UNITED STATES
SECURITIES AND EXCHANGE COMMISSION
Washington, D.C. 20549
FORMN-CSR
CERTIFIED SHAREHOLDER REPORT OF REGISTERED
MANAGEMENT INVESTMENT COMPANIES
Investment Company Act file number811-22781
Goldman Sachs Trust II
(Exact name of registrant as specified in charter)
200 West Street
15th Floor
New York, New York 10282
(Address of principal executive offices) (Zip code)
| | |
Copies to: |
Caroline Kraus | | Geoffrey R.T. Kenyon, Esq. |
Goldman Sachs & Co. LLC | | Dechert LLP |
200 West Street | | 100 Oliver Street |
New York, New York 10282 | | 40th Floor |
| | Boston, MA 02110-2605 |
(Name and address of agents for service)
Registrant’s telephone number, including area code: (212) 902-1000
Date of fiscal year end: October 31
Date of reporting period: October 31, 2019
| ITEM 1. | REPORTS TO STOCKHOLDERS. |
| | The Annual Report to Shareholders is filed herewith. |
Goldman Sachs Funds

| | | | |
| | |
| Annual Report | | | | October 31, 2019 |
| | |
| | | | Active Equity Multi-Manager Funds |
| | | | Multi-Manager International Equity |
| | | | Multi-Manager U.S. Dynamic Equity |
| | | | Multi-Manager U.S. Small Cap Equity |
It is our intention that beginning on January 1, 2021, paper copies of the Funds’ annual and semi-annual shareholder reports will no longer be sent by mail, unless you specifically request paper copies of the reports from a Fund or from your financial intermediary. Instead, the reports will be made available on a website, and you will be notified by mail each time a report is posted and provided with a website link to access the report.
If you already elected to receive shareholder reports electronically, you will not be affected by this change and you need not take any action. At any time, you may elect to receive reports and certain communications from a Fund electronically by calling the applicable toll-free number below or by contacting your financial intermediary.
You may elect to receive all future shareholder reports in paper free of charge. If you hold shares of a Fund directly with the Fund’s transfer agent, you can inform the transfer agent that you wish to receive paper copies of reports by callingtoll-free 800-621-2550 for Class P shareholders. If you hold shares of a Fund through a financial intermediary, please contact your financial intermediary to make this election. Your election to receive reports in paper will apply to all Goldman Sachs Funds held in your account if you invest through your financial intermediary or all Goldman Sachs Funds held with the Funds’ transfer agent if you invest directly with the transfer agent.

Active Equity Multi-Manager Funds
| ∎ | | MULTI-MANAGER INTERNATIONAL EQUITY |
| ∎ | | MULTI-MANAGER U.S. DYNAMIC EQUITY |
| ∎ | | MULTI-MANAGER U.S. SMALL CAP EQUITY |
| | | | |
| | | |
| NOT FDIC-INSURED | | May Lose Value | | No Bank Guarantee |
MARKET REVIEW
Active Equity Multi-Manager Funds
Market Review
The capital markets experienced mixed results during the 12 months ended October 31, 2019 (the “Reporting Period”), as global economic growth concerns and trade war uncertainty led to sustained market volatility.
The first half of the Reporting Period was characterized by a challenging 2018 year-end followed by a remarkably strong rally during the first four months of 2019. Global equities fell significantly in November and December 2018, as investors’ hopes for a trade reconciliation between the U.S. and China were dashed. Risk-off market sentiment, or reduced risk appetite, increased, and U.S. Treasury yields began a downward slide that endured for most of the Reporting Period. In January 2019, global equities rebounded from their losses, jumpstarted by a more accommodative tone from U.S. Federal Reserve (“Fed”) Chair Jerome Powell, who cited the need for a patient approach toward future interest rate changes given the continued economic slowdown in China and softening U.S. economic data. In March 2019, amid ongoing U.S.-China trade tensions and in response to the stock market volatility at 2018 year-end, the Fed announced its intention to hold interest rates steady through the conclusion of the 2019 calendar year. Meanwhile, monetary policy easing by central banks in Europe and China further supported global equities, which experienced their strongest first calendar quarter rally in more than two decades. However, despite the global equity rally, the weakening global economy, which was exacerbated by unpredictable trade rhetoric between the U.S. and China, stayed top of mind for investors. In March 2019, these concerns drove yields on German and Japanese 10-year government bonds into negative territory.
During the second half of the Reporting Period, global equity markets generally traded sideways and remained heavily influenced by trade disputes and global central bank policies. (When a market trades sideways, it generally moves within a fairly stable range without forming any distinct trends over a period of time.) Global equities began May 2019 near all-time highs before sharply declining during the month, as a breakdown in U.S. and China trade negotiations led to fresh U.S. tariffs on Chinese imports. For much of the spring and summer, investor sentiment whipsawed as the U.S. and China swapped tariff threats and company-specific blacklists. Meanwhile, the Fed shifted its monetary policy stance, deciding to cut short-term interest rates by 25 basis points in July 2019—its first interest rate cut in more than a decade. (A basis point is 1/100th of a percentage point.) Further 25 basis point reductions followed in September and October 2019. The Fed’s concern about declining economic growth and its accommodative monetary policy stance was reiterated by European Central Bank President Mario Draghi, who unveiled a new quantitative easing plan for the European Union just as his term ended on October 31st. In October 2019, the European Union remained front and center, as it approved another delay in Brexit (or the U.K.’s departure from the European Union) beyond the originally scheduled October 31st deadline. For the Reporting Period overall, global equities (as represented by the MSCI All Country World Index Investable Market Index) were up more than 12%, driven by positive performance across all major regions. From a sector perspective, cyclical stocks and information technology stocks were notable performers. Energy was the only sector that posted a negative absolute return for the Reporting Period.
Credit markets broadly sold off during the first two months of the Reporting Period. The sell-off was driven by risk-off investor sentiment and a flight to quality through November and December 2018 as well as by significant market volatility due in part to the partial U.S. federal government shutdown, investor uncertainty around the Fed’s monetary policy, tumultuous U.S.-China trade relations and uncertain global economic growth. At the beginning of 2019, however, investor sentiment improved in light of seemingly positive developments in U.S.-China trade talks as well as data indicative of ongoing solid U.S. economic growth and a more dovish Fed. (Dovish tends to suggest lower interest rates; opposite of hawkish.) Investment grade corporate bonds outperformed nearly all other major fixed income sectors during the first 10 months of 2019, surpassing high yield corporate bonds midway through the calendar year as the longer duration profile of investment grade corporate bonds benefited from a significant rally in interest rates and tightening credit spreads (or yield differentials between corporate bonds and U.S. Treasury securities of comparable maturity). Emerging markets debt also rallied, as investor optimism around U.S.-China trade negotiations persisted, with U.S. dollar-denominated emerging markets debt outpacing local currency emerging markets debt.
1
MARKET REVIEW
Looking Ahead
At the end of the Reporting Period, investors remained focused on a potential resolution to the U.S.-China trade war. Suggestions from both countries that an agreement might be reached by the end of 2019 were met with cautious optimism. Investors also adopted a wait-and-see approach toward Brexit given a second delay in its implementation and a new deadline of January 31, 2020. An early general election in the U.K., scheduled for December 2019, added further to Brexit-related uncertainty. Going forward, we expect investors to remain watchful for signs the accommodative efforts of the world’s central banks are effective in staving off a further slowdown in the global economy. We also expect investors to continue monitoring the progress of U.S.-China trade talks.
2
PORTFOLIO RESULTS
Multi-Manager International Equity Fund
Investment Objective
The Fund seeks to provide long-term capital growth.
Portfolio Management Discussion and Analysis
Below, the Goldman Sachs Alternative Investments & Manager Selection (“AIMS”) Group discusses the Multi-Manager International Equity Fund’s (the “Fund”) performance and positioning for the 12-month period ended October 31, 2019 (the “Reporting Period”).
| Q | | How did the Fund perform during the Reporting Period? |
| A | | During the Reporting Period, the Fund’s Class P Shares generated an average annual total return of 12.78%. This return compares to the 11.04% average annual total return of the Fund’s benchmark, the MSCI Europe, Australasia and Far East (“EAFE”) Index (Net, USD, Unhedged) (the “Index”) during the same time period. |
| Q | | What key factors were responsible for the Fund’s performance during the Reporting Period? |
| A | | The Fund uses a multi-manager approach and generally seeks to achieve its investment objective by dynamically allocating its assets among unaffiliated investment managers (“Underlying Managers”) that employ an international equity investment strategy. The AIMS Group is responsible for making recommendations with respect to hiring, terminating or replacing the Fund’s Underlying Managers as well as for determining the Fund’s asset allocations. The AIMS Group applies a multifaceted process with respect to manager due diligence, portfolio construction and risk management. |
| | During the Reporting Period, the Fund recorded a positive absolute return and outperformed the Index. The relative outperformance can be attributed to the performance of the Fund’s Underlying Managers overall. The Fund allocated capital to three Underlying Managers during the Reporting Period as part of its top-level strategy allocation—Causeway Capital Management LLC (“Causeway”), Massachusetts Financial Services Company doing business as MFS Investment Management (“MFS”) and WCM Investment Management (“WCM”). |
| | All three of the Underlying Managers with allocated capital during the Reporting Period generated positive absolute returns. On a relative basis, growth-oriented Underlying Manager WCM and core-oriented MFS outperformed the Index. Value-oriented Causeway underperformed the Index. The Index serves as the benchmark index for all three Underlying Managers. |
| Q | | Which international equity strategies most significantly affected Fund performance? |
| A | | Growth-oriented Underlying Manager WCM outperformed the Index during the Reporting Period. WCM’s positive results were driven by overweight positions and effective stock selection in the information technology and financials sectors. |
| | Core-oriented Underlying Manager MFS also outperformed the Index, primarily because of an overweight position and stock selection within the health care sector. |
| | Value-oriented Underlying Manager Causeway underperformed the Index. An underweight position and poor stock selection in the communication services sector detracted from returns as did an overweight position and weak stock selection in the energy sector. |
| Q | | How did the Fund use derivatives and similar instruments during the Reporting Period? |
| A | | The Fund used forward foreign currency exchange contracts during the Reporting Period to take positions in select non-U.S. markets. Rights were employed to give the Fund the opportunity, but not the obligation, to buy additional shares of specific stocks at a discount. Overall, the use of these instruments had a rather neutral impact on the Fund’s performance during the Reporting Period. |
| Q | | Were there any notable changes in the Fund’s allocations during the Reporting Period? |
| A | | There were no changes in the Fund’s allocations during the Reporting Period. At the beginning and end of the Reporting Period, the Fund’s assets were allocated approximately 44% |
3
PORTFOLIO RESULTS
| | to Causeway, 35% to MFS and 20% to WCM. The remainder of the Fund’s assets were invested in cash and cash equivalents. |
| Q | | Were there any changes to the Fund’s portfolio management team during the Reporting Period? |
| A | | Effective January 25, 2019, Tom Murray no longer served as a portfolio manager of the Fund. By design, all investment decisions for the Fund are performed within a co-lead or team structure, with multiple subject matter experts. This strategic decision making has been the cornerstone of our approach and ensures continuity in the Fund. At the end of the Reporting Period, the portfolio managers for the Fund were Kent Clark and Betsy Gorton. |
| Q | | What is the Fund’s tactical view and strategy for the months ahead? |
| A | | At the end of the Reporting Period, compared to the Index, the Fund was overweight information technology and health care stocks and was underweight financials and consumer discretionary stocks. It had no exposure to real estate stocks. On a regional basis, the Fund was significantly underweight Japan and developed Asia, while maintaining out-of-benchmark exposure to the emerging markets and North America. From a market capitalization perspective, the Fund was overweight at the end of the Reporting Period in mega-cap stocks and maintained underweights relative to the Index in mid-cap and large-cap companies. |
| | We intend to continue to position the Fund in alignment with our longer-term strategic views within the international equity complex. We further intend to continue to monitor allocations and Underlying Manager performance as we seek to generate long-term capital growth. |
4
FUND BASICS
Multi-Manager International Equity Fund
as of October 31, 2019
| | | | | | | | |
| | TOP TEN EQUITY HOLDINGS AS OF 10/31/191 |
| | | |
| | | Holding | | % of Net Assets | | | Line of Business |
| | | |
| | Nestle SA | | | 2.2 | % | | Food Products |
| | | |
| | SAP SE | | | 1.9 | | | Software |
| | | |
| | Volkswagen AG | | | 1.9 | | | Automobiles |
| | | |
| | Roche Holding AG | | | 1.7 | | | Pharmaceuticals |
| | | |
| | BASF SE | | | 1.7 | | | Chemicals |
| | | |
| | AIA Group Ltd. | | | 1.7 | | | Insurance |
| | | |
| | Takeda Pharmaceutical Co. Ltd. | | | 1.6 | | | Pharmaceuticals |
| | | |
| | UniCredit SpA | | | 1.6 | | | Banks |
| | | |
| | LVMH Moet Hennessy Louis Vuitton SE | | | 1.5 | | | Textiles, Apparel & Luxury Goods |
| | | |
| | | Experian PLC | | | 1.5 | | | Professional Services |
| 1 | | The top 10 holdings may not be representative of the Fund’s future investments. |
|
| FUND VS. BENCHMARK SECTOR ALLOCATIONS (%)2 |
|
| As of October 31, 2019 |
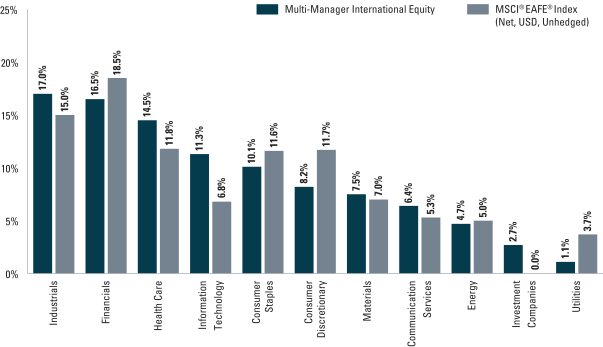
| 2 | | The Fund is actively managed and, as such, its composition may differ over time. Consequently, the Fund’s overall sector allocations may differ from the percentages contained in the graph above. Figures in the graph may not sum to 100% due to rounding and/or the exclusion of other assets and liabilities. The graph categorizes investments using the Global Industry Classification Standard (“GICS”), however, the sector classifications used by the portfolio management team may differ from GICS. The percentage shown for each investment category reflects the value of investments in that category as a percentage of market value. The graph depicts the Fund’s investments but may not represent the Fund’s market exposure due to the exclusion of certain derivatives, if any, as listed in the Additional Investment Information section of the Schedule of Investments. |
For more information about your Fund, please refer to www.GSAMFUNDS.com. There, you can learn more about your Fund’s investment strategies, holdings, and performance.
5
MULTI-MANAGER INTERNATIONAL EQUITY FUND
Performance Summary
October 31, 2019
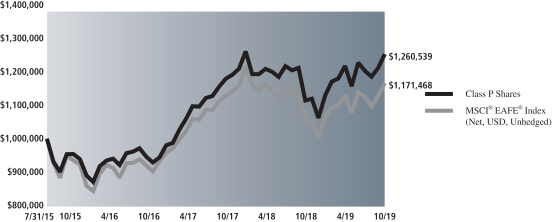
The following graph shows the value, as of October 31, 2019, of a $1,000,000 investment made on July 31, 2015 (commencement of operations) in Class P Shares at NAV. For comparative purposes, the performance of the Fund’s benchmark, the MSCI® EAFE® Index (Net, USD, Unhedged) is shown. Performance reflects applicable fee waivers and/or expense limitations in effect during the periods shown and in their absence, performance would be reduced. Returns do not reflect the deduction of taxes that a shareholder would pay on Fund distributions or the redemption of Fund shares. The returns set forth below represent past performance. Past performance does not guarantee future results. The Fund’s investment return and principal value will fluctuate so that an investor’s shares, when redeemed, may be worth more or less than their original cost. Current performance may be lower or higher than the performance quoted above. Please visit our web site at www.GSAMFUNDS.com to obtain the most recent month-end returns.
|
| Multi-Manager International Equity Fund’s Lifetime Performance |
Performance of a $1,000,000 investment, with distributions reinvested, from July 31, 2015 through October 31, 2019.
| | | | |
| Average Annual Total Return through October 31, 2019 | | One Year | | Since Inception |
|
Class P (Commenced July 31, 2015)* | | 12.78% | | 5.59% |
|
| * | | Effective April 16, 2018, Institutional Shares were redesignated as Class P Shares. |
6
PORTFOLIO RESULTS
Multi-Manager U.S. Dynamic Equity Fund
Investment Objective
The Fund seeks to provide long-term capital growth.
Portfolio Management Discussion and Analysis
Below, the Goldman Sachs Alternative Investments & Manager Selection (“AIMS”) Group discusses the Multi-Manager U.S. Dynamic Equity Fund’s (the “Fund”) performance and positioning for the12-month period ended October 31, 2019 (the “Reporting Period”).
| Q | | How did the Fund perform during the Reporting Period? |
| A | | During the Reporting Period, the Fund’s Class P Shares generated an average annual total return of 14.66%. This return compares to the 14.33% average annual total return of the Fund’s benchmark, the S&P 500® Total Return Index (the “Index”) during the same time period. |
| Q | | What key factors were responsible for the Fund’s performance during the Reporting Period? |
| A | | The Fund uses a multi-manager approach and generally seeks to achieve its investment objective by dynamically allocating its assets among unaffiliated investment managers (“Underlying Managers”) that employ dynamic equity investment strategies. (Dynamic equity investment strategies generally involve investing in equity instruments, often with a long term view. They are long-biased strategies and may have low excess return correlations to traditional long-only equity strategies.) The AIMS Group is responsible for making recommendations with respect to hiring, terminating or replacing the Fund’s Underlying Managers as well as for determining the Fund’s asset allocations. The AIMS Group applies a multifaceted process with respect to manager due diligence, portfolio construction and risk management. |
| | | During the Reporting Period, the Fund recorded a positive absolute return and outperformed the Index. The relative outperformance can be attributed to the performance of the Fund’s Underlying Managers overall. |
| | | At various points during the Reporting Period, the Fund had capital allocated to four Underlying Managers as part of itstop-level strategy allocation — Lazard Asset Management LLC (“Lazard”), Sirios Capital Management, L.P. (“Sirios”), Smead Capital Management, Inc. (“Smead”) and Vaughan Nelson Investment Management, L.P. (“Vaughan Nelson”). |
| | | Of the three Underlying Managers with allocated capital for the entire Reporting Period, all three posted positive absolute returns. Vaughan Nelson recorded a positive absolute return between December 20, 2018, when it was allocated capital as an Underlying Manager of the Fund, and the end of the Reporting Period. On a relative basis, Sirios and Lazard outperformed the Index during the Reporting Period, while Smead underperformed the Index. Vaughan Nelson outperformed the Index between December 20, 2018 and the end of the Reporting Period. The Index serves as the benchmark index for all four Underlying Managers. |
| Q | | Which dynamic equity strategies most significantly affected Fund performance? |
| A | | Growth-oriented Underlying Manager Sirios outperformed the Index during the Reporting Period, benefiting from an overweight position and positive stock selection in the industrials sector. |
| | | Lazard, which uses an all cap, concentrated investment strategy, also outperformed the Index. Strong stock selection in the financials sector added to returns as did a lack of exposure to the energy sector. |
| | | Core-oriented Vaughan Nelson outperformed the Index between December 20, 2018, when it was allocated capital, and the end of the Reporting Period. Strong stock selection in the materials sector drove these positive results. |
| | | Smead, the other core-oriented Underlying Manager, underperformed the Index during the Reporting Period overall. Smead was hurt by its underweight in the consumer staples sector. |
| Q | | How did the Fund use derivatives and similar instruments during the Reporting Period? |
| A | | The Fund used rights and forward foreign currency exchange contracts during the Reporting Period to take positions in |
7
PORTFOLIO RESULTS
| | selectnon-U.S. markets. The use of these derivatives had a rather neutral impact on the Fund’s results during the Reporting Period. |
| Q | | Were there any notable changes in the Fund’s allocations during the Reporting Period? |
| A | | At the beginning of the Reporting Period, the Fund’s assets were allocated approximately 40.5% to Smead, 40.5% to Sirios and 18% to Lazard. The remainder of the Fund’s assets were invested in cash and cash equivalents. During December 2018, Vaughan Nelson was allocated capital as an Underlying Manager of the Fund. At the end of the Reporting Period, the Fund’s assets were allocated approximately 33% to Smead, 33% to Sirios, 18% to Lazard and 15% to Vaughan Nelson. The remainder of the Fund’s assets were invested in cash and cash equivalents. |
| Q | | Were there any changes to the Fund’s portfolio management team during the Reporting Period? |
| A | | There were no changes to the Fund’s portfolio management team during the Reporting Period. |
| Q | | What is the Fund’s tactical view and strategy for the months ahead? |
| A | | At the end of the Reporting Period, the Fund maintained an overweight relative to the Index in financials, with bank exposure held by Smead and Sirios. Lazard has not historically invested in banks. In addition, the Fund was overweight the health care and consumer discretionary sectors compared to the Index. The Fund was most underweight in information technology, energy and real estate relative to the Index at the end of the Reporting Period and had no exposure to utilities. In terms of market capitalization, the Fund maintained a significant underweight in mega caps and an overweight relative to the Index insmall/mid-cap stocks. Regionally, the Fund was primarily invested in North American equities but also had modest exposure to companies domiciled in Europe. |
| | | We intend to continue to position the Fund in alignment with our longer-term strategic views within the U.S. equity complex. We further intend to continue to monitor allocations and Underlying Manager performance as we seek to generate long-term capital growth. |
8
FUND BASICS
Multi-Manager U.S. Dynamic Equity Fund
as of October 31, 2019
| | | | | | | | |
| | TOP TEN EQUITY HOLDINGS AS OF 10/31/191 |
| | | |
| | | Holding | | % of Net Assets | | | Line of Business |
| | | |
| | Berkshire Hathaway, Inc. Class B | | | 5.1 | % | | Diversified Financial Services |
| | JPMorgan Chase & Co. | | | 3.2 | | | Banks |
| | Elanco Animal Health, Inc. | | | 2.7 | | | Pharmaceuticals |
| | The Home Depot, Inc. | | | 2.4 | | | Specialty Retail |
| | NVR, Inc. | | | 2.3 | | | Household Durables |
| | Medtronic PLC | | | 2.2 | | | Health Care Equipment & Supplies |
| | Target Corp. | | | 2.2 | | | Multiline Retail |
| | Amgen, Inc. | | | 2.1 | | | Biotechnology |
| | Raytheon Co. | | | 2.1 | | | Aerospace & Defense |
| | | The Walt Disney Co. | | | 2.0 | | | Entertainment |
| 1 | | The top 10 holdings may not be representative of the Fund’s future investments. |
|
| FUND VS. BENCHMARK SECTOR ALLOCATIONS (%)2 |
|
| As of October 31, 2019 |
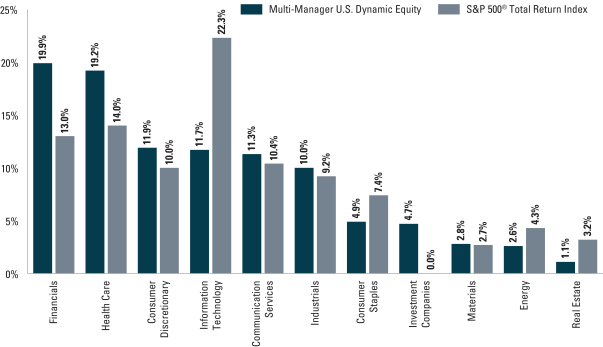
| 2 | | The Fund is actively managed and, as such, its composition may differ over time. Consequently, the Fund’s overall sector allocations may differ from the percentages contained in the graph above. Figures in the graph may not sum to 100% due to rounding and/or the exclusion of other assets and liabilities. The graph categorizes investments using the Global Industry Classification Standard (“GICS”), however, the sector classifications used by the portfolio management team may differ from GICS. The percentage shown for each investment category reflects the value of investments in that category as a percentage of market value. The graph depicts the Fund’s investments but may not represent the Fund’s market exposure due to the exclusion of certain derivatives, if any, as listed in the Additional Investment Information section of the Schedule of Investments. |
For more information about your Fund, please refer to www.GSAMFUNDS.com. There, you can learn more about your Fund’s investment strategies, holdings, and performance.
9
MULTI-MANAGER U.S. DYNAMIC EQUITY FUND
Performance Summary
October 31, 2019
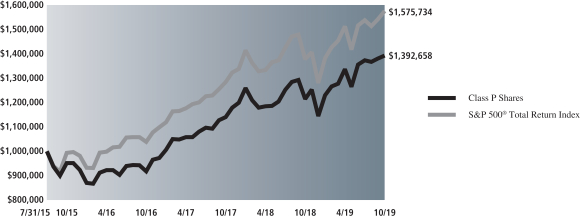
The following graph shows the value, as of October 31, 2019, of a $1,000,000 investment made on July 31, 2015 (commencement of operations) in Class P Shares at NAV. For comparative purposes, the performance of the Fund’s benchmark, the S&P 500® Total Return Index is shown. Performance reflects applicable fee waivers and/or expense limitations in effect during the periods shown and in their absence, performance would be reduced. Returns do not reflect the deduction of taxes that a shareholder would pay on Fund distributions or the redemption of Fund shares. The returns set forth below represent past performance. Past performance does not guarantee future results. The Fund’s investment return and principal value will fluctuate so that an investor’s shares, when redeemed, may be worth more or less than their original cost. Current performance may be lower or higher than the performance quoted above. Please visit our web site at www.GSAMFUNDS.com to obtain the most recent month-end returns.
|
| Multi-Manager U.S. Dynamic Equity Fund’s Lifetime Performance |
Performance of a $1,000,000 investment, with distributions reinvested, from July 31, 2015 through October 31, 2019.
| | | | |
| Average Annual Total Return through October 31, 2019 | | One Year | | Since Inception |
|
Class P (Commenced July 31, 2015)* | | 14.66% | | 8.09% |
|
| * | | Effective April 16, 2018, Institutional Shares were redesignated as Class P Shares. |
10
PORTFOLIO RESULTS
Multi-Manager U.S. Small Cap Equity Fund
Investment Objective
The Fund seeks to provide long-term capital growth.
Portfolio Management Discussion and Analysis
Below, the Goldman Sachs Alternative Investments & Manager Selection (“AIMS”) Group discusses the Multi-Manager U.S. Small Cap Equity Fund’s (the “Fund”) performance and positioning for the12-month period ended October 31, 2019 (the “Reporting Period”).
| Q | | How did the Fund perform during the Reporting Period? |
| A | | During the Reporting Period, the Fund’s Class P Shares generated an average annual total return of 10.56%. This return compares to the 4.90% average annual total return of the Fund’s benchmark, the Russell 2000® Total Return Index (the “Index”) during the same time period. |
| Q | | What key factors were responsible for the Fund’s performance during the Reporting Period? |
| A | | The Fund uses a multi-manager approach and generally seeks to achieve its investment objective by dynamically allocating its assets among unaffiliated investment managers (“Underlying Managers”) that employ asmall-cap equity investment strategy. The AIMS Group is responsible for making recommendations with respect to hiring, terminating or replacing the Fund’s Underlying Managers as well as for determining the Fund’s asset allocations. The AIMS Group applies a multifaceted process with respect to manager due diligence, portfolio construction and risk management. |
| | During the Reporting Period, the Fund recorded a positive absolute return and outperformed the Index. The relative outperformance can be attributed to the performance of the Fund’s Underlying Managers overall. At various points during the Reporting Period, the Fund allocated capital to four Underlying Managers as part of itstop-level strategy allocation—Boston Partners Global Investors (“Boston Partners”), Brown Advisory, LLC (“Brown Advisory”), QMA LLC (“QMA”) and PNC Capital Advisors, LLC (“PNC”). |
| | Of the two Underlying Managers with allocated capital for the entire Reporting Period, both generated positive absolute returns. PNC generated a positive absolute return from the beginning of the Reporting Period to May 22, 2019, when we redeemed it as an Underlying Manager of the Fund. QMA generated a positive absolute return from May 14, 2019, when it was allocated capital as an Underlying Manager of the Fund, to the end of the Reporting Period. On a relative basis, two Underlying Managers outperformed their respective benchmark indices. PNC outperformed its benchmark index between the start of the Reporting Period and May 22, 2019. QMA underperformed its benchmark index between May 14, 2019 and the end of the Reporting Period. |
| Q | | Whichsmall-cap equity strategies most significantly affected Fund performance? |
| A | | Growth-oriented Underlying Manager Brown Advisory outperformed its benchmark index, the Russell 2000® Growth Index, during the Reporting Period. An underweight position and effective stock selection in the health care sector contributed positively. Stock selection in communication services also added to relative returns. |
| | Value-oriented Underlying Manager Boston Partners outpaced its benchmark index, the Russell 2000® Value Index, benefiting from robust stock selection in the consumer discretionary and energy sectors. |
| | Core-oriented Underlying Manager PNC outperformed its benchmark index, the Russell 2000® Index, between the beginning of the Reporting Period and May 22, 2019, when it was redeemed. Strong stock selection in the consumer discretionary sector added to returns. An underweight position and effective stock selection in the health care sector were also advantageous. |
| | QMA, another core-oriented Underlying Manager, underperformed the Russell 2000® Index between May 14, 2019, when it was allocated capital, and the end of the Reporting Period. These negative results were primarily due to exposure to value factors, which resulted in weak stock selection in the real estate sector. |
11
PORTFOLIO RESULTS
| Q | | How did the Fund use derivatives and similar instruments during the Reporting Period? |
| A | | The Fund used equity futures to manage its market exposure. These derivatives had a slightly positive impact on performance during the Reporting Period. |
| Q | | Were there any notable changes in the Fund’s allocations during the Reporting Period? |
| A | | In April 2019, QMA was added as an Underlying Manager of the Fund and was allocated capital in May 2019. QMA uses a systematic investment approach, based on fundamental insights, that ranks stocks across nearly 300 fundamental, market and forecast data metrics (i.e., earnings, sales and cash flow estimate revisions, price-volume behaviors, target price movement). |
| | In May 2019, PNC was redeemed and no longer served as an Underlying Manager of the Fund. We reallocated the capital to QMA. |
| | At the beginning of the Reporting Period, the Fund’s assets were allocated approximately 44% to Boston Partners, 30% to Brown Advisory and 25% to PNC, with the remainder invested in cash and cash equivalents. At the end of the Reporting Period, the Fund’s assets were allocated approximately 39% to QMA, 35% to Boston Partners and 25% to Brown Advisory, with the remainder invested in cash and cash equivalents. |
| Q | | Were there any changes to the Fund’s portfolio management team during the Reporting Period? |
| A | | There were no changes to the Fund’s portfolio management team during the Reporting Period. |
| Q | | What is the Fund’s tactical view and strategy for the months ahead? |
| A | | At the end of the Reporting Period, the Fund was most overweight compared to the Index in financials, industrials and information technology. It was underweight health care, utilities and real estate. In terms of market capitalization, the Fund maintained a slightsmall/mid-cap bias relative to the Index, driven predominantly by Underlying Manager Brown Advisory. |
| | We intend to continue to position the Fund in alignment with our longer-term strategic views within the U.S.small-cap equity complex. We further intend to continue to monitor allocations and Underlying Manager performance as we seek to generate long-term capital growth. |
12
FUND BASICS
Multi-Manager U.S. Small Cap Equity Fund
as of October 31, 2019
| | | | | | | | |
| | TOP TEN EQUITY HOLDINGS AS OF 10/31/191 |
| | | |
| | | Holding | | % of Net Assets | | | Line of Business |
| | | |
| | Lithia Motors, Inc. Class A | | | 1.2 | % | | Specialty Retail |
| | Waste Connections, Inc. | | | 1.1 | | | Commercial Services & Supplies |
| | World Fuel Services Corp. | | | 1.0 | | | Oil, Gas & Consumable Fuels |
| | Walker & Dunlop, Inc. | | | 1.0 | | | Thrifts & Mortgage Finance |
| | Graphic Packaging Holding Co. | | | 1.0 | | | Containers & Packaging |
| | Bright Horizons Family Solutions, Inc. | | | 0.9 | | | Diversified Consumer Services |
| | Genpact Ltd. | | | 0.9 | | | IT Services |
| | Essent Group Ltd. | | | 0.9 | | | Thrifts & Mortgage Finance |
| | Two Harbors Investment Corp. | | | 0.8 | | | Mortgage Real Estate Investment Trusts (REITs) |
| | | Air Lease Corp. | | | 0.8 | | | Trading Companies & Distributors |
| 1 | | The top 10 holdings may not be representative of the Fund’s future investments. |
|
| FUND VS. BENCHMARK SECTOR ALLOCATIONS(%)2 |
|
As of October 31, 2019 |
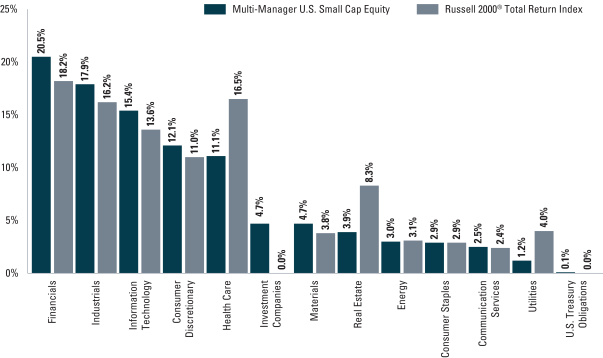
| 2 | | The Fund is actively managed and, as such, its composition may differ over time. Consequently, the Fund’s overall sector allocations may differ from the percentages contained in the graph above. Figures in the graph may not sum to 100% due to rounding and/or the exclusion of other assets and liabilities. The graph categorizes investments using the Global Industry Classification Standard (“GICS”), however, the sector classifications used by the portfolio management team may differ from GICS. The percentage shown for each investment category reflects the value of investments in that category as a percentage of market value. The graph depicts the Fund’s investments but may not represent the Fund’s market exposure due to the exclusion of certain derivatives, if any, as listed in the Additional Investment Information section of the Schedule of Investments. |
For more information about your Fund, please refer to www.GSAMFUNDS.com. There, you can learn more about your Fund’s investment strategies, holdings, and performance.
13
MULTI-MANAGER U.S. SMALL CAP EQUITY
Performance Summary
October 31, 2019
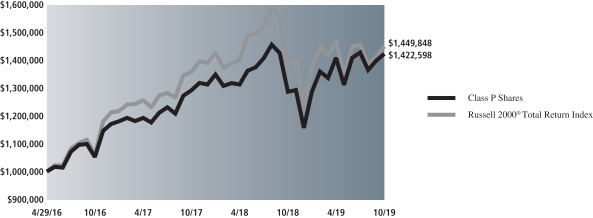
The following graph shows the value, as of October 31, 2019, of a $1,000,000 investment made on April 29, 2016 (commencement of operations) in Class P Shares at NAV. For comparative purposes, the performance of the Fund’s benchmark, the Russell 2000® Total Return Index is shown. Performance reflects applicable fee waivers and/or expense limitations in effect during the periods shown and in their absence, performance would be reduced. Returns do not reflect the deduction of taxes that a shareholder would pay on Fund distributions or the redemption of Fund shares. The returns set forth below represent past performance. Past performance does not guarantee future results. The Fund’s investment return and principal value will fluctuate so that an investor’s shares, when redeemed, may be worth more or less than their original cost. Current performance may be lower or higher than the performance quoted above. Please visit our web site at www.GSAMFUNDS.com to obtain the most recent month-end returns.
|
| Multi-Manager U.S. Small Cap Equity Fund’s Lifetime Performance |
Performance of a $1,000,000 investment, with distributions reinvested, from April 29, 2016 through October 31, 2019.
| | | | |
| Average Annual Total Return through October 31, 2019 | | One Year | | Since Inception |
|
Class P (Commenced April 29, 2016)* | | 10.56% | | 10.57% |
|
| * | | Effective April 16, 2018, Institutional Shares were redesignated as Class P Shares. |
14
FUND BASICS
Index Definitions
MSCI All Country World Index Investable Market Index captures large- and mid-cap representation across 23 developed markets and 24 emerging markets countries.
Russell 2000® Index is an unmanaged index of common stock prices that measures the performance of the 2000 smallest companies in the Russell 3000® Index. The Index is constructed to provide a comprehensive and unbiasedsmall-cap barometer and is completely reconstituted annually to ensure larger stocks do not distort the performance and characteristics of the truesmall-cap opportunity set.
Russell 2000® Growth Index measures the performance of thesmall-cap growth stocks of the U.S. equity universe.
Russell 2000® Value Index measures the performance of thesmall-cap value stocks of the U.S. equity universe.
It is not possible to invest directly in an unmanaged index.
15
MULTI-MANAGER INTERNATIONAL EQUITY FUND
Schedule of Investments
October 31, 2019
| | | | | | | | |
Shares | | | Description | | Value | |
| | | | | | | | |
|
| Common Stocks – 95.1% | |
| Australia – 1.0% | |
| | 44,341 | | | CSL Ltd. (Biotechnology) | | $ | 7,819,813 | |
| | |
| Belgium – 0.6% | |
| | 64,453 | | | KBC Group NV (Banks) | | | 4,531,966 | |
| | |
| Brazil – 0.2% | |
| | 359,210 | | | Ambev SA ADR (Beverages) | | | 1,548,195 | |
| | |
| Canada – 4.6% | |
| | 31,560 | | | Canadian Imperial Bank of Commerce (Banks) | | | 2,691,142 | |
| | 64,604 | | | Canadian National Railway Co. (Road & Rail) | | | 5,773,660 | |
| | 28,517 | | | Canadian Pacific Railway Ltd. (Road & Rail) | | | 6,482,199 | |
| | 67,438 | | | Dollarama, Inc. (Multiline Retail) | | | 2,268,756 | |
| | 1,147,615 | | | Encana Corp. (Oil, Gas & Consumable Fuels) | | | 4,496,009 | |
| | 86,559 | | | Gildan Activewear, Inc. (Textiles, Apparel & Luxury Goods) | | | 2,211,457 | |
| | 195,281 | | | Manulife Financial Corp. (Insurance) | | | 3,636,962 | |
| | 20,560 | | | Shopify, Inc. Class A* (IT Services) | | | 6,446,999 | |
| | 128,437 | | | Suncor Energy, Inc. (Oil, Gas & Consumable Fuels) | | | 3,818,687 | |
| | | | | | | | |
| | | | | | | 37,825,871 | |
| | |
| China – 1.7% | |
| | 76,171 | | | Baidu, Inc. ADR* (Interactive Media & Services) | | | 7,758,016 | |
| | 431,109 | | | Sinopharm Group Co. Ltd. Class H (Health Care Providers & Services) | | | 1,543,908 | |
| | 123,240 | | | Tencent Holdings Ltd. (Interactive Media & Services) | | | 4,998,974 | |
| | | | | | | | |
| | | | | | | 14,300,898 | |
| | |
| Denmark – 1.7% | |
| | 16,395 | | | Carlsberg A/S Class B (Beverages) | | | 2,308,812 | |
| | 33,043 | | | Chr Hansen Holding A/S (Chemicals) | | | 2,536,899 | |
| | 35,235 | | | DSV PANALPINA A/S (Air Freight & Logistics) | | | 3,424,458 | |
| | 96,479 | | | Novo Nordisk A/S Class B (Pharmaceuticals) | | | 5,305,254 | |
| | | | | | | | |
| | | | | | | 13,575,423 | |
| | |
| France – 11.1% | |
| | 85,102 | | | Air France-KLM* (Airlines) | | | 1,014,456 | |
| | 58,866 | | | Air Liquide SA (Chemicals) | | | 7,826,884 | |
| | 154,746 | | | BNP Paribas SA (Banks) | | | 8,086,955 | |
| | 230,736 | | | Carrefour SA (Food & Staples Retailing) | | | 3,928,407 | |
| | 70,814 | | | Danone SA (Food Products) | | | 5,866,318 | |
| | 9,563 | | | Dassault Systemes SE (Software) | | | 1,452,397 | |
| | 198,491 | | | Engie SA (Multi-Utilities) | | | 3,323,687 | |
| | 66,953 | | | EssilorLuxottica SA (Textiles, Apparel & Luxury Goods) | | | 10,223,341 | |
| | 878 | | | Hermes International (Textiles, Apparel & Luxury Goods) | | | 632,469 | |
| | |
| | | | | | | | |
|
| Common Stocks – (continued) | |
| France – (continued) | |
| | 13,958 | | | Ingenico Group SA (Electronic Equipment, Instruments & Components) | | | 1,492,544 | |
| | 11,686 | | | L’Oreal SA (Personal Products) | | | 3,413,032 | |
| | 35,107 | | | Legrand SA (Electrical Equipment) | | | 2,742,699 | |
| | 29,714 | | | LVMH Moet Hennessy Louis Vuitton SE (Textiles, Apparel & Luxury Goods) | | | 12,689,530 | |
| | 55,116 | | | Pernod Ricard SA (Beverages) | | | 10,181,749 | |
| | 86,137 | | | Schneider Electric SE (Electrical Equipment) | | | 8,005,604 | |
| | 159,430 | | | TOTAL SA (Oil, Gas & Consumable Fuels) | | | 8,428,776 | |
| | 41,155 | | | Ubisoft Entertainment SA* (Entertainment) | | | 2,432,229 | |
| | | | | | | | |
| | | | | | | 91,741,077 | |
| | |
| Germany – 9.9% | |
| | 19,905 | | | adidas AG (Textiles, Apparel & Luxury Goods) | | | 6,146,081 | |
| | 184,440 | | | BASF SE (Chemicals) | | | 14,020,982 | |
| | 153,180 | | | Bayer AG (Pharmaceuticals) | | | 11,883,117 | |
| | 49,635 | | | Beiersdorf AG (Personal Products) | | | 5,876,241 | |
| | 18,806 | | | Deutsche Boerse AG (Capital Markets) | | | 2,912,290 | |
| | 199,238 | | | Deutsche Post AG (Air Freight & Logistics) | | | 7,058,013 | |
| | 87,782 | | | Infineon Technologies AG (Semiconductors & Semiconductor Equipment) | | | 1,700,229 | |
| | 28,460 | | | Merck KGaA (Pharmaceuticals) | | | 3,394,323 | |
| | 7,031 | | | MTU Aero Engines AG (Aerospace & Defense) | | | 1,880,307 | |
| | 74,308 | | | ProSiebenSat.1 Media SE (Media) | | | 1,097,274 | |
| | 119,803 | | | SAP SE (Software) | | | 15,874,071 | |
| | 82,547 | | | Siemens AG (Industrial Conglomerates) | | | 9,525,923 | |
| | | | | | | | |
| | | | | | | 81,368,851 | |
| | |
| Hong Kong – 3.1% | |
| | 1,385,200 | | | AIA Group Ltd. (Insurance) | | | 13,794,123 | |
| | 911,514 | | | China Merchants Port Holdings Co. Ltd. (Transportation Infrastructure) | | | 1,425,179 | |
| | 1,267,524 | | | China Mobile Ltd. (Wireless Telecommunication Services) | | | 10,300,781 | |
| | | | | | | | |
| | | | | | | 25,520,083 | |
| | |
| India – 1.6% | |
| | 95,618 | | | HDFC Bank Ltd. ADR (Banks) | | | 5,841,304 | |
| | 93,879 | | | Housing Development Finance Corp. Ltd. (Thrifts & Mortgage Finance) | | | 2,817,501 | |
| | 137,928 | | | Tata Consultancy Services Ltd. (IT Services) | | | 4,413,560 | |
| | | | | | | | |
| | | | | | | 13,072,365 | |
| | |
| | |
| 16 | | The accompanying notes are an integral part of these financial statements. |
MULTI-MANAGER INTERNATIONAL EQUITY FUND
| | | | | | | | |
Shares | | | Description | | Value | |
| | | | | | | | |
|
| Common Stocks – (continued) | |
| Ireland – 2.1% | |
| | 35,714 | | | Accenture PLC Class A (IT Services) | | $ | 6,622,090 | |
| | 18,322 | | | ICON PLC* (Life Sciences Tools & Services) | | | 2,691,502 | |
| | 106,264 | | | Ryanair Holdings PLC ADR* (Airlines) | | | 7,931,545 | |
| | | | | | | | |
| | | | | | | 17,245,137 | |
| | |
| Israel* – 0.4% | |
| | 29,537 | | | Check Point Software Technologies Ltd. (Software) | | | 3,320,254 | |
| | |
| Italy – 2.3% | |
| | 164,915 | | | Eni SpA (Oil, Gas & Consumable Fuels) | | | 2,501,923 | |
| | 1,309,810 | | | Intesa Sanpaolo SpA (Banks) | | | 3,282,153 | |
| | 1,058,689 | | | UniCredit SpA (Banks) | | | 13,431,621 | |
| | | | | | | | |
| | | | | | | 19,215,697 | |
| | |
| Japan – 11.9% | |
| | 46,800 | | | Coca-Cola Bottlers Japan Holdings, Inc. (Beverages) | | | 1,062,550 | |
| | 36,100 | | | Daikin Industries Ltd. (Building Products) | | | 5,052,541 | |
| | 31,600 | | | Denso Corp. (Auto Components) | | | 1,467,185 | |
| | 68,800 | | | East Japan Railway Co. (Road & Rail) | | | 6,245,732 | |
| | 62,600 | | | FANUC Corp. (Machinery) | | | 12,347,804 | |
| | 91,800 | | | Hitachi Ltd. (Electronic Equipment, Instruments & Components) | | | 3,426,200 | |
| | 84,200 | | | Hoya Corp. (Health Care Equipment & Supplies) | | | 7,441,361 | |
| | 133,600 | | | Japan Tobacco, Inc. (Tobacco) | | | 3,019,721 | |
| | 317,300 | | | KDDI Corp. (Wireless Telecommunication Services) | | | 8,780,053 | |
| | 7,500 | | | Keyence Corp. (Electronic Equipment, Instruments & Components) | | | 4,742,223 | |
| | 234,200 | | | Kubota Corp. (Machinery) | | | 3,719,858 | |
| | 63,300 | | | Kyocera Corp. (Electronic Equipment, Instruments & Components) | | | 4,152,915 | |
| | 36,700 | | | Murata Manufacturing Co. Ltd. (Electronic Equipment, Instruments & Components) | | | 1,998,247 | |
| | 396,600 | | | Olympus Corp. (Health Care Equipment & Supplies) | | | 5,396,290 | |
| | 13,400 | | | Shin-Etsu Chemical Co. Ltd. (Chemicals) | | | 1,494,116 | |
| | 112,200 | | | Sompo Holdings, Inc. (Insurance) | | | 4,410,142 | |
| | 122,100 | | | Sumitomo Mitsui Financial Group, Inc. (Banks) | | | 4,334,937 | |
| | 373,200 | | | Takeda Pharmaceutical Co. Ltd. (Pharmaceuticals) | | | 13,484,856 | |
| | 167,000 | | | Terumo Corp. (Health Care Equipment & Supplies) | | | 5,450,333 | |
| | | | | | | | |
| | | | | | | 98,027,064 | |
| | |
| Mexico – 0.5% | |
| | 1,331,065 | | | Wal-Mart de Mexico SAB de CV (Food & Staples Retailing) | | | 3,994,613 | |
| | |
| | | | | | | | |
|
| Common Stocks – (continued) | |
| Netherlands – 3.2% | |
| | 107,202 | | | Akzo Nobel NV (Chemicals) | | | 9,883,315 | |
| | 15,425 | | | ASML Holding NV (Semiconductors & Semiconductor Equipment) | | | 4,040,887 | |
| | 699,482 | | | ING Groep NV (Banks) | | | 7,920,575 | |
| | 52,947 | | | QIAGEN NV* (Life Sciences Tools & Services) | | | 1,592,595 | |
| | 51,030 | | | Randstad NV (Professional Services) | | | 2,832,004 | |
| | | | | | | | |
| | | | | | | 26,269,376 | |
| | |
| Portugal – 0.2% | |
| | 91,688 | | | Galp Energia SGPS SA (Oil, Gas & Consumable Fuels) | | | 1,466,529 | |
| | |
| Singapore – 0.4% | |
| | 178,800 | | | DBS Group Holdings Ltd. (Banks) | | | 3,408,083 | |
| | |
| South Korea – 2.2% | |
| | 8,366 | | | Samsung Electronics Co. Ltd. GDR (Technology Hardware, Storage & Peripherals) | | | 8,943,153 | |
| | 9,638 | | | SK Innovation Co. Ltd. (Oil, Gas & Consumable Fuels) | | | 1,318,821 | |
| | 342,411 | | | SK Telecom Co. Ltd. ADR (Wireless Telecommunication Services) | | | 7,892,573 | |
| | | | | | | | |
| | | | | | | 18,154,547 | |
| | |
| Spain – 1.7% | |
| | 137,768 | | | Amadeus IT Group SA (IT Services) | | | 10,191,836 | |
| | 1,447,249 | | | CaixaBank SA (Banks) | | | 4,150,127 | |
| | | | | | | | |
| | | | | | | 14,341,963 | |
| | |
| Sweden – 0.7% | |
| | 95,866 | | | Atlas Copco AB Class A (Machinery) | | | 3,383,734 | |
| | 81,883 | | | Essity AB Class B (Household Products) | | | 2,558,084 | |
| | | | | | | | |
| | | | | | | 5,941,818 | |
| | |
| Switzerland – 10.9% | |
| | 463,552 | | | ABB Ltd. (Electrical Equipment) | | | 9,734,584 | |
| | 94,321 | | | Alcon, Inc.* (Health Care Equipment & Supplies) | | | 5,577,967 | |
| | 805,679 | | | Aryzta AG* (Food Products) | | | 636,429 | |
| | 36,316 | | | Chubb Ltd. (Insurance) | | | 5,535,285 | |
| | 40,603 | | | Cie Financiere Richemont SA (Textiles, Apparel & Luxury Goods) | | | 3,190,630 | |
| | 7,080 | | | Geberit AG (Building Products) | | | 3,597,277 | |
| | 44,788 | | | Julius Baer Group Ltd.* (Capital Markets) | | | 1,983,374 | |
| | 166,960 | | | Nestle SA (Food Products) | | | 17,861,600 | |
| | 137,450 | | | Novartis AG (Pharmaceuticals) | | | 12,009,721 | |
| | 47,759 | | | Roche Holding AG (Pharmaceuticals) | | | 14,373,348 | |
| | 36,028 | | | Sika AG (Chemicals) | | | 6,193,447 | |
| | 371,101 | | | UBS Group AG* (Capital Markets) | | | 4,392,040 | |
| | 11,159 | | | Zurich Insurance Group AG (Insurance) | | | 4,370,981 | |
| | | | | | | | |
| | | | | | | 89,456,683 | |
| | |
| | |
| The accompanying notes are an integral part of these financial statements. | | 17 |
MULTI-MANAGER INTERNATIONAL EQUITY FUND
Schedule of Investments(continued)
October 31, 2019
| | | | | | | | |
Shares | | | Description | | Value | |
| | | | | | | | |
|
| Common Stocks – (continued) | |
| Taiwan – 1.3% | |
| | 214,131 | | | Taiwan Semiconductor Manufacturing Co. Ltd. ADR (Semiconductors & Semiconductor Equipment) | | $ | 11,055,584 | |
| | |
| United Kingdom – 20.3% | |
| | 115,017 | | | Amcor PLC (Containers & Packaging) | | | 1,101,332 | |
| | 72,114 | | | AstraZeneca PLC (Pharmaceuticals) | | | 7,032,357 | |
| | 1,022,361 | | | Aviva PLC (Insurance) | | | 5,510,572 | |
| | 1,063,051 | | | Balfour Beatty PLC (Construction & Engineering) | | | 3,097,754 | |
| | 5,408,571 | | | Barclays PLC (Banks) | | | 11,731,578 | |
| | 1,321,744 | | | BP PLC (Oil, Gas & Consumable Fuels) | | | 8,381,656 | |
| | 270,679 | | | British American Tobacco PLC (Tobacco) | | | 9,467,231 | |
| | 892,515 | | | Cobham PLC (Aerospace & Defense) | | | 1,825,622 | |
| | 398,555 | | | Compass Group PLC (Hotels, Restaurants & Leisure) | | | 10,611,164 | |
| | 128,614 | | | Diageo PLC (Beverages) | | | 5,264,297 | |
| | 394,600 | | | Experian PLC (Professional Services) | | | 12,438,305 | |
| | 98,616 | | | Johnson Matthey PLC (Chemicals) | | | 3,917,707 | |
| | 60,655 | | | Linde PLC (Chemicals) | | | 11,973,035 | |
| | 5,739,712 | | | Lloyds Banking Group PLC (Banks) | | | 4,222,167 | |
| | 645,270 | | | M&G PLC* (Diversified Financial Services) | | | 1,787,049 | |
| | 233,271 | | | Micro Focus International PLC (Software) | | | 3,201,692 | |
| | 604,207 | | | Prudential PLC (Insurance) | | | 10,553,585 | |
| | 46,132 | | | Reckitt Benckiser Group PLC (Household Products) | | | 3,569,769 | |
| | 284,679 | | | RELX PLC (Professional Services) | | | 6,851,948 | |
| | 48,325 | | | Rio Tinto PLC (Metals & Mining) | | | 2,515,887 | |
| | 54,985,151 | | | Rolls-Royce Holdings PLC* (Aerospace & Defense) | | | 11,024,760 | |
| | 296,908 | | | Royal Dutch Shell PLC Class B (Oil, Gas & Consumable Fuels) | | | 8,550,880 | |
| | 177,298 | | | Smith & Nephew PLC (Health Care Equipment & Supplies) | | | 3,805,952 | |
| | 90,809 | | | Smiths Group PLC (Industrial Conglomerates) | | | 1,898,238 | |
| | 337,094 | | | SSE PLC (Electric Utilities) | | | 5,607,911 | |
| | 723,645 | | | Tesco PLC (Food & Staples Retailing) | | | 2,208,964 | |
| | 3,417,556 | | | Vodafone Group PLC (Wireless Telecommunication Services) | | | 6,974,273 | |
| | 150,771 | | | WPP PLC (Media) | | | 1,881,555 | |
| | | | | | | | |
| | | | | | | 167,007,240 | |
| | |
| | | | | | | | |
|
| Common Stocks – (continued) | |
| United States – 1.5% | |
| | 5,405 | | | Mettler-Toledo International, Inc.* (Life Sciences Tools & Services) | | | 3,810,201 | |
| | 40,649 | | | ResMed, Inc. (Health Care Equipment & Supplies) | | | 6,012,800 | |
| | 66,056 | | | Yum China Holdings, Inc. (Hotels, Restaurants & Leisure) | | | 2,807,380 | |
| | | | | | | | |
| | | | | | | 12,630,381 | |
| | |
| | TOTAL COMMON STOCKS | |
| | (Cost $701,369,954) | | $ | 782,839,511 | |
| | |
| | |
| Shares | | | Dividend Rate | | Value | |
|
| Preferred Stocks – 1.9% | |
| Germany – 1.9% | |
|
| | Volkswagen AG (Automobiles) | |
| | 80,539 | | | 2.790% | | $ | 15,310,885 | |
| | (Cost $11,989,712) | |
| | |
| | | | | | | | |
|
| Investment Company(a) – 2.7% | |
| Goldman Sachs Financial Square Government Fund –
Institutional Shares |
|
| | 22,489,043 | | | 1.701% | | $ | 22,489,043 | |
| | (Cost $22,489,043) | |
| | |
| | TOTAL INVESTMENTS – 99.7% | |
| | (Cost $735,848,709) | | $ | 820,639,439 | |
| | |
| OTHER ASSETS IN EXCESS OF
LIABILITIES – 0.3% | | | 2,564,532 | |
| | |
| | NET ASSETS – 100.0% | | $ | 823,203,971 | |
| | |
| | |
|
| The percentage shown for each investment category reflects the value of investments in that category as a percentage of net assets. |
| |
* | | Non-income producing security. |
| |
(a) | | Represents an affiliated issuer. |
| | |
|
Currency Abbreviations: |
JPY | | —Japanese Yen |
USD | | —U.S. Dollar |
|
Investment Abbreviations: |
ADR | | —American Depositary Receipt |
GDR | | —Global Depository Receipt |
PLC | | —Public Limited Company |
|
| | |
| 18 | | The accompanying notes are an integral part of these financial statements. |
MULTI-MANAGER INTERNATIONAL EQUITY FUND
|
| ADDITIONAL INVESTMENT INFORMATION |
FORWARD FOREIGN CURRENCY EXCHANGE CONTRACTS — At October 31, 2019, the Fund had the following forward foreign currency exchange contracts:
FORWARD FOREIGN CURRENCY EXCHANGE CONTRACTS WITH UNREALIZED GAIN
| | | | | | | | | | | | | | | | | | | | |
| Counterparty | | Currency Purchased | | | Currency Sold | | | Settlement
Date | | | Unrealized
Gain | |
| | | | | | |
State Street Bank and Trust | | JPY | | | 1,676,016 | | | USD | | | 15,501 | | | | 11/05/19 | | | $ | 24 | |
| | |
| The accompanying notes are an integral part of these financial statements. | | 19 |
MULTI-MANAGER U.S. DYNAMIC EQUITY FUND
Schedule of Investments
October 31, 2019
| | | | | | | | |
Shares | | | Description | | Value | |
| | | | | | | | |
|
| Common Stocks – 95.4% | |
| Aerospace & Defense – 5.2% | |
| | 16,082 | | | Airbus SE | | $ | 2,307,096 | |
| | 9,179 | | | General Dynamics Corp. | | | 1,622,847 | |
| | 16,742 | | | Raytheon Co. | | | 3,552,820 | |
| | 8,947 | | | Safran SA | | | 1,417,114 | |
| | | | | | | | |
| | | | | | | 8,899,877 | |
| | |
| Auto Components – 0.4% | |
| | 6,765 | | | Aptiv PLC | | | 605,806 | |
| | |
| Banks – 7.6% | |
| | 86,305 | | | Bank of America Corp. | | | 2,698,757 | |
| | 7,925 | | | Citigroup, Inc. | | | 569,491 | |
| | 43,706 | | | JPMorgan Chase & Co. | | | 5,459,754 | |
| | 34,922 | | | SunTrust Banks, Inc. | | | 2,386,569 | |
| | 37,538 | | | Wells Fargo & Co. | | | 1,938,087 | |
| | | | | | | | |
| | | | | | | 13,052,658 | |
| | |
| Beverages – 1.7% | |
| | 2,150 | | | Constellation Brands, Inc. Class A | | | 409,210 | |
| | 47,115 | | | TheCoca-Cola Co. | | | 2,564,469 | |
| | | | | | | | |
| | | | | | | 2,973,679 | |
| | |
| Biotechnology – 2.8% | |
| | 14,750 | | | AbbVie, Inc. | | | 1,173,363 | |
| | 16,849 | | | Amgen, Inc. | | | 3,593,049 | |
| | | | | | | | |
| | | | | | | 4,766,412 | |
| | |
| Building Products – 0.8% | |
| | 14,493 | | | Armstrong World Industries, Inc. | | | 1,355,530 | |
| | |
| Capital Markets – 4.0% | |
| | 41,650 | | | Ares Capital Corp. | | | 762,195 | |
| | 14,395 | | | Intercontinental Exchange, Inc. | | | 1,357,736 | |
| | 6,246 | | | London Stock Exchange Group PLC | | | 562,882 | |
| | 2,113 | | | Moody’s Corp. | | | 466,318 | |
| | 5,598 | | | S&P Global, Inc. | | | 1,444,228 | |
| | 26,725 | | | The Charles Schwab Corp. | | | 1,087,975 | |
| | 13,561 | | | Tradeweb Markets, Inc. Class A | | | 566,172 | |
| | 34,775 | | | Virtu Financial, Inc. Class A | | | 589,784 | |
| | | | | | | | |
| | | | | | | 6,837,290 | |
| | |
| Chemicals – 1.5% | |
| | 3,066 | | | International Flavors & Fragrances, Inc. | | | 374,083 | |
| | 3,809 | | | The Sherwin-Williams Co. | | | 2,179,967 | |
| | | | | | | | |
| | | | | | | 2,554,050 | |
| | |
| Commercial Services & Supplies* – 1.0% | |
| | 43,819 | | | IAA, Inc. | | | 1,671,695 | |
| | |
| Communications Equipment – 2.1% | |
| | 55,615 | | | Cisco Systems, Inc. | | | 2,642,268 | |
| | 6,290 | | | Motorola Solutions, Inc. | | | 1,046,153 | |
| | | | | | | | |
| | | | | | | 3,688,421 | |
| | |
| Construction Materials – 1.0% | |
| | 11,604 | | | Vulcan Materials Co. | | | 1,657,863 | |
| | |
| | | | | | | | |
|
| Common Stocks – (continued) | |
| Consumer Finance – 1.9% | |
| | 28,506 | | | American Express Co. | | | 3,343,184 | |
| | |
| Diversified Financial Services* – 5.1% | |
| | 41,198 | | | Berkshire Hathaway, Inc. Class B | | | 8,757,871 | |
| | |
| Diversified Telecommunication Services – 2.0% | |
| | 23,650 | | | AT&T, Inc. | | | 910,289 | |
| | 59,060 | | | Cellnex Telecom SA*(a) | | | 2,548,370 | |
| | | | | | | | |
| | | | | | | 3,458,659 | |
| | |
| Electronic Equipment, Instruments & Components* – 1.4% | |
| | 24,532 | | | Keysight Technologies, Inc. | | | 2,475,524 | |
| | |
| Entertainment – 4.7% | |
| | 34,213 | | | Electronic Arts, Inc.* | | | 3,298,133 | |
| | 26,075 | | | The Walt Disney Co. | | | 3,387,664 | |
| | 26,024 | | | World Wrestling Entertainment, Inc. Class A | | | 1,458,385 | |
| | | | | | | | |
| | | | | | | 8,144,182 | |
| | |
| Equity Real Estate Investment Trusts (REITs) – 0.8% | |
| | 52,864 | | | The Macerich Co. | | | 1,453,760 | |
| | |
| Food & Staples Retailing – 2.9% | |
| | 105,104 | | | BJ’s Wholesale Club Holdings, Inc.* | | | 2,806,277 | |
| | 38,112 | | | Walgreens Boots Alliance, Inc. | | | 2,087,775 | |
| | | | | | | | |
| | | | | | | 4,894,052 | |
| | |
| Food Products – 0.3% | |
| | 9,330 | | | General Mills, Inc. | | | 474,524 | |
| | |
| Health Care Equipment & Supplies – 8.6% | |
| | 32,233 | | | Abbott Laboratories | | | 2,695,001 | |
| | 36,957 | | | Alcon, Inc.* | | | 2,190,441 | |
| | 26,100 | | | Baxter International, Inc. | | | 2,001,870 | |
| | 6,314 | | | Becton Dickinson & Co. | | | 1,616,384 | |
| | 31,238 | | | Boston Scientific Corp.* | | | 1,302,625 | |
| | 9,189 | | | Danaher Corp. | | | 1,266,428 | |
| | 34,510 | | | Medtronic PLC | | | 3,758,139 | |
| | | | | | | | |
| | | | | | | 14,830,888 | |
| | |
| Health Care Providers & Services – 1.9% | |
| | 3,680 | | | UnitedHealth Group, Inc. | | | 929,936 | |
| | 17,468 | | | Universal Health Services, Inc. Class B | | | 2,401,151 | |
| | | | | | | | |
| | | | | | | 3,331,087 | |
| | |
| Hotels, Restaurants & Leisure – 0.4% | |
| | 7,874 | | | Starbucks Corp. | | | 665,825 | |
| | |
| Household Durables – 3.7% | |
| | 38,984 | | | Lennar Corp. Class A | | | 2,323,447 | |
| | 1,097 | | | NVR, Inc.* | | | 3,989,339 | |
| | | | | | | | |
| | | | | | | 6,312,786 | |
| | |
| Industrial Conglomerates – 0.3% | |
| | 1,385 | | | Roper Technologies, Inc. | | | 466,690 | |
| | |
| Insurance – 1.3% | |
| | 41,841 | | | Aflac, Inc. | | | 2,224,268 | |
| | |
| | |
| 20 | | The accompanying notes are an integral part of these financial statements. |
MULTI-MANAGER U.S. DYNAMIC EQUITY FUND
| | | | | | | | |
Shares | | | Description | | Value | |
| | | | | | | | |
|
| Common Stocks – (continued) | |
| Interactive Media & Services* – 1.6% | |
| | 1,583 | | | Alphabet, Inc. Class A | | $ | 1,992,680 | |
| | 4,200 | | | Facebook, Inc. Class A | | | 804,930 | |
| | | | | | | | |
| | | | | | | 2,797,610 | |
| | |
| Internet & Direct Marketing Retail – 1.2% | |
| | 301 | | | Booking Holdings, Inc.* | | | 616,680 | |
| | 39,841 | | | eBay, Inc. | | | 1,404,395 | |
| | | | | | | | |
| | | | | | | 2,021,075 | |
| | |
| IT Services – 2.9% | |
| | 8,707 | | | Accenture PLC Class A | | | 1,614,452 | |
| | 8,805 | | | Fiserv, Inc.* | | | 934,563 | |
| | 2,840 | | | Mastercard, Inc. Class A | | | 786,140 | |
| | 6,139 | | | PayPal Holdings, Inc.* | | | 639,070 | |
| | 19,826 | | | Perspecta, Inc. | | | 526,182 | |
| | 20,305 | | | Sabre Corp. | | | 476,761 | |
| | | | | | | | |
| | | | | | | 4,977,168 | |
| | |
| Leisure Products – 0.3% | |
| | 9,250 | | | Brunswick Corp. | | | 538,720 | |
| | |
| Life Sciences Tools & Services – 0.7% | |
| | 3,314 | | | PRA Health Sciences, Inc.* | | | 323,811 | |
| | 2,935 | | | Thermo Fisher Scientific, Inc. | | | 886,311 | |
| | | | | | | | |
| | | | | | | 1,210,122 | |
| | |
| Machinery – 0.4% | |
| | 3,548 | | | Cummins, Inc. | | | 611,959 | |
| | |
| Media – 3.0% | |
| | 42,028 | | | Comcast Corp. Class A | | | 1,883,695 | |
| | 118,279 | | | Discovery, Inc. Class A* | | | 3,188,210 | |
| | | | | | | | |
| | | | | | | 5,071,905 | |
| | |
| Metals & Mining – 0.3% | |
| | 18,775 | | | Wheaton Precious Metals Corp. | | | 527,014 | |
| | |
| Multiline Retail – 2.9% | |
| | 11,900 | | | Dollar Tree, Inc.* | | | 1,313,760 | |
| | 34,749 | | | Target Corp. | | | 3,715,016 | |
| | | | | | | | |
| | | | | | | 5,028,776 | |
| | |
| Oil, Gas & Consumable Fuels – 2.6% | |
| | 57,050 | | | Cameco Corp. | | | 509,457 | |
| | 175,700 | | | Kosmos Energy Ltd. | | | 1,089,340 | |
| | 58,721 | | | Occidental Petroleum Corp. | | | 2,378,200 | |
| | 4,075 | | | Pioneer Natural Resources Co. | | | 501,307 | |
| | | | | | | | |
| | | | | | | 4,478,304 | |
| | |
| Pharmaceuticals – 5.1% | |
| | 171,875 | | | Elanco Animal Health, Inc.* | | | 4,644,062 | |
| | 4,025 | | | Johnson & Johnson | | | 531,461 | |
| | 24,306 | | | Merck & Co., Inc. | | | 2,106,358 | |
| | 40,396 | | | Pfizer, Inc. | | | 1,549,995 | |
| | | | | | | | |
| | | | | | | 8,831,876 | |
| | |
| | | | | | | | |
|
| Common Stocks – (continued) | |
| Professional Services – 0.7% | |
| | 6,073 | | | Equifax, Inc. | | | 830,240 | |
| | 3,175 | | | Insperity, Inc. | | | 335,375 | |
| | | | | | | | |
| | | | | | | 1,165,615 | |
| | |
| Real Estate Management & Development – 0.3% | |
| | 3,341 | | | Jones Lang LaSalle, Inc. | | | 489,523 | |
| | |
| Road & Rail – 1.7% | |
| | 2,287 | | | Kansas City Southern | | | 321,964 | |
| | 21,600 | | | Knight-Swift Transportation Holdings, Inc. | | | 787,536 | |
| | 862 | | | Old Dominion Freight Line, Inc. | | | 156,953 | |
| | 9,956 | | | Union Pacific Corp. | | | 1,647,320 | |
| | | | | | | | |
| | | | | | | 2,913,773 | |
| | |
| Semiconductors & Semiconductor Equipment – 3.4% | |
| | 12,935 | | | Analog Devices, Inc. | | | 1,379,259 | |
| | 26,861 | | | QUALCOMM, Inc. | | | 2,160,699 | |
| | 16,296 | | | Skyworks Solutions, Inc. | | | 1,483,914 | |
| | 6,475 | | | Texas Instruments, Inc. | | | 763,985 | |
| | | | | | | | |
| | | | | | | 5,787,857 | |
| | |
| Software – 1.6% | |
| | 8,442 | | | Check Point Software Technologies Ltd.* | | | 948,965 | |
| | 8,400 | | | Microsoft Corp. | | | 1,204,308 | |
| | 7,313 | | | Varonis Systems, Inc.* | | | 523,245 | |
| | | | | | | | |
| | | | | | | 2,676,518 | |
| | |
| Specialty Retail – 3.0% | |
| | 10,091 | | | Lowe’s Cos., Inc. | | | 1,126,256 | |
| | 17,434 | | | The Home Depot, Inc. | | | 4,089,668 | |
| | | | | | | | |
| | | | | | | 5,215,924 | |
| | |
| Technology Hardware, Storage & Peripherals* – 0.3% | |
| | 23,541 | | | Pure Storage, Inc. Class A | | | 458,108 | |
| | |
| | TOTAL COMMON STOCKS | |
| | (Cost $128,382,522) | | $ | 163,698,428 | |
| | |
| | |
| Shares | | | Dividend Rate | | Value | |
|
| Investment Company(b) – 4.7% | |
| Goldman Sachs Financial Square Government Fund –
Institutional Shares |
|
| | 8,028,001 | | | 1.701% | | $ | 8,028,001 | |
| | (Cost $8,028,001) | |
| | |
| | TOTAL INVESTMENTS – 100.1% | |
| | (Cost $136,410,523) | | $ | 171,726,429 | |
| | |
| LIABILITIES IN EXCESS OF
OTHER ASSETS – (0.1)% | | | (149,914 | ) |
| | |
| | NET ASSETS – 100.0% | | $ | 171,576,515 | |
| | |
| | |
| The accompanying notes are an integral part of these financial statements. | | 21 |
MULTI-MANAGER U.S. DYNAMIC EQUITY FUND
Schedule of Investments(continued)
October 31, 2019
| | |
|
| The percentage shown for each investment category reflects the value of investments in that category as a percentage of net assets. |
| |
* | | Non-income producing security. |
| |
(a) | | Exempt from registration under Rule 144A of the Securities Act of 1933. |
| |
(b) | | Represents an affiliated issuer. |
| | |
|
Currency Abbreviations: |
EUR | | —Euro |
GBP | | —British Pound |
USD | | —U.S. Dollar |
|
Investment Abbreviations: |
PLC | | —Public Limited Company |
|
|
| ADDITIONAL INVESTMENT INFORMATION |
FORWARD FOREIGN CURRENCY EXCHANGE CONTRACTS — At October 31, 2019, the Fund had the following forward foreign currency exchange contracts:
FORWARD FOREIGN CURRENCY EXCHANGE CONTRACTS WITH UNREALIZED GAIN
| | | | | | | | | | | | | | | | | | | | |
| Counterparty | | Currency Purchased | | | Currency Sold | | | Settlement
Date | | | Unrealized
Gain | |
MS & Co. Int. PLC | | EUR | | | 542,000 | | | USD | | | 598,853 | | | | 12/18/19 | | | $ | 7,764 | |
| | | GBP | | | 375,000 | | | USD | | | 482,884 | | | | 12/18/19 | | | | 3,706 | |
| | | | | | |
| TOTAL | | | | | | | | | | | | | | | | | | $ | 11,470 | |
FORWARD FOREIGN CURRENCY EXCHANGE CONTRACTS WITH UNREALIZED LOSS
| | | | | | | | | | | | | | | | | | | | |
| Counterparty | | Currency Purchased | | | Currency Sold | | | Settlement
Date | | | Unrealized
Loss | |
MS & Co. Int. PLC | | USD | | | 6,829,823 | | | EUR | | | 6,160,000 | | | | 12/18/19 | | | $ | (64,583 | ) |
| | | USD | | | 1,017,829 | | | GBP | | | 816,000 | | | | 12/18/19 | | | | (40,991 | ) |
| | | | | | |
| TOTAL | | | | | | | | | | | | | | | | | | $ | (105,574 | ) |
| | |
|
Abbreviations: |
MS & Co. Int. PLC | | —Morgan Stanley & Co. International PLC |
|
| | |
| 22 | | The accompanying notes are an integral part of these financial statements. |
MULTI-MANAGER U.S. SMALL CAP EQUITY FUND
Schedule of Investments
October 31, 2019
| | | | | | | | |
Shares | | | Description | | Value | |
| | | | | | | | |
|
| Common Stocks – 94.4% | |
| Aerospace & Defense – 1.8% | |
| | 4,800 | | | AAR Corp. | | $ | 200,400 | |
| | 13,100 | | | Aerojet Rocketdyne Holdings, Inc.* | | | 566,313 | |
| | 30,362 | | | BWX Technologies, Inc. | | | 1,764,032 | |
| | 4,813 | | | Curtiss-Wright Corp. | | | 650,958 | |
| | 8,515 | | | HEICO Corp. | | | 1,050,240 | |
| | 20,570 | | | Hexcel Corp. | | | 1,534,934 | |
| | 6,461 | | | Mercury Systems, Inc.* | | | 475,917 | |
| | 3,300 | | | Moog, Inc. Class A | | | 276,243 | |
| | 2,700 | | | Vectrus, Inc.* | | | 123,417 | |
| | | | | | | | |
| | | | | | | 6,642,454 | |
| | |
| Air Freight & Logistics* – 0.2% | |
| | 12,800 | | | Hub Group, Inc. Class A | | | 586,240 | |
| | 44,500 | | | Radiant Logistics, Inc. | | | 239,855 | |
| | | | | | | | |
| | | | | | | 826,095 | |
| | |
| Airlines* – 0.2% | |
| | 13,100 | | | Mesa Air Group, Inc. | | | 99,822 | |
| | 13,076 | | | Spirit Airlines, Inc. | | | 491,135 | |
| | | | | | | | |
| | | | | | | 590,957 | |
| | |
| Auto Components – 0.7% | |
| | 13,100 | | | Dana, Inc. | | | 212,613 | |
| | 18,198 | | | LCI Industries | | | 1,767,390 | |
| | 18,800 | | | Modine Manufacturing Co.* | | | 214,884 | |
| | 10,299 | | | Standard Motor Products, Inc. | | | 539,255 | |
| | | | | | | | |
| | | | | | | 2,734,142 | |
| | |
| Banks – 7.1% | |
| | 1,100 | | | ACNB Corp. | | | 38,929 | |
| | 6,000 | | | Amalgamated Bank Class A | | | 109,260 | |
| | 6,500 | | | Ameris Bancorp | | | 278,525 | |
| | 42,250 | | | BankUnited, Inc. | | | 1,449,175 | |
| | 10,100 | | | Berkshire Hills Bancorp, Inc. | | | 313,403 | |
| | 52,324 | | | Boston Private Financial Holdings, Inc. | | | 588,645 | |
| | 3,200 | | | Bridge Bancorp, Inc. | | | 103,680 | |
| | 79,129 | | | Cadence BanCorp. | | | 1,217,004 | |
| | 12,900 | | | Cathay General Bancorp | | | 458,853 | |
| | 21,070 | | | CenterState Bank Corp. | | | 534,335 | |
| | 1,200 | | | Century Bancorp, Inc. Class A | | | 104,412 | |
| | 22,250 | | | Columbia Banking System, Inc. | | | 874,425 | |
| | 13,900 | | | ConnectOne Bancorp, Inc. | | | 337,492 | |
| | 5,000 | | | Customers Bancorp, Inc.* | | | 117,900 | |
| | 2,500 | | | FB Financial Corp. | | | 94,175 | |
| | 10,200 | | | Financial Institutions, Inc. | | | 320,586 | |
| | 18,100 | | | First Bancorp (Banks) | | | 296,609 | |
| | 1,444 | | | First Citizens BancShares, Inc. Class A | | | 710,333 | |
| | 24,600 | | | First Commonwealth Financial Corp. | | | 346,614 | |
| | 68,434 | | | First Hawaiian, Inc. | | | 1,870,301 | |
| | 22,580 | | | First Merchants Corp. | | | 893,039 | |
| | 27,536 | | | First Midwest Bancorp, Inc. | | | 565,589 | |
| | 900 | | | Great Southern Bancorp, Inc. | | | 54,378 | |
| | 25,900 | | | Hancock Whitney Corp. | | | 1,010,100 | |
| | 53,802 | | | Hanmi Financial Corp. | | | 1,035,689 | |
| | 2,500 | | | Heartland Financial USA, Inc. | | | 116,950 | |
| | 29,800 | | | Hilltop Holdings, Inc. | | | 696,128 | |
| | 13,900 | | | IBERIABANK Corp. | | | 1,020,121 | |
| | |
| | | | | | | | |
|
| Common Stocks – (continued) | |
| Banks – (continued) | |
| | 13,600 | | | International Bancshares Corp. | | | 557,056 | |
| | 13,900 | | | Live Oak Bancshares, Inc. | | | 252,285 | |
| | 6,100 | | | MidWestOne Financial Group, Inc. | | | 198,830 | |
| | 36,100 | | | OFG Bancorp | | | 733,191 | |
| | 5,100 | | | Old Second Bancorp, Inc. | | | 61,557 | |
| | 13,786 | | | Peapack Gladstone Financial Corp. | | | 402,551 | |
| | 8,824 | | | Preferred Bank | | | 470,407 | |
| | 21,541 | | | Prosperity Bancshares, Inc. | | | 1,486,760 | |
| | 9,100 | | | QCR Holdings, Inc. | | | 369,278 | |
| | 15,900 | | | Sandy Spring Bancorp, Inc. | | | 548,550 | |
| | 5,500 | | | SB One Bancorp | | | 121,440 | |
| | 4,000 | | | Sierra Bancorp | | | 108,960 | |
| | 36,400 | | | Simmons First National Corp. Class A | | | 870,688 | |
| | 8,000 | | | Southern National Bancorp of Virginia, Inc. | | | 126,720 | |
| | 35,065 | | | Synovus Financial Corp. | | | 1,187,652 | |
| | 42,100 | | | The Bancorp, Inc.* | | | 458,890 | |
| | 28,000 | | | The Bank of NT Butterfield & Son Ltd. | | | 922,600 | |
| | 2,100 | | | TriState Capital Holdings, Inc.* | | | 48,552 | |
| | 2,900 | | | Triumph Bancorp, Inc.* | | | 94,105 | |
| | 34,915 | | | Umpqua Holdings Corp. | | | 552,355 | |
| | 12,100 | | | Univest Financial Corp. | | | 311,575 | |
| | 27,052 | | | Webster Financial Corp. | | | 1,192,993 | |
| | | | | | | | |
| | | | | | | 26,633,645 | |
| | |
| Biotechnology* – 3.6% | |
| | 29,800 | | | ACADIA Pharmaceuticals, Inc. | | | 1,263,818 | |
| | 7,999 | | | Acceleron Pharma, Inc. | | | 358,915 | |
| | 45,100 | | | AMAG Pharmaceuticals, Inc. | | | 437,696 | |
| | 4,800 | | | Anika Therapeutics, Inc. | | | 337,872 | |
| | 10,200 | | | Athenex, Inc. | | | 112,608 | |
| | 20,822 | | | Biohaven Pharmaceutical Holding Co. Ltd. | | | 956,146 | |
| | 4,600 | | | BioSpecifics Technologies Corp. | | | 222,778 | |
| | 7,731 | | | Blueprint Medicines Corp. | | | 532,202 | |
| | 77,000 | | | Catalyst Pharmaceuticals, Inc. | | | 364,210 | |
| | 17,616 | | | Coherus Biosciences, Inc. | | | 305,990 | |
| | 20,100 | | | Concert Pharmaceuticals, Inc. | | | 125,223 | |
| | 56,700 | | | CytomX Therapeutics, Inc. | | | 347,571 | |
| | 1,100 | | | Eagle Pharmaceuticals, Inc. | | | 68,970 | |
| | 16,500 | | | Emergent BioSolutions, Inc. | | | 943,140 | |
| | 23,200 | | | FibroGen, Inc. | | | 908,280 | |
| | 10,330 | | | Global Blood Therapeutics, Inc. | | | 495,323 | |
| | 15,336 | | | Iovance Biotherapeutics, Inc. | | | 324,050 | |
| | 14,095 | | | Kura Oncology, Inc. | | | 211,143 | |
| | 11,463 | | | Neurocrine Biosciences, Inc. | | | 1,140,454 | |
| | 11,400 | | | Prothena Corp. PLC | | | 103,740 | |
| | 19,100 | | | PTC Therapeutics, Inc. | | | 780,999 | |
| | 25,600 | | | Recro Pharma, Inc. | | | 403,712 | |
| | 10,900 | | | Repligen Corp. | | | 866,441 | |
| | 27,800 | | | Retrophin, Inc. | | | 333,600 | |
| | 12,100 | | | Spectrum Pharmaceuticals, Inc. | | | 93,896 | |
| | 10,300 | | | Syndax Pharmaceuticals, Inc. | | | 69,216 | |
| | 600 | | | United Therapeutics Corp. | | | 53,904 | |
| | 56,900 | | | Vanda Pharmaceuticals, Inc. | | | 768,719 | |
| | 30,800 | | | Veracyte, Inc. | | | 706,244 | |
| | | | | | | | |
| | | | | | | 13,636,860 | |
| | |
| | |
| The accompanying notes are an integral part of these financial statements. | | 23 |
MULTI-MANAGER U.S. SMALL CAP EQUITY FUND
Schedule of Investments(continued)
October 31, 2019
| | | | | | | | |
Shares | | | Description | | Value | |
| | | | | | | | |
|
| Common Stocks – (continued) | |
| Building Products – 0.9% | |
| | 15,200 | | | Advanced Drainage Systems, Inc. | | $ | 562,704 | |
| | 6,200 | | | American Woodmark Corp.* | | | 614,792 | |
| | 12,500 | | | Builders FirstSource, Inc.* | | | 282,625 | |
| | 800 | | | CSW Industrials, Inc. | | | 55,376 | |
| | 36,200 | | | JELD-WEN Holding, Inc.* | | | 618,658 | |
| | 12,700 | | | Quanex Building Products Corp. | | | 244,983 | |
| | 21,900 | | | Universal Forest Products, Inc. | | | 1,102,884 | |
| | | | | | | | |
| | | | | | | 3,482,022 | |
| | |
| Capital Markets – 1.4% | |
| | 42,079 | | | Ares Management Corp. Class A | | | 1,244,276 | |
| | 180 | | | Ashford, Inc.* | | | 4,300 | |
| | 64,700 | | | Brightsphere Investment Group, Inc.* | | | 635,354 | |
| | 27,800 | | | Donnelley Financial Solutions, Inc.* | | | 314,140 | |
| | 11,541 | | | Evercore, Inc. Class A | | | 849,879 | |
| | 13,881 | | | Hamilton Lane, Inc. Class A | | | 827,585 | |
| | 7,000 | | | Oppenheimer Holdings, Inc. Class A | | | 190,400 | |
| | 17,900 | | | Stifel Financial Corp. | | | 1,002,042 | |
| | 1,900 | | | Virtus Investment Partners, Inc. | | | 206,112 | |
| | | | | | | | |
| | | | | | | 5,274,088 | |
| | |
| Chemicals – 2.2% | |
| | 28,815 | | | Ferro Corp.* | | | 320,711 | |
| | 22,200 | | | Koppers Holdings, Inc.* | | | 712,620 | |
| | 41,400 | | | Kronos Worldwide, Inc. | | | 524,952 | |
| | 20,959 | | | Minerals Technologies, Inc. | | | 1,036,422 | |
| | 10,000 | | | Orion Engineered Carbons SA | | | 165,600 | |
| | 27,100 | | | PolyOne Corp. | | | 868,555 | |
| | 79,191 | | | PQ Group Holdings, Inc.* | | | 1,304,276 | |
| | 32,466 | | | Trinseo SA | | | 1,379,805 | |
| | 101,891 | | | Valvoline, Inc. | | | 2,174,354 | |
| | | | | | | | |
| | | | | | | 8,487,295 | |
| | |
| Commercial Services & Supplies – 4.7% | |
| | 36,080 | | | ABM Industries, Inc. | | | 1,315,477 | |
| | 129,961 | | | ACCO Brands Corp. | | | 1,189,143 | |
| | 18,300 | | | CECO Environmental Corp.* | | | 125,538 | |
| | 18,200 | | | Deluxe Corp. | | | 943,306 | |
| | 1,000 | | | Herman Miller, Inc. | | | 46,500 | |
| | 64,961 | | | IAA, Inc.* | | | 2,478,262 | |
| | 47,554 | | | KAR Auction Services, Inc. | | | 1,182,193 | |
| | 32,400 | | | Knoll, Inc. | | | 866,376 | |
| | 7,200 | | | Mobile Mini, Inc. | | | 270,864 | |
| | 7,147 | | | MSA Safety, Inc. | | | 858,140 | |
| | 16,300 | | | SP Plus Corp.* | | | 719,971 | |
| | 39,800 | | | Steelcase, Inc. Class A | | | 695,306 | |
| | 21,636 | | | Tetra Tech, Inc. | | | 1,892,501 | |
| | 4,700 | | | UniFirst Corp. | | | 943,948 | |
| | 43,871 | | | Waste Connections, Inc. | | | 4,053,680 | |
| | | | | | | | |
| | | | | | | 17,581,205 | |
| | |
| Communications Equipment – 0.9% | |
| | 10,000 | | | Acacia Communications, Inc.* | | | 656,600 | |
| | 3,000 | | | ADTRAN, Inc. | | | 26,430 | |
| | 44,140 | | | Ciena Corp.* | | | 1,638,477 | |
| | 14,400 | | | Comtech Telecommunications Corp. | | | 503,280 | |
| | 2,500 | | | Digi International, Inc.* | | | 36,050 | |
| | |
| | | | | | | | |
|
| Common Stocks – (continued) | |
| Communications Equipment – (continued) | |
| | 107,600 | | | Extreme Networks, Inc.* | | | 692,944 | |
| | | | | | | | |
| | | | | | | 3,553,781 | |
| | |
| Construction & Engineering – 1.3% | |
| | 61,018 | | | Aegion Corp.* | | | 1,322,260 | |
| | 12,200 | | | EMCOR Group, Inc. | | | 1,070,062 | |
| | 10,098 | | | Granite Construction, Inc. | | | 237,707 | |
| | 2,000 | | | Great Lakes Dredge & Dock Corp.* | | | 21,500 | |
| | 14,600 | | | MasTec, Inc.* | | | 918,924 | |
| | 29,600 | | | Primoris Services Corp. | | | 605,024 | |
| | 40,388 | | | Tutor Perini Corp.* | | | 624,802 | |
| | | | | | | | |
| | | | | | | 4,800,279 | |
| | |
| Construction Materials* – 0.1% | |
| | 3,700 | | | US Concrete, Inc. | | | 193,362 | |
| | |
| Consumer Finance – 2.0% | |
| | 9,711 | | | FirstCash, Inc. | | | 819,511 | |
| | 124,016 | | | Navient Corp. | | | 1,707,701 | |
| | 26,819 | | | Nelnet, Inc. Class A | | | 1,643,200 | |
| | 20,888 | | | PRA Group, Inc.* | | | 708,730 | |
| | 7,800 | | | Regional Management Corp.* | | | 225,654 | |
| | 293,459 | | | SLM Corp. | | | 2,476,794 | |
| | | | | | | | |
| | | | | | | 7,581,590 | |
| | |
| Containers & Packaging – 1.3% | |
| | 233,090 | | | Graphic Packaging Holding Co. | | | 3,650,189 | |
| | 21,900 | | | Greif, Inc. Class A | | | 857,823 | |
| | 54,610 | | | Owens-Illinois, Inc. | | | 464,185 | |
| | | | | | | | |
| | | | | | | 4,972,197 | |
| | |
| Distributors – 0.1% | |
| | 16,000 | | | Core-Mark Holding Co., Inc. | | | 488,320 | |
| | |
| Diversified Consumer Services – 2.1% | |
| | 11,300 | | | Adtalem Global Education, Inc.* | | | 336,514 | |
| | 23,859 | | | Bright Horizons Family Solutions, Inc.* | | | 3,543,539 | |
| | 13,100 | | | Career Education Corp.* | | | 185,496 | |
| | 6,800 | | | Carriage Services, Inc. | | | 175,168 | |
| | 42,575 | | | Chegg, Inc.* | | | 1,305,349 | |
| | 1,700 | | | Collectors Universe, Inc. | | | 48,722 | |
| | 26,672 | | | frontdoor, Inc.* | | | 1,286,391 | |
| | 45,200 | | | Laureate Education, Inc. Class A* | | | 698,566 | |
| | 10,000 | | | WW International, Inc. | | | 348,700 | |
| | | | | | | | |
| | | | | | | 7,928,445 | |
| | |
| Diversified Financial Services – 0.2% | |
| | 94,700 | | | FGL Holdings | | | 855,141 | |
| | |
| Diversified Telecommunication Services – 0.7% | |
| | 900 | | | ATN International, Inc. | | | 53,307 | |
| | 38,301 | | | GCI Liberty, Inc. Class A* | | | 2,680,304 | |
| | | | | | | | |
| | | | | | | 2,733,611 | |
| | |
| Electric Utilities – 0.4% | |
| | 7,600 | | | ALLETE, Inc. | | | 654,056 | |
| | 1,400 | | | MGE Energy, Inc. | | | 107,856 | |
| | 16,200 | | | Portland General Electric Co. | | | 921,456 | |
| | | | | | | | |
| | | | | | | 1,683,368 | |
| | |
| | |
| 24 | | The accompanying notes are an integral part of these financial statements. |
MULTI-MANAGER U.S. SMALL CAP EQUITY FUND
| | | | | | | | |
Shares | | | Description | | Value | |
| | | | | | | | |
|
| Common Stocks – (continued) | |
| Electrical Equipment – 0.8% | |
| | 21,300 | | | Atkore International Group, Inc.* | | $ | 739,110 | |
| | 3,200 | | | AZZ, Inc. | | | 124,128 | |
| | 33,553 | | | EnerSys | | | 2,243,354 | |
| | | | | | | | |
| | | | | | | 3,106,592 | |
| | |
| Electronic Equipment, Instruments & Components – 3.0% | |
| | 18,584 | | | Anixter International, Inc.* | | | 1,537,826 | |
| | 29,994 | | | Belden, Inc. | | | 1,538,092 | |
| | 36,309 | | | Insight Enterprises, Inc.* | | | 2,228,646 | |
| | 12,300 | | | Itron, Inc.* | | | 937,998 | |
| | 6,266 | | | Littelfuse, Inc. | | | 1,100,122 | |
| | 3,700 | | | Methode Electronics, Inc. | | | 127,280 | |
| | 2,900 | | | OSI Systems, Inc.* | | | 287,796 | |
| | 18,698 | | | SYNNEX Corp. | | | 2,201,503 | |
| | 10,000 | | | Tech Data Corp.* | | | 1,215,000 | |
| | | | | | | | |
| | | | | | | 11,174,263 | |
| | |
| Energy Equipment & Services – 0.9% | |
| | 18,551 | | | Apergy Corp.* | | | 466,928 | |
| | 61,000 | | | Archrock, Inc. | | | 588,040 | |
| | 43,144 | | | Cactus, Inc. Class A* | | | 1,282,240 | |
| | 7,400 | | | DMC Global, Inc. | | | 331,076 | |
| | 27,300 | | | Matrix Service Co.* | | | 512,148 | |
| | 5,800 | | | Tidewater, Inc.* | | | 94,134 | |
| | | | | | | | |
| | | | | | | 3,274,566 | |
| | |
| Entertainment – 0.5% | |
| | 7,600 | | | The Marcus Corp. | | | 274,360 | |
| | 265,301 | | | Zynga, Inc. Class A* | | | 1,636,907 | |
| | | | | | | | |
| | | | | | | 1,911,267 | |
| | |
| Equity Real Estate Investment Trusts (REITs) – 3.5% | |
| | 7,200 | | | American Assets Trust, Inc. | | | 352,512 | |
| | 22,900 | | | Armada Hoffler Properties, Inc. | | | 429,146 | |
| | 21,700 | | | Ashford Hospitality Trust, Inc. | | | 59,241 | |
| | 30,600 | | | Braemar Hotels & Resorts, Inc. | | | 282,438 | |
| | 9,300 | | | Cedar Realty Trust, Inc. | | | 31,062 | |
| | 29,873 | | | Chatham Lodging Trust | | | 539,208 | |
| | 45,500 | | | City Office REIT, Inc. | | | 616,070 | |
| | 69,189 | | | Colony Capital, Inc. | | | 387,458 | |
| | 11,300 | | | Columbia Property Trust, Inc. | | | 231,876 | |
| | 42,000 | | | CoreCivic, Inc. | | | 640,920 | |
| | 10,779 | | | Cousins Properties, Inc. | | | 432,561 | |
| | 86,200 | | | DiamondRock Hospitality Co. | | | 860,276 | |
| | 31,000 | | | Franklin Street Properties Corp. | | | 266,600 | |
| | 14,200 | | | Hersha Hospitality Trust | | | 195,960 | |
| | 49,800 | | | Kite Realty Group Trust | | | 887,436 | |
| | 4,300 | | | Lexington Realty Trust | | | 46,784 | |
| | 34,900 | | | Paramount Group, Inc. | | | 470,103 | |
| | 48,937 | | | Retail Properties of America, Inc. Class A | | | 673,373 | |
| | 54,800 | | | RLJ Lodging Trust | | | 899,268 | |
| | 800 | | | RPT Realty | | | 11,600 | |
| | 11,800 | | | Ryman Hospitality Properties, Inc. | | | 993,206 | |
| | 8,400 | | | Sabra Health Care REIT, Inc. | | | 206,640 | |
| | 81,100 | | | Senior Housing Properties Trust | | | 804,917 | |
| | 9,634 | | | Spirit Realty Capital, Inc. | | | 480,159 | |
| | |
| | | | | | | | |
|
| Common Stocks – (continued) | |
| Equity Real Estate Investment Trusts (REITs) – (continued) | |
| | 68,400 | | | Sunstone Hotel Investors, Inc. | | | 924,084 | |
| | 39,700 | | | The Geo Group, Inc. | | | 604,234 | |
| | 33,300 | | | Xenia Hotels & Resorts, Inc. | | | 700,965 | |
| | | | | | | | |
| | | | | | | 13,028,097 | |
| | |
| Food & Staples Retailing – 0.4% | |
| | 7,711 | | | Casey’s General Stores, Inc. | | | 1,317,116 | |
| | 21,800 | | | United Natural Foods, Inc.* | | | 163,500 | |
| | | | | | | | |
| | | | | | | 1,480,616 | |
| | |
| Food Products – 1.3% | |
| | 6,700 | | | B&G Foods, Inc. | | | 104,185 | |
| | 2,901 | | | Calavo Growers, Inc. | | | 251,604 | |
| | 50,000 | | | Darling Ingredients, Inc.* | | | 965,000 | |
| | 22,437 | | | Fresh Del Monte Produce, Inc. | | | 715,740 | |
| | 8,100 | | | John B. Sanfilippo & Son, Inc. | | | 859,572 | |
| | 84,599 | | | The Hain Celestial Group, Inc.* | | | 1,999,920 | |
| | | | | | | | |
| | | | | | | 4,896,021 | |
| | |
| Gas Utilities – 0.3% | |
| | 4,000 | | | Chesapeake Utilities Corp. | | | 379,200 | |
| | 7,700 | | | Spire, Inc. | | | 647,262 | |
| | | | | | | | |
| | | | | | | 1,026,462 | |
| | |
| Health Care Equipment & Supplies – 2.0% | |
| | 11,700 | | | AngioDynamics, Inc.* | | | 179,010 | |
| | 440 | | | Atrion Corp. | | | 371,109 | |
| | 9,400 | | | CONMED Corp. | | | 1,034,188 | |
| | 1,330 | | | Establishment Labs Holdings, Inc.* | | | 24,672 | |
| | 5,700 | | | Haemonetics Corp.* | | | 688,161 | |
| | 11,800 | | | Integer Holdings Corp.* | | | 913,792 | |
| | 37,132 | | | Integra LifeSciences Holdings Corp.* | | | 2,155,884 | |
| | 26,000 | | | Lantheus Holdings, Inc.* | | | 542,100 | |
| | 4,700 | | | LivaNova PLC* | | | 332,431 | |
| | 20,900 | | | Natus Medical, Inc.* | | | 703,912 | |
| | 3,221 | | | OrthoPediatrics Corp.* | | | 124,588 | |
| | 9,100 | | | Quidel Corp.* | | | 517,790 | |
| | 2,900 | | | Varex Imaging Corp.* | | | 87,029 | |
| | | | | | | | |
| | | | | | | 7,674,666 | |
| | |
| Health Care Providers & Services – 1.4% | |
| | 6,600 | | | AMN Healthcare Services, Inc.* | | | 387,816 | |
| | 4,436 | | | Chemed Corp. | | | 1,747,385 | |
| | 6,789 | | | HealthEquity, Inc.* | | | 385,547 | |
| | 7,984 | | | Henry Schein, Inc.* | | | 499,679 | |
| | 12,600 | | | Magellan Health, Inc.* | | | 817,740 | |
| | 1,600 | | | National HealthCare Corp. | | | 131,488 | |
| | 20,035 | | | Patterson Cos., Inc. | | | 343,199 | |
| | 14,100 | | | Select Medical Holdings Corp.* | | | 256,902 | |
| | 18,600 | | | Tenet Healthcare Corp.* | | | 471,324 | |
| | 17,463 | | | Triple-S Management Corp. Class B* | | | 264,215 | |
| | | | | | | | |
| | | | | | | 5,305,295 | |
| | |
| Health Care Technology – 0.9% | |
| | 86,900 | | | Allscripts Healthcare Solutions, Inc.* | | | 950,686 | |
| | 9,600 | | | Computer Programs & Systems, Inc. | | | 221,472 | |
| | 3,500 | | | HMS Holdings Corp.* | | | 114,415 | |
| | |
| | |
| The accompanying notes are an integral part of these financial statements. | | 25 |
MULTI-MANAGER U.S. SMALL CAP EQUITY FUND
Schedule of Investments(continued)
October 31, 2019
| | | | | | | | |
Shares | | | Description | | Value | |
| | | | | | | | |
|
| Common Stocks – (continued) | |
| Health Care Technology – (continued) | |
| | 8,600 | | | NextGen Healthcare, Inc.* | | $ | 145,383 | |
| | 9,100 | | | Omnicell, Inc.* | | | 640,549 | |
| | 13,397 | | | Phreesia, Inc.* | | | 396,953 | |
| | 12,500 | | | Simulations Plus, Inc. | | | 442,625 | |
| | 10,897 | | | Tabula Rasa HealthCare, Inc.* | | | 555,093 | |
| | | | | | | | |
| | | | | | | 3,467,176 | |
| | |
| Hotels, Restaurants & Leisure – 1.8% | |
| | 9,700 | | | BBX Capital Corp. | | | 43,359 | |
| | 20,300 | | | Brinker International, Inc. | | | 902,335 | |
| | 33,778 | | | Carrols Restaurant Group, Inc.* | | | 240,837 | |
| | 17,200 | | | Century Casinos, Inc.* | | | 127,108 | |
| | 23,394 | | | Choice Hotels International, Inc. | | | 2,069,901 | |
| | 7,900 | | | Del Taco Restaurants, Inc.* | | | 60,317 | |
| | 46,226 | | | Extended Stay America, Inc. | | | 656,872 | |
| | 9,200 | | | Jack in the Box, Inc. | | | 772,984 | |
| | 38,077 | | | Lindblad Expeditions Holdings, Inc.* | | | 599,332 | |
| | 44,000 | | | Penn National Gaming, Inc.* | | | 937,860 | |
| | 4,500 | | | Target Hospitality Corp.* | | | 24,930 | |
| | 1,700 | | | Texas Roadhouse, Inc. | | | 96,050 | |
| | 16,640 | | | The Habit Restaurants, Inc. Class A* | | | 174,886 | |
| | 6,200 | | | Twin River Worldwide Holdings, Inc. | | | 155,620 | |
| | | | | | | | |
| | | | | | | 6,862,391 | |
| | |
| Household Durables – 1.6% | |
| | 1,900 | | | Cavco Industries, Inc.* | | | 364,135 | |
| | 7,900 | | | Hooker Furniture Corp. | | | 186,993 | |
| | 11,397 | | | La-Z-Boy, Inc. | | | 404,708 | |
| | 22,700 | | | M/I Homes, Inc.* | | | 1,002,886 | |
| | 7,900 | | | MDC Holdings, Inc. | | | 305,809 | |
| | 13,300 | | | Meritage Homes Corp.* | | | 958,797 | |
| | 19,200 | | | Taylor Morrison Home Corp.* | | | 480,960 | |
| | 21,554 | | | TopBuild Corp.* | | | 2,240,107 | |
| | 9,500 | | | TRI Pointe Group, Inc.* | | | 149,530 | |
| | 1,700 | | | Universal Electronics, Inc.* | | | 88,604 | |
| | | | | | | | |
| | | | | | | 6,182,529 | |
| | |
| Household Products – 0.6% | |
| | 39,989 | | | Energizer Holdings, Inc. | | | 1,699,132 | |
| | 10,589 | | | Spectrum Brands Holdings, Inc. | | | 531,674 | |
| | | | | | | | |
| | | | | | | 2,230,806 | |
| | |
| Insurance – 3.0% | |
| | 38,500 | | | American Equity Investment Life Holding Co. | | | 950,180 | |
| | 7,000 | | | Argo Group International Holdings Ltd. | | | 433,090 | |
| | 49,085 | | | Assured Guaranty Ltd. | | | 2,303,068 | |
| | 9,291 | | | Axis Capital Holdings Ltd. | | | 552,164 | |
| | 60,600 | | | Genworth Financial, Inc. Class A* | | | 259,368 | |
| | 18,742 | | | Global Indemnity Ltd. | | | 464,052 | |
| | 28,200 | | | Heritage Insurance Holdings, Inc. | | | 375,624 | |
| | 84,997 | | | National General Holdings Corp. | | | 1,812,136 | |
| | 22,308 | | | ProAssurance Corp. | | | 874,920 | |
| | 10,100 | | | Selective Insurance Group, Inc. | | | 698,112 | |
| | 6,970 | | | The Hanover Insurance Group, Inc. | | | 918,019 | |
| | 1,600 | | | White Mountains Insurance Group Ltd. | | | 1,713,600 | |
| | | | | | | | |
| | | | | | | 11,354,333 | |
| | |
| | | | | | | | |
|
| Common Stocks – (continued) | |
| Interactive Media & Services* – 0.5% | |
| | 74,600 | | | Cars.com, Inc. | | | 843,726 | |
| | 27,300 | | | Liberty TripAdvisor Holdings, Inc. Class A | | | 263,445 | |
| | 26,834 | | | Yelp, Inc. | | | 926,041 | |
| | | | | | | | |
| | | | | | | 2,033,212 | |
| | |
| Internet & Direct Marketing Retail* – 1.2% | |
| | 45,900 | | | 1-800-Flowers.com, Inc. Class A | | | 654,534 | |
| | 46,886 | | | Despegar.com Corp. | | | 524,186 | |
| | 29,769 | | | Etsy, Inc. | | | 1,324,423 | |
| | 24,800 | | | Groupon, Inc. | | | 68,944 | |
| | 63,145 | | | MakeMyTrip Ltd. | | | 1,453,598 | |
| | 28,012 | | | Stitch Fix, Inc. Class A | | | 640,354 | |
| | | | | | | | |
| | | | | | | 4,666,039 | |
| | |
| IT Services – 4.8% | |
| | 6,876 | | | Broadridge Financial Solutions, Inc. | | | 861,013 | |
| | 18,000 | | | Cardtronics PLC Class A* | | | 616,680 | |
| | 18,778 | | | EVERTEC, Inc. | | | 574,419 | |
| | 74,679 | | | Evo Payments, Inc. Class A* | | | 2,123,124 | |
| | 88,700 | | | Genpact Ltd. | | | 3,474,379 | |
| | 38,600 | | | KBR, Inc. | | | 1,086,976 | |
| | 19,832 | | | MAXIMUS, Inc. | | | 1,521,908 | |
| | 39,200 | | | Perspecta, Inc. | | | 1,040,368 | |
| | 12,210 | | | Science Applications International Corp. | | | 1,008,790 | |
| | 48,342 | | | Sykes Enterprises, Inc.* | | | 1,493,526 | |
| | 44,784 | | | TTEC Holdings, Inc. | | | 2,121,418 | |
| | 20,000 | | | Virtusa Corp.* | | | 745,600 | |
| | 7,439 | | | WEX, Inc.* | | | 1,407,310 | |
| | | | | | | | |
| | | | | | | 18,075,511 | |
| | |
| Leisure Products – 0.5% | |
| | 44,555 | | | Clarus Corp. | | | 568,076 | |
| | 20,500 | | | Malibu Boats, Inc. Class A* | | | 668,710 | |
| | 29,400 | | | MasterCraft Boat Holdings, Inc.* | | | 463,050 | |
| | | | | | | | |
| | | | | | | 1,699,836 | |
| | |
| Life Sciences Tools & Services* – 2.0% | |
| | 19,860 | | | Charles River Laboratories International, Inc. | | | 2,581,403 | |
| | 6,638 | | | ICON PLC | | | 975,122 | |
| | 5,700 | | | Medpace Holdings, Inc. | | | 419,691 | |
| | 61,405 | | | NeoGenomics, Inc. | | | 1,408,017 | |
| | 43,931 | | | Syneos Health, Inc. | | | 2,203,139 | |
| | | | | | | | |
| | | | | | | 7,587,372 | |
| | |
| Machinery – 2.6% | |
| | 52,000 | | | Commercial Vehicle Group, Inc.* | | | 379,080 | |
| | 7,895 | | | ESCO Technologies, Inc. | | | 667,048 | |
| | 3,300 | | | Federal Signal Corp. | | | 107,052 | |
| | 40,900 | | | Gates Industrial Corp. PLC* | | | 409,000 | |
| | 8,700 | | | Hillenbrand, Inc. | | | 267,873 | |
| | 1,700 | | | Hyster-Yale Materials Handling, Inc. | | | 86,224 | |
| | 7,649 | | | IDEX Corp. | | | 1,189,649 | |
| | 9,327 | | | John Bean Technologies Corp. | | | 958,536 | |
| | 5,100 | | | Kennametal, Inc. | | | 157,845 | |
| | 32,300 | | | Meritor, Inc.* | | | 711,569 | |
| | |
| | |
| 26 | | The accompanying notes are an integral part of these financial statements. |
MULTI-MANAGER U.S. SMALL CAP EQUITY FUND
| | | | | | | | |
Shares | | | Description | | Value | |
| | | | | | | | |
|
| Common Stocks – (continued) | |
| Machinery – (continued) | |
| | 17,100 | | | Mueller Industries, Inc. | | $ | 526,167 | |
| | 1,300 | | | Park-Ohio Holdings Corp. | | | 39,988 | |
| | 3,100 | | | Rexnord Corp.* | | | 87,699 | |
| | 7,400 | | | Spartan Motors, Inc. | | | 129,278 | |
| | 4,900 | | | SPX Corp.* | | | 223,146 | |
| | 23,300 | | | Terex Corp. | | | 641,915 | |
| | 19,494 | | | The Timken Co. | | | 955,206 | |
| | 54,700 | | | Wabash National Corp. | | | 780,022 | |
| | 12,836 | | | Woodward, Inc. | | | 1,369,088 | |
| | | | | | | | |
| | | | | | | 9,686,385 | |
| | |
| Media – 0.6% | |
| | 23,388 | | | AMC Networks, Inc. Class A* | | | 1,018,548 | |
| | 147,607 | | | Entercom Communications Corp. Class A | | | 513,672 | |
| | 3,300 | | | Liberty Latin America Ltd. Class A* | | | 61,677 | |
| | 8,200 | | | Liberty Latin America Ltd. Class C* | | | 150,962 | |
| | 35,900 | | | TEGNA, Inc. | | | 539,577 | |
| | | | | | | | |
| | | | | | | 2,284,436 | |
| | |
| Metals & Mining – 0.6% | |
| | 43,700 | | | Allegheny Technologies, Inc.* | | | 918,137 | |
| | 52,699 | | | Ferroglobe Representation & Warranty Insurance Trust(a) | | | — | |
| | 42,400 | | | Ryerson Holding Corp.* | | | 368,456 | |
| | 1,900 | | | Schnitzer Steel Industries, Inc. Class A | | | 40,546 | |
| | 141,771 | | | SunCoke Energy, Inc.* | | | 749,969 | |
| | | | | | | | |
| | | | | | | 2,077,108 | |
| | |
| Mortgage Real Estate Investment Trusts (REITs) – 3.3% | |
| | 19,900 | | | AG Mortgage Investment Trust, Inc. | | | 311,236 | |
| | 25,571 | | | Ares Commercial Real Estate Corp. | | | 396,350 | |
| | 46,908 | | | Blackstone Mortgage Trust, Inc. Class A | | | 1,702,760 | |
| | 39,300 | | | Colony Credit Real Estate, Inc. | | | 563,169 | |
| | 44,400 | | | Invesco Mortgage Capital, Inc. | | | 698,856 | |
| | 48,600 | | | Ladder Capital Corp. | | | 839,322 | |
| | 251,557 | | | MFA Financial, Inc. | | | 1,909,318 | |
| | 45,878 | | | Redwood Trust, Inc. | | | 749,647 | |
| | 80,806 | | | Starwood Property Trust, Inc. | | | 1,987,828 | |
| | 216,897 | | | Two Harbors Investment Corp. | | | 3,008,361 | |
| | 24,800 | | | Western Asset Mortgage Capital Corp. | | | 248,992 | |
| | | | | | | | |
| | | | | | | 12,415,839 | |
| | |
| Multi-Utilities – 0.1% | |
| | 9,100 | | | Avista Corp. | | | 437,073 | |
| | |
| Multiline Retail – 0.1% | |
| | 23,100 | | | Big Lots, Inc. | | | 500,577 | |
| | |
| Oil, Gas & Consumable Fuels – 2.1% | |
| | 22,200 | | | Ardmore Shipping Corp.* | | | 177,378 | |
| | 700 | | | Delek US Holdings, Inc. | | | 27,965 | |
| | 68,600 | | | DHT Holdings, Inc. | | | 530,278 | |
| | 46,200 | | | Dorian LPG Ltd.* | | | 575,190 | |
| | 115,254 | | | Enerplus Corp. | | | 694,982 | |
| | 68,992 | | | Extraction Oil & Gas, Inc.* | | | 117,287 | |
| | 31,612 | | | Jagged Peak Energy, Inc.* | | | 224,129 | |
| | 201,261 | | | Kosmos Energy Ltd. | | | 1,247,818 | |
| | |
| | | | | | | | |
|
| Common Stocks – (continued) | |
| Oil, Gas & Consumable Fuels – (continued) | |
| | 4,700 | | | Panhandle Oil and Gas, Inc. | | | 66,693 | |
| | 9,200 | | | Scorpio Tankers, Inc. | | | 292,652 | |
| | 94,703 | | | World Fuel Services Corp. | | | 3,955,744 | |
| | | | | | | | |
| | | | | | | 7,910,116 | |
| | |
| Paper & Forest Products – 0.5% | |
| | 4,100 | | | Clearwater Paper Corp.* | | | 76,014 | |
| | 41,554 | | | Schweitzer-Mauduit International, Inc. | | | 1,682,521 | |
| | | | | | | | |
| | | | | | | 1,758,535 | |
| | |
| Personal Products* – 0.3% | |
| | 28,800 | | | Edgewell Personal Care Co. | | | 1,008,000 | |
| | |
| Pharmaceuticals* – 1.0% | |
| | 40,400 | | | Amneal Pharmaceuticals, Inc. | | | 124,432 | |
| | 34,047 | | | Catalent, Inc. | | | 1,656,387 | |
| | 22,700 | | | Horizon Therapeutics PLC | | | 656,257 | |
| | 2,200 | | | Innoviva, Inc. | | | 25,564 | |
| | 10,700 | | | Pacira BioSciences, Inc. | | | 433,243 | |
| | 23,700 | | | SIGA Technologies, Inc. | | | 131,535 | |
| | 30,900 | | | Supernus Pharmaceuticals, Inc. | | | 858,711 | |
| | | | | | | | |
| | | | | | | 3,886,129 | |
| | |
| Professional Services – 1.8% | |
| | 17,217 | | | ASGN, Inc.* | | | 1,094,829 | |
| | 7,000 | | | Barrett Business Services, Inc. | | | 614,110 | |
| | 25,783 | | | FTI Consulting, Inc.* | | | 2,806,995 | |
| | 1,500 | | | Heidrick & Struggles International, Inc. | | | 42,690 | |
| | 9,023 | | | Huron Consulting Group, Inc.* | | | 596,781 | |
| | 500 | | | Insperity, Inc. | | | 52,815 | |
| | 16,100 | | | Kelly Services, Inc. Class A | | | 386,561 | |
| | 7,900 | | | Kforce, Inc. | | | 323,189 | |
| | 7,500 | | | Korn Ferry | | | 275,175 | |
| | 12,700 | | | TriNet Group, Inc.* | | | 672,973 | |
| | | | | | | | |
| | | | | | | 6,866,118 | |
| | |
| Real Estate Management & Development – 0.5% | |
| | 20,500 | | | Cushman & Wakefield PLC* | | | 382,325 | |
| | 88,700 | | | Newmark Group, Inc. Class A | | | 941,994 | |
| | 9,100 | | | The RMR Group, Inc. Class A | | | 440,440 | |
| | | | | | | | |
| | | | | | | 1,764,759 | |
| | |
| Road & Rail – 0.3% | |
| | 33,397 | | | Knight-Swift Transportation Holdings, Inc. | | | 1,217,655 | |
| | |
| Semiconductors & Semiconductor Equipment – 1.2% | |
| | 38,800 | | | Amkor Technology, Inc.* | | | 482,284 | |
| | 10,675 | | | Brooks Automation, Inc. | | | 453,367 | |
| | 21,900 | | | Diodes, Inc.* | | | 1,021,635 | |
| | 17,900 | | | Lattice Semiconductor Corp.* | | | 350,661 | |
| | 24,029 | | | Marvell Technology Group Ltd. | | | 586,067 | |
| | 15,600 | | | Rambus, Inc.* | | | 215,982 | |
| | 3,000 | | | Silicon Laboratories, Inc.* | | | 318,720 | |
| | 32,400 | | | Ultra Clean Holdings, Inc.* | | | 692,388 | |
| | 21,500 | | | Xperi Corp. | | | 436,558 | |
| | | | | | | | |
| | | | | | | 4,557,662 | |
| | |
| | |
| The accompanying notes are an integral part of these financial statements. | | 27 |
MULTI-MANAGER U.S. SMALL CAP EQUITY FUND
Schedule of Investments(continued)
October 31, 2019
| | | | | | | | |
Shares | | | Description | | Value | |
| | | | | | | | |
|
| Common Stocks – (continued) | |
| Software – 5.0% | |
| | 21,500 | | | ACI Worldwide, Inc.* | | $ | 674,885 | |
| | 4,252 | | | Appfolio, Inc. Class A* | | | 413,422 | |
| | 10,247 | | | Aspen Technology, Inc.* | | | 1,179,532 | |
| | 5,299 | | | Blackbaud, Inc. | | | 444,851 | |
| | 26,938 | | | Blackline, Inc.* | | | 1,259,082 | |
| | 1,600 | | | Bottomline Technologies DE, Inc.* | | | 65,520 | |
| | 52,200 | | | Cision Ltd.* | | | 525,654 | |
| | 27,110 | | | Dynatrace, Inc.* | | | 548,435 | |
| | 2,684 | | | Fair Isaac Corp.* | | | 816,043 | |
| | 13,024 | | | Guidewire Software, Inc.* | | | 1,468,326 | |
| | 11,500 | | | j2 Global, Inc. | | | 1,092,040 | |
| | 5,800 | | | LogMeIn, Inc. | | | 380,944 | |
| | 1,400 | | | MicroStrategy, Inc. Class A* | | | 214,550 | |
| | 49,574 | | | Mimecast Ltd.* | | | 1,968,584 | |
| | 49,600 | | | Mitek Systems, Inc.* | | | 478,144 | |
| | 21,100 | | | Progress Software Corp. | | | 841,468 | |
| | 15,971 | | | PROS Holdings, Inc.* | | | 818,354 | |
| | 17,100 | | | SPS Commerce, Inc.* | | | 902,367 | |
| | 99,300 | | | TiVo Corp. | | | 808,302 | |
| | 17,400 | | | Verint Systems, Inc.* | | | 789,786 | |
| | 40,017 | | | Workiva, Inc.* | | | 1,667,509 | |
| | 100,092 | | | Zuora, Inc. Class A* | | | 1,426,311 | |
| | | | | | | | |
| | | | | | | 18,784,109 | |
| | |
| Specialty Retail – 2.9% | |
| | 3,600 | | | Asbury Automotive Group, Inc.* | | | 371,268 | |
| | 5,400 | | | Conn’s, Inc.* | | | 130,626 | |
| | 15,402 | | | Group 1 Automotive, Inc. | | | 1,531,575 | |
| | 46,047 | | | Hudson Ltd. Class A* | | | 571,903 | |
| | 29,635 | | | Lithia Motors, Inc. Class A | | | 4,666,920 | |
| | 5,900 | | | Murphy USA, Inc.* | | | 695,787 | |
| | 66,060 | | | National Vision Holdings, Inc.* | | | 1,572,228 | |
| | 26,300 | | | Sally Beauty Holdings, Inc.* | | | 407,650 | |
| | 32,300 | | | Sonic Automotive, Inc. Class A | | | 1,041,029 | |
| | 6,900 | | | Tilly’s, Inc. Class A | | | 70,794 | |
| | | | | | | | |
| | | | | | | 11,059,780 | |
| | |
| Technology Hardware, Storage & Peripherals* – 0.4% | |
| | 67,600 | | | Diebold Nixdorf, Inc. | | | 473,200 | |
| | 38,357 | | | NCR Corp. | | | 1,120,408 | |
| | | | | | | | |
| | | | | | | 1,593,608 | |
| | |
| Textiles, Apparel & Luxury Goods – 0.8% | |
| | 600 | | | Deckers Outdoor Corp.* | | | 91,740 | |
| | 2,600 | | | G-III Apparel Group Ltd.* | | | 65,286 | |
| | 39,782 | | | Skechers U.S.A., Inc. Class A* | | | 1,486,653 | |
| | 34,032 | | | Steven Madden Ltd. | | | 1,401,438 | |
| | 11,300 | | | Vera Bradley, Inc.* | | | 121,588 | |
| | | | | | | | |
| | | | | | | 3,166,705 | |
| | |
| Thrifts & Mortgage Finance – 3.4% | |
| | 62,861 | | | Essent Group Ltd. | | | 3,274,429 | |
| | 5,500 | | | Federal Agricultural Mortgage Corp. Class C | | | 465,795 | |
| | 7,200 | | | Flagstar Bancorp, Inc. | | | 261,648 | |
| | 5,700 | | | HomeStreet, Inc.* | | | 171,057 | |
| | 6,000 | | | Merchants Bancorp | | | 97,980 | |
| | |
| | | | | | | | |
|
| Common Stocks – (continued) | |
| Thrifts & Mortgage Finance – (continued) | |
| | 45,558 | | | NMI Holdings, Inc. Class A* | | | 1,332,572 | |
| | 66,120 | | | Radian Group, Inc. | | | 1,659,612 | |
| | 10,300 | | | Sterling Bancorp, Inc. | | | 99,807 | |
| | 59,240 | | | Walker & Dunlop, Inc. | | | 3,731,528 | |
| | 46,788 | | | Washington Federal, Inc. | | | 1,705,890 | |
| | | | | | | | |
| | | | | | | 12,800,318 | |
| | |
| Tobacco – 0.3% | |
| | 15,300 | | | Turning Point Brands, Inc. | | | 319,311 | |
| | 15,795 | | | Universal Corp. | | | 865,566 | |
| | | | | | | | |
| | | | | | | 1,184,877 | |
| | |
| Trading Companies & Distributors – 3.2% | |
| | 67,867 | | | Air Lease Corp. | | | 2,984,791 | |
| | 66,327 | | | BMC Stock Holdings, Inc.* | | | 1,790,166 | |
| | 11,800 | | | Foundation Building Materials, Inc.* | | | 219,362 | |
| | 23,600 | | | GMS, Inc.* | | | 707,056 | |
| | 13,400 | | | Herc Holdings, Inc.* | | | 593,084 | |
| | 75,796 | | | Nesco Holdings, Inc.* | | | 351,693 | |
| | 13,800 | | | Rush Enterprises, Inc. Class A | | | 602,922 | |
| | 25,197 | | | SiteOne Landscape Supply, Inc.* | | | 2,218,848 | |
| | 54,336 | | | WESCO International, Inc.* | | | 2,724,950 | |
| | | | | | | | |
| | | | | | | 12,192,872 | |
| | |
| Water Utilities – 0.4% | |
| | 5,100 | | | American States Water Co. | | | 485,163 | |
| | 2,000 | | | Artesian Resources Corp. Class A | | | 74,200 | |
| | 1,200 | | | Middlesex Water Co. | | | 80,700 | |
| | 12,100 | | | SJW Group | | | 875,435 | |
| | | | | | | | |
| | | | | | | 1,515,498 | |
| | |
| Wireless Telecommunication Services – 0.1% | |
| | 14,900 | | | Shenandoah Telecommunications Co. | | | 479,184 | |
| | |
| | TOTAL COMMON STOCKS | |
| | (Cost $314,866,545) | | $ | 356,863,250 | |
| | |
| | | | | | | | | | | | |
Principal
Amount | | Interest
Rate | | | Maturity
Date | | | Value | |
| | | | | | | | | | | | |
|
| U.S. Treasury Obligation(b)(c) – 0.1% | |
| United States Treasury Bill | | | | |
| $240,000 | | | 0.000 | % | | | 12/19/19 | | | $ | 239,541 | |
| (Cost $239,440) | |
| |
| | |
| 28 | | The accompanying notes are an integral part of these financial statements. |
MULTI-MANAGER U.S. SMALL CAP EQUITY FUND
| | | | | | |
| Shares | | Dividend
Rate | | Value | |
|
| Investment Company(d) – 4.7% | |
Goldman Sachs Financial Square Government Fund – Institutional Shares | |
| 17,650,494 | | 1.701% | | $ | 17,650,494 | |
| (Cost $17,650,494) | |
| |
| TOTAL INVESTMENTS – 99.2% | |
| (Cost $332,756,479) | | $ | 374,753,285 | |
| |
OTHER ASSETS IN EXCESS OF LIABILITIES – 0.8% | | | 3,144,495 | |
| |
| NET ASSETS – 100.0% | | $ | 377,897,780 | |
| |
| | |
|
| The percentage shown for each investment category reflects the value of investments in that category as a percentage of net assets. |
| |
* | | Non-income producing security. |
| |
(a) | | Significant unobservable inputs were used in the valuation of this portfolio security; i.e., Level 3. |
| |
(b) | | Issued with a zero coupon. Income is recognized through the accretion of discount. |
| |
(c) | | All or portion of security is segregated as collateral for initial margin requirements on futures transactions. |
| |
(d) | | Represents an affiliated issuer. |
| | |
|
Investment Abbreviations: |
PLC | | —Public Limited Company |
REIT | | —Real Estate Investment Trust |
|
|
| ADDITIONAL INVESTMENT INFORMATION |
FUTURES CONTRACTS — At October 31, 2019, the Fund had the following futures contracts:
| | | | | | | | | | | | |
| Type | | Number of
Contracts | | Expiration
Date | | Notional
Amount | | | Unrealized
Appreciation/
(Depreciation) | |
Long position contracts: | | | | | |
E-mini Russell 2000 Index | | 32 | | 12/20/19 | | $ | 2,501,440 | | | $ | 121,328 | |
| | |
| The accompanying notes are an integral part of these financial statements. | | 29 |
ACTIVE EQUITY MULTI-MANAGER FUNDS
Statements of Assets and Liabilities
October 31, 2019
| | | | | | | | | | | | | | |
| | | | | Multi-Manager
International
Equity Fund | | | Multi-Manager
U.S. Dynamic
Equity Fund | | | Multi-Manager
U.S. Small Cap
Equity Fund | |
| | Assets: | |
| | | | |
| | Investments, at value (cost $713,359,666, $128,382,522 and $315,105,985, respectively) | | $ | 798,150,396 | | | $ | 163,698,428 | | | $ | 357,102,791 | |
| | | | |
| | Investments of affiliated issuers, at value (cost $22,489,043, $8,028,001 and $17,650,494, respectively) | | | 22,489,043 | | | | 8,028,001 | | | | 17,650,494 | |
| | | | |
| | | | | | | | | | | | | | |
| | | | |
| | | | | | | | | | | | | | |
| | | | |
| | Foreign currencies, at value (cost $50,164, $0 and $0, respectively) | | | 50,364 | | | | — | | | | — | |
| | | | |
| | Cash | | | 458,029 | | | | 958,716 | | | | 2,921,498 | |
| | | | |
| | Unrealized gain on forward foreign currency exchange contracts | | | 24 | | | | 11,470 | | | | — | |
| | | | |
| | Receivables: | | | | | | | | | | | | |
| | | | |
| | Investments sold | | | 1,397,915 | | | | 445,475 | | | | 920,116 | |
| | | | |
| | Dividends | | | 1,374,366 | | | | 115,666 | | | | 106,903 | |
| | | | |
| | Foreign tax reclaims | | | 1,339,099 | | | | 3,930 | | | | — | |
| | | | |
| | Reimbursement from investment adviser | | | 36,270 | | | | 63,518 | | | | 21,848 | |
| | | | |
| | Investments sold on an extended settlement basis | | | 11,934 | | | | — | | | | — | |
| | | | |
| | Collateral on certain derivative contracts(a) | | | — | | | | 400,000 | | | | — | |
| | | | |
| | Other assets | | | 25,877 | | | | 15,152 | | | | 14,899 | |
| | | | |
| | Total assets | | | 825,333,317 | | | | 173,740,356 | | | | 378,738,549 | |
| | | | | | | | | | | | | | |
| | Liabilities: | |
| | | | |
| | Unrealized loss on forward foreign currency exchange contracts | | | — | | | | 105,574 | | | | — | |
| | | | |
| | Variation margin on futures contracts | | | — | | | | — | | | | 17,595 | |
| | | | |
| | Payables: | | | | | | | | | | | | |
| | | | |
| | Investments purchased | | | 1,052,951 | | | | 1,479,819 | | | | 338,181 | |
| | | | |
| | Management fees | | | 293,205 | | | | 90,893 | | | | 179,834 | |
| | | | |
| | Fund shares redeemed | | | 230,000 | | | | — | | | | 165,000 | |
| | | | |
| | Investments purchased on an extended settlement basis | | | 97,137 | | | | 366,251 | | | | 3,803 | |
| | | | |
| | Transfer agency fees | | | 13,569 | | | | 2,877 | | | | 6,244 | |
| | | | |
| | Accrued expenses and other liabilities | | | 442,484 | | | | 118,427 | | | | 130,112 | |
| | | | |
| | Total liabilities | | | 2,129,346 | | | | 2,163,841 | | | | 840,769 | |
| | | | | | | | | | | | | | |
| | Net Assets: | |
| | | | |
| | Paid-in capital | | | 730,859,752 | | | | 129,191,575 | | | | 329,347,684 | |
| | | | |
| | Total distributable earnings | | | 92,344,219 | | | | 42,384,940 | | | | 48,550,096 | |
| | | | |
| | NET ASSETS | | $ | 823,203,971 | | | $ | 171,576,515 | | | $ | 377,897,780 | |
| | | | |
| | Shares Outstanding $0.001 par value (unlimited number of shares authorized): | | | 70,387,162 | | | | 13,772,314 | | | | 28,385,294 | |
| | | | |
| | Net asset value, offering and redemption price per share: | | | $11.70 | | | | $12.46 | | | | $13.31 | |
| | (a) | | Segregated for collateral on forward foreign currency exchange transactions. |
| | |
| 30 | | The accompanying notes are an integral part of these financial statements. |
ACTIVE EQUITY MULTI-MANAGER FUNDS
Statements of Operations
For the Fiscal Year Ended October 31, 2019
| | | | | | | | | | | | | | |
| | | | | Multi-Manager
International
Equity Fund | | | Multi-Manager
U.S. Dynamic
Equity Fund | | | Multi-Manager
U.S. Small Cap
Equity Fund | |
| | Investment income: | |
| | | | |
| | Dividends — unaffiliated issuers (net of foreign withholding taxes of $1,863,062, $11,756 and $9,262, respectively) | | $ | 21,358,078 | | | $ | 2,659,640 | | | $ | 4,493,550 | |
| | | | |
| | Dividends — affiliated issuers | | | 510,080 | | | | 172,320 | | | | 329,420 | |
| | | | |
| | Interest | | | — | | | | — | | | | 1,791 | |
| | | | |
| | Total investment income | | | 21,868,158 | | | | 2,831,960 | | | | 4,824,761 | |
| | | | | | | | | | | | | | |
| | Expenses: | |
| | | | |
| | Management fees | | | 4,260,745 | | | | 1,305,630 | | | | 2,553,006 | |
| | | | |
| | Custody, accounting and administrative services | | | 593,321 | | | | 355,144 | | | | 365,949 | |
| | | | |
| | Transfer Agency fees | | | 142,025 | | | | 32,641 | | | | 68,080 | |
| | | | |
| | Professional fees | | | 140,380 | | | | 136,974 | | | | 137,353 | |
| | | | |
| | Registration fees | | | 75,265 | | | | 39,220 | | | | 63,130 | |
| | | | |
| | Trustee fees | | | 45,041 | | | | 31,042 | | | | 35,753 | |
| | | | |
| | Printing and mailing costs | | | 35,372 | | | | 20,732 | | | | 27,188 | |
| | | | |
| | Other | | | 88,820 | | | | 14,755 | | | | 32,359 | |
| | | | |
| | Total expenses | | | 5,380,969 | | | | 1,936,138 | | | | 3,282,818 | |
| | | | |
| | Less — expense reductions | | | (1,370,578 | ) | | | (659,426 | ) | | | (583,627 | ) |
| | | | |
| | Net expenses | | | 4,010,391 | | | | 1,276,712 | | | | 2,699,191 | |
| | | | |
| | NET INVESTMENT INCOME | | | 17,857,767 | | | | 1,555,248 | | | | 2,125,570 | |
| | | | | | | | | | | | | | |
| | Realized and unrealized gain (loss): | |
| | | | |
| | Net realized gain (loss) from: | | | | | | | | | | | | |
| | | | |
| | Investments — unaffiliated issuers (including commission recapture of $11,880, $95 and $0, respectively) | | | (4,408,717 | ) | | | 7,418,346 | | | | 7,145,687 | |
| | | | |
| | Futures contracts | | | — | | | | — | | | | (59,015 | ) |
| | | | |
| | Forward foreign currency exchange contracts | | | 35,707 | | | | 464,787 | | | | — | |
| | | | |
| | Foreign currency transactions | | | (96,712 | ) | | | (2,341 | ) | | | (80 | ) |
| | | | |
| | Net change in unrealized gain (loss) on: | | | | | | | | | | | | |
| | | | |
| | Investments — unaffiliated issuers | | | 75,049,177 | | | | 13,218,740 | | | | 24,787,404 | |
| | | | |
| | Futures contracts | | | — | | | | — | | | | 121,328 | |
| | | | |
| | Forward foreign currency exchange contracts | | | (533 | ) | | | (249,618 | ) | | | — | |
| | | | |
| | Foreign currency translation | | | 30,625 | | | | (385 | ) | | | 2 | |
| | | | |
| | Net realized and unrealized gain | | | 70,609,547 | | | | 20,849,529 | | | | 31,995,326 | |
| | | | |
| | NET INCREASE IN NET ASSETS RESULTING FROM OPERATIONS | | $ | 88,467,314 | | | $ | 22,404,777 | | | $ | 34,120,896 | |
| | |
| The accompanying notes are an integral part of these financial statements. | | 31 |
ACTIVE EQUITY MULTI-MANAGER FUNDS
Statements of Changes in Net Assets
| | | | | | | | | | | | | | | | | | | | | | |
| | | | | Multi-Manager International Equity Fund | | | | | | Multi-Manager U.S. Dynamic Equity Fund | |
| | | | | For the Fiscal
Year Ended
October 31, 2019 | | | For the Fiscal
Year Ended
October 31, 2018 | | | | | | For the Fiscal
Year Ended
October 31, 2019 | | | For the Fiscal
Year Ended
October 31, 2018 | |
| | From operations: | |
| | | | | | |
| | Net investment income | | $ | 17,857,767 | | | $ | 9,859,222 | | | | | | | $ | 1,555,248 | | | $ | 1,212,228 | |
| | | | | | |
| | Net realized gain (loss) | | | (4,469,722 | ) | | | 12,888,907 | | | | | | | | 7,880,792 | | | | 8,188,433 | |
| | | | | | |
| | Net change in unrealized gain (loss) | | | 75,079,269 | | | | (62,895,292 | ) | | | | | | | 12,968,737 | | | | 367,847 | |
| | | | | | |
| | Net increase (decrease) in net assets resulting from operations | | | 88,467,314 | | | | (40,147,163 | ) | | | | | | | 22,404,777 | | | | 9,768,508 | |
| | | | | | | | | | | | | | | | | | | | | | |
| | Distributions to shareholders: | | | | | | | | | | | | | | | | | | | | |
| | | | | | |
| | From distributable earnings | | | (24,585,380 | ) | | | (7,093,278 | ) | | | | | | | (10,236,864 | ) | | | (4,291,680 | ) |
| | | | | | | | | | | | | | | | | | | | | | |
| | From share transactions: | |
| | | | | | |
| | Proceeds from sales of shares | | | 171,615,977 | | | | 269,285,343 | | | | | | | | 13,268,000 | | | | 54,210,000 | |
| | | | | | |
| | Reinvestment of distributions | | | 24,585,380 | | | | 7,093,278 | | | | | | | | 10,236,864 | | | | 4,291,680 | |
| | | | | | |
| | Cost of shares redeemed | | | (63,850,569 | ) | | | (44,996,789 | ) | | | | | | | (24,622,918 | ) | | | (35,535,266 | ) |
| | | | | | |
| | Net increase (decrease) in net assets resulting from share transactions | | | 132,350,788 | | | | 231,381,832 | | | | | | | | (1,118,054 | ) | | | 22,966,414 | |
| | | | | | |
| | TOTAL INCREASE | | | 196,232,722 | | | | 184,141,391 | | | | | | | | 11,049,859 | | | | 28,443,242 | |
| | | | | | | | | | | | | | | | | | | | | | |
| | Net assets: | |
| | | | | | |
| | Beginning of year | | | 626,971,249 | | | | 442,829,858 | | | | | | | | 160,526,656 | | | | 132,083,414 | |
| | | | | | |
| | End of year | | $ | 823,203,971 | | | $ | 626,971,249 | | | | | | | $ | 171,576,515 | | | $ | 160,526,656 | |
| | |
| 32 | | The accompanying notes are an integral part of these financial statements. |
ACTIVE EQUITY MULTI-MANAGER FUNDS
Statements of Changes in Net Assets(continued)
| | | | | | | | | | |
| | | | | Multi-Manager U.S. Small Cap Equity Fund | |
| | | | | For the Fiscal
Year Ended
October 31, 2019 | | | For the Fiscal
Year Ended
October 31, 2018 | |
| | From operations: | |
| | | |
| | Net investment income | | $ | 2,125,570 | | | $ | 902,587 | |
| | | |
| | Net realized gain | | | 7,086,592 | | | | 7,248,272 | |
| | | |
| | Net change in unrealized gain (loss) | | | 24,908,734 | | | | (16,208,876 | ) |
| | | |
| | Net increase (decrease) in net assets resulting from operations | | | 34,120,896 | | | | (8,058,017 | ) |
| | | | | | | | | | |
| | Distributions to shareholders: | |
| | | |
| | From distributable earnings | | | (8,948,144 | ) | | | (5,101,142 | ) |
| | | | | | | | | | |
| | From share transactions: | |
| | | |
| | Proceeds from sales of shares | | | 60,002,243 | | | | 165,669,010 | |
| | | |
| | Reinvestment of distributions | | | 8,948,144 | | | | 5,101,142 | |
| | | |
| | Cost of shares redeemed | | | (34,391,380 | ) | | | (37,822,987 | ) |
| | | |
| | Net increase in net assets resulting from share transactions | | | 34,559,007 | | | | 132,947,165 | |
| | | |
| | TOTAL INCREASE | | | 59,731,759 | | | | 119,788,006 | |
| | | | | | | | | | |
| | Net assets: | |
| | | |
| | Beginning of year | | | 318,166,021 | | | | 198,378,015 | |
| | | |
| | End of year | | $ | 377,897,780 | | | $ | 318,166,021 | |
| | |
| The accompanying notes are an integral part of these financial statements. | | 33 |
MULTI-MANAGER INTERNATIONAL EQUITY FUND
Financial Highlights
Selected Share Data for a Share Outstanding Throughout Each Period
| | | | | | | | | | | | | | | | | | | | | | |
| | | | | Multi-Manager International Equity Fund | |
| | | | | Class P Shares | |
| | | | | Year Ended October 31, | | | Period Ended
October 31, 2015(a) | |
| | | | | 2019 | | | 2018 | | | 2017 | | | 2016 | |
| | Per Share Data | |
| | | | | | |
| | Net asset value, beginning of period | | $ | 10.80 | | | $ | 11.62 | | | $ | 9.41 | | | $ | 9.52 | | | $ | 10.00 | |
| | | | | | |
| | Net investment income(b) | | | 0.28 | | | | 0.22 | | | | 0.19 | | | | 0.17 | | | | 0.03 | |
| | | | | | |
| | Net realized and unrealized gain (loss) | | | 1.03 | | | | (0.86 | ) | | | 2.17 | | | | (0.25 | ) | | | (0.51 | ) |
| | | | | | |
| | Total from investment operations | | | 1.31 | | | | (0.64 | ) | | | 2.36 | | | | (0.08 | ) | | | (0.48 | ) |
| | | | | | |
| | Distributions to shareholders from net investment income | | | (0.16 | ) | | | (0.18 | ) | | | (0.15 | ) | | | (0.03 | ) | | | — | |
| | | | | | |
| | Distributions to shareholders from net realized gains | | | (0.25 | ) | | | — | (c) | | | — | | | | — | | | | — | |
| | | | | | |
| | Total distributions | | | (0.41 | ) | | | (0.18 | ) | | | (0.15 | ) | | | (0.03 | ) | | | — | |
| | | | | | |
| | Net asset value, end of period | | $ | 11.70 | | | $ | 10.80 | | | $ | 11.62 | | | $ | 9.41 | | | $ | 9.52 | |
| | | | | | |
| | Total return(d) | | | 12.78 | % | | | (5.63 | )% | | | 25.44 | % | | | (0.82 | )% | | | (4.80 | )% |
| | | | | | |
| | Net assets, end of period (in 000s) | | $ | 823,204 | | | $ | 626,971 | | | $ | 442,830 | | | $ | 293,620 | | | $ | 185,055 | |
| | | | | | |
| | Ratio of net expenses to average net assets | | | 0.56 | % | | | 0.57 | % | | | 0.57 | % | | | 0.57 | % | | | 0.57 | %(e) |
| | | | | | |
| | Ratio of total expenses to average net assets | | | 0.76 | % | | | 0.79 | % | | | 0.82 | % | | | 1.01 | % | | | 1.07 | %(e) |
| | | | | | |
| | Ratio of net investment income to average net assets | | | 2.51 | % | | | 1.85 | % | | | 1.82 | % | | | 1.81 | % | | | 1.31 | %(e) |
| | | | | | |
| | Portfolio turnover rate(f) | | | 29 | % | | | 28 | % | | | 37 | % | | | 25 | % | | | 6 | % |
| | (a) | | Commenced operations on July 31, 2015. |
| | (b) | | Calculated based on the average shares outstanding methodology. |
| | (c) | | Amount is less than $0.005 per share. |
| | (d) | | Assumes investment at the NAV at the beginning of the period, reinvestment of all dividends and distributions, a complete redemption of the investment at the NAV at the end of the period and no sales or redemption charges (if any). Total returns would be reduced if a sales or redemption charge was taken into account. Returns do not reflect the impact of taxes to shareholders relating to Fund distributions or the redemption of Fund shares. Total returns for periods less than one full year are not annualized. |
| | (f) | | The Fund’s portfolio turnover rate is calculated in accordance with regulatory requirements, without regard to transactions involving short term investments and certain derivatives. If such transactions were included, the Fund’s portfolio turnover rate may be higher. |
| | |
| 34 | | The accompanying notes are an integral part of these financial statements. |
MULTI-MANAGER U.S. DYNAMIC EQUITY FUND
Financial Highlights(continued)
Selected Share Data for a Share Outstanding Throughout Each Period
| | | | | | | | | | | | | | | | | | | | | | |
| | | | | Multi-Manager U.S. Dynamic Equity Fund | |
| | | | | Class P Shares | |
| | | | | Year Ended October 31, | | | Period Ended
October 31, 2015(a) | |
| | | | | 2019 | | | 2018 | | | 2017 | | | 2016 | |
| | Per Share Data | |
| | | | | | |
| | Net asset value, beginning of period | | $ | 11.64 | | | $ | 11.28 | | | $ | 9.13 | | | $ | 9.51 | | | $ | 10.00 | |
| | | | | | |
| | Net investment income(b) | | | 0.11 | | | | 0.09 | | | | 0.07 | | | | 0.06 | (c) | | | 0.02 | |
| | | | | | |
| | Net realized and unrealized gain (loss) | | | 1.46 | | | | 0.64 | | | | 2.14 | | | | (0.40 | ) | | | (0.51 | ) |
| | | | | | |
| | Total from investment operations | | | 1.57 | | | | 0.73 | | | | 2.21 | | | | (0.34 | ) | | | (0.49 | ) |
| | | | | | |
| | Distributions to shareholders from net investment income | | | (0.10 | ) | | | (0.04 | ) | | | (0.06 | ) | | | (0.04 | ) | | | — | |
| | | | | | |
| | Distributions to shareholders from net realized gains | | | (0.65 | ) | | | (0.33 | ) | | | — | | | | — | | | | — | |
| | | | | | |
| | Total distributions | | | (0.75 | ) | | | (0.37 | ) | | | (0.06 | ) | | | (0.04 | ) | | | — | |
| | | | | | |
| | Net asset value, end of period | | $ | 12.46 | | | $ | 11.64 | | | $ | 11.28 | | | $ | 9.13 | | | $ | 9.51 | |
| | | | | | |
| | Total return(d) | | | 14.66 | % | | | 6.51 | % | | | 24.34 | % | | | (3.54 | )% | | | (4.90 | )% |
| | | | | | |
| | Net assets, end of period (in 000s) | | $ | 171,577 | | | $ | 160,527 | | | $ | 132,083 | | | $ | 135,996 | | | $ | 131,932 | |
| | | | | | |
| | Ratio of net expenses to average net assets | | | 0.78 | % | | | 0.78 | % | | | 0.79 | % | | | 0.80 | % | | | 0.79 | %(e) |
| | | | | | |
| | Ratio of total expenses to average net assets | | | 1.19 | % | | | 1.18 | % | | | 1.23 | % | | | 1.31 | % | | | 1.51 | %(e) |
| | | | | | |
| | Ratio of net investment income to average net assets | | | 0.95 | % | | | 0.80 | % | | | 0.63 | % | | | 0.70 | % | | | 0.70 | %(e) |
| | | | | | |
| | Portfolio turnover rate(f) | | | 91 | % | | | 86 | % | | | 96 | % | | | 112 | % | | | 14 | % |
| | (a) | | Commenced operations on July 31, 2015. |
| | (b) | | Calculated based on the average shares outstanding methodology. |
| | (c) | | Reflects income recognized from a special dividend which amounted to $0.01 per share and 0.17% of average net assets. |
| | (d) | | Assumes investment at the NAV at the beginning of the period, reinvestment of all dividends and distributions, a complete redemption of the investment at the NAV at the end of the period and no sales or redemption charges (if any). Total returns would be reduced if a sales or redemption charge was taken into account. Returns do not reflect the impact of taxes to shareholders relating to Fund distributions or the redemption of Fund shares. Total returns for periods less than one full year are not annualized. |
| | (f) | | The Fund’s portfolio turnover rate is calculated in accordance with regulatory requirements, without regard to transactions involving short term investments and certain derivatives. If such transactions were included, the Fund’s portfolio turnover rate may be higher. |
| | |
| The accompanying notes are an integral part of these financial statements. | | 35 |
MULTI-MANAGER U.S. SMALL CAP EQUITY FUND
Financial Highlights(continued)
Selected Share Data for a Share Outstanding Throughout Each Period
| | | | | | | | | | | | | | | | | | |
| | | | | Multi-Manager U.S. Small Cap Equity Fund | |
| | | | | Class P Shares | |
| | | | | Year Ended October 31, | | | Period Ended
October 31, 2016(a) | |
| | | | | 2019 | | | 2018 | | | 2017 | |
| | Per Share Data | |
| | | | | |
| | Net asset value, beginning of period | | $ | 12.40 | | | $ | 12.77 | | | $ | 10.52 | | | $ | 10.00 | |
| | | | | |
| | Net investment income(b) | | | 0.08 | | | | 0.05 | (c) | | | 0.03 | | | | 0.01 | |
| | | | | |
| | Net realized and unrealized gain (loss) | | | 1.17 | | | | (0.10 | ) | | | 2.36 | | | | 0.51 | |
| | | | | |
| | Total from investment operations | | | 1.25 | | | | (0.05 | ) | | | 2.39 | | | | 0.52 | |
| | | | | |
| | Distributions to shareholders from net investment income | | | (0.04 | ) | | | (0.07 | ) | | | (0.04 | ) | | | — | |
| | | | | |
| | Distributions to shareholders from net realized gains | | | (0.30 | ) | | | (0.25 | ) | | | (0.10 | ) | | | — | |
| | | | | |
| | Total distributions | | | (0.34 | ) | | | (0.32 | ) | | | (0.14 | ) | | | — | |
| | | | | |
| | Net asset value, end of period | | $ | 13.31 | | | $ | 12.40 | | | $ | 12.77 | | | $ | 10.52 | |
| | | | | |
| | Total return(d) | | | 10.56 | % | | | (0.40 | )% | | | 22.80 | % | | | 5.20 | % |
| | | | | |
| | Net assets, end of period (in 000s) | | $ | 377,898 | | | $ | 318,166 | | | $ | 198,378 | | | $ | 128,775 | |
| | | | | |
| | Ratio of net expenses to average net assets | | | 0.79 | % | | | 0.80 | % | | | 0.80 | % | | | 0.80 | %(e) |
| | | | | |
| | Ratio of total expenses to average net assets | | | 0.96 | % | | | 1.00 | % | | | 1.19 | % | | | 1.32 | %(e) |
| | | | | |
| | Ratio of net investment income to average net assets | | | 0.62 | % | | | 0.35 | %(c) | | | 0.25 | % | | | 0.26 | %(e) |
| | | | | |
| | Portfolio turnover rate(f) | | | 88 | % | | | 32 | % | | | 44 | % | | | 15 | % |
| | (a) | | Commenced operations on April 29, 2016. |
| | (b) | | Calculated based on the average shares outstanding methodology. |
| | (c) | | Reflects income recognized from special dividends which amounted to $0.03 per share and 0.23% of average net assets. |
| | (d) | | Assumes investment at the NAV at the beginning of the period, reinvestment of all dividends and distributions, a complete redemption of the investment at the NAV at the end of the period and no sales or redemption charges (if any). Total returns would be reduced if a sales or redemption charge was taken into account. Returns do not reflect the impact of taxes to shareholders relating to Fund distributions or the redemption of Fund shares. Total returns for periods less than one full year are not annualized. |
| | (f) | | The Fund’s portfolio turnover rate is calculated in accordance with regulatory requirements, without regard to transactions involving short term investments and certain derivatives. If such transactions were included, the Fund’s portfolio turnover rate may be higher. |
| | |
| 36 | | The accompanying notes are an integral part of these financial statements. |
ACTIVE EQUITY MULTI-MANAGER FUNDS
Notes to Financial Statements
October 31, 2019
Goldman Sachs Trust II (the “Trust”) is a Delaware statutory trust registered under the Investment Company Act of 1940, as amended (the “Act”), as anopen-end management investment company. The following table lists those series of the Trust that are included in this report (collectively, the “Funds” or individually a “Fund”), along with their corresponding share classes and respective diversification status under the Act:
| | | | |
| Fund | | Share Classes Offered | | Diversified/
Non-diversified |
Multi-Manager International Equity | | Class P | | Diversified |
Multi-Manager U.S. Dynamic Equity | | Class P | | Diversified |
Multi-Manager U.S. Small Cap Equity | | Class P | | Diversified |
Goldman Sachs Asset Management, L.P. (“GSAM”), an affiliate of Goldman Sachs & Co. LLC (“Goldman Sachs”), serves as investment adviser to the Funds pursuant to management agreements (each, an “Agreement”) with the Trust. As of October 31, 2019, GSAM hadsub-advisory agreements (the“Sub-Advisory Agreements”) for the Multi-Manager International Equity Fund with Causeway Capital Management LLC, Massachusetts Financial Services Company, doing business as MFS Investment Management and WCM Investment Management; for the Multi-Manager U.S. Dynamic Equity Fund with Lazard Asset Management LLC, Sirios Capital Management, L.P., Smead Capital Management, Inc., and Vaughan Nelson Investment Management, L.P. and for the Multi-Manager U.S. Small Cap Equity Fund with Boston Partners Global Investors Inc., Brown Advisory, LLC, and QMA LLC (the “Underlying Managers”). Pursuant to the terms of theSub-Advisory Agreements, the Underlying Managers are responsible for making investment decisions and managing the investments of the applicable Fund. GSAM compensates the Underlying Managers directly in accordance with the terms of the applicableSub-Advisory Agreements. The Funds are not charged any separate or additional investment advisory fees by the Underlying Managers. As of October 31, 2019, GSAM no longer had a sub-advisory agreement for the Multi-Manager U.S. Small Cap Equity Fund with PNC Capital Advisors, LLC.
|
| 2. SIGNIFICANT ACCOUNTING POLICIES |
The financial statements have been prepared in accordance with accounting principles generally accepted in the United States of America (“GAAP”) and require management to make estimates and assumptions that may affect the reported amounts and disclosures. Actual results may differ from those estimates and assumptions. Each Fund is an investment company under GAAP and follows the accounting and reporting guidance applicable to investment companies.
A. Investment Valuation — The Funds’ valuation policy is to value investments at fair value.
B. Investment Income and Investments — Investment income includes interest income, dividend income and securities lending income, if any. Interest income is accrued daily and adjusted for amortization of premiums and accretion of discounts. Dividend income is recognized onex-dividend date or, for certain foreign securities, as soon as such information is obtained subsequent to theex-dividend date. Non-cash dividends, if any, are recorded at the fair market value of the securities received. Investment transactions are reflected on trade date. Realized gains and losses are calculated using identified cost. Investment transactions are recorded on the following business day for daily net asset value (“NAV”) calculations. Investment income is recorded net of any foreign withholding taxes, less any amounts reclaimable. The Funds may file withholding tax reclaims in certain jurisdictions to recover a portion of amounts previously withheld. Any foreign capital gains tax is accrued daily based upon net unrealized gains, and is payable upon sale of such investments. Distributions received from the Funds’ investments in U.S. real estate investment trusts (“REITs”) may be characterized as ordinary income, net capital gain or a return of capital. A return of capital is recorded by the Funds as a reduction to the cost basis of the REIT. For derivative contracts, realized gains and losses are recorded upon settlement of the contract.
C. Expenses — Expenses incurred directly by a Fund are charged to the Fund, and certain expenses incurred by the Trust are allocated across the applicable Funds on a straight-line and/or pro-rata basis, depending upon the nature of the expenses, and are accrued daily.
37
ACTIVE EQUITY MULTI-MANAGER FUNDS
Notes to Financial Statements(continued)
October 31, 2019
|
| 2. SIGNIFICANT ACCOUNTING POLICIES (continued) |
D. Federal Taxes and Distributions to Shareholders — It is each Fund’s policy to comply with the requirements of the Internal Revenue Code of 1986, as amended (the “Code”), applicable to regulated investment companies and to distribute each year substantially all of its investment company taxable income and capital gains to its shareholders. Accordingly, each Fund is not required to make any provisions for the payment of federal income tax. Distributions to shareholders are recorded on theex-dividend date. Income and capital gains distributions, if any, are declared and paid at least annually.
Net capital losses, if any, are carried forward to future fiscal years and may be used to the extent allowed by the Code to offset any future capital gains. Losses that are carried forward will retain their character as either short-term or long-term capital losses. Utilization of capital loss carryforwards will reduce the requirement of future capital gains distributions.
The characterization of distributions to shareholders for financial reporting purposes is determined in accordance with federal income tax rules, which may differ from GAAP. The source of each Fund’s distributions may be shown in the accompanying financial statements as either from distributable earnings or capital. Certain components of the Funds’ net assets on the Statements of Assets and Liabilities reflect permanent GAAP/tax differences based on the appropriate tax character.
E. Foreign Currency Translation —The accounting records and reporting currency of a Fund are maintained in U.S. dollars. Assets and liabilities denominated in foreign currencies are translated into U.S. dollars using the current exchange rates at the close of each business day. The effect of changes in foreign currency exchange rates on investments is included within net realized and unrealized gain (loss) on investments. Changes in the value of other assets and liabilities as a result of fluctuations in foreign exchange rates are included in the Statements of Operations within net change in unrealized gain (loss) on foreign currency translation. Transactions denominated in foreign currencies are translated into U.S. dollars on the date the transaction occurred, the effects of which are included within net realized gain (loss) on foreign currency transactions.
F. Commission Recapture — GSAM, on behalf of certain Funds, may direct portfolio trades, subject to seeking best execution, to various brokers who have agreed to rebate a portion of the commissions generated. Such rebates are made directly to a Fund as cash payments and are included in net realized gain (loss) from investments on the Statements of Operations.
| | |
| 3. INVESTMENTS AND FAIR VALUE MEASUREMENTS | | |
U.S. GAAP defines the fair value of a financial instrument as the amount that would be received to sell an asset or paid to transfer a liability in an orderly transaction between market participants at the measurement date (i.e., the exit price); the Funds’ policy is to use the market approach. GAAP establishes a fair value hierarchy that prioritizes the inputs to valuation techniques used to measure fair value. The hierarchy gives the highest priority to unadjusted quoted prices in active markets for identical assets or liabilities (Level 1 measurements) and the lowest priority to unobservable inputs (Level 3 measurements). The levels used for classifying investments are not necessarily an indication of the risk associated with investing in these investments. The three levels of the fair value hierarchy are described below:
Level 1 — Unadjusted quoted prices in active markets that are accessible at the measurement date for identical, unrestricted assets or liabilities;
Level 2 — Quoted prices in markets that are not active or financial instruments for which significant inputs are observable (including, but not limited to, quoted prices for similar investments, interest rates, foreign exchange rates, volatility and credit spreads), either directly or indirectly;
Level 3 — Prices or valuations that require significant unobservable inputs (including GSAM’s assumptions in determining fair value measurement).
The Board of Trustees (“Trustees”) has approved Valuation Procedures that govern the valuation of the portfolio investments held by the Funds, including investments for which market quotations are not readily available. The Trustees have delegated to GSAMday-to-day responsibility for implementing and maintaining internal controls and procedures related to the valuation of the Funds’ investments. To assess the continuing appropriateness of pricing sources and methodologies, GSAM regularly performs price verification procedures and issues challenges as necessary to third party pricing vendors or brokers, and any differences are reviewed in accordance with the Valuation Procedures.
38
ACTIVE EQUITY MULTI-MANAGER FUNDS
|
| 3. INVESTMENTS AND FAIR VALUE MEASUREMENTS (continued) |
A. Level 1 and Level 2 Fair Value Investments — The valuation techniques and significant inputs used in determining the fair values for investments classified as Level 1 and Level 2 are as follows:
Equity Securities — Equity securities traded on a United States (“U.S.”) securities exchange or the NASDAQ system, or those located on certain foreign exchanges, including but not limited to the Americas, are valued daily at their last sale price or official closing price on the principal exchange or system on which they are traded. If there is no sale or official closing price or such price is believed by GSAM to not represent fair value, equity securities may be valued at the closing bid price for long positions and at the closing ask price for short positions. To the extent these investments are actively traded, they are classified as Level 1 of the fair value hierarchy, otherwise they are generally classified as Level 2.
Unlisted equity securities for which market quotations are available are valued at the last sale price on the valuation date, or if no sale occurs, at the last bid price for long positions or the last ask price for short positions, and are generally classified as Level 2. Securities traded on certain foreign securities exchanges are valued daily at fair value determined by an independent fair value service (if available) under Valuation Procedures approved by the Trustees and consistent with applicable regulatory guidance. The independent fair value service takes into account multiple factors including, but not limited to, movements in the securities markets, certain depositary receipts, futures contracts and foreign currency exchange rates that have occurred subsequent to the close of the foreign securities exchange. These investments are generally classified as Level 2 of the fair value hierarchy.
Money Market Funds — Investments in the Goldman Sachs Financial Square Government Fund (“Underlying Fund”) are valued at the NAV per share on the day of valuation. These investments are generally classified as Level 1 of the fair value hierarchy. For information regarding an Underlying Fund’s accounting policies and investment holdings, please see the Underlying Fund’s shareholder report.
Derivative Contracts — A derivative is an instrument whose value is derived from underlying assets, indices, reference rates or a combination of these factors. A Fund enters into derivative transactions to hedge against changes in interest rates, securities prices, and/or currency exchange rates, to increase total return, or to gain access to certain markets or attain exposure to other underliers. For financial reporting purposes, cash collateral that has been pledged to cover obligations of a Fund and cash collateral received, if any, is reported separately on the Statements of Assets and Liabilities as receivables/payables for collateral on certain derivatives contracts.Non-cash collateral pledged by a Fund, if any, is noted in the Schedules of Investments.
Exchange-traded derivatives, including futures and options contracts, are generally valued at the last sale or settlement price on the exchange where they are principally traded. Exchange-traded options without settlement prices are generally valued at the midpoint of the bid and ask prices on the exchange where they are principally traded (or, in the absence oftwo-way trading, at the last bid price for long positions and the last ask price for short positions). Exchange-traded derivatives typically fall within Level 1 of the fair value hierarchy.Over-the-counter (“OTC”) and centrally cleared derivatives are valued using market transactions and other market evidence, including market-based inputs to models, calibration to market-clearing transactions, broker or dealer quotations, or other alternative pricing sources. Where models are used, the selection of a particular model to value OTC and centrally cleared derivatives depends upon the contractual terms of, and specific risks inherent in, the instrument, as well as the availability of pricing information in the market. Valuation models require a variety of inputs, including contractual terms, market prices, yield curves, credit curves, measures of volatility, voluntary and involuntary prepayment rates, loss severity rates and correlations of such inputs. For OTC and centrally cleared derivatives that trade in liquid markets, model inputs can generally be verified and model selection does not involve significant management judgment. OTC and centrally cleared derivatives are classified within Level 2 of the fair value hierarchy when significant inputs are corroborated by market evidence.
i. Forward Contracts — A forward contract is a contract between two parties to buy or sell an asset at a specified price on a future date. A forward contract settlement can occur on a cash or delivery basis. Forward contracts aremarked-to-market daily using independent vendor prices, and the change in value, if any, is recorded as an unrealized gain or loss. Cash and certain investments may be used to collateralize forward contracts.
Aforward foreign currency exchange contractis a forward contract in which a Fund agrees to receive or deliver a fixed quantity of one currency for another, at apre-determined price at a future date. All forward foreign currency exchange
39
ACTIVE EQUITY MULTI-MANAGER FUNDS
Notes to Financial Statements(continued)
October 31, 2019
|
| 3. INVESTMENTS AND FAIR VALUE MEASUREMENTS (continued) |
contracts aremarked-to-market daily at the applicable forward rate.Non-deliverable forward foreign currency exchange contracts are settled with the counterparty in cash without the delivery of foreign currency.
ii. Futures Contracts — Futures contracts are contracts to buy or sell a standardized quantity of a specified commodity or security. Upon entering into a futures contract, a Fund deposits cash or securities in an account on behalf of the broker in an amount sufficient to meet the initial margin requirement. Subsequent payments are made or received by a Fund equal to the daily change in the contract value and are recorded as variation margin receivable or payable with a corresponding offset to unrealized gains or losses.
B. Level 3 Fair Value Investments — To the extent that significant inputs to valuation models and other alternative pricing sources are unobservable, or if quotations are not readily available, or if GSAM believes that such quotations do not accurately reflect fair value, the fair value of a Fund’s investments may be determined under Valuation Procedures approved by the Trustees. GSAM, consistent with its procedures and applicable regulatory guidance, may make an adjustment to the most recent valuation prices of either domestic or foreign securities in light of significant events to reflect what it believes to be the fair value of the securities at the time of determining a Fund’s NAV. To the extent investments are valued using single source broker quotations obtained directly from the broker or passed through from third party pricing vendors, such investments are classified as Level 3 investments. GSAM did not develop the unobservable inputs for the valuation of Level 3 Assets and Liabilities.
C. Fair Value Hierarchy — The following is a summary of the Funds’ investments and derivatives classified in the fair value hierarchy as of October 31, 2019:
| | | | | | | | | | | | |
|
| MULTI-MANAGER INTERNATIONAL EQUITY | |
| | | |
| Investment Type | | Level 1 | | | Level 2 | | | Level 3 | |
| | | |
| Assets | | | | | | | | | | | | |
| | | |
Common Stock and/or Other Equity Investments(a) | | | | | | | | | | | | |
| | | |
Asia | | $ | 43,088,671 | | | $ | 146,577,587 | | | $ | — | |
| | | |
Australia and Oceania | | | — | | | | 7,819,813 | | | | — | |
| | | |
Europe | | | 41,727,954 | | | | 505,744,691 | | | | — | |
| | | |
North America | | | 51,643,485 | | | | — | | | | — | |
| | | |
South America | | | 1,548,195 | | | | — | | | | — | |
| | | |
Investment Company | | | 22,489,043 | | | | — | | | | — | |
| | | |
| Total | | $ | 160,497,348 | | | $ | 660,142,091 | | | $ | — | |
| | | |
| Derivative Type | | | | | | | | | |
| | | |
| Assets(b) | | | | | | | | | | | | |
| | | |
Forward Foreign Currency Exchange Contracts | | $ | — | | | $ | 24 | | | $ | — | |
| (a) | | Amounts are disclosed by continent to highlight the impact of time zone differences between local market close and the calculation of net asset value. Security valuations are based on the principal exchange or system on which they are traded, which may differ from country of domicile. The Funds utilize fair value model prices provided by an independent fair value service for international equities, resulting in a Level 2 classification. |
| (b) | | Amount shown represents unrealized gain (loss) at period end. |
40
ACTIVE EQUITY MULTI-MANAGER FUNDS
|
| 3. INVESTMENTS AND FAIR VALUE MEASUREMENTS (continued) |
| | | | | | | | | | | | |
| MULTI-MANAGER U.S. DYNAMIC EQUITY | | | | | | | | | | | | |
| | | |
| Investment Type | | Level 1 | | | Level 2 | | | Level 3 | |
| | | |
| Assets | | | | | | | | | | | | |
| | | |
Common Stock and/or Other Equity Investments(a) | | | | | | | | | | | | |
| | | |
Asia | | $ | 948,965 | | | $ | — | | | $ | — | |
| | | |
Europe | | | 8,168,838 | | | | 6,835,462 | | | | — | |
| | | |
North America | | | 147,745,163 | | | | — | | | | — | |
| | | |
Investment Company | | | 8,028,001 | | | | — | | | | — | |
| | | |
| Total | | $ | 164,890,967 | | | $ | 6,835,462 | | | $ | — | |
| | | |
| Derivative Type | | | | | | | | | |
| | | |
| Assets(b) | | | | | | | | | | | | |
| | | |
Forward Foreign Currency Exchange Contracts | | $ | — | | | $ | 11,470 | | | $ | — | |
| | | |
| Liabilities(b) | | | | | | | | | | | | |
| | | |
Forward Foreign Currency Exchange Contracts | | $ | — | | | $ | (105,574 | ) | | $ | — | |
| | | |
| MULTI-MANAGER U.S. SMALL CAP EQUITY | | | | | | | | | | | | |
| | | |
| Investment Type | | Level 1 | | | Level 2 | | | Level 3 | |
| | | |
| Assets | | | | | | | | | | | | |
| | | |
Common Stock and/or Other Equity Investments(a) | | | | | | | | | | | | |
| | | |
Asia | | $ | 1,453,598 | | | $ | — | | | $ | — | |
| | | |
Europe | | | 2,663,603 | | | | — | | | | — | |
| | | |
North America | | | 352,221,863 | | | | — | | | | — | |
| | | |
South America | | | 524,186 | | | | — | | | | — | |
| | | |
Fixed Income | | | | | | | | | | | | |
| | | |
U.S. Treasury Obligations | | | 239,541 | | | | — | | | | — | |
| | | |
Investment Company | | | 17,650,494 | | | | — | | | | — | |
| | | |
| Total | | $ | 374,753,285 | | | $ | — | | | $ | — | |
| | | |
| Derivative Type | | | | | | | | | |
| | | |
| Assets | | | | | | | | | | | | |
| | | |
Futures Contracts(b) | | $ | 121,328 | | | $ | — | | | $ | — | |
| (a) | | Amounts are disclosed by continent to highlight the impact of time zone differences between local market close and the calculation of net asset value. Security valuations are based on the principal exchange or system on which they are traded, which may differ from country of domicile. The Funds utilize fair value model prices provided by an independent fair value service for international equities, resulting in a Level 2 classification. |
| (b) | | Amount shown represents unrealized gain (loss) at period end. |
For further information regarding security characteristics, see the Schedules of Investments.
|
| 4. INVESTMENTS IN DERIVATIVES |
The following tables set forth, by certain risk types, the gross value of derivative contracts (not considered to be hedging instruments for accounting disclosure purposes) as of October 31, 2019. These instruments were used as part of the Funds’ investment strategies and to obtain and/or manage exposure related to the risks below. The values in the tables below exclude the
41
ACTIVE EQUITY MULTI-MANAGER FUNDS
Notes to Financial Statements(continued)
October 31, 2019
|
| 4. INVESTMENTS IN DERIVATIVES (continued) |
effects of cash collateral received or posted pursuant to these derivative contracts, and therefore are not representative of the Funds’ net exposure.
| | | | | | | | | | | | |
| | | |
Multi-Manager International Equity Fund | | | | | | | | | | |
| Risk | | Statements of Assets
and Liabilities | | Assets | | | Statements of Assets
and Liabilities | | Liabilities | |
Currency | | Receivable for unrealized gain on forward foreign currency exchange contracts | | $ | 24 | | | — | | $ | — | |
| | | |
Multi-Manager U.S. Dynamic Equity Fund | | | | | | | | | | |
| Risk | | Statements of Assets
and Liabilities | | Assets | | | Statements of Assets
and Liabilities | | Liabilities | |
Currency | | Receivable for unrealized gain on forward foreign currency exchange contracts | | $ | 11,470 | | | Payable for unrealized loss on forward foreign currency exchange contracts | | $ | (105,574) | |
| | | |
Multi-Manager U.S. Small Cap Equity Fund | | | | | | | | | | |
| Risk | | Statements of Assets
and Liabilities | | Assets | | | Statements of Assets
and Liabilities | | Liabilities | |
Equity | | Variation margin on futures contracts | | $ | 121,328 | (a) | | — | | $ | — | |
| (a) | | Includes unrealized gain (loss) on futures contracts described in the Additional Investment Information sections of the Schedule of Investments. Only current day’s variation margin is reported within the Statement of Assets and Liabilities. |
The following tables set forth, by certain risk types, the Funds’ gains (losses) related to these derivatives and their indicative volumes for the fiscal year ended October 31, 2019. These gains (losses) should be considered in the context that these derivative contracts may have been executed to create investment opportunities and/or economically hedge certain investments, and accordingly, certain gains (losses) on such derivative contracts may offset certain (losses) gains attributable to investments. These gains (losses) are included in “Net realized gain (loss)” or “Net change in unrealized gain (loss)” on the Statements of Operations:
| | | | | | | | | | | | | | |
|
| Multi-Manager International Equity Fund | |
| Risk | | Statements of Operations | | Net Realized
Gain | | | Net Change in
Unrealized
Gain | | | Average
Number of
Contracts(a) | |
| Currency | | Net realized gain (loss) from forward foreign currency exchange contracts/Net unrealized gain (loss) on forward foreign currency exchange contracts | | $ | 35,707 | | | $ | (533 | ) | | | 1 | |
|
| Multi-Manager U.S. Dynamic Equity Fund | |
| Risk | | Statements of Operations | | Net Realized
Gain (Loss) | | | Net Change in
Unrealized
Gain (Loss) | | | Average
Number of
Contracts(a) | |
| Currency | | Net realized gain (loss) from forward foreign currency exchange contracts/Net unrealized gain (loss) on forward foreign currency exchange contracts | | $ | 464,787 | | | $ | (249,618 | ) | | | 13 | |
| |
| Multi-Manager U.S. Small Cap Equity Fund | | | | | |
| Risk | | Statement of Operations | | Net Realized
Gain (Loss) | | | Net Change in
Unrealized
Gain | | | Average
Number of
Contracts(a) | |
| Equity | | Net realized gain (loss) from futures contracts / Net change in unrealized gain (loss) on futures contracts. | | $ | (59,015 | ) | | $ | 121,328 | | | | 18 | |
| (a) | | Average number of contracts is based on the average of month end balances for the fiscal year ended October 31, 2019. |
42
ACTIVE EQUITY MULTI-MANAGER FUNDS
|
| 5. AGREEMENTS AND AFFILIATED TRANSACTIONS |
A. Management Agreement —Under the Agreement, GSAM manages the Funds, subject to the general supervision of the Trustees.
As compensation for the services rendered pursuant to the Agreement, the assumption of the expenses related thereto and administration of the Funds’ business affairs, including providing facilities, GSAM is entitled to a management fee, accrued daily and paid monthly, equal to an annual percentage rate of each Fund’s average daily net assets.
For the fiscal year ended October 31, 2019, contractual and effective net management fees with GSAM were at the following rates:
| | | | | | | | | | |
| | | | | Management Rate | |
| Fund | | | | Contractual
Management
Rate | | | Effective Net Management Rate*^ | |
Multi-Manager International Equity | | | | | 0.60 | % | | | 0.43 | % |
Multi-Manager U.S. Dynamic Equity | | | | | 0.80 | | | | 0.63 | |
Multi-Manager U.S. Small Cap Equity | | | | | 0.75 | | | | 0.60 | |
| * | | GSAM has agreed to waive a portion of its management fee for each Fund in order to achieve an effective net management fee rate that is equal to the actual cost of fees paid to the Fund’s Underlying Managers. These arrangements will remain in effect through at least February 28, 2020 and prior to such date, GSAM may not terminate the applicable arrangement without the approval of the Trustees. |
| ^ | | Effective Net Management Rate includes the impact of management fee waivers of affiliated underlying funds, if any. |
The Funds invest in Institutional Shares of the Goldman Sachs Financial Square Government Fund, which is an affiliated Underlying Fund. GSAM has agreed to waive a portion of its management fee payable by the Funds in an amount equal to the management fee it earns as an investment adviser to the affiliated Underlying Fund in which the Funds invest. For the fiscal year ended October 31, 2019, GSAM waived $37,317, $12,598 and $24,015 of the management fee for the Multi-Manager International Equity, Multi-Manager U.S. Dynamic Equity and Multi-Manager U.S. Small Cap Equity Funds, respectively.
B. Transfer Agency Agreement — Goldman Sachs also serves as the transfer agent of the Funds for a fee pursuant to the Transfer Agency Agreement. The fees charged for such transfer agency services are accrued daily and paid monthly at annual rates as follows: 0.02% of the average daily net assets of Class P Shares.
C. Other Expense Agreements and Affiliated Transactions — GSAM has agreed to reduce or limit each Fund’s “Total Annual Operating Expenses” (excluding acquired fund fees and expenses, service fees and shareholder administration fees (as applicable), taxes, interest, brokerage fees, expenses of shareholder meetings, litigation and indemnification, and extraordinary expenses) to the extent such expenses exceed, on an annual basis, a percentage rate of the average daily net assets of each Fund. Such Total Annual Operating Expense reimbursements, if any, are accrued daily and paid monthly. In addition, the Funds are not obligated to reimburse GSAM for prior fiscal year expense reimbursements, if any. The Total Annual Operating Expense limitations as an annual percentage rate of average daily net assets for the Multi-Manager International Equity, Multi-Manager U.S. Dynamic Equity and the Multi-Manager U.S. Small Cap Equity Funds are 0.57%, 0.79% and 0.80% respectively. These Total Annual Operating Expense limitations will remain in place through at least February 28, 2020, and prior to such date GSAM may not terminate the arrangements without the approval of the Trustees. In addition, the Funds have entered into certain offset arrangements with the transfer agent, which may result in a reduction of the Funds’ expenses and are received irrespective of the application of the “Total Annual Operating Expense” limitations described above.
43
ACTIVE EQUITY MULTI-MANAGER FUNDS
Notes to Financial Statements(continued)
October 31, 2019
|
| 5. AGREEMENTS AND AFFILIATED TRANSACTIONS (continued) |
For the fiscal year ended October 31, 2019, these expense reductions, including any fee waivers and Total Annual Operating Expense reimbursements, were as follows:
| | | | | | | | | | | | | | |
| Fund | | | | Management
Fee Waiver | | | Other Expense
Reimbursements | | | Total Annual
Operating Expense
Reductions | |
Multi-Manager International Equity | | | | $ | 1,185,309 | | | $ | 185,269 | | | $ | 1,370,578 | |
Multi-Manager U.S. Dynamic Equity | | | | | 269,882 | | | | 389,544 | | | | 659,426 | |
Multi-Manager U.S. Small Cap Equity | | | | | 495,486 | | | | 88,141 | | | | 583,627 | |
D. Line of Credit Facility — As of October 31, 2019, the Funds participated in a $580,000,000 committed, unsecured revolving line of credit facility (the “facility”) together with other funds of the Trust and certain registered investment companies having management agreements with GSAM or its affiliates. This facility is to be used for temporary emergency purposes, or to allow for an orderly liquidation of securities to meet redemption requests. The interest rate on borrowings is based on the federal funds rate. The facility also requires a fee to be paid by the Funds based on the amount of the commitment that has not been utilized. For the fiscal year ended October 31, 2019, the Funds did not have any borrowings under the facility. Prior to April 30, 2019 the facility was $770,000,000.
E. Other Transactions with Affiliates —For the fiscal year ended October 31, 2019 , Goldman Sachs earned $201 and $1,398 in brokerage commissions from portfolio transactions, on behalf of the Multi-Manager International Equity and Multi-Manager U.S. Small Cap Equity Funds, respectively.
The following table provides information about the Funds’ investments in the Goldman Sachs Financial Square Government Fund as of and for the year ended October 31, 2019:
| | | | | | | | | | | | | | | | | | | | | | | | | | |
| Fund | | | | Market Value as of
October 31, 2018 | | | Purchases
at Cost | | | Proceeds
from Sales | | | Market
Value as of
October 31, 2019 | | | Shares as of
October 31, 2019 | | | Dividend
Income | |
Multi-Manager International Equity | | | | $ | 22,326,171 | | | $ | 372,041,755 | | | $ | (371,878,883 | ) | | $ | 22,489,043 | | | | 22,489,043 | | | $ | 510,080 | |
Multi-Manager U.S. Dynamic Equity | | | | | 8,575,215 | | | | 87,770,345 | | | | (88,317,559 | ) | | | 8,028,001 | | | | 8,028,001 | | | | 172,320 | |
Multi-Manager U.S. Small Cap Equity | | | | | 17,772,708 | | | | 166,466,235 | | | | (166,588,449 | ) | | | 17,650,494 | | | | 17,650,494 | | | | 329,420 | |
|
| 6. PORTFOLIO SECURITIES TRANSACTIONS |
The cost of purchases and proceeds from sales and maturities of long-term securities for the fiscal year ended October 31, 2019, were as follows:
| | | | | | | | | | |
| Fund | | | | Purchases | | | Sales and Maturities | |
Multi-Manager International Equity | | | | $ | 318,765,811 | | | $ | 195,531,060 | |
Multi-Manager U.S. Dynamic Equity | | | | | 139,959,517 | | | | 145,378,696 | |
Multi-Manager U.S. Small Cap Equity | | | | | 316,175,333 | | | | 285,094,964 | |
44
ACTIVE EQUITY MULTI-MANAGER FUNDS
The tax character of distributions paid during the fiscal year ended October 31, 2019 was as follows:
| | | | | | | | | | | | | | |
| | | | | Multi-Manager
International
Equity Fund | | | Multi-Manager
U.S. Dynamic
Equity Fund | | | Multi-Manager
U.S. Small Cap
Equity Fund | |
Distribution paid from: | | | | | | | | | | | | | | |
Ordinary income | | | | $ | 11,615,633 | | | $ | 4,504,389 | | | $ | 3,721,929 | |
Net long-term capital gains | | | | | 12,969,747 | | | | 5,732,475 | | | | 5,226,215 | |
Total taxable distributions | | | | $ | 24,585,380 | | | $ | 10,236,864 | | | $ | 8,948,144 | |
Tax return of capital | | | | $ | — | | | $ | — | | | $ | — | |
The tax character of distributions paid during the fiscal year ended October 31, 2018 was as follows:
| | | | | | | | | | | | | | |
| | | | | Multi-Manager
International
Equity Fund | | | Multi-Manager
U.S. Dynamic
Equity Fund | | | Multi-Manager
U.S. Small Cap
Equity Fund | |
Distribution paid from: | | | | | | | | | | | | | | |
Ordinary income | | | | $ | 7,089,359 | | | $ | 475,869 | | | $ | 3,155,996 | |
Net long-term capital gains | | | | | 3,919 | | | | 3,815,811 | | | | 1,945,146 | |
Total taxable distributions | | | | $ | 7,093,278 | | | $ | 4,291,680 | | | $ | 5,101,142 | |
As of October 31, 2019, the components of accumulated earnings (losses) on a tax basis were as follows:
| | | | | | | | | | | | | | |
| | | | | Multi-Manager
International
Equity Fund | | | Multi-Manager
U.S. Dynamic
Equity Fund | | | Multi-Manager
U.S. Small Cap
Equity Fund | |
Undistributed ordinary income — net | | | | $ | 18,024,435 | | | $ | 3,802,574 | | | $ | 1,480,012 | |
Undistributed long-term capital gains | | | | | 1,149,216 | | | | 4,840,439 | | | | 9,933,603 | |
Total undistributed earnings | | | | $ | 19,173,651 | | | $ | 8,643,013 | | | $ | 11,413,615 | |
Unrealized gains (losses) — net | | | | | 73,170,568 | | | | 33,741,927 | | | | 37,136,481 | |
Total accumulated earnings (losses) net | | | | $ | 92,344,219 | | | $ | 42,384,940 | | | $ | 48,550,096 | |
As of October 31, 2019, the Funds’ aggregate security unrealized gains and losses based on cost for U.S. federal income tax purposes were as follows:
| | | | | | | | | | | | | | |
| | | | | Multi-Manager
International
Equity Fund | | | Multi-Manager
U.S. Dynamic
Equity Fund | | | Multi-Manager
U.S. Small Cap
Equity Fund | |
Tax Cost | | | | $ | 747,274,454 | | | $ | 137,890,008 | | | $ | 337,738,132 | |
Gross unrealized gain | | | | | 114,508,379 | | | | 36,057,121 | | | | 54,785,360 | |
Gross unrealized loss | | | | | (41,337,811 | ) | | | (2,315,194 | ) | | | (17,648,879 | ) |
Net unrealized gains | | | | $ | 73,170,568 | | | $ | 33,741,927 | | | $ | 37,136,481 | |
The difference between GAAP-basis and tax basis unrealized gains (losses) is attributable primarily to wash sales, net mark to market gains/(losses) on regulated futures contracts, net mark to market gains/(losses) on foreign currency contracts, and differences in the tax treatment of passive foreign investment company investments.
45
ACTIVE EQUITY MULTI-MANAGER FUNDS
Notes to Financial Statements(continued)
October 31, 2019
|
| 7. TAX INFORMATION (continued) |
GSAM has reviewed the Funds’ tax positions for all open tax years (the current and prior three years, as applicable) and has concluded that no provision for income tax is required in the Funds’ financial statements. Such open tax years remain subject to examination and adjustment by tax authorities.
The Funds’ risks include, but are not limited to, the following:
Derivatives Risk — The Funds’ use of derivatives may result in loss. Derivative instruments, which may pose risks in addition to and greater than those associated with investing directly in securities, currencies or other instruments, may be illiquid or less liquid, volatile, difficult to price and leveraged so that small changes in the value of the underlying instruments may produce disproportionate losses to the Funds. Derivatives are also subject to counterparty risk, which is the risk that the other party in the transaction will not fulfill its contractual obligation. The use of derivatives is a highly specialized activity that involves investment techniques and risks different from those associated with investments in more traditional securities and instruments. Losses from derivatives can also result from a lack of correlation between changes in the value of derivative instruments and the portfolio assets (if any) being hedged.
Foreign and Emerging Countries Risk — Investing in foreign markets may involve special risks and considerations not typically associated with investing in the United States. Foreign securities may be subject to risk of loss because of more or less foreign government regulation, less public information and less economic, political and social stability in the countries in which the Funds invest. The imposition of exchange controls (including repatriation restrictions), confiscation of assets and property, trade restrictions (including tariffs) and other government restrictions by the United States or other governments, or from problems in share registration, settlement or custody, may also result in losses. Foreign risk also involves the risk of negative foreign currency rate fluctuations, which may cause the value of securities denominated in such foreign currency (or other instruments through which a Fund has exposure to foreign currencies) to decline in value. Currency exchange rates may fluctuate significantly over short periods of time. To the extent that the Funds also invest in securities of issuers located in emerging markets, these risks may be more pronounced.
Foreign Custody Risk — If a Fund invests in foreign securities, the Fund may hold such securities and cash with foreign banks, agents, and securities depositories appointed by the Fund’s custodian (each a “Foreign Custodian”). Some foreign custodians may be recently organized or new to the foreign custody business. In some countries, Foreign Custodians may be subject to little or no regulatory oversight over, or independent evaluation of, their operations. Further, the laws of certain countries may place limitations on a Fund’s ability to recover its assets if a Foreign Custodian enters bankruptcy. Investments in emerging markets may be subject to even greater custody risks than investments in more developed markets. Custody services in emerging market countries are very often undeveloped and may be considerably less well regulated than in more developed countries, and thus may not afford the same level of investor protection as would apply in developed countries.
Investments in Other Investment Companies Risk — As a shareholder of another investment company, a Fund will indirectly bear its proportionate share of any net management fees and other expenses paid by such other investment companies, in addition to the fees and expenses regularly borne by the Fund.
Geographic Risk — If a Fund focuses its investments in securities of issuers located in a particular country or geographic region, the Fund may be subjected, to a greater extent than if its investments were less focused, to the risks of volatile economic cycles and/or conditions and developments that may be particular to that country or region, such as: adverse securities markets; adverse exchange rates; adverse social, political, regulatory, economic, business, environmental or other developments; or natural disasters.
Large Shareholder Transactions Risk — A Fund may experience adverse effects when certain large shareholders, such as other funds, institutional investors (including those trading by use ofnon-discretionary mathematical formulas), financial intermediaries (who may make investment decisions on behalf of underlying clients and/or include a Fund in their investment
46
ACTIVE EQUITY MULTI-MANAGER FUNDS
|
| 8. OTHER RISKS (continued) |
model), individuals, accounts and Goldman Sachs affiliates, purchase or redeem large amounts of shares of a Fund. Such large shareholder redemptions, which may occur rapidly or unexpectedly, may cause a Fund to sell portfolio securities at times when it would not otherwise do so, which may negatively impact a Fund’s NAV and liquidity. These transactions may also accelerate the realization of taxable income to shareholders if such sales of investments resulted in gains, and may also increase transaction costs. In addition, a large redemption could result in a Fund’s current expenses being allocated over a smaller asset base, leading to an increase in the Fund’s expense ratio. Similarly, large Fund share purchases may adversely affect a Fund’s performance to the extent that the Fund is delayed in investing new cash or otherwise maintains a larger cash position than it ordinarily would.
Liquidity Risk — A Fund may make investments that are illiquid or that may become less liquid in response to market developments or adverse investor perceptions. Illiquid investments may be more difficult to value. Liquidity risk may also refer to the risk that a Fund will not be able to pay redemption proceeds within the allowable time period or without significant dilution to remaining investors’ interests because of unusual market conditions, an unusually high volume of redemption requests, or other reasons. To meet redemption requests, a Fund may be forced to sell investments at an unfavorable time and/or under unfavorable conditions. If a Fund is forced to sell securities at an unfavorable time and/or under unfavorable conditions, such sales may adversely affect the Fund’s NAV and dilute remaining investors’ interests. These risks may be more pronounced in connection with a Fund’s investments in securities of issuers located in emerging market countries. Redemptions by large shareholders may have a negative impact on the Fund’s liquidity.
Market and Credit Risks — In the normal course of business, a Fund trades financial instruments and enters into financial transactions where risk of potential loss exists due to changes in the market (market risk). Additionally, a Fund may also be exposed to credit risk in the event that an issuer or guarantor fails to perform or that an institution or entity with which the Fund has unsettled or open transactions defaults.
Multi-Manager Approach Risk — The Funds’ performance depends on the ability of the Investment Adviser in selecting, overseeing, and allocating Fund assets to the Underlying Managers. The Underlying Managers’ investment styles may not always be complementary. The Funds’ multi-manager approach may result in a Fund investing a significant percentage of its assets in certain types of investments, which could be beneficial or detrimental to the Funds’ performance depending on the performance of those investments and the overall market environment. The Funds’ Underlying Managers may underperform the market generally or underperform other investment managers that could have been selected for the Funds. Because the Funds’ Underlying Managers may trade with counterparties, prime brokers, clearing brokers or futures commission merchants on terms that are different than those on which the Investment Adviser would trade, and because each Underlying Manager applies its own risk analysis in evaluating potential counterparties for the Funds, the Funds may be subject to greater counterparty risk than if they were managed directly by the Investment Adviser.
Under the Trust’s organizational documents, its Trustees, officers, employees and agents are indemnified, to the extent permitted by the Act and state law, against certain liabilities that may arise out of performance of their duties to the Funds. Additionally, in the course of business, the Funds enter into contracts that contain a variety of indemnification clauses. The Funds’s maximum exposure under these arrangements is unknown, as this would involve future claims that may be made against the Funds that have not yet occurred. However, GSAM believes the risk of loss under these arrangements to be remote.
Subsequent events after the Statements of Assets and Liabilities date other than above have been evaluated, and GSAM has concluded that there is no impact requiring adjustment or disclosure in the financial statements.
47
ACTIVE EQUITY MULTI-MANAGER FUNDS
Notes to Financial Statements(continued)
October 31, 2019
|
| 11. SUMMARY OF SHARE TRANSACTIONS |
Share activity is as follows:
| | | | | | | | | | | | | | | | |
| | | Multi-Manager International Equity Fund | |
| | | | |
| | | For the Fiscal Year Ended
October 31, 2019 | | | For the Fiscal Year Ended
October 31, 2018 | |
| | | | |
| | | Shares | | | Dollars | | | Shares | | | Dollars | |
| | | | |
| Class P Shares | | | | | | | | | | | | | | | | |
Shares sold | | | 15,694,040 | | | $ | 171,615,977 | | | | 23,098,089 | | | $ | 269,285,343 | |
Reinvestment of distributions | | | 2,457,124 | | | | 24,585,380 | | | | 605,229 | | | | 7,093,278 | |
Shares redeemed | | | (5,792,905 | ) | | | (63,850,569 | ) | | | (3,791,376 | ) | | | (44,996,789 | ) |
| | | | |
NET INCREASE | | | 12,358,259 | | | $ | 132,350,788 | | | | 19,911,942 | | | $ | 231,381,832 | |
| |
| | | Multi-Manager U.S. Dynamic Equity Fund | |
| | | | |
| | | For the Fiscal Year Ended
October 31, 2019 | | | For the Fiscal Year Ended
October 31, 2018 | |
| | | | |
| | | Shares | | | Dollars | | | Shares | | | Dollars | |
| | | | |
| Class P Shares | | | | | | | | | | | | | | | | |
Shares sold | | | 1,130,475 | | | $ | 13,268,000 | | | | 4,651,595 | | | $ | 54,210,000 | |
Reinvestment of distributions | | | 961,226 | | | | 10,236,864 | | | | 375,628 | | | | 4,291,680 | |
Shares redeemed | | | (2,106,932 | ) | | | (24,622,918 | ) | | | (2,945,947 | ) | | | (35,535,266 | ) |
| | | | |
NET INCREASE (DECREASE) | | | (15,231 | ) | | $ | (1,118,054 | ) | | | 2,081,276 | | | $ | 22,966,414 | |
| |
| | | Multi-Manager U.S. Small Cap Equity Fund | |
| | | | |
| | | For the Fiscal Year Ended
October 31, 2019 | | | For the Fiscal Year Ended
October 31, 2018 | |
| | | | |
| | | Shares | | | Dollars | | | Shares | | | Dollars | |
| | | | |
| Class P Shares | | | | | | | | | | | | | | | | |
Shares sold | | | 4,779,300 | | | $ | 60,002,243 | | | | 12,533,550 | | | $ | 165,669,010 | |
Reinvestment of distributions | | | 794,190 | | | | 8,948,144 | | | | 403,074 | | | | 5,101,142 | |
Shares redeemed | | | (2,850,471 | ) | | | (34,391,380 | ) | | | (2,809,267 | ) | | | (37,822,987 | ) |
| | | | |
NET INCREASE | | | 2,723,019 | | | $ | 34,559,007 | | | | 10,127,357 | | | $ | 132,947,165 | |
48
Report of Independent Registered Public
Accounting Firm
Tothe Board of Trustees of
Goldman Sachs Trust II and Shareholders of Goldman Sachs Multi-Manager International Equity Fund, Goldman Sachs Multi-Manager U.S. Dynamic Equity Fund, and Goldman Sachs Multi-Manager U.S. Small Cap Equity Fund
Opinions on the Financial Statements
We have audited the accompanying statements of assets and liabilities, including the schedules of investments, of Goldman Sachs Multi-Manager International Equity Fund, Goldman Sachs Multi-Manager U.S. Dynamic Equity Fund, and Goldman Sachs Multi-Manager U.S. Small Cap Equity Fund (three of the funds constituting Goldman Sachs Trust II, hereafter collectively referred to as the “Funds”) as of October 31, 2019, the related statements of operations for the year ended October 31, 2019, the statements of changes in net assets for each of the two years in the period ended October 31, 2019, including the related notes,and the financial highlights for each of the periods indicated therein (collectively referred to as the “financial statements”). In our opinion, the financial statements present fairly, in all material respects, the financial position of each of the Funds as of October 31, 2019, the results of each of their operations for the year then ended, the changes in each of their net assets for each of the two years in the period ended October 31, 2019 and each of the financial highlights for each of the periods indicated therein in conformity with accounting principles generally accepted in the United States of America.
Basis for Opinions
These financial statements are the responsibility of the Funds’ management. Our responsibility is to express an opinion on the Funds’ financial statements based on our audits. We are a public accounting firm registered with the Public Company Accounting Oversight Board (United States) (PCAOB) and are required to be independent with respect to the Funds in accordance with the U.S. federal securities laws and the applicable rules and regulations of the Securities and Exchange Commission and the PCAOB.
We conducted our audits of these financial statements in accordance with the standards of the PCAOB. Those standards require that we plan and perform the audit to obtain reasonable assurance about whether the financial statements are free of material misstatement, whether due to error or fraud.
Our audits included performing procedures to assess the risks of material misstatement of the financial statements, whether due to error or fraud, and performing procedures that respond to those risks. Such procedures included examining, on a test basis, evidence regarding the amounts and disclosures in the financial statements. Our audits also included evaluating the accounting principles used and significant estimates made by management, as well as evaluating the overall presentation of the financial statements. Our procedures included confirmation of securities owned as of October 31, 2019 by correspondence with the custodian, transfer agent and brokers; when replies were not received from brokers, we performed other auditing procedures. We believe that our audits provide a reasonable basis for our opinions.
PricewaterhouseCoopers LLP
Boston, Massachusetts
December 23, 2019
We have served as the auditor of one or more investment companies in the Goldman Sachs fund complex since 2000.
49
ACTIVE EQUITY MULTI-MANAGER FUNDS
Fund Expenses — Six Month Period Ended October 31, 2019 (Unaudited)
As a shareholder of Class P Shares of the Funds, you incur two types of costs: (1) transaction costs, including sales charges on purchase payments, and (2) ongoing costs, including management fees; and other Fund expenses. This example is intended to help you understand your ongoing costs (in dollars) of investing in the Funds and to compare these costs with the ongoing costs of investing in other mutual funds.
The example is based on an investment of $1,000 invested at the beginning of the period and held for the entire period from May 1, 2019 through October 31, 2019, which represents a period of 184 days in a 365 day year.
Actual Expenses— The first line under each share class in the table below provides information about actual account values and actual expenses. You may use the information in this line, together with the amount you invested, to estimate the expenses that you paid over the period. Simply divide your account value by $1,000 (for example, an $8,600 account value divided by $1,000=8.6), then multiply the result by the number in the first line under the heading entitled “Expenses Paid” to estimate the expenses you paid on your account during this period.
Hypothetical Example for Comparison Purposes— The second line under each share class in the table below provides information about hypothetical account values and hypothetical expenses based on the Funds’ actual net expense ratios and an assumed rate of return of 5% per year before expenses, which is not the Funds’ actual return. The hypothetical account values and expenses may not be used to estimate the actual ending account balance or expenses you paid for the period. You may use this information to compare the ongoing costs of investing in the Funds and other funds. To do so, compare this 5% hypothetical example with the 5% hypothetical examples that appear in the shareholder reports of the other funds.
Please note that the expenses shown in the table are meant to highlight your ongoing costs only and do not reflect any transactional costs, such as sales charges, redemption fees, or exchange fees. Therefore, the second line of the table is useful in comparing ongoing costs only, and will not help you determine the relative total costs of owning different funds. In addition, if these transactional costs were included, your costs would have been higher.
| | | | | | | | | | | | | | | | | | | | | | | | | | | | | | | | | | | | |
| | | Multi-Manager International Equity Fund | | | Multi-Manager U.S. Dynamic Equity Fund | | | Multi-Manager U.S. Small Cap Equity Fund | |
| Share Class | | Beginning
Account
Value
5/1/19 | | | Ending
Account
Value
10/31/19 | | | Expenses
Paid for the
6 months ended
10/31/19* | | | Beginning
Account
Value
5/1/19 | | | Ending
Account
Value
10/31/19 | | | Expenses
Paid for the
6 months ended
10/31/19* | | | Beginning
Account
Value
5/1/19 | | | Ending
Account
Value
10/31/19 | | | Expenses
Paid for the
6 months ended
10/31/19* | |
| Class P | | | | | | | | | | | | | | | | | | | | | | | | | | | | | | | | | | | | |
Actual | | $ | 1,000.00 | | | $ | 1,029.90 | | | $ | 2.87 | | | $ | 1,000.00 | | | $ | 1,041.80 | | | $ | 4.01 | | | $ | 1,000.00 | | | $ | 1,009.90 | | | $ | 4.00 | |
Hypothethical 5% return | | | 1,000.00 | | | | 1,022.38 | + | | | 2.85 | | | | 1,000.00 | | | | 1,021.27 | + | | | 3.97 | | | | 1,000.00 | | | | 1,021.22 | + | | | 4.02 | |
| + | | Hypothetical expenses are based on each Fund’s actual annualized net expense ratios and an assumed rate of return of 5% per year before expenses. |
| * | | Expenses for each share class are calculated using each Fund’s annualized net expense ratio for each class, which represents the ongoing expenses as a percentage of net assets for the six months ended October 31, 2019. Expenses are calculated by multiplying the annualized net expense ratio by the average account value for the period; then multiplying the result by the number of days in the most recent fiscal half year; and then dividing that result by the number of days in the fiscal year. The annualized net expense ratios for the period were as follows: |
| | | | |
| Fund | | Class P | |
Multi-Manager International Equity Fund | | | 0.56 | % |
Multi-Manager U.S. Dynamic Equity Fund | | | 0.78 | |
Multi-Manager U.S. Small Cap Equity Fund | | | 0.79 | |
50
ACTIVE EQUITY MULTI-MANAGER FUNDS
Statement Regarding Basis for Approval of Management Agreement and Sub-Advisory Agreements (Unaudited)
Background
The Multi-Manager International Equity Fund, Multi-Manager U.S. Dynamic Equity Fund, and Multi-Manager U.S. Small Cap Equity Fund (the “Funds”) are investment portfolios of Goldman Sachs Trust II (the “Trust”). The Board of Trustees oversees the management of the Trust and reviews the investment performance and expenses of the Funds at regularly scheduled meetings held throughout the year. Each Fund employs a “manager of managers” structure, whereby Goldman Sachs Asset Management, L.P. (the “Investment Adviser”) is responsible for selectingsub-advisers (subject to Board approval), allocating the Fund’s assets among them, and overseeing theirday-to-day management of Fund assets. The Board determines annually whether to approve the continuance of the Trust’s investment management agreement (the “Management Agreement”) with the Investment Adviser on behalf of the Funds.
The Management Agreement was most recently approved for continuation until August 31, 2020 by the Board, including those Trustees who are not parties to the Management Agreement or “interested persons” (as defined in the Investment Company Act of 1940, as amended) of any party thereto (the “Independent Trustees”), at a meeting held on August6-7, 2019 (the “Annual Meeting”). At the Annual Meeting, the Board also considered thesub-advisory agreements (each a “ DesignatedSub-Advisory Agreement” and, together with the Management Agreement, the “Agreements”) between the Investment Adviser and (i) each of Causeway Capital Management LLC, Massachusetts Financial Services Company (d/b/a MFS Investment Management), and WCM Investment Management (on behalf of Multi-Manager International Equity Fund); (ii) each of Lazard Asset Management LLC, Sirios Capital Management, L.P., and Smead Capital Management, Inc. (on behalf of Multi-Manager U.S. Dynamic Equity Fund); and (iii) each of Boston Partners Global Investors, Inc. and Brown Advisory LLC (on behalf of Multi-Manager U.S. Small Cap Equity Fund) (collectively, the “DesignatedSub-Advisers”).
The review process undertaken by the Trustees spans the course of the year and culminates with the Annual Meeting. To assist the Trustees in their deliberations, the Trustees have established a Contract Review Committee (the “Committee”), comprised of the Independent Trustees. The Committee held four meetings over the course of the year since the Management Agreement was last approved. At those Committee meetings, regularly scheduled Board or other committee meetings, and/or the Annual Meeting, matters relevant to the renewal of the Management Agreement and the DesignatedSub-Advisory Agreements were considered by the Board, or the Independent Trustees, as applicable. With respect to each Fund, such matters included:
| | (a) | | the nature and quality of the advisory, administrative, and other services provided to the Fund by the Investment Adviser and its affiliates, and the DesignatedSub-Advisers, including, as applicable, information about: |
| | (i) | | the structure, staff, and capabilities of the Investment Adviser and the DesignatedSub-Advisers and the DesignatedSub-Advisers’ portfolio management teams; |
| | (ii) | | the groups within the Investment Adviser and its affiliates that support the portfolio management teams or provide other types of necessary services, including fund services groups (e.g., accounting and financial reporting, tax, shareholder services, and operations); controls and risk management groups (e.g., legal, compliance, valuation oversight, credit risk management, internal audit, compliance testing, market risk analysis, finance, and central funding); sales and distribution support groups, and others (e.g., information technology and training); |
| | (iii) | | trends in employee headcount; |
| | (iv) | | the Investment Adviser’s financial resources and ability to hire and retain talented personnel and strengthen its operations; and |
| | (v) | | the parent company’s support of the Investment Adviser and its mutual fund business, as expressed by the firm’s senior management; |
| | (b) | | information on the investment performance of the Fund, including comparisons to the performance of similar mutual funds, as provided by a third-party mutual fund data provider engaged as part of the contract review process (the “Outside Data Provider”), benchmark performance indices, and commingled investment vehicles with comparable investment strategies managed by the Investment Adviser, as well as general investment outlooks in the markets in which the Fund invests; |
| | (c) | | information provided by the Investment Adviser indicating the Investment Adviser’s views on whether the Fund’s peer group and/or benchmark index had high, medium, or low relevance given the Fund’s particular investment strategy; |
| | (d) | | the terms of the Agreements and other agreements with affiliated service providers entered into by the Trust on behalf of the Fund; |
| | (e) | | fee and expense information for the Fund, including: |
| | (i) | | the relative management fee and expense levels of the Fund as compared to those of comparable funds managed by other advisers, as provided by the Outside Data Provider; |
| | (ii) | | the Fund’s expense trends over time; and |
51
ACTIVE EQUITY MULTI-MANAGER FUNDS
Statement Regarding Basis for Approval of Management Agreement and Sub-Advisory Agreements (Unaudited) (continued)
| | (iii) | | comparative information on the advisory fees charged and services provided by the Investment Adviser to certain collective investment vehicles that it manages with comparable investment strategies; |
| | (f) | | with respect to the extensive investment performance and expense comparison data provided by the Outside Data Provider, its processes in producing that data for the Fund; |
| | (g) | | the undertakings of the Investment Adviser and its affiliates to implement fee waivers and/or expense limitations; |
| | (h) | | information relating to the profitability of the Management Agreement and the transfer agency arrangements of the Fund to the Investment Adviser and its affiliates; |
| | (i) | | whether the Fund’s existing management fee schedule adequately addressed any economies of scale; |
| | (j) | | a summary of the“fall-out” benefits derived by the Investment Adviser and its affiliates from their relationships with the Fund, including the fees received by the Investment Adviser’s affiliates from the Fund for transfer agency, portfolio trading, and other services; |
| | (k) | | a summary of potential benefits derived by the Fund as a result of its relationship with the Investment Adviser; |
| | (l) | | with respect to the Investment Adviser, portfolio manager ownership of Fund shares; the manner in which portfolio manager compensation is determined; information on the DesignatedSub-Advisers’ compensation arrangements; and the number and types of accounts managed by the portfolio managers; |
| | (m) | | the nature and quality of the services provided to the Fund by its unaffiliated service providers (as well as the DesignatedSub-Advisers), and the Investment Adviser’s general oversight and evaluation (including reports on due diligence) of those service providers as part of the administrative services provided under the Management Agreement; and |
| | (n) | | the Investment Adviser’s and DesignatedSub-Advisers’ processes and policies addressing various types of potential conflicts of interest; their approaches to risk management; the annual review of the effectiveness of the Fund’s compliance program; and periodic compliance reports. |
The Trustees also received an overview of the Funds’ distribution arrangements. They received information regarding the Funds’ assets and share purchase and redemption activity.
The presentations made at the Board and Committee meetings and at the Annual Meeting encompassed the Funds and other mutual funds for which the Board of Trustees has responsibility. In evaluating the Agreements at the Annual Meeting, the Trustees relied upon their knowledge, resulting from their meetings and other interactions throughout the year, of the Funds and the respective services of the Investment Adviser and its affiliates, and the DesignatedSub-Advisers. In conjunction with these meetings, the Trustees received written materials and oral presentations on the topics covered, and the Investment Adviser addressed the questions and concerns of the Trustees, including concerns regarding the investment performance of certain of the funds they oversee. In addition, the Trustees periodically received written materials and oral presentations from the funds’ varioussub-advisers, including the DesignatedSub-Advisers. The Independent Trustees were advised by their independent legal counsel regarding their responsibilities and other regulatory requirements related to the approval and continuation of mutual fund investment management agreements under applicable law. In addition, the Investment Adviser and its affiliates provided the Independent Trustees with a written response to a formal request for information sent on behalf of the Independent Trustees by their independent legal counsel. The Trustees reviewed a written response prepared by each DesignatedSub-Adviser to a similar request for information submitted to the DesignatedSub-Adviser by the Investment Adviser. During the course of their deliberations, the Independent Trustees met in executive sessions with their independent legal counsel, without representatives of the Investment Adviser or its affiliates present.
Nature, Extent, and Quality of the Services Provided Under the Management Agreement
As part of their review, the Trustees considered the nature, extent, and quality of the services provided to the Funds by the Investment Adviser. In this regard, the Trustees considered both the investment advisory services andnon-advisory services that are provided by the Investment Adviser and its affiliates. They also recalled presentations received during the past year, which described portfolio management changes for the Funds. The Trustees noted the ongoing recruitment efforts aimed at bringing high quality investment talent to the Investment Adviser. They also noted the Investment Adviser’s commitment to maintaining high quality systems and expending substantial resources to respond to ongoing changes to the regulatory and control environment in which the Funds and their service providers operate, as well as the efforts of the Investment Adviser and its affiliates to combat cyber security risks. The Trustees concluded that the Investment Adviser continued to commit substantial financial and operational resources to the Funds and expressed confidence that the Investment Adviser would continue to do so in the future. The Trustees also recognized that the Investment Adviser had made significant commitments to address regulatory compliance requirements applicable to the Funds and the Investment Adviser and its affiliates. In addition, the Trustees reviewed theSub-Adviser oversight process that the Investment Adviser had employed, which included areas such as investment analytics, risk management and compliance.
52
ACTIVE EQUITY MULTI-MANAGER FUNDS
Statement Regarding Basis for Approval of Management Agreement and Sub-Advisory Agreements (Unaudited) (continued)
Investment Performance
The Trustees also considered the investment performance of the Funds. In this regard, they compared the investment performance ofeach Fund to its peers usingrankings compiled by the Outside Data Provider, and updated performance information prepared by the Investment Adviser using the peer groups identified by the Outside Data Provider. The Trustees also reviewed each Fund’s investment performance relative to its performance benchmark. As part of this review, they considered the investment performance trends of the Funds over time, and reviewed the investment performance of each Fund in light of its investment objective and policies and market conditions.The Trustees considered the Investment Adviser’s representations that each Fund had significant differences from its Outside Data Provider peer group that caused it to be an imperfect basis for comparison. The Trustees also compared the investment performance of each Fund to the performance of comparable unregistered funds for which the Investment Adviser also serves as investment adviser. They considered that the unregistered funds provide an imperfect performance comparison because they are not subject to the requirements of the Investment Company Act of 1940, as amended.
In addition, the Trustees considered materials prepared and presentations made by the Investment Adviser’s senior management and theSub-Advisers’ portfolio management personnel in which Fund performance was assessed. The Trustees also considered the Investment Adviser’s periodic reports with respect to the Funds’ risk profiles, and how the Investment Adviser’s approach to risk monitoring and management influences portfolio management.
The Trustees noted that the Multi-Manager International Equity Fund’s Class P Shares had placed in the first quartile of the Fund’s performance peer group for theone- and three-year periods, and had outperformed the Fund’s benchmark index for theone-year period ended March 31, 2019. They observed that the Multi-Manager U.S. Dynamic Equity Fund’s Class P Shares had placed in the second quartile of the Fund’s performance peer group for theone-year period and the third quartile for the three-year period, and had underperformed the Fund’s benchmark index for theone-year period ended March 31, 2019. The Trustees noted that theMulti-Manager U.S. Small Cap Equity Fund’s Class P Shares had placed in the second quartile of the Fund’s performance peer group, and had underperformed the Fund’s benchmark index for theone-year period ended March 31, 2019.
Costs of Services Provided and Competitive Information
The Trustees considered the contractual terms of the Management Agreement, the fee rates payable by each Fund thereunder, and the net amount retained by the Investment Adviser after payment ofsub-advisory fees. In this regard, the Trustees considered information on the services rendered by the Investment Adviser to the Funds, which included both advisory and administrative services that were directed to the needs and operations of the Funds as registered mutual funds.
In particular, the Trustees reviewed analyses prepared by the Outside Data Provider regarding the expense rankings of the Funds, as well as additional information provided by the Investment Adviser throughout the year. The analyses provided a comparison of each Fund’s management fee to those of a relevant peer group and category universe; an expense analysis which compared each Fund’s overall net and gross expenses to a peer group and a category universe; and data comparing each Fund’s net expenses to the peer and category medians. The analyses also compared each Fund’s other expenses and fee waivers/reimbursements to those of the peer group and category medians. The Trustees also considered comparative fee information for services provided by the Investment Adviser to collective investment vehicles having investment objectives and policies similar to those of the Funds. The Trustees considered that services provided to the Funds differed in various significant respects from the services provided to these collective investment vehicles, which generally operated under less stringent regulatory and financial reporting requirements and required fewer services from the Investment Adviser. The Trustees concluded that the comparisons provided by the Outside Data Provider and the Investment Adviser were useful in evaluating the reasonableness of the management fees and total expenses paid by the Funds.
The Trustees considered the Investment Adviser’s undertaking to waive a portion of the management fee payable by each Fund. In this regard, the Trustees noted that the Investment Adviser’s institutional clients that are invested in the Funds pay a single management fee for the Investment Adviser’s management of their accounts, and that the Investment Adviser waives a portion of the management fee with respect to each Fund in order to achieve an effective net management fee rate that is equal to the actual cost of fees paid to the Fund’ssub-advisers. They also considered the Investment Adviser’s undertaking to limit each Fund’s total annual operating expenses (excluding certain expenses) to a specified level. In addition, the Trustees noted that shareholders are able to redeem their Fund shares at any time if shareholders believe that the Fund fees and expenses are too high or if they are dissatisfied with the performance of the Fund.
53
ACTIVE EQUITY MULTI-MANAGER FUNDS
Statement Regarding Basis for Approval of Management Agreement and Sub-Advisory Agreements (Unaudited) (continued)
The Investment Adviser’s Profitability
The Trustees reviewed each Fund’s contribution to the Investment Adviser’s revenues andpre-tax profit margins. In this regard the Trustees noted that they had received, among other things, profitability analyses and summaries, revenue and expense schedules by Fund and by function (i.e., investment management, transfer agency, and distribution and service), and information on the Investment Adviser’s expense allocation methodology. They observed that the profitability and expense figures are substantially similar to those used by the Investment Adviser for many internal purposes, including compensation decisions among various business groups, and are thus subject to a vigorous internal debate about how certain revenue and expenses should be allocated.
The Trustees also noted that the internal audit group within the Goldman Sachs organization periodically audits the expense allocation methodology and that the internal audit group was satisfied with the reasonableness, consistency, and accuracy of the Investment Adviser’s expense allocation methodology. Profitability data for each Fund was provided for 2018 and 2017, and the Trustees considered this information in relation to the Investment Adviser’s overall profitability.
Economies of Scale
The Trustees considered the information that had been provided regarding whether there have been economies of scale with respect to the management of the Funds. The Trustees considered that the Funds are offered to the Investment Adviser’s institutional clients as part of an investment model whereby the Funds and other funds act as core “building blocks” with which the client and the Investment Adviser form an investment strategy for the client’s portfolio. The Trustees considered the Investment Adviser’s representations that its clients benefit from this investment model with increased liquidity, increased investment oversight, access to new investment strategies, economies of scale, and reduced complexity in managing client portfolios. The Trustees noted that, pursuant to the model, clients pay a management fee for the Investment Adviser’s management of their accounts, and that the fund-level management fee in excess of the weighted averagesub-advisory fees are waived in order to avoid charging two layers of management fees. The Trustees considered the amounts of assets in the Funds; the Funds’ recent share purchase and redemption activity; the information provided by the Investment Adviser relating to the costs of the services provided by the Investment Adviser and its affiliates and their realized profits (if any); information comparing fee rates charged by the Investment Adviser with fee rates charged to other funds in the peer groups; and the Investment Adviser’s undertakings to waive a portion of its management fee and to limit certain expenses of the Funds that exceed specified levels. The Trustees also considered the relationship between the advisory andsub-advisory fee rate schedules.
Other Benefits to the Investment Adviser and Its Affiliates
The Trustees also considered the other benefits derived by the Investment Adviser and its affiliates from their relationships with the Funds, including: (a) transfer agency fees received by Goldman Sachs & Co. LLC (“Goldman Sachs”); (b) brokerage and futures commissions earned by Goldman Sachs for executing securities transactions (in its capacity as clearing broker) and futures transactions on behalf of the Funds; (c) the Investment Adviser’s ability to leverage the infrastructure designed to service the Funds on behalf of the Investment Adviser’s other clients; (d) the Investment Adviser’s ability to cross-market other products and services to Fund shareholders; (e) the Investment Adviser’s ability to negotiate better pricing with the Funds’ custodian on behalf of its other clients, as a result of the relationship with the Funds; and (f) the possibility that the working relationship between the Investment Adviser and the Funds’ third-party service providers (including theSub-Advisers) may cause those service providers to be more likely to do business with other areas of Goldman Sachs. In the course of considering the foregoing, the Independent Trustees requested and received further information quantifying certain of thesefall-out benefits.
Other Benefits to the Funds and Their Shareholders
The Trustees also noted that the Funds receive certain other potential benefits as a result of their relationship with the Investment Adviser, including: (a) enhanced servicing from vendors due to the volume of business generated by the Investment Adviser and its affiliates; (b) the advantages received from the Investment Adviser’s knowledge and experience gained from managing other accounts and products; (c) the Investment Adviser’s ability to hire and retain qualified personnel to provide services to the Funds because of the reputation of the Goldman Sachs organization; (d) the Funds’ access, through the Investment Adviser, to certain firm-wide resources (e.g., proprietary risk management systems and databases), subject to certain restrictions; and (e) access to certain affiliated distribution channels.
54
ACTIVE EQUITY MULTI-MANAGER FUNDS
Statement Regarding Basis for Approval of Management Agreement and Sub-Advisory Agreements (Unaudited) (continued)
Conclusion
In connection with their consideration of the Management Agreement, the Trustees gave weight to various factors, but did not identify any particular factor as controlling their decision. After deliberation and consideration of the information provided, including the factors described above, the Trustees, including the Independent Trustees, unanimously concluded, in the exercise of their business judgment, that the investment management fees paid by each Fund were reasonable in light of the factors considered, and that the Management Agreement, and the terms thereof, should be approved and continued with respect to each Fund until August 31, 2020.
DesignatedSub-Advisory Agreements
Nature, Extent, and Quality of the Services Provided Under the DesignatedSub-Advisory Agreements and Performance
In evaluating the DesignatedSub-Advisory Agreements, the Trustees relied upon materials furnished and presentations made by the Investment Adviser and the DesignatedSub-Advisers. In evaluating the nature, extent, and quality of services provided by each DesignatedSub-Adviser, the Trustees considered information on the services provided to the Funds by their respective DesignatedSub-Advisers, including information about each DesignatedSub-Adviser’s (a) personnel and compensation structure; (b) track record in managing the Fund and, if applicable, other funds and/or accounts with investment strategies similar to those employed on behalf of the Funds; (c) policies and procedures in place to address potential conflicts of interest; and (d) compliance program and code of ethics. In this regard, they also considered assessments provided by the Investment Adviser of each DesignatedSub-Adviser, the DesignatedSub-Adviser’s investment strategies and personnel, and its compliance program. The Trustees also reviewed the operations and investment performance of each DesignatedSub-Adviser’s respective sleeve of the applicable Fund since its inception, including a comparison of each DesignatedSub-Adviser to relevant benchmark indices based on various metrics, including realized beta, excess return, alpha, and volatility.
Costs of Services Provided
The Trustees reviewed the terms of each DesignatedSub-Advisory Agreement, including the schedule of fees payable to the DesignatedSub-Advisers. They considered any breakpoints in thesub-advisory fee rate payable under each DesignatedSub-Advisory Agreement. The Trustees noted that the compensation paid to each DesignatedSub-Adviser is paid by the Investment Adviser, not by the Funds. The Trustees considered that certain DesignatedSub-Advisers had agreed to reduce theirsub-advisory fee rate, which benefited shareholders of the applicable Funds in light of the existing management fee waiver arrangement. The Trustees reviewed the blended average of allsub-advisory fees paid by the Investment Adviser with respect to each Fund in light of the overall management fee paid by each Fund. They also considered the Investment Adviser’s undertaking to waive a portion of its management fee which is in excess of the weighted average of each Fund’ssub-advisory fees.
Conclusion
In connection with their consideration of the DesignatedSub-Advisory Agreements, the Trustees gave weight to various factors, but did not identify any particular factor as controlling their decision.After deliberation and consideration of the information provided, including the factors described above, the Trustees, including the Independent Trustees, unanimously concluded, in the exercise of their business judgment, that thesub-advisory fees paid by the Investment Adviser to each DesignatedSub-Adviser were reasonable in light of the factors considered, and that each DesignatedSub-Advisory Agreement should be approved and continued until August 31, 2020.
55
ACTIVE EQUITY MULTI-MANAGER FUNDS
Trustees and Officers (Unaudited)
Independent Trustees
| | | | | | | | | | |
Name,
Address and Age1 | | Position(s) Held
with the Trust | | Term of
Office and
Length of
Time Served2 | | Principal Occupation(s)
During Past 5 Years | | Number of
Portfolios in
Fund Complex
Overseen by
Trustee3 | | Other
Directorships
Held by Trustee4 |
| | | | | |
Cheryl K. Beebe Age: 63 | | Chair of the Board of Trustees | | Since 2017 (Trustee since 2015) | | Ms. Beebe is retired. She is Director, Packaging Corporation of America (2008-Present); Director, The Mosaic Company (2019-Present); and was formerly Director, Convergys Corporation (a global leader in customer experience outsourcing) (2015-2018); and Executive Vice President, (2010-2014); and Chief Financial Officer, Ingredion, Inc. (a leading global ingredient solutions company) (2004-2014). Chair of the Board of Trustees — Goldman Sachs Trust II. | | 19 | | Packaging Corporation of America (producer of container board); The Mosaic Company (producer of phosphate and potash fertilizer) |
| | | | | |
Lawrence Hughes Age: 61 | | Trustee | | Since 2016 | | Mr. Hughes is retired. Formerly, he held senior management positions with BNY Mellon Wealth Management, a division of The Bank of New York Mellon Corporation (a financial services company) (1991-2015), most recently as Chief Executive Officer (2010-2015). He serves as Chairman of the Board of Directors, Ellis Memorial and Eldredge House (a not-for-profit organization) (2012-Present). Previously, Mr. Hughes served as an Advisory Board Member of Goldman Sachs Trust II (February 2016-April 2016). Trustee — Goldman Sachs Trust II. | | 19 | | None |
| | | | | |
John F. Killian Age: 64 | | Trustee | | Since 2015 | | Mr. Killian is retired. He is Director, Consolidated Edison, Inc. (2007-Present); Director, Houghton Mifflin Harcourt Publishing Company (2011-Present); and formerly held senior management positions with Verizon Communications, Inc., including Executive Vice President and Chief Financial Officer (2009-2010); and President, Verizon Business, Verizon Communications, Inc. (2005-2009). Trustee — Goldman Sachs Trust II. | | 19 | | Consolidated Edison, Inc. (a utility holding company); Houghton Mifflin Harcourt Publishing Company |
| | | | | |
Steven D. Krichmar Age: 61 | | Trustee | | Since 2018 | | Mr. Krichmar is retired. Formerly, he held senior management and governance positions with Putnam Investments, LLC, a financial services company (2001-2016). He was most recently Chief of Operations and a member of the Operating Committee of Putnam Investments, LLC and Principal Financial Officer of The Putnam Funds. Previously, Mr. Krichmar served as an Audit Partner with PricewaterhouseCoopers LLP and its predecessor company (1990-2001). Trustee — Goldman Sachs Trust II. | | 19 | | None |
| | | | | | | | | | |
56
ACTIVE EQUITY MULTI-MANAGER FUNDS
Trustees and Officers (Unaudited) (continued)
Interested Trustee*
| | | | | | | | | | |
Name,
Address and Age1 | | Position(s) Held
with the Trust | | Term of
Office and
Length of
Time Served2 | | Principal Occupation(s)
During Past 5 Years | | Number of
Portfolios in
Fund Complex
Overseen by
Trustee3 | | Other
Directorships
Held by Trustee4 |
| | | | | |
| James A. McNamara Age: 57 | | President and Trustee | | Since 2012 | | Advisory Director, Goldman Sachs (January 2018-Present); Managing Director, Goldman Sachs (January 2000-December 2017); Director of Institutional Fund Sales, GSAM (April 1998-December 2000); and Senior Vice President and Manager, Dreyfus Institutional Service Corporation (January 1993-April 1998). President and Trustee — Goldman Sachs Trust II; Goldman Sachs Trust; Goldman Sachs Variable Insurance Trust; Goldman Sachs MLP Income Opportunities Fund; Goldman Sachs MLP and Energy Renaissance Fund; and Goldman Sachs ETF Trust. | | 162 | | None |
| | | | | | | | | | |
| * | | Mr. McNamara is considered to be an “Interested Trustee” because he holds positions with Goldman Sachs and owns securities issued by The Goldman Sachs Group, Inc. He holds comparable positions with certain other companies of which Goldman Sachs, GSAM or an affiliate thereof is the investment adviser, administrator and/or distributor. |
| 1 | | Each Trustee may be contacted by writing to the Trustee, c/o Goldman Sachs, 200 West Street, New York, New York, 10282, Attn: Caroline Kraus. Information is provided as of October 31, 2019. |
| 2 | | Subject to such policies as may be adopted by the Board from time-to-time, each Trustee holds office for an indefinite term, until the earliest of: (a) the election of his or her successor; (b) the date the Trustee resigns or is removed by the Board or shareholders, in accordance with the Trust’s Declaration of Trust; or (c) the termination of the Trust. The Board has adopted policies which provide that (a) no Trustee shall hold office for more than 15 years and (b) a Trustee shall retire as of December 31st of the calendar year in which he or she reaches his or her 74th birthday, unless a waiver of such requirement shall have been adopted by a majority of the other Trustees. These policies may be changed by the Trustees without shareholder vote. |
| 3 | | The Goldman Sachs Fund Complex includes certain other companies listed above for each respective Trustee. As of October 31, 2019, Goldman Sachs Trust II consisted of 19 portfolios (17 of which offered shares to the public); Goldman Sachs Trust consisted of 89 portfolios (88 of which offered shares to the public); Goldman Sachs Variable Insurance Trust consisted of 13 portfolios; Goldman Sachs MLP Income Opportunities Fund and Goldman Sachs MLP and Energy Renaissance Fund each consisted of one portfolio; and Goldman Sachs ETF Trust consisted of 39 portfolios (21 of which offered shares to the public). |
| 4 | | This column includes only directorships of companies required to report to the Securities and Exchange Commission under the Securities Exchange Act of 1934 (i.e., “public companies”) or other investment companies registered under the Act. |
Additional information about the Trustees is available in the Funds’ Statement of Additional Information, which can be obtained from Goldman Sachs free of charge by calling this toll-free number (in the United States of America): 1-800-526-7384.
57
ACTIVE EQUITY MULTI-MANAGER FUNDS
Trustees and Officers (Unaudited) (continued)
Officers of the Trust*
| | | | | | |
| Name, Address and Age1 | | Position(s) Held
with the Trust | | Term of
Office and
Length of
Time Served2 | | Principal Occupation(s) During Past 5 Years |
| | | |
James A. McNamara 200 West Street New York, NY 10282 Age: 57 | | Trustee and President | | Since 2012 | | Advisory Director, Goldman Sachs (January 2018-Present); Managing Director, Goldman Sachs (January 2000-December 2017); Director of Institutional Fund Sales, GSAM (April 1998-December 2000); and Senior Vice President and Manager, Dreyfus Institutional Service Corporation (January 1993-April 1998). President and Trustee — Goldman Sachs Trust II; Goldman Sachs Trust; Goldman Sachs Variable Insurance Trust; Goldman Sachs MLP Income Opportunities Fund; Goldman Sachs MLP and Energy Renaissance Fund; and Goldman Sachs ETF Trust. |
| | | |
Caroline L. Kraus 200 West Street New York, NY 10282 Age: 42 | | Secretary | | Since 2012 | | Managing Director, Goldman Sachs (January 2016-Present); Vice President, Goldman Sachs (August 2006-December 2015); Associate General Counsel, Goldman Sachs (2012-Present); Assistant General Counsel, Goldman Sachs (August 2006-December 2011); and Associate, Weil, Gotshal & Manges, LLP (2002-2006). Secretary — Goldman Sachs Trust II; Goldman Sachs Trust (previously Assistant Secretary (2012)); Goldman Sachs Variable Insurance Trust (previously Assistant Secretary (2012)); Goldman Sachs BDC, Inc.; Goldman Sachs Private Middle Market Credit LLC; Goldman Sachs Middle Market Lending Corp.; Goldman Sachs MLP Income Opportunities Fund; Goldman Sachs MLP and Energy Renaissance Fund; and Goldman Sachs ETF Trust. |
| | | |
Joseph F. DiMaria 30 Hudson Street Jersey City, NJ 07302 Age: 51 | | Treasurer, Principal Financial Officer and Principal Accounting Officer | | Since 2017 (Treasurer and Principal Financial Officer Since 2019) | | Managing Director, Goldman Sachs (November 2015-Present) and Vice President — Mutual Fund Administration, Columbia Management Investment Advisers, LLC (May 2010-October 2015). Treasurer, Principal Financial Officer and Principal Accounting Officer — Goldman Sachs Trust II (previously Assistant Treasurer (2017)); Goldman Sachs Trust (previously Assistant Treasurer (2016)); Goldman Sachs Variable Insurance Trust (previously Assistant Treasurer (2016)); Goldman Sachs MLP Income Opportunities Fund (previously Assistant Treasurer (2017)); Goldman Sachs MLP and Energy Renaissance Fund (previously Assistant Treasurer (2017)); and Goldman Sachs ETF Trust (previously Assistant Treasurer (2017)). |
| | | | | | |
| * | | Represents a partial list of officers of the Trust. Additional information about all the officers is available in the Funds’ Statement of Additional Information, which can be obtained from Goldman Sachs free of charge by calling this toll-free number (in the United States): 1-800-526-7384. |
| 1 | | Information is provided as of October 31, 2019. |
| 2 | | Officers hold office at the pleasure of the Board of Trustees or until their successors are duly elected and qualified. Each officer holds comparable positions with certain other companies of which Goldman Sachs, GSAM or an affiliate thereof is the investment adviser, administrator and/or distributor. |
Goldman Sachs Trust — Active Equity Multi-Manager Funds — Tax Information (Unaudited)
For the year ended October 31, 2019, 0.16 %, 45.42% and 60.26% of the dividends paid from net investment company taxable income by the Multi-Manager International Equity, Multi-Manager U.S. Dynamic Equity, and Multi-Manager U.S. Small Cap Equity Funds qualify for the dividends received deduction available to corporations.
For the year ended October 31, 2019, 100%, 50.47% and 64.02% of the dividends paid from net investment company taxable income by the Multi-Manager International Equity, Multi-Manager U.S. Dynamic Equity, and Multi-Manager U.S. Small Cap Equity Funds qualify for the reduced tax rate under the Jobs and Growth Tax Relief and Reconciliation Act of 2003.
Pursuant to Section 852 of the Internal Revenue Code, the Multi-Manager International Equity, Multi-Manager U.S. Dynamic Equity, and Multi-Manager U.S. Small Cap Equity Funds designate $12,969,747, $5,732,475 and $5,226,215 or if different, the maximum amount allowable, as capital gain dividends paid during the fiscal year ended October 31, 2019.
From distributions paid during the year ended October 31, 2019, the total amount of income received by Multi-Manager International Equity Fund from sources within foreign countries and possessions of the United States was $0.1713 per share, all of which is attributable to qualified passive income. The percentage of net investment income dividends paid from foreign sources by the Multi-Manager International Equity Fund was 97.05%. The total amount of taxes paid by the Multi-Manager International Equity Fund was $0.0187 per share.
During the fiscal year ended October 31, 2019, the Multi-Manager International Equity, Multi-Manager U.S. Dynamic Equity and Multi-Manager U.S. Small Cap Equity Funds designate $1,608,873, $3,013,729 and $2,727,463 as short-term capital gain dividends pursuant to Section 871(k) of the Internal Revenue Code.
58
FUNDS PROFILE
Goldman Sachs Funds
Goldman Sachs is a premier financial services firm, known since 1869 for creating thoughtful and customized investment solutions in complex global markets.
Today, theConsumer and Investment Management Division of Goldman Sachs serves a diverse set of clients worldwide, including private institutions, public entities and individuals. With approximately $1.60 trillion in assets under supervision as of September 30, 2019, Goldman Sachs Asset Management (“GSAM”) has portfolio management teams located around the world and our investment professionals bring firsthand knowledge of local markets to every investment decision. Assets under supervision includes assets under management and other client assets for which Goldman Sachs does not have full discretion. GSAM leverages the resources of Goldman Sachs & Co. LLC subject to legal, internal and regulatory restrictions.
Money Market
Financial Square FundsSM
| ∎ | | Financial Square Treasury Solutions Fund1 |
| ∎ | | Financial Square Government Fund1 |
| ∎ | | Financial Square Money Market Fund2 |
| ∎ | | Financial Square Prime Obligations Fund2 |
| ∎ | | Financial Square Treasury Instruments Fund1 |
| ∎ | | Financial Square Treasury Obligations Fund1 |
| ∎ | | Financial Square Federal Instruments Fund1 |
Investor FundsSM
| ∎ | | Investor Money Market Fund3 |
| ∎ | | Investor Tax-Exempt Money Market Fund3 |
Fixed Income
Short Duration and Government
| ∎ | | High Quality Floating Rate Fund |
| ∎ | | Short-Term Conservative Income Fund |
| ∎ | | Short Duration Government Fund |
| ∎ | | Short Duration Income Fund |
| ∎ | | Inflation Protected Securities Fund |
Multi-Sector
Municipal and Tax-Free
| ∎ | | High Yield Municipal Fund |
| ∎ | | Dynamic Municipal Income Fund |
| ∎ | | Municipal Income Completion Fund |
| ∎ | | Short Duration Tax-Free Fund |
Single Sector
| ∎ | | Investment Grade Credit Fund |
| ∎ | | High Yield Floating Rate Fund |
| ∎ | | Emerging Markets Debt Fund |
| ∎ | | Local Emerging Markets Debt Fund |
Fixed Income Alternatives
| ∎ | | Long Short Credit Strategies Fund |
Fundamental Equity
| ∎ | | Small/Mid Cap Value Fund |
| ∎ | | Small/Mid Cap Growth Fund |
| ∎ | | Concentrated Growth Fund |
| ∎ | | Technology Opportunities Fund |
| ∎ | | Growth Opportunities Fund |
| ∎ | | Rising Dividend Growth Fund |
Tax-Advantaged Equity
| ∎ | | U.S. Tax-Managed Equity Fund |
| ∎ | | International Tax-Managed Equity Fund |
| ∎ | | U.S. Equity Dividend and Premium Fund |
| ∎ | | International Equity Dividend and Premium Fund |
Equity Insights
| ∎ | | Small Cap Equity Insights Fund |
| ∎ | | U.S. Equity Insights Fund |
| ∎ | | Small Cap Growth Insights Fund |
| ∎ | | Large Cap Growth Insights Fund |
| ∎ | | Large Cap Value Insights Fund |
| ∎ | | Small Cap Value Insights Fund |
| ∎ | | International Small Cap Insights Fund |
| ∎ | | International Equity Insights Fund |
| ∎ | | Emerging Markets Equity Insights Fund |
Fundamental Equity International
| ∎ | | International Equity Income Fund |
| ∎ | | International Equity ESG Fund |
| ∎ | | Emerging Markets Equity Fund |
| ∎ | | Imprint Emerging Markets Opportunities Fund5 |
| ∎ | | ESG Emerging Markets Equity Fund |
Alternative
| ∎ | | Real Estate Securities Fund |
| ∎ | | International Real Estate Securities Fund |
| ∎ | | Commodity Strategy Fund |
| ∎ | | Global Real Estate Securities Fund |
| ∎ | | Alternative Premia Fund |
| ∎ | | Absolute Return Tracker Fund |
| ∎ | | Managed Futures Strategy Fund |
| ∎ | | MLP Energy Infrastructure Fund |
| ∎ | | Multi-Manager Alternatives Fund |
| ∎ | | Global Infrastructure Fund |
Total Portfolio Solutions
| ∎ | | Global Managed Beta Fund |
| ∎ | | Multi-Manager Non-Core Fixed Income Fund |
| ∎ | | Multi-Manager U.S. Dynamic Equity Fund |
| ∎ | | Multi-Manager Global Equity Fund |
| ∎ | | Multi-Manager International Equity Fund |
| ∎ | | Tactical Tilt Overlay Fund |
| ∎ | | Balanced Strategy Portfolio |
| ∎ | | Multi-Manager U.S. Small Cap Equity Fund |
| ∎ | | Multi-Manager Real Assets Strategy Fund |
| ∎ | | Growth and Income Strategy Portfolio |
| ∎ | | Growth Strategy Portfolio |
| ∎ | | Dynamic Global Equity Fund6 |
| ∎ | | Satellite Strategies Portfolio |
| ∎ | | Enhanced Dividend Global Equity Portfolio |
| ∎ | | Tax-Advantaged Global Equity Portfolio |
| ∎ | | Strategic Factor Allocation Fund |
| ∎ | | Target Date 2020 Portfolio |
| ∎ | | Target Date 2025 Portfolio |
| ∎ | | Target Date 2030 Portfolio |
| ∎ | | Target Date 2035 Portfolio |
| ∎ | | Target Date 2040 Portfolio |
| ∎ | | Target Date 2045 Portfolio |
| ∎ | | Target Date 2050 Portfolio |
| ∎ | | Target Date 2055 Portfolio |
| ∎ | | Target Date 2060 Portfolio |
| ∎ | | GQG Partners International Opportunities Fund |
| 1 | | You could lose money by investing in the Fund. Although the Fund seeks to preserve the value of your investment at $1.00 per share, it cannot guarantee it will do so. An investment in the Fund is not a deposit of a bank and is not insured or guaranteed by the Federal Deposit Insurance Corporation or any other government agency. The Fund’s sponsor has no legal obligation to provide financial support to the Fund, and you should not expect that the sponsor will provide financial support to the Fund at any time. |
| 2 | | You could lose money by investing in the Fund. Because the share price of the Fund will fluctuate, when you sell your shares they may be worth more or less than what you originally paid for them. The Fund may impose a fee upon sale of your shares or may temporarily suspend your ability to sell shares if the Fund’s liquidity falls below required minimums because of market conditions or other factors. An investment in the Fund is not a deposit of a bank and is not insured or guaranteed by the Federal Deposit Insurance Corporation or any other government agency. The Fund’s sponsor has no legal obligation to provide financial support to the Fund, and you should not expect that the sponsor will provide financial support to the Fund at any time. |
| 3 | | You could lose money by investing in the Fund. Although the Fund seeks to preserve the value of your investment at $1.00 per share, it cannot guarantee it will do so. The Fund may impose a fee upon sale of your shares or may temporarily suspend your ability to sell shares if the Fund’s liquidity falls below required minimums because of market conditions or other factors. An investment in the Fund is not a deposit of a bank and is not insured or guaranteed by the Federal Deposit Insurance Corporation or any other government agency. The Fund’s sponsor has no legal obligation to provide financial support to the Fund, and you should not expect that the sponsor will provide financial support to the Fund at any time. |
| 4 | | Effective after the close of business on November 20, 2019, the Goldman Sachs Asia Equity Fund was renamed the Goldman Sachs China Equity Fund. |
| 5 | | Effective after the close of business on August 30, 2019, the Goldman Sachs N-11 Equity Fund was renamed the Goldman Sachs Imprint Emerging Markets Opportunities Fund. |
| 6 | | Effective after the close of business on February 28, 2019, the Goldman Sachs Equity Growth Strategy Portfolio was renamed the Goldman Sachs Dynamic Global Equity Fund. |
| * | | This list covers open-end funds only. Please visit our website at www.GSAMFUNDS.com to learn about our closed-end funds and exchange-traded funds. |
| | |
TRUSTEES Cheryl K. Beebe,Chair Lawrence Hughes John F. Killian Steven D. Krichmar James A. McNamara | | OFFICERS James A. McNamara,President Joseph F. DiMaria,Principal Financial Officer, Principal Accounting Officer and Treasurer Caroline L. Kraus,Secretary |
| |
GOLDMAN SACHS & CO. LLC Distributor and Transfer Agent | | GOLDMAN SACHS ASSET MANAGEMENT, L.P. Investment Adviser |
Visit our website atwww.GSAMFUNDS.com to obtain the most recent month-end returns.
Goldman Sachs Asset Management, L.P. 200 West Street, New York, New York 10282
The reports concerning the Funds included in this shareholder report may contain certain forward-looking statements about the factors that may affect the performance of the Funds in the future. These statements are based on the Funds’ managements’ predictions and expectations concerning certain future events and their expected impact on the Funds, such as performance of the economy as a whole and of specific industry sectors, changes in the levels of interest rates, the impact of developing world events, and other factors that may influence the future performance of the Funds. Management believes these forward-looking statements to be reasonable, although they are inherently uncertain and difficult to predict. Actual events may cause adjustments in portfolio management strategies from those currently expected to be employed.
A description of the policies and procedures that the Funds use to determine how to vote proxies relating to portfolio securities and information regarding how the Funds voted proxies relating to portfolio securities for the most recent 12-month period ended June 30, are available (I) without charge, upon request by calling 1-800-621-2550; and (II) on the Securities and Exchange Commission (“SEC’’) web site at http://www.sec.gov.
The Funds will file portfolio holdings information for each month in a fiscal quarter within 60 days after the end of the relevant fiscal quarter on Form N-PORT. Portfolio holdings information for the third month of each fiscal quarter will be made available on the SEC’s web site at http://www.sec.gov. Portfolio holdings information may be obtained upon request and without charge by calling1-800-621-2550.
Fund holdings and allocations shown are unaudited, and may not be representative of current or future investments. Fund holdings and allocations may not include a Fund’s entire investment portfolio, which may change at any time. Fund holdings should not be relied on in making investment decisions and should not be construed as research or investment advice regarding particular securities. Current and future holdings are subject to risk.
The Global Industry Classification Standard (GICS) was developed by and is the exclusive property and a service mark of Morgan Stanley Capital International Inc. (MSCI) and Standard & Poor’s, a division of The McGraw-Hill Companies, Inc. (S&P) and is licensed for use by Goldman Sachs. Neither MSCI, S&P nor any other party involved in making or compiling the GICS or any GICS classifications makes any express or implied warranties or representations with respect to such standard or classification (or the results to be obtained by the use thereof), and all such parties hereby expressly disclaim all warranties of originality, accuracy, completeness, merchantability or fitness for a particular purpose with respect to any of such standard or classification. Without limiting any of the foregoing, in no event shall MSCI, S&P, any of their affiliates or any third party involved in making or compiling the GICS or any GICS classifications have any liability for any direct, indirect, special, punitive, consequential or any other damages (including lost profits) even if notified of the possibility of such damages.
The portfolio risk management process includes an effort to monitor and manage risk, but does not imply low risk.
Fund holdings and allocations shown are as of October 31, 2019 and may not be representative of future investments. Fund holdings should not be relied on in making investment decisions and should not be construed as research or investment advice regarding particular securities. Current and future holdings are subject to risk.
This material is not authorized for distribution to prospective investors unless preceded or accompanied by a current Prospectus or summary prospectus, if applicable. Investors should consider a Fund’s objective, risks, and charges and expenses, and read the summary prospectus, if available, and/or the Prospectus carefully before investing or sending money. The summary prospectus, if available, and the Prospectus contain this and other information about a Fund and may be obtained from your authorized dealer or from Goldman Sachs & Co. LLC by calling 1-800-621-2550.
© 2019 Goldman Sachs. All rights reserved. 187112-OTU-1103591 MMGRFDSAR-19
Goldman Sachs Funds

| | | | |
| | |
| Annual Report | | | | October 31, 2019 |
| | |
| | | | GQG Partners International
Opportunities Fund |
It is our intention that beginning on January 1, 2021, paper copies of the Fund’s annual and semi-annual shareholder reports will no longer be sent by mail, unless you specifically request paper copies of the reports from the Fund or from your financial intermediary. Instead, the reports will be made available on a website, and you will be notified by mail each time a report is posted and provided with a website link to access the report.
If you already elected to receive shareholder reports electronically, you will not be affected by this change and you need not take any action. At any time, you may elect to receive reports and certain communications from the Fund electronically by calling the applicable toll-free number below or by contacting your financial intermediary.
You may elect to receive all future shareholder reports in paper free of charge. If you hold shares of the Fund directly with the Fund’s transfer agent, you can inform the transfer agent that you wish to receive paper copies of reports by callingtoll-free 800-621-2550 for Institutional, Class R6 and Class P shareholders or800-526-7384 for all other shareholders. If you hold shares of the Fund through a financial intermediary, please contact your financial intermediary to make this election. Your election to receive reports in paper will apply to all Goldman Sachs Funds held in your account if you invest through your financial intermediary or all Goldman Sachs Funds held with the Fund’s transfer agent if you invest directly with the transfer agent.

Goldman Sachs GQG Partners International Opportunities Fund
| | | | |
| | | |
| NOT FDIC-INSURED | | May Lose Value | | No Bank Guarantee |
PORTFOLIO RESULTS
Goldman Sachs GQG Partners International Opportunities Fund
Investment Objective
The Fund seeks long-term capital appreciation.
Portfolio Management Discussion and Analysis
Below, the portfolio management team of GQG Partners LLC, the Goldman Sachs GQG Partners International Opportunities Fund’s (the “Fund”) sub-adviser, discusses the Fund’s performance and positioning for the 12-month period ended October 31, 2019 (the “Reporting Period”).
| Q | | How did the Fund perform during the Reporting Period? |
| A | | During the Reporting Period, the Fund’s Class A, Class C, Institutional, Investor, Class P, Class R and Class R6 Shares generated average annual total returns, without sales charges, of 20.19%, 19.24%, 20.65%, 20.42%, 20.61%, 19.91% and 20.68%, respectively. These returns compare to the 11.27% average annual total return of the Fund’s benchmark, the MSCI ACWI ex USA Index (Net, Unhedged) (the “Index”), during the same time period. |
| Q | | What economic and market factors most influenced the Fund during the Reporting Period? |
| A | | Global equities recorded double-digit gains during the Reporting Period. U.S. stocks outperformed non-U.S. developed markets stocks. Non-U.S. developed markets stocks also slightly lagged emerging markets equities. |
| | | When the Reporting Period began in November 2018, global equity markets advanced on dovish comments from U.S. Federal Reserve (“Fed”) Chair Jerome Powell, an accommodative stance by Chinese policymakers toward the private corporate sector and seemingly encouraging progress in China-U.S. trade talks. (Dovish language tends to suggest lower interest rates; opposite of hawkish.) However, in December 2018, global equities plunged on renewed investor fears sparked by the arrest of a Chinese technology executive, a partial U.S. federal government shutdown and the U.S. President’s criticism of U.S. Fed Chair Powell. Global equities also fell sharply on trade war escalations between the U.S. and China as well as on political uncertainty — and in a delayed response to an earlier rise in global interest rates. Political uncertainty remained elevated in Europe, particularly surrounding the Italian fiscal budget and ongoing Brexit negotiations. (Brexit indicates the U.K.’s path out of the European Union.) |
| | | Recovering from weakness in the last months of 2018, global equities rallied during the first quarter of 2019. The Fed maintained its dovish stance amidst slower global economic growth and also announced a pause in its interest rate hiking cycle. At the same time, significant progress appeared to be made in U.S.-China trade talks, paving the way for a potential resolution. In the U.S., stocks posted double-digit gains. European equities were resilient, despite the overhang of Brexit and slowing economic data. Japanese equities advanced during the first calendar quarter, as investor fears around the extent of the global economic growth slowdown eased and the Japanese yen gradually weakened. Within emerging markets equities, Chinese stocks benefited from seeming progress in U.S.-China trade negotiations, faster than consensus expected policy easing and positive corporate earnings results. However, investors remained cautious around Indian equities, with general elections scheduled to commence in April 2019. Investors also remained cautious around Turkish markets, which were rattled by the overall economic downturn and by municipal elections at the end of March 2019. |
| | | Global equities continued to post gains during the second quarter of 2019, supported by increasingly accommodative stances by several major central banks, including the Fed. Trade tensions between the U.S. and China dominated headlines and broadly added noise to the markets. (Noise refers to information or activity that confuses or misrepresents genuine underlying trends.) In April 2019, there was investor optimism about a possible trade deal, but the positive sentiment faded in May when the U.S. President threatened to raise then-current tariffs and impose new duties on $300 billion of additional Chinese imports. Nevertheless, global equities generally recovered in June 2019 while awaiting U.S.-China trade talks to reconvene at the G20 Summit. (The G20 (or Group of Twenty) is an international forum for the governments and central bank |
1
PORTFOLIO RESULTS
| | governors from 19 countries and the European Union. It was founded in 1999 with the aim to discuss policy pertaining to the promotion of international financial stability.) Ultimately, the U.S. agreed to hold off on imposing the additional tariffs and to delay restrictions against Chinese technology firm Huawei, allowing U.S. companies to resume sales to the company. |
| | | During the third calendar quarter, the performance of developed markets equities was mixed, with U.S. stocks recording slightly positive returns and non-U.S. developed markets stocks edging down. Trade news continued to dominate market movements as did increasing political uncertainty across most governments. In the U.S., the Fed cut interest rates in July and September — its first interest rate cuts since 2008 — in an effort to prolong the U.S. economic expansion. In Europe, an economic slowdown, driven by weaker foreign demand, global tariff disputes and business uncertainty risk from Brexit, led the European Central Bank (“ECB”) to restart its quantitative easing measures. Emerging markets equities started the third quarter on a soft note, as in July 2019, despite their meeting in Shanghai, the U.S. and Chinese Presidents were unable to make any forward steps toward a trade deal. Emerging markets equities remained under pressure in August 2019, as the U.S. President announced a new round of tariffs on another $300 billion of Chinese goods, and China announced retaliatory tariffs on $75 billion of U.S. goods. Emerging markets equities then surged in September 2019, as optimism rose that both sides might soon be able to reach an agreement. |
| | | In October 2019, global equities generated positive returns. Within developed equity markets broadly, investors welcomed signs of an easing in geopolitical tensions, as U.S. and Chinese authorities appeared to move closer to a partial trade agreement and as the risks of a no-deal Brexit receded with the European Union extending the Brexit deadline to January 31, 2020. In the U.S., the Fed cut interest rates for the third time in 2019, but Fed Chair Powell signaled another rate change was unlikely as long as economic conditions remained steady. European equity markets moved higher on positive third calendar quarter corporate earnings and unchanged ECB policy. Japanese equities saw positive returns during October 2019, as Japan’s economy continued to recover. As for emerging markets equities, they benefited from the seeming progress in U.S.-China trade talks, with investors then expecting some sort of official interim deal between the two parties in the foreseeable future. Indian equities continued their solid performance during the month, largely driven by continued economic momentum and corporate earnings upgrades following the nation’s September corporate tax rate cut. Brazil continued its monetary policy easing cycle, as its central bank cut interest rates for a third straight meeting following the passing of new pension reform that led to heightened hopes of a recovery for the country’s sluggish economy amid low inflation. |
| Q | | What key factors were responsible for the Fund’s performance during the Reporting Period? |
| A | | During the Reporting Period, the Fund generated positive absolute returns and outperformed the Index. The Fund’s outperformance was driven primarily by security selection. Asset allocation also added modestly to relative returns. |
| | | The Fund also benefited as we sought to mitigate the risks associated with increased market volatility. Additionally, beginning in the third quarter of 2018 and through the end of the Reporting Period, the Fund was helped by our decision to focus on companies with greater earnings stability. Near calendar year-end, we found what we considered to be the best risk-reward opportunities in companies with more stable growth, which bolstered the Fund’s performance. We preferred these companies to high growth companies, which we considered prone to downward earnings revisions, and also to relatively inexpensive stocks that offered little growth potential, in our view. Our focus on large-cap stocks was also a tailwind for the Fund, as large-cap stocks outperformed small-cap stocks during the Reporting Period. |
| Q | | Which equity market sectors and countries most significantly affected Fund performance? |
| A | | During the Reporting Period, stock selection in nine of the 11 sectors in the Index added to the Fund’s relative performance. The greatest gains were within the financials sector, led by financial exchanges and emerging markets bank stocks. Security selection in the communication services and health care sectors also contributed positively to relative performance. Conversely, stock selection in the energy and consumer discretionary sectors detracted slightly from relative returns. |
| | | From an asset allocation perspective, an underweight position relative to the Index in the energy sector and overweight positions relative to the Index in the information technology and health care sectors contributed positively to the Fund’s relative results. On the other hand, underweight positions in the consumer discretionary, industrials and materials sectors diminished the Fund’s relative performance. |
2
PORTFOLIO RESULTS
| | | With regard to countries, stock selection in the U.K., Spain and Germany added substantially to the Fund’s returns. On the downside, stock selection in the Netherlands and China detracted from relative results. |
| Q | | What were some of the Fund’s best-performing individual stocks during the Reporting Period? |
| A | | The Fund’s best-performing individual holdings during the Reporting Period were Cellnex Telecom, London Stock Exchange Group and HDFC Bank. |
| | | Cellnex Telecom, Europe’s leading independent wireless tower operator, added most to the Fund’s returns during the Reporting Period. The Spain-based company executed on its core strategy, providing long-term corporate earnings visibility, and benefited from its European telecommunication cost-cutting initiatives. |
| | | The London Stock Exchange Group, a U.K.-headquartered financial exchange, benefited from growth in its diversified business lines, both in transaction volumes for swaps and in investment flows into passive products through FTSE Russell, its wholly owned subsidiary. |
| | | Despite macro headwinds in India, HDFC Bank benefited from broadly lower non-performing loans compared to its state-run peers. It also continued to gain market share through strong underwriting and cost advantages due to scale. |
| Q | | Which stocks detracted most from the Fund’s relative performance during the Reporting Period? |
| A | | Glencore, Capgemini and Hang Seng Bank detracted most from the Fund’s relative returns during the Reporting Period. |
| | | The Fund was hampered by an investment in Glencore, a British-Swiss commodity trading and mining company that is both diversified across product lines and closely tied to China. Because of slowing Chinese economic growth, we considered Glencore’s risks too high. As a result, we sold the Fund’s position during the Reporting Period in favor of what we saw as other attractive opportunities. |
| | | France-based Capgemini, an information technology consulting firm, experienced weakness in its largest core European markets, which was not completely offset by its attempts to diversify into non-core European markets. During the Reporting Period, we eliminated the Fund’s investment in Capgemini and reallocated the capital to what we considered better alternatives. |
| | | We sold the Fund’s position in Hang Seng Bank amid decelerating business economics, the result of the bank’s slower than consensus expected market expansion. In addition, a sharp decline in Hong Kong economic activity reduced the bank’s earnings growth visibility, in our view. |
| Q | | Were there any significant purchases or sales during the Reporting Period? |
| A | | During the Reporting Period, the Fund initiated a position in Novartis, a Swiss multinational pharmaceutical company. We liked what we considered to be Novartis’ robust and diversified product pipeline as well as a fundamental improvement in its core business. Specifically, the company was focusing less on lower-margin generic medications and more on higher-margin oncology drugs. |
| | | Another notable purchase was China Tower, the world’s largest telecommunications infrastructure operator. In our view, the company is benefiting from improved tenancy rates and increased demand for mobile broadband use. We also believe it is at the forefront of the rollout of China’s fifth-generation, or 5G, network. |
| | | As mentioned previously, we exited the Fund’s investments in Glencore, Capgemini and Hang Seng Bank during the Reporting Period. |
| Q | | What changes were made to the Fund’s sector and country weightings during the Reporting Period? |
| A | | In terms of sector weightings, we increased the Fund’s exposures to health care and utilities during the Reporting Period. We decreased its exposures to financials and consumer staples. Regarding countries, we increased the Fund’s exposures to the U.S. and France and reduced its exposures to Japan and the Netherlands during the Reporting Period. |
| Q | | How did the Fund use derivatives and similar instruments during the Reporting Period? |
| A | | Forward foreign exchange contracts were used during the Reporting Period as part of the standard process of buying and selling non-U.S. securities in their local currency. The use of forward foreign exchange contracts did not have a material impact on the Fund’s performance. During the Reporting Period, the Fund used rights to obtain the opportunity, but not the obligation, to buy additional shares of Cellnex Telecom at a discount, which had a positive impact on performance. |
3
PORTFOLIO RESULTS
| Q | | How was the Fund positioned relative to its benchmark index at the end of the Reporting Period? |
| A | | The Fund was overweight relative to the Index in the consumer staples, health care, information technology and utilities sectors at the end of the Reporting Period. It was underweight the consumer discretionary, energy, industrials, materials and real estate sectors. The Fund was rather neutrally positioned compared to the Index in the communication services and financials sectors at the end of the Reporting Period. |
| | | In terms of countries, the Fund had significant exposure to the U.S., which had no weighting in the Index, at the end of the Reporting Period. It was overweight relative to the Index in France, Switzerland, Spain and India. Compared to the Index, the Fund was underweight Japan, Brazil, Canada, China, South Korea and Taiwan. At the end of the Reporting Period, the Fund was rather neutrally weighted in the other countries comprising the Index. |
| Q: | | Were there any changes to the Fund’s portfolio management team during the Reporting Period? |
| A: | | Effective September 1, 2019, Brian Kersmanc of GQG Partners LLC was added as a deputy portfolio manager for the Fund. Rajiv Jain continued to serve as the lead portfolio manager for the Fund. |
| Q | | What is the Fund’s tactical view and strategy for the months ahead? |
| A | | At the end of the Reporting Period, we believed the probability of a no-deal Brexit had declined, and while the U.S.-China trade dispute was still unresolved, we saw a desire for de-escalation. In our view, the reduced uncertainty could prove positive for equity markets overall in the near term. We also believed our focus on durable earnings growth is likely to be rewarded going forward. That said, in anticipation of a global economic recovery, investors could drive up share prices on lower quality, cyclical companies, in our opinion. If so, our quality approach may well lag the Index. |
| | | Overall, our strategy remains the same — to look for what we consider to be high quality companies with solid prospects over the next three years and beyond. We are generally sector-neutral in our investment approach, which means we look for “best of breed” companies across sectors, whether or not those sectors are traditionally defined as cyclical or not. The Fund’s positioning will always be affected by share price movements, which may reflect macro events, including political developments, as well as company-specific events, including operational developments and mergers and acquisitions. |
4
FUND BASICS
GQG Partners International Opportunities Fund
as of October 31, 2019
| | | | | | | | |
| | TOP TEN HOLDINGS AS OF 10/31/191 |
| | | |
| | | Holding | | % of Net Assets | | | Line of Business |
| | | |
| | HDFC Bank Ltd. ADR | | | 4.3 | % | | Banks |
| | AstraZeneca PLC | | | 4.2 | | | Pharmaceuticals |
| | Deutsche Boerse AG | | | 4.1 | | | Capital Markets |
| | Air Liquide SA | | | 4.0 | | | Chemicals |
| | SAP SE ADR | | | 4.0 | | | Software |
| | Philip Morris International, Inc. | | | 4.0 | | | Tobacco |
| | Nestle SA | | | 3.8 | | | Food Products |
| | Novartis AG | | | 3.4 | | | Pharmaceuticals |
| | London Stock Exchange Group PLC | | | 3.3 | | | Capital Markets |
| | | Mastercard, Inc. Class A | | | 3.2 | | | IT Services |
| 1 | | The top 10 holdings may not be representative of the Fund’s future investments. |
|
| FUND VS. BENCHMARK SECTOR ALLOCATIONS2 |
|
| As of October 31, 2019 |
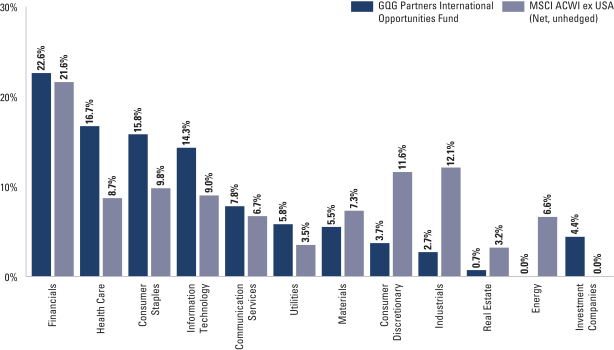
| 2 | | The Fund is actively managed and, as such, its composition may differ over time. Consequently, the Fund’s overall sector allocations may differ from the percentages contained in the graph above. Figures in the graph may not sum to 100% due to rounding and/or the exclusion of other assets and liabilities. The graph generally categorizes investments using the Global Industry Classification Standard (“GICS”); however, the sector classifications used by the portfolio management team may differ from GICS. The percentage shown for each investment category reflects the value of investments in that category as a percentage of market value. The graph depicts the Fund’s investments but may not represent the Fund’s market exposure due to the exclusion of certain derivatives, if any, as listed in the Additional Investment Information section of the Schedule of Investments. |
For more information about your Fund, please refer to www.GSAMFUNDS.com. There, you can learn more about your Fund’s investment strategies, holdings, and performance.
5
GOLDMAN SACHS GQG PARTNERS INTERNATIONAL OPPORTUNITIES FUND
Performance Summary
October 31, 2019
The following graph shows the value, as of October 31, 2019, of a $1,000,000 investment made on December 15, 2016 (commencement of operations) in Institutional Shares at NAV. For comparative purposes, the performance of the Fund’s benchmark, the MSCI All Country World Index ex USA Index (Net, Unhedged) is shown. Performance reflects applicable fee waivers and/or expense limitations in effect during the periods shown and in their absence, performance would be reduced. Returns do not reflect the deduction of taxes that a shareholder would pay on Fund distributions or the redemption of Fund shares. The returns set forth below represent past performance. Past performance does not guarantee future results. The Fund’s investment return and principal value will fluctuate so that an investor’s shares, when redeemed, may be worth more or less than their original cost. Current performance may be lower or higher than the performance quoted below. Please visit our web site at www.GSAMFUNDS.com to obtain the most recent month-end returns.
|
| Goldman Sachs GQG Partners International Opportunities Fund’s Lifetime Performance |
Performance of a $1,000,000 investment, with distributions reinvested, from December 15, 2016 through October 31, 2019.
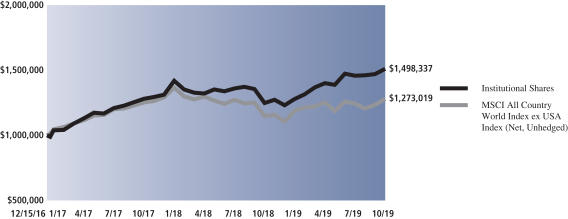
| | | | | | | | |
| Average Annual Total Return through October 31, 2019* | | | One Year | | | | Since Inception | |
Class A (Commenced December 15, 2016) | | | | | | | | |
Excluding sales charges | | | 20.19% | | | | 14.63% | |
Including sales charges | | | 13.55% | | | | 12.40% | |
| |
Class C (Commenced December 15, 2016) | | | | | | | | |
Excluding contingent deferred sales charges | | | 19.24% | | | | 13.78% | |
Including contingent deferred sales charges | | | 18.24% | | | | 13.78% | |
| |
Institutional Class (Commenced December 15, 2016) | | | 20.65% | | | | 15.08% | |
| |
Investor Class (Commenced December 15, 2016) | | | 20.42% | | | | 14.88% | |
| |
Class P (Commenced April 16, 2018) | | | 20.61% | | | | 8.52% | |
| |
Class R (Commenced December 15, 2016) | | | 19.91% | | | | 14.34% | |
| |
Class R6 (Commenced December 15, 2016) | | | 20.68% | | | | 15.08% | |
| |
| * | | These returns assume reinvestment of all distributions at NAV and reflect a maximum initial sales charge of 5.50% for Class A Shares and the assumed contingent deferred sales charge for Class C Shares (1% if redeemed within 12 months of purchase). Because Institutional, Investor, Class P, Class R and Class R6 Shares do not involve a sales charge, such a charge is not applied to their Average Annual Total Return. |
6
FUND BASICS
Index Definitions
The MSCI ACWI ex USA Index is an international equity index that tracks stocks from 22 developed and 24 emerging markets countries. Developed countries include Australia, Austria, Belgium, Canada, Denmark, Finland, France, Germany, Hong Kong, Ireland, Israel, Italy, Japan, the Netherlands, New Zealand, Norway, Portugal, Singapore, Spain, Sweden, Switzerland, and the U.K. Emerging markets countries include: Brazil, Chile, China, Colombia, Czech Republic, Egypt, Greece, Hungary, India, Indonesia, Korea, Malaysia, Mexico, Pakistan, Peru, the Philippines, Poland, Russia, Qatar, South Africa, Taiwan, Thailand, Turkey and United Arab Emirates. It is not possible to invest directly in an unmanaged index.
7
GOLDMAN SACHS GQG PARTNERS INTERNATIONAL OPPORTUNITIES FUND
Schedule of Investments
October 31, 2019
| | | | | | | | |
| Shares | | | Description | | Value | |
|
| Common Stocks – 95.6% | |
| Australia – 4.4% | |
| | 2,025,143 | | | Aristocrat Leisure Ltd. (Hotels, Restaurants & Leisure) | | $ | 44,158,298 | |
| | 489,481 | | | CSL Ltd. (Biotechnology) | | | 86,323,034 | |
| | 375,407 | | | Macquarie Group Ltd. (Capital Markets) | | | 34,664,110 | |
| | | | | | | | |
| | | | | | | 165,145,442 | |
| | |
| Belgium – 1.2% | |
| | 631,446 | | | KBC Group NV (Banks) | | | 44,399,668 | |
| | |
| Canada – 3.3% | |
| | 4,678,770 | | | Algonquin Power & Utilities Corp. (Multi-Utilities) | | | 64,261,597 | |
| | 1,445,988 | | | Fortis, Inc. (Electric Utilities) | | | 60,074,758 | |
| | | | | | | | |
| | | | | | | 124,336,355 | |
| | |
| China(a) – 0.6% | |
| | 109,055,520 | | | China Tower Corp. Ltd. Class H (Diversified Telecommunication Services) | | | 24,002,318 | |
| | |
| Denmark – 3.5% | |
| | 301,656 | | | Coloplast A/S Class B (Health Care Equipment & Supplies) | | | 36,318,154 | |
| | 171,957 | | | Genmab A/S* (Biotechnology) | | | 37,571,672 | |
| | 1,009,220 | | | Novo Nordisk A/S Class B (Pharmaceuticals) | | | 55,495,690 | |
| | | | | | | | |
| | | | | | | 129,385,516 | |
| | |
| France – 13.5% | |
| | 1,128,498 | | | Air Liquide SA (Chemicals) | | | 150,046,267 | |
| | 3,434,305 | | | Credit Agricole SA (Banks) | | | 44,811,996 | |
| | 73,745 | | | Hermes International (Textiles, Apparel & Luxury Goods) | | | 53,122,387 | |
| | 352,017 | | | L’Oreal SA (Personal Products) | | | 102,810,671 | |
| | 273,981 | | | Pernod Ricard SA (Beverages) | | | 50,613,355 | |
| | 647,720 | | | Safran SA (Aerospace & Defense) | | | 102,592,296 | |
| | | | | | | | |
| | | | | | | 503,996,972 | |
| | |
| Germany – 8.1% | |
| | 991,351 | | | Deutsche Boerse AG (Capital Markets) | | | 153,520,240 | |
| | 1,113,580 | | | SAP SE ADR(b) (Software) | | | 147,638,436 | |
| | | | | | | | |
| | | | | | | 301,158,676 | |
| | |
| Hong Kong – 1.9% | |
| | 7,044,878 | | | AIA Group Ltd. (Insurance) | | | 70,154,429 | |
| | |
| India – 6.4% | |
| | 2,645,262 | | | HDFC Bank Ltd. ADR (Banks) | | | 161,599,055 | |
| | 7,892,091 | | | Infosys Ltd. ADR (IT Services) | | | 75,685,153 | |
| | | | | | | | |
| | | | | | | 237,284,208 | |
| | |
| Indonesia – 0.9% | |
| | 15,179,466 | | | Bank Central Asia Tbk PT (Banks) | | | 33,976,612 | |
| | |
| Ireland – 1.4% | |
| | 273,465 | | | Accenture PLC Class A (IT Services) | | | 50,705,880 | |
| | |
|
| Common Stocks – (continued) | |
| Italy – 1.0% | |
| | 5,029,173 | | | Enel SpA (Electric Utilities) | | | 38,977,891 | |
| | |
| Japan – 2.1% | |
| | 1,436,116 | | | Tokio Marine Holdings, Inc. (Insurance) | | | 77,644,453 | |
| | |
| Netherlands – 3.7% | |
| | 153,121 | | | ASML Holding NV (Semiconductors & Semiconductor Equipment) | | | 40,135,203 | |
| | 383,885 | | | Euronext NV(a) (Capital Markets) | | | 30,968,810 | |
| | 294,693 | | | Heineken NV (Beverages) | | | 30,093,888 | |
| | 611,332 | | | Unilever NV (Personal Products) | | | 36,133,800 | |
| | | | | | | | |
| | | | | | | 137,331,701 | |
| | |
| Singapore – 0.7% | |
| | 10,941,740 | | | Ascendas Real Estate Investment Trust (Equity Real Estate Investment Trusts (REITs)) | | | 25,483,867 | |
| | |
| Spain – 5.5% | |
| | 794,223 | | | Cellnex Telecom SA* (Diversified Telecommunication Services) | | | 34,269,822 | |
| | 2,735,674 | | | Cellnex Telecom SA*(a)(Diversified Telecommunication Services) | | | 118,041,136 | |
| | 5,250,266 | | | Iberdrola SA (Electric Utilities) | | | 53,967,449 | |
| | | | | | | | |
| | | | | | | 206,278,407 | |
| | |
| Sweden – 1.1% | |
| | 4,216,479 | | | Svenska Handelsbanken AB Class A (Banks) | | | 42,315,757 | |
| | |
| Switzerland – 9.6% | |
| | 103,150 | | | Lonza Group AG* (Life Sciences Tools & Services) | | | 37,178,604 | |
| | 1,308,108 | | | Nestle SA (Food Products) | | | 139,943,109 | |
| | 1,437,644 | | | Novartis AG (Pharmaceuticals) | | | 125,614,428 | |
| | 327,560 | | | Sika AG (Chemicals) | | | 56,309,695 | |
| | | | | | | | |
| | | | | | | 359,045,836 | |
| | |
| United Kingdom – 10.9% | |
| | 1,587,902 | | | AstraZeneca PLC (Pharmaceuticals) | | | 154,847,783 | |
| | 2,207,088 | | | Diageo PLC (Beverages) | | | 90,338,266 | |
| | 1,381,370 | | | London Stock Exchange Group PLC (Capital Markets) | | | 124,487,445 | |
| | 2,006,790 | | | Prudential PLC (Insurance) | | | 35,052,273 | |
| | | | | | | | |
| | | | | | | 404,725,767 | |
| | |
| United States – 15.8% | |
| | 1,140,997 | | | Abbott Laboratories (Health Care Equipment & Supplies) | | | 95,398,759 | |
| | 46,675 | | | Alphabet, Inc. Class A* (Interactive Media & Services) | | | 58,754,490 | |
| | 46,673 | | | Alphabet, Inc. Class C* (Interactive Media & Services) | | | 58,813,114 | |
| | 426,547 | | | Mastercard, Inc. Class A (IT Services) | | | 118,072,475 | |
| | |
| | |
| 8 | | The accompanying notes are an integral part of these financial statements. |
GOLDMAN SACHS GQG PARTNERS INTERNATIONAL OPPORTUNITIES FUND
| | | | | | | | |
| Shares | | | Description | |
Value | |
|
| Common Stocks – (continued) | |
| United States – (continued) | |
| | 1,812,656 | | | Philip Morris International, Inc. (Tobacco) | | $ | 147,622,705 | |
| | 607,704 | | | Visa, Inc. Class A (IT Services) | | | 108,693,937 | |
| | | | | | | | |
| | | | | | | 587,355,480 | |
| | |
| | TOTAL COMMON STOCKS | | | | |
| | (Cost $3,074,227,252) | | $ | 3,563,705,235 | |
| | |
| | | | | | | | |
| Shares | | Dividend
Rate | | | Value | |
|
| Preferred Stocks – 1.2% | |
| Germany – 1.2% | |
Volkswagen AG (Automobiles) | | | | | |
| 232,567 | | | 2.660 | % | | $ | 44,212,201 | |
| (Cost $44,928,248) | | | | | |
| |
| | | | | | | | |
|
| Investment Company(c) – 4.5% | |
Goldman Sachs Financial Square Government Fund – Institutional Shares | |
| 167,689,373 | | | 1.701 | % | | $ | 167,689,373 | |
| (Cost $167,689,373) | |
| |
| TOTAL INVESTMENTS BEFORE SECURITIES LENDING REINVESTMENT VEHICLE | |
| (Cost $3,286,844,873) | | | $ | 3,775,606,809 | |
| |
|
| Securities Lending Reinvestment Vehicle(c) – 1.1% | |
Goldman Sachs Financial Square Government Fund – Institutional Shares | |
| 42,935,200 | | | 1.701 | % | | | 42,935,200 | |
| (Cost $42,935,200) | |
| |
| TOTAL INVESTMENTS – 102.4% | |
| (Cost $3,329,780,073) | | | $ | 3,818,542,009 | |
| |
| LIABILITIES IN EXCESS OF OTHER ASSETS – (2.4)% | | | | (89,031,516 | ) |
| |
| NET ASSETS – 100.0% | | | $ | 3,729,510,493 | |
| |
| | |
|
| The percentage shown for each investment category reflects the value of investments in that category as a percentage of net assets. |
| |
* | | Non-income producing security. |
| |
(a) | | Exempt from registration under Rule 144A of the Securities Act of 1933. |
| |
(b) | | All or a portion of security is on loan. |
| |
(c) | | Represents an affiliated issuer. |
| | | | |
|
Currency Abbreviations: |
EUR—Euro |
JPY—Japanese Yen |
USD—U.S. Dollar |
|
Investment Abbreviations: |
ADR—American Depositary Receipt |
PLC—Public Limited Company |
REIT—Real Estate Investment Trust |
|
|
| ADDITIONAL INVESTMENT INFORMATION |
FORWARD FOREIGN CURRENCY EXCHANGE CONTRACTS — At October 31, 2019, the Fund had the following forward foreign currency exchange contracts:
FORWARD FOREIGN CURRENCY EXCHANGE CONTRACTS WITH UNREALIZED GAIN
| | | | | | | | | | | | | | | | | | | | |
| Counterparty | | Currency
Purchased | | | Currency
Sold | | | Settlement
Date | | | Unrealized
Gain | |
| | | | | | |
State Street Bank and Trust | | EUR | | | 22,913,334 | | | USD | | | 25,554,531 | | | | 11/04/19 | | | $ | 8,296 | |
FORWARD FOREIGN CURRENCY EXCHANGE CONTRACTS WITH UNREALIZED LOSS
| | | | | | | | | | | | | | | | | | | | |
| Counterparty | | Currency
Purchased | | | Currency
Sold | | | Settlement
Date | | | Unrealized
Loss | |
| | | | | | |
State Street Bank and Trust | | JPY | | | 154,473,572 | | | USD | | | 1,431,239 | | | | 11/05/19 | | | | (382 | ) |
| | |
| The accompanying notes are an integral part of these financial statements. | | 9 |
GOLDMAN SACHS GQG PARTNERS INTERNATIONAL OPPORTUNITIES FUND
Statement of Assets and Liabilities
October 31, 2019
| | | | | | |
| | | | | | |
| | Assets: | |
| | Investments of unaffiliated issuers, at value (cost $3,119,155,500) | | $ | 3,607,917,436 | |
| | Investments of affiliated issuers, at value (cost $167,689,373) | | | 167,689,373 | |
| | Investments in securities lending reinvestment vehicle — affiliated issuer, at value (cost $42,935,200)(a) | | | 42,935,200 | |
| | Cash | | | 3,418,079 | |
| | Foreign currencies, at value (cost $14,013,704) | | | 14,030,777 | |
| | Unrealized gain on forward foreign currency exchange contracts | | | 8,296 | |
| | Receivables: | | | | |
| | Fund shares sold | | | 35,559,594 | |
| | Investments sold | | | 8,742,141 | |
| | Dividends | | | 2,780,752 | |
| | Foreign tax reclaims | | | 2,022,644 | |
| | Reimbursement from investment adviser | | | 408,893 | |
| | Securities lending income | | | 727 | |
| | Other assets | | | 184,676 | |
| | Total assets | | | 3,885,698,588 | |
| | | | | | |
| | Liabilities: | | | | |
| | Unrealized loss on forward foreign currency exchange contracts | | | 382 | |
| | Payables: | | | | |
| | Investments purchased | | | 81,185,571 | |
| | Payable upon return of securities loaned | | | 42,935,200 | |
| | Investments purchased on an extended — settlement basis | | | 26,985,677 | |
| | Management fees | | | 2,306,343 | |
| | Fund shares redeemed | | | 1,915,698 | |
| | Distribution and Service fees and Transfer Agency fees | | | 282,868 | |
| | Accrued expenses | | | 576,356 | |
| | Total liabilities | | | 156,188,095 | |
| | | | | | |
| | Net Assets: | | | | |
| | Paid-in capital | | | 3,317,498,243 | |
| | Total distributable earnings | | | 412,012,250 | |
| | | NET ASSETS | | $ | 3,729,510,493 | |
| | | Net Assets: | | | | |
| | | Class A | | $ | 89,592,187 | |
| | | Class C | | | 32,620,231 | |
| | | Institutional | | | 1,996,933,886 | |
| | | Investor | | | 1,098,284,190 | |
| | | Class P | | | 477,608,803 | |
| | | Class R | | | 208,361 | |
| | | Class R6 | | | 34,262,835 | |
| | | Total Net Assets | | $ | 3,729,510,493 | |
| | | Shares Outstanding $0.001 par value (unlimited number of shares authorized): | | | | |
| | | Class A | | | 6,060,590 | |
| | | Class C | | | 2,249,735 | |
| | | Institutional | | | 134,293,824 | |
| | | Investor | | | 74,089,533 | |
| | | Class P | | | 32,140,144 | |
| | | Class R | | | 14,188 | |
| | | Class R6 | | | 2,304,752 | |
| | | Net asset value, offering and redemption price per share:(b) | | | | |
| | | Class A | | | $14.78 | |
| | | Class C | | | 14.50 | |
| | | Institutional | | | 14.87 | |
| | | Investor | | | 14.82 | |
| | | Class P | | | 14.86 | |
| | | Class R | | | 14.69 | |
| | | Class R6 | | | 14.87 | |
| | (a) | | Includes loaned securities having a market value of $41,855,506. |
| | (b) | | Maximum public offering price per share for Class A Shares is $15.64. At redemption, Class C Shares may be subject to a contingent deferred sales charge, assessed on the amount equal to the lesser of the current net asset value (“NAV”) or the original purchase price of the shares. |
| | |
| 10 | | The accompanying notes are an integral part of these financial statements. |
GOLDMAN SACHS GQG PARTNERS INTERNATIONAL OPPORTUNITIES FUND
Statement of Operations
For the Fiscal Year Ended October 31, 2019
| | | | | | |
| | | | | | |
| | Investment income: | |
| | |
| | Dividends — unaffiliated issuers (net of foreign withholding taxes of $3,817,192) | | $ | 44,766,255 | |
| | |
| | Dividends — affiliated issuers | | | 1,962,135 | |
| | |
| | Securities lending income — affiliated issuer | | | 85,052 | |
| | |
| | Total investment income | | | 46,813,442 | |
| | | | | | |
| | Expenses: | |
| | |
| | Management fees | | | 18,810,220 | |
| | |
| | Transfer Agency fees(a) | | | 1,912,685 | |
| | |
| | Registration fees | | | 584,830 | |
| | |
| | Distribution and Service fees(a) | | | 409,014 | |
| | |
| | Custody, accounting and administrative services | | | 373,510 | |
| | |
| | Printing and mailing costs | | | 250,428 | |
| | |
| | Professional fees | | | 171,193 | |
| | |
| | Trustee fees | | | 87,590 | |
| | |
| | Other | | | 134,865 | |
| | |
| | Total expenses | | | 22,734,335 | |
| | |
| | Less — expense reductions | | | (1,451,694 | ) |
| | |
| | Net expenses | | | 21,282,641 | |
| | |
| | NET INVESTMENT INCOME | | | 25,530,801 | |
| | | | | | |
| | Realized and unrealized gain (loss): | |
| |
| | Net realized gain (loss) from: | |
| | |
| | Investments — unaffiliated issuers | | | (71,898,237 | ) |
| | |
| | Forward foreign currency exchange contracts | | | 68,129 | |
| | |
| | Foreign currency transactions | | | (3,310,029 | ) |
| |
| | Net change in unrealized gain (loss) on: | |
| | |
| | Investments — unaffiliated issuers | | | 497,730,884 | |
| | |
| | Forward foreign currency exchange contracts | | | 7,914 | |
| | |
| | Foreign currency translation | | | (121,112 | ) |
| | |
| | Net realized and unrealized gain | | | 422,477,549 | |
| | |
| | NET INCREASE IN NET ASSETS RESULTING FROM OPERATIONS | | $ | 448,008,350 | |
| | (a) | | Class specific Distribution and/or Service and Transfer Agency fees were as follows: |
| | | | | | | | | | | | | | | | | | | | | | | | | | | | | | | | | | | | | | |
| Distribution and/or Service Fees | | | Transfer Agency Fees | |
Class A | | | Class C | | | Class R | | | Class A | | | Class C | | | Institutional | | | Investor | | | Class P | | | Class R | | | Class R6 | |
| $ | 153,375 | | | $ | 255,286 | | | $ | 353 | | | $ | 108,469 | | | $ | 45,189 | | | $ | 506,239 | | | $ | 1,143,083 | | | $ | 107,969 | | | $ | 122 | | | $ | 1,614 | |
| | |
| The accompanying notes are an integral part of these financial statements. | | 11 |
GOLDMAN SACHS GQG PARTNERS INTERNATIONAL OPPORTUNITIES FUND
Statements of Changes in Net Assets
| | | | | | | | | | |
| | | | | For the Fiscal
Year Ended
October 31, 2019 | | | For the Fiscal
Year Ended
October 31, 2018 | |
| | From operations: | |
| | | |
| | Net investment income | | $ | 25,530,801 | | | $ | 7,936,831 | |
| | | |
| | Net realized loss | | | (75,140,137 | ) | | | (23,263,342 | ) |
| | | |
| | Net change in unrealized gain (loss) | | | 497,617,686 | | | | (55,009,254 | ) |
| | | |
| | Net increase (decrease) in net assets resulting from operations | | | 448,008,350 | | | | (70,335,765 | ) |
| | | | | | | | | | |
| | Distributions to shareholders: | |
| | | |
| | From distributable earnings: | | | | | | | | |
| | | |
| | Class A Shares | | | (84,001 | ) | | | — | |
| | | |
| | Class C Shares | | | — | | | | — | |
| | | |
| | Institutional Shares | | | (4,326,053 | ) | | | (730,804 | ) |
| | | |
| | Investor Shares | | | (1,041,204 | ) | | | (90,579 | ) |
| | | |
| | Class P Shares(a) | | | (1,546,031 | ) | | | — | |
| | | |
| | Class R Shares | | | (19 | ) | | | — | |
| | | |
| | Class R6 Shares | | | (3,113 | ) | | | (27 | ) |
| | | |
| | Total distributions to shareholders | | | (7,000,421 | ) | | | (821,410 | ) |
| | | | | | | | | | |
| | From share transactions: | |
| | | |
| | Proceeds from sales of shares | | | 2,677,327,488 | | | | 1,223,864,242 | |
| | | |
| | Reinvestment of distributions | | | 6,904,153 | | | | 812,227 | |
| | | |
| | Cost of shares redeemed | | | (643,146,674 | ) | | | (385,868,432 | ) |
| | | |
| | Net increase in net assets resulting from share transactions | | | 2,041,084,967 | | | | 838,808,037 | |
| | | |
| | TOTAL INCREASE | | | 2,482,092,896 | | | | 767,650,862 | |
| | | | | | | | | | |
| | Net assets: | |
| | | |
| | Beginning of year | | | 1,247,417,597 | | | | 479,766,735 | |
| | | |
| | End of year | | $ | 3,729,510,493 | | | $ | 1,247,417,597 | |
| | (a) | | Commenced operations on April 16, 2018. |
| | |
| 12 | | The accompanying notes are an integral part of these financial statements. |
GOLDMAN SACHS GQG PARTNERS INTERNATIONAL OPPORTUNITIES FUND
Financial Highlights
Selected Share Data for a Share Outstanding Throughout Each Period
| | | | | | | | | | | | | | | | | | |
| | | | | Goldman Sachs GQG Partners
International Opportunities Fund
| |
| | | | | Class A Shares | |
| | | | | Year Ended October 31, | | | | | | Period Ended October 31, | |
| | | | | 2019 | | | 2018 | | | | | | 2017(a) | |
| | Per Share Data | | | | | | | | | | | | | | | | |
| | | | | |
| | Net asset value, beginning of period | | $ | 12.32 | | | $ | 12.69 | | | | | | | $ | 10.00 | |
| | | | | |
| | Net investment income(b) | | | 0.10 | | | | 0.08 | | | | | | | | 0.04 | |
| | | | | |
| | Net realized and unrealized gain (loss) | | | 2.38 | | | | (0.45 | ) | | | | | | | 2.66 | |
| | | | | |
| | Total from investment operations | | | 2.48 | | | | (0.37 | ) | | | | | | | 2.70 | |
| | | | | |
| | Distributions to shareholders from net investment income | | | (0.02 | ) | | | — | | | | | | | | (0.01 | ) |
| | | | | |
| | Net asset value, end of period | | $ | 14.78 | | | $ | 12.32 | | | | | | | $ | 12.69 | |
| | | | | |
| | Total return(c) | | | 20.19 | % | | | (2.92 | )% | | | | | | | 26.97 | % |
| | | | | |
| | Net assets, end of period (in 000s) | | $ | 89,592 | | | $ | 44,887 | | | | | | | $ | 11,297 | |
| | | | | |
| | Ratio of net expenses to average net assets | | | 1.23 | % | | | 1.28 | % | | | | | | | 1.30 | %(d) |
| | | | | |
| | Ratio of total expenses to average net assets | | | 1.29 | % | | | 1.38 | % | | | | | | | 1.65 | %(d) |
| | | | | |
| | Ratio of net investment income to average net assets | | | 0.71 | % | | | 0.57 | % | | | | | | | 0.40 | %(d) |
| | | | | |
| | Portfolio turnover rate(e) | | | 55 | % | | | 90 | % | | | | | | | 54 | % |
| | (a) | | Commenced operations on December 15, 2016. |
| | (b) | | Calculated based on the average shares outstanding methodology. |
| | (c) | | Assumes investment at the NAV at the beginning of the period, reinvestment of all dividends and distributions, a complete redemption of the investment at the NAV at the end of the period and no sales or redemption charges (if any). Total returns would be reduced if a sales or redemption charge was taken into account. Returns do not reflect the impact of taxes to shareholders relating to Fund distributions or the redemption of Fund shares. Total returns for periods less than one full year are not annualized. |
| | (e) | | The Fund’s portfolio turnover rate is calculated in accordance with regulatory requirements, without regard to transactions involving certain derivatives and short term investments. If such transactions were included, the Fund’s portfolio turnover rate may be higher. |
| | |
| The accompanying notes are an integral part of these financial statements. | | 13 |
GOLDMAN SACHS GQG PARTNERS INTERNATIONAL OPPORTUNITIES FUND
Financial Highlights(continued)
Selected Share Data for a Share Outstanding Throughout Each Period
| | | | | | | | | | | | | | | | | | |
| | | | | Goldman Sachs GQG Partners
International Opportunities Fund | |
| | | | | Class C Shares | |
| | | | | Year Ended October 31, | | | | | | Period Ended October 31, | |
| | | | | 2019 | | | 2018 | | | | | | 2017(a) | |
| | Per Share Data | | | | | | | | | | | | | | | | |
| | | | | |
| | Net asset value, beginning of period | | $ | 12.16 | | | $ | 12.61 | | | | | | | $ | 10.00 | |
| | | | | |
| | Net investment income (loss)(b) | | | — | (c) | | | (0.02 | ) | | | | | | | (0.06 | ) |
| | | | | |
| | Net realized and unrealized gain (loss) | | | 2.34 | | | | (0.43 | ) | | | | | | | 2.67 | |
| | | | | |
| | Total from investment operations | | | 2.34 | | | | (0.45 | ) | | | | | | | 2.61 | |
| | | | | |
| | Distributions to shareholders from net investment income | | | — | | | | — | | | | | | | | — | (c) |
| | | | | |
| | Net asset value, end of period | | $ | 14.50 | | | $ | 12.16 | | | | | | | $ | 12.61 | |
| | | | | |
| | Total return(d) | | | 19.24 | % | | | (3.57 | )% | | | | | | | 26.13 | % |
| | | | | |
| | Net assets, end of period (in 000s) | | $ | 32,620 | | | $ | 20,147 | | | | | | | $ | 12,969 | |
| | | | | |
| | Ratio of net expenses to average net assets | | | 1.98 | % | | | 2.04 | % | | | | | | | 2.05 | %(e) |
| | | | | |
| | Ratio of total expenses to average net assets | | | 2.04 | % | | | 2.12 | % | | | | | | | 2.34 | %(e) |
| | | | | |
| | Ratio of net investment loss to average net assets | | | (0.02 | )% | | | (0.18 | )% | | | | | | | (0.57 | )%(e) |
| | | | | |
| | Portfolio turnover rate(f) | | | 55 | % | | | 90 | % | | | | | | | 54 | % |
| | (a) | | Commenced operations on December 15, 2016. |
| | (b) | | Calculated based on the average shares outstanding methodology. |
| | (c) | | Amount is less than $0.005 per share. |
| | (d) | | Assumes investment at the NAV at the beginning of the period, reinvestment of all dividends and distributions, a complete redemption of the investment at the NAV at the end of the period and no sales or redemption charges (if any). Total returns would be reduced if a sales or redemption charge was taken into account. Returns do not reflect the impact of taxes to shareholders relating to Fund distributions or the redemption of Fund shares. Total returns for periods less than one full year are not annualized. |
| | (f) | | The Fund’s portfolio turnover rate is calculated in accordance with regulatory requirements, without regard to transactions involving certain derivatives and short term investments. If such transactions were included, the Fund’s portfolio turnover rate may be higher. |
| | |
| 14 | | The accompanying notes are an integral part of these financial statements. |
GOLDMAN SACHS GQG PARTNERS INTERNATIONAL OPPORTUNITIES FUND
Financial Highlights(continued)
Selected Share Data for a Share Outstanding Throughout Each Period
| | | | | | | | | | | | | | | | | | |
| | | | | Goldman Sachs GQG Partners
International Opportunities Fund
| |
| | | | | Institutional Shares | |
| | | | | Year Ended October 31, | | | | | | Period Ended October 31, | |
| | | | | 2019 | | | 2018 | | | | | | 2017(a) | |
| | Per Share Data | | | | | | | | | | | | | | | | |
| | | | | |
| | Net asset value, beginning of period | | $ | 12.39 | | | $ | 12.73 | | | | | | | $ | 10.00 | |
| | | | | |
| | Net investment income(b) | | | 0.15 | | | | 0.13 | | | | | | | | 0.08 | |
| | | | | |
| | Net realized and unrealized gain (loss) | | | 2.39 | | | | (0.45 | ) | | | | | | | 2.66 | |
| | | | | |
| | Total from investment operations | | | 2.54 | | | | (0.32 | ) | | | | | | | 2.74 | |
| | | | | |
| | Distributions to shareholders from net investment income | | | (0.06 | ) | | | (0.02 | ) | | | | | | | (0.01 | ) |
| | | | | |
| | Net asset value, end of period | | $ | 14.87 | | | $ | 12.39 | | | | | | | $ | 12.73 | |
| | | | | |
| | Total return(c) | | | 20.65 | % | | | (2.52 | )% | | | | | | | 27.39 | % |
| | | | | |
| | Net assets, end of period (in 000s) | | $ | 1,996,934 | | | $ | 713,691 | | | | | | | $ | 392,168 | |
| | | | | |
| | Ratio of net expenses to average net assets | | | 0.84 | % | | | 0.90 | % | | | | | | | 0.90 | %(d) |
| | | | | |
| | Ratio of total expenses to average net assets | | | 0.90 | % | | | 0.98 | % | | | | | | | 1.30 | %(d) |
| | | | | |
| | Ratio of net investment income to average net assets | | | 1.10 | % | | | 0.96 | % | | | | | | | 0.73 | %(d) |
| | | | | |
| | Portfolio turnover rate(e) | | | 55 | % | | | 90 | % | | | | | | | 54 | % |
| | (a) | | Commenced operations on December 15, 2016. |
| | (b) | | Calculated based on the average shares outstanding methodology. |
| | (c) | | Assumes investment at the NAV at the beginning of the period, reinvestment of all dividends and distributions, a complete redemption of the investment at the NAV at the end of the period and no sales or redemption charges (if any). Total returns would be reduced if a sales or redemption charge was taken into account. Returns do not reflect the impact of taxes to shareholders relating to Fund distributions or the redemption of Fund shares. Total returns for periods less than one full year are not annualized. |
| | (e) | | The Fund’s portfolio turnover rate is calculated in accordance with regulatory requirements, without regard to transactions involving certain derivatives and short term investments. If such transactions were included, the Fund’s portfolio turnover rate may be higher. |
| | |
| The accompanying notes are an integral part of these financial statements. | | 15 |
GOLDMAN SACHS GQG PARTNERS INTERNATIONAL OPPORTUNITIES FUND
Financial Highlights(continued)
Selected Share Data for a Share Outstanding Throughout Each Period
| | | | | | | | | | | | | | | | | | |
| | | | | Goldman Sachs GQG Partners
International Opportunities Fund
| |
| | | | | Investor Shares | |
| | | | | Year Ended October 31, | | | | | | Period Ended October 31, | |
| | | | | 2019 | | | 2018 | | | | | | 2017(a) | |
| | Per Share Data | | | | | | | | | | | | | | | | |
| | | | | |
| | Net asset value, beginning of period | | $ | 12.36 | | | $ | 12.71 | | | | | | | $ | 10.00 | |
| | | | | |
| | Net investment income (loss)(b) | | | 0.15 | | | | 0.10 | | | | | | | | (0.01 | ) |
| | | | | |
| | Net realized and unrealized gain (loss) | | | 2.36 | | | | (0.43 | ) | | | | | | | 2.73 | |
| | | | | |
| | Total from investment operations | | | 2.51 | | | | (0.33 | ) | | | | | | | 2.72 | |
| | | | | |
| | Distributions to shareholders from net investment income | | | (0.05 | ) | | | (0.02 | ) | | | | | | | (0.01 | ) |
| | | | | |
| | Net asset value, end of period | | $ | 14.82 | | | $ | 12.36 | | | | | | | $ | 12.71 | |
| | | | | |
| | Total return(c) | | | 20.42 | % | | | (2.64 | )% | | | | | | | 27.18 | % |
| | | | | |
| | Net assets, end of period (in 000s) | | $ | 1,098,284 | | | $ | 234,587 | | | | | | | $ | 63,303 | |
| | | | | |
| | Ratio of net expenses to average net assets | | | 0.98 | % | | | 1.03 | % | | | | | | | 1.05 | %(d) |
| | | | | |
| | Ratio of total expenses to average net assets | | | 1.04 | % | | | 1.13 | % | | | | | | | 1.39 | %(d) |
| | | | | |
| | Ratio of net investment income to average net assets | | | 1.09 | % | | | 0.77 | % | | | | | | | (0.10 | )%(d) |
| | | | | |
| | Portfolio turnover rate(e) | | | 55 | % | | | 90 | % | | | | | | | 54 | % |
| | (a) | | Commenced operations on December 15, 2016. |
| | (b) | | Calculated based on the average shares outstanding methodology. |
| | (c) | | Assumes investment at the NAV at the beginning of the period, reinvestment of all dividends and distributions, a complete redemption of the investment at the NAV at the end of the period and no sales or redemption charges (if any). Total returns would be reduced if a sales or redemption charge was taken into account. Returns do not reflect the impact of taxes to shareholders relating to Fund distributions or the redemption of Fund shares. Total returns for periods less than one full year are not annualized. |
| | (e) | | The Fund’s portfolio turnover rate is calculated in accordance with regulatory requirements, without regard to transactions involving certain derivatives and short term investments. If such transactions were included, the Fund’s portfolio turnover rate may be higher. |
| | |
| 16 | | The accompanying notes are an integral part of these financial statements. |
GOLDMAN SACHS GQG PARTNERS INTERNATIONAL OPPORTUNITIES FUND
Financial Highlights(continued)
Selected Share Data for a Share Outstanding Throughout Each Period
| | | | | | | | | | | | | | |
| | | | | Goldman Sachs GQG Partners
International Opportunities Fund
| |
| | | | | Class P Shares | |
| | | | | Year Ended October | | | | | | Period Ended October 31, | |
| | | | | 2019 | | | | | | 2018(a) | |
| | Per Share Data | | | | | | | | | | | | |
| | | | |
| | Net asset value, beginning of period | | $ | 12.39 | | | | | | | $ | 13.17 | |
| | | | |
| | Net investment income(b) | | | 0.16 | | | | | | | | 0.02 | |
| | | | |
| | Net realized and unrealized gain (loss) | | | 2.38 | | | | | | | | (0.80 | ) |
| | | | |
| | Total from investment operations | | | 2.54 | | | | | | | | (0.78 | ) |
| | | | |
| | Distributions to shareholders from net investment income | | | (0.07 | ) | | | | | | | — | |
| | | | |
| | Net asset value, end of period | | $ | 14.86 | | | | | | | $ | 12.39 | |
| | | | |
| | Total return(c) | | | 20.61 | % | | | | | | | (5.92 | )% |
| | | | |
| | Net assets, end of period (in 000s) | | $ | 477,609 | | | | | | | $ | 233,541 | |
| | | | |
| | Ratio of net expenses to average net assets | | | 0.82 | % | | | | | | | 0.87 | %(d) |
| | | | |
| | Ratio of total expenses to average net assets | | | 0.89 | % | | | | | | | 1.02 | %(d) |
| | | | |
| | Ratio of net investment income to average net assets | | | 1.14 | % | | | | | | | 0.33 | %(d) |
| | | | |
| | Portfolio turnover rate(e) | | | 55 | % | | | | | | | 90 | % |
| | (a) | | Commenced operations on April 16, 2018. |
| | (b) | | Calculated based on the average shares outstanding methodology. |
| | (c) | | Assumes investment at the NAV at the beginning of the period, reinvestment of all dividends and distributions, a complete redemption of the investment at the NAV at the end of the period and no sales or redemption charges (if any). Total returns would be reduced if a sales or redemption charge was taken into account. Returns do not reflect the impact of taxes to shareholders relating to Fund distributions or the redemption of Fund shares. Total returns for periods less than one full year are not annualized. |
| | (e) | | The Fund’s portfolio turnover rate is calculated in accordance with regulatory requirements, without regard to transactions involving certain derivatives and short term investments. If such transactions were included, the Fund’s portfolio turnover rate may be higher. |
| | |
| The accompanying notes are an integral part of these financial statements. | | 17 |
GOLDMAN SACHS GQG PARTNERS INTERNATIONAL OPPORTUNITIES FUND
Financial Highlights(continued)
Selected Share Data for a Share Outstanding Throughout Each Period
| | | | | | | | | | | | | | | | | | |
| | | | | Goldman Sachs GQG Partners International Opportunities Fund | |
| | | | | Class R Shares | |
| | | | | Year Ended October 31, | | | | | | Period Ended October 31, | |
| | | | | 2019 | | | 2018 | | | | | | 2017(a) | |
| | Per Share Data | | | | | | | | | | | | | | | | |
| | | | | |
| | Net asset value, beginning of period | | $ | 12.26 | | | $ | 12.66 | | | | | | | $ | 10.00 | |
| | | | | |
| | Net investment income(b) | | | 0.01 | | | | 0.02 | | | | | | | | 0.04 | |
| | | | | |
| | Net realized and unrealized gain (loss) | | | 2.43 | | | | (0.42 | ) | | | | | | | 2.62 | |
| | | | | |
| | Total from investment operations | | | 2.44 | | | | (0.40 | ) | | | | | | | 2.66 | |
| | | | | |
| | Distributions to shareholders from net investment income | | | (0.01 | ) | | | — | | | | | | | | — | (c) |
| | | | | |
| | Net asset value, end of period | | $ | 14.69 | | | $ | 12.26 | | | | | | | $ | 12.66 | |
| | | | | |
| | Total return(d) | | | 19.91 | % | | | (3.16 | )% | | | | | | | 26.65 | % |
| | | | | |
| | Net assets, end of period (in 000s) | | $ | 208 | | | $ | 25 | | | | | | | $ | 17 | |
| | | | | |
| | Ratio of net expenses to average net assets | | | 1.47 | % | | | 1.53 | % | | | | | | | 1.55 | %(e) |
| | | | | |
| | Ratio of total expenses to average net assets | | | 1.54 | % | | | 1.62 | % | | | | | | | 2.22 | %(e) |
| | | | | |
| | Ratio of net investment income to average net assets | | | 0.05 | % | | | 0.15 | % | | | | | | | 0.43 | %(e) |
| | | | | |
| | Portfolio turnover rate(f) | | | 55 | % | | | 90 | % | | | | | | | 54 | % |
| | (a) | | Commenced operations on December 15, 2016. |
| | (b) | | Calculated based on the average shares outstanding methodology. |
| | (c) | | Amount is less than $0.005 per share. |
| | (d) | | Assumes investment at the NAV at the beginning of the period, reinvestment of all dividends and distributions, a complete redemption of the investment at the NAV at the end of the period and no sales or redemption charges (if any). Total returns would be reduced if a sales or redemption charge was taken into account. Returns do not reflect the impact of taxes to shareholders relating to Fund distributions or the redemption of Fund shares. Total returns for periods less than one full year are not annualized. |
| | (f) | | The Fund’s portfolio turnover rate is calculated in accordance with regulatory requirements, without regard to transactions involving certain derivatives and short term investments. If such transactions were included, the Fund’s portfolio turnover rate may be higher. |
| | |
| 18 | | The accompanying notes are an integral part of these financial statements. |
GOLDMAN SACHS GQG PARTNERS INTERNATIONAL OPPORTUNITIES FUND
Financial Highlights(continued)
Selected Share Data for a Share Outstanding Throughout Each Period
| | | | | | | | | | | | | | | | | | |
| | | | | Goldman Sachs GQG Partners
International Opportunities Fund
| |
| | | | | Class R6 Shares | |
| | | | | Year Ended October 31, | | | | | | Period Ended October 31, | |
| | | | | 2019 | | | 2018 | | | | | | 2017(a) | |
| | Per Share Data | | | | | | | | | | | | | | | | |
| | | | | |
| | Net asset value, beginning of period | | $ | 12.39 | | | $ | 12.73 | | | | | | | $ | 10.00 | |
| | | | | |
| | Net investment income(b) | | | 0.05 | | | | 0.12 | | | | | | | | 0.11 | |
| | | | | |
| | Net realized and unrealized gain (loss) | | | 2.50 | | | | (0.44 | ) | | | | | | | 2.63 | |
| | | | | |
| | Total from investment operations | | | 2.55 | | | | (0.32 | ) | | | | | | | 2.74 | |
| | | | | |
| | Distributions to shareholders from net investment income | | | (0.07 | ) | | | (0.02 | ) | | | | | | | (0.01 | ) |
| | | | | |
| | Net asset value, end of period | | $ | 14.87 | | | $ | 12.39 | | | | | | | $ | 12.73 | |
| | | | | |
| | Total return(c) | | | 20.68 | % | | | (2.52 | )% | | | | | | | 27.39 | % |
| | | | | |
| | Net assets, end of period (in 000s) | | $ | 34,263 | | | $ | 540 | | | | | | | $ | 13 | |
| | | | | |
| | Ratio of net expenses to average net assets | | | 0.81 | % | | | 0.87 | % | | | | | | | 0.89 | %(d) |
| | | | | |
| | Ratio of total expenses to average net assets | | | 0.92 | % | | | 0.98 | % | | | | | | | 1.66 | %(d) |
| | | | | |
| | Ratio of net investment income to average net assets | | | 0.34 | % | | | 0.92 | % | | | | | | | 1.09 | %(d) |
| | | | | |
| | Portfolio turnover rate(e) | | | 55 | % | | | 90 | % | | | | | | | 54 | % |
| | (a) | | Commenced operations on December 15, 2016. |
| | (b) | | Calculated based on the average shares outstanding methodology. |
| | (c) | | Assumes investment at the NAV at the beginning of the period, reinvestment of all dividends and distributions, a complete redemption of the investment at the NAV at the end of the period and no sales or redemption charges (if any). Total returns would be reduced if a sales or redemption charge was taken into account. Returns do not reflect the impact of taxes to shareholders relating to Fund distributions or the redemption of Fund shares. Total returns for periods less than one full year are not annualized. |
| | (e) | | The Fund’s portfolio turnover rate is calculated in accordance with regulatory requirements, without regard to transactions involving certain derivatives and short term investments. If such transactions were included, the Fund’s portfolio turnover rate may be higher. |
| | |
| The accompanying notes are an integral part of these financial statements. | | 19 |
GOLDMAN SACHS GQG PARTNERS INTERNATIONAL OPPORTUNITIES FUND
Notes to Financial Statements
October 31, 2019
Goldman Sachs Trust II (the “Trust”) is a Delaware statutory trust registered under the Investment Company Act of 1940, as amended (the “Act”), as anopen-end management investment company. The Trust includes the Goldman Sachs GQG Partners International Opportunities Fund (the “Fund”). The Fund is anon-diversified portfolio that currently offers seven classes of shares: Class A, Class C, Institutional, Investor, Class P, Class R and Class R6 Shares.
Class A Shares are sold with afront-end sales charge of up to 5.50%. Class C Shares are sold with a contingent deferred sales charge (“CDSC”) of 1.00%, which is imposed on redemptions made within 12 months of purchase. Institutional, Investor, Class P, Class R, and Class R6 Shares are not subject to a sales charge.
Goldman Sachs Asset Management, L.P. (“GSAM”), an affiliate of Goldman Sachs & Co. LLC (“Goldman Sachs”), serves as investment adviser to the Fund pursuant to a management agreement (the “Agreement”) with the Trust.
GQG Partners LLC (“GQG Partners” or the“Sub-Adviser”) serves as thesub-adviser to the Fund. GSAM compensates theSub-Adviser directly in accordance with the terms of theSub-Advisory Agreement. The Fund is not charged any separate or additional investment advisory fees by theSub-Adviser.
|
| 2. SIGNIFICANT ACCOUNTING POLICIES |
The financial statements have been prepared in accordance with accounting principles generally accepted in the United States of America (“GAAP”) and require management to make estimates and assumptions that may affect the reported amounts and disclosures. Actual results may differ from those estimates and assumptions. The Fund is an investment company under GAAP and follows the accounting and reporting guidance applicable to investment companies.
A. Investment Valuation — The Fund’s valuation policy is to value investments at fair value.
B. Investment Income and Investments — Investment income includes interest income, dividend income and securities lending income, if any. Interest income is accrued daily and adjusted for amortization of premiums and accretion of discounts. Dividend income is recognized onex-dividend date or, for certain foreign securities, as soon as such information is obtained subsequent to theex-dividend date. Non-cash dividends, if any, are recorded at the fair market value of the securities received. Investment transactions are reflected on trade date. Realized gains and losses are calculated using identified cost. Investment transactions are recorded on the following business day for daily net asset value (“NAV”) calculations. Investment income is recorded net of any foreign withholding taxes, less any amounts reclaimable. The Fund may file withholding tax reclaims in certain jurisdictions to recover a portion of amounts previously withheld. Any foreign capital gains tax is accrued daily based upon net unrealized gains, and is payable upon sale of such investments.
For derivative contracts, realized gains and losses are recorded upon settlement of the contract.
C. Class Allocations and Expenses — Investment income, realized and unrealized gain (loss), if any, andnon-class specific expenses of the Fund are allocated daily based upon the proportion of net assets of each class.Non-class specific expenses directly incurred by the Fund are charged to the Fund, while such expenses incurred by the Trust are allocated across the Fund on a straight-line and/orpro-rata basis depending upon the nature of the expenses. Class-specific expenses, where applicable, are borne by the respective share classes and include Distribution and Service and Transfer Agency fees.
D. Federal Taxes and Distributions to Shareholders — It is the Fund’s policy to comply with the requirements of the Internal Revenue Code of 1986, as amended (the “Code”), applicable to regulated investment companies and to distribute each year substantially all of its investment company taxable income and capital gains to its shareholders. Accordingly, the Fund is not required to make any provisions for the payment of federal income tax. Distributions to shareholders are recorded on theex-dividend date. Income and capital gains distributions, if any, are declared and paid annually.
Net capital losses, if any, are carried forward to future fiscal years and may be used to the extent allowed by the Code to offset any future capital gains. Losses that are carried forward will retain their character as either short-term or long-term capital losses. Utilization of capital loss carryforwards will reduce the requirement of future capital gains distributions.
The characterization of distributions to shareholders for financial reporting purposes is determined in accordance with federal income tax rules, which may differ from GAAP. The source of the Fund’s distributions may be shown in the accompanying
20
GOLDMAN SACHS GQG PARTNERS INTERNATIONAL OPPORTUNITIES FUND
|
| 2. SIGNIFICANT ACCOUNTING POLICIES (continued) |
financial statements as either from distributable earnings or capital. Certain components of the Fund’s net assets on the Statement of Assets and Liabilities reflect permanent GAAP/tax differences based on the appropriate tax character.
E. Foreign Currency Translation — The accounting records and reporting currency of the Fund are maintained in U.S. dollars. Assets and liabilities denominated in foreign currencies are translated into U.S. dollars using the current exchange rates at the close of each business day. The effect of changes in foreign currency exchange rates on investments is included within net realized and unrealized gain (loss) on investments. Changes in the value of other assets and liabilities as a result of fluctuations in foreign exchange rates are included in the Statement of Operations within net change in unrealized gain (loss) on foreign currency translation. Transactions denominated in foreign currencies are translated into U.S. dollars on the date the transaction occurred, the effects of which are included within net realized gain (loss) on foreign currency transactions.
|
| 3. INVESTMENTS AND FAIR VALUE MEASUREMENTS |
U.S. GAAP defines the fair value of a financial instrument as the amount that would be received to sell an asset or paid to transfer a liability in an orderly transaction between market participants at the measurement date (i.e., the exit price); the Fund’s policy is to use the market approach. GAAP establishes a fair value hierarchy that prioritizes the inputs to valuation techniques used to measure fair value. The hierarchy gives the highest priority to unadjusted quoted prices in active markets for identical assets or liabilities (Level 1 measurements) and the lowest priority to unobservable inputs (Level 3 measurements). The levels used for classifying investments are not necessarily an indication of the risk associated with investing in these investments. The three levels of the fair value hierarchy are described below:
Level 1 — Unadjusted quoted prices in active markets that are accessible at the measurement date for identical, unrestricted assets or liabilities;
Level 2 — Quoted prices in markets that are not active or financial instruments for which significant inputs are observable (including, but not limited to, quoted prices for similar investments, interest rates, foreign exchange rates, volatility and credit spreads), either directly or indirectly;
Level 3 — Prices or valuations that require significant unobservable inputs (including GSAM’s assumptions in determining fair value measurement).
The Board of Trustees (“Trustees”) has approved Valuation Procedures that govern the valuation of the portfolio investments held by the Fund, including investments for which market quotations are not readily available. The Trustees have delegated to GSAMday-to-day responsibility for implementing and maintaining internal controls and procedures related to the valuation of the Fund’s investments. To assess the continuing appropriateness of pricing sources and methodologies, GSAM regularly performs price verification procedures and issues challenges as necessary to third party pricing vendors or brokers, and any differences are reviewed in accordance with the Valuation Procedures.
A. Level 1 and Level 2 Fair Value Investments — The valuation techniques and significant inputs used in determining the fair values for investments classified as Level 1 and Level 2 are as follows:
Equity Securities — Equity securities traded on a United States (“U.S.”) securities exchange or the NASDAQ system, or those located on certain foreign exchanges, including but not limited to the Americas, are valued daily at their last sale price or official closing price on the principal exchange or system on which they are traded. If there is no sale or official closing price or such price is believed by GSAM to not represent fair value, equity securities may be valued at the closing bid price for long positions and at the closing ask price for short positions. To the extent these investments are actively traded, they are classified as Level 1 of the fair value hierarchy, otherwise they are generally classified as Level 2.
Unlisted equity securities for which market quotations are available are valued at the last sale price on the valuation date, or if no sale occurs, at the last bid price for long positions or the last ask price for short positions, and are generally classified as Level 2. Securities traded on certain foreign securities exchanges are valued daily at fair value determined by an independent fair value service (if available) under Valuation Procedures approved by the Trustees and consistent with applicable regulatory guidance. The
21
GOLDMAN SACHS GQG PARTNERS INTERNATIONAL OPPORTUNITIES FUND
Notes to Financial Statements(continued)
October 31, 2019
|
| 3. INVESTMENTS AND FAIR VALUE MEASUREMENTS (continued) |
independent fair value service takes into account multiple factors including, but not limited to, movements in the securities markets, certain depositary receipts, futures contracts and foreign currency exchange rates that have occurred subsequent to the close of the foreign securities exchange. These investments are generally classified as Level 2 of the fair value hierarchy.
Money Market Funds— Investments in the Goldman Sachs Financial Square Government Fund (“Underlying Fund”) are valued at the NAV per share of the Institutional Share class on the day of valuation. These investments are generally classified as Level 1 of the fair value hierarchy. For information regarding the Underlying Fund’s accounting policies and investment holdings, please see the Underlying Fund’s shareholder report.
Derivative Contracts— A derivative is an instrument whose value is derived from underlying assets, indices, reference rates or a combination of these factors. The Fund enters into derivative transactions to hedge against changes in interest rates, securities prices, and/or currency exchange rates, to increase total return, or to gain access to certain markets or attain exposure to other underliers. For financial reporting purposes, cash collateral that has been pledged to cover obligations of a Fund and cash collateral received, if any, is reported separately on the Statement of Assets and Liabilities as receivables/payables for collateral on certain derivatives contracts.Non-cash collateral pledged by the Fund, if any, is noted in the Schedule of Investments.
Exchange-traded derivatives, including futures and options contracts, are generally valued at the last sale or settlement price on the exchange where they are principally traded. Exchange-traded options without settlement prices are generally valued at the midpoint of the bid and ask prices on the exchange where they are principally traded (or, in the absence oftwo-way trading, at the last bid price for long positions and the last ask price for short positions). Exchange-traded derivatives typically fall within Level 1 of the fair value hierarchy.Over-the-counter (“OTC”) and centrally cleared derivatives are valued using market transactions and other market evidence, including market-based inputs to models, calibration to market-clearing transactions, broker or dealer quotations, or other alternative pricing sources. Where models are used, the selection of a particular model to value OTC and centrally cleared derivatives depends upon the contractual terms of, and specific risks inherent in, the instrument, as well as the availability of pricing information in the market. Valuation models require a variety of inputs, including contractual terms, market prices, yield curves, credit curves, measures of volatility, voluntary and involuntary prepayment rates, loss severity rates and correlations of such inputs. For OTC and centrally cleared derivatives that trade in liquid markets, model inputs can generally be verified and model selection does not involve significant management judgment. OTC and centrally cleared derivatives are classified within Level 2 of the fair value hierarchy when significant inputs are corroborated by market evidence.
i. Forward Contracts — A forward contract is a contract between two parties to buy or sell an asset at a specified price on a future date. A forward contract settlement can occur on a cash or delivery basis. Forward contracts aremarked-to-market daily using independent vendor prices, and the change in value, if any, is recorded as an unrealized gain or loss. Cash and certain investments may be used to collateralize forward contracts.
Aforward foreign currency exchange contractis a forward contract in which the Fund agrees to receive or deliver a fixed quantity of one currency for another, at apre-determined price at a future date. All forward foreign currency exchange contracts aremarked-to-market daily at the applicable forward rate.Non-deliverable forward foreign currency exchange contracts are settled with the counterparty in cash without the delivery of foreign currency.
B. Level 3 Fair Value Investments — To the extent that significant inputs to valuation models and other alternative pricing sources are unobservable, or if quotations are not readily available, or if GSAM believes that such quotations do not accurately reflect fair value, the fair value of the Fund’s investments may be determined under Valuation Procedures approved by the Trustees. GSAM, consistent with its procedures and applicable regulatory guidance, may make an adjustment to the most recent valuation prices of either domestic or foreign securities in light of significant events to reflect what it believes to be the fair value of the securities at the time of determining the Fund’s NAV. To the extent investments are valued using single source broker quotations obtained directly from the broker or passed through from third party pricing vendors, such investments are classified as Level 3 investments.
22
GOLDMAN SACHS GQG PARTNERS INTERNATIONAL OPPORTUNITIES FUND
|
| 3. INVESTMENTS AND FAIR VALUE MEASUREMENTS (continued) |
C. Fair Value Hierarchy — The following is a summary of the Fund’s investments and derivatives classified in the fair value hierarchy as of October 31, 2019:
| | | | | | | | | | | | |
| | | |
| Investment Type | | Level 1 | | | Level 2 | | | Level 3 | |
| | | |
| Assets | | | | | | | | | | | | |
| | | |
Common Stock and/or Other Equity Investments(a) | | | | | | | | | | | | |
| | | |
Asia | | $ | 237,284,208 | | | $ | 231,261,679 | | | $ | — | |
| | | |
Australia and Oceania | | | — | | | | 165,145,442 | | | | — | |
| | | |
Europe | | | 198,344,316 | | | | 2,064,189,956 | | | | — | |
| | | |
North America | | | 711,691,835 | | | | — | | | | — | |
| | | |
Investment Company | | | 167,689,373 | | | | — | | | | — | |
| | | |
Securities Lending Reinvestment Vehicle | | | 42,935,200 | | | | — | | | | — | |
| | | |
| Total | | $ | 1,357,944,932 | | | $ | 2,460,597,077 | | | $ | — | |
| | | |
| Derivative Type | | | | | | | | | |
| | | |
| Assets | | | | | | | | | | | | |
| | | |
Forward Foreign Currency Exchange Contracts(b) | | $ | — | | | $ | 8,296 | | | $ | — | |
| | | |
| Liabilities | | | | | | | | | | | | |
| | | |
Forward Foreign Currency Exchange Contracts(b) | | $ | — | | | $ | (382 | ) | | $ | — | |
| (a) | | Amounts are disclosed by continent to highlight the impact of time zone differences between local market close and the calculation of NAV. Security valuations are based on the principal exchange or system on which they are traded, which may differ from country of domicile. The Fund utilizes fair value model prices provided by an independent fair value service for international equities, resulting in a Level 2 classification. |
| (b) | | Amount shown represents unrealized gain (loss) at period end. |
For further information regarding security characteristics, see the Schedule of Investments.
|
| 4. INVESTMENTS IN DERIVATIVES |
The following table sets forth, by certain risk types, the gross value of derivative contracts (not considered to be hedging instruments for accounting disclosure purposes) as of October 31, 2019. These instruments were used as part of the Fund’s investment strategies and to obtain and/or manage exposure related to the risks below. The values in the tables below exclude the effects of cash collateral received or posted pursuant to these derivative contracts, and therefore are not representative of the Fund’s net exposure.
| | | | | | | | | | | | |
| Risk | | Statement of Assets and Liabilities | | Assets | | | Statement of Assets and Liabilities | | Liabilities | |
Currency | | Receivable for unrealized gain on forward foreign currency exchange contracts | | $ | 8,296 | | | Payable for unrealized loss on forward foreign currency exchange contracts | | $ | (382) | |
The following table sets forth, by certain risk types, the Fund’s gains (losses) related to these derivatives and their indicative volumes for the fiscal year ended October 31, 2019. These gains (losses) should be considered in the context that these derivative contracts may have been executed to create investment opportunities and/or economically hedge certain investments, and accordingly, certain gains (losses) on such derivative contracts may offset certain (losses) gains attributable to investments. These gains (losses) are included in “Net realized gain (loss)” or “Net change in unrealized gain (loss)” on the Statement of Operations:
| | | | | | | | | | | | | | |
| Risk | | Statement of Operations | | Net Realized
Gain (Loss) | | | Net Change in
Unrealized
Gain (Loss) | | | Average
Number of
Contracts(a) | |
| Currency | | Net realized gain (loss) from forward foreign currency exchange contracts/Net unrealized gain(loss) on forward foreign currency exchange contracts | | $ | 68,129 | | | $ | 7,914 | | | | 2 | |
| (a) | | Average number of contracts is based on the average of month end balances for the fiscal year ended October 31, 2019. |
23
GOLDMAN SACHS GQG PARTNERS INTERNATIONAL OPPORTUNITIES FUND
Notes to Financial Statements(continued)
October 31, 2019
|
| 5. AGREEMENTS AND AFFILIATED TRANSACTIONS |
A. Management Agreement — Under the Agreement, GSAM manages the Fund, subject to the general supervision of the Trustees.
As compensation for the services rendered pursuant to the Agreement, the assumption of the expenses related thereto and administration of the Fund’s business affairs, including providing facilities, GSAM is entitled to a management fee, accrued daily and paid monthly, equal to an annual percentage rate of the Fund’s average daily net assets.
For the fiscal year ended October 31, 2019, contractual and effective net management fees with GSAM were at the following rates:
| | | | | | | | | | | | | | | | | | | | | | | | | | |
| Contractual Management Rate | | | | | | Effective Net Management Rate^ | |
First $1 Billion | | | Next $1 Billion | | | Next $3 Billion | | | Next $3 Billion | | | Over $8 Billion | | | Effective Rate | |
| | 0.85% | | | | 0.77% | | | | 0.73% | | | | 0.71% | | | | 0.70% | | | | 0.80% | | | | 0.79% | |
| ^ | | Effective Net Management Rate includes the impact of management fee waivers of affiliated underlying funds, if any. |
The Fund invests in Institutional Shares of the Goldman Sachs Financial Square Government Fund, which is an affiliated Underlying Fund. GSAM has agreed to waive a portion of its management fee payable by the Fund in an amount equal to the management fee it earns as an investment adviser to the affiliated Underlying Fund in which the Fund invests, except those management fees it earns from the Fund’s investments of cash collateral received in connection with securities lending transactions in the Goldman Sachs Financial Square Government Fund. For the fiscal year ended October 31, 2019, GSAM waived $142,927 of the Fund’s management fee.
B. Distribution and/or Service(12b-1) Plans — The Trust, on behalf of Class A and Class R Shares of the Fund, has adopted Distribution and Service Plans subject to Rule12b-1 under the Act. Under the Distribution and Service Plans, Goldman Sachs, which serves as distributor (the “Distributor”), is entitled to a fee accrued daily and paid monthly for distribution services and personal and account maintenance services, which may then be paid by Goldman Sachs to authorized dealers. These fees are equal to an annual percentage rate of the average daily net assets attributable to Class A or Class R Shares of the Fund, as applicable, as set forth below.
The Trust, on behalf of Class C Shares of the Fund, has adopted a Distribution Plan subject to Rule12b-1 under the Act. Under the Distribution Plan, Goldman Sachs as Distributor is entitled to a fee accrued daily and paid monthly for distribution services, which may then be paid by Goldman Sachs to authorized dealers. These fees are equal to an annual percentage rate of the average daily net assets attributable to Class C Shares of the Fund, as set forth below.
| | | | | | | | | | | | |
| | | Distribution and/or Service Plan Rates | |
| | Class A* | | | Class C | | | Class R* | |
Distribution and/or Service Plan | | | 0.25 | % | | | 0.75 | % | | | 0.50 | % |
| * | | With respect to Class A and Class R Shares, the Distributor at its discretion may use compensation for distribution services paid under the Distribution Plan to compensate service organizations for personal and account maintenance services and expenses as long as such total compensation does not exceed the maximum cap on “service fees” imposed by the Financial Industry Regulatory Authority. |
C. Distribution Agreement — Goldman Sachs, as Distributor of the shares of the Fund pursuant to a Distribution Agreement, may retain a portion of the Class A Shares’ front end sales charge and Class C Shares’ CDSC. During the fiscal year ended October 31, 2019, Goldman Sachs retained $34,619 of the front end sales charges.
D. Service Plan — The Trust, on behalf of the Fund, has adopted a Service Plan to allow Class C Shares to compensate service organizations (including Goldman Sachs) for providing varying levels of personal and account maintenance services to their customers who are beneficial owners of such shares. The Service Plan provides for compensation to the service organizations equal to an annual percentage rate of 0.25% of the average daily net assets attributable to Class C Shares of the Fund.
24
GOLDMAN SACHS GQG PARTNERS INTERNATIONAL OPPORTUNITIES FUND
|
| 5. AGREEMENTS AND AFFILIATED TRANSACTIONS (continued) |
E. Transfer Agency Agreement — Goldman Sachs also serves as the transfer agent of the Fund for a fee pursuant to the Transfer Agency Agreement. The fees charged for such transfer agency services are accrued daily and paid monthly at annual rates as follows: 0.17% of the average daily net assets of Class A, Class C, Investor and Class R Shares; 0.03% of the average daily net assets of Class P and Class R6 Shares; and 0.04% of the average daily net assets of Institutional Shares. Prior to August 1, 2019 the annual rates were 0.18% of the average daily net assets of Class A, Class C, Investor and Class R Shares.
Goldman Sachs has agreed to waive a portion of its transfer agency fee equal to 0.01% as an annual percentage rate of the average daily net assets attributable to Class P Shares and Class R6 Shares of the Fund. These arrangements will remain in effect through at least February 28, 2020 with respect to Class P Shares and Class R6 Shares, and prior to such date Goldman Sachs may not terminate these arrangements without the approval of the Board of Trustees.
F. Other Expense Agreements and Affiliated Transactions — GSAM has agreed to reduce or limit certain “Other Expenses” of the Fund (excluding acquired fund fees and expenses, transfer agency fees and expenses, taxes, service fees, dividend and interest payments on securities sold short, interest, brokerage fees, expenses of shareholder meetings, litigation and indemnification, and extraordinary expenses) to the extent such expenses exceed, on an annual basis, a percentage rate of the average daily net assets of the Fund. Such Other Expense reimbursements, if any, are accrued daily and paid monthly. In addition, the Fund is not obligated to reimburse GSAM for prior fiscal year expense reimbursements, if any. The Other Expense limitation as an annual percentage rate of average daily net assets for the Fund is 0.014%. The Other Expense limitation will remain in place through at least February 28, 2020 and prior to such date GSAM may not terminate the arrangements without the approval of the Trustees. In addition, the Fund has entered into certain offset arrangements with the transfer agent, which may result in a reduction of the Fund’s expenses and are received irrespective of the application of the “Other Expense” limitation described above.
For the fiscal year ended October 31, 2019, these expense reductions, including any fee waivers and Other Expense reimbursements, were as follows:
| | | | | | | | | | | | | | |
Management Fee Waiver | | | Transfer Agency Waivers/Credits | | | Other Expense Reimbursements | | | Total
Expense Reductions | |
| $ | 142,927 | | | $ | 37,664 | | | $ | 1,271,103 | | | $ | 1,451,694 | |
G. Line of Credit Facility — As of October 31, 2019, the Fund participated in a $580,000,000 committed, unsecured revolving line of credit facility (the “facility”) together with other funds of the Trust and certain registered investment companies having management agreements with GSAM or its affiliates. This facility is to be used for temporary emergency purposes, or to allow for an orderly liquidation of securities to meet redemption requests. The interest rate on borrowings is based on the federal funds rate. The facility also requires a fee to be paid by the Fund based on the amount of the commitment that has not been utilized. For the fiscal year ended October 31, 2019, the Fund did not have any borrowings under the facility. Prior to April 30, 2019 the facility was $770,000,000.
H. Other Transactions with Affiliates — For the fiscal year ended October 31, 2019, Goldman Sachs earned $4,777 in brokerage commissions from portfolio transactions, including futures transactions executed with Goldman Sachs as the Futures Commission Merchant, on behalf of the Fund.
As of October 31, 2019, The Goldman Sachs Group, Inc. was the beneficial owner of 7% of outstanding Class R Shares of the Fund.
The table below shows the transactions in and earnings from investments in the Goldman Sachs Financial Square Government Fund for the fiscal year ended October 31, 2019:
| | | | | | | | | | |
Beginning value as of October 31, 2018 | | Purchases at Cost | | Proceeds from Sales | | Ending Value as of October 31, 2019 | | Shares as of October 31, 2019 | | Dividend Income |
$39,990,504 | | $1,556,095,576 | | $(1,428,396,707) | | $167,689,373 | | 167,689,373 | | $1,962,135 |
25
GOLDMAN SACHS GQG PARTNERS INTERNATIONAL OPPORTUNITIES FUND
Notes to Financial Statements(continued)
October 31, 2019
Pursuant to exemptive relief granted by the Securities and Exchange Commission (“SEC”) and the terms and conditions contained therein, the Fund may lend its securities through a securities lending agent, Goldman Sachs Agency Lending (“GSAL”), a wholly-owned subsidiary of Goldman Sachs, to certain qualified borrowers including Goldman Sachs and affiliates. In accordance with the Fund’s securities lending procedures, the Fund receives cash collateral at least equal to the market value of the securities on loan. The market value of the loaned securities is determined at the close of business of the Fund, at their last sale price or official closing price on the principal exchange or system on which they are traded, and any additional required collateral is delivered to the Fund on the next business day. As with other extensions of credit, the Fund may experience delay in the recovery of its securities or incur a loss should the borrower of the securities breach its agreement with the Fund or become insolvent at a time when the collateral is insufficient to cover the cost of repurchasing securities on loan. Dividend income received from securities on loan may not be subject to withholding taxes and therefore withholding taxes paid may differ from the amounts listed in the Statement of Operations. Loans of securities are terminable at any time and as such 1) the remaining contractual maturities of the outstanding securities lending transactions are considered to be overnight and continuous and 2) the borrower, after notice, is required to return borrowed securities within the standard time period for settlement of securities transactions.
The Fund invests the cash collateral received in connection with securities lending transactions in the Goldman Sachs Financial Square Government Fund (“Government Money Market Fund”), an affiliated series of the Goldman Sachs Trust. The Government Money Market Fund is registered under the Act as an open end investment company, is subject to Rule2a-7 under the Act, and is managed by GSAM, for which GSAM may receive a management fee of up to 0.16% on an annualized basis of the average daily net assets of the Government Money Market Fund.
In the event of a default by a borrower with respect to any loan, GSAL will exercise any and all remedies provided under the applicable borrower agreement to make the Fund whole. These remedies include purchasing replacement securities by applying the collateral held from the defaulting broker against the purchase cost of the replacement securities. If GSAL is unable to purchase replacement securities, GSAL will indemnify the Fund by paying the Fund an amount equal to the market value of the securities loaned minus the value of cash collateral received from the borrower for the loan, subject to an exclusion for any shortfalls resulting from a loss of value in such cash collateral due to reinvestment risk. The Fund’s master netting agreements with certain borrowers provide the right, in the event of a default (including bankruptcy or insolvency), for thenon-defaulting party to liquidate the collateral and calculate net exposure to the defaulting party or request additional collateral. However, in the event of a default by a borrower, a resolution authority could determine that such rights are not enforceable due to the restrictions or prohibitions against the right ofset-off that may be imposed in accordance with a particular jurisdiction’s bankruptcy or insolvency laws. The Fund’s loaned securities were all subject to enforceable Securities Lending Agreements and the value of the collateral was at least equal to the value of the cash received. The amounts of the Fund’s overnight and continuous agreements, which represent the gross amounts of recognized liabilities for securities lending transactions outstanding as of October 31, 2019, are disclosed as “Payable upon return of securities loaned” on the Statement of Assets and Liabilities, where applicable.
Both the Fund and GSAL received compensation relating to the lending of the Fund’s securities. The amounts earned, if any, by the Fund for the fiscal year ended October 31, 2019, are reported under Investment Income on the Statement of Operations.
The table below details securities lending activity with affiliates of Goldman Sachs:
| | | | | | | | | | |
| For the Fiscal Year Ended October 31, 2019 | | | | |
Earnings of GSAL
Relating to
Securities Loaned | | | Amounts Received by the Fund
from Lending to Goldman Sachs | | | Amounts Payable to Goldman Sachs
Upon Return of Securities Loaned as of
October 31, 2019 | |
| $ | 9,450 | | | $ | 8,028 | | | $ | — | |
26
GOLDMAN SACHS GQG PARTNERS INTERNATIONAL OPPORTUNITIES FUND
|
| 6. SECURITIES LENDING (continued) |
The following table provides information about the Fund’s investments in the Government Money Market Fund for the fiscal year ended October 31, 2019.
| | | | | | | | | | | | | | |
Market
Value as of
October 31, 2018 | | | Purchases
at Cost | | | Proceeds
from Sales | | | Market
Value as of
October 31, 2019 | |
| $ | — | | | $ | 401,792,421 | | | $ | (358,857,221 | ) | | $ | 42,935,200 | |
| | |
| 7. PORTFOLIO SECURITIES TRANSACTIONS |
The cost of purchases and proceeds from sales and maturities of long-term securities for the fiscal year ended October 31, 2019, were $3,225,322,660 and $1,260,746,427, respectively.
The tax character of distributions paid during the fiscal year ended October 31, 2019 was as follows:
| | | | |
Distributions paid from: | | | | |
Ordinary income | | $ | 7,000,421 | |
Net long-term capital gains | | | — | |
Total taxable distributions | | $ | 7,000,421 | |
The tax character of distributions paid during the period ended October 31, 2018 was as follows:
| | | | |
Distributions paid from: | | | | |
Ordinary income | | $ | 821,410 | |
Net long-term capital gains | | | — | |
Total taxable distributions | | $ | 821,410 | |
As of October 31, 2019, the components of accumulated earnings (losses) on a tax basis were as follows:
| | | | |
Undistributed ordinary income — net | | $ | 24,970,035 | |
Undistributed long-term capital gains | | | — | |
Total undistributed earnings | | $ | 24,970,035 | |
Capital loss carryforwards: | | | | |
Perpetual Short-Term | | $ | (85,399,946 | ) |
Perpetual Long-Term | | | (6,946,615 | ) |
Unrealized gains (losses) — net | | | 479,388,775 | |
Total accumulated earnings (losses) net | | $ | 412,012,249 | |
As of October 31, 2019, the Fund’s aggregate security unrealized gains and losses based on cost for U.S. federal income tax purposes were as follows:
| | | | |
Tax cost | | $ | 3,338,994,169 | |
Gross unrealized gain | | | 497,865,648 | |
Gross unrealized loss | | | (18,476,873 | ) |
Net unrealized security loss | | $ | 479,388,775 | |
27
GOLDMAN SACHS GQG PARTNERS INTERNATIONAL OPPORTUNITIES FUND
Notes to Financial Statements(continued)
October 31, 2019
|
| 8. TAX INFORMATION (continued) |
The difference between GAAP-basis and tax basis unrealized gains (losses) is attributable primarily to wash sales, net mark to market gains/(losses) on foreign currency contracts, and differences in the tax treatment of passive foreign investment company investments.
GSAM has reviewed the Fund’s tax positions for all open tax years (the current and prior two years, as applicable) and has concluded that no provision for income tax is required in the Fund’s financial statements. Such open tax years remain subject to examination and adjustment by tax authorities.
The Fund’s risks include, but are not limited to, the following:
Derivatives Risk — The Fund’s use of derivatives may result in loss. Derivative instruments, which may pose risks in addition to and greater than those associated with investing directly in securities, currencies or other instruments, may be illiquid or less liquid, volatile, difficult to price and leveraged so that small changes in the value of the underlying instruments may produce disproportionate losses to the Fund. Derivatives are also subject to counterparty risk, which is the risk that the other party in the transaction will not fulfill its contractual obligation. The use of derivatives is a highly specialized activity that involves investment techniques and risks different from those associated with investments in more traditional securities and instruments. Losses from derivatives can also result from a lack of correlation between changes in the value of derivative instruments and the portfolio assets (if any) being hedged.
Foreign and Emerging Countries Risk — Investing in foreign markets may involve special risks and considerations not typically associated with investing in the United States. Foreign securities may be subject to risk of loss because of more or less foreign government regulation, less public information and less economic, political and social stability in the countries in which the Fund invests. The imposition of exchange controls (including repatriation restrictions), confiscation of assets and property, trade restrictions (including tariffs) and other government restrictions by the United States or other governments, or from problems in share registration, settlement or custody, may also result in losses. Foreign risk also involves the risk of negative foreign currency rate fluctuations, which may cause the value of securities denominated in such foreign currency (or other instruments through which the Fund has exposure to foreign currencies) to decline in value. Currency exchange rates may fluctuate significantly over short periods of time. To the extent that the Fund also invests in securities of issuers located in emerging markets, these risks may be more pronounced.
Foreign Custody Risk — If the Fund invests in foreign securities, the Fund may hold such securities and cash with foreign banks, agents, and securities depositories appointed by the Fund’s custodian (each a “Foreign Custodian”). Some foreign custodians may be recently organized or new to the foreign custody business. In some countries, Foreign Custodians may be subject to little or no regulatory oversight over, or independent evaluation of, their operations. Further, the laws of certain countries may place limitations on the Fund’s ability to recover its assets if a Foreign Custodian enters bankruptcy. Investments in emerging markets may be subject to even greater custody risks than investments in more developed markets. Custody services in emerging market countries are very often undeveloped and may be considerably less well regulated than in more developed countries, and thus may not afford the same level of investor protection as would apply in developed countries.
Geographic Risk — If the Fund focuses its investments in securities of issuers located in a particular country or geographic region, the Fund may be subjected, to a greater extent than if its investments were less focused, to the risks of volatile economic cycles and/or conditions and developments that may be particular to that country or region, such as: adverse securities markets; adverse exchange rates; adverse social, political, regulatory, economic, business, environmental or other developments; or natural disasters.
Large Shareholder Transactions Risk —The Fund may experience adverse effects when certain large shareholders, such as other funds, institutional investors (including those trading by use ofnon-discretionary mathematical formulas), financial intermediaries (who may make investment decisions on behalf of underlying clients and/or include the Fund in their investment model), individuals, accounts and Goldman Sachs affiliates, purchase or redeem large amounts of shares of the Fund. Such large
28
GOLDMAN SACHS GQG PARTNERS INTERNATIONAL OPPORTUNITIES FUND
|
| 9. OTHER RISKS (continued) |
shareholder redemptions, which may occur rapidly or unexpectedly, may cause the Fund to sell portfolio securities at times when it would not otherwise do so, which may negatively impact the Fund’s NAV and liquidity. These transactions may also accelerate the realization of taxable income to shareholders if such sales of investments resulted in gains, and may also increase transaction costs. In addition, a large redemption could result in the Fund’s current expenses being allocated over a smaller asset base, leading to an increase in the Fund’s expense ratio. Similarly, large Fund share purchases may adversely affect the Fund’s performance to the extent that the Fund is delayed in investing new cash or otherwise maintains a larger cash position than it ordinarily would.
Investments in Other Investment Companies Risk — As a shareholder of another investment company, including an exchange-traded fund (“ETF”), the Fund will indirectly bear its proportionate share of any net management fees and other expenses paid by such other investment companies, in addition to the fees and expenses regularly borne by the Fund. ETFs are subject to risks that do not apply to conventional mutual funds, including but not limited to the following: (i) the market price of the ETF’s shares may trade at a premium or a discount to their NAV; and (ii) an active trading market for an ETF’s shares may not develop or be maintained.
Liquidity Risk — The Fund may make investments that are illiquid or that may become less liquid in response to market developments or adverse investor perceptions. Illiquid investments may be more difficult to value. Liquidity risk may also refer to the risk that the Fund will not be able to pay redemption proceeds within the allowable time period or without significant dilution to remaining investors’ interests because of unusual market conditions, an unusually high volume of redemption requests, or other reasons. To meet redemption requests, the Fund may be forced to sell investments at an unfavorable time and/or under unfavorable conditions. If a Fund is forced to sell securities at an unfavorable time and/or under unfavorable conditions, such sales may adversely affect the Fund’s NAV and dilute remaining investors’ interests. These risks may be more pronounced in connection with the Fund’s investments in securities of issuers located in emerging market countries. Redemptions by large shareholders may have a negative impact on the Fund’s liquidity.
Market and Credit Risks — In the normal course of business, the Fund trades financial instruments and enters into financial transactions where risk of potential loss exists due to changes in the market (market risk). Additionally, the Fund may also be exposed to credit risk in the event that an issuer or guarantor fails to perform or that an institution or entity with which the Fund has unsettled or open transactions defaults.
Non-Diversification Risk — The Fund isnon-diversified, meaning that it is permitted to invest a larger percentage of its assets in fewer issuers than diversified mutual funds. Thus, the Fund may be more susceptible to adverse developments affecting any single issuer held in its portfolio, and may be more susceptible to greater losses because of these developments.
Under the Trust’s organizational documents, its Trustees, officers, employees and agents are indemnified, to the extent permitted by the Act and state law, against certain liabilities that may arise out of performance of their duties to the Fund. Additionally, in the course of business, the Fund enters into contracts that contain a variety of indemnification clauses. The Fund’s maximum exposure under these arrangements is unknown, as this would involve future claims that may be made against the Fund that have not yet occurred. However, GSAM believes the risk of loss under these arrangements to be remote.
Subsequent events after the Statement of Assets and Liabilities date have been evaluated, and GSAM has concluded that there is no impact requiring adjustment or disclosure in the financial statements.
29
GOLDMAN SACHS GQG PARTNERS INTERNATIONAL OPPORTUNITIES FUND
Notes to Financial Statements(continued)
October 31, 2019
|
| 12. SUMMARY OF SHARE TRANSACTIONS |
Share activity is as follows:
| | | | | | | | | | | | | | | | |
| | | For the Fiscal Year Ended
October 31, 2019 | | | For the Fiscal Year Ended
October 31, 2018 | |
| | | Shares | | | Dollars | | | Shares | | | Dollars | |
| | | | |
| Class A Shares | | | | | | | | | | | | | | | | |
Shares sold | | | 3,794,358 | | | $ | 52,028,621 | | | | 3,879,279 | | | $ | 51,311,140 | |
Reinvestment of distributions | | | 6,959 | | | | 84,001 | | | | — | | | | — | |
Shares redeemed | | | (1,382,650 | ) | | | (18,545,275 | ) | | | (1,127,407 | ) | | | (14,848,690 | ) |
| | | | 2,418,667 | | | | 33,567,347 | | | | 2,751,872 | | | | 36,462,450 | |
| Class C Shares | | | | | | | | | | | | | | | | |
Shares sold | | | 1,241,972 | | | | 16,402,029 | | | | 1,211,964 | | | | 15,889,397 | |
Shares redeemed | | | (649,379 | ) | | | (8,452,959 | ) | | | (582,916 | ) | | | (7,687,403 | ) |
| | | | 592,593 | | | | 7,949,070 | | | | 629,048 | | | | 8,201,994 | |
| Institutional Shares | | | | | | | | | | | | | | | | |
Shares sold | | | 101,757,764 | | | | 1,376,617,331 | | | | 47,829,586 | | | | 634,794,623 | |
Reinvestment of distributions | | | 349,631 | | | | 4,230,532 | | | | 55,896 | | | | 721,621 | |
Shares redeemed | | | (25,403,818 | ) | | | (333,747,882 | ) | | | (21,095,175 | ) | | | (281,335,801 | ) |
| | | | 76,703,577 | | | | 1,047,099,981 | | | | 26,790,307 | | | | 354,180,443 | |
| Investor Shares | | | | | | | | | | | | | | | | |
Shares sold | | | 68,437,677 | | | | 920,488,378 | | | | 17,770,210 | | | | 234,768,975 | |
Reinvestment of distributions | | | 86,130 | | | | 1,040,457 | | | | 7,027 | | | | 90,579 | |
Shares redeemed | | | (13,414,533 | ) | | | (180,244,852 | ) | | | (3,777,143 | ) | | | (49,472,001 | ) |
| | | | 55,109,274 | | | | 741,283,983 | | �� | | 14,000,094 | | | | 185,387,553 | |
| Class P Shares(a) | | | | | | | | | | | | | | | | |
Shares sold | | | 21,036,854 | | | | 278,167,928 | | | | 21,469,251 | | | | 286,501,481 | |
Reinvestment of distributions | | | 127,877 | | | | 1,546,031 | | | | — | | | | — | |
Shares redeemed | | | (7,881,201 | ) | | | (101,512,643 | ) | | | (2,612,637 | ) | | | (32,501,143 | ) |
| | | | 13,283,530 | | | | 178,201,316 | | | | 18,856,614 | | | | 254,000,338 | |
| Class R Shares | | | | | | | | | | | | | | | | |
Shares sold | | | 12,153 | | | | 172,500 | | | | 1,032 | | | | 13,500 | |
Reinvestment of distributions | | | 2 | | | | 19 | | | | — | | | | — | |
Shares redeemed | | | — | | | | — | | | | (363 | ) | | | (4,738 | ) |
| | | | 12,155 | | | | 172,519 | | | | 669 | | | | 8,762 | |
| Class R6 Shares | | | | | | | | | | | | | | | | |
Shares sold | | | 2,306,223 | | | | 33,450,701 | | | | 43,936 | | | | 585,126 | |
Reinvestment of distributions | | | 257 | | | | 3,113 | | | | 2 | | | | 27 | |
Shares redeemed | | | (45,284 | ) | | | (643,063 | ) | | | (1,383 | ) | | | (18,656 | ) |
| | | | 2,261,196 | | | | 32,810,751 | | | | 42,555 | | | | 566,497 | |
| | | | |
NET INCREASE | | | 150,380,992 | | | $ | 2,041,084,967 | | | | 63,071,159 | | | $ | 838,808,037 | |
| (a) | | Commenced operations on April 16, 2018. |
30
Report of Independent Registered Public
Accounting Firm
Tothe Board of Trustees of Goldman Sachs Trust II and Shareholders of
Goldman Sachs GQG Partners International Opportunities Fund
Opinion on the Financial Statements
We have audited the accompanying statement of assets and liabilities, including the schedule of investments, of Goldman Sachs GQG Partners International Opportunities Fund (one of the funds constituting Goldman Sachs Trust II, referred to hereafter as the “Fund”) as of October 31, 2019, the related statement of operations for the year ended October 31, 2019, the statements of changes in net assets for each of the two years in the period ended October 31, 2019, including the related notes,and the financial highlights for each of the periods indicated therein (collectively referred to as the “financial statements”). In our opinion, the financial statements present fairly, in all material respects, the financial position of the Fund as of October 31, 2019, the results of its operations for the year then ended, the changes in its net assets for each of the two years in the period ended October 31, 2019 and the financial highlights for each of the periods indicated therein in conformity with accounting principles generally accepted in the United States of America.
Basis for Opinion
These financial statements are the responsibility of the Fund’s management. Our responsibility is to express an opinion on the Fund’s financial statements based on our audits. We are a public accounting firm registered with the Public Company Accounting Oversight Board (United States) (PCAOB) and are required to be independent with respect to the Fund in accordance with the U.S. federal securities laws and the applicable rules and regulations of the Securities and Exchange Commission and the PCAOB.
We conducted our audits of these financial statements in accordance with the standards of the PCAOB. Those standards require that we plan and perform the audit to obtain reasonable assurance about whether the financial statements are free of material misstatement, whether due to error or fraud.
Our audits included performing procedures to assess the risks of material misstatement of the financial statements, whether due to error or fraud, and performing procedures that respond to those risks. Such procedures included examining, on a test basis, evidence regarding the amounts and disclosures in the financial statements. Our audits also included evaluating the accounting principles used and significant estimates made by management, as well as evaluating the overall presentation of the financial statements. Our procedures included confirmation of securities owned as of October 31, 2019 by correspondence with the custodian, transfer agent and brokers; when replies were not received from brokers, we performed other auditing procedures. We believe that our audits provide a reasonable basis for our opinion.
PricewaterhouseCoopers LLP
Boston, Massachusetts
December 23, 2019
We have served as the auditor of one or more investment companies in the Goldman Sachs fund complex since 2000.
31
GOLDMAN SACHS GQG PARTNERS INTERNATIONAL OPPORTUNITIES FUND
Fund Expenses — Six Month Period Ended October 31, 2019 (Unaudited)
As a shareholder of Class A, Class C, Institutional, Investor, Class P, Class R or Class R6 Shares of the Fund, you incur two types of costs: (1) transaction costs, including sales charges on purchase payments (with respect to Class A Shares) and contingent deferred sales charges on redemptions (with respect to Class C Shares); and (2) ongoing costs, including management fees; distribution and/or service(12b-1) fees (with respect to Class A, Class C and Class R Shares); and other Fund expenses. This example is intended to help you understand your ongoing costs (in dollars) of investing in Class A, Class C, Institutional, Investor, Class P, Class R and Class R6 Shares of the Fund and to compare these costs with the ongoing costs of investing in other mutual funds.
The Example is based on an investment of $1,000 invested at the beginning of the period and held for the entire period from May 1, 2019 through October 31, 2019, which represents a period of 184 days out of 365 day year.
Actual Expenses— The first line in the table below provides information about actual account values and actual expenses. You may use the information in this line, together with the amount you invested, to estimate the expenses that you paid over the period. Simply divide your account value by $1,000 (for example, an $8,600 account value divided by $1,000=8.6), then multiply the result by the number in the first line under the heading entitled “Expenses Paid” to estimate the expenses you paid on your account during this period.
Hypothetical Example for Comparison Purposes— The second line in the table below provides information about hypothetical account values and hypothetical expenses based on the Fund’s actual net expense ratios and an assumed rate of return of 5% per year before expenses, which is not the Fund’s actual return. The hypothetical account values and expenses may not be used to estimate the actual ending account balance or expenses you paid for the period. You may use this information to compare the ongoing costs of investing in the Fund and other funds. To do so, compare this 5% hypothetical example with the 5% hypothetical examples that appear in the shareholder reports of the other funds.
Please note that the expenses shown in the table are meant to highlight your ongoing costs only and do not reflect any transactional costs, such as sales charges, redemption fees, or exchange fees. Therefore, the second line of the table is useful in comparing ongoing costs only, and will not help you determine the relative total costs of owning different funds. In addition, if these transactional costs were included, your costs would have been higher.
| | | | | | | | | | | | |
| Share Class | | Beginning
Account
Value
5/1/19 | | | Ending
Account
Value
10/31/19 | | | Expenses
Paid for the
6 months ended
10/31/19* | |
| Class A | | | | | | | | | | | | |
Actual | | $ | 1,000.00 | | | $ | 1,075.70 | | | $ | 6.38 | |
Hypothetical 5% return | | | 1,000.00 | | | | 1,019.06 | + | | | 6.21 | |
| Class C | | | | | | | | | | | | |
Actual | | | 1,000.00 | | | | 1,071.70 | | | | 10.29 | |
Hypothetical 5% return | | | 1,000.00 | | | | 1,015.27 | + | | | 10.01 | |
| Institutional | | | | | | | | | | | | |
Actual | | | 1,000.00 | | | | 1,077.50 | | | | 4.35 | |
Hypothetical 5% return | | | 1,000.00 | | | | 1,021.02 | + | | | 4.23 | |
| Investor | | | | | | | | | | | | |
Actual | | | 1,000.00 | | | | 1,076.30 | | | | 5.08 | |
Hypothetical 5% return | | | 1,000.00 | | | | 1,020.32 | + | | | 4.94 | |
| Class P | | | | | | | | | | | | |
Actual | | | 1,000.00 | | | | 1,077.60 | | | | 4.24 | |
Hypothetical 5% return | | | 1,000.00 | | | | 1,021.12 | | | | 4.13 | |
| Class R | | | | | | | | | | | | |
Actual | | | 1,000.00 | | | | 1,074.60 | | | | 7.63 | |
Hypothetical 5% return | | | 1,000.00 | | | | 1,017.85 | + | | | 7.43 | |
| Class R6 | | | | | | | | | | | | |
Actual | | | 1,000.00 | | | | 1,077.50 | | | | 4.24 | |
Hypothetical 5% return | | | 1,000.00 | | | | 1,021.12 | + | | | 4.13 | |
| | * | | Expenses for each share class are calculated using the Fund’s annualized net expense ratio for each class, which represents the ongoing expenses as a percentage of net assets for the six months ended October 31, 2019. Expenses are calculated by multiplying the annualized net expense ratio by the average account value for the period; then multiplying the result by the number of days in the most recent fiscal half year; and then dividing that result by the number of days in the fiscal year. The annualized net expense ratios for the period were as follows: |
| | | | | | | | | | | | | | | | | | | | | | | | | | | | |
| Fund | | Class A | | | Class C | | | Institutional | | | Investor | | | Class P | | | Class R | | | Class R6 | |
GQG Partners International Opportunities | | | 1.22 | % | | | 1.97 | % | | | 0.83 | % | | | 0.97 | % | | | 0.87 | % | | | 1.46 | % | | | 0.81 | % |
| | + | | Hypothetical expenses are based on the Fund’s actual annualized net expense ratios and an assumed rate of return of 5% per year before expenses. |
32
GOLDMAN SACHS GQG PARTNERS INTERNATIONAL OPPORTUNITIES FUND
Statement Regarding Basis for Approval of Management Agreement andSub-Advisory Agreement (Unaudited)
Background
The Goldman Sachs GQG Partners International Opportunities Fund (the “Fund”) is an investment portfolio of Goldman Sachs Trust II (the “Trust”). The Board of Trustees oversees the management of the Trust and reviews the investment performance and expenses of the Fund at regularly scheduled meetings held throughout the year. In addition, the Board determines annually whether to approve the continuance of the Trust’s investment management agreement (the “Management Agreement”) with Goldman Sachs Asset Management, L.P. (the “Investment Adviser”) on behalf of the Fund.
The Management Agreement was most recently approved for continuation until August 31, 2020 by the Board, including those Trustees who are not parties to the Management Agreement or “interested persons” (as defined in the Investment Company Act of 1940, as amended) of any party thereto (the “Independent Trustees”), at a meeting held on August6-7, 2019 (the “Annual Meeting”). At the Annual Meeting, the Board also considered thesub-advisory agreement (the“Sub-Advisory Agreement” and, together with the Management Agreement, the “Agreements”) between the Investment Adviser and GQG Partners LLC (the“Sub-Adviser”).
The review process undertaken by the Trustees spans the course of the year and culminates with the Annual Meeting. To assist the Trustees in their deliberations, the Trustees have established a Contract Review Committee (the “Committee”), comprised of the Independent Trustees. The Committee held four meetings over the course of the year since the Management Agreement was last approved. At those Committee meetings, regularly scheduled Board or other committee meetings, and/or the Annual Meeting, matters relevant to the renewal of the Management Agreement and theSub-Advisory Agreement were considered by the Board, or the Independent Trustees, as applicable. With respect to the Fund, such matters included:
| | (a) | | the nature and quality of the advisory, administrative, and other services provided to the Fund by the Investment Adviser and its affiliates and theSub-Adviser, including, as applicable, information about: |
| | (i) | | the structure, staff, and capabilities of the Investment Adviser and theSub-Adviser and theSub-Adviser’s portfolio management team; |
| | (ii) | | the groups within the Investment Adviser and its affiliates that support the portfolio management teams or provide other types of necessary services, including fund services groups (e.g., accounting and financial reporting, tax, shareholder services, and operations); controls and risk management groups (e.g., legal, compliance, valuation oversight, credit risk management, internal audit, compliance testing, market risk analysis, finance, and central funding); sales and distribution support groups, and others (e.g., information technology and training); |
| | (iii) | | trends in employee headcount; |
| | (iv) | | the Investment Adviser’s financial resources and ability to hire and retain talented personnel and strengthen its operations; and |
| | (v) | | the parent company’s support of the Investment Adviser and its mutual fund business, as expressed by the firm’s senior management; |
| | (b) | | information on the investment performance of the Fund, including comparisons to the performance of similar mutual funds, as provided by a third-party mutual fund data provider engaged as part of the contract review process (the “Outside Data Provider”),and a benchmark performance index; and information on general investment outlooks in the markets in which the Fund invests; |
| | (c) | | information provided by the Investment Adviser indicating the Investment Adviser’s views on whether the Fund’s peer group and/or benchmark index had high, medium, or low relevance given the Fund’s particular investment strategy; |
| | (d) | | the terms of the Agreements and other agreements with affiliated service providers entered into by the Trust on behalf of the Fund; |
| | (e) | | fee and expense information for the Fund, including: |
| | (i) | | the relative management fee and expense levels of the Fund as compared to those of comparable funds managed by other advisers, as provided by the Outside Data Provider; |
| | (ii) | | the Fund’s expense trends over time; and |
| | (iii) | | comparative information on the advisory fees charged and services provided by the Investment Adviser to anon-U.S. fund that it manages with comparable investment strategies; |
| | (f) | | with respect to the extensive investment performance and expense comparison data provided by the Outside Data Provider, its processes in producing that data for the Fund; |
| | (g) | | the undertakings of the Investment Adviser and its affiliates to implement fee waivers and/or expense limitations; |
| | (h) | | information relating to the profitability of the Management Agreement and the transfer agency, distribution and service arrangements of the Fund to the Investment Adviser and its affiliates; |
| | (i) | | whether the Fund’s existing management fee schedule adequately addressed any economies of scale; |
33
GOLDMAN SACHS GQG PARTNERS INTERNATIONAL OPPORTUNITIES FUND
Statement Regarding Basis for Approval of Management Agreement andSub-Advisory Agreement (Unaudited) (continued)
| | (j) | | a summary of the“fall-out” benefits derived by the Investment Adviser and its affiliates from their relationships with the Fund, including the fees received by the Investment Adviser’s affiliates from the Fund for transfer agency, securities lending, portfolio trading, distribution and other services; |
| | (k) | | a summary of potential benefits derived by the Fund as a result of its relationship with the Investment Adviser; |
| | (l) | | portfolio manager ownership of Fund sharesand the manner in which portfolio manager compensation is determined; information on theSub-Adviser’s compensation arrangements; and the number and types of accounts managed by the portfolio manager; |
| | (m) | | the nature and quality of the services provided to the Fund by its unaffiliated service providers (as well as theSub-Adviser), and the Investment Adviser’s general oversight and evaluation (including reports on due diligence) of those service providers as part of the services provided under the Management Agreement; and |
| | (n) | | the Investment Adviser’s andSub-Adviser’s processes and policies addressing various types of potential conflicts of interest; their approaches to risk management; the annual review of the effectiveness of the Fund’s compliance program; and periodic compliance reports. |
The Trustees also received an overview of the Fund’s distribution arrangements. They received information regarding the Fund’s assets, share purchase and redemption activity, and payment of distribution and service fees. Information was also provided to the Trustees relating to revenue sharing payments made by and services provided by the Investment Adviser and its affiliates to intermediaries that promote the sale, distribution, and/or servicing of Fund shares. The Trustees also discussed the broad range of other investment choices that are available to Fund investors, including the availability of comparable funds managed by other advisers.
The presentations made at the Board and Committee meetings and at the Annual Meeting encompassed the Fund and other mutual funds for which the Board of Trustees has responsibility. In evaluating the Agreements at the Annual Meeting, the Trustees relied upon their knowledge, resulting from their meetings and other interactions throughout the year, of the Fund and the respective services of the Investment Adviser and its affiliates, and theSub-Adviser. In conjunction with these meetings, the Trustees received written materials and oral presentations on the topics covered, and the Investment Adviser addressed the questions and concerns of the Trustees, including concerns regarding the investment performance of certain of the funds they oversee. In addition, the Trustees periodically received written materials and oral presentations from theSub-Adviser. The Independent Trustees were advised by their independent legal counsel regarding their responsibilities and other regulatory requirements related to the approval and continuation of mutual fund investment management agreements under applicable law. In addition, the Investment Adviser and its affiliates provided the Independent Trustees with a written response to a formal request for information sent on behalf of the Independent Trustees by their independent legal counsel. The Trustees reviewed a written response prepared by theSub-Adviser to a similar request for information submitted to theSub-Adviser by the Investment Adviser. During the course of their deliberations, the Independent Trustees met in executive sessions with their independent legal counsel, without representatives of the Investment Adviser or its affiliates present.
Nature, Extent, and Quality of the Services Provided Under the Management Agreement
As part of their review, the Trustees considered the nature, extent, and quality of the services provided to the Fund by the Investment Adviser. In this regard, the Trustees considered both the investment advisory services andnon-advisory services that are provided by the Investment Adviser and its affiliates. The Trustees noted the ongoing recruitment efforts aimed at bringing high quality investment talent to the Investment Adviser. They also noted the Investment Adviser’s commitment to maintaining high quality systems and expending substantial resources to respond to ongoing changes to the regulatory and control environment in which the Fund and its service providers operate, as well as the efforts of the Investment Adviser and its affiliates to combat cyber security risks. The Trustees concluded that the Investment Adviser continued to commit substantial financial and operational resources to the Fund and expressed confidence that the Investment Adviser would continue to do so in the future. The Trustees also recognized that the Investment Adviser had made significant commitments to address regulatory compliance requirements applicable to the Fund and the Investment Adviser and its affiliates. In addition, the Trustees reviewed theSub-Adviser oversight process that the Investment Adviser had employed, which included areas such as investment analytics, risk management and compliance.
Investment Performance
The Trustees also considered the investment performance of the Fund. In this regard, they compared the investment performance of the Fund to its peers using rankings compiled by the Outside Data Provider, and updated performance information prepared by the Investment Adviser using the peer groups identified by the Outside Data Provider. The Trustees also reviewed the
34
GOLDMAN SACHS GQG PARTNERS INTERNATIONAL OPPORTUNITIES FUND
Statement Regarding Basis for Approval of Management Agreement andSub-Advisory Agreement (Unaudited) (continued)
Fund’s investment performance relative to its performance benchmark. They reviewed the investment performance of the Fund in light of its investment objective and policies and market conditions.
In addition, the Trustees considered materials prepared and presentations made by the Investment Adviser’s senior management and theSub-Adviser’s portfolio management personnel in which Fund performance was assessed. The Trustees also considered the Investment Adviser’s periodic reports with respect to the Fund’s risk profiles, and how the Investment Adviser’s approach to risk monitoring and management influences portfolio management.
The Trustees noted that the Fund’s Institutional Shares had placed in the first quartile of the Fund’s performance peer group for theone- and three-year periods, and had outperformed the Fund’s primary benchmark index for theone-year period ended March 31, 2019.
Costs of Services Provided and Competitive Information
The Trustees considered the contractual terms of the Management Agreement, the fee rates payable by the Fund thereunder, and the net amount retained by the Investment Adviser after payment ofsub-advisory fees. In this regard, the Trustees considered information on the services rendered by the Investment Adviser to the Fund, which included both advisory and administrative services that were directed to the needs and operations of the Fund as a registered mutual fund.
In particular, the Trustees reviewed analyses prepared by the Outside Data Provider regarding the expense rankings of the Fund, as well as additional information provided by the Investment Adviser throughout the year. The analyses provided a comparison of the Fund’s management fee and breakpoints to those of a relevant peer group and category universe; an expense analysis which compared the Fund’s overall net and gross expenses to a peer group and a category universe; and data comparing the Fund’s net expenses to the peer and category medians. The analyses also compared the Fund’s other expenses and fee waivers/reimbursements to those of the peer group and category medians. The Trustees concluded that the comparisons provided by the Outside Data Provider and the Investment Adviser were useful in evaluating the reasonableness of the management fees and total expenses paid by the Fund.
The Trustees considered the Investment Adviser’s undertaking to limit the Fund’s “other expenses” rate (excluding certain expenses) to a specified level. They also considered comparative fee information for services provided by the Investment Adviser to anon-U.S. fund that has investment objectives and policies similar to those of the Fund.
In addition, the Trustees noted that shareholders are able to redeem their Fund shares at any time if shareholders believe that the Fund fees and expenses are too high or if they are dissatisfied with the performance of the Fund.
The Investment Adviser’s Profitability
The Trustees reviewed the Fund’s contribution to the Investment Adviser’s revenues andpre-tax profit margins. In this regard the Trustees noted that they had received, among other things, profitability analyses and summaries, revenue and expense schedules by Fund and by function (i.e., investment management, transfer agency, and distribution and service), and information on the Investment Adviser’s expense allocation methodology. They observed that the profitability and expense figures are substantially similar to those used by the Investment Adviser for many internal purposes, including compensation decisions among various business groups, and are thus subject to a vigorous internal debate about how certain revenue and expenses should be allocated. The Trustees also noted that the internal audit group within the Goldman Sachs organization periodically audits the expense allocation methodology and that the internal audit group was satisfied with the reasonableness, consistency, and accuracy of the Investment Adviser’s expense allocation methodology. Profitability data for the Fund was provided for 2018 and 2017, and the Trustees considered this information in relation to the Investment Adviser’s overall profitability.
Economies of Scale
The Trustees considered the information that had been provided regarding whether there have been economies of scale with respect to the management of the Fund. The Trustees also considered the breakpoints in the fee rate payable under the Management Agreement for the Fund at the following annual percentage rates of the average daily net assets of the Fund:
| | | | |
| Average Daily Net Assets | | Management Fee Annual Rate | |
| |
First $1 billion | | | 0.85 | % |
| |
Next $1 billion | | | 0.77 | |
| |
Next $3 billion | | | 0.73 | |
| |
Next $3 billion | | | 0.71 | |
| |
Over $8 billion | | | 0.70 | |
35
GOLDMAN SACHS GQG PARTNERS INTERNATIONAL OPPORTUNITIES FUND
Statement Regarding Basis for Approval of Management Agreement andSub-Advisory Agreement (Unaudited) (continued)
The Trustees noted that the breakpoints were designed to share potential economies of scale, if any, with the Fund and their shareholders as assets under management reach those asset levels. The Trustees considered the amounts of assets in the Fund; the Fund’s recent share purchase and redemption activity; the information provided by the Investment Adviser relating to the costs of the services provided by the Investment Adviser and its affiliates and their realized profits; information comparing fee rates charged by the Investment Adviser with fee rates charged to other funds in the peer group; and the Investment Adviser’s undertaking to limit certain expenses of the Fund that exceed specified levels. The Trustees also considered the relationship between the advisory andsub-advisory fee rate schedules. Upon reviewing these matters at the Annual Meeting, the Trustees concluded that the fee breakpoints represented a means of assuring that benefits of scalability, if any, would be passed along to shareholders at the specified asset levels. They also noted that the Investment Adviser had passed along savings to shareholders of the Fund, which had asset levels above at least the first breakpoint during the prior fiscal year.
Other Benefits to the Investment Adviser and Its Affiliates
The Trustees also considered the other benefits derived by the Investment Adviser and its affiliates from their relationships with the Fund, including: (a) transfer agency fees received by Goldman Sachs & Co. LLC (“Goldman Sachs”); (b) brokerage and futures commissions earned by Goldman Sachs for executing securities transactions (in its capacity as clearing broker) and futures transactions on behalf of the Fund; (c) fees earned by Goldman Sachs Agency Lending (“GSAL”), an affiliate of the Investment Adviser, as securities lending agent (and fees earned by the Investment Adviser for managing the fund in which the Fund’s cash collateral is invested); (d) the Investment Adviser’s ability to leverage the infrastructure designed to service the Fund on behalf of the Investment Adviser’s other clients; (e) the Investment Adviser’s ability to cross-market other products and services to Fund shareholders; (f) Goldman Sachs’ retention of certain fees as Fund distributor; (g) the Investment Adviser’s ability to negotiate better pricing with the Fund’s custodian on behalf of its other clients, as a result of the relationship with the Fund; and (h) the possibility that the working relationship between the Investment Adviser and the Fund’s third-party service providers (including theSub-Adviser) may cause those service providers to be more likely to do business with other areas of Goldman Sachs. In the course of considering the foregoing, the Independent Trustees requested and received further information quantifying certain of thesefall-out benefits.
Other Benefits to the Fund and Its Shareholders
The Trustees also noted that the Fund receives certain other potential benefits as a result of their relationship with the Investment Adviser, including: (a) trading efficiencies resulting from aggregation of orders of the Fund with those of other funds or accounts managed by the Investment Adviser; (b) enhanced servicing from vendors due to the volume of business generated by the Investment Adviser and its affiliates; (c) the advantages received from the Investment Adviser’s knowledge and experience gained from managing other accounts and products; (d) the Investment Adviser’s ability to hire and retain qualified personnel to provide services to the Fund because of the reputation of the Goldman Sachs organization; (e) the Fund’s access, through the Investment Adviser, to certain firm-wide resources (e.g., proprietary risk management systems and databases), subject to certain restrictions; (f) the Fund’s ability to participate in the securities lending program administered by GSAL, as measured by the revenue received by the Fund in connection with the program; and (g) access to certain affiliated distribution channels.
Conclusion
In connection with their consideration of the Management Agreement, the Trustees gave weight to various factors, but did not identify any particular factor as controlling their decision. After deliberation and consideration of the information provided, including the factors described above, the Trustees, including the Independent Trustees, unanimously concluded, in the exercise of their business judgment, that the investment management fees paid by the Fund were reasonable in light of the factors considered, and that the Management Agreement, and the terms thereof, should be approved and continued with respect to the Fund until August 31, 2020.
Sub-Advisory Agreement with GQG Partners LLC
Nature, Extent, and Quality of the Services Provided Under theSub-Advisory Agreement
In evaluating theSub-Advisory Agreement, the Trustees relied upon materials furnished and presentations made by the Investment Adviser andSub-Adviser. In evaluating the nature, extent, and quality of services provided by theSub-Adviser, the Trustees considered information on the services provided to the Fund by theSub-Adviser, including information about theSub-Adviser’s (a) personnel and compensation structure; (b) track record in managing the Fund and other funds and/or accounts
36
GOLDMAN SACHS GQG PARTNERS INTERNATIONAL OPPORTUNITIES FUND
Statement Regarding Basis for Approval of Management Agreement andSub-Advisory Agreement (Unaudited) (continued)
with investment strategies similar to those employed on behalf of the Fund; (c) policies and procedures in place to address potential conflicts of interest; and (d) compliance program and code of ethics. In this regard, they also considered assessments provided by the Investment Adviser of theSub-Adviser, theSub-Adviser’s investment strategies and personnel, and its compliance program.
Costs of Services Provided
The Trustees reviewed the terms of theSub-Advisory Agreement, including the schedule of fees payable to theSub-Adviser. They considered the breakpoints in thesub-advisory fee rate payable under theSub-Advisory Agreement. The Trustees noted that the compensation paid to theSub-Adviser is paid by the Investment Adviser, not by the Fund. They also considered the expense limitations that substantially reduce the fees retained by the Investment Adviser, and that the retention of theSub-Adviser does not directly increase the fees incurred by the Fund for advisory services. They considered the Investment Adviser’s belief that the relationship between the management fees paid by the Fund and thesub-advisory fees paid by the Investment Adviser is appropriate given the level of services the Investment Adviser provides to the Fund and significant differences in cost drivers and risks associated with the respective services offered by the Investment Adviser and theSub-Adviser.
Conclusion
In connection with their consideration of theSub-Advisory Agreement, the Trustees gave weight to various factors, but did not identify any particular factor as controlling their decision.After deliberation and consideration of the information provided, including the factors described above, the Trustees, including the Independent Trustees, unanimously concluded, in the exercise of their business judgment, that thesub-advisory fees paid by the Investment Adviser to theSub-Adviser were reasonable in light of the factors considered, and that theSub-Advisory Agreement should be approved and continued until August 31, 2020.
37
GOLDMAN SACHS GQG PARTNERS INTERNATIONAL OPPORTUNITIES FUND
Trustees and Officers (Unaudited)
Independent Trustees
| | | | | | | | | | |
Name,
Address and Age1 | | Position(s) Held
with the Trust | | Term of
Office and
Length of
Time Served2 | | Principal Occupation(s)
During Past 5 Years | | Number of
Portfolios in
Fund Complex
Overseen by
Trustee3 | | Other
Directorships
Held by Trustee4 |
| | | | | |
Cheryl K. Beebe Age: 63 | | Chair of the Board of Trustees | | Since 2017 (Trustee since 2015) | | Ms. Beebe is retired. She is Director, Packaging Corporation of America (2008-Present); Director, The Mosaic Company (2019-Present); and was formerly Director, Convergys Corporation (a global leader in customer experience outsourcing) (2015-2018); and Executive Vice President, (2010-2014); and Chief Financial Officer, Ingredion, Inc. (a leading global ingredient solutions company) (2004-2014). Chair of the Board of Trustees — Goldman Sachs Trust II. | | 19 | | Packaging Corporation of America (producer of container board); The Mosaic Company (producer of phosphate and potash fertilizer) |
| | | | | |
Lawrence Hughes Age: 61 | | Trustee | | Since 2016 | | Mr. Hughes is retired. Formerly, he held senior management positions with BNY Mellon Wealth Management, a division of The Bank of New York Mellon Corporation (a financial services company) (1991-2015), most recently as Chief Executive Officer (2010-2015). He serves as Chairman of the Board of Directors, Ellis Memorial and Eldredge House (a not-for-profit organization) (2012-Present). Previously, Mr. Hughes served as an Advisory Board Member of Goldman Sachs Trust II (February 2016-April 2016). Trustee — Goldman Sachs Trust II. | | 19 | | None |
| | | | | |
John F. Killian Age: 64 | | Trustee | | Since 2015 | | Mr. Killian is retired. He is Director, Consolidated Edison, Inc. (2007-Present); Director, Houghton Mifflin Harcourt Publishing Company (2011-Present); and formerly held senior management positions with Verizon Communications, Inc., including Executive Vice President and Chief Financial Officer (2009-2010); and President, Verizon Business, Verizon Communications, Inc. (2005-2009). Trustee — Goldman Sachs Trust II. | | 19 | | Consolidated Edison, Inc. (a utility holding company); Houghton Mifflin Harcourt Publishing Company |
| | | | | |
Steven D. Krichmar Age: 61 | | Trustee | | Since 2018 | | Mr. Krichmar is retired. Formerly, he held senior management and governance positions with Putnam Investments, LLC, a financial services company (2001-2016). He was most recently Chief of Operations and a member of the Operating Committee of Putnam Investments, LLC and Principal Financial Officer of The Putnam Funds. Previously, Mr. Krichmar served as an Audit Partner with PricewaterhouseCoopers LLP and its predecessor company (1990-2001). Trustee — Goldman Sachs Trust II. | | 19 | | None |
| | | | | | | | | | |
38
GOLDMAN SACHS GQG PARTNERS INTERNATIONAL OPPORTUNITIES FUND
Trustees and Officers (Unaudited) (continued)
Interested Trustee*
| | | | | | | | | | |
Name,
Address and Age1 | | Position(s) Held
with the Trust | | Term of
Office and
Length of
Time Served2 | | Principal Occupation(s)
During Past 5 Years | | Number of
Portfolios in
Fund Complex
Overseen by
Trustee3 | | Other
Directorships
Held by Trustee4 |
| | | | | |
| James A. McNamara Age: 57 | | President and Trustee | | Since 2012 | | Advisory Director, Goldman Sachs (January 2018-Present); Managing Director, Goldman Sachs (January 2000-December 2017); Director of Institutional Fund Sales, GSAM (April 1998-December 2000); and Senior Vice President and Manager, Dreyfus Institutional Service Corporation (January 1993-April 1998). President and Trustee — Goldman Sachs Trust II; Goldman Sachs Trust; Goldman Sachs Variable Insurance Trust; Goldman Sachs MLP Income Opportunities Fund; Goldman Sachs MLP and Energy Renaissance Fund; and Goldman Sachs ETF Trust. | | 162 | | None |
| | | | | | | | | | |
| * | | Mr. McNamara is considered to be an “Interested Trustee” because he holds positions with Goldman Sachs and owns securities issued by The Goldman Sachs Group, Inc. He holds comparable positions with certain other companies of which Goldman Sachs, GSAM or an affiliate thereof is the investment adviser, administrator and/or distributor. |
| 1 | | Each Trustee may be contacted by writing to the Trustee, c/o Goldman Sachs, 200 West Street, New York, New York, 10282, Attn: Caroline Kraus. Information is provided as of October 31, 2019. |
| 2 | | Subject to such policies as may be adopted by the Board from time-to-time, each Trustee holds office for an indefinite term, until the earliest of: (a) the election of his or her successor; (b) the date the Trustee resigns or is removed by the Board or shareholders, in accordance with the Trust’s Declaration of Trust; or (c) the termination of the Trust. The Board has adopted policies which provide that (a) no Trustee shall hold office for more than 15 years and (b) a Trustee shall retire as of December 31st of the calendar year in which he or she reaches his or her 74th birthday, unless a waiver of such requirement shall have been adopted by a majority of the other Trustees. These policies may be changed by the Trustees without shareholder vote. |
| 3 | | The Goldman Sachs Fund Complex includes certain other companies listed above for each respective Trustee. As of October 31, 2019, Goldman Sachs Trust II consisted of 19 portfolios (17 of which offered shares to the public); Goldman Sachs Trust consisted of 89 portfolios (88 of which offered shares to the public); Goldman Sachs Variable Insurance Trust consisted of 13 portfolios; Goldman Sachs MLP Income Opportunities Fund and Goldman Sachs MLP and Energy Renaissance Fund each consisted of one portfolio; and Goldman Sachs ETF Trust consisted of 39 portfolios (21 of which offered shares to the public). |
| 4 | | This column includes only directorships of companies required to report to the Securities and Exchange Commission under the Securities Exchange Act of 1934 (i.e., “public companies”) or other investment companies registered under the Act. |
Additional information about the Trustees is available in the Fund’s Statement of Additional Information, which can be obtained from Goldman Sachs free of charge by calling this toll-free number (in the United States of America): 1-800-526-7384.
39
GOLDMAN SACHS GQG PARTNERS INTERNATIONAL OPPORTUNITIES FUND
Trustees and Officers (Unaudited) (continued)
Officers of the Trust*
| | | | | | |
| Name, Address and Age1 | | Position(s) Held
with the Trust | | Term of
Office and
Length of
Time Served2 | | Principal Occupation(s) During Past 5 Years |
| | | |
James A. McNamara 200 West Street New York, NY 10282 Age: 57 | | Trustee and President | | Since 2012 | | Advisory Director, Goldman Sachs (January 2018-Present); Managing Director, Goldman Sachs (January 2000-December 2017); Director of Institutional Fund Sales, GSAM (April 1998-December 2000); and Senior Vice President and Manager, Dreyfus Institutional Service Corporation (January 1993-April 1998). President and Trustee — Goldman Sachs Trust II; Goldman Sachs Trust; Goldman Sachs Variable Insurance Trust; Goldman Sachs MLP Income Opportunities Fund; Goldman Sachs MLP and Energy Renaissance Fund; and Goldman Sachs ETF Trust. |
| | | |
Caroline L. Kraus 200 West Street New York, NY 10282 Age: 42 | | Secretary | | Since 2012 | | Managing Director, Goldman Sachs (January 2016-Present); Vice President, Goldman Sachs (August 2006-December 2015); Associate General Counsel, Goldman Sachs (2012-Present); Assistant General Counsel, Goldman Sachs (August 2006-December 2011); and Associate, Weil, Gotshal & Manges, LLP (2002-2006). Secretary — Goldman Sachs Trust II; Goldman Sachs Trust (previously Assistant Secretary (2012)); Goldman Sachs Variable Insurance Trust (previously Assistant Secretary (2012)); Goldman Sachs BDC, Inc.; Goldman Sachs Private Middle Market Credit LLC; Goldman Sachs Middle Market Lending Corp.; Goldman Sachs MLP Income Opportunities Fund; Goldman Sachs MLP and Energy Renaissance Fund; and Goldman Sachs ETF Trust. |
| | | |
Joseph F. DiMaria 30 Hudson Street Jersey City, NJ 07302 Age: 51 | | Treasurer, Principal Financial Officer and Principal Accounting Officer | | Since 2017 (Treasurer and Principal Financial Officer Since 2019) | | Managing Director, Goldman Sachs (November 2015-Present) and Vice President — Mutual Fund Administration, Columbia Management Investment Advisers, LLC (May 2010-October 2015). Treasurer, Principal Financial Officer and Principal Accounting Officer — Goldman Sachs Trust II (previously Assistant Treasurer (2017)); Goldman Sachs Trust (previously Assistant Treasurer (2016)); Goldman Sachs Variable Insurance Trust (previously Assistant Treasurer (2016)); Goldman Sachs MLP Income Opportunities Fund (previously Assistant Treasurer (2017)); Goldman Sachs MLP and Energy Renaissance Fund (previously Assistant Treasurer (2017)); and Goldman Sachs ETF Trust (previously Assistant Treasurer (2017)). |
| | | | | | |
| * | | Represents a partial list of officers of the Trust. Additional information about all the officers is available in the Fund’s Statement of Additional Information, which can be obtained from Goldman Sachs free of charge by calling this toll-free number (in the United States): 1-800-526-7384. |
| 1 | | Information is provided as of October 31, 2019. |
| 2 | | Officers hold office at the pleasure of the Board of Trustees or until their successors are duly elected and qualified. Each officer holds comparable positions with certain other companies of which Goldman Sachs, GSAM or an affiliate thereof is the investment adviser, administrator and/or distributor. |
Goldman Sachs GQG Partners International Opportunities Fund — Tax Information (Unaudited)
For the year ended October 31, 2019, 8.98% of the dividends paid from net investment company taxable income by the Goldman Sachs GQG Partners International Opportunities Fundqualify for the dividends received deduction available to corporations.
For the year ended October 31, 2019, 100% of the dividends paid from net investment company taxable income by the GQG Partners International Opportunities Fund qualify for the reduced tax rate under the Jobs and Growth Tax Relief and Reconciliation Act of 2003.
From distributions paid during the year ended October 31, 2019, the total amount of income received by the Goldman Sachs GQG Partners International Opportunities Fund from sources within foreign countries and possessions of the United States was $0.0783 per share, all of which is attributable to qualified passive income. The percentage of net investment income dividends paid from foreign sources by the Goldman Sachs GQG Partners International Opportunities Fund was 95.26%. The total amount of taxes paid by the Goldman Sachs GQG Partners International Opportunities Fund to such countries was $0.0135 per share.
40
FUNDS PROFILE
Goldman Sachs Funds
Goldman Sachs is a premier financial services firm, known since 1869 for creating thoughtful and customized investment solutions in complex global markets.
Today, theConsumer and Investment Management Division of Goldman Sachs serves a diverse set of clients worldwide, including private institutions, public entities and individuals. With approximately $1.60 trillion in assets under supervision as of September 30, 2019, Goldman Sachs Asset Management (“GSAM”) has portfolio management teams located around the world and our investment professionals bring firsthand knowledge of local markets to every investment decision. Assets under supervision includes assets under management and other client assets for which Goldman Sachs does not have full discretion. GSAM leverages the resources of Goldman Sachs & Co. LLC subject to legal, internal and regulatory restrictions.
Money Market
Financial Square FundsSM
| ∎ | | Financial Square Treasury Solutions Fund1 |
| ∎ | | Financial Square Government Fund1 |
| ∎ | | Financial Square Money Market Fund2 |
| ∎ | | Financial Square Prime Obligations Fund2 |
| ∎ | | Financial Square Treasury Instruments Fund1 |
| ∎ | | Financial Square Treasury Obligations Fund1 |
| ∎ | | Financial Square Federal Instruments Fund1 |
Investor FundsSM
| ∎ | | Investor Money Market Fund3 |
| ∎ | | Investor Tax-Exempt Money Market Fund3 |
Fixed Income
Short Duration and Government
| ∎ | | High Quality Floating Rate Fund |
| ∎ | | Short-Term Conservative Income Fund |
| ∎ | | Short Duration Government Fund |
| ∎ | | Short Duration Income Fund |
| ∎ | | Inflation Protected Securities Fund |
Multi-Sector
Municipal and Tax-Free
| ∎ | | High Yield Municipal Fund |
| ∎ | | Dynamic Municipal Income Fund |
| ∎ | | Municipal Income Completion Fund |
| ∎ | | Short Duration Tax-Free Fund |
Single Sector
| ∎ | | Investment Grade Credit Fund |
| ∎ | | High Yield Floating Rate Fund |
| ∎ | | Emerging Markets Debt Fund |
| ∎ | | Local Emerging Markets Debt Fund |
Fixed Income Alternatives
| ∎ | | Long Short Credit Strategies Fund |
Fundamental Equity
| ∎ | | Small/Mid Cap Value Fund |
| ∎ | | Small/Mid Cap Growth Fund |
| ∎ | | Concentrated Growth Fund |
| ∎ | | Technology Opportunities Fund |
| ∎ | | Growth Opportunities Fund |
| ∎ | | Rising Dividend Growth Fund |
Tax-Advantaged Equity
| ∎ | | U.S. Tax-Managed Equity Fund |
| ∎ | | International Tax-Managed Equity Fund |
| ∎ | | U.S. Equity Dividend and Premium Fund |
| ∎ | | International Equity Dividend and Premium Fund |
Equity Insights
| ∎ | | Small Cap Equity Insights Fund |
| ∎ | | U.S. Equity Insights Fund |
| ∎ | | Small Cap Growth Insights Fund |
| ∎ | | Large Cap Growth Insights Fund |
| ∎ | | Large Cap Value Insights Fund |
| ∎ | | Small Cap Value Insights Fund |
| ∎ | | International Small Cap Insights Fund |
| ∎ | | International Equity Insights Fund |
| ∎ | | Emerging Markets Equity Insights Fund |
Fundamental Equity International
| ∎ | | International Equity Income Fund |
| ∎ | | International Equity ESG Fund |
| ∎ | | Emerging Markets Equity Fund |
| ∎ | | Imprint Emerging Markets Opportunities Fund5 |
| ∎ | | ESG Emerging Markets Equity Fund |
Alternative
| ∎ | | Real Estate Securities Fund |
| ∎ | | International Real Estate Securities Fund |
| ∎ | | Commodity Strategy Fund |
| ∎ | | Global Real Estate Securities Fund |
| ∎ | | Alternative Premia Fund |
| ∎ | | Absolute Return Tracker Fund |
| ∎ | | Managed Futures Strategy Fund |
| ∎ | | MLP Energy Infrastructure Fund |
| ∎ | | Multi-Manager Alternatives Fund |
| ∎ | | Global Infrastructure Fund |
Total Portfolio Solutions
| ∎ | | Global Managed Beta Fund |
| ∎ | | Multi-Manager Non-Core Fixed Income Fund |
| ∎ | | Multi-Manager U.S. Dynamic Equity Fund |
| ∎ | | Multi-Manager Global Equity Fund |
| ∎ | | Multi-Manager International Equity Fund |
| ∎ | | Tactical Tilt Overlay Fund |
| ∎ | | Balanced Strategy Portfolio |
| ∎ | | Multi-Manager U.S. Small Cap Equity Fund |
| ∎ | | Multi-Manager Real Assets Strategy Fund |
| ∎ | | Growth and Income Strategy Portfolio |
| ∎ | | Growth Strategy Portfolio |
| ∎ | | Dynamic Global Equity Fund6 |
| ∎ | | Satellite Strategies Portfolio |
| ∎ | | Enhanced Dividend Global Equity Portfolio |
| ∎ | | Tax-Advantaged Global Equity Portfolio |
| ∎ | | Strategic Factor Allocation Fund |
| ∎ | | Target Date 2020 Portfolio |
| ∎ | | Target Date 2025 Portfolio |
| ∎ | | Target Date 2030 Portfolio |
| ∎ | | Target Date 2035 Portfolio |
| ∎ | | Target Date 2040 Portfolio |
| ∎ | | Target Date 2045 Portfolio |
| ∎ | | Target Date 2050 Portfolio |
| ∎ | | Target Date 2055 Portfolio |
| ∎ | | Target Date 2060 Portfolio |
| ∎ | | GQG Partners International Opportunities Fund |
| 1 | | You could lose money by investing in the Fund. Although the Fund seeks to preserve the value of your investment at $1.00 per share, it cannot guarantee it will do so. An investment in the Fund is not a deposit of a bank and is not insured or guaranteed by the Federal Deposit Insurance Corporation or any other government agency. The Fund’s sponsor has no legal obligation to provide financial support to the Fund, and you should not expect that the sponsor will provide financial support to the Fund at any time. |
| 2 | | You could lose money by investing in the Fund. Because the share price of the Fund will fluctuate, when you sell your shares they may be worth more or less than what you originally paid for them. The Fund may impose a fee upon sale of your shares or may temporarily suspend your ability to sell shares if the Fund’s liquidity falls below required minimums because of market conditions or other factors. An investment in the Fund is not a deposit of a bank and is not insured or guaranteed by the Federal Deposit Insurance Corporation or any other government agency. The Fund’s sponsor has no legal obligation to provide financial support to the Fund, and you should not expect that the sponsor will provide financial support to the Fund at any time. |
| 3 | | You could lose money by investing in the Fund. Although the Fund seeks to preserve the value of your investment at $1.00 per share, it cannot guarantee it will do so. The Fund may impose a fee upon sale of your shares or may temporarily suspend your ability to sell shares if the Fund’s liquidity falls below required minimums because of market conditions or other factors. An investment in the Fund is not a deposit of a bank and is not insured or guaranteed by the Federal Deposit Insurance Corporation or any other government agency. The Fund’s sponsor has no legal obligation to provide financial support to the Fund, and you should not expect that the sponsor will provide financial support to the Fund at any time. |
| 4 | | Effective after the close of business on November 20, 2019, the Goldman Sachs Asia Equity Fund was renamed the Goldman Sachs China Equity Fund. |
| 5 | | Effective after the close of business on August 30, 2019, the Goldman Sachs N-11 Equity Fund was renamed the Goldman Sachs Imprint Emerging Markets Opportunities Fund. |
| 6Effective | | after the close of business on February 28, 2019, the Goldman Sachs Equity Growth Strategy Portfolio was renamed the Goldman Sachs Dynamic Global Equity Fund. |
| * | | This list covers open-end funds only. Please visit our website at www.GSAMFUNDS.com to learn about our closed-end funds and exchange-traded funds. |
| | |
TRUSTEES Cheryl K. Beebe,Chair Lawrence Hughes John F. Killian Steven D. Krichmar James A. McNamara | | OFFICERS James A. McNamara,President Joseph F. DiMaria,Principal Financial Officer, Principal Accounting Officer and Treasurer Caroline L. Kraus,Secretary |
| |
GOLDMAN SACHS & CO. LLC Distributor and Transfer Agent | | GOLDMAN SACHS ASSET MANAGEMENT L.P. Investment Adviser |
Visit our website atwww.GSAMFUNDS.com to obtain the most recent month-end returns.
Goldman Sachs Asset Management, L.P., 200 West Street, New York, New York 10282
The reports concerning the Fund included in this shareholder report may contain certain forward-looking statements about the factors that may affect the performance of the Fund in the future. These statements are based on Fund management’s predictions and expectations concerning certain future events and their expected impact on the Fund, such as performance of the economy as a whole and of specific industry sectors, changes in the levels of interest rates, the impact of developing world events, and other factors that may influence the future performance of the Fund. Management believes these forward-looking statements to be reasonable, although they are inherently uncertain and difficult to predict. Actual events may cause adjustments in portfolio management strategies from those currently expected to be employed.
A description of the policies and procedures that the Fund uses to determine how to vote proxies relating to portfolio securities and information regarding how the Fund voted proxies relating to portfolio securities during the most recent 12-month period ended June 30 is available (i) without charge, upon request by calling 1-800-526-7384 (for Retail Shareholders) or 1-800-621-2550 (for Institutional Shareholders); and (ii) on the Securities and Exchange Commission (the “SEC”) web site at http://www.sec.gov.
The Fund will file its portfolio holdings for each month in a fiscal quarter within 60 days after the end of the relevant fiscal quarter on Form N-PORT. Portfolio holdings information for the third month of each fiscal quarter will be made available on the SEC’s web site at http://www.sec.gov. Portfolio holdings information may be obtained upon request and without charge by calling 1-800-526-7384 (for Retail Shareholders) or 1-800-621-2550 (for Institutional Shareholders).
Holdings and allocations shown are as of October 31, 2019 and may not be representative of future investments. Fund holdings should not be relied on in making investment decisions and should not be construed as research or investment advice regarding particular securities. Current and future holdings are subject to risk.
Economic and market forecasts presented herein reflect our judgment as of the date of this presentation and are subject to change without notice. These forecasts do not take into account the specific investment objectives, restrictions, tax and financial situation or other needs of any specific client. Actual data will vary and may not be reflected here. These forecasts are subject to high levels of uncertainty that may affect actual performance. Accordingly, these forecasts should be viewed as merely representative of a broad range of possible outcomes. These forecasts are estimated, based on assumptions, and are subject to significant revision and may change materially as economic and market conditions change. Goldman Sachs has no obligation to provide updates or changes to these forecasts. Case studies and examples are for illustrative purposes only.
The Global Industry Classification Standard (GICS) was developed by and is the exclusive property and a service mark of Morgan Stanley Capital International Inc. (MSCI) and Standard & Poor’s, a division of The McGraw-Hill Companies, Inc. (S&P) and is licensed for use by Goldman Sachs. Neither MSCI, S&P nor any other party involved in making or compiling the GICS or any GICS classifications makes any express or implied warranties or representations with respect to such standard or classification (or the results to be obtained by the use thereof), and all such parties hereby expressly disclaim all warranties of originality, accuracy, completeness, merchantability or fitness for a particular purpose with respect to any of such standard or classification. Without limiting any of the foregoing, in no event shall MSCI, S&P, any of their affiliates or any third party involved in making or compiling the GICS or any GICS classifications have any liability for any direct, indirect, special, punitive, consequential or any other damages (including lost profits) even if notified of the possibility of such damages.
The portfolio risk management process includes an effort to monitor and manage risk, but does not imply low risk.
This material is not authorized for distribution to prospective investors unless preceded or accompanied by a current Prospectus or summary prospectus, if applicable. Investors should consider the Fund’s objective, risks, and charges and expenses, and read the summary prospectus, if available, and/or the Prospectus carefully before investing or sending money. The summary prospectus, if available, and the Prospectus contain this and other information about the Fund and may be obtained from your authorized dealer or from Goldman Sachs & Co. LLC by calling (retail – 1-800-526-7384) (institutional – 1-800-621-2550).
© 2019 Goldman Sachs. All rights reserved. 187255-OTU-1103585 GQGPIOAR-19
Goldman Sachs Funds

| | | | |
| | |
| Annual Report | | | | October 31, 2019 |
| | |
| | | | Multi-Manager Alternatives Fund |
It is our intention that beginning on January 1, 2021, paper copies of the Fund’s annual and semi-annual shareholder reports will no longer be sent by mail, unless you specifically request paper copies of the reports from the Fund or from your financial intermediary. Instead, the reports will be made available on a website, and you will be notified by mail each time a report is posted and provided with a website link to access the report.
If you already elected to receive shareholder reports electronically, you will not be affected by this change and you need not take any action. At any time, you may elect to receive reports and certain communications from a Fund electronically by calling the applicable toll-free number below or by contacting your financial intermediary.
You may elect to receive all future shareholder reports in paper free of charge. If you hold shares of the Fund directly with the Fund’s transfer agent, you can inform the transfer agent that you wish to receive paper copies of reports by calling toll-free800-621-2550 for Institutional, Class R6 and Class P shareholders or800-526-7384 for all other shareholders. If you hold shares of the Fund through a financial intermediary, please contact your financial intermediary to make this election. Your election to receive reports in paper will apply to all Goldman Sachs Funds held in your account if you invest through your financial intermediary or all Goldman Sachs Funds held with the Funds’ transfer agent if you invest directly with the transfer agent.

Goldman Sachs Multi-Manager Alternatives Fund
| | | | |
| | | |
| NOT FDIC-INSURED | | May Lose Value | | No Bank Guarantee |
GOLDMAN SACHS MULTI-MANAGER ALTERNATIVES FUND
What Differentiates Goldman Sachs Multi-Manager Alternatives Fund Investment Process?
The Goldman Sachs Multi-Manager Alternatives Fund seeks long-term growth of capital by allocating its assets to underlying managers who employ a range of alternative and non-traditional investment strategies. The Fund benefits from the dedicated expertise of GSAM’s alternative investment team that has a legacy dating back to 19691 and is located in 8 offices globally.2

| ∎ | | We have over 100 alternative investment professionals2dedicated to manager selection |
| ∎ | | We employ a rigorous due diligence process to evaluate each manager’s skill, strategy, and team and continually monitor managers after an investment is made |
| ∎ | | Our Investment Committee process includes an independent “Devil’s advocate” to promote fluid debate and intense examination of each manager |

| ∎ | | We combine “top down” market and economic environment considerations with “bottom up” manager-specific factors |
| ∎ | | We incorporate judgment and quantitative tools to determine the appropriate investment size in each manager |
| ∎ | | The process is continual with ongoing re-balancing and active management to optimize diversification |

| ∎ | | We have over 60 professionals2focused on alternative investment risk management and operational diligence |
| ∎ | | We consider risk management an all-encompassing and real time discipline |
| ∎ | | Our dedicated strategists leverage our proprietary risk management systems to continually monitor risk |
| 1In | | June 1997, The Goldman Sachs Group, Inc. (GSG, Inc.) acquired the assets and business of Commodities Corporation, which GSG, Inc. subsequently renamed Goldman Sachs Hedge Fund Strategies LLC in December 2004. |
| 2As | | of September 30, 2019. |
| The | | portfolio risk management process includes an effort to monitor and manage risk, but does not imply low risk. Diversification does not protect an investor from market risk and does not ensure a profit. |
1
PORTFOLIO RESULTS
Goldman Sachs Multi-Manager Alternatives Fund
Investment Objective
The Fund seeks long-term growth of capital.
Portfolio Management Discussion and Analysis
Below, the Goldman Sachs Alternative Investments & Manager Selection (“AIMS”) Group discusses the Goldman Sachs Multi-Manager Alternatives Fund’s (the “Fund”) performance and positioning for the12-month period ended October 31, 2019 (the “Reporting Period”).
| Q | | How did the Fund perform during the Reporting Period? |
| A | | During the Reporting Period, the Fund’s Class A, Class C, Institutional, Investor, Class P, Class R and Class R6 Shares generated average annual total returns, without sales charges, of 5.75%, 4.98%, 6.20%, 6.02%, 6.20%, 5.60% and 6.19%, respectively. These returns compare to the 2.40% average annual total return of the Fund’s primary benchmark, the ICE BofAML Three-Month U.S. Treasury Bill Index (the “ICE BofAML Index”), which reflects no deductions for fees or expenses, during the same time period. The HFRX Global Hedge Fund Index (the “HFRX Index”) (net of management, administrative and performance/incentive fees), a broad proxy for hedge fund performance and the Fund’s secondary benchmark, returned 3.53% during the Reporting Period. |
| | | References to the Fund’s benchmarks mentioned herein are for informational purposes only, and unless otherwise noted, are not an indication of how the Fund is managed. The use of the ICE BofAML Index as the Fund’s benchmark does not imply the Fund is being managed like cash and does not imply low risk or low volatility. |
| Q | | What economic and market factors most influenced the financial markets as a whole during the Reporting Period? |
| A | | During the Reporting Period, the capital markets experienced mixed results, as global economic growth concerns and trade war uncertainty led to sustained market volatility. |
| | | The first half of the Reporting Period was characterized by a challenging 2018year-end followed by a remarkably strong rally during the first four months of 2019. Global equities fell significantly in November and December 2018, as investors’ hopes for a trade reconciliation between the U.S. and China were dashed.Risk-off market sentiment, or reduced risk appetite, increased, and U.S. Treasury yields began a downward slide that endured for most of the Reporting Period. In January 2019, global equities rebounded from their losses, jumpstarted by a more accommodative tone from U.S. Federal Reserve (“Fed”) Chair Jerome Powell, who cited the need for a patient approach toward future interest rate changes given the continued economic slowdown in China and softening U.S. economic data. In March 2019, amid ongoing U.S.-China trade tensions and in response to the stock market volatility at 2018year-end, the Fed announced its intention to hold interest rates steady through the conclusion of the 2019 calendar year. Meanwhile, monetary policy easing by central banks in Europe and China further supported global equities, which experienced their strongest first calendar quarter rally in more than two decades. However, despite the global equity rally, the weakening global economy, which was exacerbated by unpredictable trade rhetoric between the U.S. and China, stayed top of mind for investors. In March 2019, these concerns drove yields on German and Japanese10-year government bonds into negative territory. |
| | | During the second half of the Reporting Period, global equity markets generally traded sideways and remained heavily influenced by trade disputes and global central bank policies. (When a market trades sideways, it generally moves within a fairly stable range without forming any distinct trends over a period of time.) Global equities began May 2019 nearall-time highs before sharply declining during the month, as a breakdown in U.S. and China trade negotiations led to fresh U.S. tariffs on Chinese imports. For much of the spring and summer, investor sentiment whipsawed as the U.S. and China swapped tariff threats and company-specific blacklists. Meanwhile, the Fed shifted its monetary policy stance, deciding to cut short-term interest rates by 25 basis points in July 2019 — its first interest rate cut in more than a decade. (A basis point is 1/100th of a percentage point.) Further 25 basis point reductions followed in September and |
2
PORTFOLIO RESULTS
| | October 2019. The Fed’s concern about declining economic growth and its accommodative monetary policy stance was reiterated by European Central Bank President Mario Draghi, who unveiled a new quantitative easing plan for the European Union just as his term ended on October 31st. In October 2019, the European Union remained front and center, as it approved another delay in Brexit (or the U.K.’s departure from the European Union) beyond the originally scheduled October 31st deadline. For the Reporting Period overall, global equities (as represented by the MSCI All Country World Index Investable Market Index) were up more than 12%, driven by positive performance across all major regions. From a sector perspective, cyclical stocks and information technology stocks were notable performers. Energy was the only sector that posted a negative absolute return for the Reporting Period. |
| | | Credit markets broadly sold off during the first two months of the Reporting Period. Thesell-off was driven byrisk-off investor sentiment and a flight to quality through November and December 2018 as well as by significant market volatility due in part to the partial U.S. federal government shutdown, investor uncertainty around the Fed’s monetary policy, tumultuous U.S.-China trade relations and uncertain global economic growth. At the beginning of 2019, however, investor sentiment improved in light of seemingly positive developments in U.S.-China trade talks as well as data indicative of ongoing solid U.S. economic growth and a more dovish Fed. (Dovish tends to suggest lower interest rates; opposite of hawkish.) Investment grade corporate bonds outperformed nearly all other major fixed income sectors during the first 10 months of 2019, surpassing high yield corporate bonds midway through the calendar year as the longer duration profile of investment grade corporate bonds benefited from a significant rally in interest rates and tightening credit spreads (or yield differentials between corporate bonds and U.S. Treasury securities of comparable maturity). Emerging markets debt rallied, as investor optimism around U.S.-China trade negotiations persisted, with U.S. dollar-denominated emerging markets debt outpacing local currency emerging markets debt. |
| Q | | What key factors were responsible for the Fund’s performance during the Reporting Period? |
| A | | The Fund generally seeks to achieve its investment objective by allocating its assets among multiple unaffiliated investment managers (“Underlying Managers”) that employ one or morenon-traditional and alternative investment strategies. The AIMS Group is responsible for making recommendations with respect to hiring, terminating or replacing the Fund’s Underlying Managers as well as for determining the Fund’s asset allocations. The AIMS Group applies a multifaceted process with respect to manager due diligence, portfolio construction and risk management. |
| | | During the Reporting Period, the Fund’s performance can be attributed to the performance of the Fund’s Underlying Managers. |
| | | At various points during the Reporting Period, the Fund had capital allocated to 16 Underlying Managers — Acadian Asset Management LLC (“Acadian”); ADG Capital Management LLP (“ADG”); Algert Global LLC (“Algert”); Ares Capital Management II LLC (“Ares”); Artisan Partners LP (“Artisan”); Bardin Hill Arbitrage IC Management LP (“Bardin Hill”); Brigade Capital Management, LP (“Brigade”); Crabel Capital Management, LLC (“Crabel”); Emso Asset Management Limited (“Emso”); First Pacific Advisors, LP (“FPA”); GQG Partners LLC (“GQG Partners”); One River Asset Management, LLC (“One River”); QMS Capital Management LP (“QMS”); River Canyon Fund Management LLC (“River Canyon”); Sirios Capital Management, L.P. (“Sirios”); and Wellington Management Company LLC (“Wellington”). |
| | | These 16 Underlying Managers represented five strategies — equity long/short (FPA, Sirios and Wellington); event driven and credit (Ares, Bardin Hill, Brigade and River Canyon); tactical trading (ADG, Crabel, Emso, One River and QMS); relative value (Acadian and Algert); and dynamic equity (Artisan and GQG Partners). |
| | | Of the 16 Underlying Managers with allocated capital during the Reporting Period, 11 generated positive absolute returns and five generated negative absolute returns. |
| | | In addition, during the Reporting Period, the Fund allocated assets to Russell Investments Commodity Advisor, LLC (“RICA”). RICA manages a beta completion mandate for the Fund, which provides us with an additional tool to manage the beta of the Fund and is not used to override any views and/or decisions of the Fund’s Underlying Managers. (Beta is a measure of the sensitivity of a portfolio’s returns to broad market returns.) During the Reporting Period, RICA detracted from the Fund’s performance. |
| Q | | Which strategies most significantly affected Fund performance? |
| A | | Of the five strategies employed across the Underlying Managers during the Reporting Period, four generated positive returns and one generated a negative return. The |
3
PORTFOLIO RESULTS
| | Fund did not have an allocation to the opportunistic fixed income strategy during the Reporting Period. |
| A | | The Fund’s dynamic equity strategy added the most to performance, driven by gains in the financials, communication services and materials sectors. Notable individual contributors were U.S.-based payment processor Mastercard, German software company SAP and U.K. stock exchange London Stock Exchange Group. On a regional basis, the dynamic equity strategy benefited from its exposures to North America and Europe. Dynamic equity strategies generally involve investing in equity instruments, often with a long-term view, and may have low excess return correlations to traditional long-only equity strategies. Dynamic equity strategies are less likely to track a benchmark than traditional long-only strategies, and dynamic equity managers are less constrained than traditional long-only managers with respect to factors such as position concentration, sector and country weights, style and market capitalization. |
| | | The equity long/short strategy further bolstered the Fund’s performance, led by the Underlying Managers’ positions in the information technology, financials and industrials sectors. Leading individual contributors were Airbus, a Netherlands-based aeronautics company; BJ’s Wholesale Club, a U.S. warehouse club chain; General Mills, a U.S. food company; and SunTrust Banks, a U.S. bank holding company. The equity long/short strategy’s gains were offset slightly by the Underlying Managers’ hedging losses as well as by leading individual detractors, such as Affiliated Managers Group, a U.S. investment management firm, and General Dynamics, a U.S. aerospace and defense contractor. Equity long/short strategies generally involve long and short investing, based on fundamental evaluations, research and various analytical measurements, in equity and equity-related investments. Equity long/short managers may, for example, buy stocks they expect to outperform or they believe are undervalued, and may also sell short stocks they believe will underperform or they believe are overvalued. Long positions benefit from an increase in the price of the underlying instrument or asset class, while short positions benefit from a decrease in that price. |
| | | The event driven and credit strategy overall contributed positively during the Reporting Period. Within merger arbitrage strategies, which involve taking long and/or short positions in securities affected by a corporate merger or acquisition, the Fund was helped by select positions in the communication services, health care and information technology sectors. The top contributors were a U.S. health services organization and a U.S. financials services firm. Notable detractors included a Canadian oil sands producer, a U.S. pharmacy benefits manager and a U.S. financial services technology provider. Within credit strategies, the Fund benefited from its positions in asset backed securities. Event driven and credit strategies seek to achieve gains from market movements in security prices caused by specific corporate events or changes in perceived relative value. These strategies may include, among others, merger arbitrage, distressed credit, opportunistic credit and value with a catalyst investing style. |
| | | The tactical trading strategy added modestly to the Fund’s performance, with managed futures strategies contributing positively and macro and emerging markets strategies detracting from results. Within managed futures strategies, Underlying Managers benefited from trading gains in interest rates, while trading in commodities diminished performance. Within macro strategies, the Underlying Managers’ positions in fixed income hurt performance, though this was offset somewhat by gains from foreign currency positions. Within emerging markets strategies, the Underlying Managers experienced losses in their holdings of external sovereign high yield corporate bonds, which were largely offset by gains in their holdings of local currency emerging markets bonds. Tactical trading strategies seek to produce total return by long and short investing across global fixed income, currency, equity and commodity markets. Tactical trading managers may employ various investment styles of which the two major strategies are macro and managed futures. Tactical trading managers that employ a global macro style may select their investments based upon fundamental and/or technical analysis. Tactical trading managers that employ a managed futures investing style may use quantitative modeling techniques, e.g., determining an asset’s value based upon an analysis of price history, price momentum and the asset’s value relative to that of other assets, among other factors. Some tactical trading managers may employ both fundamental analysis and quantitative modeling techniques. Tactical trading managers typically have no bias to be long, short or neutral, but at any given time may have significant long or short exposures in a particular market or asset. |
| | | The relative value strategy detracted from Fund’s returns during the Reporting Period, led by Underlying Managers’ exposure to the value factor. Losses were concentrated in the information technology, materials and utilities sectors. These negative results were offset somewhat by gains in consumer discretionary and, to a lesser extent, financials. Relative |
4
PORTFOLIO RESULTS
| | value strategies seek to identify and capitalize on price discrepancies between related assets (assets that share a common financial factor, such as interest rates, an issuer, or an index). Relative value strategies generally rely on arbitrage (the simultaneous purchase and sale of related assets) and may exist between two issuers or within the capital structure of a single issuer. These strategies attempt to exploit a source of return with low correlation to the market and include, among others, fixed income arbitrage, convertible arbitrage, volatility arbitrage, statistical arbitrage and equity market neutral strategies. |
| Q | | How did the Fund use derivatives and similar instruments during the Reporting Period? |
| A | | The Underlying Managers of the Fund employ derivatives and similar instruments as part of their underlying strategies to hedge market exposure and/or to gain implicit leverage, subject to the constraints of the Investment Company Act of 1940. The derivatives used most by Underlying Managers during the Reporting Period were commodity futures, equity futures andover-the-counter equity options, forward contracts, warrants, rights, total return swaps (single name and index), bond futures, credit default swaps (single name and index), interest rate futures, interest rate swaps, swaptions (options on interest rate swap contracts), inflation swaps, fixed income swaps, interest only securities, structured securities, currency futures,over-the-counter options on foreign currency and forward foreign exchange contracts. Overall, the use of derivatives and similar instruments by the Underlying Managers had a negative impact on the Fund’s performance during the Reporting Period. |
| Q | | Were there any notable changes in the Fund’s allocations and Underlying Managers during the Reporting Period? |
| A | | During the Reporting Period, shifts in the Fund’s asset allocation were made in response to the market environment and were also the result of changes in allocations to the Fund’s various strategies. One of the shifts in strategy allocation during the Reporting Period was an increase in the Fund’s exposure to the dynamic equity strategy. Most of the increase occurred in December 2018, with the addition of Artisan as a new Underlying Manager. Artisan constructs its portfolio across select themes and is skewed towardsmid-to-large cap U.S. stocks, with the flexibility to invest globally across market caps. We believe one of Artisan’s key differentiators is its effort to identify inflections in trends before focusing on the specific industry segments and companies most exposed to these themes. We funded the increase in the Fund’s allocation to the dynamic equity strategy by reducing its allocation to the tactical trading strategy, ultimately removing One River and QMS as Underlying Managers for the Fund. That said, within the tactical trading strategy, we added ADG as a new Underlying Manager to focus on systematic macro strategies. ADG employs a systematic investment model designed to capture relative value, risk premia, macroeconomic and market dynamic factors across markets. In addition, during the Reporting Period, we reduced the Fund’s exposure to the relative value strategy, removing Acadian as an Underlying Manager. |
| | | Overall, we added two Underlying Managers and removed four Underlying Managers during the Reporting Period. As mentioned previously, we added Artisan and ADG as new Underlying Managers for the Fund. Artisan was added as an Underlying Manager within the Fund’s dynamic equity strategy, joining GQG Partners, and was allocated capital in November 2018. ADG was added as an Underlying Manager with the Fund’s tactical trading strategy, joining Crabel, Emso, One River and QMS, and was allocated capital in December 2018. Effective February 27, 2019, One River and QMS no longer served as Underlying Managers within the tactical trading strategy. Acadian no longer served as an Underlying Manager within the relative value strategy as of April 5, 2019. As of October 11, 2019, we removed ADG as an Underlying Manager, preferring to access tactical trading exposure through the other Underlying Managers. |
| Q | | What is the Fund’s tactical view and strategy for the months ahead? |
| A | | We intend to continue to closely monitor global economic growth, monetary policy and market volatility, while using active portfolio management and alternative investment strategies to position the Fund as we aim to deliver positive absolute returns across a variety of market environments. We believe the flexibility to allocate tactically across these alternative strategies may enable us to provide investors with positive absolute returns in a variety of market conditions and with significant diversification benefits. We intend to continue to actively explore adding new managers with what we consider to be unique alternative capabilities as market conditions warrant. |
5
FUND BASICS
Multi-Manager Alternatives Fund
as of October 31, 2019
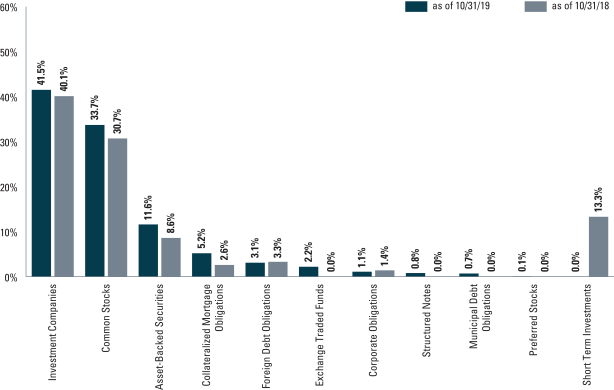
| 1 | | The percentage shown for each investment category reflects the value of investments in that category as a percentage of the Fund’s market value, excluding cash and the allocation to Russell Investments Commodity Advisor, LLC, which manages a beta completion mandate. The graph depicts the Fund’s investments but may not represent the Fund’s market exposure due to the exclusion of certain derivatives, if any, as listed in the Additional Investment Information section of the Consolidated Schedule of Investments. Short-term investments represent repurchase agreements. |
| | | | | | | | |
| | TOP TEN EQUITY HOLDINGS AS OF 10/31/192 |
| | | |
| | | Holding | | % of Net Assets | | | Line of Business |
| | | |
| | WellCare Health Plans, Inc. | | | 1.3 | % | | Health Care Providers & Services |
| | Genesee & Wyoming, Inc. Class A | | | 1.0 | | | Road & Rail |
| | Celgene Corp. | | | 0.9 | | | Biotechnology |
| | Air Liquide SA | | | 0.7 | | | Chemicals |
| | Zayo Group Holdings, Inc. | | | 0.7 | | | Diversified Telecommunication Services |
| | WABCO Holdings, Inc. | | | 0.6 | | | Machinery |
| | WestJet Airlines Ltd. | | | 0.6 | | | Airlines |
| | Fidelity National Information Services, Inc. | | | 0.5 | | | IT Services |
| | Advanced Disposal Services, Inc. | | | 0.5 | | | Commercial Services & Supplies |
| | | El Paso Electric Co. | | | 0.5 | | | Electric Utilities |
| 2 | | The top 10 holdings may not be representative of the Fund’s future investments. |
6
FUND BASICS
| | | | | | |
| | SUBADVISOR ALLOCATION (%) | |
| | |
| | | | | Percentage of
Net Assets
as of 10/31/19 | |
| | |
| | River Canyon Fund Management LLC | | | 17.3 | % |
| | Crabel Capital Manangement, LLC | | | 14.4 | |
| | Emso Asset Management, LLC | | | 14.4 | |
| | Halcyon Arbitrage IC Management LP | | | 14.3 | |
| | GQG Partners LLC | | | 10.4 | |
| | Algert Global LLC | | | 9.9 | |
| | Artisan Partners LP | | | 8.6 | |
| | Wellington Management Company LLC | | | 8.5 | |
| | Other3 | | | 2.1 | |
| | Ares Capital Management II LLC | | | 0.1 | |
| | Brigade Capital Management, LP | | | 0.0 | |
| | First Pacific Advisors, LLC | | | 0.0 | |
| | | Sirios Capital Management, LP | | | 0.0 | |
| 3 | | The chart above represents capital allocated to the Underlying Managers, as a percentage of net assets, excluding cash and the allocation to Russell Investments Commodity Advisor, LLC which manages a beta completion mandate for the Fund, and as such the weightings may not sum to 100%. Other represents the Fund’s allocation to iShares® iBoxx $ High Yield Corporate Bond ETF. |
|
| STRATEGY ALLOCATION (%)4 |
|
| As of October 31, 2019 |
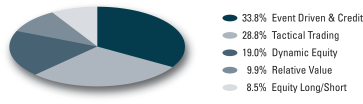
| 4 | | Equity Long/Short Strategiesgenerally involve long and short investing, based on fundamental evaluations, research and various analytical measurements, in equity and equity-related investments.Dynamic Equity Strategiesgenerally are long-biased strategies that are less constrained than traditional long-only managers with respect to factors such as position concentration, sector and country weights, style, and market capitalization.Relative Value Strategiesseek to identify and benefit from pricing discrepancies between related assets.Event Driven and Credit Strategiesseek to achieve gains from market movements in security prices caused by specific corporate events or changes in perceived relative value.Tactical Trading Strategiesseek to produce total return by long and short investing across global fixed income, currency, equity, and commodity markets. Tactical Trading managers typically have no bias to be long, short, or neutral but at any given time may have significant long or short exposures in a particular market or asset class. The percentages above exclude cash and the allocation to Russell Investments Commodity Advisor, LLC, which manages a beta completion mandate for the Fund. |
7
GOLDMAN SACHS MULTI-MANAGER ALTERNATIVES FUND
Performance Summary
October 31, 2019
The following graph shows the value, as of October 31, 2019, of a $1,000,000 investment made on April 30, 2013 (commencement of operations) in Institutional Shares at NAV. For comparative purposes, the performance of the Fund’s current benchmarks, the ICE BofAML Three-Month U.S. Treasury Bill Index and the HFRX Global Hedge Fund Index, are shown. Performance reflects applicable fee waivers and/or expense limitations in effect during the periods shown and in their absence, performance would be reduced. Returns do not reflect the deduction of taxes that a shareholder would pay on Fund distributions or the redemption of Fund shares. The returns set forth below represent past performance. Past performance does not guarantee future results. The Fund’s investment return and principal value will fluctuate so that an investor’s shares, when redeemed, may be worth more or less than their original cost. Current performance may be lower or higher than the performance quoted below. Please visit our web site at www.GSAMFUNDS.com to obtain the most recent month-end returns.
|
| Multi-Manager Alternatives Fund’s Lifetime Performance |
Performance of a $1,000,000 investment, with distributions reinvested, from April 30, 2013 through October 31, 2019.
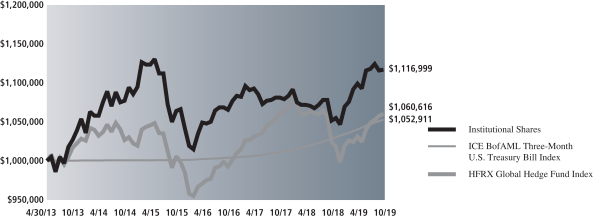
| | | | | | | | | | |
| Average Annual Total Return through October 31, 2019* | | | One Year | | | | Five Years | | | Since Inception |
Class A (Commenced April 30, 2013) | | | | | | | | | | |
Excluding sales charges | | | 5.75% | | | | 0.35% | | | 1.33% |
Including sales charges | | | -0.10% | | | | -0.78% | | | 0.46% |
|
Class C (Commenced April 30, 2013) | | | | | | | | | | |
Excluding contingent deferred sales charges | | | 4.98% | | | | -0.41% | | | 0.57% |
Including contingent deferred sales charges | | | 3.98% | | | | -0.41% | | | 0.57% |
|
Institutional (Commenced April 30, 2013) | | | 6.20% | | | | 0.73% | | | 1.71% |
|
Investor (Commenced April 30, 2013) | | | 6.02% | | | | 0.60% | | | 1.58% |
|
Class P (Commenced April 16, 2018) | | | 6.20% | | | | N/A | | | 2.58% |
|
Class R (Commenced April 30, 2013) | | | 5.60% | | | | 0.11% | | | 1.09% |
|
Class R6 (Commenced February 28, 2018) | | | 6.19% | | | | N/A | | | 2.38% |
|
| * | | These returns assume reinvestment of all distributions at NAV and reflect a maximum initial sales charge of 5.50% for Class A Shares and the assumed contingent deferred sales charge for Class C Shares (1% if redeemed within 12 months of purchase). Because Institutional, Investor, Class P, Class R and Class R6 Shares do not involve a sales charge, such a charge is not applied to their Average Annual Total Return. |
8
GOLDMAN SACHS MULTI-MANAGER ALTERNATIVES FUND
Consolidated Schedule of Investments
October 31, 2019
| | | | | | | | | | | | | | |
Principal
Amount | | | Interest
Rate | | | Maturity
Date | | | Value | |
|
| Corporate Obligations – 1.0% | |
| Banks – 0.2% | |
| | VTB Bank OJSC Via VTB Capital SA | |
| $ | 420,000 | | | | 6.950 | % | | | 10/17/22 | | | $ | 453,075 | |
| | |
| Commercial Services(a)(b)(c) – 0.0% | |
| | Cenveo Corp. | |
| | 1,315,000 | | | | 8.500 | | | | 09/15/22 | | | | 17,700 | |
| | |
| Diversified Financial Services – 0.2% | |
| | Citigroup Global Markets Holdings, Inc.(a)(d) | |
| EGP | 6,894,849 | | | | 0.000 | | | | 03/19/20 | | | | 402,939 | |
| | MDC-GMTN B.V. | |
| $ | 200,000 | | | | 4.500 | | | | 11/07/28 | | | | 225,687 | |
| | | | | | | | | | | | | | |
| | | | | | | | | | | | | 628,626 | |
| | |
| Electrical – 0.4% | |
| | Eskom Holdings SOC Ltd. | |
| | 450,000 | | | | 5.750 | | | | 01/26/21 | | | | 453,656 | |
| | 421,000 | | | | 8.450 | | | | 08/10/28 | | | | 460,995 | |
| | | | | | | | | | | | | | |
| | | | | | | | | | | | | 914,651 | |
| | |
| Energy – Exploration & Production(b)(c)(e) – 0.0% | |
| | Midstates Petroleum Co., Inc./Midstates Petroleum Co. LLC | |
| | 100,000 | | | | 10.000 | | | | 06/01/20 | | | | — | |
| | |
| Oil Field Services – 0.2% | |
| | Petrobras Global Finance B.V. | |
| | 205,000 | | | | 8.750 | | | | 05/23/26 | | | | 262,400 | |
| | 220,000 | | | | 6.900 | | | | 03/19/49 | | | | 254,950 | |
| | Petroleos de Venezuela SA(b) | |
| | 319,249 | | | | 6.000 | | | | 10/28/22 | | | | 14,366 | |
| | Seventy Seven Energy, Inc.(b)(c)(e) | |
| | 205,000 | | | | 6.500 | | | | 07/15/22 | | | | — | |
| | | | | | | | | | | | | | |
| | | | | | | | | | | | | 531,716 | |
| | |
| | TOTAL CORPORATE OBLIGATIONS | |
| | (Cost $3,362,554) | | | $ | 2,545,768 | |
| | |
| | | | | | | | |
| Shares | | | Description | | Value | |
|
| Common Stocks – 30.9% | |
| Aerospace & Defense – 0.8% | |
| | 1,808 | | | L3Harris Technologies, Inc. | | $ | 373,008 | |
| | 4,727 | | | Safran SA | | | 748,709 | |
| | 6,734 | | | United Technologies Corp.(f) | | | 966,868 | |
| | | | | | | | |
| | | | | | | 2,088,585 | |
| | |
| Airlines – 0.6% | |
| | 67,156 | | | WestJet Airlines Ltd.(g) | | | 1,561,756 | |
| | |
| Banks – 1.1% | |
| | 25,015 | | | Credit Agricole SA | | | 326,404 | |
| | 19,038 | | | HDFC Bank Ltd. ADR | | | 1,163,031 | |
| | 4,616 | | | KBC Group NV | | | 324,571 | |
| | 11,824 | | | SunTrust Banks, Inc.(f) | | | 808,052 | |
| | 30,773 | | | Svenska Handelsbanken AB Class A | | | 308,832 | |
| | | | | | | | |
| | | | | | | 2,930,890 | |
| | |
| Beverages – 0.5% | |
| | 15,947 | | | Diageo PLC | | | 652,726 | |
| | 2,146 | | | Heineken NV | | | 219,149 | |
| | 2,056 | | | Pernod Ricard SA | | | 379,811 | |
| | | | | | | | |
| | | | | | | 1,251,686 | |
| | |
| Biotechnology – 1.5% | |
| | 20,693 | | | Celgene Corp.*(f) | | | 2,235,465 | |
| | 3,858 | | | CSL Ltd. | | | 680,383 | |
| | 1,294 | | | Genmab A/S* | | | 282,732 | |
| | 7,677 | | | Ra Pharmaceuticals, Inc.* | | | 361,356 | |
| | 2,718 | | | Spark Therapeutics, Inc.* | | | 296,724 | |
| | | | | | | | |
| | | | | | | 3,856,660 | |
| | |
| Capital Markets – 1.4% | |
| | 1,375 | | | BlackRock, Inc. | | | 634,837 | |
| | 7,281 | | | Deutsche Boerse AG | | | 1,127,533 | |
| | 2,712 | | | Euronext NV(a) | | | 218,783 | |
| | 9,242 | | | London Stock Exchange Group PLC | | | 832,878 | |
| | 2,770 | | | Macquarie Group Ltd. | | | 255,775 | |
| | 1,429 | | | Moody’s Corp. | | | 315,366 | |
| | 1,224 | | | S&P Global, Inc. | | | 315,780 | |
| | | | | | | | |
| | | | | | | 3,700,952 | |
| | |
| Chemicals – 1.2% | |
| | 14,243 | | | Air Liquide SA | | | 1,893,764 | |
| | 4,082 | | | Linde PLC | | | 809,665 | |
| | 15,739 | | | Livent Corp.* | | | 107,970 | |
| | 2,391 | | | Sika AG | | | 411,028 | |
| | | | | | | | |
| | | | | | | 3,222,427 | |
| | |
| Commercial Services & Supplies – 0.6% | |
| | 43,632 | | | Advanced Disposal Services, Inc.*(f) | | | 1,430,257 | |
| | 1,636 | | | Edenred | | | 86,230 | |
| | | | | | | | |
| | | | | | | 1,516,487 | |
| | |
| Communications Equipment* – 0.0% | |
| | 372 | | | Lumentum Holdings, Inc. | | | 23,310 | |
| | |
| Diversified Consumer Services*(e) – 0.0% | |
| | 5,019 | | | Gymboree Holding Corp. | | | — | |
| | |
| Diversified Telecommunication Services – 1.2% | |
| | 1,934 | | | Bandwidth, Inc. Class A* | | | 108,594 | |
| | 18,880 | | | Cellnex Telecom SA*(a) | | | 814,650 | |
| | 1,297,575 | | | China Tower Corp. Ltd. Class H(a) | | | 285,587 | |
| | 30,032 | | | ORBCOMM, Inc.*(g) | | | 120,428 | |
| | 55,342 | | | Zayo Group Holdings, Inc.*(f) | | | 1,889,376 | |
| | | | | | | | |
| | | | | | | 3,218,635 | |
| | |
| Electric Utilities – 0.9% | |
| | 21,287 | | | El Paso Electric Co.(f) | | | 1,420,056 | |
| | 35,562 | | | Enel SpA | | | 275,618 | |
| | 10,571 | | | Fortis, Inc. | | | 439,181 | |
| | 37,714 | | | Iberdrola SA | | | 387,662 | |
| | | | | | | | |
| | | | | | | 2,522,517 | |
| | |
| | |
| The accompanying notes are an integral part of these financial statements. | | 9 |
GOLDMAN SACHS MULTI-MANAGER ALTERNATIVES FUND
Consolidated Schedule of Investments(continued)
October 31, 2019
| | | | | | | | |
| Shares | | | Description | | Value | |
|
| Common Stocks – (continued) | |
| Electrical Equipment – 0.1% | |
| | 7,987 | | | OSRAM Licht AG | | $ | 356,316 | |
| | |
| Electronic Equipment, Instruments & Components – 0.4% | |
| | 3,181 | | | Amphenol Corp. Class A | | | 319,150 | |
| | 540 | | | Coherent, Inc.* | | | 80,417 | |
| | 29,418 | | | Flex Ltd.* | | | 345,661 | |
| | 1,418 | | | Itron, Inc.* | | | 108,136 | |
| | 502 | | | Zebra Technologies Corp. Class A* | | | 119,411 | |
| | | | | | | | |
| | | | | | | 972,775 | |
| | |
| Entertainment* – 0.0% | |
| | 170 | | | Spotify Technology SA | | | 24,531 | |
| | |
| Equity Real Estate Investment Trusts (REITs) – 0.6% | |
| | 1,864 | | | American Tower Corp. | | | 406,501 | |
| | 76,523 | | | Ascendas Real Estate Investment Trust | | | 178,226 | |
| | 971 | | | Equinix, Inc. | | | 550,343 | |
| | 1,523 | | | SBA Communications Corp. | | | 366,510 | |
| | | | | | | | |
| | | | | | | 1,501,580 | |
| | |
| Food Products – 0.4% | |
| | 9,574 | | | Nestle SA | | | 1,024,239 | |
| | |
| Gas Utilities – 0.3% | |
| | 28,589 | | | AltaGas Canada, Inc. | | | 727,586 | |
| | |
| Health Care Equipment & Supplies – 0.6% | |
| | 8,050 | | | Abbott Laboratories | | | 673,061 | |
| | 2,432 | | | Becton Dickinson & Co. | | | 622,592 | |
| | 2,155 | | | Coloplast A/S Class B | | | 259,453 | |
| | | | | | | | |
| | | | | | | 1,555,106 | |
| | |
| Health Care Providers & Services*(f) – 1.3% | |
| | 11,851 | | | WellCare Health Plans, Inc. | | | 3,515,007 | |
| | |
| Hotels, Restaurants & Leisure – 1.3% | |
| | 15,014 | | | Aristocrat Leisure Ltd. | | | 327,381 | |
| | 102,798 | | | Caesars Entertainment Corp.*(f) | | | 1,262,359 | |
| | 4,386 | | | Hilton Worldwide Holdings, Inc. | | | 425,267 | |
| | 3,377 | | | Marriott International, Inc. Class A | | | 427,359 | |
| | 35,983 | | | The Stars Group, Inc.*(f) | | | 782,990 | |
| | 1,989 | | | Wyndham Hotels & Resorts, Inc. | | | 107,346 | |
| | | | | | | | |
| | | | | | | 3,332,702 | |
| | |
| Insurance – 0.5% | |
| | 49,713 | | | AIA Group Ltd. | | | 495,053 | |
| | 14,405 | | | Prudential PLC | | | 251,610 | |
| | 11,228 | | | Tokio Marine Holdings, Inc. | | | 607,048 | |
| | 4,086 | | | Trupanion, Inc.* | | | 96,838 | |
| | | | | | | | |
| | | | | | | 1,450,549 | |
| | |
| Interactive Media & Services – 1.1% | |
| | 892 | | | Alphabet, Inc. Class A* | | | 1,122,850 | |
| | 341 | | | Alphabet, Inc. Class C* | | | 429,697 | |
| | 2,201 | | | Facebook, Inc. Class A* | | | 421,822 | |
| | 13,512 | | | Tencent Holdings Ltd. | | | 548,086 | |
| | 8,498 | | | Yandex NV Class A* | | | 283,748 | |
| | | | | | | | |
| | | | | | | 2,806,203 | |
| | |
|
| Common Stocks – (continued) | |
| Internet & Direct Marketing Retail* – 0.3% | |
| | 3,896 | | | Alibaba Group Holding Ltd. ADR | | | 688,306 | |
| | 26 | | | Amazon.com, Inc. | | | 46,193 | |
| | 9 | | | Booking Holdings, Inc. | | | 18,439 | |
| | | | | | | | |
| | | | | | | 752,938 | |
| | |
| IT Services – 2.6% | |
| | 2,162 | | | Accenture PLC Class A | | | 400,878 | |
| | 848 | | | Automatic Data Processing, Inc. | | | 137,571 | |
| | 507 | | | EPAM Systems, Inc.* | | | 89,212 | |
| | 790 | | | ExlService Holdings, Inc.* | | | 55,008 | |
| | 10,880 | | | Fidelity National Information Services, Inc. | | | 1,433,549 | |
| | 2,524 | | | Fiserv, Inc.* | | | 267,897 | |
| | 1,148 | | | FleetCor Technologies, Inc.* | | | 337,765 | |
| | 1,456 | | | Genpact Ltd. | | | 57,031 | |
| | 4,734 | | | Global Payments, Inc. | | | 800,898 | |
| | 1,436 | | | GoDaddy, Inc. Class A* | | | 93,383 | |
| | 55,374 | | | Infosys Ltd. ADR | | | 531,037 | |
| | 3,242 | | | Mastercard, Inc. Class A | | | 897,418 | |
| | 403 | | | PayPal Holdings, Inc.* | | | 41,952 | |
| | 4,348 | | | StoneCo Ltd. Class A* | | | 159,963 | |
| | 151 | | | VeriSign, Inc.* | | | 28,693 | |
| | 7,486 | | | Visa, Inc. Class A | | | 1,338,946 | |
| | 1,073 | | | WEX, Inc.* | | | 202,990 | |
| | | | | | | | |
| | | | | | | 6,874,191 | |
| | |
| Life Sciences Tools & Services – 0.5% | |
| | 3,375 | | | IQVIA Holdings, Inc.* | | | 487,417 | |
| | 753 | | | Lonza Group AG* | | | 271,406 | |
| | 6,639 | | | Pacific Biosciences of California, Inc.* | | | 32,133 | |
| | 2,212 | | | Thermo Fisher Scientific, Inc. | | | 667,980 | |
| | | | | | | | |
| | | | | | | 1,458,936 | |
| | |
| Machinery* – 0.6% | |
| | 11,971 | | | WABCO Holdings, Inc. | | | 1,611,536 | |
| | |
| Media – 0.8% | |
| | 17,661 | | | Altice USA, Inc. Class A* | | | 546,608 | |
| | 1,247 | | | Charter Communications, Inc. Class A* | | | 583,421 | |
| | 17,435 | | | Comcast Corp. Class A | | | 781,437 | |
| | 10,455 | | | Cumulus Media, Inc. Class A* | | | 143,129 | |
| | | | | | | | |
| | | | | | | 2,054,595 | |
| | |
| Multi-Utilities – 0.1% | |
| | 25,961 | | | Algonquin Power & Utilities Corp. | | | 356,567 | |
| | |
| Oil, Gas & Consumable Fuels – 0.5% | |
| | 12 | | | Amplify Energy Corp. | | | 87 | |
| | 23,653 | | | Parsley Energy, Inc. Class A | | | 373,954 | |
| | 45,471 | | | Tallgrass Energy LP Class A(f) | | | 848,489 | |
| | | | | | | | |
| | | | | | | 1,222,530 | |
| | |
| Paper & Forest Products* – 0.1% | |
| | 13,118 | | | Canfor Corp. | | | 158,559 | |
| | |
| Personal Products – 0.4% | |
| | 2,528 | | | L’Oreal SA | | | 738,332 | |
| | 4,447 | | | Unilever NV | | | 262,847 | |
| | | | | | | | |
| | | | | | | 1,001,179 | |
| | |
| | |
| 10 | | The accompanying notes are an integral part of these financial statements. |
GOLDMAN SACHS MULTI-MANAGER ALTERNATIVES FUND
| | | | | | | | |
| Shares | | | Description | | Value | |
|
| Common Stocks – (continued) | |
| Pharmaceuticals – 1.3% | |
| | 5,859 | | | Allergan PLC(f) | | $ | 1,031,828 | |
| | 11,581 | | | AstraZeneca PLC | | | 1,129,347 | |
| | 10,493 | | | Novartis AG | | | 916,828 | |
| | 7,458 | | | Novo Nordisk A/S Class B | | | 410,106 | |
| | | | | | | | |
| | | | | | | 3,488,109 | |
| | |
| Professional Services – 0.6% | |
| | 141 | | | CoStar Group, Inc.* | | | 77,482 | |
| | 278 | | | Equifax, Inc. | | | 38,006 | |
| | 3,037 | | | Experian PLC | | | 95,730 | |
| | 3,273 | | | Huron Consulting Group, Inc.* | | | 216,476 | |
| | 12,579 | | | IHS Markit Ltd.* | | | 880,782 | |
| | 4,060 | | | TransUnion | | | 335,437 | |
| | 1,366 | | | TriNet Group, Inc.* | | | 72,384 | |
| | | | | | | | |
| | | | | | | 1,716,297 | |
| | |
| Road & Rail – 1.2% | |
| | 24,818 | | | Genesee & Wyoming, Inc. Class A*(f) | | | 2,755,542 | |
| | 1,731 | | | Norfolk Southern Corp. | | | 315,042 | |
| | 2,264 | | | Uber Technologies, Inc.* | | | 71,316 | |
| | 352 | | | Union Pacific Corp. | | | 58,242 | |
| | | | | | | | |
| | | | | | | 3,200,142 | |
| | |
| Semiconductors & Semiconductor Equipment – 1.7% | |
| | 8,631 | | | Advanced Micro Devices, Inc.* | | | 292,850 | |
| | 3,873 | | | Analog Devices, Inc. | | | 412,978 | |
| | 1,120 | | | ASM International NV | | | 112,920 | |
| | 1,600 | | | ASM Pacific Technology Ltd. | | | 22,341 | |
| | 1,078 | | | ASML Holding NV | | | 282,559 | |
| | 4,082 | | | BE Semiconductor Industries NV | | | 151,331 | |
| | 3,889 | | | FormFactor, Inc.* | | | 84,897 | |
| | 1,788 | | | Inphi Corp.* | | | 128,521 | |
| | 2,010 | | | KLA Corp. | | | 339,770 | |
| | 16,706 | | | Lattice Semiconductor Corp.* | | | 327,271 | |
| | 12,787 | | | Marvell Technology Group Ltd. | | | 311,875 | |
| | 8,806 | | | Micron Technology, Inc.* | | | 418,725 | |
| | 3,477 | | | NVIDIA Corp. | | | 698,947 | |
| | 48,200 | | | Renesas Electronics Corp.* | | | 326,298 | |
| | 3,294 | | | SK Hynix, Inc. | | | 231,621 | |
| | 2,528 | | | Texas Instruments, Inc. | | | 298,279 | |
| | | | | | | | |
| | | | | | | 4,441,183 | |
| | |
| Software – 2.5% | |
| | 800 | | | Adobe, Inc.* | | | 222,344 | |
| | 2,966 | | | Atlassian Corp. PLC Class A* | | | 358,263 | |
| | 2,719 | | | Blackbaud, Inc. | | | 228,260 | |
| | 2,800 | | | Ceridian HCM Holding, Inc.* | | | 135,100 | |
| | 305 | | | Guidewire Software, Inc.* | | | 34,386 | |
| | 352 | | | HubSpot, Inc.* | | | 54,595 | |
| | 623 | | | Intuit, Inc. | | | 160,423 | |
| | 6,828 | | | Microsoft Corp.(g) | | | 978,930 | |
| | 30,282 | | | NortonlifeLock, Inc.(f) | | | 692,852 | |
| | 87,781 | | | Pivotal Software, Inc. Class A*(f) | | | 1,314,082 | |
| | 181 | | | salesforce.com, Inc.* | | | 28,325 | |
| | 8,477 | | | SAP SE ADR | | | 1,123,881 | |
| | 299 | | | ServiceNow, Inc.* | | | 73,931 | |
| | |
|
| Common Stocks – (continued) | |
| Software – (continued) | |
| | 4,536 | | | Slack Technologies, Inc. Class A* | | | 99,792 | |
| | 1,163 | | | Splunk, Inc.* | | | 139,513 | |
| | 6,501 | | | SVMK, Inc.* | | | 119,618 | |
| | 3,022 | | | VMware, Inc. Class A | | | 478,292 | |
| | 1,896 | | | Workday, Inc. Class A* | | | 307,455 | |
| | 550 | | | Zscaler, Inc.* | | | 24,189 | |
| | | | | | | | |
| | | | | | | 6,574,231 | |
| | |
| Specialty Retail – 0.1% | |
| | 2,776 | | | Tiffany & Co. | | | 345,640 | |
| | |
| Technology Hardware, Storage & Peripherals – 0.4% | |
| | 6,660 | | | Pure Storage, Inc. Class A* | | | 129,603 | |
| | 16,432 | | | Western Digital Corp. | | | 848,713 | |
| | | | | | | | |
| | | | | | | 978,316 | |
| | |
| Textiles, Apparel & Luxury Goods – 0.1% | |
| | 488 | | | Hermes International | | | 351,532 | |
| | |
| Tobacco – 0.4% | |
| | 13,202 | | | Philip Morris International, Inc. | | | 1,075,171 | |
| | |
| Wireless Telecommunication Services* – 0.3% | |
| | 11,332 | | | T-Mobile US, Inc. | | | 936,703 | |
| | |
| | TOTAL COMMON STOCKS | |
| | (Cost $75,066,683) | | $ | 81,758,854 | |
| | |
| | | | | | | | | | | | | | |
Principal
Amount | | | Interest
Rate | | | Maturity
Date | | | Value | |
|
| Mortgage-Backed Obligations(h) – 4.8% | |
| Collateralized Mortgage Obligations – 4.8% | |
| Interest Only(i) – 2.1% | |
| FHLMC REMIC Series 4723, Class KS(-1 X 1M LIBOR –
6.150%) |
|
| $ | 6,339,928 | | | | 4.229 | % | | | 09/15/47 | | | $ | 1,243,018 | |
| FHLMC REMIC Series 4729, Class KS(-1 X 1M LIBOR –
6.150%) |
|
| | 4,791,103 | | | | 4.229 | | | | 11/15/47 | | | | 939,352 | |
| GNMA REMICSeries 2017-117, Class AS(-1 X 1M LIBOR +
6.200%) |
|
| | 7,474,476 | | | | 4.354 | | | | 08/20/47 | | | | 1,593,484 | |
| GNMA REMICSeries 2017-68, Class SA(c) (-1 X 1M LIBOR +
6.150%) |
|
| | 8,048,192 | | | | 4.304 | | | | 05/20/47 | | | | 1,680,753 | |
| | | | | | | | | | | | | | |
| | | | | | | | | | | | | 5,456,607 | |
| | |
| Regular Floater(a) – 0.8% | |
| CHL GMSR IssuerTrust Series 2018-GT1, Class A (1M USD
LIBOR + 2.750%) |
|
| | 1,000,000 | | | | 4.573 | | | | 05/25/23 | | | | 1,003,009 | |
| CHL GMSR IssuerTrust Series 2018-GT1, Class B (1M USD
LIBOR + 3.500%) |
|
| | 1,000,000 | | | | 5.323 | | | | 05/25/23 | | | | 1,001,641 | |
| | | | | | | | | | | | | | |
| | | | | | | | | | | | | 2,004,650 | |
| | |
| | |
| The accompanying notes are an integral part of these financial statements. | | 11 |
GOLDMAN SACHS MULTI-MANAGER ALTERNATIVES FUND
Consolidated Schedule of Investments(continued)
October 31, 2019
| | | | | | | | | | | | | | |
Principal
Amount | | | Interest
Rate | | | Maturity
Date | | | Value | |
|
| Mortgage-Backed Obligations(h) – (continued) | |
| Sequential Floating Rate(a) – 1.9% | |
| | Banc of America Funding Corp.Series 2015-R3, Class 1A2 | |
| $ | 2,681,777 | | | | 2.500 | % | | | 03/27/36 | | | $ | 2,219,161 | |
| | Citigroup Mortgage LoanTrust Series 2014-12, Class 2A5 | |
| | 3,425,599 | | | | 3.648 | | | | 02/25/37 | | | | 2,951,017 | |
| | | | | | | | | | | | | | |
| | | | | | | | | | | | | 5,170,178 | |
| | |
| | TOTAL MORTGAGE-BACKED OBLIGATIONS | |
| | (Cost $11,759,381) | | | | | | | $ | 12,631,435 | |
| | |
| | | | | | | | | | | | | | |
|
| Asset-Backed Securities – 10.6% | |
| Collateralized Loan Obligations(a)(h) – 5.3% | |
| Catamaran CLO Ltd.Series 2013-1A, Class DR (3M USD
LIBOR + 2.800%) |
|
| $ | 1,750,000 | | | | 4.736 | % | | | 01/27/28 | | | $ | 1,622,644 | |
| CIFC Funding V Ltd.Series 2018-5A, Class A1 (3M USD
LIBOR + 1.190%) |
|
| | 1,500,000 | | | | 3.191 | | | | 01/15/32 | | | | 1,496,073 | |
| CVP CLO Ltd.Series 2017-2A, Class D (3M USD LIBOR +
2.650%) |
|
| | 1,000,000 | | | | 4.616 | | | | 01/20/31 | | | | 911,547 | |
| Jamestown CLO XI Ltd.Series 2018-11A, Class A2 (3M USD
LIBOR + 1.700%) |
|
| | 1,000,000 | | | | 3.701 | | | | 07/14/31 | | | | 978,400 | |
| LCM XXV Ltd. Series 25A, Class A (3M USD LIBOR +
1.210%) |
|
| | 850,000 | | | | 3.176 | | | | 07/20/30 | | | | 848,632 | |
| Midocean Credit CLO IXSeries 18-9A, Class B (3M USD
LIBOR + 1.750%) |
|
| | 1,000,000 | | | | 3.716 | | | | 07/20/31 | | | | 971,200 | |
| Shackleton CLO Ltd.Series 2013-3A, Class DR (3M USD
LIBOR + 3.020%) |
|
| | 1,500,000 | | | | 5.021 | | | | 07/15/30 | | | | 1,379,010 | |
| Venture CDO Ltd.Series 2017-28AR, Class A2 (3M USD
LIBOR + 1.270%) |
|
| | 1,132,000 | | | | 3.236 | | | | 10/21/29 | | | | 1,129,736 | |
| Venture CLO Ltd.Series 2017-30A, Class D (3M USD LIBOR +
3.000%) |
|
| | 1,500,000 | | | | 5.001 | | | | 01/15/31 | | | | 1,392,904 | |
| Vibrant Clo VI Ltd.Series 2017-6A, Class A (3M USD LIBOR +
1.240%) |
|
| | 642,500 | | | | 3.396 | | | | 06/20/29 | | | | 640,123 | |
| Voya CLO Ltd.Series 2013-1A, Class CR (3M USD LIBOR +
2.950%) |
|
| | 1,500,000 | | | | 4.951 | | | | 10/15/30 | | | | 1,378,764 | |
| Wellfleet CLO Ltd.Series 2018-2A, Class A1 (3M USD LIBOR
+ 1.200%) |
|
| | 1,250,000 | | | | 3.166 | | | | 10/20/31 | | | | 1,234,379 | |
| | | | | | | | | | | | | | |
| | | | | | | | | | | | | 13,983,412 | |
| | |
| Credit Card(a) – 1.0% | |
| | Continental Credit CardSeries 2016-1A, Class C | |
| | 2,381,376 | | | | 11.330 | | | | 01/15/25 | | | | 2,714,546 | |
| | |
| Home Equity – 4.3% | |
| ACE Securities Corp. Home Equity Loan
Trust Series 2006-ASAP6, Class A2D(h) (1M USD LIBOR +
0.220%) |
|
| 5,155,219 | | | | 2.043 | | | | 12/25/36 | | | | 2,554,304 | |
| Argent SecuritiesTrust Series 2006-M2, Class A2D(h) (1M USD
LIBOR + 0.240%) |
|
| | 2,794,172 | | | | 2.063 | | | | 09/25/36 | | | | 1,357,417 | |
| Argent Securities, Inc. Asset-Backed Pass-Through Certificates
Series 2005-W5, Class M1(h) (1M USD LIBOR + 0.460%) |
|
| | 2,430,352 | | | | 2.283 | | | | 01/25/36 | | | | 2,295,384 | |
| Countrywide Asset-Backed CertificatesSeries 2006-22,
Class M1(h) (1M USD LIBOR + 0.230%) |
|
| | 4,160,349 | | | | 2.053 | | | | 05/25/47 | | | | 1,235,374 | |
| GE-WMC Asset-Backed Pass Through CertificatesSeries 2005-1,
Class M2(h) (1M USD LIBOR + 0.690%) |
|
| | 2,167,190 | | | | 2.513 | | | | 10/25/35 | | | | 1,864,851 | |
| JPMorgan Mortgage AcquisitionTrust Series 2007-CH1,
Class MF2(j) |
|
| | 1,452,375 | | | | 4.893 | | | | 11/25/36 | | | | 1,339,234 | |
| Securitized Asset Backed Receivables LLC Trust
Series 2006-FR3, Class A3(h) (1M USD LIBOR + 0.250%) |
|
| | 1,235,947 | | | | 2.073 | | | | 05/25/36 | | | | 815,206 | |
| | | | | | | | | | | | | | |
| | | | | | | | | | | | | 11,461,770 | |
| | |
| | TOTAL ASSET-BACKED SECURITIES | |
| | (Cost $26,716,150) | | | | | | | $ | 28,159,728 | |
| | |
| | | | | | | | | | | | | | |
|
| Foreign Debt Obligations – 2.9% | |
| | Bahrain Government International Bond | |
| $ | 200,000 | | | | 7.000 | % | | | 01/26/26 | | | $ | 228,625 | |
| | Ecuador Government International Bond | |
| | 216,000 | | | | 10.750 | | | | 03/28/22 | | | | 229,837 | |
| | Poland Government Bond | |
| PLN | 2,981,000 | | | | 2.750 | | | | 10/25/29 | | | | 834,647 | |
| | Republic of Nigeria | |
| $ | 200,000 | | | | 9.248 | | | | 01/21/49 | | | | 221,625 | |
| | Republic of Saudi | |
| | 200,000 | | | | 5.250 | | | | 01/16/50 | | | | 246,750 | |
| | Republic of South Africa | |
| ZAR | 14,429,570 | | | | 10.500 | | | | 12/21/26 | | | | 1,054,740 | |
| | Republic of Turkey | |
| $ | 400,000 | | | | 5.750 | | | | 05/11/47 | | | | 343,625 | |
| | Russian Federal Bond | |
| RUB | 40,688,000 | | | | 7.400 | | | | 07/17/24 | | | | 668,039 | |
| | 182,275,000 | | | | 7.250 | | | | 05/10/34 | | | | 3,016,858 | |
| | Ukraine Government Bond | |
| | 9,081,989 | | | | 15.700 | | | | 01/08/20 | | | | 366,401 | |
| | 8,715,185 | | | | 15.740 | | | | 01/15/20 | | | | 351,943 | |
| | |
| | TOTAL FOREIGN DEBT OBLIGATIONS | |
| | (Cost $7,125,395) | | | | | | | $ | 7,563,090 | |
| | |
| | |
| 12 | | The accompanying notes are an integral part of these financial statements. |
GOLDMAN SACHS MULTI-MANAGER ALTERNATIVES FUND
| | | | | | | | | | | | | | |
Principal
Amount | | | Interest
Rate | | | Maturity
Date | | | Value | |
|
| Structured Notes(a) – 0.8% | |
| | Arab Republic of Egypt (Issuer HSBC Bank PLC) (NR/NR)(d) | |
| $ | 4,850,000 | | | | 0.000 | % | | | 11/07/19 | | | $ | 300,012 | |
| | 5,175,000 | | | | 0.000 | | | | 05/07/20 | | | | 296,620 | |
| Arab Republic of Egypt (Issuer ICBC Standard Bank PLC)
(NR/NR)(d) |
|
| | 9,059,000 | | | | 0.000 | | | | 10/01/21 | | | | 371,179 | |
| Republic of Indonesia (Issuer JPMorgan Chase Bank NA)
(NR/NR) |
|
| | 8,435,000 | | | | 0.000 | (d) | | | 07/09/20 | | | | 471,513 | |
| | 2,893,000 | | | | 16.000 | | | | 06/13/22 | | | | 185,558 | |
| | 6,056,000 | | | | 14.350 | | | | 09/12/24 | | | | 374,665 | |
| | |
| | TOTAL STRUCTURED NOTES | |
| | (Cost $1,957,007) | | | $ | 1,999,547 | |
| | |
| | | | | | | | | | | | | | |
|
| Municipal Debt Obligations(b)(c) – 0.6% | |
| Puerto Rico – 0.6% | |
| Puerto Rico Commonwealth GO Bonds (Refunding) (Public
Improvement) Series A |
|
| $ | 430,000 | | | | 5.500 | % | | | 07/01/39 | | | $ | 288,100 | |
| | 550,000 | | | | 5.000 | | | | 07/01/41 | | | | 352,000 | |
| | Puerto Rico Commonwealth GO Bonds (Refunding) Series A | |
| | 1,775,000 | | | | 8.000 | | | | 07/01/35 | | | | 1,073,875 | |
| | |
| | TOTAL MUNICIPAL DEBT OBLIGATIONS | |
| | (Cost $1,431,618) | | | $ | 1,713,975 | |
| | |
| | | | | | | | | | | | |
| Shares | | | Description | | Expiration
Date | | | Value | |
|
| Warrant* – 0.0% | |
| Oil, Gas & Consumable Fuels – 0.0% | |
| | 93 | | | Amplify Energy Corp. | | | 04/21/20 | | | $ | — | |
| (Cost $0) | | | | |
| | |
| | | | | | | | |
| Shares | | | Description | | Value | |
|
| Exchange Traded Fund – 2.0% | |
| | 59,900 | | | iShares iBoxx High Yield Corporate Bond ETF | | $ | 5,199,919 | |
| (Cost $5,176,445) | |
| | |
| | | | | | | | |
| Shares | | | Dividend
Rate | | Value | |
|
| Preferred Stocks – 0.1% | |
| Auto Manufacturers – 0.1% | |
| | Volkswagen AG | |
| | 1,651 | | | 2.680% | | $ | 313,864 | |
| | (Cost $319,133) | |
| | |
|
| Investment Company(k) – 38.0% | |
| Goldman Sachs Financial Square Government Fund –
Institutional Shares |
|
| | 100,493,289 | | | 1.701% | | $ | 100,493,289 | |
| | (Cost $100,493,289) | |
| | |
| TOTAL INVESTMENTS BEFORE SHORT
POSITIONS – 91.7% |
|
| | (Cost $233,407,655) | | $ | 242,379,469 | |
| | |
| | | | | | | | |
| Shares | | | Description | | Value | |
|
| Common Stocks Sold Short – (2.6)% | |
| Aerospace & Defense – (0.2)% | |
| | 2,884 | | | Raytheon Co. | | $ | (612,014 | ) |
| | |
| Banks – (0.3)% | |
| | 15,312 | | | BB&T Corp. | | | (812,302 | ) |
| | |
| Biotechnology – (0.2)% | |
| | 5,074 | | | AbbVie, Inc. | | | (403,637 | ) |
| | 15,520 | | | Celgene Corp.(e) | | | (34,144 | ) |
| | | | | | | | |
| | | | | | | (437,781 | ) |
| | |
| Communications Equipment* – (0.0)% | |
| | 716 | | | Acacia Communications, Inc. | | | (47,012 | ) |
| | |
| Health Care Providers & Services* – (0.8)% | |
| | 40,056 | | | Centene Corp. | | | (2,126,172 | ) |
| | |
| Hotels, Restaurants & Leisure – (0.5)% | |
| | 9,242 | | | Eldorado Resorts, Inc.* | | | (413,765 | ) |
| | 7,456 | | | Flutter Entertainment PLC | | | (768,972 | ) |
| | | | | | | | |
| | | | | | | (1,182,737 | ) |
| | |
| Oil, Gas & Consumable Fuels* – (0.1)% | |
| | 52,914 | | | Jagged Peak Energy, Inc. | | | (375,160 | ) |
| | |
| Pharmaceuticals – (0.5)% | |
| | 20,693 | | | Bristol-Myers Squibb Co. | | | (1,187,157 | ) |
| | |
| | TOTAL COMMON STOCKS SOLD SHORT | |
| | (Cost $(6,278,254)) | | $ | (6,780,335 | ) |
| | |
| | TOTAL SECURITIES SOLD SHORT – (2.6)% | |
| | (Cost $(6,278,254)) | | $ | (6,780,335 | ) |
| | |
| OTHER ASSETS IN EXCESS OF
LIABILITIES – 10.9% | | | 28,678,681 | |
| | |
| | NET ASSETS – 100.0% | | $ | 264,277,815 | |
| | |
| | |
| The accompanying notes are an integral part of these financial statements. | | 13 |
GOLDMAN SACHS MULTI-MANAGER ALTERNATIVES FUND
Consolidated Schedule of Investments(continued)
October 31, 2019
| | |
|
| The percentage shown for each investment category reflects the value of investments in that category as a percentage of net assets. |
| |
* | | Non-income producing security. |
| |
(a) | | Exempt from registration under Rule 144A of the Securities Act of 1933. |
| |
(b) | | Security is currently in default. |
| |
(c) | | Security with “Call” features with resetting interest rates. Maturity dates disclosed are the final maturity dates. |
| |
(d) | | Issued with a zero coupon. Income is recognized through the accretion of discount. |
| |
(e) | | Significant unobservable inputs were used in the valuation of this portfolio security; i.e., Level 3. |
| |
(f) | | All or portion of security is pledged as collateral for short sales. Total market value of securities pledged as collateral on short sales amounts to $8,699,263, which represents approximately 3.0% of net assets as of October 31, 2019. |
| |
(g) | | All or a portion of security is segregated as collateral for option contracts. |
| |
(h) | | Variable rate security. Except for floating rate notes (for which final maturity is disclosed), maturity date disclosed is the next interest reset date. Interest rate disclosed is that which is in effect on October 31, 2019. |
| |
(i) | | Security with a notional or nominal principal amount. The actual effective yield of this security is different than the stated interest rate. |
| |
(j) | | Coupon changes periodically based upon a predetermined schedule. Interest rate disclosed is that which is in effect on October 31, 2019. |
| |
(k) | | Represents an affiliated issuer. |
| | |
|
Currency Abbreviations: |
AUD | | —Australian Dollar |
BRL | | —Brazilian Real |
CAD | | —Canadian Dollar |
CHF | | —Swiss Franc |
CLP | | —Chilean Peso |
CNH | | —Chinese Yuan Renminbi Offshore |
CNY | | —Chinese Yuan Renminbi |
COP | | —Colombian Peso |
DKK | | —Danish Krone |
EGP | | —Egyptian Pound |
EUR | | —Euro |
GBP | | —British Pound |
HKD | | —Hong Kong Dollar |
HUF | | —Hungarian Forint |
IDR | | —Indonesian Rupiah |
INR | | —Indian Rupee |
JPY | | —Japanese Yen |
KRW | | —South Korean Won |
NZD | | —New Zealand Dollar |
PLN | | —Polish Zloty |
RUB | | —Russian Ruble |
TRY | | —Turkish Lira |
TWD | | —Taiwan Dollar |
UAH | | —Ukraine Hryvna |
USD | | —U.S. Dollar |
ZAR | | —South African Rand |
| | |
Investment Abbreviations: |
ADR | | —American Depositary Receipt |
CDO | | —Collateralized Debt Obligation |
CLO | | —Collateralized Loan Obligation |
ETF | | —Exchange Traded Fund |
FHLMC | | —Federal Home Loan Mortgage Corp. |
GNMA | | —Government National Mortgage Association |
GO | | —General Obligation |
LIBOR | | —London Interbank Offered Rate |
LLC | | —Limited Liability Company |
LP | | —Limited Partnership |
PLC | | —Public Limited Company |
REMIC | | —Real Estate Mortgage Investment Conduit |
SHIBOR | | —Shanghai Interbank Offered Rate |
SPA | | —Stand-by Purchase Agreement |
STIB | | —Stockholm Interbank Offered Rate |
|
|
| ADDITIONAL INVESTMENT INFORMATION |
FORWARD FOREIGN CURRENCY EXCHANGE CONTRACTS — At October 31, 2019, the Fund had the following forward foreign currency exchange contracts:
FORWARD FOREIGN CURRENCY EXCHANGE CONTRACTS WITH UNREALIZED GAIN
| | | | | | | | | | | | | | | | | | | | |
| Counterparty | | Currency
Purchased | | | Currency
Sold | | | Settlement
Date | | | Unrealized
Gain | |
Deutsche Bank AG (London) | | CAD | | | 552,000 | | | USD | | | 417,189 | | | | 12/20/19 | | | $ | 2,032 | |
| | COP | | | 343,715,000 | | | USD | | | 100,000 | | | | 11/18/19 | | | | 1,628 | |
| | COP | | | 342,567,290 | | | USD | | | 100,000 | | | | 11/22/19 | | | | 1,274 | |
| | COP | | | 339,520,990 | | | USD | | | 100,000 | | | | 11/25/19 | | | | 363 | |
| | COP | | | 338,510,990 | | | USD | | | 100,000 | | | | 11/29/19 | | | | 51 | |
| | EUR | | | 64,000 | | | USD | | | 71,054 | | | | 12/20/19 | | | | 589 | |
| | GBP | | | 35,000 | | | USD | | | 44,193 | | | | 12/20/19 | | | | 1,224 | |
| | HUF | | | 29,640,000 | | | USD | | | 100,000 | | | | 11/04/19 | | | | 629 | |
| | HUF | | | 29,498,000 | | | USD | | | 100,000 | | | | 11/05/19 | | | | 152 | |
| | INR | | | 7,114,380 | | | USD | | | 100,000 | | | | 11/01/19 | | | | 262 | |
| | |
| 14 | | The accompanying notes are an integral part of these financial statements. |
GOLDMAN SACHS MULTI-MANAGER ALTERNATIVES FUND
|
| ADDITIONAL INVESTMENT INFORMATION (continued) |
FORWARD FOREIGN CURRENCY EXCHANGE CONTRACTS WITH UNREALIZED GAIN (continued)
| | | | | | | | | | | | | | | | | | | | |
| Counterparty | | Currency
Purchased | | | Currency
Sold | | | Settlement
Date | | | Unrealized
Gain | |
Deutsche Bank AG (London) (continued) | | INR | | | 7,143,130 | | | USD | | | 100,000 | | | | 11/04/19 | | | $ | 545 | |
| | INR | | | 7,145,288 | | | USD | | | 100,000 | | | | 11/18/19 | | | | 324 | |
| | KRW | | | 120,083,797 | | | USD | | | 100,000 | | | | 11/01/19 | | | | 3,128 | |
| | KRW | | | 120,104,000 | | | USD | | | 100,000 | | | | 11/04/19 | | | | 2,889 | |
| | KRW | | | 358,528,391 | | | USD | | | 300,000 | | | | 11/08/19 | | | | 6,385 | |
| | KRW | | | 478,100,000 | | | USD | | | 400,000 | | | | 11/12/19 | | | | 8,603 | |
| | KRW | | | 118,594,000 | | | USD | | | 100,000 | | | | 11/15/19 | | | | 1,362 | |
| | KRW | | | 118,599,000 | | | USD | | | 100,000 | | | | 11/18/19 | | | | 1,373 | |
| | KRW | | | 117,197,000 | | | USD | | | 100,000 | | | | 11/25/19 | | | | 191 | |
| | KRW | | | 117,156,287 | | | USD | | | 100,000 | | | | 11/29/19 | | | | 165 | |
| | PLN | | | 426,252 | | | EUR | | | 100,000 | | | | 11/04/19 | | | | 5 | |
| | PLN | | | 383,300 | | | USD | | | 100,000 | | | | 11/04/19 | | | | 325 | |
| | RUB | | | 246,463,920 | | | USD | | | 3,800,000 | | | | 11/06/19 | | | | 40,257 | |
| | TRY | | | 11,585,831 | | | USD | | | 2,000,000 | | | | 11/06/19 | | | | 23,352 | |
| | TWD | | | 3,098,300 | | | USD | | | 100,000 | | | | 11/01/19 | | | | 1,771 | |
| | TWD | | | 9,239,019 | | | USD | | | 300,000 | | | | 11/08/19 | | | | 3,330 | |
| | TWD | | | 9,239,700 | | | USD | | | 300,000 | | | | 11/12/19 | | | | 3,526 | |
| | TWD | | | 3,069,465 | | | USD | | | 100,000 | | | | 11/15/19 | | | | 876 | |
| | TWD | | | 6,110,200 | | | USD | | | 200,000 | | | | 11/18/19 | | | | 893 | |
| | TWD | | | 3,039,395 | | | USD | | | 100,000 | | | | 11/25/19 | | | | 30 | |
| | TWD | | | 3,037,000 | | | USD | | | 100,000 | | | | 11/29/19 | | | | 9 | |
| | USD | | | 892,126 | | | CAD | | | 1,168,000 | | | | 12/20/19 | | | | 5,077 | |
| | USD | | | 300,000 | | | CLP | | | 216,760,113 | | | | 11/18/19 | | | | 7,578 | |
| | USD | | | 300,000 | | | CLP | | | 217,602,601 | | | | 11/25/19 | | | | 6,388 | |
| | USD | | | 100,000 | | | CLP | | | 72,772,000 | | | | 12/04/19 | | | | 1,786 | |
| | USD | | | 100,000 | | | CLP | | | 73,959,113 | | | | 12/05/19 | | | | 181 | |
| | USD | | | 100,000 | | | COP | | | 338,230,000 | | | | 11/25/19 | | | | 18 | |
| | USD | | | 6,720 | | | EUR | | | 6,000 | | | | 12/20/19 | | | | 4 | |
| | USD | | | 100,000 | | | INR | | | 7,093,232 | | | | 11/01/19 | | | | 36 | |
| | USD | | | 364 | | | INR | | | 25,750 | | | | 11/04/19 | | | | 1 | |
| | USD | | | 100,000 | | | INR | | | 7,092,880 | | | | 11/29/19 | | | | 539 | |
| | USD | | | 481 | | | KRW | | | 559,001 | | | | 11/04/19 | | | | 2 | |
| | USD | | | 1,700,000 | | | RUB | | | 108,877,510 | | | | 11/06/19 | | | | 3,534 | |
| | USD | | | 300,000 | | | TRY | | | 1,715,783 | | | | 11/06/19 | | | | 355 | |
| | USD | | | 100,000 | | | TWD | | | 3,040,700 | | | | 11/18/19 | | | | 27 | |
JPMorgan Securities, Inc. | | BRL | | | 4,364,530 | | | USD | | | 1,046,524 | | | | 11/04/19 | | | | 41,465 | |
| | CNH | | | 6,259,823 | | | USD | | | 884,718 | | | | 12/18/19 | | | | 2,233 | |
| | EUR | | | 834,841 | | | USD | | | 923,664 | | | | 12/18/19 | | | | 10,712 | |
| | IDR | | | 4,345,941,625 | | | USD | | | 305,343 | | | | 12/18/19 | | | | 1,614 | |
| | PLN | | | 76,754 | | | USD | | | 19,595 | | | | 12/18/19 | | | | 501 | |
| | RUB | | | 14,641,572 | | | USD | | | 225,846 | | | | 12/18/19 | | | | 857 | |
| | TRY | | | 2,085,469 | | | USD | | | 351,503 | | | | 12/18/19 | | | | 8,554 | |
| | USD | | | 1,091,405 | | | BRL | | | 4,364,530 | | | | 11/04/19 | | | | 3,416 | |
| | USD | | | 1,417,207 | | | ZAR | | | 21,242,377 | | | | 12/18/19 | | | | 20,737 | |
MS & Co. Int. PLC | | EUR | | | 182,000 | | | USD | | | 202,023 | | | | 12/18/19 | | | | 1,676 | |
| | GBP | | | 226,000 | | | USD | | | 280,142 | | | | 12/18/19 | | | | 13,110 | |
| | HKD | | | 640,000 | | | USD | | | 81,643 | | | | 12/18/19 | | | | 14 | |
State Street Bank and Trust | | EUR | | | 122,555 | | | USD | | | 136,682 | | | | 11/04/19 | | | | 43 | |
| | | | | | |
| TOTAL | | | | | | | | | | | | | | | | | | $ | 238,001 | |
| | |
| The accompanying notes are an integral part of these financial statements. | | 15 |
GOLDMAN SACHS MULTI-MANAGER ALTERNATIVES FUND
Consolidated Schedule of Investments(continued)
October 31, 2019
|
| ADDITIONAL INVESTMENT INFORMATION (continued) |
FORWARD FOREIGN CURRENCY EXCHANGE CONTRACTS WITH UNREALIZED LOSS
| | | | | | | | | | | | | | | | | | | | |
| Counterparty | | Currency
Purchased | | | Currency
Sold | | | Settlement
Date | | | Unrealized
Loss | |
Deutsche Bank AG (London) | | AUD | | | 1,400,000 | | | JPY | | | 105,188,580 | | | | 11/05/19 | | | $ | (9,090 | ) |
| | CAD | | | 2,800,000 | | | JPY | | | 231,113,120 | | | | 11/05/19 | | | | (14,848 | ) |
| | CAD | | | 338,000 | | | USD | | | 257,658 | | | | 12/20/19 | | | | (961 | ) |
| | CHF | | | 2,750,000 | | | JPY | | | 302,473,600 | | | | 11/05/19 | | | | (12,967 | ) |
| | CLP | | | 214,813,827 | | | USD | | | 300,000 | | | | 11/18/19 | | | | (10,203 | ) |
| | CLP | | | 218,189,000 | | | USD | | | 300,000 | | | | 11/25/19 | | | | (5,596 | ) |
| | CLP | | | 72,320,887 | | | USD | | | 100,000 | | | | 12/04/19 | | | | (2,395 | ) |
| | COP | | | 338,236,000 | | | USD | | | 100,000 | | | | 11/29/19 | | | | (30 | ) |
| | EUR | | | 100,000 | | | HUF | | | 32,987,738 | | | | 11/04/19 | | | | (431 | ) |
| | EUR | | | 100,000 | | | HUF | | | 32,939,542 | | | | 11/05/19 | | | | (265 | ) |
| | EUR | | | 800,000 | | | JPY | | | 97,002,480 | | | | 11/05/19 | | | | (5,943 | ) |
| | EUR | | | 305,000 | | | USD | | | 341,602 | | | | 12/20/19 | | | | (180 | ) |
| | GBP | | | 1,125,000 | | | JPY | | | 158,205,375 | | | | 11/05/19 | | | | (7,898 | ) |
| | INR | | | 7,088,880 | | | USD | | | 100,000 | | | | 11/25/19 | | | | (549 | ) |
| | INR | | | 7,118,588 | | | USD | | | 100,000 | | | | 11/29/19 | | | | (179 | ) |
| | KRW | | | 76,203 | | | USD | | | 65 | | | | 11/01/19 | | | | — | |
| | KRW | | | 116,793,797 | | | USD | | | 100,000 | | | | 12/02/19 | | | | (139 | ) |
| | NZD | | | 400,000 | | | JPY | | | 27,901,000 | | | | 11/05/19 | | | | (1,961 | ) |
| | PLN | | | 426,073 | | | EUR | | | 100,000 | | | | 11/05/19 | | | | (50 | ) |
| | PLN | | | 381,720 | | | USD | | | 100,000 | | | | 11/05/19 | | | | (88 | ) |
| | RUB | | | 31,951,620 | | | USD | | | 500,000 | | | | 11/06/19 | | | | (2,149 | ) |
| | TRY | | | 2,283,474 | | | USD | | | 400,000 | | | | 11/06/19 | | | | (1,214 | ) |
| | TWD | | | 2,740 | | | USD | | | 90 | | | | 11/01/19 | | | | — | |
| | TWD | | | 3,038,200 | | | USD | | | 100,000 | | | | 11/22/19 | | | | (52 | ) |
| | USD | | | 2,247,840 | | | CAD | | | 2,981,000 | | | | 12/20/19 | | | | (16,107 | ) |
| | USD | | | 100,000 | | | COP | | | 345,675,510 | | | | 11/18/19 | | | | (2,208 | ) |
| | USD | | | 100,000 | | | COP | | | 343,775,000 | | | | 11/22/19 | | | | (1,632 | ) |
| | USD | | | 200,000 | | | COP | | | 679,678,020 | | | | 11/29/19 | | | | (887 | ) |
| | USD | | | 763,813 | | | EUR | | | 687,000 | | | | 12/20/19 | | | | (5,229 | ) |
| | USD | | | 150,082 | | | GBP | | | 118,000 | | | | 12/20/19 | | | | (3,047 | ) |
| | USD | | | 298 | | | INR | | | 21,148 | | | | 11/01/19 | | | | — | |
| | USD | | | 100,000 | | | INR | | | 7,117,380 | | | | 11/04/19 | | | | (182 | ) |
| | USD | | | 100,000 | | | INR | | | 7,158,630 | | | | 11/18/19 | | | | (511 | ) |
| | USD | | | 100,000 | | | INR | | | 7,150,892 | | | | 11/25/19 | | | | (321 | ) |
| | USD | | | 1,035,673 | | | JPY | | | 112,500,000 | | | | 11/05/19 | | | | (6,391 | ) |
| | USD | | | 100,000 | | | KRW | | | 120,160,000 | | | | 11/01/19 | | | | (3,193 | ) |
| | USD | | | 100,000 | | | KRW | | | 119,545,000 | | | | 11/04/19 | | | | (2,410 | ) |
| | USD | | | 300,000 | | | KRW | | | 358,629,000 | | | | 11/08/19 | | | | (6,471 | ) |
| | USD | | | 400,000 | | | KRW | | | 476,243,746 | | | | 11/12/19 | | | | (7,017 | ) |
| | USD | | | 100,000 | | | KRW | | | 120,023,132 | | | | 11/15/19 | | | | (2,583 | ) |
| | USD | | | 100,000 | | | KRW | | | 117,239,000 | | | | 11/18/19 | | | | (211 | ) |
| | USD | | | 100,000 | | | KRW | | | 117,304,525 | | | | 11/25/19 | | | | (282 | ) |
| | USD | | | 2,600,000 | | | RUB | | | 169,251,600 | | | | 11/06/19 | | | | (37,180 | ) |
| | USD | | | 2,800,000 | | | TRY | | | 16,333,323 | | | | 11/06/19 | | | | (52,453 | ) |
| | USD | | | 100,000 | | | TWD | | | 3,101,039 | | | | 11/01/19 | | | | (1,862 | ) |
| | USD | | | 300,000 | | | TWD | | | 9,245,700 | | | | 11/08/19 | | | | (3,549 | ) |
| | USD | | | 300,000 | | | TWD | | | 9,196,036 | | | | 11/12/19 | | | | (2,091 | ) |
| | USD | | | 100,000 | | | TWD | | | 3,068,406 | | | | 11/15/19 | | | | (841 | ) |
| | USD | | | 100,000 | | | TWD | | | 3,051,106 | | | | 11/18/19 | | | | (315 | ) |
| | USD | | | 100,000 | | | TWD | | | 3,045,506 | | | | 11/22/19 | | | | (188 | ) |
| | USD | | | 100,000 | | | TWD | | | 3,039,500 | | | | 11/25/19 | | | | (34 | ) |
| | |
| 16 | | The accompanying notes are an integral part of these financial statements. |
GOLDMAN SACHS MULTI-MANAGER ALTERNATIVES FUND
|
| ADDITIONAL INVESTMENT INFORMATION (continued) |
FORWARD FOREIGN CURRENCY EXCHANGE CONTRACTS WITH UNREALIZED LOSS (continued)
| | | | | | | | | | | | | | | | | | | | |
| Counterparty | | Currency
Purchased | | | Currency
Sold | | | Settlement
Date | | | Unrealized
Loss | |
JPMorgan Securities, Inc. | | BRL | | | 4,364,530 | | | USD | | | 1,090,015 | | | | 11/04/19 | | | $ | (2,026 | ) |
| | BRL | | | 4,364,530 | | | USD | | | 1,089,580 | | | | 12/03/19 | | | | (3,548 | ) |
| | CLP | | | 571,485,391 | | | USD | | | 788,032 | | | | 12/18/19 | | | | (16,479 | ) |
| | RUB | | | 29,753,531 | | | USD | | | 463,352 | | | | 12/18/19 | | | | (2,664 | ) |
| | USD | | | 1,246,310 | | | EUR | | | 1,123,954 | | | | 12/18/19 | | | | (11,644 | ) |
| | USD | | | 850,826 | | | PLN | | | 3,331,751 | | | | 12/18/19 | | | | (21,545 | ) |
| | | USD | | | 3,375,057 | | | RUB | | | 223,670,821 | | | | 12/18/19 | | | | (88,142 | ) |
| | | | | | |
| TOTAL | | | | | | | | | | | | | | | | | | $ | (380,431 | ) |
FUTURES CONTRACTS — At October 31, 2019, the Fund had the following futures contracts:
| | | | | | | | | | | | | | | | |
| Description | | Number of
Contracts | | | Expiration
Date | | | Notional
Amount | | | Unrealized
Appreciation/
(Depreciation) | |
Long position contracts: | | | | | | | | | | | | | | | | |
10 Year German Euro-Bund | | | 59 | | | | 12/06/19 | | | $ | 11,302,269 | | | $ | 10,799 | |
10 Year U.K. Long Gilt | | | 18 | | | | 12/27/19 | | | | 3,097,338 | | | | 18,061 | |
10 Year U.S. Treasury Notes | | | 19 | | | | 12/19/19 | | | | 2,475,641 | | | | (516 | ) |
20 Year U.S. Treasury Long Bonds | | | 37 | | | | 12/19/19 | | | | 5,970,875 | | | | 27,338 | |
5 Year German Euro-Bobl | | | 18 | | | | 12/06/19 | | | | 2,702,550 | | | | 4,611 | |
5 Year U.S. Treasury Notes | | | 23 | | | | 12/31/19 | | | | 2,741,672 | | | | 2,256 | |
CAC40 Index | | | 2 | | | | 11/15/19 | | | | 127,746 | | | | 122 | |
Canada 10 Year Government Bonds | | | 17 | | | | 12/18/19 | | | | 1,833,331 | | | | 16,049 | |
Canadian Dollar | | | 1 | | | | 12/17/19 | | | | 75,975 | | | | 99 | |
CBOE Volatility Index | | | 1 | | | | 01/22/20 | | | | 17,875 | | | | (77 | ) |
Cocoa | | | 5 | | | | 12/12/19 | | | | 120,532 | | | | (4,267 | ) |
Copper | | | 4 | | | | 11/01/19 | | | | 588,225 | | | | 7,201 | |
Copper | | | 1 | | | | 11/05/19 | | | | 144,256 | | | | (1,097 | ) |
Copper | | | 3 | | | | 11/06/19 | | | | 432,825 | | | | 388 | |
Copper | | | 1 | | | | 11/08/19 | | | | 144,304 | | | | (1,079 | ) |
Copper | | | 1 | | | | 11/13/19 | | | | 144,376 | | | | (1,041 | ) |
Copper | | | 1 | | | | 11/14/19 | | | | 144,390 | | | | (1,012 | ) |
Copper | | | 2 | | | | 11/19/19 | | | | 288,925 | | | | (1,256 | ) |
Copper | | | 2 | | | | 11/21/19 | | | | 288,900 | | | | 2,019 | |
Copper | | | 1 | | | | 11/22/19 | | | | 144,450 | | | | (1,301 | ) |
Copper | | | 1 | | | | 11/27/19 | | | | 144,547 | | | | 3,294 | |
Copper | | | 3 | | | | 11/29/19 | | | | 433,757 | | | | 4,487 | |
Copper | | | 1 | | | | 12/03/19 | | | | 144,649 | | | | 4,759 | |
Copper | | | 2 | | | | 12/04/19 | | | | 289,309 | | | | 2,091 | |
Copper | | | 1 | | | | 12/06/19 | | | | 144,665 | | | | (1,088 | ) |
Copper | | | 2 | | | | 12/09/19 | | | | 289,362 | | | | (1,871 | ) |
Copper | | | 1 | | | | 12/12/19 | | | | 144,697 | | | | (681 | ) |
Copper | | | 1 | | | | 12/13/19 | | | | 144,703 | | | | (4,388 | ) |
Copper | | | 1 | | | | 12/19/19 | | | | 144,669 | | | | (34 | ) |
Copper | | | 1 | | | | 12/24/19 | | | | 144,731 | | | | 3,235 | |
Copper | | | 8 | | | | 12/27/19 | | | | 764,056 | | | | 1,824 | |
Copper | | | 2 | | | | 12/30/19 | | | | 289,612 | | | | 1,669 | |
Copper | | | 1 | | | | 01/02/20 | | | | 144,869 | | | | 3,153 | |
Copper | | | 1 | | | | 01/03/20 | | | | 144,870 | | | | 4,142 | |
Copper | | | 4 | | | | 01/07/20 | | | | 579,506 | | | | 7,645 | |
Copper | | | 1 | | | | 01/08/20 | | | | 144,878 | | | | 1,213 | |
| | |
| The accompanying notes are an integral part of these financial statements. | | 17 |
GOLDMAN SACHS MULTI-MANAGER ALTERNATIVES FUND
Consolidated Schedule of Investments(continued)
October 31, 2019
|
| ADDITIONAL INVESTMENT INFORMATION (continued) |
FUTURES CONTRACTS (continued)
| | | | | | | | | | | | | | | | |
| Description | | Number of
Contracts | | | Expiration
Date | | | Notional
Amount | | | Unrealized
Appreciation/
(Depreciation) | |
Long position contracts: (continued) | | | | | | | | | | | | | | | | |
Copper | | | 7 | | | | 01/10/20 | | | $ | 1,014,169 | | | $ | 9,220 | |
Copper | | | 2 | | | | 01/13/20 | | | | 289,737 | | | | 1,909 | |
Copper | | | 2 | | | | 01/14/20 | | | | 289,787 | | | | 2,660 | |
Copper | | | 2 | | | | 01/16/20 | | | | 289,700 | | | | 3,357 | |
Copper | | | 6 | | | | 01/17/20 | | | | 868,987 | | | | 96 | |
Copper | | | 1 | | | | 01/21/20 | | | | 144,869 | | | | (972 | ) |
Copper | | | 1 | | | | 01/24/20 | | | | 144,886 | | | | (2,392 | ) |
Copper | | | 1 | | | | 01/30/20 | | | | 144,919 | | | | (3,108 | ) |
Copper | | | 2 | | | | 01/31/20 | | | | 289,850 | | | | (693 | ) |
Corn | | | 58 | | | | 12/13/19 | | | | 1,131,000 | | | | (1,956 | ) |
Corn | | | 1 | | | | 05/14/20 | | | | 20,238 | | | | 136 | |
Crude Palm Oil | | | 5 | | | | 01/15/20 | | | | 74,339 | | | | 1,705 | |
DAX Index | | | 10 | | | | 12/20/19 | | | | 3,595,029 | | | | 39,988 | |
DJIAE-Mini Index | | | 10 | | | | 12/20/19 | | | | 1,349,100 | | | | 1,797 | |
E-mini Comsumer Staples Select Sector | | | 10 | | | | 12/20/19 | | | | 613,800 | | | | (63 | ) |
E-mini Consumer Discretionary Select Sector | | | 3 | | | | 12/20/19 | | | | 366,000 | | | | (1,494 | ) |
E-mini Energy Select Sector | | | 1 | | | | 12/20/19 | | | | 58,090 | | | | (1,421 | ) |
E-Mini Russell 2000 Index | | | 2 | | | | 12/20/19 | | | | 156,340 | | | | (1,203 | ) |
E-mini Utilities Select Sector | | | 3 | | | | 12/20/19 | | | | 194,160 | | | | 29 | |
Euro Buxl 30 Year Bonds | | | 6 | | | | 12/06/19 | | | | 1,405,010 | | | | 3,009 | |
Euro Stoxx 50 Index | | | 24 | | | | 12/20/19 | | | | 958,422 | | | | 131 | |
Euro Stoxx 50 Index Dividend | | | 195 | | | | 12/20/19 | | | | 2,655,473 | | | | 13,551 | |
Eurodollars | | | 2 | | | | 12/13/21 | | | | 493,025 | | | | 135 | |
French 10 Year Government Bonds | | | 29 | | | | 12/06/19 | | | | 5,446,031 | | | | 8,922 | |
FTSE 100 Index | | | 3 | | | | 11/29/19 | | | | 57,114 | | | | 252 | |
FTSE China A50 Index | | | 5 | | | | 11/28/19 | | | | 69,675 | | | | 10 | |
FTSE/JSE Top 40 Index | | | 8 | | | | 12/19/19 | | | | 267,930 | | | | 1,985 | |
FTSE/MIB Index | | | 10 | | | | 12/20/19 | | | | 1,162,646 | | | | 11,461 | |
Gasoline RBOB | | | 2 | | | | 12/31/19 | | | | 132,031 | | | | (3,590 | ) |
Gold 100 Oz | | | 39 | | | | 12/27/19 | | | | 5,907,720 | | | | 8,088 | |
Hang Seng Index | | | 7 | | | | 11/28/19 | | | | 1,205,265 | | | | (1,121 | ) |
Hard Red Winter Wheat | | | 2 | | | | 12/13/19 | | | | 52,400 | | | | (481 | ) |
Hscei | | | 6 | | | | 11/28/19 | | | | 404,865 | | | | 40 | |
IBEX 35 Index | | | 1 | | | | 11/15/19 | | | | 103,473 | | | | (1,010 | ) |
Italian 10 Year Government Bonds | | | 14 | | | | 12/06/19 | | | | 2,255,783 | | | | (987 | ) |
Korea 10 Year Bonds | | | 11 | | | | 12/17/19 | | | | 1,227,118 | | | | (11 | ) |
Kospi 200 Index | | | 15 | | | | 12/12/19 | | | | 891,207 | | | | (6,768 | ) |
Lead | | | 1 | | | | 11/01/19 | | | | 55,650 | | | | 6,235 | |
Lead | | | 3 | | | | 11/06/19 | | | | 162,656 | | | | 10,774 | |
Lead | | | 1 | | | | 11/08/19 | | | | 54,199 | | | | 2,184 | |
Lead | | | 1 | | | | 11/15/19 | | | | 54,161 | | | | 2,168 | |
Lead | | | 1 | | | | 11/20/19 | | | | 54,131 | | | | 2,803 | |
Lead | | | 2 | | | | 11/27/19 | | | | 108,183 | | | | 4,603 | |
Lead | | | 9 | | | | 11/29/19 | | | | 486,756 | | | | 18,576 | |
Lead | | | 1 | | | | 12/02/19 | | | | 54,076 | | | | 3,823 | |
Lead | | | 2 | | | | 12/03/19 | | | | 108,136 | | | | 7,905 | |
Lead | | | 2 | | | | 12/04/19 | | | | 108,121 | | | | 6,140 | |
Lead | | | 2 | | | | 12/09/19 | | | | 108,073 | | | | 3,846 | |
Lead | | | 2 | | | | 12/11/19 | | | | 108,042 | | | | 670 | |
Lead | | | 2 | | | | 12/13/19 | | | | 108,010 | | | | 2,392 | |
| | |
| 18 | | The accompanying notes are an integral part of these financial statements. |
GOLDMAN SACHS MULTI-MANAGER ALTERNATIVES FUND
|
| ADDITIONAL INVESTMENT INFORMATION (continued) |
FUTURES CONTRACTS (continued)
| | | | | | | | | | | | | | | | |
| Description | | Number of
Contracts | | | Expiration
Date | | | Notional
Amount | | | Unrealized
Appreciation/
(Depreciation) | |
Long position contracts: (continued) | | | | | | | | | | | | | | | | |
Lead | | | 3 | | | | 12/16/19 | | | $ | 161,975 | | | $ | 4,929 | |
Lead | | | 1 | | | | 12/17/19 | | | | 53,989 | | | | 1,729 | |
Lead | | | 1 | | | | 12/19/19 | | | | 53,956 | | | | 2,166 | |
Lead | | | 1 | | | | 12/20/19 | | | | 53,950 | | | | 960 | |
Lead | | | 1 | | | | 12/23/19 | | | | 53,957 | | | | 307 | |
Lead | | | 2 | | | | 12/24/19 | | | | 107,919 | | | | 664 | |
Lead | | | 1 | | | | 12/27/19 | | | | 53,967 | | | | 339 | |
Lead | | | 4 | | | | 12/30/19 | | | | 215,896 | | | | 3,835 | |
Lead | | | 3 | | | | 01/02/20 | | | | 161,944 | | | | 1,002 | |
Lead | | | 2 | | | | 01/03/20 | | | | 107,968 | | | | 624 | |
Lead | | | 1 | | | | 01/07/20 | | | | 53,993 | | | | (435 | ) |
Lead | | | 3 | | | | 01/08/20 | | | | 161,987 | | | | (3,545 | ) |
Lead | | | 1 | | | | 01/14/20 | | | | 54,010 | | | | 682 | |
Lead | | | 1 | | | | 01/17/20 | | | | 53,963 | | | | (1,309 | ) |
Lead | | | 1 | | | | 01/21/20 | | | | 53,961 | | | | (1,129 | ) |
Lead | | | 1 | | | | 01/31/20 | | | | 53,950 | | | | 10 | |
Lean Hogs | | | 6 | | | | 12/13/19 | | | | 158,400 | | | | 877 | |
Live Cattle | | | 1 | | | | 12/31/19 | | | | 46,890 | | | | (132 | ) |
Maize | | | 1 | | | | 01/06/20 | | | | 9,229 | | | | (141 | ) |
MDAX Index | | | 2 | | | | 12/20/19 | | | | 293,123 | | | | 9,474 | |
Mexican Peso | | | 3 | | | | 12/16/19 | | | | 77,520 | | | | 106 | |
Mini H-shares Index | | | 6 | | | | 11/28/19 | | | | 80,973 | | | | 83 | |
Mini Tokyo Price Index | | | 1 | | | | 12/12/19 | | | | 15,451 | | | | 32 | |
Mini-Hang Seng Index | | | 2 | | | | 11/28/19 | | | | 68,872 | | | | 42 | |
MSCI EAFE Index | | | 6 | | | | 12/20/19 | | | | 587,160 | | | | 1,487 | |
MSCI Emerging Markets Index | | | 44 | | | | 12/20/19 | | | | 2,291,080 | | | | 1,993 | |
MSCI Taiwan Index | | | 8 | | | | 11/28/19 | | | | 342,880 | | | | 1,330 | |
Nasdaq 100E-Mini Index | | | 23 | | | | 12/20/19 | | | | 3,721,515 | | | | 21,111 | |
Nickel | | | 1 | | | | 11/01/19 | | | | 100,920 | | | | 6,760 | |
Nickel | | | 3 | | | | 11/08/19 | | | | 300,312 | | | | (1,427 | ) |
Nickel | | | 1 | | | | 11/12/19 | | | | 100,128 | | | | 6,019 | |
Nickel | | | 1 | | | | 11/21/19 | | | | 100,147 | | | | 4,805 | |
Nickel | | | 2 | | | | 11/29/19 | | | | 200,317 | | | | (13,499 | ) |
Nickel | | | 1 | | | | 12/02/19 | | | | 100,163 | | | | (643 | ) |
Nickel | | | 1 | | | | 12/30/19 | | | | 100,136 | | | | (654 | ) |
Nickel | | | 1 | | | | 01/13/20 | | | | 100,026 | | | | (1,527 | ) |
Nickel | | | 3 | | | | 01/14/20 | | | | 300,168 | | | | (5,433 | ) |
Nickel | | | 4 | | | | 01/16/20 | | | | 400,047 | | | | 3,406 | |
Nickel | | | 2 | | | | 01/24/20 | | | | 199,882 | | | | (614 | ) |
Nickel | | | 1 | | | | 01/31/20 | | | | 99,870 | | | | 27 | |
Nikkei 225 Index | | | 16 | | | | 12/12/19 | | | | 2,338,179 | | | | 39,639 | |
Nikkei 225 Mini | | | 60 | | | | 12/12/19 | | | | 1,275,118 | | | | 18,108 | |
NY Harbor ULSD | | | 4 | | | | 11/29/19 | | | | 315,134 | | | | (5,101 | ) |
Platinum | | | 1 | | | | 01/29/20 | | | | 46,685 | | | | 563 | |
Primary Aluminum | | | 3 | | | | 11/01/19 | | | | 131,737 | | | | (1,471 | ) |
Primary Aluminum | | | 2 | | | | 11/06/19 | | | | 87,763 | | | | (681 | ) |
Primary Aluminum | | | 1 | | | | 11/07/19 | | | | 43,897 | | | | (724 | ) |
Primary Aluminum | | | 1 | | | | 11/08/19 | | | | 43,913 | | | | (165 | ) |
Primary Aluminum | | | 1 | | | | 11/12/19 | | | | 43,984 | | | | (231 | ) |
Primary Aluminum | | | 2 | | | | 11/13/19 | | | | 88,004 | | | | (1,202 | ) |
| | |
| The accompanying notes are an integral part of these financial statements. | | 19 |
GOLDMAN SACHS MULTI-MANAGER ALTERNATIVES FUND
Consolidated Schedule of Investments(continued)
October 31, 2019
|
| ADDITIONAL INVESTMENT INFORMATION (continued) |
FUTURES CONTRACTS (continued)
| | | | | | | | | | | | | | | | |
| Description | | Number of
Contracts | | | Expiration
Date | | | Notional
Amount | | | Unrealized
Appreciation/
(Depreciation) | |
Long position contracts: (continued) | | | | | | | | | | | | | | | | |
Primary Aluminum | | | 2 | | | | 11/15/19 | | | $ | 88,075 | | | $ | (1,581 | ) |
Primary Aluminum | | | 1 | | | | 11/19/19 | | | | 44,038 | | | | (978 | ) |
Primary Aluminum | | | 1 | | | | 11/20/19 | | | | 44,038 | | | | (540 | ) |
Primary Aluminum | | | 6 | | | | 11/22/19 | | | | 264,354 | | | | (3,061 | ) |
Primary Aluminum | | | 3 | | | | 11/27/19 | | | | 132,337 | | | | (934 | ) |
Primary Aluminum | | | 4 | | | | 11/29/19 | | | | 176,514 | | | | 503 | |
Primary Aluminum | | | 2 | | | | 12/02/19 | | | | 88,306 | | | | (125 | ) |
Primary Aluminum | | | 1 | | | | 12/05/19 | | | | 44,177 | | | | (476 | ) |
Primary Aluminum | | | 3 | | | | 12/09/19 | | | | 132,627 | | | | (1,965 | ) |
Primary Aluminum | | | 5 | | | | 12/10/19 | | | | 221,085 | | | | (357 | ) |
Primary Aluminum | | | 4 | | | | 12/11/19 | | | | 176,900 | | | | (1,810 | ) |
Primary Aluminum | | | 2 | | | | 12/12/19 | | | | 88,375 | | | | 431 | |
Primary Aluminum | | | 3 | | | | 12/16/19 | | | | 132,431 | | | | (523 | ) |
Primary Aluminum | | | 1 | | | | 12/18/19 | | | | 44,150 | | | | (403 | ) |
Primary Aluminum | | | 1 | | | | 12/20/19 | | | | 43,994 | | | | (922 | ) |
Primary Aluminum | | | 6 | | | | 12/24/19 | | | | 263,025 | | | | (2,329 | ) |
Primary Aluminum | | | 5 | | | | 12/27/19 | | | | 219,000 | | | | 2,902 | |
Primary Aluminum | | | 3 | | | | 12/30/19 | | | | 131,287 | | | | 1,222 | |
Primary Aluminum | | | 3 | | | | 01/02/20 | | | | 131,475 | | | | 2,079 | |
Primary Aluminum | | | 4 | | | | 01/03/20 | | | | 175,289 | | | | 2,621 | |
Primary Aluminum | | | 1 | | | | 01/07/20 | | | | 43,817 | | | | 541 | |
Primary Aluminum | | | 2 | | | | 01/08/20 | | | | 87,628 | | | | 1,085 | |
Primary Aluminum | | | 3 | | | | 01/09/20 | | | | 131,433 | | | | 537 | |
Primary Aluminum | | | 4 | | | | 01/10/20 | | | | 175,233 | | | | 947 | |
Primary Aluminum | | | 1 | | | | 01/13/20 | | | | 43,800 | | | | 860 | |
Primary Aluminum | | | 1 | | | | 01/14/20 | | | | 43,803 | | | | 596 | |
Primary Aluminum | | | 2 | | | | 01/22/20 | | | | 87,638 | | | | 1,419 | |
Primary Aluminum | | | 2 | | | | 01/23/20 | | | | 87,650 | | | | 1,144 | |
Primary Aluminum | | | 2 | | | | 01/24/20 | | | | 87,663 | | | | 1,382 | |
Primary Aluminum | | | 1 | | | | 01/29/20 | | | | 43,863 | | | | 385 | |
Primary Aluminum | | | 1 | | | | 01/30/20 | | | | 43,869 | | | | (122 | ) |
Rapeseed Euro | | | 3 | | | | 01/31/20 | | | | 63,739 | | | | 52 | |
S&P 400E-Mini Index | | | 2 | | | | 12/20/19 | | | | 391,000 | | | | (4,033 | ) |
S&P Toronto Stock Exchange 60 Index | | | 3 | | | | 12/19/19 | | | | 448,668 | | | | (596 | ) |
SET50 Index | | | 110 | | | | 12/27/19 | | | | 778,361 | | | | (3,193 | ) |
SGX Nifty 50 Index | | | 5 | | | | 11/28/19 | | | | 119,275 | | | | (1 | ) |
Soybean | | | 22 | | | | 12/13/19 | | | | 669,680 | | | | (6,287 | ) |
STOXX 600 Banks Index | | | 1 | | | | 12/20/19 | | | | 7,489 | | | | (179 | ) |
STOXX 600 Insurance Index | | | 1 | | | | 12/20/19 | | | | 17,237 | | | | (45 | ) |
Sugar No. 11 | | | 3 | | | | 02/28/20 | | | | 41,933 | | | | 161 | |
Tin | | | 1 | | | | 01/31/20 | | | | 82,625 | | | | (453 | ) |
TOCOM Gold Mini | | | 4 | | | | 08/25/20 | | | | 19,343 | | | | (65 | ) |
TOCOM Kerosene | | | 1 | | | | 03/25/20 | | | | 25,488 | | | | (223 | ) |
Topix Index | | | 3 | | | | 12/12/19 | | | | 463,515 | | | | 3,655 | |
Ultra 10 Year U.S. Treasury Notes | | | 12 | | | | 12/19/19 | | | | 1,705,312 | | | | 7,256 | |
Ultra Long U.S. Treasury Bonds | | | 8 | | | | 12/19/19 | | | | 1,518,000 | | | | 25,961 | |
Yen Denominated Nikkei 225 Index | | | 394 | | | | 12/12/19 | | | | 41,446,801 | | | | 1,228,028 | |
Zinc | | | 1 | | | | 11/01/19 | | | | 64,225 | | | | 4,072 | |
Zinc | | | 3 | | | | 11/13/19 | | | | 189,402 | | | | 14,424 | |
Zinc | | | 1 | | | | 11/14/19 | | | | 63,132 | | | | 6,663 | |
| | |
| 20 | | The accompanying notes are an integral part of these financial statements. |
GOLDMAN SACHS MULTI-MANAGER ALTERNATIVES FUND
|
| ADDITIONAL INVESTMENT INFORMATION (continued) |
FUTURES CONTRACTS (continued)
| | | | | | | | | | | | | | | | |
| Description | | Number of
Contracts | | | Expiration
Date | | | Notional
Amount | | | Unrealized
Appreciation/
(Depreciation) | |
Long position contracts: (continued) | | | | | | | | | | | | | | | | |
Zinc | | | 2 | | | | 11/21/19 | | | $ | 126,158 | | | $ | 13,003 | |
Zinc | | | 1 | | | | 11/27/19 | | | | 62,917 | | | | 6,507 | |
Zinc | | | 1 | | | | 11/29/19 | | | | 62,881 | | | | 3,748 | |
Zinc | | | 3 | | | | 12/04/19 | | | | 188,325 | | | | 15,317 | |
Zinc | | | 1 | | | | 12/06/19 | | | | 62,756 | | | | 3,623 | |
Zinc | | | 2 | | | | 12/09/19 | | | | 125,494 | | | | 8,139 | |
Zinc | | | 1 | | | | 12/11/19 | | | | 62,727 | | | | 3,537 | |
Zinc | | | 4 | | | | 12/12/19 | | | | 250,867 | | | | 14,068 | |
Zinc | �� | | 2 | | | | 12/13/19 | | | | 125,412 | | | | 5,807 | |
Zinc | | | 4 | | | | 12/16/19 | | | | 250,783 | | | | 17,098 | |
Zinc | | | 1 | | | | 12/17/19 | | | | 62,686 | | | | 4,145 | |
Zinc | | | 1 | | | | 12/18/19 | | | | 62,675 | | | | 4,979 | |
Zinc | | | 2 | | | | 12/19/19 | | | | 125,250 | | | | 9,664 | |
Zinc | | | 2 | | | | 12/20/19 | | | | 125,216 | | | | 10,073 | |
Zinc | | | 1 | | | | 12/23/19 | | | | 62,592 | | | | 4,376 | |
Zinc | | | 2 | | | | 12/24/19 | | | | 125,150 | | | | 9,970 | |
Zinc | | | 3 | | | | 12/27/19 | | | | 187,675 | | | | 14,429 | |
Zinc | | | 4 | | | | 12/30/19 | | | | 250,167 | | | | 11,646 | |
Zinc | | | 5 | | | | 01/02/20 | | | | 312,687 | | | | 6,415 | |
Zinc | | | 3 | | | | 01/03/20 | | | | 187,546 | | | | 1,941 | |
Zinc | | | 1 | | | | 01/07/20 | | | | 62,471 | | | | 4,393 | |
Zinc | | | 2 | | | | 01/08/20 | | | | 124,897 | | | | 7,215 | |
Zinc | | | 5 | | | | 01/10/20 | | | | 312,021 | | | | 13,659 | |
Zinc | | | 2 | | | | 01/13/20 | | | | 124,675 | | | | (3,184 | ) |
Zinc | | | 3 | | | | 01/16/20 | | | | 186,787 | | | | (4,776 | ) |
Zinc | | | 3 | | | | 01/17/20 | | | | 186,712 | | | | 2,929 | |
Zinc | | | 2 | | | | 01/21/20 | | | | 124,425 | | | | 719 | |
Zinc | | | 1 | | | | 01/22/20 | | | | 62,188 | | | | 185 | |
Zinc | | | 1 | | | | 01/23/20 | | | | 62,163 | | | | 322 | |
Zinc | | | 2 | | | | 01/24/20 | | | | 124,291 | | | | (889 | ) |
Zinc | | | 1 | | | | 01/28/20 | | | | 62,113 | | | | (1,503 | ) |
Zinc | | | 2 | | | | 01/29/20 | | | | 124,191 | | | | (2,989 | ) |
| | | | |
| Total | | | | | | | | | | | | | | $ | 1,815,414 | |
Short position contracts: | | | | | | | | | | | | | | | | |
2 Year German Euro-Schatz | | | (90 | ) | | | 12/06/19 | | | | (11,249,247 | ) | | | 567 | |
2 Year U.S. Treasury Notes | | | (2 | ) | | | 12/31/19 | | | | (431,203 | ) | | | 14 | |
3 Month Euribor Interest Rate | | | (9 | ) | | | 12/14/20 | | | | (2,520,842 | ) | | | (130 | ) |
3 Month Sterling Interest Rate | | | (4 | ) | | | 12/16/20 | | | | (643,400 | ) | | | (277 | ) |
Amsterdam Exchanges Index | | | (7 | ) | | | 11/15/19 | | | | (898,144 | ) | | | 5,364 | |
BIST National-30 Index | | | (30 | ) | | | 12/31/19 | | | | (64,922 | ) | | | 177 | |
Brent Crude | | | (5 | ) | | | 11/29/19 | | | | (298,100 | ) | | | 5,385 | |
Brent Crude | | | (1 | ) | | | 12/30/19 | | �� | | (58,910 | ) | | | (271 | ) |
Brent Crude | | | (1 | ) | | | 02/28/20 | | | | (57,910 | ) | | | (211 | ) |
Brent Crude | | | (1 | ) | | | 10/30/20 | | | | (56,140 | ) | | | 399 | |
British Pound | | | (1 | ) | | | 12/16/19 | | | | (80,981 | ) | | | 180 | |
CAC40 Index | | | (12 | ) | | | 11/15/19 | | | | (766,479 | ) | | | (1,126 | ) |
Canadian Canola | | | (2 | ) | | | 01/14/20 | | | | (13,891 | ) | | | (5 | ) |
Cattle Feeder | | | (2 | ) | | | 11/21/19 | | | | (147,600 | ) | | | (2,104 | ) |
CBOE Volatility Index | | | (78 | ) | | | 11/20/19 | | | | (1,191,450 | ) | | | 123,676 | |
| | |
| The accompanying notes are an integral part of these financial statements. | | 21 |
GOLDMAN SACHS MULTI-MANAGER ALTERNATIVES FUND
Consolidated Schedule of Investments(continued)
October 31, 2019
|
| ADDITIONAL INVESTMENT INFORMATION (continued) |
FUTURES CONTRACTS (continued)
| | | | | | | | | | | | | | | | |
| Description | | Number of
Contracts | | | Expiration
Date | | | Notional
Amount | | | Unrealized
Appreciation/
(Depreciation) | |
Short position contracts: (continued) | | | | | | | | | | | | | | | | |
CBOE Volatility Index | | | (48 | ) | | | 12/18/19 | | | $ | (802,800 | ) | | $ | 30,108 | |
Cocoa | | | (5 | ) | | | 12/13/19 | | | | (120,150 | ) | | | 1,998 | |
Coffee | | | (3 | ) | | | 12/18/19 | | | | (114,694 | ) | | | (3,250 | ) |
Coffee | | | (2 | ) | | | 01/27/20 | | | | (26,440 | ) | | | (672 | ) |
Copper | | | (4 | ) | | | 11/01/19 | | | | (588,225 | ) | | | (14,394 | ) |
Copper | | | (1 | ) | | | 11/05/19 | | | | (144,256 | ) | | | (2,747 | ) |
Copper | | | (3 | ) | | | 11/06/19 | | | | (432,825 | ) | | | (5,033 | ) |
Copper | | | (1 | ) | | | 11/08/19 | | | | (144,304 | ) | | | (785 | ) |
Copper | | | (1 | ) | | | 11/13/19 | | | | (144,376 | ) | | | 1,246 | |
Copper | | | (1 | ) | | | 11/14/19 | | | | (144,391 | ) | | | 494 | |
Copper | | | (2 | ) | | | 11/19/19 | | | | (288,925 | ) | | | 1,748 | |
Copper | | | (2 | ) | | | 11/21/19 | | | | (288,900 | ) | | | 1,660 | |
Copper | | | (1 | ) | | | 11/22/19 | | | | (144,450 | ) | | | (1,815 | ) |
Copper | | | (1 | ) | | | 11/27/19 | | | | (144,547 | ) | | | 764 | |
Copper | | | (3 | ) | | | 11/29/19 | | | | (433,757 | ) | | | (2,422 | ) |
Copper | | | (1 | ) | | | 12/03/19 | | | | (144,649 | ) | | | 713 | |
Copper | | | (2 | ) | | | 12/04/19 | | | | (289,309 | ) | | | (249 | ) |
Copper | | | (1 | ) | | | 12/06/19 | | | | (144,665 | ) | | | 700 | |
Copper | | | (1 | ) | | | 12/09/19 | | | | (144,681 | ) | | | 403 | |
Copper | | | (1 | ) | | | 12/12/19 | | | | (144,697 | ) | | | 1 | |
Copper | | | (1 | ) | | | 12/13/19 | | | | (144,703 | ) | | | (1 | ) |
Copper | | | (1 | ) | | | 12/19/19 | | | | (144,669 | ) | | | 278 | |
Copper | | | (1 | ) | | | 12/24/19 | | | | (144,731 | ) | | | (234 | ) |
Copper | | | (2 | ) | | | 12/27/19 | | | | (289,538 | ) | | | (1,481 | ) |
Copper | | | (2 | ) | | | 12/30/19 | | | | (289,613 | ) | | | (6,430 | ) |
Copper | | | (1 | ) | | | 01/03/20 | | | | (144,870 | ) | | | (3,254 | ) |
Copper | | | (4 | ) | | | 01/07/20 | | | | (579,506 | ) | | | (5,473 | ) |
Copper | | | (1 | ) | | | 01/08/20 | | | | (144,878 | ) | | | (1,367 | ) |
Copper | | | (5 | ) | | | 01/10/20 | | | | (724,406 | ) | | | 342 | |
Copper | | | (1 | ) | | | 01/13/20 | | | | (144,869 | ) | | | 241 | |
Copper | | | (2 | ) | | | 01/14/20 | | | | (289,788 | ) | | | (1,256 | ) |
Copper | | | (2 | ) | | | 01/16/20 | | | | (289,700 | ) | | | (2,740 | ) |
Copper | | | (3 | ) | | | 01/17/20 | | | | (434,494 | ) | | | (1,707 | ) |
Copper | | | (1 | ) | | | 01/21/20 | | | | (144,869 | ) | | | 1,328 | |
Copper | | | (1 | ) | | | 01/22/20 | | | | (144,875 | ) | | | 610 | |
Copper | | | (4 | ) | | | 01/23/20 | | | | (579,520 | ) | | | 6,031 | |
Copper | | | (2 | ) | | | 01/24/20 | | | | (289,772 | ) | | | 4,560 | |
Copper | | | (1 | ) | | | 01/31/20 | | | | (144,925 | ) | | | 185 | |
Crude Oil | | | (16 | ) | | | 11/20/19 | | | | (866,880 | ) | | | 9,074 | |
Crude Oil | | | (3 | ) | | | 12/19/19 | | | | (162,750 | ) | | | 4,065 | |
Crude soybean oil | | | (15 | ) | | | 12/13/19 | | | | (276,750 | ) | | | (974 | ) |
DAX Index | | | (2 | ) | | | 12/20/19 | | | | (719,006 | ) | | | (11,633 | ) |
E-mini Financial Select Sector | | | (4 | ) | | | 12/20/19 | | | | (352,450 | ) | | | (6,180 | ) |
E-mini Industrial Select Sector | | | (1 | ) | | | 12/20/19 | | | | (78,720 | ) | | | (1,081 | ) |
Euro FX | | | (1 | ) | | | 12/16/19 | | | | (139,706 | ) | | | 336 | |
Euro Stoxx 50 Index | | | (15 | ) | | | 12/20/19 | | | | (603,767 | ) | | | (1,986 | ) |
Euro Stoxx 50 Index | | | (2 | ) | | | 12/18/20 | | | | (27,213 | ) | | | 42 | |
FTSE 100 Index | | | (10 | ) | | | 12/20/19 | | | | (938,611 | ) | | | 2,280 | |
FTSE/MIB Index | | | (2 | ) | | | 12/20/19 | | | | (252,749 | ) | | | (3,686 | ) |
| | |
| 22 | | The accompanying notes are an integral part of these financial statements. |
GOLDMAN SACHS MULTI-MANAGER ALTERNATIVES FUND
|
| ADDITIONAL INVESTMENT INFORMATION (continued) |
FUTURES CONTRACTS (continued)
| | | | | | | | | | | | | | | | |
| Description | | Number of
Contracts | | | Expiration
Date | | | Notional
Amount | | | Unrealized
Appreciation/
(Depreciation) | |
Short position contracts: (continued) | | | | | | | | | | | | | | | | |
Gasoline RBOB | | | (12 | ) | | | 11/29/19 | | | $ | (803,678 | ) | | $ | (3,721 | ) |
Gasoline RBOB | | | (1 | ) | | | 01/31/20 | | | | (65,806 | ) | | | 2,178 | |
Hang Seng Index | | | (2 | ) | | | 11/28/19 | | | | (344,362 | ) | | | (3,053 | ) |
IBEX 35 Index | | | (2 | ) | | | 11/15/19 | | | | (206,946 | ) | | | (448 | ) |
Korea 3 Year Bonds | | | (20 | ) | | | 12/17/19 | | | | (1,893,163 | ) | | | 1,734 | |
Lead | | | (1 | ) | | | 11/01/19 | | | | (55,650 | ) | | | (6,690 | ) |
Lead | | | (3 | ) | | | 11/06/19 | | | | (162,656 | ) | | | (12,989 | ) |
Lead | | | (1 | ) | | | 11/08/19 | | | | (54,199 | ) | | | (2,137 | ) |
Lead | | | (1 | ) | | | 11/15/19 | | | | (54,160 | ) | | | (3,076 | ) |
Lead | | | (1 | ) | | | 11/18/19 | | | | (54,131 | ) | | | (2,233 | ) |
Lead | | | (2 | ) | | | 11/27/19 | | | | (108,184 | ) | | | (4,419 | ) |
Lead | | | (9 | ) | | | 11/29/19 | | | | (486,756 | ) | | | (18,106 | ) |
Lead | | | (1 | ) | | | 12/02/19 | | | | (54,076 | ) | | | (2,195 | ) |
Lead | | | (2 | ) | | | 12/03/19 | | | | (108,136 | ) | | | (4,278 | ) |
Lead | | | (2 | ) | | | 12/04/19 | | | | (108,121 | ) | | | (4,102 | ) |
Lead | | | (2 | ) | | | 12/09/19 | | | | (108,073 | ) | | | (4,329 | ) |
Lead | | | (2 | ) | | | 12/11/19 | | | | (108,042 | ) | | | (3,620 | ) |
Lead | | | (2 | ) | | | 12/13/19 | | | | (108,010 | ) | | | 1,135 | |
Lead | | | (3 | ) | | | 12/16/19 | | | | (161,975 | ) | | | (3,907 | ) |
Lead | | | (1 | ) | | | 12/17/19 | | | | (53,989 | ) | | | (2,292 | ) |
Lead | | | (1 | ) | | | 12/19/19 | | | | (53,956 | ) | | | (2,147 | ) |
Lead | | | (1 | ) | | | 12/20/19 | | | | (53,950 | ) | | | (1,843 | ) |
Lead | | | (1 | ) | | | 12/23/19 | | | | (53,957 | ) | | | (1,385 | ) |
Lead | | | (2 | ) | | | 12/24/19 | | | | (107,919 | ) | | | (4,675 | ) |
Lead | | | (4 | ) | | | 12/30/19 | | | | (215,896 | ) | | | (3,359 | ) |
Lead | | | (3 | ) | | | 01/02/20 | | | | (161,944 | ) | | | (3,552 | ) |
Lead | | | (5 | ) | | | 01/03/20 | | | | (269,919 | ) | | | (3,826 | ) |
Lead | | | (1 | ) | | | 01/07/20 | | | | (53,993 | ) | | | (377 | ) |
Lead | | | (4 | ) | | | 01/08/20 | | | | (215,983 | ) | | | (950 | ) |
Lead | | | (1 | ) | | | 01/10/20 | | | | (54,000 | ) | | | 134 | |
Lead | | | (1 | ) | | | 01/14/20 | | | | (54,010 | ) | | | 1,394 | |
Lead | | | (2 | ) | | | 01/16/20 | | | | (107,975 | ) | | | (43 | ) |
Lead | | | (1 | ) | | | 01/17/20 | | | | (53,962 | ) | | | 360 | |
Lead | | | (1 | ) | | | 01/21/20 | | | | (53,961 | ) | | | 1,293 | |
Lead | | | (2 | ) | | | 01/30/20 | | | | (107,903 | ) | | | 2,816 | |
Lead | | | (1 | ) | | | 01/31/20 | | | | (53,950 | ) | | | 897 | |
Low Sulphur Gas Oil | | | (3 | ) | | | 01/10/20 | | | | (168,525 | ) | | | (778 | ) |
MSCI Emerging Markets Index | | | (42 | ) | | | 12/20/19 | | | | (2,186,940 | ) | | | 3,517 | |
MSCI Singapore Index | | | (4 | ) | | | 11/28/19 | | | | (108,964 | ) | | | (452 | ) |
Natural Gas | | | (3 | ) | | | 11/25/19 | | | | (19,747 | ) | | | 150 | |
Natural Gas | | | (5 | ) | | | 11/26/19 | | | | (131,650 | ) | | | 4,651 | |
Natural Gas | | | (4 | ) | | | 12/27/19 | | | | (109,280 | ) | | | 943 | |
Nickel | | | (1 | ) | | | 11/01/19 | | | | (100,920 | ) | | | (14,133 | ) |
Nickel | | | (3 | ) | | | 11/08/19 | | | | (300,312 | ) | | | (16,581 | ) |
Nickel | | | (1 | ) | | | 11/12/19 | | | | (100,128 | ) | | | (5,991 | ) |
Nickel | | | (1 | ) | | | 11/21/19 | | | | (100,147 | ) | | | (6,145 | ) |
Nickel | | | (2 | ) | | | 11/29/19 | | | | (200,317 | ) | | | 7,446 | |
Nickel | | | (1 | ) | | | 12/02/19 | | | | (100,163 | ) | | | 11,885 | |
Nickel | | | (1 | ) | | | 12/30/19 | | | | (100,136 | ) | | | 5,371 | |
Nickel | | | (1 | ) | | | 01/13/20 | | | | (100,026 | ) | | | 211 | |
| | |
| The accompanying notes are an integral part of these financial statements. | | 23 |
GOLDMAN SACHS MULTI-MANAGER ALTERNATIVES FUND
Consolidated Schedule of Investments(continued)
October 31, 2019
|
| ADDITIONAL INVESTMENT INFORMATION (continued) |
FUTURES CONTRACTS (continued)
| | | | | | | | | | | | | | | | |
| Description | | Number of
Contracts | | | Expiration
Date | | | Notional
Amount | | | Unrealized
Appreciation/
(Depreciation) | |
Short position contracts: (continued) | | | | | | | | | | | | | | | | |
Nickel | | | (3 | ) | | | 01/14/20 | | | $ | (300,168 | ) | | $ | 9,874 | |
Nickel | | | (3 | ) | | | 01/16/20 | | | | (300,036 | ) | | | 607 | |
Nickel | | | (1 | ) | | | 01/22/20 | | | | (99,969 | ) | | | (3,402 | ) |
Nickel | | | (2 | ) | | | 01/24/20 | | | | (199,882 | ) | | | 1,593 | |
Nickel | | | (1 | ) | | | 01/31/20 | | | | (99,870 | ) | | | (183 | ) |
Nikkei 225 Index | | | (355 | ) | | | 12/12/19 | | | | (40,345,750 | ) | | | (1,171,413 | ) |
Nymex Palladium | | | (2 | ) | | | 12/27/19 | | | | (351,120 | ) | | | (17,673 | ) |
OMXS 30 Index | | | (11 | ) | | | 11/15/19 | | | | (197,399 | ) | | | (352 | ) |
Primary Aluminum | | | (3 | ) | | | 11/01/19 | | | | (131,738 | ) | | | 1,754 | |
Primary Aluminum | | | (2 | ) | | | 11/06/19 | | | | (87,763 | ) | | | 849 | |
Primary Aluminum | | | (1 | ) | | | 11/07/19 | | | | (43,897 | ) | | | (87 | ) |
Primary Aluminum | | | (1 | ) | | | 11/08/19 | | | | (43,912 | ) | | | 311 | |
Primary Aluminum | | | (1 | ) | �� | | 11/12/19 | | | | (43,984 | ) | | | 570 | |
Primary Aluminum | | | (2 | ) | | | 11/13/19 | | | | (88,004 | ) | | | 1,003 | |
Primary Aluminum | | | (2 | ) | | | 11/15/19 | | | | (88,075 | ) | | | 1,147 | |
Primary Aluminum | | | (1 | ) | | | 11/19/19 | | | | (44,037 | ) | | | 479 | |
Primary Aluminum | | | (1 | ) | | | 11/20/19 | | | | (44,037 | ) | | | 498 | |
Primary Aluminum | | | (6 | ) | | | 11/22/19 | | | | (264,354 | ) | | | 604 | |
Primary Aluminum | | | (3 | ) | | | 11/27/19 | | | | (132,338 | ) | | | 386 | |
Primary Aluminum | | | (4 | ) | | | 11/29/19 | | | | (176,514 | ) | | | 1,549 | |
Primary Aluminum | | | (2 | ) | | | 12/02/19 | | | | (88,306 | ) | | | (172 | ) |
Primary Aluminum | | | (1 | ) | | | 12/05/19 | | | | (44,177 | ) | | | 483 | |
Primary Aluminum | | | (3 | ) | | | 12/09/19 | | | | (132,627 | ) | | | 61 | |
Primary Aluminum | | | (5 | ) | | | 12/10/19 | | | | (221,085 | ) | | | 6,126 | |
Primary Aluminum | | | (4 | ) | | | 12/11/19 | | | | (176,900 | ) | | | 5,564 | |
Primary Aluminum | | | (2 | ) | | | 12/12/19 | | | | (88,375 | ) | | | 1,619 | |
Primary Aluminum | | | (3 | ) | | | 12/16/19 | | | | (132,431 | ) | | | 2,698 | |
Primary Aluminum | | | (1 | ) | | | 12/18/19 | | | | (44,150 | ) | | | 473 | |
Primary Aluminum | | | (1 | ) | | | 12/20/19 | | | | (43,994 | ) | | | (945 | ) |
Primary Aluminum | | | (6 | ) | | | 12/24/19 | | | | (263,025 | ) | | | (4,469 | ) |
Primary Aluminum | | | (5 | ) | | | 12/27/19 | | | | (219,000 | ) | | | (1,927 | ) |
Primary Aluminum | | | (4 | ) | | | 12/30/19 | | | | (175,050 | ) | | | (2,136 | ) |
Primary Aluminum | | | (4 | ) | | | 01/02/20 | | | | (175,300 | ) | | | (2,681 | ) |
Primary Aluminum | | | (5 | ) | | | 01/03/20 | | | | (219,111 | ) | | | (4,875 | ) |
Primary Aluminum | | | (2 | ) | | | 01/09/20 | | | | (87,622 | ) | | | (1,290 | ) |
Primary Aluminum | | | (3 | ) | | | 01/10/20 | | | | (131,425 | ) | | | (1,940 | ) |
Primary Aluminum | | | (1 | ) | | | 01/16/20 | | | | (43,787 | ) | | | (903 | ) |
Primary Aluminum | | | (5 | ) | | | 01/31/20 | | | | (219,375 | ) | | | (2,027 | ) |
S&P 500E-Mini Index | | | (111 | ) | | | 12/20/19 | | | | (16,848,690 | ) | | | (25,911 | ) |
S&P Toronto Stock Exchange 60 Index | | | (4 | ) | | | 12/19/19 | | | | (598,223 | ) | | | (3,732 | ) |
Silver | | | (10 | ) | | | 12/27/19 | | | | (903,350 | ) | | | (13,817 | ) |
Soybean | | | (14 | ) | | | 01/14/20 | | | | (652,575 | ) | | | (1,404 | ) |
SPI 200 Index | | | (4 | ) | | | 12/19/19 | | | | (457,659 | ) | | | 2,386 | |
STOXX 600 Utilities Index | | | (1 | ) | | | 12/20/19 | | | | (19,222 | ) | | | (290 | ) |
Swiss Franc | | | (1 | ) | | | 12/16/19 | | | | (127,050 | ) | | | (51 | ) |
The Fcoj-A | | | (3 | ) | | | 01/10/20 | | | | (44,482 | ) | | | 1,193 | |
The ICE EUA | | | (1 | ) | | | 12/16/19 | | | | (28,563 | ) | | | 29 | |
Tin | | | (1 | ) | | | 01/24/20 | | | | (82,636 | ) | | | 761 | |
Topix Index | | | (10 | ) | | | 12/12/19 | | | | (1,545,050 | ) | | | (12,427 | ) |
U.S. Dollar Index Future | | | (41 | ) | | | 11/18/19 | | | | (409,877 | ) | | | (123 | ) |
| | |
| 24 | | The accompanying notes are an integral part of these financial statements. |
GOLDMAN SACHS MULTI-MANAGER ALTERNATIVES FUND
|
| ADDITIONAL INVESTMENT INFORMATION (continued) |
FUTURES CONTRACTS (continued)
| | | | | | | | | | | | | | | | |
| Description | | Number of
Contracts | | | Expiration
Date | | | Notional
Amount | | | Unrealized
Appreciation/
(Depreciation) | |
Short position contracts: (continued) | | | | | | | | | | | | | | | | |
U.S. Dollar Index Future | | | (1 | ) | | | 12/16/19 | | | $ | (97,154 | ) | | $ | 240 | |
Wheat | | | (2 | ) | | | 12/10/19 | | | | (19,852 | ) | | | 221 | |
Wheat | | | (2 | ) | | | 12/13/19 | | | | (41,975 | ) | | | 121 | |
Wheat | | | (23 | ) | | | 12/13/19 | | | | (585,063 | ) | | | 2,290 | |
White Sugar | | | (4 | ) | | | 11/15/19 | | | | (67,680 | ) | | | (620 | ) |
WIG20 Index | | | (2 | ) | | | 12/20/19 | | | | (23,137 | ) | | | 185 | |
WTI Crude Oil | | | (5 | ) | | | 11/19/19 | | | | (270,900 | ) | | | 3,905 | |
Zinc | | | (1 | ) | | | 11/01/19 | | | | (64,225 | ) | | | (5,515 | ) |
Zinc | | | (3 | ) | | | 11/13/19 | | | | (189,402 | ) | | | (18,565 | ) |
Zinc | | | (1 | ) | | | 11/14/19 | | | | (63,132 | ) | | | (6,423 | ) |
Zinc | | | (2 | ) | | | 11/21/19 | | | | (126,159 | ) | | | (10,681 | ) |
Zinc | | | (1 | ) | | | 11/27/19 | | | | (62,917 | ) | | | (6,907 | ) |
Zinc | | | (1 | ) | | | 11/29/19 | | | | (62,881 | ) | | | (6,884 | ) |
Zinc | | | (3 | ) | | | 12/04/19 | | | | (188,325 | ) | | | (11,037 | ) |
Zinc | | | (1 | ) | | | 12/06/19 | | | | (62,756 | ) | | | (4,859 | ) |
Zinc | | | (1 | ) | | | 12/09/19 | | | | (62,747 | ) | | | (5,112 | ) |
Zinc | | | (1 | ) | | | 12/11/19 | | | | (62,727 | ) | | | (3,604 | ) |
Zinc | | | (4 | ) | | | 12/12/19 | | | | (250,867 | ) | | | (17,256 | ) |
Zinc | | | (2 | ) | | | 12/13/19 | | | | (125,413 | ) | | | (5,235 | ) |
Zinc | | | (4 | ) | | | 12/16/19 | | | | (250,783 | ) | | | (13,907 | ) |
Zinc | | | (1 | ) | | | 12/17/19 | | | | (62,685 | ) | | | (4,063 | ) |
Zinc | | | (1 | ) | | | 12/18/19 | | | | (62,675 | ) | | | (4,690 | ) |
Zinc | | | (2 | ) | | | 12/19/19 | | | | (125,250 | ) | | | (9,818 | ) |
Zinc | | | (2 | ) | | | 12/20/19 | | | | (125,217 | ) | | | (10,071 | ) |
Zinc | | | (1 | ) | | | 12/23/19 | | | | (62,592 | ) | | | (5,032 | ) |
Zinc | | | (2 | ) | | | 12/24/19 | | | | (125,150 | ) | | | (11,356 | ) |
Zinc | | | (3 | ) | | | 12/27/19 | | | | (187,675 | ) | | | (6,152 | ) |
Zinc | | | (4 | ) | | | 12/30/19 | | | | (250,167 | ) | | | (14,683 | ) |
Zinc | | | (5 | ) | | | 01/02/20 | | | | (312,688 | ) | | | (24,177 | ) |
Zinc | | | (3 | ) | | | 01/03/20 | | | | (187,546 | ) | | | (12,645 | ) |
Zinc | | | (1 | ) | | | 01/07/20 | | | | (62,471 | ) | | | 1,483 | |
Zinc | | | (2 | ) | | | 01/08/20 | | | | (124,897 | ) | | | (9,615 | ) |
Zinc | | | (5 | ) | | | 01/10/20 | | | | (312,021 | ) | | | 4,213 | |
Zinc | | | (2 | ) | | | 01/13/20 | | | | (124,675 | ) | | | (3,218 | ) |
Zinc | | | (3 | ) | | | 01/16/20 | | | | (186,788 | ) | | | (5,271 | ) |
Zinc | | | (1 | ) | | | 01/21/20 | | | | (62,212 | ) | | | 1,529 | |
Zinc | | | (1 | ) | | | 01/23/20 | | | | (62,162 | ) | | | 1,471 | |
Zinc | | | (1 | ) | | | 01/24/20 | | | | (62,146 | ) | | | 1,518 | |
Zinc | | | (1 | ) | | | 01/29/20 | | | | (62,096 | ) | | | 1,450 | |
Zinc | | | (1 | ) | | | 01/30/20 | | | | (62,079 | ) | | | 830 | |
Zinc | | | (2 | ) | | | 01/31/20 | | | | (124,125 | ) | | | (631 | ) |
| | | | |
| Total | | | | | | | | | | | | | | $ | (1,431,906 | ) |
| |
| TOTAL FUTURES CONTRACTS | | | $ | 383,508 | |
| | |
| The accompanying notes are an integral part of these financial statements. | | 25 |
GOLDMAN SACHS MULTI-MANAGER ALTERNATIVES FUND
Consolidated Schedule of Investments(continued)
October 31, 2019
|
| ADDITIONAL INVESTMENT INFORMATION (continued) |
SWAP CONTRACTS — At October 31, 2019, the Fund had the following swap contracts:
CENTRALLY CLEARED INTEREST RATE SWAP CONTRACTS
| | | | | | | | | | | | | | |
| Payments Made by the Fund | | Payments
Received
by Fund | | | Termination
Date | | Notional
Amount
(000s) | | | Unrealized
Appreciation/
(Depreciation)* | |
1M BID Avg(a) | | | 5.880% | | | 01/02/23 | | BRL | 4,562 | | | $ | 16,158 | |
3M SHIBOR(b) | | | 2.813 | | | 12/18/24 | | CNY | 6,390 | | | | (14,080 | ) |
3M SHIBOR(b) | | | 2.898 | | | 12/18/24 | | | 3,306 | | | | (5,422 | ) |
3M SHIBOR(b) | | | 2.900 | | | 12/18/24 | | | 3,098 | | | | (4,819 | ) |
0.860%(c) | | | 6M GBP | | | 03/18/70 | | GBP | 482 | (d) | | | 5,154 | |
| | | | |
| TOTAL | | | | | | | | | | | | $ | (3,009 | ) |
| | * | | There are no upfront payments on the swap contracts, therefore the unrealized gain (loss) on the swap contracts is equal to their value. |
| | (a) | | Payments made at maturity. |
| | (b) | | Payments made quarterly. |
| | (c) | | Payments made semi-annually. |
| | (d) | | Represents forward starting interest rate swaps whose effective dates of commencement of accruals and cash flows occur subsequent to October 31, 2019. |
CENTRALLY CLEARED CREDIT DEFAULT SWAP CONTRACTS
| | | | | | | | | | | | | | | | | | | | | | | | | | |
| Reference Obligation/Index | | Financing Rate
Paid
(Received)
by the Fund(a) | | | Credit
Spread at
October 31,
2019(b) | | Termination
Date | | | Notional
Amount
(000s) | | | Value | | | Upfront
Premiums
(Received) Paid | | | Unrealized
Appreciation/
(Depreciation) | |
Protection Purchased: | | | | | | | | | | | | | | | | | | | | | | | | | | |
Republic of Korea, 2.750%, 01/19/27 | | | 1.000% | | | 0.270% | | | 06/20/24 | | | $ | 759 | | | $ | (25,831 | ) | | $ | 1,464 | | | $ | (27,295 | ) |
Republic of South Africa, 5.500%, 03/09/20 | | | 1.000 | | | 1.199 | | | 06/20/22 | | | | 1,291 | | | | 5,100 | | | | 1,204 | | | | 3,896 | |
Republic of South Africa, 5.500%, 03/09/20 | | | 1.000 | | | 1.313 | | | 12/20/22 | | | | 238 | | | | 1,988 | | | | 262 | | | | 1,726 | |
Republic of South Africa, 5.500%, 03/09/20 | | | 1.000 | | | 1.757 | | | 06/20/24 | | | | 264 | | | | 8,420 | | | | 8,460 | | | | (40 | ) |
Republic of Turkey, 11.875%, 01/15/30 | | | 1.000 | | | 2.665 | | | 06/20/22 | | | | 736 | | | | 30,066 | | | | 649 | | | | 29,417 | |
United Mexican States, 4.150%, 03/28/27 | | | 1.000 | | | 0.624 | | | 06/20/23 | | | | 1,081 | | | | (15,674 | ) | | | 1,964 | | | | (17,638 | ) |
United Mexican States, 4.150%, 03/28/27 | | | 1.000 | | | 0.697 | | | 12/20/23 | | | | 379 | | | | (5,044 | ) | | | 508 | | | | (5,552 | ) |
Protection Sold: | | | | | | | | | | | | | | | | | | | | | | | | | | |
Republic of Turkey, 11.875%, 01/15/30 | | | (1.000) | | | 3.216 | | | 06/20/24 | | | | 214 | | | | (19,640 | ) | | | (31,908 | ) | | | 12,268 | |
| | | | | | | |
| TOTAL | | | | | | | | | | | | | | | | $ | (20,615 | ) | | $ | (17,397 | ) | | $ | (3,218 | ) |
| | (a) | | Payments made quarterly. |
| | (b) | | Credit spread on the referenced obligation, together with the term of the swap contract, are indicators of payment/performance risk. The likelihood of a credit event occurring which would require a fund or its counterparty to make a payment or otherwise be required to perform under the swap contract is generally greater as the credit spread and the term of the swap contract increase. |
| | |
| 26 | | The accompanying notes are an integral part of these financial statements. |
GOLDMAN SACHS MULTI-MANAGER ALTERNATIVES FUND
|
| ADDITIONAL INVESTMENT INFORMATION (continued) |
OVER THE COUNTER TOTAL RETURN SWAP CONTRACTS#
| | | | | | | | | | | | | | | | | | | | | | |
| Reference Obligation/Index(a) | | Financing Rate
Paid (Received) by the Fund | | Counterparty | | Termination
Date | | Notional
Amount/
Contracts
(000s) | | | Value | | | Upfront
Premiums
(Received)
Paid | | | Unrealized
Appreciation/
(Depreciation) | |
Advanced Micro Devices, Inc. | | 1M USD LIBOR | | JPMorgan Securities, Inc. | | 05/05/20 | | $ | 244 | | | $ | 41,762 | | | $ | — | | | $ | 41,762 | |
Alphabet, Inc. Class A | | 1M USD LIBOR | | JPMorgan Securities, Inc. | | 05/05/20 | | | 82 | | | | (1,720 | ) | | | — | | | | (1,720 | ) |
Alphabet, Inc. Class C | | 1M USD LIBOR | | JPMorgan Securities, Inc. | | 05/05/20 | | | 125 | | | | (99 | ) | | | — | | | | (99 | ) |
Amazon.com, Inc. | | 1M USD LIBOR | | JPMorgan Securities, Inc. | | 05/05/20 | | | 149 | | | | 584 | | | | — | | | | 584 | |
ASM Pacific Technology Ltd. | | 1M STIB LIBOR | | JPMorgan Securities, Inc. | | 05/05/20 | | | 661 | | | | 3,493 | | | | — | | | | 3,493 | |
Ceridian HCM Holding, Inc. | | 1M USD LIBOR | | JPMorgan Securities, Inc. | | 05/05/20 | | | 130 | | | | (2,575 | ) | | | — | | | | (2,575 | ) |
Coherent, Inc. | | 1M USD LIBOR | | JPMorgan Securities, Inc. | | 05/05/20 | | | 33 | | | | (984 | ) | | | — | | | | (984 | ) |
Consumer Discretionary Select Sector SPDR Fund | | 1M USD LIBOR | | JPMorgan Securities, Inc. | | 05/05/20 | | | 12 | | | | (210 | ) | | | — | | | | (210 | ) |
Edenred SA | | 1M EUR LIBOR | | JPMorgan Securities, Inc. | | 05/05/20 | | | 153 | | | | 19,178 | | | | — | | | | 19,178 | |
Equifax, Inc. | | 1M USD LIBOR | | JPMorgan Securities, Inc. | | 05/05/20 | | | 104 | | | | (87 | ) | | | — | | | | (87 | ) |
Eqypt Treasury Bill | | 0.000% | | JPMorgan Securities, Inc. | | 11/14/19 | | | 10,395 | | | | 39,961 | | | | — | | | | 39,961 | |
ExlService Holdings, Inc. | | 1M USD LIBOR | | JPMorgan Securities, Inc. | | 05/05/20 | | | 184 | | | | 8,105 | | | | — | | | | 8,105 | |
Facebook, Inc. Class A | | 1M USD LIBOR | | JPMorgan Securities, Inc. | | 05/05/20 | | | 272 | | | | 12,768 | | | | — | | | | 12,768 | |
FleetCor Technologies, Inc. | | 1M USD LIBOR | | JPMorgan Securities, Inc. | | 05/05/20 | | | 291 | | | | (4,576 | ) | | | — | | | | (4,576 | ) |
Genpact Ltd. | | 1M USD LIBOR | | JPMorgan Securities, Inc. | | 05/05/20 | | | 903 | | | | 17,995 | | | | — | | | | 17,995 | |
Global Payments, Inc. | | 1M USD LIBOR | | JPMorgan Securities, Inc. | | 05/05/20 | | | 544 | | | | 27,997 | | | | (104 | ) | | | 28,101 | |
Guidewire Software, Inc. | | 1M USD LIBOR | | JPMorgan Securities, Inc. | | 05/05/20 | | | 527 | | | | 22,444 | | | | — | | | | 22,444 | |
HubSpot, Inc. | | 1M USD LIBOR | | JPMorgan Securities, Inc. | | 05/05/20 | | | 44 | | | | (2,621 | ) | | | — | | | | (2,621 | ) |
Huron Consulting Group, Inc. | | 1M USD LIBOR | | JPMorgan Securities, Inc. | | 05/05/20 | | | 199 | | | | 19,049 | | | | — | | | | 19,049 | |
Invesco QQQ Trust Series 1 ETF | | 1M USD LIBOR | | JPMorgan Securities, Inc. | | 05/05/20 | | | 68 | | | | (3,122 | ) | | | — | | | | (3,122 | ) |
iShares Core S&P Small-Capital ETF | | 1M USD LIBOR | | JPMorgan Securities, Inc. | | 05/05/20 | | | 47 | | | | (1,829 | ) | | | — | | | | (1,829 | ) |
iShares Expanded Tech-Software Sector ETF | | 1M USD LIBOR | | JPMorgan Securities, Inc. | | 05/05/20 | | | 373 | | | | (702 | ) | | | — | | | | (702 | ) |
iShares PHLX Semiconductor ETF | | 1M USD LIBOR | | JPMorgan Securities, Inc. | | 05/05/20 | | | 273 | | | | (15,240 | ) | | | — | | | | (15,240 | ) |
iShares Russell 2000 Growth ETF | | 1M USD LIBOR | | JPMorgan Securities, Inc. | | 05/05/20 | | | 60 | | | | (2,567 | ) | | | — | | | | (2,567 | ) |
iShares Russell Mid-Capital Growth ETF | | 1M USD LIBOR | | JPMorgan Securities, Inc. | | 05/05/20 | | | 24 | | | | (572 | ) | | | — | | | | (572 | ) |
iShares S&P NA Tech-Software Sector ETF | | 1M USD LIBOR | | JPMorgan Securities, Inc. | | 05/05/20 | | | 88 | | | | (2,883 | ) | | | — | | | | (2,883 | ) |
iShares S&P NA Technology-Multimedia Networking ETF | | 1M USD LIBOR | | JPMorgan Securities, Inc. | | 05/05/20 | | | 1,245 | | | | (39,898 | ) | | | — | | | | (39,898 | ) |
iShares S&P Small-Capital 600 Growth ETF | | 1M USD LIBOR | | JPMorgan Securities, Inc. | | 05/05/20 | | | 25 | | | | (890 | ) | | | — | | | | (890 | ) |
iShares U.S. Technology ETF | | 1M USD LIBOR | | JPMorgan Securities, Inc. | | 05/05/20 | | | 54 | | | | (2,065 | ) | | | — | | | | (2,065 | ) |
Lumentum Holdings, Inc. | | 1M USD LIBOR | | JPMorgan Securities, Inc. | | 05/05/20 | | | 83 | | | | 15,529 | | | | — | | | | 15,529 | |
Mastercard, Inc. Class A | | 1M USD LIBOR | | JPMorgan Securities, Inc. | | 05/05/20 | | | 88 | | | | 1,082 | | | | — | | | | 1,082 | |
MediaTek, Inc. | | 1M USD LIBOR | | JPMorgan Securities, Inc. | | 05/05/20 | | | 205 | | | | 12,226 | | | | — | | | | 12,226 | |
PayPal Holdings, Inc. | | 1M USD LIBOR | | JPMorgan Securities, Inc. | | 05/05/20 | | | 141 | | | | (4,796 | ) | | | — | | | | (4,796 | ) |
Pure Storage, Inc. Class A | | 1M USD LIBOR | | JPMorgan Securities, Inc. | | 05/05/20 | | | 29 | | | | 5,398 | | | | — | | | | 5,398 | |
PureFunds ISE Cyber | | 1M USD LIBOR | | JPMorgan Securities, Inc. | | 05/05/20 | | | 41 | | | | (1,475 | ) | | | — | | | | (1,475 | ) |
Salesforce.com, Inc. | | 1M USD LIBOR | | JPMorgan Securities, Inc. | | 05/05/20 | | | 132 | | | | 4,397 | | | | — | | | | 4,397 | |
ServiceNow, Inc. | | 1M USD LIBOR | | JPMorgan Securities, Inc. | | 05/05/20 | | | 92 | | | | 966 | | | | — | | | | 966 | |
SPDR S&P MidCap 400 ETF | | 1M USD LIBOR | | JPMorgan Securities, Inc. | | 05/05/20 | | | 29 | | | | (918 | ) | | | — | | | | (918 | ) |
Splunk, Inc. | | 1M USD LIBOR | | JPMorgan Securities, Inc. | | 05/05/20 | | | 42 | | | | (547 | ) | | | — | | | | (547 | ) |
Spotify Technology SA | | 1M USD LIBOR | | JPMorgan Securities, Inc. | | 05/05/20 | | | 75 | | | | 18,325 | | | | — | | | | 18,325 | |
TransUnion | | 1M USD LIBOR | | JPMorgan Securities, Inc. | | 05/05/20 | | | 132 | | | | 1,224 | | | | — | | | | 1,224 | |
TriNet Group, Inc. | | 1M USD LIBOR | | JPMorgan Securities, Inc. | | 05/05/20 | | | 179 | | | | 8,349 | | | | — | | | | 8,349 | |
Trupanion, Inc. | | 1M USD LIBOR | | JPMorgan Securities, Inc. | | 05/05/20 | | | 127 | | | | 8,285 | | | | — | | | | 8,285 | |
Vanguard Small-Capital Growth ETF | | 1M USD LIBOR | | JPMorgan Securities, Inc. | | 05/05/20 | | | 64 | | | | (1,246 | ) | | | — | | | | (1,246 | ) |
VeriSign, Inc. | | 1M USD LIBOR | | JPMorgan Securities, Inc. | | 05/05/20 | | | 142 | | | | 909 | | | | — | | | | 909 | |
Visa, Inc. Class A | | 1M USD LIBOR | | JPMorgan Securities, Inc. | | 05/05/20 | | | 159 | | | | (433 | ) | | | — | | | | (433 | ) |
WEX, Inc. | | 1M USD LIBOR | | JPMorgan Securities, Inc. | | 05/05/20 | | | 199 | | | | (15,407 | ) | | | — | | | | (15,407 | ) |
Workday, Inc. Class A | | 1M USD LIBOR | | JPMorgan Securities, Inc. | | 05/05/20 | | | 94 | | | | 1,210 | | | | — | | | | 1,210 | |
Zscaler, Inc. | | 1M USD LIBOR | | JPMorgan Securities, Inc. | | 05/05/20 | | | 83 | | | | (9,883 | ) | | | — | | | | (9,883 | ) |
| | |
| The accompanying notes are an integral part of these financial statements. | | 27 |
GOLDMAN SACHS MULTI-MANAGER ALTERNATIVES FUND
Consolidated Schedule of Investments(continued)
October 31, 2019
|
| ADDITIONAL INVESTMENT INFORMATION (continued) |
OVER THE COUNTER TOTAL RETURN SWAP CONTRACTS# (continued)
| | | | | | | | | | | | | | | | | | | | | | |
| Reference Obligation/Index(a) | | Financing Rate
Paid (Received) by the Fund | | Counterparty | | Termination
Date | | Notional
Amount/
Contracts
(000s) | | | Value | | | Upfront
Premiums
(Received)
Paid | | | Unrealized
Appreciation/
(Depreciation) | |
AbbVie, Inc. | | (1.820)% | | MS & Co. Int. PLC | | 02/03/20 | | $ | 3 | | | $ | (15,452 | ) | | $ | — | | | $ | (15,452 | ) |
Accenture PLC Class A | | 1M USD LIBOR | | MS & Co. Int. PLC | | 05/15/20 | | | 38 | | | | (357 | ) | | | — | | | | (357 | ) |
Adobe Systems, Inc. | | 1M USD LIBOR | | MS & Co. Int. PLC | | 05/15/20 | | | 79 | | | | (477 | ) | | | — | | | | (477 | ) |
Allergan PLC | | 1.820 | | MS & Co. Int. PLC | | 02/03/20 | | | 3 | | | | 16,940 | | | | — | | | | 16,940 | |
Alphabet, Inc. Class A | | 1M USD LIBOR | | MS & Co. Int. PLC | | 05/15/20 | | | 312 | | | | 3,883 | | | | — | | | | 3,883 | |
Alphabet, Inc. Class C | | 1M USD LIBOR | | MS & Co. Int. PLC | | 05/15/20 | | | 292 | | | | 3,766 | | | | — | | | | 3,766 | |
Altran Technologies SA | | 0.460 | | MS & Co. Int. PLC | | 07/07/21 | | | 57 | | | | 4,633 | | | | — | | | | 4,633 | |
Amazon.com, Inc. | | 1M USD LIBOR | | MS & Co. Int. PLC | | 05/15/20 | | | 585 | | | | 2,585 | | | | — | | | | 2,585 | |
Aroundtown SA | | 0.000 | | MS & Co. Int. PLC | | 07/07/21 | | | 30 | | | | (2,793 | ) | | | — | | | | (2,793 | ) |
Automatic Data Processing, Inc. | | 1M USD LIBOR | | MS & Co. Int. PLC | | 05/15/20 | | | 39 | | | | (485 | ) | | | — | | | | (485 | ) |
Blackbaud, Inc. | | 1M USD LIBOR | | MS & Co. Int. PLC | | 05/15/20 | | | 14 | | | | (1,350 | ) | | | — | | | | (1,350 | ) |
Booking Holdings, Inc. | | 1M USD LIBOR | | MS & Co. Int. PLC | | 05/15/20 | | | 109 | | | | 1,663 | | | | — | | | | 1,663 | |
Caesars Entertainment Corp. | | 1.820 | | MS & Co. Int. PLC | | 02/03/20 | | | 20 | | | | 5,076 | | | | — | | | | 5,076 | |
Ceridian HCM Holding, Inc. | | 1M USD LIBOR | | MS & Co. Int. PLC | | 05/15/20 | | | 69 | | | | (2,151 | ) | | | — | | | | (2,151 | ) |
Cobham PLC | | 0.710 | | MS & Co. Int. PLC | | 09/15/21 | | | 771 | | | | 29,882 | | | | — | | | | 29,882 | |
Consumer Discretionary Select Sector SPDR ETF | | 1M USD LIBOR | | MS & Co. Int. PLC | | 05/15/20 | | | 200 | | | | 1,247 | | | | — | | | | 1,247 | |
CoStar Group, Inc. | | 1M USD LIBOR | | MS & Co. Int. PLC | | 05/15/20 | | | 253 | | | | (21,576 | ) | | | — | | | | (21,576 | ) |
Eldorado Resorts, Inc. | | (1.820) | | MS & Co. Int. PLC | | 02/03/20 | | | 2 | | | | (3,365 | ) | | | — | | | | (3,365 | ) |
EPAM Systems, Inc. | | 1M USD LIBOR | | MS & Co. Int. PLC | | 05/15/20 | | | 311 | | | | (23,161 | ) | | | — | | | | (23,161 | ) |
Equifax, Inc. | | 1M USD LIBOR | | MS & Co. Int. PLC | | 05/15/20 | | | 515 | | | | (29,724 | ) | | | — | | | | (29,724 | ) |
Exlservice Holdings, Inc. | | 1M USD LIBOR | | MS & Co. Int. PLC | | 05/15/20 | | | 404 | | | | 22,220 | | | | — | | | | 22,220 | |
Expedia Group, Inc | | 1M USD LIBOR | | MS & Co. Int. PLC | | 05/15/20 | | | 77 | | | | (392 | ) | | | — | | | | (392 | ) |
Experian PLC | | 1M GBP LIBOR | | MS & Co. Int. PLC | | 05/15/20 | | | 223 | | | | (290 | ) | | | — | | | | (290 | ) |
Facebook, Inc. Class A | | 1M USD LIBOR | | MS & Co. Int. PLC | | 05/15/20 | | | 261 | | | | 3,590 | | | | — | | | | 3,590 | |
FleetCor Technologies, Inc. | | 1M USD LIBOR | | MS & Co. Int. PLC | | 05/15/20 | | | 898 | | | | (5,910 | ) | | | — | | | | (5,910 | ) |
Flex Ltd. | | 1M USD LIBOR | | MS & Co. Int. PLC | | 05/15/20 | | | 52 | | | | 8,952 | | | | — | | | | 8,952 | |
Flutter Entertainments PLC | | (0.710) | | MS & Co. Int. PLC | | 09/15/21 | | | 1 | | | | (2,598 | ) | | | — | | | | (2,598 | ) |
FormFactor, Inc. | | 1M USD LIBOR | | MS & Co. Int. PLC | | 05/15/20 | | | 81 | | | | 4,189 | | | | — | | | | 4,189 | |
Global Payments, Inc. | | 1M USD LIBOR | | MS & Co. Int. PLC | | 05/15/20 | | | 1,503 | | | | 41,139 | | | | 3,048 | | | | 38,091 | |
GoDaddy, Inc. Class A | | 1M USD LIBOR | | MS & Co. Int. PLC | | 05/15/20 | | | 286 | | | | 6,592 | | | | — | | | | 6,592 | |
HubSpot, Inc. | | 1M USD LIBOR | | MS & Co. Int. PLC | | 05/15/20 | | | 133 | | | | (9,850 | ) | | | — | | | | (9,850 | ) |
Huron Consulting Group, Inc. | | 1M USD LIBOR | | MS & Co. Int. PLC | | 05/15/20 | | | 19 | | | | 2,202 | | | | — | | | | 2,202 | |
Intuit, Inc. | | 1M USD LIBOR | | MS & Co. Int. PLC | | 05/15/20 | | | 63 | | | | (3,759 | ) | | | — | | | | (3,759 | ) |
Invesco QQQ Trust Series 1 ETF | | 1M USD LIBOR | | MS & Co. Int. PLC | | 05/15/20 | | | 1,107 | | | | (15,147 | ) | | | — | | | | (15,147 | ) |
iShares Core S&P Small-Capital ETF | | 1M USD LIBOR | | MS & Co. Int. PLC | | 05/15/20 | | | 751 | | | | (12,449 | ) | | | — | | | | (12,449 | ) |
iShares Expanded Tech-Software Sector ETF | | 1M USD LIBOR | | MS & Co. Int. PLC | | 05/15/20 | | | 890 | | | | 7,933 | | | | — | | | | 7,933 | |
iShares PHLX Semiconductor ETF | | 1M USD LIBOR | | MS & Co. Int. PLC | | 05/15/20 | | | 2,061 | | | | (19,429 | ) | | | — | | | | (19,429 | ) |
iShares Russell 2000 Growth ETF | | 1M USD LIBOR | | MS & Co. Int. PLC | | 05/15/20 | | | 965 | | | | (17,044 | ) | | | — | | | | (17,044 | ) |
iShares Russell Mid-Capital Growth ETF | | 1M USD LIBOR | | MS & Co. Int. PLC | | 05/15/20 | | | 381 | | | | (1,358 | ) | | | — | | | | (1,358 | ) |
iShares S&P NA Tech-Software Sector ETF | | 1M USD LIBOR | | MS & Co. Int. PLC | | 05/15/20 | | | 1,766 | | | | (8,134 | ) | | | — | | | | (8,134 | ) |
iShares S&P NA Technology-Multimedia Networking ETF | | 1M USD LIBOR | | MS & Co. Int. PLC | | 05/15/20 | | | 708 | | | | (4,407 | ) | | | — | | | | (4,407 | ) |
iShares S&P Small-Capital 600 Growth ETF | | 1M USD LIBOR | | MS & Co. Int. PLC | | 05/15/20 | | | 405 | | | | (5,616 | ) | | | — | | | | (5,616 | ) |
iShares U.S. Technology ETF | | 1M USD LIBOR | | MS & Co. Int. PLC | | 05/15/20 | | | 850 | | | | (6,155 | ) | | | — | | | | (6,155 | ) |
Just Eat PLC | | 0.710 | | MS & Co. Int. PLC | | 09/15/21 | | | 56 | | | | (5,951 | ) | | | — | | | | (5,951 | ) |
Marvell Technology Group Ltd. | | 1M USD LIBOR | | MS & Co. Int. PLC | | 05/15/20 | | | 245 | | | | (304 | ) | | | — | | | | (304 | ) |
Mastercard, Inc. Class A | | 1M USD LIBOR | | MS & Co. Int. PLC | | 05/15/20 | | | 354 | | | | (2,529 | ) | | | — | | | | (2,529 | ) |
MediaTek, Inc. | | 1M USD LIBOR | | MS & Co. Int. PLC | | 05/15/20 | | | 179 | | | | 20,778 | | | | — | | | | 20,778 | |
Microsoft Corp. | | 1M USD LIBOR | | MS & Co. Int. PLC | | 05/15/20 | | | 73 | | | | 855 | | | | — | | | | 855 | |
PayPal Holdings, Inc. | | 1M USD LIBOR | | MS & Co. Int. PLC | | 05/15/20 | | | 533 | | | | 2,182 | | | | — | | | | 2,182 | |
| | |
| 28 | | The accompanying notes are an integral part of these financial statements. |
GOLDMAN SACHS MULTI-MANAGER ALTERNATIVES FUND
|
| ADDITIONAL INVESTMENT INFORMATION (continued) |
OVER THE COUNTER TOTAL RETURN SWAP CONTRACTS# (continued)
| | | | | | | | | | | | | | | | | | | | | | |
| Reference Obligation/Index(a) | | Financing Rate
Paid (Received) by the Fund | | Counterparty | | Termination
Date | | Notional
Amount/
Contracts
(000s) | | | Value | | | Upfront
Premiums
(Received)
Paid | | | Unrealized
Appreciation/
(Depreciation) | |
Pure Storage Class A | | 1M USD LIBOR | | MS & Co. Int. PLC | | 05/15/20 | | $ | 11 | | | $ | 1,123 | | | $ | — | | | $ | 1,123 | |
PureFunds ISE Cyber | | 1M USD LIBOR | | MS & Co. Int. PLC | | 05/15/20 | | | 516 | | | | (14,434 | ) | | | — | | | | (14,434 | ) |
PureFunds ISE Cyber | | 1M USD LIBOR | | MS & Co. Int. PLC | | 05/15/20 | | | 131 | | | | (1,912 | ) | | | — | | | | (1,912 | ) |
S&P 500 High Beta Total Return Index | | 1M USD LIBOR | | MS & Co. Int. PLC | | 05/15/20 | | | 896 | | | | (5,269 | ) | | | — | | | | (5,269 | ) |
Salesforce.com, Inc. | | 1M USD LIBOR | | MS & Co. Int. PLC | | 05/15/20 | | | 311 | | | | 7,371 | | | | — | | | | 7,371 | |
ServiceNow, Inc. | | 1M USD LIBOR | | MS & Co. Int. PLC | | 05/15/20 | | | 358 | | | | (35,550 | ) | | | — | | | | (35,550 | ) |
SPDR S&P 500 ETF | | 1M USD LIBOR | | MS & Co. Int. PLC | | 05/15/20 | | | 68 | | | | (776 | ) | | | — | | | | (776 | ) |
SPDR S&P MidCap 400 ETF | | 1M USD LIBOR | | MS & Co. Int. PLC | | 05/15/20 | | | 468 | | | | (5,101 | ) | | | — | | | | (5,101 | ) |
Splunk, Inc. | | 1M USD LIBOR | | MS & Co. Int. PLC | | 05/15/20 | | | 99 | | | | 3 | | | | — | | | | 3 | |
Spotify Technology SA | | 1M USD LIBOR | | MS & Co. Int. PLC | | 05/15/20 | | | 7 | | | | 1,561 | | | | — | | | | 1,561 | |
TLG Immobilien AG | | 0.000% | | MS & Co. Int. PLC | | 07/07/21 | | | 8 | | | | 1,395 | | | | — | | | | 1,395 | |
TransUnion | | 1M USD LIBOR | | MS & Co. Int. PLC | | 05/15/20 | | | 362 | | | | 3,982 | | | | — | | | | 3,982 | |
TriNet Group, Inc. | | 1M USD LIBOR | | MS & Co. Int. PLC | | 05/15/20 | | | 590 | | | | (72,754 | ) | | | — | | | | (72,754 | ) |
Trupanion, Inc. | | 1M USD LIBOR | | MS & Co. Int. PLC | | 05/15/20 | | | 116 | | | | 4,599 | | | | — | | | | 4,599 | |
US Momentum | | 1M USD LIBOR | | MS & Co. Int. PLC | | 10/30/20 | | | 1,444 | | | | (4,857 | ) | | | — | | | | (4,857 | ) |
Vanguard Small-Capital Growth ETF | | 1M USD LIBOR | | MS & Co. Int. PLC | | 05/15/20 | | | 1,027 | | | | (2,449 | ) | | | — | | | | (2,449 | ) |
VeriSign, Inc. | | 1M USD LIBOR | | MS & Co. Int. PLC | | 05/15/20 | | | 313 | | | | 5,357 | | | | — | | | | 5,357 | |
Visa, Inc. Class A | | 1M USD LIBOR | | MS & Co. Int. PLC | | 05/15/20 | | | 625 | | | | (142 | ) | | | — | | | | (142 | ) |
WEX, Inc. | | 1M USD LIBOR | | MS & Co. Int. PLC | | 05/15/20 | | | 869 | | | | (83,350 | ) | | | — | | | | (83,350 | ) |
3SBio, Inc. | | 1.777 | | UBS AG (London) | | 12/14/20 | | | 149 | | | | 2,054 | | | | — | | | | 2,054 | |
A.P. Moller – Maersk A/S | | 0.537 | | UBS AG (London) | | 12/14/20 | | | — | * | | | (4,511 | ) | | | — | | | | (4,511 | ) |
AAC Technologies Holding, Inc. | | (1.777) | | UBS AG (London) | | 12/14/20 | | | 58 | | | | (15,106 | ) | | | — | | | | (15,106 | ) |
ABB Ltd. | | (0.790) | | UBS AG (London) | | 12/14/20 | | | 17 | | | | 2,120 | | | | — | | | | 2,120 | |
Accor SA | | (0.569) | | UBS AG (London) | | 12/14/20 | | | 8 | | | | 3,420 | | | | — | | | | 3,420 | |
Accton Technology Corp. | | 1.785 | | UBS AG (London) | | 12/14/20 | | | 33 | | | | (1,126 | ) | | | — | | | | (1,126 | ) |
Acs Actividades De Construccion Y Servicios SA | | 0.569 | | UBS AG (London) | | 03/29/21 | | | 9 | | | | (3,577 | ) | | | — | | | | (3,577 | ) |
Adobe, Inc. | | 1.785 | | UBS AG (London) | | 12/14/20 | | | — | * | | | 3,186 | | | | — | | | | 3,186 | |
Advantech Co. Ltd. | | 1.785 | | UBS AG (London) | | 12/14/20 | | | 11 | | | | 1,938 | | | | — | | | | 1,938 | |
Aena Sme SA | | 0.569 | | UBS AG (London) | | 03/29/21 | | | 2 | | | | (6,325 | ) | | | — | | | | (6,325 | ) |
AEON Co. Ltd. | | (0.112) | | UBS AG (London) | | 12/11/20 | | | 16 | | | | 474 | | | | — | | | | 474 | |
Aeon Mall Co. Ltd. | | 0.112 | | UBS AG (London) | | 12/11/20 | | | 22 | | | | (515 | ) | | | — | | | | (515 | ) |
Agco Corp. | | 1.785 | | UBS AG (London) | | 12/14/20 | | | 3 | | | | 1,699 | | | | — | | | | 1,699 | |
Air Lease Corp. | | 1.785 | | UBS AG (London) | | 12/14/20 | | | 7 | | | | (5,095 | ) | | | — | | | | (5,095 | ) |
Air Water, Inc. | | (0.112) | | UBS AG (London) | | 12/11/20 | | | 16 | | | | 1,584 | | | | — | | | | 1,584 | |
Airbus SE | | (0.569) | | UBS AG (London) | | 12/14/20 | | | 3 | | | | (9,947 | ) | | | — | | | | (9,947 | ) |
Aisin SEiki Co. Ltd. | | 0.112 | | UBS AG (London) | | 12/11/20 | | | 10 | | | | 47,992 | | | | — | | | | 47,992 | |
Alaska Air Group, Inc. | | 1.785 | | UBS AG (London) | | 12/14/20 | | | 2 | | | | (702 | ) | | | — | | | | (702 | ) |
Alcoa Corp. | | (1.600) | | UBS AG (London) | | 12/14/20 | | | 14 | | | | 11,614 | | | | — | | | | 11,614 | |
Alfa Laval Ab | | (0.162) | | UBS AG (London) | | 12/14/20 | | | 6 | | | | 53 | | | | — | | | | 53 | |
Alibaba Pictures Group Ltd. | | (1.777) | | UBS AG (London) | | 12/14/20 | | | 342 | | | | (210 | ) | | | — | | | | (210 | ) |
Allogene Therapeutics, Inc. | | (1.600) | | UBS AG (London) | | 12/14/20 | | | 3 | | | | 329 | | | | — | | | | 329 | |
Altice Europe NV | | 0.569 | | UBS AG (London) | | 12/14/20 | | | 48 | | | | (1,103 | ) | | | — | | | | (1,103 | ) |
Altria Group, Inc. | | 1.785 | | UBS AG (London) | | 12/14/20 | | | 2 | | | | (2,582 | ) | | | — | | | | (2,582 | ) |
Ametek, Inc. | | 1.785 | | UBS AG (London) | | 12/14/20 | | | 4 | | | | 38 | | | | — | | | | 38 | |
AMP Ltd. | | (0.922) | | UBS AG (London) | | 12/14/20 | | | 155 | | | | (30 | ) | | | — | | | | (30 | ) |
Amplifon SpA | | 0.569 | | UBS AG (London) | | 12/14/20 | | | 15 | | | | 13,115 | | | | — | | | | 13,115 | |
AMS AG | | 0.790 | | UBS AG (London) | | 12/14/20 | | | 6 | | | | (6,713 | ) | | | — | | | | (6,713 | ) |
Anaplan, Inc. | | (1.600) | | UBS AG (London) | | 12/14/20 | | | 1 | | | | 2,006 | | | | — | | | | 2,006 | |
Andritz AG | | (0.569) | | UBS AG (London) | | 12/14/20 | | | 7 | | | | 890 | | | | — | | | | 890 | |
Anhui Conch Cement Co. Ltd. | | 1.777 | | UBS AG (London) | | 12/14/20 | | | 61 | | | | 2,775 | | | | — | | | | 2,775 | |
| | |
| The accompanying notes are an integral part of these financial statements. | | 29 |
GOLDMAN SACHS MULTI-MANAGER ALTERNATIVES FUND
Consolidated Schedule of Investments(continued)
October 31, 2019
|
| ADDITIONAL INVESTMENT INFORMATION (continued) |
OVER THE COUNTER TOTAL RETURN SWAP CONTRACTS# (continued)
| | | | | | | | | | | | | | | | | | | | | | |
| Reference Obligation/Index(a) | | Financing Rate
Paid (Received) by the Fund | | Counterparty | | Termination
Date | | Notional
Amount/
Contracts
(000s) | | | Value | | | Upfront
Premiums
(Received)
Paid | | | Unrealized
Appreciation/
(Depreciation) | |
Archer-Daniels-Midland Co. | | (1.600)% | | UBS AG (London) | | 12/14/20 | | $ | 8 | | | $ | (4,153 | ) | | $ | — | | | $ | (4,153 | ) |
Aristocrat Leisure Ltd. | | 0.922 | | UBS AG (London) | | 12/14/20 | | | 14 | | | | (5,266 | ) | | | — | | | | (5,266 | ) |
Arrow Electronics, Inc. | | (1.600) | | UBS AG (London) | | 12/14/20 | | | 2 | | | | (1,645 | ) | | | — | | | | (1,645 | ) |
Asahi Kasei Corp. | | 0.112 | | UBS AG (London) | | 12/11/20 | | | 36 | | | | 1,169 | | | | — | | | | 1,169 | |
Ashland Global Holdings, Inc. | | (1.600) | | UBS AG (London) | | 12/14/20 | | | 4 | | | | 4,220 | | | | — | | | | 4,220 | |
Ashtead Group PLC | | 0.677 | | UBS AG (London) | | 12/14/20 | | | 13 | | | | 4,834 | | | | — | | | | 4,834 | |
Asics Corp. | | (0.112) | | UBS AG (London) | | 12/11/20 | | | 9 | | | | 2,761 | | | | — | | | | 2,761 | |
ASM International NV | | 0.569 | | UBS AG (London) | | 12/14/20 | | | 4 | | | | (10,468 | ) | | | — | | | | (10,468 | ) |
Astellas Pharma, Inc. | | 0.112 | | UBS AG (London) | | 12/11/20 | | | 23 | | | | 14,702 | | | | — | | | | 14,702 | |
Astrazeneca PLC | | (0.677) | | UBS AG (London) | | 12/14/20 | | | 4 | | | | (10,039 | ) | | | — | | | | (10,039 | ) |
Atlas Arteria | | (0.922) | | UBS AG (London) | | 12/14/20 | | | 67 | | | | (6,881 | ) | | | — | | | | (6,881 | ) |
Atmos Energy Corp. | | 1.785 | | UBS AG (London) | | 12/14/20 | | | 1 | | | | 846 | | | | — | | | | 846 | |
Atos SE | | (0.569) | | UBS AG (London) | | 12/14/20 | | | 3 | | | | (2,336 | ) | | | — | | | | (2,336 | ) |
Au Optronics Corp. | | (1.785) | | UBS AG (London) | | 12/14/20 | | | 1,183 | | | | 12,503 | | | | — | | | | 12,503 | |
Autoliv, Inc. | | (1.600) | | UBS AG (London) | | 12/14/20 | | | 4 | | | | 7,069 | | | | — | | | | 7,069 | |
Avalara, Inc. | | (1.600) | | UBS AG (London) | | 12/14/20 | | | 4 | | | | 12,275 | | | | — | | | | 12,275 | |
Axfood AB | | 0.162 | | UBS AG (London) | | 12/14/20 | | | 17 | | | | 2,630 | | | | — | | | | 2,630 | |
Axon Enterprise, Inc. | | (1.600) | | UBS AG (London) | | 12/14/20 | | | 5 | | | | 9,651 | | | | — | | | | 9,651 | |
Bank Ozk Co. | | 1.785 | | UBS AG (London) | | 12/14/20 | | | 11 | | | | (12,163 | ) | | | — | | | | (12,163 | ) |
Barclays PLC | | 0.677 | | UBS AG (London) | | 12/14/20 | | | 35 | | | | (1,359 | ) | | | — | | | | (1,359 | ) |
Beach Energy Ltd. | | 0.922 | | UBS AG (London) | | 12/14/20 | | | 210 | | | | (5,638 | ) | | | — | | | | (5,638 | ) |
Becton Dickinson & Co. | | (1.600) | | UBS AG (London) | | 12/14/20 | | | — | * | | | (536 | ) | | | — | | | | (536 | ) |
BHP Group PLC | | 0.677 | | UBS AG (London) | | 12/14/20 | | | 10 | | | | (3,668 | ) | | | — | | | | (3,668 | ) |
BIO Rad Laboratories, Inc. | | 1.785 | | UBS AG (London) | | 12/14/20 | | | 1 | | | | (6,725 | ) | | | — | | | | (6,725 | ) |
BOC Aviation Ltd. | | (1.777) | | UBS AG (London) | | 12/14/20 | | | 48 | | | | (9,931 | ) | | | — | | | | (9,931 | ) |
Booz Allen Hamilton Holding Corp. | | 1.785 | | UBS AG (London) | | 12/14/20 | | | 4 | | | | 1,539 | | | | — | | | | 1,539 | |
Boskalis Westminster NV | | (0.569) | | UBS AG (London) | | 12/14/20 | | | 2 | | | | 459 | | | | — | | | | 459 | |
Boston Scientific Corp. | | (1.600) | | UBS AG (London) | | 12/14/20 | | | 7 | | | | 401 | | | | — | | | | 401 | |
Bouygues SA | | (0.569) | | UBS AG (London) | | 12/14/20 | | | 7 | | | | 674 | | | | — | | | | 674 | |
Brembo SpA | | (0.569) | | UBS AG (London) | | 12/14/20 | | | 37 | | | | 11,860 | | | | — | | | | 11,860 | |
Bright Horizons Family Solutions, Inc. | | 1.785 | | UBS AG (London) | | 12/14/20 | | | 3 | | | | 3,598 | | | | — | | | | 3,598 | |
Brilliance China Automotive | | (1.777) | | UBS AG (London) | | 12/14/20 | | | 118 | | | | 4,239 | | | | — | | | | 4,239 | |
British American Tobacco PLC | | 0.677 | | UBS AG (London) | | 12/14/20 | | | 8 | | | | 6,322 | | | | — | | | | 6,322 | |
Brother Industries Ltd. | | 0.112 | | UBS AG (London) | | 12/11/20 | | | 20 | | | | (231 | ) | | | — | | | | (231 | ) |
Bruker Corp. | | 1.785 | | UBS AG (London) | | 12/14/20 | | | 1 | | | | 361 | | | | — | | | | 361 | |
Brunswick Corp. | | (1.600) | | UBS AG (London) | | 12/14/20 | | | 2 | | | | 2,629 | | | | — | | | | 2,629 | |
Bucher Industries AG | | 0.790 | | UBS AG (London) | | 12/14/20 | | | 1 | | | | (1,010 | ) | | | — | | | | (1,010 | ) |
Bunge Ltd. | | (1.600) | | UBS AG (London) | | 12/14/20 | | | 5 | | | | 11,108 | | | | — | | | | 11,108 | |
Bunzl PLC | | (0.677) | | UBS AG (London) | | 12/14/20 | | | 8 | | | | (3,740 | ) | | | — | | | | (3,740 | ) |
Burberry Group PLC | | 0.677 | | UBS AG (London) | | 12/14/20 | | | 4 | | | | 706 | | | | — | | | | 706 | |
BWX Technologies, Inc. | | (1.600) | | UBS AG (London) | | 12/14/20 | | | 1 | | | | (63 | ) | | | — | | | | (63 | ) |
Byd Co. Ltd. | | (1.777) | | UBS AG (London) | | 12/14/20 | | | 74 | | | | 26,793 | | | | — | | | | 26,793 | |
Caltex Australia Ltd. | | (0.922) | | UBS AG (London) | | 12/14/20 | | | 7 | | | | 2,721 | | | | — | | | | 2,721 | |
Campbell Soup Co. | | (1.600) | | UBS AG (London) | | 12/14/20 | | | 7 | | | | (1,616 | ) | | | — | | | | (1,616 | ) |
Cargurus, Inc. | | 1.785 | | UBS AG (London) | | 12/14/20 | | | 5 | | | | 7,070 | | | | — | | | | 7,070 | |
Carl Zeiss Meditec AG | | 0.569 | | UBS AG (London) | | 12/14/20 | | | 3 | | | | 7,193 | | | | — | | | | 7,193 | |
Carlisle Cos., Inc. | | 1.785 | | UBS AG (London) | | 12/14/20 | | | 2 | | | | (8,011 | ) | | | — | | | | (8,011 | ) |
Carrefour SA | | (0.569) | | UBS AG (London) | | 12/14/20 | | | 18 | | | | 6,393 | | | | — | | | | 6,393 | |
Cathay Financial Holding Co. | | 1.785 | | UBS AG (London) | | 12/14/20 | | | 190 | | | | (4,815 | ) | | | — | | | | (4,815 | ) |
Cellnex Telecom SA | | (0.569) | | UBS AG (London) | | 03/29/21 | | | 18 | | | | (9,939 | ) | | | — | | | | (9,939 | ) |
Celltrion, Inc. | | (1.785) | | UBS AG (London) | | 12/14/20 | | | 3 | | | | 5,323 | | | | — | | | | 5,323 | |
| | |
| 30 | | The accompanying notes are an integral part of these financial statements. |
GOLDMAN SACHS MULTI-MANAGER ALTERNATIVES FUND
|
| ADDITIONAL INVESTMENT INFORMATION (continued) |
OVER THE COUNTER TOTAL RETURN SWAP CONTRACTS# (continued)
| | | | | | | | | | | | | | | | | | | | | | |
| Reference Obligation/Index(a) | | Financing Rate
Paid (Received) by the Fund | | Counterparty | | Termination
Date | | Notional
Amount/
Contracts
(000s) | | | Value | | | Upfront
Premiums
(Received)
Paid | | | Unrealized
Appreciation/
(Depreciation) | |
Centene Corp. | | 1.785% | | UBS AG (London) | | 12/14/20 | | $ | 6 | | | $ | 20,538 | | | $ | — | | | $ | 20,538 | |
Centrica PLC | | (0.677) | | UBS AG (London) | | 12/14/20 | | | 403 | | | | (16,485 | ) | | | — | | | | (16,485 | ) |
Challenger Ltd. | | (0.922) | | UBS AG (London) | | 12/14/20 | | | 45 | | | | (3,252 | ) | | | — | | | | (3,252 | ) |
Cheniere Energy, Inc. | | (1.600) | | UBS AG (London) | | 12/14/20 | | | 1 | | | | 734 | | | | — | | | | 734 | |
China Communications Construction Co. Ltd. | | (1.777) | | UBS AG (London) | | 12/14/20 | | | 188 | | | | 4,957 | | | | — | | | | 4,957 | |
China Conch Venture Holdings Ltd. | | 1.777 | | UBS AG (London) | | 12/14/20 | | | 22 | | | | (693 | ) | | | — | | | | (693 | ) |
China International Capital Corp. Ltd. | | (1.777) | | UBS AG (London) | | 12/14/20 | | | 136 | | | | 311 | | | | — | | | | 311 | |
China Life Insurance Co. Ltd. | | 1.777 | | UBS AG (London) | | 12/14/20 | | | 68 | | | | 3,451 | | | | — | | | | 3,451 | |
China Medical System Holding | | 1.648 | | UBS AG (London) | | 12/14/20 | | | 99 | | | | 260 | | | | — | | | | 260 | |
China Petroleum & Chem Corp. | | 1.777 | | UBS AG (London) | | 12/14/20 | | | 318 | | | | (8,729 | ) | | | — | | | | (8,729 | ) |
China Resources Beer Holdings | | 1.777 | | UBS AG (London) | | 12/14/20 | | | 64 | | | | (7,536 | ) | | | — | | | | (7,536 | ) |
China Shenhua Energy Co. Ltd. | | 1.777 | | UBS AG (London) | | 12/14/20 | | | 169 | | | | 1,014 | | | | — | | | | 1,014 | |
Cintas Corp. | | 1.785 | | UBS AG (London) | | 12/14/20 | | | 1 | | | | (7,515 | ) | | | — | | | | (7,515 | ) |
CITIC Ltd. | | 1.777 | | UBS AG (London) | | 12/14/20 | | | 183 | | | | 972 | | | | — | | | | 972 | |
CJ Cheiljedang Corp. | | (1.785) | | UBS AG (London) | | 12/14/20 | | | 1 | | | | (1,388 | ) | | | — | | | | (1,388 | ) |
Coca-Cola Bottlers Japan Holding | | (0.112) | | UBS AG (London) | | 12/11/20 | | | 16 | | | | 1,499 | | | | — | | | | 1,499 | |
Coca-Cola Co. | | (1.600) | | UBS AG (London) | | 12/14/20 | | | 5 | | | | (6,829 | ) | | | — | | | | (6,829 | ) |
Coca-Cola European Partners | | 1.785 | | UBS AG (London) | | 12/14/20 | | | 6 | | | | 2,729 | | | | — | | | | 2,729 | |
Coherent, Inc. | | (1.600) | | UBS AG (London) | | 12/14/20 | | | 2 | | | | (3,569 | ) | | | — | | | | (3,569 | ) |
ComfortDelGro Corp. Ltd. | | 1.782 | | UBS AG (London) | | 12/11/20 | | | 46 | | | | (2,677 | ) | | | — | | | | (2,677 | ) |
Commonwealth Bank of Australia | | (0.922) | | UBS AG (London) | | 12/14/20 | | | 2 | | | | 2,414 | | | | — | | | | 2,414 | |
Community Bank System, Inc. | | (1.600) | | UBS AG (London) | | 12/14/20 | | | 4 | | | | 2,518 | | | | — | | | | 2,518 | |
Coty, Inc. | | (1.600) | | UBS AG (London) | | 12/14/20 | | | 27 | | | | (508 | ) | | | — | | | | (508 | ) |
Cree, Inc. | | (1.600) | | UBS AG (London) | | 12/14/20 | | | 6 | | | | 3,371 | | | | — | | | | 3,371 | |
Crown Resorts Ltd. | | (0.922) | | UBS AG (London) | | 12/14/20 | | | 40 | | | | (17,064 | ) | | | — | | | | (17,064 | ) |
CSPC Pharmaceutical Group | | 1.777 | | UBS AG (London) | | 12/14/20 | | | 140 | | | | 21,362 | | | | — | | | | 21,362 | |
Curtiss-Wright Corp. | | 1.785 | | UBS AG (London) | | 12/14/20 | | | 2 | | | | 13,570 | | | | — | | | | 13,570 | |
D.R. Horton, Inc. | | 1.785 | | UBS AG (London) | | 12/14/20 | | | 7 | | | | 5,525 | | | | — | | | | 5,525 | |
Daelim Industrial Co. Ltd. | | 1.785 | | UBS AG (London) | | 12/14/20 | | | 4 | | | | (3,618 | ) | | | — | | | | (3,618 | ) |
Daimler AG | | (0.569) | | UBS AG (London) | | 12/14/20 | | | 6 | | | | 5,934 | | | | — | | | | 5,934 | |
Davide Campari-Milano SpA | | (0.569) | | UBS AG (London) | | 12/14/20 | | | 20 | | | | 560 | | | | — | | | | 560 | |
Deere & Co. | | (1.600) | | UBS AG (London) | | 12/14/20 | | | 2 | | | | (1,657 | ) | | | — | | | | (1,657 | ) |
Delta Electronics, Inc. | | 1.785 | | UBS AG (London) | | 12/14/20 | | | 65 | | | | (155 | ) | | | — | | | | (155 | ) |
Demant A/S | | (0.537) | | UBS AG (London) | | 12/14/20 | | | 13 | | | | (6,132 | ) | | | — | | | | (6,132 | ) |
Dentsu, Inc. | | 0.112 | | UBS AG (London) | | 12/11/20 | | | 1 | | | | (585 | ) | | | — | | | | (585 | ) |
Dexcom, Inc. | | (1.600) | | UBS AG (London) | | 12/14/20 | | | 1 | | | | 659 | | | | — | | | | 659 | |
Dialog Semiconductor PLC | | (0.569) | | UBS AG (London) | | 12/14/20 | | | 7 | | | | (11,755 | ) | | | — | | | | (11,755 | ) |
Discovery Communications, Inc. | | (1.785) | | UBS AG (London) | | 12/14/20 | | | 10 | | | | (4,887 | ) | | | — | | | | (4,887 | ) |
DKSH Holding AG | | (0.790) | | UBS AG (London) | | 12/14/20 | | | 7 | | | | (21 | ) | | | — | | | | (21 | ) |
Dolby Laboratories, Inc. | | 1.785 | | UBS AG (London) | | 12/14/20 | | | 5 | | | | 1,797 | | | | — | | | | 1,797 | |
Dollar Tree, Inc. | | (1.600) | | UBS AG (London) | | 12/14/20 | | | 3 | | | | 7,415 | | | | — | | | | 7,415 | |
Dominion Energy, Inc. | | (1.600) | | UBS AG (London) | | 12/14/20 | | | 4 | | | | (3,527 | ) | | | — | | | | (3,527 | ) |
Dropbox, Inc. | | 1.785 | | UBS AG (London) | | 12/14/20 | | | 4 | | | | (940 | ) | | | — | | | | (940 | ) |
Dufry AG | | 0.790 | | UBS AG (London) | | 12/14/20 | | | 2 | | | | (2,224 | ) | | | — | | | | (2,224 | ) |
East Japan Railway Co. | | 0.112 | | UBS AG (London) | | 12/11/20 | | | 4 | | | | 707 | | | | — | | | | 707 | |
East West Bancorp, Inc. | | 1.785 | | UBS AG (London) | | 12/14/20 | | | 7 | | | | (5,539 | ) | | | — | | | | (5,539 | ) |
easyJet PLC | | (0.677) | | UBS AG (London) | | 12/14/20 | | | 3 | | | | (1,411 | ) | | | — | | | | (1,411 | ) |
Eaton Vance Corp. | | 1.785 | | UBS AG (London) | | 12/14/20 | | | 1 | | | | (685 | ) | | | — | | | | (685 | ) |
Eclat Textile Co. Ltd. | | 1.785 | | UBS AG (London) | | 12/14/20 | | | 29 | | | | 16 | | | | — | | | | 16 | |
Eiffage SA | | 0.569 | | UBS AG (London) | | 12/14/20 | | | — | * | | | 225 | | | | — | | | | 225 | |
Elastic NV | | (1.600) | | UBS AG (London) | | 12/14/20 | | | 4 | | | | 8,118 | | | | — | | | | 8,118 | |
| | |
| The accompanying notes are an integral part of these financial statements. | | 31 |
GOLDMAN SACHS MULTI-MANAGER ALTERNATIVES FUND
Consolidated Schedule of Investments(continued)
October 31, 2019
|
| ADDITIONAL INVESTMENT INFORMATION (continued) |
OVER THE COUNTER TOTAL RETURN SWAP CONTRACTS# (continued)
| | | | | | | | | | | | | | | | | | | | | | |
| Reference Obligation/Index(a) | | Financing Rate
Paid (Received) by the Fund | | Counterparty | | Termination
Date | | Notional
Amount/
Contracts
(000s) | | | Value | | | Upfront
Premiums
(Received)
Paid | | | Unrealized
Appreciation/
(Depreciation) | |
Electricite de France SA | | (0.569)% | | UBS AG (London) | | 12/14/20 | | $ | 1 | | | $ | (208 | ) | | $ | — | | | $ | (208 | ) |
Electrocomponents PLC | | 0.677 | | UBS AG (London) | | 12/14/20 | | | 6 | | | | (137 | ) | | | — | | | | (137 | ) |
Elekta AB Class B | | (0.162) | | UBS AG (London) | | 12/14/20 | | | 20 | | | | (782 | ) | | | — | | | | (782 | ) |
Eli Lilly & Co. | | (1.600) | | UBS AG (London) | | 12/14/20 | | | 1 | | | | (1,512 | ) | | | — | | | | (1,512 | ) |
Elis SA | | (0.569) | | UBS AG (London) | | 12/14/20 | | | 21 | | | | (1,296 | ) | | | — | | | | (1,296 | ) |
EMS-Chemie Holding AG | | 0.790 | | UBS AG (London) | | 12/14/20 | | | — | * | | | (539 | ) | | | — | | | | (539 | ) |
Encompass Health Corp. | | (1.600) | | UBS AG (London) | | 12/14/20 | | | 4 | | | | (2,375 | ) | | | — | | | | (2,375 | ) |
Entergy Corp | | (1.600) | | UBS AG (London) | | 12/14/20 | | | 2 | | | | (4,812 | ) | | | — | | | | (4,812 | ) |
Eog Resources, Inc. | | 1.785 | | UBS AG (London) | | 12/14/20 | | | 3 | | | | (6,952 | ) | | | — | | | | (6,952 | ) |
Equifax, Inc. | | (1.600) | | UBS AG (London) | | 12/14/20 | | | 2 | | | | (1,891 | ) | | | — | | | | (1,891 | ) |
Equinor ASA | | 1.200 | | UBS AG (London) | | 12/14/20 | | | 11 | | | | (2,165 | ) | | | — | | | | (2,165 | ) |
Essilorluxottica | | 0.569 | | UBS AG (London) | | 12/14/20 | | | 2 | | | | (10,102 | ) | | | — | | | | (10,102 | ) |
Evolution Gaming Group AB | | 0.162 | | UBS AG (London) | | 12/14/20 | | | 17 | | | | 7,760 | | | | — | | | | 7,760 | |
Evraz PLC | | 0.677 | | UBS AG (London) | | 12/14/20 | | | 29 | | | | (5,763 | ) | | | — | | | | (5,763 | ) |
Expedia Group, Inc. | | (1.600) | | UBS AG (London) | | 12/14/20 | | | 2 | | | | 948 | | | | — | | | | 948 | |
Fair Isaac Corp. | | 1.785 | | UBS AG (London) | | 12/14/20 | | | — | * | | | 317 | | | | — | | | | 317 | |
Fast Retailing Co. Ltd. | | (0.112) | | UBS AG (London) | | 12/11/20 | | | 1 | | | | 2,562 | | | | — | | | | 2,562 | |
Faurecia SA | | 0.569 | | UBS AG (London) | | 12/14/20 | | | 8 | | | | (28,827 | ) | | | — | | | | (28,827 | ) |
Fedex Corp. | | (1.600) | | UBS AG (London) | | 12/14/20 | | | 2 | | | | 9,482 | | | | — | | | | 9,482 | |
Feng Tay Entrprise Co. Ltd. | | 1.785 | | UBS AG (London) | | 12/14/20 | | | 54 | | | | 4,506 | | | | — | | | | 4,506 | |
Ferrovial SA | | (0.569) | | UBS AG (London) | | 03/29/21 | | | 12 | | | | (4,519 | ) | | | — | | | | (4,519 | ) |
Fevertree Drinks PLC | | 0.677 | | UBS AG (London) | | 12/14/20 | | | 5 | | | | (6,314 | ) | | | — | | | | (6,314 | ) |
Fielmann AG | | 0.569 | | UBS AG (London) | | 12/14/20 | | | 1 | | | | 76 | | | | — | | | | 76 | |
Fila Korea Ltd. | | (1.785) | | UBS AG (London) | | 12/14/20 | | | 3 | | | | 38 | | | | — | | | | 38 | |
First Financial Bankshares, Inc. | | (1.600) | | UBS AG (London) | | 12/14/20 | | | 10 | | | | 18,130 | | | | — | | | | 18,130 | |
First Solar, Inc. | | (1.600) | | UBS AG (London) | | 12/14/20 | | | 5 | | | | 7,893 | | | | — | | | | 7,893 | |
Flight Centre Travel Group | | (0.922) | | UBS AG (London) | | 12/14/20 | | | 11 | | | | (5,901 | ) | | | — | | | | (5,901 | ) |
Flughafen Zuerich AG | | 0.790 | | UBS AG (London) | | 12/14/20 | | | 2 | | | | 182 | | | | — | | | | 182 | |
Fortinet, Inc. | | 1.785 | | UBS AG (London) | | 12/14/20 | | | 3 | | | | 2,535 | | | | — | | | | 2,535 | |
Fortive Corp. | | (1.600) | | UBS AG (London) | | 12/14/20 | | | 2 | | | | (1,249 | ) | | | — | | | | (1,249 | ) |
Fuji Electric Co. Ltd. | | 0.112 | | UBS AG (London) | | 12/11/20 | | | 10 | | | | (3,630 | ) | | | — | | | | (3,630 | ) |
Fujifilm Holdings Corp. | | 0.112 | | UBS AG (London) | | 12/11/20 | | | 7 | | | | 1,647 | | | | — | | | | 1,647 | |
G4S PLC | | (0.677) | | UBS AG (London) | | 12/14/20 | | | 131 | | | | (1,800 | ) | | | — | | | | (1,800 | ) |
Galaxy Entertainment Group | | (1.777) | | UBS AG (London) | | 12/14/20 | | | 22 | | | | (2,889 | ) | | | — | | | | (2,889 | ) |
Gea Group AG | | (0.569) | | UBS AG (London) | | 12/14/20 | | | 10 | | | | 12,870 | | | | — | | | | 12,870 | |
General Mills, Inc. | | 1.785 | | UBS AG (London) | | 12/14/20 | | | 6 | | | | 5,582 | | | | — | | | | 5,582 | |
Genmab A/S | | 0.537 | | UBS AG (London) | | 12/14/20 | | | 2 | | | | 8,575 | | | | — | | | | 8,575 | |
Genpact Ltd. | | 1.785 | | UBS AG (London) | | 12/14/20 | | | 8 | | | | 2,699 | | | | — | | | | 2,699 | |
Getinge AB Class B | | (0.162) | | UBS AG (London) | | 12/14/20 | | | 24 | | | | (19,408 | ) | | | — | | | | (19,408 | ) |
Glacier Bancorp, Inc. | | (1.600) | | UBS AG (London) | | 12/14/20 | | | 2 | | | | 1,286 | | | | — | | | | 1,286 | |
Globalwafers Co. Ltd. | | 1.785 | | UBS AG (London) | | 12/14/20 | | | 20 | | | | (11,836 | ) | | | — | | | | (11,836 | ) |
Globant SA | | 1.785 | | UBS AG (London) | | 12/14/20 | | | 3 | | | | 6,773 | | | | — | | | | 6,773 | |
Globus Medical, Inc. | | 1.785 | | UBS AG (London) | | 12/14/20 | | | 6 | | | | 12,038 | | | | — | | | | 12,038 | |
GN Store Nord A/S | | 0.537 | | UBS AG (London) | | 12/14/20 | | | 1 | | | | 3,932 | | | | — | | | | 3,932 | |
Graftech International Ltd. | | 1.785 | | UBS AG (London) | | 12/14/20 | | | 25 | | | | (15,055 | ) | | | — | | | | (15,055 | ) |
GrubHub, Inc. | | (1.600) | | UBS AG (London) | | 12/14/20 | | | 5 | | | | (4,705 | ) | | | — | | | | (4,705 | ) |
Guardant Health, Inc. | | (1.600) | | UBS AG (London) | | 12/14/20 | | | 3 | | | | 3,189 | | | | — | | | | 3,189 | |
Halma PLC | | 0.677 | | UBS AG (London) | | 12/14/20 | | | 16 | | | | 5,452 | | | | — | | | | 5,452 | |
Hang Lung Properties Ltd. | | (1.777) | | UBS AG (London) | | 12/14/20 | | | 106 | | | | (802 | ) | | | — | | | | (802 | ) |
Hankook Tire Co. Ltd. | | 1.785 | | UBS AG (London) | | 12/14/20 | | | 14 | | | | (18,778 | ) | | | — | | | | (18,778 | ) |
Hanmi Pharm Co. Ltd. | | (1.785) | | UBS AG (London) | | 12/14/20 | | | 1 | | | | 1,365 | | | | — | | | | 1,365 | |
| | |
| 32 | | The accompanying notes are an integral part of these financial statements. |
GOLDMAN SACHS MULTI-MANAGER ALTERNATIVES FUND
|
| ADDITIONAL INVESTMENT INFORMATION (continued) |
OVER THE COUNTER TOTAL RETURN SWAP CONTRACTS# (continued)
| | | | | | | | | | | | | | | | | | | | | | |
| Reference Obligation/Index(a) | | Financing Rate
Paid (Received) by the Fund | | Counterparty | | Termination
Date | | Notional
Amount/
Contracts
(000s) | | | Value | | | Upfront
Premiums
(Received)
Paid | | | Unrealized
Appreciation/
(Depreciation) | |
Hasbro, Inc. | | (1.600)% | | UBS AG (London) | | 12/14/20 | | $ | 2 | | | $ | 1,369 | | | $ | — | | | $ | 1,369 | |
Haseko Corp. | | 0.112 | | UBS AG (London) | | 12/11/20 | | | 25 | | | | (1,313 | ) | | | — | | | | (1,313 | ) |
Heineken Holding NV | | 0.569 | | UBS AG (London) | | 12/14/20 | | | 1 | | | | 794 | | | | — | | | | 794 | |
Helmerich & Payne | | (1.600) | | UBS AG (London) | | 12/14/20 | | | 8 | | | | 17,472 | | | | — | | | | 17,472 | |
Hengan International Group | | (1.777) | | UBS AG (London) | | 12/14/20 | | | 28 | | | | (2,653 | ) | | | — | | | | (2,653 | ) |
Hera SpA | | 0.569 | | UBS AG (London) | | 12/14/20 | | | 92 | | | | 9,167 | | | | — | | | | 9,167 | |
Herbalife Ltd | | 1.785 | | UBS AG (London) | | 12/14/20 | | | 4 | | | | 17,108 | | | | — | | | | 17,108 | |
Hikma Pharmaceuticals PLC | | 0.677 | | UBS AG (London) | | 12/14/20 | | | 6 | | | | 1,394 | | | | — | | | | 1,394 | |
Hillenbrand, Inc. | | 1.785 | | UBS AG (London) | | 12/14/20 | | | — | * | | | (63 | ) | | | — | | | | (63 | ) |
Hino Motors Ltd. | | 0.112 | | UBS AG (London) | | 12/11/20 | | | 17 | | | | 4,539 | | | | — | | | | 4,539 | |
Hitachi Chemical Co. Ltd. | | (0.112) | | UBS AG (London) | | 12/11/20 | | | 3 | | | | (2,339 | ) | | | — | | | | (2,339 | ) |
Hochtief AG | | 0.569 | | UBS AG (London) | | 12/14/20 | | | 3 | | | | 2,561 | | | | — | | | | 2,561 | |
HollyFrontier Corp. | | 1.785 | | UBS AG (London) | | 12/14/20 | | | 6 | | | | (19,338 | ) | | | — | | | | (19,338 | ) |
Homeserve PLC | | 0.677 | | UBS AG (London) | | 12/14/20 | | | 27 | | | | 9,852 | | | | — | | | | 9,852 | |
Hon Hai Precision Industry Co. Ltd. | | (1.785) | | UBS AG (London) | | 12/14/20 | | | 75 | | | | 574 | | | | — | | | | 574 | |
Honeywell International, Inc. | | (1.600) | | UBS AG (London) | | 12/14/20 | | | 2 | | | | 964 | | | | — | | | | 964 | |
Hotai Motor Co. Ltd. | | (1.785) | | UBS AG (London) | | 12/14/20 | | | 21 | | | | (6,636 | ) | | | — | | | | (6,636 | ) |
Howden Joinery Group PLC | | 0.677 | | UBS AG (London) | | 12/14/20 | | | 50 | | | | 4,552 | | | | — | | | | 4,552 | |
HP, Inc. | | 1.785 | | UBS AG (London) | | 12/14/20 | | | 10 | | | | (2,211 | ) | | | — | | | | (2,211 | ) |
Hua Hong Semiconductor | | (1.777) | | UBS AG (London) | | 12/14/20 | | | 107 | | | | (2,345 | ) | | | — | | | | (2,345 | ) |
Husqvarna AB | | (0.162) | | UBS AG (London) | | 12/14/20 | | | 26 | | | | (4,632 | ) | | | — | | | | (4,632 | ) |
Hyundai Engneering & Construction Co. | | 1.785 | | UBS AG (London) | | 12/14/20 | | | 8 | | | | (5,391 | ) | | | — | | | | (5,391 | ) |
Hyundai Glovis Co. Ltd. | | 1.785 | | UBS AG (London) | | 12/14/20 | | | 1 | | | | (3,181 | ) | | | — | | | | (3,181 | ) |
Hyundai Mobis Co. Ltd. | | 1.785 | | UBS AG (London) | | 12/14/20 | | | 1 | | | | (382 | ) | | | — | | | | (382 | ) |
Ibiden Co. Ltd. | | (0.102) | | UBS AG (London) | | 12/11/20 | | | 13 | | | | 1,566 | | | | — | | | | 1,566 | |
IDEXX Laboratories, Inc. | | 1.785 | | UBS AG (London) | | 12/14/20 | | | 1 | | | | 17,932 | | | | — | | | | 17,932 | |
IDP Education Ltd. | | 0.922 | | UBS AG (London) | | 12/14/20 | | | 14 | | | | 5,342 | | | | — | | | | 5,342 | |
Iliad SA | | (0.569) | | UBS AG (London) | | 12/14/20 | | | 2 | | | | (6,651 | ) | | | — | | | | (6,651 | ) |
Illumina, Inc. | | (1.600) | | UBS AG (London) | | 12/14/20 | | | — | * | | | 1,385 | | | | — | | | | 1,385 | |
Imi PLC | | 0.677 | | UBS AG (London) | | 12/14/20 | | | 30 | | | | (8,165 | ) | | | — | | | | (8,165 | ) |
Industria De Diseno Textile SA | | 0.569 | | UBS AG (London) | | 03/29/21 | | | 10 | | | | (823 | ) | | | — | | | | (823 | ) |
Infineon Technologies AG | | (0.569) | | UBS AG (London) | | 12/14/20 | | | 16 | | | | 10,014 | | | | — | | | | 10,014 | |
Ingenico Group | | 0.569 | | UBS AG (London) | | 12/14/20 | | | 4 | | | | (1,523 | ) | | | — | | | | (1,523 | ) |
Ingevity Corp. | | 1.785 | | UBS AG (London) | | 12/14/20 | | | 3 | | | | (11,913 | ) | | | — | | | | (11,913 | ) |
Innolux Corp. | | (1.785) | | UBS AG (London) | | 12/14/20 | | | 713 | | | | 4,629 | | | | — | | | | 4,629 | |
Insurance Australia Group Ltd. | | (0.922) | | UBS AG (London) | | 12/14/20 | | | 15 | | | | — | | | | — | | | | — | |
Integra LifeSciences Holdings Corp. | | 1.785 | | UBS AG (London) | | 12/14/20 | | | 2 | | | | 1,113 | | | | — | | | | 1,113 | |
International Flavors & Fragrances, Inc. | | (1.600) | | UBS AG (London) | | 12/14/20 | | | 3 | | | | (1,371 | ) | | | — | | | | (1,371 | ) |
Interpump Group SpA | | (0.569) | | UBS AG (London) | | 12/14/20 | | | 10 | | | | 4,274 | | | | — | | | | 4,274 | |
Intertek Group PLC | | 0.677 | | UBS AG (London) | | 12/14/20 | | | 5 | | | | 16,108 | | | | — | | | | 16,108 | |
Ipsen SA | | 0.569 | | UBS AG (London) | | 12/14/20 | | | 3 | | | | 10,086 | | | | — | | | | 10,086 | |
Iss A/S | | (0.537) | | UBS AG (London) | | 12/14/20 | | | 14 | | | | 418 | | | | — | | | | 418 | |
James Hardie Industries PLC | | 0.927 | | UBS AG (London) | | 12/14/20 | | | 4 | | | | (157 | ) | | | — | | | | (157 | ) |
Japan Airport Terminal Co. | | (0.112) | | UBS AG (London) | | 12/11/20 | | | 7 | | | | (3,091 | ) | | | — | | | | (3,091 | ) |
Japan Tobacco, Inc. | | 0.112 | | UBS AG (London) | | 12/11/20 | | | 2 | | | | 230 | | | | — | | | | 230 | |
Johnson Controls International PLC | | (1.600) | | UBS AG (London) | | 12/14/20 | | | 6 | | | | 186 | | | | — | | | | 186 | |
Kakao Corp. | | 1.785 | | UBS AG (London) | | 12/14/20 | | | — | * | | | 309 | | | | — | | | | 309 | |
Kansai Paint Co. Ltd. | | (0.112) | | UBS AG (London) | | 12/11/20 | | | 9 | | | | (1,976 | ) | | | — | | | | (1,976 | ) |
Kawasaki Heavy Industr Ltd. | | 0.112 | | UBS AG (London) | | 12/11/20 | | | 8 | | | | 592 | | | | — | | | | 592 | |
Keihan Holdings Co. Ltd. | | (0.112) | | UBS AG (London) | | 12/11/20 | | | 8 | | | | (3,383 | ) | | | — | | | | (3,383 | ) |
Keysight Technologies, Inc. | | 1.785 | | UBS AG (London) | | 12/14/20 | | | 3 | | | | (9,245 | ) | | | — | | | | (9,245 | ) |
| | |
| The accompanying notes are an integral part of these financial statements. | | 33 |
GOLDMAN SACHS MULTI-MANAGER ALTERNATIVES FUND
Consolidated Schedule of Investments(continued)
October 31, 2019
|
| ADDITIONAL INVESTMENT INFORMATION (continued) |
OVER THE COUNTER TOTAL RETURN SWAP CONTRACTS# (continued)
| | | | | | | | | | | | | | | | | | | | | | |
| Reference Obligation/Index(a) | | Financing Rate
Paid (Received) by the Fund | | Counterparty | | Termination
Date | | Notional
Amount/
Contracts
(000s) | | | Value | | | Upfront
Premiums
(Received)
Paid | | | Unrealized
Appreciation/
(Depreciation) | |
Kingdee Intl Software Group Co. | | (1.777)% | | UBS AG (London) | | 12/14/20 | | $ | 69 | | | $ | 6 | | | $ | — | | | $ | 6 | |
Kingfisher PLC | | (0.677) | | UBS AG (London) | | 12/14/20 | | | 144 | | | | 543 | | | | — | | | | 543 | |
Kingsoft Co. Ltd. | | (1.777) | | UBS AG (London) | | 12/14/20 | | | 138 | | | | (3,304 | ) | | | — | | | | (3,304 | ) |
Kion Group Gmbh | | 0.569 | | UBS AG (London) | | 12/14/20 | | | 6 | | | | (3,366 | ) | | | — | | | | (3,366 | ) |
Kirby Corp. | | (1.600) | | UBS AG (London) | | 12/14/20 | | | 4 | | | | 17,128 | | | | — | | | | 17,128 | |
Konica Minolta, Inc. | | 0.112 | | UBS AG (London) | | 12/11/20 | | | 25 | | | | 163 | | | | — | | | | 163 | |
Koninklijke Ahold Delhaize | | 0.569 | | UBS AG (London) | | 12/14/20 | | | 15 | | | | (1,951 | ) | | | — | | | | (1,951 | ) |
Korian SA | | (0.569) | | UBS AG (London) | | 12/14/20 | | | 5 | | | | (1,492 | ) | | | — | | | | (1,492 | ) |
Kyushu Railway Co. | | (0.112) | | UBS AG (London) | | 12/11/20 | | | 7 | | | | (4,698 | ) | | | — | | | | (4,698 | ) |
L Brands, Inc. | | (1.600) | | UBS AG (London) | | 12/14/20 | | | 15 | | | | 10,822 | | | | — | | | | 10,822 | |
Lancaster Colony Corp. | | 1.785 | | UBS AG (London) | | 12/14/20 | | | 1 | | | | 1,059 | | | | — | | | | 1,059 | |
Largan Precision Co. Ltd. | | 1.785 | | UBS AG (London) | | 12/14/20 | | | 3 | | | | 15,830 | | | | — | | | | 15,830 | |
Lauder (Estee) Cos., Inc. Class A | | 1.785 | | UBS AG (London) | | 12/14/20 | | | 2 | | | | (7,748 | ) | | | — | | | | (7,748 | ) |
Lear Corp. | | 1.785 | | UBS AG (London) | | 12/14/20 | | | 1 | | | | (4,335 | ) | | | — | | | | (4,335 | ) |
Leggett & Platt, Inc. | | (1.600) | | UBS AG (London) | | 12/14/20 | | | 6 | | | | (2,225 | ) | | | — | | | | (2,225 | ) |
LendingTree, Inc. | | (1.600) | | UBS AG (London) | | 12/14/20 | | | – | * | | | (5,192 | ) | | | — | | | | (5,192 | ) |
LG Chemical Ltd. | | (1.785) | | UBS AG (London) | | 12/14/20 | | | 1 | | | | (7,189 | ) | | | — | | | | (7,189 | ) |
LG Display Co. Ltd. | | (1.785) | | UBS AG (London) | | 12/14/20 | | | 31 | | | | 1,817 | | | | — | | | | 1,817 | |
Lg Electronics, Inc. | | 1.785 | | UBS AG (London) | | 12/14/20 | | | 6 | | | | (12,316 | ) | | | — | | | | (12,316 | ) |
LG Household & Healthcare | | 1.785 | | UBS AG (London) | | 12/14/20 | | | — | * | | | 5,231 | | | | — | | | | 5,231 | |
LHC Group, Inc. | | (1.600) | | UBS AG (London) | | 12/14/20 | | | 2 | | | | 10,693 | | | | — | | | | 10,693 | |
Li Ning Co. Ltd. | | 1.777 | | UBS AG (London) | | 12/14/20 | | | 114 | | | | 3,027 | | | | — | | | | 3,027 | |
Liberty Global PLC | | (1.600) | | UBS AG (London) | | 12/14/20 | | | 6 | | | | (1,328 | ) | | | — | | | | (1,328 | ) |
Lincoln National Corp. | | 1.785 | | UBS AG (London) | | 12/14/20 | | | 1 | | | | (3,853 | ) | | | — | | | | (3,853 | ) |
Littelfuse, Inc. | | (1.600) | | UBS AG (London) | | 12/14/20 | | | 2 | | | | 26,609 | | | | — | | | | 26,609 | |
Liveramp Holdings, Inc. | | (1.600) | | UBS AG (London) | | 12/14/20 | | | 6 | | | | 6,461 | | | | — | | | | 6,461 | |
Logitech International SA | | 0.790 | | UBS AG (London) | | 12/14/20 | | | 9 | | | | 1,142 | | | | — | | | | 1,142 | |
Longfor Group Holdings Ltd. | | (1.777) | | UBS AG (London) | | 12/14/20 | | | 70 | | | | 825 | | | | — | | | | 825 | |
Lonza Group AG | | (0.790) | | UBS AG (London) | | 12/14/20 | | | 1 | | | | (6,542 | ) | | | — | | | | (6,542 | ) |
Lululemon Athletica, Inc. | | 1.785 | | UBS AG (London) | | 12/14/20 | | | 2 | | | | (2,207 | ) | | | — | | | | (2,207 | ) |
Lyondellbasell Industires Co. | | 1.785 | | UBS AG (London) | | 12/14/20 | | | 1 | | | | (1,359 | ) | | | — | | | | (1,359 | ) |
Macy’s, Inc. | | (1.600) | | UBS AG (London) | | 12/14/20 | | | 19 | | | | (5,171 | ) | | | — | | | | (5,171 | ) |
Madison Square Garden Co. | | (1.600) | | UBS AG (London) | | 12/14/20 | | | 1 | | | | 3,148 | | | | — | | | | 3,148 | |
Mapfre | | (0.569) | | UBS AG (London) | | 03/29/21 | | | 26 | | | | 3,592 | | | | — | | | | 3,592 | |
Marathon Petroleum Corp. | | 1.785 | | UBS AG (London) | | 12/14/20 | | | 3 | | | | (11,192 | ) | | | — | | | | (11,192 | ) |
Marriott International, Inc. | | (1.600) | | UBS AG (London) | | 12/14/20 | | | 3 | | | | (23 | ) | | | — | | | | (23 | ) |
Martin Marietta Materials | | 1.785 | | UBS AG (London) | | 12/14/20 | | | 1 | | | | (7,793 | ) | | | — | | | | (7,793 | ) |
Marvell Technology Group Ltd. | | (1.600) | | UBS AG (London) | | 12/14/20 | | | 13 | | | | 3,268 | | | | — | | | | 3,268 | |
Masimo Corp. | | 1.785 | | UBS AG (London) | | 12/14/20 | | | 2 | | | | (4,343 | ) | | | — | | | | (4,343 | ) |
Mastec, Inc. | | 1.785 | | UBS AG (London) | | 12/14/20 | | | 5 | | | | (12,788 | ) | | | — | | | | (12,788 | ) |
Mcdonald’S Holdings Co. Japan Ltd. | | (0.112) | | UBS AG (London) | | 12/11/20 | | | 4 | | | | (663 | ) | | | — | | | | (663 | ) |
Medibank Private Ltd. | | (0.922) | | UBS AG (London) | | 12/14/20 | | | 28 | | | | 1,242 | | | | — | | | | 1,242 | |
Meggitt PLC | | 0.677 | | UBS AG (London) | | 12/14/20 | | | 41 | | | | 9,117 | | | | — | | | | 9,116 | |
Melco International Development Ltd. | | 1.777 | | UBS AG (London) | | 12/14/20 | | | 137 | | | | (11,067 | ) | | | — | | | | (11,067 | ) |
Micro Focus International PLC | | (0.677) | | UBS AG (London) | | 12/14/20 | | | 25 | | | | 2,172 | | | | — | | | | 2,172 | |
Mitsubishi Materials Corp. | | 0.112 | | UBS AG (London) | | 12/11/20 | | | 11 | | | | (677 | ) | | | — | | | | (677 | ) |
MKS Instruments, Inc. | | (1.600) | | UBS AG (London) | | 12/14/20 | | | 2 | | | | 7,678 | | | | — | | | | 7,678 | |
Mohawk Industries, Inc. | | (1.600) | | UBS AG (London) | | 12/14/20 | | | 2 | | | | 3,116 | | | | — | | | | 3,116 | |
Monster Beverage Corp. | | 1.785 | | UBS AG (London) | | 12/14/20 | | | 1 | | | | (22 | ) | | | — | | | | (22 | ) |
MTU Aero Engines AG | | 0.569 | | UBS AG (London) | | 12/14/20 | | | 1 | | | | 6,174 | | | | — | | | | 6,174 | |
Mylan NV | | 1.785 | | UBS AG (London) | | 12/14/20 | | | 9 | | | | (4,126 | ) | | | — | | | | (4,126 | ) |
| | |
| 34 | | The accompanying notes are an integral part of these financial statements. |
GOLDMAN SACHS MULTI-MANAGER ALTERNATIVES FUND
|
| ADDITIONAL INVESTMENT INFORMATION (continued) |
OVER THE COUNTER TOTAL RETURN SWAP CONTRACTS# (continued)
| | | | | | | | | | | | | | | | | | | | | | |
| Reference Obligation/Index(a) | | Financing Rate
Paid (Received) by the Fund | | Counterparty | | Termination
Date | | Notional
Amount/
Contracts
(000s) | | | Value | | | Upfront
Premiums
(Received)
Paid | | | Unrealized
Appreciation/
(Depreciation) | |
Nan Ya Plastics Corp. | | (1.785)% | | UBS AG (London) | | 12/14/20 | | $ | 116 | | | $ | (2,221 | ) | | $ | — | | | $ | (2,221 | ) |
Nanya Technology Co. Ltd. | | (1.785) | | UBS AG (London) | | 12/14/20 | | | 133 | | | | 11,012 | | | | — | | | | 11,012 | |
National Instruments Corp. | | 1.785 | | UBS AG (London) | | 12/14/20 | | | 7 | | | | 3,010 | | | | — | | | | 3,010 | |
National Oilwell Varco, Inc. | | (1.600) | | UBS AG (London) | | 12/14/20 | | | 6 | | | | 7,464 | | | | — | | | | 7,464 | |
Ncsoft Corp. | | (1.785) | | UBS AG (London) | | 12/14/20 | | | 1 | | | | (2,307 | ) | | | — | | | | (2,307 | ) |
Nektar Therapeutics | | (1.600) | | UBS AG (London) | | 12/14/20 | | | 13 | | | | 6,648 | | | | — | | | | 6,648 | |
Nemetschek SE | | 0.569 | | UBS AG (London) | | 12/14/20 | | | 7 | | | | (9,342 | ) | | | — | | | | (9,342 | ) |
Newmarket Corp. | | 1.785 | | UBS AG (London) | | 12/14/20 | | | 1 | | | | 1,321 | | | | — | | | | 1,321 | |
Next PLC | | 0.677 | | UBS AG (London) | | 12/14/20 | | | 4 | | | | (12,113 | ) | | | — | | | | (12,113 | ) |
NGK Insulators Ltd. | | (0.112) | | UBS AG (London) | | 12/11/20 | | | 25 | | | | (8,116 | ) | | | — | | | | (8,116 | ) |
NGK Spark Plug Co., Ltd. | | (0.112) | | UBS AG (London) | | 12/11/20 | | | 8 | | | | (5,544 | ) | | | — | | | | (5,544 | ) |
Nintendo Co. Ltd. | | (0.112) | | UBS AG (London) | | 12/11/20 | | | 1 | | | | (17,850 | ) | | | — | | | | (17,850 | ) |
Nippon Paint Holdings Co. Ltd. | | (0.112) | | UBS AG (London) | | 12/11/20 | | | 7 | | | | 2,015 | | | | — | | | | 2,015 | |
Nippon Television Holdings, Inc. | | 0.112 | | UBS AG (London) | | 12/11/20 | | | 27 | | | | (667 | ) | | | — | | | | (667 | ) |
Nisource, Inc. | | (1.600) | | UBS AG (London) | | 12/14/20 | | | 6 | | | | (5,480 | ) | | | — | | | | (5,480 | ) |
Nokia OYJ | | (0.569) | | UBS AG (London) | | 12/14/20 | | | 75 | | | | (6,739 | ) | | | — | | | | (6,739 | ) |
Nokian Renkaat Oyj | | (0.569) | | UBS AG (London) | | 12/14/20 | | | 12 | | | | 20,433 | | | | — | | | | 20,433 | |
Norwegian Cruise Line Holdings Ltd. | | 1.785 | | UBS AG (London) | | 12/14/20 | | | 7 | | | | (13,364 | ) | | | — | | | | (13,364 | ) |
Nutanix, Inc. | | (1.600) | | UBS AG (London) | | 12/14/20 | | | 5 | | | | (484 | ) | | | — | | | | (484 | ) |
Nvr, Inc. | | 1.785 | | UBS AG (London) | | 12/14/20 | | | — | * | | | 495 | | | | — | | | | 495 | |
Ocado Group PLC | | (0.677) | | UBS AG (London) | | 12/14/20 | | | 22 | | | | 5,234 | | | | — | | | | 5,234 | |
OCI NV | | 0.569 | | UBS AG (London) | | 12/14/20 | | | 6 | | | | (5,350 | ) | | | — | | | | (5,350 | ) |
Oil Search Ltd. | | (0.922) | | UBS AG (London) | | 12/14/20 | | | 66 | | | | 3,710 | | | | — | | | | 3,710 | |
OJI Holdings Corp. | | 0.112 | | UBS AG (London) | | 12/11/20 | | | 56 | | | | (1,515 | ) | | | — | | | | (1,515 | ) |
Olympus Corp. | | (0.112) | | UBS AG (London) | | 12/11/20 | | | 3 | | | | (1,621 | ) | | | — | | | | (1,621 | ) |
OMV AG | | 0.569 | | UBS AG (London) | | 12/14/20 | | | 2 | | | | (536 | ) | | | — | | | | (536 | ) |
Orpea SA | | (0.569) | | UBS AG (London) | | 12/14/20 | | | 1 | | | | (2,857 | ) | | | — | | | | (2,857 | ) |
Otsuka Shokai Co. Ltd. | | 0.112 | | UBS AG (London) | | 12/11/20 | | | 3 | | | | 4,374 | | | | — | | | | 4,374 | |
Outfront Media, Inc. | | 1.785 | | UBS AG (London) | | 12/14/20 | | | 5 | | | | (912 | ) | | | — | | | | (912 | ) |
Paccar, Inc. | | 1.785 | | UBS AG (London) | | 12/14/20 | | | 5 | | | | (5,934 | ) | | | — | | | | (5,934 | ) |
Pandora A/S | | 0.537 | | UBS AG (London) | | 12/14/20 | | | 5 | | | | 2,781 | | | | — | | | | 2,781 | |
Parsley Energy, Inc. | | 1.785 | | UBS AG (London) | | 12/14/20 | | | 16 | | | | (11,179 | ) | | | — | | | | (11,179 | ) |
Paylocity Holding Corp. | | 1.785 | | UBS AG (London) | | 12/14/20 | | | 1 | | | | (216 | ) | | | — | | | | (216 | ) |
Pegatron Corp. | | (1.785) | | UBS AG (London) | | 12/14/20 | | | 199 | | | | 9,565 | | | | — | | | | 9,565 | |
Penske Automotive Group, Inc. | | 1.785 | | UBS AG (London) | | 12/14/20 | | | 6 | | | | (418 | ) | | | — | | | | (418 | ) |
Perrigo Co. | | (1.600) | | UBS AG (London) | | 12/14/20 | | | 5 | | | | 5,502 | | | | — | | | | 5,502 | |
Perspecta, Inc. | | 1.785 | | UBS AG (London) | | 12/14/20 | | | 5 | | | | 36 | | | | — | | | | 36 | |
Peugeot SA | | 0.569 | | UBS AG (London) | | 12/14/20 | | | 14 | | | | (33,631 | ) | | | — | | | | (33,631 | ) |
Philip Morris International, Inc. | | 1.785 | | UBS AG (London) | | 12/14/20 | | | 4 | | | | 2,804 | | | | — | | | | 2,804 | |
Phillips 66 | | 1.785 | | UBS AG (London) | | 12/14/20 | | | 1 | | | | (2,754 | ) | | | — | | | | (2,754 | ) |
Pilgrim’S Pride Corp. | | 1.785 | | UBS AG (London) | | 12/14/20 | | | 9 | | | | 8,637 | | | | — | | | | 8,637 | |
Plastic Omnium SA | | 0.569 | | UBS AG (London) | | 12/14/20 | | | 14 | | | | (17,683 | ) | | | — | | | | (17,683 | ) |
Pola Orbis Holdings, Inc. | | 0.112 | | UBS AG (London) | | 12/11/20 | | | 4 | | | | (6,261 | ) | | | — | | | | (6,261 | ) |
Polymetal International PLC | | (0.677) | | UBS AG (London) | | 12/14/20 | | | 3 | | | | (2,186 | ) | | | — | | | | (2,186 | ) |
Pool Corp. | | 1.785 | | UBS AG (London) | | 12/14/20 | | | — | * | | | 1,459 | | | | — | | | | 1,459 | |
Posco | | 1.785 | | UBS AG (London) | | 12/14/20 | | | 2 | | | | (1,541 | ) | | | — | | | | (1,541 | ) |
Post Holdings, Inc. | | (1.600) | | UBS AG (London) | | 12/14/20 | | | 4 | | | | 5,432 | | | | — | | | | 5,432 | |
Pou Chen Corp. | | 1.785 | | UBS AG (London) | | 12/14/20 | | | 180 | | | | 3,727 | | | | — | | | | 3,727 | |
Prysmian Spa | | (0.569) | | UBS AG (London) | | 12/14/20 | | | 17 | | | | (2,278 | ) | | | — | | | | (2,278 | ) |
Qantas Airways Ltd. | | 0.922 | | UBS AG (London) | | 12/14/20 | | | 85 | | | | (4,565 | ) | | | — | | | | (4,565 | ) |
Quanta Computer, Inc. | | (1.785) | | UBS AG (London) | | 12/14/20 | | | 139 | | | | (1,900 | ) | | | — | | | | (1,900 | ) |
| | |
| The accompanying notes are an integral part of these financial statements. | | 35 |
GOLDMAN SACHS MULTI-MANAGER ALTERNATIVES FUND
Consolidated Schedule of Investments(continued)
October 31, 2019
|
| ADDITIONAL INVESTMENT INFORMATION (continued) |
OVER THE COUNTER TOTAL RETURN SWAP CONTRACTS# (continued)
| | | | | | | | | | | | | | | | | | | | | | |
| Reference Obligation/Index(a) | | Financing Rate
Paid (Received) by the Fund | | Counterparty | | Termination
Date | | Notional
Amount/
Contracts
(000s) | | | Value | | | Upfront
Premiums
(Received)
Paid | | | Unrealized
Appreciation/
(Depreciation) | |
Reckitt Benckiser Group PLC | | (0.677)% | | UBS AG (London) | | 12/14/20 | | $ | 5 | | | $ | (11,454 | ) | | $ | — | | | $ | (11,454 | ) |
Remy Cointreau | | (0.569) | | UBS AG (London) | | 12/14/20 | | | 3 | | | | (7,491 | ) | | | — | | | | (7,491 | ) |
Rheinmetall AG | | 0.569 | | UBS AG (London) | | 12/14/20 | | | 3 | | | | (1,549 | ) | | | — | | | | (1,549 | ) |
Roche Holding AG | | 0.790 | | UBS AG (London) | | 12/14/20 | | | 1 | | | | 5,071 | | | | — | | | | 5,071 | |
Rolls-Royce Holdings PLC | | 0.000 | | UBS AG (London) | | 12/14/20 | | | 1,560 | | | | (2,020 | ) | | | — | | | | (2,020 | ) |
Rolls-Royce Holdings PLC | | (0.677) | | UBS AG (London) | | 12/14/20 | | | 17 | | | | (32 | ) | | | — | | | | (32 | ) |
Ross Stores, Inc. | | 1.785 | | UBS AG (London) | | 12/14/20 | | | 3 | | | | 2,477 | | | | — | | | | 2,477 | |
Rotork PLC | | 0.677 | | UBS AG (London) | | 12/14/20 | | | 93 | | | | 1,050 | | | | — | | | | 1,050 | |
Royal Caribbean Cruises Ltd. | | 1.785 | | UBS AG (London) | | 12/14/20 | | | — | * | | | (1,748 | ) | | | — | | | | (1,748 | ) |
RSA Insurance Group PLC | | (0.677) | | UBS AG (London) | | 12/14/20 | | | 47 | | | | (6,170 | ) | | | — | | | | (6,170 | ) |
Ryohin Keikaku Co. Ltd. | | 0.112 | | UBS AG (London) | | 12/11/20 | | | 8 | | | | (869 | ) | | | — | | | | (869 | ) |
S-Oil Corp. | | (1.785) | | UBS AG (London) | | 12/14/20 | | | 5 | | | | 10,506 | | | | — | | | | 10,506 | |
Sabre Corp. | | (1.600) | | UBS AG (London) | | 12/14/20 | | | 14 | | | | (18,681 | ) | | | — | | | | (18,681 | ) |
Safran SA | | 0.569 | | UBS AG (London) | | 12/14/20 | | | 2 | | | | 27 | | | | — | | | | 27 | |
Salvatore Ferragamo SpA | | (0.569) | | UBS AG (London) | | 12/14/20 | | | 16 | | | | (4,110 | ) | | | — | | | | (4,110 | ) |
Samsung Biologics Co. Ltd. | | (1.785) | | UBS AG (London) | | 12/14/20 | | | 1 | | | | 3,053 | | | | — | | | | 3,053 | |
Samsung Heavy Industries Co. | | (1.785) | | UBS AG (London) | | 12/14/20 | | | 47 | | | | 19,519 | | | | — | | | | 19,519 | |
Sankyo Co. Ltd. | | (0.112) | | UBS AG (London) | | 12/11/20 | | | 9 | | | | (6,946 | ) | | | — | | | | (6,946 | ) |
Sanofi | | (0.569) | | UBS AG (London) | | 12/14/20 | | | 4 | | | | 5,359 | | | | — | | | | 5,359 | |
Schneider Electric SE | | 0.569 | | UBS AG (London) | | 12/14/20 | | | 3 | | | | (4,563 | ) | | | — | | | | (4,563 | ) |
Scottish & Southern Energy | | (0.677) | | UBS AG (London) | | 12/14/20 | | | 15 | | | | (4,274 | ) | | | — | | | | (4,274 | ) |
SCREEN Holdings Co. Ltd. | | (0.102) | | UBS AG (London) | | 12/11/20 | | | 2 | | | | 1,453 | | | | — | | | | 1,453 | |
Seb SA | | (0.569) | | UBS AG (London) | | 12/14/20 | | | 2 | | | | 5,505 | | | | — | | | | 5,505 | |
Securitas AB | | (0.162) | | UBS AG (London) | | 12/14/20 | | | 22 | | | | (5,236 | ) | | | — | | | | (5,236 | ) |
Sekisui Chemical Co. Ltd. | | 0.112 | | UBS AG (London) | | 12/11/20 | | | 23 | | | | 24,429 | | | | — | | | | 24,429 | |
Semiconductor MFG International Corp. | | (1.777) | | UBS AG (London) | | 12/14/20 | | | 278 | | | | (9,213 | ) | | | — | | | | (9,213 | ) |
ServiceNow, Inc. | | 1.785 | | UBS AG (London) | | 12/14/20 | | | — | * | | | 1,597 | | | | — | | | | 1,597 | |
Seven & I Holdings Co. Ltd. | | (0.112) | | UBS AG (London) | | 12/11/20 | | | 1 | | | | 812 | | | | — | | | | 812 | |
SGS SA | | (0.790) | | UBS AG (London) | | 12/14/20 | | | — | * | | | (4,778 | ) | | | — | | | | (4,778 | ) |
Shimamura Co. Ltd. | | (0.112) | | UBS AG (London) | | 12/11/20 | | | 2 | | | | (1,308 | ) | | | — | | | | (1,308 | ) |
Shionogi & Co. Ltd. | | 0.112 | | UBS AG (London) | | 12/11/20 | | | 6 | | | | 12,092 | | | | — | | | | 12,092 | |
Shiseido Co. Ltd. | | (0.112) | | UBS AG (London) | | 12/11/20 | | | 4 | | | | (14,945 | ) | | | — | | | | (14,945 | ) |
Siemens AG | | (0.569) | | UBS AG (London) | | 12/14/20 | | | 3 | | | | 5,618 | | | | — | | | | 5,618 | |
Siemens Gamesa Renewable Energy SA | | (0.569) | | UBS AG (London) | | 03/29/21 | | | 25 | | | | (5,359 | ) | | | — | | | | (5,359 | ) |
Silicon Laboratories, Inc. | | 1.785 | | UBS AG (London) | | 12/14/20 | | | 3 | | | | (11,205 | ) | | | — | | | | (11,205 | ) |
Singapore Airlines Ltd. | | (1.700) | | UBS AG (London) | | 12/11/20 | | | 54 | | | | (8,526 | ) | | | — | | | | (8,526 | ) |
SiteOne Landscape Supply, Inc. | | 1.785 | | UBS AG (London) | | 12/14/20 | | | 1 | | | | 10,003 | | | | — | | | | 10,003 | |
Six Flags Entertainment Corp. | | 1.785 | | UBS AG (London) | | 12/14/20 | | | 1 | | | | (1,576 | ) | | | — | | | | (1,576 | ) |
Skandinaviska Enskilda Bank | | 0.162 | | UBS AG (London) | | 12/14/20 | | | 24 | | | | (4,531 | ) | | | — | | | | (4,531 | ) |
Skyworks Solutions, Inc. | | 1.785 | | UBS AG (London) | | 12/14/20 | | | 3 | | | | (542 | ) | | | — | | | | (542 | ) |
SMC Corp. | | (0.112) | | UBS AG (London) | | 12/11/20 | | | 1 | | | | (1,176 | ) | | | — | | | | (1,176 | ) |
Societe Bic SA | | (0.569) | | UBS AG (London) | | 12/14/20 | | | 5 | | | | (1,551 | ) | | | — | | | | (1,551 | ) |
Southwest Gas Holdings, Inc. | | 1.785 | | UBS AG (London) | | 12/14/20 | | | 1 | | | | 680 | | | | — | | | | 680 | |
Spectris PLC | | (0.677) | | UBS AG (London) | | 12/14/20 | | | 12 | | | | 13 | | | | — | | | | 13 | |
Splunk, Inc. | | (1.600) | | UBS AG (London) | | 12/14/20 | | | 2 | | | | (1,634 | ) | | | — | | | | (1,634 | ) |
Sprint Corp. | | (1.600) | | UBS AG (London) | | 12/14/20 | | | 45 | | | | (868 | ) | | | — | | | | (868 | ) |
Stanley Black & Decker, Inc. | | (1.600) | | UBS AG (London) | | 12/14/20 | | | 2 | | | | 6,052 | | | | — | | | | 6,052 | |
Stericycle, Inc. | | (1.600) | | UBS AG (London) | | 12/14/20 | | | 6 | | | | (26,828 | ) | | | — | | | | (26,828 | ) |
Steris PLC | | 1.785 | | UBS AG (London) | | 12/14/20 | | | 2 | | | | 241 | | | | — | | | | 241 | |
Sumitomo Chemical Co. Ltd. | | 0.112 | | UBS AG (London) | | 12/11/20 | | | 65 | | | | (4,601 | ) | | | — | | | | (4,601 | ) |
Sumitomo Dainippon Pharma Co. | | 0.112 | | UBS AG (London) | | 12/11/20 | | | 7 | | | | 1,789 | | | | — | | | | 1,789 | |
| | |
| 36 | | The accompanying notes are an integral part of these financial statements. |
GOLDMAN SACHS MULTI-MANAGER ALTERNATIVES FUND
|
| ADDITIONAL INVESTMENT INFORMATION (continued) |
OVER THE COUNTER TOTAL RETURN SWAP CONTRACTS# (continued)
| | | | | | | | | | | | | | | | | | | | | | |
| Reference Obligation/Index(a) | | Financing Rate
Paid (Received) by the Fund | | Counterparty | | Termination
Date | | Notional
Amount/
Contracts
(000s) | | | Value | | | Upfront
Premiums
(Received)
Paid | | | Unrealized
Appreciation/
(Depreciation) | |
Sumitomo Electric Industries Ltd. | | 0.112% | | UBS AG (London) | | 12/11/20 | | $ | 26 | | | $ | 3,953 | | | $ | — | | | $ | 3,953 | |
Sun Art Retail Group Ltd. | | (1.777) | | UBS AG (London) | | 12/14/20 | | | 362 | | | | 4,935 | | | | — | | | | 4,935 | |
Suzuki Motor Corp. | | (0.112) | | UBS AG (London) | | 12/11/20 | | | 9 | | | | (5,727 | ) | | | — | | | | (5,727 | ) |
Syneos Health, Inc. | | 1.785 | | UBS AG (London) | | 12/14/20 | | | 1 | | | | (4,540 | ) | | | — | | | | (4,540 | ) |
SYNNEX Corp. | | 1.785 | | UBS AG (London) | | 12/14/20 | | | 3 | | | | (4,050 | ) | | | — | | | | (4,050 | ) |
Taisei Corp. | | 0.102 | | UBS AG (London) | | 12/11/20 | | | 4 | | | | (174 | ) | | | — | | | | (174 | ) |
Taiwan High Speed Rail Corp. | | 1.785 | | UBS AG (London) | | 12/14/20 | | | 255 | | | | 2,073 | | | | — | | | | 2,073 | |
Tandem Diabetes Care, Inc. | | (1.600) | | UBS AG (London) | | 12/14/20 | | | 3 | | | | 9,299 | | | | — | | | | 9,299 | |
Tapestry, Inc. | | (1.600) | | UBS AG (London) | | 12/14/20 | | | 10 | | | | 121 | | | | — | | | | 121 | |
Taro Pharmaceutical Industries Ltd. | | 1.785 | | UBS AG (London) | | 12/14/20 | | | 1 | | | | 144 | | | | — | | | | 144 | |
Tate & Lyle PLC | | 0.677 | | UBS AG (London) | | 12/14/20 | | | 26 | | | | 1,826 | | | | — | | | | 1,826 | |
Te Connectivity Ltd. | | (1.600) | | UBS AG (London) | | 12/14/20 | | | 2 | | | | 10,864 | | | | — | | | | 10,864 | |
TechnipFMC PLC | | 0.569 | | UBS AG (London) | | 12/14/20 | | | 15 | | | | (10,267 | ) | | | — | | | | (10,267 | ) |
Telefonica Deutschland | | 0.569 | | UBS AG (London) | | 12/14/20 | | | 122 | | | | (317 | ) | | | — | | | | (317 | ) |
Telefonica SA | | 0.569 | | UBS AG (London) | | 03/29/21 | | | 17 | | | | (169 | ) | | | — | | | | (169 | ) |
Telstra Corp. Ltd. | | (0.922) | | UBS AG (London) | | 12/14/20 | | | 134 | | | | 3,880 | | | | — | | | | 3,880 | |
Tesla Motors, Inc. | | (1.600) | | UBS AG (London) | | 12/14/20 | | | 1 | | | | 1,392 | | | | — | | | | 1,392 | |
Tetra Tech, Inc. | | 1.785 | | UBS AG (London) | | 12/14/20 | | | 4 | | | | (7,815 | ) | | | — | | | | (7,815 | ) |
Texas Instruments, Inc. | | 1.785 | | UBS AG (London) | | 12/14/20 | | | 2 | | | | (2,951 | ) | | | — | | | | (2,951 | ) |
Texas Roadhouse, Inc. | | 1.785 | | UBS AG (London) | | 12/14/20 | | | 4 | | | | (15,010 | ) | | | — | | | | (15,010 | ) |
TGS Nopec Geophysical Co. ASA | | 1.200 | | UBS AG (London) | | 12/14/20 | | | 12 | | | | (17,665 | ) | | | — | | | | (17,665 | ) |
The Boeing Co. | | (1.592) | | UBS AG (London) | | 12/14/20 | | | 1 | | | | 7,548 | | | | — | | | | 7,548 | |
The British Land Co. PLC | | (0.677) | | UBS AG (London) | | 12/14/20 | | | 46 | | | | (7,946 | ) | | | — | | | | (7,946 | ) |
The Chiba Bank Ltd. | | (0.112) | | UBS AG (London) | | 12/11/20 | | | 56 | | | | 1,883 | | | | — | | | | 1,883 | |
The Kroger Co. | | (1.600) | | UBS AG (London) | | 12/14/20 | | | 14 | | | | (111 | ) | | | — | | | | (111 | ) |
The Procter & Gamble Co. | | (1.600) | | UBS AG (London) | | 12/14/20 | | | 2 | | | | (1,702 | ) | | | — | | | | (1,702 | ) |
The Walt Disney Co. | | (1.600) | | UBS AG (London) | | 12/14/20 | | | 3 | | | | (1,134 | ) | | | — | | | | (1,134 | ) |
Thermo Fisher Scientific, Inc. | | 1.785 | | UBS AG (London) | | 12/14/20 | | | 1 | | | | 4,400 | | | | — | | | | 4,400 | |
THK Co. Ltd. | | (0.112) | | UBS AG (London) | | 12/11/20 | | | 14 | | | | 15,913 | | | | — | | | | 15,913 | |
Thyssenkrupp AG | | (0.569) | | UBS AG (London) | | 12/14/20 | | | 27 | | | | 16,414 | | | | — | | | | 16,414 | |
Tiffany & Co. | | (1.600) | | UBS AG (London) | | 12/14/20 | | | 3 | | | | 5,769 | | | | — | | | | 5,769 | |
Tokyo Electric Power Co. Holdings, Inc. | | 0.112 | | UBS AG (London) | | 12/11/20 | | | 63 | | | | (6,628 | ) | | | — | | | | (6,628 | ) |
Tokyu Corp. | | (0.112) | | UBS AG (London) | | 12/11/20 | | | 12 | | | | (903 | ) | | | — | | | | (903 | ) |
Tomra Systems A/S | | (1.200) | | UBS AG (London) | | 12/14/20 | | | 12 | | | | (870 | ) | | | — | | | | (870 | ) |
Toshiba Corp. | | (0.112) | | UBS AG (London) | | 12/11/20 | | | 10 | | | | 377 | | | | — | | | | 377 | |
Tosoh Corp. | | 0.112 | | UBS AG (London) | | 12/11/20 | | | 28 | | | | (7,097 | ) | | | — | | | | (7,097 | ) |
Tractor Supply Co. | | 1.785 | | UBS AG (London) | | 12/14/20 | | | 3 | | | | (1,271 | ) | | | — | | | | (1,271 | ) |
Transdigm Group, Inc. | | (1.600) | | UBS AG (London) | | 12/14/20 | | | 1 | | | | (163 | ) | | | — | | | | (163 | ) |
TransUnion | | 1.785 | | UBS AG (London) | | 12/14/20 | | | 2 | | | | 1,664 | | | | — | | | | 1,664 | |
Treasury Wine Estates Ltd. | | 0.922 | | UBS AG (London) | | 12/14/20 | | | 26 | | | | 286 | | | | — | | | | 286 | |
Treehouse Foods, Inc. | | (1.600) | | UBS AG (London) | | 12/14/20 | | | 6 | | | | 7,957 | | | | — | | | | 7,957 | |
Trex Co., Inc. | | 1.785 | | UBS AG (London) | | 12/14/20 | | | 2 | | | | 8,078 | | | | — | | | | 8,078 | |
Trinet Group, Inc. | | 1.785 | | UBS AG (London) | | 12/14/20 | | | 5 | | | | 16,796 | | | | — | | | | 16,796 | |
Tsingtao Brewery Co. Ltd. | | 1.777 | | UBS AG (London) | | 12/14/20 | | | 62 | | | | (13,142 | ) | | | — | | | | (13,142 | ) |
Tullow Oil PLC | | (0.677) | | UBS AG (London) | | 12/14/20 | | | 90 | | | | 1,349 | | | | — | | | | 1,349 | |
Umicore SA | | (0.569) | | UBS AG (London) | | 12/14/20 | | | 9 | | | | (855 | ) | | | — | | | | (855 | ) |
Under Armour, Inc. | | (1.600) | | UBS AG (London) | | 12/14/20 | | | 14 | | | | 2,966 | | | | — | | | | 2,966 | |
Uni-President Enterprise Co. | | 1.785 | | UBS AG (London) | | 12/14/20 | | | 147 | | | | (2,137 | ) | | | — | | | | (2,137 | ) |
Unicredit SpA | | 0.569 | | UBS AG (London) | | 12/14/20 | | | 3 | | | | (850 | ) | | | — | | | | (850 | ) |
Uniper SE | | (0.569) | | UBS AG (London) | | 12/14/20 | | | 12 | | | | (2,952 | ) | | | — | | | | (2,952 | ) |
United Microelectronics Corp. | | (1.785) | | UBS AG (London) | | 12/14/20 | | | 799 | | | | 11,834 | | | | — | | | | 11,834 | |
| | |
| The accompanying notes are an integral part of these financial statements. | | 37 |
GOLDMAN SACHS MULTI-MANAGER ALTERNATIVES FUND
Consolidated Schedule of Investments(continued)
October 31, 2019
|
| ADDITIONAL INVESTMENT INFORMATION (continued) |
OVER THE COUNTER TOTAL RETURN SWAP CONTRACTS# (continued)
| | | | | | | | | | | | | | | | | | | | | | | | | | |
| Reference Obligation/Index(a) | | Financing Rate
Paid (Received) by the Fund | | | Counterparty | | Termination
Date | | | Notional
Amount/
Contracts
(000s) | | | Value | | | Upfront
Premiums
(Received)
Paid | | | Unrealized
Appreciation/
(Depreciation) | |
United Therapeutics Corp. | | | 1.785% | | | UBS AG (London) | | | 12/14/20 | | | $ | 2 | | | $ | 5,220 | | | $ | — | | | $ | 5,220 | |
UnitedHealth Group, Inc. | | | 1.785 | | | UBS AG (London) | | | 12/14/20 | | | | 1 | | | | 415 | | | | — | | | | 415 | |
Univar, Inc. | | | (1.600) | | | UBS AG (London) | | | 12/14/20 | | | | 6 | | | | 3,394 | | | | — | | | | 3,394 | |
Unum Group | | | 1.785 | | | UBS AG (London) | | | 12/14/20 | | | | 4 | | | | (3,741 | ) | | | — | | | | (3,741 | ) |
Upm-Kymmene Corp. | | | 0.569 | | | UBS AG (London) | | | 12/14/20 | | | | 1 | | | | (538 | ) | | | — | | | | (538 | ) |
Valeo SA | | | 0.569 | | | UBS AG (London) | | | 12/14/20 | | | | 4 | | | | (6,934 | ) | | | — | | | | (6,934 | ) |
Valmet Corp. | | | 0.569 | | | UBS AG (London) | | | 12/14/20 | | | | 15 | | | | (10,627 | ) | | | — | | | | (10,627 | ) |
Veeva Systems, Inc. | | | 1.785 | | | UBS AG (London) | | | 12/14/20 | | | | 2 | | | | (7,527 | ) | | | — | | | | (7,527 | ) |
Venture Corp Ltd. | | | 1.782 | | | UBS AG (London) | | | 12/11/20 | | | | 31 | | | | 12,051 | | | | — | | | | 12,051 | |
Verbund AG | | | 0.569 | | | UBS AG (London) | | | 12/14/20 | | | | 7 | | | | 1,894 | | | | — | | | | 1,894 | |
VF Corp. | | | (1.600) | | | UBS AG (London) | | | 12/14/20 | | | | 2 | | | | (2,316 | ) | | | — | | | | (2,316 | ) |
Viacom, Inc. | | | 1.785 | | | UBS AG (London) | | | 12/14/20 | | | | 4 | | | | 384 | | | | — | | | | 384 | |
Vicinity Centres | | | 0.922 | | | UBS AG (London) | | | 12/14/20 | | | | 20 | | | | (404 | ) | | | — | | | | (404 | ) |
Vodafone Group PLC | | | 0.677 | | | UBS AG (London) | | | 12/14/20 | | | | 31 | | | | 198 | | | | — | | | | 198 | |
Voestalpine AG | | | (0.569) | | | UBS AG (London) | | | 12/14/20 | | | | 6 | | | | 6,363 | | | | — | | | | 6,363 | |
Volkswagen AG | | | (0.569) | | | UBS AG (London) | | | 12/14/20 | | | | 2 | | | | 3,133 | | | | — | | | | 3,133 | |
Vulcan Materials Co. | | | 1.785 | | | UBS AG (London) | | | 12/14/20 | | | | 1 | | | | (1,752 | ) | | | — | | | | (1,752 | ) |
Wabtec Corp. | | | (1.600) | | | UBS AG (London) | | | 12/14/20 | | | | 2 | | | | 1,257 | | | | — | | | | 1,257 | |
Want Want China Holdings Ltd. | | | 1.777 | | | UBS AG (London) | | | 12/14/20 | | | | 393 | | | | 4,927 | | | | — | | | | 4,927 | |
Wartsila Oyj Abp | | | (0.569) | | | UBS AG (London) | | | 12/14/20 | | | | 22 | | | | 1,551 | | | �� | — | | | | 1,551 | |
Weichai Power Co. Ltd. | | | 1.777 | | | UBS AG (London) | | | 12/14/20 | | | | 234 | | | | (6,325 | ) | | | — | | | | (6,325 | ) |
Western Alliance Bancorp | | | 1.785 | | | UBS AG (London) | | | 12/14/20 | | | | 6 | | | | (8,206 | ) | | | — | | | | (8,206 | ) |
Westrock Co. | | | 1.785 | | | UBS AG (London) | | | 12/14/20 | | | | 8 | | | | (4,587 | ) | | | — | | | | (4,587 | ) |
Weyerhaeuser Co. | | | (1.600) | | | UBS AG (London) | | | 12/14/20 | | | | 8 | | | | 3,825 | | | | — | | | | 3,825 | |
Wh Group Ltd. | | | 1.777 | | | UBS AG (London) | | | 12/14/20 | | | | 240 | | | | 2,658 | | | | — | | | | 2,658 | |
Wh Smith PLC | | | 0.677 | | | UBS AG (London) | | | 12/14/20 | | | | 6 | | | | (1,870 | ) | | | — | | | | (1,870 | ) |
Williams-Sonoma, Inc. | | | 1.785 | | | UBS AG (London) | | | 12/14/20 | | | | 1 | | | | (1,203 | ) | | | — | | | | (1,203 | ) |
Wilmar International Ltd. | | | (1.700) | | | UBS AG (London) | | | 12/11/20 | | | | 37 | | | | (935 | ) | | | — | | | | (935 | ) |
Wisetech Global | | | 0.922 | | | UBS AG (London) | | | 12/14/20 | | | | 18 | | | | (4,272 | ) | | | — | | | | (4,272 | ) |
Wizz Air Holdings PLC | | | 0.677 | | | UBS AG (London) | | | 12/14/20 | | | | 7 | | | | 6,932 | | | | — | | | | 6,932 | |
Wright Medical Group NV | | | (1.600) | | | UBS AG (London) | | | 12/14/20 | | | | 9 | | | | (157 | ) | | | — | | | | (157 | ) |
XPO Logistics, Inc. | | | 1.785 | | | UBS AG (London) | | | 12/14/20 | | | | 1 | | | | (3,789 | ) | | | — | | | | (3,789 | ) |
Yelp, Inc. | | | 1.785 | | | UBS AG (London) | | | 12/14/20 | | | | 6 | | | | 1,040 | | | | — | | | | 1,040 | |
Yokohama Rubber Co. Ltd. | | | (0.112) | | | UBS AG (London) | | | 12/11/20 | | | | 2 | | | | 322 | | | | — | | | | 322 | |
Zalando SE | | | 0.570 | | | UBS AG (London) | | | 12/14/20 | | | | 1 | | | | (60 | ) | | | — | | | | (60 | ) |
Zillow Group, Inc. | | | (1.600) | | | UBS AG (London) | | | 12/14/20 | | | | 2 | | | | 2,810 | | | | — | | | | 2,810 | |
Zscaler, Inc. | | | (1.600) | | | UBS AG (London) | | | 12/14/20 | | | | 4 | | | | (3,295 | ) | | | — | | | | (3,295 | ) |
| | | | | | | |
| TOTAL | | | | | | | | | | | | | | | | $ | (76,383 | ) | | $ | 2,944 | | | $ | (79,328 | ) |
| | # | | The Fund pays/receives annual coupon payments in accordance with the swap contract(s). On the termination date of the swap contract(s), the Fund will either receive from or pay to the counterparty an amount equal to the net of the accrued financing fees and the value of the reference security subtracted from the original notional cost (notional multiplied by the price change of the reference security, converted to U.S. Dollars). |
| | * | | Rounds to less than $1,000. |
| | (a) | | Payments made monthly. |
| | |
| 38 | | The accompanying notes are an integral part of these financial statements. |
GOLDMAN SACHS MULTI-MANAGER ALTERNATIVES FUND
|
| ADDITIONAL INVESTMENT INFORMATION (continued) |
PURCHASED AND WRITTEN OPTIONS CONTRACTS — At October 31, 2019, the Fund had the following purchased and written options:
EXCHANGE TRADED OPTIONS ON EQUITIES CONTRACTS
| | | | | | | | | | | | | | | | | | | | | | | | | | |
| Description | | Exercise
Price | | Expiration
Date | | | Number of
Contracts | | | Notional
Amount | | | Market
Value | | | Premiums Paid
(Received) by
Portfolio | | | Unrealized
Appreciation/
(Depreciation) | |
Purchased option contracts | | | | | | | | | | | | | | | | | | | | | | | | | | |
Calls | | | | | | | | | | | | | | | | | | | | | | | | | | |
Fidelity National Information | | $130.00 | | | 12/20/2019 | | | | 30 | | | $ | 3,000 | | | $ | 17,550 | | | $ | 12,517 | | | $ | 5,033 | |
Norfolk Southern Corp. | | 125.00 | | | 01/17/2020 | | | | 11 | | | | 1,100 | | | | 63,415 | | | | 66,440 | | | | (3,025 | ) |
Texas Instruments, Inc. | | 120.00 | | | 12/20/2019 | | | | 25 | | | | 2,500 | | | | 7,125 | | | | 7,231 | | | | (106 | ) |
Union Pacific Corp. | | 125.00 | | | 01/17/2020 | | | | 26 | | | | 2,600 | | | | 105,885 | | | | 109,692 | | | | (3,807 | ) |
| | | | | | | | | | 92 | | | $ | 9,200 | | | $ | 193,975 | | | $ | 195,880 | | | $ | (1,905 | ) |
Puts | | | | | | | | | | | | | | | | | | | | | | | | | | |
Invesco QQQ Trust | | $178.00 | | | 11/15/2019 | | | | 233 | | | $ | 23,300 | | | $ | 2,446 | | | $ | 64,548 | | | $ | (62,102 | ) |
Microsoft Corp. | | 140.00 | | | 11/15/2019 | | | | 44 | | | | 4,400 | | | | 3,432 | | | | 16,308 | | | | (12,876 | ) |
Nvidia Corp. | | 185.00 | | | 11/15/2019 | | | | 14 | | | | 1,400 | | | | 3,151 | | | | 4,047 | | | | (896 | ) |
Nvidia Corp. | | 190.00 | | | 11/15/2019 | | | | 17 | | | | 1,700 | | | | 5,865 | | | | 5,791 | | | | 74 | |
T-Mobile Us, Inc. | | 82.00 | | | 11/15/2019 | | | | 51 | | | | 5,100 | | | | 5,533 | | | | 6,075 | | | | (542 | ) |
| | | | | | | | | | 359 | | | $ | 35,900 | | | $ | 20,427 | | | $ | 96,769 | | | $ | (76,342 | ) |
| | | | | | | |
| Total Purchased option contracts | | | | | | | | | 451 | | | $ | 45,100 | | | $ | 214,402 | | | $ | 292,649 | | | $ | (78,247 | ) |
Written option contracts | | | | | | | | | | | | | | | | | | | | | | | | | | |
Calls | | | | | | | | | | | | | | | | | | | | | | | | | | |
Nvidia Corp. | | $215.00 | | | 11/15/2019 | | | | (15 | ) | | $ | (1,500 | ) | | $ | (3,727 | ) | | $ | (3,029 | ) | | $ | (698 | ) |
Nvidia Corp. | | 220.00 | | | 11/15/2019 | | | | (17 | ) | | | (1,700 | ) | | | (2,499 | ) | | | (4,775 | ) | | | 2,276 | |
| | | | | | | | | | (32 | ) | | $ | (3,200 | ) | | $ | (6,226 | ) | | $ | (7,804 | ) | | $ | 1,578 | |
Puts | | | | | | | | | | | | | | | | | | | | | | | | | | |
Microsoft Corp. | | $140.00 | | | 11/15/2019 | | | | (44 | ) | | $ | (4,400 | ) | | $ | (3,432 | ) | | $ | (15,661 | ) | | $ | 12,229 | |
| | | | | | | |
| Total Written option contracts | | | | | | | | | (76 | ) | | $ | (7,600 | ) | | $ | (9,658 | ) | | $ | (23,465 | ) | | $ | 13,807 | |
| | | | | | | |
| TOTAL | | | | | | | | | 375 | | | $ | 37,500 | | | $ | 204,744 | | | $ | 269,184 | | | $ | (64,440 | ) |
|
|
Abbreviations: |
1M BID Avg—1 month Brazilian Interbank Deposit Average |
MS & Co. Int. PLC—Morgan Stanley & Co. International PLC |
|
| | |
| The accompanying notes are an integral part of these financial statements. | | 39 |
GOLDMAN SACHS MULTI-MANAGER ALTERNATIVES FUND
Consolidated Statement of Assets and Liabilities(a)
October 31, 2019
| | | | | | |
| | Assets: | |
| | Investments, at value (cost $132,914,366) | | $ | 141,886,180 | |
| | Investments of affiliated issuers, at value (cost $100,493,289) | | | 100,493,289 | |
| | Purchased options, at value (premium paid $292,649) | | | 214,402 | |
| | Cash | | | 7,316,186 | |
| | Foreign currencies, at value (cost $259,724) | | | 253,837 | |
| | Unrealized gain on swap contracts | | | 1,710,311 | |
| | Unrealized gain on forward foreign currency exchange contracts | | | 238,001 | |
| | Variation margin on futures contracts | | | 210,389 | |
| | Variation margin on swaps contracts | | | 108,689 | |
| | Receivables: | | | | |
| | Collateral on certain derivative contracts(b) | | | 23,035,540 | |
| | Reimbursement from investment adviser | | | 1,149,790 | |
| | Investments sold | | | 1,009,013 | |
| | Dividends and interest | | | 685,892 | |
| | Fund shares sold | | | 103,195 | |
| | Investments sold on an extended settlement basis | | | 61,086 | |
| | Foreign tax reclaims | | | 49,125 | |
| | Upfront payments made on swap contracts | | | 3,048 | |
| | Other assets | | | 26,457 | |
| | Total assets | | | 278,554,430 | |
| | | | | | |
| | Liabilities: | | | | |
| | Securities sold short, at value (proceeds received $6,278,254) | | | 6,780,335 | |
| | Unrealized loss on swap contracts | | | 1,789,639 | |
| | Unrealized loss on forward foreign currency exchange contracts | | | 380,431 | |
| | Variation margin on futures contracts | | | 472,488 | |
| | Written option contracts, at value (premium received $23,465) | | | 9,658 | |
| | Payables: | | | | |
| | Investments purchased on an extended settlement basis | | | 1,573,549 | |
| | Investments purchased | | | 1,679,860 | |
| | Fund shares redeemed | | | 723,775 | |
| | Management fees | | | 341,870 | |
| | Due to broker | | | 258,020 | |
| | Distribution and service fees and transfer agency fees | | | 21,181 | |
| | Dividend expense payable on securities sold short | | | 13,863 | |
| | Upfront payments received on swap contracts | | | 104 | |
| | Accrued expenses and other liabilities | | | 231,842 | |
| | Total liabilities | | | 14,276,615 | |
| | | | | | |
| | Net Assets: | | | | |
| | Paid-in capital | | | 316,579,842 | |
| | Total distributable earnings (loss) | | | (52,302,027 | ) |
| | | NET ASSETS | | $ | 264,277,815 | |
| | | Net Assets: | | | | |
| | | Class A | | $ | 11,538,295 | |
| | | Class C | | | 7,646,444 | |
| | | Institutional | | | 158,958,332 | |
| | | Investor | | | 12,456,968 | |
| | | Class P | | | 73,640,558 | |
| | | Class R | | | 26,817 | |
| | | Class R6 | | | 10,401 | |
| | | Total Net Assets | | $ | 264,277,815 | |
| | | Shares Outstanding $0.001 par value (unlimited number of shares authorized): | | | | |
| | | Class A | | | 1,100,534 | |
| | | Class C | | | 756,238 | |
| | | Institutional | | | 14,964,660 | |
| | | Investor | | | 1,179,132 | |
| | | Class P | | | 6,932,934 | |
| | | Class R | | | 2,586 | |
| | | Class R6 | | | 978 | |
| | | Net asset value, offering and redemption price per share:(c) | | | | |
| | | Class A | | $ | 10.48 | |
| | | Class C | | | 10.11 | |
| | | Institutional | | | 10.62 | |
| | | Investor | | | 10.56 | |
| | | Class P | | | 10.62 | |
| | | Class R | | | 10.37 | |
| | | Class R6 | | | 10.63 | |
| | (a) | | Statement of Assets and Liabilities for the Fund is consolidated and includes the balances of three wholly-owned subsidiaries, Cayman Commodity — MMA, Ltd., Cayman Commodity — MMA IV, Ltd. and Cayman Commodity — MMA V, Ltd. Accordingly, all interfund balances and transactions have been eliminated. |
| | (b) | | Includes segregated cash of $5,158,314, $1,175,000 and $16,702,226 relating to initial margin requirements and/or collateral on futures, forwards and swaps transactions, respectively. |
| | (c) | | Maximum public offering price per share for Class A Shares is $11.09. At redemption, Class C shares may be subject to a contingent deferred sales charge, assessed on the amount equal to the lesser of the current net asset value (“NAV”) or the original purchase price of the shares. |
| | |
| 40 | | The accompanying notes are an integral part of these financial statements. |
GOLDMAN SACHS MULTI-MANAGER ALTERNATIVES FUND
Consolidated Statement of Operations(a)
For the Fiscal Year Ended October 31, 2019
| | | | | | |
| | Investment income: | |
| | |
| | Interest — unaffiliated issuers | | $ | 4,502,567 | |
| | |
| | Dividends — affiliated issuers | | | 3,250,623 | |
| | |
| | Dividends — unaffiliated issuers (net of foreign withholding taxes of $72,288) | | | 1,569,570 | |
| | |
| | Total investment income | | | 9,322,760 | |
| | | | | | |
| | Expenses: | |
| | |
| | Management fees | | | 7,087,548 | |
| | |
| | Custody, accounting and administrative services | | | 3,208,984 | |
| | |
| | Professional fees | | | 330,814 | |
| | |
| | Transfer Agency fees(b) | | | 195,059 | |
| | |
| | Registration fees | | | 187,478 | |
| | |
| | Printing and mailing costs | | | 176,134 | |
| | |
| | Distribution and Service fees(b) | | | 131,763 | |
| | |
| | Dividend expense for securities sold short | | | 119,612 | |
| | |
| | Prime broker fees | | | 84,149 | |
| | |
| | Trustee fees | | | 35,313 | |
| | |
| | Other | | | 41,859 | |
| | |
| | Total expenses | | | 11,598,713 | |
| | |
| | Less — expense reductions | | | (4,765,096 | ) |
| | |
| | Net expenses | | | 6,833,617 | |
| | |
| | NET INVESTMENT INCOME | | | 2,489,143 | |
| | | | | | |
| | Realized and unrealized gain (loss): | |
| | |
| | Net realized gain (loss) from: | | | | |
| | |
| | Investments (including commission recapture of $6,475) | | | 12,962,655 | |
| | |
| | Securities short sales | | | (520,296 | ) |
| | |
| | Purchased options | | | (392,702 | ) |
| | |
| | Futures contracts | | | 260,957 | |
| | |
| | Written options | | | 4,209 | |
| | |
| | Swap contracts | | | (1,978,607 | ) |
| | |
| | Forward foreign currency exchange contracts | | | (394,445 | ) |
| | |
| | Foreign currency transactions | | | 89,909 | |
| | |
| | Net change in unrealized gain (loss) on: | | | | |
| | |
| | Investments — unaffiliated issuers | | | 11,596,045 | |
| | |
| | Securities short sales | | | (825,838 | ) |
| | |
| | Purchased options | | | (78,247 | ) |
| | |
| | Futures contracts | | | (417,942 | ) |
| | |
| | Written options | | | 13,807 | |
| | |
| | Swap contracts | | | 92,662 | |
| | |
| | Forward foreign currency exchange contracts | | | 207,442 | |
| | |
| | Foreign currency translation | | | 7,124 | |
| | |
| | Net realized and unrealized gain | | | 20,626,733 | |
| | |
| | NET INCREASE IN NET ASSETS RESULTING FROM OPERATIONS | | $ | 23,115,876 | |
| | (a) | | Statement of Operations for the Fund is consolidated and includes the balances of three wholly-owned subsidiaries, Cayman Commodity — MMA, Ltd., Cayman Commodity — MMA IV, Ltd. and Cayman Commodity — MMA V, Ltd. Accordingly, all interfund balances and transactions have been eliminated. |
| | (b) | | Class specific Distribution and/or Service, and Transfer Agency fees were as follows: |
| | | | | | | | | | | | | | | | | | | | | | | | | | | | | | | | | | | | | | |
| Distribution and Service Fees | | | Transfer Agency Fees | |
Class A | | | Class C | | | Class R | | | Class A | | | Class C | | | Institutional | | | Investor | | | Class P | | | Class R | | | Class R6 | |
| $ | 36,151 | | | $ | 95,481 | | | $ | 132 | | | $ | 25,712 | | | $ | 16,979 | | | $ | 98,703 | | | $ | 28,102 | | | $ | 25,513 | | | $ | 46 | | | $ | 4 | |
| | |
| The accompanying notes are an integral part of these financial statements. | | 41 |
GOLDMAN SACHS MULTI-MANAGER ALTERNATIVES FUND
Consolidated Statements of Changes in Net Assets(a)
| | | | | | | | | | |
| | | | | Multi Manager Alternatives Fund | |
| | | | | For the Fiscal
Year Ended
October 31, 2019 | | | For the Fiscal
Year Ended
October 31, 2018 | |
| | From operations: | |
| | | |
| | Net investment income (loss) | | $ | 2,489,143 | | | $ | (957,880 | ) |
| | | |
| | Net realized gain | | | 10,031,680 | | | | 8,675,960 | |
| | | |
| | Net change in unrealized gain (loss) | | | 10,595,053 | | | | (24,885,335 | ) |
| | | |
| | Net increase (decrease) in net assets resulting from operations | | | 23,115,876 | | | | (17,167,255 | ) |
| | | | | | | | | | |
| | From share transactions: | |
| | | |
| | Proceeds from sales of shares | | | 62,447,737 | | | | 263,366,454 | |
| | | |
| | Cost of shares redeemed | | | (353,836,473 | ) | | | (684,149,192 | ) |
| | | |
| | Net decrease in net assets resulting from share transactions | | | (291,388,736 | ) | | | (420,782,738 | ) |
| | | |
| | TOTAL DECREASE | | | (268,272,860 | ) | | | (437,949,993 | ) |
| | | | | | | | | | |
| | Net assets: | |
| | Beginning of year | | | 532,550,675 | | | | 970,500,668 | |
| | | |
| | End of year | | $ | 264,277,815 | | | $ | 532,550,675 | |
| | (a) | | Statements of Changes in Net Assets for the Fund is consolidated and includes the balances of three wholly-owned subsidiaries, Cayman Commodity — MMA, Ltd., Cayman Commodity — MMA IV, Ltd. and Cayman Commodity — MMA V, Ltd. Accordingly, all interfund balances and transactions have been eliminated. |
| | |
| 42 | | The accompanying notes are an integral part of these financial statements. |
GOLDMAN SACHS MULTI-MANAGER ALTERNATIVES FUND
Consolidated Financial Highlights
Selected Share Data for a Share Outstanding Throughout Each Period
| | | | | | | | | | | | | | | | | | | | | | | | | | |
| | | | | Goldman Sachs Multi-Manager Alternatives Fund | |
| | | | | Class A Shares | |
| | | | | Year Ended October 31, | | | Period Ended
January 1–
October 31, 2015 | | | Year Ended
December 31, 2014 | |
| | | | | 2019 | | | 2018 | | | 2017 | | | 2016 | |
| | Per Share Data | | | | | |
| | | | | | | |
| | Net asset value, beginning of period | | $ | 9.91 | | | $ | 10.22 | | | $ | 10.25 | | | $ | 10.33 | | | $ | 10.58 | | | $ | 10.46 | |
| | | | | | | |
| | Net investment income (loss)(a) | | | 0.04 | | | | (0.04 | ) | | | (0.02 | ) | | | 0.04 | | | | (0.03 | ) | | | (0.06 | ) |
| | | | | | | |
| | Net realized and unrealized gain (loss) | | | 0.53 | | | | (0.27 | ) | | | 0.13 | | | | (0.06 | ) | | | (0.22 | ) | | | 0.33 | |
| | | | | | | |
| | Total from investment operations | | | 0.57 | | | | (0.31 | ) | | | 0.11 | | | | (0.02 | ) | | | (0.25 | ) | | | 0.27 | |
| | | | | | | |
| | Distributions to shareholders from net investment income | | | — | | | | — | | | | (0.14 | ) | | | (0.01 | ) | | | — | | | | (0.03 | ) |
| | | | | | | |
| | Distributions to shareholders from net realized gains | | | — | | | | — | | | | — | | | | (0.05 | ) | | | — | | | | (0.12 | ) |
| | | | | | | |
| | Total distributions | | | — | | | | — | | | | (0.14 | ) | | | (0.06 | ) | | | — | | | | (0.15 | ) |
| | | | | | | |
| | Net asset value, end of period | | $ | 10.48 | | | $ | 9.91 | | | $ | 10.22 | | | $ | 10.25 | | | $ | 10.33 | | | $ | 10.58 | |
| | | | | | | |
| | Total return(b) | | | 5.75 | % | | | (3.03 | )% | | | 1.08 | % | | | (0.23 | )% | | | (2.36 | )% | | | 2.61 | % |
| | | | | | | |
| | Net assets, end of period (in 000s) | | $ | 11,538 | | | $ | 19,155 | | | $ | 37,077 | | | $ | 134,843 | | | $ | 217,307 | | | $ | 116,593 | |
| | | | | | | |
| | Ratio of net expenses to average net assets (including dividend and interest payments and other expenses relating to securities sold short) | | | 2.12 | % | | | 2.31 | % | | | 2.51 | % | | | 2.65 | % | | | 2.89 | %(c) | | | 2.85 | % |
| | | | | | | |
| | Ratio of net expenses to average net assets (excluding dividend and interest payments and other expenses relating to securities sold short) | | | 2.07 | % | | | 2.23 | % | | | 2.38 | % | | | 2.41 | % | | | 2.56 | %(c) | | | 2.56 | % |
| | | | | | | |
| | Ratio of total expenses to average net assets (including dividend and interest payments and other expenses relating to securities sold short) | | | 3.51 | % | | | 2.91 | % | | | 2.74 | % | | | 2.85 | % | | | 2.97 | %(c) | | | 3.23 | % |
| | | | | | | |
| | Ratio of total expenses to average net assets (excluding dividend and interest payments and other expenses relating to securities sold short) | | | 3.46 | % | | | 2.82 | % | | | 2.62 | % | | | 2.60 | % | | | 2.63 | %(c) | | | 2.94 | % |
| | | | | | | |
| | Ratio of net investment income (loss) to average net assets | | | 0.39 | % | | | (0.43 | )% | | | (0.22 | )% | | | 0.39 | % | | | (0.29 | )%(c) | | | (0.53 | )% |
| | | | | | | |
| | Portfolio turnover rate(d) | | | 202 | % | | | 232 | % | | | 112 | % | | | 73 | % | | | 130 | % | | | 144 | % |
| | (a) | | Calculated based on the average shares outstanding methodology. |
| | (b) | | Assumes investment at the NAV at the beginning of the period, reinvestment of all dividends and distributions, a complete redemption of the investment at the NAV at the end of the period and no sales or redemption charges (if any). Total returns would be reduced if a sales or redemption charge was taken into account. Returns do not reflect the impact of taxes to shareholders relating to Fund distributions or the redemption of Fund shares. Total returns for periods less than one full year are not annualized. |
| | (d) | | The Fund’s portfolio turnover rate is calculated in accordance with regulatory requirements, without regard to transactions involving short term investments and certain derivatives. If such transactions were included, the Fund’s portfolio turnover rate may be higher. |
| | |
| The accompanying notes are an integral part of these financial statements. | | 43 |
GOLDMAN SACHS MULTI-MANAGER ALTERNATIVES FUND
Consolidated Financial Highlights(continued)
Selected Share Data for a Share Outstanding Throughout Each Period
| | | | | | | | | | | | | | | | | | | | | | | | | | |
| | | | | Goldman Sachs Multi-Manager Alternatives Fund | |
| | | | | Class C Shares | |
| | | | | Year Ended October 31, | | | Period Ended
January 1–
October 31, 2015 | | | Year Ended
December 31, 2014 | |
| | | | | 2019 | | | 2018 | | | 2017 | | | 2016 | |
| | Per Share Data | | | | | |
| | | | | | | |
| | Net asset value, beginning of period | | $ | 9.62 | | | $ | 10.00 | | | $ | 10.02 | | | $ | 10.16 | | | $ | 10.47 | | | $ | 10.40 | |
| | | | | | | |
| | Net investment loss(a) | | | (0.03 | ) | | | (0.12 | ) | | | (0.11 | ) | | | (0.04 | ) | | | (0.09 | ) | | | (0.14 | ) |
| | | | | | | |
| | Net realized and unrealized gain (loss) | | | 0.52 | | | | (0.26 | ) | | | 0.13 | | | | (0.05 | ) | | | (0.22 | ) | | | 0.33 | |
| | | | | | | |
| | Total from investment operations | | | 0.49 | | | | (0.38 | ) | | | 0.02 | | | | (0.09 | ) | | | (0.31 | ) | | | 0.19 | |
| | | | | | | |
| | Distributions to shareholders from net investment income | | | — | | | | — | | | | (0.04 | ) | | | — | | | | — | | | | — | (b) |
| | | | | | | |
| | Distributions to shareholders from net realized gains | | | — | | | | — | | | | — | | | | (0.05 | ) | | | — | | | | (0.12 | ) |
| | | | | | | |
| | Total distributions | | | — | | | | — | | | | (0.04 | ) | | | (0.05 | ) | | | — | | | | (0.12 | ) |
| | | | | | | |
| | Net asset value, end of period | | $ | 10.11 | | | $ | 9.62 | | | $ | 10.00 | | | $ | 10.02 | | | $ | 10.16 | | | $ | 10.47 | |
| | | | | | | |
| | Total return(c) | | | 4.98 | % | | | (3.70 | )% | | | 0.23 | % | | | (1.02 | )% | | | (2.87 | )% | | | 1.84 | % |
| | | | | | | |
| | Net assets, end of period (in 000s) | | $ | 7,646 | | | $ | 12,333 | | | $ | 29,758 | | | $ | 49,334 | | | $ | 79,891 | | | $ | 38,207 | |
| | | | | | | |
| | Ratio of net expenses to average net assets (including dividend and interest payments and other expenses relating to securities sold short) | | | 2.87 | % | | | 3.07 | % | | | 3.26 | % | | | 3.40 | % | | | 3.64 | %(d) | | | 3.64 | % |
| | | | | | | |
| | Ratio of net expenses to average net assets (excluding dividend and interest payments and other expenses relating to securities sold short) | | | 2.82 | % | | | 2.99 | % | | | 3.13 | % | | | 3.16 | % | | | 3.31 | %(d) | | | 3.31 | % |
| | | | | | | |
| | Ratio of total expenses to average net assets (including dividend and interest payments and other expenses relating to securities sold short) | | | 4.27 | % | | | 3.65 | % | | | 3.54 | % | | | 3.60 | % | | | 3.72 | %(d) | | | 3.99 | % |
| | | | | | | |
| | Ratio of total expenses to average net assets (excluding dividend and interest payments and other expenses relating to securities sold short) | | | 4.21 | % | | | 3.57 | % | | | 3.41 | % | | | 3.36 | % | | | 3.38 | %(d) | | | 3.66 | % |
| | | | | | | |
| | Ratio of net investment loss to average net assets | | | (0.36 | )% | | | (1.23 | )% | | | (1.07 | )% | | | (0.35 | )% | | | (1.04 | )%(d) | | | (1.33 | )% |
| | | | | | | |
| | Portfolio turnover rate(e) | | | 202 | % | | | 232 | % | | | 112 | % | | | 73 | % | | | 130 | % | | | 144 | % |
| | (a) | | Calculated based on the average shares outstanding methodology. |
| | (b) | | Amount is less than $0.005 per share. |
| | (c) | | Assumes investment at the NAV at the beginning of the period, reinvestment of all dividends and distributions, a complete redemption of the investment at the NAV at the end of the period and no sales or redemption charges (if any). Total returns would be reduced if a sales or redemption charge was taken into account. Returns do not reflect the impact of taxes to shareholders relating to Fund distributions or the redemption of Fund shares. Total returns for periods less than one full year are not annualized. |
| | (e) | | The Fund’s portfolio turnover rate is calculated in accordance with regulatory requirements, without regard to transactions involving short term investments and certain derivatives. If such transactions were included, the Fund’s portfolio turnover rate may be higher. |
| | |
| 44 | | The accompanying notes are an integral part of these financial statements. |
GOLDMAN SACHS MULTI-MANAGER ALTERNATIVES FUND
Consolidated Financial Highlights(continued)
Selected Share Data for a Share Outstanding Throughout Each Period
| | | | | | | | | | | | | | | | | | | | | | | | | | |
| | | | | Goldman Sachs Multi-Manager Alternatives Fund | |
| | | | | Institutional Shares | |
| | | | | Year Ended October 31, | | | Period Ended
January 1–
October 31, 2015 | | | Year Ended
December 31, 2014 | |
| | | | | 2019 | | | 2018 | | | 2017 | | | 2016 | |
| | Per Share Data | | | | | |
| | | | | | | |
| | Net asset value, beginning of period | | $ | 10.00 | | | $ | 10.28 | | | $ | 10.33 | | | $ | 10.40 | | | $ | 10.61 | | | $ | 10.49 | |
| | | | | | | |
| | Net investment income (loss)(a) | | | 0.07 | | | | (0.01 | ) | | | — | (b) | | | 0.08 | | | | 0.01 | | | | (0.01 | ) |
| | | | | | | |
| | Net realized and unrealized gain (loss) | | | 0.55 | | | | (0.27 | ) | | | 0.15 | | | | (0.07 | ) | | | (0.22 | ) | | | 0.31 | |
| | | | | | | |
| | Total from investment operations | | | 0.62 | | | | (0.28 | ) | | | 0.15 | | | | 0.01 | | | | (0.21 | ) | | | 0.30 | |
| | | | | | | |
| | Distributions to shareholders from net investment income | | | — | | | | — | | | | (0.20 | ) | | | (0.03 | ) | | | — | | | | (0.06 | ) |
| | | | | | | |
| | Distributions to shareholders from net realized gains | | | — | | | | — | | | | — | | | | (0.05 | ) | | | — | | | | (0.12 | ) |
| | | | | | | |
| | Total distributions | | | — | | | | — | | | | (0.20 | ) | | | (0.08 | ) | | | — | | | | (0.18 | ) |
| | | | | | | |
| | Net asset value, end of period | | $ | 10.62 | | | $ | 10.00 | | | $ | 10.28 | | | $ | 10.33 | | | $ | 10.40 | | | $ | 10.61 | |
| | | | | | | |
| | Total return(c) | | | 6.20 | % | | | (2.72 | )% | | | 1.47 | % | | | 0.13 | % | | | (1.98 | )% | | | 3.00 | % |
| | | | | | | |
| | Net assets, end of period (in 000s) | | $ | 158,958 | | | $ | 361,962 | | | $ | 807,918 | | | $ | 903,812 | | | $ | 1,236,592 | | | $ | 628,397 | |
| | | | | | | |
| | Ratio of net expenses to average net assets (including dividend and interest payments and other expenses relating to securities sold short) | | | 1.80 | % | | | 1.97 | % | | | 2.11 | % | | | 2.25 | % | | | 2.49 | %(d) | | | 2.45 | % |
| | | | | | | |
| | Ratio of net expenses to average net assets (excluding dividend and interest payments and other expenses relating to securities sold short) | | | 1.74 | % | | | 1.89 | % | | | 1.98 | % | | | 2.01 | % | | | 2.16 | %(d) | | | 2.16 | % |
| | | | | | | |
| | Ratio of total expenses to average net assets (including dividend and interest payments and other expenses relating to securities sold short) | | | 3.03 | % | | | 2.51 | % | | | 2.40 | % | | | 2.45 | % | | | 2.57 | %(d) | | | 2.82 | % |
| | | | | | | |
| | Ratio of total expenses to average net assets (excluding dividend and interest payments and other expenses relating to securities sold short) | | | 2.98 | % | | | 2.43 | % | | | 2.28 | % | | | 2.21 | % | | | 2.24 | %(d) | | | 2.53 | % |
| | | | | | | |
| | Ratio of net investment income (loss) to average net assets | | | 0.71 | % | | | (0.12 | )% | | | 0.02 | % | | | 0.81 | % | | | 0.11 | %(d) | | | (0.11 | )% |
| | | | | | | |
| | Portfolio turnover rate(e) | | | 202 | % | | | 232 | % | | | 112 | % | | | 73 | % | | | 130 | % | | | 144 | % |
| | (a) | | Calculated based on the average shares outstanding methodology. |
| | (b) | | Amount is less than $0.005 per share. |
| | (c) | | Assumes investment at the NAV at the beginning of the period, reinvestment of all dividends and distributions, a complete redemption of the investment at the NAV at the end of the period and no sales or redemption charges (if any). Total returns would be reduced if a sales or redemption charge was taken into account. Returns do not reflect the impact of taxes to shareholders relating to Fund distributions or the redemption of Fund shares. Total returns for periods less than one full year are not annualized. |
| | (e) | | The Fund’s portfolio turnover rate is calculated in accordance with regulatory requirements, without regard to transactions involving short term investments and certain derivatives. If such transactions were included, the Fund’s portfolio turnover rate may be higher. |
| | |
| The accompanying notes are an integral part of these financial statements. | | 45 |
GOLDMAN SACHS MULTI-MANAGER ALTERNATIVES FUND
Consolidated Financial Highlights(continued)
Selected Share Data for a Share Outstanding Throughout Each Period
| | | | | | | | | | | | | | | | | | | | | | | | | | |
| | | | | Goldman Sachs Multi-Manager Alternatives Fund | |
| | | | | Investor Shares | |
| | | | | Year Ended October 31, | | | Period Ended
January 1–
October 31, 2015 | | | Year Ended
December 31, 2014 | |
| | | | | 2019 | | | 2018 | | | 2017 | | | 2016 | |
| | Per Share Data | | | | | |
| | | | | | | |
| | Net asset value, beginning of period | | $ | 9.95 | | | $ | 10.24 | | | $ | 10.30 | | | $ | 10.37 | | | $ | 10.60 | | | $ | 10.48 | |
| | | | | | | |
| | Net investment income (loss)(a) | | | 0.07 | | | | (0.03 | ) | | | (0.01 | ) | | | 0.07 | | | | — | (b) | | | (0.03 | ) |
| | | | | | | |
| | Net realized and unrealized gain (loss) | | | 0.54 | | | | (0.26 | ) | | | 0.14 | | | | (0.07 | ) | | | (0.23 | ) | | | 0.33 | |
| | | | | | | |
| | Total from investment operations | | | 0.61 | | | | (0.29 | ) | | | 0.13 | | | | — | | | | (0.23 | ) | | | 0.30 | |
| | | | | | | |
| | Distributions to shareholders from net investment income | | | — | | | | — | | | | (0.19 | ) | | | (0.02 | ) | | | — | | | | (0.06 | ) |
| | | | | | | |
| | Distributions to shareholders from net realized gains | | | — | | | | — | | | | — | | | | (0.05 | ) | | | — | | | | (0.12 | ) |
| | | | | | | |
| | Total distributions | | | — | | | | — | | | | (0.19 | ) | | | (0.07 | ) | | | — | | | | (0.18 | ) |
| | | | | | | |
| | Net asset value, end of period | | $ | 10.56 | | | $ | 9.95 | | | $ | 10.24 | | | $ | 10.30 | | | $ | 10.37 | | | $ | 10.60 | |
| | | | | | | |
| | Total return(c) | | | 6.02 | % | | | (2.73 | )% | | | 1.23 | % | | | (0.06 | )% | | | (2.08 | )% | | | 2.85 | % |
| | | | | | | |
| | Net assets, end of period (in 000s) | | $ | 12,457 | | | $ | 30,347 | | | $ | 95,628 | | | $ | 108,924 | | | $ | 119,570 | | | $ | 42,894 | |
| | | | | | | |
| | Ratio of net expenses to average net assets (including dividend and interest payments and other expenses relating to securities sold short) | | | 1.87 | % | | | 2.09 | % | | | 2.26 | % | | | 2.39 | % | | | 2.64 | %(d) | | | 2.62 | % |
| | | | | | | |
| | Ratio of net expenses to average net assets (excluding dividend and interest payments and other expenses relating to securities sold short) | | | 1.82 | % | | | 2.01 | % | | | 2.13 | % | | | 2.16 | % | | | 2.31 | %(d) | | | 2.31 | % |
| | | | | | | |
| | Ratio of total expenses to average net assets (including dividend and interest payments and other expenses relating to securities sold short) | | | 3.23 | % | | | 2.64 | % | | | 2.54 | % | | | 2.61 | % | | | 2.72 | %(d) | | | 3.06 | % |
| | | | | | | |
| | Ratio of total expenses to average net assets (excluding dividend and interest payments and other expenses relating to securities sold short) | | | 3.18 | % | | | 2.56 | % | | | 2.42 | % | | | 2.38 | % | | | 2.38 | %(d) | | | 2.73 | % |
| | | | | | | |
| | Ratio of net investment income (loss) to average net assets | | | 0.63 | % | | | (0.26 | )% | | | (0.13 | )% | | | 0.70 | % | | | (0.02 | )%(d) | | | (0.27 | )% |
| | | | | | | |
| | Portfolio turnover rate(e) | | | 202 | % | | | 232 | % | | | 112 | % | | | 73 | % | | | 130 | % | | | 144 | % |
| | (a) | | Calculated based on the average shares outstanding methodology. |
| | (b) | | Amount is less than $0.005 per share. |
| | (c) | | Assumes investment at the NAV at the beginning of the period, reinvestment of all dividends and distributions, a complete redemption of the investment at the NAV at the end of the period and no sales or redemption charges (if any). Total returns would be reduced if a sales or redemption charge was taken into account. Returns do not reflect the impact of taxes to shareholders relating to Fund distributions or the redemption of Fund shares. Total returns for periods less than one full year are not annualized. |
| | (e) | | The Fund’s portfolio turnover rate is calculated in accordance with regulatory requirements, without regard to transactions involving short term investments and certain derivatives. If such transactions were included, the Fund’s portfolio turnover rate may be higher. |
| | |
| 46 | | The accompanying notes are an integral part of these financial statements. |
GOLDMAN SACHS MULTI-MANAGER ALTERNATIVES FUND
Consolidated Financial Highlights(continued)
Selected Share Data for a Share Outstanding Throughout Each Period
| | | | | | | | | | |
| | | | | Goldman SachsMulti-Manager
Alternatives Fund | |
| | | | | Class P Shares | |
| | | | | Year Ended
October 31, 2019 | | | Period Ended
October 31, 2018(a) | |
| | Per Share Data | | | | | | | | |
| | | |
| | Net asset value, beginning of period | | $ | 10.00 | | | $ | 10.21 | |
| | | |
| | Net investment income(b) | | | 0.08 | | | | 0.02 | |
| | | |
| | Net realized and unrealized gain (loss) | | | 0.54 | | | | (0.23 | ) |
| | | |
| | Total from investment operations | | | 0.62 | | | | (0.21 | ) |
| | | |
| | Net asset value, end of period | | $ | 10.62 | | | $ | 10.00 | |
| | | |
| | Total return(c) | | | 6.20 | % | | | (2.06 | )% |
| | | |
| | Net assets, end of period (in 000s) | | $ | 73,641 | | | $ | 108,718 | |
| | | |
| | Ratio of net expenses to average net assets (including dividend and interest payments and other expenses relating to securities sold short) | | | 1.79 | % | | | 1.83 | %(d) |
| | | |
| | Ratio of net expenses to average net assets (excluding dividend and interest payments and other expenses relating to securities sold short) | | | 1.73 | % | | | 1.74 | %(d) |
| | | |
| | Ratio of total expenses to average net assets (including dividend and interest payments and other expenses relating to securities sold short) | | | 3.13 | % | | | 2.68 | %(d) |
| | | |
| | Ratio of total expenses to average net assets (excluding dividend and interest payments and other expenses relating to securities sold short) | | | 3.08 | % | | | 2.58 | %(d) |
| | | |
| | Ratio of net investment income to average net assets | | | 0.73 | % | | | 0.45 | %(d) |
| | | |
| | Portfolio turnover rate(e) | | | 202 | % | | | 232 | % |
| | (a) | | Commenced operations on April 16, 2018. |
| | (b) | | Calculated based on the average shares outstanding methodology. |
| | (c) | | Assumes investment at the NAV at the beginning of the period, reinvestment of all dividends and distributions, a complete redemption of the investment at the NAV at the end of the period and no sales or redemption charges (if any). Total returns would be reduced if a sales or redemption charge was taken into account. Returns do not reflect the impact of taxes to shareholders relating to Fund distributions or the redemption of Fund shares. Total returns for periods less than one full year are not annualized. |
| | (e) | | The Fund’s portfolio turnover rate is calculated in accordance with regulatory requirements, without regard to transactions involving short term investments and certain derivatives. If such transactions were included, the Fund’s portfolio turnover rate may be higher. |
| | |
| The accompanying notes are an integral part of these financial statements. | | 47 |
GOLDMAN SACHS MULTI-MANAGER ALTERNATIVES FUND
Consolidated Financial Highlights(continued)
Selected Share Data for a Share Outstanding Throughout Each Period
| | | | | | | | | | | | | | | | | | | | | | | | | | |
| | | | | Goldman Sachs Multi-Manager Alternatives Fund | |
| | | | | Class R Shares | |
| | | | | Year Ended October 31, | | | Period Ended
January 1–
October 31, 2015 | | | Year Ended
December 31, 2014 | |
| | | | | 2019 | | | 2018 | | | 2017 | | | 2016 | |
| | Per Share Data | | | | | |
| | | | | | | |
| | Net asset value, beginning of period | | $ | 9.82 | | | $ | 10.15 | | | $ | 10.18 | | | $ | 10.29 | | | $ | 10.56 | | | $ | 10.44 | |
| | | | | | | |
| | Net investment income (loss)(a) | | | 0.02 | | | | (0.09 | ) | | | (0.06 | ) | | | 0.01 | | | | (0.04 | ) | | | (0.07 | ) |
| | | | | | | |
| | Net realized and unrealized gain (loss) | | | 0.53 | | | | (0.24 | ) | | | 0.14 | | | | (0.05 | ) | | | (0.23 | ) | | | 0.31 | |
| | | | | | | |
| | Total from investment operations | | | 0.55 | | | | (0.33 | ) | | | 0.08 | | | | (0.04 | ) | | | (0.27 | ) | | | 0.24 | |
| | | | | | | |
| | Distributions to shareholders from net investment income | | | — | | | | — | | | | (0.11 | ) | | | (0.02 | ) | | | — | | | | — | (b) |
| | | | | | | |
| | Distributions to shareholders from net realized gains | | | — | | | | — | | | | — | | | | (0.05 | ) | | | — | | | | (0.12 | ) |
| | | | | | | |
| | Total distributions | | | — | | | | — | | | | (0.11 | ) | | | (0.07 | ) | | | — | | | | (0.12 | ) |
| | | | | | | |
| | Net asset value, end of period | | $ | 10.37 | | | $ | 9.82 | | | $ | 10.15 | | | $ | 10.18 | | | $ | 10.29 | | | $ | 10.56 | |
| | | | | | | |
| | Total return(c) | | | 5.60 | % | | | (3.25 | )% | | | 0.73 | % | | | (0.40 | )% | | | (2.56 | )% | | | 2.30 | % |
| | | | | | | |
| | Net assets, end of period (in 000s) | | $ | 27 | | | $ | 25 | | | $ | 120 | | | $ | 119 | | | $ | 87 | | | $ | 30 | |
| | | | | | | |
| | Ratio of net expenses to average net assets (including dividend and interest payments and other expenses relating to securities sold short) | | | 2.38 | % | | | 2.61 | % | | | 2.76 | % | | | 2.91 | % | | | 3.14 | %(d) | | | 3.05 | % |
| | | | | | | |
| | Ratio of net expenses to average net assets (excluding dividend and interest payments and other expenses relating to securities sold short) | | | 2.32 | % | | | 2.53 | % | | | 2.63 | % | | | 2.66 | % | | | 2.81 | %(d) | | | 2.81 | % |
| | | | | | | |
| | Ratio of total expenses to average net assets (including dividend and interest payments and other expenses relating to securities sold short) | | | 3.86 | % | | | 3.12 | % | | | 3.07 | % | | | 3.11 | % | | | 3.24 | %(d) | | | 3.46 | % |
| | | | | | | |
| | Ratio of total expenses to average net assets (excluding dividend and interest payments and other expenses relating to securities sold short) | | | 3.81 | % | | | 3.04 | % | | | 2.94 | % | | | 2.85 | % | | | 2.90 | %(d) | | | 3.22 | % |
| | | | | | | |
| | Ratio of net investment income (loss) to average net assets | | | 0.15 | % | | | (0.91 | )% | | | (0.63 | )% | | | 0.07 | % | | | (0.49 | )%(d) | | | (0.69 | )% |
| | | | | | | |
| | Portfolio turnover rate(e) | | | 202 | % | | | 232 | % | | | 112 | % | | | 73 | % | | | 130 | % | | | 144 | % |
| | (a) | | Calculated based on the average shares outstanding methodology. |
| | (b) | | Amount is less than $0.005 per share. |
| | (c) | | Assumes investment at the NAV at the beginning of the period, reinvestment of all dividends and distributions, a complete redemption of the investment at the NAV at the end of the period and no sales or redemption charges (if any). Total returns would be reduced if a sales or redemption charge was taken into account. Returns do not reflect the impact of taxes to shareholders relating to Fund distributions or the redemption of Fund shares. Total returns for periods less than one full year are not annualized. |
| | (e) | | The Fund’s portfolio turnover rate is calculated in accordance with regulatory requirements, without regard to transactions involving short term investments and certain derivatives. If such transactions were included, the Fund’s portfolio turnover rate may be higher. |
| | |
| 48 | | The accompanying notes are an integral part of these financial statements. |
GOLDMAN SACHS MULTI-MANAGER ALTERNATIVES FUND
Consolidated Financial Highlights(continued)
Selected Share Data for a Share Outstanding Throughout Each Period
| | | | | | | | | | |
| | | | | Goldman Sachs Multi-Manager
Alternatives Fund | |
| | | | | Class R6 Shares | |
| | | | | Year Ended
October 31, 2019 | | | Period Ended
October 31, 2018(a) | |
| | Per Share Data | |
| | | |
| | Net asset value, beginning of period | | $ | 10.01 | | | $ | 10.22 | |
| | | |
| | Net investment income(b) | | | 0.08 | | | | 0.01 | |
| | | |
| | Net realized and unrealized gain (loss) | | | 0.54 | | | | (0.22 | ) |
| | | |
| | Total from investment operations | | | 0.62 | | | | (0.21 | ) |
| | | |
| | Net asset value, end of period | | $ | 10.63 | | | $ | 10.01 | |
| | | |
| | Total return(c) | | | 6.19 | % | | | (2.05 | )% |
| | | |
| | Net assets, end of period (in 000s) | | $ | 10 | | | $ | 10 | |
| | | |
| | Ratio of net expenses to average net assets (including dividend and interest payments and other expenses relating to securities sold short) | | | 1.79 | % | | | 1.90 | %(d) |
| | | |
| | Ratio of net expenses to average net assets (excluding dividend and interest payments and other expenses relating to securities sold short) | | | 1.74 | % | | | 1.81 | %(d) |
| | | |
| | Ratio of total expenses to average net assets (including dividend and interest payments and other expenses relating to securities sold short) | | | 3.23 | % | | | 2.63 | %(d) |
| | | |
| | Ratio of total expenses to average net assets (excluding dividend and interest payments and other expenses relating to securities sold short) | | | 3.18 | % | | | 2.54 | %(d) |
| | | |
| | Ratio of net investment income to average net assets | | | 0.75 | % | | | 0.13 | %(d) |
| | | |
| | Portfolio turnover rate(e) | | | 202 | % | | | 232 | % |
| | (a) | | Commenced operations on February 28, 2018. |
| | (b) | | Calculated based on the average shares outstanding methodology. |
| | (c) | | Assumes investment at the NAV at the beginning of the period, reinvestment of all dividends and distributions, a complete redemption of the investment at the NAV at the end of the period and no sales or redemption charges (if any). Total returns would be reduced if a sales or redemption charge was taken into account. Returns do not reflect the impact of taxes to shareholders relating to Fund distributions or the redemption of Fund shares. Total returns for periods less than one full year are not annualized. |
| | (e) | | The Fund’s portfolio turnover rate is calculated in accordance with regulatory requirements, without regard to transactions involving short term investments and certain derivatives. If such transactions were included, the Fund’s portfolio turnover rate may be higher. |
| | |
| The accompanying notes are an integral part of these financial statements. | | 49 |
GOLDMAN SACHS MULTI-MANAGER ALTERNATIVES FUND
Consolidated Notes to Financial Statements
October 31, 2019
Goldman Sachs Trust II (the “Trust”) is a Delaware statutory trust registered under the Investment Company Act of 1940, as amended (the “Act”), as anopen-end management investment company. The Trust includes the Goldman Sachs Multi-Manager Alternatives Fund (the “Fund”). The Fund is a diversified portfolio and currently offers seven classes of shares: Class A, Class C, Institutional, Investor, Class P, Class R, Class R6 Shares.
Class A Shares are sold with afront-end sales charge of up to 5.50%. Class C Shares are sold with a contingent deferred sales charge (“CDSC”) of 1.00%, which is imposed on redemptions made within 12 months of purchase. Institutional, Investor, Class P, Class R and Class R6 Shares are not subject to a sales charge.
Goldman Sachs Asset Management, L.P. (“GSAM”), an affiliate of Goldman Sachs & Co. LLC (“Goldman Sachs”), serves as investment adviser to the Fund pursuant to a management agreement (the “Agreement”) with the Trust. As of October 31, 2019, GSAM hadsub-advisory agreements (the“Sub-Advisory Agreements”) for the Fund with Algert Global LLC (“Algert”), Ares Capital Management II LLC (“Ares”), Artisan Partners Limited Partnership (“Artisan Partners”), Bardin Hill Arbitrage IC Management LP (“Bardin Hill”), Brigade Capital Management, LP (“Brigade”), Crabel Capital Management, LLC (“Crabel”), Emso Asset Management Limited (“Emso”), First Pacific Advisors, LP (“FPA”), GQG Partners LLC (“GQG Partners”), River Canyon Fund Management LLC (“River Canyon”), Russell Investments Commodity Advisor, LLC (“RICA”), Sirios Capital Management L.P. (“Sirios”) and Wellington Management Company LLP (“Wellington”) (the “Underlying Managers”). Crabel also serves as an Underlying Manager for a Subsidiary (as defined below). Pursuant to the terms of theSub-Advisory Agreements, the Underlying Managers are responsible for making investment decisions and managing the investments of the Fund. GSAM compensates the Underlying Managers directly in accordance with the terms of theSub-Advisory Agreements. The Fund is not charged any separate or additional investment advisory fees by the Underlying Managers.
As of October 31, 2019, GSAM no longer hadsub-advisory agreements for the Fund with Acadian Asset Management LLC (“Acadian”), ADG Capital Management LLP (“ADG”), One River Asset Management LLC (“One River”), and QMS Capital Management LP (“QMS”).
|
| 2. SIGNIFICANT ACCOUNTING POLICIES |
The financial statements have been prepared in accordance with accounting principles generally accepted in the United States of America (“GAAP”) and require management to make estimates and assumptions that may affect the reported amounts and disclosures. Actual results may differ from those estimates and assumptions. The Fund is an investment company under GAAP and follows the accounting and reporting guidance applicable to investment companies.
A. Basis of Consolidation for the Goldman Sachs Multi-Manager Alternatives Fund — The Cayman Commodity — MMA IV, Ltd. (a “Subsidiary”), Cayman Islands exempted companies, respectively, and is a wholly-owned subsidiary of the Fund. The Subsidiary acts as an investment vehicle for the Fund to enable the Fund to gain exposure to certain types of commodity-linked derivative instruments. The Fund is the sole shareholder of the Subsidiary and it is intended that the Fund will remain the sole shareholder and will continue to control the Subsidiary. Under the Memorandum and Articles of Association of the Subsidiary, shares issued by the Subsidiary confer upon a shareholder the right to vote at general meetings of the Subsidiary and certain rights in connection with anywinding-up or repayment of capital, as well as the right to participate in the profits or assets of the Subsidiary. All inter-fund balances and transactions have been eliminated in consolidation. As of October 31, 2019, the Fund’s net assets were $264,277,815 of which, $ 3,965,169, or 1.5%, represented the Cayman Commodity — MMA IV, Ltd.’s net assets. As of October 31, 2019, the Cayman Commodity — MMA, Ltd., and Cayman Commodity — MMA V, Ltd. did not hold any assets.
B. Investment Valuation— The Fund’s valuation policy is to value investments at fair value.
C. Investment Income and Investments — Investment income includes interest income, dividend income, and securities lending income, if any. Interest income is accrued daily and adjusted for amortization of premiums and accretion of discounts. Dividend income is recognized onex-dividend date or, for certain foreign securities, as soon as such information is obtained subsequent to theex-dividend date. Non-cash dividends, if any, are recorded at the fair market value of the securities received. Investment transactions are reflected on trade date. Realized gains and losses are calculated using identified cost.
50
GOLDMAN SACHS MULTI-MANAGER ALTERNATIVES FUND
|
| 2. SIGNIFICANT ACCOUNTING POLICIES (continued) |
Investment transactions are recorded on the following business day for daily net asset value (“NAV”) calculations. Investment income is recorded net of any foreign withholding taxes, less any amounts reclaimable. The Fund may file withholding tax reclaims in certain jurisdictions to recover a portion of amounts previously withheld. Any foreign capital gains tax is accrued daily based upon net unrealized gains, and is payable upon sale of such investments.
Distributions received from the Fund’s investments in U.S. real estate investment trusts (“REITs”) may be characterized as ordinary income, net capital gain and/or a return of capital. A return of capital is recorded by the Fund as a reduction to the cost basis of the REIT.
For derivative contracts, realized gains and losses are recorded upon settlement of the contract. Upfront payments, if any, are made or received upon entering into a swap agreement and are reflected in the Consolidated Statement of Assets and Liabilities. Upfront payments are recognized over the contract’s term/event as realized gains or losses, with the exception of forward starting swaps contracts whose realized gains or losses are recognized from the effective start date. For securities with paydown provisions, principal payments received are treated as a proportionate reduction to the cost basis of the securities, and excess or shortfall amounts are recorded as income. For treasury inflation protected securities (“TIPS”), adjustments to principal due to inflation/deflation are reflected as increases/decreases to interest income with a corresponding adjustment to cost.
D. Class Allocations and Expenses — Investment income, realized and unrealized gain (loss), if any, andnon-class specific expenses of the Fund are allocated daily based upon the proportion of net assets of each class.Non-class specific expenses directly incurred by the Fund are charged to the Fund, while such expenses incurred by the Trust are allocated across the Fund on a straight-line and/orpro-rata basis depending upon the nature of the expenses. Class-specific expenses, where applicable, are borne by the respective share classes and include Distribution and Service, Transfer Agency and Service and Shareholder Administration fees.
E. Federal Taxes and Distributions to Shareholders — It is the Fund’s policy to comply with the requirements of the Internal Revenue Code of 1986, as amended (the “Code”), applicable to regulated investment companies and to distribute each year substantially all of its investment company taxable income and capital gains to its shareholders. Accordingly, the Fund is not required to make any provisions for the payment of federal income tax. Distributions to shareholders are recorded on theex-dividend date. Income and capital gains distributions, if any, are declared and paid at least annually.
Each Subsidiary is classified as a controlled foreign corporation under the Code. Therefore, the Fund is required to increase its taxable income by its share of each Subsidiary’s income. Net losses of a Subsidiary cannot be deducted by the Fund in the current period nor carried forward to offset taxable income in future periods.
Net capital losses, if any, are carried forward to future fiscal years and may be used to the extent allowed by the Code to offset any future capital gains. Losses that are carried forward will retain their character as either short-term or long-term capital losses. Utilization of capital loss carryforwards will reduce the requirement of future capital gains distributions.
The characterization of distributions to shareholders for financial reporting purposes is determined in accordance with federal income tax rules, which may differ from GAAP. The source of the Fund’s distributions may be shown in the accompanying financial statements as either from distributable earnings or capital. Certain components of the Fund’s net assets on the Consolidated Statement of Assets and Liabilities reflect permanent GAAP/tax differences based on the appropriate tax character.
F. Foreign Currency Translation — The accounting records and reporting currency of the Fund are maintained in U.S. dollars. Assets and liabilities denominated in foreign currencies are translated into U.S. dollars using the current exchange rates at the close of each business day. The effect of changes in foreign currency exchange rates on investments is included within net realized and unrealized gain (loss) on investments. Changes in the value of other assets and liabilities as a result of fluctuations in foreign exchange rates are included in the Consolidated Statement of Operations within net change in unrealized gain (loss) on foreign currency translation. Transactions denominated in foreign currencies are translated into U.S. dollars on the date the transaction occurred, the effects of which are included within net realized gain (loss) on foreign currency transactions.
G. Commission Recapture — GSAM, on behalf of the Fund, may direct portfolio trades, subject to seeking best execution, to various brokers who have agreed to rebate a portion of the commissions generated. Such rebates are made directly to the Fund as cash payments and are included in net realized gain (loss) from investments on the Consolidated Statement of Operations.
51
GOLDMAN SACHS MULTI-MANAGER ALTERNATIVES FUND
Consolidated Notes to Financial Statements(continued)
October 31, 2019
|
| 3. INVESTMENTS AND FAIR VALUE MEASUREMENTS |
U.S. GAAP defines the fair value of a financial instrument as the amount that would be received to sell an asset or paid to transfer a liability in an orderly transaction between market participants at the measurement date (i.e., the exit price); the Fund’s policy is to use the market approach. GAAP establishes a fair value hierarchy that prioritizes the inputs to valuation techniques used to measure fair value. The hierarchy gives the highest priority to unadjusted quoted prices in active markets for identical assets or liabilities (Level 1 measurements) and the lowest priority to unobservable inputs (Level 3 measurements). The levels used for classifying investments are not necessarily an indication of the risk associated with investing in these investments. The three levels of the fair value hierarchy are described below:
Level 1 — Unadjusted quoted prices in active markets that are accessible at the measurement date for identical, unrestricted assets or liabilities;
Level 2 — Quoted prices in markets that are not active or financial instruments for which significant inputs are observable (including, but not limited to, quoted prices for similar investments, interest rates, foreign exchange rates, volatility and credit spreads), either directly or indirectly;
Level 3 — Prices or valuations that require significant unobservable inputs (including GSAM’s assumptions in determining fair value measurement).
The Board of Trustees (“Trustees”) has approved Valuation Procedures that govern the valuation of the portfolio investments held by the Fund, including investments for which market quotations are not readily available. The Trustees have delegated to GSAMday-to-day responsibility for implementing and maintaining internal controls and procedures related to the valuation of the Fund’s investments. To assess the continuing appropriateness of pricing sources and methodologies, GSAM regularly performs price verification procedures and issues challenges as necessary to third party pricing vendors or brokers, and any differences are reviewed in accordance with the Valuation Procedures.
A. Level 1 and Level 2 Fair Value Investments — The valuation techniques and significant inputs used in determining the fair values for investments classified as Level 1 and Level 2 are as follows:
Equity Securities — Equity securities traded on a United States (“U.S.”) securities exchange or the NASDAQ system, or those located on certain foreign exchanges, including but not limited to the Americas, are valued daily at their last sale price or official closing price on the principal exchange or system on which they are traded. If there is no sale or official closing price or such price is believed by GSAM to not represent fair value, equity securities may be valued at the closing bid price for long positions and at the closing ask price for short positions. To the extent these investments are actively traded, they are classified as Level 1 of the fair value hierarchy, otherwise they are generally classified as Level 2.
Unlisted equity securities for which market quotations are available are valued at the last sale price on the valuation date, or if no sale occurs, at the last bid price for long positions or the last ask price for short positions and are generally classified as Level 2. Securities traded on certain foreign securities exchanges are valued daily at fair value determined by an independent fair value service (if available) under Valuation Procedures approved by the Trustees and consistent with applicable regulatory guidance. The independent fair value service takes into account multiple factors including, but not limited to, movements in the securities markets, certain depositary receipts, futures contracts and foreign currency exchange rates that have occurred subsequent to the close of the foreign securities exchange. These investments are generally classified as Level 2 of the fair value hierarchy.
Underlying Funds (including Money Market Funds) — Underlying Funds (“Underlying Funds”) include other investment companies and exchange-traded funds (“ETFs”). Investments in the Underlying Funds (except ETFs) are valued at the NAV per share on the day of valuation. ETFs are valued daily at the last sale price or official closing price on the principal exchange or system on which the investment is traded. Because the Fund invests in Underlying Funds that fluctuate in value, the Fund’s shares will correspondingly fluctuate in value. To the extent these investments are actively traded, they are classified as Level 1 of the fair value hierarchy, otherwise they are generally classified as Level 2. For information regarding an Underlying Fund’s accounting policies and investment holdings, please see the Underlying Fund’s shareholder report.
Debt Securities — Debt securities for which market quotations are readily available are valued daily on the basis of quotations supplied by dealers or an independent pricing service approved by the Trustees. The pricing services may use valuation models or
52
GOLDMAN SACHS MULTI-MANAGER ALTERNATIVES FUND
|
| 3. INVESTMENTS AND FAIR VALUE MEASUREMENTS (continued) |
matrix pricing, which consider: (i) yield or price with respect to bonds that are considered comparable in characteristics such as rating, interest rate and maturity date or (ii) quotations from securities dealers to determine current value. With the exception of treasury securities of G7 countries, which are generally classified as Level 1, these investments are generally classified as Level 2 of the fair value hierarchy.
i. Mortgage-Backed and Asset-Backed Securities — Mortgage-backed securities represent direct or indirect participations in, or are collateralized by and payable from, mortgage loans secured by residential and/or commercial real estate property. Asset-backed securities include securities whose principal and interest payments are collateralized by pools of other assets or receivables. The value of certain mortgage-backed and asset-backed securities (including adjustable rate mortgage loans) may be particularly sensitive to changes in prevailing interest rates. The value of these securities may also fluctuate in response to the market’s perception of the creditworthiness of the issuers.
Asset-backed securities may present credit risks that are not presented by mortgage-backed securities because they generally do not have the benefit of a security interest in collateral that is comparable to mortgage assets. Some asset-backed securities may only have a subordinated claim on collateral.
Stripped mortgage-backed securities are usually structured with two different classes: one that receives substantially all interest payments (interest-only, or “IO” and/or high coupon rate with relatively low principal amount, or “IOette”), and the other that receives substantially all principal payments (principal-only, or “PO”) from a pool of mortgage loans. Little to no principal will be received at the maturity of an IO; as a result, periodic adjustments are recorded to reduce the cost of the security until maturity. These adjustments are included in interest income.
ii. Structured Notes — The values of structured notes are based on the price movements of a reference security or index. Upon termination, a Fund will receive a payment from the issuer based on the value of the referenced instrument (notional amount multiplied by price of the referenced instrument) and record a realized gain or loss. Structured notes that are exchange traded are generally classified as Level 1 of the fair value hierarchy.
Securities Sold Short — Securities sold short are those securities which the Fund has sold but which it does not own. When the Fund sells a security it does not own, it must borrow the security that was sold and it generally delivers the proceeds from the short sale to the broker through which it made the short sale. In addition, cash and certain investments in securities may be used to collateralize the securities sold short. Each day the securities sold short transaction is open, the liability to replace the borrowed security is marked to market and an unrealized gain or loss is recorded. While the transaction remains open, the Fund may also incur expenses for any dividends or interest which will be paid to the lender of the securities as well as a fee to borrow the delivered security. During the term of the short sale, the value of the securities pledged as collateral on short sales is required to exceed the value of the securities sold short. The market value of securities pledged as collateral is included in the Consolidated Schedule of Investments.
Derivative Contracts — A derivative is an instrument whose value is derived from underlying assets, indices, reference rates or a combination of these factors. The Fund enters into derivative transactions to hedge against changes in interest rates, securities prices, and/or currency exchange rates, to increase total return, or to gain access to certain markets or attain exposure to other underliers. For financial reporting purposes, cash collateral that has been pledged to cover obligations of a Fund and cash collateral received, if any, is reported separately on the Consolidated Statement of Assets and Liabilities as receivables/payables for collateral on certain derivatives contracts.Non-cash collateral pledged by the Fund, if any, is noted in the Consolidated Schedule of Investments.
Exchange-traded derivatives, including futures and options contracts, are generally valued at the last sale or settlement price on the exchange where they are principally traded. Exchange-traded options without settlement prices are generally valued at the midpoint of the bid and ask prices on the exchange where they are principally traded (or, in the absence oftwo-way trading, at the last bid price for long positions and the last ask price for short positions). Exchange-traded derivatives typically fall within Level 1 of the fair value hierarchy.Over-the-counter (“OTC”) and centrally cleared derivatives are valued using market transactions and other market evidence, including market-based inputs to models, calibration to market-clearing transactions, broker or dealer quotations, or other alternative pricing sources. Where models are used, the selection of a particular model to value OTC and
53
GOLDMAN SACHS MULTI-MANAGER ALTERNATIVES FUND
Consolidated Notes to Financial Statements(continued)
October 31, 2019
|
| 3. INVESTMENTS AND FAIR VALUE MEASUREMENTS (continued) |
centrally cleared derivatives depends upon the contractual terms of, and specific risks inherent in, the instrument, as well as the availability of pricing information in the market. Valuation models require a variety of inputs, including contractual terms, market prices, yield curves, credit curves, measures of volatility, voluntary and involuntary prepayment rates, loss severity rates and correlations of such inputs. For OTC and centrally cleared derivatives that trade in liquid markets, model inputs can generally be verified and model selection does not involve significant management judgment. OTC and centrally cleared derivatives are classified within Level 2 of the fair value hierarchy when significant inputs are corroborated by market evidence.
i. Forward Contracts — A forward contract is a contract between two parties to buy or sell an asset at a specified price on a future date. A forward contract settlement can occur on a cash or delivery basis. Forward contracts aremarked-to-market daily using independent vendor prices, and the change in value, if any, is recorded as an unrealized gain or loss. Cash and certain investments may be used to collateralize forward contracts.
Aforward foreign currency exchange contractis a forward contract in which the Fund agrees to receive or deliver a fixed quantity of one currency for another, at apre-determined price at a future date. All forward foreign currency exchange contracts aremarked-to-market daily at the applicable forward rate.Non-deliverable forward foreign currency exchange contracts are settled with the counterparty in cash without the delivery of foreign currency.
ii. Futures Contracts — Futures contracts are contracts to buy or sell a standardized quantity of a specified commodity or security. Upon entering into a futures contract, the Fund deposits cash or securities in an account on behalf of the broker in an amount sufficient to meet the initial margin requirement. Subsequent payments are made or received by the Fund equal to the daily change in the contract value and are recorded as variation margin receivable or payable with a corresponding offset to unrealized gains or losses.
iii. Options — When the Fund writes call or put options, an amount equal to the premium received is recorded as a liability and is subsequentlymarked-to-market to reflect the current value of the option written. Swaptions are options on interest rate swap contracts or credit default swap contracts.
Upon the purchase of a call option or a put option by the Fund, the premium paid is recorded as an investment and subsequentlymarked-to-market to reflect the current value of the option. Certain options may be purchased with premiums to be determined on a future date. The premiums for these options are based upon implied volatility parameters at specified terms.
iv. Swap Contracts — Bilateral swap contracts are agreements in which the Fund and a counterparty agree to exchange periodic payments on a specified notional amount or make a net payment upon termination. Bilateral swap transactions are privately negotiated in the OTC market and payments are settled through direct payments between the Fund and the counterparty. By contrast, certain swap transactions are subject to mandatory central clearing. These swaps are executed through a derivatives clearing member (“DCM”), acting in an agency capacity, and submitted to a central counterparty (“CCP”) (“centrally cleared swaps”), in which case all payments are settled with the CCP through the DCM. Swaps aremarked-to-market daily using pricing vendor quotations, counterparty or clearinghouse prices or model prices, and the change in value, if any, is recorded as an unrealized gain or loss. Upon entering into a swap contract, the Fund is required to satisfy an initial margin requirement by delivering cash or securities to the counterparty (or in some cases, segregated in a triparty account on behalf of the counterparty), which can be adjusted by anymark-to-market gains or losses pursuant to bilateral or centrally cleared arrangements. For centrally cleared swaps the daily change in valuation, if any, is recorded as a receivable or payable for variation margin.
An interest rate swap is an agreement that obligates two parties to exchange a series of cash flows at specified intervals, based upon or calculated by reference to changes in interest rates on a specified notional principal amount. The payment flows are usually netted against each other, with the difference being paid by one party to the other.
A credit default swap is an agreement that involves one party (the buyer of protection) making a stream of payments to another party (the seller of protection) in exchange for the right to receive protection on a reference security or obligation, including a group of assets or exposure to the performance of an index. The Fund’s investment in credit default swaps may involve greater risks than if the Fund had invested in the referenced obligation directly. Credit events are contract specific but
54
GOLDMAN SACHS MULTI-MANAGER ALTERNATIVES FUND
|
| 3. INVESTMENTS AND FAIR VALUE MEASUREMENTS (continued) |
may include bankruptcy, failure to pay, restructuring and obligation acceleration. If the Fund buys protection through a credit default swap and no credit event occurs, its payments are limited to the periodic payments previously made to the counterparty. Upon the occurrence of a specified credit event, the Fund, as a buyer of credit protection, is entitled to receive an amount equal to the notional amount of the swap and deliver to the seller the defaulted reference obligation in a physically settled trade. The Fund may also receive a net settlement amount in the form of cash or securities equal to the notional amount of the swap reduced by the recovery value of the reference obligation in a cash settled trade.
As a seller of protection, the Fund generally receives a payment stream throughout the term of the swap, provided that there is no credit event. In addition, if the Fund sells protection through a credit default swap, the Fund could suffer a loss because the value of the referenced obligation and the premium payments received may be less than the notional amount of the swap paid to the buyer of protection. Upon the occurrence of a specified credit event, the Fund, as a seller of credit protection, may be required to take possession of the defaulted reference obligation and pay the buyer an amount equal to the notional amount of the swap in a physically settled trade. The Fund may also pay a net settlement amount in the form of cash or securities equal to the notional amount of the swap reduced by the recovery value of the reference obligation in a cash settled trade. Recovery values are at times established through the credit event auction process in which market participants are ensured that a transparent price has been set for the defaulted security or obligation. In addition the Fund is entitled to a return of any assets, which have been pledged as collateral to the counterparty upon settlement.
The maximum potential amount of future payments (undiscounted) that the Fund as seller of protection could be required to make under a credit default swap would be an amount equal to the notional amount of the agreement. These potential amounts would be partially offset by any recovery values of the respective referenced obligations or net amounts received from a settlement of a credit default swap for the same reference security or obligation where the Fund bought credit protection.
A total return swap is an agreement that gives the Fund the right to receive or pay the appreciation or depreciation, as applicable, in the value of a specified security, an index, a basket of securities or indices or other instrument in return for a fee paid to the counterparty, which will typically be an agreed upon interest rate. If the underlying asset declines in value over the term of the swap, the Fund may also be required to pay the dollar value of that decline to the counterparty.
B. Level 3 Fair Value Investments — To the extent that significant inputs to valuation models and other alternative pricing sources are unobservable, or if quotations are not readily available, or if GSAM believes that such quotations do not accurately reflect fair value, the fair value of the Fund’s investments may be determined under Valuation Procedures approved by the Trustees. GSAM, consistent with its procedures and applicable regulatory guidance, may make an adjustment to the most recent valuation prices of either domestic or foreign securities in light of significant events to reflect what it believes to be the fair value of the securities at the time of determining the Fund’s NAV. To the extent investments are valued using single source broker quotations obtained directly from the broker or passed through from third party pricing vendors, such investments are classified as Level 3 investments. GSAM did not develop the unobservable inputs for valuation of Level 3 Assets and Liabilities.
55
GOLDMAN SACHS MULTI-MANAGER ALTERNATIVES FUND
Consolidated Notes to Financial Statements(continued)
October 31, 2019
|
| 3. INVESTMENTS AND FAIR VALUE MEASUREMENTS (continued) |
C. Fair Value Hierarchy — The following is a summary of the Fund’s investments and derivatives classified in the fair value hierarchy as of October 31, 2019:
| | | | | | | | | | | | |
| | | |
| MULTI-MANAGER ALTERNATIVES | | | | | | | | | | | | |
| | | |
| Investment Type | | Level 1 | | | Level 2 | | | Level 3 | |
| | | |
| Assets | | | | | | | | | | | | |
| | | |
Fixed Income | | | | | | | | | | | | |
| | | |
Corporate Obligations | | $ | — | | | $ | 2,545,768 | | | $ | — | |
| | | |
Mortgage-Backed Obligations | | | — | | | | 12,631,435 | | | | — | |
| | | |
Asset-Backed Securities | | | — | | | | 28,159,728 | | | | — | |
| | | |
Foreign Debt Obligations | | | — | | | | 7,563,090 | | | | — | |
| | | |
Structured Notes | | | — | | | | 1,999,547 | | | | — | |
| | | |
Municipal Debt Obligations | | | — | | | | 1,713,975 | | | | — | |
| | | |
Common Stock and/or Other Equity Investments(a) | | | | | | | | | | | | |
| | | |
Asia | | | 2,382,374 | | | | 2,694,260 | | | | — | |
| | | |
Australia and Oceania | | | 358,263 | | | | 1,263,539 | | | | — | |
| | | |
Europe | | | 3,879,801 | | | | 15,549,320 | | | | — | |
| | | |
North America | | | 55,471,334 | | | | — | | | | — | |
| | | |
South America | | | 159,963 | | | | — | | | | — | |
| | | |
Exchange Traded Fund | | | 5,199,919 | | | | — | | | | — | |
| | | |
Investment Company | | | 100,493,289 | | | | — | | | | — | |
| | | |
Preferred Stock | | | — | | | | 313,864 | | | | — | |
| | | |
Warrants | | | — | | | | — | | | | — | |
| | | |
| Total | | $ | 167,944,943 | | | $ | 74,434,526 | | | $ | — | |
| | | |
| Liabilities | | | | | | | | | | | | |
| | | |
Common Stock and/or Other Equity Investments(a) | | | | | | | | | | | | |
| | | |
North America | | $ | (5,977,219 | ) | | $ | — | | | $ | (34,144 | ) |
| | | |
Europe | | | — | | | | (768,972 | ) | | | — | |
| | | |
| Total | | $ | (5,977,219 | ) | | $ | (768,972 | ) | | $ | (34,144 | ) |
| (a) | | Amounts are disclosed by continent to highlight the impact of time zone differences between local market close and the calculation of net asset value. Security valuations are based on the principal exchange or system on which they are traded, which may differ from country of domicile. The Fund utilizes fair value model prices provided by an independent fair value service for international equities, resulting in a Level 2 classification. |
56
GOLDMAN SACHS MULTI-MANAGER ALTERNATIVES FUND
|
| 3. INVESTMENTS AND FAIR VALUE MEASUREMENTS (continued) |
| | | | | | | | | | | | |
| | | |
| MULTI-MANAGER ALTERNATIVES (continued) | | | | | | | | | | | | |
| | | |
| Derivative Type | | Level 1 | | | Level 2 | | | Level 3 | |
| | | |
| Assets | | | | | | | | | | | | |
| | | |
Forward Foreign Currency Exchange Contracts(b) | | $ | — | | | $ | 238,001 | | | $ | — | |
| | | |
Futures Contracts(b) | | | 2,260,154 | | | | — | | | | — | |
| | | |
Interest Rate Swap Contracts(b) | | | — | | | | 21,312 | | | | — | |
| | | |
Credit Default Swap Contracts(b) | | | — | | | | 47,307 | | | | — | |
| | | |
Total Return Swap Contracts(b) | | | — | | | | 1,710,311 | | | | — | |
| | | |
Options Purchased | | | 214,402 | | | | — | | | | — | |
| | | |
| Total | | $ | 2,474,556 | | | $ | 2,016,931 | | | $ | — | |
| | | |
| Liabilities | | | | | | | | | | | | |
| | | |
Forward Foreign Currency Exchange Contracts(b) | | $ | — | | | $ | (380,431 | ) | | $ | — | |
| | | |
Futures Contracts(b) | | | (1,876,646 | ) | | | — | | | | — | |
| | | |
Interest Rate Swap Contracts(b) | | | — | | | | (24,321 | ) | | | — | |
| | | |
Credit Default Swap Contracts(b) | | | — | | | | (50,525 | ) | | | — | |
| | | |
Total Return Swap Contracts(b) | | | — | | | | (1,789,639 | ) | | | — | |
| | | |
Written option contracts | | | (9,658 | ) | | | — | | | | — | |
| | | |
| Total | | $ | (1,886,304 | ) | | $ | (2,244,916 | ) | | $ | — | |
| (b) | | Amount shown represents unrealized gain (loss) at period end. |
For further information regarding security characteristics, see the Consolidated Schedule of Investments.
| | |
| 4. INVESTMENTS IN DERIVATIVES | | |
The following table sets forth, by certain risk types, the gross value of derivative contracts (not considered to be hedging instruments for accounting disclosure purposes) as of October 31. 2019. These instruments were used as part of the Fund’s investment strategies and to obtain and/or manage exposure related to the risks below. The values in the tables below exclude the effects of cash collateral received or posted pursuant to these derivative contracts, and therefore are not representative of the Fund’s net exposure.
| | | | | | | | | | | | |
| Risk | | Consolidated
Statement of Assets
and Liabilities | | Assets | | | Consolidated
Statement of Assets
and Liabilities | | Liabilities | |
Interest rate | | Variation margin on swap contracts; and Variation margin on futures contracts | | $ | 187,902 | (a) | | Variation margin on swap contracts; and Variation margin on futures contracts | | $ | (26,242) | (a) |
Credit | | Variation margin on swap contracts | | | 47,307 | (a) | | Variation margin on swap contracts | | | (50,525) | (a) |
Equity | | Unrealized gain on swap contracts; Variation margin on futures contracts; and Purchased options, at value | | | 3,446,824 | (a) | | Unrealized loss on swap contracts; Variation margin on futures contracts; and Written option contracts | | | (3,058,045) | (a) |
Currency | | Receivable for unrealized gain on forward foreign currency exchange contracts; and Variation margin on futures contracts | | | 239,097 | (a) | | Payable for unrealized loss on forward foreign currency exchange contracts; and Variation margin on futures contracts | | | (380,605) | (a) |
Commodity | | Variation margin on futures contracts | | | 570,357 | (a) | | Variation margin on futures contracts | | | (609,577) | (a) |
| Total | | | | $ | 4,491,487 | | | | | $ | (4,124,994) | |
| (a) | | Includes unrealized gain (loss) on futures contracts described in the Additional Investment Information sections of the Consolidated Schedule of Investments. Only current day’s variation margin is reported within the Consolidated Statement of Assets and Liabilities. |
57
GOLDMAN SACHS MULTI-MANAGER ALTERNATIVES FUND
Consolidated Notes to Financial Statements(continued)
October 31, 2019
|
| 4. INVESTMENTS IN DERIVATIVES (continued) |
The following table sets forth, by certain risk types, the Fund’s gains (losses) related to these derivatives and their indicative volumes for the fiscal year ended October 31, 2019. These gains (losses) should be considered in the context that these derivative contracts may have been executed to create investment opportunities and/or economically hedge certain investments, and accordingly, certain gains (losses) on such derivative contracts may offset certain (losses) gains attributable to investments. These gains (losses) are included in “Net realized gain (loss)” or “Net change in unrealized gain (loss)” on the Consolidated Statement of Operations:
| | | | | | | | | | | | | | |
| Risk | | Consolidated Statement of Operations | | Net Realized
Gain (Loss) | | | Net Change in
Unrealized
Gain (Loss) | | | Average
Number of
Contracts(a) | |
| Interest rate | | Net realized gain (loss) from swap contracts and futures contracts/Net change in unrealized gain (loss) on swap contracts and futures contracts | | $ | 1,309,741 | | | $ | (725,419 | ) | | | 1,048 | |
| Credit | | Net realized gain (loss) from swap contracts/Net change in unrealized gain (loss) on swap contracts | | | 77,023 | | | | (263,181 | ) | | | 8 | |
| Currency | | Net realized gain (loss) from forward foreign currency exchange Contracts and futures contracts/Net change in unrealized gain (loss) on forward foreign currency exchange contracts and futures contracts | | | (293,332 | ) | | | 211,171 | | | | 737 | |
| Equity | | Net realized gain (loss) from purchased options, futures contracts, swap contracts and written options/Net change in unrealized gain (loss) on purchase options, futures contracts, swaps contracts and written options | | | (2,837,753 | ) | | | 548,138 | | | | 2,450 | |
| Commodity | | Net realized gain (loss) from futures contracts/Net change in unrealized gain (loss) on futures contracts | | | (756,267 | ) | | | 47,013 | | | | 682 | |
| Total | | | | $ | (2,500,588 | ) | | $ | (182,278 | ) | | | 4,925 | |
| (a) | | Average number of contracts is based on the average of month end balances for the fiscal year ended October 31, 2019. |
In order to better define its contractual rights and to secure rights that will help the Fund mitigate its counterparty risk, the Fund may enter into an International Swaps and Derivatives Association, Inc. Master Agreement (“ISDA Master Agreement”) or similar agreement with its derivatives counterparties. An ISDA Master Agreement is a bilateral agreement between the Fund and a counterparty that governs OTC derivatives (including forward foreign currency exchange contracts, and certain options and swaps), and typically contains, among other things, collateral posting terms and netting provisions in the event of a default and/or termination event. The provisions of the ISDA Master Agreement typically permit a single net payment in the event of a default(close-out netting) or similar event, including the bankruptcy or insolvency of the counterparty.
Collateral and margin requirements differ between exchange traded derivatives and OTC derivatives. Margin requirements are established by the broker or clearing house for exchange-traded and centrally cleared derivatives (financial futures contracts, options and centrally cleared swaps) pursuant to governing agreements for those instrument types. Brokers can ask for margin in excess of the minimum in certain circumstances. Collateral terms are contract-specific for OTC derivatives. For derivatives traded under an ISDA Master Agreement, the collateral requirements are typically calculated by netting the marked to market amount for each transaction under such agreement and comparing that amount to the value of any collateral currently pledged by the Fund and the counterparty. Additionally, the Fund may be required to post initial margin to the counterparty, the terms of which would be outlined in the confirmation of the OTC transaction.
For financial reporting purposes, cash collateral that has been pledged to cover obligations of the Fund and cash collateral received from the counterparty, if any, is reported separately on the Consolidated Statement of Assets and Liabilities as receivables/payables for collateral on certain derivative contracts.Non-cash collateral pledged by the Fund, if any, is noted in the Consolidated Schedule of Investments. Generally, the amount of collateral due from or to a counterparty must exceed a minimum transfer amount threshold before a transfer is required to be made. To the extent amounts due to the Fund from its counterparties are not fully collateralized, contractually or otherwise, the Fund bears the risk of loss from counterparty nonperformance. The Fund attempts to mitigate counterparty risk by only entering into agreements with counterparties that the Underlying Managers believe to be of good standing and by monitoring the financial stability of those counterparties.
58
GOLDMAN SACHS MULTI-MANAGER ALTERNATIVES FUND
|
| 4. INVESTMENTS IN DERIVATIVES (continued) |
Additionally, the netting of assets and liabilities and the offsetting of collateral pledged or received are based on contractualnetting/set-off provisions in the ISDA Master Agreement or similar agreements. However, in the event of a default or insolvency of a counterparty, a court could determine that such rights are not enforceable due to the restrictions or prohibitions against the right of setoff that may be imposed in accordance with a particular jurisdiction’s bankruptcy or insolvency laws.
The following table sets forth the Fund’s net exposure for derivative instruments that are subject to enforceable master netting arrangements or similar agreements as of October 31, 2019:
| | | | | | | | | | | | | | | | | | | | | | | | | | | | | | | | | | | | |
| | | Derivative Assets(1) | | | Derivative Liabilities(1) | | | | | | | | | | |
| Counterparty | | Swaps | | | Forward
Currency
Contracts | | | Total | | | Swaps | | | Forward
Currency
Contracts | | | Total | | | Net Derivative
Asset
(Liabilities) | | | Collateral
(Received)
Pledged(1) | | | Net
Amount(2) | |
Deutsche Bank AG (London) | | $ | — | | | $ | 133,069 | | | $ | 133,069 | | | $ | — | | | $ | (234,383 | ) | | $ | (234,383 | ) | | $ | (101,314 | ) | | $ | 101,314 | | | $ | — | |
JPMorgan Securities, Inc. | | | 291,340 | | | | 90,089 | | | | 381,429 | | | | (117,345 | ) | | | (146,048 | ) | | | (263,393 | ) | | | 118,036 | | | | — | | | | 118,036 | |
MS & Co. Int. PLC | | | 212,650 | | | | 14,800 | | | | 227,450 | | | | (448,807 | ) | | | — | | | | (448,807 | ) | | | (221,357 | ) | | | 221,357 | | | | — | |
State Street Bank and Trust | | | — | | | | 43 | | | | 43 | | | | — | | | | — | | | | — | | | | 43 | | | | — | | | | 43 | |
UBS AG (London) | | | 1,206,321 | | | | — | | | | 1,206,321 | | | | (1,223,487 | ) | | | — | | | | (1,223,487 | ) | | | (17,166 | ) | | | 17,166 | | | | — | |
| | | | | | | | | |
Total | | $ | 1,710,311 | | | $ | 238,001 | | | $ | 1,948,312 | | | $ | (1,789,639 | ) | | $ | (380,431 | ) | | $ | (2,170,070 | ) | | $ | (221,758 | ) | | $ | 339,837 | | | $ | 118,079 | |
| (1) | | Gross amounts available for offset but not netted in the Consolidated Statement of Assets and Liabilities. |
| (2) | | Net amount represents the net amount due (to) from counterparty in the event of a default based on the contractualset-off rights under the agreement. Net amount excludes any over-collateralized amounts. |
|
| 5. AGREEMENTS AND AFFILIATED TRANSACTIONS |
A. Management Agreement — Under the Agreement, GSAM manages the Fund, subject to the general supervision of the Trustees.
As compensation for the services rendered pursuant to the Agreement, the assumption of the expenses related thereto and administration of the Fund’s business affairs, including providing facilities, GSAM is entitled to a management fee, accrued daily and paid monthly, equal to an annual percentage rate of the Fund’s average daily net assets. For the fiscal year ended October 31, 2019, contractual and effective net management fees with GSAM were at the following rates:
| | | | | | | | | | | | | | | | | | | | | | |
| Contractual Management Rate | | | Effective Net
Management
Fee Rate*^(a) | |
First
$2 billion | | | Next
$3 billion | | | Next
$3 billion | | | Over
$8 billion | | | Effective
Fee Rate | |
| | 1.90% | | | | 1.80% | | | | 1.71% | | | | 1.68% | | | | 1.90% | | | | 1.51% | |
| * | | GSAM has agreed to waive a portion of its management fee in order to achieve a net management fee rate of 1.57% as an annual percentage of the average daily net assets of the Fund as defined in the Fund’s most recent prospectus. This arrangement will be effective through at least February 28, 2020, and prior to such date GSAM may not terminate the arrangement without the approval of the Trustees. |
| ^ | | Effective Net Management Rate includes the impact of management fee waivers of affiliated Underlying Funds if any. |
| (a) | | Reflects combined management fees paid to GSAM under the Agreement and the Subsidiary Agreements as defined below after waivers. |
The Fund invests in Institutional Shares of the Goldman Sachs Financial Square Government Fund, which is an affiliated Underlying Fund. GSAM has agreed to waive a portion of its management fee payable by the Fund in an amount equal to the management fee it earns as an investment adviser to the affiliated Underlying Fund in which the Fund invests. For the fiscal year ended October 31, 2019, GSAM waived $1,482,699 of the Fund’s management fee.
59
GOLDMAN SACHS MULTI-MANAGER ALTERNATIVES FUND
Consolidated Notes to Financial Statements(continued)
October 31, 2019
|
| 5. AGREEMENTS AND AFFILIATED TRANSACTIONS (continued) |
GSAM also provides management services to the Subsidiary pursuant to Subsidiary Management Agreements (the “Subsidiary Agreements”) and is entitled to a management fee accrued daily and paid monthly, equal to an annual percentage rate of 0.42% of the Subsidiary’s average daily net assets. In consideration of the Subsidiary management fee, and for as long as the Subsidiary Agreements remain in effect, GSAM has contractually agreed to waive irrevocably a portion of the Fund’s management fee in an amount equal to the management fee accrued and paid to GSAM by the Subsidiary under the Subsidiary Agreement.
B. Distribution and/or Service(12b-1) Plans — The Trust, on behalf of Class A and Class R Shares of the Fund, has adopted Distribution and Service Plans subject to Rule12b-1 under the Act. Under the Distribution and Service Plans, Goldman Sachs, which serves as distributor (the “Distributor”), is entitled to a fee accrued daily and paid monthly, for distribution services and personal and account maintenance services, which may then be paid by Goldman Sachs to authorized dealers. These fees are equal to an annual percentage rate of the average daily net assets attributable to Class A or Class R Shares of the Fund, as applicable, as set forth below.
The Trust, on behalf of Class C Shares of the Fund, has adopted a Distribution Plan subject to Rule12b-1 under the Act. Under the Distribution Plan, Goldman Sachs as Distributor is entitled to a fee accrued daily and paid monthly for distribution services, which may then be paid by Goldman Sachs to authorized dealers. These fees are equal to an annual percentage rate of the average daily net assets attributable to Class C Shares of the Fund, as set forth below.
| | | | | | | | | | | | |
| | | Distribution and/or Service Plan Rates | |
| | | Class A* | | | Class C | | | Class R* | |
Distribution and/or Service Plan | | | 0.25 | % | | | 0.75 | % | | | 0.50 | % |
| * | | With respect to Class A and Class R Shares, the Distributor at its discretion may use compensation for distribution services paid under the Distribution and Service Plans to compensate service organizations for personal and account maintenance services and expenses as long as such total compensation does not exceed the maximum cap on “service fees” imposed by the Financial Industry Regulatory Authority. |
C. Distribution Agreement— Goldman Sachs, as Distributor of the shares of the Fund pursuant to a Distribution Agreement, may retain a portion of the Class A Shares’ front end sales charge and Class C Shares’ CDSC. During the fiscal year ended October 31, 2019, Goldman Sachs retained $5 and $0, respectively.
D. Service Plan — The Trust, on behalf of the Fund has adopted a Service Plan to allow Class C Shares to compensate service organizations (including Goldman Sachs) for providing varying levels of personal and account maintenance services to their customers who are beneficial owners of such shares. The Service Plan provides for compensation to the service organizations equal to an annual percentage rate of 0.25% of the average daily net assets attributable to Class C Shares of the Fund.
E. Transfer Agency Agreement — Goldman Sachs also serves as the transfer agent of the Fund for a fee pursuant to the Transfer Agency Agreement. The fees charged for such transfer agency services are accrued daily and paid monthly at annual rates as follows: 0.17% of the average daily net assets of Class A, Class C, Investor and Class R Shares; 0.04% of the average daily net assets of Institutional Shares; and 0.03% of the average daily net assets of Class P and Class R6 Shares. Prior to August 1, 2019, such fee was 0.18% of the average daily net assets of the Class A, Class C, Investor and Class R Shares.
Goldman Sachs has agreed to waive a portion of the transfer agency fees equal to 0.06% of the average daily net assets attributable to Class A, Class C, Investor and Class R Shares of the Fund through at least February 28, 2020 (the “TA Fee Waiver”). Prior to such date, Goldman Sachs may not terminate the arrangement without approval of the Board of Trustees.
F. Other Expense Agreements and Affiliated Transactions — GSAM has agreed to reduce or limit certain “Other Expenses” of the Fund (excluding acquired fund fees and expenses, dividend and interest payments on securities sold short, transfer agency fees and expenses, service fees and shareholder administration fees (as applicable), taxes, interest, brokerage fees, expenses of shareholder meetings, litigation and indemnification, and extraordinary expenses) to 0.194% of the average daily net assets of the Fund and limit the Fund’s total annual operating expenses (excluding acquired fund fees and expenses, dividend and interest payments on securities sold short, transfer agency fees and expenses, service fees and shareholder administration fees (as applicable), taxes, interest, brokerage fees, expenses of shareholder meetings, litigation and indemnification, and extraordinary expenses) of Class A, Class C, Institutional, Investor, Class P, Class R and Class R6 Shares to (after the application of the TA Fee
60
GOLDMAN SACHS MULTI-MANAGER ALTERNATIVES FUND
|
| 5. AGREEMENTS AND AFFILIATED TRANSACTIONS (continued) |
Waiver described above) 2.13%, 2.88%, 1.80%, 1.88%, 1.79%, 2.38%, and 1.79%, respectively. These Other Expense limitations will remain in place through at least February 28, 2020, and prior to such date GSAM may not terminate the arrangements without the approval of the Trustees.
In addition, the Fund has entered into certain offset arrangements with the transfer agent, which may result in a reduction of the Fund’s expenses and are received irrespective of the application of the “Other Expense” limitations described above. For the fiscal year ended October 31, 2019, these expense reductions, including any fee waivers and Other Expense reimbursements, were as follows:
| | | | | | | | | | | | | | |
Management
Fee Waiver | | | Transfer Agency
Waivers/Credits | | | Other
Expense
Reimbursements | | | Total
Annual Operating
Expense Reductions | |
| $ | 1,482,699 | | | $ | 24,043 | | | $ | 3,258,354 | | | $ | 4,765,096 | |
G. Line of Credit Facility — As of October 31, 2019, the Fund participated in a $580,000,000 committed, unsecured revolving line of credit facility (the “facility”) together with other funds of the Trust and certain registered investment companies having management agreements with GSAM or its affiliates. This facility is to be used for temporary emergency purposes, or to allow for an orderly liquidation of securities to meet redemption requests. The interest rate on borrowings is based on the federal funds rate. The facility also requires a fee to be paid by the Fund based on the amount of the commitment that has not been utilized. For the fiscal year ended October 31, 2019, the Fund did not have any borrowings under the facility. Prior to April 30, 2019, the facility was $770,000,000.
H. Other Transactions with Affiliates — For the fiscal year ended October 31, 2019, Goldman Sachs earned $23,010, in brokerage commissions from portfolio transactions on behalf of the Fund.
As of October 31, 2019, The Goldman Sachs Group, Inc. was the beneficial owner of approximately 100% of Class R and Class R6 Shares of the Fund.
The table below shows the transaction in and earnings from investments in the Goldman Sachs Financial Square Government Fund for the fiscal year ended October 31, 2019:
| | | | | | | | | | | | | | | | | | | | | | | | | | | | |
| Underlying Fund | | Beginning
Value as of
October 31, 2018 | | | Purchases
at Cost | | | Proceeds
from Sales | | | Change in
Unrealized
Gain (Loss) | | | Ending
Value as of
October 31, 2019 | | | Shares as of
October 31, 2019 | | | Dividend
Income | |
Goldman Sachs Financial Square Government Fund — Institutional Shares | | $ | 187,779,673 | | | $ | 861,249,755 | | | $ | (948,536,139 | ) | | $ | — | | | $ | 100,493,289 | | | | 100,493,289 | | | $ | 3,250,623 | |
|
| 6. PORTFOLIO SECURITIES TRANSACTIONS |
The cost of purchases and proceeds from sales and maturities of long-term securities for the fiscal year ended October 31, 2019, were $369,582,442 and $449,555,315, respectively. In these amounts are the cost of purchases and proceeds from sales and maturities of U.S. Government and agency obligations in the amounts of $0 and $1,225,613, respectively.
The following table sets forth the Fund’s net exposure for short securities that are subject to enforceable master netting arrangements or similar agreements as of October 31, 2019:
| | | | | | | | | | | | |
| Counterparty | | Securities
Sold Short(1) | | | Collateral
Pledged | | | Net
Amount(2) | |
| | | |
| State Street Bank & Trust | | $ | (6,780,335 | ) | | $ | 6,780,335 | | | $ | — | |
| (1) | | Gross amounts available for offset but not netted in the Consolidated Statement of Assets and Liabilities. |
| (2) | | Net amount represents the net amount due (to) from counterparty in the event of a default based on the contractualset-off rights under the agreement. Net amount excludes any over-collateralized amounts. |
61
GOLDMAN SACHS MULTI-MANAGER ALTERNATIVES FUND
Consolidated Notes to Financial Statements(continued)
October 31, 2019
There were no distributions by the Fund during the fiscal years ended October 31, 2019 and October 31, 2018.
As of October 31, 2019, the components of accumulated earnings (losses) on a tax basis were as follows:
| | | | |
Undistributed ordinary income — net | | $ | 2,552,028 | |
Capital loss carryforwards:(1) | | | | |
Perpetual Short-Term | | | (57,221,512 | ) |
Perpetual Long-Term | | | (3,605,611 | ) |
Total capital loss carryforwards | | $ | (60,827,123 | ) |
Timing differences (Straddle Loss Deferral) | | $ | (1,390,785 | ) |
Unrealized gains (losses) — net | | | 7,363,853 | |
Total accumulated earnings (losses) net | | $ | (52,302,027 | ) |
| (1) | | The Fund utilized $8,604,233 of capital losses in the current fiscal year. |
As of October 31, 2019, the Fund’s aggregate security unrealized gains and losses based on cost for U.S. federal income tax purposes were as follows:
| | | | |
Tax Cost | | $ | 234,901,038 | |
Gross unrealized gain | | | 9,514,065 | |
Gross unrealized loss | | | (2,150,212 | ) |
Net unrealized gain | | $ | 7,363,853 | |
The difference between GAAP-basis and tax basis unrealized gains (losses) is attributable primarily to wash sales, net mark to market gains/(losses) on regulated futures, net mark to market gains/(losses) on foreign currency contracts and differences in the tax treatment of underlying fund investments, passive foreign investment company investments, swap transactions, foreign currency transactions.
The Fund reclassed $438,167 from paid in capital to distributable earnings for the fiscal year ended October 31, 2019. In order to present certain components of the Fund’s capital accounts on a tax-basis, certain reclassifications have been recorded to the Fund’s accounts. These reclassifications have no impact on the net asset value of the Fund and result primarily from differences in the tax treatment of underlying fund investments.
GSAM has reviewed the Fund’s tax positions for all open tax years (the current and prior three years, as applicable) and has concluded that no provision for income tax is required in the Fund’s financial statements. Such open tax years remain subject to examination and adjustment by tax authorities.
The Fund’s risks include, but are not limited to, the following:
Derivatives Risk — The Fund’s use of derivatives may result in loss. Derivative instruments, which may pose risks in addition to and greater than those associated with investing directly in securities, currencies or other instruments, may be illiquid or less liquid, volatile, difficult to price and leveraged so that small changes in the value of the underlying instruments may produce disproportionate losses to the Fund. Derivatives are also subject to counterparty risk, which is the risk that the other party in the transaction will not fulfill its contractual obligation. The use of derivatives is a highly specialized activity that involves investment techniques and risks different from those associated with investments in more traditional securities and instruments. Losses from derivatives can also result from a lack of correlation between changes in the value of derivative instruments and the portfolio assets (if any) being hedged.
62
GOLDMAN SACHS MULTI-MANAGER ALTERNATIVES FUND
|
| 8. OTHER RISKS (continued) |
Foreign Custody Risk — If the Fund invests in foreign securities, the Fund may hold such securities and cash with foreign banks, agents, and securities depositories appointed by the Fund’s custodian (each a “Foreign Custodian”). Some foreign custodians may be recently organized or new to the foreign custody business. In some countries, Foreign Custodians may be subject to little or no regulatory oversight over, or independent evaluation of, their operations. Further, the laws of certain countries may place limitations on the Fund’s ability to recover its assets if a Foreign Custodian enters bankruptcy. Investments in emerging markets may be subject to even greater custody risks than investments in more developed markets. Custody services in emerging market countries are very often undeveloped and may be considerably less well regulated than in more developed countries, and thus may not afford the same level of investor protection as would apply in developed countries.
Foreign and Emerging Countries Risk — Investing in foreign markets may involve special risks and considerations not typically associated with investing in the United States. Foreign securities may be subject to risk of loss because of more or less foreign government regulation, less public information and less economic, political and social stability in the countries in which the Fund invests. The imposition of exchange controls (including repatriation restrictions), confiscation of assets and property, trade restrictions (including tariffs) and other government restrictions by the United States or other governments, or from problems in share registration, settlement or custody, may also result in losses. Foreign risk also involves the risk of negative foreign currency rate fluctuations, which may cause the value of securities denominated in such foreign currency (or other instruments through which the Fund has exposure to foreign currencies) to decline in value. Currency exchange rates may fluctuate significantly over short periods of time. To the extent that the Fund also invests in securities of issuers located in emerging markets, these risks may be more pronounced.
Interest Rate Risk — When interest rates increase, fixed income securities or instruments held by the Fund will generally decline in value. Long-term fixed income securities or instruments will normally have more price volatility because of this risk than short-term fixed income securities or instruments. The risks associated with changing interest rates may have unpredictable effects on the markets the Fund’s investments. Fluctuations in interest rates may also affect the liquidity of fixed income securities and instruments held by the Fund.
Investments in Other Investment Companies Risk — As a shareholder of another investment company, including an exchange-traded fund (“ETF”), the Fund will indirectly bear its proportionate share of any net management fees and other expenses paid by such other investment companies, in addition to the fees and expenses regularly borne by the Fund. ETFs are subject to risks that do not apply to conventional mutual funds, including but not limited to the following: (i) the market price of the ETF’s shares may trade at a premium or a discount to their NAV; and (ii) an active trading market for an ETF’s shares may not develop or be maintained.
Large Shareholder Transactions Risk — The Fund may experience adverse effects when certain large shareholders, such as other funds, institutional investors (including those trading by use ofnon-discretionary mathematical formulas), financial intermediaries (who may make investment decisions on behalf of underlying clients and/or the Fund in their investment model), individuals, accounts and Goldman Sachs affiliates, purchase or redeem large amounts of shares of the Fund. Such large shareholder redemptions, which may occur rapidly or unexpectedly, may cause the Fund to sell portfolio securities at times when it would not otherwise do so, which may negatively impact the Fund’s NAV and liquidity. These transactions may also accelerate the realization of taxable income to shareholders if such sales of investments resulted in gains, and may also increase transaction costs. In addition, a large redemption could result in the Fund’s current expenses being allocated over a smaller asset base, leading to an increase in the Fund’s expense ratio. Similarly, large Fund share purchases may adversely affect the Fund’s performance to the extent that the Fund is delayed in investing new cash or otherwise maintains a larger cash position than it ordinarily would.
Liquidity Risk — The Fund may make investments that are illiquid or that may become less liquid in response to market developments or adverse investor perceptions. Illiquid investments may be more difficult to value. Liquidity risk may also refer to the risk that the Fund will not be able to pay redemption proceeds within the allowable time period or without significant dilution to remaining investors’ interests because of unusual market conditions, an unusually high volume of redemption requests, or other reasons. To meet redemption requests, the Fund may be forced to sell investments at an unfavorable time and/or under unfavorable
63
GOLDMAN SACHS MULTI-MANAGER ALTERNATIVES FUND
Consolidated Notes to Financial Statements(continued)
October 31, 2019
|
| 8. OTHER RISKS (continued) |
conditions. If the Fund is forced to sell securities at an unfavorable time and/or under unfavorable conditions, such sales may adversely affect the Fund’s NAV and dilute remaining investors’ interests. Liquidity risk may be the result of, among other things, the reduced number and capacity of traditional market participants to make a market in fixed income securities or the lack of an active market. The potential for liquidity risk may be magnified by a rising interest rate environment or other circumstances where investor redemptions from fixed income mutual funds may be higher than normal, potentially causing increased supply in the market due to selling activity. These risks may be more pronounced in connection with the Fund’s investments in securities of issuers located in emerging market countries. Redemptions by large shareholders may have a negative impact on the Fund’s liquidity.
Market and Credit Risks — In the normal course of business, the Fund trades financial instruments and enters into financial transactions where risk of potential loss exists due to changes in the market (market risk). Additionally, the Fund may also be exposed to credit risk in the event that an issuer or guarantor fails to perform or that an institution or entity with which the Fund has unsettled or open transactions defaults.
Multi-Manager Approach Risk — The Fund’s performance depends on the ability of the Investment Adviser in selecting, overseeing, and allocating Fund assets to the Underlying Managers. The Underlying Managers’ investment styles may not always be complementary. The Fund’s multi-manager approach may result in the Fund investing a significant percentage of its assets in certain types of investments, which could be beneficial or detrimental to the Fund’s performance depending on the performance of those investments and the overall market environment. The Fund’s Underlying Managers may underperform the market generally or underperform other investment managers that could have been selected for the Fund. Because the Fund’s Underlying Managers may trade with counterparties, prime brokers, clearing brokers or futures commission merchants on terms that are different than those on which the Investment Adviser would trade, and because each Underlying Manager applies its own risk analysis in evaluating potential counterparties for the Fund, the Fund may be subject to greater counterparty risk than if it were managed directly by the Investment Adviser.
Short Position Risk — The Fund may enter into a short position through a futures contract, an option or swap agreement or through short sales of any instrument that the Fund may purchase for investment. Taking short positions involves leverage of the Fund’s assets and presents various risks, including counterparty risk. If the value of the underlying instrument or market in which the Fund has taken a short position increases, then the Fund will incur a loss equal to the increase in value from the time that the short position was entered into plus any related interest payments or other fees. Taking short positions involves the risk that losses may be disproportionate, may exceed the amount invested, and may be unlimited. To the extent that the Fund uses the proceeds it receives from a short position to take additional long positions, the risks associated with the short position, including leverage risks, may be heightened, because doing so increases the exposure of the Fund to the markets and therefore could magnify changes to the Fund’s NAV.
Tax Risk — The Fund will seek to gain exposure to the commodity markets primarily through investments in the Subsidiary and/or commodity index-linked structured notes, as applicable. Historically, the Internal Revenue Service (“IRS”) issued private letter rulings (“PLRs”) in which the IRS specifically concluded that income and gains from investments in commodity index-linked structured notes (the “Notes Rulings”) or a wholly-owned foreign subsidiary that invests in commodity-linked instruments are “qualifying income” for purposes of compliance with Subchapter M of the Code. However, the Fund has not received a PLR, and is not able to rely on PLRs issued to other taxpayers. The IRS recently issued final regulations that, would generally treat the Fund’s income inclusion with respect to a subsidiary as qualifying income either if (A) there is a distribution out of the earnings and profits of a subsidiary that are attributable to such income inclusion or (B) such inclusion is derived with respect to the Fund’s business of investing in stock, securities, or currencies.
The IRS also issued a revenue procedure, which states that the IRS will not in the future issue PLRs that would require a determination of whether an asset (such as a commodity index-linked note) is a “security” under the Investment Company Act of 1940. In connection with issuing such revenue procedure, the IRS has revoked the Notes Ruling on a prospective basis. In light of the revocation of the Notes Rulings, the Fund has limited its investments in commodity index-linked structured notes. The Fund has obtained an opinion of counsel that the Fund’s income from investments in the Subsidiary should constitute “qualifying
64
GOLDMAN SACHS MULTI-MANAGER ALTERNATIVES FUND
|
| 8. OTHER RISKS (continued) |
income.” However, no assurances can be provided that the IRS would not be able to successfully assert that the Fund’s income from such investments was not “qualifying income,” in which case the Fund would fail to qualify as a regulated investment company (“RIC”) under Subchapter M of the Code if over 10% of its gross income were derived from these investments. If the Fund failed to qualify as a RIC, it would be subject to federal and state income tax on all of its taxable income at regular corporate tax rates. This would significantly adversely affect the returns to, and could cause substantial losses for, Fund shareholders.
Under the Trust’s organizational documents, its Trustees, officers, employees and agents are indemnified, to the extent permitted by the Act and state law, against certain liabilities that may arise out of performance of their duties to the Fund. Additionally, in the course of business, the Fund enters into contracts that contain a variety of indemnification clauses. The Fund’s maximum exposure under these arrangements is unknown, as this would involve future claims that may be made against the Fund that have not yet occurred. However, GSAM believes the risk of loss under these arrangements to be remote.
In March 2017, the Financial Accounting Standards Board issued Accounting Standards Update (ASU)2017-08 – Receivables – Nonrefundable Fees and Other Costs (Subtopic310-20): Premium Amortization on Purchased Callable Debt Securities. The amendments in the ASU shorten the amortization period for certain callable debt securities held at a premium, by requiring amortization to the earliest call date. The ASU is effective for fiscal years, and interim periods within those fiscal years, beginning after December 15, 2018. GSAM is currently evaluating the impact, if any, of the amendments.
Subsequent events after the Consolidated Statement of Assets and Liabilities date other than above have been evaluated, and GSAM has concluded that there is no impact requiring adjustment or disclosure in the financial statements.
65
GOLDMAN SACHS MULTI-MANAGER ALTERNATIVES FUND
Consolidated Notes to Financial Statements(continued)
October 31, 2019
|
| 12. SUMMARY OF SHARE TRANSACTIONS |
Share activity is as follows:
| | | | | | | | | | | | | | | | |
| | | Multi Manager Alternatives Fund | |
| | | | |
| | | For the Fiscal Year Ended
October 31, 2019 | | | For the Fiscal Year Ended
October 31, 2018 | |
| | | | |
| | | Shares | | | Dollars | | | Shares | | | Dollars | |
| | | | |
| Class A Shares | |
Shares sold | | | 322,978 | | | $ | 3,321,374 | | | | 454,553 | | | $ | 4,610,532 | |
Shares redeemed | | | (1,156,192 | ) | | | (11,773,524 | ) | | | (2,149,466 | ) | | | (21,824,927 | ) |
| | | | (833,214 | ) | | | (8,452,150 | ) | | | (1,694,913 | ) | | | (17,214,395 | ) |
| Class C Shares | |
Shares sold | | | 81,656 | | | | 788,264 | | | | 30,626 | | | | 304,279 | |
Shares redeemed | | | (606,788 | ) | | | (5,938,672 | ) | | | (1,724,298 | ) | | | (17,082,932 | ) |
| | | | (525,132 | ) | | | (5,150,408 | ) | | | (1,693,672 | ) | | | (16,778,653 | ) |
| Institutional Shares | |
Shares sold | | | 5,084,316 | | | | 51,745,429 | | | | 11,823,203 | | | | 121,296,620 | |
Shares redeemed | | | (26,305,071 | ) | | | (270,636,930 | ) | | | (54,218,713 | ) | | | (554,562,273 | ) |
| | | | (21,220,755 | ) | | | (218,891,501 | ) | | | (42,395,510 | ) | | | (433,265,653 | ) |
| Investor Shares | |
Shares sold | | | 331,338 | | | | 3,400,610 | | | | 651,113 | | | | 6,644,464 | |
Shares redeemed | | | (2,200,818 | ) | | | (22,172,449 | ) | | | (6,937,409 | ) | | | (70,702,314 | ) |
| | | | (1,869,480 | ) | | | (18,771,839 | ) | | | (6,286,296 | ) | | | (64,057,850 | ) |
| Class P Shares(a) | |
Shares sold | | | 307,174 | | | | 3,192,060 | | | | 12,829,464 | | | | 130,500,559 | |
Shares redeemed | | | (4,244,846 | ) | | | (43,314,898 | ) | | | (1,958,858 | ) | | | (19,883,699 | ) |
| | | | (3,937,672 | ) | | | (40,122,838 | ) | | | 10,870,606 | | | | 110,616,860 | |
| Class R Shares | |
Shares redeemed | | | — | | | | — | | | | (9,220 | ) | | | (93,047 | ) |
| | | | — | | | | — | | | | (9,220 | ) | | | (93,047 | ) |
| Class R6 Shares(b) | |
Shares sold | | | — | | | | — | | | | 978 | | | | 10,000 | |
| | | | — | | | | — | | | | 978 | | | | 10,000 | |
| | | | |
NET DECREASE | | | (28,386,253 | ) | | $ | (291,388,736 | ) | | | (41,208,027 | ) | | $ | (420,782,738 | ) |
| (a) | | Class P Shares commenced operations on April 16, 2018. |
| (b) | | Class R6 Shares commenced operations on February 28, 2018. |
66
Report of Independent Registered Public
Accounting Firm
Tothe Board of Trustees of Goldman Sachs Trust II and Shareholders of
Goldman Sachs Multi-Manager Alternatives Fund
Opinion on the Consolidated Financial Statements
We have audited the accompanying consolidated statement of assets and liabilities, including the consolidated schedule of investments, of Goldman Sachs Multi-Manager Alternatives Fund and its subsidiary (one of the funds constituting Goldman Sachs Trust II, referred to hereafter as the “Fund”) as of October 31, 2019, the related consolidated statement of operations for the year ended October 31, 2019, the consolidated statements of changes in net assets for each of the two years in the period ended October 31, 2019, including the related notes,and the consolidated financial highlights for each of the periods indicated therein (collectively referred to as the “consolidated financial statements”). In our opinion, the consolidated financial statements present fairly, in all material respects, the financial position of the Fund as of October 31, 2019, the results of its operations for the year then ended, the changes in its net assets for each of the two years in the period ended October 31, 2019 and the consolidated financial highlights for each of the periods indicated therein in conformity with accounting principles generally accepted in the United States of America.
Basis for Opinion
These consolidated financial statements are the responsibility of the Fund’s management. Our responsibility is to express an opinion on the Fund’s consolidated financial statements based on our audits. We are a public accounting firm registered with the Public Company Accounting Oversight Board (United States) (PCAOB) and are required to be independent with respect to the Fund in accordance with the U.S. federal securities laws and the applicable rules and regulations of the Securities and Exchange Commission and the PCAOB.
We conducted our audits of these consolidated financial statements in accordance with the standards of the PCAOB. Those standards require that we plan and perform the audit to obtain reasonable assurance about whether the consolidated financial statements are free of material misstatement, whether due to error or fraud.
Our audits included performing procedures to assess the risks of material misstatement of the consolidated financial statements, whether due to error or fraud, and performing procedures that respond to those risks. Such procedures included examining, on a test basis, evidence regarding the amounts and disclosures in the consolidated financial statements. Our audits also included evaluating the accounting principles used and significant estimates made by management, as well as evaluating the overall presentation of the consolidated financial statements. Our procedures included confirmation of securities owned as of October 31, 2019 by correspondence with the custodian, transfer agent and brokers; when replies were not received from brokers, we performed other auditing procedures. We believe that our audits provide a reasonable basis for our opinion.
PricewaterhouseCoopers LLP
Boston, Massachusetts
December 23, 2019
We have served as the auditor of one or more investment companies in the Goldman Sachs fund complex since 2000.
67
GOLDMAN SACHS MULTI-MANAGER ALTERNATIVES FUND
| | |
| | |
Fund Expenses — Six Month Period Ended October 31, 2019 (Unaudited) | | |
As a shareholder of Class A, Class C, Institutional, Investor, Class P, Class R or Class R6 Shares of the Fund, you incur two types of costs: (1) transaction costs, including sales charges on purchase payments (with respect to Class A Shares), contingent deferred sales charges on redemptions (with respect to Class C Shares), and (2) ongoing costs, including management fees; distribution and service(12b-1) fees (with respect to Class A and Class R Shares); and other Fund expenses. This example is intended to help you understand your ongoing costs (in dollars) of investing in Class A, Class C, Institutional, Service, Investor, Class P, Class R or Class R6 Shares of the Fund and to compare these costs with the ongoing costs of investing in other mutual funds.
The example is based on an investment of $1,000 invested at the beginning of the period and held for the entire period from May 1, 2019 through October 31, 2019, which represents a period of 184 days of a 365 day year.
Actual Expenses — The first line under each share class in the table below provides information about actual account values and actual expenses. You may use the information in this line, together with the amount you invested, to estimate the expenses that you paid over the period. Simply divide your account value by $1,000 (for example, an $8,600 account value divided by $1,000=8.6), then multiply the result by the number in the first line under the heading entitled “Expenses Paid” to estimate the expenses you paid on your account during this period.
Hypothetical Example for Comparison Purposes — The second line under each share class in the table below provides information about hypothetical account values and hypothetical expenses based on the Fund’s actual net expense ratios and an assumed rate of return of 5% per year before expenses, which is not the Fund’s actual return. The hypothetical account values and expenses may not be used to estimate the actual ending account balance or expenses you paid for the period. You may use this information to compare the ongoing costs of investing in the Fund and other funds. To do so, compare this 5% hypothetical example with the 5% hypothetical examples that appear in the shareholder reports of the other funds.
Please note that the expenses shown in the table are meant to highlight your ongoing costs only and do not reflect any transactional costs, such as sales charges, redemption fees, or exchange fees. Therefore, the second line of the table is useful in comparing ongoing costs only, and will not help you determine the relative total costs of owning different funds. In addition, if these transactional costs were included, your costs would have been higher.
| | | | | | | | | | | | |
| | | Multi Manager Alternatives Fund | |
| Share Class | | Beginning
Account Value
5/1/19 | | | Ending
Account Value
10/31/19 | | | Expenses Paid for the
6 months ended
10/31/19* | |
| Class A | | | | | | | | | | | | |
Actual | | $ | 1,000.00 | | | $ | 1,014.50 | | | $ | 10.82 | |
Hypothetical 5% return | | | 1,000.00 | | | | 1,014.47 | + | | | 10.82 | |
| Class C | | | | | | | | | | | | |
Actual | | | 1,000.00 | | | | 1,011.00 | | | | 14.60 | |
Hypothetical 5% return | | | 1,000.00 | | | | 1,010.69 | + | | | 14.60 | |
| Institutional | | | | | | | | | | | | |
Actual | | | 1,000.00 | | | | 1,016.30 | | | | 9.20 | |
Hypothetical 5% return | | | 1,000.00 | | | | 1,016.08 | + | | | 9.20 | |
| Investor | | | | | | | | | | | | |
Actual | | | 1,000.00 | | | | 1,016.40 | | | | 9.55 | |
Hypothetical 5% return | | | 1,000.00 | | | | 1,015.73 | + | | | 9.55 | |
| Class P | | | | | | | | | | | | |
Actual | | | 1,000.00 | | | | 1,016.30 | | | | 9.10 | |
Hypothetical 5% return | | | 1,000.00 | | | | 1,016.18 | + | | | 9.10 | |
| Class R | | | | | | | | | | | | |
Actual | | | 1,000.00 | | | | 1,013.70 | | | | 12.08 | |
Hypothetical 5% return | | | 1,000.00 | | | | 1,013.21 | + | | | 12.08 | |
| Class R6 | | | | | | | | | | | | |
Actual | | | 1,000.00 | | | | 1,017.20 | | | | 9.15 | |
Hypothetical 5% return | | | 1,000.00 | | | | 1,016.13 | + | | | 9.15 | |
| | + | | Hypothetical expenses are based on the Fund’s actual annualized net expense ratios and an assumed rate of return of 5% per year before expenses. | |
| | * | | Expenses are calculated using the Fund’s annualized net expense ratio for each class, which represents the ongoing expenses as a percentage of net assets for the six months ended October 31, 2019. Expenses are calculated by multiplying the annualized net expense ratio by the average account value for the period; then multiplying the result by the number of days in the most recent fiscal half year; and then dividing that result by the number of days in the fiscal year. The annualized net expense ratios for the period were as follows: | |
| | | | | | | | | | | | | | | | | | | | | | | | | | | | |
| Fund | | Class A | | | Class C | | | Institutional | | | Investor | | | Class P | | | Class R | | | Class R6 | |
Multi Manager Alternatives | | | 2.01 | % | | | 2.76 | % | | | 1.67 | % | | | 1.76 | % | | | 1.67 | % | | | 2.27 | % | | | 1.80 | % |
68
GOLDMAN SACHS MULTI-MANAGER ALTERNATIVES FUND
Statement Regarding Basis for Approval of Management Agreement andSub-Advisory Agreements (Unaudited)
Background
The Goldman Sachs Multi-Manager Alternatives Fund (the “Fund”) is an investment portfolio of Goldman Sachs Trust II (the “Trust”). The Board of Trustees oversees the management of the Trust and reviews the investment performance and expenses of the Fund at regularly scheduled meetings held throughout the year. The Fund employs a “manager of managers” structure, whereby Goldman Sachs Asset Management, L.P. (the “Investment Adviser”) is responsible for selectingsub-advisers (subject to Board approval), allocating the Fund’s assets among them, and overseeing theirday-to-day management of Fund assets. The Board determines annually whether to approve the continuance of the Trust’s investment management agreement (the “Management Agreement”) with the Investment Adviser on behalf of the Fund.
The Management Agreement was most recently approved for continuation until August 31, 2020 by the Board, including those Trustees who are not parties to the Management Agreement or “interested persons” (as defined in the Investment Company Act of 1940, as amended) of any party thereto (the “Independent Trustees”), at a meeting held on August6-7, 2019 (the “Annual Meeting”). At the Annual Meeting, the Board also considered thesub-advisory agreements (each a “DesignatedSub-Advisory Agreement” and, together with the Management Agreement, the “Agreements”) between the Investment Adviser and each of Algert Global LLC, Ares Capital Management II LLC, Brigade Capital Management, LP, Crabel Capital Management, LLC, Emso Asset Management Limited, First Pacific Advisors, LLC, GQG Partners LLC, Halcyon Arbitrage IC Management LP, River Canyon Fund Management LLC, Russell Investments Commodity Advisor, LLC, Sirios Capital Management, L.P., and Wellington Management Company LLP (each a “DesignatedSub-Adviser” and collectively, the “DesignatedSub-Advisers”).
The review process undertaken by the Trustees spans the course of the year and culminates with the Annual Meeting. To assist the Trustees in their deliberations, the Trustees have established a Contract Review Committee (the “Committee”), comprised of the Independent Trustees. The Committee held four meetings over the course of the year since the Management Agreement was last approved. At those Committee meetings, regularly scheduled Board or other committee meetings, and/or the Annual Meeting, matters relevant to the renewal of the Management Agreement and the DesignatedSub-Advisory Agreements were considered by the Board, or the Independent Trustees, as applicable. With respect to the Fund, such matters included:
| | (a) | | the nature and quality of the advisory, administrative, and other services provided to the Fund by the Investment Adviser and its affiliates, and the DesignatedSub-Advisers, including, as applicable, information about: |
| | (i) | | the structure, staff, and capabilities of the Investment Adviser and the DesignatedSub-Advisers and the DesignatedSub-Advisers’ portfolio management teams; |
| | (ii) | | the groups within the Investment Adviser and its affiliates that support the portfolio management teams or provide other types of necessary services, including fund services groups (e.g., accounting and financial reporting, tax, shareholder services, and operations); controls and risk management groups (e.g., legal, compliance, valuation oversight, credit risk management, internal audit, compliance testing, market risk analysis, finance, and central funding); sales and distribution support groups, and others (e.g., information technology and training); |
| | (iii) | | trends in employee headcount; |
| | (iv) | | the Investment Adviser’s financial resources and ability to hire and retain talented personnel and strengthen its operations; and |
| | (v) | | the parent company’s support of the Investment Adviser and its mutual fund business, as expressed by the firm’s senior management; |
| | (b) | | information on the investment performance of the Fund, including comparisons to the performance of similar mutual funds, as provided by a third-party mutual fund data provider engaged as part of the contract review process (the “Outside Data Provider”), benchmark performance indices, and commingled investment vehicles with comparable investment strategies managed by the Investment Adviser, as well as general investment outlooks in the markets in which the Fund invests; |
| | (c) | | information provided by the Investment Adviser indicating the Investment Adviser’s views on whether the Fund’s peer group and/or benchmark index had high, medium, or low relevance given the Fund’s particular investment strategy; |
| | (d) | | the terms of the Agreements and other agreements with affiliated service providers entered into by the Trust on behalf of the Fund; |
| | (e) | | fee and expense information for the Fund, including: |
| | (i) | | the relative management fee and expense levels of the Fund as compared to those of comparable funds managed by other advisers, as provided by the Outside Data Provider; |
| | (ii) | | the Fund’s expense trends over time; and |
| | (iii) | | comparative information on the advisory fees charged and services provided by the Investment Adviser to certain collective investment vehicles that it manages with comparable investment strategies; |
69
GOLDMAN SACHS MULTI-MANAGER ALTERNATIVES FUND
Statement Regarding Basis for Approval of Management Agreement andSub-Advisory Agreements (Unaudited) (continued)
| | (f) | | with respect to the extensive investment performance and expense comparison data provided by the Outside Data Provider, its processes in producing that data for the Fund; |
| | (g) | | the undertakings of the Investment Adviser and its affiliates to implement fee waivers and/or expense limitations; |
| | (h) | | information relating to the profitability of the Management Agreement and the transfer agency, distribution and service arrangements of the Fund to the Investment Adviser and its affiliates; |
| | (i) | | whether the Fund’s existing management fee schedule adequately addressed any economies of scale; |
| | (j) | | a summary of the“fall-out” benefits derived by the Investment Adviser and its affiliates from their relationships with the Fund, including the fees received by the Investment Adviser’s affiliates from the Fund for transfer agency, portfolio trading, distribution and other services; |
| | (k) | | a summary of potential benefits derived by the Fund as a result of its relationship with the Investment Adviser; |
| | (l) | | with respect to the Investment Adviser, portfolio manager ownership of Fund shares and the manner in which portfolio manager compensation is determined; information on the DesignatedSub-Advisers’ compensation arrangements; and the number and types of accounts managed by the portfolio managers; |
| | (m) | | the nature and quality of the services provided to the Fund by its unaffiliated service providers (as well as the DesignatedSub-Advisers), and the Investment Adviser’s general oversight and evaluation (including reports on due diligence) of those service providers as part of the services provided under the Management Agreement; and |
| | (n) | | the Investment Adviser’s and DesignatedSub-Advisers’ processes and policies addressing various types of potential conflicts of interest; their approaches to risk management; the annual review of the effectiveness of the Fund’s compliance program; and periodic compliance reports. |
The Trustees also received an overview of the Fund’s distribution arrangements. They received information regarding the Fund’s assets, share purchase and redemption activity, and payment of distribution and service fees. Information was also provided to the Trustees relating to revenue sharing payments made by and services provided by the Investment Adviser and its affiliates to intermediaries that promote the sale, distribution, and/or servicing of Fund shares.
The presentations made at the Board and Committee meetings and at the Annual Meeting encompassed the Fund and other mutual funds for which the Board of Trustees has responsibility. In evaluating the Agreements at the Annual Meeting, the Trustees relied upon their knowledge, resulting from their meetings and other interactions throughout the year, of the Fund and the respective services of the Investment Adviser and its affiliates, and the DesignatedSub-Advisers. In conjunction with these meetings, the Trustees received written materials and oral presentations on the topics covered, and the Investment Adviser addressed the questions and concerns of the Trustees, including concerns regarding the investment performance of certain of the funds they oversee. In addition, the Trustees periodically received written materials and oral presentations from the DesignatedSub-Advisers. The Independent Trustees were advised by their independent legal counsel regarding their responsibilities and other regulatory requirements related to the approval and continuation of mutual fund investment management agreements under applicable law. In addition, the Investment Adviser and its affiliates provided the Independent Trustees with a written response to a formal request for information sent on behalf of the Independent Trustees by their independent legal counsel. The Trustees reviewed a written response prepared by each DesignatedSub-Adviser to a similar request for information submitted to the DesignatedSub-Adviser by the Investment Adviser. During the course of their deliberations, the Independent Trustees met in executive sessions with their independent legal counsel, without representatives of the Investment Adviser or its affiliates present.
Nature, Extent, and Quality of the Services Provided Under the Management Agreement
As part of their review, the Trustees considered the nature, extent, and quality of the services provided to the Fund by the Investment Adviser. In this regard, the Trustees considered both the investment advisory services andnon-advisory services that are provided by the Investment Adviser and its affiliates. They also recalled presentations received during the past year, which described portfolio management changes for the Fund.The Trustees noted the ongoing recruitment efforts aimed at bringing high quality investment talent to the Investment Adviser. They also noted the Investment Adviser’s commitment to maintaining high quality systems and expending substantial resources to respond to ongoing changes to the regulatory and control environment in which the Fund and its service providers operate, as well as the efforts of the Investment Adviser and its affiliates to combat cyber security risks. The Trustees concluded that the Investment Adviser continued to commit substantial financial and operational resources to the Fund and expressed confidence that the Investment Adviser would continue to do so in the future. The Trustees also recognized that the Investment Adviser had made significant commitments to address regulatory compliance requirements applicable to the Fund and the Investment Adviser and its affiliates. In addition, the Trustees reviewed theSub-Adviser oversight process that the Investment Adviser had employed, which included areas such as investment analytics, risk management and compliance.
70
GOLDMAN SACHS MULTI-MANAGER ALTERNATIVES FUND
Statement Regarding Basis for Approval of Management Agreement andSub-Advisory Agreements (Unaudited) (continued)
Investment Performance
The Trustees also considered the investment performance of the Fund. In this regard, they compared the investment performance ofthe Fund to its peers usingrankings and ratings compiled by the Outside Data Provider, and updated performance information prepared by the Investment Adviser using the peer groups identified by the Outside Data Provider. The Trustees also reviewed the Fund’s investment performance relative to its performance benchmark. As part of this review, they considered the investment performance trends of the Fund over time, and reviewed the investment performance of the Fund in light of its investment objective and policies and market conditions. The Trustees considered the Investment Adviser’s representations that the Fund had significant differences from its Outside Data Provider peer group and benchmark index that caused them to be imperfect bases for comparison. The Trustees also compared the investment performance of the Fund to the performance of comparable unregistered funds for which the Investment Adviser also serves as investment adviser. They considered that the unregistered funds provide an imperfect performance comparison because they are not subject to the requirements of the Investment Company Act of 1940, as amended.
In addition, the Trustees considered materials prepared and presentations made by the Investment Adviser’s senior management and theSub-Advisers’ portfolio management personnel in which Fund performance was assessed. The Trustees also considered the Investment Adviser’s periodic reports with respect to the Fund’s risk profiles, and how the Investment Adviser’s approach to risk monitoring and management influences portfolio management.
The Trustees noted that the Fund’s Institutional Shares had placed in the second quartile of the Fund’s performance peer group for theone-year period and the third quartile for the three- and five-year periods, and had underperformed the Fund’s U.S. Treasury-based benchmark index for theone-year period ended March 31, 2019.
Costs of Services Provided and Competitive Information
The Trustees considered the contractual terms of the Management Agreement, the fee rates payable by the Fund thereunder, and the net amount retained by the Investment Adviser after payment ofsub-advisory fees. In this regard, the Trustees considered information on the services rendered by the Investment Adviser to the Fund, which included both advisory and administrative services that were directed to the needs and operations of the Fund as a registered mutual fund.
In particular, the Trustees reviewed the analyses prepared by the Outside Data Provider regarding the expense rankings of the Fund, as well as additional information provided by the Investment Adviser throughout the year. The analyses provided a comparison of the Fund’s management fee and breakpoints to those of a relevant peer group and category universe; an expense analysis which compared the Fund’s overall net and gross expenses to a peer group and a category universe; and data comparing the Fund’s net expenses to the peer and category medians. The analyses also compared the Fund’s other expenses and fee waivers/reimbursements to those of the peer group and category medians. The Trustees also considered comparative fee information for services provided by the Investment Adviser to collective investment vehicles having investment objectives and policies similar to those of the Fund. They also noted that, in some cases, these collective investment vehicles have a compensation structure that includes performance fees and also pay additional asset-based fees and performance fees to the managers of underlying hedge funds. The Trustees considered that services provided to the Fund differed in various significant respects from the services provided to these collective investment vehicles, which generally operated under less stringent regulatory and financial reporting requirements, required fewer services from the Investment Adviser to a smaller number of client contact points, and were less time-sensitive. The Trustees concluded that the comparisons provided by the Outside Data Provider and the Investment Adviser were useful in evaluating the reasonableness of the management fees and total expenses paid by the Fund.
The Trustees considered the Investment Adviser’s undertakings to implement fee waivers and/or expense limitations. The Trustees noted that the Investment Adviser had agreed to waive a portion of its management fee in an amount equal to the aggregate management fees paid to the Investment Adviser as the investment adviser to the Fund’s wholly-owned subsidiaries.
In addition, the Trustees noted that shareholders are able to redeem their Fund shares at any time if shareholders believe that the Fund fees and expenses are too high or if they are dissatisfied with the performance of the Fund.
The Investment Adviser’s Profitability
The Trustees reviewed the Fund’s contribution to the Investment Adviser’s revenues andpre-tax profit margins. In this regard the Trustees noted that they had received, among other things, profitability analyses and summaries, revenue and expense schedules by Fund and by function (i.e., investment management, transfer agency, and distribution and service), and information on the Investment Adviser’s expense allocation methodology. They observed that the profitability and expense figures are substantially similar to those used by the Investment Adviser for many internal purposes, including compensation decisions among various business groups, and are thus subject to a vigorous internal debate about how certain revenue and expenses should be
71
GOLDMAN SACHS MULTI-MANAGER ALTERNATIVES FUND
Statement Regarding Basis for Approval of Management Agreement andSub-Advisory Agreements (Unaudited) (continued)
allocated. The Trustees also noted that the internal audit group within the Goldman Sachs organization periodically audits the expense allocation methodology and that the internal audit group was satisfied with the reasonableness, consistency, and accuracy of the Investment Adviser’s expense allocation methodology. Profitability data for the Fund was provided for 2018 and 2017, and the Trustees considered this information in relation to the Investment Adviser’s overall profitability.
Economies of Scale
The Trustees considered the information that had been provided regarding whether there have been economies of scale with respect to the management of the Fund. The Trustees also considered the breakpoints in the fee rate payable under the Management Agreement for the Fund at the following annual percentage rates of the average daily net assets of the Fund:
| | | | |
| Average Daily Net Assets | | Management Fee Annual Rate | |
| |
First $2 billion | | | 1.90 | % |
| |
Next $3 billion | | | 1.80 | |
| |
Next $3 billion | | | 1.71 | |
| |
Over $8 billion | | | 1.68 | |
The Trustees noted that the breakpoints were designed to share potential economies of scale, if any, with the Fund and its shareholders as assets under management reach those asset levels. The Trustees considered the amounts of assets in the Fund; the Fund’s recent share purchase and redemption activity; the information provided by the Investment Adviser relating to the costs of the services provided by the Investment Adviser and its affiliates and their realized profits; information comparing fee rates charged by the Investment Adviser with fee rates charged to other funds in the peer group; and the Investment Adviser’s undertakings to waive a portion of its management fee and to limit certain expenses of the Fund that exceed specified levels. The Trustees also considered the relationship between the advisory andsub-advisory fee rate schedules. Upon reviewing these matters at the Annual Meeting, the Trustees concluded that the fee breakpoints represented a means of assuring that benefits of scalability, if any, would be passed along to shareholders at the specified asset levels.
Other Benefits to the Investment Adviser and Its Affiliates
The Trustees also considered the other benefits derived by the Investment Adviser and its affiliates from their relationships with the Fund, including: (a) transfer agency fees received by Goldman Sachs & Co. LLC (“Goldman Sachs”); (b) brokerage and futures commissions earned by Goldman Sachs for executing securities transactions (in its capacity as clearing broker) and futures transactions on behalf of the Fund; (c) the Investment Adviser’s ability to leverage the infrastructure designed to service the Fund on behalf of the Investment Adviser’s other clients; (d) the Investment Adviser’s ability to cross-market other products and services to Fund shareholders; (e) Goldman Sachs’ retention of certain fees as Fund distributor; (f) the Investment Adviser’s ability to negotiate better pricing with the Fund’s custodian on behalf of its other clients, as a result of the relationship with the Fund; and (g) the possibility that the working relationship between the Investment Adviser and the Fund’s third-party service providers (including theSub-Advisers) may cause those service providers to be more likely to do business with other areas of Goldman Sachs. In the course of considering the foregoing, the Independent Trustees requested and received further information quantifying certain of thesefall-out benefits.
Other Benefits to the Fund and Its Shareholders
The Trustees also noted that the Fund receives certain other potential benefits as a result of its relationship with the Investment Adviser, including: (a) enhanced servicing from vendors due to the volume of business generated by the Investment Adviser and its affiliates; (b) the advantages received from the Investment Adviser’s knowledge and experience gained from managing other accounts and products; (c) the Investment Adviser’s ability to hire and retain qualified personnel to provide services to the Fund because of the reputation of the Goldman Sachs organization; (d) the Fund’s access, through the Investment Adviser, to certain firm-wide resources (e.g., proprietary risk management systems and databases), subject to certain restrictions; and (e) access to certain affiliated distribution channels.
Conclusion
In connection with their consideration of the Management Agreement, the Trustees gave weight to various factors, but did not identify any particular factor as controlling their decision. After deliberation and consideration of the information provided, including the factors described above, the Trustees, including the Independent Trustees, unanimously concluded, in the exercise of
72
GOLDMAN SACHS MULTI-MANAGER ALTERNATIVES FUND
Statement Regarding Basis for Approval of Management Agreement andSub-Advisory Agreements (Unaudited) (continued)
their business judgment, that the investment management fees paid by the Fund were reasonable in light of the factors considered, and that the Management Agreement, and the terms thereof, should be approved and continued with respect to the Fund until August 31, 2020.
DesignatedSub-Advisory Agreements
Nature, Extent, and Quality of the Services Provided Under the DesignatedSub-Advisory Agreements and Performance
In evaluating the DesignatedSub-Advisory Agreements, the Trustees relied upon materials furnished and presentations made by the Investment Adviser and the DesignatedSub-Advisers. In evaluating the nature, extent, and quality of services provided by each DesignatedSub-Adviser, the Trustees considered information on the services provided to the Fund by each DesignatedSub-Adviser, including information about each DesignatedSub-Adviser’s (a) personnel and compensation structure; (b) track record in managing the Fund and, if applicable, other funds and/or accounts with investment strategies similar to those employed on behalf of the Fund; (c) policies and procedures in place to address potential conflicts of interest; and (d) compliance program and code of ethics. In this regard, they also considered assessments provided by the Investment Adviser of each DesignatedSub-Adviser, the Designated Sub-Adviser’s investment strategies and personnel, and its compliance program. The Trustees also reviewed the operations and investment performance of each DesignatedSub-Adviser’s respective sleeve of the Fund since its inception, including a comparison of each DesignatedSub-Adviser to relevant benchmark indices based on various metrics, including realized beta, excess return, alpha, and volatility.
Costs of Services Provided
The Trustees reviewed the terms of each DesignatedSub-Advisory Agreement, including the schedule of fees payable to the DesignatedSub-Advisers. They considered any breakpoints in thesub-advisory fee rate payable under each DesignatedSub-Advisory Agreement. The Trustees noted that the compensation paid to each DesignatedSub-Adviser is paid by the Investment Adviser, not by the Fund, and that the retention of the DesignatedSub-Advisers does not directly increase the fees incurred by the Fund for advisory services. They considered the Investment Adviser’s belief that the relationship between the management fees paid by the Fund and thesub-advisory fees paid by the Investment Adviser is appropriate given the level of services the Investment Adviser provides to the Fund and significant differences in cost drivers and risks associated with the respective services offered by the Investment Adviser and each DesignatedSub-Adviser. They also considered the management fee waivers and expense limitations that substantially reduce the fees retained by the Investment Adviser. The Trustees considered that certain DesignatedSub-Advisers had agreed to reduce theirsub-advisory fee rate. The Trustees reviewed the blended average of allsub-advisory fees paid by the Investment Adviser with respect to the Fund in light of the overall management fee paid by the Fund.
Conclusion
In connection with their consideration of the DesignatedSub-Advisory Agreements, the Trustees gave weight to various factors, but did not identify any particular factor as controlling their decision. After deliberation and consideration of the information provided, including the factors described above, the Trustees, including the Independent Trustees, unanimously concluded, in the exercise of their business judgment, that thesub-advisory fees paid by the Investment Adviser to each DesignatedSub-Adviser were reasonable in light of the factors considered, and that each DesignatedSub-Advisory Agreement should be approved and continued until August 31, 2020.
73
GOLDMAN SACHS MULTI-MANAGER ALTERNATIVES FUND
Trustees and Officers (Unaudited)
Independent Trustees
| | | | | | | | | | |
Name,
Address and Age1 | | Position(s) Held
with the Trust | | Term of
Office and
Length of
Time Served2 | | Principal Occupation(s)
During Past 5 Years | | Number of
Portfolios in
Fund Complex
Overseen by
Trustee3 | | Other
Directorships
Held by Trustee4 |
| | | | | |
Cheryl K. Beebe Age: 63 | | Chair of the Board of Trustees | | Since 2017 (Trustee since 2015) | | Ms. Beebe is retired. She is Director, Packaging Corporation of America (2008-Present); Director, The Mosaic Company (2019–Present); and was formerly Director, Convergys Corporation (a global leader in customer experience outsourcing) (2015–2018); and Executive Vice President, (2010-2014); and Chief Financial Officer, Ingredion, Inc. (a leading global ingredient solutions company) (2004-2014). Chair of the Board of Trustees — Goldman Sachs Trust II. | | 19 | | Packaging Corporation of America (producer of container board); The Mosaic Company (producer of phosphate and potash fertilizer) |
| | | | | |
Lawrence Hughes Age: 61 | | Trustee | | Since 2016 | | Mr. Hughes is retired. Formerly, he held senior management positions with BNY Mellon Wealth Management, a division of The Bank of New York Mellon Corporation (a financial services company) (1991-2015), most recently as Chief Executive Officer (2010-2015). He serves as Chairman of the Board of Directors, Ellis Memorial and Eldredge House (a not-for-profit organization) (2012-Present). Previously, Mr. Hughes served as an Advisory Board Member of Goldman Sachs Trust II (February 2016-April 2016). Trustee — Goldman Sachs Trust II. | | 19 | | None |
| | | | | |
John F. Killian Age: 64 | | Trustee | | Since 2015 | | Mr. Killian is retired. He is Director, Consolidated Edison, Inc. (2007-Present); Director, Houghton Mifflin Harcourt Publishing Company (2011-Present); and formerly held senior management positions with Verizon Communications, Inc., including Executive Vice President and Chief Financial Officer (2009-2010); and President, Verizon Business, Verizon Communications, Inc. (2005-2009). Trustee — Goldman Sachs Trust II. | | 19 | | Consolidated Edison, Inc. (a utility holding company); Houghton Mifflin Harcourt Publishing Company |
| | | | | |
Steven D. Krichmar Age: 61 | | Trustee | | Since 2018 | | Mr. Krichmar is retired. Formerly, he held senior management and governance positions with Putnam Investments, LLC, a financial services company (2001-2016). He was most recently Chief of Operations and a member of the Operating Committee of Putnam Investments, LLC and Principal Financial Officer of The Putnam Funds. Previously, Mr. Krichmar served as an Audit Partner with PricewaterhouseCoopers LLP and its predecessor company (1990-2001). Trustee — Goldman Sachs Trust II. | | 19 | | None |
| | | | | | | | | | |
74
GOLDMAN SACHS MULTI-MANAGER ALTERNATIVES FUND
Trustees and Officers (Unaudited) (continued)
Interested Trustee*
| | | | | | | | | | |
Name,
Address and Age1 | | Position(s) Held
with the Trust | | Term of
Office and
Length of
Time Served2 | | Principal Occupation(s)
During Past 5 Years | | Number of
Portfolios in
Fund Complex
Overseen by
Trustee3 | | Other
Directorships
Held by Trustee4 |
| | | | | |
| James A. McNamara Age: 57 | | President and Trustee | | Since 2012 | | Advisory Director, Goldman Sachs (January 2018-Present); Managing Director, Goldman Sachs (January 2000-December 2017); Director of Institutional Fund Sales, GSAM (April 1998-December 2000); and Senior Vice President and Manager, Dreyfus Institutional Service Corporation (January 1993-April 1998). President and Trustee — Goldman Sachs Trust II; Goldman Sachs Trust; Goldman Sachs Variable Insurance Trust; Goldman Sachs MLP Income Opportunities Fund; Goldman Sachs MLP and Energy Renaissance Fund; and Goldman Sachs ETF Trust. | | 162 | | None |
| | | | | | | | | | |
| * | | Mr. McNamara is considered to be an “Interested Trustee” because he holds positions with Goldman Sachs and owns securities issued by The Goldman Sachs Group, Inc. He holds comparable positions with certain other companies of which Goldman Sachs, GSAM or an affiliate thereof is the investment adviser, administrator and/or distributor. |
| 1 | | Each Trustee may be contacted by writing to the Trustee, c/o Goldman Sachs, 200 West Street, New York, New York, 10282, Attn: Caroline Kraus. Information is provided as of October 31, 2019. |
| 2 | | Subject to such policies as may be adopted by the Board from time-to-time, each Trustee holds office for an indefinite term, until the earliest of: (a) the election of his or her successor; (b) the date the Trustee resigns or is removed by the Board or shareholders, in accordance with the Trust’s Declaration of Trust; or (c) the termination of the Trust. The Board has adopted policies which provide that (a) no Trustee shall hold office for more than 15 years and (b) a Trustee shall retire as of December 31st of the calendar year in which he or she reaches his or her 74th birthday, unless a waiver of such requirement shall have been adopted by a majority of the other Trustees. These policies may be changed by the Trustees without shareholder vote. |
| 3 | | The Goldman Sachs Fund Complex includes certain other companies listed above for each respective Trustee. As of October 31, 2019, Goldman Sachs Trust II consisted of 19 portfolios (17 of which offered shares to the public); Goldman Sachs Trust consisted of 89 portfolios (88 of which offered shares to the public); Goldman Sachs Variable Insurance Trust consisted of 13 portfolios; Goldman Sachs MLP Income Opportunities Fund and Goldman Sachs MLP and Energy Renaissance Fund each consisted of one portfolio; and Goldman Sachs ETF Trust consisted of 39 portfolios (21 of which offered shares to the public). |
| 4 | | This column includes only directorships of companies required to report to the Securities and Exchange Commission under the Securities Exchange Act of 1934 (i.e., “public companies”) or other investment companies registered under the Act. |
Additional information about the Trustees is available in the Fund’s Statement of Additional Information, which can be obtained from Goldman Sachs free of charge by calling this toll-free number (in the United States of America): 1-800-526-7384.
75
GOLDMAN SACHS MULTI-MANAGER ALTERNATIVES FUND
Trustees and Officers (Unaudited) (continued)
Officers of the Trust*
| | | | | | |
| Name, Address and Age1 | | Position(s) Held
with the Trust | | Term of
Office and
Length of
Time Served2 | | Principal Occupation(s) During Past 5 Years |
| | | |
James A. McNamara 200 West Street New York, NY 10282 Age: 57 | | Trustee and President | | Since 2012 | | Advisory Director, Goldman Sachs (January 2018-Present); Managing Director, Goldman Sachs (January 2000-December 2017); Director of Institutional Fund Sales, GSAM (April 1998-December 2000); and Senior Vice President and Manager, Dreyfus Institutional Service Corporation (January 1993-April 1998). President and Trustee — Goldman Sachs Trust II; Goldman Sachs Trust; Goldman Sachs Variable Insurance Trust; Goldman Sachs MLP Income Opportunities Fund; Goldman Sachs MLP and Energy Renaissance Fund; and Goldman Sachs ETF Trust. |
| | | |
Caroline L. Kraus 200 West Street New York, NY 10282 Age: 42 | | Secretary | | Since 2012 | | Managing Director, Goldman Sachs (January 2016-Present); Vice President, Goldman Sachs (August 2006-December 2015); Associate General Counsel, Goldman Sachs (2012-Present); Assistant General Counsel, Goldman Sachs (August 2006-December 2011); and Associate, Weil, Gotshal & Manges, LLP (2002-2006). Secretary — Goldman Sachs Trust II; Goldman Sachs Trust (previously Assistant Secretary (2012)); Goldman Sachs Variable Insurance Trust (previously Assistant Secretary (2012)); Goldman Sachs BDC, Inc.; Goldman Sachs Private Middle Market Credit LLC; Goldman Sachs Middle Market Lending Corp.; Goldman Sachs MLP Income Opportunities Fund; Goldman Sachs MLP and Energy Renaissance Fund; and Goldman Sachs ETF Trust. |
| | | |
Joseph F. DiMaria 30 Hudson Street Jersey City, NJ 07302 Age: 51 | | Treasurer, Principal Financial Officer and Principal Accounting Officer | | Since 2017 (Treasurer and Principal Financial Officer Since 2019) | | Managing Director, Goldman Sachs (November 2015-Present) and Vice President — Mutual Fund Administration, Columbia Management Investment Advisers, LLC (May 2010-October 2015). Treasurer, Principal Financial Officer and Principal Accounting Officer — Goldman Sachs Trust II (previously Assistant Treasurer (2017)); Goldman Sachs Trust (previously Assistant Treasurer (2016)); Goldman Sachs Variable Insurance Trust (previously Assistant Treasurer (2016)); Goldman Sachs MLP Income Opportunities Fund (previously Assistant Treasurer (2017)); Goldman Sachs MLP and Energy Renaissance Fund (previously Assistant Treasurer (2017)); and Goldman Sachs ETF Trust (previously Assistant Treasurer (2017)). |
| | | | | | |
| * | | Represents a partial list of officers of the Trust. Additional information about all the officers is available in the Fund’s Statement of Additional Information, which can be obtained from Goldman Sachs free of charge by calling this toll-free number (in the United States): 1-800-526-7384. |
| 1 | | Information is provided as of October 31, 2019. |
| 2 | | Officers hold office at the pleasure of the Board of Trustees or until their successors are duly elected and qualified. Each officer holds comparable positions with certain other companies of which Goldman Sachs, GSAM or an affiliate thereof is the investment adviser, administrator and/or distributor. |
76
FUNDS PROFILE
Goldman Sachs Funds
Goldman Sachs is a premier financial services firm, known since 1869 for creating thoughtful and customized investment solutions in complex global markets.
Today, theConsumer and Investment Management Division of Goldman Sachs serves a diverse set of clients worldwide, including private institutions, public entities and individuals. With approximately $1.60 trillion in assets under supervision as of September 30, 2019, Goldman Sachs Asset Management (“GSAM”) has portfolio management teams located around the world and our investment professionals bring firsthand knowledge of local markets to every investment decision. Assets under supervision includes assets under management and other client assets for which Goldman Sachs does not have full discretion. GSAM leverages the resources of Goldman Sachs & Co. LLC subject to legal, internal and regulatory restrictions.
Money Market
Financial Square FundsSM
| ∎ | | Financial Square Treasury Solutions Fund1 |
| ∎ | | Financial Square Government Fund1 |
| ∎ | | Financial Square Money Market Fund2 |
| ∎ | | Financial Square Prime Obligations Fund2 |
| ∎ | | Financial Square Treasury Instruments Fund1 |
| ∎ | | Financial Square Treasury Obligations Fund1 |
| ∎ | | Financial Square Federal Instruments Fund1 |
Investor FundsSM
| ∎ | | Investor Money Market Fund3 |
| ∎ | | Investor Tax-Exempt Money Market Fund3 |
Fixed Income
Short Duration and Government
| ∎ | | High Quality Floating Rate Fund |
| ∎ | | Short-Term Conservative Income Fund |
| ∎ | | Short Duration Government Fund |
| ∎ | | Short Duration Income Fund |
| ∎ | | Inflation Protected Securities Fund |
Multi-Sector
Municipal and Tax-Free
| ∎ | | High Yield Municipal Fund |
| ∎ | | Dynamic Municipal Income Fund |
| ∎ | | Municipal Income Completion Fund |
| ∎ | | Short Duration Tax-Free Fund |
Single Sector
| ∎ | | Investment Grade Credit Fund |
| ∎ | | High Yield Floating Rate Fund |
| ∎ | | Emerging Markets Debt Fund |
| ∎ | | Local Emerging Markets Debt Fund |
Fixed Income Alternatives
| ∎ | | Long Short Credit Strategies Fund |
Fundamental Equity
| ∎ | | Small/Mid Cap Value Fund |
| ∎ | | Small/Mid Cap Growth Fund |
| ∎ | | Concentrated Growth Fund |
| ∎ | | Technology Opportunities Fund |
| ∎ | | Growth Opportunities Fund |
| ∎ | | Rising Dividend Growth Fund |
Tax-Advantaged Equity
| ∎ | | U.S. Tax-Managed Equity Fund |
| ∎ | | International Tax-Managed Equity Fund |
| ∎ | | U.S. Equity Dividend and Premium Fund |
| ∎ | | International Equity Dividend and Premium Fund |
Equity Insights
| ∎ | | Small Cap Equity Insights Fund |
| ∎ | | U.S. Equity Insights Fund |
| ∎ | | Small Cap Growth Insights Fund |
| ∎ | | Large Cap Growth Insights Fund |
| ∎ | | Large Cap Value Insights Fund |
| ∎ | | Small Cap Value Insights Fund |
| ∎ | | International Small Cap Insights Fund |
| ∎ | | International Equity Insights Fund |
| ∎ | | Emerging Markets Equity Insights Fund |
Fundamental Equity International
| ∎ | | International Equity Income Fund |
| ∎ | | International Equity ESG Fund |
| ∎ | | Emerging Markets Equity Fund |
| ∎ | | Imprint Emerging Markets Opportunities Fund5 |
| ∎ | | ESG Emerging Markets Equity Fund |
Alternative
| ∎ | | Real Estate Securities Fund |
| ∎ | | International Real Estate Securities Fund |
| ∎ | | Commodity Strategy Fund |
| ∎ | | Global Real Estate Securities Fund |
| ∎ | | Alternative Premia Fund |
| ∎ | | Absolute Return Tracker Fund |
| ∎ | | Managed Futures Strategy Fund |
| ∎ | | MLP Energy Infrastructure Fund |
| ∎ | | Multi-Manager Alternatives Fund |
| ∎ | | Global Infrastructure Fund |
Total Portfolio Solutions
| ∎ | | Global Managed Beta Fund |
| ∎ | | Multi-Manager Non-Core Fixed Income Fund |
| ∎ | | Multi-Manager U.S. Dynamic Equity Fund |
| ∎ | | Multi-Manager Global Equity Fund |
| ∎ | | Multi-Manager International Equity Fund |
| ∎ | | Tactical Tilt Overlay Fund |
| ∎ | | Balanced Strategy Portfolio |
| ∎ | | Multi-Manager U.S. Small Cap Equity Fund |
| ∎ | | Multi-Manager Real Assets Strategy Fund |
| ∎ | | Growth and Income Strategy Portfolio |
| ∎ | | Growth Strategy Portfolio |
| ∎ | | Dynamic Global Equity Fund6 |
| ∎ | | Satellite Strategies Portfolio |
| ∎ | | Enhanced Dividend Global Equity Portfolio |
| ∎ | | Tax-Advantaged Global Equity Portfolio |
| ∎ | | Strategic Factor Allocation Fund |
| ∎ | | Target Date 2020 Portfolio |
| ∎ | | Target Date 2025 Portfolio |
| ∎ | | Target Date 2030 Portfolio |
| ∎ | | Target Date 2035 Portfolio |
| ∎ | | Target Date 2040 Portfolio |
| ∎ | | Target Date 2045 Portfolio |
| ∎ | | Target Date 2050 Portfolio |
| ∎ | | Target Date 2055 Portfolio |
| ∎ | | Target Date 2060 Portfolio |
| ∎ | | GQG Partners International Opportunities Fund |
| 1 | | You could lose money by investing in the Fund. Although the Fund seeks to preserve the value of your investment at $1.00 per share, it cannot guarantee it will do so. An investment in the Fund is not a deposit of a bank and is not insured or guaranteed by the Federal Deposit Insurance Corporation or any other government agency. The Fund’s sponsor has no legal obligation to provide financial support to the Fund, and you should not expect that the sponsor will provide financial support to the Fund at any time. |
| 2 | | You could lose money by investing in the Fund. Because the share price of the Fund will fluctuate, when you sell your shares they may be worth more or less than what you originally paid for them. The Fund may impose a fee upon sale of your shares or may temporarily suspend your ability to sell shares if the Fund’s liquidity falls below required minimums because of market conditions or other factors. An investment in the Fund is not a deposit of a bank and is not insured or guaranteed by the Federal Deposit Insurance Corporation or any other government agency. The Fund’s sponsor has no legal obligation to provide financial support to the Fund, and you should not expect that the sponsor will provide financial support to the Fund at any time. |
| 3 | | You could lose money by investing in the Fund. Although the Fund seeks to preserve the value of your investment at $1.00 per share, it cannot guarantee it will do so. The Fund may impose a fee upon sale of your shares or may temporarily suspend your ability to sell shares if the Fund’s liquidity falls below required minimums because of market conditions or other factors. An investment in the Fund is not a deposit of a bank and is not insured or guaranteed by the Federal Deposit Insurance Corporation or any other government agency. The Fund’s sponsor has no legal obligation to provide financial support to the Fund, and you should not expect that the sponsor will provide financial support to the Fund at any time. |
| 4 | | Effective after the close of business on November 20, 2019, the Goldman Sachs Asia Equity Fund was renamed the Goldman Sachs China Equity Fund. |
| 5 | | Effective after the close of business on August 30, 2019, the Goldman Sachs N-11 Equity Fund was renamed the Goldman Sachs Imprint Emerging Markets Opportunities Fund. |
| 6 | | Effective after the close of business on February 28, 2019, the Goldman Sachs Equity Growth Strategy Portfolio was renamed the Goldman Sachs Dynamic Global Equity Fund. |
| * | | This list covers open-end funds only. Please visit our website at www.GSAMFUNDS.com to learn about our closed-end funds and exchange-traded funds. |
| | |
TRUSTEES Cheryl K. Beebe,Chair Lawrence Hughes John F. Killian Steven D. Krichmar James A. McNamara | | OFFICERS James A. McNamara,President Joseph F. DiMaria,Principal Financial Officer, Principal Accounting Officer and Treasurer Caroline L. Kraus,Secretary |
| |
GOLDMAN SACHS & CO. LLC Distributor and Transfer Agent | | GOLDMAN SACHS ASSET MANAGEMENT, L.P. Investment Adviser |
Visit our web site atwww.GSAMFUNDS.com to obtain the most recent month-end returns.
Goldman Sachs Asset Management, L.P. 200 West Street, New York, New York 10282
The reports concerning the Fund included in this shareholder report may contain certain forward-looking statements about the factors that may affect the performance of the Fund in the future. These statements are based on Fund management’s predictions and expectations concerning certain future events and their expected impact on the Fund, such as performance of the economy as a whole and of specific industry sectors, changes in the levels of interest rates, the impact of developing world events, and other factors that may influence the future performance of the Fund. Management believes these forward-looking statements to be reasonable, although they are inherently uncertain and difficult to predict. Actual events may cause adjustments in portfolio management strategies from those currently expected to be employed.
A description of the policies and procedures that the Fund uses to determine how to vote proxies relating to portfolio securities and information regarding how the Fund voted proxies relating to portfolio securities during the most recent 12-month period ended June 30 is available (I)��without charge, upon request by calling1-800-526-7384 (for Retail Shareholders) or 1-800-621-2550 (for Institutional Shareholders); and (II) on the Securities and Exchange Commission (“SEC”) web site at http://www.sec.gov.
The Funds will file their portfolio holdings for each month in a fiscal quarter within 60 days after the end of the relevant fiscal quarter on Form N-PORT. Portfolio holdings information for the third month of each fiscal quarter will be made available on the SEC’s web site at http://www.sec.gov. Portfolio holdings information may be obtained upon request and without charge by calling1-800-526-7384 (for Retail Shareholders) or1-800-621-2550 (for Institutional Shareholders).
Fund holdings and allocations shown are unaudited, and may not be representative of current or future investments. Fund holdings and allocations may not include the Fund’s entire investment portfolio, which may change at any time. Fund holdings should not be relied on in making investment decisions and should not be construed as research or investment advice regarding particular securities. Current and future holdings are subject to risk.
Economic and market forecasts presented herein reflect our judgment as of the date of this presentation and are subject to change without notice. These forecasts do not take into account the specific investment objectives, restrictions, tax and financial situation or other needs of any specific client. Actual data will vary and may not be reflected here. These forecasts are subject to high levels of uncertainty that may affect actual performance. Accordingly, these forecasts should be viewed as merely representative of a broad range of possible outcomes. These forecasts are estimated, based on assumptions, and are subject to significant revision and may change materially as economic and market conditions change. Goldman Sachs has no obligation to provide updates or changes to these forecasts. Case studies and examples are for illustrative purposes only.
The portfolio risk management process includes an effort to monitor and manage risk, but does not imply low risk. Past correlations are not indicative of future correlations, which may vary.
This material is not authorized for distribution to prospective investors unless preceded or accompanied by a current Prospectus or summary prospectus, if applicable. Investors should consider the Fund’s objective, risks, and charges and expenses, and read the summary prospectus, if available, and/or the Prospectus carefully before investing or sending money. The summary prospectus, if available, and the Prospectus contain this and other information about the Fund and may be obtained from your authorized dealer or from Goldman Sachs & Co. LLC by calling(retail –1-800-526-7384) (institutional – 1-800-621-2550).
© 2019 Goldman Sachs. All rights reserved. 187256-OTU-1103587 MMALTAR-19
Goldman Sachs Funds

| | | | |
| | |
| Annual Report | | | | October 31, 2019 |
| | |
| | | | Strategic Multi-Asset Class Funds |
| | | | Multi-Manager Global Equity |
| | | | Multi-Manager Non-Core Fixed Income |
| | | | Multi-Manager Real Assets Strategy |
It is our intention that beginning on January 1, 2021, paper copies of the Funds’ annual and semi-annual shareholder reports will no longer be sent by mail, unless you specifically request paper copies of the reports from a Fund or from your financial intermediary. Instead, the reports will be made available on a website, and you will be notified by mail each time a report is posted and provided with a website link to access the report.
If you already elected to receive shareholder reports electronically, you will not be affected by this change and you need not take any action. At any time, you may elect to receive reports and certain communications from a Fund electronically by calling the applicable toll-free number below or by contacting your financial intermediary.
You may elect to receive all future shareholder reports in paper free of charge. If you hold shares of a Fund directly with the Fund’s transfer agent, you can inform the transfer agent that you wish to receive paper copies of reports by callingtoll-free 800-621-2550. If you hold shares of a Fund through a financial intermediary, please contact your financial intermediary to make this election. Your election to receive reports in paper will apply to all Goldman Sachs Funds held in your account if you invest through your financial intermediary or all Goldman Sachs Funds held with the Funds’ transfer agent if you invest directly with the transfer agent.

Goldman Sachs Strategic
Multi-Asset Class Funds
| ∎ | | MULTI-MANAGER GLOBAL EQUITY |
| ∎ | | MULTI-MANAGER NON-CORE FIXED INCOME |
| ∎ | | MULTI-MANAGER REAL ASSETS STRATEGY |
| | | | |
| | | |
| NOT FDIC-INSURED | | May Lose Value | | No Bank Guarantee |
MARKET REVIEW
Goldman Sachs Strategic Multi-Asset Class Funds
Market Review
The capital markets experienced mixed results during the 12 months ended October 31, 2019 (the “Reporting Period”), as global economic growth concerns and trade war uncertainty led to sustained market volatility.
The first half of the Reporting Period was characterized by a challenging 2018year-end followed by a remarkably strong rally during the first four months of 2019. Global equities fell significantly in November and December 2018, as investors’ hopes for a trade reconciliation between the U.S. and China were dashed.Risk-off market sentiment, or reduced risk appetite, increased, and U.S. Treasury yields began a downward slide that endured for most of the Reporting Period. In January 2019, global equities rebounded from their losses, jumpstarted by a more accommodative tone from U.S. Federal Reserve (“Fed”) Chair Jerome Powell, who cited the need for a patient approach toward future interest rate changes given the continued economic slowdown in China and softening U.S. economic data. In March 2019, amid ongoing U.S.-China trade tensions and in response to the stock market volatility at 2018year-end, the Fed announced its intention to hold interest rates steady through the conclusion of the 2019 calendar year. Meanwhile, monetary policy easing by central banks in Europe and China further supported global equities, which experienced their strongest first calendar quarter rally in more than two decades. However, despite the global equity rally, the weakening global economy, which was exacerbated by unpredictable trade rhetoric between the U.S. and China, stayed top of mind for investors. In March 2019, these concerns drove yields on German and Japanese10-year government bonds into negative territory.
During the second half of the Reporting Period, global equity markets generally traded sideways and remained heavily influenced by trade disputes and global central bank policies. (When a market trades sideways, it generally moves within a fairly stable range without forming any distinct trends over a period of time.) Global equities began May 2019 nearall-time highs before sharply declining during the month, as a breakdown in U.S. and China trade negotiations led to fresh U.S. tariffs on Chinese imports. For much of the spring and summer, investor sentiment whipsawed as the U.S. and China swapped tariff threats and company-specific blacklists. Meanwhile, the Fed shifted its monetary policy stance, deciding to cut short-term interest rates by 25 basis points in July 2019 — its first interest rate cut in more than a decade. (A basis point is 1/100th of a percentage point.) Further 25 basis point reductions followed in September and October 2019. The Fed’s concern about declining economic growth and its accommodative monetary policy stance was reiterated by European Central Bank President Mario Draghi, who unveiled a new quantitative easing plan for the European Union just as his term ended on October 31st. In October 2019, the European Union remained front and center, as it approved another delay in Brexit (or the U.K.’s departure from the European Union) beyond the originally scheduled October 31st deadline. For the Reporting Period overall, global equities (as represented by the MSCI All Country World Index Investable Market Index) were up more than 12%, driven by positive performance across all major regions. From a sector perspective, cyclical stocks and information technology stocks were notable performers. Energy was the only sector that posted a negative absolute return for the Reporting Period.
Credit markets broadly sold off during the first two months of the Reporting Period. Thesell-off was driven byrisk-off investor sentiment and a flight to quality through November and December 2018 as well as by significant market volatility due in part to the partial U.S. federal government shutdown, investor uncertainty around the Fed’s monetary policy, tumultuous U.S.-China trade relations and uncertain global economic growth. At the beginning of 2019, however, investor sentiment improved in light of seemingly positive developments in U.S.-China trade talks as well as data indicative of ongoing solid U.S. economic growth and a more dovish Fed. (Dovish tends to suggest lower interest rates; opposite of hawkish.) Investment grade corporate bonds outperformed nearly all other major fixed income sectors during the first 10 months of 2019, surpassing high yield corporate bonds midway through the calendar year as the longer duration profile of investment grade corporate bonds benefited from a significant rally in interest rates and tightening credit spreads (or yield differentials between corporate bonds and U.S. Treasury securities of comparable maturity). Emerging markets debt also rallied, as investor optimism around U.S.-China trade negotiations persisted, with U.S. dollar-denominated emerging markets debt outpacing local currency emerging markets debt.
Global real estate securities reached their lows of the Reporting Period during the last two months of 2018 but were more resilient overall than global equities. During the first 10 months of 2019, global real estate securities rallied alongside global equities broadly and were trading at the end of the Reporting Period at premium valuations to their underlying net asset values on average, with solid fundamentals and transaction volumes in private real estate markets driving investor sentiment. During the Reporting
1
MARKET REVIEW
Period as a whole, the performance of global real estate securities was driven largely by investor expectations of more dovish Fed monetary policy and by falling long-term yields, which cast real estate securities in an attractive light from a yield perspective and seemed likely to keep borrowing costs low for capital-intensive real estate companies. That said, there continued to be disparities in valuations amongst market segments across regions. Segments viewed as defensive generally performed strongly as thelower-for-longer interest rate investment theme strengthened, and sectors viewed as more vulnerable to weaker economic growth and/or geopolitical risks were weaker. Among market segments, industrial real estate investment trusts (“REITs”) performed strongly during the Reporting Period overall, as they continued to be well supported bye-commerce demand, supply chain reconfiguration and high barriers to entry for competitive new supply. Conversely, retail REITs, specifically malls, were weaker, as they suffered from ongoing retail store closures, a lack of significant transaction activity that would demonstrate asset values, and growing investor concerns regarding the potential negative impact of U.S.-China trade issues. Regionally, Asia and North America drove real estate markets during the Reporting Period overall, while European real estate markets lagged. Asia rallied in spite of investors’ geopolitical, trade and economic concerns, while the decline in U.S. long-term yields and the Fed’s dovish pivot unpinned the rally in North American real estate.
As for global infrastructure markets, they moved higher during the Reporting Period, holding up well during the equity marketsell-off in December 2018 and keeping pace with the rally in risk assets from January 2019 through the end of the Reporting Period. For the Reporting Period overall, global infrastructure securities outperformed global equities broadly. Among market segments, real estate infrastructure assets performed most strongly. Specialized REITs focused on communications infrastructure performed particularly well during the Reporting Period, as U.S.-based cellular tower companies benefited from strong earnings results and visible growth catalysts derived from increasing mobile data traffic and the transition to fifth-generation, or 5G, networks. Energy also helped drive the performance of global infrastructure markets. Although midstream energy infrastructure securities were weak near the end of 2018, they recovered significantly in the first half of 2019 on the back of sustained and robust fundamental earnings results from underlying companies, particularly within the U.S. (The midstream component of the energy industry is usually defined as those companies providing products or services that help link the supply side, i.e., energy producers, and the demand side, i.e., energyend-users, for any type of energy commodity. Such midstream businesses can include, but are not limited to, those that process, store, market and transport various energy commodities.) The utilities sector was another source of strength, led by multi-utilities, particularly within North America, followed by gas and water utilities. Regionally, North America was the primary driver of global infrastructure market performance, along with Europe, which also saw strongly positive returns. Developed Asia posted gains, though to a lesser extent given investors’ concerns around the ongoing U.S.-China trade dispute and protests in Hong Kong, which weighed on performance.
Looking Ahead
At the end of the Reporting Period, investors remained focused on a potential resolution to the U.S.-China trade war. Suggestions from both countries that an agreement might be reached by the end of 2019 were met with cautious optimism. Investors also adopted await-and-see approach toward Brexit given a second delay in its implementation and a new deadline of January 31, 2020. An early general election in the U.K., scheduled for December 2019, added further to Brexit-related uncertainty. Going forward, we expect investors to remain watchful for signs the accommodative efforts of the world’s central banks are effective in staving off a further slowdown in the global economy. We also expect investors to continue monitoring the progress of U.S.-China trade talks.
2
PORTFOLIO RESULTS
Goldman Sachs Multi-Manager
Global Equity Fund
Investment Objective
The Fund seeks to provide long-term capital growth.
Portfolio Management Discussion and Analysis
Below, the Goldman Sachs Global Portfolio Solutions (“GPS”) and Alternative Investments & Manager Selection (“AIMS”) Groups discuss the Goldman Sachs Multi-Manager Global Equity Fund’s (the “Fund”) performance and positioning for12-month period ended October 31, 2019 (the “Reporting Period”).
| Q | | How did the Fund perform during the Reporting Period? |
| A | | During the Reporting Period, the Fund’s Class R6 Shares generated an average annual total return of 11.39%. This return compares to the 12.36% average annual total return of the Fund’s benchmark, the MSCI All Country World Index Investable Market Index (“MSCI ACWI IMI”) (Net, USD, 50%Non-U.S. Developed Hedged to USD) (the “Index”), during the same time period. |
| Q | | What key factors were responsible for the Fund’s performance during the Reporting Period? |
| A | | The Fund uses a multi-manager approach and generally seeks to achieve its investment objective by dynamically allocating its assets among unaffiliated investment managers (“Underlying Managers”) that employ a mix of international, global and U.S.-focused equity investment strategies. The GPS Group is responsible for the Fund’s asset allocation, wherein it applies a risk-based approach that draws from both fundamental and quantitative disciplines with the intention of dynamically accessing a diversified set of risks and returns in a market cycle aware manner. The AIMS Group is responsible for making recommendations with respect to hiring, terminating or replacing the Fund’s Underlying Managers and applying a multifaceted process for manager due diligence, portfolio construction and risk management. The GPS Group also provides certain risk management services to the Fund. |
| | | During the Reporting Period, the Fund recorded a double-digit positive absolute return but underperformed the Index. The Fund’s relative underperformance can be attributed to the performance of the Fund’s Underlying Managers overall. Strategic asset allocation also underperformed the Index during the Reporting Period. |
| | | At various points during the Reporting Period, the Fund had capital allocated to 12 Underlying Managers — Boston Partners Global Investors, Inc. (“Boston Partners”), Causeway Capital Management LLC (“Causeway”), Fisher Asset Management, LLC (“Fisher”), GW&K Investment Management, LLC (“GW&K”), Legal & General Investment Management America, Inc. (“LGIMA”), Massachusetts Financial Services Company, doing business as MFS Investment Management, (“MFS”), Principal Global Investors, LLC (“Principal”), QMA LLC (“QMA”) (known as Quantitative Management Associates LLC prior to April 3, 2019); Vaughan Nelson Investment Management, L.P. (“Vaughan Nelson”), Vulcan Value Partners, LLC (“Vulcan”), WCM Investment Management (“WCM”) and Wellington Management Company LLP (“Wellington”). |
| | | These 12 Underlying Managers represented five market segments across global equity as part of the Fund’stop-level strategy allocation — U.S. large cap (QMA, Vaughan Nelson and Vulcan); Europe, Australasia and Far East (“EAFE”) large cap (Causeway, MFS and WCM); U.S. small cap (Boston Partners and GW&K); EAFE small cap (Principal); and emerging markets (Fisher and Wellington). LGIMA managed a diversified beta strategy. |
| | | Of the 11 Underlying Managers with allocated capital for the entire Reporting Period, all 11 generated positive absolute returns. MFS generated a positive absolute return between June 28, 2019, when it was allocated capital as an Underlying Manager of the Fund, and the end of the Reporting Period. On a relative basis, six Underlying Managers outperformed their respective benchmark indices, four underperformed their respective benchmark indices, and one performed in line with its benchmark index during the Reporting Period. MFS performed in line with its benchmark index between June 28, 2019 and the end of the Reporting Period. |
| | | During the first three months of the Reporting Period, the Fund used Russell Investments Implementation Services, |
3
PORTFOLIO RESULTS
| | LLC (“RIIS”) for a currency overlay program given the hedged nature of the Fund’s benchmark index. Effective February 2019, RIIS was redeemed, and the GPS Group began managing a passive currency overlay, which is designed to hedge exposure tonon-U.S. currencies by selling the currencies in which the Fund’s equity securities are traded and investing in the U.S. dollar. The currency overlay seeks to minimize unintended currency exposures for the Fund. Also, in connection with the risk management services it provides, the GPS Group added passive equity exposure to the Fund during the last two months of the Reporting Period in order to bring the Fund’s beta closer to that of the Index. (Beta refers to the component of the returns that is attributable market risk exposure, rather than manager skill.) |
| | | As mentioned earlier, the Fund’s performance relative to the Index was driven mainly by manager selection, which detracted from returns overall during the Reporting Period. The most significant underperformance came from international value manager Causeway, which lagged the MSCI EAFE Index, and emerging markets manager Wellington, which trailed the MSCI Emerging Markets Index. These negative results were partially offset by EAFElarge-cap Underlying Manager WCM, which outperformed the MSCI ACWIex-U.S. Index; emerging markets manager Fisher, which performed in line with the MSCI Emerging Markets Index; and U.S.small-cap value manager Boston Partners, which outpaced the Russell 2000® Value Index during the Reporting Period. |
| | | Strategic asset allocation, which reflects a longer-term perspective to diversify and invest across global equity markets, underperformed the Index during the Reporting Period. The underperformance occurred between the start of the Reporting Period and the end of August 2019, when the Fund held an overweight allocation versus the Index to globalsmall-cap equities and an underweight allocation versus the Index to developed marketslarge-cap equities. In August 2019, the GPS Group modestly changed the strategic asset allocation such that the Fund was tilted toward developed markets equities and away from emerging markets equities and globalsmall-cap equities. That said, the Fund maintained a slight overweight compared to the Index in emerging markets equities and a modest underweight in U.S.large-cap equities. Because of these changes to its strategic asset allocation, the Fund regained a significant portion of its previous losses in the final two months of the Reporting Period, as global equity markets, and emerging markets equities in particular, rallied. |
| Q | | Which global equity asset classes most significantly affected Fund performance? |
| A | | Diversified beta manager LGIMA, which we measure against the MSCI ACWI Index, underperformed during the Reporting Period due to its exposure to value and size factors, which led to an underweight position and weak stock selection in the information technology sector. |
| | | In EAFE large cap, Underlying Manager WCM outperformed its benchmark index, the MSCI ACWIex-U.S. Index, due to its overweight position and stock selection in the information technology sector and its underweight position and stock selection in the financials sector. Underlying Manager Causeway underperformed its benchmark index, the MSCI EAFE Index, because of an underweight position and stock selection in the communication services sector as well as an overweight position and stock selection in the energy sector. Underlying Manager MFS performed in line with its benchmark index, the MSCI EAFE Index, between June 28, 2019 and the end of the Reporting Period, as an overweight and weak stock selection in consumer staples, which detracted, was offset by an underweight and effective stock selection in energy, which contributed positively. |
| | | In EAFE small cap, Underlying Manager Principal outperformed its benchmark index, the MSCI Worldex-U.S. Small Cap Index, because of strong stock selection in the consumer discretionary sector. |
| | | In U.S. large cap, which we measure relative to the S&P 500® Index, Underlying Manager QMA underperformed the benchmark index primarily due to exposure to value factors, which resulted in weak stock selection in the consumer discretionary sector. As for Underlying Manager Vulcan, it outpaced its benchmark index because of beneficial positioning and stock selection in information technology. Underlying Manager Vaughan Nelson also outperformed the benchmark index, largely because of strong stock selection in the materials sector. |
| | | In U.S. small cap, both Underlying Managers outperformed their respective benchmark indices. Boston Partners, the value-oriented Underlying Manager, significantly outpaced the Russell 2000® Value Index due to strong stock selection in consumer discretionary and energy. GW&K outperformed the Russell 2000® Index through an underweight position and stock selection in the energy sector. |
| | | In emerging markets, which we measure relative to the MSCI Emerging Markets Index, Underlying Manager Wellington |
4
PORTFOLIO RESULTS
| | underperformed because of weak stock selection in the financials sector. Underlying Manager Fisher performed in line with the MSCI Emerging Markets Index, as strong stock selection within financials was largely offset by ineffective stock picking in the energy sector. |
| Q | | How did the Fund use derivatives and similar instruments during the Reporting Period? |
| A | | During the first three months of the Reporting Period, RIIS managed a currency overlay allocation that sought to minimize unintended currency exposures that either reduce performance or increase risk of the Fund’s portfolio. As part of this strategy, RIIS used currency forwards, which had a positive impact on the Fund’s performance. During the last nine months of the Reporting Period, the GPS Group managed a passive currency overlay in which it also utilized currency forwards. The use of these currency forwards had a positive impact on the Fund’s performance. During the Reporting Period overall, LGIMA and QMA used equity index futures to manage exposure and tracking error relative to their respective benchmark indices during certain market events, such as dividend accrual periods or small corporate actions. The use of equity index futures had a positive impact on the Fund’s performance. Other Underlying Managers employed rights and warrants to implement their strategies. The use of warrants and rights did not have a material impact on the Fund’s performance during the Reporting Period overall. |
| Q | | Were there any notable changes in the Fund’s allocations during the Reporting Period? |
| A | | In January 2019, we reduced the Fund’s allocation to LGIMA as we prepared to reevaluate the diversified beta strategy. We reallocated the capital to the iShares® Core MSCI EAFE ETF and the Vanguard S&P 500® ETF. |
| | | As mentioned previously, RIIS was redeemed during February 2019, and the GPS Group began managing the Fund’s passive currency overlay. |
| | | In April 2019, MFS was added as an Underlying Manager of the Fund and was allocated capital in June 2019. MFS employs a core style of international equity investing, with a slight growth bias. Using abottom-up investment process, MFS seeks to 1) identify stocks that have a projected earnings growth rate of at least two to three times that of global Gross Domestic Product growth, 2) identify stocks trading at a discount to projected long-term growth, and 3) outperform in a variety of market environments. |
| | | At the end of the Reporting Period, Underlying Manager Fisher was redeemed and no longer served as an Underlying Manager of the Fund. We reallocated the capital to the Vanguard FTSE Emerging Markets ETF. |
| | | Regarding the Fund’s strategic asset allocation, the Fund’s assets were allocated at the beginning of the Reporting Period 38.2% to U.S. large cap, 25.8% to EAFE large cap, 10.1% to U.S. small cap, 7.1% to EAFE small cap and 16.8% to emerging markets, with the remainder in cash and cash equivalents. When the Reporting Period started, the Fund was overweight relative to the Index in emerging markets equities versus developed markets equities. During the third quarter of 2018, we had modestly reduced the Fund’s overweight in emerging markets equities because of heightened market volatility driven by emerging markets currency risk. We further reduced this overweight at the beginning of 2019, as fresh data releases showed continued deterioration in China’s economy. In the process, we increased the Fund’s strategic allocations to U.S. and EAFElarge-cap stocks. Beginning in September 2019, we increased the Fund’s strategic allocations to developed markets equities and reduced its strategic allocations to emerging market equities and globalsmall-cap stocks. At the end of the Reporting Period, the Fund’s assets were allocated 47.6% to U.S. large cap, 27.7% to EAFE large cap, 6.4% to U.S. small cap, 4.8% to EAFE small cap and 14.0% to emerging markets, with the remainder in cash and cash equivalents. |
| Q | | Were there any changes to the Fund’s portfolio management team during the Reporting Period? |
| A | | Effective January 25, 2019, Tom Murray no longer served as a portfolio manager of the Fund. By design, all investment decisions for the Fund are performed within aco-lead or team structure, with multiple subject matter experts. This strategic decision making has been the cornerstone of our approach and ensures continuity in the Fund. At the end of the Reporting Period, the portfolio managers for the Fund were Neill Nuttall, Kate El-Hillow, Kent Clark and Betsy Gorton. |
| Q | | What is the Fund’s tactical view and strategy for the months ahead? |
| A | | Overall, we intend to continue to position the Fund in alignment with our longer-term strategic views within the equity complex as a complement to additional strategic market exposures. We further intend to continue to monitor allocations and Underlying Manager performance as we seek to generate long-term capital growth. |
5
PORTFOLIO RESULTS
Index Definitions
MSCI All Country World Index Investable Market Index captures large- andmid-cap representation across 23 developed markets and 24 emerging markets countries.
MSCI ACWI Index captures large- andmid-cap representation across 23 developed markets and 24 emerging markets countries. It is not possible to invest directly in an unmanaged index.
MSCI Emerging Markets Index captureslarge-cap andmid-cap representation across 24 emerging markets countries. The index covers approximately 85% of the free float-adjusted market capitalization in each country. Emerging markets countries in the index include Brazil, Chile, China, Colombia, Czech Republic, Egypt, Greece, Hungary, India, Indonesia, South Korea, Malaysia, Mexico, Pakistan, Peru, the Philippines, Poland, Russia, Qatar, South Africa, Taiwan, Thailand, Turkey and United Arab Emirates.
S&P 500® Index is the Standard & Poor’s 500 composite index of 500 stocks, an unmanaged index of common stock prices.
Russell 2000® Index is an unmanaged index of common stock prices that measures the performance of the 2000 smallest companies in the Russell 3000® Index. The Index is constructed to provide a comprehensive and unbiasedsmall-cap barometer and is completely reconstituted annually to ensure larger stocks do not distort the performance and characteristics of the truesmall-cap opportunity set.
Russell 2000® Value Index measures the performance ofsmall-cap value segment of the U.S. equity universe. It includes those Russell 2000 companies with lowerprice-to-book ratios and lower forecasted growth values. The Index is completely reconstituted annually to ensure larger stocks do not distort the performance and characteristics of the truesmall-cap opportunity set and that the represented companies continue to reflect value characteristics.
MSCI ACWIex-U.S. Index captures large and mid cap representation across 22 of 23 developed markets countries (excluding the U.S.) and 26 emerging markets countries. With 2,217 constituents, the index covers approximately 85% of the global equity opportunity set outside the U.S.
MSCI EAFE Index is a stock market index that is designed to measure the equity market performance of developed markets in Europe, Australasia and the Far East, excluding the U.S. and Canada.
MSCI Worldex-U.S. Small Cap Index is an unmanaged index maintained by MSCI and considered representative ofsmall-cap stocks of global developed markets, excluding those of the U.S.
It is not possible to invest directly in an unmanaged index.
6
FUND BASICS
Multi-Manager Global Equity Fund
as of October 31, 2019
| | | | | | | | |
| | TOP TEN HOLDINGS AS OF 10/31/191,2 |
| | | |
| | | Holding | | % of Net Assets | | | Line of Business |
| | | |
| | Vanguard FTSE Emerging Markets ETF | | | 5.1 | % | | Exchange Traded Funds |
| | Microsoft Corp. | | | 1.3 | | | Software |
| | Facebook, Inc. Class A | | | 0.8 | | | Interactive Media & Services |
| | Electronic Arts, Inc. | | | 0.7 | | | Entertainment |
| | The Home Depot, Inc. | | | 0.7 | | | Specialty Retail |
| | The Sherwin-Williams Co. | | | 0.7 | | | Chemicals |
| | Mastercard, Inc. Class A | | | 0.6 | | | IT Services |
| | Dollar Tree, Inc. | | | 0.6 | | | Multiline Retail |
| | AT&T, Inc. | | | 0.6 | | | Diversified Telecommunication Services |
| | | UnitedHealth Group, Inc. | | | 0.6 | | | Health Care Providers & Services |
| 1 | | The top 10 holdings may not be representative of the Fund’s future investments. |
| 2 | | The Fund’s overall top 10 holdings differ from the table above due to the exclusion of the Goldman Sachs Financial Square Government Fund (a short-term investment fund), which represents approximately 10.5% of the Fund’s net assets as of 10/31/19. |
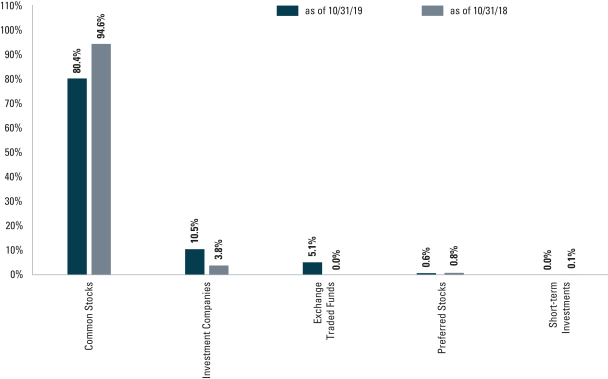
| 3 | | The percentage shown for each investment category reflects the value of investments in that category as a percentage of net assets. Short-term investments represent U.S. Treasury Obligations and Repurchase Agreements. Figures in the graph may not sum to 100% due to the exclusion of other assets and liabilities. Underlying compositions of exchange traded funds and investment companies held by the Fund are not reflected in the graph above. The graph depicts the Fund’s investments but may not represent the Fund’s market exposure due to the exclusion of certain derivatives, if any, as listed in the Additional Investment Information section of the Schedule of Investments. |
For more information about your Fund, please refer to www.GSAMFUNDS.com. There, you can learn more about your Fund’s investment strategies, holdings, and performance.
7
GOLDMAN SACHS MULTI-MANAGER GLOBAL EQUITY FUND
Performance Summary
October 31, 2019
The following graph shows the value, as of October 31, 2019, of a $1,000,000 investment made on June 24, 2015 (commencement of operations) in Class R6 Shares at NAV. For comparative purposes, the performance of the Fund’s benchmark, the MSCI ACWI IMI (Net, USD, 50% Non-U.S. Developed Hedged to USD) is shown. Performance reflects applicable fee waivers and/or expense limitations in effect during the periods shown and in their absence, performance would be reduced. Returns do not reflect the deduction of taxes that a shareholder would pay on Fund distributions or the redemption of Fund shares. The returns set forth below represent past performance. Past performance does not guarantee future results. The Fund’s investment return and principal value will fluctuate so that an investor’s shares, when redeemed, may be worth more or less than their original cost. Current performance may be lower or higher than the performance quoted below. Please visit our web site at www.GSAMFUNDS.com to obtain the most recent month-end returns.
|
| Goldman Sachs Multi-Manager Global Equity Fund’s Lifetime Performance |
Performance of a $1,000,000 Investment, with distributions reinvested, from June 24, 2015 through October 31, 2019.
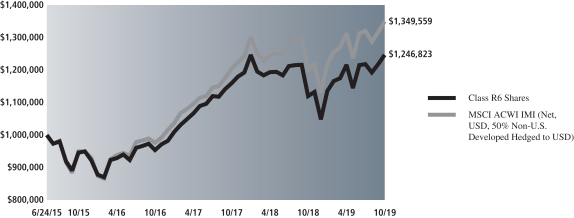
| | | | |
| Average Annual Total Return through October 31, 2019 | | One Year | | Since Inception |
|
Class R6 (Commenced June 24, 2015)* | | 11.39% | | 5.19% |
|
| * | | Effective January 16, 2018, Institutional Shares were redesignated as Class R6 Shares. These returns assume reinvestment of all distributions at NAV. Because Class R6 Shares do not involve a sales charge, such a charge is not applied to their Average Annual Total Returns. |
8
PORTFOLIO RESULTS
Goldman Sachs Multi-ManagerNon-Core Fixed Income Fund
Investment Objective
The Fund seeks a total return consisting of income and capital appreciation.
Portfolio Management Discussion and Analysis
Below, the Goldman Sachs Global Portfolio Solutions (“GPS”) and the Goldman Sachs Alternative Investments & Manager Selection (“AIMS”) Groups discuss the Goldman Sachs Multi-ManagerNon-Core Fixed Income Fund’s (the “Fund”) performance and positioning for the12-month period ended October 31, 2019 (the “Reporting Period”).
| Q | | How did the Fund perform during the Reporting Period? |
| A | | During the Reporting Period, the Fund’s Class R6 Shares generated an average annual total return of 9.03%. This return compares to the 8.91% average annual total return of the Fund’s benchmark, the Multi-ManagerNon-Core Fixed Income Composite Dynamic Index (the “Index”), during the same time period. |
| | The Index is comprised of the Bloomberg Barclays Global High Yield Corporate Index (Gross, USD, Unhedged) (the “Bloomberg Barclays Index”), the Credit Suisse Leveraged Loan Index (Gross, USD, Unhedged) (the “Credit Suisse Index”), the J.P. Morgan Emerging Market Bond Index (“EMBISM”) Global Diversified Index (Gross, USD, Unhedged) (the “J.P. Morgan EMBISM Index”) and the J.P. Morgan Government Bond Index — Emerging Markets(“GBI-EMSM”) Global Diversified Index (Gross, USD, Unhedged) (the “J.P. MorganGBI-EMSM Index”), which are weighted in accordance with the relative market capitalizations of each constituent index (as determined by the constituent index providers) as of the last business day of the previous calendar year. During the Reporting Period, the Bloomberg Barclays Index, the Credit Suisse Index, the J.P. Morgan EMBISM Index and the J.P. MorganGBI-EMSM Index returned 8.17%, 2.61%, 14.35% and 15.59%, respectively. |
| | To compare, the Fund’s previous benchmark index, the Multi-ManagerNon-Core Fixed Income Composite Index, returned 9.84% during the Reporting Period. The Multi-ManagerNon-Core Fixed Income Composite Index is comprised 40% of the Bloomberg Barclays U.S. High-Yield 2% Issuer Capped Bond Index (Gross, USD, Unhedged) (“the Bloomberg Barclays U.S. High Yield Index”), 20% of the Credit Suisse Index, 20% of the J.P. Morgan EMBISM Index and 20% of the J.P. MorganGBI-EMSM Index). For reference, the Bloomberg Barclays U.S. High Yield Index returned 8.38% during the Reporting Period. |
| Q | | What key factors were responsible for the Fund’s performance during the Reporting Period? |
| A | | The Fund uses a multi-manager approach and generally seeks to achieve its investment objective by dynamically allocating its assets among unaffiliated investment managers (“Underlying Managers”) that employ anon-core fixed income investment strategy.(Non-core fixed income includesnon-investment grade securities, bank loans and emerging markets debt). The GPS Group is responsible for the Fund’s asset allocation, wherein it applies a risk-based approach that draws from both fundamental and quantitative disciplines with the intention of dynamically accessing a diversified set of risks and returns in a market cycle aware manner. The AIMS Group is responsible for making recommendations with respect to hiring, terminating or replacing the Fund’s Underlying Managers and applying a multifaceted process for manager due diligence, portfolio construction and risk management. |
| | During the Reporting Period, the Fund recorded a positive absolute return and outperformed the Index. The Fund’s relative outperformance can be attributed to the performance of the Underlying Managers overall. Strategic asset allocation outperformed the Index during the Reporting Period. |
| | At various points during the Reporting Period, the Fund had capital allocated to seven Underlying Managers — Ares Capital Management II LLC (“Ares”), BlueBay Asset Management LLP (“BlueBay”), Brigade Capital Management, LP (“Brigade”), Lazard Asset Management LLC (“Lazard”), Marathon Asset Management, L.P. (“Marathon”), Symphony Asset Management LLC |
9
PORTFOLIO RESULTS
| | (“Symphony”) and TCW Investment Management Company LLC (“TCW”). |
| | These seven Underlying Managers represented four sectors acrossnon-core fixed income as part of the Fund’stop-level strategy allocation — high yield (Ares, Blue Bay and Brigade), bank loans (Symphony), external emerging markets debt (Lazard and Marathon) and local emerging markets debt (TCW). |
| | Of the four Underlying Managers with allocated capital for the entire Reporting Period, all four posted positive absolute returns. Ares recorded a positive absolute return between the beginning of the Reporting Period and November 7, 2018, when we redeemed it as an Underlying Manager of the Fund. Lazard produced a positive absolute return between the beginning of the Reporting Period and May 24, 2019, when we redeemed it as an Underlying Manager of the Fund. Marathon generated a positive absolute return between April 18, 2019, when it was allocated capital as an Underlying Manager of the Fund, and the end of the Reporting Period. |
| | On a relative basis, three of the four Underlying Managers with allocated capital during the entire Reporting Period underperformed their respective benchmark indices and one outperformed its benchmark index. The relative performance of Ares was not particularly meaningful, given we were in the process of redeeming it between the start of the Reporting Period and November 7, 2018. Lazard slightly underperformed its benchmark index between the beginning of the Reporting Period and May 24, 2019, when it was redeemed. Marathon performed in line with its benchmark index between April 18, 2019, when it was allocated capital, and the end of the Reporting Period. |
| | Strategic asset allocation, which reflects a longer-term perspective to diversify and invest innon-core fixed income sectors, outperformed the Index during the Reporting Period. An underweight allocation versus the Index in bank loans contributed positively, as bank loans underperformed other fixed income sectors, including high yield corporate bonds. During the Reporting Period, investor demand for bank loans was weak, and overall supply contracted. New issuance was generally stagnant due to the shift in Federal Reserve monetary policy from interest rate hikes to interest rate cuts, which reduced the incentive to issue floating rate loans. In addition, the Fund benefited during the Reporting Period from its overweight allocation to emerging markets bonds, as their spreads (or yield differentials versus other bonds of comparable maturity) tightened significantly in 2019, reversing most of the spread widening that had occurred in the second half of 2018. |
| Q | | Whichnon-core fixed income Underlying Managers most significantly affected Fund performance? |
| A | | Blue Bay, a high yield Underlying Manager, outperformed the ICE BofA Merrill Lynch Global High Yield Investment Grade Country Constrained Index, largely because of an overweight position in and favorable selection ofB-rated high yield corporate bonds. An overweight position in the financials market segment was also positive. Exposure to energy high yield corporate bonds somewhat offset these gains. |
| | Brigade, the other high yield Underlying Manager, underperformed the ICE BofA Merrill Lynch BB U.S. High Yield Constrained Index. These negative results were driven by security selection in energy and health care, which were partly offset by positive selection in retail and amongBB-rated high yield corporate bonds. |
| | Symphony, the bank loans Underlying Manager, underperformed the Credit Suisse Leveraged Loan Index during the Reporting Period. Poor selection in the financials market segment and in post-reorganization equity detracted from performance. (Reorganization equity refers to equity securities that are issued in connection with a reorganization or restructuring.) Strong credit selection within the telecommunications and consumer services market segments, as well as inB-rated credits, partially offset these negative results. |
| | TCW, the local emerging markets debt Underlying Manager, modestly underperformed the J.P. MorganGBI-EMSM Index during the Reporting Period, driven by country positioning. Trading in Turkey and an overweight in Argentina further diminished returns, though these losses were somewhat offset by an underweight in Poland and anout-of-benchmark position in Egypt, which added value. |
| | Marathon, an external emerging markets debt Underlying Manager, performed in line with the J.P. Morgan EMBISM Diversified Index between April 18, 2019, when it was allocated capital, and the end of the Reporting Period. Credit selection in Guatemala and in certain Persian Gulf countries, such as Qatar and Saudi Arabia, enhanced performance. These positive results were largely offset by weak selection in Kazakhstan and China, which detracted from returns. |
| | Lazard, an external emerging markets debt Underlying Manager, slightly underperformed the J.P. Morgan EMBISM |
10
PORTFOLIO RESULTS
| | Diversified Index from the beginning of the Reporting Period through May 24, 2019, when it was redeemed. The underperformance was driven by overweight positions in Argentina and Turkey as well as by a cash drag. Strong security selection in Asia and Europe bolstered results. |
| Q | | How did the Fund use derivatives and similar instruments during the Reporting Period? |
| A | | The Fund’s Underlying Managers employed credit default swaps, equity options, warrants, U.S. Treasury futures and forward foreign currency exchange contracts to implement their strategies. The use of forward foreign currency exchange contracts by Underlying Managers had a negative impact on the Fund’s performance, while the use of credit default swaps, equity options and warrants by Underlying Managers had a negative impact on performance. The use of U.S. Treasury futures by Underlying Managers had a neutral impact on the Fund’s results during the Reporting Period. |
| Q | | Were there any notable changes in the Fund’s allocations during the Reporting Period? |
| A | | In early November 2018, Ares capital was redeemed. We reallocated the capital to Blue Bay and Brigade. |
| | In April 2019, Marathon Asset Management, L.P. (“Marathon”) was added as an Underlying Manager of the Fund and was allocated capital during May 2019. Marathon manages a long-only, “optimal beta” strategy designed to match the J.P. MorganGBI-EMSM Index in terms of its primary risk exposures and seeks to outperform it throughbottom-up issue selection and index arbitrage. |
| | In May 2019, Lazard was redeemed and no longer served as an Underlying Manager of the Fund. We reallocated the capital to Marathon. |
| | In terms of the Fund’s strategic allocation, at the start of the Reporting Period, the Fund’s assets were allocated 41.6% to high yield corporate bonds, 25.3% to local emerging markets debt, 18.4% to external emerging markets debt and 12.7% to bank loans, with the remainder in cash and cash equivalents. Beginning in June through September 2019, we reduced the Fund’s exposure to local emerging markets debt and external emerging markets debt, while increasing its exposure to bank loans. At the same time, we increased the Fund’s exposure to high yield corporate bonds. At the end of the Reporting Period, the Fund’s assets were allocated 45.7% to high yield corporate bonds, 20.0% to bank loans, 19.1% to local emerging markets debt, 13.2% to external emerging markets debt, with the remainder in cash and cash equivalents. |
| Q | | Were there any changes to the Fund’s portfolio management team during the Reporting Period? |
| A | | Effective January 25, 2019, Tom Murray no longer served as a portfolio manager of the Fund. By design, all investment decisions for the Fund are performed within aco-lead or team structure, with multiple subject matter experts. This strategic decision making has been the cornerstone of our approach and ensures continuity in the Fund. At the end of the Reporting Period, the portfolio managers for the Fund were Neill Nuttall, KateEl-Hillow, Kent Clark and Betsy Gorton. |
| Q | | What is the Fund’s tactical view and strategy for the months ahead? |
| A | | Overall, we intend to continue to position the Fund in alignment with our longer-term strategic views on thenon-core fixed income market as a complement to additional strategic market exposures. We further intend to continue to monitor allocations and Underlying Manager performance as we seek to generate total return consisting of income and capital appreciation. |
11
PORTFOLIO RESULTS
Index Definitions
MSCI All Country World Index Investable Market Indexcaptures large- andmid-cap representation across 23 developed markets and 24 emerging markets countries.
ICE BofA Merrill Lynch BB US High Yield Constrained Indexis a modified market capitalization-weighted index of U.S. dollar denominated below investment grade corporate debt publicly issued in the U.S. domestic market.
ICE BofA Merrill Lynch Global High Yield Investment Grade Country Constrained Indexcontains all securities in the ICE BofA Merrill Lynch Global High Yield Index but caps issuer exposure at 2%. Index constituents are capitalization-weighted, based on their current amount outstanding, provided the total allocation to an individual issuer does not exceed 2%. Issuers that exceed the limit are reduced to 2% and the face value of each of their bonds is adjusted on apro-rata basis. Similarly, the face values of bonds of all other issuers that fall below the 2% cap are increased on apro-rata basis. In the event there are fewer than 50 issuers in the Index, each is equally weighted and the face values of their respective bonds are increased or decreased on apro-rata basis.
Bloomberg Barclays Global High Yield Corporate Index is a multi-currency measure of the global high yield debt market.
Bloomberg Barclays U.S. High Yield Index measures the U.S. dollar-denominated, high yield, fixed-rate corporate bond market.
Credit Suisse Leveraged Loan Index is designed to mirror the investable universe of the U.S. dollar-denominated leveraged loan market.
J.P. Morgan Emerging Market Bond Index (“EMBISM”) Global Diversified Indextracks total returns for U.S. dollar-denominated debt instruments issued by emerging market sovereign and quasi-sovereign entities.
J.P. Morgan Government Bond Index — Emerging Markets(“GBI-EMSM”) Global Diversified Index is a comprehensive local emerging markets index, consisting of regularly traded, fixed-rate, local currency government bonds.
It is not possible to invest directly in an unmanaged index.
12
FUND BASICS
Multi-Manager Non-Core Fixed Income Fund
as of October 31, 2019
| | | | | | | | |
| | TOP TEN HOLDINGS AS OF 10/31/191 |
| | | |
| | | Holding | | % of Net Assets | | | Line of Business |
| | | |
| | Brazil Notas do Tesouro Nacional | | | 0.9 | % | | Foreign Debt Obligations |
| | Indonesia Treasury Bond | | | 0.7 | | | Foreign Debt Obligations |
| | Republic of Poland | | | 0.7 | | | Foreign Debt Obligations |
| | Brazil Notas do Tesouro Nacional | | | 0.6 | | | Foreign Debt Obligations |
| | United Mexican States | | | 0.6 | | | Foreign Debt Obligations |
| | iHeartCommunications, Inc. | | | 0.6 | | | Bank Loans |
| | Republic of South Africa | | | 0.5 | | | Foreign Debt Obligations |
| | Egypt Treasury Bills | | | 0.5 | | | Foreign Debt Obligations |
| | Russian Federation Bond | | | 0.5 | | | Foreign Debt Obligations |
| | | Fidelity & Guaranty Life Holdings, Inc. | | | 0.5 | | | Corporate Obligations |
| 1 | | The Fund’s overall top 10 holdings differ from the table above due to the exclusion of the Goldman Sachs Financial Square Government Fund (a short-term investment fund), which represents approximately 8.3% of the Fund’s net assets as of 10/31/19. The top 10 holdings may not be representative of the Fund’s future investments. |

| 2 | | The percentage shown for each investment category reflects the value of investments in that category as a percentage of net assets. Figures in the graph may not sum to 100% due to the exclusion of other assets and liabilities. Underlying sector allocations of exchange traded funds and investment companies held by the Fund are not reflected in the graph above. The graph depicts the Fund’s investments but may not represent the Fund’s market exposure due to the exclusion of certain derivatives, if any, as listed in the Additional Investment Information section of the Schedule of Investments. |
For more information about your Fund, please refer to www.GSAMFUNDS.com. There, you can learn more about your Fund’s investment strategies, holdings, and performance.
13
GOLDMAN SACHS MULTI-MANAGER NON-CORE FIXED INCOME FUND
Performance Summary
October 31, 2019
The following graph shows the value, as of October 31, 2019, of a $1,000,000 investment made on March 31, 2015 (commencement of operations) in Class R6 Shares at NAV. For comparative purposes, the performance of the Fund’s current benchmark, the Multi-Manager Non-Core Fixed Income Composite Dynamic Index, which is comprised of the Bloomberg Barclays Global High Yield Corporate Index (Gross, USD, Unhedged), the Credit Suisse Leveraged Loan Index (Gross, USD, Unhedged), the J.P. Morgan EMBISM Global Diversified Index (Gross, USD, Unhedged) and the J.P. Morgan GBI-EMSM Global Diversified Index (Gross, USD, Unhedged), is shown. The performance of the Fund’s former benchmark, the Multi-Manager Non-Core Fixed Income Composite Index, which is comprised of the Bloomberg Barclays U.S.High-Yield 2% Issuer Capped Bond Index (Gross, USD, Unhedged) (40%), the Credit Suisse Leveraged Loan Index (Gross, USD, Unhedged) (20%), the J.P. Morgan EMBISM Global Diversified Index (Gross, USD, Unhedged) (20%), and the J.P. MorganGBI-EMSM Global Diversified Index (Gross, USD, Unhedged) (20%), is also shown. The Investment Adviser believes that the Multi-Manager Non-Core Fixed Income Composite Dynamic Index is a more appropriate benchmark against which to measure the performance of the Fund, as compared to the Multi-Manager Non-Core Fixed Income Composite Index. Performance reflects applicable fee waivers and/or expense limitations in effect during the periods shown and in their absence, performance would be reduced. Returns do not reflect the deduction of taxes that a shareholder would pay on Fund distributions or the redemption of Fund shares. The returns set forth below represent past performance. Past performance does not guarantee future results. The Fund’s investment return and principal value will fluctuate so that an investor’s shares, when redeemed, may be worth more or less than their original cost. Current performance may be lower or higher than the performance quoted below. Please visit our web site at www.GSAMFUNDS.com to obtain the most recent month-end returns.
|
| Goldman Sachs Non-Core Fixed Income Fund’s Lifetime Performance |
Performance of a $1,000,000 Investment, with distributions reinvested, from March 31, 2015 through October 31, 2019.
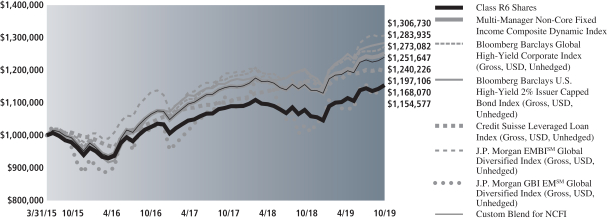
| | | | |
| Average Annual Total Return through October 31, 2019 | | One year | | Since Inception |
|
Class R6 (Commenced March 31, 2015)* | | 9.03% | | 3.18% |
|
| * | | Effective January 16, 2018, Institutional Shares were redesignated as Class R6 Shares. These returns assume reinvestment of all distributions at NAV. Because Class R6 Shares do not involve a sales charge, such a charge is not applied to their Average Annual Total Returns. |
14
PORTFOLIO RESULTS
Goldman Sachs Multi-Manager Real Assets Strategy Fund
Investment Objective
The Fund seeks to provide long-term capital growth through investments related to real assets.
Portfolio Management Discussion and Analysis
Below, the Goldman Sachs Global Portfolio Solutions (“GPS”) and the Goldman Sachs Alternative Investments & Manager Selection (“AIMS”) Groups discuss the Goldman Sachs Multi-Manager Real Assets Strategy Fund’s (the “Fund”) performance and positioning for the 12-month period ended October 31, 2019 (the “Reporting Period”).
| Q | | How did the Fund perform during the Reporting Period? |
| A | | During the Reporting Period, the Fund’s Class R6 Shares generated an average annual total return of 20.04%. This return compares to the 20.29% average annual total return of the Fund’s benchmark, the Multi-Manager Real Assets Strategy Composite Dynamic Index (the “Index”), during the same time period. |
| | | The Index is comprised of the FTSE EPRA/NAREIT Developed Index (Net, USD, Unhedged) (the “FTSE Index”) and the Dow Jones Brookfield Global Infrastructure Index (Net, USD, Unhedged) (the “Dow Jones Brookfield Index”), which are weighted in accordance with the relative market capitalizations of each constituent index (as determined by the constituent index providers) as of the last business day of the previous calendar year. During the Reporting Period, the FTSE Index and the Dow Jones Brookfield Index returned 20.48% and 19.84%, respectively. |
| | | To compare, the Fund’s previous benchmark index, the Multi-Manager Real Assets Strategy Composite Index, returned 20.21% during the Reporting Period. The Multi-Manager Real Assets Strategy Composite Index is comprised 50% of the FTSE Index and 50% of the Dow Jones Brookfield Index. |
| Q | | What key factors were responsible for the Fund’s performance during the Reporting Period? |
| A | | The Fund uses a multi-manager approach and generally seeks to achieve its investment objective by dynamically allocating its assets among unaffiliated investment managers (“Underlying Managers”) that invest primarily in real assets. (Real assets are defined broadly by the Fund and include any assets that have physical properties or inflation sensitive characteristics, such as energy, real estate, infrastructure, commodities and inflation linked or floating rate fixed income securities. Inflation is a sustained increase in prices that erodes the purchasing power of money. Assets with inflation sensitive characteristics are assets that benefit from rising real cash flows in times of rising inflation.) The GPS Group is responsible for the Fund’s asset allocation, wherein it applies a risk-based approach that draws from both fundamental and quantitative disciplines with the intention of dynamically accessing a diversified set of risks and returns in a market cycle aware manner. The AIMS Group is responsible for making recommendations with respect to hiring, terminating or replacing the Fund’s Underlying Managers and applying a multifaceted process for manager due diligence, portfolio construction and risk management. |
| | | During the Reporting Period, the Fund posted a positive absolute return but modestly underperformed the Index in relative terms. The Fund’s relative underperformance can be attributed to the performance of the Underlying Managers overall. Strategic asset allocation also underperformed the Index during the Reporting Period. |
| | | At various points during the Reporting Period, the Fund allocated capital to five Underlying Managers — Cohen & Steers Capital Management, Inc. (“Cohen & Steers”), PGIM Real Estate, a business unit of PGIM, Inc. (“PGIM Real Estate”), Presima Inc. (“Presima”), RARE Infrastructure (North America) Pty Limited (“RARE”) and RREEF America L.L.C. (“RREEF”). These five Underlying Managers represented two sectors of real assets as part of the Fund’s top-level strategy allocation — global real estate (PGIM Real Estate and Presima) and global infrastructure (Cohen & Steers, RARE and RREEF). |
| | | Of the three Underlying Managers with allocated capital during the entire Reporting Period, all three generated positive absolute returns. RARE recorded a positive absolute return between the beginning of the Reporting Period and July 26, 2019 when we redeemed it as an Underlying |
15
PORTFOLIO RESULTS
| | Manager of the Fund. Cohen & Steers posted a positive absolute return between May 9, 2019, when it was allocated capital as an Underlying Manager of the Fund, and the end of the Reporting Period. |
| | | On a relative basis, two of the Underlying Managers with allocated capital during the entire Reporting Period outperformed their respective benchmark indices, while one generally performed in line with its benchmark index. RARE underperformed its benchmark index between the start of the Reporting Period and July 26, 2019, when it was redeemed. Cohen & Steers underperformed its benchmark index between May 9, 2019, when it was allocated capital, and the end of the Reporting Period. |
| | | Strategic asset allocation, which reflects a longer-term perspective to diversify and invest across real assets, underperformed the Index during the Reporting Period. The underperformance was due to the Fund’s modest allocation to cash, which was a drag on returns, as global real estate securities and global infrastructure securities experienced a strong rally during the Reporting Period overall. In the first quarter of 2019, the Federal Reserve’s dovish tone promoted a positive relationship between real estate investment trusts’ (“REITs”) returns and long-term interest rates. (Dovish tends to suggest lower interest rates; opposite of hawkish.) Meanwhile, commercial property prices continued to rise, and the increase in prices of multifamily properties contributed to low vacancy rates and high rents. Furthermore, weak investor risk appetite supported the more defensive parts of the capital markets, including real estate securities as well as certain global infrastructure securities, such as those in the utilities sector. |
| Q | | Which real assets asset classes most significantly affected Fund performance? |
| A | | In global real estate, which we measure against the FTSE EPRA/NAREIT Developed Index, Underlying Manager PGIM Real Estate outperformed the benchmark index during the Reporting Period. An overweight position in and strong stock selection among U.S. industrial REITs contributed most positively to relative returns. Stock selection within U.S. health care REITS, as well as an underweight in U.S. mall REITs, also added to results. |
| | | Global real estate Underlying Manager Presima was relatively neutral in its performance versus its benchmark index during the Reporting Period. An overweight position and strong selection in residential and industrial REITs were largely offset by weaker selection within retail and office REITs. Regionally, strong selection within Asia and, to a lesser extent, Europe was counterbalanced by weaker selection in North America. |
| | | In global infrastructure, which we measure against the Dow Jones Brookfield Global Infrastructure Index, Underlying Manager RREEF outperformed the benchmark index, as strong stock selection in European communications and transport companies bolstered returns, slightly offset by weak selection among North American utilities. |
| | | Global infrastructure Underlying Manager RARE lagged its benchmark index from the beginning of the Reporting Period until it was redeemed on July 26, 2019. An underweight position in towers and in communications infrastructure, along with poor stock selection in industrials, detracted from relative returns. On the positive side, an underweight in energy added to performance. Regionally, stock selection within the emerging markets and an overweight in the U.K. diminished results, while stock selection in North America contributed positively. |
| | | Cohen & Steers, another global infrastructure Underlying Manager, underperformed its benchmark index between May 9, 2019, when it was allocated capital, and the end of the Reporting Period. Weak stock selection in midstream energy companies was the largest relative detractor, although this was slightly offset by an overweight position and strong stock selection within communications, which added value. (The midstream component of the energy industry is usually defined as those companies providing products or services that help link the supply side, i.e. energy producers, and the demand side, i.e. energy end-users, for any type of energy commodity. Such midstream businesses can include, but are not limited to, those that process, store, market and transport various energy commodities.) |
| Q | | How did the Fund use derivatives and similar instruments during the Reporting Period? |
| A | | Forward foreign currency exchange contracts were used by Underlying Managers to facilitate equity transactions settling in foreign currencies. Rights were employed to give the Fund the opportunity, but not the obligation, to buy additional shares of a specific security at a discount. The use of these derivatives and similar instruments had a rather neutral impact on performance during the Reporting Period. |
16
PORTFOLIO RESULTS
| Q | | Were there any notable changes in the Fund’s allocations during the Reporting Period? |
| A | | In April 2019, Cohen & Steers was added as an Underlying Manager of the Fund and, in May 2019, was allocated capital. Cohen & Steers takes a total return relative-value approach to investing in global infrastructure securities. |
| | | In July 2019, RARE was redeemed and no longer served as an Underlying Manager of the Fund. We reallocated the capital to Cohen & Steers. |
| | | In terms of the Fund’s strategic asset allocation, the Fund’s assets were allocated 60% to global real estate and 39% to global infrastructure, with the remainder in cash and cash equivalents, at the beginning of the Reporting Period. In September and October 2019, we slightly increased the Fund’s exposure to global infrastructure securities by reducing its exposure to global real estate securities. In our view, global real estate securities had a less attractive risk/return profile than they did earlier in the Reporting Period. At the end of the Reporting Period, the Fund’s assets were allocated 54.2% to global real estate and 44.3% to global infrastructure, with the remainder in cash and cash equivalents. |
| Q | | Were there any changes to the Fund’s portfolio management team during the Reporting Period? |
| A | | There were no changes to the Fund’s portfolio management team during the Reporting Period. |
| Q | | What is the Fund’s tactical view and strategy for the months ahead? |
| A | | Overall, we intend to continue to position the Fund in alignment with our longer-term strategic views on the real assets complex as a complement to additional strategic market exposures. We further intend to continue to monitor allocations and Underlying Manager performance as we seek to generate long-term capital growth through investments related to real assets. |
17
FUND BASICS
Multi-Manager Real Assets Strategy Fund
as of October 31, 2019
| | | | | | | | |
| | TOP TEN EQUITY HOLDINGS AS OF 10/31/191 |
| | | |
| | | Holding | | % of Net Assets | | | Line of Business |
| | | |
| | Prologis, Inc. | | | 3.3 | % | | Equity Real Estate Investment Trusts (REITs) |
| | American Tower Corp. | | | 3.3 | | | Equity Real Estate Investment Trusts (REITs) |
| | AvalonBay Communities, Inc. | | | 2.6 | | | Equity Real Estate Investment Trusts (REITs) |
| | Enbridge, Inc. | | | 2.6 | | | Oil, Gas & Consumable Fuels |
| | Crown Castle International Corp. | | | 2.2 | | | Equity Real Estate Investment Trusts (REITs) |
| | TC Energy Corp. | | | 2.1 | | | Oil, Gas & Consumable Fuels |
| | Vinci SA | | | 2.1 | | | Construction & Engineering |
| | SBA Communications Corp. | | | 1.8 | | | Equity Real Estate Investment Trusts (REITs) |
| | Equity LifeStyle Properties, Inc. | | | 1.7 | | | Equity Real Estate Investment Trusts (REITs) |
| | | Mitsui Fudosan Co. Ltd. | | �� | 1.6 | | | Real Estate Management & Development |
| 1 | | The Fund’s overall top 10 holdings differ from the table above due to the exclusion of the Goldman Sachs Financial Square Government Fund (a short-term investment fund), which represents approximately 1.8% of the Fund’s net assets as of 10/31/19. The top 10 holdings may not be representative of the Fund’s future investments. |
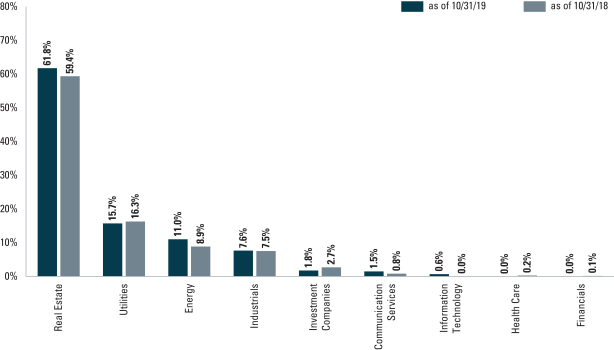
| 2 | | The Fund is actively managed and, as such, its composition may differ over time. Consequently, the Fund’s overall sector allocations may differ from the percentages contained in the graph above. The graph generally categorizes investments using the Global Industry Classification Standard (“GICS”), however, the sector classifications used by the portfolio management team may differ from GICS. Underlying sector allocations of investment companies held by the Fund are not reflected in the graph above. The percentage shown for each investment category reflects the value of investments in that category as a percentage of market value. The graph depicts the Fund’s investments but may not represent the Fund’s market exposure due to the exclusion of certain derivatives, if any, as listed in the Additional Investment Information section of the Schedule of Investments. |
For more information about your Fund, please refer to www.GSAMFUNDS.com. There, you can learn more about your Fund’s investment strategies, holdings, and performance.
18
GOLDMAN SACHS MULTI-MANAGER REAL ASSETS STRATEGY FUND
Performance Summary
October 31, 2019
The following graph shows the value, as of October 31, 2019, of a $1,000,000 investment made on June 30, 2015 (commencement of operations) in Class R6 Shares at NAV. For comparative purposes, the performance of the Fund’s current benchmark, the Multi-Manager Real Assets Strategy Composite Dynamic Index, which is comprised of the FTSE EPRA/NAREIT Developed Index (Net, USD, Unhedged) and the Dow Jones Brookfield Global Infrastructure Index (Net, USD, Unhedged), is shown. The Fund’s former benchmark, the Multi-Manager Real Assets Strategy Composite Index, which is comprised of the FTSE EPRA/NAREIT Developed Index (Net, USD, Unhedged) (50%) and the Dow Jones Brookfield Global Infrastructure Index (Net, USD, Unhedged) (50%), is also shown. The Investment Adviser believes that the Multi-Manager Real Assets Strategy Composite Dynamic Index is a more appropriate benchmark against which to measure the performance of the Fund, as compared to the Multi-Manager Real Assets Strategy Composite Index. Until December 31, 2015, the S&P GSCI® (Net, USD, Unhedged) comprised 20% of the Fund’s former benchmark, the Multi-Manager Real Assets Strategy Composite Index (with each other index comprising 40% of the Index.). Performance reflects applicable fee waivers and/or expense limitations in effect during the periods shown and in their absence, performance would be reduced. Returns do not reflect the deduction of taxes that a shareholder would pay on Fund distributions or the redemption of Fund shares. The returns set forth below represent past performance. Past performance does not guarantee future results. The Fund’s investment return and principal value will fluctuate so that an investor’s shares, when redeemed, may be worth more or less than their original cost. Current performance may be lower or higher than the performance quoted below. Please visit our web site at www.GSAMFUNDS.com to obtain the most recent month-end returns.
|
| Goldman Sachs Multi-Manager Real Assets Strategy Fund’s Lifetime Performance |
Performance of a $1,000,000 Investment, with distributions reinvested, from June 30, 2015 through October 31, 2019.
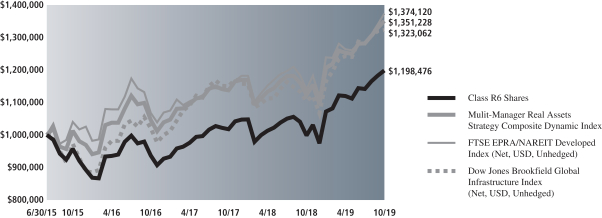
| | | | |
| Average Annual Total Return through October 31, 2019 | | One Year | | Since Inception |
|
Class R6 (Commenced June 30, 2015)* | | 20.04% | | 4.26% |
|
| * | | Effective January 16, 2018, Institutional Shares were redesignated as Class R6 Shares. These returns assume reinvestment of all distributions at NAV. Because Class R6 Shares do not involve a sales charge, such a charge is not applied to their Average Annual Total Returns. |
19
PORTFOLIO RESULTS
Index Definitions
MSCI All Country World Index Investable Market Index captures large- and mid-cap representation across 23 developed markets and 24 emerging markets countries.
FTSE EPRA/NAREIT Developed Index is designed to track the performance of listed real estate companies and real estate investment trusts (“REITs”) worldwide. The index incorporates REITs and real estate holding & development companies.
Dow Jones Brookfield Global Infrastructure Index intends to measure the stock performance of pure-play infrastructure companies domiciled globally. The index covers all sectors of the infrastructure market. Components are required to have more than 70% of cash flows derived from infrastructure lines of business.
It is not possible to invest directly in an unmanaged index.
20
GOLDMAN SACHS MULTI-MANAGER GLOBAL EQUITY FUND
Schedule of Investments
October 31, 2019
| | | | | | | | |
Shares | | | Description | | Value | |
|
| Common Stocks – 83.4% | |
| Argentina – 0.0% | |
| | 961 | | | Banco Macro SA ADR (Banks) | | $ | 22,007 | |
| | 5,929 | | | Grupo Financiero Galicia SA ADR (Banks) | | | 68,539 | |
| | | | | | | | |
| | | | | | | 90,546 | |
| | |
| Australia – 0.7% | |
| | 1,551 | | | AGL Energy Ltd. (Multi-Utilities) | | | 21,172 | |
| | 3,487 | | | ALS Ltd. (Professional Services) | | | 19,393 | |
| | 843 | | | Ansell Ltd. (Health Care Equipment & Supplies) | | | 16,031 | |
| | 2,992 | | | APA Group (Gas Utilities) | | | 24,032 | |
| | 5,598 | | | Appen Ltd. (IT Services) | | | 84,105 | |
| | 10,586 | | | Aurizon Holdings Ltd. (Road & Rail) | | | 43,066 | |
| | 21,977 | | | AusNet Services (Electric Utilities) | | | 28,073 | |
| | 1,640 | | | Bank of Queensland Ltd. (Banks) | | | 10,235 | |
| | 68,362 | | | Beach Energy Ltd. (Oil, Gas & Consumable Fuels) | | | 107,532 | |
| | 1,548 | | | Bendigo & Adelaide Bank Ltd. (Banks) | | | 11,361 | |
| | 361 | | | BHP Group Ltd. (Metals & Mining) | | | 8,849 | |
| | 1,194 | | | BlueScope Steel Ltd. (Metals & Mining) | | | 10,930 | |
| | 2,050 | | | Boral Ltd. (Construction Materials) | | | 7,117 | |
| | 2,839 | | | Brambles Ltd. (Commercial Services & Supplies) | | | 23,470 | |
| | 883 | | | Caltex Australia Ltd. (Oil, Gas & Consumable Fuels) | | | 16,599 | |
| | 17,742 | | | Charter Hall Group (Equity Real Estate Investment Trusts (REITs)) | | | 138,244 | |
| | 814 | | | CIMIC Group Ltd. (Construction & Engineering) | | | 18,550 | |
| | 5,458 | | | Coca-Cola Amatil Ltd. (Beverages) | | | 38,302 | |
| | 3,233 | | | Computershare Ltd. (IT Services) | | | 35,290 | |
| | 3,402 | | | Crown Resorts Ltd. (Hotels, Restaurants & Leisure) | | | 29,225 | |
| | 6,134 | | | CSL Ltd. (Biotechnology) | | | 1,081,769 | |
| | 2,536 | | | Dexus (Equity Real Estate Investment Trusts (REITs)) | | | 20,913 | |
| | 26,832 | | | Downer EDI Ltd. (Commercial Services & Supplies) | | | 149,241 | |
| | 4,794 | | | Fortescue Metals Group Ltd. (Metals & Mining) | | | 29,342 | |
| | 2,273 | | | Goodman Group (Equity Real Estate Investment Trusts (REITs)) | | | 22,569 | |
| | 12,693 | | | Incitec Pivot Ltd. (Chemicals) | | | 30,202 | |
| | 3,120 | | | Insurance Australia Group Ltd. (Insurance) | | | 17,095 | |
| | 921 | | | LendLease Group (Real Estate Management & Development) | | | 11,905 | |
| | 105 | | | Macquarie Group Ltd. (Capital Markets) | | | 9,695 | |
| | 5,120 | | | Mirvac Group (Equity Real Estate Investment Trusts (REITs)) | | | 11,345 | |
| | 184 | | | National Australia Bank Ltd. (Banks) | | | 3,612 | |
| | 1,248 | | | Newcrest Mining Ltd. (Metals & Mining) | | | 27,242 | |
| | 93,727 | | | Nine Entertainment Co. Holdings Ltd. (Media) | | | 118,924 | |
| | 12,063 | | | Northern Star Resources Ltd. (Metals & Mining) | | | 81,767 | |
| | |
|
| Common Stocks – (continued) | |
| Australia – (continued) | |
| | 1,954 | | | Orica Ltd. (Chemicals) | | | 30,880 | |
| | 2,021 | | | Origin Energy Ltd. (Oil, Gas & Consumable Fuels) | | | 10,957 | |
| | 6,493 | | | Orora Ltd. (Containers & Packaging) | | | 13,840 | |
| | 51,890 | | | Perenti Global Ltd. (Metals & Mining) | | | 81,742 | |
| | 3,304 | | | QBE Insurance Group Ltd. (Insurance) | | | 28,746 | |
| | 8,832 | | | Qube Holdings Ltd. (Transportation Infrastructure) | | | 19,802 | |
| | 166 | | | Rio Tinto Ltd. (Metals & Mining) | | | 10,380 | |
| | 6,842 | | | Santos Ltd. (Oil, Gas & Consumable Fuels) | | | 38,271 | |
| | 48,277 | | | Saracen Mineral Holdings Ltd.* (Metals & Mining) | | | 124,913 | |
| | 6,816 | | | Scentre Group (Equity Real Estate Investment Trusts (REITs)) | | | 18,009 | |
| | 9,582 | | | Seven Network Ltd. (Trading Companies & Distributors) | | | 123,850 | |
| | 614 | | | Sonic Healthcare Ltd. (Health Care Providers & Services) | | | 12,093 | |
| | 3,975 | | | South32 Ltd. (Metals & Mining) | | | 6,956 | |
| | 23,741 | | | Spark Infrastructure Group (Electric Utilities) | | | 33,107 | |
| | 2,280 | | | Suncorp Group Ltd. (Insurance) | | | 21,169 | |
| | 17,177 | | | Super Retail Group Ltd. (Specialty Retail) | | | 112,845 | |
| | 6,321 | | | Tabcorp Holdings Ltd. (Hotels, Restaurants & Leisure) | | | 20,946 | |
| | 9,648 | | | Telstra Corp. Ltd. (Diversified Telecommunication Services) | | | 23,237 | |
| | 4,727 | | | The GPT Group (Equity Real Estate Investment Trusts (REITs)) | | | 19,403 | |
| | 7,744 | | | The Star Entertainment Grp Ltd. (Hotels, Restaurants & Leisure) | | | 25,110 | |
| | 512 | | | Transurban Group (Transportation Infrastructure) | | | 5,244 | |
| | 14,025 | | | Vicinity Centres (Equity Real Estate Investment Trusts (REITs)) | | | 25,816 | |
| | 642 | | | Wesfarmers Ltd. (Multiline Retail) | | | 17,639 | |
| | 630 | | | Woodside Petroleum Ltd. (Oil, Gas & Consumable Fuels) | | | 13,963 | |
| | 1,007 | | | Woolworths Group Ltd. (Food & Staples Retailing) | | | 25,967 | |
| | 771 | | | Worley Ltd. (Energy Equipment & Services) | | | 7,237 | |
| | | | | | | | |
| | | | | | | 3,179,319 | |
| | |
| Austria – 0.1% | |
| | 749 | | | ANDRITZ AG (Machinery) | | | 33,680 | |
| | 2,485 | | | BAWAG Group AG*(a) (Banks) | | | 102,706 | |
| | 2,260 | | | CA Immobilien Anlagen AG (Real Estate Management & Development) | | | 87,084 | |
| | 2,848 | | | IMMOFINANZ AG* (Real Estate Management & Development) | | | 81,882 | |
| | 528 | | | OMV AG (Oil, Gas & Consumable Fuels) | | | 30,868 | |
| | |
| | |
| The accompanying notes are an integral part of these financial statements. | | 21 |
GOLDMAN SACHS MULTI-MANAGER GLOBAL EQUITY FUND
Schedule of Investments(continued)
October 31, 2019
| | | | | | | | |
Shares | | | Description | | Value | |
|
| Common Stocks – (continued) | |
| Austria – (continued) | |
| | 1,222 | | | Raiffeisen Bank International AG (Banks) | | $ | 30,109 | |
| | 5,321 | | | S&T AG (Technology Hardware, Storage & Peripherals) | | | 113,476 | |
| | 724 | | | voestalpine AG (Metals & Mining) | | | 18,167 | |
| | | | | | | | |
| | | | | | | 497,972 | |
| | |
| Belgium – 0.3% | |
| | 192 | | | Ackermans & van Haaren NV (Diversified Financial Services) | | | 29,433 | |
| | 1,110 | | | Ageas (Insurance) | | | 64,014 | |
| | 384 | | | Groupe Bruxelles Lambert SA (Diversified Financial Services) | | | 38,575 | |
| | 9,730 | | | KBC Group NV (Banks) | | | 684,158 | |
| | 5,477 | | | Proximus SADP (Diversified Telecommunication Services) | | | 168,312 | |
| | 198 | | | Solvay SA (Chemicals) | | | 21,528 | |
| | 1,070 | | | UCB SA (Pharmaceuticals) | | | 86,241 | |
| | | | | | | | |
| | | | | | | 1,092,261 | |
| | |
| Brazil – 0.6% | |
| | 400 | | | Ambev SA (Beverages) | | | 1,733 | |
| | 48,568 | | | Ambev SA ADR (Beverages) | | | 209,328 | |
| | 24,149 | | | B3 SA – Brasil Bolsa Balcao (Capital Markets) | | | 291,317 | |
| | 51,924 | | | Banco do Brasil SA (Banks) | | | 623,399 | |
| | 3,964 | | | BR Malls Participacoes SA (Real Estate Management & Development) | | | 15,172 | |
| | 7,935 | | | BRF SA* (Food Products) | | | 70,259 | |
| | 1,600 | | | Centrais Eletricas Brasileiras SA (Electric Utilities) | | | 15,783 | |
| | 500 | | | Cia de Saneamento Basico do Estado de Sao Paulo (Water Utilities) | | | 6,810 | |
| | 40,345 | | | Cia Siderurgica Nacional SA (Metals & Mining) | | | 118,706 | |
| | 8,029 | | | Cosan SA (Oil, Gas & Consumable Fuels) | | | 115,695 | |
| | 1,000 | | | Engie Brasil Energia SA (Independent Power and Renewable Electricity Producers) | | | 11,285 | |
| | 717 | | | Equatorial Energia SA (Electric Utilities) | | | 18,214 | |
| | 19,445 | | | Even Construtora e Incorporadora SA* (Household Durables) | | | 59,104 | |
| | 1,800 | | | Hypera SA (Pharmaceuticals) | | | 15,404 | |
| | 8,698 | | | Iochpe Maxion SA (Machinery) | | | 37,824 | |
| | 1,500 | | | IRB Brasil Resseguros S/A (Insurance) | | | 14,134 | |
| | 41,489 | | | JBS SA (Food Products) | | | 292,663 | |
| | 670 | | | Lojas Renner SA (Multiline Retail) | | | 8,478 | |
| | 1,464 | | | Magazine Luiza SA (Multiline Retail) | | | 16,295 | |
| | 1,600 | | | Natura Cosmeticos SA (Personal Products) | | | 12,431 | |
| | 800 | | | Notre Dame Intermedica Participacoes SA (Health Care Providers & Services) | | | 11,969 | |
| | 8,974 | | | Qualicorp Consultoria e Corretora de Seguros SA (Health Care Providers & Services) | | | 71,380 | |
| | |
|
| Common Stocks – (continued) | |
| Brazil – (continued) | |
| | 67,112 | | | TIM Participacoes SA (Wireless Telecommunication Services) | | | 191,103 | |
| | 47,405 | | | Vale SA* (Metals & Mining) | | | 557,915 | |
| | 1,794 | | | WEG SA (Electrical Equipment) | | | 11,407 | |
| | 700 | | | YDUQS Part (Diversified Consumer Services) | | | 6,851 | |
| | | | | | | | |
| | | | | | | 2,804,659 | |
| | |
| Cambodia – 0.0% | |
| | 36,000 | | | NagaCorp Ltd. (Hotels, Restaurants & Leisure) | | | 65,415 | |
| | |
| Canada – 2.8% | |
| | 462 | | | Agnico Eagle Mines Ltd. (Metals & Mining) | | | 28,395 | |
| | 3,100 | | | Air Canada* (Airlines) | | | 110,386 | |
| | 4,733 | | | Algonquin Power & Utilities Corp. (Multi-Utilities) | | | 65,006 | |
| | 550 | | | Alimentation Couche-Tard, Inc. Class B (Food & Staples Retailing) | | | 16,495 | |
| | 2,900 | | | Allied Properties Real Estate Investment Trust (Equity Real Estate Investment Trusts (REITs)) | | | 117,973 | |
| | 931 | | | AltaGas Ltd. (Gas Utilities) | | | 13,543 | |
| | 6,300 | | | ATS Automation Tooling Systems, Inc.* (Machinery) | | | 85,524 | |
| | 2,250 | | | Badger Daylighting Ltd. (Construction & Engineering) | | | 66,658 | |
| | 578 | | | Bank of Montreal (Banks) | | | 42,787 | |
| | 1,031 | | | Barrick Gold Corp. (Metals & Mining) | | | 17,910 | |
| | 536 | | | BCE, Inc. (Diversified Telecommunication Services) | | | 25,427 | |
| | 11,546 | | | Brookfield Asset Management, Inc. Class A (Capital Markets) | | | 637,933 | |
| | 5,086 | | | CAE, Inc. (Aerospace & Defense) | | | 127,546 | |
| | 118,655 | | | Cameco Corp. (Oil, Gas & Consumable Fuels) | | | 1,059,584 | |
| | 4,386 | | | Canadian Apartment Properties REIT (Equity Real Estate Investment Trusts (REITs)) | | | 182,620 | |
| | 4,648 | | | Canadian Imperial Bank of Commerce (Banks) | | | 396,338 | |
| | 9,032 | | | Canadian National Railway Co. (Road & Rail) | | | 807,210 | |
| | 146 | | | Canadian Natural Resources Ltd. (Oil, Gas & Consumable Fuels) | | | 3,681 | |
| | 4,039 | | | Canadian Pacific Railway Ltd. (Road & Rail) | | | 918,119 | |
| | 219 | | | Canadian Tire Corp. Ltd. Class A (Multiline Retail) | | | 23,609 | |
| | 6,100 | | | Capital Power Corp. (Independent Power and Renewable Electricity Producers) | | | 146,213 | |
| | 451 | | | CGI, Inc.* (IT Services) | | | 35,057 | |
| | 699 | | | CI Financial Corp. (Capital Markets) | | | 10,174 | |
| | 18 | | | Constellation Software, Inc. (Software) | | | 17,778 | |
| | 7,600 | | | Detour Gold Corp.* (Metals & Mining) | | | 126,195 | |
| | |
| | |
| 22 | | The accompanying notes are an integral part of these financial statements. |
GOLDMAN SACHS MULTI-MANAGER GLOBAL EQUITY FUND
| | | | | | | | |
Shares | | | Description | | Value | |
|
| Common Stocks – (continued) | |
| Canada – (continued) | |
| | 9,173 | | | Dollarama, Inc. (Multiline Retail) | | $ | 308,599 | |
| | 1,520 | | | Emera, Inc. (Electric Utilities) | | | 62,930 | |
| | 5,411 | | | Empire Co. Ltd. Class A (Food & Staples Retailing) | | | 143,666 | |
| | 1,000 | | | Enbridge, Inc. (Oil, Gas & Consumable Fuels) | | | 36,421 | |
| | 175,980 | | | Encana Corp. (Oil, Gas & Consumable Fuels) | | | 689,436 | |
| | 28,092 | | | Enerplus Corp. (Oil, Gas & Consumable Fuels) | | | 169,497 | |
| | 17,959 | | | Entertainment One Ltd. (Entertainment) | | | 129,700 | |
| | 17 | | | Fairfax Financial Holdings Ltd. (Insurance) | | | 7,202 | |
| | 2,142 | | | Finning International, Inc. (Trading Companies & Distributors) | | | 36,478 | |
| | 1,861 | | | First Capital Realty, Inc. (Real Estate Management & Development) | | | 30,802 | |
| | 480 | | | First Quantum Minerals Ltd. (Metals & Mining) | | | 4,056 | |
| | 1,450 | | | Fortis, Inc. (Electric Utilities) | | | 60,241 | |
| | 395 | | | George Weston Ltd. (Food & Staples Retailing) | | | 31,625 | |
| | 13,587 | | | Gildan Activewear, Inc. (Textiles, Apparel & Luxury Goods) | | | 347,128 | |
| | 2,803 | | | Great-West Lifeco, Inc. (Insurance) | | | 68,165 | |
| | 8,066 | | | H&R Real Estate Investment Trust (Equity Real Estate Investment Trusts (REITs)) | | | 136,444 | |
| | 19,540 | | | Hudbay Minerals, Inc. (Metals & Mining) | | | 70,914 | |
| | 1,979 | | | Husky Energy, Inc. (Oil, Gas & Consumable Fuels) | | | 13,823 | |
| | 3,688 | | | Hydro One Ltd.(a) (Electric Utilities) | | | 68,574 | |
| | 1,020 | | | Imperial Oil Ltd. (Oil, Gas & Consumable Fuels) | | | 25,401 | |
| | 729 | | | Inter Pipeline Ltd. (Oil, Gas & Consumable Fuels) | | | 12,238 | |
| | 8,600 | | | Interfor Corp.* (Paper & Forest Products) | | | 102,513 | |
| | 14,369 | | | International Petroleum Corp.* (Oil, Gas & Consumable Fuels) | | | 49,767 | |
| | 4,400 | | | Keyera Corp. (Oil, Gas & Consumable Fuels) | | | 101,991 | |
| | 1,500 | | | Kinaxis, Inc.* (Software) | | | 95,790 | |
| | 8,806 | | | Kinross Gold Corp.* (Metals & Mining) | | | 42,790 | |
| | 2,100 | | | Kirkland Lake Gold Ltd. (Metals & Mining) | | | 98,614 | |
| | 376 | | | Loblaw Cos. Ltd. (Food & Staples Retailing) | | | 20,052 | |
| | 23,843 | | | Lundin Mining Corp. (Metals & Mining) | | | 120,383 | |
| | 329 | | | Magna International, Inc. (Auto Components) | | | 17,690 | |
| | 28,059 | | | Manulife Financial Corp. (Insurance) | | | 522,578 | |
| | 368 | | | Methanex Corp. (Chemicals) | | | 13,945 | |
| | 713 | | | Metro, Inc. (Food & Staples Retailing) | | | 30,153 | |
| | |
|
| Common Stocks – (continued) | |
| Canada – (continued) | |
| | 381 | | | National Bank of Canada (Banks) | | | 19,676 | |
| | 2,900 | | | Northview Apartment Real Estate Investment Trust (Equity Real Estate Investment Trusts (REITs)) | | | 63,544 | |
| | 2,380 | | | Novanta, Inc.* (Electronic Equipment, Instruments & Components) | | | 211,939 | |
| | 378 | | | Nutrien Ltd. (Chemicals) | | | 18,084 | |
| | 415 | | | Onex Corp. (Diversified Financial Services) | | | 24,397 | |
| | 849 | | | Open Text Corp. (Software) | | | 34,306 | |
| | 6,900 | | | Parex Resources, Inc.* (Oil, Gas & Consumable Fuels) | | | 93,512 | |
| | 880 | | | Parkland Fuel Corp. (Oil, Gas & Consumable Fuels) | | | 29,231 | |
| | 354 | | | Pembina Pipeline Corp. (Oil, Gas & Consumable Fuels) | | | 12,463 | |
| | 1,085 | | | Power Corp. of Canada (Insurance) | | | 25,109 | |
| | 1,736 | | | Power Financial Corp. (Insurance) | | | 40,596 | |
| | 794 | | | PrairieSky Royalty Ltd. (Oil, Gas & Consumable Fuels) | | | 7,753 | |
| | 345 | | | Restaurant Brands International, Inc. (Hotels, Restaurants & Leisure) | | | 22,571 | |
| | 2,789 | | | RioCan Real Estate Investment Trust (Equity Real Estate Investment Trusts (REITs)) | | | 55,966 | |
| | 7,771 | | | Ritchie Bros. Auctioneers, Inc. (Commercial Services & Supplies) | | | 319,544 | |
| | 567 | | | Rogers Communications, Inc. Class B (Wireless Telecommunication Services) | | | 26,695 | |
| | 235 | | | Royal Bank of Canada (Banks) | | | 18,956 | |
| | 348 | | | Saputo, Inc. (Food Products) | | | 10,093 | |
| | 1,977 | | | Shaw Communications, Inc. Class B (Media) | | | 40,348 | |
| | 2,795 | | | Shopify, Inc. Class A* (IT Services) | | | 876,428 | |
| | 745 | | | Sun Life Financial, Inc. (Insurance) | | | 33,423 | |
| | 18,374 | | | Suncor Energy, Inc. (Oil, Gas & Consumable Fuels) | | | 546,296 | |
| | 18,000 | | | Tamarack Valley Energy Ltd.* (Oil, Gas & Consumable Fuels) | | | 23,233 | |
| | 300 | | | TC Energy Corp. (Oil, Gas & Consumable Fuels) | | | 15,122 | |
| | 783 | | | Teck Resources Ltd. Class B (Metals & Mining) | | | 12,377 | |
| | 484 | | | TELUS Corp. (Diversified Telecommunication Services) | | | 17,216 | |
| | 4,100 | | | TFI International, Inc. (Road & Rail) | | | 130,648 | |
| | 226 | | | The Bank of Nova Scotia (Banks) | | | 12,962 | |
| | 2,900 | | | The Descartes Systems Group, Inc.* (Software) | | | 112,843 | |
| | 4,100 | | | The Stars Group, Inc.* (Hotels, Restaurants & Leisure) | | | 89,216 | |
| | 465 | | | Thomson Reuters Corp. (Professional Services) | | | 31,248 | |
| | 13,700 | | | TORC Oil & Gas Ltd. (Oil, Gas & Consumable Fuels) | | | 34,950 | |
| | |
| | |
| The accompanying notes are an integral part of these financial statements. | | 23 |
GOLDMAN SACHS MULTI-MANAGER GLOBAL EQUITY FUND
Schedule of Investments(continued)
October 31, 2019
| | | | | | | | |
Shares | | | Description | | Value | |
|
| Common Stocks – (continued) | |
| Canada – (continued) | |
| | 2,250 | | | Toromont Industries Ltd. (Trading Companies & Distributors) | | $ | 116,181 | |
| | 2,110 | | | Tourmaline Oil Corp. (Oil, Gas & Consumable Fuels) | | | 18,103 | |
| | 951 | | | Vermilion Energy, Inc. (Oil, Gas & Consumable Fuels) | | | 12,564 | |
| | 217 | | | Waste Connections, Inc. (Commercial Services & Supplies) | | | 20,044 | |
| | 446 | | | West Fraser Timber Co. Ltd. (Paper & Forest Products) | | | 20,622 | |
| | 38,423 | | | Wheaton Precious Metals Corp. (Metals & Mining) | | | 1,078,512 | |
| | 680 | | | WSP Global, Inc. (Construction & Engineering) | | | 42,428 | |
| | | | | | | | |
| | | | | | | 13,070,966 | |
| | |
| Chile – 0.0% | |
| | 28,322 | | | Aguas Andinas SA Class A (Water Utilities) | | | 12,985 | |
| | 1,906 | | | Banco de Chile (Banks) | | | 245 | |
| | 8,260 | | | Cencosud SA (Food & Staples Retailing) | | | 11,206 | |
| | 1,725 | | | Cia Cervecerias Unidas SA (Beverages) | | | 17,213 | |
| | 3,212 | | | Empresas CMPC SA (Paper & Forest Products) | | | 7,341 | |
| | 1,681 | | | Empresas COPEC SA (Oil, Gas & Consumable Fuels) | | | 15,031 | |
| | 57,785 | | | Enel Americas SA (Electric Utilities) | | | 10,826 | |
| | 55,314 | | | Enel Chile SA (Electric Utilities) | | | 4,553 | |
| | 2,450,448 | | | Itau CorpBanca (Banks) | | | 14,869 | |
| | 250 | | | Latam Airlines Group SA (Airlines) | | | 2,765 | |
| | 3,370 | | | Parque Arauco SA (Real Estate Management & Development) | | | 8,871 | |
| | 606 | | | SACI Falabella (Multiline Retail) | | | 3,082 | |
| | | | | | | | |
| | | | | | | 108,987 | |
| | |
| China – 3.0% | |
| | 875 | | | 58.Com, Inc. ADR* (Interactive Media & Services) | | | 46,209 | |
| | 1,243,224 | | | Agricultural Bank of China Ltd. Class H (Banks) | | | 511,591 | |
| | 9,881 | | | Alibaba Group Holding Ltd. ADR* (Internet & Direct Marketing Retail) | | | 1,745,676 | |
| | 56,989 | | | Anhui Conch Cement Co. Ltd. Class H (Construction Materials) | | | 340,608 | |
| | 67,535 | | | ANTA Sports Products Ltd. (Textiles, Apparel & Luxury Goods) | | | 660,635 | |
| | 439 | | | Autohome, Inc. ADR* (Interactive Media & Services) | | | 37,122 | |
| | 10,978 | | | Baidu, Inc. ADR* (Interactive Media & Services) | | | 1,118,109 | |
| | 1,899,037 | | | Bank of China Ltd. Class H (Banks) | | | 774,398 | |
| | 261,363 | | | Bank of Communications Co. Ltd. Class H (Banks) | | | 178,497 | |
| | |
|
| Common Stocks – (continued) | |
| China – (continued) | |
| | 146,000 | | | CGN Power Co. Ltd. Class H(a) (Independent Power and Renewable Electricity Producers) | | | 37,919 | |
| | 144,802 | | | China Aoyuan Group Ltd. (Real Estate Management & Development) | | | 185,047 | |
| | 467,011 | | | China Cinda Asset Management Co. Ltd. Class H (Capital Markets) | | | 96,880 | |
| | 129,042 | | | China CITIC Bank Corp. Ltd. Series H (Banks) | | | 74,801 | |
| | 30,541 | | | China Communications Construction Co. Ltd. Class H (Construction & Engineering) | | | 23,249 | |
| | 10,500 | | | China Conch Venture Holdings Ltd. (Machinery) | | | 41,085 | |
| | 74,515 | | | China Construction Bank Corp. Class H (Banks) | | | 59,707 | |
| | 303,709 | | | China Everbright Bank Co. Ltd. Class H (Banks) | | | 139,757 | |
| | 5,000 | | | China Evergrande Group* (Real Estate Management & Development) | | | 12,171 | |
| | 130,162 | | | China Galaxy Securities Co. Ltd. Class H (Capital Markets) | | | 66,368 | |
| | 178,425 | | | China Huarong Asset Management Co. Ltd. Class H(a) (Capital Markets) | | | 26,342 | |
| | 113,000 | | | China Huishan Dairy Holdings Co. Ltd.*(b) (Food Products) | | | — | |
| | 45,652 | | | China Lesso Group Holdings Ltd. (Building Products) | | | 47,141 | |
| | 36,033 | | | China Life Insurance Co. Ltd. Class H (Insurance) | | | 92,666 | |
| | 83,532 | | | China Medical System Holdings Ltd. (Pharmaceuticals) | | | 113,280 | |
| | 8,000 | | | China Mengniu Dairy Co. Ltd.* (Food Products) | | | 31,894 | |
| | 2,500 | | | China Merchants Bank Co. Ltd. Class H (Banks) | | | 11,923 | |
| | 416,433 | | | China Minsheng Banking Corp. Ltd. Class H (Banks) | | | 291,283 | |
| | 350,370 | | | China National Building Material Co. Ltd. Class H (Construction Materials) | | | 295,300 | |
| | 121,695 | | | China Oilfield Services Ltd. Class H (Energy Equipment & Services) | | | 169,433 | |
| | 61,265 | | | China Oriental Group Co. Ltd. (Metals & Mining) | | | 21,381 | |
| | 19,957 | | | China Pacific Insurance Group Co. Ltd. Class H (Insurance) | | | 72,410 | |
| | 333,726 | | | China Petroleum & Chemical Corp. Class H (Oil, Gas & Consumable Fuels) | | | 189,815 | |
| | 37,444 | | | China Railway Group Ltd. Class H (Construction & Engineering) | | | 22,568 | |
| | 8,500 | | | China Shenhua Energy Co. Ltd. Class H (Oil, Gas & Consumable Fuels) | | | 17,263 | |
| | 41,245 | | | China Shineway Pharmaceutical Group Ltd. (Pharmaceuticals) | | | 39,690 | |
| | 617,632 | | | China Telecom Corp. Ltd. Class H (Diversified Telecommunication Services) | | | 262,746 | |
| | |
| | |
| 24 | | The accompanying notes are an integral part of these financial statements. |
GOLDMAN SACHS MULTI-MANAGER GLOBAL EQUITY FUND
| | | | | | | | |
Shares | | | Description | | Value | |
|
| Common Stocks – (continued) | |
| China – (continued) | |
| | 100,000 | | | China Tower Corp. Ltd. Class H(a) (Diversified Telecommunication Services) | | $ | 22,009 | |
| | 67,136 | | | Country Garden Services Holdings Co. Ltd. (Commercial Services & Supplies) | | | 227,482 | |
| | 40,000 | | | CRRC Corp. Ltd. Class H (Machinery) | | | 26,753 | |
| | 34,000 | | | Dongfeng Motor Group Co. Ltd. Class H (Automobiles) | | | 34,106 | |
| | 3,300 | | | ENN Energy Holdings Ltd. (Gas Utilities) | | | 37,648 | |
| | 27,000 | | | Great Wall Motor Co. Ltd. Class H (Automobiles) | | | 21,877 | |
| | 11,755 | | | Guangzhou Automobile Group Co. Ltd. Class H (Automobiles) | | | 11,740 | |
| | 13,633 | | | Guangzhou Baiyunshan Pharmaceutical Holdings Co. Ltd. Class H (Pharmaceuticals) | | | 43,119 | |
| | 68,271 | | | Guangzhou R&F Properties Co. Ltd. Class H (Real Estate Management & Development) | | | 105,783 | |
| | 104,318 | | | Haitong Securities Co. Ltd. Class H (Capital Markets) | | | 106,499 | |
| | 3,500 | | | Hengan International Group Co. Ltd. (Personal Products) | | | 24,437 | |
| | 32,000 | | | Huaneng Power International, Inc. Class H (Independent Power and Renewable Electricity Producers) | | | 15,199 | |
| | 9,400 | | | Huatai Securities Co. Ltd. Class H(a) (Capital Markets) | | | 13,972 | |
| | 432,011 | | | Industrial and Commercial Bank of China Ltd. Class H (Banks) | | | 309,490 | |
| | 9,483 | | | JD.com, Inc. ADR* (Internet & Direct Marketing Retail) | | | 295,395 | |
| | 74,225 | | | Li Ning Co. Ltd. (Textiles, Apparel & Luxury Goods) | | | 251,684 | |
| | 6,000 | | | Longfor Group Holdings Ltd.(a) (Real Estate Management & Development) | | | 24,901 | |
| | 92,699 | | | Luye Pharma Group Ltd.(a) (Pharmaceuticals) | | | 68,518 | |
| | 1,954 | | | NetEase, Inc. ADR (Entertainment) | | | 558,570 | |
| | 82,626 | | | New China Life Insurance Co. Ltd. Class H (Insurance) | | | 320,686 | |
| | 944 | | | New Oriental Education & Technology Group, Inc. ADR* (Diversified Consumer Services) | | | 115,225 | |
| | 54,000 | | | PetroChina Co. Ltd. Class H (Oil, Gas & Consumable Fuels) | | | 26,334 | |
| | 16,000 | | | PICC Property and Casualty Co. Ltd. Class H (Insurance) | | | 20,248 | |
| | 1,243 | | | Pinduoduo, Inc. ADR* (Internet & Direct Marketing Retail) | | | 50,814 | |
| | 4,008 | | | Ping An Insurance Group Co. of China Ltd. Class H (Insurance) | | | 46,259 | |
| | 31,000 | | | Postal Savings Bank of China Co. Ltd. Class H(a) (Banks) | | | 19,876 | |
| | 8,805 | | | Qudian, Inc. ADR* (Consumer Finance) | | | 61,019 | |
| | |
|
| Common Stocks – (continued) | |
| China – (continued) | |
| | 18,500 | | | Semiconductor Manufacturing International Corp.* (Semiconductors & Semiconductor Equipment) | | | 23,500 | |
| | 70,939 | | | Sinopharm Group Co. Ltd. Class H (Health Care Providers & Services) | | | 254,050 | |
| | 36,215 | | | Sinotruk Hong Kong Ltd. (Machinery) | | | 54,723 | |
| | 43,038 | | | Tencent Holdings Ltd. (Interactive Media & Services) | | | 1,745,747 | |
| | 761,119 | | | The People’s Insurance Co. Group of China Ltd. Class H (Insurance) | | | 320,563 | |
| | 91,996 | | | Tianneng Power International Ltd. (Auto Components) | | | 60,093 | |
| | 8,000 | | | Tingyi Cayman Islands Holding Corp. (Food Products) | | | 10,642 | |
| | 4,000 | | | Tsingtao Brewery Co. Ltd. Class H (Beverages) | | | 23,180 | |
| | 4,000 | | | Want Want China Holdings Ltd. (Food Products) | | | 3,370 | |
| | 241 | | | Weibo Corp. ADR* (Interactive Media & Services) | | | 11,855 | |
| | 122,137 | | | Weichai Power Co. Ltd. Class H (Machinery) | | | 192,246 | |
| | 138,500 | | | Yanzhou Coal Mining Co. Ltd. Class H (Oil, Gas & Consumable Fuels) | | | 140,518 | |
| | 20,960 | | | YiChang HEC ChangJiang Pharmaceutical Co. Ltd. Class H(a) (Pharmaceuticals) | | | 128,564 | |
| | 281 | | | YY, Inc. ADR* (Interactive Media & Services) | | | 15,972 | |
| | 6,800 | | | Zhuzhou CRRC Times Electric Co. Ltd. Class H (Electrical Equipment) | | | 25,232 | |
| | | | | | | | |
| | | | | | | 13,724,862 | |
| | |
| Colombia – 0.0% | |
| | 23,759 | | | Ecopetrol SA (Oil, Gas & Consumable Fuels) | | | 21,369 | |
| | 3,251 | | | Grupo Argos SA (Construction Materials) | | | 17,601 | |
| | 1,613 | | | Grupo de Inversiones Suramericana SA (Diversified Financial Services) | | | 16,321 | |
| | 2,345 | | | Interconexion Electrica SA ESP (Electric Utilities) | | | 13,529 | |
| | | | | | | | |
| | | | | | | 68,820 | |
| | |
| Czech Republic – 0.0% | |
| | 868 | | | CEZ AS (Electric Utilities) | | | 19,800 | |
| | 176 | | | Komercni banka AS (Banks) | | | 5,948 | |
| | | | | | | | |
| | | | | | | 25,748 | |
| | |
| Denmark – 0.5% | |
| | 21 | | | AP Moller – Maersk A/S Class B (Marine) | | | 26,788 | |
| | 2,684 | | | Carlsberg A/S Class B (Beverages) | | | 377,972 | |
| | 4,752 | | | Chr Hansen Holding A/S (Chemicals) | | | 364,838 | |
| | 336 | | | Coloplast A/S Class B (Health Care Equipment & Supplies) | | | 40,453 | |
| | |
| | |
| The accompanying notes are an integral part of these financial statements. | | 25 |
GOLDMAN SACHS MULTI-MANAGER GLOBAL EQUITY FUND
Schedule of Investments(continued)
October 31, 2019
| | | | | | | | |
Shares | | | Description | | Value | |
|
| Common Stocks – (continued) | |
| Denmark – (continued) | |
| | 5,115 | | | DSV PANALPINA A/S (Air Freight & Logistics) | | $ | 497,122 | |
| | 805 | | | GN Store Nord A/S (Health Care Equipment & Supplies) | | | 35,414 | |
| | 1,600 | | | ISS A/S (Commercial Services & Supplies) | | | 41,890 | |
| | 13,980 | | | Novo Nordisk A/S Class B (Pharmaceuticals) | | | 768,742 | |
| | 1,005 | | | Orsted A/S(a) (Electric Utilities) | | | 88,211 | |
| | 523 | | | Pandora A/S (Textiles, Apparel & Luxury Goods) | | | 25,735 | |
| | 2,175 | | | Royal Unibrew A/S (Beverages) | | | 178,435 | |
| | | | | | | | |
| | | | | | | 2,445,600 | |
| | |
| Finland – 0.1% | |
| | 1,193 | | | Elisa Oyj (Diversified Telecommunication Services) | | | 65,157 | |
| | 2,661 | | | Fortum Oyj (Electric Utilities) | | | 65,029 | |
| | 728 | | | Kesko Oyj Class B (Food & Staples Retailing) | | | 48,505 | |
| | 1,047 | | | Kone Oyj Class B (Machinery) | | | 66,669 | |
| | 3,583 | | | Metso Oyj (Machinery) | | | 135,641 | |
| | 958 | | | Neste Oyj (Oil, Gas & Consumable Fuels) | | | 34,615 | |
| | 6,291 | | | Nokia Oyj (Communications Equipment) | | | 23,094 | |
| | 1,108 | | | Nokian Renkaat Oyj (Auto Components) | | | 31,666 | |
| | 3,123 | | | Stora Enso Oyj Class R (Paper & Forest Products) | | | 40,573 | |
| | 1,217 | | | UPM-Kymmene Oyj (Paper & Forest Products) | | | 39,637 | |
| | 1,258 | | | Wartsila Oyj Abp (Machinery) | | | 13,290 | |
| | | | | | | | |
| | | | | | | 563,876 | |
| | |
| France – 3.5% | |
| | 173 | | | Aeroports de Paris (Transportation Infrastructure) | | | 32,903 | |
| | 12,693 | | | Air France-KLM* (Airlines) | | | 151,307 | |
| | 8,381 | | | Air Liquide SA (Chemicals) | | | 1,114,346 | |
| | 1,260 | | | Alstom SA (Machinery) | | | 54,512 | |
| | 75 | | | Amundi SA(a) (Capital Markets) | | | 5,360 | |
| | 1,180 | | | Arkema SA (Chemicals) | | | 120,759 | |
| | 311 | | | Atos SE (IT Services) | | | 24,136 | |
| | 2,899 | | | AXA SA (Insurance) | | | 76,740 | |
| | 22,522 | | | BNP Paribas SA (Banks) | | | 1,176,989 | |
| | 6,579 | | | Bollore SA (Air Freight & Logistics) | | | 28,500 | |
| | 1,029 | | | Bouygues SA (Construction & Engineering) | | | 43,648 | |
| | 1,328 | | | Bureau Veritas SA (Professional Services) | | | 33,952 | |
| | 341 | | | Capgemini SE (IT Services) | | | 38,441 | |
| | 36,084 | | | Carrefour SA (Food & Staples Retailing) | | | 614,350 | |
| | 409 | | | Cie de Saint-Gobain (Building Products) | | | 16,658 | |
| | 219 | | | Cie Generale des Etablissements Michelin SCA (Auto Components) | | | 26,665 | |
| | 1,353 | | | CNP Assurances (Insurance) | | | 26,856 | |
| | |
|
| Common Stocks – (continued) | |
| France – (continued) | |
| | 1,624 | | | Covivio (Equity Real Estate Investment Trusts (REITs)) | | | 183,917 | |
| | 1,104 | | | Credit Agricole SA (Banks) | | | 14,405 | |
| | 10,323 | | | Danone SA (Food Products) | | | 855,170 | |
| | 5 | | | Dassault Aviation SA (Aerospace & Defense) | | | 6,946 | |
| | 1,678 | | | Dassault Systemes SE (Software) | | | 254,849 | |
| | 356 | | | Eiffage SA (Construction & Engineering) | | | 38,237 | |
| | 4,439 | | | Electricite de France SA (Electric Utilities) | | | 45,859 | |
| | 29,035 | | | Engie SA (Multi-Utilities) | | | 486,184 | |
| | 9,403 | | | EssilorLuxottica SA (Textiles, Apparel & Luxury Goods) | | | 1,435,784 | |
| | 323 | | | Eurazeo SE (Diversified Financial Services) | | | 22,538 | |
| | 386 | | | Gecina SA (Equity Real Estate Investment Trusts (REITs)) | | | 66,264 | |
| | 242 | | | Hermes International (Textiles, Apparel & Luxury Goods) | | | 174,325 | |
| | 1,201 | | | ICADE (Equity Real Estate Investment Trusts (REITs)) | | | 117,606 | |
| | 2,416 | | | Ingenico Group SA (Electronic Equipment, Instruments & Components) | | | 258,345 | |
| | 153 | | | Ipsen SA (Pharmaceuticals) | | | 16,308 | |
| | 65 | | | Kering SA (Textiles, Apparel & Luxury Goods) | | | 36,985 | |
| | 548 | | | Klepierre SA (Equity Real Estate Investment Trusts (REITs)) | | | 20,427 | |
| | 3,299 | | | Korian SA (Health Care Providers & Services) | | | 139,901 | |
| | 1,716 | | | L’Oreal SA (Personal Products) | | | 501,178 | |
| | 5,018 | | | Legrand SA (Electrical Equipment) | | | 392,026 | |
| | 4,137 | | | LVMH Moet Hennessy Louis Vuitton SE (Textiles, Apparel & Luxury Goods) | | | 1,766,729 | |
| | 4,900 | | | Natixis SA (Capital Markets) | | | 22,512 | |
| | 3,603 | | | Orange SA (Diversified Telecommunication Services) | | | 57,988 | |
| | 1,156 | | | Orpea (Health Care Providers & Services) | | | 139,232 | |
| | 7,877 | | | Pernod Ricard SA (Beverages) | | | 1,455,143 | |
| | 2,444 | | | Peugeot SA (Automobiles) | | | 61,897 | |
| | 570 | | | Publicis Groupe SA (Media) | | | 24,532 | |
| | 436 | | | Renault SA (Automobiles) | | | 22,262 | |
| | 14,881 | | | Rexel SA (Trading Companies & Distributors) | | | 184,487 | |
| | 3,073 | | | Rubis SCA (Gas Utilities) | | | 178,196 | |
| | 164 | | | Safran SA (Aerospace & Defense) | | | 25,976 | |
| | 653 | | | Sanofi (Pharmaceuticals) | | | 60,198 | |
| | 12,400 | | | Schneider Electric SE (Electrical Equipment) | | | 1,152,460 | |
| | 1,247 | | | SCOR SE (Insurance) | | | 52,597 | |
| | 785 | | | Societe Generale SA (Banks) | | | 22,325 | |
| | 171 | | | Sodexo SA (Hotels, Restaurants & Leisure) | | | 18,805 | |
| | 623 | | | Sopra Steria Group (IT Services) | | | 85,520 | |
| | |
| | |
| 26 | | The accompanying notes are an integral part of these financial statements. |
GOLDMAN SACHS MULTI-MANAGER GLOBAL EQUITY FUND
| | | | | | | | |
Shares | | | Description | | Value | |
|
| Common Stocks – (continued) | |
| France – (continued) | |
| | 4,743 | | | SPIE SA (Commercial Services & Supplies) | | $ | 100,103 | |
| | 3,090 | | | Suez (Multi-Utilities) | | | 48,196 | |
| | 203 | | | Teleperformance (Professional Services) | | | 46,057 | |
| | 203 | | | Thales SA (Aerospace & Defense) | | | 19,845 | |
| | 23,368 | | | TOTAL SA (Oil, Gas & Consumable Fuels) | | | 1,235,424 | |
| | 5,600 | | | Ubisoft Entertainment SA* (Entertainment) | | | 330,956 | |
| | 150 | | | Unibail-Rodamco-Westfield (Equity Real Estate Investment Trusts (REITs)) | | | 23,195 | |
| | 1,538 | | | Veolia Environnement SA (Multi-Utilities) | | | 40,486 | |
| | 1,911 | | | Vivendi SA (Entertainment) | | | 53,217 | |
| | 51 | | | Wendel SA (Diversified Financial Services) | | | 7,232 | |
| | | | | | | | |
| | | | | | | 15,888,946 | |
| | |
| Germany – 3.1% | |
| | 2,858 | | | adidas AG (Textiles, Apparel & Luxury Goods) | | | 882,467 | |
| | 99 | | | Allianz SE (Insurance) | | | 24,178 | |
| | 6,821 | | | alstria office REIT AG (Equity Real Estate Investment Trusts (REITs)) | | | 127,805 | |
| | 27,120 | | | BASF SE (Chemicals) | | | 2,061,641 | |
| | 21,846 | | | Bayer AG (Pharmaceuticals) | | | 1,694,729 | |
| | 340 | | | Bayerische Motoren Werke AG (Automobiles) | | | 26,035 | |
| | 1,287 | | | Bechtle AG (IT Services) | | | 139,375 | |
| | 7,087 | | | Beiersdorf AG (Personal Products) | | | 839,023 | |
| | 464 | | | Brenntag AG (Trading Companies & Distributors) | | | 23,256 | |
| | 434 | | | Carl Zeiss Meditec AG (Health Care Equipment & Supplies) | | | 47,308 | |
| | 15,758 | | | CECONOMY AG* (Specialty Retail) | | | 79,298 | |
| | 3,428 | | | Commerzbank AG (Banks) | | | 20,512 | |
| | 897 | | | CompuGroup Medical SE (Health Care Technology) | | | 57,424 | |
| | 174 | | | Continental AG (Auto Components) | | | 23,306 | |
| | 320 | | | Covestro AG(a) (Chemicals) | | | 15,367 | |
| | 355 | | | Daimler AG (Automobiles) | | | 20,751 | |
| | 159 | | | Delivery Hero SE*(a) (Internet & Direct Marketing Retail) | | | 7,461 | |
| | 2,313 | | | Deutsche Bank AG (Capital Markets) | | | 16,773 | |
| | 2,605 | | | Deutsche Boerse AG (Capital Markets) | | | 403,409 | |
| | 2,015 | | | Deutsche Lufthansa AG (Airlines) | | | 34,906 | |
| | 28,673 | | | Deutsche Post AG (Air Freight & Logistics) | | | 1,015,742 | |
| | 1,591 | | | Deutsche Telekom AG (Diversified Telecommunication Services) | | | 27,995 | |
| | 1,425 | | | Deutsche Wohnen SE (Real Estate Management & Development) | | | 53,726 | |
| | 12,839 | | | Deutz AG (Machinery) | | | 71,432 | |
| | 1,096 | | | Evonik Industries AG (Chemicals) | | | 28,884 | |
| | 4,254 | | | Evotec SE* (Life Sciences Tools & Services) | | | 97,441 | |
| | |
|
| Common Stocks – (continued) | |
| Germany – (continued) | |
| | 278 | | | Fraport AG Frankfurt Airport Services Worldwide (Transportation Infrastructure) | | | 23,236 | |
| | 360 | | | GEA Group AG (Machinery) | | | 11,005 | |
| | 320 | | | Hannover Rueck SE (Insurance) | | | 56,705 | |
| | 340 | | | HeidelbergCement AG (Construction Materials) | | | 25,207 | |
| | 316 | | | HUGO BOSS AG (Textiles, Apparel & Luxury Goods) | | | 13,323 | |
| | 13,288 | | | Infineon Technologies AG (Semiconductors & Semiconductor Equipment) | | | 257,372 | |
| | 1,146 | | | K&S AG (Chemicals) | | | 16,273 | |
| | 291 | | | LANXESS AG (Chemicals) | | | 18,909 | |
| | 1,884 | | | LEG Immobilien AG (Real Estate Management & Development) | | | 216,404 | |
| | 4,360 | | | Merck KGaA (Pharmaceuticals) | | | 520,002 | |
| | 977 | | | MTU Aero Engines AG (Aerospace & Defense) | | | 261,280 | |
| | 103 | | | Muenchener Rueckversicherungs-Gesellschaft AG in Muenchen (Insurance) | | | 28,617 | |
| | 722 | | | OSRAM Licht AG (Electrical Equipment) | | | 32,210 | |
| | 20,853 | | | ProSiebenSat.1 Media SE (Media) | | | 307,927 | |
| | 351 | | | Puma SE (Textiles, Apparel & Luxury Goods) | | | 26,405 | |
| | 1,422 | | | Rheinmetall AG (Industrial Conglomerates) | | | 171,503 | |
| | 17,384 | | | SAP SE (Software) | | | 2,303,405 | |
| | 2,421 | | | Scout24 AG(a) (Interactive Media & Services) | | | 150,069 | |
| | 12,020 | | | Siemens AG (Industrial Conglomerates) | | | 1,387,108 | |
| | 524 | | | Siemens Healthineers AG(a) (Health Care Equipment & Supplies) | | | 22,263 | |
| | 902 | | | Sixt SE (Road & Rail) | | | 88,208 | |
| | 1,510 | | | Stroeer SE & Co. KGaA (Media) | | | 121,658 | |
| | 313 | | | Symrise AG (Chemicals) | | | 30,081 | |
| | 1,170 | | | Uniper SE (Independent Power and Renewable Electricity Producers) | | | 36,465 | |
| | 324 | | | United Internet AG (Diversified Telecommunication Services) | | | 9,781 | |
| | 1,421 | | | Vonovia SE (Real Estate Management & Development) | | | 75,675 | |
| | | | | | | | |
| | | | | | | 14,051,335 | |
| | |
| Greece – 0.0% | |
| | 13,880 | | | Eurobank Ergasias SA* (Banks) | | | 14,071 | |
| | 249 | | | Hellenic Telecommunications Organization SA (Diversified Telecommunication Services) | | | 3,776 | |
| | 653 | | | JUMBO SA (Specialty Retail) | | | 12,722 | |
| | 443 | | | Motor Oil Hellas Corinth Refineries SA (Oil, Gas & Consumable Fuels) | | | 10,956 | |
| | 2,263 | | | National Bank of Greece SA* (Banks) | | | 7,675 | |
| | |
| | |
| The accompanying notes are an integral part of these financial statements. | | 27 |
GOLDMAN SACHS MULTI-MANAGER GLOBAL EQUITY FUND
Schedule of Investments(continued)
October 31, 2019
| | | | | | | | |
Shares | | | Description | | Value | |
|
| Common Stocks – (continued) | |
| Greece – (continued) | |
| | 1,355 | | | OPAP SA (Hotels, Restaurants & Leisure) | | $ | 14,736 | |
| | | | | | | | |
| | | | | | | 63,936 | |
| | |
| Hong Kong – 1.5% | |
| | 189,108 | | | AIA Group Ltd. (Insurance) | | | 1,883,179 | |
| | 1,000 | | | ASM Pacific Technology Ltd. (Semiconductors & Semiconductor Equipment) | | | 13,963 | |
| | 7,000 | | | Beijing Enterprises Holdings Ltd. (Gas Utilities) | | | 32,959 | |
| | 40,000 | | | Beijing Enterprises Water Group Ltd.* (Water Utilities) | | | 20,849 | |
| | 53,105 | | | Bosideng International Holdings Ltd. (Textiles, Apparel & Luxury Goods) | | | 27,461 | |
| | 6,000 | | | China Jinmao Holdings Group Ltd. (Real Estate Management & Development) | | | 3,989 | |
| | 201,162 | | | China Merchants Port Holdings Co. Ltd. (Transportation Infrastructure) | | | 314,523 | |
| | 196,872 | | | China Mobile Ltd. (Wireless Telecommunication Services) | | | 1,599,919 | |
| | 31,301 | | | China Overseas Land & Investment Ltd. (Real Estate Management & Development) | | | 98,770 | |
| | 10,000 | | | China Resources Beer Holdings Co. Ltd. (Beverages) | | | 51,270 | |
| | 8,000 | | | China Resources Gas Group Ltd. (Gas Utilities) | | | 48,234 | |
| | 2,000 | | | China Resources Land Ltd. (Real Estate Management & Development) | | | 8,506 | |
| | 23,000 | | | China Resources Pharmaceutical Group Ltd.(a) (Pharmaceuticals) | | | 21,241 | |
| | 16,000 | | | China Resources Power Holdings Co. Ltd. (Independent Power and Renewable Electricity Producers) | | | 20,108 | |
| | 404,892 | | | China South City Holdings Ltd. (Real Estate Management & Development) | | | 46,930 | |
| | 143,363 | | | China Unicom Hong Kong Ltd. (Diversified Telecommunication Services) | | | 141,141 | |
| | 479,322 | | | CITIC Ltd. (Industrial Conglomerates) | | | 630,540 | |
| | 1,500 | | | CK Asset Holdings Ltd. (Real Estate Management & Development) | | | 10,437 | |
| | 2,500 | | | CK Hutchison Holdings Ltd. (Industrial Conglomerates) | | | 23,083 | |
| | 5,500 | | | CLP Holdings Ltd. (Electric Utilities) | | | 57,120 | |
| | 344,560 | | | CNOOC Ltd. (Oil, Gas & Consumable Fuels) | | | 512,791 | |
| | 2,000 | | | Dairy Farm International Holdings Ltd. (Food & Staples Retailing) | | | 12,060 | |
| | 14,000 | | | Guangdong Investment Ltd. (Water Utilities) | | | 30,300 | |
| | 4,000 | | | Haier Electronics Group Co. Ltd. (Household Durables) | | | 11,420 | |
| | |
|
| Common Stocks – (continued) | |
| Hong Kong – (continued) | |
| | 6,000 | | | Hang Lung Group Ltd. (Real Estate Management & Development) | | | 15,028 | |
| | 7,000 | | | Hang Lung Properties Ltd. (Real Estate Management & Development) | | | 15,387 | |
| | 2,000 | | | Henderson Land Development Co. Ltd. (Real Estate Management & Development) | | | 9,989 | |
| | 18,183 | | | Hong Kong & China Gas Co. Ltd. (Gas Utilities) | | | 35,291 | |
| | 3,200 | | | Hongkong Land Holdings Ltd. (Real Estate Management & Development) | | | 17,579 | |
| | 17,000 | | | Hysan Development Co. Ltd. (Real Estate Management & Development) | | | 67,001 | |
| | 500 | | | Jardine Matheson Holdings Ltd. (Industrial Conglomerates) | | | 28,505 | |
| | 600 | | | Jardine Strategic Holdings Ltd. (Industrial Conglomerates) | | | 19,375 | |
| | 46,000 | | | Kunlun Energy Co. Ltd. (Gas Utilities) | | | 42,814 | |
| | 80,000 | | | Lenovo Group Ltd. (Technology Hardware, Storage & Peripherals) | | | 55,771 | |
| | 4,000 | | | Link REIT (Equity Real Estate Investment Trusts (REITs)) | | | 43,566 | |
| | 45,000 | | | Melco International Development Ltd. (Hotels, Restaurants & Leisure) | | | 119,265 | |
| | 1,837 | | | MTR Corp. Ltd. (Road & Rail) | | | 10,533 | |
| | 8,071 | | | New World Development Co. Ltd. (Real Estate Management & Development) | | | 11,545 | |
| | 18,945 | | | NWS Holdings Ltd. (Industrial Conglomerates) | | | 28,195 | |
| | 46,000 | | | PCCW Ltd. (Diversified Telecommunication Services) | | | 27,320 | |
| | 6,000 | | | Power Assets Holdings Ltd. (Electric Utilities) | | | 42,817 | |
| | 5,018 | | | Shimao Property Holdings Ltd. (Real Estate Management & Development) | | | 16,811 | |
| | 193,470 | | | Sino Biopharmaceutical Ltd. (Pharmaceuticals) | | | 288,056 | |
| | 15,467 | | | Sino Land Co. Ltd. (Real Estate Management & Development) | | | 23,121 | |
| | 1,000 | | | Sun Hung Kai Properties Ltd. (Real Estate Management & Development) | | | 15,153 | |
| | 2,500 | | | Swire Pacific Ltd. Class A (Real Estate Management & Development) | | | 23,831 | |
| | 11,600 | | | Swire Properties Ltd. (Real Estate Management & Development) | | | 36,483 | |
| | 2,000 | | | Techtronic Industries Co. Ltd. (Machinery) | | | 15,630 | |
| | 7,000 | | | The Wharf Holdings Ltd. (Real Estate Management & Development) | | | 15,885 | |
| | 2,000 | | | Vitasoy International Holdings Ltd. (Food Products) | | | 8,133 | |
| | 25,000 | | | WH Group Ltd.(a) (Food Products) | | | 26,388 | |
| | 3,000 | | | Wharf Real Estate Investment Co. Ltd. (Real Estate Management & Development) | | | 17,645 | |
| | 3,000 | | | Wheelock & Co. Ltd. (Real Estate Management & Development) | | | 18,554 | |
| | |
| | |
| 28 | | The accompanying notes are an integral part of these financial statements. |
GOLDMAN SACHS MULTI-MANAGER GLOBAL EQUITY FUND
| | | | | | | | |
Shares | | | Description | | Value | |
|
| Common Stocks – (continued) | |
| Hong Kong – (continued) | |
| | 14,000 | | | Xinyi Glass Holdings Ltd. (Auto Components) | | $ | 15,741 | |
| | 36,544 | | | Yue Yuen Industrial Holdings Ltd. (Textiles, Apparel & Luxury Goods) | | | 102,988 | |
| | | | | | | | |
| | | | | | | 6,835,193 | |
| | |
| Hungary – 0.0% | |
| | 2,097 | | | MOL Hungarian Oil & Gas PLC (Oil, Gas & Consumable Fuels) | | | 20,738 | |
| | 409 | | | OTP Bank Nyrt (Banks) | | | 18,862 | |
| | 936 | | | Richter Gedeon Nyrt (Pharmaceuticals) | | | 17,347 | |
| | | | | | | | |
| | | | | | | 56,947 | |
| | |
| India – 1.1% | |
| | 64,263 | | | Adani Power Ltd.* (Independent Power and Renewable Electricity Producers) | | | 59,743 | |
| | 3,587 | | | Ambuja Cements Ltd. (Construction Materials) | | | 10,221 | |
| | 362 | | | Apollo Hospitals Enterprise Ltd. (Health Care Providers & Services) | | | 7,574 | |
| | 473 | | | Asian Paints Ltd. (Chemicals) | | | 12,057 | |
| | 1,201 | | | Aurobindo Pharma Ltd. (Pharmaceuticals) | | | 7,956 | |
| | 661 | | | Axis Bank Ltd. (Banks) | | | 6,849 | |
| | 615 | | | Bajaj Auto Ltd. (Automobiles) | | | 28,130 | |
| | 119 | | | Bajaj Finserv Ltd. (Insurance) | | | 13,639 | |
| | 4,263 | | | Bata India Ltd. (Textiles, Apparel & Luxury Goods) | | | 108,503 | |
| | 104,784 | | | Bharat Electronics Ltd. (Aerospace & Defense) | | | 174,269 | |
| | 709 | | | Bharti Airtel Ltd. (Wireless Telecommunication Services) | | | 3,741 | |
| | 12,207 | | | Bharti Infratel Ltd. (Diversified Telecommunication Services) | | | 32,624 | |
| | 575 | | | Britannia Industries Ltd. (Food Products) | | | 26,452 | |
| | 3,757 | | | Cipla Ltd. (Pharmaceuticals) | | | 24,717 | |
| | 2,936 | | | Coal India Ltd. (Oil, Gas & Consumable Fuels) | | | 8,577 | |
| | 4,832 | | | Dabur India Ltd. (Personal Products) | | | 31,437 | |
| | 586 | | | Dr Reddy’s Laboratories Ltd. (Pharmaceuticals) | | | 23,007 | |
| | 106,996 | | | Federal Bank Ltd. (Banks) | | | 126,231 | |
| | 4,613 | | | GAIL India Ltd. (Gas Utilities) | | | 8,922 | |
| | 6,601 | | | Gujarat Narmada Valley Fertilizers & Chemicals Ltd. (Chemicals) | | | 20,153 | |
| | 871 | | | Havells India Ltd. (Electrical Equipment) | | | 8,486 | |
| | 1,852 | | | HCL Technologies Ltd. (IT Services) | | | 30,360 | |
| | 4,849 | | | HDFC Asset Management Co. Ltd.(a) (Capital Markets) | | | 204,396 | |
| | 13,003 | | | HDFC Bank Ltd. ADR (Banks) | | | 794,353 | |
| | 40 | | | Hero MotoCorp Ltd. (Automobiles) | | | 1,523 | |
| | 3,276 | | | Hindalco Industries Ltd. (Metals & Mining) | | | 8,660 | |
| | |
|
| Common Stocks – (continued) | |
| India – (continued) | |
| | 11,155 | | | Hindustan Petroleum Corp. Ltd. (Oil, Gas & Consumable Fuels) | | | 50,993 | |
| | 749 | | | Hindustan Unilever Ltd. (Household Products) | | | 22,957 | |
| | 13,528 | | | Housing Development Finance Corp. Ltd. (Thrifts & Mortgage Finance) | | | 406,003 | |
| | 3,445 | | | Indian Oil Corp. Ltd. (Oil, Gas & Consumable Fuels) | | | 7,116 | |
| | 69,441 | | | Indraprastha Gas Ltd. (Gas Utilities) | | | 382,925 | |
| | 6,433 | | | InterGlobe Aviation Ltd.(a) (Airlines) | | | 131,835 | |
| | 6,504 | | | ITC Ltd. (Tobacco) | | | 23,604 | |
| | 15,945 | | | Just Dial Ltd.* (Interactive Media & Services) | | | 132,328 | |
| | 288 | | | Larsen & Toubro Ltd. (Construction & Engineering) | | | 5,975 | |
| | 2,886 | | | LIC Housing Finance Ltd. (Thrifts & Mortgage Finance) | | | 16,763 | |
| | 1,224 | | | Lupin Ltd. (Pharmaceuticals) | | | 12,858 | |
| | 7,605 | | | Mahanagar Gas Ltd. (Gas Utilities) | | | 109,186 | |
| | 473 | | | Mahindra & Mahindra Ltd. (Automobiles) | | | 4,040 | |
| | 26,618 | | | Manappuram Finance Ltd. (Consumer Finance) | | | 63,463 | |
| | 4,071 | | | Marico Ltd. (Personal Products) | | | 20,996 | |
| | 18,251 | | | Muthoot Finance Ltd. (Consumer Finance) | | | 181,764 | |
| | 108 | | | Nestle India Ltd. (Food Products) | | | 22,729 | |
| | 16,946 | | | NTPC Ltd. (Independent Power and Renewable Electricity Producers) | | | 29,243 | |
| | 248,924 | | | Oil & Natural Gas Corp. Ltd. (Oil, Gas & Consumable Fuels) | | | 496,819 | |
| | 17,630 | | | Petronet LNG Ltd. (Oil, Gas & Consumable Fuels) | | | 71,140 | |
| | 69,592 | | | Power Finance Corp.* (Diversified Financial Services) | | | 106,962 | |
| | 6,469 | | | Power Grid Corp. of India Ltd. (Electric Utilities) | | | 18,090 | |
| | 1,970 | | | RBL Bank Ltd.(a) (Banks) | | | 8,599 | |
| | 72,844 | | | REC Ltd. (Diversified Financial Services) | | | 143,302 | |
| | 443 | | | Reliance Industries Ltd. (Oil, Gas & Consumable Fuels) | | | 9,131 | |
| | 26 | | | Shree Cement Ltd. (Construction Materials) | | | 7,289 | |
| | 614 | | | Shriram Transport Finance Co. Ltd. (Consumer Finance) | | | 9,842 | |
| | 233 | | | State Bank of India* (Banks) | | | 1,025 | |
| | 1,843 | | | Sun Pharmaceutical Industries Ltd. (Pharmaceuticals) | | | 11,258 | |
| | 18,716 | | | Tata Consultancy Services Ltd. (IT Services) | | | 598,893 | |
| | 4,141 | | | Tata Motors Ltd.* (Automobiles) | | | 10,240 | |
| | 2,065 | | | Tata Steel Ltd. (Metals & Mining) | | | 11,057 | |
| | 161 | | | UltraTech Cement Ltd. (Construction Materials) | | | 9,402 | |
| | 3,636 | | | Vedanta Ltd. (Metals & Mining) | | | 7,589 | |
| | |
| | |
| The accompanying notes are an integral part of these financial statements. | | 29 |
GOLDMAN SACHS MULTI-MANAGER GLOBAL EQUITY FUND
Schedule of Investments(continued)
October 31, 2019
| | | | | | | | |
Shares | | | Description | | Value | |
|
| Common Stocks – (continued) | |
| India – (continued) | |
| | 7,813 | | | Wipro Ltd. (IT Services) | | $ | 28,611 | |
| | 73,656 | | | Yes Bank Ltd. (Banks) | | | 73,107 | |
| | | | | | | | |
| | | | | | | 5,029,714 | |
| | |
| Indonesia – 0.1% | |
| | 112,000 | | | Adaro Energy Tbk PT (Oil, Gas & Consumable Fuels) | | | 10,442 | |
| | 8,700 | | | Bank Central Asia Tbk PT (Banks) | | | 19,473 | |
| | 831,406 | | | Bank Tabungan Pensiunan Nasional Syariah Tbk PT* (Banks) | | | 227,377 | |
| | 25,300 | | | Charoen Pokphand Indonesia Tbk PT (Food Products) | | | 11,347 | |
| | 22,109 | | | Gudang Garam Tbk PT (Tobacco) | | | 88,297 | |
| | 48,200 | | | Hanjaya Mandala Sampoerna Tbk PT (Tobacco) | | | 7,308 | |
| | 10,600 | | | Indocement Tunggal Prakarsa Tbk PT (Construction Materials) | | | 15,101 | |
| | 26,100 | | | Indofood CBP Sukses Makmur Tbk PT (Food Products) | | | 21,609 | |
| | 32,258 | | | Indofood Sukses Makmur Tbk PT (Food Products) | | | 17,678 | |
| | 61,900 | | | Kalbe Farma Tbk PT (Pharmaceuticals) | | | 7,029 | |
| | 680,545 | | | Media Nusantara Citra Tbk PT (Media) | | | 63,723 | |
| | 109,100 | | | Perusahaan Gas Negara Tbk PT (Gas Utilities) | | | 16,373 | |
| | 3,200 | | | Semen Indonesia Persero Tbk PT (Construction Materials) | | | 2,886 | |
| | 40,000 | | | Telekomunikasi Indonesia Persero Tbk PT (Diversified Telecommunication Services) | | | 11,673 | |
| | 1,400 | | | Unilever Indonesia Tbk PT (Household Products) | | | 4,359 | |
| | | | | | | | |
| | | | | | | 524,675 | |
| | |
| Ireland – 1.6% | |
| | 8,099 | | | Accenture PLC Class A (IT Services) | | | 1,501,717 | |
| | 270 | | | Allergan PLC (Pharmaceuticals) | | | 47,550 | |
| | 6,576 | | | Bank of Ireland Group PLC (Banks) | | | 31,697 | |
| | 373 | | | CRH PLC* (Construction Materials) | | | 13,581 | |
| | 1,140 | | | DCC PLC (Industrial Conglomerates) | | | 106,909 | |
| | 770 | | | Eaton Corp. PLC (Electrical Equipment) | | | 67,075 | |
| | 540 | | | Flutter Entertainment PLC (Hotels, Restaurants & Leisure) | | | 55,781 | |
| | 14,472 | | | Grafton Group PLC (Trading Companies & Distributors) | | | 146,547 | |
| | 40,328 | | | Greencore Group PLC (Food Products) | | | 121,247 | |
| | 3,916 | | | ICON PLC* (Life Sciences Tools & Services) | | | 575,260 | |
| | 815 | | | Ingersoll-Rand PLC (Machinery) | | | 103,415 | |
| | 12,570 | | | Johnson Controls International PLC (Building Products) | | | 544,658 | |
| | 585 | | | Kerry Group PLC Class A (Food Products) | | | 70,726 | |
| | 767 | | | Kingspan Group PLC (Building Products) | | | 39,743 | |
| | 8,497 | | | Linde PLC (Chemicals) | | | 1,677,271 | |
| | |
|
| Common Stocks – (continued) | |
| Ireland – (continued) | |
| | 5,508 | | | Medtronic PLC (Health Care Equipment & Supplies) | | | 599,821 | |
| | 1,370 | | | Perrigo Co. PLC (Pharmaceuticals) | | | 72,637 | |
| | 15,781 | | | Ryanair Holdings PLC ADR* (Airlines) | | | 1,177,894 | |
| | 739 | | | Seagate Technology PLC (Technology Hardware, Storage & Peripherals) | | | 42,884 | |
| | 556 | | | Smurfit Kappa Group PLC (Containers & Packaging) | | | 18,569 | |
| | 627 | | | STERIS PLC (Health Care Equipment & Supplies) | | | 88,764 | |
| | 506 | | | Willis Towers Watson PLC (Insurance) | | | 94,571 | |
| | | | | | | | |
| | | | | | | 7,198,317 | |
| | |
| Israel – 0.3% | |
| | 7,035 | | | Bank Hapoalim BM (Banks) | | | 56,306 | |
| | 7,220 | | | Bank Leumi Le-Israel BM (Banks) | | | 52,592 | |
| | 134,590 | | | Bezeq The Israeli Telecommunication Corp. Ltd.* (Diversified Telecommunication Services) | | | 88,805 | |
| | 5,381 | | | Check Point Software Technologies Ltd.* (Software) | | | 604,878 | |
| | 896 | | | CyberArk Software Ltd.* (Software) | | | 91,016 | |
| | 9,365 | | | Israel Chemicals Ltd. (Chemicals) | | | 41,628 | |
| | 44,877 | | | Israel Discount Bank Ltd. Class A (Banks) | | | 205,080 | |
| | 5,829 | | | Mizrahi Tefahot Bank Ltd. (Banks) | | | 144,621 | |
| | 638 | | | Nice Ltd.* (Software) | | | 100,638 | |
| | 2,649 | | | Teva Pharmaceutical Industries Ltd.* (Pharmaceuticals) | | | 21,699 | |
| | | | | | | | |
| | | | | | | 1,407,263 | |
| | |
| Italy – 0.9% | |
| | 5,129 | | | Amplifon SpA (Health Care Providers & Services) | | | 128,986 | |
| | 2,753 | | | Assicurazioni Generali SpA (Insurance) | | | 55,824 | |
| | 9,702 | | | Autogrill SpA (Hotels, Restaurants & Leisure) | | | 95,922 | |
| | 6,759 | | | Buzzi Unicem SpA (Construction Materials) | | | 163,085 | |
| | 3,531 | | | Davide Campari-Milano SpA (Beverages) | | | 32,387 | |
| | 6,464 | | | Enel SpA (Electric Utilities) | | | 50,098 | |
| | 24,848 | | | Eni SpA (Oil, Gas & Consumable Fuels) | | | 376,969 | |
| | 35,700 | | | Hera SpA (Multi-Utilities) | | | 152,928 | |
| | 195,138 | | | Intesa Sanpaolo SpA (Banks) | | | 488,982 | |
| | 44,317 | | | Iren SpA (Multi-Utilities) | | | 137,505 | |
| | 3,483 | | | Leonardo SpA (Aerospace & Defense) | | | 40,464 | |
| | 15,794 | | | Mediobanca Banca di Credito Finanziario SpA (Banks) | | | 187,812 | |
| | 398 | | | Moncler SpA (Textiles, Apparel & Luxury Goods) | | | 15,358 | |
| | 5,629 | | | Poste Italiane SpA(a) (Insurance) | | | 68,372 | |
| | 5,160 | | | Prysmian SpA (Electrical Equipment) | | | 119,363 | |
| | 262 | | | Recordati SpA (Pharmaceuticals) | | | 11,010 | |
| | 4,945 | | | Snam SpA (Gas Utilities) | | | 25,387 | |
| | |
| | |
| 30 | | The accompanying notes are an integral part of these financial statements. |
GOLDMAN SACHS MULTI-MANAGER GLOBAL EQUITY FUND
| | | | | | | | |
Shares | | | Description | | Value | |
|
| Common Stocks – (continued) | |
| Italy – (continued) | |
| | 46,452 | | | Telecom Italia SpA* (Diversified Telecommunication Services) | | $ | 27,188 | |
| | 6,574 | | | Terna Rete Elettrica Nazionale SpA (Electric Utilities) | | | 43,450 | |
| | 155,530 | | | UniCredit SpA (Banks) | | | 1,973,214 | |
| | | | | | | | |
| | | | | | | 4,194,304 | |
| | |
| Japan – 5.4% | |
| | 9 | | | Advance Residence Investment Corp. (Equity Real Estate Investment Trusts (REITs)) | | | 29,908 | |
| | 800 | | | Advantest Corp. (Semiconductors & Semiconductor Equipment) | | | 36,407 | |
| | 1,400 | | | Aeon Co. Ltd. (Food & Staples Retailing) | | | 28,169 | |
| | 600 | | | AGC, Inc. (Building Products) | | | 21,096 | |
| | 600 | | | Air Water, Inc. (Chemicals) | | | 11,233 | |
| | 1,000 | | | Ajinomoto Co., Inc. (Food Products) | | | 19,012 | |
| | 600 | | | Alfresa Holdings Corp. (Health Care Providers & Services) | | | 13,397 | |
| | 900 | | | Alps Alpine Co. Ltd (Electronic Equipment, Instruments & Components) | | | 19,295 | |
| | 3,000 | | | Amada Holdings Co. Ltd. (Machinery) | | | 34,164 | |
| | 800 | | | ANA Holdings, Inc. (Airlines) | | | 27,471 | |
| | 600 | | | Aozora Bank Ltd. (Banks) | | | 15,395 | |
| | 3,900 | | | Aruhi Corp. (Thrifts & Mortgage Finance) | | | 87,680 | |
| | 2,600 | | | Asahi Kasei Corp. (Chemicals) | | | 28,864 | |
| | 600 | | | Asics Corp. (Textiles, Apparel & Luxury Goods) | | | 10,301 | |
| | 1,200 | | | Astellas Pharma, Inc. (Pharmaceuticals) | | | 20,595 | |
| | 700 | | | Bandai Namco Holdings, Inc. (Leisure Products) | | | 43,042 | |
| | 700 | | | Bridgestone Corp. (Auto Components) | | | 29,085 | |
| | 1,400 | | | Brother Industries Ltd. (Technology Hardware, Storage & Peripherals) | | | 26,312 | |
| | 4,200 | | | Canon Marketing Japan, Inc. (Electronic Equipment, Instruments & Components) | | | 88,862 | |
| | 900 | | | Canon, Inc. (Technology Hardware, Storage & Peripherals) | | | 24,696 | |
| | 2,000 | | | Casio Computer Co. Ltd. (Household Durables) | | | 32,467 | |
| | 100 | | | Central Japan Railway Co. (Road & Rail) | | | 20,513 | |
| | 1,900 | | | Chubu Electric Power Co., Inc. (Electric Utilities) | | | 28,504 | |
| | 200 | | | Chugai Pharmaceutical Co. Ltd. (Pharmaceuticals) | | | 16,831 | |
| | 9,500 | | | Coca-Cola Bottlers Japan Holdings, Inc. (Beverages) | | | 215,689 | |
| | 3,100 | | | Concordia Financial Group Ltd. (Banks) | | | 12,642 | |
| | 500 | | | Cosmos Pharmaceutical Corp. (Food & Staples Retailing) | | | 103,255 | |
| | 1,200 | | | Dai Nippon Printing Co. Ltd. (Commercial Services & Supplies) | | | 32,050 | |
| | 3,400 | | | Daicel Corp. (Chemicals) | | | 30,394 | |
| | |
|
| Common Stocks – (continued) | |
| Japan – (continued) | |
| | 300 | | | Daiichi Sankyo Co. Ltd. (Pharmaceuticals) | | | 19,726 | |
| | 5,000 | | | Daikin Industries Ltd. (Building Products) | | | 699,798 | |
| | 13 | | | Daiwa House REIT Investment Corp. (Equity Real Estate Investment Trusts (REITs)) | | | 37,853 | |
| | 2,200 | | | Daiwa Securities Group, Inc. (Capital Markets) | | | 9,889 | |
| | 4,500 | | | Denka Co. Ltd (Chemicals) | | | 129,864 | |
| | 4,800 | | | Denso Corp. (Auto Components) | | | 222,864 | |
| | 600 | | | Dentsu, Inc. (Media) | | | 21,450 | |
| | 4,400 | | | DIC Corp. (Chemicals) | | | 126,038 | |
| | 100 | | | Disco Corp. (Semiconductors & Semiconductor Equipment) | | | 21,824 | |
| | 10,100 | | | East Japan Railway Co. (Road & Rail) | | | 916,888 | |
| | 900 | | | Electric Power Development Co. Ltd. (Independent Power and Renewable Electricity Producers) | | | 21,852 | |
| | 500 | | | Ezaki Glico Co. Ltd. (Food Products) | | | 23,202 | |
| | 500 | | | FamilyMart Co. Ltd. (Food & Staples Retailing) | | | 12,403 | |
| | 9,100 | | | FANUC Corp. (Machinery) | | | 1,794,968 | |
| | 700 | | | Fuji Electric Co. Ltd. (Electrical Equipment) | | | 22,247 | |
| | 900 | | | FUJIFILM Holdings Corp. (Technology Hardware, Storage & Peripherals) | | | 39,512 | |
| | 600 | | | Fujitsu Ltd. (IT Services) | | | 53,177 | |
| | 200 | | | Fukuoka Financial Group, Inc. (Banks) | | | 3,855 | |
| | 16 | | | GLP J-REIT (Equity Real Estate Investment Trusts (REITs)) | | | 20,861 | |
| | 800 | | | Hakuhodo DY Holdings, Inc. (Media) | | | 11,938 | |
| | 900 | | | Hamamatsu Photonics KK (Electronic Equipment, Instruments & Components) | | | 34,946 | |
| | 300 | | | Hankyu Hanshin Holdings, Inc. (Road & Rail) | | | 12,005 | |
| | 1,000 | | | Haseko Corp. (Household Durables) | | | 12,904 | |
| | 14,500 | | | Hazama Ando Corp. (Construction & Engineering) | | | 112,347 | |
| | 1,600 | | | Hino Motors Ltd. (Machinery) | | | 15,127 | |
| | 10 | | | Hirose Electric Co. Ltd. (Electronic Equipment, Instruments & Components) | | | 1,260 | |
| | 100 | | | Hisamitsu Pharmaceutical Co., Inc. (Pharmaceuticals) | | | 4,654 | |
| | 2,300 | | | Hitachi High-Technologies Corp. (Electronic Equipment, Instruments & Components) | | | 143,096 | |
| | 12,900 | | | Hitachi Ltd. (Electronic Equipment, Instruments & Components) | | | 481,459 | |
| | 500 | | | Honda Motor Co. Ltd. (Automobiles) | | | 13,527 | |
| | 12,400 | | | Hoya Corp. (Health Care Equipment & Supplies) | | | 1,095,877 | |
| | 300 | | | Idemitsu Kosan Co. Ltd. (Oil, Gas & Consumable Fuels) | | | 8,819 | |
| | 700 | | | Inpex Corp. (Oil, Gas & Consumable Fuels) | | | 6,471 | |
| | |
| | |
| The accompanying notes are an integral part of these financial statements. | | 31 |
GOLDMAN SACHS MULTI-MANAGER GLOBAL EQUITY FUND
Schedule of Investments(continued)
October 31, 2019
| | | | | | | | |
Shares | | | Description | | Value | |
|
| Common Stocks – (continued) | |
| Japan – (continued) | |
| | 217 | | | Invincible Investment Corp. (Equity Real Estate Investment Trusts (REITs)) | | $ | 137,025 | |
| | 2,300 | | | Isetan Mitsukoshi Holdings Ltd. (Multiline Retail) | | | 18,343 | |
| | 2,400 | | | Isuzu Motors Ltd. (Automobiles) | | | 27,888 | |
| | 1,900 | | | ITOCHU Corp. (Trading Companies & Distributors) | | | 39,725 | |
| | 11,500 | | | J. Front Retailing Co. Ltd. (Multiline Retail) | | | 146,233 | |
| | 2,000 | | | Jafco Co. Ltd. (Capital Markets) | | | 75,124 | |
| | 300 | | | Japan Airport Terminal Co. Ltd. (Transportation Infrastructure) | | | 14,819 | |
| | 216 | | | Japan Hotel REIT Investment Corp. (Equity Real Estate Investment Trusts (REITs)) | | | 179,417 | |
| | 2,900 | | | Japan Post Bank Co. Ltd. (Banks) | | | 28,848 | |
| | 5,200 | | | Japan Post Holdings Co. Ltd. (Insurance) | | | 47,732 | |
| | 8 | | | Japan Prime Realty Investment Corp. (Equity Real Estate Investment Trusts (REITs)) | | | 38,448 | |
| | 4 | | | Japan Real Estate Investment Corp. (Equity Real Estate Investment Trusts (REITs)) | | | 27,303 | |
| | 23 | | | Japan Retail Fund Investment Corp. (Equity Real Estate Investment Trusts (REITs)) | | | 53,672 | |
| | 18,300 | | | Japan Tobacco, Inc. (Tobacco) | | | 413,630 | |
| | 500 | | | JFE Holdings, Inc. (Metals & Mining) | | | 6,254 | |
| | 900 | | | JSR Corp. (Chemicals) | | | 16,896 | |
| | 10,900 | | | Kajima Corp. (Construction & Engineering) | | | 149,794 | |
| | 5,500 | | | Kamigumi Co. Ltd. (Transportation Infrastructure) | | | 124,361 | |
| | 3,800 | | | Kanamoto Co. Ltd. (Trading Companies & Distributors) | | | 101,590 | |
| | 400 | | | Kaneka Corp. (Chemicals) | | | 13,315 | |
| | 400 | | | Kao Corp. (Personal Products) | | | 32,159 | |
| | 800 | | | KAWADA TECHNOLOGIES, Inc. (Construction & Engineering) | | | 52,731 | |
| | 200 | | | Kawasaki Heavy Industries Ltd. (Machinery) | | | 4,800 | |
| | 46,200 | | | KDDI Corp. (Wireless Telecommunication Services) | | | 1,278,407 | |
| | 200 | | | Keihan Holdings Co. Ltd. (Industrial Conglomerates) | | | 9,443 | |
| | 5,500 | | | Keihin Corp. (Auto Components) | | | 130,749 | |
| | 100 | | | Keio Corp. (Road & Rail) | | | 6,186 | |
| | 600 | | | Keisei Electric Railway Co. Ltd. (Road & Rail) | | | 24,531 | |
| | 20 | | | Kenedix Office Investment Corp. (Equity Real Estate Investment Trusts (REITs)) | | | 156,681 | |
| | 78 | | | Kenedix Residential Next Investment Corp. (Equity Real Estate Investment Trusts (REITs)) | | | 160,709 | |
| | 1,500 | | | Kewpie Corp. (Food Products) | | | 34,046 | |
| | |
|
| Common Stocks – (continued) | |
| Japan – (continued) | |
| | 1,010 | | | Keyence Corp. (Electronic Equipment, Instruments & Components) | | | 638,619 | |
| | 200 | | | Kikkoman Corp. (Food Products) | | | 9,621 | |
| | 400 | | | Kintetsu Group Holdings Co. Ltd. (Road & Rail) | | | 21,802 | |
| | 800 | | | Kirin Holdings Co. Ltd. (Beverages) | | | 16,971 | |
| | 200 | | | Kobayashi Pharmaceutical Co. Ltd. (Personal Products) | | | 15,992 | |
| | 800 | | | Kobe Steel Ltd. (Metals & Mining) | | | 4,301 | |
| | 4,000 | | | Komeri Co. Ltd. (Specialty Retail) | | | 85,721 | |
| | 400 | | | Konami Holdings Corp. (Entertainment) | | | 17,560 | |
| | 4,500 | | | Konica Minolta, Inc. (Technology Hardware, Storage & Peripherals) | | | 33,029 | |
| | 32,200 | | | Kubota Corp. (Machinery) | | | 511,441 | |
| | 1,800 | | | Kuraray Co. Ltd. (Chemicals) | | | 21,415 | |
| | 800 | | | Kurita Water Industries Ltd. (Machinery) | | | 23,030 | |
| | 9,100 | | | Kyocera Corp. (Electronic Equipment, Instruments & Components) | | | 597,022 | |
| | 5,700 | | | Kyowa Exeo Corp. (Construction & Engineering) | | | 145,019 | |
| | 1,500 | | | Kyowa Kirin Co. Ltd. (Pharmaceuticals) | | | 27,600 | |
| | 4,100 | | | Kyushu Electric Power Co., Inc. (Electric Utilities) | | | 40,973 | |
| | 1,100 | | | Kyushu Railway Co. (Road & Rail) | | | 36,341 | |
| | 4,500 | | | LAC Co. Ltd. (IT Services) | | | 53,971 | |
| | 400 | | | Lawson, Inc. (Food & Staples Retailing) | | | 22,067 | |
| | 3,800 | | | Lintec Corp. (Chemicals) | | | 79,811 | |
| | 1,400 | | | Lion Corp. (Household Products) | | | 29,298 | |
| | 1,600 | | | LIXIL Group Corp. (Building Products) | | | 29,757 | |
| | 12,500 | | | Maeda Corp. (Construction & Engineering) | | | 116,010 | |
| | 3,300 | | | Makino Milling Machine Co. Ltd. (Machinery) | | | 164,073 | |
| | 2,400 | | | Marubeni Corp. (Trading Companies & Distributors) | | | 16,891 | |
| | 3,700 | | | Mazda Motor Corp. (Automobiles) | | | 33,967 | |
| | 7,700 | | | MCJ Co. Ltd. (Technology Hardware, Storage & Peripherals) | | | 50,817 | |
| | 135 | | | MCUBS MidCity Investment Corp. (Equity Real Estate Investment Trusts (REITs)) | | | 156,568 | |
| | 30,500 | | | Mebuki Financial Group, Inc. (Banks) | | | 77,489 | |
| | 1,400 | | | Medipal Holdings Corp. (Health Care Providers & Services) | | | 31,987 | |
| | 200 | | | MEIJI Holdings Co. Ltd. (Food Products) | | | 14,416 | |
| | 1,300 | | | Mitsubishi Chemical Holdings Corp. (Chemicals) | | | 9,908 | |
| | 1,300 | | | Mitsubishi Corp. (Trading Companies & Distributors) | | | 33,065 | |
| | 1,100 | | | Mitsubishi Electric Corp. (Electrical Equipment) | | | 15,716 | |
| | 1,300 | | | Mitsubishi Gas Chemical Co., Inc. (Chemicals) | | | 18,339 | |
| | 1,000 | | | Mitsubishi Heavy Industries Ltd. (Machinery) | | | 40,469 | |
| | |
| | |
| 32 | | The accompanying notes are an integral part of these financial statements. |
GOLDMAN SACHS MULTI-MANAGER GLOBAL EQUITY FUND
| | | | | | | | |
Shares | | | Description | | Value | |
|
| Common Stocks – (continued) | |
| Japan – (continued) | |
| | 800 | | | Mitsubishi Materials Corp. (Metals & Mining) | | $ | 23,004 | |
| | 4,800 | | | Mitsubishi Motors Corp. (Automobiles) | | | 21,916 | |
| | 2,200 | | | Mitsubishi Tanabe Pharma Corp. (Pharmaceuticals) | | | 26,330 | |
| | 2,300 | | | Mitsubishi UFJ Financial Group, Inc. (Banks) | | | 11,924 | |
| | 23,700 | | | Mitsubishi UFJ Lease & Finance Co. Ltd. (Diversified Financial Services) | | | 145,494 | |
| | 1,800 | | | Mitsui & Co. Ltd. (Trading Companies & Distributors) | | | 30,913 | |
| | 600 | | | Mitsui Chemicals, Inc. (Chemicals) | | | 14,269 | |
| | 800 | | | Mitsui OSK Lines Ltd. (Marine) | | | 21,791 | |
| | 11,800 | | | Mizuho Financial Group, Inc. (Banks) | | | 18,319 | |
| | 4,200 | | | Morinaga Milk Industry Co. Ltd. (Food Products) | | | 163,288 | |
| | 600 | | | MS&AD Insurance Group Holdings, Inc. (Insurance) | | | 19,375 | |
| | 5,500 | | | Murata Manufacturing Co. Ltd. (Electronic Equipment, Instruments & Components) | | | 299,465 | |
| | 1,300 | | | Nagoya Railroad Co. Ltd. (Road & Rail) | | | 41,324 | |
| | 400 | | | Nankai Electric Railway Co. Ltd. (Road & Rail) | | | 10,395 | |
| | 1,300 | | | NEC Corp. (Technology Hardware, Storage & Peripherals) | | | 51,520 | |
| | 4,000 | | | NH Foods Ltd. (Food Products) | | | 168,063 | |
| | 1,800 | | | Nichiha Corp. (Building Products) | | | 51,758 | |
| | 5,400 | | | Nichirei Corp. (Food Products) | | | 124,010 | |
| | 2,100 | | | Nikon Corp. (Household Durables) | | | 26,776 | |
| | 4 | | | Nippon Building Fund, Inc. (Equity Real Estate Investment Trusts (REITs)) | | | 30,346 | |
| | 300 | | | Nippon Express Co. Ltd. (Road & Rail) | | | 17,117 | |
| | 8 | | | Nippon Prologis REIT, Inc. (Equity Real Estate Investment Trusts (REITs)) | | | 22,346 | |
| | 1,500 | | | Nippon Shinyaku Co. Ltd. (Pharmaceuticals) | | | 135,325 | |
| | 1,000 | | | Nippon Telegraph & Telephone Corp. (Diversified Telecommunication Services) | | | 49,643 | |
| | 600 | | | Nippon Yusen KK (Marine) | | | 10,779 | |
| | 2,700 | | | Nishio Rent All Co. Ltd. (Trading Companies & Distributors) | | | 72,536 | |
| | 300 | | | Nissan Chemical Corp. (Chemicals) | | | 12,317 | |
| | 4,400 | | | Nissan Motor Co. Ltd. (Automobiles) | | | 27,767 | |
| | 900 | | | Nisshin Seifun Group, Inc. (Food Products) | | | 17,842 | |
| | 300 | | | Nissin Foods Holdings Co. Ltd. (Food Products) | | | 22,661 | |
| | 1,300 | | | Nomura Holdings, Inc. (Capital Markets) | | | 5,908 | |
| | 14 | | | Nomura Real Estate Master Fund, Inc. (Equity Real Estate Investment Trusts (REITs)) | | | 26,762 | |
| | 1,000 | | | Nomura Research Institute Ltd. (IT Services) | | | 21,231 | |
| | 2,000 | | | NSD Co. Ltd. (IT Services) | | | 61,649 | |
| | |
|
| Common Stocks – (continued) | |
| Japan – (continued) | |
| | 1,100 | | | NSK Ltd. (Machinery) | | | 10,228 | |
| | 1,400 | | | NTT Data Corp. (IT Services) | | | 18,383 | |
| | 900 | | | NTT DOCOMO, Inc. (Wireless Telecommunication Services) | | | 24,674 | |
| | 1,700 | | | Obayashi Corp. (Construction & Engineering) | | | 17,495 | |
| | 100 | | | Obic Co. Ltd. (IT Services) | | | 12,521 | |
| | 300 | | | Odakyu Electric Railway Co. Ltd. (Road & Rail) | | | 7,303 | |
| | 6,000 | | | Oji Holdings Corp. (Paper & Forest Products) | | | 31,021 | |
| | 2,100 | | | OKUMA Corp. (Machinery) | | | 125,475 | |
| | 56,800 | | | Olympus Corp. (Health Care Equipment & Supplies) | | | 772,842 | |
| | 200 | | | Oriental Land Co. Ltd. (Hotels, Restaurants & Leisure) | | | 29,320 | |
| | 800 | | | ORIX Corp. (Diversified Financial Services) | | | 12,572 | |
| | 18 | | | Orix JREIT, Inc. (Equity Real Estate Investment Trusts (REITs)) | | | 40,700 | |
| | 800 | | | Osaka Gas Co. Ltd. (Gas Utilities) | | | 15,644 | |
| | 500 | | | Otsuka Corp. (IT Services) | | | 20,159 | |
| | 700 | | | Otsuka Holdings Co. Ltd. (Pharmaceuticals) | | | 29,183 | |
| | 2,100 | | | Pan Pacific International Holdings Corp. (Multiline Retail) | | | 33,057 | |
| | 2,600 | | | Panasonic Corp. (Household Durables) | | | 21,851 | |
| | 100 | | | Pigeon Corp. (Household Products) | | | 4,882 | |
| | 200 | | | Recruit Holdings Co. Ltd. (Professional Services) | | | 6,647 | |
| | 4,000 | | | Renesas Electronics Corp.* (Semiconductors & Semiconductor Equipment) | | | 27,079 | |
| | 2,900 | | | Resona Holdings, Inc. (Banks) | | | 12,611 | |
| | 4,400 | | | Ricoh Co. Ltd. (Technology Hardware, Storage & Peripherals) | | | 39,185 | |
| | 100 | | | Rinnai Corp. (Household Durables) | | | 7,350 | |
| | 300 | | | Rohm Co. Ltd. (Semiconductors & Semiconductor Equipment) | | | 23,769 | |
| | 4,400 | | | Saizeriya Co. Ltd. (Hotels, Restaurants & Leisure) | | | 99,898 | |
| | 2,800 | | | Sankyu, Inc. (Road & Rail) | | | 142,355 | |
| | 2,100 | | | Sato Holdings Corp. (Commercial Services & Supplies) | | | 61,817 | |
| | 2,700 | | | Sawai Pharmaceutical Co. Ltd. (Pharmaceuticals) | | | 152,353 | |
| | 3,400 | | | SBI Holdings, Inc. (Capital Markets) | | | 73,944 | |
| | 100 | | | Secom Co. Ltd. (Commercial Services & Supplies) | | | 9,266 | |
| | 10,100 | | | Sega Sammy Holdings, Inc. (Leisure Products) | | | 142,138 | |
| | 2,100 | | | Seiko Epson Corp. (Technology Hardware, Storage & Peripherals) | | | 29,696 | |
| | 2,600 | | | Seiko Holdings Corp. (Textiles, Apparel & Luxury Goods) | | | 63,846 | |
| | |
| | |
| The accompanying notes are an integral part of these financial statements. | | 33 |
GOLDMAN SACHS MULTI-MANAGER GLOBAL EQUITY FUND
Schedule of Investments(continued)
October 31, 2019
| | | | | | | | |
Shares | | | Description | | Value | |
|
| Common Stocks – (continued) | |
| Japan – (continued) | |
| | 1,600 | | | Sekisui Chemical Co. Ltd. (Household Durables) | | $ | 27,897 | |
| | 1,000 | | | Sekisui House Ltd. (Household Durables) | | | 21,564 | |
| | 400 | | | Seven & i Holdings Co. Ltd. (Food & Staples Retailing) | | | 15,112 | |
| | 400 | | | Shimadzu Corp. (Electronic Equipment, Instruments & Components) | | | 10,682 | |
| | 2,200 | | | Shimizu Corp. (Construction & Engineering) | | | 20,508 | |
| | 1,700 | | | Shin-Etsu Chemical Co. Ltd. (Chemicals) | | | 189,552 | |
| | 1,400 | | | Shinsei Bank Ltd. (Banks) | | | 21,826 | |
| | 200 | | | Shionogi & Co. Ltd. (Pharmaceuticals) | | | 12,005 | |
| | 2,200 | | | Ship Healthcare Holdings, Inc. (Health Care Providers & Services) | | | 93,768 | |
| | 400 | | | Shiseido Co. Ltd. (Personal Products) | | | 32,979 | |
| | 400 | | | Softbank Corp. (Wireless Telecommunication Services) | | | 5,487 | |
| | 200 | | | Sohgo Security Services Co. Ltd. (Commercial Services & Supplies) | | | 10,864 | |
| | 7,000 | | | Sojitz Corp. (Trading Companies & Distributors) | | | 22,033 | |
| | 13,100 | | | Sompo Holdings, Inc. (Insurance) | | | 514,910 | |
| | 300 | | | Square Enix Co. Ltd. (Entertainment) | | | 14,276 | |
| | 700 | | | Stanley Electric Co. Ltd. (Auto Components) | | | 19,371 | |
| | 2,500 | | | Sumitomo Bakelite Co. Ltd. (Chemicals) | | | 103,663 | |
| | 2,200 | | | Sumitomo Chemical Co. Ltd. (Chemicals) | | | 10,064 | |
| | 900 | | | Sumitomo Corp. (Trading Companies & Distributors) | | | 14,618 | |
| | 600 | | | Sumitomo Dainippon Pharma Co. Ltd. (Pharmaceuticals) | | | 10,472 | |
| | 1,000 | | | Sumitomo Electric Industries Ltd. (Auto Components) | | | 13,714 | |
| | 10,000 | | | Sumitomo Forestry Co. Ltd. (Household Durables) | | | 145,145 | |
| | 3,000 | | | Sumitomo Heavy Industries Ltd. (Machinery) | | | 93,186 | |
| | 18,900 | | | Sumitomo Mitsui Financial Group, Inc. (Banks) | | | 671,010 | |
| | 500 | | | Sumitomo Mitsui Trust Holdings, Inc. (Banks) | | | 18,223 | |
| | 1,500 | | | Sumitomo Rubber Industries Ltd. (Auto Components) | | | 19,881 | |
| | 600 | | | Suntory Beverage & Food Ltd. (Beverages) | | | 25,650 | |
| | 1,800 | | | Sushiro Global Holdings Ltd. (Hotels, Restaurants & Leisure) | | | 123,755 | |
| | 300 | | | Suzuken Co. Ltd. (Health Care Providers & Services) | | | 16,018 | |
| | 300 | | | Taiheiyo Cement Corp. (Construction Materials) | | | 8,487 | |
| | 300 | | | Taisho Pharmaceutical Holdings Co. Ltd. (Pharmaceuticals) | | | 21,352 | |
| | 54,900 | | | Takeda Pharmaceutical Co. Ltd. (Pharmaceuticals) | | | 1,983,705 | |
| | |
|
| Common Stocks – (continued) | |
| Japan – (continued) | |
| | 1,000 | | | Teijin Ltd. (Chemicals) | | | 20,038 | |
| | 23,900 | | | Terumo Corp. (Health Care Equipment & Supplies) | | | 780,018 | |
| | 3,900 | | | The 77 Bank Ltd. (Banks) | | | 61,441 | |
| | 700 | | | The Chiba Bank Ltd. (Banks) | | | 3,805 | |
| | 3,300 | | | The Chugoku Electric Power Co., Inc. (Electric Utilities) | | | 43,962 | |
| | 1,700 | | | The Kansai Electric Power Co., Inc. (Electric Utilities) | | | 19,832 | |
| | 1,200 | | | The Shizuoka Bank Ltd. (Banks) | | | 9,119 | |
| | 300 | | | THK Co. Ltd. (Machinery) | | | 8,627 | |
| | 2,900 | | | TIS, Inc. (IT Services) | | | 175,837 | |
| | 900 | | | Tobu Railway Co. Ltd. (Road & Rail) | | | 30,033 | |
| | 700 | | | Toho Co. Ltd. (Entertainment) | | | 28,270 | |
| | 1,000 | | | Toho Gas Co. Ltd. (Gas Utilities) | | | 38,949 | |
| | 3,400 | | | Tohoku Electric Power Co., Inc. (Electric Utilities) | | | 34,944 | |
| | 600 | | | Tokio Marine Holdings, Inc. (Insurance) | | | 32,439 | |
| | 6,300 | | | Tokyo Broadcasting System Holdings, Inc. (Media) | | | 100,456 | |
| | 6,300 | | | Tokyo Electric Power Co. Holdings, Inc.* (Electric Utilities) | | | 29,176 | |
| | 2,000 | | | Tokyo Gas Co. Ltd. (Gas Utilities) | | | 48,822 | |
| | 1,000 | | | Tokyo Tatemono Co. Ltd. (Real Estate Management & Development) | | | 14,227 | |
| | 1,800 | | | Tokyotokeiba Co. Ltd. (Hotels, Restaurants & Leisure) | | | 56,839 | |
| | 800 | | | Tokyu Corp. (Road & Rail) | | | 15,131 | |
| | 1,500 | | | Toppan Printing Co. Ltd. (Commercial Services & Supplies) | | | 27,743 | |
| | 3,500 | | | Toray Industries, Inc. (Chemicals) | | | 24,735 | |
| | 900 | | | Toshiba Corp. (Industrial Conglomerates) | | | 30,777 | |
| | 2,200 | | | Tosoh Corp. (Chemicals) | | | 30,124 | |
| | 3,000 | | | Towa Pharmaceutical Co. Ltd. (Pharmaceuticals) | | | 76,928 | |
| | 1,100 | | | Toyo Seikan Group Holdings Ltd. (Containers & Packaging) | | | 17,384 | |
| | 900 | | | Toyo Suisan Kaisha Ltd. (Food Products) | | | 37,894 | |
| | 5,300 | | | Toyoda Gosei Co. Ltd. (Auto Components) | | | 123,992 | |
| | 300 | | | Toyota Industries Corp. (Auto Components) | | | 18,001 | |
| | 300 | | | Toyota Motor Corp. (Automobiles) | | | 20,814 | |
| | 700 | | | Toyota Tsusho Corp. (Trading Companies & Distributors) | | | 24,149 | |
| | 600 | | | Trend Micro, Inc. (Software) | | | 30,285 | |
| | 1,100 | | | Tsuruha Holdings, Inc. (Food & Staples Retailing) | | | 123,737 | |
| | 500 | | | Unicharm Corp. (Household Products) | | | 16,945 | |
| | 21 | | | United Urban Investment Corp. (Equity Real Estate Investment Trusts (REITs)) | | | 42,366 | |
| | 1,300 | | | USS Co. Ltd. (Specialty Retail) | | | 25,179 | |
| | 400 | | | West Japan Railway Co. (Road & Rail) | | | 34,756 | |
| | 300 | | | Yakult Honsha Co. Ltd. (Food Products) | | | 17,193 | |
| | 7,900 | | | Yamada Denki Co. Ltd. (Specialty Retail) | | | 38,185 | |
| | 500 | | | Yamaha Corp. (Leisure Products) | | | 23,285 | |
| | |
| | |
| 34 | | The accompanying notes are an integral part of these financial statements. |
GOLDMAN SACHS MULTI-MANAGER GLOBAL EQUITY FUND
| | | | | | | | |
Shares | | | Description | | Value | |
|
| Common Stocks – (continued) | |
| Japan – (continued) | |
| | 600 | | | Yamaha Motor Co. Ltd. (Automobiles) | | $ | 11,744 | |
| | 1,000 | | | Yamazaki Baking Co. Ltd. (Food Products) | | | 17,049 | |
| | 3,300 | | | Yokogawa Bridge Holdings Corp. (Construction & Engineering) | | | 60,413 | |
| | 700 | | | Yokogawa Electric Corp. (Electronic Equipment, Instruments & Components) | | | 12,826 | |
| | 3,100 | | | Zenkoku Hosho Co. Ltd. (Diversified Financial Services) | | | 129,422 | |
| | 9,300 | | | Zeon Corp. (Chemicals) | | | 105,943 | |
| | | | | | | | |
| | | | | | | 24,961,003 | |
| | |
| Liberia – 0.0% | |
| | 552 | | | Royal Caribbean Cruises Ltd. (Hotels, Restaurants & Leisure) | | | 60,074 | |
| | |
| Luxembourg – 0.1% | |
| | 411 | | | ArcelorMittal (Metals & Mining) | | | 6,111 | |
| | 2,403 | | | Aroundtown SA (Real Estate Management & Development) | | | 20,312 | |
| | 25,925 | | | B&M European Value Retail SA (Multiline Retail) | | | 124,372 | |
| | 1,155 | | | Globant SA* (Software) | | | 107,715 | |
| | 7,500 | | | Samsonite International SA(a) (Textiles, Apparel & Luxury Goods) | | | 15,271 | |
| | 1,837 | | | Subsea 7 SA (Energy Equipment & Services) | | | 17,258 | |
| | 2,641 | | | Tenaris SA (Energy Equipment & Services) | | | 26,793 | |
| | 1,579 | | | Trinseo SA (Chemicals) | | | 67,108 | |
| | | | | | | | |
| | | | | | | 384,940 | |
| | |
| Malaysia – 0.2% | |
| | 32,200 | | | AirAsia Group Bhd (Airlines) | | | 14,701 | |
| | 16,000 | | | AMMB Holdings Bhd (Banks) | | | 15,262 | |
| | 5,975 | | | CIMB Group Holdings Bhd (Banks) | | | 7,499 | |
| | 7,700 | | | DiGi.Com Bhd (Wireless Telecommunication Services) | | | 8,647 | |
| | 52,162 | | | DRB-Hicom Bhd (Automobiles) | | | 31,528 | |
| | 5,400 | | | Gamuda Bhd (Construction & Engineering) | | | 4,829 | |
| | 10,000 | | | Genting Bhd (Hotels, Restaurants & Leisure) | | | 13,891 | |
| | 85,373 | | | Genting Malaysia Bhd (Hotels, Restaurants & Leisure) | | | 65,480 | |
| | 2,400 | | | Hong Leong Bank Bhd (Banks) | | | 9,882 | |
| | 20,000 | | | IJM Corp. Bhd (Construction & Engineering) | | | 10,283 | |
| | 10,300 | | | IOI Corp. Bhd (Food Products) | | | 10,750 | |
| | 2,800 | | | Kuala Lumpur Kepong Bhd (Food Products) | | | 14,518 | |
| | 10,586 | | | Malayan Banking Bhd (Banks) | | | 21,769 | |
| | 6,700 | | | Malaysia Airports Holdings Bhd (Transportation Infrastructure) | | | 12,681 | |
| | 5,500 | | | Maxis Bhd (Wireless Telecommunication Services) | | | 7,082 | |
| | 7,200 | | | MISC Bhd (Marine) | | | 14,341 | |
| | |
|
| Common Stocks – (continued) | |
| Malaysia – (continued) | |
| | 600 | | | Nestle Malaysia Bhd (Food Products) | | | 20,765 | |
| | 6,500 | | | Petronas Chemicals Group Bhd (Chemicals) | | | 11,613 | |
| | 1,400 | | | Petronas Dagangan Bhd (Oil, Gas & Consumable Fuels) | | | 7,894 | |
| | 600 | | | Petronas Gas Bhd (Gas Utilities) | | | 2,389 | |
| | 7,620 | | | PPB Group Bhd (Food Products) | | | 32,965 | |
| | 220,354 | | | RHB Bank Bhd (Banks) | | | 303,227 | |
| | 162,957 | | | Sime Darby Bhd (Industrial Conglomerates) | | | 88,357 | |
| | 4,100 | | | Tenaga Nasional Berhad (Electric Utilities) | | | 13,578 | |
| | | | | | | | |
| | | | | | | 743,931 | |
| | |
| Mexico – 0.4% | |
| | 6,000 | | | Alsea SAB de CV* (Hotels, Restaurants & Leisure) | | | 16,007 | |
| | 3,100 | | | Arca Continental SAB de CV (Beverages) | | | 17,319 | |
| | 3,700 | | | Banco del Bajio SA(a) (Banks) | | | 5,961 | |
| | 33,576 | | | Cemex SAB de CV (Construction Materials) | | | 12,619 | |
| | 134,339 | | | Fibra Uno Administracion SA de CV (Equity Real Estate Investment Trusts (REITs)) | | | 204,059 | |
| | 1,000 | | | Fomento Economico Mexicano SAB de CV (Beverages) | | | 8,874 | |
| | 5,689 | | | Fomento Economico Mexicano SAB de CV ADR (Beverages) | | | 506,435 | |
| | 1,085 | | | Gruma SAB de CV Class B (Food Products) | | | 11,385 | |
| | 21,103 | | | Grupo Aeroportuario del Centro Norte SAB de CV (Transportation Infrastructure) | | | 146,311 | |
| | 1,100 | | | Grupo Aeroportuario del Pacifico SAB de CV Class B (Transportation Infrastructure) | | | 11,533 | |
| | 115 | | | Grupo Elektra SAB DE CV (Banks) | | | 8,358 | |
| | 9,600 | | | Grupo Financiero Inbursa SAB de CV Class O (Banks) | | | 11,927 | |
| | 5,800 | | | Grupo Televisa SAB (Media) | | | 12,808 | |
| | 2,800 | | | Infraestructura Energetica Nova SAB de CV* (Gas Utilities) | | | 12,377 | |
| | 138,882 | | | Kimberly-Clark de Mexico SAB de CV Class A* (Household Products) | | | 280,053 | |
| | 4,600 | | | Megacable Holdings SAB de CV (Media) | | | 18,898 | |
| | 6,828 | | | Orbia Advance Corp. SAB de CV (Chemicals) | | | 14,734 | |
| | 1,705 | | | Promotora y Operadora de Infraestructura SAB de CV (Transportation Infrastructure) | | | 15,771 | |
| | 224,517 | | | Wal-Mart de Mexico SAB de CV (Food & Staples Retailing) | | | 673,790 | |
| | | | | | | | |
| | | | | | | 1,989,219 | |
| | |
| | |
| The accompanying notes are an integral part of these financial statements. | | 35 |
GOLDMAN SACHS MULTI-MANAGER GLOBAL EQUITY FUND
Schedule of Investments(continued)
October 31, 2019
| | | | | | | | |
Shares | | | Description | | Value | |
|
| Common Stocks – (continued) | |
| Netherlands – 1.4% | |
| | 213 | | | Aalberts NV (Machinery) | | $ | 8,583 | |
| | 2,524 | | | ABN AMRO Bank NV(a) (Banks) | | | 47,047 | |
| | 2,579 | | | Aegon NV (Insurance) | | | 11,189 | |
| | 2,184 | | | AerCap Holdings NV* (Trading Companies & Distributors) | | | 126,410 | |
| | 6,509 | | | Airbus SE (Aerospace & Defense) | | | 937,509 | |
| | 15,790 | | | Akzo Nobel NV (Chemicals) | | | 1,455,733 | |
| | 1,561 | | | ASM International NV (Semiconductors & Semiconductor Equipment) | | | 157,383 | |
| | 2,211 | | | ASML Holding NV (Semiconductors & Semiconductor Equipment) | | | 579,232 | |
| | 6,337 | | | ASR Nederland NV (Insurance) | | | 232,305 | |
| | 1,808 | | | Euronext NV(a) (Capital Markets) | | | 145,855 | |
| | 394 | | | EXOR NV (Diversified Financial Services) | | | 30,206 | |
| | 99 | | | Ferrari NV (Automobiles) | | | 15,856 | |
| | 1,197 | | | Fiat Chrysler Automobiles NV (Automobiles) | | | 18,576 | |
| | 387 | | | Heineken NV (Beverages) | | | 39,520 | |
| | 101,954 | | | ING Groep NV (Banks) | | | 1,154,475 | |
| | 5,423 | | | Koninklijke Ahold Delhaize NV (Food & Staples Retailing) | | | 135,141 | |
| | 268 | | | Koninklijke DSM NV (Chemicals) | | | 31,808 | |
| | 10,498 | | | Koninklijke KPN NV (Diversified Telecommunication Services) | | | 32,590 | |
| | 556 | | | Koninklijke Philips NV (Health Care Equipment & Supplies) | | | 24,394 | |
| | 1,824 | | | Mylan NV* (Pharmaceuticals) | | | 34,930 | |
| | 1,775 | | | NN Group NV (Insurance) | | | 67,728 | |
| | 322 | | | NXP Semiconductors NV (Semiconductors & Semiconductor Equipment) | | | 36,605 | |
| | 7,348 | | | QIAGEN NV* (Life Sciences Tools & Services) | | | 221,021 | |
| | 7,608 | | | Randstad NV (Professional Services) | | | 422,220 | |
| | 1,519 | | | Rhi Magnesita NV (Construction Materials) | | | 68,459 | |
| | 5,096 | | | Signify NV(a) (Electrical Equipment) | | | 149,313 | |
| | 1,575 | | | STMicroelectronics NV (Semiconductors & Semiconductor Equipment) | | | 35,747 | |
| | 620 | | | Unilever NV (Personal Products) | | | 36,646 | |
| | 441 | | | Wolters Kluwer NV (Professional Services) | | | 32,481 | |
| | 8,047 | | | Wright Medical Group NV* (Health Care Equipment & Supplies) | | | 167,378 | |
| | 1,281 | | | X5 Retail Group NV GDR (Food & Staples Retailing) | | | 42,862 | |
| | | | | | | | |
| | | | | | | 6,499,202 | |
| | |
| New Zealand – 0.1% | |
| | 8,274 | | | Contact Energy Ltd. (Electric Utilities) | | | 39,133 | |
| | 1,675 | | | Fisher & Paykel Healthcare Corp. Ltd. (Health Care Equipment & Supplies) | | | 20,544 | |
| | 7,060 | | | Fletcher Building Ltd. (Construction Materials) | | | 20,743 | |
| | |
|
| Common Stocks – (continued) | |
| New Zealand – (continued) | |
| | 13,724 | | | Meridian Energy Ltd. (Independent Power and Renewable Electricity Producers) | | | 40,454 | |
| | 59,671 | | | Spark New Zealand Ltd. (Diversified Telecommunication Services) | | | 171,176 | |
| | 406 | | | Xero Ltd.* (Software) | | | 19,259 | |
| | | | | | | | |
| | | | | | | 311,309 | |
| | |
| Norway – 0.1% | |
| | 72,287 | | | DNO ASA (Oil, Gas & Consumable Fuels) | | | 87,845 | |
| | 4,901 | | | Entra ASA(a) (Real Estate Management & Development) | | | 73,393 | |
| | 1,762 | | | Equinor ASA (Oil, Gas & Consumable Fuels) | | | 32,713 | |
| | 1,906 | | | Mowi ASA (Food Products) | | | 46,529 | |
| | 8,515 | | | Norsk Hydro ASA (Metals & Mining) | | | 30,088 | |
| | 6,728 | | | Orkla ASA (Food Products) | | | 64,669 | |
| | 1,486 | | | Telenor ASA (Diversified Telecommunication Services) | | | 27,812 | |
| | 722 | | | Yara International ASA (Chemicals) | | | 28,126 | |
| | | | | | | | |
| | | | | | | 391,175 | |
| | |
| Pakistan – 0.0% | |
| | 57,241 | | | Oil & Gas Development Co. Ltd. (Oil, Gas & Consumable Fuels) | | | 47,348 | |
| | |
| Panama – 0.0% | |
| | 1,319 | | | Carnival Corp. (Hotels, Restaurants & Leisure) | | | 56,572 | |
| | |
| Peru – 0.0% | |
| | 1,671 | | | Cia de Minas Buenaventura SAA ADR (Metals & Mining) | | | 25,633 | |
| | 24 | | | Credicorp Ltd. (Banks) | | | 5,137 | |
| | | | | | | | |
| | | | | | | 30,770 | |
| | |
| Philippines – 0.0% | |
| | 23 | | | GT Capital Holdings, Inc. (Industrial Conglomerates) | | | 405 | |
| | 16,728 | | | International Container Terminal Services, Inc. (Transportation Infrastructure) | | | 39,106 | |
| | 10,440 | | | JG Summit Holdings, Inc. (Industrial Conglomerates) | | | 15,670 | |
| | 2,580 | | | Jollibee Foods Corp. (Hotels, Restaurants & Leisure) | | | 11,789 | |
| | 1,770 | | | Manila Electric Co. (Electric Utilities) | | | 11,804 | |
| | 6,900 | | | Metro Pacific Investments Corp. (Diversified Financial Services) | | | 652 | |
| | 592 | | | Metropolitan Bank & Trust Co. (Banks) | | | 788 | |
| | 2,384 | | | PLDT, Inc. (Wireless Telecommunication Services) | | | 51,302 | |
| | 1,560 | | | Universal Robina Corp. (Food Products) | | | 4,634 | |
| | | | | | | | |
| | | | | | | 136,150 | |
| | |
| | |
| 36 | | The accompanying notes are an integral part of these financial statements. |
GOLDMAN SACHS MULTI-MANAGER GLOBAL EQUITY FUND
| | | | | | | | |
Shares | | | Description | | Value | |
|
| Common Stocks – (continued) | |
| Poland – 0.1% | |
| | 1,042 | | | Bank Millennium SA* (Banks) | | $ | 1,677 | |
| | 906 | | | CD Projekt SA (Entertainment) | | | 59,808 | |
| | 2,101 | | | Cyfrowy Polsat SA (Media) | | | 15,240 | |
| | 577 | | | Grupa Lotos SA (Oil, Gas & Consumable Fuels) | | | 14,410 | |
| | 5,235 | | | Jastrzebska Spolka Weglowa SA (Metals & Mining) | | | 26,600 | |
| | 226 | | | KGHM Polska Miedz SA* (Metals & Mining) | | | 4,955 | |
| | 1 | | | LPP SA (Textiles, Apparel & Luxury Goods) | | | 2,136 | |
| | 6,624 | | | PGE Polska Grupa Energetyczna SA* (Electric Utilities) | | | 14,203 | |
| | 748 | | | Polski Koncern Naftowy ORLEN SA (Oil, Gas & Consumable Fuels) | | | 20,453 | |
| | 5,139 | | | Polskie Gornictwo Naftowe i Gazownictwo SA (Oil, Gas & Consumable Fuels) | | | 6,331 | |
| | 23,232 | | | Powszechna Kasa Oszczednosci Bank Polski SA (Banks) | | | 231,969 | |
| | 71 | | | Santander Bank Polska SA (Banks) | | | 5,824 | |
| | | | | | | | |
| | | | | | | 403,606 | |
| | |
| Portugal – 0.1% | |
| | 545,095 | | | Banco Comercial Portugues SA Class R (Banks) | | | 123,613 | |
| | 17,411 | | | EDP – Energias de Portugal SA (Electric Utilities) | | | 71,720 | |
| | 14,872 | | | Galp Energia SGPS SA (Oil, Gas & Consumable Fuels) | | | 237,874 | |
| | 1,767 | �� | | Jeronimo Martins SGPS SA (Food & Staples Retailing) | | | 29,692 | |
| | 93,052 | | | Sonae SGPS SA (Food & Staples Retailing) | | | 93,884 | |
| | | | | | | | |
| | | | | | | 556,783 | |
| | |
| Puerto Rico – 0.0% | |
| | 1,472 | | | EVERTEC, Inc. (IT Services) | | | 45,029 | |
| | 900 | | | Popular, Inc. (Banks) | | | 49,014 | |
| | | | | | | | |
| | | | | | | 94,043 | |
| | |
| Qatar – 0.0% | |
| | 4,556 | | | Barwa Real Estate Co. (Real Estate Management & Development) | | | 4,278 | |
| | 16,592 | | | Masraf Al Rayan QSC (Banks) | | | 17,083 | |
| | 11,586 | | | Ooredoo QPSC (Diversified Telecommunication Services) | | | 23,252 | |
| | 2,900 | | | Qatar Fuel QSC (Oil, Gas & Consumable Fuels) | | | 17,619 | |
| | 42,422 | | | Qatar Gas Transport Co. Ltd. (Oil, Gas & Consumable Fuels) | | | 28,778 | |
| | 4,428 | | | Qatar Islamic Bank SAQ (Banks) | | | 18,510 | |
| | 21,615 | | | The Commercial Bank PQSC (Banks) | | | 25,499 | |
| | | | | | | | |
| | | | | | | 135,019 | |
| | |
|
| Common Stocks – (continued) | |
| Romania – 0.0% | |
| | 1,157 | | | NEPI Rockcastle PLC (Real Estate Management & Development) | | | 10,069 | |
| | |
| Russia – 0.3% | |
| | 6,360 | | | Alrosa PJSC* (Metals & Mining) | | | 7,393 | |
| | 6,240 | | | Gazprom PJSC (Oil, Gas & Consumable Fuels) | | | 25,314 | |
| | 8,201 | | | Gazprom PJSC ADR (Oil, Gas & Consumable Fuels) | | | 65,711 | |
| | 129,058 | | | Inter RAO UES PJSC (Electric Utilities) | | | 8,698 | |
| | 145 | | | Lukoil PJSC (Oil, Gas & Consumable Fuels) | | | 13,396 | |
| | 7,374 | | | Lukoil PJSC ADR (Oil, Gas & Consumable Fuels) | | | 678,850 | |
| | 1,103 | | | Mail.Ru Group Ltd. GDR* (Interactive Media & Services) | | | 23,428 | |
| | 39 | | | MMC Norilsk Nickel PJSC (Metals & Mining) | | | 10,881 | |
| | 5,275 | | | MMC Norilsk Nickel PJSC ADR (Metals & Mining) | | | 146,302 | |
| | 102 | | | Novatek PJSC GDR (Oil, Gas & Consumable Fuels) | | | 21,828 | |
| | 8,230 | | | Novolipetsk Steel PJSC (Metals & Mining) | | | 16,063 | |
| | 275 | | | PhosAgro PJSC GDR (Chemicals) | | | 3,459 | |
| | 3,580 | | | Rosneft Oil Co. PJSC (Oil, Gas & Consumable Fuels) | | | 23,814 | |
| | 4,150 | | | Sberbank of Russia PJSC (Banks) | | | 15,209 | |
| | 507 | | | Severstal PJSC (Metals & Mining) | | | 6,980 | |
| | 9,600 | | | Surgutneftegas PJSC (Oil, Gas & Consumable Fuels) | | | 6,442 | |
| | 630 | | | Tatneft PJSC (Oil, Gas & Consumable Fuels) | | | 7,363 | |
| | 27,347,553 | | | VTB Bank PJSC (Banks) | | | 18,378 | |
| | 178,905 | | | VTB Bank PJSC GDR (Banks) | | | 237,765 | |
| | | | | | | | |
| | | | | | | 1,337,274 | |
| | |
| Singapore – 0.3% | |
| | 9,000 | | | Ascendas Real Estate Investment Trust (Equity Real Estate Investment Trusts (REITs)) | | | 20,961 | |
| | 26,588 | | | CapitaLand Commercial Trust (Equity Real Estate Investment Trusts (REITs)) | | | 40,041 | |
| | 9,000 | | | CapitaLand Ltd. (Real Estate Management & Development) | | | 23,789 | |
| | 13,700 | | | CapitaLand Mall Trust (Equity Real Estate Investment Trusts (REITs)) | | | 25,562 | |
| | 1,100 | | | City Developments Ltd. (Real Estate Management & Development) | | | 8,711 | |
| | 83,800 | | | ComfortDelGro Corp. Ltd. (Road & Rail) | | | 141,512 | |
| | 24,600 | | | DBS Group Holdings Ltd. (Banks) | | | 468,897 | |
| | 107,600 | | | Frasers Logistics & Industrial Trust (Equity Real Estate Investment Trusts (REITs)) | | | 99,582 | |
| | |
| | |
| The accompanying notes are an integral part of these financial statements. | | 37 |
GOLDMAN SACHS MULTI-MANAGER GLOBAL EQUITY FUND
Schedule of Investments(continued)
October 31, 2019
| | | | | | | | |
Shares | | | Description | | Value | |
|
| Common Stocks – (continued) | |
| Singapore – (continued) | |
| | 23,300 | | | Genting Singapore Ltd. (Hotels, Restaurants & Leisure) | | $ | 16,075 | |
| | 4,200 | | | Keppel Corp. Ltd. (Industrial Conglomerates) | | | 21,149 | |
| | 103,821 | | | Mapletree Commercial Trust (Equity Real Estate Investment Trusts (REITs)) | | | 177,709 | |
| | 78,000 | | | Mapletree North Asia Commercial Trust (Equity Real Estate Investment Trusts (REITs)) | | | 73,325 | |
| | 5,500 | | | SATS Ltd. (Transportation Infrastructure) | | | 20,397 | |
| | 4,600 | | | Singapore Airlines Ltd. (Airlines) | | | 31,794 | |
| | 4,900 | | | Singapore Exchange Ltd. (Capital Markets) | | | 32,171 | |
| | 1,900 | | | Singapore Press Holdings Ltd. (Media) | | | 3,092 | |
| | 8,800 | | | Singapore Technologies Engineering Ltd. (Aerospace & Defense) | | | 25,778 | |
| | 6,600 | | | Singapore Telecommunications Ltd. (Diversified Telecommunication Services) | | | 15,973 | |
| | 18,700 | | | Suntec Real Estate Investment Trust (Equity Real Estate Investment Trusts (REITs)) | | | 25,546 | |
| | 469 | | | United Overseas Bank Ltd. (Banks) | | | 9,233 | |
| | 23,141 | | | UOL Group Ltd. (Real Estate Management & Development) | | | 132,503 | |
| | 2,500 | | | Venture Corp. Ltd. (Electronic Equipment, Instruments & Components) | | | 28,999 | |
| | 22,500 | | | Wilmar International Ltd. (Food Products) | | | 61,863 | |
| | | | | | | | |
| | | | | | | 1,504,662 | |
| | |
| South Africa – 0.5% | |
| | 1,060 | | | Absa Group Ltd. (Banks) | | | 10,871 | |
| | 4,005 | | | African Rainbow Minerals Ltd. (Metals & Mining) | | | 40,125 | |
| | 7,907 | | | Anglo American Platinum Ltd. (Metals & Mining) | | | 590,091 | |
| | 832 | | | AngloGold Ashanti Ltd. (Metals & Mining) | | | 18,402 | |
| | 5,339 | | | AngloGold Ashanti Ltd. ADR (Metals & Mining) | | | 117,885 | |
| | 2,064 | | | Aspen Pharmacare Holdings Ltd.* (Pharmaceuticals) | | | 14,409 | |
| | 755 | | | AVI Ltd. (Food Products) | | | 4,328 | |
| | 4,072 | | | Barloworld Ltd. (Trading Companies & Distributors) | | | 32,433 | |
| | 396 | | | Bid Corp. Ltd. (Food & Staples Retailing) | | | 9,238 | |
| | 24,619 | | | Exxaro Resources Ltd. (Oil, Gas & Consumable Fuels) | | | 201,274 | |
| | 9,377 | | | Fortress REIT Ltd. Class A (Equity Real Estate Investment Trusts (REITs)) | | | 13,038 | |
| | 3,503 | | | Gold Fields Ltd. (Metals & Mining) | | | 21,755 | |
| | 3,448 | | | Growthpoint Properties Ltd. (Equity Real Estate Investment Trusts (REITs)) | | | 5,049 | |
| | |
|
| Common Stocks – (continued) | |
| South Africa – (continued) | |
| | 930 | | | Hyprop Investments Ltd. (Equity Real Estate Investment Trusts (REITs)) | | | 3,631 | |
| | 10,827 | | | Impala Platinum Holdings Ltd.* (Metals & Mining) | | | 74,544 | |
| | 574 | | | Investec Ltd. (Capital Markets) | | | 3,262 | |
| | 4,268 | | | Kumba Iron Ore Ltd. (Metals & Mining) | | | 103,994 | |
| | 44,451 | | | MTN Group Ltd. (Wireless Telecommunication Services) | | | 275,133 | |
| | 2,687 | | | Naspers Ltd. Class N (Internet & Direct Marketing Retail) | | | 380,233 | |
| | 5,402 | | | Old Mutual Ltd. (Insurance) | | | 7,025 | |
| | 29,624 | | | Redefine Properties Ltd. (Equity Real Estate Investment Trusts (REITs)) | | | 14,782 | |
| | 2,816 | | | Sappi Ltd. (Paper & Forest Products) | | | 7,231 | |
| | 320 | | | Sasol Ltd. (Chemicals) | | | 5,801 | |
| | 28,937 | | | Sibanye Gold Ltd.* (Metals & Mining) | | | 55,869 | |
| | 30,613 | | | Telkom SA SOC Ltd. (Diversified Telecommunication Services) | | | 139,946 | |
| | 21 | | | The Bidvest Group Ltd. (Industrial Conglomerates) | | | 287 | |
| | 1,065 | | | The Foschini Group Ltd. (Specialty Retail) | | | 12,283 | |
| | 520 | | | The SPAR Group Ltd. (Food & Staples Retailing) | | | 6,996 | |
| | 772 | | | Tiger Brands Ltd. (Food Products) | | | 10,962 | |
| | 3,232 | | | Woolworths Holdings Ltd. (Multiline Retail) | | | 12,288 | |
| | | | | | | | |
| | | | | | | 2,193,165 | |
| | |
| South Korea – 1.8% | |
| | 1,478 | | | AfreecaTV Co. Ltd. (Interactive Media & Services) | | | 93,709 | |
| | 195 | | | AMOREPACIFIC Group (Personal Products) | | | 14,132 | |
| | 2,792 | | | BS Financial Group, Inc. (Banks) | | | 16,675 | |
| | 63 | | | CJ CheilJedang Corp. (Food Products) | | | 12,383 | |
| | 136 | | | CJ Corp. (Industrial Conglomerates) | | | 9,613 | |
| | 108 | | | CJ ENM Co. Ltd. (Internet & Direct Marketing Retail) | | | 15,285 | |
| | 1,315 | | | Daelim Industrial Co. Ltd. (Construction & Engineering) | | | 102,214 | |
| | 386 | | | DB Insurance Co. Ltd. (Insurance) | | | 16,735 | |
| | 575 | | | DGB Financial Group, Inc. (Banks) | | | 3,471 | |
| | 16 | | | E-MART, Inc. (Food & Staples Retailing) | | | 1,530 | |
| | 173 | | | GS Engineering & Construction Corp. (Construction & Engineering) | | | 4,580 | |
| | 245 | | | GS Holdings Corp. (Oil, Gas & Consumable Fuels) | | | 10,441 | |
| | 6,956 | | | Hana Financial Group, Inc. (Banks) | | | 201,394 | |
| | 568 | | | Hankook Tire & Technology Co. Ltd. (Auto Components) | | | 15,146 | |
| | 3,284 | | | Hanwha Life Insurance Co. Ltd. (Insurance) | | | 6,285 | |
| | 148 | | | Hyundai Department Store Co. Ltd. (Multiline Retail) | | | 9,397 | |
| | |
| | |
| 38 | | The accompanying notes are an integral part of these financial statements. |
GOLDMAN SACHS MULTI-MANAGER GLOBAL EQUITY FUND
| | | | | | | | |
Shares | | | Description | | Value | |
|
| Common Stocks – (continued) | |
| South Korea – (continued) | |
| | 133 | | | Hyundai Glovis Co. Ltd. (Air Freight & Logistics) | | $ | 17,228 | |
| | 233 | | | Hyundai Marine & Fire Insurance Co. Ltd. (Insurance) | | | 5,060 | |
| | 2,407 | | | Hyundai Mobis Co. Ltd. (Auto Components) | | | 490,868 | |
| | 2,385 | | | Hyundai Motor Co. (Automobiles) | | | 249,815 | |
| | 9,365 | | | Industrial Bank of Korea (Banks) | | | 94,843 | |
| | 386 | | | Kangwon Land, Inc. (Hotels, Restaurants & Leisure) | | | 10,393 | |
| | 6,297 | | | KB Financial Group, Inc. (Banks) | | | 226,688 | |
| | 17 | | | KCC Corp. (Building Products) | | | 3,300 | |
| | 11,065 | | | Kia Motors Corp. (Automobiles) | | | 404,397 | |
| | 821 | | | Korea Electric Power Corp.* (Electric Utilities) | | | 17,948 | |
| | 1,100 | | | Korea Investment Holdings Co. Ltd. (Capital Markets) | | | 63,904 | |
| | 48 | | | Korea Zinc Co. Ltd. (Metals & Mining) | | | 17,886 | |
| | 12,055 | | | KT Corp. ADR (Diversified Telecommunication Services) | | | 135,378 | |
| | 326 | | | KT&G Corp. (Tobacco) | | | 27,984 | |
| | 41 | | | LG Corp. (Industrial Conglomerates) | | | 2,444 | |
| | 17 | | | LG Household & Health Care Ltd. (Personal Products) | | | 18,396 | |
| | 1,823 | | | LG Uplus Corp. (Diversified Telecommunication Services) | | | 21,060 | |
| | 55 | | | Lotte Chemical Corp. (Chemicals) | | | 10,700 | |
| | 46 | | | Lotte Shopping Co. Ltd. (Multiline Retail) | | | 4,917 | |
| | 857 | | | NH Investment & Securities Co. Ltd. (Capital Markets) | | | 8,887 | |
| | 59 | | | OCI Co. Ltd. (Chemicals) | | | 3,179 | |
| | 7,946 | | | Partron Co. Ltd. (Electronic Equipment, Instruments & Components) | | | 80,577 | |
| | 1,878 | | | POSCO (Metals & Mining) | | | 340,755 | |
| | 215 | | | S-1 Corp. (Commercial Services & Supplies) | | | 17,315 | |
| | 163 | | | Samsung C&T Corp. (Industrial Conglomerates) | | | 13,958 | |
| | 32 | | | Samsung Electro-Mechanics Co. Ltd. (Electronic Equipment, Instruments & Components) | | | 3,098 | |
| | 44,459 | | | Samsung Electronics Co. Ltd. (Technology Hardware, Storage & Peripherals) | | | 1,921,511 | |
| | 1,244 | | | Samsung Electronics Co. Ltd. GDR (Technology Hardware, Storage & Peripherals) | | | 1,329,821 | |
| | 6,649 | | | Samsung Engineering Co. Ltd.* (Construction & Engineering) | | | 101,504 | |
| | 119 | | | Samsung Fire & Marine Insurance Co. Ltd. (Insurance) | | | 22,137 | |
| | 17 | | | Samsung Life Insurance Co. Ltd. (Insurance) | | | 1,032 | |
| | 56 | | | Samsung SDS Co. Ltd. (IT Services) | | | 9,672 | |
| | |
|
| Common Stocks – (continued) | |
| South Korea – (continued) | |
| | 108 | | | Samsung Securities Co. Ltd. (Capital Markets) | | | 3,111 | |
| | 16,148 | | | Shinhan Financial Group Co. Ltd. (Banks) | | | 588,354 | |
| | 32 | | | Shinsegae, Inc. (Multiline Retail) | | | 6,485 | |
| | 102 | | | SK Holdings Co. Ltd. (Industrial Conglomerates) | | | 22,629 | |
| | 174 | | | SK Hynix, Inc. (Semiconductors & Semiconductor Equipment) | | | 12,235 | |
| | 1,515 | | | SK Innovation Co. Ltd. (Oil, Gas & Consumable Fuels) | | | 207,306 | |
| | 161 | | | SK Telecom Co. Ltd. (Wireless Telecommunication Services) | | | 32,908 | |
| | 49,659 | | | SK Telecom Co. Ltd. ADR (Wireless Telecommunication Services) | | | 1,144,640 | |
| | 8,964 | | | Woori Financial Group, Inc. (Banks) | | | 90,373 | |
| | 55 | | | Yuhan Corp. (Pharmaceuticals) | | | 10,602 | |
| | | | | | | | |
| | | | | | | 8,328,288 | |
| | |
| Spain – 0.6% | |
| | 236 | | | ACS Actividades de Construccion y Servicios SA (Construction & Engineering) | | | 9,576 | |
| | 92 | | | Aena SME SA(a) (Transportation Infrastructure) | | | 16,888 | |
| | 3,097 | | | Almirall SA (Pharmaceuticals) | | | 58,168 | |
| | 19,372 | | | Amadeus IT Group SA (IT Services) | | | 1,433,107 | |
| | 1,571 | | | Banco Bilbao Vizcaya Argentaria SA (Banks) | | | 8,274 | |
| | 1,878 | | | Banco Santander SA (Banks) | | | 7,541 | |
| | 1,872 | | | Bankinter SA (Banks) | | | 12,965 | |
| | 195,404 | | | CaixaBank SA (Banks) | | | 560,340 | |
| | 1,714 | | | Enagas SA (Gas Utilities) | | | 42,412 | |
| | 1,200 | | | Endesa SA (Electric Utilities) | | | 32,682 | |
| | 1,048 | | | Ferrovial SA (Construction & Engineering) | | | 30,919 | |
| | 4,198 | | | Iberdrola SA (Electric Utilities) | | | 43,151 | |
| | 13,479 | | | Indra Sistemas SA* (IT Services) | | | 130,208 | |
| | 9,234 | | | Inmobiliaria Colonial Socimi SA (Equity Real Estate Investment Trusts (REITs)) | | | 119,325 | |
| | 13,336 | | | Merlin Properties Socimi SA (Equity Real Estate Investment Trusts (REITs)) | | | 196,317 | |
| | 2,126 | | | Naturgy Energy Group SA (Gas Utilities) | | | 57,923 | |
| | 745 | | | Red Electrica Corp. SA (Electric Utilities) | | | 14,973 | |
| | 2,753 | | | Repsol SA (Oil, Gas & Consumable Fuels) | | | 45,369 | |
| | 2,901 | | | Telefonica SA (Diversified Telecommunication Services) | | | 22,278 | |
| | | | | | | | |
| | | | | | | 2,842,416 | |
| | |
| Sweden – 0.5% | |
| | 6,240 | | | AAK AB (Food Products) | | | 110,692 | |
| | 91 | | | Alfa Laval AB (Machinery) | | | 2,106 | |
| | |
| | |
| The accompanying notes are an integral part of these financial statements. | | 39 |
GOLDMAN SACHS MULTI-MANAGER GLOBAL EQUITY FUND
Schedule of Investments(continued)
October 31, 2019
| | | | | | | | |
Shares | | | Description | | Value | |
|
| Common Stocks – (continued) | |
| Sweden – (continued) | |
| | 1,207 | | | Assa Abloy AB Class B (Building Products) | | $ | 28,664 | |
| | 14,252 | | | Atlas Copco AB Class A (Machinery) | | | 503,046 | |
| | 678 | | | Boliden AB (Metals & Mining) | | | 18,284 | |
| | 10,744 | | | Castellum AB (Real Estate Management & Development) | | | 219,561 | |
| | 1,752 | | | Electrolux AB Series B (Household Durables) | | | 46,062 | |
| | 8,234 | | | Elekta AB Class B (Health Care Equipment & Supplies) | | | 114,706 | |
| | 2,201 | | | Epiroc AB Class A (Machinery) | | | 24,799 | |
| | 12,073 | | | Essity AB Class B (Household Products) | | | 377,169 | |
| | 1,636 | | | Hennes & Mauritz AB Class B (Specialty Retail) | | | 34,290 | |
| | 699 | | | Hexagon AB Class B (Electronic Equipment, Instruments & Components) | | | 35,787 | |
| | 19,151 | | | Husqvarna AB Class B (Household Durables) | | | 146,714 | |
| | 1,124 | | | ICA Gruppen AB (Food & Staples Retailing) | | | 49,739 | |
| | 1,103 | | | Industrivarden AB Class C (Diversified Financial Services) | | | 23,898 | |
| | 534 | | | Investor AB Class B (Diversified Financial Services) | | | 27,397 | |
| | 832 | | | Kinnevik AB Class B (Diversified Financial Services) | | | 22,770 | |
| | 3,960 | | | Loomis AB Class B (Commercial Services & Supplies) | | | 153,329 | |
| | 6,176 | | | Mycronic AB (Electronic Equipment, Instruments & Components) | | | 102,801 | |
| | 1,177 | | | Nibe Industrier AB Class B (Building Products) | | | 16,116 | |
| | 2,356 | | | Sandvik AB (Machinery) | | | 41,624 | |
| | 2,860 | | | Securitas AB Class B (Commercial Services & Supplies) | | | 45,795 | |
| | 1,502 | | | SKF AB Class B (Machinery) | | | 27,195 | |
| | 2,904 | | | Svenska Cellulosa AB SCA Class B (Paper & Forest Products) | | | 29,633 | |
| | 939 | | | Swedish Match AB (Tobacco) | | | 44,113 | |
| | 4,991 | | | Telefonaktiebolaget LM Ericsson Class B (Communications Equipment) | | | 43,615 | |
| | 3,944 | | | Telia Co. AB (Diversified Telecommunication Services) | | | 17,349 | |
| | 1,420 | | | Trelleborg AB Class B (Machinery) | | | 22,962 | |
| | | | | | | | |
| | | | | | | 2,330,216 | |
| | |
| Switzerland – 3.3% | |
| | 67,288 | | | ABB Ltd. (Electrical Equipment) | | | 1,413,047 | |
| | 438 | | | Adecco Group AG (Professional Services) | | | 26,037 | |
| | 12,859 | | | Alcon, Inc.* (Health Care Equipment & Supplies) | | | 760,457 | |
| | 179,588 | | | Aryzta AG* (Food Products) | | | 141,862 | |
| | 206 | | | Baloise Holding AG (Insurance) | | | 38,100 | |
| | 7 | | | Barry Callebaut AG (Food Products) | | | 14,793 | |
| | |
|
| Common Stocks – (continued) | |
| Switzerland – (continued) | |
| | 415 | | | Bucher Industries AG (Machinery) | | | 128,452 | |
| | 1,457 | | | Cembra Money Bank AG (Consumer Finance) | | | 154,508 | |
| | 5,744 | | | Chubb Ltd. (Insurance) | | | 875,500 | |
| | 6,221 | | | Cie Financiere Richemont SA (Textiles, Apparel & Luxury Goods) | | | 488,853 | |
| | 1,756 | | | Clariant AG* (Chemicals) | | | 36,020 | |
| | 1,030 | | | Coca-Cola HBC AG* (Beverages) | | | 31,362 | |
| | 1,240 | | | Credit Suisse Group AG* (Capital Markets) | | | 15,349 | |
| | 244 | | | Dufry AG* (Specialty Retail) | | | 21,222 | |
| | 32 | | | EMS-Chemie Holding AG (Chemicals) | | | 20,048 | |
| | 1,013 | | | Geberit AG (Building Products) | | | 514,695 | |
| | 39 | | | Georg Fischer AG (Machinery) | | | 37,247 | |
| | 10 | | | Givaudan SA (Chemicals) | | | 29,379 | |
| | 2,151 | | | Glencore PLC* (Metals & Mining) | | | 6,492 | |
| | 329 | | | Helvetia Holding AG (Insurance) | | | 46,214 | |
| | 6,223 | | | Julius Baer Group Ltd.* (Capital Markets) | | | 275,577 | |
| | 150 | | | Kuehne & Nagel International AG (Marine) | | | 24,234 | |
| | 447 | | | LafargeHolcim Ltd.* (Construction Materials) | | | 23,073 | |
| | 141 | | | Logitech International SA (Technology Hardware, Storage & Peripherals) | | | 5,788 | |
| | 57 | | | Lonza Group AG* (Life Sciences Tools & Services) | | | 20,545 | |
| | 23,618 | | | Nestle SA (Food Products) | | | 2,526,685 | |
| | 19,715 | | | Novartis AG (Pharmaceuticals) | | | 1,722,602 | |
| | 345 | | | Pargesa Holding SA (Diversified Financial Services) | | | 27,272 | |
| | 1,840 | | | PSP Swiss Property AG (Real Estate Management & Development) | | | 243,552 | |
| | 6,842 | | | Roche Holding AG (Pharmaceuticals) | | | 2,059,140 | |
| | 76 | | | Schindler Holding AG (Machinery) | | | 18,620 | |
| | 7 | | | SGS SA (Professional Services) | | | 18,257 | |
| | 5,043 | | | Sika AG (Chemicals) | | | 866,924 | |
| | 128 | | | Sonova Holding AG (Health Care Equipment & Supplies) | | | 29,373 | |
| | 5 | | | Straumann Holding AG (Health Care Equipment & Supplies) | | | 4,467 | |
| | 102 | | | Swiss Life Holding AG (Insurance) | | | 51,083 | |
| | 272 | | | Swiss Prime Site AG* (Real Estate Management & Development) | | | 28,035 | |
| | 10,300 | | | Swiss Re AG (Insurance) | | | 1,080,354 | |
| | 107 | | | Swisscom AG (Diversified Telecommunication Services) | | | 54,730 | |
| | 578 | | | TE Connectivity Ltd. (Electronic Equipment, Instruments & Components) | | | 51,731 | |
| | 97 | | | The Swatch Group AG (Textiles, Apparel & Luxury Goods) | | | 26,896 | |
| | 51,506 | | | UBS Group AG* (Capital Markets) | | | 609,582 | |
| | 357 | | | Valora Holding AG* (Specialty Retail) | | | 102,244 | |
| | 1,670 | | | Wizz Air Holdings PLC*(a) (Airlines) | | | 82,699 | |
| | 1,645 | | | Zurich Insurance Group AG (Insurance) | | | 644,347 | |
| | | | | | | | |
| | | | | | | 15,397,447 | |
| | |
| | |
| 40 | | The accompanying notes are an integral part of these financial statements. |
GOLDMAN SACHS MULTI-MANAGER GLOBAL EQUITY FUND
| | | | | | | | |
Shares | | | Description | | Value | |
|
| Common Stocks – (continued) | |
| Taiwan – 1.6% | |
| | 15,047 | | | Accton Technology Corp. (Communications Equipment) | | $ | 89,510 | |
| | 3,000 | | | Acer, Inc. (Technology Hardware, Storage & Peripherals) | | | 1,750 | |
| | 2,000 | | | Advantech Co. Ltd. (Technology Hardware, Storage & Peripherals) | | | 19,760 | |
| | 314,548 | | | Asia Cement Corp. (Construction Materials) | | | 444,024 | |
| | 1,000 | | | Asustek Computer, Inc. (Technology Hardware, Storage & Peripherals) | | | 6,784 | |
| | 82,000 | | | AU Optronics Corp. (Electronic Equipment, Instruments & Components) | | | 20,907 | |
| | 6,000 | | | Cathay Financial Holding Co. Ltd. (Insurance) | | | 7,942 | |
| | 14,741 | | | Chang Hwa Commercial Bank Ltd. (Banks) | | | 11,502 | |
| | 9,000 | | | Cheng Shin Rubber Industry Co. Ltd. (Auto Components) | | | 14,145 | |
| | 3,040 | | | Chicony Electronics Co. Ltd. (Technology Hardware, Storage & Peripherals) | | | 9,445 | |
| | 16,000 | | | China Development Financial Holding Corp. (Insurance) | | | 4,990 | |
| | 11,203 | | | China Life Insurance Co. Ltd.* (Insurance) | | | 9,233 | |
| | 16,000 | | | China Steel Corp. (Metals & Mining) | | | 12,320 | |
| | 10,000 | | | Chunghwa Telecom Co. Ltd. (Diversified Telecommunication Services) | | | 36,825 | |
| | 24,000 | | | Compal Electronics, Inc. (Technology Hardware, Storage & Peripherals) | | | 14,327 | |
| | 35,576 | | | Compeq Manufacturing Co. Ltd. (Electronic Equipment, Instruments & Components) | | | 49,769 | |
| | 9,000 | | | CTBC Financial Holding Co. Ltd. (Banks) | | | 6,257 | |
| | 3,000 | | | Delta Electronics, Inc. (Electronic Equipment, Instruments & Components) | | | 13,171 | |
| | 15,083 | | | E.Sun Financial Holding Co. Ltd. (Banks) | | | 13,628 | |
| | 1,000 | | | Eclat Textile Co. Ltd. (Textiles, Apparel & Luxury Goods) | | | 13,409 | |
| | 38,124 | | | Elite Material Co Ltd. (Electronic Equipment, Instruments & Components) | | | 158,356 | |
| | 14,000 | | | Far Eastern New Century Corp. (Industrial Conglomerates) | | | 13,616 | |
| | 5,000 | | | Far EasTone Telecommunications Co. Ltd. (Wireless Telecommunication Services) | | | 11,997 | |
| | 25,533 | | | Feng TAY Enterprise Co. Ltd. (Textiles, Apparel & Luxury Goods) | | | 172,484 | |
| | 13,917 | | | First Financial Holding Co. Ltd. (Banks) | | | 10,205 | |
| | 2,500 | | | Formosa Chemicals & Fibre Corp. (Chemicals) | | | 7,267 | |
| | 2,000 | | | Formosa Petrochemical Corp. (Oil, Gas & Consumable Fuels) | | | 6,370 | |
| | |
|
| Common Stocks – (continued) | |
| Taiwan – (continued) | |
| | 2,000 | | | Formosa Plastic Corp. (Chemicals) | | | 6,420 | |
| | 73,394 | | | Foxconn Technology Co. Ltd. (Electronic Equipment, Instruments & Components) | | | 156,952 | |
| | 122,217 | | | Fubon Financial Holding Co. Ltd. (Insurance) | | | 178,808 | |
| | 1,000 | | | Giant Manufacturing Co. Ltd. (Leisure Products) | | | 7,394 | |
| | 5,000 | | | Highwealth Construction Corp. (Real Estate Management & Development) | | | 7,674 | |
| | 14,682 | | | Hua Nan Financial Holdings Co. Ltd. (Banks) | | | 10,551 | |
| | 44,000 | | | Innolux Corp. (Electronic Equipment, Instruments & Components) | | | 9,753 | |
| | 7,948 | | | International Games System Co. Ltd. (Entertainment) | | | 102,228 | |
| | 41,000 | | | Inventec Corp. (Technology Hardware, Storage & Peripherals) | | | 29,708 | |
| | 31,300 | | | ITEQ Corp. (Electronic Equipment, Instruments & Components) | | | 158,531 | |
| | 16,070 | | | Johnson Health Tech Co. Ltd. (Leisure Products) | | | 41,491 | |
| | 41,211 | | | King Yuan Electronics Co. Ltd. (Semiconductors & Semiconductor Equipment) | | | 51,624 | |
| | 120,340 | | | Lite-On Technology Corp. (Technology Hardware, Storage & Peripherals) | | | 198,299 | |
| | 79,279 | | | Macronix International (Semiconductors & Semiconductor Equipment) | | | 80,480 | |
| | 46,967 | | | MediaTek, Inc. (Semiconductors & Semiconductor Equipment) | | | 627,237 | |
| | 15,000 | | | Mega Financial Holding Co. Ltd. (Banks) | | | 14,722 | |
| | 3,000 | | | Micro-Star International Co. Ltd. (Technology Hardware, Storage & Peripherals) | | | 8,860 | |
| | 6,000 | | | Nan Ya Plastics Corp. (Chemicals) | | | 14,178 | |
| | 3,000 | | | Novatek Microelectronics Corp. (Semiconductors & Semiconductor Equipment) | | | 19,217 | |
| | 8,000 | | | Pegatron Corp. (Technology Hardware, Storage & Peripherals) | | | 15,534 | |
| | 1,000 | | | Phison Electronics Corp. (Semiconductors & Semiconductor Equipment) | | | 9,093 | |
| | 11,000 | | | Pou Chen Corp. (Textiles, Apparel & Luxury Goods) | | | 14,706 | |
| | 2,000 | | | President Chain Store Corp. (Food & Staples Retailing) | | | 19,952 | |
| | 6,000 | | | Quanta Computer, Inc. (Technology Hardware, Storage & Peripherals) | | | 11,510 | |
| | 58,488 | | | Radiant Opto-Electronics Corp. (Semiconductors & Semiconductor Equipment) | | | 232,214 | |
| | |
| | |
| The accompanying notes are an integral part of these financial statements. | | 41 |
GOLDMAN SACHS MULTI-MANAGER GLOBAL EQUITY FUND
Schedule of Investments(continued)
October 31, 2019
| | | | | | | | |
Shares | | | Description | | Value | |
|
| Common Stocks – (continued) | |
| Taiwan – (continued) | |
| | 20,096 | | | Realtek Semiconductor Corp. (Semiconductors & Semiconductor Equipment) | | $ | 149,071 | |
| | 5,800 | | | Ruentex Industries Ltd.* (Textiles, Apparel & Luxury Goods) | | | 13,926 | |
| | 31,980 | | | Shin Kong Financial Holding Co. Ltd.* (Insurance) | | | 10,103 | |
| | 29,744 | | | Shin Zu Shing Co. Ltd. (Machinery) | | | 117,958 | |
| | 2,000 | | | Simplo Technology Co. Ltd. (Electronic Equipment, Instruments & Components) | | | 18,422 | |
| | 272,521 | | | SinoPac Financial Holdings Co. Ltd. (Banks) | | | 111,844 | |
| | 6,000 | | | Synnex Technology International Corp. (Electronic Equipment, Instruments & Components) | | | 7,156 | |
| | 21,726 | | | Taishin Financial Holding Co. Ltd. (Banks) | | | 10,090 | |
| | 44,226 | | | Taiwan Business Bank (Banks) | | | 18,644 | |
| | 8,332 | | | Taiwan Cement Corp. (Construction Materials) | | | 11,062 | |
| | 6,561 | | | Taiwan Cooperative Financial Holding Co. Ltd. (Banks) | | | 4,514 | |
| | 5,000 | | | Taiwan Mobile Co. Ltd. (Wireless Telecommunication Services) | | | 18,643 | |
| | 108,305 | | | Taiwan Semiconductor Manufacturing Co. Ltd. (Semiconductors & Semiconductor Equipment) | | | 1,061,367 | |
| | 29,046 | | | Taiwan Semiconductor Manufacturing Co. Ltd. ADR (Semiconductors & Semiconductor Equipment) | | | 1,499,645 | |
| | 21,407 | | | Taiwan Surface Mounting Technology Corp. (Semiconductors & Semiconductor Equipment) | | | 69,984 | |
| | 19,000 | | | Teco Electric and Machinery Co. Ltd. (Electrical Equipment) | | | 16,847 | |
| | 9,731 | | | The Shanghai Commercial & Savings Bank Ltd. (Banks) | | | 16,733 | |
| | 4,000 | | | Tripod Technology Corp. (Electronic Equipment, Instruments & Components) | | | 15,459 | |
| | 121,199 | | | Uni-President Enterprises Corp. (Food Products) | | | 299,408 | |
| | 34,973 | | | Unitech Printed Circuit Board Corp. (Electronic Equipment, Instruments & Components) | | | 38,033 | |
| | 427,435 | | | United Microelectronics Corp. (Semiconductors & Semiconductor Equipment) | | | 196,842 | |
| | 7,000 | | | Vanguard International Semiconductor Corp. (Semiconductors & Semiconductor Equipment) | | | 14,956 | |
| | 11,000 | | | Walsin Lihwa Corp. (Electrical Equipment) | | | 5,379 | |
| | 5,094 | | | Win Semiconductors Corp. (Semiconductors & Semiconductor Equipment) | | | 53,023 | |
| | |
|
| Common Stocks – (continued) | |
| Taiwan – (continued) | |
| | 6,000 | | | Winbond Electronics Corp. (Semiconductors & Semiconductor Equipment) | | | 3,378 | |
| | 23,791 | | | Wistron Corp. (Technology Hardware, Storage & Peripherals) | | | 21,812 | |
| | 6,880 | | | WPG Holdings Ltd. (Electronic Equipment, Instruments & Components) | | | 8,722 | |
| | 265,223 | | | Yuanta Financial Holding Co. Ltd. (Capital Markets) | | | 165,756 | |
| | 25,216 | | | Zhen Ding Technology Holding Ltd. (Electronic Equipment, Instruments & Components) | | | 119,231 | |
| | | | | | | | |
| | | | | | | 7,305,137 | |
| | |
| Thailand – 0.3% | |
| | 22,709 | | | Advanced Info Service PCL (Wireless Telecommunication Services) | | | 172,271 | |
| | 2,600 | | | Advanced Info Service PCL NVDR (Wireless Telecommunication Services) | | | 19,724 | |
| | 7,800 | | | Airports of Thailand PCL NVDR (Transportation Infrastructure) | | | 20,210 | |
| | 14,300 | | | Bangkok Dusit Medical Services PCL NVDR (Health Care Providers & Services) | | | 11,368 | |
| | 7,000 | | | Berli Jucker PCL NVDR (Food & Staples Retailing) | | | 11,303 | |
| | 1,500 | | | Bumrungrad Hospital PCL NVDR (Health Care Providers & Services) | | | 5,987 | |
| | 125,245 | | | Charoen Pokphand Foods PCL (Food Products) | | | 104,773 | |
| | 18,200 | | | Charoen Pokphand Foods PCL NVDR (Food Products) | | | 15,225 | |
| | 2,500 | | | CP ALL PCL NVDR (Food & Staples Retailing) | | | 6,462 | |
| | 26,913 | | | Electricity Generating PCL (Independent Power and Renewable Electricity Producers) | | | 309,302 | |
| | 40,500 | | | Home Product Center PCL NVDR (Specialty Retail) | | | 23,065 | |
| | 64,500 | | | IRPC PCL NVDR (Oil, Gas & Consumable Fuels) | | | 7,263 | |
| | 53,686 | | | Krung Thai Bank PCL (Banks) | | | 29,514 | |
| | 33,200 | | | Krung Thai Bank PCL NVDR (Banks) | | | 18,252 | |
| | 64,293 | | | PTG Energy PCL (Specialty Retail) | | | 38,319 | |
| | 135,047 | | | PTT Exploration & Production PCL (Oil, Gas & Consumable Fuels) | | | 538,770 | |
| | 5,400 | | | PTT Exploration & Production PCL NVDR (Oil, Gas & Consumable Fuels) | | | 21,543 | |
| | 6,200 | | | PTT Global Chemical PCL NVDR (Chemicals) | | | 10,473 | |
| | 9,800 | | | PTT PCL NVDR (Oil, Gas & Consumable Fuels) | | | 14,685 | |
| | 25,300 | | | Thai Beverage PCL (Beverages) | | | 16,986 | |
| | 5,400 | | | Thai Oil PCL NVDR (Oil, Gas & Consumable Fuels) | | | 12,249 | |
| | |
| | |
| 42 | | The accompanying notes are an integral part of these financial statements. |
GOLDMAN SACHS MULTI-MANAGER GLOBAL EQUITY FUND
| | | | | | | | |
Shares | | | Description | | Value | |
|
| Common Stocks – (continued) | |
| Thailand – (continued) | |
| | 600 | | | The Siam Cement PCL NVDR (Construction Materials) | | $ | 7,296 | |
| | 37,766 | | | Tisco Financial Group PCL (Banks) | | | 121,918 | |
| | 281,200 | | | TMB Bank PCL NVDR (Banks) | | | 13,404 | |
| | 18,700 | | | True Corp. PCL NVDR (Diversified Telecommunication Services) | | | 3,098 | |
| | | | | | | | |
| | | | | | | 1,553,460 | |
| | |
| Turkey – 0.1% | |
| | 1,290 | | | BIM Birlesik Magazalar AS (Food & Staples Retailing) | | | 10,677 | |
| | 7,786 | | | Eregli Demir ve Celik Fabrikalari TAS (Metals & Mining) | | | 8,901 | |
| | 48,139 | | | Haci Omer Sabanci Holding AS (Diversified Financial Services) | | | 69,637 | |
| | 5,956 | | | KOC Holding AS (Industrial Conglomerates) | | | 19,523 | |
| | 9,173 | | | Pegasus Hava Tasimaciligi AS* (Airlines) | | | 105,928 | |
| | 31,896 | | | Tekfen Holding AS (Construction & Engineering) | | | 94,436 | |
| | 594 | | | Tupras Turkiye Petrol Rafinerileri AS (Oil, Gas & Consumable Fuels) | | | 12,929 | |
| | 1,237 | | | Turk Hava Yollari AO* (Airlines) | | | 2,517 | |
| | 5,069 | | | Turkcell Iletisim Hizmetleri AS (Wireless Telecommunication Services) | | | 11,146 | |
| | 23,785 | | | Turkiye Garanti Bankasi AS* (Banks) | | | 38,231 | |
| | 92,459 | | | Turkiye Is Bankasi AS Class C* (Banks) | | | 93,690 | |
| | 104,444 | | | Yapi ve Kredi Bankasi AS* (Banks) | | | 41,610 | |
| | | | | | | | |
| | | | | | | 509,225 | |
| | |
| United Arab Emirates – 0.1% | |
| | 11,148 | | | Abu Dhabi Commercial Bank PJSC (Banks) | | | 23,648 | |
| | 39,479 | | | Aldar Properties PJSC (Real Estate Management & Development) | | | 25,247 | |
| | 16,076 | | | Dubai Islamic Bank PJSC (Banks) | | | 23,142 | |
| | 82,547 | | | Emaar Properties PJSC (Real Estate Management & Development) | | | 95,937 | |
| | 39,551 | | | Emirates NBD PJSC (Banks) | | | 129,225 | |
| | 5,532 | | | Emirates Telecommunications Group Co. PJSC (Diversified Telecommunication Services) | | | 24,943 | |
| | 7,900 | | | First Abu Dhabi Bank PJSC (Banks) | | | 32,697 | |
| | | | | | | | |
| | | | | | | 354,839 | |
| | |
| United Kingdom – 6.3% | |
| | 1,901 | | | 3i Group PLC (Capital Markets) | | | 27,779 | |
| | 1,304 | | | Admiral Group PLC (Insurance) | | | 34,128 | |
| | 15,709 | | | Amcor PLC (Containers & Packaging) | | | 150,420 | |
| | 3,643 | | | Anglo American PLC (Metals & Mining) | | | 93,760 | |
| | 342 | | | Aon PLC (Insurance) | | | 66,061 | |
| | 10,661 | | | AstraZeneca PLC (Pharmaceuticals) | | | 1,039,631 | |
| | 6,597 | | | Auto Trader Group PLC(a) (Interactive Media & Services) | | | 48,068 | |
| | |
|
| Common Stocks – (continued) | |
| United Kingdom – (continued) | |
| | 153,909 | | | Aviva PLC (Insurance) | | | 829,577 | |
| | 4,963 | | | BAE Systems PLC (Aerospace & Defense) | | | 37,072 | |
| | 168,763 | | | Balfour Beatty PLC (Construction & Engineering) | | | 491,779 | |
| | 793,892 | | | Barclays PLC (Banks) | | | 1,722,009 | |
| | 6,371 | | | Barratt Developments PLC (Household Durables) | | | 52,101 | |
| | 731 | | | Bellway PLC (Household Durables) | | | 29,919 | |
| | 521 | | | Berkeley Group Holdings PLC (Household Durables) | | | 29,697 | |
| | 2,203 | | | BHP Group PLC (Metals & Mining) | | | 46,727 | |
| | 36,573 | | | Boohoo Group PLC* (Internet & Direct Marketing Retail) | | | 125,020 | |
| | 195,934 | | | BP PLC (Oil, Gas & Consumable Fuels) | | | 1,242,488 | |
| | 39,032 | | | British American Tobacco PLC (Tobacco) | | | 1,365,178 | |
| | 28,138 | | | BT Group PLC (Diversified Telecommunication Services) | | | 74,674 | |
| | 1,237 | | | Bunzl PLC (Trading Companies & Distributors) | | | 32,180 | |
| | 1,109 | | | Burberry Group PLC (Textiles, Apparel & Luxury Goods) | | | 29,407 | |
| | 7,118 | | | Burford Capital Ltd. (Capital Markets) | | | 81,040 | |
| | 7,900 | | | Capri Holdings Ltd.* (Textiles, Apparel & Luxury Goods) | | | 245,453 | |
| | 1,161 | | | Carnival PLC (Hotels, Restaurants & Leisure) | | | 46,460 | |
| | 48,423 | | | Centrica PLC (Multi-Utilities) | | | 45,569 | |
| | 45,883 | | | Cineworld Group PLC (Entertainment) | | | 132,215 | |
| | 6,231 | | | Clinigen Healthcare Ltd. (Life Sciences Tools & Services) | | | 67,073 | |
| | 126,851 | | | Cobham PLC (Aerospace & Defense) | | | 259,471 | |
| | 589 | | | Coca-Cola European Partners PLC (Beverages) | | | 31,517 | |
| | 57,506 | | | Compass Group PLC (Hotels, Restaurants & Leisure) | | | 1,531,045 | |
| | 4,203 | | | Computacenter PLC (IT Services) | | | 74,378 | |
| | 505 | | | Croda International PLC (Chemicals) | | | 31,508 | |
| | 1,170 | | | Derwent London PLC (Equity Real Estate Investment Trusts (REITs)) | | | 53,802 | |
| | 18,661 | | | Diageo PLC (Beverages) | | | 763,813 | |
| | 38,324 | | | Direct Line Insurance Group PLC (Insurance) | | | 135,121 | |
| | 37,481 | | | DS Smith PLC (Containers & Packaging) | | | 173,770 | |
| | 55,265 | | | Experian PLC (Professional Services) | | | 1,742,025 | |
| | 161 | | | Ferguson PLC (Trading Companies & Distributors) | | | 13,748 | |
| | 17,300 | | | Gates Industrial Corp. PLC* (Machinery) | | | 173,000 | |
| | 2,678 | | | GlaxoSmithKline PLC (Pharmaceuticals) | | | 61,339 | |
| | 17,097 | | | GVC Holdings PLC (Hotels, Restaurants & Leisure) | | | 197,244 | |
| | |
| | |
| The accompanying notes are an integral part of these financial statements. | | 43 |
GOLDMAN SACHS MULTI-MANAGER GLOBAL EQUITY FUND
Schedule of Investments(continued)
October 31, 2019
| | | | | | | | |
Shares | | | Description | | Value | |
|
| Common Stocks – (continued) | |
| United Kingdom – (continued) | |
| | 1,547 | | | Halma PLC (Electronic Equipment, Instruments & Components) | | $ | 37,539 | |
| | 1,088 | | | Hargreaves Lansdown PLC (Capital Markets) | | | 24,984 | |
| | 5,907 | | | Hikma Pharmaceuticals PLC (Pharmaceuticals) | | | 153,835 | |
| | 7,065 | | | HSBC Holdings PLC (Banks) | | | 53,377 | |
| | 23,597 | | | Ibstock PLC(a) (Construction Materials) | | | 73,737 | |
| | 2,119 | | | IHS Markit Ltd.* (Professional Services) | | | 148,372 | |
| | 18,169 | | | Inchcape PLC (Distributors) | | | 151,903 | |
| | 4,681 | | | Informa PLC (Media) | | | 47,050 | |
| | 203 | | | InterContinental Hotels Group PLC (Hotels, Restaurants & Leisure) | | | 12,285 | |
| | 9,975 | | | Intermediate Capital Group PLC (Capital Markets) | | | 191,976 | |
| | 166 | | | Intertek Group PLC (Professional Services) | | | 11,510 | |
| | 5,326 | | | ITV PLC (Media) | | | 9,239 | |
| | 11,041 | | | J Sainsbury PLC (Food & Staples Retailing) | | | 29,096 | |
| | 14,557 | | | JD Sports Fashion PLC (Specialty Retail) | | | 144,806 | |
| | 14,635 | | | Johnson Matthey PLC (Chemicals) | | | 581,403 | |
| | 4,493 | | | Keywords Studios PLC (IT Services) | | | 64,744 | |
| | 9,769 | | | Kingfisher PLC (Specialty Retail) | | | 26,206 | |
| | 6,051 | | | Land Securities Group PLC (Equity Real Estate Investment Trusts (REITs)) | | | 73,704 | |
| | 896 | | | Linde PLC (Chemicals) | | | 177,722 | |
| | 884,215 | | | Lloyds Banking Group PLC (Banks) | | | 650,434 | |
| | 93,357 | | | M&G PLC* (Diversified Financial Services) | | | 258,548 | |
| | 60,693 | | | Man Group PLC/Jersey (Capital Markets) | | | 112,960 | |
| | 21,193 | | | Marks & Spencer Group PLC (Multiline Retail) | | | 49,926 | |
| | 19,813 | | | Meggitt PLC (Aerospace & Defense) | | | 160,314 | |
| | 35,528 | | | Micro Focus International PLC (Software) | | | 487,629 | |
| | 1,861 | | | Mondi PLC (Paper & Forest Products) | | | 38,586 | |
| | 22,308 | | | National Express Group PLC (Road & Rail) | | | 128,995 | |
| | 4,110 | | | National Grid PLC (Multi-Utilities) | | | 48,055 | |
| | 634 | | | Next PLC (Multiline Retail) | | | 54,072 | |
| | 6,850 | | | Nielsen Holdings PLC (Professional Services) | | | 138,096 | |
| | 1,431 | | | Ocado Group PLC* (Internet & Direct Marketing Retail) | | | 24,665 | |
| | 13,516 | | | Paragon Banking Group PLC (Thrifts & Mortgage Finance) | | | 88,106 | |
| | 5,232 | | | Pearson PLC (Media) | | | 46,207 | |
| | 3,974 | | | Pennon Group PLC (Water Utilities) | | | 46,237 | |
| | 812 | | | Persimmon PLC (Household Durables) | | | 23,951 | |
| | 20,750 | | | Phoenix Group Holdings PLC (Insurance) | | | 189,533 | |
| | |
|
| Common Stocks – (continued) | |
| United Kingdom – (continued) | |
| | 102,511 | | | Premier Oil PLC* (Oil, Gas & Consumable Fuels) | | | 110,150 | |
| | 87,267 | | | Prudential PLC (Insurance) | | | 1,524,278 | |
| | 31,607 | | | QinetiQ Group PLC (Aerospace & Defense) | | | 128,850 | |
| | 6,402 | | | Reckitt Benckiser Group PLC (Household Products) | | | 495,397 | |
| | 42,088 | | | RELX PLC (Professional Services) | | | 1,013,034 | |
| | 26,610 | | | Rentokil Initial PLC (Commercial Services & Supplies) | | | 156,605 | |
| | 3,836 | | | Rightmove PLC (Interactive Media & Services) | | | 29,776 | |
| | 8,211 | | | Rio Tinto PLC (Metals & Mining) | | | 427,480 | |
| | 7,811,248 | | | Rolls-Royce Holdings PLC* (Aerospace & Defense) | | | 1,573,809 | |
| | 5,586 | | | Royal Bank of Scotland Group PLC (Banks) | | | 15,441 | |
| | 1,046 | | | Royal Dutch Shell PLC Class A (Oil, Gas & Consumable Fuels) | | | 30,322 | |
| | 42,614 | | | Royal Dutch Shell PLC Class B (Oil, Gas & Consumable Fuels) | | | 1,227,273 | |
| | 4,406 | | | RSA Insurance Group PLC (Insurance) | | | 29,808 | |
| | 287 | | | Schroders PLC (Capital Markets) | | | 11,506 | |
| | 5,825 | | | Segro PLC (Equity Real Estate Investment Trusts (REITs)) | | | 63,721 | |
| | 26,475 | | | Smith & Nephew PLC (Health Care Equipment & Supplies) | | | 568,323 | |
| | 14,103 | | | Smiths Group PLC (Industrial Conglomerates) | | | 294,804 | |
| | 6,181 | | | Softcat PLC (IT Services) | | | 75,330 | |
| | 468 | | | Spirax-Sarco Engineering PLC (Machinery) | | | 48,028 | |
| | 52,638 | | | SSE PLC (Electric Utilities) | | | 875,688 | |
| | 15,422 | | | SSP Group Plc (Hotels, Restaurants & Leisure) | | | 127,172 | |
| | 7,390 | | | Standard Life Aberdeen PLC (Capital Markets) | | | 29,055 | |
| | 4,158 | | | Tate & Lyle PLC (Food Products) | | | 36,267 | |
| | 15,060 | | | Taylor Wimpey PLC (Household Durables) | | | 32,299 | |
| | 1,500 | | | TechnipFMC PLC (Energy Equipment & Services) | | | 29,595 | |
| | 113,242 | | | Tesco PLC (Food & Staples Retailing) | | | 345,677 | |
| | 3,771 | | | The British Land Co. PLC (Equity Real Estate Investment Trusts (REITs)) | | | 30,319 | |
| | 2,370 | | | The Sage Group PLC (Software) | | | 22,089 | |
| | 2,006 | | | Travis Perkins PLC (Trading Companies & Distributors) | | | 37,260 | |
| | 856 | | | Unilever PLC (Personal Products) | | | 51,256 | |
| | 6,679 | | | United Utilities Group PLC (Water Utilities) | | | 75,417 | |
| | 15,140 | | | Vesuvius PLC (Machinery) | | | 78,329 | |
| | 533,008 | | | Vodafone Group PLC (Wireless Telecommunication Services) | | | 1,087,720 | |
| | |
| | |
| 44 | | The accompanying notes are an integral part of these financial statements. |
GOLDMAN SACHS MULTI-MANAGER GLOBAL EQUITY FUND
| | | | | | | | |
Shares | | | Description | | Value | |
|
| Common Stocks – (continued) | |
| United Kingdom – (continued) | |
| | 797 | | | Whitbread PLC (Hotels, Restaurants & Leisure) | | $ | 41,951 | |
| | 37,926 | | | William Hill PLC (Hotels, Restaurants & Leisure) | | | 97,097 | |
| | 13,994 | | | Wm Morrison Supermarkets PLC (Food & Staples Retailing) | | | 36,151 | |
| | 23,513 | | | WPP PLC (Media) | | | 293,432 | |
| | | | | | | | |
| | | | | | | 29,137,777 | |
| | |
| United States – 39.6% | |
| | 924 | | | 3M Co. (Industrial Conglomerates) | | | 152,451 | |
| | 4,987 | | | AAR Corp. (Aerospace & Defense) | | | 208,207 | |
| | 1,113 | | | Abbott Laboratories (Health Care Equipment & Supplies) | | | 93,058 | |
| | 31,125 | | | AbbVie, Inc. (Biotechnology) | | | 2,475,994 | |
| | 3,259 | | | ABM Industries, Inc. (Commercial Services & Supplies) | | | 118,823 | |
| | 7,969 | | | ACCO Brands Corp. (Commercial Services & Supplies) | | | 72,916 | |
| | 1,944 | | | Activision Blizzard, Inc. (Entertainment) | | | 108,922 | |
| | 1,073 | | | Adobe, Inc.* (Software) | | | 298,219 | |
| | 680 | | | Advance Auto Parts, Inc. (Specialty Retail) | | | 110,486 | |
| | 1,819 | | | Advanced Micro Devices, Inc.* (Semiconductors & Semiconductor Equipment) | | | 61,719 | |
| | 5,329 | | | Aegion Corp.* (Construction & Engineering) | | | 115,479 | |
| | 3,800 | | | Affiliated Managers Group, Inc. (Capital Markets) | | | 303,544 | |
| | 1,895 | | | Aflac, Inc. (Insurance) | | | 100,738 | |
| | 1,410 | | | Agilent Technologies, Inc. (Life Sciences Tools & Services) | | | 106,807 | |
| | 6,190 | | | Air Lease Corp. (Trading Companies & Distributors) | | | 272,236 | |
| | 530 | | | Air Products & Chemicals, Inc. (Chemicals) | | | 113,028 | |
| | 1,242 | | | Akamai Technologies, Inc.* (IT Services) | | | 107,433 | |
| | 2,015 | | | Alamo Group, Inc. (Machinery) | | | 215,726 | |
| | 620 | | | Albemarle Corp. (Chemicals) | | | 37,659 | |
| | 574 | | | Alexandria Real Estate Equities, Inc. (Equity Real Estate Investment Trusts (REITs)) | | | 91,122 | |
| | 515 | | | Alexion Pharmaceuticals, Inc.* (Biotechnology) | | | 54,281 | |
| | 124 | | | Alleghany Corp.* (Insurance) | | | 96,508 | |
| | 1,737 | | | Allegiant Travel Co. (Airlines) | | | 290,652 | |
| | 1,830 | | | Alliant Energy Corp. (Electric Utilities) | | | 97,612 | |
| | 5,200 | | | Allison Transmission Holdings, Inc. (Machinery) | | | 226,772 | |
| | 2,543 | | | Ally Financial, Inc. (Consumer Finance) | | | 77,892 | |
| | 766 | | | Alphabet, Inc. Class A* (Interactive Media & Services) | | | 964,241 | |
| | 1,740 | | | Alphabet, Inc. Class C* (Interactive Media & Services) | | | 2,192,591 | |
| | 11,500 | | | Altria Group, Inc. (Tobacco) | | | 515,085 | |
| | |
|
| Common Stocks – (continued) | |
| United States – (continued) | |
| | 1,147 | | | Amazon.com, Inc.* (Internet & Direct Marketing Retail) | | | 2,037,829 | |
| | 2,109 | | | AMC Networks, Inc. Class A* (Media) | | | 91,847 | |
| | 1,134 | | | Amdocs Ltd. (IT Services) | | | 73,937 | |
| | 2,984 | | | Ameren Corp. (Multi-Utilities) | | | 231,857 | |
| | 2,336 | | | American Electric Power Co., Inc. (Electric Utilities) | | | 220,495 | |
| | 1,100 | | | American Equity Investment Life Holding Co. (Insurance) | | | 27,148 | |
| | 533 | | | American Express Co. (Consumer Finance) | | | 62,510 | |
| | 8,017 | | | American International Group, Inc. (Insurance) | | | 424,580 | |
| | 2,500 | | | American Tower Corp. (Equity Real Estate Investment Trusts (REITs)) | | | 545,200 | |
| | 802 | | | American Water Works Co., Inc. (Water Utilities) | | | 98,863 | |
| | 700 | | | Ameriprise Financial, Inc. (Capital Markets) | | | 105,623 | |
| | 6,516 | | | Ameris Bancorp (Banks) | | | 279,211 | |
| | 3,721 | | | AMERISAFE, Inc. (Insurance) | | | 236,395 | |
| | 10,067 | | | AmerisourceBergen Corp. (Health Care Providers & Services) | | | 859,520 | |
| | 500 | | | AMETEK, Inc. (Electrical Equipment) | | | 45,825 | |
| | 700 | | | Amgen, Inc. (Biotechnology) | | | 149,275 | |
| | 587 | | | Amphenol Corp. Class A (Electronic Equipment, Instruments & Components) | | | 58,894 | |
| | 989 | | | Analog Devices, Inc. (Semiconductors & Semiconductor Equipment) | | | 105,457 | |
| | 448 | | | Anixter International, Inc.* (Electronic Equipment, Instruments & Components) | | | 37,072 | |
| | 12,149 | | | Annaly Capital Management, Inc. (Mortgage Real Estate Investment Trusts (REITs)) | | | 109,098 | |
| | 565 | | | ANSYS, Inc.* (Software) | | | 124,385 | |
| | 6,442 | | | Anthem, Inc. (Health Care Providers & Services) | | | 1,733,413 | |
| | 2,927 | | | Apache Corp. (Oil, Gas & Consumable Fuels) | | | 63,399 | |
| | 2,500 | | | Apartment Investment & Management Co. Class A (Equity Real Estate Investment Trusts (REITs)) | | | 137,200 | |
| | 1,699 | | | Apergy Corp.* (Energy Equipment & Services) | | | 42,764 | |
| | 2,600 | | | Apple Hospitality REIT, Inc. (Equity Real Estate Investment Trusts (REITs)) | | | 42,848 | |
| | 10,408 | | | Apple, Inc. (Technology Hardware, Storage & Peripherals) | | | 2,589,094 | |
| | 3,597 | | | Applied Materials, Inc. (Semiconductors & Semiconductor Equipment) | | | 195,173 | |
| | 3,835 | | | Arch Capital Group Ltd.* (Insurance) | | | 160,150 | |
| | 8,689 | | | Archer-Daniels-Midland Co. (Food Products) | | | 365,286 | |
| | 16,819 | | | Arconic, Inc. (Aerospace & Defense) | | | 462,018 | |
| | 84,000 | | | Ares Capital Corp. (Capital Markets) | | | 1,537,200 | |
| | |
| | |
| The accompanying notes are an integral part of these financial statements. | | 45 |
GOLDMAN SACHS MULTI-MANAGER GLOBAL EQUITY FUND
Schedule of Investments(continued)
October 31, 2019
| | | | | | | | |
Shares | | | Description | | Value | |
|
| Common Stocks – (continued) | |
| United States – (continued) | |
| | 2,343 | | | Ares Commercial Real Estate Corp. (Mortgage Real Estate Investment Trusts (REITs)) | | $ | 36,317 | |
| | 177 | | | Arista Networks, Inc.* (Communications Equipment) | | | 43,289 | |
| | 909 | | | Arthur J. Gallagher & Co. (Insurance) | | | 82,919 | |
| | 1,580 | | | ASGN, Inc.* (Professional Services) | | | 100,472 | |
| | 4,856 | | | Assured Guaranty Ltd. (Insurance) | | | 227,844 | |
| | 68,701 | | | AT&T, Inc. (Diversified Telecommunication Services) | | | 2,644,301 | |
| | 1,200 | | | Atmos Energy Corp. (Gas Utilities) | | | 134,976 | |
| | 5,483 | | | AtriCure, Inc.* (Health Care Equipment & Supplies) | | | 145,793 | |
| | 521 | | | Autodesk, Inc.* (Software) | | | 76,775 | |
| | 417 | | | Automatic Data Processing, Inc. (IT Services) | | | 67,650 | |
| | 2,000 | | | AutoNation, Inc.* (Specialty Retail) | | | 101,700 | |
| | 97 | | | AutoZone, Inc.* (Specialty Retail) | | | 111,005 | |
| | 355 | | | AvalonBay Communities, Inc. (Equity Real Estate Investment Trusts (REITs)) | | | 77,269 | |
| | 852 | | | Axis Capital Holdings Ltd. (Insurance) | | | 50,634 | |
| | 2,131 | | | Balchem Corp. (Chemicals) | | | 215,679 | |
| | 1,193 | | | Ball Corp. (Containers & Packaging) | | | 83,474 | |
| | 35,612 | | | Bank of America Corp. (Banks) | | | 1,113,587 | |
| | 3,865 | | | BankUnited, Inc. (Banks) | | | 132,569 | |
| | 443 | | | Bausch Health Cos., Inc.* (Pharmaceuticals) | | | 11,012 | |
| | 1,027 | | | Baxter International, Inc. (Health Care Equipment & Supplies) | | | 78,771 | |
| | 1,163 | | | BB&T Corp. (Banks) | | | 61,697 | |
| | 500 | | | Becton Dickinson & Co. (Health Care Equipment & Supplies) | | | 128,000 | |
| | 2,673 | | | Belden, Inc. (Electronic Equipment, Instruments & Components) | | | 137,071 | |
| | 11,909 | | | Berkshire Hathaway, Inc. Class B* (Diversified Financial Services) | | | 2,531,615 | |
| | 1,739 | | | Best Buy Co., Inc. (Specialty Retail) | | | 124,912 | |
| | 1,690 | | | Biogen, Inc.* (Biotechnology) | | | 504,820 | |
| | 4,296 | | | Blackstone Mortgage Trust, Inc. Class A (Mortgage Real Estate Investment Trusts (REITs)) | | | 155,945 | |
| | 3,068 | | | BMC Stock Holdings, Inc.* (Trading Companies & Distributors) | | | 82,805 | |
| | 592 | | | Booking Holdings, Inc.* (Internet & Direct Marketing Retail) | | | 1,212,872 | |
| | 1,406 | | | BorgWarner, Inc. (Auto Components) | | | 58,602 | |
| | 4,865 | | | Boston Private Financial Holdings, Inc. (Banks) | | | 54,731 | |
| | 271 | | | Boston Properties, Inc. (Equity Real Estate Investment Trusts (REITs)) | | | 37,181 | |
| | 1,510 | | | Boston Scientific Corp.* (Health Care Equipment & Supplies) | | | 62,967 | |
| | 798 | | | Bristol-Myers Squibb Co. (Pharmaceuticals) | | | 45,781 | |
| | 2,592 | | | Broadcom, Inc. (Semiconductors & Semiconductor Equipment) | | | 759,067 | |
| | |
|
| Common Stocks – (continued) | |
| United States – (continued) | |
| | 445 | | | Broadridge Financial Solutions, Inc. (IT Services) | | | 55,723 | |
| | 950 | | | Brooks Automation, Inc. (Semiconductors & Semiconductor Equipment) | | | 40,347 | |
| | 1,136 | | | Brown-Forman Corp. Class B (Beverages) | | | 74,431 | |
| | 4,052 | | | Bunge Ltd. (Food Products) | | | 218,808 | |
| | 133 | | | Burlington Stores, Inc.* (Specialty Retail) | | | 25,559 | |
| | 475 | | | C.H. Robinson Worldwide, Inc. (Air Freight & Logistics) | | | 35,929 | |
| | 2,661 | | | Cabot Oil & Gas Corp. (Oil, Gas & Consumable Fuels) | | | 49,601 | |
| | 2,094 | | | Cactus, Inc. Class A* (Energy Equipment & Services) | | | 62,234 | |
| | 2,304 | | | Cadence BanCorp. (Banks) | | | 35,436 | |
| | 1,527 | | | Cadence Design Systems, Inc.* (Software) | | | 99,789 | |
| | 3,331 | | | Cantel Medical Corp. (Health Care Equipment & Supplies) | | | 242,797 | |
| | 5,122 | | | Capital One Financial Corp. (Consumer Finance) | | | 477,626 | |
| | 7,776 | | | Catalent, Inc.* (Pharmaceuticals) | | | 378,302 | |
| | 8,239 | | | Cathay General Bancorp (Banks) | | | 293,061 | |
| | 1,076 | | | CBRE Group, Inc. Class A* (Real Estate Management & Development) | | | 57,620 | |
| | 6,705 | | | CBS Corp. Class B (Media) | | | 241,648 | |
| | 714 | | | CDW Corp. (Electronic Equipment, Instruments & Components) | | | 91,328 | |
| | 360 | | | Celanese Corp. (Chemicals) | | | 43,614 | |
| | 697 | | | Centene Corp.* (Health Care Providers & Services) | | | 36,997 | |
| | 4,481 | | | CenterPoint Energy, Inc. (Multi-Utilities) | | | 130,263 | |
| | 1,924 | | | CenterState Bank Corp. (Banks) | | | 48,793 | |
| | 3,277 | | | Central Garden & Pet Co.* (Household Products) | | | 98,376 | |
| | 7,681 | | | Central Garden & Pet Co. Class A* (Household Products) | | | 217,219 | |
| | 2,126 | | | CenturyLink, Inc. (Diversified Telecommunication Services) | | | 27,510 | |
| | 435 | | | Cerner Corp. (Health Care Technology) | | | 29,197 | |
| | 305 | | | Charter Communications, Inc. Class A* (Media) | | | 142,697 | |
| | 5,227 | | | Chatham Lodging Trust (Equity Real Estate Investment Trusts (REITs)) | | | 94,347 | |
| | 369 | | | Chemed Corp. (Health Care Providers & Services) | | | 145,353 | |
| | 5,527 | | | Chevron Corp. (Oil, Gas & Consumable Fuels) | | | 641,906 | |
| | 136 | | | Chipotle Mexican Grill, Inc.* (Hotels, Restaurants & Leisure) | | | 105,830 | |
| | 1,112 | | | Church & Dwight Co., Inc. (Household Products) | | | 77,773 | |
| | 1,957 | | | Churchill Downs, Inc. (Hotels, Restaurants & Leisure) | | | 254,390 | |
| | 3,647 | | | Chuy’s Holdings, Inc.* (Hotels, Restaurants & Leisure) | | | 88,877 | |
| | 4,025 | | | Ciena Corp.* (Communications Equipment) | | | 149,408 | |
| | |
| | |
| 46 | | The accompanying notes are an integral part of these financial statements. |
GOLDMAN SACHS MULTI-MANAGER GLOBAL EQUITY FUND
| | | | | | | | |
Shares | | | Description | | Value | |
|
| Common Stocks – (continued) | |
| United States – (continued) | |
| | 2,200 | | | Cigna Corp. (Health Care Providers & Services) | | $ | 392,612 | |
| | 1,116 | | | Cincinnati Financial Corp. (Insurance) | | | 126,342 | |
| | 388 | | | Cintas Corp. (Commercial Services & Supplies) | | | 104,244 | |
| | 18,187 | | | Cisco Systems, Inc. (Communications Equipment) | | | 864,064 | |
| | 500 | | | CIT Group, Inc. (Banks) | | | 21,445 | |
| | 26,262 | | | Citigroup, Inc. (Banks) | | | 1,887,187 | |
| | 1,474 | | | Citizens Financial Group, Inc. (Banks) | | | 51,826 | |
| | 478 | | | Citrix Systems, Inc. (Software) | | | 52,035 | |
| | 1,246 | | | CME Group, Inc. (Capital Markets) | | | 256,364 | |
| | 3,381 | | | CMS Energy Corp. (Multi-Utilities) | | | 216,114 | |
| | 7,907 | | | Cognizant Technology Solutions Corp. Class A (IT Services) | | | 481,853 | |
| | 4,113 | | | Cohen & Steers, Inc. (Capital Markets) | | | 269,155 | |
| | 876 | | | Colgate-Palmolive Co. (Household Products) | | | 60,094 | |
| | 6,310 | | | Colony Capital, Inc. (Equity Real Estate Investment Trusts (REITs)) | | | 35,336 | |
| | 2,352 | | | Columbia Banking System, Inc. (Banks) | | | 92,434 | |
| | 4,100 | | | Columbia Property Trust, Inc. (Equity Real Estate Investment Trusts (REITs)) | | | 84,132 | |
| | 3,301 | | | Comcast Corp. Class A (Media) | | | 147,951 | |
| | 417 | | | Comerica, Inc. (Banks) | | | 27,280 | |
| | 2,518 | | | Compass Minerals International, Inc. (Metals & Mining) | | | 142,217 | |
| | 3,017 | | | Conagra Brands, Inc. (Food Products) | | | 81,610 | |
| | 727 | | | Concho Resources, Inc. (Oil, Gas & Consumable Fuels) | | | 49,087 | |
| | 1,231 | | | ConocoPhillips (Oil, Gas & Consumable Fuels) | | | 67,951 | |
| | 1,542 | | | Consolidated Edison, Inc. (Multi-Utilities) | | | 142,203 | |
| | 289 | | | Constellation Brands, Inc. Class A (Beverages) | | | 55,005 | |
| | 505 | | | Copart, Inc.* (Commercial Services & Supplies) | | | 41,733 | |
| | 2,600 | | | CoreCivic, Inc. (Equity Real Estate Investment Trusts (REITs)) | | | 39,676 | |
| | 1,928 | | | Corning, Inc. (Electronic Equipment, Instruments & Components) | | | 57,127 | |
| | 313 | | | CoStar Group, Inc.* (Professional Services) | | | 172,000 | |
| | 1,616 | | | Costco Wholesale Corp. (Food & Staples Retailing) | | | 480,130 | |
| | 992 | | | Cousins Properties, Inc. (Equity Real Estate Investment Trusts (REITs)) | | | 39,809 | |
| | 3,200 | | | Crown Castle International Corp. (Equity Real Estate Investment Trusts (REITs)) | | | 444,128 | |
| | 1,903 | | | CSX Corp. (Road & Rail) | | | 133,724 | |
| | 685 | | | Cummins, Inc. (Machinery) | | | 118,149 | |
| | 445 | | | Curtiss-Wright Corp. (Aerospace & Defense) | | | 60,186 | |
| | 23,973 | | | CVS Health Corp. (Health Care Providers & Services) | | | 1,591,567 | |
| | |
|
| Common Stocks – (continued) | |
| United States – (continued) | |
| | 2,663 | | | D.R. Horton, Inc. (Household Durables) | | | 139,461 | |
| | 701 | | | Danaher Corp. (Health Care Equipment & Supplies) | | | 96,612 | |
| | 982 | | | Darden Restaurants, Inc. (Hotels, Restaurants & Leisure) | | | 110,249 | |
| | 1,739 | | | Delta Air Lines, Inc. (Airlines) | | | 95,784 | |
| | 6,663 | | | DENTSPLY SIRONA, Inc. (Health Care Equipment & Supplies) | | | 364,999 | |
| | 2,246 | | | Devon Energy Corp. (Oil, Gas & Consumable Fuels) | | | 45,549 | |
| | 8,100 | | | Discovery, Inc. Class C* (Media) | | | 204,444 | |
| | 2,755 | | | Dollar General Corp. (Multiline Retail) | | | 441,737 | |
| | 24,643 | | | Dollar Tree, Inc.* (Multiline Retail) | | | 2,720,587 | |
| | 6,264 | | | Dominion Energy, Inc. (Multi-Utilities) | | | 517,093 | |
| | 98 | | | Domino’s Pizza, Inc. (Hotels, Restaurants & Leisure) | | | 26,619 | |
| | 989 | | | Dover Corp. (Machinery) | | | 102,747 | |
| | 936 | | | Dow, Inc. (Chemicals) | | | 47,259 | |
| | 1,711 | | | Dril-Quip, Inc.* (Energy Equipment & Services) | | | 70,185 | |
| | 1,176 | | | DTE Energy Co. (Multi-Utilities) | | | 149,728 | |
| | 4,069 | | | Duke Energy Corp. (Electric Utilities) | | | 383,544 | |
| | 2,738 | | | Duke Realty Corp. (Equity Real Estate Investment Trusts (REITs)) | | | 96,213 | |
| | 6,511 | | | DuPont de Nemours, Inc. (Chemicals) | | | 429,140 | |
| | 1,422 | | | DXC Technology Co. (IT Services) | | | 39,347 | |
| | 758 | | | Eastman Chemical Co. (Chemicals) | | | 57,638 | |
| | 13,090 | | | eBay, Inc. (Internet & Direct Marketing Retail) | | | 461,422 | |
| | 355 | | | Ecolab, Inc. (Chemicals) | | | 68,185 | |
| | 1,693 | | | Edison International (Electric Utilities) | | | 106,490 | |
| | 2,055 | | | Edwards Lifesciences Corp.* (Health Care Equipment & Supplies) | | | 489,871 | |
| | 1,566 | | | Elanco Animal Health, Inc.* (Pharmaceuticals) | | | 42,313 | |
| | 32,746 | | | Electronic Arts, Inc.* (Entertainment) | | | 3,156,714 | |
| | 534 | | | Eli Lilly & Co. (Pharmaceuticals) | | | 60,849 | |
| | 2,800 | | | EMCOR Group, Inc. (Construction & Engineering) | | | 245,588 | |
| | 540 | | | Emerson Electric Co. (Electrical Equipment) | | | 37,881 | |
| | 3,729 | | | Energizer Holdings, Inc. (Household Products) | | | 158,445 | |
| | 3,185 | | | EnerSys (Electrical Equipment) | | | 212,949 | |
| | 6,122 | | | Entegris, Inc. (Semiconductors & Semiconductor Equipment) | | | 293,856 | |
| | 8,550 | | | Entercom Communications Corp. Class A (Media) | | | 29,754 | |
| | 2,385 | | | Entergy Corp. (Electric Utilities) | | | 289,730 | |
| | 641 | | | EOG Resources, Inc. (Oil, Gas & Consumable Fuels) | | | 44,428 | |
| | 120 | | | Equinix, Inc. (Equity Real Estate Investment Trusts (REITs)) | | | 68,014 | |
| | 940 | | | Equity Residential (Equity Real Estate Investment Trusts (REITs)) | | | 83,340 | |
| | 3,946 | | | Essent Group Ltd. (Thrifts & Mortgage Finance) | | | 205,547 | |
| | |
| | |
| The accompanying notes are an integral part of these financial statements. | | 47 |
GOLDMAN SACHS MULTI-MANAGER GLOBAL EQUITY FUND
Schedule of Investments(continued)
October 31, 2019
| | | | | | | | |
Shares | | | Description | | Value | |
|
| Common Stocks – (continued) | |
| United States – (continued) | |
| | 527 | | | Essex Property Trust, Inc. (Equity Real Estate Investment Trusts (REITs)) | | $ | 172,398 | |
| | 1,007 | | | Evercore, Inc. Class A (Capital Markets) | | | 74,155 | |
| | 3,066 | | | Everest Re Group Ltd. (Insurance) | | | 788,238 | |
| | 2,473 | | | Evergy, Inc. (Electric Utilities) | | | 158,049 | |
| | 1,395 | | | Eversource Energy (Electric Utilities) | | | 116,817 | |
| | 13,308 | | | Exelon Corp. (Electric Utilities) | | | 605,381 | |
| | 2,853 | | | ExlService Holdings, Inc.* (IT Services) | | | 198,654 | |
| | 836 | | | Expedia Group, Inc. (Internet & Direct Marketing Retail) | | | 114,248 | |
| | 452 | | | Expeditors International of Washington, Inc. (Air Freight & Logistics) | | | 32,969 | |
| | 24,712 | | | Extended Stay America, Inc. (Hotels, Restaurants & Leisure) | | | 351,158 | |
| | 6,182 | | | Extraction Oil & Gas, Inc.* (Oil, Gas & Consumable Fuels) | | | 10,509 | |
| | 2,179 | | | Exxon Mobil Corp. (Oil, Gas & Consumable Fuels) | | | 147,235 | |
| | 648 | | | F5 Networks, Inc.* (Communications Equipment) | | | 93,364 | |
| | 18,961 | | | Facebook, Inc. Class A* (Interactive Media & Services) | | | 3,633,876 | |
| | 201 | | | FactSet Research Systems, Inc. (Capital Markets) | | | 50,958 | |
| | 1,991 | | | Fastenal Co. (Trading Companies & Distributors) | | | 71,557 | |
| | 350 | | | Federal Realty Investment Trust (Equity Real Estate Investment Trusts (REITs)) | | | 47,604 | |
| | 151 | | | FedEx Corp. (Air Freight & Logistics) | | | 23,052 | |
| | 2,560 | | | Ferro Corp.* (Chemicals) | | | 28,493 | |
| | 17,993 | | | Ferroglobe Representation & Warranty Insurance Trust(b) (Metals & Mining) | | | — | |
| | 2,000 | | | Fidelity National Financial, Inc. (Insurance) | | | 91,680 | |
| | 558 | | | Fidelity National Information Services, Inc. (IT Services) | | | 73,522 | |
| | 3,807 | | | Fifth Third Bancorp (Banks) | | | 110,708 | |
| | 131 | | | First Citizens BancShares, Inc. Class A (Banks) | | | 64,442 | |
| | 6,165 | | | First Hawaiian, Inc. (Banks) | | | 168,489 | |
| | 1,998 | | | First Merchants Corp. (Banks) | | | 79,021 | |
| | 2,526 | | | First Midwest Bancorp, Inc. (Banks) | | | 51,884 | |
| | 885 | | | FirstCash, Inc. (Consumer Finance) | | | 74,685 | |
| | 9,151 | | | FirstEnergy Corp. (Electric Utilities) | | | 442,176 | |
| | 2,725 | | | Fiserv, Inc.* (IT Services) | | | 289,231 | |
| | 2,319 | | | Five Below, Inc.* (Specialty Retail) | | | 290,130 | |
| | 120 | | | FleetCor Technologies, Inc.* (IT Services) | | | 35,306 | |
| | 49,425 | | | Ford Motor Co. (Automobiles) | | | 424,561 | |
| | 729 | | | Fortinet, Inc.* (Software) | | | 59,457 | |
| | 1,209 | | | Fortive Corp. (Machinery) | | | 83,421 | |
| | 406 | | | Fortune Brands Home & Security, Inc. (Building Products) | | | 24,380 | |
| | 6,054 | | | Forum Energy Technologies, Inc.* (Energy Equipment & Services) | | | 7,023 | |
| | |
|
| Common Stocks – (continued) | |
| United States – (continued) | |
| | 1,526 | | | Fox Corp. Class A (Media) | | | 48,893 | |
| | 1,453 | | | Franklin Resources, Inc. (Capital Markets) | | | 40,030 | |
| | 5,314 | | | Freeport-McMoRan, Inc. (Metals & Mining) | | | 52,183 | |
| | 2,015 | | | Fresh Del Monte Produce, Inc. (Food Products) | | | 64,279 | |
| | 2,611 | | | frontdoor, Inc.* (Diversified Consumer Services) | | | 125,929 | |
| | 2,297 | | | FTI Consulting, Inc.* (Professional Services) | | | 250,074 | |
| | 426 | | | Gartner, Inc.* (IT Services) | | | 65,638 | |
| | 14,340 | | | General Dynamics Corp. (Aerospace & Defense) | | | 2,535,312 | |
| | 60,300 | | | General Electric Co. (Industrial Conglomerates) | | | 601,794 | |
| | 6,919 | | | General Motors Co. (Automobiles) | | | 257,110 | |
| | 841 | | | Genuine Parts Co. (Distributors) | | | 86,270 | |
| | 8,987 | | | Gilead Sciences, Inc. (Biotechnology) | | | 572,562 | |
| | 6,473 | | | Glacier Bancorp, Inc. (Banks) | | | 273,937 | |
| | 1,995 | | | Global Indemnity Ltd. (Insurance) | | | 49,396 | |
| | 674 | | | Globe Life, Inc. (Insurance) | | | 65,600 | |
| | 9,219 | | | Globus Medical, Inc. Class A* (Health Care Equipment & Supplies) | | | 482,799 | |
| | 610 | | | GoDaddy, Inc. Class A* (IT Services) | | | 39,668 | |
| | 4,167 | | | Grand Canyon Education, Inc.* (Diversified Consumer Services) | | | 383,197 | |
| | 928 | | | Granite Construction, Inc. (Construction & Engineering) | | | 21,845 | |
| | 21,644 | | | Graphic Packaging Holding Co. (Containers & Packaging) | | | 338,945 | |
| | 596 | | | Group 1 Automotive, Inc. (Specialty Retail) | | | 59,266 | |
| | 3,173 | | | Hanmi Financial Corp. (Banks) | | | 61,080 | |
| | 893 | | | Hasbro, Inc. (Leisure Products) | | | 86,898 | |
| | 487 | | | HCA Healthcare, Inc. (Health Care Providers & Services) | | | 65,034 | |
| | 2,933 | | | Healthpeak Properties, Inc. (Equity Real Estate Investment Trusts (REITs)) | | | 110,339 | |
| | 8,710 | | | Heartland Express, Inc. (Road & Rail) | | | 182,039 | |
| | 946 | | | Helen of Troy Ltd.* (Household Durables) | | | 141,673 | |
| | 3,330 | | | Helios Technologies, Inc. (Machinery) | | | 131,968 | |
| | 1,079 | | | Henry Schein, Inc.* (Health Care Providers & Services) | | | 67,529 | |
| | 1,932 | | | Hess Corp. (Oil, Gas & Consumable Fuels) | | | 127,029 | |
| | 3,815 | | | Hewlett Packard Enterprise Co. (Technology Hardware, Storage & Peripherals) | | | 62,604 | |
| | 9,236 | | | Hilton Worldwide Holdings, Inc. (Hotels, Restaurants & Leisure) | | | 895,523 | |
| | 3,820 | | | HollyFrontier Corp. (Oil, Gas & Consumable Fuels) | | | 209,871 | |
| | 7,128 | | | Hologic, Inc.* (Health Care Equipment & Supplies) | | | 344,354 | |
| | |
| | |
| 48 | | The accompanying notes are an integral part of these financial statements. |
GOLDMAN SACHS MULTI-MANAGER GLOBAL EQUITY FUND
| | | | | | | | |
Shares | | | Description | | Value | |
|
| Common Stocks – (continued) | |
| United States – (continued) | |
| | 2,558 | | | Honeywell International, Inc. (Industrial Conglomerates) | | $ | 441,843 | |
| | 2,441 | | | Hormel Foods Corp. (Food Products) | | | 99,812 | |
| | 2,671 | | | Host Hotels & Resorts, Inc. (Equity Real Estate Investment Trusts (REITs)) | | | 43,778 | |
| | 4,050 | | | Houlihan Lokey, Inc. (Capital Markets) | | | 191,403 | |
| | 4,600 | | | HP, Inc. (Technology Hardware, Storage & Peripherals) | | | 79,902 | |
| | 2,163 | | | HubSpot, Inc.* (Software) | | | 335,481 | |
| | 128 | | | Humana, Inc. (Health Care Providers & Services) | | | 37,658 | |
| | 234 | | | Huntington Ingalls Industries, Inc. (Aerospace & Defense) | | | 52,804 | |
| | 775 | | | Huron Consulting Group, Inc.* (Professional Services) | | | 51,259 | |
| | 1,591 | | | IAA, Inc.* (Commercial Services & Supplies) | | | 60,697 | |
| | 709 | | | IAC/InterActiveCorp.* (Interactive Media & Services) | | | 161,120 | |
| | 3,335 | | | ICF International, Inc. (Professional Services) | | | 285,776 | |
| | 1,179 | | | ICU Medical, Inc.* (Health Care Equipment & Supplies) | | | 190,538 | |
| | 2,225 | | | IDACORP, Inc. (Electric Utilities) | | | 239,454 | |
| | 228 | | | IDEX Corp. (Machinery) | | | 35,461 | |
| | 406 | | | IDEXX Laboratories, Inc.* (Health Care Equipment & Supplies) | | | 115,714 | |
| | 276 | | | Illinois Tool Works, Inc. (Machinery) | | | 46,528 | |
| | 3,230 | | | Insight Enterprises, Inc.* (Electronic Equipment, Instruments & Components) | | | 198,257 | |
| | 300 | | | Integer Holdings Corp.* (Health Care Equipment & Supplies) | | | 23,232 | |
| | 17,127 | | | Intel Corp. (Semiconductors & Semiconductor Equipment) | | | 968,189 | |
| | 1,848 | | | Intercontinental Exchange, Inc. (Capital Markets) | | | 174,303 | |
| | 1,486 | | | International Business Machines Corp. (IT Services) | | | 198,723 | |
| | 465 | | | International Flavors & Fragrances, Inc. (Chemicals) | | | 56,735 | |
| | 1,146 | | | International Paper Co. (Containers & Packaging) | | | 50,057 | |
| | 2,160 | | | Intuit, Inc. (Software) | | | 556,200 | |
| | 200 | | | Intuitive Surgical, Inc.* (Health Care Equipment & Supplies) | | | 110,590 | |
| | 9,200 | | | Invesco Ltd. (Capital Markets) | | | 154,744 | |
| | 2,806 | | | IQVIA Holdings, Inc.* (Life Sciences Tools & Services) | | | 405,243 | |
| | 1,000 | | | Itron, Inc.* (Electronic Equipment, Instruments & Components) | | | 76,260 | |
| | 514 | | | J.B. Hunt Transport Services, Inc. (Road & Rail) | | | 60,426 | |
| | 1,352 | | | Jacobs Engineering Group, Inc. (Construction & Engineering) | | | 126,520 | |
| | 2,875 | | | Jagged Peak Energy, Inc.* (Oil, Gas & Consumable Fuels) | | | 20,384 | |
| | |
|
| Common Stocks – (continued) | |
| United States – (continued) | |
| | 8,800 | | | Jefferies Financial Group, Inc. (Diversified Financial Services) | | | 164,296 | |
| | 1,612 | | | John Bean Technologies Corp. (Machinery) | | | 165,665 | |
| | 12,783 | | | Johnson & Johnson (Pharmaceuticals) | | | 1,687,867 | |
| | 1,100 | | | Jones Lang LaSalle, Inc. (Real Estate Management & Development) | | | 161,172 | |
| | 4,595 | | | JPMorgan Chase & Co. (Banks) | | | 574,007 | |
| | 2,490 | | | Juniper Networks, Inc. (Communications Equipment) | | | 61,802 | |
| | 1,032 | | | Kansas City Southern (Road & Rail) | | | 145,285 | |
| | 4,273 | | | KAR Auction Services, Inc. (Commercial Services & Supplies) | | | 106,227 | |
| | 499 | | | Kellogg Co. (Food Products) | | | 31,701 | |
| | 11,200 | | | Keurig Dr Pepper, Inc. (Beverages) | | | 315,392 | |
| | 7,511 | | | KeyCorp. (Banks) | | | 134,973 | |
| | 2,127 | | | Keysight Technologies, Inc.* (Electronic Equipment, Instruments & Components) | | | 214,636 | |
| | 575 | | | Kimberly-Clark Corp. (Household Products) | | | 76,406 | |
| | 12,845 | | | Kinder Morgan, Inc. (Oil, Gas & Consumable Fuels) | | | 256,643 | |
| | 46,226 | | | KKR & Co., Inc. Class A (Capital Markets) | | | 1,332,696 | |
| | 667 | | | KLA Corp. (Semiconductors & Semiconductor Equipment) | | | 112,750 | |
| | 43,525 | | | Knight-Swift Transportation Holdings, Inc. (Road & Rail) | | | 1,586,921 | |
| | 1,573 | | | Kohl’s Corp. (Multiline Retail) | | | 80,632 | |
| | 372,538 | | | Kosmos Energy Ltd. (Oil, Gas & Consumable Fuels) | | | 2,309,736 | |
| | 1,434 | | | L3Harris Technologies, Inc. (Aerospace & Defense) | | | 295,849 | |
| | 1,029 | | | La-Z-Boy, Inc. (Household Durables) | | | 36,540 | |
| | 719 | | | Laboratory Corp. of America Holdings* (Health Care Providers & Services) | | | 118,470 | |
| | 1,417 | | | Lam Research Corp. (Semiconductors & Semiconductor Equipment) | | | 384,064 | |
| | 1,673 | | | LCI Industries (Auto Components) | | | 162,482 | |
| | 413 | | | Lear Corp. (Auto Components) | | | 48,639 | |
| | 3,500 | | | Leidos Holdings, Inc. (IT Services) | | | 301,805 | |
| | 2,526 | | | Lennar Corp. Class A (Household Durables) | | | 150,550 | |
| | 2,161 | | | LHC Group, Inc.* (Health Care Providers & Services) | | | 239,806 | |
| | 800 | | | Lincoln National Corp. (Insurance) | | | 45,184 | |
| | 4,877 | | | Lithia Motors, Inc. Class A (Specialty Retail) | | | 768,030 | |
| | 2,036 | | | LKQ Corp.* (Distributors) | | | 69,204 | |
| | 700 | | | Lockheed Martin Corp. (Aerospace & Defense) | | | 263,676 | |
| | 1,275 | | | Loews Corp. (Insurance) | | | 62,475 | |
| | 5,254 | | | Lowe’s Cos., Inc. (Specialty Retail) | | | 586,399 | |
| | 2,900 | | | LPL Financial Holdings, Inc. (Capital Markets) | | | 234,436 | |
| | |
| | |
| The accompanying notes are an integral part of these financial statements. | | 49 |
GOLDMAN SACHS MULTI-MANAGER GLOBAL EQUITY FUND
Schedule of Investments(continued)
October 31, 2019
| | | | | | | | |
Shares | | | Description | | Value | |
|
| Common Stocks – (continued) | |
| United States – (continued) | |
| | 497 | | | Lululemon Athletica, Inc.* (Textiles, Apparel & Luxury Goods) | | $ | 101,522 | |
| | 393 | | | M&T Bank Corp. (Banks) | | | 61,516 | |
| | 5,815 | | | MACOM Technology Solutions Holdings, Inc.* (Semiconductors & Semiconductor Equipment) | | | 132,233 | |
| | 6,434 | | | Macy’s, Inc. (Multiline Retail) | | | 97,539 | |
| | 7,380 | | | Marathon Oil Corp. (Oil, Gas & Consumable Fuels) | | | 85,091 | |
| | 74 | | | Markel Corp.* (Insurance) | | | 86,654 | |
| | 112 | | | MarketAxess Holdings, Inc. (Capital Markets) | | | 41,282 | |
| | 4,933 | | | Marriott International, Inc. Class A (Hotels, Restaurants & Leisure) | | | 624,271 | |
| | 705 | | | Marsh & McLennan Cos., Inc. (Insurance) | | | 73,052 | |
| | 780 | | | Martin Marietta Materials, Inc. (Construction Materials) | | | 204,290 | |
| | 3,566 | | | Marvell Technology Group Ltd. (Semiconductors & Semiconductor Equipment) | | | 86,975 | |
| | 753 | | | Masco Corp. (Building Products) | | | 34,826 | |
| | 300 | | | MasTec, Inc.* (Construction & Engineering) | | | 18,882 | |
| | 9,919 | | | Mastercard, Inc. Class A (IT Services) | | | 2,745,678 | |
| | 14,426 | | | Matador Resources Co.* (Oil, Gas & Consumable Fuels) | | | 200,666 | |
| | 929 | | | Maxim Integrated Products, Inc. (Semiconductors & Semiconductor Equipment) | | | 54,495 | |
| | 1,397 | | | MAXIMUS, Inc. (IT Services) | | | 107,206 | |
| | 616 | | | McCormick & Co., Inc. (Food Products) | | | 98,985 | |
| | 2,424 | | | McDonald’s Corp. (Hotels, Restaurants & Leisure) | | | 476,801 | |
| | 5,770 | | | McKesson Corp. (Health Care Providers & Services) | | | 767,410 | |
| | 700 | | | MDU Resources Group, Inc. (Multi-Utilities) | | | 20,223 | |
| | 10,352 | | | Merck & Co., Inc. (Pharmaceuticals) | | | 897,104 | |
| | 6,371 | | | Meridian Bancorp, Inc. (Thrifts & Mortgage Finance) | | | 124,617 | |
| | 600 | | | Meritage Homes Corp.* (Household Durables) | | | 43,254 | |
| | 10,422 | | | MetLife, Inc. (Insurance) | | | 487,645 | |
| | 840 | | | Mettler-Toledo International, Inc.* (Life Sciences Tools & Services) | | | 592,150 | |
| | 23,114 | | | MFA Financial, Inc. (Mortgage Real Estate Investment Trusts (REITs)) | | | 175,435 | |
| | 3,076 | | | MGM Resorts International (Hotels, Restaurants & Leisure) | | | 87,666 | |
| | 656 | | | Microchip Technology, Inc. (Semiconductors & Semiconductor Equipment) | | | 61,854 | |
| | 1,718 | | | Micron Technology, Inc.* (Semiconductors & Semiconductor Equipment) | | | 81,691 | |
| | |
|
| Common Stocks – (continued) | |
| United States – (continued) | |
| | 42,780 | | | Microsoft Corp. (Software) | | | 6,133,369 | |
| | 731 | | | Mid-America Apartment Communities, Inc. (Equity Real Estate Investment Trusts (REITs)) | | | 101,602 | |
| | 1,872 | | | Minerals Technologies, Inc. (Chemicals) | | | 92,570 | |
| | 5,464 | | | Mobile Mini, Inc. (Commercial Services & Supplies) | | | 205,556 | |
| | 470 | | | Mohawk Industries, Inc.* (Household Durables) | | | 67,389 | |
| | 729 | | | Molson Coors Brewing Co. Class B (Beverages) | | | 38,433 | |
| | 1,896 | | | Mondelez International, Inc. Class A (Food Products) | | | 99,445 | |
| | 2,885 | | | Moody’s Corp. (Capital Markets) | | | 636,691 | |
| | 11,646 | | | Morgan Stanley (Capital Markets) | | | 536,298 | |
| | 614 | | | Motorola Solutions, Inc. (Communications Equipment) | | | 102,120 | |
| | 439 | | | MSCI, Inc. (Capital Markets) | | | 102,972 | |
| | 528 | | | Nasdaq, Inc. (Capital Markets) | | | 52,679 | |
| | 6,437 | | | National General Holdings Corp. (Insurance) | | | 137,237 | |
| | 2,606 | | | National Health Investors, Inc. (Equity Real Estate Investment Trusts (REITs)) | | | 223,569 | |
| | 67,314 | | | National Oilwell Varco, Inc. (Energy Equipment & Services) | | | 1,522,643 | |
| | 12,195 | | | Navient Corp. (Consumer Finance) | | | 167,925 | |
| | 3,468 | | | NCR Corp.* (Technology Hardware, Storage & Peripherals) | | | 101,300 | |
| | 2,566 | | | Nelnet, Inc. Class A (Consumer Finance) | | | 157,219 | |
| | 484 | | | NetApp, Inc. (Technology Hardware, Storage & Peripherals) | | | 27,046 | |
| | 2,341 | | | Newmont Goldcorp Corp. (Metals & Mining) | | | 93,008 | |
| | 704 | | | NextEra Energy, Inc. (Electric Utilities) | | | 167,791 | |
| | 2,164 | | | NIKE, Inc. Class B (Textiles, Apparel & Luxury Goods) | | | 193,786 | |
| | 4,034 | | | NiSource, Inc. (Multi-Utilities) | | | 113,113 | |
| | 4,196 | | | NMI Holdings, Inc. Class A* (Thrifts & Mortgage Finance) | | | 122,733 | |
| | 4,513 | | | Noble Energy, Inc. (Oil, Gas & Consumable Fuels) | | | 86,920 | |
| | 494 | | | Norfolk Southern Corp. (Road & Rail) | | | 89,908 | |
| | 360 | | | Northrop Grumman Corp. (Aerospace & Defense) | | | 126,893 | |
| | 3,998 | | | NorthWestern Corp. (Multi-Utilities) | | | 289,935 | |
| | 11,304 | | | NortonlifeLock, Inc. (Software) | | | 258,636 | |
| | 1,184 | | | Norwegian Cruise Line Holdings Ltd.* (Hotels, Restaurants & Leisure) | | | 60,100 | |
| | 9,300 | | | NRG Energy, Inc. (Independent Power and Renewable Electricity Producers) | | | 373,116 | |
| | 907 | | | Nucor Corp. (Metals & Mining) | | | 48,842 | |
| | 4,534 | | | NVIDIA Corp. (Semiconductors & Semiconductor Equipment) | | | 911,425 | |
| | 15 | | | NVR, Inc.* (Household Durables) | | | 54,549 | |
| | 241 | | | O’Reilly Automotive, Inc.* (Specialty Retail) | | | 104,958 | |
| | |
| | |
| 50 | | The accompanying notes are an integral part of these financial statements. |
GOLDMAN SACHS MULTI-MANAGER GLOBAL EQUITY FUND
| | | | | | | | |
Shares | | | Description | | Value | |
|
| Common Stocks – (continued) | |
| United States – (continued) | |
| | 1,832 | | | Occidental Petroleum Corp. (Oil, Gas & Consumable Fuels) | | $ | 74,196 | |
| | 400 | | | Okta, Inc.* (IT Services) | | | 43,628 | |
| | 2,950 | | | Ollie’s Bargain Outlet Holdings, Inc.* (Multiline Retail) | | | 188,446 | |
| | 21,932 | | | Oracle Corp. (Software) | | | 1,195,075 | |
| | 2,900 | | | Oshkosh Corp. (Machinery) | | | 247,602 | |
| | 4,891 | | | Owens-Illinois, Inc. (Containers & Packaging) | | | 41,574 | |
| | 2,113 | | | Oxford Industries, Inc. (Textiles, Apparel & Luxury Goods) | | | 145,501 | |
| | 6,611 | | | Pacific Premier Bancorp, Inc. (Banks) | | | 223,154 | |
| | 286 | | | Packaging Corp. of America (Containers & Packaging) | | | 31,306 | |
| | 3,153 | | | Parker-Hannifin Corp. (Machinery) | | | 578,544 | |
| | 4,433 | | | Patrick Industries, Inc.* (Building Products) | | | 219,035 | |
| | 1,828 | | | Patterson Cos., Inc. (Health Care Providers & Services) | | | 31,314 | |
| | 813 | | | Paychex, Inc. (IT Services) | | | 67,999 | |
| | 242 | | | Paycom Software, Inc.* (Software) | | | 51,190 | |
| | 3,124 | | | Paylocity Holding Corp.* (Software) | | | 320,522 | |
| | 1,265 | | | Peapack Gladstone Financial Corp. (Banks) | | | 36,938 | |
| | 5,415 | | | Pebblebrook Hotel Trust (Equity Real Estate Investment Trusts (REITs)) | | | 139,220 | |
| | 2,434 | | | PepsiCo, Inc. (Beverages) | | | 333,872 | |
| | 8,884 | | | Performance Food Group Co.* (Food & Staples Retailing) | | | 378,547 | |
| | 2,171 | | | Pfizer, Inc. (Pharmaceuticals) | | | 83,301 | |
| | 5,350 | | | Phillips 66 (Oil, Gas & Consumable Fuels) | | | 624,987 | |
| | 5,700 | | | Pilgrim’s Pride Corp.* (Food Products) | | | 173,052 | |
| | 1,365 | | | Pinnacle West Capital Corp. (Electric Utilities) | | | 128,474 | |
| | 8,175 | | | Pioneer Natural Resources Co. (Oil, Gas & Consumable Fuels) | | | 1,005,688 | |
| | 8,046 | | | PolyOne Corp. (Chemicals) | | | 257,874 | |
| | 1,437 | | | Power Integrations, Inc. (Semiconductors & Semiconductor Equipment) | | | 130,925 | |
| | 981 | | | PPG Industries, Inc. (Chemicals) | | | 122,743 | |
| | 4,614 | | | PPL Corp. (Electric Utilities) | | | 154,523 | |
| | 5,991 | | | PQ Group Holdings, Inc.* (Chemicals) | | | 98,672 | |
| | 6,149 | | | PRA Group, Inc.* (Consumer Finance) | | | 208,636 | |
| | 832 | | | Preferred Bank (Banks) | | | 44,354 | |
| | 9,824 | | | Primoris Services Corp. (Construction & Engineering) | | | 200,803 | |
| | 478 | | | Principal Financial Group, Inc. (Insurance) | | | 25,516 | |
| | 2,014 | | | ProAssurance Corp. (Insurance) | | | 78,989 | |
| | 2,444 | | | Prologis, Inc. (Equity Real Estate Investment Trusts (REITs)) | | | 214,485 | |
| | 1,797 | | | Proofpoint, Inc.* (Software) | | | 207,320 | |
| | 757 | | | Prudential Financial, Inc. (Insurance) | | | 68,993 | |
| | 1,986 | | | Public Service Enterprise Group, Inc. (Multi-Utilities) | | | 125,734 | |
| | |
|
| Common Stocks – (continued) | |
| United States – (continued) | |
| | 573 | | | Public Storage (Equity Real Estate Investment Trusts (REITs)) | | | 127,699 | |
| | 1,908 | | | PVH Corp. (Textiles, Apparel & Luxury Goods) | | | 166,301 | |
| | 22,545 | | | Qorvo, Inc.* (Semiconductors & Semiconductor Equipment) | | | 1,822,989 | |
| | 5,426 | | | QTS Realty Trust, Inc. Class A (Equity Real Estate Investment Trusts (REITs)) | | | 290,779 | |
| | 14,902 | | | QUALCOMM, Inc. (Semiconductors & Semiconductor Equipment) | | | 1,198,717 | |
| | 840 | | | Quest Diagnostics, Inc. (Health Care Providers & Services) | | | 85,050 | |
| | 8,000 | | | Qurate Retail, Inc.* (Internet & Direct Marketing Retail) | | | 76,320 | |
| | 3,896 | | | Radian Group, Inc. (Thrifts & Mortgage Finance) | | | 97,790 | |
| | 278 | | | Raymond James Financial, Inc. (Capital Markets) | | | 23,210 | |
| | 8,534 | | | Raytheon Co. (Aerospace & Defense) | | | 1,811,000 | |
| | 2,162 | | | RBC Bearings, Inc.* (Machinery) | | | 346,871 | |
| | 1,377 | | | Realty Income Corp. (Equity Real Estate Investment Trusts (REITs)) | | | 112,625 | |
| | 4,197 | | | Redwood Trust, Inc. (Mortgage Real Estate Investment Trusts (REITs)) | | | 68,579 | |
| | 1,579 | | | Regency Centers Corp. (Equity Real Estate Investment Trusts (REITs)) | | | 106,172 | |
| | 6,839 | | | Regions Financial Corp. (Banks) | | | 110,108 | |
| | 1,398 | | | Republic Services, Inc. (Commercial Services & Supplies) | | | 122,339 | |
| | 5,739 | | | ResMed, Inc. (Health Care Equipment & Supplies) | | | 848,913 | |
| | 4,495 | | | Retail Properties of America, Inc. Class A (Equity Real Estate Investment Trusts (REITs)) | | | 61,851 | |
| | 165 | | | Rockwell Automation, Inc. (Electrical Equipment) | | | 28,378 | |
| | 1,452 | | | Rogers Corp.* (Electronic Equipment, Instruments & Components) | | | 196,717 | |
| | 3,056 | | | Roper Technologies, Inc. (Industrial Conglomerates) | | | 1,029,750 | |
| | 782 | | | Ross Stores, Inc. (Specialty Retail) | | | 85,762 | |
| | 2,900 | | | Ryman Hospitality Properties, Inc. (Equity Real Estate Investment Trusts (REITs)) | | | 244,093 | |
| | 3,408 | | | S&P Global, Inc. (Capital Markets) | | | 879,230 | |
| | 432 | | | salesforce.com, Inc.* (Software) | | | 67,604 | |
| | 3,228 | | | Schweitzer-Mauduit International, Inc. (Paper & Forest Products) | | | 130,702 | |
| | 1,113 | | | Science Applications International Corp. (IT Services) | | | 91,956 | |
| | 6,659 | | | Seacoast Banking Corp. of Florida* (Banks) | | | 186,452 | |
| | 881 | | | Sempra Energy (Multi-Utilities) | | | 127,313 | |
| | 354 | | | ServiceNow, Inc.* (Software) | | | 87,530 | |
| | 8,557 | | | Silgan Holdings, Inc. (Containers & Packaging) | | | 263,299 | |
| | |
| | |
| The accompanying notes are an integral part of these financial statements. | | 51 |
GOLDMAN SACHS MULTI-MANAGER GLOBAL EQUITY FUND
Schedule of Investments(continued)
October 31, 2019
| | | | | | | | |
Shares | | | Description | | Value | |
|
| Common Stocks – (continued) | |
| United States – (continued) | |
| | 2,398 | | | Silicon Laboratories, Inc.* (Semiconductors & Semiconductor Equipment) | | $ | 254,764 | |
| | 3,100 | | | Simmons First National Corp. Class A (Banks) | | | 74,152 | |
| | 5,732 | | | Sirius XM Holdings, Inc. (Media) | | | 38,519 | |
| | 3,020 | | | SiteOne Landscape Supply, Inc.* (Trading Companies & Distributors) | | | 265,941 | |
| | 3,613 | | | Skechers U.S.A., Inc. Class A* (Textiles, Apparel & Luxury Goods) | | | 135,018 | |
| | 7,947 | | | Skyline Champion Corp.* (Household Durables) | | | 224,344 | |
| | 20,486 | | | Skyworks Solutions, Inc. (Semiconductors & Semiconductor Equipment) | | | 1,865,455 | |
| | 713 | | | SL Green Realty Corp. (Equity Real Estate Investment Trusts (REITs)) | | | 59,607 | |
| | 32,030 | | | SLM Corp. (Consumer Finance) | | | 270,333 | |
| | 529 | | | Snap-on, Inc. (Machinery) | | | 86,052 | |
| | 952 | | | Southwest Airlines Co. (Airlines) | | | 53,436 | |
| | 2,031 | | | Spectrum Brands Holdings, Inc. (Household Products) | | | 101,977 | |
| | 1,190 | | | Spirit Airlines, Inc.* (Airlines) | | | 44,696 | |
| | 882 | | | Spirit Realty Capital, Inc. (Equity Real Estate Investment Trusts (REITs)) | | | 43,959 | |
| | 632 | | | Splunk, Inc.* (Software) | | | 75,815 | |
| | 407 | | | SS&C Technologies Holdings, Inc. (Software) | | | 21,168 | |
| | 9,001 | | | STAG Industrial, Inc. (Equity Real Estate Investment Trusts (REITs)) | | | 279,391 | |
| | 821 | | | Standard Motor Products, Inc. (Auto Components) | | | 42,988 | |
| | 291 | | | Stanley Black & Decker, Inc. (Machinery) | | | 44,037 | |
| | 6,500 | | | Starbucks Corp. (Hotels, Restaurants & Leisure) | | | 549,640 | |
| | 7,411 | | | Starwood Property Trust, Inc. (Mortgage Real Estate Investment Trusts (REITs)) | | | 182,311 | |
| | 784 | | | State Street Corp. (Capital Markets) | | | 51,799 | |
| | 3,084 | | | Steven Madden Ltd. (Textiles, Apparel & Luxury Goods) | | | 126,999 | |
| | 7,422 | | | Stifel Financial Corp. (Capital Markets) | | | 415,484 | |
| | 2,267 | | | Stryker Corp. (Health Care Equipment & Supplies) | | | 490,284 | |
| | 539 | | | Sun Communities, Inc. (Equity Real Estate Investment Trusts (REITs)) | | | 87,668 | |
| | 12,989 | | | SunCoke Energy, Inc.* (Metals & Mining) | | | 68,712 | |
| | 1,221 | | | SunTrust Banks, Inc. (Banks) | | | 83,443 | |
| | 4,539 | | | Sykes Enterprises, Inc.* (IT Services) | | | 140,232 | |
| | 9,425 | | | Syneos Health, Inc.* (Life Sciences Tools & Services) | | | 472,664 | |
| | 1,722 | | | SYNNEX Corp. (Electronic Equipment, Instruments & Components) | | | 202,748 | |
| | 915 | | | Synopsys, Inc.* (Software) | | | 124,211 | |
| | 5,377 | | | Synovus Financial Corp. (Banks) | | | 182,119 | |
| | |
|
| Common Stocks – (continued) | |
| United States – (continued) | |
| | 1,730 | | | Sysco Corp. (Food & Staples Retailing) | | | 138,175 | |
| | 1,899 | | | T-Mobile US, Inc.* (Wireless Telecommunication Services) | | | 156,971 | |
| | 2,440 | | | Tapestry, Inc. (Textiles, Apparel & Luxury Goods) | | | 63,098 | |
| | 1,358 | | | Targa Resources Corp. (Oil, Gas & Consumable Fuels) | | | 52,799 | |
| | 2,405 | | | Target Corp. (Multiline Retail) | | | 257,119 | |
| | 1,400 | | | TCF Financial Corp. (Banks) | | | 55,426 | |
| | 1,631 | | | Tetra Tech, Inc. (Commercial Services & Supplies) | | | 142,664 | |
| | 13,665 | | | Texas Instruments, Inc. (Semiconductors & Semiconductor Equipment) | | | 1,612,333 | |
| | 5,819 | | | Texas Roadhouse, Inc. (Hotels, Restaurants & Leisure) | | | 328,773 | |
| | 1,301 | | | Textron, Inc. (Aerospace & Defense) | | | 59,963 | |
| | 4,433 | | | The Allstate Corp. (Insurance) | | | 471,760 | |
| | 851 | | | The Bank of New York Mellon Corp. (Capital Markets) | | | 39,784 | |
| | 54,200 | | | The Charles Schwab Corp. (Capital Markets) | | | 2,206,482 | |
| | 593 | | | The Clorox Co. (Household Products) | | | 87,580 | |
| | 9,083 | | | TheCoca-Cola Co. (Beverages) | | | 494,388 | |
| | 475 | | | The Cooper Cos., Inc. (Health Care Equipment & Supplies) | | | 138,225 | |
| | 717 | | | The Estee Lauder Cos., Inc. Class A (Personal Products) | | | 133,556 | |
| | 2,100 | | | The Gap, Inc. (Specialty Retail) | | | 34,146 | |
| | 5,200 | | | The Geo Group, Inc. (Equity Real Estate Investment Trusts (REITs)) | | | 79,144 | |
| | 641 | | | The Hanover Insurance Group, Inc. (Insurance) | | | 84,426 | |
| | 2,411 | | | The Hartford Financial Services Group, Inc. (Insurance) | | | 137,620 | |
| | 771 | | | The Hershey Co. (Food Products) | | | 113,237 | |
| | 12,775 | | | The Home Depot, Inc. (Specialty Retail) | | | 2,996,759 | |
| | 1,126 | | | The J.M. Smucker Co. (Food Products) | | | 118,996 | |
| | 2,059 | | | The Kraft Heinz Co. (Food Products) | | | 66,567 | |
| | 2,712 | | | The Kroger Co. (Food & Staples Retailing) | | | 66,824 | |
| | 5,600 | | | The Michaels Cos., Inc.* (Specialty Retail) | | | 48,888 | |
| | 1,062 | | | The Mosaic Co. (Chemicals) | | | 21,113 | |
| | 721 | | | The PNC Financial Services Group, Inc. (Banks) | | | 105,771 | |
| | 6,869 | | | The Procter & Gamble Co. (Household Products) | | | 855,259 | |
| | 5,220 | | | The Sherwin-Williams Co. (Chemicals) | | | 2,987,510 | |
| | 6,112 | | | The Southern Co. (Electric Utilities) | | | 382,978 | |
| | 1,773 | | | The Timken Co. (Machinery) | | | 86,877 | |
| | 2,748 | | | The TJX Cos., Inc. (Specialty Retail) | | | 158,422 | |
| | 670 | | | The Travelers Cos., Inc. (Insurance) | | | 87,810 | |
| | 19,122 | | | The Walt Disney Co. (Entertainment) | | | 2,484,330 | |
| | 1,480 | | | The Western Union Co. (IT Services) | | | 37,089 | |
| | 1,200 | | | The Williams Cos., Inc. (Oil, Gas & Consumable Fuels) | | | 26,772 | |
| | |
| | |
| 52 | | The accompanying notes are an integral part of these financial statements. |
GOLDMAN SACHS MULTI-MANAGER GLOBAL EQUITY FUND
| | | | | | | | |
Shares | | | Description | | Value | |
|
| Common Stocks – (continued) | |
| United States – (continued) | |
| | 6,263 | | | Thermo Fisher Scientific, Inc. (Life Sciences Tools & Services) | | $ | 1,891,301 | |
| | 890 | | | Tiffany & Co. (Specialty Retail) | | | 110,814 | |
| | 648 | | | Tractor Supply Co. (Specialty Retail) | | | 61,573 | |
| | 3,008 | | | TTEC Holdings, Inc. (IT Services) | | | 142,489 | |
| | 3,608 | | | Tutor Perini Corp.* (Construction & Engineering) | | | 55,816 | |
| | 659 | | | Twilio, Inc. Class A* (IT Services) | | | 63,633 | |
| | 22,978 | | | Two Harbors Investment Corp. (Mortgage Real Estate Investment Trusts (REITs)) | | | 318,705 | |
| | 6,185 | | | Tyson Foods, Inc. Class A (Food Products) | | | 512,056 | |
| | 1,905 | | | U.S. Bancorp (Banks) | | | 108,623 | |
| | 1,630 | | | UDR, Inc. (Equity Real Estate Investment Trusts (REITs)) | | | 81,907 | |
| | 2,400 | | | UGI Corp. (Gas Utilities) | | | 114,408 | |
| | 393 | | | Ulta Salon, Cosmetics & Fragrance, Inc.* (Specialty Retail) | | | 91,628 | |
| | 3,141 | | | Umpqua Holdings Corp. (Banks) | | | 49,691 | |
| | 200 | | | UniFirst Corp. (Commercial Services & Supplies) | | | 40,168 | |
| | 414 | | | Union Pacific Corp. (Road & Rail) | | | 68,500 | |
| | 3,838 | | | United Bankshares, Inc. (Banks) | | | 151,755 | |
| | 7,479 | | | United Parcel Service, Inc. Class B (Air Freight & Logistics) | | | 861,356 | |
| | 1,854 | | | United Technologies Corp. (Aerospace & Defense) | | | 266,197 | |
| | 10,314 | | | UnitedHealth Group, Inc. (Health Care Providers & Services) | | | 2,606,348 | |
| | 1,591 | | | Universal Corp. (Tobacco) | | | 87,187 | |
| | 300 | | | Universal Display Corp. (Semiconductors & Semiconductor Equipment) | | | 60,054 | |
| | 7,925 | | | Universal Forest Products, Inc. (Building Products) | | | 399,103 | |
| | 903 | | | Universal Health Services, Inc. Class B (Health Care Providers & Services) | | | 124,126 | |
| | 1,650 | | | Unum Group (Insurance) | | | 45,441 | |
| | 3,643 | | | US Ecology, Inc. (Commercial Services & Supplies) | | | 226,704 | |
| | 4,214 | | | Valero Energy Corp. (Oil, Gas & Consumable Fuels) | | | 408,674 | |
| | 9,339 | | | Valvoline, Inc. (Chemicals) | | | 199,294 | |
| | 457 | | | Varian Medical Systems, Inc.* (Health Care Equipment & Supplies) | | | 55,210 | |
| | 309 | | | Veeva Systems, Inc. Class A* (Health Care Technology) | | | 43,825 | |
| | 1,045 | | | Ventas, Inc. (Equity Real Estate Investment Trusts (REITs)) | | | 68,030 | |
| | 566 | | | VeriSign, Inc.* (IT Services) | | | 107,551 | |
| | 673 | | | Verisk Analytics, Inc. (Professional Services) | | | 97,383 | |
| | 14,894 | | | Verizon Communications, Inc. (Diversified Telecommunication Services) | | | 900,640 | |
| | |
|
| Common Stocks – (continued) | |
| United States – (continued) | |
| | 1,200 | | | Vertex Pharmaceuticals, Inc.* (Biotechnology) | | | 234,576 | |
| | 1,382 | | | VF Corp. (Textiles, Apparel & Luxury Goods) | | | 113,725 | |
| | 16,567 | | | Viacom, Inc. Class B (Entertainment) | | | 357,185 | |
| | 70,125 | | | Virtu Financial, Inc. Class A (Capital Markets) | | | 1,189,320 | |
| | 6,058 | | | Virtusa Corp.* (IT Services) | | | 225,842 | |
| | 9,705 | | | Visa, Inc. Class A (IT Services) | | | 1,735,836 | |
| | 1,900 | | | Vistra Energy Corp. (Independent Power and Renewable Electricity Producers) | | | 51,357 | |
| | 295 | | | VMware, Inc. Class A (Software) | | | 46,690 | |
| | 394 | | | Vornado Realty Trust (Equity Real Estate Investment Trusts (REITs)) | | | 25,858 | |
| | 1,700 | | | Vulcan Materials Co. (Construction Materials) | | | 242,879 | |
| | 176 | | | W.W. Grainger, Inc. (Trading Companies & Distributors) | | | 54,356 | |
| | 4,145 | | | Walgreens Boots Alliance, Inc. (Food & Staples Retailing) | | | 227,063 | |
| | 3,267 | | | Walker & Dunlop, Inc. (Thrifts & Mortgage Finance) | | | 205,788 | |
| | 1,894 | | | Walmart, Inc. (Food & Staples Retailing) | | | 222,090 | |
| | 4,303 | | | Washington Federal, Inc. (Thrifts & Mortgage Finance) | | | 156,887 | |
| | 614 | | | Waste Management, Inc. (Commercial Services & Supplies) | | | 68,897 | |
| | 126 | | | Waters Corp.* (Life Sciences Tools & Services) | | | 26,664 | |
| | 889 | | | WD-40 Co. (Household Products) | | | 166,599 | |
| | 4,787 | | | Webster Financial Corp. (Banks) | | | 211,107 | |
| | 2,359 | | | WEC Energy Group, Inc. (Multi-Utilities) | | | 222,690 | |
| | 321 | | | WellCare Health Plans, Inc.* (Health Care Providers & Services) | | | 95,209 | |
| | 1,661 | | | Wells Fargo & Co. (Banks) | | | 85,757 | |
| | 1,229 | | | Welltower, Inc. (Equity Real Estate Investment Trusts (REITs)) | | | 111,458 | |
| | 7,187 | | | WESCO International, Inc.* (Trading Companies & Distributors) | | | 360,428 | |
| | 1,100 | | | Western Alliance Bancorp (Banks) | | | 54,263 | |
| | 1,452 | | | Western Digital Corp. (Technology Hardware, Storage & Peripherals) | | | 74,996 | |
| | 1,218 | | | Westrock Co. (Containers & Packaging) | | | 45,517 | |
| | 1,400 | | | Whirlpool Corp. (Household Durables) | | | 212,968 | |
| | 147 | | | White Mountains Insurance Group Ltd. (Insurance) | | | 157,437 | |
| | 400 | | | Wintrust Financial Corp. (Banks) | | | 25,528 | |
| | 5,212 | | | Wolverine World Wide, Inc. (Textiles, Apparel & Luxury Goods) | | | 154,692 | |
| | 7,816 | | | World Fuel Services Corp. (Oil, Gas & Consumable Fuels) | | | 326,474 | |
| | 1,225 | | | WP Carey, Inc. (Equity Real Estate Investment Trusts (REITs)) | | | 112,773 | |
| | 8,250 | | | WPX Energy, Inc.* (Oil, Gas & Consumable Fuels) | | | 82,335 | |
| | |
| | |
| The accompanying notes are an integral part of these financial statements. | | 53 |
GOLDMAN SACHS MULTI-MANAGER GLOBAL EQUITY FUND
Schedule of Investments(continued)
October 31, 2019
| | | | | | | | |
Shares | | | Description | | Value | |
|
| Common Stocks – (continued) | |
| United States – (continued) | |
| | 447 | | | Wynn Resorts Ltd. (Hotels, Restaurants & Leisure) | | $ | 54,239 | |
| | 2,747 | | | Xcel Energy, Inc. (Electric Utilities) | | | 174,462 | |
| | 1,900 | | | Xerox Holdings Corp. (Technology Hardware, Storage & Peripherals) | | | 64,467 | |
| | 661 | | | Xilinx, Inc. (Semiconductors & Semiconductor Equipment) | | | 59,979 | |
| | 1,308 | | | Xylem, Inc. (Machinery) | | | 100,311 | |
| | 2,456 | | | Yelp, Inc.* (Interactive Media & Services) | | | 84,757 | |
| | 14,002 | | | Yum China Holdings, Inc. (Hotels, Restaurants & Leisure) | | | 595,085 | |
| | 781 | | | Yum! Brands, Inc. (Hotels, Restaurants & Leisure) | | | 79,436 | |
| | 248 | | | Zimmer Biomet Holdings, Inc. (Health Care Equipment & Supplies) | | | 34,281 | |
| | 817 | | | Zions Bancorp NA (Banks) | | | 39,600 | |
| | 4,212 | | | Zoetis, Inc. (Pharmaceuticals) | | | 538,799 | |
| | | | | | | | |
| | | | | | | 183,228,815 | |
| | |
| | TOTAL COMMON STOCKS | |
| | (Cost $336,886,373) | | $ | 385,823,595 | |
| | |
| | |
| Shares | | | Dividend
Rate | | Value | |
|
| Preferred Stocks – 0.6% | |
| Brazil – 0.1% | |
| | Banco Bradesco SA (Banks) | |
| | 1,311 | | | 6.020% | | $ | 11,497 | |
| | Bradespar SA (Metals & Mining) | |
| | 1,200 | | | 3.820 | | | 9,578 | |
| | Braskem SA Class A (Chemicals) | |
| | 800 | | | 2.670 | | | 5,526 | |
| | Cia Brasileira de Distribuicao (Food & Staples Retailing) | |
| | 500 | | | 1.440 | | | 10,347 | |
| Cia de Transmissao de Energia Eletrica Paulista (Electric
Utilities) |
|
| | 24,800 | | | 14.260 | | | 145,751 | |
| | Cia Energetica de Minas Gerais (Electric Utilities) | |
| | 30,866 | | | 4.530 | | | 105,054 | |
| | Gerdau SA (Metals & Mining) | |
| | 700 | | | 1.830 | | | 2,344 | |
| | Gol Linhas Aereas Inteligentes SA* (Airlines) | |
| | 5,600 | | | 0.000 | | | 51,106 | |
| | Itau Unibanco Holding SA (Banks) | |
| | 750 | | | 4.740 | | | 6,775 | |
| | Petroleo Brasileiro SA (Oil, Gas & Consumable Fuels) | |
| | 2,500 | | | 4.390 | | | 18,944 | |
| | Telefonica Brasil SA (Diversified Telecommunication Services) | |
| | 6,670 | | | 6.860 | | | 88,279 | |
| | | | | | | | |
| | | | | | | 455,201 | |
| | |
| Chile – 0.0% | |
| | Embotelladora Andina SA (Beverages) | |
| | 899 | | | 4.800% | | | 2,594 | |
| | |
| Colombia – 0.0% | |
| | Bancolombia SA (Banks) | |
| | 595 | | | 2.400 | | | 7,767 | |
| | Grupo Aval Acciones y Valores SA (Banks) | |
| | 30,535 | | | 3.970 | | | 12,512 | |
| | | | | | | | |
| | | | | | | 20,279 | |
| | |
| Germany – 0.5% | |
| | FUCHS PETROLUB SE (Chemicals) | |
| | 422 | | | 2.330 | | | 17,979 | |
| | Henkel AG & Co. KGaA (Household Products) | |
| | 78 | | | 1.950 | | | 8,102 | |
| | Volkswagen AG (Automobiles) | |
| | 12,061 | | | 2.670 | | | 2,292,859 | |
| | | | | | | | |
| | | | | | | 2,318,940 | |
| | |
| Russia – 0.0% | |
| | Transneft PJSC (Oil, Gas & Consumable Fuels) | |
| | 1 | | | 0.000 | | | 2,597 | |
| | |
| | TOTAL PREFERRED STOCKS | |
| | (Cost $1,915,521) | | $ | 2,799,611 | |
| | |
| | | | | | | | | | | | | | |
Principal
Amount | | | Interest
Rate | | | Maturity
Date | | | Value | |
|
| Corporate Obligations – 0.0% | |
| Food & Drug Retailing – 0.0% | |
| | Britannia Industries Ltd. | |
| INR | 17,250 | | | | 8.000% | | | | 08/28/22 | | | $ | 252 | |
| | (Cost $246) | |
| | |
| | | |
| Shares | | | Description | | | Expiration
Date | | | Value | |
|
| Rights* – 0.0% | |
| Singapore – 0.0% | |
| Mapletree Commerical Trust (Equity Real Estate Investment
Trusts (REITs)) |
|
| | 7,371 | | | | | | | | 11/07/19 | | | $ | 480 | |
| | |
| Taiwan – 0.0% | | | | | | | | | | |
| | Cathay Financial Holding Co. (Insurance) | |
| | 206 | | | | | | | | 11/25/19 | | | | 36 | |
| | |
| Thailand – 0.0% | | | | | | | | | | |
| | TMB Bank PCL (Banks) | |
| | 194,665 | | | | | | | | 11/19/19 | | | | 254 | |
| | |
| United Arab Emirates – 0.0% | |
| | Emirates NBD PJSC (Banks) | |
| | 5,400 | | | | | | | | 11/20/19 | | | | 5,149 | |
| | |
| | TOTAL RIGHTS | | | | | | | | | | | | | |
| | (Cost $–) | | | | | | | | | | | $ | 5,919 | |
| | |
| | |
| 54 | | The accompanying notes are an integral part of these financial statements. |
GOLDMAN SACHS MULTI-MANAGER GLOBAL EQUITY FUND
| | | | | | | | |
Shares | | | Description | | Value | |
| | | | | | | | |
|
| Exchange Traded Funds – 5.2% | |
| | 8,861 | | | iShares MSCI Emerging Markets ETF | | $ | 377,301 | |
| | 567,000 | | | Vanguard FTSE Emerging Markets ETF | | | 23,728,950 | |
| | |
| | TOTAL EXCHANGE TRADED FUNDS | |
| | (Cost $24,052,116) | | $ | 24,106,251 | |
| | |
| | |
| Shares | | | Dividend
Rate | | Value | |
|
| Investment Companies(c) – 10.5% | |
| Goldman Sachs Financial Square Government Fund – Class R6
Shares |
|
| | 34,444,680 | | | 1.701% | | $ | 34,444,680 | |
| Goldman Sachs Financial Square Government Fund –
Institutional Shares |
|
| | 13,920,727 | | | 1.701 | | | 13,920,727 | |
| | |
| | TOTAL INVESTMENT COMPANIES | |
| | (Cost $48,365,407) | | $ | 48,365,407 | |
| | |
| TOTAL INVESTMENTS BEFORESHORT-TERM
INVESTMENT |
|
| | (Cost $411,219,663) | | $ | 461,101,035 | |
| | |
| | | | | | | | |
| | | | | | | | | | | | |
Principal
Amount | | | Interest
Rate | | Maturity
Date | | | Value | |
|
| Short-term Investment(d)(e) – 0.0% | |
| U.S. Treasury Obligation – 0.0% | |
| | United States Treasury Bill | |
| $ | 100,000 | | | 0.000% | | | 12/19/19 | | | $ | 99,809 | |
| | (Cost $99,745) | |
| | |
| | TOTAL INVESTMENTS – 99.7% | |
| | (Cost $411,319,408) | | | $ | 461,200,844 | |
| | |
| OTHER ASSETS IN EXCESS OF
LIABILITIES – 0.3% |
| | | 1,240,336 | |
| | |
| | NET ASSETS – 100.0% | | | $ | 462,441,180 | |
| | |
| | |
|
| The percentage shown for each investment category reflects the value of investments in that category as a percentage of net assets. |
| |
* | | Non-income producing security. |
| |
(a) | | Exempt from registration under Rule 144A of the Securities Act of 1933. |
| |
(b) | | Significant unobservable inputs were used in the valuation of this portfolio security; i.e., Level 3. |
| |
(c) | | Represents an affiliated issuer. |
| |
(d) | | Issued with a zero coupon. Income is recognized through the accretion of discount. |
| |
(e) | | All or a portion of security is segregated as collateral for initial margin requirements on futures transactions. |
| | |
|
Currency Abbreviations: |
AUD | | —Australian Dollar |
CHF | | —Swiss Franc |
DKK | | —Danish Krone |
EUR | | —Euro |
GBP | | —British Pound |
HKD | | —Hong Kong Dollar |
ILS | | —Israeli Shekel |
INR | | —Indian Rupee |
JPY | | —Japanese Yen |
NOK | | —Norwegian Krone |
NZD | | —New Zealand Dollar |
SEK | | —Swedish Krona |
SGD | | —Singapore Dollar |
USD | | —U.S. Dollar |
|
Investment Abbreviations: |
ADR | | —American Depositary Receipt |
ETF | | —Exchange Traded Fund |
GDR | | —Global Depository Receipt |
PLC | | —Public Limited Company |
REIT | | —Real Estate Investment Trust |
|
| | |
| The accompanying notes are an integral part of these financial statements. | | 55 |
GOLDMAN SACHS MULTI-MANAGER GLOBAL EQUITY FUND
Schedule of Investments(continued)
October 31, 2019
|
| ADDITIONAL INVESTMENT INFORMATION |
FORWARD FOREIGN CURRENCY EXCHANGE CONTRACTS — At October 31, 2019, the Fund had the following forward foreign currency exchange contracts:
FORWARD FOREIGN CURRENCY EXCHANGE CONTRACTS WITH UNREALIZED GAIN
| | | | | | | | | | | | | | | | | | | | |
| Counterparty | | Currency
Purchased | | | Currency
Sold | | | Settlement
Date | | | Unrealized
Gain | |
BNP Paribas SA | | AUD | | | 6,050,000 | | | USD | | | 4,119,108 | | | | 11/04/19 | | | $ | 52,013 | |
| | CHF | | | 5,360,000 | | | USD | | | 5,384,546 | | | | 11/04/19 | | | | 50,598 | |
| | DKK | | | 6,990,000 | | | USD | | | 1,036,382 | | | | 11/04/19 | | | | 7,426 | |
| | EUR | | | 16,580,000 | | | USD | | | 18,361,463 | | | | 11/04/19 | | | | 135,699 | |
| | GBP | | | 7,565,000 | | | USD | | | 9,617,052 | | | | 11/04/19 | | | | 183,655 | |
| | HKD | | | 14,870,000 | | | USD | | | 1,896,566 | | | | 11/04/19 | | | | 1,034 | |
| | ILS | | | 560,000 | | | USD | | | 158,509 | | | | 11/04/19 | | | | 416 | |
| | JPY | | | 1,234,000,000 | | | USD | | | 11,327,981 | | | | 11/05/19 | | | | 102,307 | |
| | NOK | | | 2,700,000 | | | USD | | | 293,509 | | | | 11/04/19 | | | | 103 | |
| | NZD | | | 220,000 | | | USD | | | 139,385 | | | | 11/04/19 | | | | 1,678 | |
| | SEK | | | 14,475,000 | | | USD | | | 1,486,247 | | | | 11/04/19 | | | | 13,232 | |
| | SGD | | | 1,010,000 | | | USD | | | 739,652 | | | | 11/04/19 | | | | 2,774 | |
| | USD | | | 5,448,062 | | | CHF | | | 5,360,000 | | | | 11/04/19 | | | | 12,918 | |
| | USD | | | 1,898,127 | | | HKD | | | 14,870,000 | | | | 11/04/19 | | | | 527 | |
| | USD | | | 194,624 | | | ILS | | | 680,000 | | | | 11/04/19 | | | | 1,644 | |
| | USD | | | 14,514,816 | | | JPY | | | 1,556,000,000 | | | | 11/05/19 | | | | 101,908 | |
| | USD | | | 382,343 | | | NOK | | | 3,450,000 | | | | 11/04/19 | | | | 7,172 | |
JPMorgan Securities, Inc. | | AUD | | | 2,390,000 | | | USD | | | 1,632,012 | | | | 11/04/19 | | | | 15,753 | |
| | CHF | | | 2,190,000 | | | USD | | | 2,198,909 | | | | 11/04/19 | | | | 21,794 | |
| | DKK | | | 2,840,000 | | | USD | | | 421,876 | | | | 11/04/19 | | | | 2,218 | |
| | EUR | | | 6,540,000 | | | USD | | | 7,256,829 | | | | 11/04/19 | | | | 39,398 | |
| | GBP | | | 3,065,000 | | | USD | | | 3,937,053 | | | | 11/04/19 | | | | 33,756 | |
| | HKD | | | 6,400,000 | | | USD | | | 816,340 | | | | 11/04/19 | | | | 381 | |
| | ILS | | | 280,000 | | | USD | | | 79,255 | | | | 11/04/19 | | | | 208 | |
| | JPY | | | 594,000,000 | | | USD | | | 5,452,853 | | | | 11/05/19 | | | | 49,247 | |
| | NOK | | | 1,350,000 | | | USD | | | 146,754 | | | | 11/04/19 | | | | 52 | |
| | NZD | | | 90,000 | | | USD | | | 57,094 | | | | 11/04/19 | | | | 613 | |
| | SEK | | | 5,625,000 | | | USD | | | 580,698 | | | | 11/04/19 | | | | 2,001 | |
| | SGD | | | 420,000 | | | USD | | | 308,324 | | | | 11/04/19 | | | | 408 | |
| | USD | | | 2,225,981 | | | CHF | | | 2,190,000 | | | | 11/04/19 | | | | 5,278 | |
| | USD | | | 816,948 | | | HKD | | | 6,400,000 | | | | 11/04/19 | | | | 227 | |
| | USD | | | 80,139 | | | ILS | | | 280,000 | | | | 11/04/19 | | | | 677 | |
| | USD | | | 5,541,003 | | | JPY | | | 594,000,000 | | | | 11/05/19 | | | | 38,903 | |
| | USD | | | 149,612 | | | NOK | | | 1,350,000 | | | | 11/04/19 | | | | 2,806 | |
State Street Bank and Trust | | JPY | | | 535,055 | | | USD | | | 4,948 | | | | 11/05/19 | | | | 8 | |
| | | | | | |
| TOTAL | | | | | | | | | | | | | | | | | | $ | 888,832 | |
FORWARD FOREIGN CURRENCY EXCHANGE CONTRACTS WITH UNREALIZED LOSS
| | | | | | | | | | | | | | | | | | | | |
| Counterparty | | Currency
Purchased | | | Currency
Sold | | | Settlement
Date | | | Unrealized
Loss | |
BNP Paribas SA | | ILS | | | 120,000 | | | USD | | | 34,330 | | | | 11/04/19 | | | $ | (275 | ) |
| | JPY | | | 322,000,000 | | | USD | | | 3,001,625 | | | | 11/05/19 | | | | (19,005 | ) |
| | NOK | | | 750,000 | | | USD | | | 81,822 | | | | 11/04/19 | | | | (263 | ) |
| | USD | | | 4,090,441 | | | AUD | | | 6,050,000 | | | | 11/04/19 | | | | (80,679 | ) |
| | USD | | | 3,266,598 | | | AUD | | | 4,780,000 | | | | 12/03/19 | | | | (31,492 | ) |
| | USD | | | 4,296,648 | | | CHF | | | 4,270,000 | | | | 12/03/19 | | | | (42,637 | ) |
| | USD | | | 1,031,809 | | | DKK | | | 6,990,000 | | | | 11/04/19 | | | | (11,999 | ) |
| | |
| 56 | | The accompanying notes are an integral part of these financial statements. |
GOLDMAN SACHS MULTI-MANAGER GLOBAL EQUITY FUND
|
| ADDITIONAL INVESTMENT INFORMATION (continued) |
FORWARD FOREIGN CURRENCY EXCHANGE CONTRACTS WITH UNREALIZED LOSS (continued)
| | | | | | | | | | | | | | | | | | | | |
| Counterparty | | Currency
Purchased | | | Currency
Sold | | | Settlement
Date | | | Unrealized
Loss | |
BNP Paribas SA (continued) | | USD | | | 818,778 | | | DKK | | | 5,500,000 | | | | 12/03/19 | | | $ | (4,280 | ) |
| | USD | | | 18,264,843 | | | EUR | | | 16,580,000 | | | | 11/04/19 | | | | (232,320 | ) |
| | USD | | | 14,530,549 | | | EUR | | | 13,070,000 | | | | 12/03/19 | | | | (78,483 | ) |
| | USD | | | 9,382,993 | | | GBP | | | 7,565,000 | | | | 11/04/19 | | | | (417,715 | ) |
| | USD | | | 7,663,093 | | | GBP | | | 5,960,000 | | | | 12/03/19 | | | | (65,412 | ) |
| | USD | | | 1,511,755 | | | HKD | | | 11,850,000 | | | | 12/03/19 | | | | (228 | ) |
| | USD | | | 158,740 | | | ILS | | | 560,000 | | | | 12/03/19 | | | | (412 | ) |
| | USD | | | 11,346,591 | | | JPY | | | 1,234,000,000 | | | | 12/03/19 | | | | (103,106 | ) |
| | USD | | | 293,555 | | | NOK | | | 2,700,000 | | | | 12/03/19 | | | | (98 | ) |
| | USD | | | 138,437 | | | NZD | | | 220,000 | | | | 11/04/19 | | | | (2,625 | ) |
| | USD | | | 114,265 | | | NZD | | | 180,000 | | | | 12/03/19 | | | | (1,213 | ) |
| | USD | | | 1,493,842 | | | SEK | | | 14,475,000 | | | | 11/04/19 | | | | (5,638 | ) |
| | USD | | | 1,178,851 | | | SEK | | | 11,400,000 | | | | 12/03/19 | | | | (3,974 | ) |
| | USD | | | 733,110 | | | SGD | | | 1,010,000 | | | | 11/04/19 | | | | (9,317 | ) |
| | USD | | | 602,155 | | | SGD | | | 820,000 | | | | 12/03/19 | | | | (789 | ) |
JPMorgan Securities, Inc. | | USD | | | 1,615,893 | | | AUD | | | 2,390,000 | | | | 11/04/19 | | | | (31,872 | ) |
| | USD | | | 1,633,299 | | | AUD | | | 2,390,000 | | | | 12/03/19 | | | | (15,746 | ) |
| | USD | | | 2,203,667 | | | CHF | | | 2,190,000 | | | | 12/03/19 | | | | (21,868 | ) |
| | USD | | | 419,219 | | | DKK | | | 2,840,000 | | | | 11/04/19 | | | | (4,875 | ) |
| | USD | | | 422,787 | | | DKK | | | 2,840,000 | | | | 12/03/19 | | | | (2,210 | ) |
| | USD | | | 7,204,588 | | | EUR | | | 6,540,000 | | | | 11/04/19 | | | | (91,639 | ) |
| | USD | | | 7,270,833 | | | EUR | | | 6,540,000 | | | | 12/03/19 | | | | (39,271 | ) |
| | USD | | | 3,801,569 | | | GBP | | | 3,065,000 | | | | 11/04/19 | | | | (169,239 | ) |
| | USD | | | 3,940,835 | | | GBP | | | 3,065,000 | | | | 12/03/19 | | | | (33,639 | ) |
| | USD | | | 816,475 | | | HKD | | | 6,400,000 | | | | 12/03/19 | | | | (123 | ) |
| | USD | | | 79,370 | | | ILS | | | 280,000 | | | | 12/03/19 | | | | (206 | ) |
| | USD | | | 5,461,811 | | | JPY | | | 594,000,000 | | | | 12/03/19 | | | | (49,631 | ) |
| | USD | | | 146,777 | | | NOK | | | 1,350,000 | | | | 12/03/19 | | | | (49 | ) |
| | USD | | | 56,633 | | | NZD | | | 90,000 | | | | 11/04/19 | | | | (1,074 | ) |
| | USD | | | 57,133 | | | NZD | | | 90,000 | | | | 12/03/19 | | | | (607 | ) |
| | USD | | | 580,508 | | | SEK | | | 5,625,000 | | | | 11/04/19 | | | | (2,191 | ) |
| | USD | | | 581,670 | | | SEK | | | 5,625,000 | | | | 12/03/19 | | | | (1,961 | ) |
| | USD | | | 304,857 | | | SGD | | | 420,000 | | | | 11/04/19 | | | | (3,874 | ) |
| | USD | | | 308,421 | | | SGD | | | 420,000 | | | | 12/03/19 | | | | (404 | ) |
State Street Bank and Trust | | USD | | | 1,688 | | | JPY | | | 182,527 | | | | 11/05/19 | | | | (3 | ) |
| | | | | | |
| TOTAL | | | | | | | | | | | | | | | | | | $ | (1,582,442 | ) |
FUTURES CONTRACTS — At October 31, 2019, the Fund had the following futures contracts:
| | | | | | | | | | | | | | | | |
| Description | | Number of
Contracts | | | Expiration
Date | | | Notional
Amount | | | Unrealized
Appreciation/
(Depreciation) | |
Long position contracts: | | | | | | | | | | | | | | | | |
Mini MSCI EAFE Index | | | 1 | | | | 12/20/19 | | | $ | 97,860 | | | $ | 2,089 | |
S&P 500E-Mini Index | | | 306 | | | | 12/20/19 | | | | 46,447,740 | | | | 494,173 | |
| | | | |
| TOTAL FUTURES CONTRACTS | | | | | | | | | | | | | | $ | 496,262 | |
| | |
| The accompanying notes are an integral part of these financial statements. | | 57 |
GOLDMAN SACHS MULTI-MANAGER NON-CORE FIXED INCOME FUND
Schedule of Investments
October 31, 2019
| | | | | | | | | | | | | | |
Principal
Amount | | | Interest
Rate | | | Maturity
Date | | | Value | |
|
| Foreign Debt Obligations – 28.2% | |
| Sovereign – 28.2% | |
| | Abu Dhabi Government International Bond(a) | |
| $ | 2,031,000 | | | | 2.500 | % | | | 09/30/29 | | | $ | 2,018,306 | |
| | 1,728,000 | | | | 3.125 | | | | 09/30/49 | | | | 1,665,360 | |
| | Bonos de la Tesoreria de la Republica | |
| CLP | 1,445,365,525 | | | | 2.000 | | | | 03/01/35 | | | | 2,285,938 | |
| | Brazil Notas do Tesouro Nacional | |
| BRL | 25,502,000 | | | | 10.000 | | | | 01/01/23 | | | | 7,198,115 | |
| | 10,455,000 | | | | 10.000 | | | | 01/01/25 | | | | 3,060,462 | |
| | 17,170,000 | | | | 10.000 | | | | 01/01/27 | | | | 5,169,838 | |
| | China Government International Bond | |
| $ | 787,000 | | | | 3.250 | | | | 10/19/23 | | | | 825,063 | |
| | Croatia Government International Bond | |
| | 1,193,000 | | | | 6.625 | | | | 07/14/20 | | | | 1,228,790 | |
| | Dominican Republic | |
| | 1,623,000 | | | | 6.000 | | | | 07/19/28 | | | | 1,798,994 | |
| | 778,000 | | | | 6.400 | | | | 06/05/49 | | | | 841,942 | |
| DOP | 10,300,000 | | | | 9.750 | (a) | | | 06/05/26 | | | | 197,599 | |
| | Ecuador Government International Bond | |
| $ | 769,000 | | | | 9.500 | (a) | | | 03/27/30 | | | | 738,240 | |
| | 1,432,000 | | | | 10.750 | | | | 01/31/29 | | | | 1,458,402 | |
| | Egypt Treasury Bills(b) | |
| EGP | 1,675,000 | | | | 0.000 | | | | 01/07/20 | | | | 100,818 | |
| | 72,000,000 | | | | 0.000 | | | | 11/05/19 | | | | 4,453,784 | |
| | 30,500,000 | | | | 0.000 | | | | 11/12/19 | | | | 1,880,323 | |
| | 13,900,000 | | | | 0.000 | | | | 11/19/19 | | | | 854,617 | |
| | 15,525,000 | | | | 0.000 | | | | 12/17/19 | | | | 942,956 | |
| | El Salvador Government International Bond | |
| $ | 228,000 | | | | 5.875 | | | | 01/30/25 | | | | 237,049 | |
| | Federal Republic of Brazil(c) | |
| | 2,883,000 | | | | 4.500 | | | | 05/30/29 | | | | 3,040,664 | |
| | Government of Jamaica | |
| | 819,000 | | | | 7.875 | | | | 07/28/45 | | | | 1,084,663 | |
| | Hungary Government Bond | |
| HUF | 568,000,000 | | | | 3.000 | | | | 08/21/30 | | | | 2,127,161 | |
| | 677,310,000 | | | | 3.250 | | | | 10/22/31 | | | | 2,578,693 | |
| $ | 1,912,000 | | | | 6.375 | | | | 03/29/21 | | | | 2,026,720 | |
| | Indonesia Treasury Bond | |
| IDR | 10,100,000,000 | | | | 6.625 | | | | 05/15/33 | | | | 675,276 | |
| | 21,316,000,000 | | | | 7.500 | | | | 08/15/32 | | | | 1,532,984 | |
| | 33,900,000,000 | | | | 7.500 | | | | 06/15/35 | | | | 2,418,094 | |
| | 77,690,000,000 | | | | 8.375 | | | | 03/15/34 | | | | 5,988,500 | |
| | Islamic Republic of Pakistan | |
| $ | 886,000 | | | | 6.875 | | | | 12/05/27 | | | | 884,892 | |
| | Kingdom of Jordan | |
| | 714,000 | | | | 7.375 | | | | 10/10/47 | | | | 753,493 | |
| | Kuwait International Government Bond | |
| | 345,000 | | | | 2.750 | | | | 03/20/22 | | | | 350,175 | |
| | 200,000 | | | | 3.500 | | | | 03/20/27 | | | | 215,375 | |
| | Malaysia Government Bond | |
| MYR | 5,799,000 | | | | 3.480 | | | | 03/15/23 | | | | 1,397,841 | |
| | 1,926,000 | | | | 3.844 | | | | 04/15/33 | | | | 465,571 | |
| | 13,753,000 | | | | 3.885 | | | | 08/15/29 | | | | 3,412,334 | |
| | 6,930,000 | | | | 3.899 | | | | 11/16/27 | | | | 1,706,414 | |
| | 5,120,000 | | | | 4.181 | | | | 07/15/24 | | | | 1,267,842 | |
| | 2,440,000 | | | | 4.893 | | | | 06/08/38 | | | | 664,977 | |
| | |
|
| Foreign Debt Obligations – (continued) | |
| Sovereign – (continued) | |
| | Mexico Government International Bond | |
| $ | 1,031,000 | | | | 4.500 | | | | 04/22/29 | | | | 1,135,067 | |
| | Mongolia Government International Bond | |
| | 724,000 | | | | 5.625 | | | | 05/01/23 | | | | 741,648 | |
| | Nigeria T – Bill | |
| NGN | 377,832,000 | | | | 1.000 | | | | 09/17/20 | | | | 926,177 | |
| | 227,168,000 | | | | 13.300 | | | | 09/17/20 | | | | 556,856 | |
| | Oman Government International Bond | |
| $ | 849,000 | | | | 4.875 | (a) | | | 02/01/25 | | | | 853,245 | |
| | 870,000 | | | | 6.500 | | | | 03/08/47 | | | | 804,750 | |
| | 166,000 | | | | 6.500 | | | | 03/08/47 | | | | 153,550 | |
| | 837,000 | | | | 6.750 | | | | 01/17/48 | | | | 784,164 | |
| | Panama Notas del Tesoro(a) | |
| | 512,000 | | | | 3.750 | | | | 04/17/26 | | | | 533,888 | |
| | Perusahaan Penerbit SBSN Indonesia III | |
| | 341,000 | | | | 4.325 | | | | 05/28/25 | | | | 366,255 | |
| | Poland Government Bond | |
| PLN | 20,250,000 | | | | 2.750 | | | | 10/25/29 | | | | 5,669,777 | |
| | Republic of Angola | |
| $ | 993,000 | | | | 9.500 | | | | 11/12/25 | | | | 1,118,366 | |
| | Republic of Argentina | |
| | 2,478,000 | | | | 5.875 | | | | 01/11/28 | | | | 947,835 | |
| | 793,000 | | | | 6.875 | | | | 04/22/21 | | | | 357,593 | |
| | Republic of Azerbaijan | |
| | 1,000,000 | | | | 5.125 | | | | 09/01/29 | | | | 1,086,244 | |
| | 135,000 | | | | 5.125 | | | | 09/01/29 | | | | 146,643 | |
| | Republic of Bahrain(a) | |
| | 925,000 | | | | 5.625 | | | | 09/30/31 | | | | 969,529 | |
| | Republic of Chile(c) | |
| | 1,417,000 | | | | 3.500 | | | | 01/25/50 | | | | 1,524,161 | |
| | Republic of Colombia | |
| | 751,000 | | | | 4.500 | (c) | | | 03/15/29 | | | | 836,661 | |
| | 1,192,000 | | | | 5.000 | (c) | | | 06/15/45 | | | | 1,389,797 | |
| COP | 6,985,400,000 | | | | 6.000 | | | | 04/28/28 | | | | 2,084,729 | |
| | 3,000,000,000 | | | | 7.000 | | | | 05/04/22 | | | | 929,325 | |
| | 5,389,200,000 | | | | 7.500 | | | | 08/26/26 | | | | 1,760,881 | |
| | 7,499,500,000 | | | | 7.750 | | | | 09/18/30 | | | | 2,510,824 | |
| | 7,402,300,000 | | | | 10.000 | | | | 07/24/24 | | | | 2,621,838 | |
| | Republic of Costa Rica | |
| $ | 639,000 | | | | 4.250 | | | | 01/26/23 | | | | 626,619 | |
| | 318,000 | | | | 7.158 | | | | 03/12/45 | | | | 316,609 | |
| | Republic of Egypt | |
| | 784,000 | | | | 7.600 | | | | 03/01/29 | | | | 831,040 | |
| | 820,000 | | | | 8.500 | | | | 01/31/47 | | | | 861,256 | |
| | 911,000 | | | | 8.500 | | | | 01/31/47 | | | | 956,835 | |
| | Republic of El Salvador | |
| | 309,000 | | | | 7.375 | | | | 12/01/19 | | | | 309,869 | |
| | Republic of Gabon | |
| | 400,000 | | | | 6.375 | | | | 12/12/24 | | | | 397,875 | |
| | Republic of Ghana | |
| | 596,000 | | | | 8.125 | | | | 03/26/32 | | | | 602,705 | |
| | 707,000 | | | | 7.875 | | | | 03/26/27 | | | | 735,280 | |
| | Republic of Guatemala(c) | |
| | 700,000 | | | | 4.900 | | | | 06/01/30 | | | | 745,063 | |
| | |
| | |
| 58 | | The accompanying notes are an integral part of these financial statements. |
GOLDMAN SACHS MULTI-MANAGER NON-CORE FIXED INCOME FUND
| | | | | | | | | | | | | | |
Principal
Amount | | | Interest
Rate | | | Maturity
Date | | | Value | |
|
| Foreign Debt Obligations – (continued) | |
| Sovereign – (continued) | |
| | Republic of Indonesia | |
| $ | 748,000 | | | | 3.850 | % | | | 07/18/27 | | | $ | 791,945 | |
| | 1,853,000 | | | | 4.125 | | | | 01/15/25 | | | | 1,971,129 | |
| | 771,000 | | | | 4.625 | | | | 04/15/43 | | | | 860,629 | |
| IDR | 11,565,000,000 | | | | 7.000 | | | | 05/15/27 | | | | 835,840 | |
| | 12,280,000,000 | | | | 8.250 | | | | 05/15/29 | | | | 950,941 | |
| | 22,001,000,000 | | | | 8.375 | | | | 09/15/26 | | | | 1,711,555 | |
| | 22,339,000,000 | | | | 9.000 | | | | 03/15/29 | | | | 1,799,119 | |
| | Republic of Iraq(c) | |
| $ | 839,000 | | | | 5.800 | | | | 01/15/28 | | | | 804,391 | |
| | Republic of Ivory Coast(c)(d) | |
| | 126,720 | | | | 5.750 | | | | 12/31/32 | | | | 125,374 | |
| | 520,960 | | | | 5.750 | | | | 12/31/32 | | | | 515,425 | |
| | Republic of Kenya | |
| | 1,070,000 | | | | 7.000 | | | | 05/22/27 | | | | 1,119,487 | |
| | Republic of Korea | |
| | 526,000 | | | | 2.000 | | | | 06/19/24 | | | | 526,732 | |
| | 790,000 | | | | 2.500 | | | | 06/19/29 | | | | 802,761 | |
| | Republic of Lebanon | |
| | 404,000 | | | | 6.000 | | | | 01/27/23 | | | | 239,370 | |
| | 535,000 | | | | 6.000 | | | | 01/27/23 | | | | 316,988 | |
| | 992,000 | | | | 6.100 | | | | 10/04/22 | | | | 595,200 | |
| | 325,000 | | | | 6.600 | | | | 11/27/26 | | | | 180,375 | |
| | 567,000 | | | | 6.650 | | | | 11/03/28 | | | | 316,103 | |
| | Republic of Lithuania | |
| | 641,000 | | | | 7.375 | | | | 02/11/20 | | | | 650,012 | |
| | Republic of Namibia | |
| | 255,000 | | | | 5.250 | | | | 10/29/25 | | | | 259,622 | |
| | Republic of Nigeria | |
| | 975,000 | | | | 8.747 | | | | 01/21/31 | | | | 1,074,023 | |
| | Republic of Nigeria | |
| | 96,000 | | | | 7.625 | | | | 11/28/47 | | | | 93,540 | |
| | 1,090,000 | | | | 7.875 | | | | 02/16/32 | | | | 1,124,062 | |
| | Republic of Panama | |
| | 610,000 | | | | 3.160 | (c) | | | 01/23/30 | | | | 630,588 | |
| | 594,000 | | | | 3.870 | (c) | | | 07/23/60 | | | | 634,838 | |
| | 411,000 | | | | 4.500 | | | | 05/15/47 | | | | 484,852 | |
| | Republic of Peru | |
| | 2,341,000 | | | | 2.844 | | | | 06/20/30 | | | | 2,416,351 | |
| PEN | 1,410,000 | | | | 5.400 | (a) | | | 08/12/34 | | | | 447,394 | |
| | 2,158,000 | | | | 6.150 | (a) | | | 08/12/32 | | | | 733,526 | |
| | 4,809,000 | | | | 6.900 | | | | 08/12/37 | | | | 1,748,744 | |
| | 2,478,000 | | | | 6.950 | | | | 08/12/31 | | | | 894,263 | |
| | Republic of Philippines | |
| $ | 664,000 | | | | 3.750 | | | | 01/14/29 | | | | 738,493 | |
| | 2,129,000 | | | | 4.000 | | | | 01/15/21 | | | | 2,180,894 | |
| PHP | 25,000,000 | | | | 5.500 | | | | 03/08/23 | | | | 515,119 | |
| | Republic of Poland | |
| PLN | 14,201,000 | | | | 2.500 | | | | 07/25/27 | | | | 3,868,222 | |
| $ | 1,659,000 | | | | 5.000 | | | | 03/23/22 | | | | 1,779,277 | |
| | Republic of Qatar | |
| | 941,000 | | | | 4.000 | | | | 03/14/29 | | | | 1,045,980 | |
| | 1,857,000 | | | | 4.817 | | | | 03/14/49 | | | | 2,284,110 | |
| | Republic of Romania | |
| RON | 8,855,000 | | | | 4.250 | | | | 06/28/23 | | | | 2,113,063 | |
| | 1,985,000 | | | | 5.000 | | | | 02/12/29 | | | | 492,296 | |
| | 3,930,000 | | | | 5.850 | | | | 04/26/23 | | | | 984,928 | |
| | |
|
| Foreign Debt Obligations – (continued) | |
| Sovereign – (continued) | |
| | Republic of Senegal | |
| $ | 497,000 | | | | 6.250 | % | | | 07/30/24 | | | $ | 542,662 | |
| | Republic of Serbia | |
| | 415,000 | | | | 7.250 | | | | 09/28/21 | | | | 452,350 | |
| | Republic of South Africa | |
| | 972,000 | | | | 4.850 | | | | 09/30/29 | | | | 959,850 | |
| | 1,600,000 | | | | 5.750 | | | | 09/30/49 | | | | 1,545,280 | |
| ZAR | 51,600,000 | | | | 6.500 | | | | 02/28/41 | | | | 2,365,502 | |
| | 23,100,000 | | | | 8.250 | | | | 03/31/32 | | | | 1,385,911 | |
| | 76,425,000 | | | | 8.500 | | | | 01/31/37 | | | | 4,472,125 | |
| | 44,642,000 | | | | 8.750 | | | | 01/31/44 | | | | 2,593,424 | |
| | 40,104,467 | | | | 8.750 | | | | 02/28/48 | | | | 2,323,216 | |
| | 12,150,000 | | | | 8.875 | | | | 02/28/35 | | | | 747,175 | |
| | Republic of Sri Lanka | |
| $ | 765,000 | | | | 6.350 | (a) | | | 06/28/24 | | | | 774,562 | |
| | 1,662,000 | | | | 6.850 | | | | 11/03/25 | | | | 1,684,333 | |
| | Republic of Turkey | |
| | 1,202,000 | | | | 6.350 | | | | 08/10/24 | | | | 1,237,684 | |
| | 2,135,000 | | | | 7.625 | | | | 04/26/29 | | | | 2,291,789 | |
| TRY | 7,475,000 | | | | 9.500 | | | | 01/12/22 | | | | 1,240,767 | |
| | 7,025,000 | | | | 10.500 | | | | 08/11/27 | | | | 1,109,550 | |
| | 4,044,823 | | | | 10.700 | | | | 02/17/21 | | | | 695,450 | |
| | 7,588,100 | | | | 11.000 | | | | 03/02/22 | | | | 1,291,394 | |
| | 7,531,103 | | | | 11.000 | | | | 02/24/27 | | | | 1,223,734 | |
| | 2,350,000 | | | | 16.200 | | | | 06/14/23 | | | | 453,168 | |
| | Republic of Uruguay(c) | |
| $ | 2,195,940 | | | | 4.375 | | | | 01/23/31 | | | | 2,450,532 | |
| | Republic of Venezuela(e) | |
| | 85,000 | | | | 6.000 | | | | 12/09/20 | | | | 8,075 | |
| | 190,000 | | | | 7.000 | | | | 03/31/38 | | | | 18,050 | |
| | 199,000 | | | | 7.650 | | | | 04/21/25 | | | | 18,905 | |
| | 110,000 | | | | 7.750 | | | | 10/13/19 | | | | 10,450 | |
| | 175,000 | | | | 8.250 | | | | 10/13/24 | | | | 16,625 | |
| | 203,000 | | | | 9.000 | | | | 05/07/23 | | | | 19,285 | |
| | Republic Of Venezuela(e) | |
| | 165,000 | | | | 9.250 | | | | 09/15/27 | | | | 15,675 | |
| | Republic of Venezuela(e) | |
| | 145,000 | | | | 9.250 | | | | 05/07/28 | | | | 13,775 | |
| | 152,000 | | | | 9.375 | | | | 01/13/34 | | | | 14,440 | |
| | 205,000 | | | | 11.750 | | | | 10/21/26 | | | | 19,475 | |
| | 205,000 | | | | 11.950 | | | | 08/05/31 | | | | 19,475 | |
| | 140,000 | | | | 12.750 | | | | 08/23/22 | | | | 13,300 | |
| | Republic of Zambia | |
| | 675,000 | | | | 8.500 | | | | 04/14/24 | | | | 476,719 | |
| | Romanian Government International Bond | |
| | 96,000 | | | | 5.125 | | | | 06/15/48 | | | | 110,430 | |
| | 996,000 | | | | 6.750 | | | | 02/07/22 | | | | 1,094,044 | |
| | Russian Federation Bond | |
| RUB | 273,300,000 | | | | 6.900 | | | | 05/23/29 | | | | 4,425,182 | |
| | 92,400,000 | | | | 7.050 | | | | 01/19/28 | | | | 1,509,079 | |
| | 135,100,000 | | | | 7.100 | | | | 10/16/24 | | | | 2,193,351 | |
| | 203,000,000 | | | | 7.700 | | | | 03/23/33 | | | | 3,484,930 | |
| | 102,576,000 | | | | 7.750 | | | | 09/16/26 | | | | 1,732,766 | |
| | 67,550,000 | | | | 8.150 | | | | 02/03/27 | | | | 1,166,404 | |
| | 97,200,000 | | | | 8.500 | | | | 09/17/31 | | | | 1,766,312 | |
| | |
| | |
| The accompanying notes are an integral part of these financial statements. | | 59 |
GOLDMAN SACHS MULTI-MANAGER NON-CORE FIXED INCOME FUND
Schedule of Investments(continued)
October 31, 2019
| | | | | | | | | | | | | | |
Principal
Amount | | | Interest
Rate | | | Maturity
Date | | | Value | |
|
| Foreign Debt Obligations – (continued) | |
| Sovereign – (continued) | |
| | Russian Foreign Bond – Eurobond | |
| $ | 600,000 | | | | 4.375 | % | | | 03/21/29 | | | $ | 649,800 | |
| | 1,800,000 | | | | 5.100 | | | | 03/28/35 | | | | 2,077,200 | |
| | 1,000,000 | | | | 5.100 | | | | 03/28/35 | | | | 1,154,000 | |
| | Saudi Government International Bond | |
| | 200,000 | | | | 4.500 | | | | 10/26/46 | | | | 220,000 | |
| | 627,000 | | | | 4.625 | | | | 10/04/47 | | | | 702,554 | |
| | Thailand Government Bond | |
| THB | 55,888,000 | | | | 3.300 | | | | 06/17/38 | | | | 2,316,345 | |
| | 67,800,000 | | | | 3.400 | | | | 06/17/36 | | | | 2,792,415 | |
| | Ukraine Government Bond | |
| UAH | 16,500,000 | | | | 0.000 | (b) | | | 12/04/19 | | | | 655,913 | |
| | 14,000,000 | | | | 0.000 | (b) | | | 04/01/20 | | | | 530,197 | |
| | 23,980,000 | | | | 0.010 | (b) | | | 01/29/20 | | | | 931,523 | |
| $ | 200,000 | | | | 7.375 | | | | 09/25/32 | | | | 209,125 | |
| | 379,000 | | | | 7.750 | | | | 09/01/20 | | | | 389,233 | |
| UAH | 16,500,000 | | | | 14.500 | | | | 08/19/20 | | | | 661,863 | |
| | 8,146,000 | | | | 14.640 | | | | 06/10/20 | | | | 325,832 | |
| | 7,354,000 | | | | 17.250 | | | | 09/30/20 | | | | 301,354 | |
| | Ukraine Government International Bond | |
| $ | 271,000 | | | | 7.750 | | | | 09/01/21 | | | | 283,331 | |
| | 423,000 | | | | 7.750 | | | | 09/01/22 | | | | 449,649 | |
| | 948,000 | | | | 8.994 | | | | 02/01/24 | | | | 1,053,702 | |
| | United Mexican States | |
| MXN | 31,810,000 | | | | 5.750 | | | | 03/05/26 | | | | 1,572,044 | |
| | 55,050,000 | | | | 7.500 | | | | 06/03/27 | | | | 2,985,246 | |
| | 32,260,000 | | | | 7.750 | | | | 05/29/31 | | | | 1,789,560 | |
| | 72,950,000 | | | | 7.750 | | | | 11/13/42 | | | | 4,030,748 | |
| | 11,540,000 | | | | 8.000 | | | | 09/05/24 | | | | 633,805 | |
| | 32,250,000 | | | | 8.500 | | | | 11/18/38 | | | | 1,913,455 | |
| | 76,400,000 | | | | 10.000 | | | | 12/05/24 | | | | 4,546,261 | |
| | |
| | TOTAL FOREIGN DEBT OBLIGATIONS | |
| | (Cost $223,713,603) | | | $ | 231,561,140 | |
| | |
| | | | | | | | | | | | | | |
|
| Corporate Obligations – 44.0% | |
| Aerospace & Defense – 0.7% | |
| | F-Brasile SpA/F-Brasile US LLC(a)(c) | |
| $ | 1,000,000 | | | | 7.375 | % | | | 08/15/26 | | | $ | 1,021,360 | |
| | Monitronics International, Inc.(f) | |
| | 1,750,000 | | | | 9.125 | | | | 04/01/20 | | | | — | |
| | TransDigm, Inc.(c) | |
| | 1,028,000 | | | | 6.000 | | | | 07/15/22 | | | | 1,045,579 | |
| | 2,305,000 | | | | 6.250 | (a) | | | 03/15/26 | | | | 2,469,231 | |
| | Triumph Group, Inc.(c) | |
| | 1,080,000 | | | | 7.750 | | | | 08/15/25 | | | | 1,077,300 | |
| | | | | | | | | | | | | | |
| | | | | | | | | | | | | 5,613,470 | |
| | |
| Agriculture(a) – 0.4% | |
| | JBS Investments II GmbH(c) | |
| | 1,230,000 | | | | 7.000 | | | | 01/15/26 | | | | 1,333,012 | |
| | MHP Lux SA | |
| | 589,000 | | | | 6.250 | | | | 09/19/29 | | | | 566,176 | |
| | |
|
| Corporate Obligations – (continued) | |
| Agriculture(a) – (continued) | |
| | Vector Group Ltd.(c) | |
| 575,000 | | | | 6.125 | | | | 02/01/25 | | | | 550,563 | |
| | 850,000 | | | | 10.500 | | | | 11/01/26 | | | | 864,875 | |
| | | | | | | | | | | | | | |
| | | | | | | | | | | | | 3,314,626 | |
| | |
| Automotive(a) – 0.6% | |
| | Adient US LLC(c) | |
| | 760,000 | | | | 7.000 | | | | 05/15/26 | | | | 799,900 | |
| | Delphi Technologies PLC | |
| | 2,110,000 | | | | 5.000 | | | | 10/01/25 | | | | 1,830,425 | |
| | IHO Verwaltungs GmbH(c)(g) | |
| | (PIK 6.750%, Cash 6.000%) | |
| | 685,000 | | | | 6.000 | | | | 05/15/27 | | | | 706,406 | |
| | (PIK 7.125%, Cash 6.375%) | |
| | 535,000 | | | | 6.375 | | | | 05/15/29 | | | | 551,050 | |
| | Tesla, Inc.(c) | |
| | 1,379,000 | | | | 5.300 | | | | 08/15/25 | | | | 1,303,155 | |
| | | | | | | | | | | | | | |
| | | | | | | | | | | | | 5,190,936 | |
| | |
| Banks – 2.5% | |
| Banca Monte dei Paschi di Siena SpA(c)(h) (5 year EUR Swap
+ 5.005%) |
|
| EUR | 1,569,000 | | | | 5.375 | | | | 01/18/28 | | | | 1,360,551 | |
| | Banco Internacional del Peru SAA Interbank(a) | |
| $ | 732,000 | | | | 3.250 | | | | 10/04/26 | | | | 730,170 | |
| | Barclays PLC(c)(h) | |
| | (5 year CMT + 5.672%) | |
| | 1,430,000 | | | | 8.000 | | | | 12/31/99 | | | | 1,560,163 | |
| | (5 year USD Swap + 4.842%) | |
| | 1,755,000 | | | | 7.750 | | | | 12/31/99 | | | | 1,870,791 | |
| | BBVA Bancomer SA(a)(c)(h) (5 year CMT + 4.308%) | |
| | 2,500,000 | | | | 5.875 | | | | 09/13/34 | | | | 2,539,800 | |
| | Freedom Mortgage Corp.(a)(c) | |
| | 1,005,000 | | | | 8.125 | | | | 11/15/24 | | | | 943,444 | |
| | 2,298,000 | | | | 8.250 | | | | 04/15/25 | | | | 2,162,992 | |
| | Intesa Sanpaolo SpA | |
| | 1,300,000 | | | | 5.710 | (a) | | | 01/15/26 | | | | 1,389,375 | |
| | (5 year EUR Swap + 7.192%) | |
| EUR | 900,000 | | | | 7.750 | (c)(h) | | | 12/29/49 | | | | 1,195,741 | |
| | (5 year USD Swap + 5.462%) | |
| $ | 500,000 | | | | 7.700 | (a)(c)(h) | | | 12/29/49 | | | | 526,250 | |
| | Lloyds Banking Group PLC(c)(h)(5 year USD Swap + 4.496%) | |
| | 140,000 | | | | 7.500 | | | | 12/31/99 | | | | 153,713 | |
| | UniCredit SpA | |
| | 1,000,000 | | | | 6.572 | (a) | | | 01/14/22 | | | | 1,076,070 | |
| | (5 Year USD ICE Swap + 3.703%) | |
| | 2,350,000 | | | | 5.861 | (a)(c)(h) | | | 06/19/32 | | | | 2,449,875 | |
| | (5 year USD ICE Swap + 4.914%) | |
| | 760,000 | | | | 7.296 | (a)(c)(h) | | | 04/02/34 | | | | 874,000 | |
| | (5 year USD Swap + 5.180%) | |
| | 1,270,000 | | | | 8.000 | (c)(h) | | | 04/03/49 | | | | 1,339,850 | |
| | | | | | | | | | | | | | |
| | | | | | | | | | | | | 20,172,785 | |
| | |
| Building Materials(a)(c) – 0.1% | |
| | Norbord, Inc. | |
| | 737,000 | | | | 5.750 | | | | 07/15/27 | | | | 766,480 | |
| | |
| | |
| 60 | | The accompanying notes are an integral part of these financial statements. |
GOLDMAN SACHS MULTI-MANAGER NON-CORE FIXED INCOME FUND
| | | | | | | | | | | | | | |
Principal
Amount | | | Interest
Rate | | | Maturity
Date | | | Value | |
|
| Corporate Obligations – (continued) | |
| Chemicals(a)(c) – 1.3% | |
| | Alpha 3 B.V./Alpha US Bidco, Inc. | |
| $ | 1,400,000 | | | | 6.250 | % | | | 02/01/25 | | | $ | 1,407,000 | |
| | Cornerstone Chemical Co. | |
| | 2,830,000 | | | | 6.750 | | | | 08/15/24 | | | | 2,603,600 | |
| | Hexion, Inc. | |
| | 1,160,000 | | | | 7.875 | | | | 07/15/27 | | | | 1,116,500 | |
| | Neon Holdings, Inc. | |
| | 1,260,000 | | | | 10.125 | | | | 04/01/26 | | | | 1,247,400 | |
| | Rain CII Carbon LLC/CII Carbon Corp. | |
| | 3,000,000 | | | | 7.250 | | | | 04/01/25 | | | | 2,913,750 | |
| | Starfruit Finco B.V./Starfruit US Holdco LLC | |
| | 1,650,000 | | | | 8.000 | | | | 10/01/26 | | | | 1,656,187 | |
| | | | | | | | | | | | | | |
| | | | | | | | | | | | | 10,944,437 | |
| | |
| Coal(a)(c) – 0.2% | |
| SunCoke Energy Partners LP/SunCoke Energy Partners
Finance Corp. |
|
| | 1,563,000 | | | | 7.500 | | | | 06/15/25 | | | | 1,328,550 | |
| | |
| Commercial Services(c) – 1.9% | |
| | AA Bond Co, Ltd. | |
| GBP | 1,080,000 | | | | 4.875 | | | | 07/31/24 | | | | 1,385,730 | |
| | Capitol Investment Merger Sub 2 LLC(a) | |
| $ | 1,644,000 | | | | 10.000 | | | | 08/01/24 | | | | 1,689,210 | |
| GEMS MENASA Cayman Ltd./GEMS Education Delaware
LLC(a) |
|
| | 1,460,000 | | | | 7.125 | | | | 07/31/26 | | | | 1,517,488 | |
| | Global A&T Electronics Ltd. | |
| | 3,959,000 | | | | 8.500 | | | | 01/12/23 | | | | 3,701,665 | |
| | Herc Holdings, Inc.(a) | |
| | 2,286,000 | | | | 5.500 | | | | 07/15/27 | | | | 2,383,155 | |
| | Team Health Holdings, Inc.(a) | |
| | 650,000 | | | | 6.375 | | | | 02/01/25 | | | | 420,875 | |
| | United Rentals North America, Inc. | |
| | 865,000 | | | | 6.500 | | | | 12/15/26 | | | | 935,281 | |
| | 973,000 | | | | 5.250 | | | | 01/15/30 | | | | 1,022,866 | |
| | Verisure Midholding AB | |
| EUR | 1,260,000 | | | | 5.750 | | | | 12/01/23 | | | | 1,446,621 | |
| | Verscend Escrow Corp.(a) | |
| $ | 990,000 | | | | 9.750 | | | | 08/15/26 | | | | 1,056,825 | |
| | | | | | | | | | | | | | |
| | | | | | | | | | | | | 15,559,716 | |
| | |
| Computers(c) – 0.1% | |
| | Banff Merger Sub, Inc. | |
| EUR | 450,000 | | | | 8.375 | | | | 09/01/26 | | | | 469,418 | |
| | 700,000 | | | | 8.375 | (a) | | | 09/01/26 | | | | 729,964 | |
| | | | | | | | | | | | | | |
| | | | | | | | | | | | | 1,199,382 | |
| | |
| Diversified Financial Services – 2.5% | |
| | Avation Capital SA(a)(c) | |
| $ | 2,340,000 | | | | 6.500 | | | | 05/15/21 | | | | 2,433,600 | |
| | Bracken MidCo1 PLC(c)(g)(PIK 10.375%, Cash 8.875%) | |
| GBP | 900,000 | | | | 8.875 | | | | 10/15/23 | | | | 1,119,019 | |
| Global Aircraft Leasing Co. Ltd.(a)(c)(g)(PIK 7.250%,
Cash 6.500%) |
|
| $ | 3,823,000 | | | | 6.500 | | | | 09/15/24 | | | | 3,904,239 | |
| | |
|
| Corporate Obligations – (continued) | |
| Diversified Financial Services – (continued) | |
| | Jerrold Finco PLC(c) | |
| GBP | 850,000 | | | | 6.125 | | | | 01/15/24 | | | | 1,123,498 | |
| | Mulhacen Pte Ltd.(c)(g)(PIK 7.250%, Cash 6.500%) | |
| EUR | 1,476,263 | | | | 6.500 | | | | 08/01/23 | | | | 1,341,878 | |
| | Nationstar Mortgage Holdings, Inc.(a)(c) | |
| $ | 1,200,000 | | | | 8.125 | | | | 07/15/23 | | | | 1,270,500 | |
| | 2,670,000 | | | | 9.125 | | | | 07/15/26 | | | | 2,920,312 | |
| | Springleaf Finance Corp. | |
| | 2,015,000 | | | | 6.875 | | | | 03/15/25 | | | | 2,276,950 | |
| | 2,118,000 | | | | 7.125 | | | | 03/15/26 | | | | 2,417,168 | |
| | Voyager Aviation Holdings LLC/Voyager Finance Co.(a)(c) | |
| | 1,500,000 | | | | 8.500 | | | | 08/15/21 | | | | 1,552,500 | |
| | | | | | | | | | | | | | |
| | | | | | | | | | | | | 20,359,664 | |
| | |
| Electrical – 1.2% | |
| | Drax Finco PLC(a)(c) | |
| | 2,133,000 | | | | 6.625 | | | | 11/01/25 | | | | 2,250,315 | |
| | Eskom Holdings SOC Ltd. | |
| | 326,000 | | | | 5.750 | | | | 01/26/21 | | | | 328,649 | |
| | 542,000 | | | | 6.750 | | | | 08/06/23 | | | | 558,938 | |
| | NRG Energy, Inc.(c) | |
| | 1,285,000 | | | | 7.250 | | | | 05/15/26 | | | | 1,407,075 | |
| | Perusahaan Listrik Negara PT(a) | |
| | 478,000 | | | | 3.375 | | | | 02/05/30 | | | | 472,742 | |
| | 478,000 | | | | 4.375 | | | | 02/05/50 | | | | 472,264 | |
| | Talen Energy Supply LLC(a)(c) | |
| | 1,321,000 | | | | 7.250 | | | | 05/15/27 | | | | 1,317,697 | |
| | 1,430,000 | | | | 6.625 | | | | 01/15/28 | | | | 1,383,525 | |
| | Vistra Operations Co. LLC(a)(c) | |
| | 1,215,000 | | | | 5.500 | | | | 09/01/26 | | | | 1,281,825 | |
| | | | | | | | | | | | | | |
| | | | | | | | | | | | | 9,473,030 | |
| | |
| Energy – Exploration & Production(e)(f) – 0.0% | |
| | Midstates Petroleum Co., Inc./Midstates Petroleum Co. LLC | |
| | 700,000 | | | | 10.000 | | | | 06/01/20 | | | | — | |
| | |
| Engineering & Construction – 0.6% | |
| | Bioceanico Sovereign Certificate Ltd.(b) | |
| | 1,080,000 | | | | 0.000 | | | | 06/05/34 | | | | 750,600 | |
| | New Enterprise Stone & Lime Co., Inc.(a)(c) | |
| | 905,000 | | | | 6.250 | | | | 03/15/26 | | | | 942,331 | |
| | Tutor Perini Corp.(a)(c) | |
| | 1,610,000 | | | | 6.875 | | | | 05/01/25 | | | | 1,601,950 | |
| | Weekley Homes LLC/Weekley Finance Corp.(c) | |
| | 1,385,000 | | | | 6.625 | | | | 08/15/25 | | | | 1,416,163 | |
| | | | | | | | | | | | | | |
| | | | | | | | | | | | | 4,711,044 | |
| | |
| Entertainment(c) – 1.5% | |
| | AMC Entertainment Holdings, Inc. | |
| | 1,520,000 | | | | 5.875 | | | | 11/15/26 | | | | 1,385,100 | |
| | Caesars Resort Collection LLC/CRC Finco, Inc.(a) | |
| | 1,960,000 | | | | 5.250 | | | | 10/15/25 | | | | 2,001,650 | |
| | Cirsa Finance International Sarl(a) | |
| | 1,334,000 | | | | 7.875 | | | | 12/20/23 | | | | 1,409,038 | |
| EUR | 860,000 | | | | 4.750 | | | | 05/22/25 | | | | 997,610 | |
| | Golden Entertainment, Inc.(a) | |
| $ | 965,000 | | | | 7.625 | | | | 04/15/26 | | | | 1,014,456 | |
| | |
| | |
| The accompanying notes are an integral part of these financial statements. | | 61 |
GOLDMAN SACHS MULTI-MANAGER NON-CORE FIXED INCOME FUND
Schedule of Investments(continued)
October 31, 2019
| | | | | | | | | | | | | | |
Principal
Amount | | | Interest
Rate | | | Maturity
Date | | | Value | |
|
| Corporate Obligations – (continued) | |
| Entertainment(c) – (continued) | |
| | International Game Technology PLC(a) | |
| $ | 840,000 | | | | 6.250 | % | | | 01/15/27 | | | $ | 936,600 | |
| | Scientific Games International, Inc. | |
| EUR | 1,543,000 | | | | 5.500 | | | | 02/15/26 | | | | 1,677,369 | |
| $ | 1,780,000 | | | | 8.250 | (a) | | | 03/15/26 | | | | 1,882,350 | |
| | Twin River Worldwide Holdings, Inc.(a) | |
| | 765,000 | | | | 6.750 | | | | 06/01/27 | | | | 803,250 | |
| | | | | | | | | | | | | | |
| | | | | | | | | | | | | 12,107,423 | |
| | |
| Environmental(a)(c) – 0.1% | |
| | GFL Environmental, Inc. | |
| | 500,000 | | | | 5.375 | | | | 03/01/23 | | | | 515,000 | |
| | 500,000 | | | | 8.500 | | | | 05/01/27 | | | | 550,000 | |
| | | | | | | | | | | | | | |
| | | | | | | | | | | | | 1,065,000 | |
| | |
| Food & Drug Retailing – 1.6% | |
| Albertsons Cos. LLC/Safeway, Inc./New Albertsons
LP/Albertson’s LLC(c) |
|
| | 1,820,000 | | | | 5.750 | | | | 03/15/25 | | | | 1,879,150 | |
| | 1,219,000 | | | | 7.500 | (a) | | | 03/15/26 | | | | 1,363,756 | |
| | Alicorp SAA(a) | |
| PEN | 1,250,000 | | | | 6.875 | | | | 04/17/27 | | | | 403,904 | |
| | B&G Foods, Inc.(c) | |
| $ | 2,190,000 | | | | 5.250 | | | | 09/15/27 | | | | 2,184,525 | |
| JBS USA LUX SA/JBS USA Food Co./JBS USA Finance,
Inc.(a)(c) |
|
| | 1,074,000 | | | | 6.500 | | | | 04/15/29 | | | | 1,192,140 | |
| | 1,662,000 | | | | 5.500 | | | | 01/15/30 | | | | 1,790,805 | |
| | New Albertsons LP | |
| | 645,000 | | | | 8.700 | | | | 05/01/30 | | | | 675,638 | |
| | Post Holdings, Inc.(a)(c) | |
| | 970,000 | | | | 5.000 | | | | 08/15/26 | | | | 1,008,800 | |
| | 2,190,000 | | | | 5.500 | | | | 12/15/29 | | | | 2,304,975 | |
| | | | | | | | | | | | | | |
| | | | | | | | | | | | | 12,803,693 | |
| | |
| Forest Products&Paper(c) – 0.9% | |
| | Celulosa Arauco y Constitucion SA(a) | |
| | 278,000 | | | | 4.200 | | | | 01/29/30 | | | | 277,027 | |
| | Eldorado Intl. Finance GmbH | |
| | 1,900,000 | | | | 8.625 | | | | 06/16/21 | | | | 1,985,500 | |
| | Resolute Forest Products, Inc. | |
| | 2,974,000 | | | | 5.875 | | | | 05/15/23 | | | | 2,959,130 | |
| | Schweitzer-Mauduit International, Inc.(a) | |
| | 1,900,000 | | | | 6.875 | | | | 10/01/26 | | | | 2,028,250 | |
| | | | | | | | | | | | | | |
| | | | | | | | | | | | | 7,249,907 | |
| | |
| Gaming(a)(c) – 0.1% | |
| | Station Casinos LLC | |
| | 930,000 | | | | 5.000 | | | | 10/01/25 | | | | 940,462 | |
| | |
| Healthcare Providers & Services – 2.2% | |
| | Air Medical Group Holdings, Inc.(a)(c) | |
| | 2,075,000 | | | | 6.375 | | | | 05/15/23 | | | | 1,753,375 | |
| | Charles River Laboratories International, Inc.(a)(c) | |
| | 755,000 | | | | 5.500 | | | | 04/01/26 | | | | 807,850 | |
| | CHS/Community Health Systems, Inc.(a)(c) | |
| | 1,055,000 | | | | 8.625 | | | | 01/15/24 | | | | 1,076,100 | |
| | 2,250,000 | | | | 8.000 | | | | 03/15/26 | | | | 2,199,375 | |
| | |
|
| Corporate Obligations – (continued) | |
| Healthcare Providers & Services – (continued) | |
| | Encompass Health Corp.(c) | |
| 850,000 | | | | 4.500 | | | | 02/01/28 | | | | 867,000 | |
| | 1,530,000 | | | | 4.750 | | | | 02/01/30 | | | | 1,577,812 | |
| | HCA, Inc. | |
| | 1,125,000 | | | | 7.500 | | | | 02/15/22 | | | | 1,248,750 | |
| | 900,000 | | | | 5.250 | | | | 04/15/25 | | | | 1,001,250 | |
| | RegionalCare Hospital Partners Holdings, Inc.(a)(c) | |
| | 1,020,000 | | | | 8.250 | | | | 05/01/23 | | | | 1,088,850 | |
| RegionalCare Hospital Partners Holdings, Inc./LifePoint Health,
Inc.(a)(c) |
|
| | 1,764,000 | | | | 9.750 | | | | 12/01/26 | | | | 1,935,990 | |
| | Tenet Healthcare Corp. | |
| | 567,000 | | | | 8.125 | | | | 04/01/22 | | | | 613,777 | |
| | 530,000 | | | | 6.750 | | | | 06/15/23 | | | | 561,800 | |
| | 700,000 | | | | 4.625 | (c) | | | 07/15/24 | | | | 719,250 | |
| | 655,000 | | | | 7.000 | (c) | | | 08/01/25 | | | | 678,744 | |
| | 1,285,000 | | | | 4.875 | (a)(c) | | | 01/01/26 | | | | 1,329,975 | |
| | 435,000 | | | | 6.250 | (a)(c) | | | 02/01/27 | | | | 460,013 | |
| | WellCare Health Plans, Inc.(c) | |
| | 395,000 | | | | 5.250 | | | | 04/01/25 | | | | 412,775 | |
| | | | | | | | | | | | | | |
| | | | | | | | | | | | | 18,332,686 | |
| | |
| Home Builders(c) – 0.2% | |
| | KB Home | |
| | 1,012,000 | | | | 4.800 | | | | 11/15/29 | | | | 1,020,855 | |
| | Mattamy Group Corp.(a) | |
| | 890,000 | | | | 6.500 | | | | 10/01/25 | | | | 941,175 | |
| | | | | | | | | | | | | | |
| | | | | | | | | | | | | 1,962,030 | |
| | |
| Household Products(a)(c) – 0.3% | |
| | Spectrum Brands, Inc. | |
| | 2,000,000 | | | | 5.000 | | | | 10/01/29 | | | | 2,042,500 | |
| | |
| Insurance(a) – 0.6% | |
| | Fidelity & Guaranty Life Holdings, Inc.(c) | |
| | 3,778,000 | | | | 5.500 | | | | 05/01/25 | | | | 4,042,460 | |
| | MGIC Investment Corp. | |
| | 850,000 | | | | 9.000 | | | | 04/01/63 | | | | 1,144,020 | |
| | | | | | | | | | | | | | |
| | | | | | | | | | | | | 5,186,480 | |
| | |
| Internet – 0.9% | |
| | Getty Images, Inc.(a)(c) | |
| | 810,000 | | | | 9.750 | | | | 03/01/27 | | | | 812,025 | |
| | Netflix, Inc. | |
| | 680,000 | | | | 5.875 | | | | 02/15/25 | | | | 750,550 | |
| EUR | 1,531,000 | | | | 3.875 | | | | 11/15/29 | | | | 1,748,624 | |
| $ | 2,000,000 | | | | 4.875 | (a)(c) | | | 06/15/30 | | | | 2,022,500 | |
| | Photo Holdings Merger Sub, Inc.(a)(c) | |
| | 1,123,000 | | | | 8.500 | | | | 10/01/26 | | | | 985,432 | |
| | Symantec Corp.(a)(c) | |
| | 1,020,000 | | | | 5.000 | | | | 04/15/25 | | | | 1,045,500 | |
| | | | | | | | | | | | | | |
| | | | | | | | | | | | | 7,364,631 | |
| | |
| Investment Companies(a)(c) – 0.2% | |
| | FS Energy & Power Fund | |
| | 1,050,000 | | | | 7.500 | | | | 08/15/23 | | | | 1,060,500 | |
| | |
| | |
| 62 | | The accompanying notes are an integral part of these financial statements. |
GOLDMAN SACHS MULTI-MANAGER NON-CORE FIXED INCOME FUND
| | | | | | | | | | | | | | |
Principal
Amount | | | Interest
Rate | | | Maturity
Date | | | Value | |
|
| Corporate Obligations – (continued) | |
| Investment Companies(a)(c) – (continued) | |
| | Icahn Enterprises LP/Icahn Enterprises Finance Corp. | |
| $ | 910,000 | | | | 4.750 | % | | | 09/15/24 | | | $ | 919,100 | |
| | | | | | | | | | | | | | |
| | | | | | | | | | | | | 1,979,600 | |
| | |
| Iron/Steel – 1.0% | |
| | ArcelorMittal | |
| | 965,000 | | | | 5.500 | | | | 03/01/21 | | | | 1,004,507 | |
| | Baffinland Iron Mines Corp./Baffinland Iron Mines LP(a)(c) | |
| | 2,659,000 | | | | 8.750 | | | | 07/15/26 | | | | 2,659,000 | |
| | Cleveland-Cliffs, Inc.(a)(c) | |
| | 1,100,000 | | | | 5.875 | | | | 06/01/27 | | | | 1,045,000 | |
| | Mineral Resources Ltd.(a)(c) | |
| | 3,620,000 | | | | 8.125 | | | | 05/01/27 | | | | 3,791,950 | |
| | | | | | | | | | | | | | |
| | | | | | | | | | | | | 8,500,457 | |
| | |
| Leisure Time(a)(c) – 0.1% | |
| | LTF Merger Sub, Inc. | |
| | 950,000 | | | | 8.500 | | | | 06/15/23 | | | | 971,375 | |
| | |
| Lodging(c) – 0.6% | |
| | Diamond Resorts International, Inc.(a) | |
| | 1,460,000 | | | | 10.750 | | | | 09/01/24 | | | | 1,511,100 | |
| Inn of the Mountain Gods Resort & Casino(g)(PIK 9.250% or
Cash 9.250%) |
|
| | 1,112,456 | | | | 9.250 | | | | 11/30/20 | | | | 1,104,113 | |
| Sugarhouse HSP Gaming Prop Mezz LP/Sugarhouse HSP
Gaming Finance Corp.(a) |
|
| | 2,304,000 | | | | 5.875 | | | | 05/15/25 | | | | 2,280,960 | |
| | | | | | | | | | | | | | |
| | | | | | | | | | | | | 4,896,173 | |
| | |
| Machinery – Construction & Mining(a)(c) – 0.1% | |
| | Vertiv Group Corp. | |
| | 730,000 | | | | 9.250 | | | | 10/15/24 | | | | 686,200 | |
| | |
| Media – 6.2% | |
| | Altice Financing SA(a)(c) | |
| | 2,205,000 | | | | 7.500 | | | | 05/15/26 | | | | 2,340,056 | |
| | Altice Finco SA(a)(c) | |
| | 1,690,000 | | | | 7.625 | | | | 02/15/25 | | | | 1,730,137 | |
| | Altice Luxembourg SA(a)(c) | |
| EUR | 1,330,000 | | | | 8.000 | | | | 05/15/27 | | | | 1,626,952 | |
| $ | 1,520,000 | | | | 10.500 | | | | 05/15/27 | | | | 1,719,500 | |
| | CCO Holdings LLC/CCO Holdings Capital Corp.(a)(c) | |
| | 1,780,000 | | | | 5.375 | | | | 05/01/25 | | | | 1,842,300 | |
| | 2,303,000 | | | | 5.375 | | | | 06/01/29 | | | | 2,455,574 | |
| | Cengage Learning, Inc.(a)(c) | |
| | 1,040,000 | | | | 9.500 | | | | 06/15/24 | | | | 930,800 | |
| | Clear Channel Worldwide Holdings, Inc.(a)(c) | |
| | 1,000,000 | | | | 5.125 | | | | 08/15/27 | | | | 1,040,000 | |
| | CSC Holdings LLC(a)(c) | |
| | 1,195,000 | | | | 7.500 | | | | 04/01/28 | | | | 1,345,869 | |
| | 970,000 | | | | 6.500 | | | | 02/01/29 | | | | 1,083,975 | |
| | 2,800,000 | | | | 5.750 | | | | 01/15/30 | | | | 2,933,000 | |
| | Cumulus Media New Holdings, Inc.(a)(c) | |
| | 595,000 | | | | 6.750 | | | | 07/01/26 | | | | 630,700 | |
| | Diamond Sports Group LLC/Diamond Sports Finance Co.(a)(c) | |
| | 2,420,000 | | | | 6.625 | | | | 08/15/27 | | | | 2,495,625 | |
| | |
|
| Corporate Obligations – (continued) | |
| Media – (continued) | |
| | DISH DBS Corp. | |
| 615,000 | | | | 5.000 | | | | 03/15/23 | | | | 618,844 | |
| | 310,000 | | | | 5.875 | | | | 11/15/24 | | | | 310,000 | |
| | Gray Television, Inc.(a)(c) | |
| | 1,606,000 | | | | 7.000 | | | | 05/15/27 | | | | 1,756,562 | |
| | iHeartCommunications, Inc.(c) | |
| | 216,446 | | | | 6.375 | | | | 05/01/26 | | | | 232,679 | |
| | 392,309 | | | | 8.375 | | | | 05/01/27 | | | | 420,751 | |
| | LCPR Senior Secured Financing DAC(a)(c) | |
| | 1,800,000 | | | | 6.750 | | | | 10/15/27 | | | | 1,838,250 | |
| | Liberty Interactive LLC(c) | |
| | 3,996,050 | | | | 4.000 | | | | 11/15/29 | | | | 2,782,250 | |
| | 893,237 | | | | 3.750 | | | | 02/15/30 | | | | 627,499 | |
| McGraw-Hill Global Education Holdings LLC/McGraw-Hill
Global Education Finance(a)(c) |
|
| | 225,000 | | | | 7.875 | | | | 05/15/24 | | | | 187,875 | |
| | Salem Media Group, Inc.(a)(c) | |
| | 1,585,000 | | | | 6.750 | | | | 06/01/24 | | | | 1,355,175 | |
| | Sinclair Television Group, Inc.(a)(c) | |
| | 600,000 | | | | 5.625 | | | | 08/01/24 | | | | 618,000 | |
| | 780,000 | | | | 5.875 | | | | 03/15/26 | | | | 815,100 | |
| | Sirius XM Radio, Inc.(a)(c) | |
| | 865,000 | | | | 5.500 | | | | 07/01/29 | | | | 935,281 | |
| | Summer BidCo B.V.(c)(g) | |
| EUR | 200,000 | | | | 9.000 | | | | 11/15/25 | | | | 232,462 | |
| | (PIK 9.750%, Cash 9.000%) | |
| | 723,000 | | | | 9.000 | (a) | | | 11/15/25 | | | | 839,959 | |
| | TEGNA, Inc.(a)(c) | |
| $ | 3,108,000 | | | | 5.000 | | | | 09/15/29 | | | | 3,154,620 | |
| | Telenet Finance Luxembourg Notes Sarl(a)(c) | |
| | 1,200,000 | | | | 5.500 | | | | 03/01/28 | | | | 1,273,500 | |
| | The McClatchy Co.(c) | |
| | 1,802,000 | | | | 9.000 | | | | 07/15/26 | | | | 1,693,880 | |
| | UPC Holding BV(c) | |
| EUR | 770,000 | | | | 3.875 | | | | 06/15/29 | | | | 889,242 | |
| | UPCB Finance IV Ltd.(a)(c) | |
| $ | 1,230,000 | | | | 5.375 | | | | 01/15/25 | | | | 1,268,438 | |
| | Urban One, Inc.(a)(c) | |
| | 2,665,000 | | | | 7.375 | | | | 04/15/22 | | | | 2,571,725 | |
| | Virgin Media Finance PLC(a)(c) | |
| | 1,450,000 | | | | 5.750 | | | | 01/15/25 | | | | 1,493,500 | |
| | Ziggo BV(a)(c) | |
| | 1,695,000 | | | | 5.500 | | | | 01/15/27 | | | | 1,777,631 | |
| | 873,000 | | | | 4.875 | | | | 01/15/30 | | | | 885,077 | |
| | | | | | | | | | | | | | |
| | | | | | | | | | | | | 50,752,788 | |
| | |
| Media – Non Cable(e)(f) – 0.0% | |
| | Clear Channel Communications, Inc. | |
| | 375,000 | | | | 9.000 | | | | 12/15/19 | | | | — | |
| | 930,000 | | | | 9.000 | | | | 03/01/21 | | | | — | |
| | | | | | | | | | | | | | |
| | | | | | | | | | | | | — | |
| | |
| Mining(c) – 1.3% | |
| | Eldorado Gold Corp.(a) | |
| | 1,745,000 | | | | 9.500 | | | | 06/01/24 | | | | 1,884,600 | |
| | |
| | |
| The accompanying notes are an integral part of these financial statements. | | 63 |
GOLDMAN SACHS MULTI-MANAGER NON-CORE FIXED INCOME FUND
Schedule of Investments(continued)
October 31, 2019
| | | | | | | | | | | | | | |
Principal
Amount | | | Interest
Rate | | | Maturity
Date | | | Value | |
|
| Corporate Obligations – (continued) | |
| Mining(c) – (continued) | |
| | First Quantum Minerals Ltd.(a) | |
| $ | 735,000 | | | | 7.250 | % | | | 04/01/23 | | | $ | 738,925 | |
| | 1,560,000 | | | | 6.500 | | | | 03/01/24 | | | | 1,528,800 | |
| | 1,555,000 | | | | 7.500 | | | | 04/01/25 | | | | 1,556,944 | |
| | Freeport-McMoRan, Inc. | |
| | 247,000 | | | | 3.875 | | | | 03/15/23 | | | | 250,705 | |
| | 1,550,000 | | | | 5.450 | | | | 03/15/43 | | | | 1,437,625 | |
| | KME AG | |
| EUR | 564,000 | | | | 6.750 | | | | 02/01/23 | | | | 514,552 | |
| | Mountain Province Diamonds, Inc.(a) | |
| $ | 1,045,000 | | | | 8.000 | | | | 12/15/22 | | | | 1,013,650 | |
| | New Gold, Inc.(a) | |
| | 590,000 | | | | 6.250 | | | | 11/15/22 | | | | 590,000 | |
| | 415,000 | | | | 6.375 | | | | 05/15/25 | | | | 394,250 | |
| | Northwest Acquisitions ULC/Dominion Finco, Inc.(a) | |
| | 1,260,000 | | | | 7.125 | | | | 11/01/22 | | | | 626,850 | |
| | | | | | | | | | | | | | |
| | | | | | | | | | | | | 10,536,901 | |
| | |
| Miscellaneous Manufacturing(a)(c) – 0.2% | |
| | LSB Industries, Inc. | |
| | 1,505,000 | | | | 9.625 | | | | 05/01/23 | | | | 1,595,300 | |
| | |
| Oil Field Services – 3.4% | |
| | Ascent Resources Utica Holdings LLC/ARU Finance Corp.(a)(c) | |
| | 899,000 | | | | 7.000 | | | | 11/01/26 | | | | 685,488 | |
| | Chesapeake Energy Corp.(c) | |
| | 935,000 | | | | 7.500 | | | | 10/01/26 | | | | 589,050 | |
| | Citgo Holding, Inc.(a)(c) | |
| | 478,000 | | | | 9.250 | | | | 08/01/24 | | | | 498,315 | |
| | Denbury Resources, Inc.(a)(c) | |
| | 750,000 | | | | 7.750 | | | | 02/15/24 | | | | 545,625 | |
| | Ecopetrol SA | |
| | 638,000 | | | | 5.875 | | | | 09/18/23 | | | | 709,456 | |
| | Empresa Nacional del Petroleo | |
| | 1,121,000 | | | | 4.750 | | | | 12/06/21 | | | | 1,161,636 | |
| | Endeavor Energy Resources LP/EER Finance, Inc.(a)(c) | |
| | 1,486,000 | | | | 5.500 | | | | 01/30/26 | | | | 1,530,580 | |
| | Energy Ventures Gom LLC/EnVen Finance Corp.(a)(c) | |
| | 479,000 | | | | 11.000 | | | | 02/15/23 | | | | 471,815 | |
| | Extraction Oil & Gas, Inc.(a)(c) | |
| | 1,940,000 | | | | 5.625 | | | | 02/01/26 | | | | 795,400 | |
| | Gulfport Energy Corp.(c) | |
| | 664,000 | | | | 6.375 | | | | 01/15/26 | | | | 398,400 | |
| | KazMunayGas National Co. JSC | |
| | 1,228,000 | | | | 3.875 | | | | 04/19/22 | | | | 1,259,314 | |
| | MEG Energy Corp.(a)(c) | |
| | 870,000 | | | | 7.000 | | | | 03/31/24 | | | | 828,675 | |
| | Noble Holding International Ltd.(c) | |
| | 895,000 | | | | 7.750 | | | | 01/15/24 | | | | 554,900 | |
| | 670,000 | | | | 8.950 | | | | 04/01/45 | | | | 286,861 | |
| | Petrobras Global Finance B.V. | |
| | 809,000 | | | | 5.093 | (a) | | | 01/15/30 | | | | 855,922 | |
| | 2,120,000 | | | | 6.900 | | | | 03/19/49 | | | | 2,456,788 | |
| | Petroleos de Venezuela SA(e) | |
| | 700,000 | | | | 6.000 | | | | 11/15/26 | | | | 42,875 | |
| | Petroleos Mexicanos(a)(c) | |
| | 2,813,000 | | | | 6.840 | | | | 01/23/30 | | | | 2,999,361 | |
| | |
|
| Corporate Obligations – (continued) | |
| Oil Field Services – (continued) | |
| | Rowan Cos., Inc.(c) | |
| 591,000 | | | | 7.375 | | | | 06/15/25 | | | | 325,050 | |
| | 350,000 | | | | 5.850 | | | | 01/15/44 | | | | 141,750 | |
| | Saudi Arabian Oil Co. | |
| | 696,000 | | | | 4.250 | (a) | | | 04/16/39 | | | | 745,256 | |
| | 1,211,000 | | | | 4.250 | | | | 04/16/39 | | | | 1,296,703 | |
| | Sinopec Group Overseas Development 2018 Ltd.(a)(c) | |
| | 1,792,000 | | | | 2.500 | | | | 08/08/24 | | | | 1,793,487 | |
| | SM Energy Co.(c) | |
| | 1,497,000 | | | | 5.625 | | | | 06/01/25 | | | | 1,264,965 | |
| | The Oil and Gas Holding Co. BSCC | |
| | 973,000 | | | | 7.500 | | | | 10/25/27 | | | | 1,087,023 | |
| | 414,000 | | | | 8.375 | | | | 11/07/28 | | | | 485,933 | |
| | Transocean Poseidon Ltd.(a)(c) | |
| | 1,070,000 | | | | 6.875 | | | | 02/01/27 | | | | 1,080,700 | |
| | Transocean, Inc. | |
| | 910,000 | | | | 7.500 | | | | 04/15/31 | | | | 618,800 | |
| USA Compression Partners LP/USA Compression Finance
Corp.(c) |
|
| | 1,755,000 | | | | 6.875 | | | | 04/01/26 | | | | 1,761,581 | |
| | YPF SA(a)(c) | |
| | 285,000 | | | | 8.500 | | | | 06/27/29 | | | | 216,377 | |
| | | | | | | | | | | | | | |
| | | | | | | | | | | | | 27,488,086 | |
| | |
| Packaging(a)(c) – 0.5% | |
| | Ardagh Packaging Finance PLC/Ardagh Holdings USA, Inc. | |
| | 1,560,000 | | | | 4.625 | | | | 05/15/23 | | | | 1,591,200 | |
| | 565,000 | | | | 4.125 | | | | 08/15/26 | | | | 570,650 | |
| | Intertape Polymer Group, Inc. | |
| | 735,000 | | | | 7.000 | | | | 10/15/26 | | | | 764,400 | |
| | Trivium Packaging Finance B.V. | |
| EUR | 508,000 | | | | 3.750 | | | | 08/15/26 | | | | 588,442 | |
| $ | 612,000 | | | | 5.500 | | | | 08/15/26 | | | | 640,305 | |
| | | | | | | | | | | | | | |
| | | | | | | | | | | | | 4,154,997 | |
| | |
| Pharmaceuticals – 0.6% | |
| | Bausch Health Americas, Inc.(a)(c) | |
| | 875,000 | | | | 8.500 | | | | 01/31/27 | | | | 983,281 | |
| | Endo Dac/Endo Finance LLC/Endo Finco, Inc.(a)(c) | |
| | 770,000 | | | | 6.000 | | | | 07/15/23 | | | | 509,163 | |
| | Nidda Healthcare Holding GmbH(a)(c) | |
| EUR | 665,000 | | | | 3.500 | | | | 09/30/24 | | | | 765,712 | |
| | Par Pharmaceutical, Inc.(a)(c) | |
| $ | 1,205,000 | | | | 7.500 | | | | 04/01/27 | | | | 1,147,762 | |
| | Teva Pharmaceutical Finance Co. B.V. | |
| | 1,000,000 | | | | 2.950 | | | | 12/18/22 | | | | 910,000 | |
| | Teva Pharmaceutical Finance Netherlands III BV | |
| | 1,105,000 | | | | 3.150 | | | | 10/01/26 | | | | 832,894 | |
| | | | | | | | | | | | | | |
| | | | | | | | | | | | | 5,148,812 | |
| | |
| Pipelines – 1.1% | |
| | Cheniere Corpus Christi Holdings LLC(c) | |
| | 90,000 | | | | 7.000 | | | | 06/30/24 | | | | 103,500 | |
| | 645,000 | | | | 5.125 | | | | 06/30/27 | | | | 697,406 | |
| | CNX Midstream Partners LP/CNX Midstream Finance Corp.(a)(c) | |
| | 1,445,000 | | | | 6.500 | | | | 03/15/26 | | | | 1,347,463 | |
| | |
| | |
| 64 | | The accompanying notes are an integral part of these financial statements. |
GOLDMAN SACHS MULTI-MANAGER NON-CORE FIXED INCOME FUND
| | | | | | | | | | | | | | |
Principal
Amount | | | Interest
Rate | | | Maturity
Date | | | Value | |
|
| Corporate Obligations – (continued) | |
| Pipelines – (continued) | |
| Crestwood Midstream Partners LP/Crestwood Midstream Finance
Corp.(c) |
|
| $ | 980,000 | | | | 5.750 | % | | | 04/01/25 | | | $ | 1,009,400 | |
| | DCP Midstream Operating LP | |
| | 375,000 | | | | 8.125 | | | | 08/16/30 | | | | 461,250 | |
| | EnLink Midstream LLC(c) | |
| | 1,896,000 | | | | 5.375 | | | | 06/01/29 | | | | 1,709,985 | |
| | Global Partners LP/GLP Finance Corp.(a)(c) | |
| | 942,000 | | | | 7.000 | | | | 08/01/27 | | | | 979,680 | |
| | KazTransGas JSC | |
| | 1,471,000 | | | | 4.375 | | | | 09/26/27 | | | | 1,543,631 | |
| Targa Resources Partners LP/Targa Resources Partners Finance
Corp.(c) |
|
| | 1,250,000 | | | | 5.375 | | | | 02/01/27 | | | | 1,287,500 | |
| | | | | | | | | | | | | | |
| | | | | | | | | | | | | 9,139,815 | |
| | |
| Real Estate – 1.1% | |
| | China Evergrande Group(c) | |
| | 1,890,000 | | | | 8.250 | | | | 03/23/22 | | | | 1,750,612 | |
| | Haya Finance 2017 SA(c) | |
| EUR | 234,000 | | | | 5.250 | | | | 11/15/22 | | | | 245,084 | |
| | Kaisa Group Holdings Ltd.(a)(c) | |
| $ | 1,000,000 | | | | 11.950 | | | | 10/22/22 | | | | 1,016,250 | |
| | Realogy Group LLC/Realogy Co-Issuer Corp.(a)(c) | |
| | 1,033,000 | | | | 9.375 | | | | 04/01/27 | | | | 1,014,923 | |
| | Saracen Development LLC(a)(c)(f)(g) | |
| | 1,180,000 | | | | 11.000 | | | | 10/15/25 | | | | 1,180,000 | |
| | Sunac China Holdings Ltd.(c) | |
| | 1,027,000 | | | | 7.875 | | | | 02/15/22 | | | | 1,050,403 | |
| | 1,620,000 | | | | 8.350 | | | | 04/19/23 | | | | 1,666,575 | |
| | WeWork Cos., Inc.(a) | |
| | 1,430,000 | | | | 7.875 | | | | 05/01/25 | | | | 1,201,200 | |
| | | | | | | | | | | | | | |
| | | | | | | | | | | | | 9,125,047 | |
| | |
| Real Estate Investment Trust(c) – 0.5% | |
| Brookfield Property REIT, Inc./BPR Cumulus LLC/BPR Nimbus
LLC/GGSI Sellco LL(a) |
|
| | 1,600,000 | | | | 5.750 | | | | 05/15/26 | | | | 1,664,707 | |
| | CTR Partnership LP/CareTrust Capital Corp. | |
| | 975,000 | | | | 5.250 | | | | 06/01/25 | | | | 1,014,000 | |
| | Iron Mountain, Inc.(a) | |
| | 920,000 | | | | 4.875 | | | | 09/15/29 | | | | 938,400 | |
| | Uniti Group LP/Uniti Fiber Holdings, Inc./CSL Capital LLC(a) | |
| | 180,000 | | | | 7.125 | | | | 12/15/24 | | | | 149,400 | |
| | Uniti Group LP/Uniti Group Finance, Inc./CSL Capital LLC(a) | |
| | 125,000 | | | | 6.000 | | | | 04/15/23 | | | | 119,063 | |
| | | | | | | | | | | | | | |
| | | | | | | | | | | | | 3,885,570 | |
| | |
| Retailing – 1.2% | |
| | 1011778 BC ULC/New Red Finance, Inc.(a)(c) | |
| | 550,000 | | | | 4.250 | | | | 05/15/24 | | | | 564,437 | |
| | 1,263,000 | | | | 5.000 | | | | 10/15/25 | | | | 1,304,047 | |
| | Carvana Co.(a)(c) | |
| | 1,120,000 | | | | 8.875 | | | | 10/01/23 | | | | 1,159,200 | |
| | Guitar Center Escrow Issuer, Inc.(a)(c) | |
| | 730,000 | | | | 9.500 | | | | 10/15/21 | | | | 675,250 | |
| | |
|
| Corporate Obligations – (continued) | |
| Retailing – (continued) | |
| | Guitar Center, Inc.(a)(c)(g)(PIK 8.000%, Cash 5.000%) | |
| 1,855,627 | | | | 13.000 | | | | 04/15/22 | | | | 1,484,502 | |
| | JC Penney Corp., Inc. | |
| | 1,285,000 | | | | 6.375 | | | | 10/15/36 | | | | 433,688 | |
| KFC Holding Co./Pizza Hut Holdings LLC/Taco Bell of America
LLC(a)(c) |
|
| | 215,000 | | | | 5.250 | | | | 06/01/26 | | | | 226,825 | |
| | 820,000 | | | | 4.750 | | | | 06/01/27 | | | | 856,900 | |
| | Neiman Marcus Group Ltd. LLC(a)(c) | |
| | 605,000 | | | | 8.000 | | | | 10/15/21 | | | | 402,325 | |
| | Rite Aid Corp. | |
| | 1,035,000 | | | | 6.125 | (a)(c) | | | 04/01/23 | | | | 883,631 | |
| | 835,000 | | | | 7.700 | | | | 02/15/27 | | | | 555,275 | |
| | 390,000 | | | | 6.875 | (a) | | | 12/15/28 | | | | 257,400 | |
| | Yum! Brands, Inc. | |
| | 615,000 | | | | 6.875 | | | | 11/15/37 | | | | 694,950 | |
| | | | | | | | | | | | | | |
| | | | | | | | | | | | | 9,498,430 | |
| | |
| Software(a)(c) – 0.4% | |
| | Ascend Learning LLC | |
| | 566,000 | | | | 6.875 | | | | 08/01/25 | | | | 590,762 | |
| | Rackspace Hosting, Inc. | |
| | 2,710,000 | | | | 8.625 | | | | 11/15/24 | | | | 2,479,650 | |
| | | | | | | | | | | | | | |
| | | | | | | | | | | | | 3,070,412 | |
| | |
| Sovereign – 0.6% | |
| | 1MDB Global Investments Ltd. | |
| | 700,000 | | | | 4.400 | | | | 03/09/23 | | | | 672,962 | |
| | KSA Sukuk Ltd.(a) | |
| | 2,263,000 | | | | 2.969 | | | | 10/29/29 | | | | 2,258,474 | |
| | Malaysia Sukuk Global Bhd | |
| | 1,812,000 | | | | 3.179 | | | | 04/27/26 | | | | 1,892,974 | |
| | | | | | | | | | | | | | |
| | | | | | | | | | | | | 4,824,410 | |
| | |
| Telecommunication Services – 4.0% | |
| | Altice France SA(a)(c) | |
| | 2,770,000 | | | | 7.375 | | | | 05/01/26 | | | | 2,967,362 | |
| | 1,100,000 | | | | 8.125 | | | | 02/01/27 | | | | 1,219,625 | |
| | CommScope, Inc.(a)(c) | |
| | 265,000 | | | | 6.000 | | | | 03/01/26 | | | | 271,956 | |
| | 2,450,000 | | | | 8.250 | | | | 03/01/27 | | | | 2,315,250 | |
| | Connect Finco S.A.R.L./Connect US Finco LLC(a)(c) | |
| | 1,418,000 | | | | 6.750 | | | | 10/01/26 | | | | 1,483,582 | |
| | Digicel Ltd.(a)(c) | |
| | 1,250,000 | | | | 6.000 | | | | 04/15/21 | | | | 930,859 | |
| | 210,000 | | | | 6.750 | | | | 03/01/23 | | | | 110,316 | |
| | Frontier Communications Corp. | |
| | 575,000 | | | | 10.500 | (c) | | | 09/15/22 | | | | 269,531 | |
| | 665,000 | | | | 7.125 | | | | 01/15/23 | | | | 302,575 | |
| | 915,000 | | | | 6.875 | (c) | | | 01/15/25 | | | | 407,175 | |
| | 1,006,000 | | | | 8.500 | (a)(c) | | | 04/01/26 | | | | 1,006,000 | |
| | 910,000 | | | | 8.000 | (a)(c) | | | 04/01/27 | | | | 955,500 | |
| | Intelsat Connect Finance SA(a)(c) | |
| | 195,000 | | | | 9.500 | | | | 02/15/23 | | | | 181,838 | |
| | Intelsat Jackson Holdings SA(c) | |
| | 350,000 | | | | 5.500 | | | | 08/01/23 | | | | 328,125 | |
| | 2,280,000 | | | | 8.500 | (a) | | | 10/15/24 | | | | 2,299,950 | |
| | 1,230,000 | | | | 9.750 | (a) | | | 07/15/25 | | | | 1,277,663 | |
| | |
| | |
| The accompanying notes are an integral part of these financial statements. | | 65 |
GOLDMAN SACHS MULTI-MANAGER NON-CORE FIXED INCOME FUND
Schedule of Investments(continued)
October 31, 2019
| | | | | | | | | | | | | | |
Principal
Amount | | | Interest
Rate | | | Maturity
Date | | | Value | |
|
| Corporate Obligations – (continued) | |
| Telecommunication Services – (continued) | |
| | Intelsat Luxembourg SA(c) | |
| $ | 285,000 | | | | 8.125 | % | | | 06/01/23 | | | $ | 239,400 | |
| | Level 3 Financing, Inc.(a)(c) | |
| | 2,300,000 | | | | 4.625 | | | | 09/15/27 | | | | 2,337,375 | |
| | SoftBank Group Corp.(c) | |
| EUR | 720,000 | | | | 4.000 | | | | 09/19/29 | | | | 819,349 | |
| | Sprint Capital Corp. | |
| $ | 1,120,000 | | | | 8.750 | | | | 03/15/32 | | | | 1,366,400 | |
| | Sprint Corp. | |
| | 1,695,000 | | | | 7.875 | | | | 09/15/23 | | | | 1,872,975 | |
| | 902,000 | | | | 7.625 | (c) | | | 02/15/25 | | | | 993,328 | |
| | T-Mobile USA, Inc.(c) | |
| | 1,340,000 | | | | 4.750 | | | | 02/01/28 | | | | 1,410,350 | |
| | Telecom Italia Capital SA | |
| | 2,185,000 | | | | 6.000 | | | | 09/30/34 | | | | 2,332,487 | |
| | Telecom Italia Finance SA | |
| EUR | 715,000 | | | | 7.750 | | | | 01/24/33 | | | | 1,182,164 | |
| | Telecom Italia SpA(a) | |
| $ | 1,745,000 | | | | 5.303 | | | | 05/30/24 | | | | 1,879,915 | |
| | Telefonica del Peru SAA(a) | |
| PEN | 6,350,000 | | | | 7.375 | | | | 04/10/27 | | | | 2,029,050 | |
| | Windstream Services LLC/Windstream Finance Corp.(a)(c)(e) | |
| $ | 150,000 | | | | 10.500 | | | | 06/30/24 | | | | 79,500 | |
| | 250,000 | | | | 9.000 | | | | 06/30/25 | | | | 128,750 | |
| | | | | | | | | | | | | | |
| | | | | | | | | | | | | 32,998,350 | |
| | |
| Textiles(a)(c) – 0.1% | |
| | Eagle Intermediate Global Holding BV/Ruyi US Finance LLC | |
| | 998,000 | | | | 7.500 | | | | 05/01/25 | | | | 869,508 | |
| | |
| Transportation(a)(c) – 0.2% | |
| | The Kenan Advantage Group, Inc. | |
| | 1,850,000 | | | | 7.875 | | | | 07/31/23 | | | | 1,665,000 | |
| | |
| Trucking & Leasing(a)(c) – 0.1% | |
| | Fortress Transportation & Infrastructure Investors LLC | |
| | 735,000 | | | | 6.750 | | | | 03/15/22 | | | | 765,319 | |
| | 245,000 | | | | 6.500 | | | | 10/01/25 | | | | 247,450 | |
| | | | | | | | | | | | | | |
| | | | | | | | | | | | | 1,012,769 | |
| | |
| | TOTAL CORPORATE OBLIGATIONS | |
| | (Cost $358,707,584) | | | $ | 360,488,932 | |
| | |
| | | | | | | | | | | | | | |
|
| Bank Loans(i) – 21.9% | |
| Advertising – 0.5% | |
| | BidFair MergerRight, Inc.(j) | |
| $ | 326,749 | | | | 0.000 | % | | | 01/15/27 | | | $ | 318,786 | |
| | Clear Channel Outdoor Holdings, Inc.(h) (1M LIBOR + 3.500%) | |
| | 2,500,000 | | | | 5.286 | | | | 08/21/26 | | | | 2,504,025 | |
| | ExGen Renewables IV LLC(h) (3M LIBOR + 3.000%) | |
| | 442,817 | | | | 5.130 | | | | 11/28/24 | | | | 414,773 | |
| | Outfront Media Capital LLC(h) (1M LIBOR + 2.000%) | |
| | 925,373 | | | | 3.940 | | | | 03/18/24 | | | | 928,844 | |
| | | | | | | | | | | | | | |
| | | | | | | | | | | | | 4,166,428 | |
| | |
|
| Bank Loans(i) – (continued) | |
| Aerospace & Defense(h) – 0.2% | |
| | Blackstone CQP Holding Co. LP (3M LIBOR + 3.500%) | |
| 498,750 | | | | 5.656 | | | | 09/30/24 | | | | 495,947 | |
| | Sequa Mezzanine Holdings LLC | |
| | (3M LIBOR + 5.000%) | |
| | 690,480 | | | | 7.187 | | | | 11/28/21 | | | | 680,413 | |
| | (3M LIBOR + 9.000%) | |
| | 201,082 | | | | 10.936 | | | | 04/28/22 | | | | 194,547 | |
| | TransDigm, Inc. | |
| | (1M LIBOR + 2.500%) | |
| | 494,987 | | | | 4.286 | | | | 06/09/23 | | | | 492,448 | |
| | (1M LIBOR + 2.500%) | |
| | 249,365 | | | | 4.286 | | | | 08/22/24 | | | | 247,301 | |
| | | | | | | | | | | | | | |
| | | | | | | | | | | | | 2,110,656 | |
| | |
| Airlines(h) – 0.2% | |
| | Allegiant Travel Co. (3M LIBOR + 4.500%) | |
| | 500,000 | | | | 6.709 | | | | 02/05/24 | | | | 500,210 | |
| | American Airlines, Inc. (1M LIBOR + 2.000%) | |
| | 305,624 | | | | 3.805 | | | | 04/28/23 | | | | 305,099 | |
| | United Airlines, Inc. (1M LIBOR + 1.750%) | |
| | 493,671 | | | | 3.536 | | | | 04/01/24 | | | | 494,495 | |
| | | | | | | | | | | | | | |
| | | | | | | | | | | | | 1,299,804 | |
| | |
| Automotive – Parts(h) – 0.8% | |
| | Capital Automotive LP (1M LIBOR + 2.500%) | |
| | 1,490,450 | | | | 4.290 | | | | 03/24/24 | | | | 1,488,318 | |
| | Evergreen Skills Lux S.a.r.l.(6M LIBOR + 4.750%) | |
| | 989,052 | | | | 6.946 | | | | 04/28/21 | | | | 786,573 | |
| | Gates Global LLC (1M LIBOR + 2.750%) | |
| | 264,729 | | | | 4.536 | | | | 04/01/24 | | | | 258,950 | |
| | Jaguar Holding Company II (1M LIBOR + 2.500%) | |
| | 2,175,817 | | | | 4.286 | | | | 08/18/22 | | | | 2,170,378 | |
| | Navistar International Corp. (1M LIBOR + 3.500%) | |
| | 491,250 | | | | 5.420 | | | | 11/06/24 | | | | 485,419 | |
| | Panther BF Aggregator 2 LP (1M LIBOR + 3.500%) | |
| | 1,600,000 | | | | 5.300 | | | | 04/30/26 | | | | 1,576,672 | |
| | | | | | | | | | | | | | |
| | | | | | | | | | | | | 6,766,310 | |
| | |
| Building Materials(h) – 0.1% | |
| | Quikrete Holdings, Inc. (1M LIBOR + 2.750%) | |
| | 968,805 | | | | 4.536 | | | | 11/15/23 | | | | 964,261 | |
| | |
| Chemicals(h) – 0.1% | |
| | H.B. Fuller Co. (1M LIBOR + 2.000%) | |
| | 446,826 | | | | 3.846 | | | | 10/20/24 | | | | 445,195 | |
| | |
| Commercial Services(h) – 0.1% | |
| | Monitronics International, Inc. (3M LIBOR + 6.500%) | |
| | 166,589 | | | | 8.604 | | | | 03/29/24 | | | | 146,668 | |
| | Wand NewCo 3, Inc. (1M LIBOR + 3.500%) | |
| | 498,750 | | | | 5.286 | | | | 02/05/26 | | | | 500,371 | |
| | | | | | | | | | | | | | |
| | | | | | | | | | | | | 647,039 | |
| | |
| Computers(j) – 0.1% | |
| | NCR Corp. | |
| | 639,687 | | | | 0.000 | | | | 08/28/26 | | | | 639,418 | |
| | |
| | |
| 66 | | The accompanying notes are an integral part of these financial statements. |
GOLDMAN SACHS MULTI-MANAGER NON-CORE FIXED INCOME FUND
| | | | | | | | | | | | | | |
Principal
Amount | | | Interest
Rate | | | Maturity
Date | | | Value | |
|
| Bank Loans(i) – (continued) | |
| Consumer Cyclical Services(h) – 0.3% | |
| | Compuware Corp. (1M LIBOR + 4.000%) | |
| $ | 1,095,361 | | | | 5.786 | % | | | 08/22/25 | | | $ | 1,097,640 | |
| | Equinox Holdings, Inc. (1M LIBOR + 3.000%) | |
| | 1,243,655 | | | | 4.786 | | | | 03/08/24 | | | | 1,238,021 | |
| | | | | | | | | | | | | | |
| | | | | | | | | | | | | 2,335,661 | |
| | |
| Consumer Noncyclical(h) – 0.5% | |
| | Coty, Inc. (1M LIBOR + 1.500%) | |
| | 596,047 | | | | 3.478 | | | | 04/05/23 | | | | 576,675 | |
| | Jacobs Douwe Egberts International B.V. (1M LIBOR + 2.000%) | |
| | 1,055,853 | | | | 4.063 | | | | 11/01/25 | | | | 1,055,589 | |
| | Lifescan Global Corp.(6M LIBOR + 6.000%) | |
| | 2,367,462 | | | | 8.056 | | | | 10/01/24 | | | | 2,103,088 | |
| | NeuStar, Inc. (1M LIBOR + 8.000%) | |
| | 224,563 | | | | 9.786 | | | | 08/08/25 | | | | 209,546 | |
| | | | | | | | | | | | | | |
| | | | | | | | | | | | | 3,944,898 | |
| | |
| Consumer Products – Household & Leisure(h) – 0.3% | |
| | Coty, Inc. (1M LIBOR + 2.250%) | |
| | 132,338 | | | | 4.228 | | | | 04/07/25 | | | | 127,706 | |
| | Revlon Consumer Products Corp. (3M LIBOR + 3.500%) | |
| | 2,736,227 | | | | 5.624 | | | | 09/07/23 | | | | 2,142,247 | |
| | | | | | | | | | | | | | |
| | | | | | | | | | | | | 2,269,953 | |
| | |
| Consumer Products – Non Durable(h) – 0.1% | |
| | Alphabet Holding Co., Inc. (1M LIBOR + 3.500%) | |
| | 246,851 | | | | 5.286 | | | | 09/26/24 | | | | 224,704 | |
| | KIK Custom Products, Inc. (1M LIBOR + 4.000%) | |
| | 750,000 | | | | 5.804 | | | | 05/15/23 | | | | 706,770 | |
| | | | | | | | | | | | | | |
| | | | | | | | | | | | | 931,474 | |
| | |
| Distribution & Wholesale(h) – 0.1% | |
| | American Tire Distributors Holdings, Inc. (1M LIBOR + 7.500%) | |
| | 859,761 | | | | 9.624 | | | | 09/02/24 | | | | 768,772 | |
| | |
| Electrical – 0.2% | |
| | Pacific Gas & Electric Co.(j) | |
| | 950,000 | | | | 0.000 | | | | 04/27/22 | | | | 885,086 | |
| | Vistra Operations Co. LLC(h) (1M LIBOR + 2.000%) | |
| | 445,625 | | | | 3.786 | | | | 12/31/25 | | | | 447,020 | |
| | | | | | | | | | | | | | |
| | | | | | | | | | | | | 1,332,106 | |
| | |
| Energy(h) – 0.1% | |
| | Epic Y-Grade Services, LP (1M LIBOR + 5.500%) | |
| | 1,125,155 | | | | 7.535 | | | | 06/13/24 | | | | 1,069,831 | |
| | |
| Energy – Exploration & Production(h) – 0.3% | |
| | Fieldwood Energy LLC | |
| | (3M LIBOR + 5.250%) | |
| | 1,951,985 | | | | 7.177 | | | | 04/11/22 | | | | 1,559,636 | |
| | (3M LIBOR + 7.250%) | |
| | 1,737,440 | | | | 9.177 | | | | 04/11/23 | | | | 825,284 | |
| | | | | | | | | | | | | | |
| | | | | | | | | | | | | 2,384,920 | |
| | |
| Entertainment(h) – 1.0% | |
| | AMC Entertainment Holdings, Inc.(6M LIBOR + 3.000%) | |
| | 1,443,750 | | | | 5.230 | | | | 04/22/26 | | | | 1,442,350 | |
| | Crown Finance US, Inc. (1M LIBOR + 2.250%) | |
| | 648,023 | | | | 4.036 | | | | 02/28/25 | | | | 638,821 | |
| | |
|
| Bank Loans(i) – (continued) | |
| Entertainment(h) – (continued) | |
| | Delta 2 (LUX) S.A.R.L. (1M LIBOR + 2.500%) | |
| 1,250,000 | | | | 4.286 | | | | 02/01/24 | | | | 1,229,688 | |
| East Valley Tourist Development Authority(6M LIBOR
+ 8.000%) |
|
| | 714,055 | | | | 10.064 | | | | 09/30/20 | | | | 706,914 | |
| | LTF Merger Sub, Inc. (3M LIBOR + 2.750%) | |
| | 1,236,152 | | | | 4.874 | | | | 06/10/22 | | | | 1,229,823 | |
| | PCI Gaming Authority (1M LIBOR + 3.000%) | |
| | 452,596 | | | | 4.786 | | | | 05/29/26 | | | | 455,144 | |
| | The Stars Group Holdings B.V. (3M LIBOR + 3.500%) | |
| | 2,238,627 | | | | 5.604 | | | | 07/10/25 | | | | 2,246,843 | |
| | | | | | | | | | | | | | |
| | | | | | | | | | | | | 7,949,583 | |
| | |
| Entertainment & Leisure(h) – 0.1% | |
| | Intrawest Resorts Holdings, Inc. (1M LIBOR + 3.000%) | |
| | 997,462 | | | | 4.786 | | | | 07/31/24 | | | | 998,290 | |
| | |
| Environmental(h) – 0.3% | |
| | Advanced Disposal Services, Inc.(1 Week LIBOR + 2.250%) | |
| | 1,419,789 | | | | 4.086 | | | | 11/10/23 | | | | 1,421,550 | |
| | GFL Environmental, Inc.(j) (1M LIBOR + 3.000%) | |
| | 750,000 | | | | 0.000 | | | | 05/30/25 | | | | 747,052 | |
| | | | | | | | | | | | | | |
| | | | | | | | | | | | | 2,168,602 | |
| | |
| Financial Services – 0.3% | |
| | RPI Finance Trust(h) (1M LIBOR + 2.000%) | |
| | 2,422,657 | | | | 3.786 | | | | 03/27/23 | | | | 2,432,493 | |
| | Walter Investment Management Corp.(j) | |
| | 352,630 | | | | 0.000 | | | | 06/30/22 | | | | 141,052 | |
| | | | | | | | | | | | | | |
| | | | | | | | | | | | | 2,573,545 | |
| | |
| Food & Beverage(h) – 0.4% | |
| | 8th Avenue Food & Provisions, Inc. (1M LIBOR + 3.750%) | |
| | 496,250 | | | | 5.690 | | | | 10/01/25 | | | | 496,250 | |
| | US Foods, Inc. (1M LIBOR + 2.000%) | |
| | 2,724,447 | | | | 3.786 | | | | 06/27/23 | | | | 2,731,612 | |
| | | | | | | | | | | | | | |
| | | | | | | | | | | | | 3,227,862 | |
| | |
| Food & Drug Retailing(h) – 0.1% | |
| | B&G Foods, Inc. (3M LIBOR + 2.500%) | |
| | 500,000 | | | | 4.475 | | | | 10/10/26 | | | | 501,565 | |
| | |
| Gaming(h) – 0.8% | |
| | Affinity Gaming LLC (1M LIBOR + 3.250%) | |
| | 522,406 | | | | 5.036 | | | | 07/01/23 | | | | 497,722 | |
| | Caesars Resort Collection LLC (1M LIBOR + 2.750%) | |
| | 2,724,902 | | | | 4.536 | | | | 12/23/24 | | | | 2,682,611 | |
| | Mashantucket (Western) Pequot Tribe(f) (1M LIBOR + 8.125%) | |
| | 1,499,829 | | | | 9.911 | | | | 06/30/20 | | | | 1,488,581 | |
| | Scientific Games International, Inc. (1M LIBOR + 2.750%) | |
| | 1,720,601 | | | | 4.536 | | | | 08/14/24 | | | | 1,699,627 | |
| | | | | | | | | | | | | | |
| | | | | | | | | | | | | 6,368,541 | |
| | |
| Health Care – Medical Products(h) – 0.5% | |
| | Carestream Dental Equiment, Inc (1M LIBOR + 3.250%) | |
| | 343,000 | | | | 5.036 | | | | 09/01/24 | | | | 317,275 | |
| | |
| | |
| The accompanying notes are an integral part of these financial statements. | | 67 |
GOLDMAN SACHS MULTI-MANAGER NON-CORE FIXED INCOME FUND
Schedule of Investments(continued)
October 31, 2019
| | | | | | | | | | | | | | |
Principal
Amount | | | Interest
Rate | | | Maturity
Date | | | Value | |
|
| Bank Loans(i) – (continued) | |
| Health Care – Medical Products(h) – (continued) | |
| | Carestream Health, Inc. | |
| | (1M LIBOR + 5.750%) | |
| $ | 2,553,372 | | | | 7.536 | % | | | 02/28/21 | | | $ | 2,449,654 | |
| | (1M LIBOR + 8.500%) | |
| | 193,550 | | | | 10.286 | | | | 12/07/19 | | | | 188,227 | |
| | MedPlast Holdings, Inc. (3M LIBOR + 3.750%) | |
| | 742,574 | | | | 5.854 | | | | 07/02/25 | | | | 692,450 | |
| | Vyaire Medical, Inc. (3M LIBOR + 4.750%) | |
| | 548,575 | | | | 6.835 | | | | 04/16/25 | | | | 482,746 | |
| | | | | | | | | | | | | | |
| | | | | | | | | | | | | 4,130,352 | |
| | |
| Health Care – Pharmaceuticals(h) – 0.7% | |
| | Concordia International Corp.(j) (1M LIBOR + 4.250%) | |
| | 1,262,240 | | | | 0.000 | | | | 09/06/24 | | | | 1,180,422 | |
| Grifols Worldwide Operations USA, Inc.(1 Week LIBOR
+ 2.250%) |
|
| | 1,679,105 | | | | 4.086 | | | | 01/31/25 | | | | 1,680,549 | |
| | Mallinckrodt International Finance S.A. | |
| | (3M LIBOR + 2.750%) | |
| | 71,458 | | | | 4.854 | | | | 09/24/24 | | | | 55,840 | |
| | (3M LIBOR + 3.000%) | |
| | 249,367 | | | | 5.175 | | | | 02/24/25 | | | | 193,728 | |
| Valeant Pharmaceuticals International, Inc. (1M LIBOR
+ 3.000%) |
|
| | 2,988,812 | | | | 4.921 | | | | 06/02/25 | | | | 2,998,465 | |
| | | | | | | | | | | | | | |
| | | | | | | | | | | | | 6,109,004 | |
| | |
| Health Care – Services(h) – 1.6% | |
| | AHP Health Partners, Inc. (1M LIBOR + 4.500%) | |
| | 594,366 | | | | 6.286 | | | | 06/30/25 | | | | 593,623 | |
| | Air Medical Group Holdings, Inc. (1M LIBOR + 3.250%) | |
| | 672,452 | | | | 5.096 | | | | 04/28/22 | | | | 602,476 | |
| | Air Methods Corp. (3M LIBOR + 3.500%) | |
| | 498,090 | | | | 5.604 | | | | 04/22/24 | | | | 396,813 | |
| | Change Healthcare Holdings LLC (1M LIBOR + 2.500%) | |
| | 1,827,932 | | | | 4.286 | | | | 03/01/24 | | | | 1,816,086 | |
| | DaVita, Inc. (1M LIBOR + 2.250%) | |
| | 750,000 | | | | 4.036 | | | | 08/12/26 | | | | 751,672 | |
| | Gentiva Health Services, Inc. (1M LIBOR + 3.750%) | |
| | 2,070,536 | | | | 5.563 | | | | 07/02/25 | | | | 2,065,360 | |
| | IQVIA, Inc. (3M LIBOR + 1.750%) | |
| | 492,491 | | | | 3.854 | | | | 06/11/25 | | | | 491,570 | |
| | Parexel International Corp. (1M LIBOR + 2.750%) | |
| | 1,346,364 | | | | 4.536 | | | | 09/27/24 | | | | 1,284,095 | |
| | Phoenix Guarantor, Inc. (1M LIBOR + 4.500%) | |
| | 498,750 | | | | 6.490 | | | | 03/05/26 | | | | 497,723 | |
| | Quorum Health Corp. (3M LIBOR + 6.750%) | |
| | 66,722 | | | | 8.677 | | | | 04/29/22 | | | | 64,192 | |
| RegionalCare Hospital Partners Holdings, Inc. (1M LIBOR
+ 4.500%) |
|
| | 1,989,975 | | | | 6.304 | | | | 11/17/25 | | | | 1,983,886 | |
| | Select Medical Corp. (3M LIBOR + 2.500%) | |
| | 750,000 | | | | 4.580 | | | | 03/06/25 | | | | 745,312 | |
| | Team Health Holdings, Inc. (1M LIBOR + 2.750%) | |
| | 1,265,740 | | | | 4.536 | | | | 02/06/24 | | | | 971,455 | |
| | Verscend Holding Corp. (1M LIBOR + 4.500%) | |
| | 1,023,994 | | | | 6.286 | | | | 08/27/25 | | | | 1,023,994 | |
| | | | | | | | | | | | | | |
| | | | | | | | | | | | | 13,288,257 | |
| | |
|
| Bank Loans(i) – (continued) | |
| Health Care Providers & Services(h) – 0.4% | |
| | Envision Healthcare Corp. (1M LIBOR + 3.750%) | |
| 3,057,886 | | | | 5.536 | | | | 10/10/25 | | | | 2,463,984 | |
| | HCA, Inc. (1M LIBOR + 1.750%) | |
| | 894,390 | | | | 3.536 | | | | 03/17/23 | | | | 897,296 | |
| | | | | | | | | | | | | | |
| | | | | | | | | | | | | 3,361,280 | |
| | |
| Hotels, Restaurants & Leisure(h) – 0.2% | |
| Caesars Entertainment Operating Co., Inc. (1M LIBOR
+ 2.000%) |
|
| | 1,389,032 | | | | 3.786 | | | | 10/07/24 | | | | 1,388,171 | |
| | |
| Insurance(h) – 0.1% | |
| | Alliant Holdings Intermediate LLC (3M LIBOR + 3.000%) | |
| | 498,737 | | | | 4.804 | | | | 05/09/25 | | | | 485,416 | |
| | |
| Internet(h) – 0.1% | |
| | Getty Images, Inc. (1M LIBOR + 4.500%) | |
| | 514,071 | | | | 6.313 | | | | 02/19/26 | | | | 499,934 | |
| | |
| Leisure Time(h) – 0.1% | |
| | ClubCorp Holdings, Inc. (3M LIBOR + 2.750%) | |
| | 500,000 | | | | 4.854 | | | | 09/18/24 | | | | 438,125 | |
| | |
| Lodging(h) – 0.3% | |
| | Boyd Gaming Corp.(1 Week LIBOR + 2.250%) | |
| | 1,410,513 | | | | 3.960 | | | | 09/15/23 | | | | 1,410,950 | |
| | Station Casinos LLC (1M LIBOR + 2.500%) | |
| | 1,238,410 | | | | 4.290 | | | | 06/08/23 | | | | 1,238,930 | |
| | | | | | | | | | | | | | |
| | | | | | | | | | | | | 2,649,880 | |
| | |
| Machinery-Diversified(h) – 0.2% | |
| | Gardner Denver, Inc. (1M LIBOR + 2.750%) | |
| | 815,133 | | | | 4.536 | | | | 07/30/24 | | | | 816,323 | |
| | North American Lifting Holdings, Inc. (3M LIBOR + 4.500%) | |
| | 591,255 | | | | 6.604 | | | | 11/27/20 | | | | 479,904 | |
| | | | | | | | | | | | | | |
| | | | | | | | | | | | | 1,296,227 | |
| | |
| Media(h) – 1.0% | |
| | CSC Holdings LLC (1M LIBOR + 2.250%) | |
| | 491,184 | | | | 4.171 | | | | 07/17/25 | | | | 488,251 | |
| | Gray Television, Inc. (1M LIBOR + 2.500%) | |
| | 1,671,941 | | | | 4.511 | | | | 01/02/26 | | | | 1,675,335 | |
| | iHeartCommunications, Inc. (1M LIBOR + 4.000%) | |
| | 4,506,193 | | | | 6.032 | | | | 05/01/26 | | | | 4,518,855 | |
| | Sinclair Television Group, Inc. | |
| | (1M LIBOR + 2.250%) | |
| | 1,238,569 | | | | 4.040 | | | | 01/03/24 | | | | 1,235,472 | |
| | (1M LIBOR + 2.500%) | |
| | 250,000 | | | | 4.430 | | | | 09/30/26 | | | | 250,078 | |
| | | | | | | | | | | | | | |
| | | | | | | | | | | | | 8,167,991 | |
| | |
| Media – Broadcasting & Radio(h) – 0.6% | |
| | Communications Sales & Leasing, Inc. (1M LIBOR + 5.000%) | |
| | 1,501,191 | | | | 6.786 | | | | 10/24/22 | | | | 1,443,215 | |
| | Metro-Goldwyn-Mayer, Inc. (1M LIBOR + 2.500%) | |
| | 1,242,484 | | | | 4.290 | | | | 07/03/25 | | | | 1,220,741 | |
| | Nexstar Broadcasting, Inc. (1M LIBOR + 2.250%) | |
| | 1,626,787 | | | | 4.050 | | | | 01/17/24 | | | | 1,628,316 | |
| | |
| | |
| 68 | | The accompanying notes are an integral part of these financial statements. |
GOLDMAN SACHS MULTI-MANAGER NON-CORE FIXED INCOME FUND
| | | | | | | | | | | | | | |
Principal
Amount | | | Interest
Rate | | | Maturity
Date | | | Value | |
|
| Bank Loans(i) – (continued) | |
| Media – Broadcasting & Radio(h) – (continued) | |
| | Radio One, Inc. (1M LIBOR + 4.000%) | |
| $ | 500,302 | | | | 5.790 | % | | | 04/18/23 | | | $ | 474,451 | |
| | | | | | | | | | | | | | |
| | | | | | | | | | | | | 4,766,723 | |
| | |
| Media – Cable(h) – 0.1% | |
| | Ziggo Secured Finance BV (1M LIBOR + 2.500%) | |
| | 500,000 | | | | 4.421 | | | | 04/15/25 | | | | 493,565 | |
| | |
| Media – Non Cable(h) – 1.3% | |
| | Advantage Sales & Marketing, Inc. | |
| | (1M LIBOR + 3.250%) | |
| | 559,524 | | | | 5.036 | | | | 07/23/21 | | | | 520,777 | |
| | (1M LIBOR + 3.250%) | |
| | 378,735 | | | | 5.036 | | | | 07/25/21 | | | | 349,720 | |
| | Cengage Learning Acquisitions, Inc. (1M LIBOR + 4.250%) | |
| | 2,444,601 | | | | 6.036 | | | | 06/07/23 | | | | 2,268,590 | |
| | Entercom Media Corp. (1M LIBOR + 2.750%) | |
| | 667,744 | | | | 4.554 | | | | 11/18/24 | | | | 667,577 | |
| Houghton Mifflin Harcourt Publishing Co. (1M LIBOR
+ 3.000%) |
|
| | 1,282,574 | | | | 4.786 | | | | 05/31/21 | | | | 1,271,351 | |
| | Lions Gate Capital Holdings LLC (1M LIBOR + 2.250%) | |
| | 1,495,756 | | | | 4.036 | | | | 03/24/25 | | | | 1,447,144 | |
| McGraw-Hill Global Education Holdings LLC (1M LIBOR
+ 4.000%) |
|
| | 2,589,452 | | | | 5.786 | | | | 05/04/22 | | | | 2,360,441 | |
| | Mission Broadcasting, Inc. (1M LIBOR + 2.250%) | |
| | 323,251 | | | | 4.282 | | | | 01/17/24 | | | | 323,555 | |
| | Nielsen Finance LLC (1M LIBOR + 2.000%) | |
| | 1,492,983 | | | | 3.940 | | | | 10/04/23 | | | | 1,487,385 | |
| | | | | | | | | | | | | | |
| | | | | | | | | | | | | 10,696,540 | |
| | |
| Metal Fabricate/Hardware(j) – 0.0% | |
| | Advanced Drainage Systems, Inc. | |
| | 116,071 | | | | 0.000 | | | | 07/31/26 | | | | 116,507 | |
| | |
| Metals & Mining(h) – 0.0% | |
| | Unimin Corp. (3M LIBOR + 4.000%) | |
| | 100,376 | | | | 6.043 | | | | 06/01/25 | | | | 69,761 | |
| | |
| Noncaptive – Financial(h) – 0.1% | |
| | Avolon TLB Borrower 1 (US) LLC (1M LIBOR + 1.750%) | |
| | 1,000,000 | | | | 3.596 | | | | 01/15/25 | | | | 1,003,500 | |
| | |
| Oil & Gas Services(h) – 0.1% | |
| | Delek US Holdings, Inc. (1M LIBOR + 2.250%) | |
| | 497,482 | | | | 4.036 | | | | 03/31/25 | | | | 490,641 | |
| | EG Finco Ltd. (3M LIBOR + 4.000%) | |
| | 544,240 | | | | 6.104 | | | | 02/07/25 | | | | 524,239 | |
| | | | | | | | | | | | | | |
| | | | | | | | | | | | | 1,014,880 | |
| | |
| Oil Field Services(h) – 0.1% | |
| | California Resources Corp. (1M LIBOR + 4.750%) | |
| | 250,000 | | | | 0.000 | (j) | | | 12/31/22 | | | | 213,875 | |
| | 750,000 | | | | 6.550 | | | | 12/31/22 | | | | 495,000 | |
| | | | | | | | | | | | | | |
| | | | | | | | | | | | | 708,875 | |
| | |
| Packaging(h) – 0.2% | |
| | Berry Global, Inc. (1M LIBOR + 2.500%) | |
| | 498,750 | | | | 4.439 | | | | 07/01/26 | | | | 500,206 | |
| | |
|
| Bank Loans(i) – (continued) | |
| Packaging(h) – (continued) | |
| | Reynolds Group Holdings, Inc. (1M LIBOR + 2.750%) | |
| 1,123,080 | | | | 4.536 | | | | 02/05/23 | | | | 1,122,463 | |
| | | | | | | | | | | | | | |
| | | | | | | | | | | | | 1,622,669 | |
| | |
| Pharmaceuticals(h) – 0.1% | |
| | Alphabet Holding Co., Inc. (1M LIBOR + 7.750%) | |
| | 350,000 | | | | 9.536 | | | | 09/26/25 | | | | 297,937 | |
| | Patterson Medical Holdings, Inc.(2M LIBOR + 4.750%) | |
| | 790,949 | | | | 6.677 | | | | 08/28/22 | | | | 708,888 | |
| | | | | | | | | | | | | | |
| | | | | | | | | | | | | 1,006,825 | |
| | |
| Pipelines(h) – 0.0% | |
| | Traverse Midstream Partners LLC (1M LIBOR + 4.000%) | |
| | 465,933 | | | | 5.800 | | | | 09/27/24 | | | | 407,691 | |
| | |
| Real Estate(h) – 0.2% | |
| | MGM Growth Properties LLC (1M LIBOR + 2.000%) | |
| | 1,242,291 | | | | 3.786 | | | | 03/21/25 | | | | 1,245,397 | |
| | Realogy Corp. (1M LIBOR + 2.250%) | |
| | 491,250 | | | | 4.072 | | | | 02/08/25 | | | | 464,845 | |
| | | | | | | | | | | | | | |
| | | | | | | | | | | | | 1,710,242 | |
| | |
| Restaurants(h) – 0.3% | |
| | 1011778 B.C. Unlimited Liability Co. (1M LIBOR + 2.250%) | |
| | 2,774,354 | | | | 4.036 | | | | 02/16/24 | | | | 2,776,435 | |
| | |
| Retailers(h) – 0.7% | |
| | Academy Ltd. (1M LIBOR + 4.000%) | |
| | 2,833,705 | | | | 6.011 | | | | 07/01/22 | | | | 1,894,728 | |
| | Belk, Inc. (3M LIBOR + 6.750%) | |
| | 683,524 | | | | 8.803 | | | | 07/31/25 | | | | 555,546 | |
| | Neiman Marcus Group Ltd., Inc. (1M LIBOR + 5.500%) | |
| | 423,999 | | | | 5.240 | | | | 10/25/20 | | | | 311,109 | |
| | Petco Animal Supplies, Inc. (3M LIBOR + 3.250%) | |
| | 403,961 | | | | 5.177 | | | | 01/26/23 | | | | 300,725 | |
| | PetSmart, Inc. (1M LIBOR + 4.000%) | |
| | 2,678,071 | | | | 5.930 | | | | 03/11/22 | | | | 2,607,210 | |
| | Serta Simmons Bedding LLC | |
| | (1M LIBOR + 3.500%) | |
| | 671,174 | | | | 5.421 | | | | 11/08/23 | | | | 394,315 | |
| | (1M LIBOR + 8.000%) | |
| | 156,560 | | | | 9.846 | | | | 11/08/24 | | | | 41,168 | |
| | | | | | | | | | | | | | |
| | | | | | | | | | | | | 6,104,801 | |
| | |
| Semiconductors(h) – 0.0% | |
| | Bright Bidco BV (3M LIBOR + 3.500%) | |
| | 371,263 | | | | 5.604 | | | | 06/30/24 | | | | 191,201 | |
| | |
| Services Cyclical – Business Services(h) – 0.3% | |
| | Asurion LLC (1M LIBOR + 3.000%) | |
| | 498,737 | | | | 4.786 | | | | 11/03/24 | | | | 499,052 | |
| | Tempo Acquisition LLC (1M LIBOR + 3.000%) | |
| | 488,750 | | | | 4.786 | | | | 05/01/24 | | | | 488,647 | |
| | Trans Union LLC (1M LIBOR + 2.000%) | |
| | 1,023,047 | | | | 3.786 | | | | 04/10/23 | | | | 1,024,428 | |
| | Travelport Finance S.a.r.l. (3M LIBOR + 5.000%) | |
| | 750,000 | | | | 7.104 | | | | 05/29/26 | | | | 697,500 | |
| | | | | | | | | | | | | | |
| | | | | | | | | | | | | 2,709,627 | |
| | |
| | |
| The accompanying notes are an integral part of these financial statements. | | 69 |
GOLDMAN SACHS MULTI-MANAGER NON-CORE FIXED INCOME FUND
Schedule of Investments(continued)
October 31, 2019
| | | | | | | | | | | | | | |
Principal
Amount | | | Interest
Rate | | | Maturity
Date | | | Value | |
|
| Bank Loans(i) – (continued) | |
| Software(h) – 0.2% | |
| | Rackspace Hosting, Inc. (3M LIBOR + 3.000%) | |
| $ | 1,989,450 | | | | 5.287 | % | | | 11/03/23 | | | $ | 1,766,253 | |
| | |
| Technology – Hardware(h) – 0.2% | |
| | CommScope, Inc. (1M LIBOR + 3.250%) | |
| | 1,390,654 | | | | 5.036 | | | | 04/06/26 | | | | 1,362,410 | |
| | |
| Technology – Software(h) – 0.1% | |
| | Epicor Software Corp. (1M LIBOR + 3.250%) | |
| | 696,642 | | | | 5.040 | | | | 06/01/22 | | | | 694,030 | |
| | Kronos, Inc. (3M LIBOR + 3.000%) | |
| | 500,000 | | | | 5.253 | | | | 11/01/23 | | | | 498,705 | |
| | | | | | | | | | | | | | |
| | | | | | | | | | | | | 1,192,735 | |
| | |
| Technology – Software/Services(h) – 2.5% | |
| | Almonde, Inc. | |
| | (6M LIBOR + 3.500%) | |
| | 1,493,989 | | | | 5.696 | | | | 06/13/24 | | | | 1,425,833 | |
| | (6M LIBOR + 7.250%) | |
| | 811,134 | | | | 9.446 | | | | 06/13/25 | | | | 756,723 | |
| | Blackboard, Inc. (1M LIBOR + 5.000%) | |
| | 622,867 | | | | 6.878 | | | | 06/30/21 | | | | 620,532 | |
| | BMC Software Finance, Inc. (1M LIBOR + 4.250%) | |
| | 411,947 | | | | 6.036 | | | | 10/02/25 | | | | 380,610 | |
| | Ceridian HCM Holding, Inc. (1M LIBOR + 3.000%) | |
| | 742,500 | | | | 4.800 | | | | 04/30/25 | | | | 743,428 | |
| | Dynatrace LLC (1M LIBOR + 2.750%) | |
| | 445,114 | | | | 4.536 | | | | 08/22/25 | | | | 446,227 | |
| | Financial & Risk US Holdings, Inc. (1M LIBOR + 3.750%) | |
| | 1,496,231 | | | | 5.536 | | | | 10/01/25 | | | | 1,503,338 | |
| | Greeneden U.S. Holdings II, LLC (1M LIBOR + 3.250%) | |
| | 1,488,456 | | | | 5.036 | | | | 12/01/23 | | | | 1,452,183 | |
| | Infor (US), Inc. (3M LIBOR + 2.750%) | |
| | 2,236,054 | | | | 4.854 | | | | 02/01/22 | | | | 2,236,054 | |
| | Informatica Corp. (1M LIBOR + 3.250%) | |
| | 1,336,407 | | | | 5.036 | | | | 08/05/22 | | | | 1,338,318 | |
| | MA FinanceCo. LLC | |
| | (1M LIBOR + 2.250%) | |
| | 484,778 | | | | 4.050 | | | | 11/19/21 | | | | 480,536 | |
| | (1M LIBOR + 2.500%) | |
| | 185,601 | | | | 4.300 | | | | 06/21/24 | | | | 179,917 | |
| | Mavenir Systems, Inc. (1M LIBOR + 6.000%) | |
| | 592,481 | | | | 7.940 | | | | 05/08/25 | | | | 584,335 | |
| | McAfee LLC (1M LIBOR + 3.750%) | |
| | 996,228 | | | | 5.555 | | | | 09/30/24 | | | | 995,431 | |
| | Perforce Software, Inc. (1M LIBOR + 4.500%) | |
| | 250,000 | | | | 6.286 | | | | 07/01/26 | | | | 246,250 | |
| | Seattle SpinCo, Inc. (1M LIBOR + 2.500%) | |
| | 1,253,406 | | | | 4.300 | | | | 06/21/24 | | | | 1,215,027 | |
| | Sophia L.P. (3M LIBOR + 3.250%) | |
| | 974,837 | | | | 5.354 | | | | 09/30/22 | | | | 973,619 | |
| SS&C Technologies Holdings Europe S.a.r.l. (1M LIBOR
+ 2.250%) |
|
| | 643,362 | | | | 4.036 | | | | 04/16/25 | | | | 644,437 | |
| | SS&C Technologies, Inc. (1M LIBOR + 2.250%) | |
| | 985,575 | | | | 4.036 | | | | 04/16/25 | | | | 987,221 | |
| | Syniverse Holdings, Inc. (3M LIBOR + 5.000%) | |
| | 2,770,403 | | | | 6.921 | | | | 03/09/23 | | | | 2,487,822 | |
| | |
|
| Bank Loans(i) – (continued) | |
| Technology – Software/Services(h) – (continued) | |
| | TIBCO Software, Inc. (1M LIBOR + 4.000%) | |
| 500,000 | | | | 6.000 | | | | 06/30/26 | | | | 496,875 | |
| | Western Digital Corp. (1M LIBOR + 1.750%) | |
| | 442,695 | | | | 3.747 | | | | 04/29/23 | | | | 440,813 | |
| | | | | | | | | | | | | | |
| | | | | | | | | | | | | 20,635,529 | |
| | |
| Telecommunication Services – 1.4% | |
| | Altice France SA(h) (1M LIBOR + 4.000%) | |
| | 992,487 | | | | 5.921 | | | | 08/14/26 | | | | 975,476 | |
| | CenturyLink, Inc.(h) (1M LIBOR +2.750%) | |
| | 2,627,223 | | | | 4.536 | | | | 01/31/25 | | | | 2,598,665 | |
| | Frontier Communications Corp.(h) (1M LIBOR + 3.750%) | |
| | 2,624,627 | | | | 5.540 | | | | 06/15/24 | | | | 2,612,160 | |
| | Inmarsat Finance PLC(j) | |
| | 250,000 | | | | 0.000 | | | | 09/23/26 | | | | 246,015 | |
| | Intelsat Jackson Holdings SA(h)(6M LIBOR + 3.750%) | |
| | 3,250,000 | | | | 5.682 | | | | 11/27/23 | | | | 3,243,922 | |
| | IQOR US Inc.(h) (3M LIBOR + 5.000%) | |
| | 598,309 | | | | 7.099 | | | | 04/01/21 | | | | 494,102 | |
| | MLN US Holding Co. LLC(h) (3M LIBOR + 4.500%) | |
| | 249,372 | | | | 6.532 | | | | 11/30/25 | | | | 219,447 | |
| | Plantronics, Inc.(h) (1M LIBOR + 2.500%) | |
| | 314,811 | | | | 4.286 | | | | 07/02/25 | | | | 312,910 | |
| | Sprint Communications, Inc.(h) (1M LIBOR + 3.000%) | |
| | 496,244 | | | | 4.813 | | | | 02/02/24 | | | | 492,934 | |
| | | | | | | | | | | | | | |
| | | | | | | | | | | | | 11,195,631 | |
| | |
| Telecommunications(h) – 0.0% | |
| | Maxar Technologies Ltd. (3M LIBOR + 2.750%) | |
| | 244,304 | | | | 4.854 | | | | 10/04/24 | | | | 215,496 | |
| | |
| Telecommunications – Internet & Data(h) – 0.2% | |
| | Avaya, Inc. (1M LIBOR + 4.250%) | |
| | 2,028,774 | | | | 6.164 | | | | 12/15/24 | | | | 1,931,149 | |
| | |
| Telecommunications – Satellites(h) –0.1% | |
| | West Corp. (3M LIBOR + 4.000%) | |
| | 564,883 | | | | 5.927 | | | | 10/10/24 | | | | 468,649 | |
| | Windstream Corp. (3M LIBOR + 5.000%) | |
| | 493,725 | | | | 9.750 | | | | 03/29/21 | | | | 498,223 | |
| | | | | | | | | | | | | | |
| | | | | | | | | | | | | 966,872 | |
| | |
| Textiles(h) – 0.1% | |
| | Boardriders, Inc. (1M LIBOR + 6.500%) | |
| | 458,025 | | | | 8.624 | | | | 04/23/24 | | | | 426,650 | |
| | |
| Transportation – 0.2% | |
| | CEVA Logistics Finance B.V.(j) | |
| | 498,750 | | | | 0.000 | | | | 08/04/25 | | | | 430,486 | |
| | HGIM Corp.(h) (3M LIBOR + 6.000%) | |
| | 186,235 | | | | 8.034 | | | | 07/02/23 | | | | 146,195 | |
| | Uber Technologies(h) (1M LIBOR + 3.500%) | |
| | 1,237,903 | | | | 5.304 | | | | 07/13/23 | | | | 1,217,787 | |
| | | | | | | | | | | | | | |
| | | | | | | | | | | | | 1,794,468 | |
| | |
| Utilities(h) – 0.1% | |
| | TEX Operations Co. LLC (1M LIBOR + 2.000%) | |
| | 711,735 | | | | 3.786 | | | | 08/04/23 | | | | 713,813 | |
| | |
| | |
| 70 | | The accompanying notes are an integral part of these financial statements. |
GOLDMAN SACHS MULTI-MANAGER NON-CORE FIXED INCOME FUND
| | | | | | | | | | | | | | |
Principal
Amount | | | Interest
Rate | | | Maturity
Date | | | Value | |
|
| Bank Loans(i) – (continued) | |
| Wireless(j) – 0.1% | |
| | Liberty Latin America Ltd. | |
| $ | 550,000 | | | | 0.000 | % | | | 10/22/26 | | | $ | 553,096 | |
| | |
| Wirelines Telecommunications(h) – 0.4% | |
| | Flexential Intermediate Corp. (3M LIBOR + 3.500%) | |
| | 845,788 | | | | 5.604 | | | | 08/01/24 | | | | 711,519 | |
| | Greenway Health LLC (3M LIBOR + 3.750%) | |
| | 149,617 | | | | 5.850 | | | | 02/14/24 | | | | 130,167 | |
| | Level 3 Financing, Inc. (1M LIBOR + 2.250%) | |
| | 1,500,000 | | | | 4.036 | | | | 02/22/24 | | | | 1,501,125 | |
| | Sprint Communications, Inc. (1M LIBOR + 2.500%) | |
| | 1,221,734 | | | | 4.313 | | | | 02/02/24 | | | | 1,206,976 | |
| | | | | | | | | | | | | | |
| | | | | | | | | | | | | 3,549,787 | |
| | |
| | TOTAL BANK LOANS | |
| | (Cost $184,540,042) | | | $ | 179,383,082 | |
| | |
| | | | | | | | |
| Shares | | | Description | | Value | |
|
| Common Stocks – 0.4% | |
| Automobiles(e) – 0.1% | |
| | 438 | | | HGIM Corp.(f) | | $ | 4,818 | |
| | 65,182 | | | Monitronics International, Inc. | | | 495,383 | |
| | | | | | | | |
| | | | | | | 500,201 | |
| | |
| Chemicals(e) – 0.1% | |
| | 42,218 | | | Hexion Holdings Corp. Class B | | | 426,402 | |
| | |
| Commercial Services & Supplies(e) – 0.0% | |
| | 10,879 | | | Cenveo, Inc. | | | 159,562 | |
| | |
| Distributors(e)(f) – 0.0% | |
| | 542 | | | ATD New Holdings, Inc. | | | 15,176 | |
| | |
| Diversified Consumer Services – 0.0% | |
| | 4,333 | | | Gymboree Holding Corp.(e)(f) (Diversified Consumer Services) | | | — | |
| | 7,679 | | | Premier Brands Group Holdings LLC | | | 115,185 | |
| | | | | | | | |
| | | | | | | 115,185 | |
| | |
| Energy Equipment & Services(e) – 0.0% | |
| | 17,981 | | | Parker Drilling Co. | | | 332,109 | |
| | |
| Health Care Services(e)(f) – 0.0% | |
| | 24,425 | | | Aurora Diagnostics Holdings LLC | | | — | |
| | |
| Health Care Technology(e)(f) – 0.0% | |
| | 2,776 | | | MModal, Inc. | | | 6,940 | |
| | |
| Media(e) – 0.2% | |
| | 123,364 | | | Clear Channel Outdoor Holdings, Inc. | | | 287,438 | |
| | 19,393 | | | Cumulus Media, Inc. Class A | | | 265,490 | |
| | 52,092 | | | iHeartMedia, Inc. Class A | | | 747,000 | |
| | | | | | | | |
| | | | | | | 1,299,928 | |
| | |
|
| Common Stocks – (continued) | |
| Oil, Gas & Consumable Fuels – 0.0% | |
| | 3 | | | Amplify Energy Corp. | | | 22 | |
| | 117,847 | | | Jupiter Resources, Inc.(e) | | | 176,770 | |
| | | | | | | | |
| | | | | | | 176,792 | |
| | |
| Software(e) – 0.0% | |
| | 14,799 | | | Avaya Holdings Corp. | | | 178,920 | |
| | |
| | TOTAL COMMON STOCKS | |
| | (Cost $5,721,129) | | $ | 3,211,215 | |
| | |
| | | | | | | | | | | | |
| Shares | | | Description | | Expiration
Date | | | Value | |
|
| Warrant – 0.0% | |
| Automobiles – 0.0% | | | | |
| |
| | Amplify Energy Corp.(e) | | | | | |
| | 28 | | | | | | 04/21/20 | | | $ | — | |
| | |
| |
| | HGIM Corp.(f) | | | | | |
| | 1,958 | | | | | | 07/02/43 | | | | 19,580 | |
| | | | | | | | | | | | |
| | | | | | | | | | | 19,580 | |
| | |
| Specialty Retail(f) – 0.0% | | | | |
| |
| | Guitar Center, Inc. | | | | | |
| | 3,904 | | | | | | 04/16/25 | | | | — | |
| | |
| | TOTAL WARRANT | | | | | |
| | (Cost $75,229) | | | | | | $ | 19,580 | |
| | |
| | | | | | | | |
| Shares | | Dividend
Rate | | | Value | |
|
| Investment Company(k) – 8.3% | |
Goldman Sachs Financial Square Government Fund – Institutional Shares | |
| 68,210,674 | | | 1.701 | % | | $ | 68,210,674 | |
| (Cost $68,210,674) | |
| |
| TOTAL INVESTMENTS – 102.8% | |
| (Cost $840,968,261) | | | $ | 842,874,623 | |
| |
LIABILITIES IN EXCESS OF OTHER ASSETS – (2.8)% | | | | (22,710,761 | ) |
| |
| NET ASSETS – 100.0% | | | $ | 820,163,862 | |
| |
| | |
| The accompanying notes are an integral part of these financial statements. | | 71 |
GOLDMAN SACHS MULTI-MANAGER NON-CORE FIXED INCOME FUND
Schedule of Investments(continued)
October 31, 2019
| | |
|
| The percentage shown for each investment category reflects the value of investments in that category as a percentage of net assets. |
| |
(a) | | Exempt from registration under Rule 144A of the Securities Act of 1933. |
| |
(b) | | Issued with a zero coupon. Income is recognized through the accretion of discount. |
| |
(c) | | Security with “Call” features with resetting interest rates. Maturity dates disclosed are the final maturity dates. |
| |
(d) | | Coupon changes periodically based upon a predetermined schedule. Interest rate disclosed is that which is in effect on October 31, 2019. |
| |
(e) | | Security is currently in default and/or non-income producing. |
| |
(f) | | Significant unobservable inputs were used in the valuation of this portfolio security; i.e., Level 3. |
| |
(g) | | Pay-in-kind securities. |
| |
(h) | | Variable rate security. Except for floating rate notes (for which final maturity is disclosed), maturity date disclosed is the next interest reset date. Interest rate disclosed is that which is in effect on October 31, 2019. |
| |
(i) | | Bank Loans often require prepayments from excess cash flows or permit the borrower to repay at its election. The degree to which borrowers repay, whether as a contractual requirement or at their election, cannot be predicted with accuracy. As a result, the actual remaining maturity may be substantially less than the stated maturities shown. As bank loan positions may involve multiple underlying tranches for which the aggregate position is presented, the stated interest rate represents the weighted average interest rate of all contracts on October 31, 2019. Bank Loans typically have rates of interest which are predetermined either daily, monthly, quarterly or semi-annually by reference to a base lending rate, plus a premium. These base lending rates are primarily the London-Interbank Offered Rate (“LIBOR”), and secondarily the prime rate offered by one or more major United States banks (the “Prime Rate”) and the certificate of deposit (“CD”) rate or other base lending rates used by commercial lenders. |
| |
(j) | | This position represents an unsettled loan commitment at period end. Certain details associated with this purchase are not known prior to the settlement date, including coupon rate. |
| |
(k) | | Represents an affiliated issuer. |
| | |
|
Currency Abbreviations: |
BRL | | —Brazilian Real |
CAD | | —Canadian Dollar |
CLP | | —Chilean Peso |
COP | | —Colombian Peso |
CZK | | —Czech Koruna |
DOP | | —Dominican Peso |
EGP | | —Egyptian Pound |
EUR | | —Euro |
GBP | | —British Pound |
HUF | | —Hungarian Forint |
IDR | | —Indonesian Rupiah |
MXN | | —Mexican Peso |
MYR | | —Malaysian Ringgit |
NGN | | —Nigerian Naira |
PEN | | —Peruvian Nuevo Sol |
PHP | | —Philippine Peso |
PLN | | —Polish Zloty |
RON | | —New Romanian Leu |
RUB | | —Russian Ruble |
SGD | | —Singapore Dollar |
THB | | —Thai Baht |
TRY | | —Turkish Lira |
TWD | | —Taiwan Dollar |
UAH | | —Ukraine Hryvna |
USD | | —U.S. Dollar |
ZAR | | —South African Rand |
|
Investment Abbreviations: |
CMT | | —Constant Maturity Treasury Indexes |
LIBOR | | —London Interbank Offered Rate |
LLC | | —Limited Liability Company |
LP | | —Limited Partnership |
PLC | | —Public Limited Company |
REIT | | —Real Estate Investment Trust |
|
| | |
| 72 | | The accompanying notes are an integral part of these financial statements. |
GOLDMAN SACHS MULTI-MANAGER NON-CORE FIXED INCOME FUND
|
| ADDITIONAL INVESTMENT INFORMATION |
FORWARD FOREIGN CURRENCY EXCHANGE CONTRACTS — At October 31, 2019, the Fund had the following forward foreign currency exchange contracts:
FORWARD FOREIGN CURRENCY EXCHANGE CONTRACTS WITH UNREALIZED GAIN
| | | | | | | | | | | | | | | | | | | | |
| Counterparty | | Currency
Purchased | | | Currency
Sold | | | Settlement
Date | | | Unrealized
Gain | |
Barclays Bank PLC | | CZK | | | 14,968,740 | | | USD | | | 650,000 | | | | 12/10/19 | | | $ | 4,511 | |
| | EUR | | | 1,508,054 | | | USD | | | 1,656,084 | | | | 11/26/19 | | | | 28,690 | |
| | EUR | | | 34,087,000 | | | USD | | | 37,916,954 | | | | 12/13/19 | | | | 217,256 | |
| | GBP | | | 3,744,000 | | | USD | | | 4,642,185 | | | | 12/13/19 | | | | 214,876 | |
| | HUF | | | 132,075,135 | | | USD | | | 435,000 | | | | 12/10/19 | | | | 14,284 | |
| | PLN | | | 22,505,491 | | | USD | | | 5,840,000 | | | | 01/29/20 | | | | 53,990 | |
| | SGD | | | 414,395 | | | USD | | | 300,000 | | | | 12/05/19 | | | | 4,711 | |
| | TWD | | | 72,990,014 | | | USD | | | 2,364,355 | | | | 11/20/19 | | | | 36,120 | |
| | ZAR | | | 7,665,376 | | | USD | | | 500,000 | | | | 11/08/19 | | | | 6,682 | |
BNP Paribas SA | | COP | | | 2,085,439,300 | | | USD | | | 612,779 | | | | 01/03/20 | | | | 2,669 | |
| | CZK | | | 207,830,420 | | | USD | | | 8,890,000 | | | | 12/10/19 | | | | 197,423 | |
| | EUR | | | 3,670,000 | | | USD | | | 4,068,056 | | | | 11/26/19 | | | | 32,010 | |
| | HUF | | | 2,349,642,000 | | | USD | | | 7,890,000 | | | | 12/10/19 | | | | 102,845 | |
| | PLN | | | 43,927,855 | | | USD | | | 11,400,000 | | | | 11/07/19 | | | | 97,903 | |
| | THB | | | 404,418,760 | | | USD | | | 13,125,000 | | | | 11/21/19 | | | | 270,853 | |
| | TWD | | | 24,318,000 | | | USD | | | 783,937 | | | | 11/20/19 | | | | 15,827 | |
| | USD | | | 2,160,000 | | | ZAR | | | 32,394,600 | | | | 11/08/19 | | | | 18,725 | |
Citibank NA (London) | | CAD | | | 1,271,969 | | | USD | | | 957,980 | | | | 11/26/19 | | | | 7,806 | |
| | EUR | | | 17,006,668 | | | USD | | | 18,861,527 | | | | 11/26/19 | | | | 138,061 | |
| | | GBP | | | 2,088,830 | | | USD | | | 2,589,135 | | | | 11/26/19 | | | | 118,835 | |
| | | | | | |
| TOTAL | | | | | | | | | | | | | | | | | | $ | 1,584,077 | |
FORWARD FOREIGN CURRENCY EXCHANGE CONTRACTS WITH UNREALIZED LOSS
| | | | | | | | | | | | | | | | | | | | |
| Counterparty | | Currency
Purchased | | | Currency
Sold | | | Settlement
Date | | | Unrealized
Loss | |
Barclays Bank PLC | | CLP | | | 968,601,520 | | | USD | | | 1,360,000 | | | | 01/21/20 | | | $ | (51,022 | ) |
| | MXN | | | 22,844,825 | | | USD | | | 1,183,557 | | | | 12/30/19 | | | | (7,111 | ) |
| | PEN | | | 1,300,000 | | | USD | | | 387,959 | | | | 01/03/20 | | | | (69 | ) |
| | USD | | | 595,000 | | | COP | | | 2,085,439,300 | | | | 01/03/20 | | | | (20,448 | ) |
| | USD | | | 4,652,778 | | | EUR | | | 4,207,000 | | | | 12/13/19 | | | | (53,727 | ) |
| | USD | | | 5,788,388 | | | HUF | | | 1,751,717,135 | | | | 12/10/19 | | | | (170,479 | ) |
| | USD | | | 2,748,000 | | | MXN | | | 54,856,231 | | | | 12/30/19 | | | | (76,947 | ) |
| | USD | | | 980,000 | | | PEN | | | 3,345,720 | | | | 01/03/20 | | | | (18,286 | ) |
| | USD | | | 4,817,126 | | | PLN | | | 18,574,840 | | | | 11/07/19 | | | | (44,748 | ) |
| | USD | | | 2,475,000 | | | SGD | | | 3,415,748 | | | | 12/05/19 | | | | (36,650 | ) |
| | ZAR | | | 4,100,000 | | | USD | | | 273,327 | | | | 11/08/19 | | | | (2,318 | ) |
BNP Paribas SA | | USD | | | 2,357,861 | | | CZK | | | 55,339,169 | | | | 12/10/19 | | | | (61,854 | ) |
| | USD | | | 5,780,000 | | | EUR | | | 5,178,054 | | | | 11/26/19 | | | | (4,842 | ) |
| | USD | | | 2,428,543 | | | HUF | | | 730,000,000 | | | | 12/10/19 | | | | (54,719 | ) |
| | USD | | | 6,510,228 | | | PLN | | | 25,353,015 | | | | 11/07/19 | | | | (125,800 | ) |
| | USD | | | 977,275 | | | PLN | | | 3,740,000 | | | | 01/29/20 | | | | (2,199 | ) |
| | USD | | | 3,995,798 | | | THB | | | 122,028,437 | | | | 11/21/19 | | | | (46,237 | ) |
| | USD | | | 840,000 | | | TRY | | | 5,155,500 | | | | 01/21/20 | | | | (42,359 | ) |
| | USD | | | 3,125,000 | | | TWD | | | 97,308,014 | | | | 11/20/19 | | | | (75,240 | ) |
| | USD | | | 200,000 | | | ZAR | | | 3,071,965 | | | | 11/08/19 | | | | (3,056 | ) |
| | ZAR | | | 23,701,189 | | | USD | | | 1,584,335 | | | | 11/08/19 | | | | (17,692 | ) |
| | |
| The accompanying notes are an integral part of these financial statements. | | 73 |
GOLDMAN SACHS MULTI-MANAGER NON-CORE FIXED INCOME FUND
Schedule of Investments(continued)
October 31, 2019
|
| ADDITIONAL INVESTMENT INFORMATION (continued) |
FORWARD FOREIGN CURRENCY EXCHANGE CONTRACTS WITH UNREALIZED LOSS (continued)
| | | | | | | | | | | | | | | | | | | | |
| Counterparty | | Currency
Purchased | | | Currency
Sold | | | Settlement
Date | | | Unrealized
Loss | |
Citibank NA (London) | | EUR | | | 380,000 | | | USD | | | 425,347 | | | | 11/26/19 | | | $ | (817 | ) |
| | USD | | | 128,082 | | | CAD | | | 170,000 | | | | 11/26/19 | | | | (995 | ) |
| | USD | | | 4,335,346 | | | EUR | | | 3,950,000 | | | | 11/26/19 | | | | (77,533 | ) |
| | USD | | | 2,059,869 | | | GBP | | | 1,654,022 | | | | 11/26/19 | | | | (84,414 | ) |
State Street Bank (London) | | IDR | | | 6,005,615,616 | | | USD | | | 428,472 | | | | 11/01/19 | | | | (900 | ) |
| | | | | | |
| TOTAL | | | | | | | | | | | | | | | | | | $ | (1,080,462 | ) |
FUTURES CONTRACTS — At October 31, 2019, the Fund had the following futures contracts:
| | | | | | | | | | | | | | | | |
| Type | | Number of
Contracts | | | Expiration
Date | | | Notional
Amount | | | Unrealized
Appreciation/
(Depreciation) | |
Short position contracts: | | | | | | | | | | | | | | | | |
10 Year U.S. Treasury Notes | | | (5 | ) | | | 12/19/19 | | | $ | (651,484 | ) | | $ | (3,220 | ) |
SWAP CONTRACTS — At October 31, 2019, the Fund had the following swap contracts:
OVER THE COUNTER CREDIT DEFAULT SWAP CONTRACTS
| | | | | | | | | | | | | | | | | | | | | | | | | | | | | | |
| Reference Obligation/Index | | Financing Rate
Paid by the
Fund(a) | | Credit
Spread at
October 31,
2019(b) | | | Counterparty | | | Termination
Date | | | Notional
Amount
(000s) | | | Value | | | Upfront
Premiums
(Received) Paid | | | Unrealized
Appreciation/
(Depreciation) | |
Protection Purchased: | | | | | | | | | | | | | | | | | | | | | | | | | | | | | | |
| | | | | | | | |
Barrick Gold Corp.,
5.800%, 11/15/34 | | (1.000)% | | | 0.540% | | |
| Citibank NA
(London) |
| | | 12/20/24 | | | $ | 1,000 | | | $ | (25,496 | ) | | $ | (22,475 | ) | | $ | (3,021 | ) |
| | (a) | | Payments made quarterly. |
| | (b) | | Credit spread on the referenced obligation, together with the term of the swap contract, are indicators of payment/performance risk. The likelihood of a credit event occurring which would require a fund or its counterparty to make a payment or otherwise be required to perform under the swap contract is generally greater as the credit spread and the term of the swap contract increase. |
| | |
| 74 | | The accompanying notes are an integral part of these financial statements. |
GOLDMAN SACHS MULTI-MANAGER REAL ASSETS STRATEGY FUND
Schedule of Investments
October 31, 2019
| | | | | | | | |
Shares | | | Description | | Value | |
|
| Common Stocks – 97.8% | |
| Argentina* – 0.0% | | | |
| | 18,980 | | | Corp. America Airports SA (Transportation Infrastructure) | | $ | 75,161 | |
| | |
| Australia – 4.0% | |
| | 87,442 | | | Atlas Arteria Ltd. (Transportation Infrastructure) | | | 483,595 | |
| | 315,278 | | | Aurizon Holdings Ltd. (Road & Rail) | | | 1,282,626 | |
| | 280,844 | | | Dexus (Equity Real Estate Investment Trusts (REITs)) | | | 2,315,971 | |
| | 377,426 | | | Goodman Group (Equity Real Estate Investment Trusts (REITs)) | | | 3,747,561 | |
| | 126,417 | | | Ingenia Communities Group (Equity Real Estate Investment Trusts (REITs)) | | | 383,440 | |
| | 833,393 | | | Mirvac Group (Equity Real Estate Investment Trusts (REITs)) | | | 1,846,697 | |
| | 210,563 | | | Scentre Group (Equity Real Estate Investment Trusts (REITs)) | | | 556,338 | |
| | 348,654 | | | Sydney Airport (Transportation Infrastructure) | | | 2,111,604 | |
| | 490,274 | | | Transurban Group (Transportation Infrastructure) | | | 5,021,358 | |
| | | | | | | | |
| | | | | | | 17,749,190 | |
| | |
| Belgium – 0.8% | |
| | 29,762 | | | Elia System Operator SA (Electric Utilities) | | | 2,565,861 | |
| | 24,138 | | | Shurgard Self Storage SA (Real Estate Management & Development) | | | 817,056 | |
| | | | | | | | |
| | | | | | | 3,382,917 | |
| | |
| Brazil – 0.2% | |
| | 184,058 | | | Neoenergia SA (Electric Utilities) | | | 961,939 | |
| | |
| Canada – 8.0% | |
| | 46,681 | | | Canadian Apartment Properties REIT (Equity Real Estate Investment Trusts (REITs)) | | | 1,943,654 | |
| | 75,600 | | | Dream Industrial Real Estate Investment Trust (Equity Real Estate Investment Trusts (REITs)) | | | 771,440 | |
| | 27,819 | | | Emera, Inc. (Electric Utilities) | | | 1,151,750 | |
| | 317,017 | | | Enbridge, Inc. (Oil, Gas & Consumable Fuels) | | | 11,546,052 | |
| | 138,400 | | | First Capital Realty, Inc. (Real Estate Management & Development) | | | 2,290,730 | |
| | 114,499 | | | InterRent Real Estate Investment Trust (Equity Real Estate Investment Trusts (REITs)) | | | 1,357,019 | |
| | 102,839 | | | Keyera Corp. (Oil, Gas & Consumable Fuels) | | | 2,383,778 | |
| | 53,905 | | | Pembina Pipeline Corp. (Oil, Gas & Consumable Fuels) | | | 1,897,787 | |
| | 252,396 | | | Summit Industrial Income REIT (Equity Real Estate Investment Trusts (REITs)) | | | 2,449,500 | |
| | 185,943 | | | TC Energy Corp. (Oil, Gas & Consumable Fuels) | | | 9,372,679 | |
| | |
|
| Common Stocks – (continued) | |
| Canada – (continued) | |
| | 10,700 | | | Waste Connections, Inc. (Commercial Services & Supplies) | | | 988,680 | |
| | | | | | | | |
| | | | | | | 36,153,069 | |
| | |
| China – 1.3% | |
| | 6,540,000 | | | China Tower Corp. Ltd. Class H(a) (Diversified Telecommunication Services) | | | 1,439,406 | |
| | 375,617 | | | ENN Energy Holdings Ltd. (Gas Utilities) | | | 4,285,244 | |
| | | | | | | | |
| | | | | | | 5,724,650 | |
| | |
| Denmark(a) – 0.5% | |
| | 27,228 | | | Orsted A/S (Electric Utilities) | | | 2,389,847 | |
| | |
| Finland – 0.3% | |
| | 65,391 | | | Kojamo Oyj (Real Estate Management & Development) | | | 1,101,251 | |
| | |
| France – 4.1% | |
| | 3,110 | | | Aeroports de Paris (Transportation Infrastructure) | | | 591,489 | |
| | 25,170 | | | Gecina SA (Equity Real Estate Investment Trusts (REITs)) | | | 4,320,907 | |
| | 51,879 | | | Getlink SE (Transportation Infrastructure) | | | 869,019 | |
| | 28,828 | | | Klepierre SA (Equity Real Estate Investment Trusts (REITs)) | | | 1,074,571 | |
| | 15,300 | | | Unibail-Rodamco-Westfield (Equity Real Estate Investment Trusts (REITs)) | | | 2,365,935 | |
| | 83,296 | | | Vinci SA (Construction & Engineering) | | | 9,345,497 | |
| | | | | | | | |
| | | | | | | 18,567,418 | |
| | |
| Germany – 1.9% | |
| | 18,696 | | | Deutsche Wohnen SE (Real Estate Management & Development) | | | 704,884 | |
| | 12,139 | | | LEG Immobilien AG (Real Estate Management & Development) | | | 1,394,332 | |
| | 19,082 | | | TLG Immobilien AG (Real Estate Management & Development) | | | 558,656 | |
| | 113,070 | | | Vonovia SE (Real Estate Management & Development) | | | 6,021,526 | |
| | | | | | | | |
| | | | | | | 8,679,398 | |
| | |
| Hong Kong – 4.5% | |
| | 654,299 | | | CK Asset Holdings Ltd. (Real Estate Management & Development) | | | 4,552,422 | |
| | 1,180,000 | | | COSCO SHIPPING Ports Ltd. (Transportation Infrastructure) | | | 927,703 | |
| | 476,000 | | | Guangdong Investment Ltd. (Water Utilities) | | | 1,030,205 | |
| | 156,834 | | | Henderson Land Development Co. Ltd. (Real Estate Management & Development) | | | 783,320 | |
| | |
| | |
| The accompanying notes are an integral part of these financial statements. | | 75 |
GOLDMAN SACHS MULTI-MANAGER REAL ASSETS STRATEGY FUND
Schedule of Investments(continued)
October 31, 2019
| | | | | | | | |
Shares | | | Description | | Value | |
|
| Common Stocks – (continued) | |
| Hong Kong – (continued) | |
| | 909,734 | | | Hong Kong & China Gas Co. Ltd. (Gas Utilities) | | $ | 1,765,703 | |
| | 171,700 | | | Hongkong Land Holdings Ltd. (Real Estate Management & Development) | | | 943,216 | |
| | 493,818 | | | Link REIT (Equity Real Estate Investment Trusts (REITs)) | | | 5,378,369 | |
| | 682,048 | | | New World Development Co. Ltd. (Real Estate Management & Development) | | | 975,626 | |
| | 156,491 | | | Sun Hung Kai Properties Ltd. (Real Estate Management & Development) | | | 2,371,356 | |
| | 175,783 | | | Swire Properties Ltd. (Real Estate Management & Development) | | | 552,846 | |
| | 1,079,000 | | | Towngas China Co. Ltd.* (Gas Utilities) | | | 831,776 | |
| | | | | | | | |
| | | | | | | 20,112,542 | |
| | |
| Ireland – 0.3% | |
| | 366,701 | | | Hibernia REIT PLC (Equity Real Estate Investment Trusts (REITs)) | | | 570,938 | |
| | 415,724 | | | Irish Residential Properties REIT PLC (Equity Real Estate Investment Trusts (REITs)) | | | 814,182 | |
| | | | | | | | |
| | | | | | | 1,385,120 | |
| | |
| Italy – 0.8% | |
| | 172,850 | | | Infrastrutture Wireless Italiane SpA(a) (Diversified Telecommunication Services) | | | 1,773,572 | |
| | 236,899 | | | Terna Rete Elettrica Nazionale SpA (Electric Utilities) | | | 1,565,760 | |
| | | | | | | | |
| | | | | | | 3,339,332 | |
| | |
| Japan – 7.8% | |
| | 236 | | | Activia Properties, Inc. (Equity Real Estate Investment Trusts (REITs)) | | | 1,245,164 | |
| | 109 | | | Daiwa Office Investment Corp. (Equity Real Estate Investment Trusts (REITs)) | | | 868,403 | |
| | 2,500 | | | East Japan Railway Co. (Road & Rail) | | | 226,952 | |
| | 2,206 | | | Invincible Investment Corp. (Equity Real Estate Investment Trusts (REITs)) | | | 1,392,986 | |
| | 11,400 | | | Japan Airport Terminal Co. Ltd. (Transportation Infrastructure) | | | 563,120 | |
| | 1,251 | | | Japan Hotel REIT Investment Corp. (Equity Real Estate Investment Trusts (REITs)) | | | 1,039,121 | |
| | 298 | | | Japan Real Estate Investment Corp. (Equity Real Estate Investment Trusts (REITs)) | | | 2,034,090 | |
| | 318 | | | Kenedix Office Investment Corp. (Equity Real Estate Investment Trusts (REITs)) | | | 2,491,231 | |
| | 433 | | | Kenedix Retail REIT Corp. (Equity Real Estate Investment Trusts (REITs)) | | | 1,193,266 | |
| | |
|
| Common Stocks – (continued) | |
| Japan – (continued) | |
| | 1,259 | | | LaSalle Logiport REIT (Equity Real Estate Investment Trusts (REITs)) | | | 1,874,181 | |
| | 132,167 | | | Mitsubishi Estate Co. Ltd. (Real Estate Management & Development) | | | 2,566,071 | |
| | 284,468 | | | Mitsui Fudosan Co. Ltd. (Real Estate Management & Development) | | | 7,277,497 | |
| | 251 | | | Nippon Building Fund, Inc. (Equity Real Estate Investment Trusts (REITs)) | | | 1,904,238 | |
| | 1,319 | | | Orix JREIT, Inc. (Equity Real Estate Investment Trusts (REITs)) | | | 2,982,414 | |
| | 71,543 | | | Sumitomo Realty & Development Co. Ltd. (Real Estate Management & Development) | | | 2,596,885 | |
| | 92,100 | | | Tokyo Gas Co. Ltd. (Gas Utilities) | | | 2,248,255 | |
| | 229,000 | | | Tokyu Fudosan Holdings Corp. (Real Estate Management & Development) | | | 1,518,934 | |
| | 11,900 | | | West Japan Railway Co. (Road & Rail) | | | 1,033,995 | |
| | | | | | | | |
| | | | | | | 35,056,803 | |
| | |
| Luxembourg – 0.1% | |
| | 31,631 | | | SES SA (Media) | | | 613,164 | |
| | |
| Mexico – 0.4% | |
| | 98,137 | | | Grupo Aeroportuario del Pacifico SAB de CV Class B (Transportation Infrastructure) | | | 1,028,891 | |
| | 205,257 | | | Infraestructura Energetica Nova SAB de CV* (Gas Utilities) | | | 907,286 | |
| | | | | | | | |
| | | | | | | 1,936,177 | |
| | |
| Netherlands – 1.0% | |
| | 29,728 | | | InterXion Holding NV* (IT Services) | | | 2,622,604 | |
| | 31,039 | | | Koninklijke Vopak NV (Oil, Gas & Consumable Fuels) | | | 1,705,148 | |
| | | | | | | | |
| | | | | | | 4,327,752 | |
| | |
| New Zealand – 0.2% | |
| | 148,740 | | | Auckland International Airport Ltd. (Transportation Infrastructure) | | | 886,464 | |
| | |
| Singapore – 1.6% | |
| | 903,200 | | | CapitaLand Ltd. (Real Estate Management & Development) | | | 2,387,358 | |
| | 42,071 | | | City Developments Ltd. (Real Estate Management & Development) | | | 333,168 | |
| | 573,961 | | | Frasers Centrepoint Trust (Equity Real Estate Investment Trusts (REITs)) | | | 1,159,913 | |
| | 1,492,570 | | | Frasers Logistics & Industrial Trust (Equity Real Estate Investment Trusts (REITs)) | | | 1,381,345 | |
| | 1,120,148 | | | Keppel REIT (Equity Real Estate Investment Trusts (REITs)) | | | 995,716 | |
| | 900,520 | | | Mapletree Logistics Trust (Equity Real Estate Investment Trusts (REITs)) | | | 1,111,516 | |
| | | | | | | | |
| | | | | | | 7,369,016 | |
| | |
| | |
| 76 | | The accompanying notes are an integral part of these financial statements. |
GOLDMAN SACHS MULTI-MANAGER REAL ASSETS STRATEGY FUND
| | | | | | | | |
Shares | | | Description | | Value | |
|
| Common Stocks – (continued) | |
| Spain – 2.5% | |
| | 71,485 | | | Cellnex Telecom SA*(a) (Diversified Telecommunication Services) | | $ | 3,084,494 | |
| | 156,223 | | | Ferrovial SA (Construction & Engineering) | | | 4,609,076 | |
| | 149,636 | | | Iberdrola SA (Electric Utilities) | | | 1,538,108 | |
| | 74,818 | | | Inmobiliaria Colonial Socimi SA (Equity Real Estate Investment Trusts (REITs)) | | | 966,823 | |
| | 79,400 | | | Merlin Properties Socimi SA (Equity Real Estate Investment Trusts (REITs)) | | | 1,168,833 | |
| | | | | | | | |
| | | | | | | 11,367,334 | |
| | |
| Sweden – 0.6% | |
| | 36,715 | | | Atrium Ljungberg AB Class B (Real Estate Management & Development) | | | 730,825 | |
| | 85,478 | | | Fabege AB (Real Estate Management & Development) | | | 1,276,567 | |
| | 36,613 | | | Hufvudstaden AB Class A (Real Estate Management & Development) | | | 612,686 | |
| | | | | | | | |
| | | | | | | 2,620,078 | |
| | |
| Switzerland – 0.9% | |
| | 7,658 | | | Flughafen Zurich AG (Transportation Infrastructure) | | | 1,379,911 | |
| | 18,380 | | | PSP Swiss Property AG (Real Estate Management & Development) | | | 2,432,868 | |
| | | | | | | | |
| | | | | | | 3,812,779 | |
| | |
| United Kingdom – 5.1% | |
| | 44,649 | | | Big Yellow Group PLC (Equity Real Estate Investment Trusts (REITs)) | | | 660,794 | |
| | 361,200 | | | Capital & Counties Properties PLC (Real Estate Management & Development) | | | 1,193,818 | |
| | 18,215 | | | Derwent London PLC (Equity Real Estate Investment Trusts (REITs)) | | | 837,615 | |
| | 54,502 | | | Great Portland Estates PLC (Equity Real Estate Investment Trusts (REITs)) | | | 556,039 | |
| | 213,418 | | | Land Securities Group PLC (Equity Real Estate Investment Trusts (REITs)) | | | 2,599,541 | |
| | 376,023 | | | National Grid PLC (Multi-Utilities) | | | 4,396,567 | |
| | 89,254 | | | Primary Health Properties PLC (Equity Real Estate Investment Trusts (REITs)) | | | 163,480 | |
| | 209,777 | | | Segro PLC (Equity Real Estate Investment Trusts (REITs)) | | | 2,294,815 | |
| | 101,355 | | | Severn Trent PLC (Water Utilities) | | | 2,960,594 | |
| | 374,377 | | | Tritax Big Box REIT PLC (Equity Real Estate Investment Trusts (REITs)) | | | 729,188 | |
| | 588,684 | | | Tritax EuroBox PLC(a) (Equity Real Estate Investment Trusts (REITs)) | | | 705,801 | |
| | 170,165 | | | UNITE Group PLC (Equity Real Estate Investment Trusts (REITs)) | | | 2,478,398 | |
| | 310,902 | | | United Utilities Group PLC (Water Utilities) | | | 3,510,586 | |
| | | | | | | | |
| | | | | | | 23,087,236 | |
| | |
|
| Common Stocks – (continued) | |
| United States – 50.9% | |
| | 47,290 | | | Alliant Energy Corp. (Electric Utilities) | | | 2,522,449 | |
| | 49,773 | | | American Assets Trust, Inc. (Equity Real Estate Investment Trusts (REITs)) | | | 2,436,886 | |
| | 28,100 | | | American Campus Communities, Inc. (Equity Real Estate Investment Trusts (REITs)) | | | 1,404,438 | |
| | 67,433 | | | American Tower Corp. (Equity Real Estate Investment Trusts (REITs)) | | | 14,705,789 | |
| | 40,705 | | | American Water Works Co., Inc. (Water Utilities) | | | 5,017,705 | |
| | 148,455 | | | Americold Realty Trust (Equity Real Estate Investment Trusts (REITs)) | | | 5,951,561 | |
| | 18,508 | | | Antero Midstream Corp. (Oil, Gas & Consumable Fuels) | | | 119,192 | |
| | 39,419 | | | Apartment Investment & Management Co. Class A (Equity Real Estate Investment Trusts (REITs)) | | | 2,163,315 | |
| | 95,036 | | | Apple Hospitality REIT, Inc. (Equity Real Estate Investment Trusts (REITs)) | | | 1,566,193 | |
| | 29,695 | | | Atmos Energy Corp. (Gas Utilities) | | | 3,340,094 | |
| | 54,181 | | | AvalonBay Communities, Inc. (Equity Real Estate Investment Trusts (REITs)) | | | 11,793,036 | |
| | 68,300 | | | Brixmor Property Group, Inc. (Equity Real Estate Investment Trusts (REITs)) | | | 1,503,966 | |
| | 32,789 | | | Camden Property Trust (Equity Real Estate Investment Trusts (REITs)) | | | 3,750,078 | |
| | 84,273 | | | CareTrust REIT, Inc. (Equity Real Estate Investment Trusts (REITs)) | | | 2,042,778 | |
| | 52,938 | | | CenterPoint Energy, Inc. (Multi-Utilities) | | | 1,538,908 | |
| | 112,547 | | | Cheniere Energy, Inc.* (Oil, Gas & Consumable Fuels) | | | 6,927,268 | |
| | 55,855 | | | Cousins Properties, Inc. (Equity Real Estate Investment Trusts (REITs)) | | | 2,241,461 | |
| | 71,382 | | | Crown Castle International Corp. (Equity Real Estate Investment Trusts (REITs)) | | | 9,907,108 | |
| | 37,800 | | | CSX Corp. (Road & Rail) | | | 2,656,206 | |
| | 53,700 | | | CubeSmart (Equity Real Estate Investment Trusts (REITs)) | | | 1,702,290 | |
| | 33,937 | | | CyrusOne, Inc. (Equity Real Estate Investment Trusts (REITs)) | | | 2,419,029 | |
| | 28,800 | | | Digital Realty Trust, Inc. (Equity Real Estate Investment Trusts (REITs)) | | | 3,658,752 | |
| | 53,406 | | | Duke Realty Corp. (Equity Real Estate Investment Trusts (REITs)) | | | 1,876,687 | |
| | 81,432 | | | Edison International (Electric Utilities) | | | 5,122,073 | |
| | 92,381 | | | Energy Transfer LP (Oil, Gas & Consumable Fuels) | | | 1,163,077 | |
| | 74,408 | | | Enterprise Products Partners LP (Oil, Gas & Consumable Fuels) | | | 1,936,840 | |
| | 1,376 | | | Equinix, Inc. (Equity Real Estate Investment Trusts (REITs)) | | | 779,889 | |
| | 106,180 | | | Equity LifeStyle Properties, Inc. (Equity Real Estate Investment Trusts (REITs)) | | | 7,426,229 | |
| | |
| | |
| The accompanying notes are an integral part of these financial statements. | | 77 |
GOLDMAN SACHS MULTI-MANAGER REAL ASSETS STRATEGY FUND
Schedule of Investments(continued)
October 31, 2019
| | | | | | | | |
Shares | | | Description | | Value | |
|
| Common Stocks – (continued) | |
| United States – (continued) | |
| | 26,629 | | | Equity Residential (Equity Real Estate Investment Trusts (REITs)) | | $ | 2,360,927 | |
| | 90,745 | | | Essential Properties Realty Trust, Inc. (Equity Real Estate Investment Trusts (REITs)) | | | 2,328,517 | |
| | 30,074 | | | Eversource Energy (Electric Utilities) | | | 2,518,397 | |
| | 26,277 | | | Extra Space Storage, Inc. (Equity Real Estate Investment Trusts (REITs)) | | | 2,950,119 | |
| | 16,800 | | | Federal Realty Investment Trust (Equity Real Estate Investment Trusts (REITs)) | | | 2,284,968 | |
| | 25,845 | | | First Industrial Realty Trust, Inc. (Equity Real Estate Investment Trusts (REITs)) | | | 1,088,333 | |
| | 112,046 | | | FirstEnergy Corp. (Electric Utilities) | | | 5,414,063 | |
| | 60,464 | | | Healthcare Trust of America, Inc. Class A (Equity Real Estate Investment Trusts (REITs)) | | | 1,874,384 | |
| | 73,021 | | | Healthpeak Properties, Inc. (Equity Real Estate Investment Trusts (REITs)) | | | 2,747,050 | |
| | 170,831 | | | Hudson Pacific Properties, Inc. (Equity Real Estate Investment Trusts (REITs)) | | | 6,136,250 | |
| | 136,000 | | | Invitation Homes, Inc. (Equity Real Estate Investment Trusts (REITs)) | | | 4,187,440 | |
| | 61,571 | | | JBG SMITH Properties (Equity Real Estate Investment Trusts (REITs)) | | | 2,478,848 | |
| | 15,823 | | | Kilroy Realty Corp. (Equity Real Estate Investment Trusts (REITs)) | | | 1,328,024 | |
| | 153,808 | | | Medical Properties Trust, Inc. (Equity Real Estate Investment Trusts (REITs)) | | | 3,188,440 | |
| | 65,811 | | | MGM Growth Properties LLC Class A (Equity Real Estate Investment Trusts (REITs)) | | | 2,053,961 | |
| | 110,209 | | | NiSource, Inc. (Multi-Utilities) | | | 3,090,260 | |
| | 34,056 | | | NorthWestern Corp. (Multi-Utilities) | | | 2,469,741 | |
| | 21,544 | | | ONE Gas, Inc. (Gas Utilities) | | | 2,000,145 | |
| | 18,350 | | | ONEOK, Inc. (Oil, Gas & Consumable Fuels) | | | 1,281,380 | |
| | 319,100 | | | Paramount Group, Inc. (Equity Real Estate Investment Trusts (REITs)) | | | 4,298,277 | |
| | 102,829 | | | Plains GP Holdings LP Class A* (Oil, Gas & Consumable Fuels) | | | 1,908,506 | |
| | 170,174 | | | Prologis, Inc. (Equity Real Estate Investment Trusts (REITs)) | | | 14,934,470 | |
| | 28,711 | | | Realty Income Corp. (Equity Real Estate Investment Trusts (REITs)) | | | 2,348,273 | |
| | 42,555 | | | Rexford Industrial Realty, Inc. (Equity Real Estate Investment Trusts (REITs)) | | | 2,046,470 | |
| | 32,773 | | | SBA Communications Corp. (Equity Real Estate Investment Trusts (REITs)) | | | 7,886,822 | |
| | 34,846 | | | Sempra Energy (Multi-Utilities) | | | 5,035,595 | |
| | 23,796 | | | Simon Property Group, Inc. (Equity Real Estate Investment Trusts (REITs)) | | | 3,585,581 | |
| | 43,222 | | | Spirit Realty Capital, Inc. (Equity Real Estate Investment Trusts (REITs)) | | | 2,154,184 | |
| | 101,192 | | | STAG Industrial, Inc. (Equity Real Estate Investment Trusts (REITs)) | | | 3,141,000 | |
| | |
|
| Common Stocks – (continued) | |
| United States – (continued) | |
| | 43,745 | | | STORE Capital Corp. (Equity Real Estate Investment Trusts (REITs)) | | | 1,771,672 | |
| | 44,694 | | | Targa Resources Corp. (Oil, Gas & Consumable Fuels) | | | 1,737,703 | |
| | 73,900 | | | The Macerich Co. (Equity Real Estate Investment Trusts (REITs)) | | | 2,032,250 | |
| | 325,415 | | | The Williams Cos., Inc. (Oil, Gas & Consumable Fuels) | | | 7,260,009 | |
| | 70,488 | | | Ventas, Inc. (Equity Real Estate Investment Trusts (REITs)) | | | 4,588,769 | |
| | 64,500 | | | VICI Properties, Inc. (Equity Real Estate Investment Trusts (REITs)) | | | 1,518,975 | |
| | 37,255 | | | Welltower, Inc. (Equity Real Estate Investment Trusts (REITs)) | | | 3,378,656 | |
| | | | | | | | |
| | | | | | | 229,081,756 | |
| | |
| | TOTAL COMMON STOCKS | |
| | (Cost $381,415,448) | | | 439,780,393 | |
| | |
| | |
| Shares | | | Dividend
Rate | | Value | |
|
| Investment Company(b) – 1.8% | |
| Goldman Sachs Financial Square Government Fund –
Institutional Shares |
|
| | 8,199,800 | | | 1.701% | | $ | 8,199,800 | |
| | (Cost $8,199,800) | |
| | |
| | TOTAL INVESTMENTS – 99.6% | |
| | (Cost $389,615,248) | | | 447,980,193 | |
| | |
| OTHER ASSETS IN EXCESS OF
LIABILITIES – 0.4% | | | 1,957,947 | |
| | |
| | NET ASSETS – 100.0% | | $ | 449,938,140 | |
| | |
| | |
|
| The percentage shown for each investment category reflects the value of investments in that category as a percentage of net assets. |
| |
* | | Non-income producing security. |
| |
(a) | | Exempt from registration under Rule 144A of the Securities Act of 1933. |
| |
(b) | | Represents an affiliated issuer. |
| | |
|
Investment Abbreviations: |
GP | | —General Partnership |
LLC | | —Limited Liability Company |
LP | | —Limited Partnership |
PLC | | —Public Limited Company |
REIT | | —Real Estate Investment Trust |
|
| | |
| 78 | | The accompanying notes are an integral part of these financial statements. |
GOLDMAN SACHS STRATEGIC MULTI-ASSET CLASS FUNDS
Statements of Assets and Liabilities
October 31, 2019
| | | | | | | | | | | | | | |
| | | | | Multi-Manager
Global Equity
Fund | | | Multi-Manager
Non-Core Fixed
Income Fund | | | Multi-Manager
Real Assets
Strategy Fund | |
| | Assets: | | | | | | | | | | | | |
| | | | |
| | Investments, at value (cost $362,954,001, $772,757,587 and $381,415,448, respectively) | | | $412,835,437 | | | | $774,663,949 | | | | $439,780,393 | |
| | | | |
| | Foreign currencies, at value (cost $270,218, $0 and $214,561, respectively) | | | 272,883 | | | | — | | | | 214,573 | |
| | | | |
| | Investments of affiliated issuers, at value (cost $48,365,407, $68,210,674 and $8,199,800, respectively) | | | 48,365,407 | | | | 68,210,674 | | | | 8,199,800 | |
| | | | |
| | Cash | | | 2,337,555 | | | | 4,403,940 | | | | 2,630,044 | |
| | | | |
| | Unrealized gain on forward foreign currency exchange contracts | | | 888,832 | | | | 1,584,077 | | | | — | |
| | | | |
| | Variation margin on futures contracts | | | — | | | | 8,673 | | | | — | |
| | | | |
| | Receivables: | | | | | | | | | | | | |
| | | | |
| | Collateral on certain derivative contracts(a) | | | 4,029,720 | | | | 777,150 | | | | — | |
| | | | |
| | Investments sold | | | 1,302,948 | | | | 45,139,971 | | | | 1,572,148 | |
| | | | |
| | Dividends and interest | | | 710,176 | | | | 10,226,797 | | | | 601,258 | |
| | | | |
| | Foreign tax reclaims | | | 339,572 | | | | 124,779 | | | | 61,893 | |
| | | | |
| | Reimbursement from investment adviser | | | 304,051 | | | | — | | | | — | |
| | | | |
| | Investments sold on an extended settlement basis | | | 3,978 | | | | 4,158,870 | | | | 37,018 | |
| | | | |
| | Other assets | | | 22,426 | | | | 19,539 | | | | 17,893 | |
| | | | |
| | Total assets | | | 471,412,985 | | | | 909,318,419 | | | | 453,115,020 | |
| | | | | | | | | | | | | | |
| | Liabilities: | | | | | | | | | | | | |
| | | | |
| | Unrealized loss on forward foreign currency exchange contracts | | | 1,582,442 | | | | 1,080,462 | | | | — | |
| | | | |
| | Variation margin on futures contracts | | | 180,020 | | | | — | | | | — | |
| | | | |
| | Foreign currency overdraft, at value (identified cost $0, $966,717 and $0, respectively) | | | — | | | | 963,664 | | | | — | |
| | | | |
| | Unrealized loss on swap contracts | | | — | | | | 3,021 | | | | — | |
| | | | |
| | Payables: | | | | | | | | | | | | |
| | | | |
| | Fund shares redeemed | | | 4,525,000 | | | | 63,250,000 | | | | 450,000 | |
| | | | |
| | Investments purchased | | | 1,817,233 | | | | 12,621,285 | | | | 2,144,932 | |
| | | | |
| | Management fees | | | 148,233 | | | | 304,773 | | | | 213,764 | |
| | | | |
| | Investments purchased on an extended settlement basis | | | 17,111 | | | | 10,532,989 | | | | 123,991 | |
| | | | |
| | Transfer agency fees | | | 8,015 | | | | 15,100 | | | | 7,678 | |
| | | | |
| | Upfront payments received on swap contracts | | | — | | | | 22,475 | | | | — | |
| | | | |
| | Accrued expenses and other liabilities | | | 693,751 | | | | 360,788 | | | | 236,515 | |
| | | | |
| | Total liabilities | | | 8,971,805 | | | | 89,154,557 | | | | 3,176,880 | |
| | | | | | | | | | | | | | |
| | Net Assets: | | | | | | | | | | | | |
| | | | |
| | Paid-in capital | | | 399,198,338 | | | | 835,720,415 | | | | 384,981,295 | |
| | | | |
| | Total distributable earnings (loss) | | | 63,242,842 | | | | (15,556,553 | ) | | | 64,956,845 | |
| | | | |
| | NET ASSETS | | | $462,441,180 | | | | $820,163,862 | | | | $449,938,140 | |
| | | | |
| | Shares Outstanding $0.001 par value (unlimited number of shares authorized): | | | 42,159,505 | | | | 90,555,557 | | | | 41,738,204 | |
| | | | |
| | Net asset value, offering and redemption price per share: | | | $10.97 | | | | $9.06 | | | | $10.78 | |
| | (a) | | Segregated for initial margin and/or collateral as follows: |
| | | | | | | | | | | | |
| Fund | | Futures | | | Forwards | | | Swaps | |
Multi-Manager Global Equity Fund | | $ | 2,079,720 | | | $ | 1,950,000 | | | $ | — | |
| | | |
Multi-ManagerNon-Core Fixed Income Fund | | | 7,150 | | | | 550,000 | | | | 220,000 | |
| | |
| The accompanying notes are an integral part of these financial statements. | | 79 |
GOLDMAN SACHS STRATEGIC MULTI-ASSET CLASS FUNDS
Statements of Operations
For the Fiscal Year Ended October 31, 2019
| | | | | | | | | | | | | | |
| | | | | Multi-Manager
Global Equity
Fund | | | Multi-Manager
Non-Core Fixed
Income Fund | | | Multi-Manager
Real Assets
Strategy Fund | |
| | Investment income: | |
| | | | |
| | Dividends — unaffiliated issuers (net of foreign withholding taxes of $854,102, $2,947 and $639,374, respectively) | | $ | 14,779,501 | | | $ | 395,058 | | | $ | 12,595,043 | |
| | | | |
| | Dividends — affiliated issuers | | | 605,889 | | | | 1,319,700 | | | | 222,565 | |
| | | | |
| | Interest | | | — | | | | 51,014,871 | | | | — | |
| | | | |
| | Total investment income | | | 15,385,390 | | | | 52,729,629 | | | | 12,817,608 | |
| | | | | | | | | | | | | | |
| | Expenses: | |
| | | | |
| | Management fees | | | 6,264,995 | | | | 6,771,779 | | | | 4,224,791 | |
| | | | |
| | Custody, accounting and administrative services | | | 1,662,594 | | | | 929,528 | | | | 573,460 | |
| | | | |
| | Professional fees | | | 287,611 | | | | 280,284 | | | | 202,800 | |
| | | | |
| | Transfer Agency fees | | | 121,650 | | | | 159,336 | | | | 84,496 | |
| | | | |
| | Printing and mailing costs | | | 44,465 | | | | 53,543 | | | | 41,257 | |
| | | | |
| | Trustee fees | | | 44,127 | | | | 49,467 | | | | 38,674 | |
| | | | |
| | Registration fees | | | 39,864 | | | | 51,622 | | | | 31,510 | |
| | | | |
| | Prime broker fees | | | 4,738 | | | | 1,759 | | | | — | |
| | | | |
| | Other | | | 150,850 | | | | 97,789 | | | | 36,861 | |
| | | | |
| | Total expenses | | | 8,620,894 | | | | 8,395,107 | | | | 5,233,849 | |
| | | | |
| | Less — expense reductions | | | (4,228,522 | ) | | | (3,545,613 | ) | | | (1,826,234 | ) |
| | | | |
| | Net expenses | | | 4,392,372 | | | | 4,849,494 | | | | 3,407,615 | |
| | | | |
| | NET INVESTMENT INCOME | | | 10,993,018 | | | | 47,880,135 | | | | 9,409,993 | |
| | | | | | | | | | | | | | |
| | Realized and unrealized gain (loss): | |
| | | | |
| | Net realized gain (loss) from: | | | | | | | | | | | | |
| | | | |
| | Investments — unaffiliated issuers (including commission recapture of $2,583, $0 and $0, respectively) | | | 4,180,765 | | | | (2,725,377 | ) | | | 8,752,338 | |
| | | | |
| | Purchased options | | | — | | | | (214,725 | ) | | | — | |
| | | | |
| | Futures contracts | | | 1,751,201 | | | | (31,703 | ) | | | — | |
| | | | |
| | Written options | | | — | | | | 33,677 | | | | — | |
| | | | |
| | Swap contracts | | | — | | | | (68,100 | ) | | | — | |
| | | | |
| | Forward foreign currency exchange contracts | | | 4,949,302 | | | | (3,538,385 | ) | | | (15,663 | ) |
| | | | |
| | Foreign currency transactions | | | 241,851 | | | | (421,741 | ) | | | (166,215 | ) |
| | | | |
| | Net change in unrealized gain (loss) on: | | | | | | | | | | | | |
| | | | |
| | Investments — unaffiliated issuers | | | 50,787,833 | | | | 27,402,175 | | | | 57,794,259 | |
| | | | |
| | Purchased options | | | — | | | | (78 | ) | | | — | |
| | | | |
| | Futures contracts | | | 597,711 | | | | (3,220 | ) | | | — | |
| | | | |
| | Swap contracts | | | — | | | | (87,771 | ) | | | — | |
| | | | |
| | Forward foreign currency exchange contracts | | | (3,074,726 | ) | | | 1,138,057 | | | | (46 | ) |
| | | | |
| | Foreign currency translation | | | 26,990 | | | | 66,666 | | | | 5,200 | |
| | | | |
| | Net realized and unrealized gain | | | 59,460,927 | | | | 21,549,475 | | | | 66,369,873 | |
| | | | |
| | NET INCREASE IN NET ASSETS RESULTING FROM OPERATIONS | | $ | 70,453,945 | | | $ | 69,429,610 | | | $ | 75,779,866 | |
| | |
| 80 | | The accompanying notes are an integral part of these financial statements. |
GOLDMAN SACHS STRATEGIC MULTI-ASSET CLASS FUNDS
Statements of Changes in Net Assets
| | | | | | | | | | | | | | | | | | | | | | |
| | | | | Multi-Manager Global Equity Fund | | | | | | Multi-Manager Non-Core Fixed Income Fund | |
| | | | | For the Fiscal
Year Ended
October 31, 2019 | | | For the Fiscal
Year Ended
October 31, 2018 | | | | | | For the Fiscal
Year Ended
October 31, 2019 | | | For the Fiscal
Year Ended
October 31, 2018 | |
| | From operations: | | | | | | | | | | | | | |
| | | | | | |
| | Net investment income | | $ | 10,993,018 | | | $ | 7,226,072 | | | | | | | $ | 47,880,135 | | | $ | 30,636,147 | |
| | | | | | |
| | Net realized gain (loss) | | | 11,123,119 | | | | 36,630,124 | | | | | | | | (6,966,354 | ) | | | (20,549,334 | ) |
| | | | | | |
| | Net change in unrealized gain (loss) | | | 48,337,808 | | | | (72,126,124 | ) | | | | | | | 28,515,829 | | | | (28,794,618 | ) |
| | | | | | |
| | Net increase (decrease) in net assets resulting from operations | | | 70,453,945 | | | | (28,269,928 | ) | | | | | | | 69,429,610 | | | | (18,707,805 | ) |
| | | | | | | | | | | | | | | | | | | | | | |
| | Distributions to shareholders: | | | | | | | | | | | | | |
| | | | | | |
| | From distributable earnings | | | (45,106,144 | ) | | | (16,134,908 | ) | | | | | | | (44,128,245 | ) | | | (23,374,598 | ) |
| | | | | | |
| | From return or capital | | | — | | | | — | | | | | | | | (3,930,447 | ) | | | (7,036,890 | ) |
| | | | | | |
| | Total distributions to shareholders | | | (45,106,144 | ) | | | (16,134,908 | ) | | | | | | | (48,058,692 | ) | | | (30,411,488 | ) |
| | | | | | | | | | | | | | | | | | | | | | |
| | From share transactions: | | | | | | | | | | | | | |
| | | | | | |
| | Proceeds from sales of shares | | | 112,385,000 | | | | 224,350,010 | | | | | | | | 463,878,772 | | | | 343,095,015 | |
| | | | | | |
| | Reinvestment of distributions | | | 45,106,144 | | | | 16,134,908 | | | | | | | | 48,005,796 | | | | 30,411,488 | |
| | | | | | |
| | Cost of shares redeemed | | | (353,974,521 | ) | | | (53,000,010 | ) | | | | | | | (396,921,299 | ) | | | (42,240,015 | ) |
| | | | | | |
| | Net increase (decrease) in net assets resulting from share transactions | | | (196,483,377 | ) | | | 187,484,908 | | | | | | | | 114,963,269 | | | | 331,266,488 | |
| | | | | | |
| | TOTAL INCREASE (DECREASE) | | | (171,135,576 | ) | | | 143,080,072 | | | | | | | | 136,334,187 | | | | 282,147,195 | |
| | | | | | | | | | | | | | | | | | | | | | |
| | Net assets: | | | | | | | | | | | | | |
| | | | | | |
| | Beginning of year | | | 633,576,756 | | | | 490,496,684 | | | | | | | | 683,829,675 | | | | 401,682,480 | |
| | | | | | |
| | End of year | | $ | 462,441,180 | | | $ | 633,576,756 | | | | | | | $ | 820,163,862 | | | $ | 683,829,675 | |
| | |
| The accompanying notes are an integral part of these financial statements. | | 81 |
GOLDMAN SACHS STRATEGIC MULTI-ASSET CLASS FUNDS
Statements of Changes in Net Assets(continued)
| | | | | | | | | | |
| | | | | Multi-Manager Real Assets Strategy Fund | |
| | | | | For the Fiscal
Year Ended
October 31, 2019 | | | For the Fiscal
Year Ended
October 31, 2018 | |
| | From operations: | | | | | | | | |
| | | |
| | Net investment income | | $ | 9,409,993 | | | $ | 6,654,654 | |
| | | |
| | Net realized gain (loss) | | | 8,570,460 | | | | (494,269 | ) |
| | | |
| | Net change in unrealized gain (loss) | | | 57,799,413 | | | | (16,748,719 | ) |
| | | |
| | Net increase (decrease) in net assets resulting from operations | | | 75,779,866 | | | | (10,588,334 | ) |
| | | | | | | | | | |
| | Distributions to shareholders: | | | | | | | | |
| | | |
| | From distributable earnings | | | (10,439,193 | ) | | | (5,483,013 | ) |
| | | | | | | | | | |
| | From share transactions: | | | | | | | | |
| | | |
| | Proceeds from sales of shares | | | 112,080,000 | | | | 272,441,005 | |
| | | |
| | Reinvestment of distributions | | | 10,439,193 | | | | 5,483,013 | |
| | | |
| | Cost of shares redeemed | | | (124,929,890 | ) | | | (87,285,114 | ) |
| | | |
| | Net increase (decrease) in net assets resulting from share transactions | | | (2,410,697 | ) | | | 190,638,904 | |
| | | |
| | TOTAL INCREASE (DECREASE) | | | 62,929,976 | | | | 174,567,557 | |
| | | | | | | | | | |
| | Net assets: | | | | | | | | |
| | | |
| | Beginning of year | | | 387,008,164 | | | | 212,440,607 | |
| | | |
| | End of year | | $ | 449,938,140 | | | $ | 387,008,164 | |
| | |
| 82 | | The accompanying notes are an integral part of these financial statements. |
GOLDMAN SACHS MULTI-MANAGER GLOBAL EQUITY FUND
Financial Highlights
Selected Share Data for a Share Outstanding Throughout Each Year
| | | | | | | | | | | | | | | | | | | | | | |
| | | | | Goldman Sachs Multi-Manager Global Equity Fund | |
| | | | | Class R6 Shares(a) | |
| | | | | Year Ended October 31, | | | For the Period
Ended
October 31, 2015(b) | |
| | | | | 2019 | | | 2018 | | | 2017 | | | 2016 | |
| | Per Share Data | | | | | | | | | | | | | | | | | | | | |
| | | | | | |
| | Net asset value, beginning of period | | $ | 10.62 | | | $ | 11.36 | | | $ | 9.49 | | | $ | 9.46 | | | $ | 10.00 | |
| | | | | | |
| | Net investment income(c) | | | 0.19 | | | | 0.15 | | | | 0.11 | | | | 0.11 | | | | 0.02 | |
| | | | | | |
| | Net realized and unrealized gain (loss) | | | 0.91 | | | | (0.52 | ) | | | 1.91 | | | | (0.04 | ) | | | (0.56 | ) |
| | | | | | |
| | Total from investment operations | | | 1.10 | | | | (0.37 | ) | | | 2.02 | | | | 0.07 | | | | (0.54 | ) |
| | | | | | |
| | Distributions to shareholders from net investment income | | | (0.19 | ) | | | (0.15 | ) | | | (0.15 | ) | | | (0.04 | ) | | | — | |
| | | | | | |
| | Distributions to shareholders from net realized gains | | | (0.56 | ) | | | (0.22 | ) | | | — | | | | — | | | | — | |
| | | | | | |
| | Total distributions | | | (0.75 | ) | | | (0.37 | ) | | | (0.15 | ) | | | (0.04 | ) | | | — | |
| | | | | | |
| | Net asset value, end of period | | $ | 10.97 | | | $ | 10.62 | | | $ | 11.36 | | | $ | 9.49 | | | $ | 9.46 | |
| | | | | | |
| | Total return(d) | | | 11.39 | % | | | (3.43 | )% | | | 21.63 | % | | | 0.74 | % | | | (5.40 | )% |
| | | | | | |
| | Net assets, end of period (in 000s) | | $ | 462,441 | | | $ | 633,577 | | | $ | 490,497 | | | $ | 605,053 | | | $ | 439,155 | |
| | | | | | |
| | Ratio of net expenses to average net assets | | | 0.72 | % | | | 0.80 | % | | | 0.85 | % | | | 0.85 | % | | | 0.85 | %(e) |
| | | | | | |
| | Ratio of total expenses to average net assets | | | 1.42 | % | | | 1.39 | % | | | 1.47 | % | | | 1.31 | % | | | 1.34 | %(e) |
| | | | | | |
| | Ratio of net investment income to average net assets | | | 1.81 | % | | | 1.29 | % | | | 1.03 | % | | | 1.19 | % | | | 0.74 | %(e) |
| | | | | | |
| | Portfolio turnover rate(f) | | | 91 | % | | | 76 | % | | | 88 | % | | | 47 | % | | | 10 | % |
| | (a) | | Effective January 16, 2018, the Institutional Shares were redesignated as Class R6 Shares. |
| | (b) | | Commenced operations on June 24, 2015. |
| | (c) | | Calculated based on the average shares outstanding methodology. |
| | (d) | | Assumes investment at the NAV at the beginning of the period, reinvestment of all dividends and distributions, a complete redemption of the investment at the NAV at the end of the period and no sales or redemption charges (if any). Total returns would be reduced if a sales or redemption charge was taken into account. Returns do not reflect the impact of taxes to shareholders relating to Fund distributions or the redemption of Fund shares. Total returns for periods less than one full year are not annualized. |
| | (f) | | The Fund’s portfolio turnover rate is calculated in accordance with regulatory requirements, without regard to transactions involving short term investments and certain derivatives. If such transactions were included, the Fund’s portfolio turnover rate may be higher. |
| | |
| The accompanying notes are an integral part of these financial statements. | | 83 |
GOLDMAN SACHS MULTI-MANAGERNON-CORE FIXED INCOME FUND
Financial Highlights(continued)
Selected Share Data for a Share Outstanding Throughout Each Year
| | | | | | | | | | | | | | | | | | | | | | |
| | | | | Goldman Sachs Multi-ManagerNon-Core Fixed Income Fund | |
| | | | | Class R6 Shares(a) | |
| | | | | Year Ended October 31, | | | For the Period
Ended October 31, 2015(b) | |
| | | | | 2019 | | | 2018 | | | 2017 | | | 2016 | |
| | Per Share Data | | | | | | | | | | | | | | | | | | | | |
| | | | | | |
| | Net asset value, beginning of period | | $ | 8.83 | | | $ | 9.60 | | | $ | 9.60 | | | $ | 9.37 | | | $ | 10.00 | |
| | | | | | |
| | Net investment income(c) | | | 0.54 | | | | 0.51 | | | | 0.50 | | | | 0.46 | | | | 0.25 | |
| | | | | | |
| | Net realized and unrealized gain (loss) | | | 0.31 | | | | (0.77 | ) | | | — | | | | 0.23 | | | | (0.63 | ) |
| | | | | | |
| | Total from investment operations | | | 0.85 | | | | (0.26 | ) | | | 0.50 | | | | 0.69 | | | | (0.38 | ) |
| | | | | | |
| | Distributions to shareholders from net investment income | | | (0.55 | ) | | | (0.39 | ) | | | (0.47 | ) | | | (0.43 | ) | | | (0.24 | ) |
| | | | | | |
| | Distributions to shareholders from return of capital | | | (0.07 | ) | | | (0.12 | ) | | | (0.03 | ) | | | (0.03 | ) | | | (0.01 | ) |
| | | | | | |
| | Total distributions | | | (0.62 | ) | | | (0.51 | ) | | | (0.50 | ) | | | (0.46 | ) | | | (0.25 | ) |
| | | | | | |
| | Net asset value, end of period | | $ | 9.06 | | | $ | 8.83 | | | $ | 9.60 | | | $ | 9.60 | | | $ | 9.37 | |
| | | | | | |
| | Total return(d) | | | 9.03 | % | | | (2.84 | )% | | | 5.38 | % | | | 7.54 | % | | | (3.84 | )% |
| | | | | | |
| | Net assets, end of period (in 000s) | | $ | 820,164 | | | $ | 683,830 | | | $ | 401,682 | | | $ | 304,046 | | | $ | 270,687 | |
| | | | | | |
| | Ratio of net expenses to average net assets | | | 0.61 | % | | | 0.70 | % | | | 0.70 | % | | | 0.70 | % | | | 0.70 | %(e) |
| | | | | | |
| | Ratio of total expenses to average net assets | | | 1.05 | % | | | 1.08 | % | | | 1.12 | % | | | 1.20 | % | | | 1.19 | %(e) |
| | | | | | |
| | Ratio of net investment income to average net assets | | | 6.01 | % | | | 5.52 | % | | | 5.26 | % | | | 4.91 | % | | | 4.45 | %(e) |
| | | | | | |
| | Portfolio turnover rate(f) | | | 150 | % | | | 123 | % | | | 152 | % | | | 96 | % | | | 82 | % |
| | (a) | | Effective January 16, 2018, the Institutional Shares were redesignated as Class R6 Shares. |
| | (b) | | Commenced operations March 31, 2015. |
| | (c) | | Calculated based on the average shares outstanding methodology. |
| | (d) | | Assumes investment at the NAV at the beginning of the period, reinvestment of all dividends and distributions, a complete redemption of the investment at the NAV at the end of the period and no sales or redemption charges (if any). Total returns would be reduced if a sales or redemption charge was taken into account. Returns do not reflect the impact of taxes to shareholders relating to Fund distributions or the redemption of Fund shares. Total returns for periods less than one full year are not annualized. |
| | (f) | | The Fund’s portfolio turnover rate is calculated in accordance with regulatory requirements, without regard to transactions involving short term investments and certain derivatives. If such transactions were included, the Fund’s portfolio turnover rate may be higher. |
| | |
| 84 | | The accompanying notes are an integral part of these financial statements. |
GOLDMAN SACHS MULTI-MANAGER REAL ASSETS STRATEGY FUND
Financial Highlights(continued)
Selected Share Data for a Share Outstanding Throughout Each Year
| | | | | | | | | | | | | | | | | | | | | | |
| | | | | Goldman Sachs Multi-Manager Real Assets Strategy Fund | |
| | | | | Class R6 Shares(a) | |
| | | | | Year Ended October 31, | | | For the Period
Ended October 31, 2015(b) | |
| | | | | 2019 | | | 2018 | | | 2017 | | | 2016 | |
| | Per Share Data | | | | | | | | | | | | | | | | | | | | |
| | | | | | |
| | Net asset value, beginning of period | | $ | 9.24 | | | $ | 9.66 | | | $ | 9.17 | | | $ | 9.57 | | | $ | 10.00 | |
| | | | | | |
| | Net investment income(c) | | | 0.22 | | | | 0.23 | (d) | | | 0.20 | | | | 0.18 | | | | 0.02 | |
| | | | | | |
| | Net realized and unrealized gain (loss) | | | 1.57 | | | | (0.41 | ) | | | 0.58 | | | | (0.38 | ) | | | (0.45 | ) |
| | | | | | |
| | Total from investment operations | | | 1.79 | | | | (0.18 | ) | | | 0.78 | | | | (0.20 | ) | | | (0.43 | ) |
| | | | | | |
| | Distributions to shareholders from net investment income | | | (0.20 | ) | | | (0.05 | ) | | | (0.29 | ) | | | (0.20 | ) | | | — | |
| | | | | | |
| | Distributions to shareholder from net realized gains | | | (0.05 | ) | | | (0.19 | ) | | | — | | | | — | | | | — | |
| | | | | | |
| | Total distributions | | | (0.25 | ) | | | (0.24 | ) | | | (0.29 | ) | | | (0.20 | ) | | | — | |
| | | | | | |
| | Net asset value, end of period | | $ | 10.78 | | | $ | 9.24 | | | $ | 9.66 | | | $ | 9.17 | | | $ | 9.57 | |
| | | | | | |
| | Total return(e) | | | 20.04 | % | | | (1.88 | )% | | | 8.65 | % | | | (2.14 | )% | | | (4.30 | )% |
| | | | | | |
| | Net assets, end of period (in 000s) | | $ | 449,938 | | | $ | 387,008 | | | $ | 212,441 | | | $ | 308,375 | | | $ | 197,429 | |
| | | | | | |
| | Ratio of net expenses to average net assets | | | 0.81 | % | | | 0.90 | % | | | 0.90 | % | | | 0.87 | % | | | 0.90 | %(f) |
| | | | | | |
| | Ratio of total expenses to average net assets | | | 1.24 | % | | | 1.32 | % | | | 1.32 | % | | | 1.33 | % | | | 1.42 | %(f) |
| | | | | | |
| | Ratio of net investment income to average net assets | | | 2.23 | % | | | 2.37 | %(d) | | | 2.10 | % | | | 1.96 | % | | | 0.67 | %(f) |
| | | | | | |
| | Portfolio turnover rate(g) | | | 97 | % | | | 86 | % | | | 131 | % | | | 93 | % | | | 35 | % |
| | (a) | | Effective January 16, 2018, the Institutional Shares were redesignated as Class R6 Shares. |
| | (b) | | Commenced operations on June 30, 2015. |
| | (c) | | Calculated based on the average shares outstanding methodology. |
| | (d) | | Reflects income recognized from special dividends which amounted to $0.04 per share and 0.45% of average net assets. |
| | (e) | | Assumes investment at the NAV at the beginning of the period, reinvestment of all dividends and distributions, a complete redemption of the investment at the NAV at the end of the period and no sales or redemption charges (if any). Total returns would be reduced if a sales or redemption charge was taken into account. Returns do not reflect the impact of taxes to shareholders relating to Fund distributions or the redemption of Fund shares. Total returns for periods less than one full year are not annualized. |
| | (g) | | The Fund’s portfolio turnover rate is calculated in accordance with regulatory requirements, without regard to transactions involving short term investments and certain derivatives. If such transactions were included, the Fund’s portfolio turnover rate may be higher. |
| | |
| The accompanying notes are an integral part of these financial statements. | | 85 |
GOLDMAN SACHS STRATEGIC MULTI-ASSET CLASS FUNDS
Notes to Financial Statements
October 31, 2019
Goldman Sachs Trust II (the “Trust”) is a Delaware statutory trust registered under the Investment Company Act of 1940, as amended (the “Act”), as anopen-end management investment company. The following table lists those series of the Trust that are included in this report (collectively, the “Funds” or individually a “Fund”), along with their corresponding share classes and respective diversification status under the Act:
| | | | |
| Fund | | Share Classes Offered | | Diversified/
Non-diversified |
Multi-Manager Global Equity Fund | | Class R6 (formerly Institutional) | | Diversified |
Multi-Manager Non-Core Fixed Income Fund | | Class R6 (formerly Institutional) | | Diversified |
Mutli-Manager Real Assets Strategy Fund | | Class R6 (formerly Institutional) | | Diversified |
Goldman Sachs Asset Management, L.P. (“GSAM”), an affiliate of Goldman Sachs & Co. LLC (“Goldman Sachs”), serves as investment adviser to the Funds pursuant to management agreements (the “Agreement”) with the Trust. As of October 31, 2019, GSAM hadsub-advisory agreements (the“Sub-Advisory Agreements”) for the Multi-Manager Global Equity Fund with Boston Partners Global Investors, Inc., Causeway Capital Management LLC, DWS Investment Management Americas, Inc., GW&K Investment Management, LLC, Legal & General Investment Management America, Inc., Massachusetts Financial Services Company d/b/a/ MFS Investment Management, Principal Global Investors, LLC, QMA LLC, Vaughan Nelson Investment Management, L.P., Vulcan Value Partners, LLC, WCM Investment Management and Wellington Management Company LLP; for the Multi-ManagerNon-Core Fixed Income Fund with Ares Capital Management II LLC, BlueBay Asset Management LLP, Brigade Capital Management, LP, Marathon Asset Management, L.P., Symphony Asset Management LLC, and TCW Investment Management Company LLC; and for the Multi-Manager Real Assets Strategy Fund with Cohen & Steers Capital Management, Inc., PGIM Real Estate, a business unit of PGIM, Inc., Presima Inc., and RREEF America L.L.C. (the “Underlying Managers”). Pursuant to the terms of theSub-Advisory Agreements, the Underlying Managers are responsible for making investment decisions and managing the investments of the Fund. GSAM compensates the Underlying Managers directly in accordance with the terms of theSub-Advisory Agreements. The Funds are not charged any separate or additional investment advisory fees by the Underlying Managers.
As of October 31, 2019, GSAM no longer had sub-advisory agreements with Lazard Asset Management LLC and Russell Investments Implementation Services, LLC (with respect to the Multi-Manager Global Equity Fund) and RARE Infrastructure (North America) Pty Limited (with respect to the Multi-Manager Real Assets Strategy Fund).
|
| 2. SIGNIFICANT ACCOUNTING POLICIES |
The financial statements have been prepared in accordance with accounting principles generally accepted in the United States of America (“GAAP”) and require management to make estimates and assumptions that may affect the reported amounts and disclosures. Actual results may differ from those estimates and assumptions. Each Fund is an investment company under GAAP and follows the accounting and reporting guidance applicable to investment companies.
A. Investment Valuation — The Funds’ valuation policy and underlying funds (“Underlying Funds”) is to value investments at fair value.
B. Investment Income and Investments — Investment income includes interest income, dividend income and securities lending income, if any. Interest income is accrued daily and adjusted for amortization of premiums and accretion of discounts. Dividend income is recognized onex-dividend date or, for certain foreign securities, as soon as such information is obtained subsequent to theex-dividend date. Non-cash dividends, if any, are recorded at the fair market value of the securities received. Investment transactions are reflected on trade date. Realized gains and losses are calculated using identified cost. Investment transactions are recorded on the following business day for daily net asset value (“NAV”) calculations. Investment income is recorded net of any foreign withholding taxes, less any amounts reclaimable. The Funds may file withholding tax reclaims in
86
GOLDMAN SACHS STRATEGIC MULTI-ASSET CLASS FUNDS
|
| 2. SIGNIFICANT ACCOUNTING POLICIES (continued) |
certain jurisdictions to recover a portion of amounts previously withheld. Any foreign capital gains tax is accrued daily based upon net unrealized gains, and is payable upon sale of such investments. Distributions received from the Funds’ investments in U.S. real estate investment trusts (“REITs”) may be characterized as ordinary income, net capital gain and/or a return of capital. A return of capital is recorded by the Funds as a reduction to the cost basis of the REIT.
For derivative contracts, realized gains and losses are recorded upon settlement of the contract. Upfront payments, if any, are made or received upon entering into a swap agreement and are reflected in the Statements of Assets and Liabilities. Upfront payments are recognized over the contract’s term/event as realized gains or losses, with the exception of forward starting swap contracts whose realized gains or losses are recognized from the effective start date.
C. Expenses —Expenses incurred directly by a Fund are charged to the Fund, and certain expenses incurred by the Trust are allocated across the applicable Funds on a straight-line and/orpro-rata basis, depending upon the nature of the expenses, and are accrued daily.
D. Federal Taxes and Distributions to Shareholders — It is each Fund’s policy to comply with the requirements of the Internal Revenue Code of 1986, as amended (the “Code”), applicable to regulated investment companies and to distribute each year substantially all of its investment company taxable income and capital gains to its shareholders. Accordingly, each Fund is not required to make any provisions for the payment of federal income tax. Distributions to shareholders are recorded on theex-dividend date. Income and capital gains distributions, if any, are declared and paid according to the following schedule:
| | | | | | |
| Fund | | | | Income Distributions Declared/Paid | | Capital Gains Distributions Declared/Paid |
Multi-Manager Global Equity | | | | Annually | | Annually |
Multi-Manager Non-Core Fixed Income | | | | Daily/Monthly | | Annually |
Multi-Manager Real Assets Strategy | | | | Annually | | Annually |
Net capital losses, if any, are carried forward to future fiscal years and may be used to the extent allowed by the Code to offset any future capital gains. Losses that are carried forward will retain their character as either short-term or long-term capital losses. Utilization of capital loss carryforwards will reduce the requirement of future capital gains distributions.
The characterization of distributions to shareholders for financial reporting purposes is determined in accordance with federal income tax rules, which may differ from GAAP. The source of each Fund’s distributions may be shown in the accompanying financial statements as either from distributable earnings or capital. Certain components of the Funds’ net assets on the Statements of Assets and Liabilities reflect permanent GAAP/tax differences based on the appropriate tax character.
E. Foreign Currency Translation —The accounting records and reporting currency of the Funds are maintained in U.S. dollars. Assets and liabilities denominated in foreign currencies are translated into U.S. dollars using the current exchange rates at the close of each business day. The effect of changes in foreign currency exchange rates on investments is included within net realized and unrealized gain (loss) on investments. Changes in the value of other assets and liabilities as a result of fluctuations in foreign exchange rates are included in the Statements of Operations within net change in unrealized gain (loss) on foreign currency translation. Transactions denominated in foreign currencies are translated into U.S. dollars on the date the transaction occurred, the effects of which are included within net realized gain (loss) on foreign currency transactions.
F. Commission Recapture — GSAM, on behalf of certain Funds, may direct portfolio trades, subject to seeking best execution, to various brokers who have agreed to rebate a portion of the commissions generated. Such rebates are made directly to a Fund as cash payments and are included in net realized gain (loss) from investments on the Statements of Operations.
87
GOLDMAN SACHS STRATEGIC MULTI-ASSET CLASS FUNDS
Notes to Financial Statements(continued)
October 31, 2019
|
| 3. INVESTMENTS AND FAIR VALUE MEASUREMENTS |
U.S. GAAP defines the fair value of a financial instrument as the amount that would be received to sell an asset or paid to transfer a liability in an orderly transaction between market participants at the measurement date (i.e., the exit price); the Funds’ policy is to use the market approach. GAAP establishes a fair value hierarchy that prioritizes the inputs to valuation techniques used to measure fair value. The hierarchy gives the highest priority to unadjusted quoted prices in active markets for identical assets or liabilities (Level 1 measurements) and the lowest priority to unobservable inputs (Level 3 measurements). The levels used for classifying investments are not necessarily an indication of the risk associated with investing in these investments. The three levels of the fair value hierarchy are described below:
Level 1 — Unadjusted quoted prices in active markets that are accessible at the measurement date for identical, unrestricted assets or liabilities;
Level 2 — Quoted prices in markets that are not active or financial instruments for which significant inputs are observable (including, but not limited to, quoted prices for similar investments, interest rates, foreign exchange rates, volatility and credit spreads), either directly or indirectly;
Level 3 — Prices or valuations that require significant unobservable inputs (including GSAM’s assumptions in determining fair value measurement).
The Board of Trustees (“Trustees”) has approved Valuation Procedures that govern the valuation of the portfolio investments held by the Funds, including investments for which market quotations are not readily available. The Trustees have delegated to GSAMday-to-day responsibility for implementing and maintaining internal controls and procedures related to the valuation of the Funds’ investments. To assess the continuing appropriateness of pricing sources and methodologies, GSAM regularly performs price verification procedures and issues challenges as necessary to third party pricing vendors or brokers, and any differences are reviewed in accordance with the Valuation Procedures.
A. Level 1 and Level 2 Fair Value Investments — The valuation techniques and significant inputs used in determining the fair values for investments classified as Level 1 and Level 2 are as follows:
Equity Securities— Equity securities traded on a United States (“U.S.”) securities exchange or the NASDAQ system, or those located on certain foreign exchanges, including but not limited to the Americas, are valued daily at their last sale price or official closing price on the principal exchange or system on which they are traded. If there is no sale or official closing price or such price is believed by GSAM to not represent fair value, equity securities may be valued at the closing bid price for long positions and at the closing ask price for short positions. To the extent these investments are actively traded, they are classified as Level 1 of the fair value hierarchy, otherwise they are generally classified as Level 2.
Unlisted equity securities for which market quotations are available are valued at the last sale price on the valuation date, or if no sale occurs, at the last bid price for long positions or the last ask price for short positions, and are generally classified as Level 2. Securities traded on certain foreign securities exchanges are valued daily at fair value determined by an independent fair value service (if available) under Valuation Procedures approved by the Trustees and consistent with applicable regulatory guidance. The independent fair value service takes into account multiple factors including, but not limited to, movements in the securities markets, certain depositary receipts, futures contracts and foreign currency exchange rates that have occurred subsequent to the close of the foreign securities exchange. These investments are generally classified as Level 2 of the fair value hierarchy.
Underlying Funds (including Money Market Funds)— Underlying Funds (“Underlying Funds”) include other investment companies and exchange-traded funds (“ETFs”). Investments in the Underlying Funds (except ETFs) are valued at the NAV per share on the day of valuation. ETFs are valued daily at the last sale price or official closing price on the principal exchange or system on which the investment is traded. Because the Funds invest in Underlying Funds that fluctuate in value, the Funds’ shares will correspondingly fluctuate in value. To the extent these investments are actively traded, they are classified as Level 1 of the fair value hierarchy, otherwise they are generally classified as Level 2. For information regarding an Underlying Fund’s accounting policies and investment holdings, please see the Underlying Fund’s shareholder report.
Debt Securities— Debt securities for which market quotations are readily available are valued daily on the basis of quotations supplied by dealers or an independent pricing service approved by the Trustees. The pricing services may use valuation models or
88
GOLDMAN SACHS STRATEGIC MULTI-ASSET CLASS FUNDS
|
| 3. INVESTMENTS AND FAIR VALUE MEASUREMENTS (continued) |
matrix pricing, which consider: (i) yield or price with respect to bonds that are considered comparable in characteristics such as rating, interest rate and maturity date or (ii) quotations from securities dealers to determine current value. With the exception of treasury securities of G7 countries, which are generally classified as Level 1, these investments are generally classified as Level 2 of the fair value hierarchy.
i. Bank Loans — Bank loans (“Loans”) are interests in amounts owed by corporate, governmental, or other borrowers to lenders or lending syndicates. Loans are arranged through private negotiations between the borrower and one or more financial institutions (“Lenders”). A Fund’s investments in Loans are in the form of either participations in Loans (“Participations”) or assignments of all or a portion of Loans from third parties (“Assignments”). With respect to Participations, a Fund has the right to receive payments of principal, interest and any fees to which it is entitled from the Lender selling the Participations and only upon receipt by the Lender of the payments from the borrower. A Fund generally has no right to enforce compliance by the borrower with the terms of the loan agreement with respect to Participations. Conversely, assignments result in a Fund having a direct contractual relationship with the borrower, and the Fund may be permitted to enforce compliance by the borrower with the terms of the loan agreement.
Derivative Contracts — A derivative is an instrument whose value is derived from underlying assets, indices, reference rates or a combination of these factors. A Fund enters into derivative transactions to hedge against changes in interest rates, securities prices, and/or currency exchange rates, to increase total return, or to gain access to certain markets or attain exposure to other underliers. For financial reporting purposes, cash collateral that has been pledged to cover obligations of a Fund and cash collateral received, if any, is reported separately on the Statements of Assets and Liabilities as receivables/payables for collateral on certain derivative contracts.Non-cash collateral pledged by a Fund, if any, is noted in the Schedules of Investments.
Exchange-traded derivatives, including futures and options contracts, are generally valued at the last sale or settlement price on the exchange where they are principally traded. Exchange-traded options without settlement prices are generally valued at the midpoint of the bid and ask prices on the exchange where they are principally traded (or, in the absence oftwo-way trading, at the last bid price for long positions and the last ask price for short positions). Exchange-traded derivatives typically fall within Level 1 of the fair value hierarchy.Over-the-counter (“OTC”) and centrally cleared derivatives are valued using market transactions and other market evidence, including market-based inputs to models, calibration to market-clearing transactions, broker or dealer quotations, or other alternative pricing sources. Where models are used, the selection of a particular model to value OTC and centrally cleared derivatives depends upon the contractual terms of, and specific risks inherent in, the instrument, as well as the availability of pricing information in the market. Valuation models require a variety of inputs, including contractual terms, market prices, yield curves, credit curves, measures of volatility, voluntary and involuntary prepayment rates, loss severity rates and correlations of such inputs. For OTC and centrally cleared derivatives that trade in liquid markets, model inputs can generally be verified and model selection does not involve significant management judgment. OTC and centrally cleared derivatives are classified within Level 2 of the fair value hierarchy when significant inputs are corroborated by market evidence.
i. Forward Contracts — A forward contract is a contract between two parties to buy or sell an asset at a specified price on a future date. A forward contract settlement can occur on a cash or delivery basis. Forward contracts aremarked-to-market daily using independent vendor prices, and the change in value, if any, is recorded as an unrealized gain or loss. Cash and certain investments may be used to collateralize forward contracts.
Aforward foreign currency exchange contractis a forward contract in which a Fund agrees to receive or deliver a fixed quantity of one currency for another, at apre-determined price at a future date. All forward foreign currency exchange contracts aremarked-to-market daily at the applicable forward rate.Non-deliverable forward foreign currency exchange contracts are settled with the counterparty in cash without the delivery of foreign currency.
ii. Futures Contracts — Futures contracts are contracts to buy or sell a standardized quantity of a specified commodity or security. Upon entering into a futures contract, a Fund deposits cash or securities in an account on behalf of the broker in an amount sufficient to meet the initial margin requirement. Subsequent payments are made or received by a Fund equal to the daily change in the contract value and are recorded as variation margin receivable or payable with a corresponding offset to unrealized gains or losses.
89
GOLDMAN SACHS STRATEGIC MULTI-ASSET CLASS FUNDS
Notes to Financial Statements(continued)
October 31, 2019
|
| 3. INVESTMENTS AND FAIR VALUE MEASUREMENTS (continued) |
iii. Options — When a Fund writes call or put options, an amount equal to the premium received is recorded as a liability and is subsequentlymarked-to-market to reflect the current value of the option written. Swaptions are options on interest rate swap contracts or credit defaults swap contracts.
Upon the purchase of a call option or a put option by a Fund, the premium paid is recorded as an investment and subsequentlymarked-to-market to reflect the current value of the option. Certain options may be purchased with premiums to be determined on a future date. The premiums for these options are based upon implied volatility parameters at specified terms.
iv. Swap Contracts — Bilateral swap contracts are agreements in which a Fund and a counterparty agree to exchange periodic payments on a specified notional amount or make a net payment upon termination. Bilateral swap transactions are privately negotiated in the OTC market and payments are settled through direct payments between a Fund and the counterparty. By contrast, certain swap transactions are subject to mandatory central clearing. These swaps are executed through a derivatives clearing member (“DCM”), acting in an agency capacity, and submitted to a central counterparty (“CCP”) (“centrally cleared swaps”), in which case all payments are settled with the CCP through the DCM. Swaps aremarked-to-market daily using pricing vendor quotations, counterparty or clearinghouse prices or model prices, and the change in value, if any, is recorded as an unrealized gain or loss. Upon entering into a swap contract, a Fund is required to satisfy an initial margin requirement by delivering cash or securities to the counterparty (or in some cases, segregated in a triparty account on behalf of the counterparty), which can be adjusted by anymark-to-market gains or losses pursuant to bilateral or centrally cleared arrangements. For centrally cleared swaps the daily change in valuation, if any, is recorded as a receivable or payable for variation margin.
A credit default swapis an agreement that involves one party (the buyer of protection) making a stream of payments to another party (the seller of protection) in exchange for the right to receive protection on a reference security or obligation, including a group of assets or exposure to the performance of an index. A Fund’s investment in credit default swaps may involve greater risks than if the Fund had invested in the referenced obligation directly. Credit events are contract specific but may include bankruptcy, failure to pay, restructuring and obligation acceleration. If a Fund buys protection through a credit default swap and no credit event occurs, its payments are limited to the periodic payments previously made to the counterparty. Upon the occurrence of a specified credit event, a Fund, as a buyer of credit protection, is entitled to receive an amount equal to the notional amount of the swap and deliver to the seller the defaulted reference obligation in a physically settled trade. A Fund may also receive a net settlement amount in the form of cash or securities equal to the notional amount of the swap reduced by the recovery value of the reference obligation in a cash settled trade.
B. Level 3 Fair Value Investments — To the extent that significant inputs to valuation models and other alternative pricing sources are unobservable, or if quotations are not readily available, or if GSAM believes that such quotations do not accurately reflect fair value, the fair value of the Funds’ investments may be determined under Valuation Procedures approved by the Trustees. GSAM, consistent with its procedures and applicable regulatory guidance, may make an adjustment to the most recent valuation prices of either domestic or foreign securities in light of significant events to reflect what it believes to be the fair value of the securities at the time of determining a Fund’s NAV. To the extent investments are valued using single source broker quotations obtained directly from the broker or passed through from third party pricing vendors, such investments are classified as Level 3 investments. GSAM did not develop the unobservable inputs for valuation of Level 3 Assets and Liabilities.
90
GOLDMAN SACHS STRATEGIC MULTI-ASSET CLASS FUNDS
|
| 3. INVESTMENTS AND FAIR VALUE MEASUREMENTS (continued) |
C. Fair Value Hierarchy — The following is a summary of the Funds’ investments and derivatives classified in the fair value hierarchy as of October 31, 2019:
| | | | | | | | | | | | |
|
| MULTI-MANAGER GLOBAL EQUITY | |
| | | |
| Investment Type | | Level 1 | | | Level 2 | | | Level 3 | |
| | | |
| Assets | | | | | | | | | | | | |
| | | |
Common Stock and/or Other Equity Investments(a) | | | | | | | | | | | | |
| | | |
Africa | | $ | 803,829 | | | $ | 1,449,410 | | | $ | — | |
| | | |
Asia | | | 10,343,049 | | | | 62,313,910 | | | | — | |
| | | |
Australia and Oceania | | | — | | | | 3,490,628 | | | | — | |
| | | |
Europe | | | 13,201,003 | | | | 94,999,906 | | | | — | |
| | | |
North America | | | 198,260,148 | | | | 179,467 | | | | — | |
| | | |
South America | | | 3,054,893 | | | | 526,963 | | | | — | |
| | | |
Fixed Income | | | | | | | | | | | | |
| | | |
Corporate Obligations | | | — | | | | 252 | | | | — | |
| | | |
Exchange Traded Funds | | | 24,106,251 | | | | — | | | | — | |
| | | |
Investment Companies | | | 48,365,407 | | | | — | | | | — | |
| | | |
Rights | | | — | | | | 5,919 | | | | — | |
| | | |
Short-term Investments | | | 99,809 | | | | — | | | | — | |
| | | |
| Total | | $ | 298,234,389 | | | $ | 162,966,455 | | | $ | — | |
| | | |
| Derivative Type | | | | | | | | | |
| | | |
| Assets(b) | | | | | | | | | | | | |
| | | |
Forward Foreign Currency Exchange Contracts | | $ | — | | | $ | 888,832 | | | $ | — | |
| | | |
Futures Contracts | | | 496,262 | | | | — | | | | — | |
| | | |
| Total | | $ | 496,262 | | | $ | 888,832 | | | $ | — | |
| | | |
| Liabilities(b) | | | | | | | | | | | | |
| | | |
Forward Foreign Currency Exchange Contracts | | $ | — | | | $ | (1,582,442 | ) | | $ | — | |
| | | |
| MULTI-MANAGERNON-CORE FIXED INCOME | | | | | | | | | | | | |
| | | |
| Investment Type | | Level 1 | | | Level 2 | | | Level 3 | |
| | | |
| Assets | | | | | | | | | | | | |
| | | |
Fixed Income | | | | | | | | | | | | |
| | | |
Foreign Debt Obligations | | $ | — | | | $ | 231,561,140 | | | $ | — | |
| | | |
Corporate Obligations | | | — | | | | 359,308,932 | | | | 1,180,000 | |
| | | |
Bank Loans | | | — | | | | 177,894,501 | | | | 1,488,581 | |
|
Common Stock and/or Other Equity Investments(a) | |
| | | |
North America | | | 2,237,381 | | | | 946,900 | | | | 26,934 | |
| | | |
Warrants | | | — | | | | — | | | | 19,580 | |
| | | |
Investment Company | | | 68,210,674 | | | | — | | | | — | |
| | | |
| Total | | $ | 70,448,055 | | | $ | 769,711,473 | | | $ | 2,715,095 | |
91
GOLDMAN SACHS STRATEGIC MULTI-ASSET CLASS FUNDS
Notes to Financial Statements(continued)
October 31, 2019
|
| 3. INVESTMENTS AND FAIR VALUE MEASUREMENTS (continued) |
| | | | | | | | | | | | |
| | | |
| MULTI-MANAGERNON-CORE FIXED INCOME (continued) | | | | | | | | | | | | |
| | | |
| Derivative Type | | Level 1 | | | Level 2 | | | Level 3 | |
| | | |
| Assets(b) | | | | | | | | | | | | |
| | | |
Forward Foreign Currency Exchange Contracts | | $ | — | | | $ | 1,584,077 | | | $ | — | |
| | | |
| Liabilities(b) | | | | | | | | | | | | |
| | | |
Forward Foreign Currency Exchange Contracts | | $ | — | | | $ | (1,080,462 | ) | | $ | — | |
| | | |
Futures Contracts | | | (3,220 | ) | | | — | | | | — | |
| | | |
Credit Default Swaps | | $ | — | | | $ | (3,021 | ) | | $ | — | |
| | | |
| Total | | $ | (3,220 | ) | | $ | (1,083,483 | ) | | $ | — | |
| | | |
| MULTI-MANAGER REAL ASSETS STRATEGY | | | | | | | | | | | | |
| | | |
| Investment Type | | Level 1 | | | Level 2 | | | Level 3 | |
| | | |
| Assets | | | | | | | | | | | | |
| | | |
Common Stock and/or Other Equity Investments(a) | | | | | | | | | | | | |
| | | |
Asia | | $ | 4,723,618 | | | $ | 63,539,393 | | | $ | — | |
| | | |
Australia and Oceania | | | 383,440 | | | | 18,252,214 | | | | — | |
| | | |
Europe | | | 19,144,409 | | | | 65,529,217 | | | | — | |
| | | |
North America | | | 267,171,002 | | | | — | | | | — | |
| | | |
South America | | | 1,037,100 | | | | — | | | | — | |
| | | |
Investment Company | | | 8,199,800 | | | | — | | | | — | |
| | | |
| Total | | $ | 300,659,369 | | | $ | 147,320,824 | | | $ | — | |
| (a) | | Amounts are disclosed by continent to highlight the impact of time zone differences between local market close and the calculation of net asset value. Security valuations are based on the principal exchange or system on which they are traded, which may differ from country of domicile. The Funds utilize fair value model prices provided by an independent fair value service for international equities, resulting in a Level 2 classification. |
| (b) | | Amount shown represents unrealized gain (loss) at period end. |
For further information regarding security characteristics, see the Schedules of Investments.
|
| 4. INVESTMENTS IN DERIVATIVES |
The following tables set forth, by certain risk types, the gross value of derivative contracts (not considered to be hedging instruments for accounting disclosure purposes) as of October 31, 2019. These instruments were used as part of the Funds’ investment strategies and to obtain and/or manage exposure related to the risks below. The values in the tables below exclude the effects of cash collateral received or posted pursuant to these derivative contracts, and therefore are not representative of the Funds’ net exposure.
| | | | | | | | | | | | |
| | | |
| Multi-Manager Global Equity | | | | | | | | | | |
| Risk | | Statements of Assets
and Liabilities | | Assets | | | Statements of Assets
and Liabilities | | Liabilities | |
Currency | | Receivable for unrealized gain on forward foreign currency exchange contracts | | $ | 888,832 | | | Payable for unrealized loss on forward foreign currency exchange contracts | | $ | (1,582,442) | |
Equity | | Variation margin on futures contracts | | | 496,262 | (a) | | — | | | — | |
| Total | | | | $ | 1,385,094 | | | | | $ | (1,582,442) | |
92
GOLDMAN SACHS STRATEGIC MULTI-ASSET CLASS FUNDS
|
| 4. INVESTMENTS IN DERIVATIVES (continued) |
| | | | | | | | | | | | |
| | | |
| Multi-ManagerNon-Core Fixed Income | | | | | | | | | | |
| Risk | | Statements of Assets
and Liabilities | | Assets | | | Statements of Assets
and Liabilities | | Liabilities | |
Interest rate | | — | | $ | — | | | Variation margin on futures contracts | | $ | (3,220) | |
Credit | | — | | | — | | | Unrealized loss on swap contracts | | | (3,021) | (a)(b) |
Currency | | Receivable for unrealized gain on forward foreign currency exchange contracts | | | 1,584,077 | | | Payable for unrealized loss on forward foreign currency exchange contracts. | | | (1,080,462) | |
| Total | | | | | $1,584,077 | | | | | $ | (1,086,703) | |
| (a) | | Includes unrealized gain (loss) on futures contracts and centrally cleared swaps described in the Additional Investment Information sections of the Schedules of Investments. Only current day’s variation margin is reported within the Statements of Assets and Liabilities. |
| (b) | | Aggregate of amounts include $3,021 for Multi-ManagerNon-Core Fixed Income Fund, which represent the payments to be made pursuant to bilateral agreements should counterparties exercise their “right to terminate” provisions based on, among others, the Funds’ performance, their failure to pay on their obligations or failure to pledge collateral. Such amounts do not include incremental charges directly associated with theclose-out of the agreements. They also do not reflect the fair value of any assets pledged as collateral which, through the daily margining process, substantially offsets the aforementioned amounts and for which the Funds are entitled to a full return. |
The following tables set forth, by certain risk types, the Funds’ gains (losses) related to these derivatives and their indicative volumes for the fiscal year ended October 31, 2019. These gains (losses) should be considered in the context that these derivative contracts may have been executed to create investment opportunities and/or economically hedge certain investments, and accordingly, certain gains (losses) on such derivative contracts may offset certain (losses) gains attributable to investments. These gains (losses) are included in “Net realized gain (loss)” or “Net change in unrealized gain (loss)” on the Statements of Operations:
| | | | | | | | | | | | | | |
|
| Multi-Manager Global Equity | |
| Risk | | Statements of Operations | | Net Realized
Gain (Loss) | | | Net Change in
Unrealized
Gain | | | Average
Number of
Contracts(a) | |
| Currency | | Net realized gain (loss) from forward foreign currency exchange contracts/Net unrealized gain (loss) on forward foreign currency exchange contracts | | $ | 4,949,302 | | | $ | (3,074,726 | ) | | | 95 | |
| Equity | | Net realized gain (loss) from futures contracts/Net change in unrealized gain (loss) on futures contracts | | | 1,751,201 | | | | 597,711 | | | | 108 | |
| Total | | | | $ | 6,700,503 | | | $ | (2,477,015 | ) | | | 203 | |
|
| Multi-ManagerNon-Core Fixed Income | |
| Risk | | Statements of Operations | | Net Realized
Gain (Loss) | | | Net Change in
Unrealized
Gain | | | Average
Number of
Contracts(a) | |
| Interest rate | | Net realized gain (loss) from futures contracts, purchased options and written options contracts/Net change in unrealized gain (loss) on futures contracts and purchased options contracts | | $ | (212,751 | ) | | $ | (3,298 | ) | | | 4 | |
| Credit | | Net realized gain (loss) from swap contracts/Net change in unrealized gain (loss) on swap contracts | | | (68,100 | ) | | | (87,771 | ) | | | 3 | |
| Currency | | Net realized gain (loss) from forward foreign currency exchange contracts/Net change in unrealized gain (loss) on forward foreign currency exchange contracts | | | (3,538,385 | ) | | | 1,138,057 | | | | 56 | |
| Total | | | | $ | (3,819,236 | ) | | $ | 1,046,988 | | | | 63 | |
93
GOLDMAN SACHS STRATEGIC MULTI-ASSET CLASS FUNDS
Notes to Financial Statements(continued)
October 31, 2019
|
| 4. INVESTMENTS IN DERIVATIVES (continued) |
| | | | | | | | | | | | | | |
|
| Multi-Manager Real Assets Strategy Fund | |
| Risk | | Statements of Operations | | Net
Realized
Gain (Loss) | | | Net Change in
Unrealized
Gain (Loss) | | | Average
Number of
Contracts(a) | |
| Currency | | Net realized gain (loss) from forward foreign currency exchange contracts/Net unrealized gain(loss) on forward foreign currency exchange contracts | | $ | (15,663 | ) | | $ | (46 | ) | | | 1 | |
| (a) | | Average number of contracts is based on the average of month end balances for the fiscal year ended October 31, 2019. |
|
| 5. AGREEMENTS AND AFFILIATED TRANSACTIONS |
A. Management Agreement —Under the Agreement, GSAM manages the Funds, subject to the general supervision of the Trustees.
As compensation for the services rendered pursuant to the Agreement, the assumption of the expenses related thereto and administration of the Funds’ business affairs, including providing facilities, GSAM is entitled to a management fee, accrued daily and paid monthly, equal to an annual percentage rate of each Fund’s average daily net assets.
For the fiscal year ended October 31, 2019, contractual and effective net management fees with GSAM were at the following rates:
| | | | | | | | | | | | | | | | | | | | | | | | | | | | |
| Fund | | First $1 billion | | | Next $1 billion | | | Next $3 billion | | | Next $3 billion | | | Over $8 billion | | | Effective Rate | | | Effective Net Management
Rate*^ | |
| Multi-Manager Global Equity | | | 1.03 | % | | | 0.93 | % | | | 0.89 | % | | | 0.87 | % | | | 0.84 | % | | | 1.03 | % | | | 0.39 | % |
| Multi-ManagerNon-Core Fixed Income | | | 0.85 | | | | 0.85 | | | | 0.77 | | | | 0.73 | | | | 0.71 | | | | 0.85 | | | | 0.41 | |
| Multi-Manager Real Asset Strategy | | | 1.00 | | | | 0.90 | | | | 0.86 | | | | 0.84 | | | | 0.82 | | | | 1.00 | | | | 0.57 | |
| * | | GSAM has agreed to waive a portion of its management fee for each Fund in order to achieve an effective net management fee rate that is equal to the actual cost of fees paid to the Fund’s Underlying Managers. These arrangements will remain in effect through at least February 28, 2020, and prior to such date GSAM may not terminate the arrangements without the approval of the Board of Trustees. |
| ^ | | Effective Net Management Rate includes the impact of management fee waivers of affiliated underlying funds, if any. |
The Multi-Manager Global Equity, Multi-ManagerNon-Core Fixed Income and Multi-Manager Real Assets Strategy Funds invest in shares of the Goldman Sachs Financial Square Government Fund, which is an affiliated Underlying Fund. GSAM has agreed to waive a portion of its management fee payable by the Funds in an amount equal to the management fee it earns as an investment adviser to the affiliated Underlying Fund in which the Funds invest. For the fiscal year ended October 31, 2019, GSAM waived $45,169, $97,183 and $16,376 of the Multi-Manager Global Equity, Multi-ManagerNon-Core Fixed Income and Multi-Manager Real Assets Strategy Funds’ management fees, respectively.
B. Transfer Agency Agreement— Goldman Sachs also serves as the transfer agent of the Funds for a fee pursuant to the Transfer Agency Agreement. The fees charged for such transfer agency services are accrued daily and paid monthly at annual rates of 0.02% of the average daily net assets of Class R6 Shares.
C. Other Expense Agreements and Affiliated Transactions — GSAM has agreed to reduce or limit each Fund’s “Total Annual Operating Expenses” (excluding acquired fund fees and expenses, transfer agency fees and expenses taxes, interest, brokerage fees, expenses of shareholder meetings, litigation and indemnification, and extraordinary expenses) to the extent such expenses exceed, on an annual basis, a percentage rate of the average daily net assets of each Fund. Such Total Annual Operating Expense reimbursements, if any, are accrued daily and paid monthly. In addition, the Funds are not obligated to reimburse GSAM for prior fiscal year expense reimbursements, if any. The Total Annual Operating Expense limitations as an annual percentage rate of average daily net assets for the Multi-Manager Global Equity Fund, Multi-ManagerNon-Core Fixed Income Fund and Multi-Manager Real Assets Strategy Fund are 0.75%, 0.70%, and 0.90% respectively. Prior to October 1, 2019, the Total Annual Operating Expense limitation for the Multi-Manager Global Equity Fund was 0.85%. Effective October 1, 2019, GSAM has also
94
GOLDMAN SACHS STRATEGIC MULTI-ASSET CLASS FUNDS
|
| 5. AGREEMENTS AND AFFILIATED TRANSACTIONS (continued) |
agreed to reduce or limit the Multi-Manager Global Equity Fund’s “Other Expenses” (excluding acquired fund fees and expenses, transfer agency fees and expenses, service fees, taxes, interest, brokerage fees, expenses of shareholder meetings, litigation and indemnification, and extraordinary expenses) to 0.10% of the Fund’s average daily net assets. The arrangements for the Multi-Manager Global Equity Fund will remain in effect through at least October 1, 2020, and the arrangements for the Multi-Manager Non-Core Fixed Income Fund and Multi-Manager Real Assets Strategy Fund will each remain in effect through at least February 28, 2020, and prior to such dates GSAM may not terminate the arrangements without the approval of the Trustees. In addition, the Funds have entered into certain offset arrangements with the transfer agent, which may result in a reduction of the Funds’ expenses and are received irrespective of the application of the “Other Expense” limitations described above.
For the fiscal year ended October 31, 2019, these expense reductions, including any fee waivers and Other Expense reimbursements, were as follows:
| | | | | | | | | | | | |
| Fund | | Management
Fee Waiver | | | Other Expense
Reimbursements | | | Total Annual
Operating Expense
Reductions | |
| Multi-Manager Global Equity | | $ | 3,924,471 | | | $ | 304,051 | | | $ | 4,228,522 | |
| Multi-ManagerNon-Core Fixed Income | | | 3,545,613 | | | | — | | | | 3,545,613 | |
| Multi-Manager Real Assets Strategy | | | 1,826,234 | | | | — | | | | 1,826,234 | |
D. Line of Credit Facility — As of October 31, 2019, the Funds participated in a $580,000,000 committed, unsecured revolving line of credit facility (the “facility”) together with other funds of the Trust and certain registered investment companies having management agreements with GSAM or its affiliates. This facility is to be used for temporary emergency purposes, or to allow for an orderly liquidation of securities to meet redemption requests. The interest rate on borrowings is based on the federal funds rate. The facility also requires a fee to be paid by the Funds based on the amount of the commitment that has not been utilized. For the fiscal year ended October 31, 2019, the Funds did not have any borrowings under the facility. Prior to April 30, 2019, the facility was $770,000,000.
E. Other Transactions with Affiliates — For the fiscal year ended October 31, 2019 , Goldman Sachs earned $165 and $4,766, in brokerage commissions from portfolio transactions, on behalf of the Multi-Manager Global Equity Fund and Multi-Manager Real Assets Strategy Fund, respectively.
The following table provides information about the Funds’ investments in the Goldman Sachs Financial Square Government Fund as of and for the fiscal year ended October 31, 2019:
| | | | | | | | | | | | | | | | | | | | | | | | |
| Fund | | Market Value
as of October 31, 2018 | | | Purchases at Cost | | | Proceeds from Sales | | | Market
Value as of October 31,
2019 | | | Shares as of
October 31,
2019 | | | Dividend Income
from Affiliated
Investment
Companies | |
Multi-Manager Global Equity | | | | | | | | | | | | | | | | | | | | | | | | |
Goldman Sachs Financial Square Government Fund — Institutional Shares | | $ | 23,766,349 | | | $ | 398,357,896 | | | $ | (408,203,518 | ) | | $ | 13,920,727 | | | | 13,920,727 | | | $ | 357,306 | |
Goldman Sachs Financial Square Government Fund — Class R6 Shares | | | — | | | | 157,569,826 | | | | (123,125,146 | ) | | | 34,444,680 | | | | 34,444,680 | | | | 248,583 | |
Multi-ManagerNon-Core Fixed Income | | | | | | | | | | | | | | | | | | | | | | | | |
Goldman Sachs Financial Square Government Fund — Institutional Shares | | | 56,198,365 | | | | 940,240,165 | | | | (928,227,857 | ) | | | 68,210,674 | | | | 68,210,674 | | | | 1,319,700 | |
Multi-Manager Real Asset Strategy | | | | | | | | | | | | | | | | | | | | | | | | |
Goldman Sachs Financial Square Government Fund — Institutional Shares | | | 10,604,129 | | | | 156,835,309 | | | | (159,239,638 | ) | | | 8,199,800 | | | | 8,199,800 | | | | 222,565 | |
95
GOLDMAN SACHS STRATEGIC MULTI-ASSET CLASS FUNDS
Notes to Financial Statements(continued)
October 31, 2019
|
| 6. PORTFOLIO SECURITIES TRANSACTIONS |
The cost of purchases and proceeds from sales and maturities of long-term securities For the fiscal year ended October 31, 2019, were as follows:
| | | | | | | | | | | | | | | | |
| Fund | | Purchases of
Government
Securities | | | Purchases Excluding
Government
Securities | | | Sales of Government Securities | | | Sales Excluding Government Securities | |
Multi-Manager Global Equity | | $ | — | | | $ | 512,650,476 | | | $ | — | | | $ | 759,724,769 | |
Multi-ManagerNon-Core Fixed Income | | | — | | | | 1,092,204,792 | | | | 6,930,819 | | | | 1,072,900,143 | |
Multi-Manager Real Asset Strategy | | | — | | | | 393,669,675 | | | | — | | | | 393,833,805 | |
The tax character of distributions paid during the fiscal year ended October 31, 2019 was as follows:
| | | | | | | | | | | | |
| | | Multi-Manager
Global Equity | | | Multi-Manager
Non-Core
Fixed Income | | | Multi-Manager
Real Assets
Strategy | |
Distribution paid from: | | | | | | | | | | | | |
Ordinary income | | $ | 20,782,062 | | | $ | 44,128,245 | | | $ | 8,034,023 | |
Net long-term capital gains | | | 24,324,082 | | | | — | | | | 2,405,170 | |
Total taxable distributions | | | 45,106,144 | | | $ | 44,128,245 | | | | 10,439,193 | |
Tax return of capital | | $ | — | | | $ | 3,930,447 | | | $ | — | |
The tax character of distributions paid during the fiscal year ended October 31, 2018 was as follows:
| | | | | | | | | | | | |
| | | Multi-Manager
Global Equity | | | Multi-Manager
Non-Core
Fixed Income | | | Multi-Manager
Real Assets
Strategy | |
Distribution paid from: | | | | | | | | | | | | |
Ordinary income | | $ | 6,769,105 | | | $ | 23,374,598 | | | $ | 2,894,587 | |
Net long-term capital gains | | | 9,365,803 | | | | — | | | | 2,588,426 | |
Total taxable distributions | | $ | 16,134,908 | | | $ | 23,374,598 | | | $ | 5,483,013 | |
Tax return of capital | | $ | — | | | $ | 7,036,890 | | | $ | — | |
As of October 31, 2019, the components of accumulated earnings (losses) on a tax basis were as follows:
| | | | | | | | | | | | |
| | | Multi-Manager Global Equity
Fund | | | Multi-Manager
Non-Core
Fixed Income | | | Multi-Manager
Real Assets
Strategy | |
Undistributed ordinary income — net | | $ | 12,794,597 | | | $ | — | | | $ | 16,513,642 | |
Undistributed long-term capital gains | | | 12,162,203 | | | | — | | | | 3,310,621 | |
Total undistributed earnings | | $ | 24,956,800 | | | $ | — | | | $ | 19,824,263 | |
Capital loss carryforwards Timing differences (Straddle Loss Deferral) Unrealized gains (losses) — net | | $
| —
(14,996 38,301,038 |
) | | $
| (13,320,723
(3,013,471 777,641 | )
) | | $
| —
— 45,132,582 |
|
Total accumulated earnings (losses) net | | $ | 63,242,842 | | | $ | (15,556,553 | ) | | $ | 64,956,845 | |
96
GOLDMAN SACHS STRATEGIC MULTI-ASSET CLASS FUNDS
|
| 7. TAX INFORMATION (continued) |
| | | | | | | | | | | | |
| | | Multi-Manager
Global Equity
Fund | | | Multi-Manager
Non-Core
Fixed Income | | | Multi-Manager
Real Assets
Strategy | |
Capital loss carryforward: | | | | | | | | | | | | |
Perpetual short-term | | $ | — | | | $ | (4,706,113 | ) | | $ | — | |
Perpetual long-term | | | — | | | | (8,614,610 | ) | | | — | |
Total capital loss carryforwards: | | $ | — | | | $ | (13,320,723 | ) | | $ | — | |
As of October 31, 2019, the Funds’ aggregate security unrealized gains and losses based on cost for U.S. federal income tax purposes were as follows:
| | | | | | | | | | | | |
| | | Multi-Manager
Global Equity
Fund | | | Multi-Manager
Non-Core
Fixed Income | | | Multi-Manager
Real Assets
Strategy | |
Tax Cost | | $ | 422,694,755 | | | $ | 842,517,935 | | | $ | 402,848,404 | |
Gross unrealized gain
| | | 48,090,176 | | | | 21,754,982 | | | | 52,005,027 | |
Gross unrealized loss | | | (9,789,138 | ) | | | (20,977,341 | ) | | | (6,872,445 | ) |
Net unrealized gains (losses) on securities | | | 38,301,038 | | | | 777,641 | | | $ | 45,132,582 | |
The difference between GAAP-basis and tax basis unrealized gains (losses) is attributable primarily to wash sales, net mark to market gains/(losses) on regulated futures contracts, net mark to market gains/(losses) on foreign currency contracts and differences in the tax treatment of swap transactions, underlying fund investments, passive foreign investment company investments, real estate investment trust investments and material modification of debt securities.
GSAM has reviewed the Funds’ tax positions for all open tax years (the current and prior three years, as applicable) and has concluded that no provision for income tax is required in the Funds’ financial statements. Such open tax years remain subject to examination and adjustment by tax authorities.
The Funds’ risks include, but are not limited to, the following:
Derivatives Risk — The Funds’ use of derivatives may result in loss. Derivative instruments, which may pose risks in addition to and greater than those associated with investing directly in securities, currencies or other instruments, may be illiquid or less liquid, volatile, difficult to price and leveraged so that small changes in the value of the underlying instruments may produce disproportionate losses to the Funds. Derivatives are also subject to counterparty risk, which is the risk that the other party in the transaction will not fulfill its contractual obligation. The use of derivatives is a highly specialized activity that involves investment techniques and risks different from those associated with investments in more traditional securities and instruments. Losses from derivatives can also result from a lack of correlation between changes in the value of derivative instruments and the portfolio assets (if any) being hedged.
Foreign and Emerging Countries Risk — Investing in foreign markets may involve special risks and considerations not typically associated with investing in the United States. Foreign securities may be subject to risk of loss because of more or less foreign government regulation, less public information and less economic, political and social stability in the countries in which the Funds invest. The imposition of exchange controls (including repatriation restrictions), confiscation of assets and property, trade restrictions (including tariffs) and other government restrictions by the United States or other governments, or from problems in share registration, settlement or custody, may also result in losses. Foreign risk also involves the risk of negative foreign currency rate fluctuations, which may cause the value of securities denominated in such foreign currency (or other instruments through
97
GOLDMAN SACHS STRATEGIC MULTI-ASSET CLASS FUNDS
Notes to Financial Statements(continued)
October 31, 2019
|
| 8. OTHER RISKS (continued) |
which the Funds have exposure to foreign currencies) to decline in value. Currency exchange rates may fluctuate significantly over short periods of time. To the extent that the Funds also invest in securities of issuers located in emerging markets, these risks may be more pronounced.
Foreign Custody Risk— If a Fund invests in foreign securities, the Fund may hold such securities and cash with foreign banks, agents, and securities depositories appointed by the Fund’s custodian (each a “Foreign Custodian”). Some foreign custodians may be recently organized or new to the foreign custody business. In some countries, Foreign Custodians may be subject to little or no regulatory oversight over, or independent evaluation of, their operations. Further, the laws of certain countries may place limitations on a Fund’s ability to recover its assets if a Foreign Custodian enters bankruptcy.
Investments in emerging markets may be subject to even greater custody risks than investments in more developed markets. Custody services in emerging market countries are very often undeveloped and may be considerably less well regulated than in more developed countries, and thus may not afford the same level of investor protection as would apply in developed countries.
Interest Rate Risk — When interest rates increase, fixed income securities or instruments held by the Funds will generally decline in value. Long-term fixed income securities or instruments will normally have more price volatility because of this risk than short-term fixed income securities or instruments. The risks associated with changing interest rates may have unpredictable effects on the markets and a Fund’s investments. Fluctuations in interest rates may also affect the liquidity of fixed income securities and instruments held by the Funds.
Investments in Other Investment Companies Risk — As a shareholder of another investment company, including an ETF, a Fund will indirectly bear its proportionate share of any net management fees and other expenses paid by such other investment companies, in addition to the fees and expenses regularly borne by the Fund. ETFs are subject to risks that do not apply to conventional mutual funds, including but not limited to the following: (i) the market price of the ETF’s shares may trade at a premium or a discount to their NAV; and (ii) an active trading market for an ETF’s shares may not develop or be maintained.
Large Shareholder Transactions Risk — A Fund may experience adverse effects when certain large shareholders, such as other funds, institutional investors (including those trading by use ofnon-discretionary mathematical formulas), financial intermediaries (who may make investment decisions on behalf of underlying clients and/or include a Fund in their investment model), individuals, accounts and Goldman Sachs affiliates, purchase or redeem large amounts of shares of a Fund. Such large shareholder redemptions, which may occur rapidly or unexpectedly, may cause a Fund to sell portfolio securities at times when it would not otherwise do so, which may negatively impact a Fund’s NAV and liquidity. These transactions may also accelerate the realization of taxable income to shareholders if such sales of investments resulted in gains, and may also increase transaction costs. In addition, a large redemption could result in a Fund’s current expenses being allocated over a smaller asset base, leading to an increase in the Fund’s expense ratio. Similarly, large Fund share purchases may adversely affect a Fund’s performance to the extent that the Fund is delayed in investing new cash or otherwise maintains a larger cash position than it ordinarily would.
Liquidity Risk — A Fund may make investments that are illiquid or that may become less liquid in response to market developments or adverse investor perceptions. Illiquid investments may be more difficult to value. Liquidity risk may also refer to the risk that a Fund will not be able to pay redemption proceeds within the allowable time period or without significant dilution to remaining investors’ interests because of unusual market conditions, an unusually high volume of redemption requests, or other reasons. To meet redemption requests, a Fund may be forced to sell investments at an unfavorable time and/or under unfavorable conditions. If a Fund is forced to sell securities at an unfavorable time and/or under unfavorable conditions, such sales may adversely affect the Fund’s NAV and dilute remaining investors’ interests. Liquidity risk may be the result of, among other things, the reduced number and capacity of traditional market participants to make a market in fixed income securities or the lack of an active market. The potential for liquidity risk may be magnified by a rising interest rate environment or other circumstances where investor redemptions from fixed income mutual funds may be higher than normal, potentially causing increased supply in the market due to selling activity. These risks may be more pronounced in connection with a Fund’s investments in securities of issuers located in emerging market countries. Redemptions by large shareholders may have a negative impact on a Fund’s liquidity.
98
GOLDMAN SACHS STRATEGIC MULTI-ASSET CLASS FUNDS
|
| 8. OTHER RISKS (continued) |
Loan-Related Investments Risk — In addition to risks generally associated with debt investments (e.g., interest rate risk and default risk), loan-related investments such as loan participations and assignments are subject to other risks. Although a loan obligation may be fully collateralized at the time of acquisition, the collateral may decline in value, be or become illiquid or less liquid, or lose all or substantially all of its value subsequent to investment. Many loan investments are subject to legal or contractual restrictions on resale and certain loan investments may be or become illiquid or less liquid and more difficult to value, particularly in the event of a downgrade of the loan or the borrower. There is less readily available, reliable information about most loan investments than is the case for many other types of securities. Substantial increases in interest rates may cause an increase in loan obligation defaults. With respect to loan participations, a Fund may not always have direct recourse against a borrower if the borrower fails to pay scheduled principal and/or interest; may be subject to greater delays, expenses and risks than if the Fund had purchased a direct obligation of the borrower; and may be regarded as the creditor of the agent lender (rather than the borrower), subjecting the Fund to the creditworthiness of that lender as well. Investors in loans, such as a Fund, may not be entitled to rely on the anti-fraud protections of the federal securities laws, although they may be entitled to certain contractual remedies. The market for loan obligations may be subject to irregular trading activity, wide bid/ask spreads and extended trade settlement periods. Because transactions in many loans are subject to extended trade settlement periods, a Fund may not receive the proceeds from the sale of a loan for a period after the sale. As a result, sale proceeds related to the sale of loans may not be available to make additional investments or to meet a Fund’s redemption obligations for a period after the sale of the loans, and, as a result, the Fund may have to sell other investments or engage in borrowing transactions, such as borrowing from its credit facility, if necessary to raise cash to meet its obligations.
Senior Loans hold the most senior position in the capital structure of a business entity, and are typically secured with specific collateral, but are nevertheless usually rated below investment grade. Because Second Lien Loans are subordinated or unsecured and thus lower in priority of payment to Senior Loans, they are subject to the additional risk that the cash flow of the borrower and property securing the loan or debt, if any, may be insufficient to meet scheduled payments after giving effect to the senior secured obligations of the borrower. Second Lien Loans generally have greater price volatility than Senior Loans and may be less liquid.
Market and Credit Risks — In the normal course of business, a Fund trades financial instruments and enters into financial transactions where risk of potential loss exists due to changes in the market (market risk). Additionally, the Funds may also be exposed to credit risk in the event that an issuer or guarantor fails to perform or that an institution or entity with which the Funds have unsettled or open transactions defaults.
Multi-Manager Approach Risk — The Funds’ performance depends on the ability of the Investment Adviser in selecting, overseeing, and allocating Fund assets to the Underlying Managers. The Underlying Managers’ investment styles may not always be complementary. The Funds’ multi-manager approach may result in the Fund investing a significant percentage of its assets in certain types of investments, which could be beneficial or detrimental to the Funds’ performance depending on the performance of those investments and the overall market environment. The Funds’ Underlying Managers may underperform the market generally or underperform other investment managers that could have been selected for the Funds. Because the Funds’ Underlying Managers may trade with counterparties, prime brokers, clearing brokers or futures commission merchants on terms that are different than those on which the Investment Adviser would trade, and because each Underlying Manager applies its own risk analysis in evaluating potential counterparties for the Funds, the Funds may be subject to greater counterparty risk than if they were managed directly by the Investment Adviser.
Under the Trust’s organizational documents, its Trustees, officers, employees and agents are indemnified, to the extent permitted by the Act and state law, against certain liabilities that may arise out of performance of their duties to the Funds. Additionally, in the course of business, the Funds enter into contracts that contain a variety of indemnification clauses. The Funds maximum exposure under these arrangements is unknown, as this would involve future claims that may be made against the Funds that have not yet occurred. However, GSAM believes the risk of loss under these arrangements to be remote.
99
GOLDMAN SACHS STRATEGIC MULTI-ASSET CLASS FUNDS
Notes to Financial Statements(continued)
October 31, 2019
In March 2017, the Financial Accounting Standards Board issued Accounting Standards Update (ASU)2017-08 – Receivables – Nonrefundable Fees and Other Costs (Subtopic310-20): Premium Amortization on Purchased Callable Debt Securities. The amendments in the ASU shorten the amortization period for certain callable debt securities held at a premium, by requiring amortization to the earliest call date. The ASU is effective for fiscal years, and interim periods within those fiscal years, beginning after December 15, 2018. GSAM is currently evaluating the impact, if any, of the amendments.
Subsequent events after the Statements of Assets and Liabilities date other than above have been evaluated, and GSAM has concluded that there is no impact requiring adjustment or disclosure in the financial statements.
|
| 12. SUMMARY OF SHARE TRANSACTIONS |
| | | | | | | | | | | | | | | | |
| | | Multi-Manager Global Equity Fund | |
| | | | |
| | | For the Fiscal Year Ended
October 31, 2019
| | | For the Fiscal Year Ended
October 31, 2018
| |
| | | | |
| | | Shares | | | Dollars | | | Shares | | | Dollars | |
| | | | |
| Class R6 Shares(a) | |
Shares sold | | | 11,269,092 | | | $ | 112,385,000 | | | | 19,647,160 | | | $ | 224,350,010 | |
Reinvestment of distributions | | | 4,729,280 | | | | 45,106,144 | | | | 1,422,831 | | | | 16,134,908 | |
Shares redeemed | | | (33,507,312 | ) | | | (353,974,521 | ) | | | (4,562,894 | ) | | | (53,000,010 | ) |
| | | | |
NET INCREASE (DECREASE) | | | (17,508,940 | ) | | $ | (196,483,377 | ) | | | 16,507,097 | | | $ | 187,484,908 | |
| |
| | | Multi-ManagerNon-Core Fixed Income Fund | |
| | | | |
| | | For the Fiscal Year Ended
October 31, 2019
| | | For the Fiscal Year Ended
October 31, 2018
| |
| | | | |
| | | Shares | | | Dollars | | | Shares | | | Dollars | |
| | | | |
| Class R6 Shares(a) | |
Shares sold | | | 51,695,826 | | | $ | 463,878,772 | | | | 37,020,923 | | | $ | 343,095,015 | |
Reinvestment of distributions | | | 5,356,955 | | | | 48,005,796 | | | | 3,298,557 | | | | 30,411,488 | |
Shares redeemed | | | (43,963,119 | ) | | | (396,921,299 | ) | | | (4,695,828 | ) | | | (42,240,015 | ) |
| | | | |
NET INCREASE | | | 13,089,662 | | | $ | 114,963,269 | | | | 35,623,652 | | | $ | 331,266,488 | |
| |
| | | Multi-Manager Real Assets Strategy Fund | |
| | | | |
| | | For the Fiscal Year Ended
October 31, 2019
| | | For the Fiscal Year Ended
October 31, 2018
| |
| | | | |
| | | Shares | | | Dollars | | | Shares | | | Dollars | |
| | | | |
| Class R6 Shares(a) | |
Shares sold | | | 10,886,591 | | | $ | 112,080,000 | | | | 28,269,374 | | | $ | 272,441,005 | |
Reinvestment of distributions | | | 1,177,709 | | | | 10,439,193 | | | | 567,208 | | | | 5,483,013 | |
Shares redeemed | | | (12,189,226 | ) | | | (124,929,890 | ) | | | (8,958,849 | ) | | | (87,285,114 | ) |
| | | | |
NET INCREASE (DECREASE) | | | (124,926 | ) | | $ | (2,410,697 | ) | | | 19,877,733 | | | $ | 190,638,904 | |
| (a) | | Effective January 16, 2018, Institutional Shares were redesignated as Class R6 Shares. |
100
Report of Independent Registered Public
Accounting Firm
Tothe Board of Trustees of Goldman Sachs Trust II and Shareholders of
Goldman Sachs Multi-Manager Global Equity Fund, Goldman Sachs Multi-ManagerNon-Core Fixed Income Fund, and Goldman Sachs Multi-Manager Real Assets Strategy Fund
Opinions on the Financial Statements
We have audited the accompanying statements of assets and liabilities, including the schedules of investments, of Goldman Sachs Multi-Manager Global Equity Fund, Goldman Sachs Multi-ManagerNon-Core Fixed Income Fund, and Goldman Sachs Multi-Manager Real Assets Strategy Fund (three of the funds constituting Goldman Sachs Trust II, hereafter collectively referred to as the “Funds”) as of October 31, 2019, the related statements of operations for the year ended October 31, 2019, the statements of changes in net assets for each of the two years in the period ended October 31, 2019, including the related notes,and the financial highlights for each of the periods indicated therein (collectively referred to as the “financial statements”). In our opinion, the financial statements present fairly, in all material respects, the financial position of each of the Funds as of October 31, 2019, the results of each of their operations for the year then ended, the changes in each of their net assets for each of the two years in the period ended October 31, 2019 and each of the financial highlights for each of the periods indicated therein in conformity with accounting principles generally accepted in the United States of America.
Basis for Opinions
These financial statements are the responsibility of the Funds’ management. Our responsibility is to express an opinion on the Funds’ financial statements based on our audits. We are a public accounting firm registered with the Public Company Accounting Oversight Board (United States) (PCAOB) and are required to be independent with respect to the Funds in accordance with the U.S. federal securities laws and the applicable rules and regulations of the Securities and Exchange Commission and the PCAOB.
We conducted our audits of these financial statements in accordance with the standards of the PCAOB. Those standards require that we plan and perform the audit to obtain reasonable assurance about whether the financial statements are free of material misstatement, whether due to error or fraud.
Our audits included performing procedures to assess the risks of material misstatement of the financial statements, whether due to error or fraud, and performing procedures that respond to those risks. Such procedures included examining, on a test basis, evidence regarding the amounts and disclosures in the financial statements. Our audits also included evaluating the accounting principles used and significant estimates made by management, as well as evaluating the overall presentation of the financial statements. Our procedures included confirmation of securities owned as of October 31, 2019 by correspondence with the custodian, transfer agent and brokers; when replies were not received from brokers, we performed other auditing procedures. We believe that our audits provide a reasonable basis for our opinions.
PricewaterhouseCoopers LLP
Boston, Massachusetts
December 23, 2019
We have served as the auditor of one or more investment companies in the Goldman Sachs fund complex since 2000.
101
GOLDMAN SACHS STRATEGIC MULTI-ASSET CLASS FUNDS
Fund Expenses — Six Month Period Ended October 31, 2019 (Unaudited)
As a shareholder of Class R6 Shares of the Funds, you incur two types of costs: (1) transaction costs, including sales charges on purchase payments, and (2) ongoing costs, including management fees; and other Fund expenses. This example is intended to help you understand your ongoing costs (in dollars) of investing in the Funds and to compare these costs with the ongoing costs of investing in other mutual
funds.
The example is based on an investment of $1,000 invested at the beginning of the period and held for the entire period from May 1, 2019 through October 31, 2019, which represents a period of 184 days in a365-day year.
Actual Expenses— The first line under each share class in the table below provides information about actual account values and actual expenses. You may use the information in this line, together with the amount you invested, to estimate the expenses that you paid over the period. Simply divide your account value by $1,000 (for example, an $8,600 account value divided by $1,000=8.6), then multiply the result by the number in the first line under the heading entitled “Expenses Paid” to estimate the expenses you paid on your account during this period.
Hypothetical Example for Comparison Purposes— The second line under each share class in the table below provides information about hypothetical account values and hypothetical expenses based on the Funds’ actual net expense ratios and an assumed rate of return of 5% per year before expenses, which is not the Funds’ actual return. The hypothetical account values and expenses may not be used to estimate the actual ending account balance or expenses you paid for the period. You may use this information to compare the ongoing costs of investing in the Funds and other funds. To do so, compare this 5% hypothetical example with the 5% hypothetical examples that appear in the shareholder reports of the other funds.
Please note that the expenses shown in the table are meant to highlight your ongoing costs only and do not reflect any transactional costs, such as sales charges, redemption fees, or exchange fees. Therefore, the second line of the table is useful in comparing ongoing costs only, and will not help you determine the relative total costs of owning different funds. In addition, if these transactional costs were included, your costs would have been higher.
| | | | | | | | | | | | | | | | | | | | | | | | | | | | | | | | | | | | |
| | | Multi-Manager Global Equity Fund | | | Multi-Manager Non-Core Fixed Income Fund | | | Multi-Manager Real Assets Strategy Fund | |
| Share Class | | Beginning
Account
Value
5/1/19 | | | Ending
Account
Value
10/31/19 | | | Expenses
Paid for the
6 months ended
10/31/19* | | | Beginning
Account
Value
5/1/19 | | | Ending
Account
Value
10/31/19 | | | Expenses
Paid for the
6 months ended
10/31/19* | | | Beginning
Account
Value
5/1/19 | | | Ending
Account
Value
10/31/19 | | | Expenses
Paid for the
6 months ended
10/31/19* | |
| Class R6 | | | | | | | | | | | | | | | | | | | | | | | | | | | | | | | | | | | | |
Actual | | $ | 1,000.00 | | | $ | 1,025.30 | | | $ | 4.03 | | | $ | 1,000.00 | | | $ | 1,036.20 | | | $ | 3.18 | | | $ | 1,000.00 | | | $ | 1,070.50 | | | $ | 4.38 | |
Hypothetical 5% return | | | 1,000.00 | | | | 1,021.22 | + | | | 4.02 | | | | 1,000.00 | | | | 1,022.08 | + | | | 3.16 | | | | 1,000.00 | | | | 1,020.97 | + | | | 4.28 | |
| + | | Hypothetical expenses are based on each Fund’s actual annualized net expense ratios and an assumed rate of return of 5% per year before expenses. |
| * | | Expenses are calculated using the Fund’s annualized net expense ratio for each class, which represents the ongoing expenses as a percentage of net assets for the six months ended October 31, 2019. Expenses are calculated by multiplying the annualized net expense ratio by the average account value for the period; then multiplying the result by the number of days in the most recent fiscal half year; and then dividing that result by the number of days in the fiscal year. |
The annualized net expense ratios for the period were as follows:
| | | | |
| Fund | | Class R6 | |
Multi-Manager Global Equity | | | 0.72 | % |
Multi-ManagerNon-Core Fixed Income | | | 0.62 | |
Multi-Manager Real Assets Strategy | | | 0.84 | |
102
GOLDMAN SACHS STRATEGIC MULTI-ASSET CLASS FUNDS
Statement Regarding Basis for Approval of Management Agreement andSub-Advisory Agreements (Unaudited)
Background
The Goldman Sachs Multi-Manager Global Equity Fund, Goldman Sachs Multi-ManagerNon-Core Fixed Income Fund, and Goldman Sachs Multi-Manager Real Assets Strategy Fund (the “Funds”) are investment portfolios of Goldman Sachs Trust II (the “Trust”). The Board of Trustees oversees the management of the Trust and reviews the investment performance and expenses of the Funds at regularly scheduled meetings held throughout the year. Each Fund employs a “manager of managers” structure, whereby Goldman Sachs Asset Management, L.P. (the “Investment Adviser”) is responsible for selectingsub-advisers (subject to Board approval), allocating the Fund’s assets among them, and overseeing theirday-to-day management of Fund assets. The Board determines annually whether to approve the continuance of the Trust’s investment management agreement (the “Management Agreement”) with the Investment Adviser on behalf of the Funds.
The Management Agreement was most recently approved for continuation until August 31, 2020 by the Board, including those Trustees who are not parties to the Management Agreement or “interested persons” (as defined in the Investment Company Act of 1940, as amended) of any party thereto (the “Independent Trustees”), at a meeting held on August6-7, 2019 (the “Annual Meeting”). At the Annual Meeting, the Board also considered thesub-advisory agreements (each a “DesignatedSub-Advisory Agreement” and, together with the Management Agreement, the “Agreements”) between the Investment Adviser and (i) each of Boston Partners Global Investors, Inc., Causeway Capital Management LLC, DWS Investment Management Americas, Inc., Fisher Asset Management, LLC, GW&K Investment Management, LLC, Legal & General Investment Management Americas, Inc., Principal Global Investors, LLC, QMA LLC, Russell Investment Commodity Advisor, LLC, Vaughan Nelson Investment Management, L.P., Vulcan Value Partners, LLC, WCM Investment Management, and Wellington Management Company LLP (on behalf of Goldman Sachs Multi-Manager Global Equity Fund); (ii) each of Ares Capital Management II LLC, BlueBay Asset Management LLP, Brigade Capital Management, LP, Symphony Asset Management LLC, and TCW Investment Management Company LLC (on behalf of Goldman Sachs Multi-ManagerNon-Core Fixed Income Fund); and (iii) each of PGIM Real Estate (a business unit of PGIM, Inc.), Presima Inc., and RREEF America L.L.C. (on behalf of Goldman Sachs Multi-Manager Real Assets Strategy Fund) (each, a “DesignatedSub-Adviser” and collectively, the “DesignatedSub-Advisers”).
The review process undertaken by the Trustees spans the course of the year and culminates with the Annual Meeting. To assist the Trustees in their deliberations, the Trustees have established a Contract Review Committee (the “Committee”), comprised of the Independent Trustees. The Committee held four meetings over the course of the year since the Management Agreement was last approved. At those Committee meetings, regularly scheduled Board or other committee meetings, and/or the Annual Meeting, matters relevant to the renewal of the Management Agreement and the DesignatedSub-Advisory Agreements were considered by the Board, or the Independent Trustees, as applicable. With respect to each Fund, such matters included:
| | (a) | | the nature and quality of the advisory, administrative, and other services provided to the Fund by the Investment Adviser and its affiliates, and the DesignatedSub-Advisers, including, as applicable, information about: |
| | (i) | | the structure, staff, and capabilities of the Investment Adviser and the DesignatedSub-Advisers and the DesignatedSub-Advisers’ portfolio management teams; |
| | (ii) | | the groups within the Investment Adviser and its affiliates that support the portfolio management teams or provide other types of necessary services, including fund services groups (e.g., accounting and financial reporting, tax, shareholder services, and operations); controls and risk management groups (e.g., legal, compliance, valuation oversight, credit risk management, internal audit, compliance testing, market risk analysis, finance, and central funding); sales and distribution support groups, and others (e.g., information technology and training); |
| | (iii) | | trends in employee headcount; |
| | (iv) | | the Investment Adviser’s financial resources and ability to hire and retain talented personnel and strengthen its operations; and |
| | (v) | | the parent company’s support of the Investment Adviser and its mutual fund business, as expressed by the firm’s senior management; |
| | (b) | | information on the investment performance of the Fund, including comparisons to the performance of similar mutual funds, as provided by a third-party mutual fund data provider engaged as part of the contract review process (the “Outside Data Provider”), benchmark performance indices, and, with respect to the Goldman Sachs Multi-Manager Global Equity Fund, commingled investment vehicles with comparable investment strategies managed by the Investment Adviser, as well as general investment outlooks in the markets in which the Fund invests; |
| | (c) | | information provided by the Investment Adviser indicating the Investment Adviser’s views on whether the Fund’s peer group and/or benchmark index had high, medium, or low relevance given the Fund’s particular investment strategy; |
| | (d) | | the terms of the Agreements and other agreements with affiliated service providers entered into by the Trust on behalf of the Fund; |
103
GOLDMAN SACHS STRATEGIC MULTI-ASSET CLASS FUNDS
Statement Regarding Basis for Approval of Management Agreement andSub-Advisory Agreements (Unaudited) (continued)
| | (e) | | fee and expense information for the Fund, including: |
| | (i) | | the relative management fee and expense levels of the Fund as compared to those of comparable funds managed by other advisers, as provided by the Outside Data Provider; |
| | (ii) | | the Fund’s expense trends over time; and |
| | (iii) | | with respect to the Goldman Sachs Multi-Manager Global Equity Fund, comparative information on the advisory fees charged and services provided by the Investment Adviser to certain collective investment vehicles that it manages with comparable investment strategies; |
| | (f) | | with respect to the extensive investment performance and expense comparison data provided by the Outside Data Provider, its processes in producing that data for the Fund; |
| | (g) | | the undertakings of the Investment Adviser and its affiliates to implement fee waivers and/or expense limitations; |
| | (h) | | information relating to the profitability of the Management Agreement and the transfer agency arrangements of the Fund to the Investment Adviser and its affiliates; |
| | (i) | | whether the Fund’s existing management fee schedule adequately addressed any economies of scale; |
| | (j) | | a summary of the“fall-out” benefits derived by the Investment Adviser and its affiliates from their relationships with the Fund, including the fees received by the Investment Adviser’s affiliates from the Fund for transfer agency, portfolio trading, and other services; |
| | (k) | | a summary of potential benefits derived by the Fund as a result of its relationship with the Investment Adviser; |
| | (l) | | with respect to the Investment Adviser, portfolio manager ownership of Fund shares and the manner in which portfolio manager compensation is determined; information on the DesignatedSub-Advisers’ compensation arrangements; and the number and types of accounts managed by the portfolio managers; |
| | (m) | | the nature and quality of the services provided to the Fund by its unaffiliated service providers (as well as the DesignatedSub-Advisers), and the Investment Adviser’s general oversight and evaluation (including reports on due diligence) of those service providers as part of the services provided under the Management Agreement; and |
| | (n) | | the Investment Adviser’s and DesignatedSub-Advisers’ processes and policies addressing various types of potential conflicts of interest; their approaches to risk management; the annual review of the effectiveness of the Fund’s compliance program; and periodic compliance reports. |
The Trustees also received an overview of the Funds’ distribution arrangements. They received information regarding the Funds’ assets and share purchase and redemption activity.
The presentations made at the Board and Committee meetings and at the Annual Meeting encompassed the Funds and other mutual funds for which the Board of Trustees has responsibility. In evaluating the Agreements at the Annual Meeting, the Trustees relied upon their knowledge, resulting from their meetings and other interactions throughout the year, of the Funds and the respective services of the Investment Adviser and its affiliates, and the DesignatedSub-Advisers. In conjunction with these meetings, the Trustees received written materials and oral presentations on the topics covered, and the Investment Adviser addressed the questions and concerns of the Trustees, including concerns regarding the investment performance of certain of the funds they oversee. In addition, the Trustees periodically received written materials and oral presentations from the funds’ varioussub-advisers, including the DesignatedSub-Advisers. The Independent Trustees were advised by their independent legal counsel regarding their responsibilities and other regulatory requirements related to the approval and continuation of mutual fund investment management agreements under applicable law. In addition, the Investment Adviser and its affiliates provided the Independent Trustees with a written response to a formal request for information sent on behalf of the Independent Trustees by their independent legal counsel. The Trustees reviewed a written response prepared by each DesignatedSub-Adviser to a similar request for information submitted to the DesignatedSub-Adviser by the Investment Adviser. During the course of their deliberations, the Independent Trustees met in executive sessions with their independent legal counsel, without representatives of the Investment Adviser or its affiliates present.
Nature, Extent, and Quality of the Services Provided Under the Management Agreement
As part of their review, the Trustees considered the nature, extent, and quality of the services provided to the Funds by the Investment Adviser. In this regard, the Trustees considered both the investment advisory services andnon-advisory services that are provided by the Investment Adviser and its affiliates. They also recalled presentations received during the past year, which described portfolio management changes for the Funds. The Trustees noted the ongoing recruitment efforts aimed at bringing high quality investment talent to the Investment Adviser. They also noted the Investment Adviser’s commitment to maintaining high quality systems and expending substantial resources to respond to ongoing changes to the regulatory and control environment in which the Funds and their service providers operate, as well as the efforts of the Investment Adviser and its affiliates to combat
104
GOLDMAN SACHS STRATEGIC MULTI-ASSET CLASS FUNDS
Statement Regarding Basis for Approval of Management Agreement andSub-Advisory Agreements (Unaudited) (continued)
cyber security risks. The Trustees concluded that the Investment Adviser continued to commit substantial financial and operational resources to the Funds and expressed confidence that the Investment Adviser would continue to do so in the future. The Trustees also recognized that the Investment Adviser had made significant commitments to address regulatory compliance requirements applicable to the Funds and the Investment Adviser and its affiliates. In addition, the Trustees reviewed theSub-Adviser oversight process that the Investment Adviser had employed, which included areas such as investment analytics, risk management and compliance.
Investment Performance
The Trustees also considered the investment performance of the Funds. In this regard, they compared the investment performance ofeach Fund to its peers usingrankings compiled by the Outside Data Provider, and updated performance information prepared by the Investment Adviser using the peer groups identified by the Outside Data Provider. The Trustees also reviewed each Fund’s investment performance relative to its performance benchmark. As part of this review, they considered the investment performance trends of the Funds over time, and reviewed the investment performance of each Fund in light of its investment objective and policies and market conditions.The Trustees considered the Investment Adviser’s representations that each Fund had significant differences from its Outside Data Provider peer group that caused them to be imperfect bases for comparison. The Trustees also compared the investment performance of the Goldman Sachs Multi-Manager Global Equity Fund to the performance of comparable unregistered funds for which the Investment Adviser also serves as investment adviser. They considered that the unregistered funds provide an imperfect performance comparison because they are not subject to the requirements of the Investment Company Act of 1940, as amended.
In addition, the Trustees considered materials prepared and presentations made by the Investment Adviser’s senior management and theSub-Advisers’ portfolio management personnel in which Fund performance was assessed. The Trustees also considered the Investment Adviser’s periodic reports with respect to the Funds’ risk profiles, and how the Investment Adviser’s approach to risk monitoring and management influences portfolio management.
The Trustees noted that the Goldman Sachs Multi-Manager Global Equity Fund’s Class R6 Shares had placed in the fourth quartile of the Fund’s performance peer group for theone-year period and the third quartile for the three-year period, and had underperformed the Fund’s benchmark index for theone-year period ended March 31, 2019. They observed that Goldman Sachs Multi-ManagerNon-Core Fixed Income Fund’s Class R6 Shares had placed in the third quartile of the Fund’s performance peer group for theone-year period and second quartile for the three-year period,and had underperformed the Fund’s composite benchmark index for theone-year period ended March 31, 2019. The Trustees noted that the Goldman Sachs Real Assets Strategy Fund’s Class R6 Shares had placed in the first quartile of the Fund’s performance peer group for theone-year period and the fourth quartile for the three-year period, and had underperformed the Fund’s composite benchmark index for theone-year period ended March 31, 2019.
Costs of Services Provided and Competitive Information
The Trustees considered the contractual terms of the Management Agreement, the fee rates payable by each Fund thereunder, and the net amount retained by the Investment Adviser after payment ofsub-advisory fees. In this regard, the Trustees considered information on the services rendered by the Investment Adviser to the Funds, which included both advisory and administrative services that were directed to the needs and operations of the Funds as registered mutual funds.
In particular, the Trustees reviewed analyses prepared by the Outside Data Provider regarding the expense rankings of the Funds, as well as additional information provided by the Investment Adviser throughout the year. The analyses provided a comparison of each Fund’s management fee and breakpoints to those of a relevant peer group and category universe; an expense analysis which compared each Fund’s overall net and gross expenses to a peer group and a category universe; and data comparing each Fund’s net expenses to the peer and category medians. The analyses also compared each Fund’s other expenses and fee waivers/reimbursements to those of the peer group and category medians. With respect to the Goldman Sachs Multi-Manager Global Equity Fund, the Trustees also considered comparative fee information for services provided by the Investment Adviser to collective investment vehicles having investment objectives and policies similar to those of the Fund. The Trustees considered that services provided to the Funds differed in various significant respects from the services provided to these collective investment vehicles, which generally operated under less stringent regulatory and financial reporting requirements and required fewer services from the Investment Adviser. The Trustees concluded that the comparisons provided by the Outside Data Provider and the Investment Adviser were useful in evaluating the reasonableness of the management fees and total expenses paid by the Funds.
The Trustees considered the Investment Adviser’s undertaking to waive a portion of the management fee payable by each Fund. In this regard, the Trustees noted that the Investment Adviser’s institutional clients that are invested in the Funds pay a
105
GOLDMAN SACHS STRATEGIC MULTI-ASSET CLASS FUNDS
Statement Regarding Basis for Approval of Management Agreement andSub-Advisory Agreements (Unaudited) (continued)
single management fee for the Investment Adviser’s management of their accounts, and that the Investment Adviser waives a portion of the management fee with respect to each Fund in order to achieve an effective net management fee rate that is equal to the actual cost of fees paid to the Fund’ssub-advisers. They also considered the Investment Adviser’s undertaking to limit each Fund’s “other expenses” rate (excluding certain expenses) to a specified level. In addition, the Trustees noted that shareholders are able to redeem their Fund shares at any time if shareholders believe that the Fund fees and expenses are too high or if they are dissatisfied with the performance of the Fund.
The Investment Adviser’s Profitability
The Trustees reviewed each Fund’s contribution to the Investment Adviser’s revenues andpre-tax profit margins. In this regard the Trustees noted that they had received, among other things, profitability analyses and summaries, revenue and expense schedules by Fund and by function (i.e., investment management, transfer agency, and distribution and service), and information on the Investment Adviser’s expense allocation methodology. They observed that the profitability and expense figures are substantially similar to those used by the Investment Adviser for many internal purposes, including compensation decisions among various business groups, and are thus subject to a vigorous internal debate about how certain revenue and expenses should be allocated. The Trustees also noted that the internal audit group within the Goldman Sachs organization periodically audits the expense allocation methodology and that the internal audit group was satisfied with the reasonableness, consistency, and accuracy of the Investment Adviser’s expense allocation methodology. Profitability data for each Fund was provided for 2018 and 2017, and the Trustees considered this information in relation to the Investment Adviser’s overall profitability.
Economies of Scale
The Trustees considered the information that had been provided regarding whether there have been economies of scale with respect to the management of the Funds. The Trustees also considered that the Funds are offered to the Investment Adviser’s institutional clients as part of an investment model whereby the Funds and other funds act as core “building blocks” with which the client and the Investment Adviser form an investment strategy for the client’s portfolio. The Trustees considered the Investment Adviser’s representations that its clients benefit from this investment model with increased liquidity, increased investment oversight, access to new investment strategies, economies of scale, and reduced complexity in managing client portfolios. The Trustees noted that, pursuant to the model, clients pay a management fee for the Investment Adviser’s management of their accounts, and that the fund-level management fee in excess of the weighted averagesub-advisory fees are waived in order to avoid charging two layers of management fees. The Trustees also considered the breakpoints in the fee rate payable under the Management Agreement for each of the Funds at the following annual percentage rates of the average daily net assets of the Funds:
| | | | | | | | | | | | |
Average Daily
Net Assets | | Goldman
Sachs Multi-
Manager
Global Equity
Fund | | | Goldman
Sachs Multi-
Manager
Non-Core
Fixed Income
Fund Fund | | | Goldman
Sachs Multi-
Manager Real
Assets
Strategy Fund | |
| | | |
| First $1 billion | | | 1.03 | % | | | 0.85 | % | | | 1.00 | % |
| | | |
| Next $1 billion | | | 0.93 | | | | 0.85 | | | | 0.90 | |
| | | |
| Next $3 billion | | | 0.89 | | | | 0.77 | | | | 0.86 | |
| | | |
| Next $3 billion | | | 0.87 | | | | 0.73 | | | | 0.84 | |
| | | |
| Over $8 billion | | | 0.84 | | | | 0.71 | | | | 0.82 | |
The Trustees noted that the breakpoints were designed to share potential economies of scale, if any, with the Funds and their shareholders as assets under management reach those asset levels. The Trustees considered the amounts of assets in the Funds; the Funds’ recent share purchase and redemption activity; the information provided by the Investment Adviser relating to the costs of the services provided by the Investment Adviser and its affiliates and their realized profits (if any); information comparing fee rates charged by the Investment Adviser with fee rates charged to other funds in the peer groups; and the Investment Adviser’s undertakings to waive a portion of its management fee and to limit certain expenses of the Funds that exceed specified levels. The Trustees also considered the relationship between the advisory andsub-advisory fee rate schedules. Upon reviewing these matters at the Annual Meeting, the Trustees concluded that the fee breakpoints represented a means of assuring that benefits of scalability, if any, would be passed along to shareholders at the specified asset levels.
106
GOLDMAN SACHS STRATEGIC MULTI-ASSET CLASS FUNDS
Statement Regarding Basis for Approval of Management Agreement andSub-Advisory Agreements (Unaudited) (continued)
Other Benefits to the Investment Adviser and Its Affiliates
The Trustees also considered the other benefits derived by the Investment Adviser and its affiliates from their relationships with the Funds, including: (a) transfer agency fees received by Goldman Sachs & Co. LLC (“Goldman Sachs”); (b) brokerage and futures commissions earned by Goldman Sachs for executing securities transactions (in its capacity as clearing broker) and futures transactions on behalf of the Funds; (c) the Investment Adviser’s ability to leverage the infrastructure designed to service the Funds on behalf of the Investment Adviser’s other clients; (d) the Investment Adviser’s ability to cross-market other products and services to Fund shareholders; (e) the Investment Adviser’s ability to negotiate better pricing with the Funds’ custodian on behalf of its other clients, as a result of the relationship with the Funds; and (f) the possibility that the working relationship between the Investment Adviser and the Funds’ third-party service providers (including theSub-Advisers) may cause those service providers to be more likely to do business with other areas of Goldman Sachs. In the course of considering the foregoing, the Independent Trustees requested and received further information quantifying certain of thesefall-out benefits.
Other Benefits to the Funds and Their Shareholders
The Trustees also noted that the Funds receive certain other potential benefits as a result of their relationship with the Investment Adviser, including: (a) enhanced servicing from vendors due to the volume of business generated by the Investment Adviser and its affiliates; (b) the advantages received from the Investment Adviser’s knowledge and experience gained from managing other accounts and products; (c) the Investment Adviser’s ability to hire and retain qualified personnel to provide services to the Funds because of the reputation of the Goldman Sachs organization; (d) the Funds’ access, through the Investment Adviser, to certain firm-wide resources (e.g., proprietary risk management systems and databases), subject to certain restrictions; and (e) access to certain affiliated distribution channels.
Conclusion
In connection with their consideration of the Management Agreement, the Trustees gave weight to various factors, but did not identify any particular factor as controlling their decision. After deliberation and consideration of the information provided, including the factors described above, the Trustees, including the Independent Trustees, unanimously concluded, in the exercise of their business judgment, that the investment management fees paid by each Fund were reasonable in light of the factors considered, and that the Management Agreement, and the terms thereof, should be approved and continued with respect to each Fund until August 31, 2020.
DesignatedSub-Advisory Agreements
Nature, Extent, and Quality of the Services Provided Under the DesignatedSub-Advisory Agreements and Performance
In evaluating the DesignatedSub-Advisory Agreements, the Trustees relied upon materials furnished and presentations made by the Investment Adviser and the DesignatedSub-Advisers. In evaluating the nature, extent, and quality of services provided by each DesignatedSub-Adviser, the Trustees considered information on the services provided to the Funds by their respective DesignatedSub-Advisers, including information about each DesignatedSub-Adviser’s (a) personnel and compensation structure; (b) track record in managing the Fund and, if applicable, other funds and/or accounts with investment strategies similar to those employed on behalf of the Funds; (c) policies and procedures in place to address potential conflicts of interest; and (d) compliance program and code of ethics. In this regard, they also considered assessments provided by the Investment Adviser of each DesignatedSub-Adviser, the DesignatedSub-Adviser’s investment strategies and personnel, and its compliance program. The Trustees also reviewed the operations and investment performance of each DesignatedSub-Adviser’s respective sleeve of the applicable Fund since its inception, including a comparison of each DesignatedSub-Adviser to relevant benchmark indices based on various metrics, including realized beta, excess return, alpha, and volatility.
Costs of Services Provided
The Trustees reviewed the terms of each DesignatedSub-Advisory Agreement, including the schedule of fees payable to the DesignatedSub-Advisers. They considered any breakpoints in thesub-advisory fee rate payable under each DesignatedSub-Advisory Agreement. The Trustees noted that the compensation paid to each DesignatedSub-Adviser is paid by the Investment Adviser, not by the Funds. The Trustees considered that certain DesignatedSub-Advisers had agreed to reduce theirsub-advisory fee rate, which benefited shareholders of those Funds in light of the existing management fee waiver arrangement. The Trustees reviewed the blended average of allsub-advisory fees paid by the Investment Adviser with respect to each Fund in light of the overall management fee paid by each Fund. They also considered the Investment Adviser’s undertaking to waive a portion of its management fee which is in excess of the weighted average of each Fund’ssub-advisory fees.
107
GOLDMAN SACHS STRATEGIC MULTI-ASSET CLASS FUNDS
Statement Regarding Basis for Approval of Management Agreement andSub-Advisory Agreements (Unaudited) (continued)
Conclusion
In connection with their consideration of the DesignatedSub-Advisory Agreements, the Trustees gave weight to various factors, but did not identify any particular factor as controlling their decision. After deliberation and consideration of the information provided, including the factors described above, the Trustees, including the Independent Trustees, unanimously concluded, in the exercise of their business judgment, that thesub-advisory fees paid by the Investment Adviser to each DesignatedSub-Adviser were reasonable in light of the factors considered, and that each DesignatedSub-Advisory Agreement should be approved and continued until August 31, 2020.
108
GOLDMAN SACHS STRATEGIC MULTI-ASSET CLASS FUNDS
Trustees and Officers (Unaudited)
Independent Trustees
| | | | | | | | | | |
Name,
Address and Age1 | | Position(s) Held
with the Trust | | Term of
Office and
Length of
Time Served2 | | Principal Occupation(s)
During Past 5 Years | | Number of
Portfolios in
Fund Complex
Overseen by
Trustee3 | | Other
Directorships
Held by Trustee4 |
| | | | | |
Cheryl K. Beebe Age: 63 | | Chair of the Board of Trustees | | Since 2017 (Trustee since 2015) | | Ms. Beebe is retired. She is Director, Packaging Corporation of America (2008-Present); Director, The Mosaic Company (2019-Present); and was formerly Director, Convergys Corporation (a global leader in customer experience outsourcing) (2015-2018); and Executive Vice President, (2010-2014); and Chief Financial Officer, Ingredion, Inc. (a leading global ingredient solutions company) (2004-2014). Chair of the Board of Trustees — Goldman Sachs Trust II. | | 19 | | Packaging Corporation of America (producer of container board); The Mosaic Company (producer of phosphate and potash fertilizer) |
| | | | | |
Lawrence Hughes Age: 61 | | Trustee | | Since 2016 | | Mr. Hughes is retired. Formerly, he held senior management positions with BNY Mellon Wealth Management, a division of The Bank of New York Mellon Corporation (a financial services company) (1991-2015), most recently as Chief Executive Officer (2010-2015). He serves as Chairman of the Board of Directors, Ellis Memorial and Eldredge House (a not-for-profit organization) (2012-Present). Previously, Mr. Hughes served as an Advisory Board Member of Goldman Sachs Trust II (February 2016-April 2016). Trustee — Goldman Sachs Trust II. | | 19 | | None |
| | | | | |
John F. Killian Age: 64 | | Trustee | | Since 2015 | | Mr. Killian is retired. He is Director, Consolidated Edison, Inc. (2007-Present); Director, Houghton Mifflin Harcourt Publishing Company (2011-Present); and formerly held senior management positions with Verizon Communications, Inc., including Executive Vice President and Chief Financial Officer (2009-2010); and President, Verizon Business, Verizon Communications, Inc. (2005-2009). Trustee — Goldman Sachs Trust II. | | 19 | | Consolidated Edison, Inc. (a utility holding company); Houghton Mifflin Harcourt Publishing Company |
| | | | | |
Steven D. Krichmar Age: 61 | | Trustee | | Since 2018 | | Mr. Krichmar is retired. Formerly, he held senior management and governance positions with Putnam Investments, LLC, a financial services company (2001-2016). He was most recently Chief of Operations and a member of the Operating Committee of Putnam Investments, LLC and Principal Financial Officer of The Putnam Funds. Previously, Mr. Krichmar served as an Audit Partner with PricewaterhouseCoopers LLP and its predecessor company (1990-2001). Trustee — Goldman Sachs Trust II. | | 19 | | None |
| | | | | | | | | | |
109
GOLDMAN SACHS STRATEGIC MULTI-ASSET CLASS FUNDS
Trustees and Officers (Unaudited) (continued)
Interested Trustee*
| | | | | | | | | | |
Name,
Address and Age1 | | Position(s) Held
with the Trust | | Term of
Office and
Length of
Time Served2 | | Principal Occupation(s)
During Past 5 Years | | Number of
Portfolios in
Fund Complex
Overseen by
Trustee3 | | Other
Directorships
Held by Trustee4 |
| | | | | |
| James A. McNamara Age: 57 | | President and Trustee | | Since 2012 | | Advisory Director, Goldman Sachs (January 2018-Present); Managing Director, Goldman Sachs (January 2000-December 2017); Director of Institutional Fund Sales, GSAM (April 1998-December 2000); and Senior Vice President and Manager, Dreyfus Institutional Service Corporation (January 1993-April 1998). President and Trustee — Goldman Sachs Trust II; Goldman Sachs Trust; Goldman Sachs Variable Insurance Trust; Goldman Sachs MLP Income Opportunities Fund; Goldman Sachs MLP and Energy Renaissance Fund; and Goldman Sachs ETF Trust. | | 162 | | None |
| | | | | | | | | | |
| * | | Mr. McNamara is considered to be an “Interested Trustee” because he holds positions with Goldman Sachs and owns securities issued by The Goldman Sachs Group, Inc. He holds comparable positions with certain other companies of which Goldman Sachs, GSAM or an affiliate thereof is the investment adviser, administrator and/or distributor. |
| 1 | | Each Trustee may be contacted by writing to the Trustee, c/o Goldman Sachs, 200 West Street, New York, New York, 10282, Attn: Caroline Kraus. Information is provided as of October 31, 2019. |
| 2 | | Subject to such policies as may be adopted by the Board from time-to-time, each Trustee holds office for an indefinite term, until the earliest of: (a) the election of his or her successor; (b) the date the Trustee resigns or is removed by the Board or shareholders, in accordance with the Trust’s Declaration of Trust; or (c) the termination of the Trust. The Board has adopted policies which provide that (a) no Trustee shall hold office for more than 15 years and (b) a Trustee shall retire as of December 31st of the calendar year in which he or she reaches his or her 74th birthday, unless a waiver of such requirement shall have been adopted by a majority of the other Trustees. These policies may be changed by the Trustees without shareholder vote. |
| 3 | | The Goldman Sachs Fund Complex includes certain other companies listed above for each respective Trustee. As of October 31, 2019, Goldman Sachs Trust II consisted of 19 portfolios (17 of which offered shares to the public); Goldman Sachs Trust consisted of 89 portfolios (88 of which offered shares to the public); Goldman Sachs Variable Insurance Trust consisted of 13 portfolios; Goldman Sachs MLP Income Opportunities Fund and Goldman Sachs MLP and Energy Renaissance Fund each consisted of one portfolio; and Goldman Sachs ETF Trust consisted of 39 portfolios (21 of which offered shares to the public). |
| 4 | | This column includes only directorships of companies required to report to the Securities and Exchange Commission under the Securities Exchange Act of 1934 (i.e., “public companies”) or other investment companies registered under the Act. |
Additional information about the Trustees is available in the Funds’ Statement of Additional Information, which can be obtained from Goldman Sachs free of charge by calling this toll-free number (in the United States of America): 1-800-526-7384.
110
GOLDMAN SACHS STRATEGIC MULTI-ASSET CLASS FUNDS
Trustees and Officers (Unaudited) (continued)
Officers of the Trust*
| | | | | | |
| Name, Address and Age1 | | Position(s) Held
with the Trust | | Term of
Office and
Length of
Time Served2 | | Principal Occupation(s) During Past 5 Years |
| | | |
James A. McNamara 200 West Street New York, NY 10282 Age: 57 | | Trustee and President | | Since 2012 | | Advisory Director, Goldman Sachs (January 2018-Present); Managing Director, Goldman Sachs (January 2000-December 2017); Director of Institutional Fund Sales, GSAM (April 1998-December 2000); and Senior Vice President and Manager, Dreyfus Institutional Service Corporation (January 1993-April 1998). President and Trustee — Goldman Sachs Trust II; Goldman Sachs Trust; Goldman Sachs Variable Insurance Trust; Goldman Sachs MLP Income Opportunities Fund; Goldman Sachs MLP and Energy Renaissance Fund; and Goldman Sachs ETF Trust. |
| | | |
Caroline L. Kraus 200 West Street New York, NY 10282 Age: 42 | | Secretary | | Since 2012 | | Managing Director, Goldman Sachs (January 2016-Present); Vice President, Goldman Sachs (August 2006-December 2015); Associate General Counsel, Goldman Sachs (2012-Present); Assistant General Counsel, Goldman Sachs (August 2006-December 2011); and Associate, Weil, Gotshal & Manges, LLP (2002-2006). Secretary — Goldman Sachs Trust II; Goldman Sachs Trust (previously Assistant Secretary (2012)); Goldman Sachs Variable Insurance Trust (previously Assistant Secretary (2012)); Goldman Sachs BDC, Inc.; Goldman Sachs Private Middle Market Credit LLC; Goldman Sachs Middle Market Lending Corp.; Goldman Sachs MLP Income Opportunities Fund; Goldman Sachs MLP and Energy Renaissance Fund; and Goldman Sachs ETF Trust. |
| | | |
Joseph F. DiMaria 30 Hudson Street Jersey City, NJ 07302 Age: 51 | | Treasurer, Principal Financial Officer and Principal Accounting Officer | | Since 2017 (Treasurer and Principal Financial Officer Since 2019) | | Managing Director, Goldman Sachs (November 2015-Present) and Vice President — Mutual Fund Administration, Columbia Management Investment Advisers, LLC (May 2010-October 2015). Treasurer, Principal Financial Officer and Principal Accounting Officer — Goldman Sachs Trust II (previously Assistant Treasurer (2017)); Goldman Sachs Trust (previously Assistant Treasurer (2016)); Goldman Sachs Variable Insurance Trust (previously Assistant Treasurer (2016)); Goldman Sachs MLP Income Opportunities Fund (previously Assistant Treasurer (2017)); Goldman Sachs MLP and Energy Renaissance Fund (previously Assistant Treasurer (2017)); and Goldman Sachs ETF Trust (previously Assistant Treasurer (2017)). |
| | | | | | |
| * | | Represents a partial list of officers of the Trust. Additional information about all the officers is available in the Funds’ Statement of Additional Information, which can be obtained from Goldman Sachs free of charge by calling this toll-free number (in the United States): 1-800-526-7384. |
| 1 | | Information is provided as of October 31, 2019. |
| 2 | | Officers hold office at the pleasure of the Board of Trustees or until their successors are duly elected and qualified. Each officer holds comparable positions with certain other companies of which Goldman Sachs, GSAM or an affiliate thereof is the investment adviser, administrator and/or distributor. |
Goldman Sachs Trust II — Strategic Multi-Asset Class Funds — Tax Information (Unaudited)
For the year ended October 31, 2019, 14.93% and 11.74% of the dividends paid from net investment company taxable income by the Multi-Manager Global Equity and Multi-Manager Real Assets Strategy Funds, respectively, qualify for the dividends received deduction available to corporations.
For the year ended October 31, 2019, 62.83% and 53.63% of the dividends paid from net investment company taxable income by the Multi-Manager Global Equity and Multi-Manager Real Assets Strategy Funds, respectively, qualify for the reduced tax rate under the Jobs and Growth Tax Relief and Reconciliation Act of 2003.
Pursuant to Section 852 of the Internal Revenue Code, the Multi-Manager Global Equity and Multi-Manager Real Assets Strategy Funds designate $24,324,082 and $2,405,170 respectively, or if different, the maximum amount allowable, as capital gain dividends paid during the fiscal year ended October 31, 2019.
During the fiscal year ended October 31, 2019, the Multi-Manager Global Equity Fund designates $8,343,048 as short-term capital gain dividends pursuant to Section 871(k) of the Internal Revenue Code.
111
FUNDS PROFILE
Goldman Sachs Funds
Goldman Sachs is a premier financial services firm, known since 1869 for creating thoughtful and customized investment solutions in complex global markets.
Today, theConsumer and Investment Management Division of Goldman Sachs serves a diverse set of clients worldwide, including private institutions, public entities and individuals. With approximately $1.60 trillion in assets under supervision as of September 30, 2019, Goldman Sachs Asset Management (“GSAM”) has portfolio management teams located around the world and our investment professionals bring firsthand knowledge of local markets to every investment decision. Assets under supervision includes assets under management and other client assets for which Goldman Sachs does not have full discretion. GSAM leverages the resources of Goldman Sachs & Co. LLC subject to legal, internal and regulatory restrictions.
Money Market
Financial Square FundsSM
| ∎ | | Financial Square Treasury Solutions Fund1 |
| ∎ | | Financial Square Government Fund1 |
| ∎ | | Financial Square Money Market Fund2 |
| ∎ | | Financial Square Prime Obligations Fund2 |
| ∎ | | Financial Square Treasury Instruments Fund1 |
| ∎ | | Financial Square Treasury Obligations Fund1 |
| ∎ | | Financial Square Federal Instruments Fund1 |
Investor FundsSM
| ∎ | | Investor Money Market Fund3 |
| ∎ | | Investor Tax-Exempt Money Market Fund3 |
Fixed Income
Short Duration and Government
| ∎ | | High Quality Floating Rate Fund |
| ∎ | | Short-Term Conservative Income Fund |
| ∎ | | Short Duration Government Fund |
| ∎ | | Short Duration Income Fund |
| ∎ | | Inflation Protected Securities Fund |
Multi-Sector
Municipal and Tax-Free
| ∎ | | High Yield Municipal Fund |
| ∎ | | Dynamic Municipal Income Fund |
| ∎ | | Municipal Income Completion Fund |
| ∎ | | Short Duration Tax-Free Fund |
Single Sector
| ∎ | | Investment Grade Credit Fund |
| ∎ | | High Yield Floating Rate Fund |
| ∎ | | Emerging Markets Debt Fund |
| ∎ | | Local Emerging Markets Debt Fund |
Fixed Income Alternatives
| ∎ | | Long Short Credit Strategies Fund |
Fundamental Equity
| ∎ | | Small/Mid Cap Value Fund |
| ∎ | | Small/Mid Cap Growth Fund |
| ∎ | | Concentrated Growth Fund |
| ∎ | | Technology Opportunities Fund |
| ∎ | | Growth Opportunities Fund |
| ∎ | | Rising Dividend Growth Fund |
Tax-Advantaged Equity
| ∎ | | U.S. Tax-Managed Equity Fund |
| ∎ | | International Tax-Managed Equity Fund |
| ∎ | | U.S. Equity Dividend and Premium Fund |
| ∎ | | International Equity Dividend and Premium Fund |
Equity Insights
| ∎ | | Small Cap Equity Insights Fund |
| ∎ | | U.S. Equity Insights Fund |
| ∎ | | Small Cap Growth Insights Fund |
| ∎ | | Large Cap Growth Insights Fund |
| ∎ | | Large Cap Value Insights Fund |
| ∎ | | Small Cap Value Insights Fund |
| ∎ | | International Small Cap Insights Fund |
| ∎ | | International Equity Insights Fund |
| ∎ | | Emerging Markets Equity Insights Fund |
Fundamental Equity International
| ∎ | | International Equity Income Fund |
| ∎ | | International Equity ESG Fund |
| ∎ | | Emerging Markets Equity Fund |
| ∎ | | Imprint Emerging Markets Opportunities Fund5 |
| ∎ | | ESG Emerging Markets Equity Fund |
Alternative
| ∎ | | Real Estate Securities Fund |
| ∎ | | International Real Estate Securities Fund |
| ∎ | | Commodity Strategy Fund |
| ∎ | | Global Real Estate Securities Fund |
| ∎ | | Alternative Premia Fund |
| ∎ | | Absolute Return Tracker Fund |
| ∎ | | Managed Futures Strategy Fund |
| ∎ | | MLP Energy Infrastructure Fund |
| ∎ | | Multi-Manager Alternatives Fund |
| ∎ | | Global Infrastructure Fund |
Total Portfolio Solutions
| ∎ | | Global Managed Beta Fund |
| ∎ | | Multi-Manager Non-Core Fixed Income Fund |
| ∎ | | Multi-Manager U.S. Dynamic Equity Fund |
| ∎ | | Multi-Manager Global Equity Fund |
| ∎ | | Multi-Manager International Equity Fund |
| ∎ | | Tactical Tilt Overlay Fund |
| ∎ | | Balanced Strategy Portfolio |
| ∎ | | Multi-Manager U.S. Small Cap Equity Fund |
| ∎ | | Multi-Manager Real Assets Strategy Fund |
| ∎ | | Growth and Income Strategy Portfolio |
| ∎ | | Growth Strategy Portfolio |
| ∎ | | Dynamic Global Equity Fund6 |
| ∎ | | Satellite Strategies Portfolio |
| ∎ | | Enhanced Dividend Global Equity Portfolio |
| ∎ | | Tax-Advantaged Global Equity Portfolio |
| ∎ | | Strategic Factor Allocation Fund |
| ∎ | | Target Date 2020 Portfolio |
| ∎ | | Target Date 2025 Portfolio |
| ∎ | | Target Date 2030 Portfolio |
| ∎ | | Target Date 2035 Portfolio |
| ∎ | | Target Date 2040 Portfolio |
| ∎ | | Target Date 2045 Portfolio |
| ∎ | | Target Date 2050 Portfolio |
| ∎ | | Target Date 2055 Portfolio |
| ∎ | | Target Date 2060 Portfolio |
| ∎ | | GQG Partners International Opportunities Fund |
| 1 | | You could lose money by investing in the Fund. Although the Fund seeks to preserve the value of your investment at $1.00 per share, it cannot guarantee it will do so. An investment in the Fund is not a deposit of a bank and is not insured or guaranteed by the Federal Deposit Insurance Corporation or any other government agency. The Fund’s sponsor has no legal obligation to provide financial support to the Fund, and you should not expect that the sponsor will provide financial support to the Fund at any time. |
| 2 | | You could lose money by investing in the Fund. Because the share price of the Fund will fluctuate, when you sell your shares they may be worth more or less than what you originally paid for them. The Fund may impose a fee upon sale of your shares or may temporarily suspend your ability to sell shares if the Fund’s liquidity falls below required minimums because of market conditions or other factors. An investment in the Fund is not a deposit of a bank and is not insured or guaranteed by the Federal Deposit Insurance Corporation or any other government agency. The Fund’s sponsor has no legal obligation to provide financial support to the Fund, and you should not expect that the sponsor will provide financial support to the Fund at any time. |
| 3 | | You could lose money by investing in the Fund. Although the Fund seeks to preserve the value of your investment at $1.00 per share, it cannot guarantee it will do so. The Fund may impose a fee upon sale of your shares or may temporarily suspend your ability to sell shares if the Fund’s liquidity falls below required minimums because of market conditions or other factors. An investment in the Fund is not a deposit of a bank and is not insured or guaranteed by the Federal Deposit Insurance Corporation or any other government agency. The Fund’s sponsor has no legal obligation to provide financial support to the Fund, and you should not expect that the sponsor will provide financial support to the Fund at any time. |
| 4 | | Effective after the close of business on November 20, 2019, the Goldman Sachs Asia Equity Fund was renamed the Goldman Sachs China Equity Fund. |
| 5 | | Effective after the close of business on August 30, 2019, the Goldman Sachs N-11 Equity Fund was renamed the Goldman Sachs Imprint Emerging Markets Opportunities Fund. |
| 6 | | Effective after the close of business on February 28, 2019, the Goldman Sachs Equity Growth Strategy Portfolio was renamed the Goldman Sachs Dynamic Global Equity Fund. |
| * | | This list covers open-end funds only. Please visit our website at www.GSAMFUNDS.com to learn about our closed-end funds and exchange-traded funds. |
| | |
TRUSTEES Cheryl K. Beebe,Chair Lawrence Hughes John F. Killian Steven D. Krichmar James A. McNamara | | OFFICERS James A. McNamara,President Joseph F. DiMaria,Principal Financial Officer, Principal Accounting Officer and Treasurer Caroline L. Kraus,Secretary |
| |
GOLDMAN SACHS & CO. LLC Distributor and Transfer Agent | | GOLDMAN SACHS ASSET MANAGEMENT, L.P. Investment Adviser |
Visit our web site atwww.GSAMFUNDS.com to obtain the most recent month-end returns.
Goldman Sachs Asset Management, L.P., 200 West Street, New York, New York 10282
The reports concerning the Funds included in this shareholder report may contain certain forward-looking statements about the factors that may affect the performance of the Funds in the future. These statements are based on Fund management’s predictions and expectations concerning certain future events and their expected impact on the Funds, such as performance of the economy as a whole and of specific industry sectors, changes in the levels of interest rates, the impact of developing world events, and other factors that may influence the future performance of the Funds. Management believes these forward-looking statements to be reasonable, although they are inherently uncertain and difficult to predict. Actual events may cause adjustments in portfolio management strategies from those currently expected to be employed.
A description of the policies and procedures that the Funds use to determine how to vote proxies relating to portfolio securities and information regarding how Funds voted proxies relating to portfolio securities during the most recent 12-month period ended June 30 are available (I) without charge, upon request by calling 1-800-621-2550; and (II) on the Securities and Exchange Commission (’’SEC’’) web site at http://www.sec.gov.
The Funds will file portfolio holdings information for each month in a fiscal quarter within 60 days after the end of the relevant fiscal quarter on Form N-PORT. Portfolio holdings information for the third month of each fiscal quarter will be made available on the SEC’s web site at http://www.sec.gov. Portfolio holdings information may be obtained upon request and without charge by calling1-800-526-7384 (for Retail Shareholders) or1-800-621-2550 (for Institutional Shareholders).
Goldman Sachs & Co. LLC (‘‘Goldman Sachs’’) does not provide legal, tax or accounting advice. Any statement contained in this communication (including any attachments) concerning U.S. tax matters was not intended or written to be used, and cannot be used, for the purpose of avoiding penalties under the Internal Revenue Code, and was written to support the promotion or marketing of the transaction(s) or matter(s) addressed. Clients of Goldman Sachs should obtain their own independent tax advice based on their particular circumstances.
Economic and market forecasts presented herein reflect our judgment as of the date of this presentation and are subject to change without notice. These forecasts do not take into account the specific investment objectives, restrictions, tax and financial situation or other needs of any specific client. Actual data will vary and may not be reflected here. These forecasts are subject to high levels of uncertainty that may affect actual performance. Accordingly, these forecasts should be viewed as merely representative of a broad range of possible outcomes. These forecasts are estimated, based on assumptions, and are subject to significant revision and may change materially as economic and market conditions change. Goldman Sachs has no obligation to provide updates or changes to these forecasts. Case studies and examples are for illustrative purposes only. The Global Industry Classification Standard (GICS) was developed by and is the exclusive property and a service mark of Morgan Stanley Capital International Inc. (MSCI) and Standard & Poor’s, a division of The McGraw-Hill Companies, Inc. (S&P) and is licensed for use by Goldman Sachs. Neither MSCI, S&P nor any other party involved in making or compiling the GICS or any GICS classifications makes any express or implied warranties or representations with respect to such standard or classification (or the results to be obtained by the use thereof), and all such parties hereby expressly disclaim all warranties of originality, accuracy, completeness, merchantability or fitness for a particular purpose with respect to any of such standard or classification. Without limiting any of the foregoing, in no event shall MSCI, S&P, any of their affiliates or any third party involved in making or compiling the GICS or any GICS classifications have any liability for any direct, indirect, special, punitive, consequential or any other damages (including lost profits) even if notified of the possibility of such damages.
The portfolio risk management process includes an effort to monitor and manage risk, but does not imply low risk. Diversification does not protect an investor from market risk and does not ensure a profit. Past correlations are not indicative of future correlations, which may vary.
This material is not authorized for distribution to prospective investors unless preceded or accompanied by a current Prospectus or summary prospectus, if applicable. Investors should consider the Funds’ objective, risks, and charges and expenses, and read the summary prospectus, if available, and/or the Prospectus carefully before investing or sending money. The summary prospectus, if available, and the Prospectus contain this and other information about each Fund and may be obtained from your authorized dealer or from Goldman Sachs & Co. LLC by calling 1-800-621-2550.
© 2019 Goldman Sachs. All rights reserved. 187122-OTU-1103593 SMACAR-19
(a) As of the end of the period covered by this report, the registrant has adopted a code of ethics that applies to the registrant’s principal executive officer, principal financial officer, principal accounting officer or controller, or persons performing similar functions, regardless of whether these individuals are employed by the registrant or a third party (the “Code of Ethics”).
(b) During the period covered by this report, no amendments were made to the provisions of the Code of Ethics.
(c) During the period covered by this report, the registrant did not grant any waivers, including an implicit waiver, from any provision of the Code of Ethics.
(d) A copy of the Code of Ethics is available as provided in Item 13(a)(1) of this report.
| ITEM 3. | AUDIT COMMITTEE FINANCIAL EXPERT. |
The registrant’s board of trustees has determined that the registrant has at least one “audit committee financial expert” (as defined in Item 3 of Form N-CSR) serving on its audit committee. John F. Killian is the “audit committee financial expert” and is “independent” (as each term is defined in Item 3 of Form N-CSR).
| ITEM 4. | PRINCIPAL ACCOUNTANT FEES AND SERVICES. |
Table 1 — Items 4(a) - 4(d). The accountant fees below reflect the aggregate fees billed by the Funds of the Goldman Sachs Trust II to which this certified shareholder report relates.
| | | | | | | | | | | | |
| | | 2019 | | 2018 | | Description of Services Rendered |
| | | | | | | | | | | | |
| | | |
Audit Fees: | | | | | | | | | | | | |
| | | |
• PricewaterhouseCoopers LLP
(“PwC”) | | | $ | 493,885 | | | | $ | 464,885 | | | Financial Statement audits. |
| | | |
Audit-Related Fees: | | | | | | | | | | | | |
| | | |
• PwC | | | $ | 33,305 | | | | $ | 54,252 | | | |
| | | |
Tax Fees: | | | | | | | | | | | | |
| | | |
• PwC | | | $ | 176,493 | | | | $ | 233,440 | | | |
Table 2 — Items 4(b)(c) & (d).Non-Audit Services to the Goldman Sachs Trust II’s service affiliates * that werepre-approved by the Audit Committee of the Goldman Sachs Trust II pursuant to Rule2-01(c)(7)(ii) of RegulationS-X.
| | | | | | | | | | | | |
| | | 2019 | | 2018 | | Description of Services Rendered |
| | | | | | | | | | | | |
| | | |
Audit-Related Fees: | | | | | | | | | | | | |
| | | |
• PwC | | | $ | 2,400,617 | | | | $ | 1,862,076 | | | Internal control review performed in accordance with Statement on Standards for Attestation Engagements No. 16 and semi annual updates relating to withholding tax accrual for non-US jurisdictions. These fees are borne by the Funds’ Adviser. |
| * | These include the advisor (excludingsub-advisors) and any entity controlling, controlled by or under common control with the advisor that provides ongoing services to the registrant (hereinafter referred to as “service affiliates”). |
Item 4(e)(1) — Audit CommitteePre-Approval Policies and Procedures
Pre-Approval of Audit andNon-Audit Services Provided to the Funds of the Goldman Sachs Trust II. The Audit andNon-Audit ServicesPre-Approval Policy (the “Policy”) adopted by the Audit Committee of Goldman Sachs Trust II (“GST II”) sets forth the procedures and the conditions pursuant to which services performed by an independent auditor for GST II may bepre-approved. Services may bepre-approved specifically by the Audit Committee as a whole or, in certain circumstances, by the Audit Committee Chairman or the person designated as the Audit Committee Financial Expert. In addition, subject to specified cost limitations, certain services may bepre-approved under the provisions of the Policy. The Policy provides that the Audit Committee will consider whether the services provided by an independent auditor are consistent with the Securities and Exchange Commission’s rules on auditor independence. The Policy provides for periodic review andpre-approval by the Audit Committee of the services that may be provided by the independent auditor.
De Minimis Waiver. Thepre-approval requirements of the Policy may be waived with respect to the provision ofnon-audit services that are permissible for an independent auditor to perform, provided (1) the aggregate amount of all such services provided constitutes no more than five percent of the total amount of revenues subject topre-approval that was paid to the independent auditors during the fiscal year in which the services are provided; (2) such services were not recognized by GST II at the time of the engagement to benon-audit services; and (3) such services are promptly brought to the attention of the Audit Committee and approved prior to the completion of the audit by the Audit Committee or by one or more members of the Audit Committee to whom authority to grant such approvals has been delegated by the Audit Committee, pursuant to thepre-approval provisions of the Policy.
Pre-Approval ofNon-Audit Services Provided to GST’s Investment Advisers. The Policy provides that, in addition to requiringpre-approval of audit andnon-audit services provided to GST II, the Audit Committee willpre-approve thosenon-audit services provided to GST II’s investment advisers (and entities controlling, controlled by or under common control with the investment advisers that provide ongoing services to GST II) where the engagement relates directly to the operations or financial reporting of GST II.
Item 4(e)(2) –0% of the audit-related fees, tax fees and other fees listed in Table 1 were approved by GST II’s Audit Committee pursuant to the “de minimis” exception of Rule2-01(c)(7)(i)(C) of RegulationS-X. In addition, 0% of thenon-audit services to the GST II’s service affiliates listed in Table 2 were approved by GST II’s Audit Committee pursuant to the “de minimis” exception of Rule2-01(c)(7)(i)(C) of RegulationS-X.
Item 4(f) –Not applicable.
Item 4(g) AggregateNon-Audit Fees Disclosure
The aggregatenon-audit fees billed to GST II by PwC for the twelve months ended October 31, 2019 and October 31, 2018 were $209,798 and $287,692 respectively. The aggregatenon-audit fees billed to GST II’s adviser and service affiliates by PwC for the twelve months ended October 31, 2019 and October 31, 2018 were approximately $12.3 million and $9.7 million respectively. With regard to the aggregatenon-audit fees billed to GST II’s adviser and service affiliates, the 2019 and 2018 amounts include fees fornon-audit services required to bepre-approved [see Table 2] and fees for non-audit services that did not requirepre-approval since they did not directly relate to GST II’s operations or financial reporting.
Item 4(h) —GST II’s Audit Committee has considered whether the provision ofnon-audit services to GST II’s investment adviser and service affiliates that did not requirepre-approval pursuant to paragraph (c)(7)(ii) of Rule2-01 of RegulationS-X is compatible with maintaining the auditors’ independence.
| ITEM 5. | AUDIT COMMITTEE OF LISTED REGISTRANTS. |
| ITEM 6. | SCHEDULE OF INVESTMENTS. |
| | Schedule of Investments is included as part of the Report to Shareholders filed under Item 1. |
| ITEM 7. | DISCLOSURE OF PROXY VOTING POLICIES AND PROCEDURES FORCLOSED-END MANAGEMENT INVESTMENT COMPANIES. |
| ITEM 8. | PORTFOLIO MANAGERS OFCLOSED-END MANAGEMENT INVESTMENT COMPANIES. |
| ITEM 9. | PURCHASES OF EQUITY SECURITIES BYCLOSED-END MANAGEMENT INVESTMENT COMPANY AND AFFILIATED PURCHASERS. |
| ITEM 10. | SUBMISSION OF MATTERS TO A VOTE OF SECURITY HOLDERS. |
| | There have been no material changes to the procedures by which shareholders may recommend nominees to the registrant’s board of trustees. |
| ITEM 11. | CONTROLS AND PROCEDURES. |
| | (a) | The registrant’s principal executive and principal financial officers, or persons performing similar functions have concluded that the registrant’s disclosure controls and procedures (as defined in Rule 30a-3(c) under the Investment Company Act of 1940, as amended (the “1940 Act”)) are effective as of a date within 90 days of the filing of this report that includes the disclosure required by this paragraph, based on the evaluation of these controls and procedures required by Rule 30a-3(b) under the 1940 Act and15d-15(b) under the Securities Exchange Act of 1934, as amended. |
| | (b) | There were no changes in the registrant’s internal control over financial reporting (as defined in Rule 30a-3(d) under the 1940 Act) that occurred during the period covered by this report that have materially affected, or are reasonably likely to materially affect, the registrant’s internal control over financial reporting. |
| ITEM 12. | DISCLOSURE OF SECURITIES LENDING ACTIVITIES FOR CLOSED-END MANAGEMENT INVESTMENT COMPANIES |
| | | | |
| (a)(1) | | Goldman Sachs Trust II’s Code of Ethics for Principal Executive and Senior Financial Officers is incorporated by reference to Exhibit 12(a)(1) of the registrant’s Form N-CSR filed on July 8, 2015 for its Multi-Manager Non-Core Fixed Income Fund. |
| | |
| (a)(2) | | Exhibit 99.CERT | | Certifications pursuant to Section 302 of the Sarbanes-Oxley Act of 2002 filed herewith. |
| |
| (a)(3) | | Not applicable to open-end investment companies. |
| |
| (a)(4) | | There was no change in the registrant’s independent public accountant for the period covered by this report. |
| | |
| (b) | | Exhibit 99.906CERT | | Certifications pursuant to Section 906 of the Sarbanes-Oxley Act of 2002 filed herewith. |
SIGNATURES
Pursuant to the requirements of the Securities Exchange Act of 1934 and the Investment Company Act of 1940, the registrant has duly caused this report to be signed on its behalf by the undersigned, thereunto duly authorized.
| | | | |
| | | | Goldman Sachs Trust II |
| | |
| By: | | | | /s/ James A. McNamara |
| | |
| | | | James A. McNamara |
| | | | President/Chief Executive Officer |
| | | | Goldman Sachs Trust II |
| | |
| Date: | | | | January 2, 2020 |
Pursuant to the requirements of the Securities Exchange Act of 1934 and the Investment Company Act of 1940, this report has been signed below by the following persons on behalf of the registrant and in the capacities and on the dates indicated.
| | | | |
| | |
| By: | | | | /s/ James A. McNamara |
| | |
| | | | James A. McNamara |
| | | | President/Chief Executive Officer |
| | | | Goldman Sachs Trust II |
| | |
| Date: | | | | January 2, 2020 |
| | |
| By: | | | | /s/ Joseph F. DiMaria |
| | |
| | | | Joseph F. DiMaria |
| | | | Principal Financial Officer |
| | | | Goldman Sachs Trust II |
| | |
| Date: | | | | January 2, 2020 |