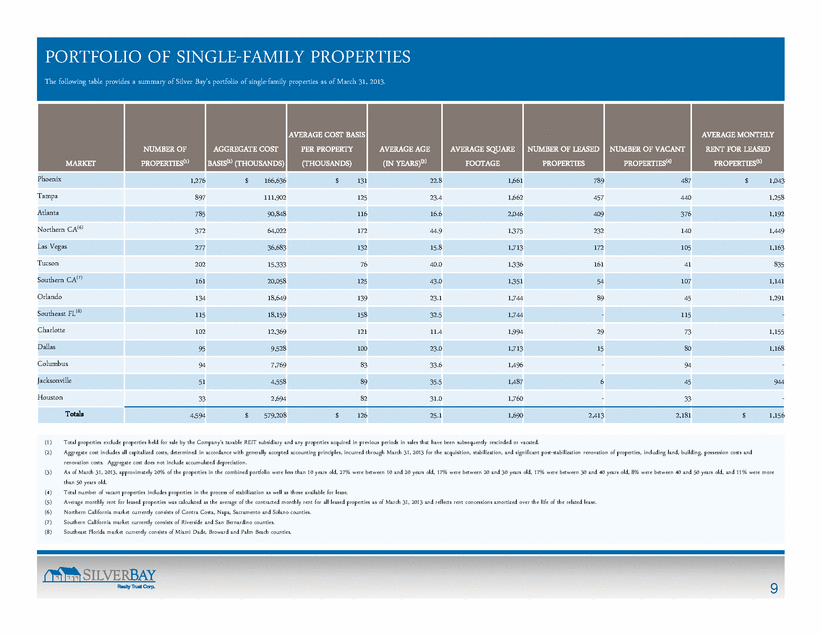
| PORTFOLIO OF SINGLE-FAMILY PROPERTIES The following table provides a summary of Silver Bay’s portfolio of single-family properties as of March 31, 2013. MARKET NUMBER OF PROPERTIES(1) AGGREGATE COST BASIS(2) (THOUSANDS) AVERAGE COST BASIS PER PROPERTY (THOUSANDS) AVERAGE AGE (IN YEARS)(3) AVERAGE SQUARE FOOTAGE NUMBER OF LEASED PROPERTIES NUMBER OF VACANT PROPERTIES(4) AVERAGE MONTHLY RENT FOR LEASED PROPERTIES(5) Phoenix 1,276 $ 166,636 $ 131 22.8 1,661 789 487 $ 1,043 Tampa 897 125 111,902 23.4 1,662 1,258 Atlanta 785 90,848 116 16.6 2,046 409 376 1,192 Northern CA(6) 372 64,022 172 44.9 1,375 232 140 1,449 Las Vegas 277 36,683 132 15.8 1,713 172 105 1,163 Tucson 202 15,333 76 40.0 1,336 161 41 835 CA(7) Southern 161 20,058 125 43.0 1,351 54 107 1,141 Orlando 134 18,649 139 23.1 1,744 89 45 1,291 Southeast FL(8) 115 18,159 158 32.5 1,744 - 115 - Charlotte 102 12,369 121 11.4 1,994 29 73 1,155 Dallas 95 9,528 100 23.0 1,713 15 80 1,168 Columbus 94 7,769 83 33.6 1,496 - 94 - Jacksonville 51 4,558 89 35.5 1,487 6 45 944 Houston 33 2,694 82 31.0 1,760 - 33 - Totals 4,594 $ 579,208 $ 126 25.1 1,690 2,413 2,181 $ 1,156 (1) Total properties exclude properties held for sale by the Company’s taxable REIT subsidiary and any properties acquired in previous periods in sales that have been subsequently rescinded or vacated. (2) Aggregate cost includes all capitalized costs, determined in accordance with generally accepted accounting principles, incurred through March 31, 2013 for the acquisition, stabilization, and significant post-stabilization renovation of properties, including land, building, possession costs and renovation costs. Aggregate cost does not include accumulated depreciation. (3) As of March 31, 2013, approximately 20% of the properties in the combined portfolio were less than 10 years old, 27% were between 10 and 20 years old, 17% were between 20 and 30 years old, 17% were between 30 and 40 years old, 8% were between 40 and 50 years old, and 11% were more than 50 years old. (4) Total number of vacant properties includes properties in the process of stabilization as well as those available for lease. (5) Average monthly rent for leased properties was calculated as the average of the contracted monthly rent for all leased properties as of March 31, 2013 and reflects rent concessions amortized over the life of the related lease. (6) Northern California market currently consists of Contra Costa, Napa, Sacramento and Solano counties. 9 (7) Southern California market currently consists of Riverside and San Bernardino counties. (8) Southeast Florida market currently consists of Miami Dade, Broward and Palm Beach counties. |
