UNITED STATES
SECURITIES AND EXCHANGE COMMISSION
Washington, D.C. 20549
FORM N-CSR
CERTIFIED SHAREHOLDER REPORT OF REGISTERED
MANAGEMENT INVESTMENT COMPANIES
Investment Company Act File Number 811-22759
SharesPost 100 Fund
(Exact name of registrant as specified in charter)
101 Jefferson Drive
Menlo Park, CA 94025
(Address of principal executive offices) (Zip code)
National Corporate Research, Ltd.
c/o SharesPost 100 Fund
615 South DuPont Highway
City of Dover, County of Kent, Delaware 19901
(Name and address of agent for service)
Copies to:
Mintz, Levin, Cohn, Ferris, Glovsky and Popeo, P.C.
666 Third Avenue
New York, NY 10017
Registrant's telephone number, including area code: (800) 834-8707
Date of fiscal year end: December 31
Date of reporting period: December 31, 2016
Item 1. Reports to Stockholders.

SHARESPOST 100 FUND
Table of Contents | |
Shareholder Letter | 2 |
Fund Performance | 5 |
Portfolio Composition | 6 |
Schedule of Investments | 7 |
Statement of Assets and Liabilities | 10 |
Statement of Operations | 11 |
Statements of Changes in Net Assets | 12 |
Statement of Cash Flows | 13 |
Financial Highlights | 14 |
Notes to the Financial Statements | 15 |
Report of Independent Registered Public Accounting Firm | 24 |
Trustee Information | 25 |
Additional Information | 26 |
1
SHARESPOST 100 FUND
February 2017
Dear Investors,
We believe 2016 was a transitional year, which started both with high volatility in the public market and a slowdown of the IPO market and then ended with a year-end rally and the resurgence of the tech IPOs. Although many predicted significant valuation corrections for private companies at year’s end, these predictions were not confirmed by reality.
While the number of tech IPOs went down, current PitchbookTM data shows that in 2016 corporations paid a total of over $60bn for acquiring US based technology companies. The mean price of venture-backed tech companies rose over 40% and the median consideration doubled, according to data from PitchbookTM. In short, last year corporations paid the highest prices for technology companies ever. Although this number will still change over the course of the next months, as merger and acquisition (M&A) deals are often reported delayed, we can already determine that 2016 was one of the two best M&A years for venture capital backed US based companies, only 2014 was slightly higher with $69bn, including the $19bn WhatsApp acquisition as an outlier, with an overall median price 46% below 2016 levels.
The biggest driver of this trend was a significant increase in M&A activity in the Information Technology sector totaling $29bn in 2016 up from $17bn in 2015, whereas Healthcare went down to $21bn from $27bn. It appears that blue-chip companies decided that it was a good time to go shopping. Among other notable deals, Walmart bought Jet.com for $3 billion, and GE announced the purchase of our Fund’s portfolio company ServiceMax for $915 million. Both were undeterred by what some felt were overheated valuations. In fact, companies were willing to pay a premium to buy companies that would enable them to innovate or offer new products. Recent Bloomberg data shows that the number of tech companies sold to non-tech corporations for the first time in 16 years exceeded those acquired by tech companies, indicating that non-tech corporations are exceedingly willing to use their significant cash positions to keep up with innovation.
The M&A driven liquidity is a key indicator for the health of the private tech growth asset class. M&A exits, which always far outnumber IPOs by a 20:1 ratio, are continuing to power the entire innovation ecosystem, particularly here in the San Francisco Bay Area. Going into 2017, we have every reason to believe it will be another strong year. If some policy changes with respect to repatriation of corporate balance sheet assets into the U.S. are put into place, there may be even more cash to fuel M&A exits.
The Fund’s strategy is to invest in late-stage private growth companies that are expected to have a liquidity event (i.e., an IPO or sale) within 2-4 years. We feel this is when many private companies typically experience a significant portion of their overall growth. As of December 31, 2016, the Fund had approximately $78 million in assets under management with investments in 38 private companies across 17 industry sectors. In 2016, 5 of our Fund’s portfolio companies - AddThis, Appirio, ServiceMax, Jumio, and One Kings Lane, have been acquired and one portfolio company, Apptio has gone public. In addition Cisco announced in January 2017 the acquisition of AppDynamics resulting in a total of 8 portfolio acquisitions and 2 IPOs since inception.
We would like to highlight a few of the companies that were added to the Fund in the latter part of 2016 as a means of giving you a insight into some of the great innovative companies we are investing in and where we see opportunities.
Lyft (Transportation – Total Funding $2B) – Lyft is a provider of an on-demand ride sharing platform that connects the community of drivers with passengers who requests rides through the companies’ mobile application.
xAd (Advertising – Total Funding $74M) – xAd offers location intelligence services that leverages mobile device’s current or past locations to drive in-store foot traffic and sales.
InsideSales (Enterprise Software – Total Funding $201M) – InsideSales provides a sales automation and predictive analytics platform to help companies accelerate growth.
Cloudera (Analytics/Big Data – Total Funding $1.2B) – Cloudera is a developer of a data management and analytics platform built on the open source Hadoop infrastructure. The company also provides enterprise-level support and training services.
2
The Fund has generated a cumulative total return since inception of 34.15%. This compares to 27.25% for the S&P 500 and 37.40% for the Dow Jones US Technology Index, the Fund’s benchmarks. The chart below provides complete performance information.
Total Return Information (Unaudited) |
SharesPost 100 Fund
(Inception Date: 03/25/2014) | Annualized
Total Return:
Inception - 12/31/16 | Cumulative
Total Return:
Inception - 12/31/16 | 1 Year
Total Return: 01/01/16 - 12/31/16 |
Returns based on Purchase Without Any Sales Charge (NAV) | 11.19% | 34.15% | 5.30% |
Returns based on Purchase With Maximum Sales Charge of 5.75% (POP) | 8.84% | 26.44% | -0.74% |
Fund Benchmarks | | | |
Dow Jones US Technology Index | 12.15% | 37.40% | 14.23% |
Standard and Poor’s 500 Index | 9.09% | 27.25% | 11.96% |
Performance data quoted represents past performance and is no guarantee of future results. POP performance assumes a maximum sales load of 5.75% on all sales. Investment return and principal value will fluctuate so that an investor’s shares, when redeemed, may be worth more or less than original cost. Current performance may be lower or higher than the performance data quoted. For performance as of the most recent month-end, please call +1.855.551.5510. Some of the Fund’s fees were waived or expenses reimbursed; otherwise, returns would have been lower. The Fund’s total annual expenses per the currently stated prospectus are 4.12%. The Adviser has contractually agreed to waive fees and/or reimburse expenses such that the total expenses of the Fund do not exceed 2.50% through May 1, 2017. |
Correlation is also an important performance metric and we believe investors may find it beneficial to hold alternative investments that offer the potential for high correlation when markets rise and a low to negative correlation when markets fall. The SharesPost 100 Fund had a positive 76% correlation to the S&P 500 from March 2014 (fund inception) through December 2016. This was a period of broader market outperformance. However, specifically during the period of August 2015 – January 2016, where the market was particularly volatile, the Fund had a negative -1% correlation to the S&P 500. Past performance does not guarantee future results, of course, but this may demonstrate how the Fund’s investment strategy has been able to capitalize on the upside and hedge against the downside. Holding non-correlated investments in a portfolio can be an important determinant of performance over the long-term.
The SharesPost 100 Fund is one of the few ways a public investor can gain access to a portfolio that invests primarily in late-stage, venture backed private companies for a minimum of $2,500. The typical selection criteria for these companies includes company revenue, revenue growth rate, market potential, and the investment activity of top-decile performing venture capital funds. Investing in late-stage, venture- backed private companies requires a solid understanding of the private markets and is why active professional management is so important in this asset class. Our investment process is disciplined and we remain committed to pursuing only what we believe are the highest potential growth opportunities.
Thank you for your investment in the Fund.
Sincerely,

Sven Weber
President, the SharesPost 100 Fund.
3
IMPORTANT DISCLOSURE
All investing involves risk including the possible loss of principal. Shares in the Fund are highly illiquid, and you may not be able to sell your shares when, or in the amount that, you desire. The Fund intends to primarily invest in securities of private, late-stage, venture-backed growth companies. There are significant potential risks relating to investing in such securities. Because most of the securities in which the Fund invests are not publicly traded, the Fund’s investments will be valued by the Investment Adviser pursuant to fair valuation procedures and methodologies adopted by the Board of Trustees.
There are significant potential risks associated with investing in venture capital and private equity-backed companies with complex capital structures. The Fund focuses its investments on a limited number of securities, which could subject it to greater risk than that of a larger, more varied portfolio. There is a greater focus in technology securities which could adversely affect the Fund’s performance.
If the Fund does not have at least 500 Members for an entire taxable year, you could receive an adverse tax treatment.
The Fund’s quarterly repurchase policy may require the Fund to liquidate portfolio holdings earlier than the Investment Adviser would otherwise do so, and may also result in an increase in the Fund’s expense ratio. This is not a complete enumeration of the Fund’s risks. Please read the Fund prospectus for other risk factors related to the Fund, its investment strategy and your investment in the Fund, and other additional details.
4
SHARESPOST 100 FUND
Fund Performance & Portfolio Composition
December 31, 2016 (Unaudited)
Growth of $10,000 Investment

This graph illustrates the hypothetical investment of $10,000 in the Fund from March 25, 2014 (Fund inception) to December 31, 2016. The Average Annual Total Return table and Growth of Assumed $10,000 Investment graph do not reflect the deduction of taxes that a shareholder would pay on fund distributions or the redemption of fund shares. The Public Offering Price (POP) assumes an initial investment of $9,425 ($10,000 less the maximum sales load of 5.75%). The Net Asset Value (NAV) assumes no sales load.
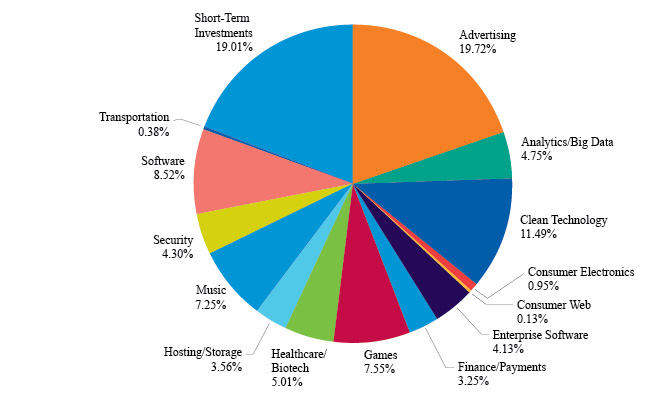
Fund Sector Diversification
The following chart provides a visual breakdown of the Fund by the industry sectors that the underlying securities represent as a percentage of the total investments.
5
SHARESPOST 100 FUND
Portfolio Composition
December 31, 2016 (Unaudited)
Fund Holdings

6
SHARESPOST 100 FUND
Schedule of Investments
December 31, 2016 |
| Acquisition
Date | | Shares | | | Cost | | | Fair Value | |
COMMON STOCK IN PUBLIC COMPANIES – 1.2% | | | | | | | | | | |
CLEAN TECHNOLOGY – 0.2% | | | | | | | | | | |
Sunrun, Inc.(a) | Sep 2014 | | | 24,968 | | | $ | 307,476 | | | $ | 132,580 | |
| | | | | | | | | | | | | | |
ENTERPRISE SOFTWARE – 1.0% | | | | | | | | | | | | | |
Apptio, Inc.(a) | Jul 2014 | | | 45,832 | | | | 962,472 | | | | 791,060 | |
TOTAL COMMON STOCK IN PUBLIC COMPANIES | | | | | | | | 1,269,948 | | | | 923,640 | |
| | | | | | | | | | | | | | |
COMMON STOCK IN PRIVATE COMPANIES (b) – 44.4% | |
ADVERTISING – 16.5% | | | | | | | | | | | | | |
Chartboost(a) | Mar 2015 | | | 700,000 | | | | 1,611,000 | | | | 2,506,000 | |
OpenX(a) | Jun 2015 | | | 2,899,297 | | | | 2,615,385 | | | | 4,928,805 | |
PubMatic(a) | Jun 2015 | | | 200,000 | | | | 1,170,000 | | | | 2,326,000 | |
Turn, Inc.(a) | Dec 2014 | | | 456,250 | | | | 1,453,125 | | | | 2,828,750 | |
xAd, Inc.(a) | Oct 2016 | | | 763,594 | | | | 267,258 | | | | 274,894 | |
| | | | | | | | | 7,116,768 | | | | 12,864,449 | |
ANALYTICS/BIG DATA – 4.7% | | | | | | | | | | | | | |
Cloudera Inc.(a) | Dec 2016 | | | 21,511 | | | | 258,132 | | | | 366,117 | |
Dataminr, Inc.(a) | Sep 2015 | | | 141,875 | | | | 1,168,750 | | | | 1,136,419 | |
INRIX, Inc.(a) | May 2014 | | | 70,750 | | | | 1,592,150 | | | | 2,179,100 | |
| | | | | | | | | 3,019,032 | | | | 3,681,636 | |
CLEAN TECHNOLOGY – 2.3% | | | | | | | | | | | | | |
Spruce Finance Inc.(a) | Sep 2014 | | | 1,092,989 | | | | 1,870,943 | | | | 1,792,502 | |
| | | | | | | | | | | | | | |
CONSUMER ELECTRONICS – 0.0% | | | | | | | | | | | | | |
AliphCom dba Jawbone, Inc.(a) | Mar 2014 | | | 125,000 | | | | 678,750 | | | | 20,000 | |
| | | | | | | | | | | | | | |
ENTERPRISE SOFTWARE – 3.1% | | | | | | | | | | | | | |
InsideSales.com(a) | Dec 2016 | | | 75,000 | | | | 225,000 | | | | 294,000 | |
SugarCRM(a) | Sep 2015 | | | 164,917 | | | | 612,887 | | | | 1,292,949 | |
Zuora, Inc.(a) | Jun 2016 | | | 200,000 | | | | 578,000 | | | | 826,000 | |
| | | | | | | | | 2,092,723 | | | | 2,412,949 | |
FINANCE/PAYMENTS – 1.2% | | | | | | | | | | | | | |
Prosper Marketplace, Inc.(a) | Jan 2016 | | | 244,130 | | | | 1,307,998 | | | | 937,459 | |
| | | | | | | | | | | | | | |
GAMES – 2.3% | | | | | | | | | | | | | |
KABAM, Inc.(a) | Dec 2014 | | | 1,190,000 | | | | 2,332,400 | | | | 1,820,700 | |
| | | | | | | | | | | | | | |
HEALTHCARE/BIOTECH – 3.5% | | | | | | | | | | | | | |
Metabiota(a) | Apr 2015 | | | 494,589 | | | | 500,000 | | | | 702,316 | |
Practice Fusion(a) | Oct 2014 | | | 734,000 | | | | 1,137,640 | | | | 858,780 | |
ZocDoc, Inc.(a) | Feb 2015 | | | 61,016 | | | | 1,321,708 | | | | 1,161,745 | |
| | | | | | | | | 2,959,348 | | | | 2,722,841 | |
See accompanying Notes to the Financial Statements
7
SHARESPOST 100 FUND
Schedule of Investments (Continued)
December 31, 2016 |
| Acquisition
Date | | Shares | | | Cost | | | Fair Value | |
COMMON STOCK IN PRIVATE COMPANIES (b) – 44.4% (Continued) | |
HOSTING/STORAGE – 3.6% | | | | | | | | | | |
Code 42 Software Inc.(a) | May 2016 | | | 180,000 | | | $ | 360,000 | | | $ | 988,200 | |
Hightail, Inc.(a) | Apr 2014 | | | 136,028 | | | | 376,149 | | | | 195,880 | |
Tintri, Inc.(a) | Jul 2015 | | | 235,937 | | | | 961,716 | | | | 1,578,419 | |
| | | | | | | | | 1,697,865 | | | | 2,762,499 | |
MUSIC – 3.6% | | | | | | | | | | | | | |
Spotify(a) | Aug 2015 | | | 1,068 | | | | 2,099,200 | | | | 2,816,252 | |
| | | | | | | | | | | | | | |
SECURITY – 1.8% | | | | | | | | | | | | | |
AlienVault(a) | Oct 2014 | | | 237,500 | | | | 850,000 | | | | 1,368,000 | |
| | | | | | | | | | | | | | |
SOFTWARE – 1.8% | | | | | | | | | | | | | |
Acquia(a) | Apr 2016 | | | 30,000 | | | | 300,000 | | | | 491,400 | |
AppDynamics, Inc.(a) | Mar 2016 | | | 25,000 | | | | 300,000 | | | | 319,000 | |
DocuSign, Inc.(a) | May 2014 | | | 4,000 | | | | 53,000 | | | | 73,200 | |
ServiceMax, Inc.(a) | Jun 2016 | | | 65,000 | | | | 292,500 | | | | 494,000 | |
| | | | | | | | | 945,500 | | | | 1,377,600 | |
TOTAL COMMON STOCK IN PRIVATE COMPANIES | | | | | | | | | | | | 34,576,887 | |
| | | | | | | | | | | | | | |
PREFERRED STOCK IN PRIVATE COMPANIES (b) – 33.7% | |
ADVERTISING – 3.1% | | | | | | | | | | | | | |
AppNexus, Inc., Preferred Class F(a) | Jul 2016 | | | 56,317 | | | | 1,317,818 | | | | 1,406,799 | |
WideOrbit, Inc., Preferred Class C(a) | Oct 2015 | | | 400,000 | | | | 1,100,000 | | | | 1,016,000 | |
| | | | | | | | | 2,417,818 | | | | 2,422,799 | |
CLEAN TECHNOLOGY – 7.7% | | | | | | | | | | | | | |
Spruce Finance, Inc., Preferred Class A-1(a) | Sep 2016 | | | 100,000 | | | | 1,000,000 | | | | 1,250,000 | |
Sungevity, Preferred Class D(a) | Dec 2015 | | | 47,375,754 | | | | 3,126,084 | | | | 4,737,575 | |
| | | | | | | | | 4,126,084 | | | | 5,987,575 | |
CONSUMER ELECTRONICS – 0.9% | | | | | | | | | | | | | |
AliphCom dba Jawbone, Inc., Preferred Class 5(a) | Dec 2014 | | | 102,938 | | | | 740,124 | | | | 717,478 | |
| | | | | | | | | | | | | | |
CONSUMER WEB – 0.1% | | | | | | | | | | | | | |
Musely, Preferred Class B(a) | Oct 2014 | | | 7,961 | | | | 100,012 | | | | 100,012 | |
| | | | | | | | | | | | | | |
FINANCE/PAYMENTS – 2.0% | | | | | | | | | | | | | |
Prosper Marketplace, Inc. Preferred Class A & A-1(a) | Jan 2016 | | | 113,560 | | | | 305,897 | | | | 270,882 | |
Social Finance, Inc., Class R | Nov 2014 | | | 34,000 | | | | 850,000 | | | | 1,313,760 | |
| | | | | | | | | 1,155,897 | | | | 1,584,642 | |
GAMES – 5.2% | | | | | | | | | | | | | |
KABAM, Inc., Preferred Class D(a) | Jul 2014 | | | 1,046,017 | | | | 2,000,000 | | | | 1,600,406 | |
RockYou, Inc., Preferred Class 1(a) | Apr 2015 | | | 1,014,900 | | | | 1,400,000 | | | | 2,435,760 | |
| | | | | | | | | 3,400,000 | | | | 4,036,166 | |
See accompanying Notes to the Financial Statements
8
SHARESPOST 100 FUND
Schedule of Investments (Continued)
December 31, 2016 |
| Acquisition
Date | | Shares or Principal
Amount | | | Cost | | | Fair Value | |
PREFERRED STOCK IN PRIVATE COMPANIES (b) – 33.7% (Continued) | | | | |
HEALTHCARE/BIOTECH – 1.5% | | | | | | | | | | |
Metabiota, Preferred Class A(a) | Apr 2015 | | | 346,212 | | | $ | 500,000 | | | $ | 498,545 | |
ZocDoc, Inc., Preferred Class A(a) | Feb 2015 | | | 35,000 | | | | 875,000 | | | | 666,400 | |
| | | | | | | | | 1,375,000 | | | | 1,164,945 | |
MUSIC – 3.6% | | | | | | | | | | | | | |
SoundHound, Inc., Preferred Class D(a) | Sep 2016 | | | 107,484 | | | | 2,200,767 | | | | 2,801,356 | |
| | | | | | | | | | | | | | |
SECURITY – 2.5% | | | | | | | | | | | | | |
Lookout, Inc., Preferred Class A(a) | Feb 2015 | | | 204,000 | | | | 1,927,800 | | | | 1,964,520 | |
| | | | | | | | | | | | | | |
SOFTWARE – 6.7% | | | | | | | | | | | | | |
DocuSign, Preferred Class F(a) | Nov 2015 | | | 219,973 | | | | 4,531,444 | | | | 5,230,958 | |
| | | | | | | | | | | | | | |
TRANSPORTATION – 0.4% | | | | | | | | | | | | | |
Lyft, Preferred Class D(a) | Oct 2016 | | | 12,000 | | | | 266,600 | | | | 291,840 | |
TOTAL PREFERRED STOCK IN PRIVATE COMPANIES | | | | | | | | | | | | 26,302,291 | |
| | | | | | | | | | | | | | |
CONVERTIBLE NOTES OF PRIVATE COMPANIES (b) – 1.3% | |
CLEAN TECHNOLOGY – 1.3% | | | | | | | | | | | | | |
Sungevity, 15.00%, 06/30/2018 | Jun 2016 | | | 500,000 | | | $ | 500,000 | | | $ | 500,000 | |
Sungevity, 15.00%, 06/30/2018 | Aug 2016 | | | 500,000 | | | | 500,000 | | | | 500,000 | |
TOTAL CONVERTIBLE NOTES OF PRIVATE COMPANIES | | | | | | | 1,000,000 | | | | 1,000,000 | |
| | | | | | | | | | | | | | |
SHORT-TERM INVESTMENTS – 18.9% | | | | | | | | | | | | | |
DEMAND DEPOSIT – 18.9% | | | | | | | | | | | | | |
UMB Money Market Fiduciary, 0.01% (c) | | | | | | | | 14,738,037 | | | | 14,738,037 | |
SHORT-TERM INVESTMENTS | | | | | | | | 14,738,037 | | | | 14,738,037 | |
| | | | | | | | | | | | | | |
TOTAL INVESTMENTS – 99.5% (Cost $65,543,222) | | | | | | | | | | | | 77,540,855 | |
Other assets less liabilities – 0.5% | | | | | | | | | | | | 374,214 | |
| | | | | | | | | | | | | | |
NET ASSETS – 100.0% | | | | | | | | | | | $ | 77,915,069 | |
(b) | Investments in private companies may be subject to restrictions on disposition imposed by the issuer. As of December 31, 2016 restricted securities represented 79.42% of net assets of the Fund. |
(c) | Rate disclosed represents the seven day yield as of the Fund’s period end. The UMB Money Market Fiduciary account is an interest-bearing money market deposit account maintained by UMB Bank, n.a. in its capacity as a custodian for various participating custody accounts. The Fund may redeem its investments in whole, or in part, on each business day. |
All issuers are United States based, except for Spotify and OpenX, which are based in Sweden and UK, respectively.
See accompanying Notes to the Financial Statements
9
SHARESPOST 100 FUND
Statement of Assets and Liabilities
December 31, 2016 |
Assets: | | | |
Investments, at fair value (Note 3): | | | |
Common stock in public companies | | $ | 923,640 | |
Common stock in private companies | | | 34,576,887 | |
Preferred stock in private companies | | | 26,302,291 | |
Convertible notes of private companies | | | 1,000,000 | |
Short-term investments | | | 14,738,037 | |
Total investments (cost $65,543,222) | | | 77,540,855 | |
Receivable for investments sold | | | 495,385 | |
Receivable for fund shares sold | | | 103,096 | |
Interest receivable | | | 63,408 | |
Prepaid expenses and other assets | | | 37,754 | |
Total assets | | | 78,240,498 | |
| | | | | |
Liabilities: | | | | |
Advisory fees | | | 87,567 | |
Payable for fund shares redeemed | | | 52,015 | |
Payable for shareholder servicing fees | | | 16,683 | |
Payable for audit and tax fees | | | 79,000 | |
Payable for transfer agent fees | | | 42,529 | |
Payable for chief compliance officer fees | | | 5,833 | |
Other accrued liabilities | | | 41,802 | |
Total liabilities | | | 325,429 | |
Net assets | | $ | 77,915,069 | |
Commitments and contingencies (Note 9) | | | | |
Net assets consist of: | | | | |
Capital stock (unlimited shares authorized, 25,000,000 shares registered, no par value) | | $ | 69,782,135 | |
Accumulated net realized loss on investments | | | (3,864,699 | ) |
Accumulated net unrealized gain on investments | | | 11,997,633 | |
Net assets | | $ | 77,915,069 | |
| | | | | |
Shares outstanding | | | 2,903,705 | |
Net asset value and redemption proceeds per share | | $ | 26.83 | |
Public offering price per share(a) | | $ | 28.47 | |
(a) | Computation of public offering price per share 100/94.25 of net asset value. (See Note 10) |
See accompanying Notes to the Financial Statements
10
SHARESPOST 100 FUND
Statement of Operations
For the year ended December 31, 2016 |
Investment Income: | | | |
Interest | | $ | 184,812 | |
Dividends | | | 56,171 | |
Total investment income | | | 240,983 | |
| | | | | |
Expenses: | | | | |
Investment advisory fees (Note 5) | | | 1,354,506 | |
Transfer agent fees | | | 267,838 | |
Legal fees | | | 155,794 | |
Audit and tax fees | | | 151,000 | |
Fund accounting & administration fees | | | 130,105 | |
Shareholder servicing fees | | | 86,400 | |
Trustee fees | | | 86,000 | |
Printing & postage | | | 81,589 | |
Chief compliance officer fees | | | 70,000 | |
Insurance fees | | | 63,855 | |
Registration fees | | | 35,321 | |
Custodian fees | | | 30,957 | |
Miscellaneous expenses | | | 26,858 | |
Total expenses | | | 2,540,223 | |
Less: Contractual waiver of fees and reimbursement of expenses (Note 4) | | | (757,978 | ) |
Net expenses | | | 1,782,245 | |
Net investment loss | | | (1,541,262 | ) |
| | | | | |
Net realized loss on investments | | | (1,752,845 | ) |
Net unrealized gain on investments | | | 6,955,787 | |
Net realized & unrealized gain on investments | | | 5,202,942 | |
Net change in net assets from operations | | $ | 3,661,680 | |
See accompanying Notes to the Financial Statements
11
SHARESPOST 100 FUND
Statements of Changes in Net Assets |
| | | Year ended
December 31, 2016 | | | Year ended
December 31, 2015 | |
Operations: | | | | | | |
Net investment loss | | $ | (1,541,262 | ) | | $ | (1,014,005 | ) |
Net realized loss on investments | | | (1,752,845 | ) | | | (2,033,460 | ) |
Net unrealized gain on investments | | | 6,955,787 | | | | 3,372,466 | |
Net change in net assets resulting from operations | | | 3,661,680 | | | | 325,001 | |
| | | | | | | | | |
Fund share transactions: | | | | | | | | |
Proceeds from shares issued | | | 16,102,805 | | | | 52,834,189 | |
Cost of shares redeemed | | | (9,429,838 | ) | | | (4,737,575 | ) |
Redemption fees | | | — | | | | 2,475 | * |
Net change in net assets from fund share transactions | | | 6,672,967 | | | | 48,099,089 | |
Net change in net assets | | $ | 10,334,647 | | | $ | 48,424,090 | |
| | | | | | | | | |
Net assets: | | | | | | | | |
Beginning of year | | $ | 67,580,422 | | | $ | 19,156,332 | |
End of year | | $ | 77,915,069 | | | $ | 67,580,422 | |
| | | | | | | | | |
Accumulated net investment loss | | $ | — | | | $ | — | |
| | | | | | | | | |
Transactions in shares: | | | | | | | | |
Issuance of shares | | | 615,850 | | | | 2,057,944 | |
Redemption of shares | | | (364,251 | ) | | | (185,694 | ) |
Net change in shares | | $ | 251,599 | | | $ | 1,872,250 | |
* | Redemption fees were discontinued in conjunction with the prospectus renewal effective April 30, 2015. |
See accompanying Notes to the Financial Statements
12
SHARESPOST 100 FUND
Statement of Cash Flows
For the year ended December 31, 2016 |
Cash flows from operating activities: | | | |
Net change in net assets from operations | | $ | 3,661,680 | |
Adjustments to reconcile net change in net assets from operations to net cash used in operating activities: | | | | |
Purchase of investments | | | (11,832,111 | ) |
Net sales of short-term investments | | | 2,403,852 | |
Sales of investments | | | 4,031,315 | |
Net unrealized gain on investments | | | (6,955,787 | ) |
Net realized loss on investments | | | 1,752,845 | |
Change in operating assets and liabilities: | | | | |
Decrease in interest receivable | | | 17,411 | |
Increase in prepaid expenses and other assets | | | (1,699 | ) |
Increase in net payable to adviser | | | 87,815 | |
Increase in other accrued liabilities | | | 29,624 | |
Net cash used in operating activities | | | (6,805,055 | ) |
| | | | | |
Cash flows from financing activities: | | | | |
Proceeds from shares issued, net of change in receivable for fund shares sold | | | 16,182,878 | |
Cost of shares redeemed, net of change in payable for fund shares redeemed | | | (9,377,823 | ) |
Net cash provided by financing activities | | | 6,805,055 | |
| | | | | |
Net change in cash | | | — | |
| | | | | |
Cash at beginning of year | | | — | |
Cash at end of year | | $ | — | |
| | | | | |
Supplemental disclosure of non-cash operating and financing activities: | | | | |
Conversion of convertible note and accrued interest to preferred stock | | $ | 2,200,767 | |
See accompanying Notes to the Financial Statements
13
SHARESPOST 100 FUND
Financial Highlights
For a capital share outstanding throughout each period |
| | | Year ended
December 31,
2016 | | | Year ended
December 31,
2015(a) | | | Year ended
December 31,
2014*(a) | | | Period ended
December 31,
2013** | |
Per share operating performance | | | | | | | | | | | | |
Net asset value, beginning of year | | $ | 25.48 | | | $ | 24.56 | | | $ | 20.00 | | | $ | 20.00 | |
| | | | | | | | | | | | | | | | | |
Change in net assets from operations: | | | | | | | | | | | | | | | | |
Net investment income (loss) | | | (0.53 | ) | | | (0.38 | ) | | | (0.24 | ) | | | — | |
Net realized and unrealized gain on investments | | | 1.88 | | | | 1.30 | | | | 4.80 | | | | — | |
Total change in net assets from operations | | | 1.35 | | | | 0.92 | | | | 4.56 | | | | — | |
| | | | | | | | | | | | | | | | | |
Distributions: | | | | | | | | | | | | | | | | |
From net investment income | | | — | | | | — | | | | — | | | | — | |
From net realized gain on investments | | | — | | | | — | | | | — | | | | — | |
Total distributions | | | — | | | | — | | | | — | | | | — | |
Net increase in net asset value | | | 1.35 | | | | 0.92 | | | | 4.56 | | | | — | |
Net asset value, end of year | | $ | 26.83 | | | $ | 25.48 | | | $ | 24.56 | | | $ | 20.00 | |
| | | | | | | | | | | | | | | | | |
Total return | | | 5.30 | %(b) | | | 3.75 | %(b) | | | 22.80 | %(b)(c) | | | — | %(b)(c) |
| | | | | | | | | | | | | | | | | |
Ratios and supplemental data | | | | | | | | | | | | | | | | |
Net assets, end of year (in thousands) | | $ | 77,915 | | | $ | 67,580 | | | $ | 19,156 | | | $ | 100 | |
Ratio of net expenses to average net assets | | | 2.50 | %(d) | | | 2.50 | %(e) | | | 2.49 | %(f) | | | — | %(g) |
Ratio of gross expenses before reimbursement to average net assets | | | 3.56 | % | | | 4.47 | % | | | 18.45 | % | | | 680.12 | %(g) |
Ratio of net investment income(loss) to average net assets | | | (2.16 | )% | | | (2.01 | )% | | | (2.49 | )% | | | — | %(g) |
Portfolio turnover | | | 7.78 | % | | | 4.45 | % | | | 2.40 | %(c) | | | — | %(c) |
* | The Fund’s inception date was March 25, 2014. Prior to March 25, 2014, the Fund had been inactive except for matters related to the Fund’s establishment, designation and planned registration and the sale of shares to SP Investment Management, LLC (see Note 1). |
** | The date of initial share purchase by the Investment Adviser was July 30, 2013. |
(a) | Redemption fees consisted of per share amounts of less than $0.01. Redemption fees were discontinued in conjunction with the prospectus renewal effective April 30, 2015. |
(b) | The Fund’s total investment returns do not include a sales load. |
(c) | Not annualized for periods less than one year. |
(d) | The ratio of net expenses are the result of $757,978 in contractual waivers and expense reimbursement representing (1.06)%. Please see Note 4 in the Notes to the Financial Statements for additional information. |
(e) | The ratio of net expenses are the result of $993,070 in contractual waivers and expense reimbursements representing (1.97)%. Please see Note 4 in the Notes to the Financial Statements for additional information. |
(f) | The ratio of net expenses are the combined result of $1,208,322 in contractual waivers and expense reimbursements representing (15.95)% and $575 in voluntary expense reimbursements representing (0.01)%. Please see note 4 in the Notes to the Financial Statements for additional information. |
(g) | Annualized for period less than one year, with the exception of non-recurring organizational costs. |
See accompanying Notes to the Financial Statements
14
SHARESPOST 100 FUND
Notes to the Financial Statements
December 31, 2016 |
1. Organization
SharesPost 100 Fund (the “Fund”) was established as a limited liability company under the laws of the State of Delaware on August 20, 2012 and converted into a Delaware statutory trust on March 22, 2013. The Fund is registered with the Securities and Exchange Commission (the “SEC”) as a non-diversified, closed-end management investment company that operates as an “interval fund” under the Investment Company Act of 1940, as amended (the “1940 Act”). The shares of beneficial interest of the Fund (the “Shares”) will be continuously offered under Rule 415 of the Securities Act of 1933, as amended (the “Securities Act”). As an interval fund, the Fund will make quarterly repurchase offers for 5% of the Fund’s outstanding Shares at net asset value (“NAV”), with no repurchase fee incurred. The Fund’s inception date was March 25, 2014. Prior to March 25, 2014, the Fund had been inactive except for matters relating to the Fund’s establishment, designation and planned registration of the Fund’s Shares under the Securities Act and the sale of 5,000 Shares (“Initial Shares”) for $100,000 to SP Investments Management, LLC (the “Investment Adviser”), which occurred on July 30, 2013.
The investment objective of the Fund is to provide investors capital appreciation, which it seeks to achieve by primarily investing in the equity securities of certain private, operating, late-stage, growth companies primarily comprising the SharesPost 100, a list of companies selected and maintained by the Investment Adviser. The Investment Adviser’s primary strategy will be to invest in portfolio companies (each, a “Portfolio Company”) and generally to hold such securities until a liquidity event with respect to such Portfolio Company occurs, such as an initial public offering, which generally includes a restrictive period of 180 days commonly known as a lock-up period, or a merger or acquisition transaction.
2. Significant accounting policies
The Fund is an investment company and follows the accounting and reporting guidance under Financial Accounting Standards Board (“FASB”) Accounting Standards (“ASC”) Topic 946, Financial Services – Investment Companies. The following is a summary of significant accounting policies consistently followed by the Fund in the preparation of its financial statements.
Investment transactions and income recognition — Investment transactions are accounted for on a trade date basis. Net realized gains and losses on securities are computed on a high cost, long term basis. Dividend income is recorded on the ex-dividend date or as soon as known if after the ex-dividend date. Non-cash dividends included in dividend income, if any, are recorded at fair market value. Interest income and estimated expenses are accrued daily.
Use of estimates — The preparation of the financial statements in accordance with accounting principles generally accepted in the United States of America (“GAAP”) requires management to make estimates and assumptions that affect the reported amounts of assets and liabilities and disclosure of contingent assets and liabilities at the date of the financial statement, as well as reported amounts of increases and decreases in net assets from operations during the reporting period. Actual results could differ from these estimates.
Investment valuation — The Fund’s NAV is based in large part on the value of its securities which will be carried at fair value in accordance with the provision of FASB ASC Topic 820, Fair value Measurements and Disclosures. Where reliable market prices are available for those securities, the Investment Adviser will rely on those prices. However, because the securities in which the Fund invests are often illiquid, market prices may not be readily available or, where available, may be unreliable. At any point in time, there may be few recent purchase or sale transactions or offers on which to base the value of a given private share. In addition, the prices reflected in recent transactions or offers may be extremely sensitive to changes in supply or demand, including changes fueled by investor perceptions or other conditions.
When reliable market values are not available, the Fund’s investments will be valued by the Investment Adviser pursuant to fair valuation procedures and methodologies adopted by the Board of Trustees. While the Fund and the Investment Adviser will use good faith efforts to determine the fair value of the Fund’s securities, fair value will be dependent on the judgment of the Investment Adviser. The Investment Adviser may also rely to some extent on information provided by the Portfolio Companies.
15
SHARESPOST 100 FUND
Notes to the Financial Statements (Continued)
December 31, 2016 |
2. Significant accounting policies — (continued)
From time to time, the Fund may determine that it should modify its estimates or assumptions, as new information becomes available. As a consequence, the value of the securities and therefore the Fund’s NAV may vary. This may adversely affect Shareholders. Other than in connection with a liquidity event of a Portfolio Company, the Fund will generally sell Portfolio Company securities only in order (and only to the extent necessary) to fund quarterly repurchases of Fund Shares. However, because of the uncertainty and judgment involved in the fair valuation of the private shares, which do not have a readily available market, the estimated fair value of such shares may be different from values that would have been used had a readily available market existed for such shares. In addition, in the event that the Fund desires to sell Portfolio Company shares, the Fund may also not be able to sell these securities at the prices at which they are carried on the Fund’s books, or may have to delay their sale in order to do so. This may adversely affect the Fund’s NAV.
The Board of Trustees has delegated the day-to-day responsibility for determining these fair values to the Investment Adviser, but the Board of Trustees has the ultimate responsibility for determining the fair value of the portfolio of the Fund. The Investment Adviser has developed the Fund’s fair valuation procedures and methodologies, which have been approved by the Board of Trustees, and will make fair valuation determinations and act in accordance with those procedures and methodologies, and in accordance with the 1940 Act. Fair valuation determinations are to be reviewed and, as necessary, ratified or revised quarterly by the Board of Trustees (or more frequently if necessary), including in connection with any quarterly repurchase offer.
Federal income taxes — The Fund’s policy is to comply with Subchapter M of the Internal Revenue Code of 1986, as amended (the “Code”), and to distribute to shareholders each year substantially all of its net investment income and any net realized capital gain. Therefore, a federal income tax or excise tax provision is not required.
Management has evaluated all tax positions taken or expected to be taken by the Fund to determine whether each tax position is more likely than not (i.e. greater than 50%) to be sustained upon examination by the applicable taxing authority, including resolution of any related appeals or litigation processes, based on the technical merits of the position. Tax positions that do not meet the more likely than not threshold may result in a tax benefit or expense in the current year. If the Fund were to incur an income tax liability in the future, interest on any income tax liability would be reported as interest expense and penalties on any income tax liability would be reported as income taxes. No interest expense or penalties have been recognized as of or for the year ended December 31, 2016. Management of the Fund also is not aware of any tax positions for which it is reasonably possible that the total amounts of recognized tax benefits will significantly change in the next twelve months. Management has determined that the Fund has not taken any tax positions which do not meet the more likely than not threshold and as such, no liabilities related to uncertain tax positions have been reflected in the Fund’s financial statements.
Management analyzed all open tax years, as defined by the applicable statute of limitations for all major jurisdictions in which it files tax returns, which includes federal and certain states. The Fund’s 2012 - 2015 tax years are open to examination as of December 31, 2016.
Distributions to shareholders — The Fund distributes net investment income and net realized gains (net of any capital loss carryovers), if any, annually. The timing and character of income and capital gain distributions are determined in accordance with income tax regulations, which may differ from GAAP. These differences are due in part to differing treatment of net operating loss, wash sales, non-deductible offering costs and capital loss carryforwards. To the extent that differences arise that are permanent in nature, such amounts are reclassified within the capital accounts, on the Statement of Assets and Liabilities, based on their federal tax treatment; temporary differences do not require reclassification.
Shareholder service fee plan — Under the terms of the Fund’s Shareholder Services Plan, the Fund may compensate financial industry professionals for providing ongoing services in respect to clients to whom they have distributed Shares of the Fund. The Fund may incur shareholder servicing fees on an annual basis up to 0.25% of its average NAV. For the year ended December 31, 2016, the Fund accrued $86,400 in shareholder servicing fees.
16
SHARESPOST 100 FUND
Notes to the Financial Statements (Continued)
December 31, 2016 |
2. Significant accounting policies — (continued)
Redemption fee — Redemption fees were discontinued in conjunction with the prospectus renewal effective April 30, 2015. Prior to April 30, 2015, the Fund received a 2.00% redemption fee on redemption amounts for Shares held for less than 365 days, and recorded these fees as paid-in-capital.
Transactions with affiliates — SharesPost Financial Corporation (“SharesPost Financial”) is a registered broker-dealer, member of FINRA and SIPC, and wholly owned subsidiary of SharesPost, Inc. Since they are both wholly owned by SharesPost, Inc., SharesPost Financial and the Investment Adviser are affiliates.
To the extent any affiliate of the Investment Adviser or the Fund (“Affiliated Broker”) receives any fee, payment, commission, or other financial incentive of any type (“Broker Fees”) in connection with the purchase and sale of securities by the Fund, such Broker Fees will be subject to policies and procedures adopted by the Board of Trustees pursuant to Section 17(e) and Rule 17e-1 of the 1940 Act. These policies and procedures include a quarterly review of Broker Fees by the Board of Trustees. Among other things, Section 17(e) and those procedures provide that, when acting as broker for the Fund in connection with the purchase or sale of securities to or by the Fund, an affiliated broker may not receive any compensation exceeding the following limits: (1) if the transaction is effected on a securities exchange, the compensation may not exceed the “usual and customary broker’s commission” (as defined in Rule 17e-1 under the 1940 Act); (2) in the case of the purchase of securities by the Fund in connection with a secondary distribution, the compensation cannot exceed 2% of the sale price; and (iii) the compensation for transactions otherwise effected cannot exceed 1% of the purchase or sale price. Rule 17e-1 defines a “usual and customary broker’s commission” as one that is fair compared to the commission received by other brokers in connection with comparable transactions involving similar securities being purchased or sold on an exchange during a comparable period of time. The Fund has adopted a policy that it will not utilize the services of Affiliated Brokers (although Affiliated Brokers may be engaged by sellers or buyers in transactions opposite the Fund). Notwithstanding the foregoing, no Affiliated Broker will receive any undisclosed fees from the Fund in connection with any transaction involving the Fund and such Affiliated Broker, and to the extent any transactions involving the Fund are effected by an Affiliated Broker, such Affiliated Broker’s Broker Fees for such transactions shall be limited in accordance with Section 17(e)(2) of the 1940 Act and the Fund’s policies and procedures concerning Affiliated Brokers. For the year ended December 31, 2016, the Fund paid no commissions to Affiliated Brokers.
The Fund has implemented certain written policies and procedures to ensure that the Fund does not engage in any transactions with any prohibited affiliates. Under the 1940 Act, our Board of Trustees has a duty to evaluate, and shall oversee the analysis of, all conflicts of interest involving the Fund and its affiliates, and shall do so in accordance with the aforementioned policies and procedures.
3. Fair value measurements
GAAP defines fair value, establishes a three-tier framework for measuring fair value based on a hierarchy of inputs, and expands disclosure about fair value measurements. It also provides guidance on determining
when there has been a significant decrease in the volume and level of activity for an asset or liability, when a transaction is not orderly and how that information must be incorporated into a fair value measurement. The hierarchy distinguishes between market data obtained from independent sources (observable inputs) and the Fund’s own market assumptions (unobservable inputs). These inputs are used in determining the fair value of the Fund’s investments. These inputs are summarized in the three broad levels listed below:
| | • | Level 1 — quoted prices for active markets for identical securities. An active market for the security is a market in which transactions occur with sufficient frequency and volume to provide pricing information on an ongoing basis. A quoted price in an active market provides the most reliable evidence of fair value. |
17
SHARESPOST 100 FUND
Notes to the Financial Statements (Continued)
December 31, 2016 |
3. Fair valuation measurements — (continued)
| | • | Level 2 — other significant observable inputs (including quoted prices for similar securities, interest rates, prepayment speeds, credit risk, etc. and quoted prices for identical or similar assets in markets that are not active). Inputs that are derived principally from or corroborated by observable market data. An adjustment to any observable input that is significant to the fair value may render the measurement a Level 3 measurement. |
| | • | Level 3 — significant unobservable inputs, including the Fund’s own assumptions in determining the fair value of investments. |
For the year ended December 31, 2016 there were transfers of $132,580 out of Level 2 and into Level 1, and $791,060 out of Level 3 and into Level 2, due to changes in the liquidity restrictions of private holdings. It is the Fund’s policy to recognize transfers into and out of all Levels at the end of the reporting period.
The following is a description of the valuation techniques applied to the Fund’s major categories of assets and liabilities measured at fair value on a recurring basis. There were no changes to these techniques during 2016.
Securities traded on a national exchange (or reported on the NASDAQ national market) are stated at the last reported sales price on the day of valuation. To the extent these securities are actively traded and valuation adjustments are not applied, they are categorized in Level 1 of the fair value hierarchy. Stocks traded on inactive markets or valued by reference to similar instruments which are marketable and to the extent the inputs are observable and timely, are categorized in Level 2 of the fair value hierarchy.
The Fund’s portfolio holdings are primarily in Level 3 investments. As they are not publicly traded, and many are subject to restrictions on resale, the investments are less liquid than publicly traded securities, resulting in increased liquidity risk to the Fund.
The Fund’s portfolio investments will generally not be in publicly traded securities. Investments for which observable market prices in active markets do not exist are reported at fair value, as determined in good faith by the Investment Adviser under consistently applied policies and procedures approved by the Board of Trustees in accordance with GAAP. In connection with that determination, members of the Investment Adviser’s portfolio management team will prepare Portfolio Company valuations using the most recent Portfolio Company financial statements and forecasts when and if available. The types of factors that the Investment Adviser will take into account in determining fair value, subject to review and ratification where required by the Board of Trustees with respect to such non-traded investments will include, as relevant and, to the extent available, the Portfolio Company’s earnings, the markets in which the Portfolio Company does business, comparison to valuations of publicly traded companies in the Portfolio Company’s industry, comparisons to recent sales of comparable companies, the discounted value of the cash flows of the Portfolio Company and other relevant factors. This information may not be available because it is difficult to obtain financial and other information with respect to private companies. Because such valuations are inherently uncertain and may be based on estimates, the determinations of fair value may differ materially from the values that would be assessed if a readily available market for these securities existed. Based on these factors, the investments in private companies will generally be presented as a Level 3 investment. Changes in accounting standards, such as the currently pending changes in revenue recognition policies, may not be adopted consistently by issuers or at the same time, and as a result varied implementation may make it more difficult for the Fund to properly evaluate or compare financial information provided by Portfolio Companies of the Fund or to determine the validity of data of publicly traded company comparables for purposes of valuing the Fund’s portfolio holdings.
In May 2015, the Financial Accounting Standards Board (the “FASB”) issued Accounting Standard Update (“ASU”) 2015-07, Disclosures for Investments in Certain Entities That Calculate Net Asset Value per Unit (or Its Equivalent), modifying ASC 820. Under the modifications, investments in private investment funds valued at net asset value are no longer included in the fair value hierarchy table. The adoption of AS 2015-07 resulted in the Fund’s investment in short-term investments being removed from the Fair Value hierarchy table.
18
SHARESPOST 100 FUND
Notes to the Financial Statements (Continued)
December 31, 2016 |
3. Fair valuation measurements — (continued)
The inputs or methodology used for valuing securities are not necessarily an indication of the risk associated with investing in those securities. The following is a summary of the inputs used to determine fair value of the Fund’s investments as of December 31, 2016:
Investment in Securities | | Level 1 -
Quoted Prices | | | Level 2 –
Other Significant Observable Inputs | | | Level 3 –
Significant
Unobservable Inputs | | | Total | |
Security Type | | | | | | | | | | | | |
Common stock in public companies* | | $ | 132,580 | | | $ | 791,060 | | | $ | — | | | $ | 923,640 | |
Common stock in private companies* | | | | | | | | | | | 34,576,887 | | | | 34,576,887 | |
Preferred stock in private companies* | | | | | | | — | | | | 26,302,291 | | | | 26,302,291 | |
Convertible notes of private companies | | | — | | | | — | | | | 1,000,000 | | | | 1,000,000 | |
Total | | $ | 132,580 | | | $ | 791,060 | | | $ | 61,879,178 | | | $ | 62,802,818 | |
Money Market holdings valued using the practical expedient and not subject to the fair value hierarchy | | | | | | | | | | | | | | | 14,738,037 | |
Total | | | | | | | | | | | | | | | 77,540,855 | |
* | All sub-categories within the security type represent their respective evaluation status. For a detailed breakout by industry, please refer to the Schedule of Investments. |
The following is a rollforward of the activity in investments in which significant unobservable inputs (Level 3) were used in determining fair value on a recurring basis:
| | Beginning balance January 1, 2016 | | | Transfers into Level 3 during the period | | | Transfers out of Level 3 during the period | | | Purchases | | | (Sales) | | | Net
realized
gain | | | Change in net
unrealized gain | | | Ending balance
December 31,
2016 | | | Change in unrealized gains for the period for investment still held at December 31, 2016 | |
SharesPost 100 Fund | | | | | | | | | | | | | | | | | | | | | | | | | |
Common stock in private companies | $ | 27,012,005 | | | $ | — | | | $ | (791,060 | ) | | $ | 5,730,835 | | | $ | (1,168,169 | ) | | $ | (998,304 | ) | | | 4,791,580 | | | $ | 34,576,887 | | | $ | 4,455,725 | |
Preferred stock in private companies | | 19,453,214 | | | | — | | | | — | | | | 5,101,275 | ** | | | (284,305 | ) | | | 22,305 | | | | 2,009,801 | | | | 26,302,291 | | | | 2,022,802 | |
Convertible notes of private companies | | 2,000,000 | | | | — | | | | — | | | | 1,000,000 | | | | (2,000,000 | )** | | | — | | | | — | | | | 1,000,000 | | | | — | |
| | $ | 48,465,219 | | | $ | — | | | $ | (791,060 | ) | | $ | 11,832,111 | | | $ | (3,452,474 | ) | | $ | (975,999 | ) | | $ | 6,801,381 | | | $ | 61,879,178 | | | $ | 6,478,527 | |
** | Amounts include $2,000,000 in convertible note, which along with $200,767 accrued interest was converted into $2,200,767 of preferred stock. |
19
SHARESPOST 100 FUND
Notes to the Financial Statements (Continued)
December 31, 2016 |
3. Fair valuation measurements — (continued)
The following is a summary of quantitative information about significant unobservable valuation inputs for Level 3 Fair Value Measurements for investments held as of December 31, 2016:
Type of Level 3
Investment | Fair Value as of
December 31, 2016 | Valuation
Technique | Unobservable
Inputs | Range (Avg) |
Common stock in private companies | $ 34,576,887 | Market approach | Precedent Transactions | N/A |
| | | | | |
| | | Income approach | Revenue Multiples | 1.33 - 7.08 (3.78) |
| | | | Stage Discout Rates | 10% - 60% (22.76%) |
| | | | Execution Discount Rates | 10% - 90% (41.80%) |
| | | | Discounts For Lack of Marketability | 15% - 15% (15.00%) |
Preferred stock in private companies | 26,302,291 | Market approach | Precedent Transactions | N/A |
| | | | | |
| | | Income approach | Revenue Multiples | 1.33 - 7.08 (3.46) |
| | | | Stage Discout Rates | 20% - 60% (24.38%) |
| | | | Execution Discount Rates | 10% - 90% (45.00%) |
| | | | Discounts For Lack of Marketability | 15% - 15% (15.00%) |
Convertible notes of private companies | 1,000,000 | Market approach | Precedent Transactions | N/A |
| | | | | |
| | | Income approach | Revenue Multiples | 3.25 – 3.25 (3.25) |
| | | | Stage Discout Rates | 20% - 20% (20.00%) |
| | | | Execution Discount Rates | 40% - 40% (40.00%) |
| | | | Discounts For Lack of Marketability | 15% - 15% (15.00%) |
To the extent the revenue multiples increase, there is a corresponding increase in fair value; while as discount rates increase, there is a decrease in fair value.
4. Expense limitation agreement
The Investment Adviser has contractually agreed to reimburse the Fund so that its total annual operating expenses, excluding interest, taxes, brokerage commissions and other expenses that are capitalized in accordance with GAAP, and other extraordinary costs, such as litigation and other expenses not incurred in the ordinary course of the Fund’s business, do not exceed 2.50% of the Fund’s average net assets per year, through May 1, 2017.
Under the terms of the Expense Limitation Agreement, at any time that the expenses of the Fund are less than the expense limitation, the Investment Adviser retains the right to seek reimbursement for any fees previously waived and/or expenses previously assumed, to the extent that such reimbursement will not cause the Fund’s annualized expenses to exceed 2.50% of its average net assets on an annualized basis. The Fund is not obligated to reimburse the Investment Adviser for fees previously waived or expenses previously assumed by the Investment Adviser more than three years before the date of such waiver or expense reimbursement. For the periods
20
SHARESPOST 100 FUND
Notes to the Financial Statements (Continued)
December 31, 2016 |
4. Expense limitation agreement — (continued)
ended December 31, 2014, December 31, 2015, and December 31, 2016 the investment advisory fees and expense reimbursements by the Investment Adviser waived in the amounts of $1,208,322, $993,070, and $757,978 respectively, are subject to possible recoupment by the Investment Adviser through December 31, 2017, December 31, 2018, and December 31, 2019, respectively.
5. Investment advisory agreement
The Fund has entered into an Investment Advisory Agreement with the Investment Adviser, pursuant to which the Investment Adviser provides general investment advisory services for the Fund. For providing these services, the Investment Adviser receives a fee from the Fund, accrued daily and paid monthly, at an annual rate equal to 1.90% of the Fund’s average daily net assets. For the year ending December 31, 2016, the Fund accrued $1,354,506 in investment advisory fees.
Certain officers and Trustees of the Fund are also officers of the Investment Adviser. None of the Fund officers who are affiliated with the Adviser or interested Trustees receives any compensation from the Fund.
6. Capital share transactions
The Fund Shares will be continuously offered under Rule 415 of the Securities Act of 1933, as amended. As of December 31, 2016, the Fund had registered 25,000,000.
Investors may purchase shares each business day at a price equal to the NAV per share next determined after receipt of a purchase order. Any sales load will be deducted from the proceeds to the Fund.
As of December 31, 2016, ownership from affiliated parties represents 1.31% of the Fund.
The Fund’s shares are not redeemable each business day, are not listed for trading on an exchange, and no secondary market currently exists for Fund shares. As an interval fund and as described in the Fund’s prospectus, the Fund will make quarterly repurchase offers of 5% of the total number of shares outstanding at their NAV, unless postponed in accordance with regulatory requirements, and each repurchase pricing shall occur no later than the 14th day after the repurchase request deadline, or the next business day if the 14th day is not a business day. Rule 23c-3 of the 1940 Act permits repurchases between 5% and 25% of the Fund’s outstanding shares at NAV.
In every full quarter since the commencement of operations, the Fund has offered shareholders the opportunity to participate in this program. During the year ended December 31, 2016, the Fund had Repurchase Offers as follows:
Summary of Repurchase Offers – 1/1/16 through 12/31/16
Repurchase Pricing Date | Repurchase Offer Amount | % of Shares
Tendered | Number of
Shares Tendered |
3/28/2016 | 5% | 3.27% | 89,733 |
6/27/2016 | 5% | 4.41% | 124,825 |
9/26/2016 | 5% | 3.39% | 90,762 |
12/27/2016 | 5% | 1.95% | 58,931 |
7. Purchases and sales of securities
Purchases and sales of investments for the year ended December 31, 2016, were $11,832,111 and $4,420,602, respectively.
21
SHARESPOST 100 FUND
Notes to the Financial Statements (Continued)
December 31, 2016 |
8. Federal tax information
At December 31, 2016, gross unrealized appreciation and depreciation of investments, based on cost for federal income tax purposes were as follows:
Cost of investments | | $ | 65,543,222 | |
Gross unrealized appreciation | | | 16,018,107 | |
Gross unrealized depreciation | | | (4,020,474 | ) |
Net unrealized appreciation on investments | | $ | 11,997,633 | |
GAAP requires that certain components of net assets be reclassified between financial and tax reporting. These reclassifications have no effect on net assets or net asset value per share. For the year ended December 31, 2016, permanent differences in book and tax accounting have been reclassified to paid-in capital, accumulated net investment income (loss) and accumulated realized gain (loss) as follows:
Increase (Decrease) |
Paid in Capital | Accumulated Net
Investment Income (Loss) | Accumulated Net Realized Gain (Loss) |
$(1,541,262) | $1,541,262 | $ — |
As of December 31, 2016, the components of accumulated earnings on a tax basis were as follows:
Undistributed ordinary income | | $ | — | |
Undistributed long-term capital gains | | | — | |
Tax accumulated earnings | | | — | |
Accumulated capital and other losses | | | (3,864,699 | ) |
Net unrealized gain | | | 11,997,633 | |
Total accumulated earnings | | $ | 8,132,934 | |
The Fund had a net capital loss carryforward of:
Short-term non-expiring | | $ | (1,749,206 | ) |
Long-term non-expiring | | | (2,115,493 | ) |
| | | $ | (3,864,699 | ) |
To the extent that the Fund may realize future net capital gains, those gains will be offset by any of its unused capital loss carryforward. Future capital loss carryover utilization in any given year may be subject to Internal Revenue Code limitations.
9. Commitments and Contingencies
In the normal course of business, the Fund will enter into contracts that contain a variety of representations, provide general indemnifications, set forth termination provisions and compel the contracting parties to arbitration in the event of dispute. From time to time, the Fund may be a party to arbitration, or legal proceedings, in the ordinary course of business, including proceedings relating to the enforcement of provisions of such contracts. The Fund’s maximum exposure under these arrangements is unknown, as this would involve future claims that may be made against the Fund that would be subject to arbitration, generally.
22
SHARESPOST 100 FUND
Notes to the Financial Statements (Continued)
December 31, 2016 |
9. Commitments and Contingencies — (continued)
In the normal course of business, the Company may enter into agreements to purchase investments. Such agreements are subject to certain rights of the issuer’s and ultimately, issuer approval. At December 31, 2016, the Fund had entered into agreements to purchase equity securities totaling $265,517. If approved by the issuer the Fund would record such amount in purchase costs. The Fund reasonably believes its assets will provide adequate cover to satisfy all its unfunded commitments. The Fund has ensured through its policies and procedures that it does not enter into an unfunded commitment unless it has reserved enough cash to meet the funding requirements thereof.
10. Offering Price Per Share
A maximum front-end sales load of 5.75% is imposed on purchases of the Fund’s shares. For the year ended December 31, 2016, the Fund was advised that various broker dealers received $71,127 of sales charges from sales of the Fund’s shares, of which $29,920 represented sales load received by affiliates.
11. Subsequent events
Management of the Fund has evaluated events occurring after December 31, 2016 and through the date the financials were available to be issued, to determine whether any subsequent events would require adjustment to or disclosure in the financial statements. No subsequent events requiring adjustment to or disclosure within the financial statements were noted.
23
SHARESPOST 100 FUND
Report of Independent Registered Public Accounting Firm |
The Board of Trustees and Shareholders
SharesPost 100 Fund:
We have audited the accompanying statement of assets and liabilities, including the schedule of investments, of SharesPost 100 Fund (the Fund) as of December 31, 2016, and the related statements of operations and cash flows for the year then ended, the statements of changes in net assets for the years ended December 31, 2016 and 2015, and financial highlights for the years ended December 31, 2016, 2015, 2014 and for the period from July 30, 2013 (date of initial share purchase by SP Investments Management, LLC) through December 31, 2013. These financial statements are the responsibility of the Fund’s management. Our responsibility is to express an opinion on these financial statements based on our audits.
We conducted our audits in accordance with the standards of the Public Company Accounting Oversight Board (United States). Those standards require that we plan and perform the audit to obtain reasonable assurance about whether the financial statements are free of material misstatement. Our procedures included confirmation of securities owned as of December 31, 2016 by correspondence with the custodian, issuers of the securities, or other appropriate auditing procedures when replies from the issuers were not received. An audit includes examining, on a test basis, evidence supporting the amounts and disclosures in the financial statements. An audit also includes assessing the accounting principles used and significant estimates made by management, as well as evaluating the overall financial statement presentation. We believe that our audits provide a reasonable basis for our opinion.
In our opinion, the financial statements referred to above present fairly, in all material respects, the financial position of SharesPost 100 Fund as of December 31, 2016, and the results of its operations and its cash flows for the year then ended, and the changes in its net assets for the years ended December 31, 2016 and 2015 and its financial highlights for the years ended December 31, 2016, 2015, 2014 and for the period from July 30, 2013 through December 31, 2013, in conformity with U.S. generally accepted accounting principles.

Los Angeles, California
February 28, 2017
24
SHARESPOST 100 FUND
Trustee Information
December 31, 2016 (Unaudited) |
The Board of Trustees of the Fund has overall responsibility for monitoring the Fund’s investment program, determining the fair value of the Fund’s Portfolio Companies, and its management and operations. The names of the Trustees and Officers of the Fund, their addresses, ages and principal occupations during the past five years are provided in the tables below. Trustees who are deemed “interested persons,” as defined in the 1940 Act, are included in the table titled “Interested Trustee and Officer.” Trustees who are not “interested persons” are referred to as “Independent Trustees.” The Fund’s Statement of Additional Information includes additional information about the Fund’s Trustees and is available, without charge and upon request, by calling 1-800-834-8707.
Name, Address(1) and Age | Position(s)
held with the Fund | Term of
Office and Length of Time Served | Principal Occupation(s) During Past Five Years | Number of Portfolios in Fund Complex Overseen by Trustee | Other Directorships Held by Director |
INDEPENDENT TRUSTEES: | | | | |
Robert Boulware
Age: 60 | Independent Trustee | Since inception(2) | Professional board director and trustee. Managing Director, Pilgrim Funds, LLC | 1 | Gainsco, Inc. (PINK: GANS), Met Investor Series Trust (trustee) |
Mark Radcliffe
Age: 64 | Independent Trustee | Since inception(2) | Partner, DLA Piper | 1 | N/A |
INTERESTED TRUSTEE AND OFFICER: | | | |
Sven Weber
Age: 46 | Interested Trustee and President | Since inception(2) | Managing Director of SP Investments Management, LLC, President SVB Capital with SVB Financial Group, Principal of Cipio Partners LLC | 1 | None |
OFFICER: | | | | | |
Julie Walsh
Age: 46 | Chief Compliance Officer | Elected by the Board annually; Since August 12, 2014 | Managing Director, Compliance and NFA Member Services, Foreside Fund Officer Services, LLC (f/k/a Foreside Compliance Services, LLC); Fund Chief Compliance Officer | N/A | N/A |
(1) | All addresses c/o SharesPost 100 Fund, 101 Jefferson Drive, Menlo Park, CA 94025. |
(2) | Each Trustee will serve for the duration of the Fund, or until death, resignation, termination, removal or retirement |
25
SHARESPOST 100 FUND
Additional Information
December 31, 2016 (Unaudited) |
Proxy voting — A description of the policies and procedures that the Fund uses to determine how to vote proxies relating to portfolio securities and information regarding how the Fund voted proxies during the 12 month period ended June 30, are available without charge upon request by (1) calling the Fund at 1-800-834-8707 and (2) from Fund documents filed with the Securities and Exchange Commission (“SEC”) on the SEC’s website at www.sec.gov.
Portfolio holdings — The Fund files its complete schedule of portfolio holdings with the SEC for the first and third quarters of each fiscal year on form N-Q. The Fund’s Form N-Q is available on the SEC’s website at www.sec.gov, or they may be reviewed and copied at the SEC’s Public Reference Room in Washington, DC (call 1-800-732-0330 for information on the operation of the Public Reference Room). You may also obtain copies by calling the Fund at 1-800-834-8707.
26
27
THIS PAGE INTENTIONALLY LEFT BLANK
THIS PAGE INTENTIONALLY LEFT BLANK
THIS PAGE INTENTIONALLY LEFT BLANK

Board of Trustees
Sven Weber
Robert J. Boulware
Mark Radcliffe
Investment Adviser
SP Investments Management, LLC
101 Jefferson Drive,
Menlo Park, CA 94025
Dividend Paying Agent, Custodian, Transfer Agent
UMB Fund Services
235 West Galena Street
Milwaukee, WI 53212
Distributor
Foreside Fund Services, LLC
Three Canal Plaza, Suite 100
Portland, ME 04101
Independent Auditors
KPMG LLP
550 South Hope Street, Suite 1500
Los Angeles, CA 90071
This report has been prepared for the general information of the shareholders. It is not authorized for distribution to prospective investors unless preceded or accompanied by a current prospectus. The Fund’s prospectus contains more complete information about the objectives, policies, expenses and risks of the Funds. The Fund is not a bank deposit, not FDIC insured and may lose value. Please read the prospectus carefully before investing or sending money.
This report contains certain forward looking statements which are subject to known and unknown risks and uncertainties that could cause actual results to differ materially from those expressed or implied by such statements. Forward looking statements generally include words such as ‘‘believes’’, ‘‘expects’’, ‘‘anticipates’’ and other words of similar import. Such risks and uncertainties include, among other things, the Risk Factors noted in the Fund’s filings with the Securities and Exchange Commission. The Fund undertakes no obligation to update any forward looking statement.
Item 2. Code of Ethics.
The Registrant has a code of ethics (the “Code”) that applies to the Registrant’s principal executive officer and principal financial officer. During the period covered by this report, there were no amendments to the provisions of the Code, nor were there any implicit or explicit waivers to the provisions of the Code. The Code is filed herewith.
Item 3. Audit Committee Financial Expert.
The Registrant does not have an audit committee financial expert. The Board of Trustees of the Registrant has determined that the members of its Audit Committee have sufficient financial experience to ensure the proper functioning of that committee, but that neither of the members has the requisite expertise or experience to be deemed an “audit committee financial expert” for purposes of the definition of such term in the Instructions to this Item 3 on Form N-CSR.
Item 4. Principal Accountant Fees and Services.
The aggregate fees for professional services by KPMG LLP during the fiscal year 2016 and 2015 were as follows:
(a) Audit Fees.
| Fiscal year ended December 31, 2016: | $132,500 |
| Fiscal year ended December 31, 2015: | $115,000 |
(b) Audit-Related Fees.
| Fiscal year ended December 31, 2016: | $0 |
| Fiscal year ended December 31, 2015: | $0 |
(c) Tax Fees. These are fees billed for professional services rendered by the Registrant’s independent auditors for tax compliance, tax advice, and tax planning.
| Fiscal year ended December 31, 2016 | $11,000 |
| Fiscal year ended December 31, 2015 | $11,500 |
(d) All Other Fees.
| Fiscal year ended December 31, 2016 | $0 |
| Fiscal year ended December 31, 2015 | $0 |
(e) Audit Committee’s pre-approval policies and procedures.
| | (1) | The Audit Committee has adopted pre-approval policies and procedures that require the Audit Committee to pre-approve all audit and non-audit services of the Registrant, including services provided to the Registrant’s investment adviser or any entity controlling, controlled by or under common control with the Registrant’s investment adviser that provides ongoing services to the Registrant with respect to any engagement that directly relates to the operations and financial reporting of the Registrant. |
| | (2) | Services approved pursuant to paragraph (c)(7)(i)(C) of Rule 2-01 of Regulation S-X: 100% of these fees were approved by the Audit Committee as required pursuant to paragraph (c)(7)(ii) of Rule 2-01 of Regulation S-X. |
(f) None.
(g) During the last two fiscal years, there were no other non-audit services rendered by the Registrant’s independent auditors to the Registrant, its investment adviser or any entity controlling, controlled by or under the common control with the investment adviser that provides ongoing services to the Registrant.
(h) Not applicable.
Item 5. Audit Committee of Listed Registrants.
Not applicable.
Item 6. Schedule of Investments.
Included as part of the report to shareholders filed under Item 1 of this Form N-CSR.
Item 7. Disclosure of Proxy Voting Policies and Procedures for Closed-End Management Investment Companies.
The Board of Trustees of the Registrant has adopted the Proxy Voting Procedures of SP Investments Management, LLC (“SPIM” or the “Adviser”), the Registrant’s investment adviser, as the Registrant’s Proxy Voting Procedures. Subject to the oversight of the Registrant’s Board of Trustees, the Registrant has delegated responsibility to the Adviser to vote any proxies the Registrant may receive. The Adviser’s general policy is to vote proxy proposals, amendments, consents or resolutions relating to the Registrant in a manner that serves the best interests of the Registrant.
Adviser’s Proxy Voting Policy
SPIM, as a matter of policy and as a fiduciary to its clients that are registered management investment companies (“Clients”), permits Clients to delegate proxy voting authority to SPIM, consistent with the best economic interests of the Clients.
Adviser’s Proxy Voting Procedure
All Client proxies are voted in accordance with the Adviser’s Proxy Voting Guidelines, as summarized below. In the event the Adviser’s Proxy Voting Guidelines do not address how a proxy should be voted, SPIM votes the proxy in a manner consistent with the general principles of its Proxy Voting Policies and Procedures and in the particular Client’s best interest. Prior to voting any proxies, the Chief Compliance Officer of the Adviser will determine whether any material conflict of interest may exist between SPIM and the respective Client with respect thereto. If the Chief Compliance Officer determines that any such material conflict of interest may exist, SPIM will follow the procedures identified under “Conflicts of Interest” below in connection with the voting of such proxies.
Conflicts of Interest
| | A. | In the event that SPIM or its Chief Compliance Officer determines that voting a proxy may present a material conflict of interest between SPIM and a Client, SPIM will (1) disclose such conflict of interest to the Client and obtain written direction from the Client as to how to vote the proxy, (2) suggest that the Client engage another party to determine how to vote the proxy, or (3) engage another independent third party to determine how to vote the proxy. |
| | B. | Notwithstanding the foregoing, SPIM must vote proxies in the best interest of Clients when material conflicts of interest may exist with respect thereto. |
| | C. | SPIM believes that its policies and procedures are reasonably designed to address material conflicts of interest that may arise between SPIM and a Client as to the manner in which proxies are voted. |
Except in instances where Clients have retained voting authority, SPIM will instruct custodians of Client accounts to forward all proxy statements and materials received in respect of Client accounts to SPIM’s Chief Compliance Officer. SPIM retains final authority and fiduciary responsibility for proxy voting.
Adviser’s General Proxy Voting Guidelines
SPIM has adopted general guidelines for voting proxies as summarized below. In keeping with its fiduciary obligations to its Clients, SPIM reviews all proposals, even those that may be considered to be routine matters. Although these guidelines are to be followed as a general policy, in all cases each proxy and proposal will be considered based on the relevant facts and circumstances. SPIM may deviate from the general policies and procedures when it determines that the particular facts and circumstances warrant such deviation to protect the best interests of the Clients. These guidelines cannot provide an exhaustive list of all the issues that may arise nor can SPIM anticipate all future situations. Corporate governance issues are diverse and continually evolving and SPIM devotes significant time and resources to monitor these changes.
The following guidelines reflect what SPIM believes to be good corporate governance and behavior:
Board of Directors: The election of directors and an independent board are key to good corporate governance. Directors are expected to be competent individuals and they should be accountable and responsive to shareholders. SPIM supports an independent board of directors, and prefers that key committees such as audit, nominating, and compensation committees be comprised of independent directors. SPIM will generally vote against management efforts to classify a board and will generally support proposals to declassify the board of directors. SPIM will consider withholding votes from directors who have attended less than 75% of meetings without a valid reason. While generally in favor of separating Chairman and CEO positions, SPIM will review this issue on a case-by-case basis taking into consideration other factors including the company's corporate governance guidelines and performance. SPIM evaluates proposals to restore or provide for cumulative voting on a case-by-case basis and considers such factors as corporate governance provisions as well as relative performance. SPIM generally will support non-binding shareholder proposals to require a majority vote standard for the election of directors; however, if these proposals are binding, SPIM will give careful review on a case-by-case basis of the potential ramifications of such implementation. In the event of a contested election, SPIM will review a number of factors in making a decision including management’s track record, the company’s financial performance, qualifications of candidates on both slates, and the strategic plan of the dissidents.
Ratification of Auditors: SPIM will closely scrutinize the independence, role, and performance of auditors. On a case-by-case basis, SPIM will examine proposals relating to non-audit relationships and non-audit fees. SPIM will also consider, on a case-by-case basis, proposals to rotate auditors, and will vote against the ratification of auditors when there is clear and compelling evidence of a lack of independence, accounting irregularities or negligence attributable to the auditors. SPIM may also consider whether the ratification of auditors has been approved by an appropriate audit committee that meets applicable composition and independence requirements.
Anti-Takeover Mechanisms and Related Issues: SPIM generally opposes antitakeover measures since they tend to reduce shareholder rights. However, as with all proxy issues, SPIM conducts an independent review of each anti-takeover proposal. On occasion, SPIM may vote with management when the research analyst has concluded that the proposal is not onerous and would not harm Clients' interests as stockholders. SPIM generally supports proposals that require shareholder rights plans ("poison pills") to be subject to a shareholder vote. SPIM will closely evaluate shareholder rights' plans on a case-by-case basis to determine whether or not they warrant support. SPIM will generally vote against any proposal to issue stock that has unequal or subordinate voting rights. In addition, SPIM generally opposes any supermajority voting requirements as well as the payment of "greenmail." SPIM usually supports "fair price" provisions and confidential voting. SPIM will review a company’s proposal to reincorporate to a different state or country on a case-by-case basis taking into consideration financial benefits such as tax treatment as well as comparing corporate governance provisions and general business laws that may result from the change in domicile.
Changes to Capital Structure: SPIM realizes that a company's financing decisions have a significant impact on its shareholders, particularly when they involve the issuance of additional shares of common or preferred stock or the assumption of additional debt. SPIM will carefully review, on a case-by-case basis, proposals by companies to increase authorized shares and the purpose for the increase. SPIM will generally not vote in favor of dual-class capital structures to increase the number of authorized shares where that class of stock would have superior voting rights. SPIM will generally vote in favor of the issuance of preferred stock in cases where the company specifies the voting, dividend, conversion and other rights of such stock and the terms of the preferred stock issuance are deemed reasonable. SPIM will review proposals seeking preemptive rights on a case-by-case basis.
Item 8. Portfolio Managers of Closed-End Management Investment Companies.
(a)(1) Identification of Portfolio Manager(s) and Description of Role of Portfolio Manager(s).
As of December 31, 2016, Sven Weber was the sole portfolio manager of the Registrant, and was primarily responsible for the day-to-day portfolio management of the Registrant.
Mr. Weber is the President, Principal Executive Officer and a Member of the Board of Trustees of the Registrant, and is the Managing Director of the Adviser. Mr. Weber joined SP Investments Management, LLC in 2012 and has managed the Registrant since its inception in March 2014. Previously, Mr. Weber served as President of SVB Capital at Silicon Valley Bank, where he managed that company’s venture capital investing business, which included direct, secondary, and fund of fund investments exceeding $1.5 billion under management. Prior to SVB Capital, Mr. Weber managed secondary investments at Cipio Partners and direct investments for Siemens. He previously had operational responsibilities at both Vodafone Germany and O2 Germany.
(a)(2) Other Accounts Managed by Portfolio Manager(s) or Management Team Member and Potential Conflicts of Interest.
(i) As of March 10, 2017, Sven Weber was the sole portfolio manager of SP100 Special Opportunities Fund LLC (“SP100 Opportunity”), and is primarily responsible for the day-to-day portfolio management of SP100 Opportunity.
(B) One (1), SP100 Opportunity. Total assets of SP100 Opportunity managed by Mr. Weber as of February 28, 2017 were approximately $17,700,000.
(C) Zero.
(iii) One (1) account. As of March 10, 2017, $0.00 of assets SP100 Opportunity were subject to an advisory performance fee.
(iv) A material conflict could arise in respect of the allocation of investment opportunities between the Registrant and SP100 Opportunity, as both entities have a substantially similar investment strategy to invest in the equity securities of private companies. However, to address such potential conflict of interest, SPIM has adopted compliance policies and procedures designed to address such conflict. It is SPIM’s general policy to allocate purchase or sale opportunities on a pro rata basis to all applicable Clients, measured by reference to each Client’s relative net asset value as of the beginning of the month in which the purchase or sale is executed. However, with respect to SP100 Opportunity, only after the SPIM Investment Committee has made its decision to pursue a purchase or sale opportunity in a given security on behalf the Registrant and the rationale for such decision has been documented by the Investment Committee and reviewed and approved by SPIM’s Chief Compliance Officer, may SP100 Opportunity, or any other overage fund structure advised by SPIM, be permitted to pursue a purchase or sale opportunity in any additionally available interests or shares of such security.
(a)(3) Compensation Structure of Portfolio Manager(s).
As of March 10, 2017, compensation for the Registrant’s portfolio manager, Sven Weber, consists of base salary and bonus, which are monitored to ensure competitiveness in the external marketplace. The portfolio manager may also receive a cash bonus which is a percentage of the gross margins of the Adviser in each fiscal year.
(a)(4) Disclosure of Securities Ownership.
The following table sets forth the dollar range of equity securities beneficially owned by the Portfolio Manager in the Registrant as of December 31, 2016:
| Portfolio Manager | Dollar Range of Registrant Shares Beneficially Owned |
| Sven Weber | $100,000-$500,000 |
Item 9. Purchases of Equity Securities by Closed-End Management Investment Company and Affiliated Purchasers.
| REGISTRANT PURCHASES OF EQUITY SECURITIES | | |
| Period | (a) Total Number of Shares (or Units) Purchased | (b) Average Price Paid per Share (of Unit) | (c) Total Number of Shares (or Units) Purchased as Part of Publicly Announced Plans or Programs | (d) Maximum Number (or Approximate Dollar Value) of Shares (or Units) that May Yet Be Purchased Under the Plans or Programs |
| Jan. 1-31, 2016 | 0 | 0 | 0 | 0 |
| Feb. 1-28, 2016 | 0 | 0 | 0 | 0 |
| Mar. 1-31, 2016 | 89,733 | 25.20 | 0 | 0 |
| Apr. 1-28, 2016 | 0 | 0 | 0 | 0 |
| May. 1-31, 2016 | 0 | 0 | 0 | 0 |
| Jun. 1-30, 2016 | 124,825 | 25.38 | 0 | 0 |
| Jul. 1-31, 2016 | 0 | 0 | 0 | 0 |
| Aug. 1-31, 2016 | 0 | 0 | 0 | 0 |
| Sep. 1-30, 2016 | 90,762 | 26.65 | 0 | 0 |
| Oct. 1-31, 2016 | 0 | 0 | 0 | 0 |
| Nov. 1-30, 2016 | 0 | 0 | 0 | 0 |
| Dec. 1-31, 2016 | 58,931 | 26.84 | 0 | 0 |
| Total | 364,251 | 25.89 | 0 | 0 |
On February 18, 2016, May 19, 2016, August 24, 2016, and November 17, 2016 the Registrant offered to repurchase up to 5% of the Registrant’s total outstanding shares, or 137,346, 141,672, 138,695, and 147,223 shares, respectively, pursuant to its periodic repurchase plan.
Item 10. Submission of Matters to a Vote of Security Holders.
Not applicable.
Item 11. Controls and Procedures.
| (a) | The Registrant’s Principal Executive Officer and Principal Financial Officer have reviewed the Registrant's disclosure controls and procedures (as defined in Rule 30a-3(c) under the Investment Company Act of 1940, as amended, (the “Act”)) as of a date within 90 days of the filing of this report, as required by Rule 30a-3(b) under the Act. Based on their review, such officers have concluded that the disclosure controls and procedures were effective in ensuring that information required to be disclosed in this report was appropriately recorded, processed, summarized and reported and made known to them by others within the Registrant and by the Registrant’s service providers. |
| (b) | There were no changes in the Registrant’s internal control over financial reporting (as defined in Rule 30a-3(d) under the Act (17 CFR 270.30a-3(d)) that occurred during the Registrant’s second fiscal quarter of the period covered by this report that materially affected, or were reasonably likely to materially affect, the Registrant’s internal control over financial reporting. |
Item 12. Exhibits.
| (a) (1) | Code of Ethics. Filed herewith. |
| (a) (2) | Certifications required pursuant to Section 302 of the Sarbanes-Oxley Act of 2002. Filed herewith. |
| (b) | Certification pursuant to Section 906 of the Sarbanes-Oxley Act of 2002. Filed herewith. |
SIGNATURES
Pursuant to the requirements of the Securities Exchange Act of 1934 and the Investment Company Act of 1940, the Registrant has duly caused this report to be signed on its behalf by the undersigned, thereunto duly authorized.
SharesPost 100 Fund
| /s/ Sven Weber | |
| By: Sven Weber | |
| President | |
| March 10, 2017 | |
Pursuant to the requirements of the Securities Exchange Act of 1934 and the Investment Company Act of 1940, this report has been signed below by the following persons on behalf of the Registrant and in the capacities and on the dates indicated.
| /s/ Sven Weber | |
| By: Sven Weber | |
| President | |
| (Principal Executive Officer) | |
| March 10, 2017 | |
| /s/ Ryan Stroub | |
| By: Ryan Stroub | |
| Treasurer | |
| (Principal Financial Officer) | |
| March 10, 2017 | |