UNITED STATES
SECURITIES AND EXCHANGE COMMISSION
Washington, D.C. 20549
FORM N-CSR
CERTIFIED SHAREHOLDER REPORT OF REGISTERED
MANAGEMENT INVESTMENT COMPANIES
Investment Company Act File Number811-22759
SharesPost 100 Fund
(Exact name of registrant as specified in charter)
555 Montgomery Street, Suite 1400
San Francisco, CA 94111
(Address of principal executive offices) (Zip code)
Cogency Global, Inc.
c/o SharesPost 100 Fund
850 New Burton Rd. Ste. 201
City of Dover, County of Kent, Delaware 19904
(Name and address of agent for service)
Copies to:
Dechert LLP
One Bush Street, Suite 1600
San Francisco, CA 94104-4446
Registrant's telephone number, including area code:(800) 834-8707
Date of fiscal year end:December 31
Date of reporting period:December 31, 2019
Item 1. Reports to Stockholders.
SHARESPOST 100 FUND
Table of Contents | |
Shareholder Letter | 2 |
Fund Performance | 4 |
Fund Performance & Portfolio Diversification | 6 |
Portfolio Composition | 7 |
Schedule of Investments | 8 |
Statement of Assets and Liabilities | 12 |
Statement of Operations | 13 |
Statements of Changes in Net Assets | 14 |
Statement of Cash Flows | 15 |
Financial Highlights | 16 |
Notes to the Financial Statements | 19 |
Report of Independent Registered Public Accounting Firm | 28 |
Trustees and Officers | 29 |
Additional Information | 30 |
1
SHARESPOST 100 FUND
Shareholder Letter
The National Venture Capital Association (“NVCA”) reported that US Venture Capital (“VC”) deal count and deal value have continued their trend into record-breaking territory in all stages for the year. Deal value in 2019 reached $136.5 billion, just shy of record deal value of $140.2 billion in 2018. Moreover, deal count for 2019 increased to 10,777 deals, representing a 2% increase from 2018’s record 10,542 figure. Mega deals “deals greater than or of at least $100 million” continue to increase with a record 237 deals closed in 2019, representing an increase of 11.8% from 2018 figures. Specifically, new heights were reached for late-stage mega deals with 181 deals completed of at least $100 million, representing a 10% increase year over year. The continued increase in deal count and deal value can be attributed to low interest-rate environments that continue to bring large non-VC investors into the VC industry. In 2019, nontraditional investors, such as sovereign wealth funds and Private Equity (“PE”) Funds, participated in more than 85% of these mega deals.
During 2019, exit value totaled over $250 billion across 882 liquidity events (i.e., an Initial Public Offering “IPO” or sale). Most recently, exit activity in the fourth quarter of 2019 experienced quarter over quarter declines for the second consecutive quarter, both on a count- and value-basis, with 174 exits totaling $18.8 billion. Although exit activity has cooled off in the second half of the year, 2019’s $250 billion total exit value is record-breaking regarding US VC exit activity, surpassing 2018’s record with a 97% increase in exit value over $130 billion in 2018. However, despite strong exit value growth, 2019’s total liquidity events of 882 represented a 13% decline in liquidity events from 1,015 in 2018. IPO exit activity has been the primary driver of exit value for 2019 with nearly 80% attributed to VC-backed IPOs. Healthcare IPOs dominated the fourth quarter, representing 9 out of 13 companies listed (69%). However, post-IPO performance of many newly listed technology companies has been lackluster over the past six months, which may give potential IPO-candidates hesitation to go public in 2020. Regardless, as noted in its 2019 annual letter, the NVCA believes the record flow of capital back to General Partners (“GPs”) and Limited Partners (“LPs”) from these recent IPOs will likely drive impressive return metrics for investors, which in turn should encourage more fundraising and funding allocation to VCs. According to the NVCA, VC funds have returned more capital to investors than has been called down each year since 2012.
The Fund’s strategy is to invest in late-stage private growth companies that are expected to have a liquidity event within 2-4 years. Based on historical observations and general market trends, we believe this is when private companies typically experience a significant portion of their overall growth. As of December 31, 2019, the Fund had approximately $191 million in assets under management with investments in 51 companies. In 2019, three of the Fund’s portfolio companies (Cylance, Acquia and MapR Technologies) were acquired, and three portfolio companies (Lyft, Uber and Pinterest) completed their initial public offering, ultimately resulting in a total of six exits for the year.
We are pleased to report that 2019 was the Fund’s most active year since inception with regards to both new investments and overall capital deployment. We would like to highlight several of the companies that were added to the Fund in 2019 to give you insights into some of the primary rounds the Fund has participated in as well as other innovative companies the Fund has invested in through secondary transactions.
Heap (Analytics/Big Data; Total Funding - $95m) Heap is a developer of mobile and web analytics tools designed to automatically capture all user data. The company’s Web Analytics tools automatically capture every user interaction including clicks, taps, gestures, form submissions, page views and more, with no extra code, enabling companies to identify and understand their users in-depth.
FundBox (Finance/Payments; Total Funding - $433m) Fundbox is a provider of web- and mobile-based cash flow management platform designed to simplify and improve the way that small businesses pay and are paid. The company’s cash flow management platform leverages deep data analytics for invoice financing offering a line of credit that requires only a bank connection to get a credit decision, enabling Small- and Medium-Sized Enterprises to accelerate cash flow against their outstanding invoices and achieve their full potential.
Lime (Transportation; Total Funding - $777m) Lime operates a scooter and bike sharing platform designed to improve urban mobility and last-mile transportation. Lime’s platform enables users to rent from the company’s fleet of smart-bikes and smart-scooters on-demand using their smartphones.
2
SHARESPOST 100 FUND
Shareholder Letter (Continued)
KeepTruckin (Enterprise Software; Total Funding - $229m) KeepTruckin develops electronic fleet tracking systems designed to offer an ELD and GPS tracking system to digitize the long-haul trucking services. The company’s system provides electronic logs and fleet management platforms that features electronic logging device, GPS tracking, IFTA reporting, vehicle diagnostics, driver performance monitoring, vehicle utilization tracking and other tools. The company claims to have over 60,000 customers ranging from small trucking companies to Fortune 500 enterprises.
Carbon (3D Printing; Total Funding - $682m) Carbon develops 3D printing technology through innovations in software, hardware and material sciences. Carbon’s Digital Light Synthesis technology and broad family of programmable liquid resins allows manufacturers to unlock new business opportunities in mass customization and previously impossible designs.
ChargePoint (Clean Technology; Total Funding - $558m) ChargePoint designs, builds, and supports all aspects of its of electric vehicle charging networks including; charging stations, hardware, energy management software, and the associated mobile application. ChargePoint serves a broad array of clients including apartment communities, stadiums and entertainment venues, cities, parking operators, general workplaces and individual homes. Founded in 2007, the company has grown to over 110,000 places to charge while delivering more than 72 million charges.
3
SHARESPOST 100 FUND
Fund Performance
December 31, 2019 (Unaudited)
As of December 31, 2019, the Fund’s performance is as follows:
Total Return Information (Unaudited) |
SharesPost 100 Fund – Class A
(Inception Date: 03/25/2014) | Annualized
Total Return:
Inception - 12/31/19 | Cumulative
Total Return:
Inception - 12/31/19 | Total Return:
01/01/19 - 12/31/19 |
Returns based on Purchase Without Any Sales Charge (NAV) | 7.26% | 49.80% | 5.34% |
Returns based on Purchase With Maximum Sales Charge of 5.75% (POP) | 6.16% | 41.19% | -0.73% |
Fund Benchmarks | | | |
Russell 2000® Index | 7.71% | 53.47% | 25.53% |
Dow Jones US Technology Index | 19.27% | 176.43% | 47.47% |
Standard and Poor’s 500® Index | 12.26% | 94.91% | 31.49% |
SharesPost 100 Fund – Class I
(Inception Date: 11/17/2017) | Annualized
Total Return:
Inception - 12/31/19 | Cumulative
Total Return:
Inception - 12/31/19 | Total Return:
01/01/19 - 12/31/19 |
Returns based on Purchase Without Any Sales Charge (NAV) | 6.47% | 14.22% | 5.65% |
Fund Benchmarks | | | |
Russell 2000® Index | 6.87% | 15.13% | 25.53% |
Dow Jones US Technology Index | 19.85% | 46.80% | 47.47% |
Standard and Poor’s 500® Index | 13.42% | 30.62% | 31.49% |
SharesPost 100 Fund – Class L
(Inception Date: 05/11/2018) | Annualized
Total Return:
Inception - 12/31/19 | Cumulative
Total Return:
Inception - 12/31/19 | Total Return:
01/01/19 - 12/31/19 |
Returns based on Purchase Without Any Sales Charge (NAV) | 3.11% | 5.15% | 5.07% |
Returns based on Purchase With Maximum Sales Charge of 4.25% (POP) | 0.41% | 0.68% | 0.61% |
Fund Benchmarks | | | |
Russell 2000® Index | 3.81% | 6.32% | 25.53% |
Dow Jones US Technology Index | 18.24% | 31.64% | 47.47% |
Standard and Poor’s 500® Index | 13.10% | 22.39% | 31.49% |
Performance data quoted represents past performance and is no guarantee of future results. POP performance assumes a maximum sales load of 5.75% (Class A) and 4.25% (Class L) on all sales. Investment return and principal value will fluctuate so that an investor’s shares, when redeemed, may be worth more or less than original cost. Current performance may be lower or higher
4
SHARESPOST 100 FUND
than the performance data quoted. For performance as of the most recent month-end, please call +1.855.551.5510. Some of the Fund’s fees were waived or expenses reimbursed; otherwise, returns would have been lower. The Fund’s total annual expenses per the currently stated prospectus are 3.35% (Class A), 3.10% (Class I), and 3.60% (Class L). The Adviser has contractually agreed to waive fees and/or reimburse expenses such that the total expenses do not exceed 2.50% (Class A), 2.25% (Class I), and 2.75% (Class L) through May 1, 2020.
IMPORTANT DISCLOSURE
All investing involves risk including the possible loss of principal. Shares in the Fund are highly illiquid, and you may not be able to sell your shares when, or in the amount that, you desire. The Fund intends to primarily invest in securities of private, late-stage, venture-backed growth companies. There are significant potential risks relating to investing in such securities. Because most of the securities in which the Fund invests are not publicly traded, the Fund’s investments will be valued by the Investment Adviser pursuant to fair valuation procedures and methodologies adopted by the Board of Trustees.
There are significant potential risks associated with investing in venture capital and private equity-backed companies with complex capital structures. The Fund focuses its investments on a limited number of securities, which could subject it to greater risk than that of a larger, more varied portfolio. There is a greater focus in technology securities which could adversely affect the Fund’s performance. The inclusion of various indices is for comparison purposes only. The performance of an index is not an exact representation of any particular investment, as you cannot invest directly in an index.
If the Fund does not have at least 500 Members for an entire taxable year, you could receive an adverse tax treatment.
The Fund’s quarterly repurchase policy may require the Fund to liquidate portfolio holdings earlier than the Investment Adviser would otherwise do so, and may also result in an increase in the Fund’s expense ratio. This is not a complete enumeration of the Fund’s risks. Please read the Fund prospectus for other risk factors related to the Fund, its investment strategy and your investment in the Fund, and other additional details.
5
SHARESPOST 100 FUND
Fund Performance & Portfolio Diversification
December 31, 2019 (Unaudited)
Growth of $10,000 Investment

This graph illustrates the hypothetical investment of $10,000 in the Class A from March 25, 2014 (Class inception) to December 31, 2019. The Total Return Information table and Growth of $10,000 Investment graph do not reflect the deduction of taxes that a shareholder would pay on fund distributions or the redemption of fund shares. The Public Offering Price (“POP”) assumes an initial investment of $9,425 ($10,000 less the maximum sales load of 5.75%). The Net Asset Value (“NAV”) assumes no sales load.
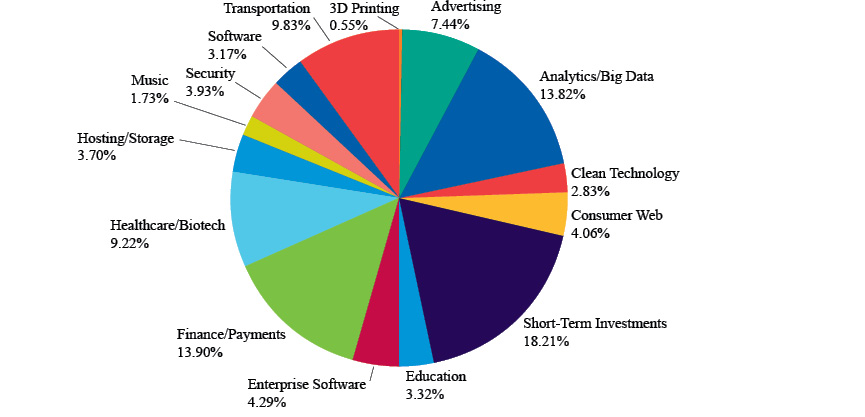
Fund Sector Diversification
The following chart provides a visual breakdown of the Fund by the industry sectors that the underlying securities represent as a percentage of the total investments.
6
SHARESPOST 100 FUND
Portfolio Composition
December 31, 2019 (Unaudited)
Fund Holdings

7
SHARESPOST 100 FUND
Schedule of Investments
December 31, 2019
| | Acquisition
Date | | Shares | | | Cost | | | Fair Value | |
COMMON STOCK IN PRIVATE COMPANIES(b) — 55.0% | | | | | | | | | | | | |
3D PRINTING — 0.5% | | | | | | | | | | | | | |
Carbon, Inc.(a) | Jun 2019 | | | 38,853 | | | $ | 685,214 | | | $ | 1,045,534 | |
| | | | | | | | | | | | | | |
ADVERTISING — 6.2% | | | | | | | | | | | | | |
Chartboost(a) | Mar 2015 | | | 700,000 | | | | 1,611,000 | | | | 2,996,000 | |
GroundTruth (f.k.a. xAd, Inc.)(a) | Oct 2016 | | | 1,659,427 | | | | 446,424 | | | | 730,148 | |
NextRoll (f.k.a AdRoll)(a) | Mar 2017 | | | 3,155 | | | | 24,050 | | | | 47,861 | |
OpenX(a) | Jun 2015 | | | 2,899,297 | | | | 2,615,386 | | | | 5,276,721 | |
PubMatic(a) | Jun 2015 | | | 200,000 | | | | 1,170,000 | | | | 2,908,000 | |
| | | | | | | | 5,866,860 | | | | 11,958,730 | |
ANALYTICS/BIG DATA — 6.4% | | | | | | | | | | | | | |
Dataminr, Inc.(a) | Sep 2015 | | | 307,583 | | | | 2,638,591 | | | | 6,711,461 | |
INRIX, Inc.(a) | May 2014 | | | 70,750 | | | | 1,592,150 | | | | 1,901,052 | |
Metabiota(a) | Apr 2015 | | | 494,589 | | | | 500,000 | | | | 855,639 | |
Planet Labs, Inc.(a) | Mar 2018 | | | 125,000 | | | | 731,250 | | | | 1,515,000 | |
ThoughtSpot, Inc.(a) | Oct 2018 | | | 100,000 | | | | 780,000 | | | | 1,350,000 | |
| | | | | | | | 6,241,991 | | | | 12,333,152 | |
CONSUMER WEB — 3.4% | | | | | | | | | | | | | |
Nextdoor(a) | Nov 2018 | | | 235,495 | | | | 3,990,451 | | | | 4,568,603 | |
Wag Labs, Inc.(a) | Oct 2018 | | | 438,828 | | | | 2,314,001 | | | | 1,865,019 | |
| | | | | | | | 6,304,452 | | | | 6,433,622 | |
EDUCATION — 3.3% | | | | | | | | | | | | | |
Udacity, Inc.(a) | Nov 2018 | | | 448,075 | | | | 2,884,586 | | | | 3,096,198 | |
Udemy, Inc.(a) | Aug 2019 | | | 300,000 | | | | 3,025,000 | | | | 3,237,000 | |
| | | | | | | | 5,909,586 | | | | 6,333,198 | |
ENTERPRISE SOFTWARE — 4.3% | | | | | | | | | | | | | |
Blend Labs, Inc.(a) | Aug 2018 | | | 975,665 | | | | 1,112,023 | | | | 1,502,524 | |
D2iQ (f.k.a Mesosphere, Inc.)(a) | Feb 2019 | | | 165,000 | | | | 1,605,450 | | | | 1,742,400 | |
InsideSales.com(a) | Dec 2016 | | | 75,000 | | | | 225,000 | | | | 328,500 | |
KeepTruckin(a) | May 2019 | | | 788,562 | | | | 3,420,734 | | | | 3,816,640 | |
Sprinklr(a) | Jun 2017 | | | 100,000 | | | | 500,000 | | | | 808,000 | |
| | | | | | | | 6,863,207 | | | | 8,198,064 | |
FINANCE/PAYMENTS — 10.0% | | | | | | | | | | | | | |
Circle Internet Financial, Inc.(a) | Apr 2018 | | | 290,200 | | | | 2,604,825 | | | | 4,846,340 | |
Marqeta, Inc.(a) | Jul 2018 | | | 1,155,000 | | | | 2,035,350 | | | | 4,377,450 | |
Prosper Marketplace, Inc.(a) | Jan 2016 | | | 244,130 | | | | 1,307,998 | | | | 244,130 | |
Ripple(a) | Dec 2018 | | | 42,000 | | | | 504,000 | | | | 2,488,080 | |
Robinhood Markets, Inc.(a) | Jul 2019 | | | 260,500 | | | | 3,544,251 | | | | 3,248,435 | |
Social Finance, Inc.(a) | Apr 2017 | | | 274,889 | | | | 3,090,675 | | | | 4,029,873 | |
| | | | | | | | 13,087,099 | | | | 19,234,308 | |
HARDWARE — 0.4% | | | | | | | | | | | | | |
Tempo Automation, Inc.(a) | Aug 2019 | | | 150,000 | | | | 480,000 | | | | 679,500 | |
| | | | | | | | | | | | | | |
See accompanying Notes to the Financial Statements
8
SHARESPOST 100 FUND
Schedule of Investments (Continued)
December 31, 2019
| | Acquisition
Date | | Shares | | | Cost | | | Fair Value | |
COMMON STOCK IN PRIVATE COMPANIES(b) — 55.0% (Continued) | | | | | | | | | | | | |
HEALTHCARE/BIOTECH — 5.0% | | | | | | | | | | | | | |
1Life Healthcare, Inc. (f.k.a One Medical Group)(a) | Mar 2017 | | | 143,750 | | | $ | 1,178,662 | | | $ | 1,686,188 | |
23andMe, Inc.(a) | Oct 2017 | | | 338,157 | | | | 4,808,483 | | | | 7,077,626 | |
ZocDoc, Inc.(a) | Feb 2015 | | | 61,016 | | | | 1,321,708 | | | | 915,850 | |
| | | | | | | | 7,308,853 | | | | 9,679,664 | |
HOSTING/STORAGE — 3.7% | | | | | | | | | | | | | |
Code 42 Software, Inc.(a) | May 2016 | | | 330,000 | | | | 754,500 | | | | 1,478,400 | |
Digital Ocean(a) | Oct 2019 | | | 150,000 | | | | 1,800,000 | | | | 2,071,500 | |
Rubrik(a) | Sep 2019 | | | 132,220 | | | | 3,371,610 | | | | 3,510,441 | |
| | | | | | | | 5,926,110 | | | | 7,060,341 | |
SECURITY — 3.1% | | | | | | | | | | | | | |
Tanium(a) | Apr 2019 | | | 640,000 | | | | 4,787,200 | | | | 5,932,800 | |
| | | | | | | | | | | | | | |
SOFTWARE — 3.2% | | | | | | | | | | | | | |
Docker, Inc.(a) | May 2017 | | | 25,000 | | | | 531,250 | | | | 41,000 | |
Malwarebytes(a) | Dec 2019 | | | 188,173 | | | | 1,129,038 | | | | 3,247,866 | |
Optimizely(a) | Feb 2017 | | | 160,303 | | | | 1,420,675 | | | | 2,766,830 | |
| | | | | | | | 3,080,963 | | | | 6,055,696 | |
TRANSPORTATION — 5.5% | | | | | | | | | | | | | |
SpaceX(a) | May 2019 | | | 49,020 | | | | 10,049,100 | | | | 10,545,673 | |
TOTAL COMMON STOCK IN PRIVATE COMPANIES | | | | | | | | 76,590,635 | | | | 105,490,282 | |
| | | | | | | | | | | | | |
PREFERRED STOCK IN PRIVATE COMPANIES(b) — 26.8% | | | | | | | | | | | | |
ADVERTISING — 1.2% | | | | | | | | | | | | | |
GroundTruth (f.k.a. xAd, Inc.), Preferred Class B-1(a) | Jan 2017 | | | 600,000 | | | | 149,200 | | | | 264,000 | |
WideOrbit, Inc., Preferred Class C(a) | Oct 2015 | | | 400,000 | | | | 1,100,000 | | | | 1,976,000 | |
| | | | | | | | 1,249,200 | | | | 2,240,000 | |
ANALYTICS/BIG DATA — 7.3% | | | | | | | | | | | | | |
Dataminr, Inc., Preferred Class A(a) | Apr 2019 | | | 20,000 | | | | 198,000 | | | | 436,400 | |
Dataminr, Inc., Preferred Class B(a) | Apr 2019 | | | 87,496 | | | | 866,210 | | | | 1,909,163 | |
Heap, Preferred Class C(a) | May 2019 | | | 1,361,503 | | | | 4,999,997 | | | | 4,983,101 | |
Metabiota, Preferred Class A(a) | Apr 2015 | | | 346,212 | | | | 500,000 | | | | 598,947 | |
Metabiota, Preferred Class B(a) | Feb 2017 | | | 366,669 | | | | 500,952 | | | | 744,338 | |
Palantir Technologies, Inc., Preferred Class D(a) | Jan 2017 | | | 75,740 | | | | 516,287 | | | | 620,311 | |
Palantir Technologies, Inc., Preferred Class E(a) | Dec 2017 | | | 79,260 | | | | 512,714 | | | | 649,139 | |
Palantir Technologies, Inc., Preferred Class J(a) | Nov 2018 | | | 480,000 | | | | 2,720,000 | | | | 4,118,400 | |
| | | | | | | | 10,814,160 | | | | 14,059,799 | |
CLEAN TECHNOLOGY — 2.8% | | | | | | | | | | | | | |
ChargePoint, Inc., Preferred Class D(a) | Nov 2019 | | | 555,133 | | | | 2,836,730 | | | | 2,975,513 | |
ChargePoint, Inc., Preferred Class E(a) | Nov 2019 | | | 211,304 | | | | 1,079,763 | | | | 1,198,093 | |
ChargePoint, Inc., Preferred Class F(a) | Nov 2019 | | | 165,388 | | | | 845,133 | | | | 939,404 | |
ChargePoint, Inc., Preferred Class G(a) | Nov 2019 | | | 47,300 | | | | 241,703 | | | | 290,895 | |
| | | | | | | | 5,003,329 | | | | 5,403,905 | |
See accompanying Notes to the Financial Statements
9
SHARESPOST 100 FUND
Schedule of Investments (Continued)
December 31, 2019
| | Acquisition
Date | | Shares | | | Cost | | | Fair Value | |
PREFERRED STOCK IN PRIVATE COMPANIES(b) — 26.8% (Continued) | | | | | | | | | | | | |
CONSUMER WEB — 0.7% | | | | | | | | | | | | | |
Musely, Preferred Class B(a) | Oct 2014 | | | 7,961 | | | $ | 100,012 | | | $ | 100,012 | |
Nextdoor, Preferred Class B(a) | Mar 2018 | | | 29,495 | | | | 494,041 | | | | 572,203 | |
Nextdoor, Preferred Class C(a) | Mar 2018 | | | 17,543 | | | | 293,845 | | | | 340,334 | |
Nextdoor, Preferred Class D(a) | Mar 2018 | | | 6,899 | | | | 115,558 | | | | 133,841 | |
Nextdoor, Preferred Class E(a) | Mar 2018 | | | 3,392 | | | | 56,816 | | | | 65,805 | |
Nextdoor, Preferred Class F(a) | Mar 2018 | | | 5,171 | | | | 86,614 | | | | 100,317 | |
| | | | | | | | 1,146,886 | | | | 1,312,512 | |
FINANCE/PAYMENTS — 3.8% | | | | | | | | | | | | | |
Fundbox, Preferred Class C(a) | Jun 2019 | | | 439,552 | | | | 4,999,992 | | | | 5,002,102 | |
Prosper Marketplace, Inc., Preferred Class A(a) | Jan 2016 | | | 55,395 | | | | 305,781 | | | | 55,395 | |
Prosper Marketplace, Inc., Preferred Class A-1(a) | Jan 2016 | | | 58,165 | | | | 116 | | | | 58,165 | |
Social Finance, Inc., Preferred Class A(a) | Apr 2017 | | | 10,714 | | | | 174,638 | | | | 157,067 | |
Social Finance, Inc., Preferred Class B(a) | Apr 2017 | | | 1,361 | | | �� | 22,184 | | | | 19,952 | |
Social Finance, Inc., Preferred Class C(a) | Apr 2017 | | | 2,893 | | | | 47,156 | | | | 42,411 | |
Social Finance, Inc., Preferred Class D(a) | Apr 2017 | | | 64,165 | | | | 931,926 | | | | 940,659 | |
Social Finance, Inc., Preferred Class E(a) | Apr 2017 | | | 43,740 | | | | 712,962 | | | | 641,229 | |
Social Finance, Inc., Preferred Class F(a) | Apr 2017 | | | 25,172 | | | | 410,304 | | | | 387,901 | |
| | | | | | | | 7,605,059 | | | | 7,304,881 | |
HEALTHCARE/BIOTECH — 4.2% | | | | | | | | | | | | | |
23andMe, Inc., Preferred Class D(a) | Jan 2019 | | | 143,000 | | | | 2,492,490 | | | | 2,992,990 | |
Hims, Inc., Preferred Class A(a) | Sep 2019 | | | 1,000,000 | | | | 3,000,000 | | | | 4,000,000 | |
Intarcia Therapeutics, Inc., Preferred Class DD(a) | May 2017 | | | 9,000 | | | | 519,300 | | | | 416,790 | |
ZocDoc, Inc., Preferred Class A(a) | Feb 2015 | | | 35,000 | | | | 875,000 | | | | 525,350 | |
| | | | | | | | 6,886,790 | | | | 7,935,130 | |
MUSIC — 1.7% | | | | | | | | | | | | | |
SoundHound, Inc., Preferred Class D(a) | Sep 2016 | | | 107,484 | | | | 2,200,767 | | | | 3,312,657 | |
| | | | | | | | | | | | | | |
SECURITY — 0.8% | | | | | | | | | | | | | |
Lookout, Inc., Preferred Class A(a) | Feb 2015 | | | 204,000 | | | | 1,927,800 | | | | 1,581,000 | |
| | | | | | | | | | | | | | |
TRANSPORTATION — 4.3% | | | | | | | | | | | | | |
Lime (Neutron Holdings, Inc.), Preferred Class D(a) | Mar 2019 | | | 20,618,556 | | | | 5,000,000 | | | | 4,948,453 | |
Turo, Preferred Class D1(a) | Jun 2018 | | | 642,535 | | | | 2,999,996 | | | | 3,212,675 | |
Virgin Hyperloop One, Preferred Class B-1(a) | Jun 2017 | | | 4,145 | | | | 999,999 | | | | 24,331 | |
Virgin Hyperloop One, Preferred Class C(a) | May 2019 | | | 12,992 | | | | 37,938 | | | | 37,937 | |
| | | | | | | | 9,037,933 | | | | 8,223,396 | |
TOTAL PREFERRED STOCK IN PRIVATE COMPANIES | | | | | | | | 45,871,924 | | | | 51,373,280 | |
| | | | | | | | | | | | | |
See accompanying Notes to the Financial Statements
10
SHARESPOST 100 FUND
Schedule of Investments (Continued)
December 31, 2019
| | Acquisition
Date | | Shares | | | Cost | | | Fair Value | |
SHORT-TERM INVESTMENTS — 18.1% | | | | | | | | | | | | | |
DEMAND DEPOSIT — 18.1% | | | | | | | | | | | | | |
UMB Money Market Fiduciary, 0.25%(c) | | | | | | | $ | 34,764,321 | | | $ | 34,764,321 | |
TOTAL SHORT-TERM INVESTMENTS | | | | | | | | 34,764,321 | | | | 34,764,321 | |
| | | | | | | | | | | | | |
TOTAL INVESTMENTS — 99.9% | | | | | | | | 157,226,880 | | | | 191,627,883 | |
Other assets less liabilities — 0.1% | | | | | | | | | | | | 241,424 | |
| | | | | | | | | | | | | |
NET ASSETS — 100.0% | | | | | | | | | | | $ | 191,869,307 | |
(b) | Investments in private companies, and in some cases public companies, may be subject to restrictions on disposition imposed by the issuer. As of December 31, 2019 restricted securities represented 81.80% of the net assets of the Fund. |
(c) | Rate disclosed represents the seven day yield as of the Fund’s period end. The UMB Money Market Fiduciary account is an interest-bearing money market deposit account maintained by UMB Bank, n.a. in its capacity as a custodian for various participating custody accounts. The fund may redeem its investments in whole, or in part, on each business day. |
All issuers are United States based, except for OpenX, which is based in the UK.
See accompanying Notes to the Financial Statements
11
SHARESPOST 100 FUND
Statement of Assets and Liabilities
December 31, 2019
Assets: | | | | |
Investments, at fair value (Note 3): | | | | |
Common stock in private companies | | $ | 105,490,282 | |
Preferred stock in private companies | | | 51,373,280 | |
Short-term investments | | | 34,764,321 | |
Receivable for investments sold | | | 798,763 | |
Receivable for fund shares sold | | | 188,760 | |
Interest receivable | | | 9,588 | |
Prepaid expenses and other assets | | | 67,465 | |
Total assets | | | 192,692,459 | |
| | | | |
Liabilities: | | | | |
Advisory fees | | | 384,491 | |
Payable for shareholder servicing fees - Class L | | | 168 | |
Payable for shareholder servicing fees - Class A | | | 24,221 | |
Payable for audit and tax fees | | | 126,500 | |
Payable for transfer agent fees | | | 181,013 | |
Payable for 12b-1 fees - Class L | | | 167 | |
Other accrued liabilities | | | 106,592 | |
Total liabilities | | | 823,152 | |
Commitments and contingences (Note 9) | | | | |
Net assets | | $ | 191,869,307 | |
| | | | |
Net assets consist of: | | | | |
Capital stock (unlimited shares authorized, 25,000,000 shares registered, no par value) | | $ | 157,441,573 | |
Total distributable earnings | | | 34,427,734 | |
Net assets | | $ | 191,869,307 | |
| | | | |
Net assets: | | | | |
Class A | | $ | 108,067,510 | |
Class I | | | 82,991,929 | |
Class L | | | 809,868 | |
Total net assets | | $ | 191,869,307 | |
| | | | |
Shares outstanding: | | | | |
Class A | | | 3,606,486 | |
Class I | | | 2,755,758 | |
Class L | | | 27,153 | |
Total shares outstanding | | | 6,389,397 | |
| | | | |
Net asset value, public offering price, and redemption proceeds per share: | | | | |
Class A - Net asset value and redemption proceeds per share | | $ | 29.96 | |
Class I - Net asset value and redemption proceeds per share | | $ | 30.12 | |
Class L - Net asset value and redemption proceeds per share | | $ | 29.83 | |
Class A - Public offering price per share(a) | | $ | 31.79 | |
Class L - Public offering price per share(b) | | $ | 31.15 | |
| | | | |
Cost of investments | | $ | 157,226,880 | |
(a) | Computation of public offering price per share 100/94.25 of net asset value. (See Note 10). |
(b) | Computation of public offering price per share 100/95.75 of net asset value. (See Note 10). |
See accompanying Notes to the Financial Statements
12
SHARESPOST 100 FUND
Statement of Operations
For the year ended December 31, 2019
Investment Income: | | | | |
Interest | | $ | 145,418 | |
Total investment income | | | 145,418 | |
| | | | |
Expenses: | | | | |
Investment advisory fees (Note 5) | | | 3,506,326 | |
Transfer agent fees | | | 780,769 | |
Legal fees1 | | | 669,746 | |
Fund accounting & administration fees | | | 307,946 | |
Audit and tax fees1 | | | 256,085 | |
Shareholder servicing fees - Class A | | | 241,739 | |
Printing & postage | | | 171,812 | |
Trustee fees1 | | | 161,190 | |
Chief compliance officer fees | | | 126,350 | |
Registration fees | | | 81,591 | |
Insurance fees | | | 71,247 | |
Miscellaneous expenses | | | 39,895 | |
Custodian fees | | | 26,255 | |
Distribution fees - Class L | | | 1,325 | |
Shareholder servicing fees - Class L | | | 1,325 | |
Total expenses | | | 6,443,601 | |
Less: Contractual waiver of fees and reimbursement of expenses (Note 4) | | | (1,467,342 | ) |
Net expenses | | | 4,976,259 | |
Net investment loss | | $ | (4,830,841 | ) |
| | | | |
Net realized gain on investments | | | 2,780,200 | |
Net change in unrealized gain on investments | | | 11,628,996 | |
Net realized & change in unrealized gain on investments | | | 14,409,196 | |
Net change in net assets from operations | | $ | 9,578,355 | |
1 | Includes extraordinary expenses incurred during the fiscal year. Extraordinary expenses related to Legal, Audit, and Trustees expenses incurred in the amount of $461,590, $20,000, and $45,552, respectively, were excluded from the contractual waiver of fees due to their nature. Please see Note 4 in the Notes to the Financial Statements for additional information. |
See accompanying Notes to the Financial Statements
13
SHARESPOST 100 FUND
Statements of Changes in Net Assets
| | | Year ended
December 31, 2019 | | | Year ended
December 31, 2018 | |
Operations: | | | | | | | | |
Net investment loss | | $ | (4,830,841 | ) | | $ | (2,978,843 | ) |
Net realized gain on investments | | | 2,780,200 | | | | 7,698,095 | |
Net change in unrealized gain on investments | | | 11,628,996 | | | | 1,488,665 | |
Net change in net assets resulting from operations | | | 9,578,355 | | | | 6,207,917 | |
| | | | | | | | |
Fund share transactions: | | | | | | | | |
Proceeds from shares issued - Class A | | | 33,090,718 | | | | 24,845,249 | |
Proceeds from shares issued - Class I | | | 53,378,503 | | | | 33,417,339 | |
Proceeds from shares issued - Class L | | | 820,920 | | | | 1,000 | * |
Cost of shares redeemed - Class A | | | (40,995,412 | ) | | | (22,532,713 | ) |
Cost of shares redeemed - Class I | | | (7,823,404 | ) | | | (453,834 | ) |
Cost of shares redeemed - Class L | | | (28,143 | ) | | | — | * |
Net change in net assets from fund share transactions | | | 38,443,182 | | | | 35,277,041 | |
Net change in net assets | | $ | 48,021,537 | | | $ | 41,484,958 | |
| | | | | | | | |
Net assets: | | | | | | | | |
Beginning of year | | $ | 143,847,770 | | | $ | 102,362,812 | |
End of year | | $ | 191,869,307 | | | $ | 143,847,770 | |
| | | | | | | | |
Transactions in shares: | | | | | | | | |
Issuance of shares - Class A | | | 1,136,414 | | | | 881,805 | |
Issuance of shares - Class I | | | 1,829,929 | | | | 1,165,000 | |
Issuance of shares - Class L | | | 28,082 | | | | 35 | * |
Redemption of shares - Class A | | | (1,394,581 | ) | | | (788,511 | ) |
Redemption of shares - Class I | | | (264,843 | ) | | | (15,862 | ) |
Redemption of shares - Class L | | | (964 | ) | | | — | * |
Net change in shares | | | 1,334,037 | | | | 1,242,467 | |
* | Reflects operations for the period from May 11, 2018 (inception date of the share Class L) to December 31, 2018. |
See accompanying Notes to the Financial Statements
14
SHARESPOST 100 FUND
Statement of Cash Flows
For the year ended December 31, 2019
Cash flows from operating activities: | | | | |
Net change in net assets from operations | | $ | 9,578,355 | |
Adjustments to reconcile net change in net assets from operations to net cash used in operating activities: | | | | |
Purchases of investments1 | | | (74,079,285 | ) |
Net sales of short-term investments | | | 21,235,690 | |
Proceeds from sales of investments1 | | | 18,752,547 | |
Net change in unrealized gain on investments | | | (11,628,996 | ) |
Net realized gain on investments | | | (2,780,200 | ) |
Change in operating assets and liabilities: | | | | |
Decrease in interest receivable | | | 2,915 | |
Decrease in prepaid expenses and other assets | | | 2,361 | |
Increase in net payable to adviser | | | 177,386 | |
Increase in other accrued liabilities | | | 173,839 | |
Net cash used in operating activities | | | (38,565,388 | ) |
| | | | |
Cash flows from financing activities: | | | | |
Proceeds from shares issued, net of change in receivable for fund shares sold | | | 87,412,347 | |
Cost of shares redeemed, net of change in payable for fund shares redeemed | | | (48,846,959 | ) |
Net cash provided by financing activities | | | 38,565,388 | |
| | | | |
Net change in cash | | | — | |
| | | | |
Cash at beginning of year | | | — | |
Cash at end of year | | $ | — | |
1 | Amounts include the conversion of Hyperloop convertible bond into Preferred Class C shares of which, $860 in interest was capitalized. |
See accompanying Notes to the Financial Statements
15
SHARESPOST 100 FUND
Financial Highlights – Class A
For a capital share outstanding throughout each period
| | | Year ended
December 31,
2019 | | | Year ended
December 31,
2018 | | | Year ended
December 31,
2017 | | | Year ended
December 31,
2016 | | | Year ended
December 31,
2015(a) | |
Per share operating performance | | | | | | | | | | | | | | | | | | | | |
Net asset value, beginning of period | | $ | 28.44 | | | $ | 26.85 | | | $ | 26.83 | | | $ | 25.48 | | | $ | 24.56 | |
| | | | | | | | | | | | | | | | | | | | |
Change in net assets from operations: | | | | | | | | | | | | | | | | | | | | |
Net investment loss | | | (0.88 | ) | | | (0.71 | ) | | | (0.63 | ) | | | (0.53 | ) | | | (0.38 | ) |
Net realized and unrealized gain on investments | | | 2.40 | | | | 2.30 | | | | 0.65 | | | | 1.88 | | | | 1.30 | |
Total change in net assets from operations | | | 1.52 | | | | 1.59 | | | | 0.02 | | | | 1.35 | | | | 0.92 | |
| | | | | | | | | | | | | | | | | | | | |
Distributions: | | | | | | | | | | | | | | | | | | | | |
From net investment income | | | — | | | | — | | | | — | | | | — | | | | — | |
From net realized gain on investments | | | — | | | | — | | | | — | | | | — | | | | — | |
Total distributions | | | — | | | | — | | | | — | | | | — | | | | — | |
Net increase in net asset value | | | 1.52 | | | | 1.59 | | | | 0.02 | | | | 1.35 | | | | 0.92 | |
Net asset value, end of period | | $ | 29.96 | | | $ | 28.44 | | | $ | 26.85 | | | $ | 26.83 | | | $ | 25.48 | |
| | | | | | | | | | | | | | | | | | | | |
Total return(b) | | | 5.34 | % | | | 5.92 | % | | | 0.07 | % | | | 5.30 | % | | | 3.75 | % |
| | | | | | | | | | | | | | | | | | | | |
Ratios and supplemental data | | | | | | | | | | | | | | | | | | | | |
Net assets, end of period (in thousands) | | $ | 108,068 | | | $ | 109,902 | | | $ | 101,248 | | | $ | 77,915 | | | $ | 67,580 | |
Ratio of net expenses to average net assets | | | 2.79 | %(c)(d) | | | 2.50 | %(c) | | | 2.50 | %(c) | | | 2.50 | %(c) | | | 2.50 | %(c) |
Ratio of gross expenses before reimbursement to average net assets | | | 3.56 | % | | | 3.29 | % | | | 3.69 | % | | | 3.56 | % | | | 4.47 | % |
Ratio of net investment loss to average net assets | | | (2.71 | )% | | | (2.44 | )% | | | (2.52 | )% | | | (2.16 | )% | | | (2.01 | )% |
Portfolio turnover | | | 14.76 | % | | | 24.75 | % | | | 8.78 | % | | | 7.78 | % | | | 4.45 | % |
(a) | Redemption fees consisted of per share amounts of less than $0.01. Redemption fees were discontinued in conjunction with the prospectus renewal effective April 30, 2015. |
(b) | The Fund’s total investment returns as presented do not include a sales load. |
(c) | The ratio of net expenses are the result of $916,804, $887,579, $1,120,912, $757,978 and $993,070, respectively, in contractual waivers and expense reimbursement representing (0.78)%, (0.79)%, (1.19)%, (1.06)% and (1.97)%, respectively. Please see Note 4 in the Notes to the Financial Statements for additional information. |
(d) | The exclusion of certain extraordinary expenses incurred by the Fund caused the expense ratio to exceed the contractual amount by $336,193 or 0.29%. Please see Note 4 in the Notes to the Financial Statements for additional information. |
See accompanying Notes to the Financial Statements
16
SHARESPOST 100 FUND
Financial Highlights – Class I
For a capital share outstanding throughout each period
| | | Year ended
December 31,
2019 | | | Year ended
December 31,
2018 | | | Period ended
December 31,
2017* | |
Per share operating performance | | | | | | | | | | | | |
Net asset value, beginning of period | | $ | 28.51 | | | $ | 26.85 | | | $ | 26.37 | |
| | | | | | | | | | | | |
Change in net assets from operations: | | | | | | | | | | | | |
Net investment loss | | | (0.59 | ) | | | (0.20 | ) | | | (0.01 | ) |
Net realized and unrealized gain on investments | | | 2.20 | | | | 1.86 | | | | 0.49 | |
Total change in net assets from operations | | | 1.61 | | | | 1.66 | | | | 0.48 | |
| | | | | | | | | | | | |
Distributions: | | | | | | | | | | | | |
From net investment income | | | — | | | | — | | | | — | |
From net realized gain on investments | | | — | | | | — | | | | — | |
Total distributions | | | — | | | | — | | | | — | |
Net increase in net asset value | | | 1.61 | | | | 1.66 | | | | 0.48 | |
Net asset value, end of period | | $ | 30.12 | | | $ | 28.51 | | | $ | 26.85 | |
| | | | | | | | | | | | |
Total return | | | 5.65 | % | | | 6.18 | % | | | 1.82 | %(a) |
| | | | | | | | | | | | |
Ratios and supplemental data | | | | | | | | | | | | |
Net assets, end of period (in thousands) | | $ | 82,992 | | | $ | 33,945 | | | $ | 1,115 | |
Ratio of net expenses to average net assets | | | 2.54 | %(b)(c) | | | 2.25% | (b) | | | 2.25% | (b)(d) |
Ratio of gross expenses before reimbursement to average net assets | | | 3.36 | % | | | 3.10 | % | | | 3.50 | %(d) |
Ratio of net investment loss to average net assets | | | (2.46 | )% | | | (2.17 | )% | | | (2.25 | )%(d) |
Portfolio turnover | | | 14.76 | % | | | 24.75 | % | | | 8.78 | %(a) |
* | Reflects operations for the period from November 17, 2017 (inception date) to December 31, 2017. |
(a) | Not annualized for periods less than one year. |
(b) | The ratio of net expenses are the result of $546,174, $94,654 and $109, respectively, in contractual waivers and expense reimbursement representing (0.82)%, (0.85)%, and (1.25)%, respectively. Please see Note 4 in the Notes to the Financial Statements for additional information. |
(c) | The exclusion of certain extraordinary expenses incurred by the Fund caused the expense ratio to exceed the contractual amount by $189,435 or 0.29%. Please see Note 4 in the Notes to the Financial Statements for additional information. |
(d) | Annualized for period less than one year. |
See accompanying Notes to the Financial Statements
17
SHARESPOST 100 FUND
Financial Highlights – Class L
For a capital share outstanding throughout each period
| | | Year ended
December 31,
2019 | | | Period ended
December 31,
2018* | |
Per share operating performance | | | | | | | | |
Net asset value, beginning of period | | $ | 28.39 | | | $ | 28.37 | |
| | | | | | | | |
Change in net assets from operations: | | | | | | | | |
Net investment loss | | | (0.58 | ) | | | (0.49 | ) |
Net realized and unrealized gain on investments | | | 2.02 | | | | 0.51 | |
Total change in net assets from operations | | | 1.44 | | | | 0.02 | |
| | | | | | | | |
Distributions: | | | | | | | | |
From net investment income | | | — | | | | — | |
From net realized gain on investments | | | — | | | | — | |
Total distributions | | | — | | | | — | |
Net increase in net asset value | | | 1.44 | | | | 0.02 | |
Net asset value, end of period | | $ | 29.83 | | | $ | 28.39 | |
| | | | | | | | |
Total return(a) | | | 5.07 | % | | | 0.07 | %(b) |
| | | | | | | | |
Ratios and supplemental data | | | | | | | | |
Net assets, end of period (in thousands) | | $ | 810 | | | $ | 1 | |
Ratio of net expenses to average net assets | | | 3.04 | %(c)(d) | | | 2.75 | %(c)(e) |
Ratio of gross expenses before reimbursement to average net assets | | | 3.86 | % | | | 3.60 | %(e) |
Ratio of net investment loss to average net assets | | | (2.97 | )% | | | (2.68 | )%(e) |
Portfolio turnover | | | 14.76 | % | | | 24.75 | %(b) |
* | Reflects operations for the period from May 11, 2018 (inception date) to December 31, 2018. |
(a) | The Fund’s total investment returns as presented do not include a sales load. |
(b) | Not annualized for periods less than one year. |
(c) | The ratio of net expenses are the result of $4,364 and $6, respectively, in contractual waivers and expense reimbursement representing (0.82)% and (0.85)%, respectively. Please see Note 4 in the Notes to the Financial Statements for additional information. |
(d) | The exclusion of certain extraordinary expenses incurred by the Fund caused the expense ratio to exceed the contractual amount by $1,514 or 0.29%. Please see Note 4 in the Notes to the Financial Statements for additional information. |
(e) | Annualized for period less than one year. |
See accompanying Notes to the Financial Statements
18
SHARESPOST 100 FUND
Notes to the Financial Statements
December 31, 2019
1. Organization
SharesPost 100 Fund (the “Fund”) was established as a limited liability company under the laws of the State of Delaware on August 20, 2012 and converted into a Delaware statutory trust on March 22, 2013. The Fund is registered with the Securities and Exchange Commission (the “SEC”) as a non-diversified, closed-end management investment company that operates as an “interval fund” under the Investment Company Act of 1940, as amended (the “1940 Act”). The shares of beneficial interest of the Fund (the “Shares”) will be continuously offered under Rule 415 of the Securities Act of 1933, as amended (the “Securities Act”). As an interval fund, the Fund will make quarterly repurchase offers for 5% of the Fund’s outstanding Shares at net asset value (“NAV”), with no repurchase fee incurred. The Fund’s inception date was March 25, 2014. Prior to March 25, 2014, the Fund had been inactive except for matters relating to the Fund’s establishment, designation and planned registration of the Fund’s Shares under the Securities Act and the sale of 5,000 Shares (“Initial Shares”) for $100,000 to SP Investments Management, LLC (the “Investment Adviser”), which occurred on July 30, 2013.
The investment objective of the Fund is to provide investors capital appreciation, which it seeks to achieve by primarily investing in the equity securities of certain private, operating, late-stage, growth companies primarily comprising the SharesPost 100, a list of companies selected and maintained by the Investment Adviser. The Investment Adviser’s primary strategy will be to invest in portfolio companies (each, a “Portfolio Company”) and generally to hold such securities until a liquidity event with respect to such Portfolio Company occurs, such as an initial public offering, which generally includes a restrictive period of 180 days commonly known as a lock-up period, or a merger or acquisition transaction. The Fund currently offers three different classes of shares: Class A, Class I, and Class L shares. The separate classes of shares differ principally in the applicable sales charges (if any) and shareholder servicing fees. Generally, shareholders of each class also bear certain expenses that pertain to that particular class. All shareholders bear the common expenses of the Fund and earn income and realized gains/ losses pro rata based on the daily ending net assets of each class, without discrimination between share classes. Expenses that are specific to a class are charged directly to that class. Dividends are determined separately for each class based on income and expenses allocated to each class. Realized gain distributions are allocated to each class pro rata based on the shares outstanding of each class on the date of distribution. Differences in per share dividend rates generally result from the differences in separate class expenses, including distribution and shareholder servicing fees.
2. Significant accounting policies
The Fund is an investment company and follows the accounting and reporting guidance under Financial Accounting Standards Board (“FASB”) Accounting Standards Codification (“ASC”) Topic 946, Financial Services – Investment Companies. The following is a summary of significant accounting policies consistently followed by the Fund in the preparation of its financial statements.
Investment transactions and income recognition — Investment transactions are accounted for on a trade date basis. Net realized gains and losses on securities are computed on a specific identification basis. Dividend income is recorded on the ex-dividend date or as soon as known if after the ex-dividend date. Non-cash dividends included in dividend income, if any, are recorded at fair market value. Interest income and estimated expenses are accrued daily.
Use of estimates — The preparation of the financial statements in accordance with US generally accepted accounting principles (“GAAP”) requires management to make estimates and assumptions that affect the reported amounts of assets and liabilities and disclosure of contingent assets and liabilities at the date of the financial statement, as well as reported amounts of increases and decreases in net assets from operations during the reporting period. Actual results could differ from these estimates.
Investment valuation — The Fund’s NAV is based in large part on the value of its securities whichare carried at fair value in accordance with the provisions of FASB ASC Topic 820, FairValue Measurements and Disclosures. Where reliable market prices are available for those securities, the Investment Adviser will rely on those prices. However, because the securities in which the Fund invests are often illiquid, market prices may not be readily available or, where available, may be unreliable. At any point in
19
SHARESPOST 100 FUND
Notes to the Financial Statements (Continued)
December 31, 2019
2. Significant accounting policies — (continued)
time, there may be few recent purchase or sale transactions or offers on which to base the value of a given private share. In addition, the prices reflected in recent transactions or offers may be extremely sensitive to changes in supply or demand, including changes fueled by investor perceptions or other conditions.
When reliable market values are not available, the Fund’s investments will be valued by the Investment Adviser pursuant to fair valuation procedures and methodologies adopted by the Board of Trustees. While the Fund and the Investment Adviser will use good faith efforts to determine the fair value of the Fund’s securities, fair value will be dependent on the judgment of the Investment Adviser. The Investment Adviser may also rely to some extent on information provided by the Portfolio Companies.
From time to time, the Fund may determine that it should modify its estimates or assumptions, as new information becomes available. As a consequence, the value of the securities and therefore the Fund’s NAV may vary. This may adversely affect Shareholders. Other than in connection with a liquidity event of a Portfolio Company, the Fund will generally sell Portfolio Company securities only in order (and only to the extent necessary) to fund quarterly repurchases of Fund Shares. However, because of the uncertainty and judgment involved in the fair valuation of the private shares, which do not have a readily available market, the estimated fair value of such shares may be different from values that would have been used had a readily available market existed for such shares. In addition, in the event that the Fund desires to sell Portfolio Company shares, the Fund may also not be able to sell these securities at the prices at which they are carried on the Fund’s books or may have to delay their sale in order to do so. This may adversely affect the Fund’s NAV.
The Board of Trustees has delegated the day-to-day responsibility for determining these fair values to the Investment Adviser, but the Board of Trustees has the ultimate responsibility for determining the fair value of the portfolio of the Fund. The Investment Adviser has developed the Fund’s fair valuation procedures and methodologies, which have been approved by the Board of Trustees, and will make fair valuation determinations and act in accordance with those procedures and methodologies, and in accordance with the 1940 Act. Fair valuation determinations are to be reviewed and, as necessary, ratified or revised quarterly by the Board of Trustees (or more frequently if necessary), including in connection with any quarterly repurchase offer.
There were no changes to the valuation approaches or techniques applied during 2019.
Federal income taxes — The Fund’s policy is to comply with Subchapter M of the Internal Revenue Code of 1986, as amended (the “Code”), and to distribute to shareholders each year substantially all of its net investment income and any net realized capital gain. Therefore, a federal income tax or excise tax provision is not required.
Management has evaluated all tax positions taken or expected to be taken by the Fund to determine whether each tax position is more likely than not (i.e. greater than 50%) to be sustained upon examination by the applicable taxing authority, including resolution of any related appeals or litigation processes, based on the technical merits of the position. Tax positions that do not meet the more likely than not threshold may result in a tax benefit or expense in the current year. If the Fund were to incur an income tax liability in the future, interest on any income tax liability would be reported as interest expense and penalties on any income tax liability would be reported as income taxes. No interest expense or penalties have been recognized as of or for the year ended December 31, 2019. Management of the Fund also is not aware of any tax positions for which it is reasonably possible that the total amounts of recognized tax benefits will significantly change in the next twelve months. Management has determined that the Fund has not taken any tax positions which do not meet the more likely than not threshold and as such, no liabilities related to uncertain tax positions have been reflected in the Fund’s financial statements.
Management analyzed all open tax years, as defined by the applicable statute of limitations for all major jurisdictions in which it files tax returns, which includes federal and certain states. The Fund’s 2015 - 2018 tax years are open to examination as of December 31, 2019.
20
SHARESPOST 100 FUND
Notes to the Financial Statements (Continued)
December 31, 2019
2. Significant accounting policies — (continued)
Distributions to shareholders — The Fund distributes net investment income and net realized gains (net of any capital loss carryovers), if any, annually. The timing and character of income and capital gain distributions are determined in accordance with income tax regulations, which may differ from GAAP. These differences are due in part to differing treatment of net operating loss, wash sales, non-deductible offering costs, and capital loss carryforwards. To the extent that differences arise that are permanent in nature, such amounts are reclassified within the capital accounts on the Statement of Assets and Liabilities, based on their federal tax treatment. Temporary differences do not require reclassification.
Shareholder service fee plan — Under the terms of the Fund’s Shareholder Services Plan, the Fund may compensate financial industry professionals for providing ongoing serviceswith respect to clients to whom they have distributed Shares of the Fund’s Class A and Class L. Both Class A and Class L may incur shareholder servicing fees on an annual basis up to 0.25% of its daily average NAV. Class I is not subject to a shareholder servicing fee. For the year ended December 31, 2019, Class A and Class Lincurred $241,739 and $1,325, respectively, in shareholder servicing fees.
Distribution fee plan — Under the terms of the Fund’s Distribution Plan, the Fund may compensate financial industry professionals for providing ongoing services in respect to certain activities relating to the distribution of Class L to investors and maintenance of shareholder accounts, as well as for payments to the Class L platform sponsors. Although the Fund is not an open-end investment company, it has undertaken to comply with the terms of Rule 12b-1 as a condition of an exemptive order under the 1940 Act which permits it to have asset based distribution fees. Under the Distribution Plan, Class L pays the Distributor a Distribution Fee at an annual rate of 0.25% of its average daily NAV. Class A and Class I are not subject to a distribution fee. For theyear ended December 31, 2019, Class L incurred $1,325 in distribution fees.
Transactions with affiliates — SharesPost Financial Corporation (“SharesPost Financial”) is a registered broker-dealer, member of FINRA and SIPC, and wholly owned subsidiary of SharesPost, Inc. Since the Investment Advisor is also wholly owned by SharesPost, Inc., SharesPost Financial and the Investment Adviser are affiliates.
To the extent any affiliate of the Investment Adviser or the Fund (“Affiliated Broker”) receives any fee, payment, commission, or other financial incentive of any type (“Broker Fees”) in connection with the purchase and sale of securities by the Fund, such Broker Fees will be subject to policies and procedures adopted by the Board of Trustees pursuant to Section 17(e) and Rule 17e-1 of the 1940 Act. These policies and procedures include a quarterly review of Broker Fees by the Board of Trustees. Among other things, Section 17(e) and those procedures provide that, when acting as broker for the Fund in connection with the purchase or sale of securities to or by the Fund, an affiliated broker may not receive any compensation exceeding the following limits: (1) if the transaction is effected on a securities exchange, the compensation may not exceed the “usual and customary broker’s commission” (as defined in Rule 17e-1 under the 1940 Act); (2) in the case of the purchase of securities by the Fund in connection with a secondary distribution, the compensation cannot exceed 2% of the sale price; and (iii) the compensation for transactions otherwise effected cannot exceed 1% of the purchase or sale price. Rule 17e-1 defines a “usual and customary broker’s commission” as one that is fair compared to the commission received by other brokers in connection with comparable transactions involving similar securities being purchased or sold on an exchange during a comparable period of time. The Fund has adopted a policy that it will not utilize the services of Affiliated Brokers (although Affiliated Brokers may be engaged by sellers or buyers in transactions opposite the Fund). Notwithstanding the foregoing, no Affiliated Broker will receive any undisclosed fees from the Fund in connection with any transaction involving the Fund and such Affiliated Broker, and to the extent any transactions involving the Fund are effected by an Affiliated Broker, such Affiliated Broker’s Broker Fees for such transactions shall be limited in accordance with Section 17(e)(2) of the 1940 Act and the Fund’s policies and procedures concerning Affiliated Brokers. For the year ended December 31, 2019, the Fund paid $49,020 in commissions to Affiliated Brokers.
The Fund has implemented certain written policies and procedures to ensure that the Fund does not engage in any transactions with any prohibited affiliates. Under the 1940 Act, our Board of Trustees has a duty to evaluate, and shall oversee the analysis of, all conflicts of interest involving the Fund and its affiliates, and shall do so in accordance with the aforementioned policies and procedures.
21
SHARESPOST 100 FUND
Notes to the Financial Statements (Continued)
December 31, 2019
3. Fair value measurements
GAAP defines fair value, establishes a three-tier framework for measuring fair value based on a hierarchy of inputs, and expands disclosure about fair value measurements. It also provides guidance on determining when there has been a significant decrease in the volume and level of activity for an asset or liability, when a transaction is not orderly and how that information must be incorporated into a fair value measurement. The hierarchy distinguishes between market data obtained from independent sources (observable inputs) and the Fund’s own market assumptions (unobservable inputs). These inputs are used in determining the fair value of the Fund’s investments. These inputs are summarized in the three broad levels listed below:
| | ● | Level 1 — quoted prices for active markets for identical securities. An active market for the security is a market in which transactions occur with sufficient frequency and volume to provide pricing information on an ongoing basis. A quoted price in an active market provides the most reliable evidence of fair value. |
| | ● | Level 2 — other significant observable inputs (including quoted prices for similar securities, interest rates, prepayment speeds, credit risk, etc. and quoted prices for identical or similar assets in markets that are not active). Inputs that are derived principally from or corroborated by observable market data. An adjustment to any observable input that is significant to the fair value may render the measurement a Level 3 measurement. |
| | ● | Level 3 — significant unobservable inputs, including the Fund’s own assumptions in determining the fair value of investments. |
For the year ended December 31, 2019 there were no transfers out of Level 3 and into Level 1 or Level 2, due to changes in the liquidity restrictions of private holdings.
The following is a description of the valuation techniques applied to the Fund’s major categories of assets and liabilities measured at fair value on a recurring basis. There were no changes to these techniques or approaches during the year ended December 31, 2019.
Securities traded on a national exchange (or reported on the NASDAQ national market) are stated at the last reported sales price on the day of valuation. To the extent these securities are actively traded and valuation adjustments are not applied, they are categorized in Level 1 of the fair value hierarchy. Stocks traded on inactive markets or valued by reference to similar instruments which are marketable and to the extent the inputs are observable and timely, are categorized in Level 2 of the fair value hierarchy.
The Fund’s portfolio holdings are primarily in Level 3 investments. As they are not publicly traded, and many are subject to restrictions on resale, the investments are less liquid than publicly traded securities, resulting in increased liquidity risk to the Fund.
The Fund’s portfolio investments will generally not be in publicly traded securities. Investments for which observable market prices in active markets do not exist are reported at fair value, as determined in good faith by the Investment Adviser under consistently applied policies and procedures approved by the Board of Trustees in accordance with GAAP. In connection with that determination, members of the Investment Adviser’s portfolio management team will prepare Portfolio Company valuations using the most recent Portfolio Company financial statements and forecasts when and if available. The types of factors that the Investment Adviser will take into account in determining fair value, subject to review and ratification where required by the Board of Trustees with respect to such non-traded investments, will include, as relevant and, to the extent available, the Portfolio Company’s earnings, the markets in which the Portfolio Company does business, comparison to valuations of publicly traded companies in the Portfolio Company’s industry, comparisons to recent sales of comparable companies, the discounted value of the cash flows of the Portfolio Company, the rights and preferences of the specific securities held, and other relevant factors. This information may not be available because it is difficult to obtain financial and other information with respect to private companies. In considering the extent and nature of information utilized in the valuation process, management will generally apply a greater weighting to that information which is recent and observable. Because such valuations are inherently uncertain and may be based on estimates, the determinations of fair value may differ materially from the values that would be assessed if a readily available market for these securities existed. Based on these factors, the investments in private companies will generally be presented as a Level 3 investment. Changes in accounting standards, such as the recent change in revenue recognition policies, may not be adopted consistently by issuers or at the same time,
22
SHARESPOST 100 FUND
Notes to the Financial Statements (Continued)
December 31, 2019
3. Fair valuation measurements — (continued)
and as a result varied implementation may make it more difficult for the Fund to properly evaluate or compare financial information provided by Portfolio Companies of the Fund or to determine the validity of data of publicly traded company comparables for purposes of valuing the Fund’s portfolio holdings.
The inputs or methodology used for valuing securities are not necessarily an indication of the risk associated with investing in those securities. The following is a summary of the inputs used to determine fair value of the Fund’s investments as of December 31, 2019:
Investment in Securities | | Level 1 -
Quoted Prices | | | Level 2 –
Other Significant
Observable Inputs | | | Level 3 –
Significant
Unobservable Inputs | | | Total | |
Security Type | | | | | | | | | | | | | | | | |
Common stock in private companies* | | $ | — | | | $ | — | | | $ | 105,490,282 | | | $ | 105,490,282 | |
Preferred stock in private companies* | | | — | | | | — | | | | 51,373,280 | | | | 51,373,280 | |
Total | | $ | — | | | $ | — | | | $ | 156,863,562 | | | $ | 156,863,562 | |
Money Market holdings valued using the practical expedient and not subject to the fair value hierarchy | | | | | | | | | | | | | | | 34,764,321 | |
Total | | | | | | | | | | | | | | $ | 191,627,883 | |
* | All sub-categories within the security type represent their respective evaluation status. For a detailed breakout by industry, please refer to the Schedule of Investments. |
The following is a rollforward of the activity in investments in which significant unobservable inputs (Level 3) were used in determining fair value on a recurring basis:
| | | Beginning
balance
January 1,
2019 | | | Transfers
into Level 3
during the
period | | | Transfers
out of Level 3
during the
period | | | Purchases or
Conversions | | | (Sales or
Conversions) | | | Net
realized
gain/(loss) | | | Change in net
unrealized
gain/(loss) | | | Ending
balance
December 31,
2019 | | | Change in
Unrealized
gains for the
period for
investments
still held at
December 31,
2019 | |
SharesPost 100 Fund | | | | | | | | | | | | | | | | | | | | | | | | | | | | | | | | |
Common stock in private companies | | $ | 51,717,475 | | | $ | — | | | $ | — | | | $ | 45,356,689 | | | $ | (3,837,183 | ) | | $ | (300,118 | ) | | $ | 12,553,419 | | | $ | 105,490,282 | | | $ | 13,236,131 | |
Preferred stock in private companies | | | 32,050,755 | | | | — | | | | — | | | | 28,722,596 | | | | (10,663,283 | ) | | | 1,119,234 | | | | 143,978 | | | | 51,373,280 | | | | 4,201,091 | |
Convertible Bond | | | 37,078 | | | | — | | | | — | | | | — | | | | (37,078 | ) | | | — | | | | — | | | | — | | | | — | |
| | | $ | 83,805,308 | | | $ | — | | | $ | — | | | $ | 74,079,285 | | | $ | (14,537,544 | ) | | $ | 819,116 | | | $ | 12,697,397 | | | $ | 156,863,562 | | | $ | 17,437,222 | |
23
SHARESPOST 100 FUND
Notes to the Financial Statements (Continued)
December 31, 2019
3. Fair valuation measurements — (continued)
The following is a summary of quantitative information about significant unobservable valuation inputs for Level 3 Fair Value Measurements for investments held as of December 31,2019:
Type of Level 3
Investment | | Fair Value as of
December 31, 2019 | | Valuation
Technique* | Unobservable
Inputs | | Range (Avg) | |
Common stock in private companies | | $ | 105,490,282 | | Precedent Transactions | Precedent Transactions | | | N/A | |
| | | | | | | | | | | |
| | | | | | Revenue Model | Revenue Multiples | | | 2.40 – 11.13 (6.11) | |
| | | | | | | Stage Discount Rates | | | 20% - 30% (21.05%) | |
| | | | | | | Execution Discount Rates | | | 15% - 80% (42.11%) | |
| | | | | | | Discounts For Lack of Marketability | | | 15.00% (15.00%) | |
Preferred stock in private companies | | | 51,373,280 | | Precedent Transactions | Precedent Transactions | | | N/A | |
| | | | | | | | | | | |
| | | | | | Revenue Model | Revenue Multiples | | | 2.31 – 9.98 (5.53) | |
| | | | | | | Stage Discount Rates | | | 20% - 60% (23.43%) | |
| | | | | | | Execution Discount Rates | | | 15% - 50% - (42.86%) | |
| | | | | | | Discounts For Lack of Marketability | | | 15.00% (15.00%) | |
To the extent the revenue multiples increase, there is a corresponding increase in fair value; while as discount rates increase, there is a decrease in fair value.
4. Expense limitation agreement
The Investment Adviser has contractually agreed to reimburse the Fund so that its total annual operating expenses, excluding interest, taxes, brokerage commissions and other expenses that are capitalized in accordance with GAAP, and other extraordinary costs, such as litigation and other expenses not incurred in the ordinary course of the Fund’s business, do not exceed 2.50% of the Class A average net assets per year, 2.25% of the Class I average net assets per year, and 2.75% of Class L average net assets per year, through May 1, 2020.
During the calendar year ended December 31, 2019, there were certain expenses incurred by the Fund that were distinguishable in their characterization as being unusual in nature as well as not expected to be recurring in future periods. The amount caused the aforementioned percentages of the Class A, Class I and Class L shares to exceed the contractually agreed ratio limitation. These certain expenses are not expected to be incurred in future periods and thus will not have an impact on the ratios discussed herein. Please refer to the Financial Highlights for the Class A, Class I and Class L shares for the effect on the respective expense ratios.
24
SHARESPOST 100 FUND
Notes to the Financial Statements (Continued)
December 31, 2019
4. Expense limitation agreement — (continued)
Under the terms of the Expense Limitation Agreement, at any time that the expenses of the Fund are less than the expense limitation, the Investment Adviser retains the right to seek reimbursement for any fees previously waived and/or expenses previously assumed, to the extent that such reimbursement will not cause the Classes’ annualized expenses to exceed 2.50%, 2.25%, and 2.75%, for Class A, Class I, and Class L respectively, of their average net assets on an annualized basis. The Fund is not obligated to reimburse the Investment Adviser for fees previously waived or expenses previously assumed by the Investment Adviser more than three years before the date of such waiver or expense reimbursement. For the periods ended December 31, 2017, December 31, 2018, and December 31, 2019 the investment advisory fees and expense reimbursements by the Investment Adviser waived in the amounts of $1,121,021, $982,239, and $1,467,342 respectively, are subject to possible recoupment by the Investment Adviser through December 31, 2020, December 31, 2021, and December 31, 2022, respectively.
5. Investment advisory agreement
The Fund has entered into an Investment Advisory Agreement with the Investment Adviser, pursuant to which the Investment Adviser provides general investment advisory services for the Fund. For providing these services, the Investment Adviser receives a fee from the Fund, accrued daily and paid monthly, at an annual rate equal to 1.90% of the Fund’s average daily net assets. For the year ended December 31, 2019, the Fund incurred $3,506,326 in investment advisory fees.
Certain officers and Trustees of the Fund are also officers of the Investment Adviser. None of the Fund officers who are affiliated with the Adviser or interested Trustees receives any compensation from the Fund.
6. Capital share transactions
The Fund Shares will be continuously offered under Rule 415 of the Securities Act of 1933, as amended. As of December 31, 2019, the Fund had registered 25,000,000 shares.
Investors may purchase shares each business day at a price equal to the NAV per share next determined after receipt of a purchase order. Any sales load will be deducted from the proceeds to the Fund.
As of December 31, 2019, ownership from affiliated parties represents 0.03% of the Fund.
The Fund’s shares are not redeemable each business day, are not listed for trading on an exchange, and no secondary market currently exists for Fund shares. As an interval fund and as described in the Fund’s prospectus, the Fund will make quarterly repurchase offers of 5% of the total number of shares outstanding at its NAV, unless postponed in accordance with regulatory requirements, and each repurchase pricing shall occur no later than the 14th day after the repurchase request deadline, or the next business day if the 14th day is not a business day. Rule 23c-3 of the 1940 Act permits repurchases between 5% and 25% of the Fund’s outstanding shares at NAV.
25
SHARESPOST 100 FUND
Notes to the Financial Statements (Continued)
December 31, 2019
6. Capital share transactions — (continued)
In every full quarter since the commencement of operations, the Fund has offered shareholders the opportunity to participate in this program. During the year ended December 31, 2019, the Fund had Repurchase Offers as follows:
Commencement Date
Repurchase Request Deadline Date
Repurchase Pricing Date | February 13, 2019
March 25, 2019
March 25, 2019 | May 15, 2019
June 25, 2019
June 25, 2019 | August 14, 2019
September 25, 2019
September 25, 2019 | November 14, 2019
December 26, 2019
December 26, 2019 |
% of Shares Offered - Total Fund | 5.00% | 7.00%* | 5.70%* | 6.01%* |
| | | | | |
Number of Shares Offered - Total Fund | 302,622 | 474,943 | 389,943 | 406,575 |
| | | | | |
Pricing Date Net Asset Value - Class A | $29.43 | $29.26 | $29.15 | $29.78 |
Pricing Date Net Asset Value - Class I | $29.52 | $29.36 | $29.27 | $29.93 |
Pricing Date Net Asset Value - Class L | $29.35 | $29.16 | $29.03 | $29.64 |
| | | | | |
Number of Shares Tendered - Class A | 179,845 | 410,166 | 322,149 | 314,715 |
Number of Shares Tendered - Class I | 8,779 | 105,814 | 67,074 | 91,616 |
Number of Shares Tendered - Class L | — | — | 720 | 244 |
| | | | | |
Number of Shares Repurchased - Class A** | 179,845 | 377,569*** | 322,149 | 314,715 |
Number of Shares Repurchased - Class I | 8,779 | 97,374 *** | 67,074 | 91,616 |
Number of Shares Repurchased - Class L | — | — | 720 | 244 |
| | | | | |
% of Shares Tendered - Total Fund | 3.12% | 7.60% | 5.70% | 6.01% |
% of Shares Repurchased - Total Fund | 3.12% | 7.00% *** | 5.70% | 6.01% |
* | The Fund is permitted to, but not required to, repurchase an additional 2% of all outstanding shares of the Fund. |
** | Amounts included herein do not include redemptions for shares transfered between shares classes. |
*** | Repurchases were made on a pro-rata basis. |
7. Purchases and sales of securities
Purchases and sales of investments for the year ended December 31, 2019, were $74,079,285 and $18,535,045, respectively.
8. Federal tax information
At December 31, 2019, gross unrealized appreciation and depreciation of investments based on cost for federal income tax purposes were as follows:
Cost of investments | | $ | 157,226,880 | |
Gross unrealized appreciation | | | 39,549,397 | |
Gross unrealized depreciation | | | (5,148,394 | ) |
Net unrealized appreciation on investments | | $ | 34,401,003 | |
26
SHARESPOST 100 FUND
Notes to the Financial Statements (Continued)
December 31, 2019
8. Federal tax information — (continued)
GAAP requires that certain components of net assets be reclassified between financial and tax reporting. These reclassifications have no effect on net assets or net asset value per share. For the year ended December 31, 2019, permanent differences in book and tax accounting have been reclassified to paid-in capital and total distributable income/(loss) as follows:
Increase (Decrease) |
Paid in Capital | Total Distributable Income/(Loss) |
$(4,830,842) | $4,830,842 |
As of December 31, 2019, the components of accumulated earnings on a tax basis were as follows:
Undistributed ordinary income | | $ | — | |
Undistributed long-term capital gains | | | 26,731 | |
Tax accumulated earnings | | | 26,731 | |
Accumulated capital and other losses | | | — | |
Net unrealized gain | | | 34,401,003 | |
Total accumulated earnings | | $ | 34,427,734 | |
During the fiscal year ended December 31, 2019, the Fund utilized $403,968 and $2,348,007 of its non-expiring short-term and long-term capital loss carryforwards, respectively.
9. Commitments and contingencies
In the normal course of business, the Fund will enter into contracts that contain a variety of representations, provide general indemnifications, set forth termination provisions and compel the contracting parties to arbitration in the event of dispute. From time to time, the Fund may be a party to arbitration, or legal proceedings, in the ordinary course of business, including proceedings relating to the enforcement of provisions of such contracts. The Fund’s maximum exposure under these arrangements is unknown, as this would involve future claims that may be made against the Fund that would be subject to arbitration, generally.
In the normal course of business, the Company may enter into agreements to purchase investments. Such agreements are subject to certain rights of the issuer’s and ultimately, issuer approval. At December 31, 2019, the Fund had entered into agreements to purchase equity securities totaling $495,000. If approved by the issuer the Fund, would record such amount in purchase costs.
The Fund reasonably believes its assets will provide adequate cover to satisfy all its unfunded commitments. The Fund has ensured through its policies and procedures that it does not enter into an unfunded commitment unless it has reserved enough cash to meet the funding requirements thereof.
10. Offering price per share
A maximum front-end sales load of 5.75% for Class A shares and 4.25% for Class L is imposed on purchases. Class I shares are not subject to sales charge. For the year ended December 31, 2019, the Fund was advised that various broker dealers received $582,558 of sales charges from sales of the Fund’s shares, of which $16,365 represented sales load received by affiliates.
11. Subsequent events
Management of the Fund has evaluated events occurring after December 31, 2019 and through the date the financials were issued, to determine whether any subsequent events would require adjustment to or disclosure in the financial statements. No subsequent events requiring adjustment to or disclosure within the financial statements were noted.
27
SHARESPOST 100 FUND
Report of Independent Registered Public Accounting Firm
To the Shareholders and Board of Trustees
SharesPost 100 Fund:
Opinion on the Financial Statements
We have audited the accompanying statement of assets and liabilities of SharesPost 100 Fund (the Fund), including the schedule of investments, as of December 31, 2019, the related statements of operations and cash flows for the year then ended, the statements of changes in net assets for each of the years in the two-year period then ended, and the related notes (collectively, the financial statements) and the financial highlights for each of the years in the five-year period then ended. In our opinion, the financial statements and financial highlights present fairly, in all material respects, the financial position of the Fund as of December 31, 2019, the results of its operations and its cash flows for the year then ended, the changes in its net assets for each of the years in the two-year period then ended, and the financial highlights for each of the years in the five-year period then ended, in conformity with U.S. generally accepted accounting principles.
Basis for Opinion
These financial statements and financial highlights are the responsibility of the Fund’s management. Our responsibility is to express an opinion on these financial statements and financial highlights based on our audits. We are a public accounting firm registered with the Public Company Accounting Oversight Board (United States) (PCAOB) and are required to be independent with respect to the Fund in accordance with the U.S. federal securities laws and the applicable rules and regulations of the Securities and Exchange Commission and the PCAOB.
We conducted our audits in accordance with the standards of the PCAOB. Those standards require that we plan and perform the audit to obtain reasonable assurance about whether the financial statements and financial highlights are free of material misstatement, whether due to error or fraud. Our audits included performing procedures to assess the risks of material misstatement of the financial statements and financial highlights, whether due to error or fraud, and performing procedures that respond to those risks. Such procedures included examining, on a test basis, evidence regarding the amounts and disclosures in the financial statements and financial highlights. Such procedures also included confirmation of securities owned as of December 31, 2019, by correspondence with custodians, issuers of the securities, or other appropriate audting procedures when replies from the issuers were not received. Our audits also included evaluating the accounting principles used and significant estimates made by management, as well as evaluating the overall presentation of the financial statements and financial highlights. We believe that our audits provide a reasonable basis for our opinion.

We have served as the Fund’s auditor since 2013.
Los Angeles, California
February 28, 2020
28
SHARESPOST 100 FUND
Trustees and Officers
December 31, 2019 (Unaudited)
The Board of Trustees of the Fund has overall responsibility for monitoring the Fund’s investment program and its management and operations. The names of the Trustees and Officers of the Fund, their addresses, ages and principal occupations during the past five years are provided in the tables below. Trustees who are deemed “interested persons,” as defined in the 1940 Act, are included in the table titled “Interested Trustee and Officer.” Trustees who are not “interested persons” are referred to as “Independent Trustees.” The Fund’s Statement of Additional Information includes additional information about the Fund’s Trustees and is available, without charge and upon request, by calling 1-800-834-8707.
Name, Address(1)
and Age | Position(s)
held with
the Fund | Term of
Office and Length
of Time Served | Principal Occupation(s)
During Past Five Years | Number of
Portfolios in
Fund Complex
Overseen by
Trustee | Other
Directorships
Held by
Director |
INDEPENDENT TRUSTEES: | | | | |
Robert Boulware Age: 63 | Independent Trustee | Since
inception(2) | Professional board director and trustee. Managing Director, Pilgrim Funds, LLC | 1 | Gainsco, Brighthouse Financial, Trustee of Vertical Capital Fund |
Mark Radcliffe Age: 67 | Independent Trustee | Since
inception(2) | Partner, DLA Piper | 1 | N/A |
INTERESTED TRUSTEE: | | | |
Jeff Miller Age: 60 | Interested Trustee | Since
December 2018(2) | President, SharesPost Inc., President, SharesPost Investment Management; President Truelytics, Inc. (2018); Managing Director, Head of Advisory and Products, UBS (2014 – 2017) | 0 | Truelytics |
OFFICERS: | | | | | |
Kevin Moss Age: 50 | President | Since
April 11, 2019 | Managing Director and Chief Operating Officer of SP Investments Management LLC | N/A | N/A |
Jack Sweeney Age: 34 | Treasurer and Chief Financial Officer | Since
April 29, 2019 | Finance Manager at Venrock; Senior Associate at Ernst &Young LLP | N/A | N/A |
Peter Guarino Age: 61 | Chief Compliance Officer | Since
May 7, 2019 | President and Chief Compliance Officer, Compliance4, LLC April 2018 to the present; Senior Consultant, Ascendant, January 2017 through March 2018 and Vice President, Cordium 2014 through December 2018 | N/A | N/A |
(1) | All addresses c/o SharesPost 100 Fund, 555 Montgomery Street, 14th Floor - San Francisco, CA 94111. |
(2) | Each Trustee will serve for the duration of the Fund, or until death, resignation, termination, removal or retirement. |
29
SHARESPOST 100 FUND
Additional Information
December 31, 2019 (Unaudited)
Proxy voting — A description of the policies and procedures that the Fund uses to determine how to vote proxies relating to portfolio securities and information regarding how the Fund voted proxies during the 12-month period ended June 30 are available without charge upon request by (1) calling the Fund at 1-800-834-8707 and (2) from Fund documents filed with the Securities and Exchange Commission (“SEC”) on the SEC’s website at www.sec.gov.
Portfolio holdings — The Fund files its complete schedule of portfolio holdings with the SEC for the first and third quarters of each fiscal year on form N-Q. The Fund’s Form N-Q is available on the SEC’s website at http://sec.gov. You may also obtain copies by calling the Fund at 1-800-834-8707.
30

Board of Trustees
Jeff Miller
Robert J. Boulware
Mark Radcliffe
Investment Adviser
SP Investments Management, LLC
555 Montgomery Street, 14th Floor
San Francisco, CA 94111
Dividend Paying Agent, Transfer Agent
UMB Fund Services
235 West Galena Street
Milwaukee, WI 53212
Custodian
UMB Bank National Association
1010 Grand Boulevard
Kansas City, MO 64106
Distributor
Foreside Fund Services, LLC
Three Canal Plaza, Suite 100
Portland, ME 04101
Independent Auditors
KPMG LLP
550 South Hope Street, Suite 1500
Los Angeles, CA 90071
This report has been prepared for the general information of the shareholders. It is not authorized for distribution to prospective investors unless preceded or accompanied by a current prospectus. The Fund’s prospectus contains more complete information about the objectives, policies, expenses and risks of the Funds. The Fund is not a bank deposit, not FDIC insured and may lose value. Please read the prospectus carefully before investing or sending money.
This report contains certain forward looking statements which are subject to known and unknown risks and uncertainties that could cause actual results to differ materially from those expressed or implied by such statements. Forward looking statements generally include words such as ‘‘believes’’, ‘‘expects’’, ‘‘anticipates’’ and other words of similar import. Such risks and uncertainties include, among other things, the Risk Factors noted in the Fund’s filings with the Securities and Exchange Commission. The Fund undertakes no obligation to update any forward looking statement.
Item 2. Code of Ethics.
The Registrant has a code of ethics (the “Code”) that applies to the Registrant’s principal executive officer and principal financial officer. During the period covered by this report, there were no amendments to the provisions of the Code, nor were there any implicit or explicit waivers to the provisions of the Code. The Code is filed herewith.
Item 3. Audit Committee Financial Expert.
The Registrant does not have an audit committee financial expert. The Board of Trustees of the Registrant has determined that the members of its Audit Committee have sufficient financial experience to ensure the proper functioning of that committee, but that neither of the members has the requisite expertise or experience to be deemed an “audit committee financial expert” for purposes of the definition of such term in the Instructions to this Item 3 on Form N-CSR.
Item 4. Principal Accountant Fees and Services.
The aggregate fees for professional services by KPMG LLP during the fiscal year 2019 and 2018 were as follows:
(a)Audit Fees.
| Fiscal year ended December 31, 2019: | $ 195,000 |
| Fiscal year ended December 31, 2018: | $ 199,250 |
(b)Audit-Related Fees.
| Fiscal year ended December 31, 2019: | $ 0.00 |
| Fiscal year ended December 31, 2018: | $ 0.00 |
(c)Tax Fees. These are fees billed for professional services rendered by the Registrant’s independent auditors for tax compliance, tax advice, and tax planning.
| Fiscal year ended December 31, 2019: | $ 15,325 |
| Fiscal year ended December 31, 2018: | $ 12,825 |
(d)All Other Fees.
| Fiscal year ended December 31, 2019 | $ 0.00 |
| Fiscal year ended December 31, 2018 | $ 0.00 |
(e) Audit Committee’s pre-approval policies and procedures.
| | (1) | The Audit Committee has adopted pre-approval policies and procedures that require the Audit Committee to pre-approve all audit and non-audit services of the Registrant, including services provided to the Registrant’s investment adviser or any entity controlling, controlled by or under common control with the Registrant’s investment adviser that provides ongoing services to the Registrant with respect to any engagement that directly relates to the operations and financial reporting of the Registrant. |
| | (2) | Services approved pursuant to paragraph (c)(7)(i)(C) of Rule 2-01 of Regulation S-X: 100% of these fees were approved by the Audit Committee as required pursuant to paragraph (c)(7)(ii) of Rule 2-01 of Regulation S-X. |
(f) None.
(g) During the last two fiscal years, there were no other non-audit services rendered by the Registrant’s independent auditors to the Registrant, its investment adviser or any entity controlling, controlled by or under the common control with the investment adviser that provides ongoing services to the Registrant.
(h) Not applicable.
Item 5. Audit Committee of Listed Registrants.
Not applicable.
Item 6. Schedule of Investments.
Included as part of the report to shareholders filed under Item 1 of this Form N-CSR.
Item 7. Disclosure of Proxy Voting Policies and Procedures for Closed-End Management Investment Companies.
The Board of Trustees of the Registrant has adopted the Proxy Voting Procedures of SP Investments Management, LLC (“SPIM” or the “Adviser”), the Registrant’s investment adviser, as the Registrant’s Proxy Voting Procedures. Subject to the oversight of the Registrant’s Board of Trustees, the Registrant has delegated responsibility to the Adviser to vote any proxies the Registrant may receive. The Adviser’s general policy is to vote proxy proposals, amendments, consents or resolutions relating to the Registrant in a manner that serves the best interests of the Registrant.
Adviser’s Proxy Voting Policy
SPIM, as a matter of policy and as a fiduciary to its clients that are registered management investment companies (“Clients”), permits Clients to delegate proxy voting authority to SPIM, consistent with the best economic interests of the Clients.
Adviser’s Proxy Voting Procedure
All Client proxies are voted in accordance with the Adviser’s Proxy Voting Guidelines, as summarized below. In the event the Adviser’s Proxy Voting Guidelines do not address how a proxy should be voted, SPIM votes the proxy in a manner consistent with the general principles of its Proxy Voting Policies and Procedures and in the particular Client’s best interest. Prior to voting any proxies, the Chief Compliance Officer of the Adviser will determine whether any material conflict of interest may exist between SPIM and the respective Client with respect thereto. If the Chief Compliance Officer determines that any such material conflict of interest may exist, SPIM will follow the procedures identified under “Conflicts of Interest” below in connection with the voting of such proxies.
Conflicts of Interest
| | A. | In the event that SPIM or its Chief Compliance Officer determines that voting a proxy may present a material conflict of interest between SPIM and a Client, SPIM will (1) disclose such conflict of interest to the Client and obtain written direction from the Client as to how to vote the proxy, (2) suggest that the Client engage another party to determine how to vote the proxy, or (3) engage another independent third party to determine how to vote the proxy. |
| | B. | Notwithstanding the foregoing, SPIM must vote proxies in the best interest of Clients when material conflicts of interest may exist with respect thereto. |
| | C. | SPIM believes that its policies and procedures are reasonably designed to address material conflicts of interest that may arise between SPIM and a Client as to the manner in which proxies are voted. |
Except in instances where Clients have retained voting authority, SPIM will instruct custodians of Client accounts to forward all proxy statements and materials received in respect of Client accounts to SPIM’s Chief Compliance Officer. SPIM retains final authority and fiduciary responsibility for proxy voting.
Adviser’s General Proxy Voting Guidelines
SPIM has adopted general guidelines for voting proxies as summarized below. In keeping with its fiduciary obligations to its Clients, SPIM reviews all proposals, even those that may be considered to be routine matters. Although these guidelines are to be followed as a general policy, in all cases each proxy and proposal will be considered based on the relevant facts and circumstances. SPIM may deviate from the general policies and procedures when it determines that the particular facts and circumstances warrant such deviation to protect the best interests of the Clients. These guidelines cannot provide an exhaustive list of all the issues that may arise nor can SPIM anticipate all future situations. Corporate governance issues are diverse and continually evolving and SPIM devotes significant time and resources to monitor these changes.
The following guidelines reflect what SPIM believes to be good corporate governance and behavior:
Board of Directors: The election of directors and an independent board are key to good corporate governance. Directors are expected to be competent individuals and they should be accountable and responsive to shareholders. SPIM supports an independent board of directors, and prefers that key committees such as audit, nominating, and compensation committees be comprised of independent directors. SPIM will generally vote against management efforts to classify a board and will generally support proposals to declassify the board of directors. SPIM will consider withholding votes from directors who have attended less than 75% of meetings without a valid reason. While generally in favor of separating Chairman and CEO positions, SPIM will review this issue on a case-by-case basis taking into consideration other factors including the company's corporate governance guidelines and performance. SPIM evaluates proposals to restore or provide for cumulative voting on a case-by-case basis and considers such factors as corporate governance provisions as well as relative performance. SPIM generally will support non-binding shareholder proposals to require a majority vote standard for the election of directors; however, if these proposals are binding, SPIM will give careful review on a case-by-case basis of the potential ramifications of such implementation. In the event of a contested election, SPIM will review a number of factors in making a decision including management’s track record, the company’s financial performance, qualifications of candidates on both slates, and the strategic plan of the dissidents.
Ratification of Auditors: SPIM will closely scrutinize the independence, role, and performance of auditors. On a case-by-case basis, SPIM will examine proposals relating to non-audit relationships and non-audit fees. SPIM will also consider, on a case-by-case basis, proposals to rotate auditors, and will vote against the ratification of auditors when there is clear and compelling evidence of a lack of independence, accounting irregularities or negligence attributable to the auditors. SPIM may also consider whether the ratification of auditors has been approved by an appropriate audit committee that meets applicable composition and independence requirements.
Anti-Takeover Mechanisms and Related Issues: SPIM generally opposes anti-takeover measures since they tend to reduce shareholder rights. However, as with all proxy issues, SPIM conducts an independent review of each anti-takeover proposal. On occasion, SPIM may vote with management when the research analyst has concluded that the proposal is not onerous and would not harm Clients' interests as stockholders. SPIM generally supports proposals that require shareholder rights plans ("poison pills") to be subject to a shareholder vote. SPIM will closely evaluate shareholder rights' plans on a case-by-case basis to determine whether or not they warrant support. SPIM will generally vote against any proposal to issue stock that has unequal or subordinate voting rights. In addition, SPIM generally opposes any supermajority voting requirements as well as the payment of "greenmail." SPIM usually supports "fair price" provisions and confidential voting. SPIM will review a company’s proposal to reincorporate to a different state or country on a case-by-case basis taking into consideration financial benefits such as tax treatment as well as comparing corporate governance provisions and general business laws that may result from the change in domicile.
Changes to Capital Structure: SPIM realizes that a company's financing decisions have a significant impact on its shareholders, particularly when they involve the issuance of additional shares of common or preferred stock or warrants or the assumption of additional debt. SPIM will carefully review, on a case-by-case basis, proposals by companies to increase authorized shares and the purpose for the increase. SPIM will generally not vote in favor of dual-class capital structures to increase the number of authorized shares where that class of stock would have superior voting rights. SPIM will generally vote in favor of the issuance of preferred stock in cases where the company specifies the voting, dividend, conversion and other rights of such stock and the terms of the preferred stock issuance are deemed reasonable. SPIM will review proposals seeking preemptive rights on a case-by-case basis.
Item 8. Portfolio Managers of Closed-End Management Investment Companies.
(a)(1)Identification of Portfolio Manager(s) and Description of Role of Portfolio Manager(s).
As of December 31, 2019, the portfolio management team of the Registrant was comprised of Kevin Moss, Christian Munafo and Sven Jonas Grankvist (the “Portfolio Management Team”). The Portfolio Management Team was primarily responsible for the day-to-day portfolio management of the Registrant.
Mr. Moss has been with SharesPost for seven years and is currently the COO of SP Investments Management overseeing the operations and trading of the SPIM funds. He is also one of the creators of the SharesPost 100 Fund, serving as the President of the fund and one of the portfolio managers and members of the investment committee. Prior to joining SharesPost, Kevin was a senior portfolio manager at First New York Securities, where he managed a global macro book. With over 18 years of senior level experience in financial services, Kevin’s specific areas of expertise include the management of client relationships, investment research coverage, block and position trading, and operations management. Kevin began his career as an institutional equity’s sales trader working for Instinet, and later Commerzbank. His client base included hedge funds, pension funds and proprietary trading desks. Subsequently, Kevin held a series of distinguished posts at leading hedge funds and proprietary trading firms including serving as the head of international trading for Libra Advisors and Opus Trading Funds.
Mr. Munafo is the Chief Investment Officer of SP Investments Management, LLC, a registered investment adviser and wholly owned subsidiary of SharesPost. Mr. Munafo joined the Investment Adviser in August 2019. Prior to his position with the Investment Adviser, Mr. Munafo was Co-Head of the Global Private Equity Secondary Practice at HQ Capital based in New York, where he was also a member of the senior leadership team. Prior to that, he served as Head of Secondaries at Thomas Weisel Partners. Mr. Munafo has 19 years of experience in finance, with the last 14 years focused on secondary investments involving venture-backed and growth equity-oriented companies and funds. During this time, he has also served on the boards of many of these companies and funds. In aggregate, Mr. Munafo has helped raise more than $1 billion globally from institutional investors, corporations, pensions, endowments and family offices. In addition, Mr. Munafo has overseen the completion of more than 100 secondary transactions representing over $1 billion in capital commitments, ranging from traditional purchases of limited partnership interests to more complex non-traditional transactions including fund restructurings, recapitalizations, tender programs, preferred equity/loan facilities and purchases of company securities. Mr. Munafo began his career as an investment banker focused on mergers and acquisitions at Banc of America Securities. Mr. Munafo holds a Bachelor of Arts from Rutgers College in Economics and Finance.
Mr. Grankvist has been with SharesPost for eight years and is currently a Director and Portfolio Manager, co-leading investment management for SP Investments Managements funds and participating as a voting member of the Investment Committee. He is also an initial member of the SharesPost 100 Fund team and has been instrumental in developing and overseeing the valuation procedures. During his tenure as Portfolio Manager, he has led or helped lead over 100 primary and secondary direct transactions for close to 40 leading growth stage private companies, with responsibilities including due diligence, originating, negotiating and deal execution. Jonas began his career as a technology investment banker at Berman Capital. Jonas received his LLM from Uppsala University and MBA from Golden Gate University, magna cum laude. He holds FINRA series 7 and 63 licenses.
(a)(2)Other Accounts Managed by Portfolio Manager(s) or Management Team Member and Potential Conflicts of Interest.
(i) As of December 31st, 2019, Messrs. Moss and Grankvist were the portfolio managers of SP100 Special Opportunities Fund LLC (“SP100 Opportunity”), and are primarily responsible for the day-to-day portfolio management of SP100 Opportunity.
(ii) (A) Zero.
(B) One (1), SP100 Opportunity. Total assets of SP100 Opportunity managed by Messrs. Moss and Grankvist as of December 31, 2019 were approximately $3,471,129.
(C) Zero.
(iii) One (1) account. As of December 31, 2019, $0.00 of assets SP100 Opportunity were subject to an advisory performance fee.
(iv) A material conflict could arise in respect of the allocation of investment opportunities between the Registrant and SP100 Opportunity, as both entities have a substantially similar investment strategy to invest in the equity securities of private companies. However, to address such potential conflict of interest, SPIM has adopted compliance policies and procedures designed to address such conflict. It is SPIM’s general policy to allocate purchase or sale opportunities on apro rata basis to all applicable Clients, measured by reference to each Client’s relative net asset value as of the beginning of the month in which the purchase or sale is executed. However, with respect to SP100 Opportunity, only after the SPIM Investment Committee has made its decision to pursue a purchase or sale opportunity in a given security on behalf the Registrant and the rationale for such decision has been documented by the Investment Committee and reviewed and approved by SPIM’s Chief Compliance Officer, may SP100 Opportunity, or any other overage fund structure advised by SPIM, be permitted to pursue a purchase or sale opportunity in any additionally available interests or shares of such security.
(a)(3)Compensation Structure of Portfolio Manager(s).
As of December 31, 2019, compensation for the Registrant’s Portfolio Management Team consists of base salary and bonus, which is in part dependent upon the overall performance of SPIM. The compensation is monitored to ensure competitiveness in the external marketplace.
(a)(4)Disclosure of Securities Ownership.
The following table sets forth the dollar range of equity securities beneficially owned by the Portfolio Management Team in the Registrant as of December 31, 2019:
| Portfolio Manager | Dollar Range of Registrant Shares Beneficially Owned |
| Kevin Moss | $10,000 - $50,000 |
| Christian Munafo | None |
| Sven Jonas Grankvist | $1 - $10,000 |
Item 9. Purchases of Equity Securities by Closed-End Management Investment Company and Affiliated Purchasers.
REGISTRANT PURCHASES OF EQUITY SECURITIES
| Class A | (a) Total Number of Shares (or Units) Purchased | (b) Average Price Paid per Share (of Unit) | (c) Total Number of Shares (or Units) Purchased as Part of Publicly Announced Plans or Programs | (d) Maximum Number (or Approximate Dollar Value) of Shares (or Units) that May Yet Be Purchased Under the Plans or Programs |
| Period | | | | |
| Jan. 1-31, 2019 | 0 | 0 | 0 | 0 |
| Feb. 1-28, 2019 | 0 | 0 | 0 | 0 |
| Mar. 1-31, 2019 | 179,845 | $29.43 | 0 | 0 |
| Apr. 1-30, 2019 | 0 | 0 | 0 | 0 |
| May 1-31, 2019 | 0 | 0 | 0 | 0 |
| Jun. 1-30, 2019 | 377,569 | $29.26 | 0 | 0 |
| Jul. 1-31, 2019 | 0 | 0 | 0 | 0 |
| Aug. 1-31, 2019 | 0 | 0 | 0 | 0 |
| Sep. 1-30, 2019 | 322,149 | $29.15 | 0 | 0 |
| Oct. 1-31, 2019 | 0 | 0 | 0 | 0 |
| Nov. 1-30, 2019 | 0 | 0 | 0 | 0 |
| Dec. 1-31, 2019 | 314,715 | $29.78 | 0 | 0 |
| Total | 1,194,278 | $29.39 | 0 | 0 |
| Class I | (a) Total Number of Shares (or Units) Purchased | (b) Average Price Paid per Share (of Unit) | (c) Total Number of Shares (or Units) Purchased as Part of Publicly Announced Plans or Programs | (d) Maximum Number (or Approximate Dollar Value) of Shares (or Units) that May Yet Be Purchased Under the Plans or Programs |
| Period | | | | |
| Jan. 1-31, 2019 | 0 | 0 | 0 | 0 |
| Feb. 1-28, 2019 | 0 | 0 | 0 | 0 |
| Mar. 1-31, 2019 | 8,779 | $29.52 | 0 | 0 |
| Apr. 1-30, 2019 | 0 | 0 | 0 | 0 |
| May 1-31, 2019 | 0 | 0 | 0 | 0 |
| Jun. 1-30, 2019 | 97,374 | $29.36 | 0 | 0 |
| Jul. 1-31, 2019 | 0 | 0 | 0 | 0 |
| Aug. 1-31, 2019 | 0 | 0 | 0 | 0 |
| Sep. 1-30, 2019 | 67,074 | $29.27 | 0 | 0 |
| Oct. 1-31, 2019 | 0 | 0 | 0 | 0 |
| Nov. 1-30, 2019 | 0 | 0 | 0 | 0 |
| Dec. 1-31, 2019 | 91,616 | $29.93 | 0 | 0 |
| Total | 264,843 | $29.54 | 0 | 0 |
| Class L | (a) Total Number of Shares (or Units) Purchased | (b) Average Price Paid per Share (of Unit) | (c) Total Number of Shares (or Units) Purchased as Part of Publicly Announced Plans or Programs | (d) Maximum Number (or Approximate Dollar Value) of Shares (or Units) that May Yet Be Purchased Under the Plans or Programs |
| Period | | | | |
| Jan. 1-31, 2019 | 0 | 0 | 0 | 0 |
| Feb. 1-28, 2019 | 0 | 0 | 0 | 0 |
| Mar. 1-31, 2019 | 0 | 0 | 0 | 0 |
| Apr. 1-30, 2019 | 0 | 0 | 0 | 0 |
| May 1-31, 2019 | 0 | 0 | 0 | 0 |
| Jun. 1-30, 2019 | 0 | 0 | 0 | 0 |
| Jul. 1-31, 2019 | 0 | 0 | 0 | 0 |
| Aug. 1-31, 2019 | 0 | 0 | 0 | 0 |
| Sep. 1-30, 2019 | 720 | $29.03 | 0 | 0 |
| Oct. 1-31, 2019 | 0 | 0 | 0 | 0 |
| Nov. 1-30, 2019 | 0 | 0 | 0 | 0 |
| Dec. 1-31, 2019 | 244 | $29.64 | 0 | 0 |
| Total | 964 | $29.18 | 0 | 0 |
On February 13, 2019, May 15, 2019, August 14, 2019, and November 14, 2019 the Registrant offered to repurchase 302,622, 474,943, 389,943, and 406,575 shares, respectively, pursuant to its periodic repurchase plan.
Item 10. Submission of Matters to a Vote of Security Holders.
Not applicable.
Item 11. Controls and Procedures.
| (a) | The Registrant’s Principal Executive Officer and Principal Financial Officer have reviewed the Registrant's disclosure controls and procedures (as defined in Rule 30a-3(c) under the Investment Company Act of 1940, as amended, (the “Act”)) as of a date within 90 days of the filing of this report, as required by Rule 30a-3(b) under the Act. Based on their review, such officers have concluded that the disclosure controls and procedures were effective in ensuring that information required to be disclosed in this report was appropriately recorded, processed, summarized and reported and made known to them by others within the Registrant and by the Registrant’s service providers. |
| (b) | There were no changes in the Registrant’s internal control over financial reporting (as defined in Rule 30a-3(d) under the Act (17 CFR 270.30a-3(d)) that occurred during the Registrant’s last fiscal quarter that materially affected, or were reasonably likely to materially affect, the Registrant’s internal control over financial reporting. |
Item 12. Disclosure of Securities Lending Activities for Closed-End Management Investment Companies
The Fund has not engaged in Security Lending Activities.
Item 13. Exhibits.
| (a) (1) | Code of Ethics. Filed herewith. |
| (a) (2) | Certifications required pursuant to Section 302 of the Sarbanes-Oxley Act of 2002. Filed herewith. |
| (a) (4) | Change in the registrant’s independent public accountant. Not applicable. |
| (b) | Certification pursuant to Section 906 of the Sarbanes-Oxley Act of 2002. Filed herewith. |
SIGNATURES
Pursuant to the requirements of the Securities Exchange Act of 1934 and the Investment Company Act of 1940, the Registrant has duly caused this report to be signed on its behalf by the undersigned, thereunto duly authorized.
SharesPost 100 Fund
| /s/ Kevin Moss | |
| By: Kevin Moss | |
| President | |
| March 6, 2020 | |
Pursuant to the requirements of the Securities Exchange Act of 1934 and the Investment Company Act of 1940, this report has been signed below by the following persons on behalf of the Registrant and in the capacities and on the dates indicated.
| /s/ Kevin Moss | |
| By: Kevin Moss | |
| President | |
| March 6, 2020 | |
| /s/ Jack Sweeney | |
| By: Jack Sweeney | |
| Principal Financial Officer | |
| March 6, 2020 | |
| | |