UNITED STATES
SECURITIES AND EXCHANGE COMMISSION
Washington, D.C. 20549
FORM N-CSR
CERTIFIED SHAREHOLDER REPORT OF REGISTERED
MANAGEMENT INVESTMENT COMPANIES
Investment Company Act File Number 811-22759
The Private Shares Fund
(Exact name of registrant as specified in charter)
88 Pine Street, 31st Floor, Suite 3101
New York, NY 10005
(Address of principal executive offices) (Zip code)
Cogency Global, Inc.
c/o The Private Shares Fund
850 New Burton Rd. Ste. 201
City of Dover, County of Kent, Delaware 19904
(Name and address of agent for service)
Copies to:
Dechert LLP
One Bush Street, Suite 1600
San Francisco, CA 94104-4446
Registrant's telephone number, including area code: (646) 839-5548
Date of fiscal year end: December 31
Date of reporting period: December 31, 2022
Item 1. Reports to Stockholders.
(a) The following is a copy of the report transmitted to shareholders pursuant to Rule 30e-1 under the Investment Company Act of 1940, as amended.

THE PRIVATE SHARES FUND
Table of Contents | |
Shareholder Letter | 2 |
Fund Performance | 7 |
Fund Performance & Portfolio Diversification | 10 |
Portfolio Composition | 11 |
Schedule of Investments | 13 |
Statement of Assets and Liabilities | 21 |
Statement of Operations | 22 |
Statements of Changes in Net Assets | 23 |
Statement of Cash Flows | 24 |
Financial Highlights | 25 |
Notes to the Financial Statements | 28 |
Report of Independent Registered Public Accounting Firm | 41 |
Trustees and Officers | 42 |
Additional Information | 43 |
1
THE PRIVATE SHARES FUND
Shareholder Letter
PORTFOLIO MANAGER 2022 COMMENTARY
The Private Shares Fund (the “Fund”) can report that through 2022, the Fund generated a one-year total return of 0.70% as measured by the Fund’s Institutional Class (PIIVX) and was able to achieve those returns with a significantly lower level of volatility than the broader market. While the returns are disappointing on an absolute basis, the Fund’s relative returns demonstrate resilience during a challenging year in the financial markets.
The National Venture Capital Association (NVCA) reported approximately 2,935 U.S. Venture Capital (VC)-backed deals closed in the fourth quarter of 2022, while total deal value fell to $36.2 billion, a twelve-quarter low. Despite the slowdown, full year 2022 VC deal activity has exceeded all prior years except for 2021 with an estimated $238 billion in total deal value across nearly 16,000 deals. Late-stage investment activity continued to moderate in the fourth quarter of 2022 with 936 deals closed representing $13.5 billion in total value, the lowest quarterly deal value for late-stage VC since the second quarter of 2018. However, full year 2022 late-stage investment activity far exceeded all prior 2021 levels with $93.7 billion in total deal value across 4,285 deals. While mega-deals (late-stage VC deals over $100 million) experienced a slowdown with 30 deals closed during the fourth quarter, this figure still far exceeds pre-2021 levels.
During the fourth quarter, the NVCA created a new category called venture-growth stage deals, which they define as any financing that is Series E or later, or any VC financing of a company that is at least seven years old and has raised at least six VC rounds. The purpose of this new category is to better distinguish the mitigated risk/reward profile of these more mature companies compared to other VC deals. For the full year 2022, venture-growth investment activity also slowed, but still far exceeded all prior 2021 levels with approximately $55 billion in total deal value across 845 deals.
Early-stage VC activity was mixed during the fourth quarter of 2022, with 1,330 deals closed representing $10.7 billion. Notably, aggregate investment of $68.4 billion through the fourth quarter of 2022 exceeded all pre-2021 full-year figures and total deal count of nearly 5,600 set a new record. This data continues to support a recent trend of larger investors entering companies at earlier stages in the traditional venture lifecycle, which has also resulted in larger median and average valuations. However, given that early-stage companies typically require less capital and have longer holding periods, current market conditions may be less problematic for this segment of the VC market.
2022 was the second most active year for all VC-related activity on record despite sustained macroeconomic and geopolitical headwinds, which may continue to have a meaningful impact over the coming quarters. Groups like nontraditional investors (e.g., crossover funds, sovereign wealth firms, family offices, etc.) that have been heavily involved in late-stage VC activity further reduced their participation in deals during Q4, a trend that may continue. That said, the significant levels of VC fundraising in recent years should serve as a backstop for the entire ecosystem. Along those lines, US VC fundraising set a new annual record in 2022 with $162.6 billion raised, taking the last 24-month total to roughly $316 billion.
VC exit activity for the fourth quarter of 2022 continued to moderate with respect to both count and value. NVCA estimates 281 exits occurred in Q4 2022 representing $5.2 billion in estimated exit value, notably lower than the $14.0 billion estimated for Q3. In aggregate, $71.4 billion in total exit value was generated in 2022, down roughly 90% compared to the $753.2 billion generated in 2021 and falling below $100 billion for the first time since 2016. Roughly half of the exits generated year-to-date involved acquisitions as the IPO market remains relatively frozen. Related, SPAC (special purpose acquisition company) activity is also at a near standstill, as many of the remaining SPACs have hit their two-year maturity and will likely lead to a large percentage deciding to shut down and return capital to investors. However, it is important to note that these exit trends are common during periods of increased market volatility and macroeconomic uncertainty.
While it is possible to see an increase in M&A activity as strategic and private equity buyers look to take advantage of dislocations without much competition from public offerings, increased regulatory scrutiny and rising rates may create more obstacles.
Overall, 2022 was a challenging year for the markets and economy. This was largely driven by a combination of rising inflation, aggressive Fed rate hikes and balance sheet tightening, ongoing labor market and supply chain challenges, increased geopolitical risks stemming from the Russia-Ukraine conflict, ongoing Covid-19 variants, and general concerns around a recession and the
2
THE PRIVATE SHARES FUND
Shareholder Letter (Continued)
impacts these measures may have on corporate growth rates and earnings. During the fourth quarter of 2022, the CBOE Volatility Index (VIX) increased in October but fell to more moderate levels in November and December. While it remains unclear whether there will be a soft or hard landing for the economy, we anticipate these challenges to persist into 2023, but with challenges comes opportunity.
As previously noted, while our portfolio of late-stage VC and growth companies is not immune to what may happen if these challenges persist over a longer time period, we have been pleased it’s overall performance and resiliency thus far and will continue to monitor developments. In our view, we believe the bigger implication will be that companies planning to raise capital may face greater pressure on valuation and terms, and it may take companies longer to exit. We prefer to see our companies remain disciplined, strengthen their balance sheets, right-size their cost structures and continue executing on their strategies in the private market rather than forcing exits and instead pursue liquidity options at a more optimal time.
As long-term investors in private market technology innovation and disruption, we believe the Fund could potentially continue to benefit from value creation across sectors including fintech, artificial intelligence, cyber-security, cloud, data storage and analytics, online education, supply chain optimization, e-commerce, digital health, and the space economy. It is important to acknowledge the record high levels of dry-powder available to support the VC ecosystem and increased maturity of market participants relative to prior cyclical rotations. Furthermore, we are encouraged to see companies reducing their headcount and burn levels and believe this will lead to better efficiency and profitability as they learn to do more with less. To that end, the Fund continued deploying capital during 2022 across existing holdings and new positions in a market environment where dislocations are creating more attractive entry points. We continue to focus on companies that have differentiated business models, are operated by seasoned management teams, backed by strong VCs, and have healthy balance sheets to help manage through market cycles.
Historically, the Fund’s Net Asset Value (NAV) has been relatively stable during periods of public market stress like those in 2016 and 2018, during which we were able to invest in some very strong names at attractive prices. Similarly, the Fund’s NAV has remained relatively stable over the last 12-18 months despite negative impacts by various macro developments, multiple contraction, etc., and we have continued investing throughout this cycle. It is the experience of the PMs that periods of increased volatility and uncertainty in the public equity markets and overall macro environment are often good catalysts for increasing the supply of opportunities in the private markets. In other words, these catalysts may improve supply and demand imbalances in favor of buyers and investors, as owners of illiquid assets tend to become more risk averse and prefer liquidity. These types of environments often result in more attractive risk-adjusted entry points. As a result, vintages involving periods of increased public market activity and macro uncertainty typically also generate outperformance. While this may appear a bit counter- intuitive, these environments could create buying and investing opportunities in the private markets while simultaneously maintaining discipline, relying upon our comprehensive diligence process and leveraging our relationships across the private market ecosystem.
NEW PORTFOLIO ADDITIONS
LOADSMART
With the goal of transforming the future of freight, Loadsmart leverages artificial intelligence, machine learning, and strategic partnerships to automate how freight is priced, booked, and shipped. Pairing advanced technologies with deep-seated industry experience, Loadsmart fuels growth, simplifies operational complexity, and bolsters efficiency for carriers and shippers alike.
COLOR HEALTH
Color is a provider in distributed healthcare and clinical testing. Color makes population-scale healthcare programs accessible, convenient, and cost-effective for everyone. Color works with health systems, employers, and national health initiatives around the world, including the million-person All of Us Research Program by the National Institutes of Health.
3
THE PRIVATE SHARES FUND
Shareholder Letter (Continued)
CONTRAST SECURITY
Contrast Security provides a modern and comprehensive Application Security Platform, removing security roadblock inefficiencies and empowering enterprises to write and release secure application code faster. Embedding code analysis and attack prevention directly into software with instrumentation, the Contrast platform automatically detects vulnerabilities while developers write code, eliminates false positives, and provides context-specific how-to-fix guidance for easy and fast vulnerability remediation. Doing so enables application and development teams to collaborate more effectively and to innovate faster while accelerating digital transformation initiatives. This is why a growing number of the world’s largest private and public sector organizations rely on Contrast to secure their applications in development and extend protection in production.
HYDROW
Hydrow is the Live Outdoor Reality (LOR)™ rower. With workouts led by world-class athletes, including some training for the U.S. National Rowing team, Hydrow delivers a live on-river rowing experience at-home that engages two times more of the body’s muscles than biking or running. Now more than ever, people’s over-scheduled, stressful lives leave little time for meaningful exercise and the soul-enriching opportunity to spend time outdoors. Hydrow’s innovative LOR technology brings balance and peace, while simultaneously delivering a challenging workout that burns up to 400 calories per 20-minute session.
DATABRICKS
Databricks is a data and AI company. More than 5,000 organizations worldwide — including Comcast, Condé Nast, H&M, and over 40% of the Fortune 500 — rely on the Databricks Lakehouse Platform to unify their data, analytics and AI. Databricks is headquartered in San Francisco, with offices around the globe. Founded by the original creators of Apache Spark™, Delta Lake and MLflow, Databricks is on a mission to help data teams solve the world’s toughest problems.
DEVOTED HEALTH
Devoted Health is on a mission to provide simple, seamless, and affordable healthcare. In other words, they want to offer the kind of plans and care they’d want for their own families. They support the health and wellness of their members with guides who help them navigate the healthcare system, by utilizing world-class technology that powers a simplified member experience, and partnerships with trusted providers.
CONSENSYS
ConsenSys is a leading Ethereum software company which enables developers, enterprises, and people worldwide to build next-generation applications, launch modern financial infrastructure, and access the decentralized web. Consensys’ suite of products serves millions of users, supports billions of blockchain-based queries for their clients, and has handled billions of dollars in digital assets. Ethereum is the largest programmable blockchain in the world, leading in business adoption, developer community, and DeFi activity.
XPLORE
Xplore is a provider of commercial space services intended to facilitate the flight of instruments out of earth’s orbit. The company’s services provide hosting of mission-critical payloads, communication relay services and delivery of datasets via its multi-mission spacecraft, serving national space agencies, national security agencies, sovereign space agencies and universities.
4
THE PRIVATE SHARES FUND
Shareholder Letter (Continued)
CEREBRAS SYSTEMS
Cerebras Systems is a team of pioneering computer architects, computer scientists, deep learning researchers, and subject matter experts of all types. They have come together to build a new class of computer system, designed for the singular purpose of accelerating AI and changing the future of AI work forever. The Cerebras CS-2 system, powered by the world’s largest processor – the WSE-2, enables customers to accelerate their deep learning by orders of magnitude over general purpose compute.
CLEARMOTION
ClearMotion builds products enabling a next-generation user experience in vehicles. The company’s proactive suspension and seating systems combine software and hardware to mitigate vehicle movement across uneven road surfaces. ClearMotion was founded out of MIT and has locations in the greater Boston area and Birmingham, UK.
ROOFSTOCK
Roofstock provides a digital real estate investing platform for single-family rental home sector. The company provides resources for investors to buy, manage, and sell investment homes online, including data analytics, property management oversight, and other tools. Roofstock’s marketplace empowers investors to own cash-flowing rental properties, diversify their investment portfolios, and build long-term wealth through real estate.
VOYAGER SPACE
Voyager Space operates a space-focused holding company intended to increase vertical integration and mission capability. Voyager’s long-term mission is to create a vertically integrated NewSpace company capable of delivering any space mission humans can conceive. The company centralizes core shared services and offers an alternative solution to traditional private capital models and replaces them with a longer-term approach as a provider of permanent capital, enabling commercial space companies to focus more on the development of innovative products and solutions.
UPGRADE
Upgrade, Inc. is a financial technology company offering credit, mobile banking and payment products to mainstream consumers. Upgrade has delivered over $12 billion in affordable credit to consumers through credit cards and loans since 2017. The company also offers reward checking accounts with debit cards to its customers.
FLEXPORT
Flexport is a modern freight forwarder. Flexport delivers a combination of advanced technology, physical logistics infrastructure and human expertise, providing fast and predictable transit times, visibility and control, and lower supply chain costs to logistics and supply chain professionals across the globe. First to market with a purpose-built cloud software and data analytics platform, Flexport today connects almost 10,000 clients and suppliers across more than 200 countries, including established global brands as well as emerging innovators. Flexport offers a full range of services, including ocean, air, truck and rail freight, drayage and cartage, warehousing, customs and trade advisory, financing, and insurance.
NANOTRONICS
Nanotronics is an advanced machines and intelligence company that helps customers across the public, private, and nonprofit sectors solve for the unique inspection and process control challenges of precision manufacturing. Deployed across fifteen countries and industry agnostic, Nanotronics works with leading-edge companies, from aerospace, to electronics, to healthcare, to drive up yield, reduce footprint and waste, lower costs, and speed up design iteration, while eliminating laborious manual inspections.
5
THE PRIVATE SHARES FUND
Shareholder Letter (Continued)
EPIC GAMES
Epic Games is a leading developer of gaming software and applications designed for gamers and game developers to publish and play immersive games. The company specializes in game engine developing technology and operates a game store that empowers others to make quality games and 3D content, providing game developers the ability to build high-fidelity, interactive experiences for PC, console, mobile, and virtual reality devices.
NORTHGATE GROWTH FUND III
Northgate Growth Fund III is a special-purpose vehicle that holds an underlying private fund investment.
6
THE PRIVATE SHARES FUND
Fund Performance
December 31, 2022 (Unaudited)
As of December 31, 2022, the Fund’s performance is as follows:
Total Return Information (Unaudited) |
The Private Shares Fund – Class A
(Inception Date: 03/25/2014) | Five
Years | Three
Years | One
Year | Annualized
Since Inception | Cumulative
Since Inception |
Returns based on Purchase Without Any Sales Charge (NAV) | 11.41% | 15.44% | 0.42% | 9.99% | 130.45% |
Returns based on Purchase With Maximum Sales Charge of 5.75% (POP) | 10.10% | 13.18% | -5.35% | 9.25% | 117.20% |
Fund Benchmark | | | | | |
Russell 2000® Index | 4.13% | 3.10% | -20.44% | 6.11% | 68.18% |
The Private Shares Fund – Class I
(Inception Date: 11/17/2017) | Five
Years | Three
Years | One
Year | Annualized
Since Inception | Cumulative
Since Inception |
Returns based on Purchase Without Any Sales Charge (NAV) | 11.69% | 15.72% | 0.70% | 11.80% | 77.00% |
Fund Benchmark | | | | | |
Russell 2000® Index | 4.13% | 3.10% | -20.44% | 4.64% | 26.17% |
The Private Shares Fund – Class L
(Inception Date: 05/11/2018) | Three
Years | One
Year | Annualized
Since Inception | Cumulative
Since Inception |
Returns based on Purchase Without Any Sales Charge (NAV) | 15.13% | 0.16% | 10.73% | 60.47% |
Returns based on Purchase With Maximum Sales Charge of 4.25% (POP) | 13.48% | -4.08% | 9.70% | 53.65% |
Fund Benchmark | | | | |
Russell 2000® Index | 3.10% | -20.44% | 3.35% | 16.52% |
Performance data quoted represents past performance and is no guarantee of future results. Public offering price (“POP”) performance assumes a maximum sales load of 5.75% (Class A) and 4.25% (Class L) on all sales. Investment return and principal value will fluctuate so that an investor’s shares, when redeemed, may be worth more or less than original cost. Current performance may be lower or higher than the performance data quoted. For performance as of the most recent month-end, please call 1-855-551-5510. Some of the Fund’s fees were waived or expenses reimbursed; otherwise, returns would have been lower. The Fund’s total annual expenses per the currently stated prospectus are 2.37% (Class A), 2.32% (Class I), and 2.60% (Class L). The Fund’s total net expenses are 2.53% (Class A), 2.28% (Class I), and 2.78% (Class L). Liberty Street Advisors, Inc. (the “Investment Adviser”) has contractually agreed to waive fees and/or reimburse (excluding taxes, interest, brokerage commissions, acquired fund fees and expenses, and extraordinary expenses) expenses such that the total expenses do not exceed 2.50% (Class A), 2.25% (Class I), and 2.75% (Class L) through May 2, 2023. Net expenses are applicable to investors.
7
THE PRIVATE SHARES FUND
Fund Performance (Continued)
December 31, 2022 (Unaudited)
DISCLOSURES
As of December 9, 2020, Liberty Street Advisors, Inc. became the adviser to the Fund. The Fund’s portfolio managers did not change. Effective April 30, 2021, the Fund changed its name from the “SharesPost 100 Fund” to “The Private Shares Fund.” Effective July 7, 2021, the Fund made changes to its investment strategy. In addition to directly investing in private companies, the Fund may also invest in private investments in public equity (“PIPEs”) where the issuer is a special purpose acquisition company (“SPAC”), and profit sharing agreements. The Fund’s investment thesis has not changed.
Investment in the Fund involves substantial risk. The Fund is not suitable for investors who cannot bear the risk of loss of all or part of their investment. The Fund is appropriate only for investors who can tolerate a high degree of risk and do not require a liquid investment. All investing involves risk including the possible loss of principal. Shares in the Fund are highly illiquid, and can be sold by shareholders only in the quarterly repurchase program of the Fund which allows for up to 5% of the Fund’s outstanding shares at NAV to be redeemed each quarter. Due to transfer restrictions and the illiquid nature of the Fund’s investments, you may not be able to sell your shares when, or in the amount that, you desire. The Fund intends to primarily invest in securities of private, late-stage, venture-backed growth companies. There are significant potential risks relating to investing in such securities. Because most of the securities in which the Fund invests are not publicly traded, the Fund’s investments will be valued by Liberty Street Advisors, Inc. (the “Investment Adviser”) as Valuation Designee pursuant to fair valuation procedures and methodologies approved by the Board of Trustees, as set forth in the prospectus. As a consequence, the value of the securities, and therefore the Fund’s Net Asset Value (NAV), may vary. There are significant potential risks associated with investing in venture capital and private equity-backed companies with complex capital structures. The Fund focuses its investments in a limited number of securities, which could subject it to greater risk than that of a larger, more varied portfolio. There is a greater focus in technology securities that could adversely affect the Fund’s performance. The Fund’s quarterly repurchase policy may require the Fund to liquidate portfolio holdings earlier than the Investment Adviser would otherwise do so and may also result in an increase in the Fund’s expense ratio. Portfolio holdings of private companies that become publicly traded likely will be subject to more volatile market fluctuations than when private, and the Fund may not be able to sell shares at favorable prices. Such companies frequently impose lock-ups that would prohibit the Fund from selling shares for a period of time after an initial public offering (IPO). Market prices of public securities held by the Fund may decline substantially before the Investment Adviser is able to sell the securities. The Fund may invest in private securities utilizing special purpose vehicles (“SPV”s), venture capital funds and other funds that invest in private companies and rely on exclusions from the 1940 Act under section 3(c)(1) or 3(c)(7) (“Private Funds”), private investments in public equity (“PIPE”) transactions where the issuer is a special purpose acquisition company (“SPAC”), and profit sharing agreements. The Fund will bear its pro rata portion of expenses on investments in SPVs and Private Funds and will have no direct claim against underlying portfolio companies. The Fund’s investments in Private Funds subject it to the risks associated with direct ownership of the securities in which the underlying funds invest, as well as additional risks specific to the Private Funds, including operational risk, legal and indemnification risks, and lock-ups and other restrictions on withdrawal. PIPE transactions involve price risk, market risk, expense risk, and the Fund may not be able to sell the securities due to lock-ups or restrictions. Profit sharing agreements may expose the Fund to certain risks, including that the agreements could reduce the gain the Fund otherwise would have achieved on its investment, may be difficult to value and may result in contractual disputes. Certain conflicts of interest involving the Fund and its affiliates could impact the Fund’s investment returns and limit the flexibility of its investment policies. This is not a complete enumeration of the Fund’s risks. Please read the Fund prospectus for other risk factors related to the Fund.
The Fund may not be suitable for all investors. We encourage you to consult with appropriate financial professionals before considering an investment in the Fund.
The Russell 2000 is an index measuring the performance of approximately 2,000 smallest-cap American companies in the Russell 3000 Index, which is made up of 3,000 of the largest U.S. stocks. It is a market-cap weighted index. CBOE Volatility Index measures the stock market’s expectation of volatility based on S&P 500 index options. One cannot invest in an index. A Special Purpose Acquisition Company (SPAC) is a company that has no commercial operations and is formed strictly to raise capital through an initial public offering (IPO) for the purpose of acquiring or merging with an existing company.
8
THE PRIVATE SHARES FUND
Fund Performance (Continued)
December 31, 2022 (Unaudited)
The views expressed in this material reflect those of the Fund’s Investment Advisor as of the date this is written and may not reflect its views on the date this material is first published or anytime thereafter. These views are intended to assist in understanding the Fund’s investment methodology and do not constitute investment advice. This material may contain discussions about investments that may or may not be held by the Fund. All current and future holdings are subject to risk and to change.
The Fund is distributed by Foreside Fund Services, LLC
IMPORTANT DISCLOSURE
All investing involves risk including the possible loss of principal. Shares in the Fund are highly illiquid, and you may not be able to sell your shares when, or in the amount that, you desire. The Fund intends to primarily invest in securities of private, late-stage, venture-backed growth companies. There are significant potential risks relating to investing in such securities. Because most of the securities in which the Fund invests are not publicly traded, the Fund’s investments will be valued by the Investment Adviser, as Valuation Designee, pursuant to fair valuation procedures and methodologies approved by the Board of Trustees.
There are significant potential risks associated with investing in venture capital and private equity-backed companies with complex capital structures. The Fund focuses its investments on a limited number of securities, which could subject it to greater risk than that of a larger, more varied portfolio. There is a greater focus in technology securities which could adversely affect the Fund’s performance. The inclusion of various indices is for comparison purposes only. The performance of an index is not an exact representation of any particular investment, as you cannot invest directly in an index.
The Fund’s quarterly repurchase policy may require the Fund to liquidate portfolio holdings earlier than the Investment Adviser would otherwise do so, and may also result in an increase in the Fund’s expense ratio. This is not a complete enumeration of the Fund’s risks. Please read the Fund prospectus for other risk factors related to the Fund, its investment strategy and your investment in the Fund, and other additional details.
Holdings subject to change. Not a recommendation to buy, sell, or hold any specific security.
9
THE PRIVATE SHARES FUND
Fund Performance & Portfolio Diversification
December 31, 2022 (Unaudited)
Growth of $10,000 Investment
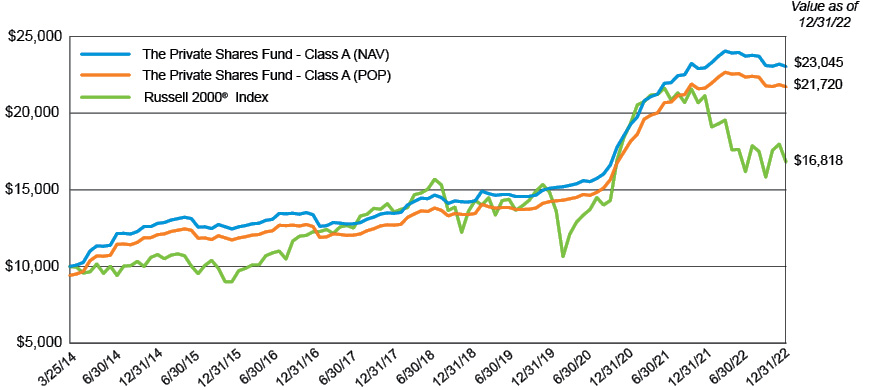
This graph illustrates the hypothetical investment of $10,000 in the Class A from March 25, 2014 (Class inception) to December 31, 2022. The Total Return Information table and Growth of $10,000 Investment graph do not reflect the deduction of taxes that a shareholder would pay on fund distributions or the redemption of fund shares. The Public Offering Price (“POP”) assumes an initial investment of $9,425 ($10,000 less the maximum sales load of 5.75%). The Net Asset Value (“NAV”) assumes no sales load.
Fund Sector Diversification
The following chart provides a visual breakdown of the Fund, by the industry sectors that the underlying securities represent, as a percentage of the total investments.

10
THE PRIVATE SHARES FUND
Portfolio Composition
December 31, 2022 (Unaudited)
Fund Holdings
11
THE PRIVATE SHARES FUND
Portfolio Composition (Continued)
December 31, 2022 (Unaudited)
Fund Holdings (Continued)

12
THE PRIVATE SHARES FUND
Schedule of Investments
December 31, 2022
| | Acquisition
Date | | Shares | | | Cost | | | Fair Value | |
COMMON STOCK IN PUBLIC COMPANIES(a) — 1.0% | | | | | | | | | | | | |
3D PRINTING — 0.1% | | | | | | | | | | | | | |
Fathom Digital Manufacturing, Corp. | Dec 2021 | | | 263,646 | | | $ | 2,636,460 | | | $ | 348,013 | |
| | | | | | | | | | | | | | |
CONSUMER WEB — 0.3% | | | | | | | | | | | | | |
Nextdoor Holding, Inc. | Nov 2018 | | | 925,479 | | | | 5,037,326 | | | | 1,906,487 | |
Wag Labs, Inc.(b) | Oct 2018 | | | 426,552 | | | | 2,314,001 | | | | 1,300,983 | |
| | | | | | | | 7,351,327 | | | | 3,207,470 | |
EDUCATION — 0.2% | | | | | | | | | | | | | |
Udemy, Inc. | Aug 2019 | | | 163,448 | | | | 1,648,103 | | | | 1,724,376 | |
| | | | | | | | | | | | | | |
FINANCE/PAYMENTS — 0.1% | | | | | | | | | | | | | |
Marqeta, Inc. | Jul 2018 | | | 194,514 | | | | 227,581 | | | | 1,188,481 | |
| | | | | | | | | | | | | | |
HARDWARE — 0.0% | | | | | | | | | | | | | |
Tempo Automation, Inc. | Aug 2019 | | | 93,787 | | | | 1,868,000 | | | | 72,216 | |
| | | | | | | | | | | | | | |
HEALTHCARE/BIOTECH — 0.2% | | | | | | | | | | | | | |
23andMe Holding Co. | Oct 2017 | | | 724,260 | | | | 4,436,112 | | | | 1,564,402 | |
| | | | | | | | | | | | | | |
SOFTWARE — 0.1% | | | | | | | | | | | | | |
SoundHound AI, Inc. | Sep 2016 | | | 736,112 | | | | 3,200,767 | | | | 1,302,918 | |
TOTAL COMMON STOCK IN PUBLIC COMPANIES | | | | | | | | 21,368,350 | | | | 9,407,876 | |
| | | | | | | | | | | | | |
COMMON STOCK IN PRIVATE COMPANIES(a),(b) — 39.3% | | | | | | | | | | | | |
3D PRINTING — 0.3% | | | | | | | | | | | | | |
Carbon, Inc. | Jun 2019 | | | 158,853 | | | | 2,125,214 | | | | 3,569,427 | |
| | | | | | | | | | | | | | |
ADVERTISING — 2.6% | | | | | | | | | | | | | |
GroundTruth, Inc. | Oct 2016 | | | 1,659,427 | | | | 446,424 | | | | 381,668 | |
NextRoll, Inc. | Mar 2017 | | | 2,367,054 | | | | 16,079,048 | | | | 22,131,955 | |
OpenX Software, Ltd. | Jun 2015 | | | 2,899,297 | | | | 2,615,386 | | | | 2,145,480 | |
WideOrbit, Inc. | Oct 2015 | | | 400,000 | | | | 1,100,000 | | | | 948,000 | |
| | | | | | | | 20,240,858 | | | | 25,607,103 | |
AEROSPACE — 5.3% | | | | | | | | | | | | | |
Axiom Space, Inc. | Mar 2021 | | | 29,543 | | | | 5,099,983 | | | | 4,990,699 | |
Relativity Space, Inc. | Oct 2021 | | | 437,922 | | | | 9,999,993 | | | | 9,835,728 | |
Space Exploration Technologies Corp. | May 2019 | | | 490,200 | | | | 10,049,100 | | | | 37,402,260 | |
| | | | | | | | 25,149,076 | | | | 52,228,687 | |
AGTECH — 0.5% | | | | | | | | | | | | | |
Farmer’s Business Network, Inc. | Sep 2021 | | | 87,500 | | | | 5,042,625 | | | | 5,337,500 | |
See accompanying Notes to the Financial Statements
13
THE PRIVATE SHARES FUND
Schedule of Investments (Continued)
December 31, 2022
| | | Acquisition
Date | | | Shares | | | Cost | | | Fair Value | |
COMMON STOCK IN PRIVATE COMPANIES(a),(b) — 39.3% (Continued) | | | | | | | | | | | | |
ANALYTICS/BIG DATA — 4.6% | | | | | | | | | | | | | | | | |
Baktus, Inc. | | | Apr 2015 | | | | 10,795 | | | $ | 1,500,951 | | | $ | 22,669 | |
Dataminr, Inc. | | | Sep 2015 | | | | 500,083 | | | | 5,671,336 | | | | 14,402,390 | |
Domino Data Lab, Inc. | | | Apr 2021 | | | | 330,000 | | | | 4,118,400 | | | | 5,134,800 | |
Dremio Corp.(c) | | | Dec 2021 | | | | 166,664 | | | | 1,018,383 | | | | 1,369,978 | |
INRIX, Inc. | | | May 2014 | | | | 133,238 | | | | 3,026,249 | | | | 6,200,630 | |
SingleStore, Inc. | | | May 2020 | | | | 2,148,366 | | | | 10,359,604 | | | | 13,792,510 | |
Tealium, Inc. | | | Sep 2020 | | | | 200,000 | | | | 1,300,000 | | | | 2,372,000 | |
ThoughtSpot, Inc. | | | Oct 2018 | | | | 162,087 | | | | 1,745,759 | | | | 1,998,533 | |
| | | | | | | | | | | 28,740,682 | | | | 45,293,510 | |
ARTIFICIAL INTELLIGENCE — 3.0% | | | | | | | | | | | | | | | | |
Brain Corp. | | | Dec 2020 | | | | 2,375,000 | | | | 9,540,000 | | | | 10,283,750 | |
Cerebras Systems, Inc. | | | Feb 2022 | | | | 309,813 | | | | 6,946,627 | | | | 6,648,587 | |
Nanotronics Imaging, Inc. | | | Aug 2022 | | | | 76,504 | | | | 7,803,408 | | | | 12,408,184 | |
| | | | | | | | | | | 24,290,035 | | | | 29,340,521 | |
CLEAN TECHNOLOGY — 0.0% | | | | | | | | | | | | | | | | |
WiTricity Holdings, Inc.(c) | | | Mar 2021 | | | | 166,667 | | | | 1,667 | | | | 500,001 | |
| | | | | | | | | | | | | | | | | |
E-COMMERCE — 0.6% | | | | | | | | | | | | | | | | |
1661, Inc. (d.b.a. GOAT)(c) | | | Sep 2021 | | | | 128,148 | | | | 760,724 | | | | 658,681 | |
CaaStle, Inc. | | | Mar 2022 | | | | 859,884 | | | | 2,742,746 | | | | 5,107,711 | |
| | | | | | | | | | | 3,503,470 | | | | 5,766,392 | |
EDUCATION — 1.7% | | | | | | | | | | | | | | | | |
Eruditus Learning Solutions Pte., Ltd.(c) | | | Aug 2021 | | | | 36,264 | | | | 5,092,426 | | | | 4,969,619 | |
Learneo, Inc. (f.k.a. Course Hero, Inc.) | | | Jun 2020 | | | | 270,000 | | | | 3,429,200 | | | | 9,379,800 | |
Udacity, Inc. | | | Nov 2018 | | | | 448,075 | | | | 2,884,586 | | | | 2,258,298 | |
| | | | | | | | | | | 11,406,212 | | | | 16,607,717 | |
ENTERPRISE SOFTWARE — 3.0% | | | | | | | | | | | | | | | | |
Algolia, Inc. | | | Jan 2020 | | | | 45,000 | | | | 420,000 | | | | 1,197,000 | |
Automation Anywhere, Inc. | | | Jul 2021 | | | | 189,449 | | | | 4,019,940 | | | | 2,286,649 | |
D2iQ, Inc. | | | Feb 2019 | | | | 165,000 | | | | 1,605,450 | | | | 270,600 | |
Docker, Inc. | | | May 2017 | | | | 2,500 | | | | 531,250 | | | | 74,150 | |
EquipmentShare.com, Inc. | | | Oct 2021 | | | | 694,800 | | | | 9,985,874 | | | | 10,755,504 | |
Motive Technologies, Inc. (f.k.a. Keep Truckin, Inc.) | | | May 2019 | | | | 788,562 | | | | 3,420,734 | | | | 6,253,297 | |
Tebra Technologies, Inc. (f.k.a. Kareo, Inc.) | | | Nov 2020 | | | | 190,007 | | | | 1,235,126 | | | | 1,540,805 | |
Trax, Ltd. | | | Mar 2020 | | | | 149,970 | | | | 5,100,000 | | | | 7,889,922 | |
| | | | | | | | | | | 26,318,374 | | | | 30,267,927 | |
See accompanying Notes to the Financial Statements
14
THE PRIVATE SHARES FUND
Schedule of Investments (Continued)
December 31, 2022
| | | Acquisition
Date | | | Shares | | | Cost | | | Fair Value | |
COMMON STOCK IN PRIVATE COMPANIES(a),(b) — 39.3% (Continued) | | | | | | | | | | | | |
FINANCE/PAYMENTS — 4.3% | | | | | | | | | | | | | | | | |
Betterment Holdings, Inc. | | | Mar 2021 | | | | 1,457,800 | | | $ | 14,999,995 | | | $ | 17,653,958 | |
Circle Internet Financial, Ltd. | | | Apr 2018 | | | | 290,200 | | | | 2,604,825 | | | | 14,155,956 | |
ConsenSys Software, Inc. | | | May 2022 | | | | 31,010 | | | | 3,703,824 | | | | 4,134,563 | |
Payward, Inc. (d.b.a. Kraken) | | | Jun 2021 | | | | 105,218 | | | | 5,079,228 | | | | 3,088,148 | |
Prosper Marketplace, Inc. | | | Jan 2016 | | | | 244,130 | | | | 1,307,998 | | | | 178,215 | |
Upgrade, Inc. | | | Apr 2022 | | | | 661,053 | | | | 2,900,002 | | | | 3,602,739 | |
| | | | | | | | | | | 30,595,872 | | | | 42,813,579 | |
FOODTECH — 0.6% | | | | | | | | | | | | | | | | |
Impossible Foods, Inc. | | | Oct 2022 | | | | 299,056 | | | | 3,050,371 | | | | 5,966,167 | |
| | | | | | | | | | | | | | | | | |
GAMES — 1.1% | | | | | | | | | | | | | | | | |
Epic Games | | | Nov 2022 | | | | 11,774 | | | | 7,650,039 | | | | 10,551,623 | |
| | | | | | | | | | | | | | | | | |
HEALTHCARE/BIOTECH — 2.8% | | | | | | | | | | | | | | | | |
Click Therapeutics, Inc. | | | Nov 2020 | | | | 1,000,000 | | | | 3,500,000 | | | | 3,250,000 | |
Color Health, Inc. | | | Feb 2022 | | | | 139,486 | | | | 10,039,927 | | | | 13,944,416 | |
Devoted Health, Inc. | | | Aug 2022 | | | | 177,776 | | | | 9,999,953 | | | | 9,999,900 | |
ZocDoc, Inc. | | | Feb 2015 | | | | 61,016 | | | | 1,321,708 | | | | 881,681 | |
| | | | | | | | | | | 24,861,588 | | | | 28,075,997 | |
HOSTING/STORAGE — 0.4% | | | | | | | | | | | | | | | | |
Rubrik, Inc. | | | Sep 2019 | | | | 126,281 | | | | 3,220,166 | | | | 3,718,975 | |
| | | | | | | | | | | | | | | | | |
SECURITY — 4.9% | | | | | | | | | | | | | | | | |
Arctic Wolf Networks, Inc. | | | Dec 2021 | | | | 1,747,151 | | | | 17,915,660 | | | | 16,265,976 | |
Code42 Software, Inc. | | | May 2016 | | | | 330,000 | | | | 754,500 | | | | 990,000 | |
Contrast Security, Inc. | | | Sep 2022 | | | | 31,250 | | | | 255,000 | | | | 430,625 | |
Exabeam, Inc. | | | Jul 2021 | | | | 54,500 | | | | 1,590,855 | | | | 1,367,405 | |
Lookout, Inc. | | | Jul 2022 | | | | 1,869,160 | | | | 10,000,006 | | | | 19,962,629 | |
Malwarebytes, Inc. | | | Dec 2019 | | | | 188,173 | | | | 1,129,038 | | | | 2,732,272 | |
Tanium, Inc. | | | Apr 2019 | | | | 640,000 | | | | 4,787,200 | | | | 6,508,800 | |
| | | | | | | | | | | 36,432,259 | | | | 48,257,707 | |
SOFTWARE — 2.8% | | | | | | | | | | | | | | | | |
Discord, Inc.(c) | | | Dec 2021 | | | | 45,694 | | | | 18,267,788 | | | | 21,680,432 | |
Mynd Management, Inc. | | | Dec 2021 | | | | 340,202 | | | | 6,130,637 | | | | 6,007,967 | |
| | | | | | | | | | | 24,398,425 | | | | 27,688,399 | |
TRANSPORTATION — 0.8% | | | | | | | | | | | | | | | | |
Flexport, Inc. | | | Jul 2022 | | | | 538,387 | | | | 7,260,075 | | | | 7,537,418 | |
TOTAL COMMON STOCK IN PRIVATE COMPANIES | | | | | | | | | | | 284,287,008 | | | | 389,128,650 | |
| | | | | | | | | | | | | | | | |
PREFERRED STOCK IN PRIVATE COMPANIES (a),(b) — 39.1% | | | | | | | | | | | | | | | | |
ADVERTISING — 0.0% | | | | | | | | | | | | | | | | |
GroundTruth, Inc., Preferred Series B-1 | | | Jan 2017 | | | | 600,000 | | | | 149,200 | | | | 138,000 | |
See accompanying Notes to the Financial Statements
15
THE PRIVATE SHARES FUND
Schedule of Investments (Continued)
December 31, 2022
| | | Acquisition
Date | | | Shares | | | Cost | | | Fair Value | |
PREFERRED STOCK IN PRIVATE COMPANIES(a),(b) — 39.1% (Continued) | | | | | | | | | | | | |
AEROSPACE — 3.5% | | | | | | | | | | | | | | | | |
Axiom Space, Inc., Preferred Series B | | | Dec 2020 | | | | 32,221 | | | $ | 2,019,958 | | | $ | 5,443,094 | |
Beta Technologies, Inc., Preferred Series A | | | Apr 2021 | | | | 40,944 | | | | 2,999,967 | | | | 4,215,185 | |
Beta Technologies, Inc., Preferred Series B | | | Apr 2022 | | | | 58,156 | | | | 5,999,954 | | | | 5,994,139 | |
Radian Aerospace, Inc., Preferred Series Seed 2 | | | Sep 2021 | | | | 607,336 | | | | 1,999,997 | | | | 1,998,135 | |
Relativity Space, Inc., Preferred Series E | | | Jul 2021 | | | | 437,922 | | | | 10,299,992 | | | | 9,923,312 | |
Voyager Space Holdings, Inc., Preferred Series B | | | Mar 2022 | | | | 192,061 | | | | 7,499,982 | | | | 7,499,982 | |
| | | | | | | | | | | 30,819,850 | | | | 35,073,847 | |
AGTECH — 1.8% | | | | | | | | | | | | | | | | |
CIBO Technologies, Inc., Preferred Series C(c) | | | Aug 2021 | | | | 600,000 | | | | 3,090,000 | | | | 2,928,000 | |
Farmer’s Business Network, Inc., Preferred Series G | | | Sep 2021 | | | | 160,880 | | | | 10,199,946 | | | | 9,910,208 | |
Invaio Sciences, Inc., Preferred Series C(c) | | | Mar 2021 | | | | 1,061,390 | | | | 5,150,000 | | | | 5,264,494 | |
| | | | | | | | | | | 18,439,946 | | | | 18,102,702 | |
ANALYTICS/BIG DATA — 3.0% | | | | | | | | | | | | | | | | |
Databricks, Inc., Preferred Series G(c) | | | Jul 2022 | | | | 182,664 | | | | 10,799,704 | | | | 11,608,297 | |
Dataminr, Inc., Preferred Series A | | | Apr 2019 | | | | 20,000 | | | | 198,000 | | | | 576,000 | |
Dataminr, Inc., Preferred Series B | | | Apr 2019 | | | | 87,496 | | | | 866,211 | | | | 2,519,885 | |
Dremio Corp., Preferred Series E(c) | | | Dec 2021 | | | | 469,594 | | | | 4,070,000 | | | | 3,930,502 | |
Heap, Inc., Preferred Series C | | | May 2019 | | | | 1,361,503 | | | | 4,999,997 | | | | 10,783,104 | |
Heap, Inc., Preferred Series D | | | Nov 2021 | | | | 84,047 | | | | 711,170 | | | | 689,185 | |
| | | | | | | | | | | 21,645,082 | | | | 30,106,973 | |
ARTIFICIAL INTELLIGENCE — 2.7% | | | | | | | | | | | | | | | | |
Nanotronics Imaging, Inc., Preferred Series F-2 | | | Apr 2022 | | | | 90,888 | | | | 15,300,066 | | | | 14,873,821 | |
VerbIT, Inc., Preferred Series A | | | Nov 2021 | | | | 47,640 | | | | 693,256 | | | | 663,953 | |
VerbIT, Inc., Preferred Series B | | | Nov 2021 | | | | 288,180 | | | | 4,194,173 | | | | 4,016,333 | |
VerbIT, Inc., Preferred Series E-1 | | | Nov 2021 | | | | 423,720 | | | | 6,166,668 | | | | 6,041,226 | |
VerbIT, Inc., Preferred Series Seed 2 | | | Nov 2021 | | | | 65,000 | | | | 945,904 | | | | 905,898 | |
| | | | | | | | | | | 27,300,067 | | | | 26,501,231 | |
CLEAN TECHNOLOGY — 0.4% | | | | | | | | | | | | | | | | |
WiTricity Holdings, Inc., Preferred Series A | | | Oct 2020 | | | | 1,000,000 | | | | 1,020,000 | | | | 3,000,000 | |
WiTricity Holdings, Inc., Preferred Series B | | | Jun 2022 | | | | 333,253 | | | | 999,999 | | | | 999,759 | |
| | | | | | | | | | | 2,019,999 | | | | 3,999,759 | |
CONSUMER WEB — 0.0% | | | | | | | | | | | | | | | | |
Trusper, Inc. (d.b.a. Musely), Preferred Series B | | | Oct 2014 | | | | 7,961 | | | | 100,012 | | | | 124,749 | |
See accompanying Notes to the Financial Statements
16
THE PRIVATE SHARES FUND
Schedule of Investments (Continued)
December 31, 2022
| | | Acquisition
Date | | | Shares | | | Cost | | | Fair Value | |
PREFERRED STOCK IN PRIVATE COMPANIES(a),(b) — 39.1% (Continued) | | | | | | | | | | | | |
E-COMMERCE — 5.8% | | | | | | | | | | | | | | | | |
1661, Inc. (d.b.a. GOAT), Preferred Series A-1(c) | | | Sep 2021 | | | | 112,563 | | | $ | 668,206 | | | $ | 578,574 | |
1661, Inc. (d.b.a. GOAT), Preferred Series A-5(c) | | | Sep 2021 | | | | 2,394 | | | | 14,211 | | | | 12,305 | |
1661, Inc. (d.b.a. GOAT), Preferred Series A-7(c) | | | Sep 2021 | | | | 146,495 | | | | 869,637 | | | | 752,984 | |
1661, Inc. (d.b.a. GOAT), Preferred Series B(c) | | | Sep 2021 | | | | 231,687 | | | | 1,375,362 | | | | 1,190,871 | |
1661, Inc. (d.b.a. GOAT), Preferred Series C(c) | | | Sep 2021 | | | | 237,913 | | | | 1,412,322 | | | | 1,222,873 | |
CaaStle, Inc., Preferred Series A-12 | | | Dec 2021 | | | | 1,740,786 | | | | 8,050,124 | | | | 10,583,979 | |
GrubMarket, Inc., Preferred Series D | | | Oct 2020 | | | | 440,742 | | | | 1,999,999 | | | | 6,318,653 | |
GrubMarket, Inc., Preferred Series E | | | Jun 2021 | | | | 1,520,838 | | | | 14,999,995 | | | | 21,803,342 | |
GrubMarket, Inc., Preferred Series F | | | Feb 2022 | | | | 697,526 | | | | 9,999,982 | | | | 10,000,012 | |
Lyst, Ltd., Preferred Series E | | | Jul 2021 | | | | 401,929 | | | | 5,172,500 | | | | 4,598,068 | |
| | | | | | | | | | | 44,562,338 | | | | 57,061,661 | |
EDUCATION — 0.6% | | | | | | | | | | | | | | | | |
Yanka Industries, Inc. (d.b.a. MasterClass), Preferred Series Seed 1 | | | Jul 2021 | | | | 193,100 | | | | 6,146,189 | | | | 5,590,245 | |
| | | | | | | | | | | | | | | | | |
ENTERPRISE SOFTWARE — 4.1% | | | | | | | | | | | | | | | | |
Checkr, Inc., Preferred Series A-1 | | | Mar 2020 | | | | 150,000 | | | | 1,405,000 | | | | 2,751,000 | |
Cohere Technologies, Inc., Preferred Series D-1 | | | Feb 2022 | | | | 279,571 | | | | 1,999,995 | | | | 1,909,470 | |
Cohere Technologies, Inc., Preferred Series D-2 | | | Dec 2020 | | | | 386,038 | | | | 2,071,233 | | | | 2,501,526 | |
EquipmentShare.com, Inc., Preferred Series E | | | May 2022 | | | | 323,064 | | | | 4,999,997 | | | | 5,001,031 | |
Motive Technologies, Inc. (f.k.a. Keep Truckin, Inc.), Preferred Series E | | | May 2021 | | | | 638,843 | | | | 4,599,996 | | | | 5,066,025 | |
Motive Technologies, Inc. (f.k.a. Keep Truckin, Inc.), Preferred Series F | | | Jun 2022 | | | | 1,923,076 | | | | 14,999,993 | | | | 15,249,993 | |
Ocrolus, Inc., Preferred Series C(c) | | | Aug 2021 | | | | 438,327 | | | | 3,062,500 | | | | 2,629,962 | |
Tebra Technologies, Inc. (f.k.a. Kareo, Inc.), Preferred Series Seed 2 | | | Nov 2020 | | | | 123,819 | | | | 804,870 | | | | 1,004,073 | |
Trax, Ltd., Pre IPO | | | Mar 2021 | | | | 76,722 | | | | 3,999,978 | | | | 4,036,344 | |
| | | | | | | | | | | 37,943,562 | | | | 40,149,424 | |
FINANCE/PAYMENTS — 5.3% | | | | | | | | | | | | | | | | |
Betterment Holdings, Inc., Preferred Series F | | | Sep 2021 | | | | 318,380 | | | | 3,999,999 | | | | 3,928,809 | |
ConsenSys Software, Inc., Preferred Series D(c) | | | Feb 2022 | | | | 35,699 | | | | 5,075,000 | | | | 4,886,122 | |
Fundbox, Ltd., Preferred Series C | | | Jun 2019 | | | | 439,552 | | | | 4,999,992 | | | | 6,197,683 | |
Fundbox, Ltd., Preferred Series D | | | Sep 2021 | | | | 531,914 | | | | 7,499,988 | | | | 7,499,988 | |
Payward, Inc. (d.b.a. Kraken), Preferred Series A | | | Nov 2021 | | | | 262,210 | | | | 13,768,164 | | | | 7,695,864 | |
Payward, Inc. (d.b.a. Kraken), Preferred Series Seed | | | Apr 2022 | | | | 67,000 | | | | 3,505,340 | | | | 1,966,450 | |
Prosper Marketplace, Inc., Preferred Series A | | | Jan 2016 | | | | 55,395 | | | | 305,781 | | | | 40,438 | |
Prosper Marketplace, Inc., Preferred Series A-1 | | | Jan 2016 | | | | 58,165 | | | | 116 | | | | 86,666 | |
Ripple Labs, Inc., Preferred Series A | | | Dec 2018 | | | | 42,000 | | | | 504,000 | | | | 2,367,540 | |
Upgrade, Inc., Preferred Series C-1 | | | Mar 2022 | | | | 3,290,000 | | | | 14,159,000 | | | | 17,930,500 | |
| | | | | | | | | | | 53,817,380 | | | | 52,600,060 | |
See accompanying Notes to the Financial Statements
17
THE PRIVATE SHARES FUND
Schedule of Investments (Continued)
December 31, 2022
| | | Acquisition
Date | | | Shares/
Principal | | | Cost | | | Fair Value | |
PREFERRED STOCK IN PRIVATE COMPANIES(a),(b) — 39.1% (Continued) | | | | | | | | | | | | |
FOODTECH — 1.3% | | | | | | | | | | | | | | | | |
Impossible Foods, Inc., Preferred Series E-1 | | | Nov 2022 | | | | 400,000 | | | $ | 4,080,000 | | | $ | 7,980,000 | |
Impossible Foods, Inc., Preferred Series H-1(c) | | | Nov 2021 | | | | 153,494 | | | | 3,746,778 | | | | 3,398,357 | |
Impossible Foods, Inc., Preferred Series H-2(c) | | | Nov 2021 | | | | 53,389 | | | | 1,303,222 | | | | 1,182,033 | |
| | | | | | | | | | | 9,130,000 | | | | 12,560,390 | |
HARDWARE — 0.3% | | | | | | | | | | | | | | | | |
Hydrow, Inc., Preferred Series D | | | Feb 2022 | | | | 435,304 | | | | 4,999,989 | | | | 2,612,520 | |
| | | | | | | | | | | | | | | | | |
HEALTHCARE/BIOTECH — 2.1% | | | | | | | | | | | | | | | | |
Click Therapeutics, Inc., Preferred Series A | | | Nov 2020 | | | | 60,087 | | | | 210,304 | | | | 195,283 | |
Collective Health, Inc., Preferred Series F | | | May 2021 | | | | 3,989,361 | | | | 3,120,000 | | | | 2,672,872 | |
Crossover Health Management Services, Inc., Preferred Series D | | | Mar 2021 | | | | 239,125 | | | | 8,503,127 | | | | 9,978,686 | |
Omada Health, Inc., Preferred Series E | | | Dec 2021 | | | | 1,334,400 | | | | 7,999,995 | | | | 7,752,864 | |
ZocDoc, Inc., Preferred Series A | | | Feb 2015 | | | | 35,000 | | | | 875,000 | | | | 505,750 | |
| | | | | | | | | | | 20,708,426 | | | | 21,105,455 | |
SECURITY — 3.9% | | | | | | | | | | | | | | | | |
Contrast Security, Inc., Preferred Series A | | | Jul 2022 | | | | 828,514 | | | | 10,300,003 | | | | 11,416,923 | |
Contrast Security, Inc., Preferred Series C | | | Nov 2022 | | | | 1,164,596 | | | | 7,649,998 | | | | 16,048,133 | |
Cybereason, Inc., Preferred Series F(c) | | | Jul 2021 | | | | 1,510,600 | | | | 7,631,457 | | | | 7,250,880 | |
Exabeam, Preferred Series A | | | Nov 2020 | | | | 80,000 | | | | 1,020,000 | | | | 2,007,200 | |
Lookout, Inc., Preferred Series A | | | Feb 2015 | | | | 204,000 | | | | 1,927,800 | | | | 2,178,720 | |
| | | | | | | | | | | 28,529,258 | | | | 38,901,856 | |
SOFTWARE — 1.0% | | | | | | | | | | | | | | | | |
Roofstock, Inc., Preferred Series E | | | Mar 2022 | | | | 339,154 | | | | 9,999,990 | | | | 9,482,746 | |
| | | | | | | | | | | | | | | | | |
TRANSPORTATION — 3.3% | | | | | | | | | | | | | | | | |
Clearmotion, Inc., Preferred Series A-4 | | | Mar 2022 | | | | 12,954,589 | | | | 908,932 | | | | 1,562,324 | |
Flexport, Inc., Preferred Series A | | | Jun 2022 | | | | 580,165 | | | | 8,489,030 | | | | 8,122,310 | |
Flexport, Inc., Preferred Series B-1 | | | Jul 2022 | | | | 69,790 | | | | 944,665 | | | | 977,060 | |
Flexport, Inc., Preferred Series D-3 | | | Jul 2022 | | | | 82,613 | | | | 1,117,776 | | | | 1,156,582 | |
Hyperloop Technologies, Inc., Preferred Series B-1 | | | Jun 2017 | | | | 1,381 | | | | 999,999 | | | | 4,920 | |
Hyperloop Technologies, Inc., Preferred Series C | | | May 2019 | | | | 4,330 | | | | 37,938 | | | | 15,426 | |
Loadsmart, Inc., Preferred Series D | | | Jan 2022 | | | | 500,000 | | | | 10,000,000 | | | | 9,915,000 | |
Neutron Holdings, Inc. (d.b.a. Lime), Preferred Series 1-D | | | Mar 2019 | | | | 20,618,556 | | | | 5,000,000 | | | | 1,649,485 | |
Turo, Inc., Preferred Series D-1 | | | Jun 2018 | | | | 628,035 | | | | 2,932,295 | | | | 9,445,646 | |
| | | | | | | | | | | 30,430,635 | | | | 32,848,753 | |
TOTAL PREFERRED STOCK IN PRIVATE COMPANIES | | | | | | | | 346,741,923 | | | | 386,960,371 | |
| | | | | | | | | | | | | | | | |
CONVERTIBLE NOTES OF PRIVATE COMPANIES(b) — 6.4% | | | | | | | | | | | | | |
AEROSPACE — 1.9% | | | | | | | | | | | | | | | | |
Axiom Space, Inc., 3.00% 8/11/2023 | | | Aug 2021 | | | $ | 15,000,000 | | | | 15,612,740 | | | | 18,367,928 | |
See accompanying Notes to the Financial Statements
18
THE PRIVATE SHARES FUND
Schedule of Investments (Continued)
December 31, 2022
| | | Acquisition
Date | | | Units/Principal/
Commitment | | | Cost | | | Fair Value | |
CONVERTIBLE NOTES OF PRIVATE COMPANIES(b) — 6.4% (Continued) | | | | | | | | | | | | |
HOSTING/STORAGE — 1.0% | | | | | | | | | | | | | | | | |
TMGcore, Inc., 4.00% 8/11/2026 | | | Dec 2021 | | | $ | 10,000,000 | | | $ | 10,000,000 | | | $ | 10,000,000 | |
| | | | | | | | | | | | | | | | | |
SOFTWARE — 2.0% | | | | | | | | | | | | | | | | |
Tradeshift Holdings, Inc., 6.00% 11/22/2023 (d) | | | Nov 2021 | | | $ | 5,000,000 | | | | 2,574,645 | | | | 5,000,000 | |
Tradeshift Holdings, Inc., 6.00% 6/15/2023 (d) | | | Jun 2021 | | | $ | 10,000,000 | | | | 5,451,896 | | | | 10,000,000 | |
Tradeshift Holdings, Inc., 7.00% 3/25/2024 | | | Mar 2022 | | | $ | 5,000,000 | | | | 2,461,948 | | | | 5,000,000 | |
| | | | | | | | | | | 10,488,489 | | | | 20,000,000 | |
TRANSPORTATION — 1.5% | | | | | | | | | | | | | | | | |
Neutron Holdings, Inc. (d.b.a. Lime), 4.00% 10/29/2025 | | | Oct 2021 | | | $ | 15,000,000 | | | | 15,000,000 | | | | 15,000,000 | |
Neutron Holdings, Inc. (d.b.a. Lime), 4.00% 6/1/2027 | | | Jun 2020 | | | $ | 253,169 | | | | 252,362 | | | | 253,169 | |
| | | | | | | | | | | 15,252,362 | | | | 15,253,169 | |
TOTAL CONVERTIBLE NOTES OF PRIVATE COMPANIES | | | | | | | | 51,353,591 | | | | 63,621,097 | |
| | | | | | | | | | | | | | | | |
WARRANTS OF PRIVATE COMPANIES — 1.1% | | | | | | | | | | | | | | | | |
| | | | | | | | | | | | | | | | | |
SOFTWARE — 1.1% | | | | | | | | | | | | | | | | |
Tradeshift Holdings, Inc., Exercise Price $0.001, Exercise Date 11/21/2031 | | | Nov 2021 | | | | 213,797 | | | | 2,425,355 | | | | 2,663,654 | |
Tradeshift Holdings, Inc., Exercise Price $0.001, Exercise Date 9/9/2031 | | | Dec 2021 | | | | 427,594 | | | | 4,570,844 | | | | 5,327,308 | |
Tradeshift Holdings, Inc., Exercise Price $0.001, Exercise Date 3/25/2032 | | | Mar 2022 | | | | 213,797 | | | | 2,538,052 | | | | 2,663,676 | |
| | | | | | | | | | | 9,534,251 | | | | 10,654,638 | |
TRANSPORTATION — 0.0% | | | | | | | | | | | | | | | | |
Clearmotion, Inc., Exercise Price $0.12, Exercise Date 3/9/2029 | | | Mar 2022 | | | | 5,181,836 | | | | 341,068 | | | | 447,711 | |
Neutron Holdings, Inc. (d.b.a. Lime), Exercise Price $0.01, Exercise Date 6/2/2027 | | | Jun 2020 | | | | 1,016,483 | | | | 807 | | | | 1,802 | |
| | | | | | | | | | | 341,875 | | | | 449,513 | |
TOTAL WARRANTS OF PRIVATE COMPANIES | | | | | | | | | | | 9,876,126 | | | | 11,104,151 | |
| | | | | | | | | | | | | | | | | |
SIMPLE AGREEMENT FOR FUTURE EQUITY OF PRIVATE COMPANIES(a),(b) — 0.1% | | | | | | | | |
AEROSPACE — 0.1% | | | | | | | | | | | | | | | | |
Xplore, Inc. | | | Feb 2022 | | | | 1,000,000 | | | | 1,000,000 | | | | 1,000,000 | |
TOTAL SIMPLE AGREEMENT FOR FUTURE EQUITY OF PRIVATE COMPANIES | | | 1,000,000 | | | | 1,000,000 | |
See accompanying Notes to the Financial Statements
19
THE PRIVATE SHARES FUND
Schedule of Investments (Continued)
December 31, 2022
| | | Acquisition
Date | | | Shares | | | Cost | | | Fair Value | |
SPECIAL PURPOSE VEHICLES/PRIVATE FUNDS(a),(b) — 0.1% | | | | | | | | | | | | | |
PRIVATE FUNDS — 0.1% | | | | | | | | | | | | | | | | |
Northgate Growth Fund III(f) | | | Dec 2022 | | | | 400,000 | | | $ | 400,000 | | | $ | 400,000 | |
TOTAL SPECIAL PURPOSE VEHICLES/PRIVATE FUNDS | | | | | | | | | 400,000 | | | | 400,000 | |
| | | | | | | | | | | | | | | | | |
SHORT-TERM INVESTMENTS — 12.6% | | | | | | | | | | | | | | | | |
DEMAND DEPOSIT — 12.6% | | | | | | | | | | | | | | | | |
Goldman Sachs Government Fund, 4.07%, (e) | | | | | | | | | | | 124,900,347 | | | | 124,900,347 | |
| | | | | | | | | | | | | | | | |
TOTAL SHORT-TERM INVESTMENTS | | | | | | | | | | | 124,900,347 | | | | 124,900,347 | |
| | | | | | | | | | | | | | | | |
TOTAL INVESTMENTS — 99.7% | | | | | | | | | | | 839,927,345 | | | | 986,522,492 | |
Other assets less liabilities — 0.3% | | | | | | | | | | | | | | | 2,764,791 | |
| | | | | | | | | | | | | | | | |
NET ASSETS — 100.0% | | | | | | | | | | | | | | $ | 989,287,283 | |
(a) | Equity positions are non-income producing and debt positions are income producing. |
(b) | Investments in private companies, and in some cases public companies, may be subject to restrictions on disposition imposed by the issuer. All positions held are non-controlled and non-affiliated investments, as defined by the Investment Company Act of 1940, as amended (“1940 Act”). As of December 31, 2022 restricted securities represented 86.28% of the net assets of the Fund. |
(c) | These securities have been purchased through Special Purpose Vehicles/Private Funds in which the Fund has a direct investment of ownership units of the Vehicles. The shares, cost basis and fair value stated are disclosed based on the underlying securities purchased by the Vehicle and the Fund’s ownership percentage. |
(d) | Denotes a variable rate security. The rate shown is the current interest rate as of December 31, 2022. |
(e) | Represents the 7-day effective yield as of December 31, 2022. |
(f) | These investments in Special Purpose Vehicles/Private Funds are expected to be invested into Portfolio Companies’ common and preferred shares. |
All issuers are based in the United States, except for Lyst, Ltd. and OpenX Software, Ltd., which are based in the UK, and Trax, Ltd., Eruditus Learning Solutions Pte., Ltd., and Fundbox, Ltd., which are based in the Cayman Islands, Singapore, and Israel, respectively.
See accompanying Notes to the Financial Statements
20
THE PRIVATE SHARES FUND
Statement of Assets and Liabilities
December 31, 2022
Assets: | | | | |
Investments, at fair value (cost $839,927,345) (Note 3) | | $ | 986,522,492 | |
Receivable for fund shares sold | | | 2,137,707 | |
Interest receivable | | | 2,848,602 | |
Prepaid expenses and other assets | | | 372,044 | |
Total assets | | | 991,880,845 | |
| | | | |
Liabilities: | | | | |
Advisory fees | | | 1,574,711 | |
Payable for shareholder servicing fees - Class L | | | 892 | |
Payable for shareholder servicing fees - Class A | | | 39,327 | |
Payable for investments purchased | | | 75,090 | |
Payable for audit and tax fees | | | 219,999 | |
Payable for transfer agent fees | | | 321,000 | |
Payable for 12b-1 fees - Class L | | | 892 | |
Other accrued liabilities | | | 361,651 | |
Total liabilities | | | 2,593,562 | |
Commitments and contingences (Note 9) | | | | |
Net assets | | $ | 989,287,283 | |
| | | | |
Net assets consist of: | | | | |
Capital stock (unlimited shares authorized, no par value) | | $ | 851,302,678 | |
Total distributable earnings | | | 137,984,605 | |
Net assets | | $ | 989,287,283 | |
| | | | |
Net assets: | | | | |
Class A | | $ | 178,576,857 | |
Class I | | | 807,234,330 | |
Class L | | | 3,476,096 | |
Total net assets | | $ | 989,287,283 | |
| | | | |
Shares outstanding: | | | | |
Class A | | | 4,316,217 | |
Class I | | | 19,245,141 | |
Class L | | | 85,149 | |
Total shares outstanding | | | 23,646,507 | |
| | | | | |
Net asset value, public offering price, and redemption proceeds per share: | | | | |
Class A - Net asset value and redemption proceeds per share | | $ | 41.37 | |
Class I - Net asset value and redemption proceeds per share | | $ | 41.94 | |
Class L - Net asset value and redemption proceeds per share | | $ | 40.82 | |
Class A - Public offering price per share(a) | | $ | 43.89 | |
Class L - Public offering price per share(b) | | $ | 42.63 | |
(a) | Computation of public offering price per share 100/94.25 of net asset value. (See Note 10). |
(b) | Computation of public offering price per share 100/95.75 of net asset value. (See Note 10). |
See accompanying Notes to the Financial Statements
21
THE PRIVATE SHARES FUND
Statement of Operations
For the year ended December 31, 2022
Investment Income: | | | | |
Dividends1 | | $ | 503,160 | |
Interest2 | | | 5,579,883 | |
Total investment income | | | 6,083,043 | |
| | | | | |
Expenses: | | | | |
Investment advisory fees (Note 5) | | | 18,224,852 | |
Transfer agent fees | | | 1,650,306 | |
Audit and tax fees | | | 517,100 | |
Legal fees3 | | | 515,982 | |
Fund accounting & administration fees | | | 368,575 | |
Printing & postage | | | 350,878 | |
Registration fees | | | 194,983 | |
Insurance fees | | | 186,697 | |
Trustee fees | | | 147,750 | |
Shareholder servicing fees - Class A | | | 121,262 | |
Miscellaneous expenses | | | 111,932 | |
Chief compliance officer fees | | | 90,000 | |
Custodian fees | | | 72,663 | |
SEC fees | | | 26,705 | |
Distribution fees - Class L | | | 11,122 | |
Shareholder servicing fees - Class L | | | 1,822 | |
Total expenses | | | 22,592,629 | |
Less: Net contractual waiver of fees and reimbursement of expenses (Note 4) | | | (441,827 | ) |
Net expenses | | | 22,150,802 | |
Net investment loss | | $ | (16,067,759 | ) |
| | | | |
Net realized loss on investments | | | (5,976,695 | ) |
Net change in unrealized gain on investments | | | 20,286,802 | |
Net realized & change in unrealized gain on investments | | | 14,310,107 | |
Net change in net assets from operations | | $ | (1,757,652 | ) |
1 | Includes paid-in-kind dividends of $503,160. |
2 | Includes paid-in-kind interest of $1,811,644. |
3 | Includes extraordinary expenses incurred during the fiscal year. Extraordinary expenses related to Legal expenses incurred in the amount of $92,234 were excluded from the contractual waiver of fees due to their nature. Please see Note 4 in the Notes to the Financial Statements for additional information. |
See accompanying Notes to the Financial Statements
22
THE PRIVATE SHARES FUND
Statements of Changes in Net Assets
| | | Year ended
December 31, 2022 | | | Year ended
December 31, 2021 | |
Operations: | | | | | | | | |
Net investment loss | | $ | (16,067,759 | ) | | $ | (11,695,427 | ) |
Net realized gain/loss on investments | | | (5,976,695 | ) | | | 65,538,431 | |
Net change in unrealized gain on investments | | | 20,286,802 | | | | 40,658,916 | |
Net change in net assets resulting from operations | | | (1,757,652 | ) | | | 94,501,920 | |
| | | | | | | | | |
Distributions to Shareholders: | | | | | | | | |
Distributions from long term capital gains | | | (14,486,991 | ) | | | (51,227,704 | ) |
Net change in net assets from distributions | | | (14,486,991 | ) | | | (51,227,704 | ) |
| | | | | | | | | |
Fund share transactions: | | | | | | | | |
Proceeds from shares issued - Class A | | | 64,299,732 | | | | 62,603,597 | |
Proceeds from shares issued - Class I | | | 439,954,802 | | | | 351,778,917 | |
Proceeds from shares issued - Class L | | | 1,615,901 | | | | 2,173,960 | |
Reinvested distributions - Class A | | | 951,826 | | | | 5,041,316 | |
Reinvested distributions - Class I | | | 5,539,070 | | | | 21,362,256 | |
Reinvested distributions - Class L | | | 50,276 | | | | 204,652 | |
Cost of shares repurchased - Class A | | | (42,652,800 | ) | | | (28,951,952 | ) |
Cost of shares repurchased - Class I | | | (190,815,002 | ) | | | (32,099,168 | ) |
Cost of shares repurchased - Class L | | | (1,896,389 | ) | | | (346,778 | ) |
Net change in net assets from fund share transactions | | | 277,047,416 | | | | 381,766,800 | |
Net change in net assets | | $ | 260,802,773 | | | $ | 425,041,016 | |
| | | | | | | | | |
Net assets: | | | | | | | | |
Beginning of year | | $ | 728,484,510 | | | $ | 303,443,494 | |
End of year | | $ | 989,287,283 | | | $ | 728,484,510 | |
| | | | | | | | |
Transactions in shares: | | | | | | | | |
Issuance of shares - Class A | | | 1,492,876 | | | | 1,500,815 | |
Issuance of shares - Class I | | | 10,118,688 | | | | 8,243,895 | |
Issuance of shares - Class L | | | 37,898 | | | | 52,196 | |
Reinvested distributions - Class A | | | 22,749 | | | | 120,808 | |
Reinvested distributions - Class I | | | 130,638 | | | | 506,455 | |
Reinvested distributions - Class L | | | 1,218 | | | | 4,955 | |
Repurchase of shares - Class A | | | (992,797 | ) | | | (690,399 | ) |
Repurchase of shares - Class I | | | (4,415,495 | ) | | | (745,246 | ) |
Repurchase of shares - Class L | | | (45,436 | ) | | | (8,342 | ) |
Net change in shares | | | 6,350,339 | | | | 8,985,137 | |
See accompanying Notes to the Financial Statements
23
THE PRIVATE SHARES FUND
Statement of Cash Flows
For the year ended December 31, 2022
Cash flows from operating activities: | | | | |
Net change in net assets from operations | | $ | (1,757,652 | ) |
Adjustments to reconcile net change in net assets from operations to net cash used in operating activities: | | | | |
Purchases of investments | | | (319,606,614 | ) |
Net sales of short-term investments | | | 51,017,789 | |
Proceeds from sales of investments | | | 24,350,527 | |
Net change in unrealized gain on investments | | | (20,286,802 | ) |
Net realized loss on investments | | | 5,976,695 | |
Change in operating assets and liabilities: | | | | |
Increase in interest receivable | | | (2,387,803 | ) |
Increase in prepaid expenses and other assets | | | (36,187 | ) |
Increase in net payable to adviser | | | 517,090 | |
Increase in other accrued liabilities | | | 223,943 | |
Net cash used in operating activities | | | (261,989,014 | ) |
| | | | | |
Cash flows from financing activities: | | | | |
Proceeds from shares issued, net of change in receivable for fund shares sold | | | 495,889,060 | |
Cost of shares redeemed | | | (225,954,227 | ) |
Cash distributions paid | | | (7,945,819 | ) |
Net cash provided by financing activities | | | 261,989,014 | |
| | | | | |
Net change in cash | | | — | |
| | | | |
Cash at beginning of year | | | — | |
Cash at end of year | | $ | — | |
| | | | | |
Supplemental disclosure of noncash financing activities | | | | |
Transfer in and out between share classes | | $ | 9,409,965 | |
Purchases of shares through reinvested distributions | | | 6,541,172 | |
See accompanying Notes to the Financial Statements
24
THE PRIVATE SHARES FUND
Financial Highlights – Class A
For a capital share outstanding throughout each period
| | | Year ended
December 31,
2022 | | Year ended
December 31,
2021 | | Year ended
December 31,
2020 | | Year ended
December 31,
2019 | | Year ended
December 31,
2018 |
Per share operating performance | | | | | | | | | | | | | | | | | | | | |
Net asset value, beginning of year | | $ | 41.77 | | | $ | 36.33 | | | $ | 29.96 | | | $ | 28.44 | | | $ | 26.85 | |
| | | | | | | | | | | | | | | | | | | | |
Change in net assets from operations: | | | | | | | | | | | | | | | | | |
Net investment loss | | | (0.80 | ) | | | (0.88 | ) | | | (0.90 | ) | | | (0.88 | ) | | | (0.71 | ) |
Net realized and unrealized gain on investments | | | 0.98 | | | | 9.54 | | | | 7.98 | | | | 2.40 | | | | 2.30 | |
Total change in net assets from operations | | | 0.18 | | | | 8.66 | | | | 7.08 | | | | 1.52 | | | | 1.59 | |
| | | | | | | | | | | | | | | | | | | | |
Distributions: | | | | | | | | | | | | | | | | | | | | |
From net return of capital | | | — | | | | — | | | | (0.07 | ) | | | — | | | | — | |
From net realized gain on investments | | | (0.58 | ) | | | (3.22 | ) | | | (0.64 | ) | | | — | | | | — | |
Total distributions | | | (0.58 | ) | | | (3.22 | ) | | | (0.71 | ) | | | — | | | | — | |
Net increase (decrease) in net asset value | | | (0.40 | ) | | | 5.44 | | | | 6.37 | | | | 1.52 | | | | 1.59 | |
Net asset value, end of year | | $ | 41.37 | (f) | | $ | 41.77 | | | $ | 36.33 | | | $ | 29.96 | | | $ | 28.44 | |
| | | | | | | | | | | | | | | | | | | | |
Total return(a) | | | 0.42 | % | | | 23.85 | % | | | 23.69 | % | | | 5.34 | % | | | 5.92 | % |
| | | | | | | | | | | | | | | | | | | | |
Ratios and supplemental data | | | | | | | | | | | | | | | | | | | | |
Net assets, end of year (in thousands) | | $ | 178,577 | | | $ | 158,433 | | | $ | 103,984 | | | $ | 108,068 | | | $ | 109,902 | |
Ratio of net expenses to average net assets | | | 2.51 | %(b)(c) | | | 2.51 | %(b)(d) | | | 2.50 | %(b) | | | 2.79 | %(b)(e) | | | 2.50 | %(b) |
Ratio of gross expenses before reimbursement to average net assets | | | 2.41 | % | | | 2.64 | % | | | 2.97 | % | | | 3.56 | % | | | 3.29 | % |
Ratio of net investment loss to average net assets | | | (1.89 | )% | | | (2.42 | )% | | | (2.48 | )% | | | (2.71 | )% | | | (2.44 | )% |
Portfolio turnover | | | 3.17 | % | | | 26.20 | % | | | 6.97 | % | | | 14.76 | % | | | 24.75 | % |
(a) | The Fund’s total investment returns do not include a sales load. |
(b) | The ratio of net expenses includes recoupment of previously waived and/or reimbursed fees of $184,461, or 0.10%, for the fiscal year ended December 31, 2022, and contractual waivers and expense reimbursements of $171,876, $492,357, $916,804, and $887,579, or 0.12%, 0.47%, 0.78%, and 0.79%, for the fiscal years ended December 31, 2021, 2020, 2019, and 2018, respectively. Please see Note 4 in the Notes to the Financial Statements for additional information. |
(c) | During the fiscal year ended December 31, 2022, there were legal expenses incurred by the Fund that were distinguishable in their characterization as being unusual in nature as well as not expected to be recurring in future periods. The exclusion of these extraordinary expenses from the Fund’s expense limitation agreement caused the expense ratio to exceed the contractual expense limit by $17,472 or 0.01%. |
(d) | During the fiscal year ended December 31, 2021, there were legal expenses incurred by the Fund that were distinguishable in their characterization as being unusual in nature as well as not expected to be recurring in future periods. The exclusion of these extraordinary expenses from the Fund’s expense limitation agreement caused the expense ratio to exceed the contractual expense limit by $17,584 or 0.01%. |
(e) | During the fiscal year ended December 31, 2019, there were certain expenses incurred by the Fund that were distinguishable in their characterization as being unusual in nature as well as not expected to be recurring in future periods. The exclusion of these extraordinary expenses from the Fund’s expense limitation agreement caused the expense ratio to exceed the contractual expense limit by $336,193 or 0.29%. |
(f) | The NAV per share has been adjusted from the published NAV of $41.75 for post-closing adjustments. |
See accompanying Notes to the Financial Statements
25
THE PRIVATE SHARES FUND
Financial Highlights – Class I
For a capital share outstanding throughout each period
| | | Year ended
December 31,
2022 | | Year ended
December 31,
2021 | | Year ended
December 31,
2020 | | Year ended
December 31,
2019 | | Year ended
December 31,
2018 |
Per share operating performance | | | | | | | | | | | | | | | | | | | | |
Net asset value, beginning of year | | $ | 42.22 | | | $ | 36.61 | | | $ | 30.12 | | | $ | 28.51 | | | $ | 26.85 | |
| | | | | | | | | | | | | | | | | | | | |
Change in net assets from operations: | | | | | | | | | | | | | | | | | | | | |
Net investment loss | | | (0.65 | ) | | | (0.62 | ) | | | (0.47 | ) | | | (0.59 | ) | | | (0.20 | ) |
Net realized and unrealized gain on investments | | | 0.95 | | | | 9.45 | | | | 7.67 | | | | 2.20 | | | | 1.86 | |
Total change in net assets from operations | | | 0.30 | | | | 8.83 | | | | 7.20 | | | | 1.61 | | | | 1.66 | |
| | | | | | | | | | | | | | | | | | | | |
Distributions: | | | | | | | | | | | | | | | | | | | | |
From net return of capital | | | — | | | | — | | | | (0.07 | ) | | | — | | | | — | |
From net realized gain on investments | | | (0.58 | ) | | | (3.22 | ) | | | (0.64 | ) | | | — | | | | — | |
Total distributions | | | (0.58 | ) | | | (3.22 | ) | | | (0.71 | ) | | | — | | | | — | |
Net increase (decrease) in net asset value | | | (0.28 | ) | | | 5.61 | | | | 6.49 | | | | 1.61 | | | | 1.66 | |
Net asset value, end of year | | $ | 41.94 | (e) | | $ | 42.22 | | | $ | 36.61 | | | $ | 30.12 | | | $ | 28.51 | |
| | | | | | | | | | | | | | | | | | | | |
Total return | | | 0.70 | % | | | 24.13 | % | | | 23.97 | % | | | 5.65 | % | | | 6.18 | % |
| | | | | | | | | | | | | | | | | | | | |
Ratios and supplemental data | | | | | | | | | | | | | | | | | | | | |
Net assets, end of year (in thousands) | | $ | 807,234 | | | $ | 566,272 | | | $ | 197,921 | | | $ | 82,992 | | | $ | 33,945 | |
Ratio of net expenses to average net assets | | | 2.26 | %(a)(b) | | | 2.26 | %(a)(c) | | | 2.25 | %(a) | | | 2.54 | %(a)(d) | | | 2.25 | %(a) |
Ratio of gross expenses before reimbursement to average net assets | | | 2.34 | % | | | 2.50 | % | | | 2.75 | % | | | 3.36 | % | | | 3.10 | % |
Ratio of net investment loss to average net assets | | | (1.62 | )% | | | (2.15 | )% | | | (2.24 | )% | | | (2.46 | )% | | | (2.17 | )% |
Portfolio turnover | | | 3.17 | % | | | 26.20 | % | | | 6.97 | % | | | 14.76 | % | | | 24.75 | % |
(a) | The ratio of net expenses includes contractual waivers and expense reimbursements of $631,951, $899,197, $567,388, $546,174, and $94,654, or 0.08%, 0.23%, 0.50%, 0.82%, and 0.85%, for the fiscal years ended December 31, 2022, 2021, 2020, 2019, and 2018, respectively. Please see Note 4 in the Notes to the Financial Statements for additional information. |
(b) | During the fiscal year ended December 31, 2022, there were legal expenses incurred by the Fund that were distinguishable in their characterization as being unusual in nature as well as not expected to be recurring in future periods. The exclusion of these extraordinary expenses from the Fund’s expense limitation agreement caused the expense ratio to exceed the contractual expense limit by $74,334 or 0.01%. |
(c) | During the fiscal year ended December 31, 2021, there were legal expenses incurred by the Fund that were distinguishable in their characterization as being unusual in nature as well as not expected to be recurring in future periods. The exclusion of these extraordinary expenses from the Fund’s expense limitation agreement caused the expense ratio to exceed the contractual expense limit by $48,772 or 0.01%. |
(d) | During the fiscal year ended December 31, 2019, there were certain expenses incurred by the Fund that were distinguishable in their characterization as being unusual in nature as well as not expected to be recurring in future periods. The exclusion of these extraordinary expenses from the Fund’s expense limitation agreement caused the expense ratio to exceed the contractual expense limit by $189,435 or 0.29%. |
(e) | The NAV per share has been adjusted from the published NAV of $42.32 for post-closing adjustments. |
See accompanying Notes to the Financial Statements
26
THE PRIVATE SHARES FUND
Financial Highlights – Class L
For a capital share outstanding throughout each period
| | | Year ended
December 31,
2022 | | Year ended
December 31,
2021 | | Year ended
December 31,
2020 | | Year ended
December 31,
2019 | | Period ended
December 31,
2018* |
Per share operating performance | | | | | | | | | | | | | | | | | | | | |
Net asset value, beginning of period | | $ | 41.33 | | | $ | 36.07 | | | $ | 29.83 | | | $ | 28.39 | | | $ | 28.37 | |
| | | | | | | | | | | | | | | | | | | | |
Change in net assets from operations: | | | | | | | | | | | | | | | | | | | | |
Net investment loss | | | (1.12 | ) | | | (0.82 | ) | | | (0.67 | ) | | | (0.58 | ) | | | (0.49 | ) |
Net realized and unrealized gain on investments | | | 1.19 | | | | 9.30 | | | | 7.62 | | | | 2.02 | | | | 0.51 | |
Total change in net assets from operations | | | 0.07 | | | | 8.48 | | | | 6.95 | | | | 1.44 | | | | 0.02 | |
| | | | | | | | | | | | | | | | | | | | |
Distributions: | | | | | | | | | | | | | | | | | | | | |
From net return of capital | | | — | | | | — | | | | (0.07 | ) | | | — | | | | — | |
From net realized gain on investments | | | (0.58 | ) | | | (3.22 | ) | | | (0.64 | ) | | | — | | | | — | |
Total distributions | | | (0.58 | ) | | | (3.22 | ) | | | (0.71 | ) | | | — | | | | — | |
Net increase (decrease) in net asset value | | | (0.51 | ) | | | 5.26 | | | | 6.24 | | | | 1.44 | | | | 0.02 | |
Net asset value, end of period | | $ | 40.82 | (h) | | $ | 41.33 | | | $ | 36.07 | | | $ | 29.83 | | | $ | 28.39 | |
| | | | | | | | | | | | | | | | | | | | |
Total return(a) | | | 0.16 | % | | | 23.52 | % | | | 23.36 | % | | | 5.07 | % | | | 0.07 | %(b) |
| | | | | | | | | | | | | | | | | | | | |
Ratios and supplemental data | | | | | | | | | | | | | | | | | | | | |
Net assets, end of period (in thousands) | | $ | 3,476 | | | $ | 3,780 | | | $ | 1,539 | | | $ | 810 | | | $ | 1 | |
Ratio of net expenses to average net assets | | | 2.76 | %(c)(d) | | | 2.76 | %(c)(e) | | | 2.75 | %(c) | | | 3.04 | %(c)(f) | | | 2.75 | %(c)(g) |
Ratio of gross expenses before reimbursement to average net assets | | | 2.63 | % | | | 2.84 | % | | | 3.18 | % | | | 3.86 | % | | | 3.60 | %(g) |
Ratio of net investment loss to average net assets | | | (2.15 | )% | | | (2.66 | )% | | | (2.74 | )% | | | (2.97 | )% | | | (2.68 | )%(g) |
Portfolio turnover | | | 3.17 | % | | | 26.20 | % | | | 6.97 | % | | | 14.76 | % | | | 24.75 | %(b) |
* | Reflects operations for the period from May 11, 2018 (inception date) to December 31, 2018. |
(a) | The Fund’s total investment returns do not include a sales load. |
(b) | Not annualized for periods less than one year. |
(c) | The ratio of net expenses includes recoupment of previously waived and/or reimbursed fees of $5,663, or 0.13%, for the fiscal year ended December 31, 2022, and contractual waivers and expense reimbursements of $2,134, $4,514, $4,364, and $6, or 0.08%, 0.43%, 0.82%, and 0.85%, for the fiscal years ended December 31, 2021, 2020, and 2019, and the fiscal period ended December 31, 2018, respectively. Please see Note 4 in the Notes to the Financial Statements for additional information. |
(d) | During the fiscal year ended December 31, 2022, there were legal expenses incurred by the Fund that were distinguishable in their characterization as being unusual in nature as well as not expected to be recurring in future periods. The exclusion of these extraordinary expenses from the Fund’s expense limitation agreement caused the expense ratio to exceed the contractual expense limit by $428 or 0.01%. |
(e) | During the fiscal year ended December 31, 2021, there were legal expenses incurred by the Fund that were distinguishable in their characterization as being unusual in nature as well as not expected to be recurring in future periods. The exclusion of these extraordinary expenses from the Fund’s expense limitation agreement caused the expense ratio to exceed the contractual expense limit by $361 or 0.01%. |
(f) | During the fiscal year ended December 31, 2019, there were certain expenses incurred by the Fund that were distinguishable in their characterization as being unusual in nature as well as not expected to be recurring in future periods. The exclusion of these extraordinary expenses from the Fund’s expense limitation agreement caused the expense ratio to exceed the contractual expense limit by $1,514 or 0.29%. |
(g) | Annualized for period less than one year. |
(h) | The NAV per share has been adjusted from the published NAV of $41.20 for post-closing adjustments. |
See accompanying Notes to the Financial Statements
27
THE PRIVATE SHARES FUND
Notes to the Financial Statements
December 31, 2022
1. Organization
The Private Shares Fund (the “Fund”) was established as a limited liability company under the laws of the State of Delaware on August 20, 2012 and converted into a Delaware statutory trust on March 22, 2013. The Fund is registered with the Securities and Exchange Commission (the “SEC”) as a diversified, closed-end management investment company that operates as an “interval fund” under the Investment Company Act of 1940, as amended (the “1940 Act”). The shares of beneficial interest of the Fund (the “Shares”) will be continuously offered under Rule 415 of the Securities Act of 1933, as amended (the “Securities Act”). As an interval fund, the Fund makes quarterly repurchase offers for 5% of the Fund’s outstanding Shares at net asset value (“NAV”), with no repurchase fee incurred. The Fund’s inception date was March 25, 2014. Prior to March 25, 2014, the Fund had been inactive except for matters relating to the Fund’s establishment, designation and planned registration of the Fund’s Shares under the Securities Act and the sale of 5,000 Shares (“Initial Shares”) for $100,000 to the Fund’s initial shareholder, which occurred on July 30, 2013.
The investment objective of the Fund is to provide investors capital appreciation, which it seeks by primarily investing, under normal market conditions, at least 80% of (i) the value of its net assets, plus (ii) the amount of any borrowings for investment purposes, in the equity securities (e.g., common and/or preferred stock, or equity-linked securities convertible into such equity securities) of private, operating growth companies (each, a “Portfolio Company”). Liberty Street Advisors, Inc.’s (the “Investment Adviser”) primary strategy is to invest in Portfolio Companies and to hold such securities until a liquidity event with respect to such Portfolio Company occurs, such as an initial public offering, or a merger or acquisition transaction. The Fund currently offers three different classes of shares: Class A, Class I, and Class L shares. The separate classes of shares differ principally in the applicable sales charges (if any) and shareholder servicing fees. Generally, shareholders of each class also bear certain expenses that pertain to that particular class. All shareholders bear the common expenses of the Fund and earn income and realized and unrealized gains/losses pro rata based on the daily ending net assets of each class, without discrimination between share classes. Expenses that are specific to a class are charged directly to that class. Dividends are determined separately for each class based on income and expenses allocated to each class. Realized gain distributions are allocated to each class pro rata based on the shares outstanding of each class on the date of distribution. Differences in per share dividend rates generally result from the differences in separate class expenses, including distribution and shareholder servicing fees.
2. Significant accounting policies
The Fund is an investment company and follows the accounting and reporting guidance under Financial Accounting Standards Board (“FASB”) Accounting Standards Codification (“ASC”) Topic 946, Financial Services – Investment Companies. The following is a summary of significant accounting policies consistently followed by the Fund in the preparation of its financial statements.
Investment transactions and income recognition — Investment transactions are accounted for on a trade date basis. Net realized gains and losses on securities are computed on a specific identification basis. Dividend income is recorded on the ex-dividend date or as soon as known if after the ex-dividend date. Non-cash dividends included in dividend income, if any, are recorded at fair value. Interest income and estimated expenses are accrued daily.
Use of estimates — The preparation of the financial statements in accordance with US generally accepted accounting principles (“GAAP”) requires management to make estimates and assumptions that affect the reported amounts of assets and liabilities and disclosure of contingent assets and liabilities at the date of the financial statements, as well as reported amounts of increases and decreases in net assets from operations during the reporting period. Actual results could differ from these estimates.
Investment valuation — The Fund’s NAV is based in large part on the value of its securities which are carried at fair value in accordance with the provisions of FASB ASC Topic 820, Fair Value Measurements and Disclosures. Where reliable market prices are available for those securities, the Investment Adviser will rely on those prices. However, because the securities in which the Fund invests are often illiquid, market prices may not be readily available or, where available, may be unreliable. At any point in
28
THE PRIVATE SHARES FUND
Notes to the Financial Statements (Continued)
December 31, 2022
2. Significant accounting policies — (continued)
time, there may be few recent purchase or sale transactions or offers on which to base the value of a given Portfolio Company’s security. In addition, the prices reflected in recent transactions or offers may be extremely sensitive to changes in supply or demand, including changes fueled by investor perceptions or other conditions.
When reliable market values are not available, the Fund’s investments will be valued by the Investment Adviser, as the Valuation Designee designated by the Board of Trustees, pursuant to valuation procedures and methodologies approved by the Board of Trustees. While the Valuation Designee will use good faith efforts to determine the fair value of the Fund’s securities, fair value will be dependent on the judgment of the Valuation Designee. The Investment Adviser may also rely to some extent on information provided by the Portfolio Companies.
From time to time, the Fund may determine that it should modify its estimates or assumptions, as new information becomes available. As a consequence, the value of the securities, and therefore the Fund’s NAV, may vary. This may adversely affect Shareholders. Because of the uncertainty and judgment involved in the valuation of the Portfolio Company securities, which do not have a readily available market, the estimated fair value of such securities may be different from values that would have been used had a readily available market existed for such securities. In addition, in the event that the Fund desires to sell Portfolio Company shares, the Fund may also not be able to sell these securities at the prices at which they are carried on the Fund’s books or may have to delay their sale in order to do so. This may adversely affect the Fund’s NAV.
There were no changes to the valuation approaches or techniques applied during 2022.
Federal income taxes — The Fund’s policy is to comply with Subchapter M of the Internal Revenue Code of 1986, as amended (the “Code”), and to distribute to shareholders each year substantially all of its net investment income and any net realized capital gain. Therefore, a federal income tax or excise tax provision is not required.
Management has evaluated all tax positions taken or expected to be taken by the Fund to determine whether each tax position is more likely than not (i.e. greater than 50%) to be sustained upon examination by the applicable taxing authority, including resolution of any related appeals or litigation processes, based on the technical merits of the position. Tax positions that do not meet the more likely than not threshold may result in a tax benefit or expense in the current year. If the Fund were to incur an income tax liability in the future, interest on any income tax liability would be reported as interest expense and penalties on any income tax liability would be reported as income taxes. No interest expense or penalties have been recognized as of or for the year ended December 31, 2022. Management of the Fund also is not aware of any tax positions for which it is reasonably possible that the total amounts of recognized tax benefits will significantly change in the next twelve months. Management has determined that the Fund has not taken any tax positions which do not meet the more likely than not threshold and as such, no liabilities related to uncertain tax positions have been reflected in the Fund’s financial statements.
Management analyzed all open tax years, as defined by the applicable statute of limitations for all major jurisdictions in which it files tax returns, which includes federal and certain states. The Fund’s 2018 - 2021 tax years are open to examination as of December 31, 2022.
Distributions to shareholders — The Fund distributes net investment income and net realized gains (net of any capital loss carryovers), if any, annually. The timing and character of income and capital gain distributions are determined in accordance with income tax regulations, which may differ from GAAP. These differences are due in part to differing treatment of net operating loss, wash sales, non-deductible offering costs and capital loss carryforwards. To the extent that differences arise that are permanent in nature, such amounts are reclassified within the capital accounts on the Statement of Assets and Liabilities, based on their federal tax treatment. Temporary differences do not require reclassification.
29
THE PRIVATE SHARES FUND
Notes to the Financial Statements (Continued)
December 31, 2022
2. Significant accounting policies — (continued)
Shareholder service fee plan — Under the terms of the Fund’s Shareholder Services Plan, the Fund may compensate financial industry professionals for providing ongoing services with respect to clients to whom they have distributed Class A and Class L Shares of the Fund. Both Class A and Class L may incur shareholder servicing fees on an annual basis up to 0.25% of its daily average NAV. Class I is not subject to a shareholder servicing fee. For the year ended December 31, 2022, Class A and Class L incurred $121,262 and $1,822, respectively, in shareholder servicing fees.
Distribution fee plan — Under the terms of the Fund’s Distribution Plan, the Fund may compensate financial industry professionals for providing ongoing services in respect to certain activities relating to the distribution of Class L to investors and maintenance of shareholder accounts, as well as for payments to the Class L platform sponsors. Although the Fund is not an open-end investment company, it has undertaken to comply with the terms of Rule 12b-1 as a condition of an exemptive order under the 1940 Act which permits it to have asset based distribution fees. Under the Distribution Plan, Class L pays the Distributor a Distribution Fee at an annual rate of 0.25% of its average daily NAV. Class A and Class I are not subject to a distribution fee. For the year ended December 31, 2022, Class L incurred $11,122 in distribution fees.
The Investment Adviser’s affiliated broker-dealer, HRC Fund Associates, LLC (“HRC”), Member FINRA/SIPC, markets the Fund shares to financial intermediaries pursuant to a marketing agreement with the Investment Adviser. The marketing agreement between the Investment Adviser and HRC is not part of the Distribution Plan. The Investment Adviser pays HRC out of its own resources and without additional cost to the Fund or its shareholders. In addition, for its wholesaling activities, HRC receives sales charges from the Fund’s Distributor pursuant to a wholesaling agreement with the Fund’s Distributor. During the year ended December 31, 2022, HRC received $190,724 in sales charges from the Fund’s Distributor for the wholesaling services rendered from December 2020 through December 2022.
Line of credit — On June 15, 2021, the Fund entered into a one-year Credit Facility Agreement (“Facility”) of $22,000,000 (“Committed Facility”) and $8,000,000 (“Uncommitted Facility”) with UMB Bank, N. A. (the “Bank”). No more than once per quarter, the Fund is permitted to increase the Committed Facility to an amount equal to the greater of (i) $22,000,000 and (ii) 5% of the Fund’s assets under management. The Fund’s Uncommitted Facility will increase or decrease so that the aggregate Commitments do not exceed $30,000,000 unless consented to by the Bank. Borrowings under this agreement bore interest at the WSJ Prime Rate, minus 0.25%, subject to a minimum interest rate floor of 3.00%. On June 15, 2022, the Facility was renewed for another year and the Committed Facility and Uncommitted Facility amounts increased to $50,945,000 and $9,055,000, respectively. Borrowings under the renewed Facility bear interest at the 1-Month Secured Overnight Financing Rate (SOFR) plus 2.50%, annually. The purpose of the Facility is to potentially finance temporarily the redemption of shares of the Fund. Any interest derived from usage of the line of credit should be treated as exclusive of the expense cap. As compensation for holding the lending commitment available, the Fund is charged a commitment fee on the average daily unused balance of the Committed Facility at the rate of 0.20% per annum. Commitment fees for the period January 1, 2022 through June 14, 2022 were $19,891 and for the period June 15, 2022 through December 31, 2022 were $55,830, and are included within Miscellaneous expenses on the Statement of Operations. The Fund did not borrow under the Facility during the year ended and had no outstanding balance at December 31, 2022.
Transactions with affiliates — To the extent any affiliate of the Investment Adviser or the Fund (“Affiliated Broker”) receives any fee, payment, commission, or other financial incentive of any type (“Broker Fees”) in connection with the purchase and sale of securities by the Fund, such Broker Fees will be subject to policies and procedures adopted by the Board of Trustees pursuant to Section 17(e) and Rule 17e-1 of the 1940 Act. These policies and procedures include a quarterly review of Broker Fees by the Board of Trustees. Among other things, Section 17(e) and those procedures provide that, when acting as broker for the Fund in connection with the purchase or sale of securities to or by the Fund, an affiliated broker may not receive any compensation exceeding the following limits: (1) if the transaction is effected on a securities exchange, the compensation may not exceed the “usual and customary broker’s commission” (as defined in Rule 17e-1 under the 1940 Act); (2) in the case of the purchase of securities by the Fund in connection with a secondary distribution, the compensation cannot exceed 2% of the sale price; and (iii) the compensation for transactions otherwise effected cannot exceed 1% of the purchase or sale price. Rule 17e-1 defines a “usual
30
THE PRIVATE SHARES FUND
Notes to the Financial Statements (Continued)
December 31, 2022
2. Significant accounting policies — (continued)
and customary broker’s commission” as one that is fair compared to the commission received by other brokers in connection with comparable transactions involving similar securities being purchased or sold on an exchange during a comparable period of time. Notwithstanding the foregoing, no Affiliated Broker will receive any undisclosed fees from the Fund in connection with any transaction involving the Fund and such Affiliated Broker, and to the extent any transactions involving the Fund are effected by an Affiliated Broker, such Affiliated Broker’s Broker Fees for such transactions shall be limited in accordance with Section 17(e)(2) of the 1940 Act and the Fund’s policies and procedures concerning Affiliated Brokers. The Fund did not conduct any transactions with an Affiliated Broker for the year ended December 31, 2022.
The Fund has implemented certain written policies and procedures to ensure that the Fund does not engage in any transactions with any prohibited affiliates. Under the 1940 Act, our Board of Trustees has a duty to evaluate, and shall oversee the analysis of, all conflicts of interest involving the Fund and its affiliates, and shall do so in accordance with the aforementioned policies and procedures.
Investments in private investments in public equities — The Fund invests in equity securities of an issuer that are issued through a private investment in public equity (“PIPE”) transaction. PIPE transactions typically involve the purchase of securities directly from a publicly traded company or its affiliates in a private placement transaction, typically at a discount to the market price of the issuer’s common stock. Securities purchased through PIPE transactions will be restricted from trading and generally considered illiquid until a registration statement for the shares is filed and declared effective. These securities are valued the same as other equity securities as noted above. Securities purchased through PIPE transactions are classified as Level 2 of the fair value hierarchy until such time as the trading restriction is removed.
Investments in special purpose vehicles — Special purpose vehicles (“SPVs”) consist of an investment by the Fund in an entity that invests directly in the common or preferred stock of a Portfolio Company. Investments in SPVs are generally valued using the same fair value techniques for our securities held by the Fund once the investment has been made by the SPV into the underlying Portfolio Company and are categorized as Level 3 of the fair value hierarchy. The investments in an SPV that have yet to purchase the underlying securities are held at cost and are categorized in Level 3 of the fair value hierarchy.
3. Fair value measurements
GAAP defines fair value, establishes a three-tier framework for measuring fair value based on a hierarchy of inputs, and expands disclosure about fair value measurements. It also provides guidance on determining when there has been a significant decrease in the volume and level of activity for an asset or liability, when a transaction is not orderly and how that information must be incorporated into a fair value measurement. The hierarchy distinguishes between market data obtained from independent sources (observable inputs) and the Fund’s own market assumptions (unobservable inputs). These inputs are used in determining the fair value of the Fund’s investments. These inputs are summarized in the three broad levels listed below:
| | ● | Level 1 — quoted prices for active markets for identical securities. An active market for the security is a market in which transactions occur with sufficient frequency and volume to provide pricing information on an ongoing basis. A quoted price in an active market provides the most reliable evidence of fair value. |
| | ● | Level 2 — other significant observable inputs (including quoted prices for similar securities, interest rates, prepayment speeds, credit risk, etc. and quoted prices for identical or similar assets in markets that are not active). Inputs that are derived principally from or corroborated by observable market data. An adjustment to any observable input that is significant to the fair value may render the measurement a Level 3 measurement. |
| | ● | Level 3 — significant unobservable inputs, including the Fund’s own assumptions in determining the fair value of investments. |
For the year ended December 31, 2022, there were transfers of $2,676,118 out of Level 3.
31
THE PRIVATE SHARES FUND
Notes to the Financial Statements (Continued)
December 31, 2022
3. Fair value measurements — (continued)
The following is a description of the valuation techniques applied to the Fund’s major categories of assets and liabilities measured at fair value on a recurring basis. There were no changes to these techniques or approaches during the year ended December 31, 2022.
Securities traded on a national exchange (or reported on the NYSE and NASDAQ national market) are stated at the last reported sales price on the day of valuation. To the extent these securities are actively traded, and valuation adjustments are not applied, they are categorized in Level 1 of the fair value hierarchy. Stocks traded on inactive markets or valued by reference to similar instruments which are marketable and to the extent the inputs are observable and timely, are categorized in Level 2 of the fair value hierarchy.
The Fund’s portfolio holdings are primarily in Level 3 investments. As they are not publicly traded, and many are subject to restrictions on resale, the investments are less liquid than publicly traded securities, resulting in increased liquidity risk to the Fund.
The Fund’s portfolio investments will generally not be in publicly traded securities. Investments for which observable market prices in active markets do not exist are reported at fair value, as determined in good faith by the Investment Adviser under consistently applied policies and procedures approved by the Board of Trustees in accordance with GAAP. The Board has designated the Investment Adviser to be the Valuation Designee to prepare Portfolio Company valuations. The Valuation Designee has adopted appropriate segregation protocols to minimize the Fund portfolio managers’ influence on the Adviser’s Fair Value process. The types of factors that the Investment Adviser will take into account in determining fair value, subject to review and ratification where required by the Board of Trustees with respect to such non-traded investments, will include, as relevant and, to the extent available, the Portfolio Company’s earnings, the markets in which the Portfolio Company does business, comparison to valuations of publicly traded companies in the Portfolio Company’s industry, comparisons to recent sales of comparable companies, the discounted value of the cash flows of the Portfolio Company, the rights and preferences of the specific securities held, and other relevant factors. This information may not be available because it is difficult to obtain financial and other information with respect to private companies. In considering the extent and nature of information utilized in the valuation process, management will generally apply a greater weighting to that information which is recent and observable. Because such valuations are inherently uncertain and may be based on estimates, the determinations of fair value may differ materially from the values that would be assessed if a readily available market for these securities existed. Based on these factors, the investments in private companies will generally be presented as a Level 3 investment. Changes in accounting standards, such as the recent change in revenue recognition policies, may not be adopted consistently by issuers or at the same time, and as a result varied implementation may make it more difficult for the Fund to properly evaluate or compare financial information provided by Portfolio Companies of the Fund or to determine the validity of data of publicly traded company comparables for purposes of valuing the Fund’s portfolio holdings.
32
THE PRIVATE SHARES FUND
Notes to the Financial Statements (Continued)
December 31, 2022
3. Fair value measurements — (continued)
The inputs or methodology used for valuing securities are not necessarily an indication of the risk associated with investing in those securities. The following is a summary of the inputs used to determine fair value of the Fund’s investments as of December 31, 2022:
Investment in Securities | | Level 1
Quoted Prices | | | Level 2
Other Significant
Observable Inputs | | | Level 3
Significant
Unobservable Inputs | | | Total | |
Security Type | | | | | | | | | | | | | | | | |
Common stock in public companies | | $ | 8,106,893 | | | $ | 1,300,983 | | | $ | — | | | $ | 9,407,876 | |
Common stock in private companies* | | | — | | | | — | | | | 389,128,650 | | | | 389,128,650 | |
Preferred stock in private companies* | | | — | | | | — | | | | 386,960,371 | | | | 386,960,371 | |
Convertible notes of private companies* | | | — | | | | — | | | | 63,621,097 | | | | 63,621,097 | |
Warrants of private companies* | | | — | | | | — | | | | 11,104,151 | | | | 11,104,151 | |
Simple agreement for future equity of private companies | | | — | | | | — | | | | 1,000,000 | | | | 1,000,000 | |
Short-term investments | | | 124,900,347 | | | | — | | | | — | | | | 124,900,347 | |
Special purpose vehicles/private funds | | | — | | | | — | | | | 400,000 | | | | 400,000 | |
Total | | $ | 133,007,240 | | | $ | 1,300,983 | | | $ | 852,214,269 | | | $ | 986,522,492 | |
* | All sub-categories within the security type represent their respective evaluation status. For a detailed breakout by industry, please refer to the Schedule of Investments. |
33
THE PRIVATE SHARES FUND
Notes to the Financial Statements (Continued)
December 31, 2022
3. Fair value measurements — (continued)
The following is a rollforward of the activity in investments in which significant unobservable inputs (Level 3) were used in determining fair value on a recurring basis:
| | | Beginning
balance
January 1,
2022 | | | Transfers
into Level 3
during the
period | | | Transfers
out of Level 3
during the
period | | | Purchases or
Conversions | | | (Sales or
Conversions) | | | Net
realized
gain/(loss) | | | Change in net
unrealized
gain/(loss) | | | Ending
balance
December 31,
2022 | | | Change in
Unrealized
gains for the
period for
investments
still held at
December 31,
2022 | |
The Private Shares Fund | | | | | | | | | | | | | | | | | | | | | | | | | | | | | | | | |
Common stock in private companies | | $ | 223,228,378 | | | $ | — | | | $ | (1,373,200 | ) | | $ | 146,481,795 | 2 | | $ | (10,000,000 | )1 | | $ | — | | | $ | 30,791,677 | | | $ | 389,128,650 | | | $ | 35,083,174 | |
Preferred stock in private companies | | | 221,556,975 | | | | — | | | | (1,302,918 | ) | | | 175,943,292 | 2 | | | (10,206,045 | ) | | | (8,966,652 | ) | | | 9,935,719 | | | | 386,960,371 | | | | 15,419,666 | |
Convertible notes of private companies | | | 45,253,169 | | | | — | | | | — | | | | 13,074,688 | 1 | | | — | | | | — | | | | 5,293,240 | | | | 63,621,097 | | | | 5,344,300 | |
Warrants of private companies | | | 13,705,489 | | | | — | | | | — | | | | 2,879,120 | | | | — | | | | — | | | | (5,480,458 | ) | | | 11,104,151 | | | | (5,480,458 | ) |
Simple agreement for future equity of private companies | | | — | | | | — | | | | — | | | | 1,000,000 | | | | — | | | | — | | | | — | | | | 1,000,000 | | | | — | |
Special purpose vehicles/private funds | | | 10,175,792 | | | | — | | | | — | | | | 400,000 | | | | (10,175,792 | )2 | | | — | | | | — | | | | 400,000 | | | | — | |
| | | $ | 513,919,803 | | | $ | — | | | $ | (2,676,118 | ) | | $ | 339,778,895 | | | $ | (30,381,837 | ) | | $ | (8,966,652 | ) | | $ | 40,540,178 | | | $ | 852,214,269 | | | $ | 50,366,682 | |
1 | Amounts include $10,000,000 in common stock in private companies converted to $10,000,000 in convertible notes in private companies. |
2 | Amounts include $10,175,792 in special purpose vehicles converted into $6,135,792 of common stock in private companies and $4,040,000 of preferred stock in private companies. |
34
THE PRIVATE SHARES FUND
Notes to the Financial Statements (Continued)
December 31, 2022
3. Fair value measurements — (continued)
The following is a summary of quantitative information about significant unobservable valuation inputs for Level 3 Fair Value Measurements for investments held as of December 31, 2022:
Type of Level 3
Investment | | Fair Value as of
December 31, 2022 | | Valuation
Technique* | Unobservable
Inputs | | Range (Wt. Avg) | |
Common stock in private companies | | $ | 389,128,650 | | Precedent Transactions | Precedent Transactions | | | N/A | |
| | | | | | | | | | | |
| | | | | | Revenue Model | Revenue Multiples | | | 0.98 - 10.17 (4.54) | |
| | | | | | | Stage Discount Rates | | | 10% - 80% (22.11%) | |
| | | | | | | Execution Discount Rates | | | 25% - 90% (42.02%) | |
| | | | | | | Discounts For Lack of Marketability | | | 15.00% (15.00%) | |
Preferred stock in private companies | | | 386,960,371 | | Precedent Transactions | Precedent Transactions | | | N/A | |
| | | | | | | | | | | |
| | | | | | Revenue Model | Revenue Multiples | | | 0.74 - 9.35 (3.84) | |
| | | | | | | Stage Discount Rates | | | 10% - 80% (26.92%) | |
| | | | | | | Execution Discount Rates | | | 25% - 70% (41.58%) | |
| | | | | | | Discounts For Lack of Marketability | | | 15.00% (15.00%) | |
Convertible notes of private companies | | | 63,621,097 | | Market Approach | Precedent Transactions | | | N/A | |
Warrants of private companies | | | 11,104,151 | | Option Pricing Model | Industry Volatility | | | 61.14% - 74.76% (67.08%) | |
| | | | | | | Estimated Time to Exit | | | 4.46 - 9.32 (7.51) Years | |
Simple agreement for future equity of private companies | | | 1,000,000 | | Market Approach | Precedent Transactions | | | N/A | |
Special purpose vehicles/private funds | | | 400,000 | | Market Approach | Precedent Transactions | | | N/A | |
To the extent the revenue multiples increase, there is a corresponding increase in fair value; while as discount rates increase, there is a decrease in fair value.
4. Expense limitation agreement
The Investment Adviser has contractually agreed to waive management fees and/or reimburse the Fund for expenses the Fund incurs, but only to the extent necessary to maintain the Fund’s total annual operating expenses after fee waivers and/or reimbursement (exclusive of any taxes, interest, brokerage commissions, acquired fund fees and expenses, and extraordinary expenses, such as litigation or reorganization costs, but inclusive of organizational costs and offering costs) to an annual rate of 2.50%, 2.25%, and 2.75% of the average daily net assets of the Fund (the “Expense Limitation”) attributable to Class A, Class I and Class L Shares, respectively, until May 2, 2023.
Under the terms of the Expense Limitation Agreement, the Investment Adviser retains the right to seek reimbursement for any fees previously waived and/or expenses previously assumed, to the extent that such reimbursement will not cause Class A, Class I or Class L Shares’ annualized expenses to exceed the applicable Expense Limitation. The Fund is not obligated to reimburse the Investment Adviser for fees previously waived or expenses previously assumed by the Investment Adviser more than three years
35
THE PRIVATE SHARES FUND
Notes to the Financial Statements (Continued)
December 31, 2022
4. Expense limitation agreement — (continued)
after the date of such waiver or expense reimbursement. For the year ended December 31, 2019 and period between January 1, 2020 and December 9, 2020, the Fund’s previous investment adviser waived and/or reimbursed $1,467,342 and $1,048,038 of investment advisory fees and Fund expenses. These amounts are not subject to possible recoupment by the Investment Adviser. For the periods between December 9, 2020 and December 31, 2020, January 1, 2021 and December 31, 2021, and January 1, 2022 and December 31, 2022, the Investment Adviser waived investment advisory fees and/or reimbursed expenses in the amount of $16,222, $1,073,207, and $441,827, respectively. For the year ended December 31, 2022, Class A and Class L had recognized net recoupment of $184,461 and $5,663, respectively, and Class I had recognized a net waiver/reimbursement of $631,951. The remaining unrecouped amounts of $16,222, $1,073,207, and $441,827, respectively are subject to possible recoupment by the Investment Adviser through December 31, 2023, December 31, 2024, and December 31, 2025 respectively.
During the year ended December 31, 2022, there were legal expenses incurred by the Fund that were distinguishable in their characterization as being unusual in nature as well as not expected to be recurring in future periods. The amount caused the ratio of net expenses to average net assets of the Class A, Class I and Class L shares to exceed the contractual expense limitation. These certain expenses are not expected to be incurred in future periods. Please refer to the Financial Highlights for the Class A, Class I and Class L shares for the effect on the respective expense ratios.
5. Investment advisory agreement
The Fund has entered into an Investment Advisory Agreement with the Investment Adviser, pursuant to which the Investment Adviser provides general investment advisory services for the Fund. For providing these services, the Investment Adviser receives a fee from the Fund, accrued daily and paid monthly in arrears, at an annual rate equal to 1.90% of the Fund’s average daily net assets. For the year ended December 31, 2022, the Fund incurred $18,224,852 in investment advisory fees of which $1,574,711 is payable at December 31, 2022.
Certain officers of the Fund are also employees of the Investment Adviser. None of the Fund officers who are affiliated with the Investment Adviser receives any compensation from the Fund.
6. Capital share transactions
The Fund is offering an unlimited number of shares on a continuous basis at NAV. The value per share of the relevant class is calculated after receipt of the purchase, in good order, plus any applicable sales load.
As of December 31, 2022, ownership from affiliated parties represents 0.02% of the Fund.
The Fund’s shares are not redeemable each business day, are not listed for trading on an exchange, and no secondary market currently exists for Fund shares. As an interval fund and as described in the Fund’s prospectus, the Fund will make quarterly repurchase offers of 5% of the total number of shares outstanding at its NAV, unless postponed in accordance with regulatory requirements, and each repurchase pricing shall occur no later than the 14th day after the repurchase request deadline, or the next business day if the 14th day is not a business day. Rule 23c-3 of the 1940 Act permits repurchases between 5% and 25% of the Fund’s outstanding shares at NAV.
36
THE PRIVATE SHARES FUND
Notes to the Financial Statements (Continued)
December 31, 2022
6. Capital share transactions — (continued)
In every full quarter since the commencement of operations, the Fund has offered shareholders the opportunity to participate in this program. During the year ended December 31, 2022, the Fund had Repurchase Offers as follows:
Repurchase Offer
Notice | | Repurchase Request
Deadline | | | Repurchase Pricing
Date | | | Repurchase Offer
Amount | | | % of Shares
Repurchased | | | Number of Shares
Repurchased | |
February 23, 2022 | | | March 25, 2022 | | | | March 25, 2022 | | | | 5% | | | | 4.51% | | | | 933,332 | |
May 26, 2022* | | | June 24, 2022 | | | | June 24, 2022 | | | | 5% | | | | 7.00% | | | | 1,651,963 | |
August 25, 2022 | | | September 23, 2022 | | | | September 23, 2022 | | | | 5% | | | | 3.57% | | | | 869,953 | |
November 23, 2022* | | | December 23, 2022 | | | | December 23, 2022 | | | | 5% | | | | 7.00% | | | | 1,773,152 | |
* | The Fund is permitted to, but not required to, repurchase an additional 2% of all outstanding shares of the Fund. |
7. Purchases and sales of securities
Purchases and sales of investments for the year ended December 31, 2022, were $318,892,277 and $23,433,583, respectively.
8. Federal tax information
At December 31, 2022, gross unrealized appreciation and depreciation of investments based on cost for federal income tax purposes were as follows:
Cost of investments | | $ | 842,587,103 | |
Gross unrealized appreciation | | $ | 195,985,777 | |
Gross unrealized depreciation | | | (52,050,388 | ) |
Net unrealized appreciation on investments | | $ | 143,935,389 | |
GAAP requires that certain components of net assets be reclassified between financial and tax reporting. These reclassifications have no effect on net assets or net asset value per share. For the year ended December 31, 2022, permanent differences in book and tax accounting have been reclassified to paid-in capital and total distributable income/(loss) as follows:
Increase (Decrease) |
Paid in Capital | Total Distributable Income/(Loss) |
$(16,455,009) | $16,455,009 |
As of December 31, 2022, the components of accumulated earnings on a tax basis were as follows:
Undistributed ordinary income | | $ | — | |
Undistributed long-term capital gains | | | — | |
Tax accumulated earnings | | | — | |
Accumulated capital and other losses | | | (5,887,337 | ) |
Net unrealized gain | | | 143,935,389 | |
Payable for withholding attributed to profit sharing agreement | | | (63,447 | ) |
Total accumulated earnings | | $ | 137,984,605 | |
37
THE PRIVATE SHARES FUND
Notes to the Financial Statements (Continued)
December 31, 2022
8. Federal tax information — (continued)
The tax character of distributions paid during the fiscal years ended, December 31, 2022 and December 31, 2021 were as follows:
| | | 2022 | | | 2021 | |
Distributions Paid from: | | | | | | | | |
Ordinary Income | | $ | — | | | $ | — | |
Net Long Term Capital Gains | | | 14,486,991 | | | | 51,227,704 | |
Total Taxable Distributions Paid | | $ | 14,486,991 | | | $ | 51,227,704 | |
As of December 31, 2022, the Fund had post-October capital losses which are deferred until January 1, 2023 for tax purposes. Net capital losses incurred after October 31 and within the taxable year are deemed to arise on the first day of the Fund’s next taxable year.
Post-October capital losses | | | $5,887,337 | |
9. Commitments and contingencies
In the normal course of business, the Fund will enter into contracts that contain a variety of representations, provide general indemnifications, set forth termination provisions and compel the contracting parties to arbitration in the event of dispute. From time to time, the Fund may be a party to arbitration, or legal proceedings, in the ordinary course of business, including proceedings relating to the enforcement of provisions of such contracts. The Fund’s maximum exposure under these arrangements is unknown, as this would involve future claims that may be made against the Fund that would be subject to arbitration, generally.
In the normal course of business, the Fund may enter into agreements to purchase and sell investments. Such agreements are subject to certain rights of the issuers and ultimately, issuer approval. At December 31, 2022, the Fund had entered into agreements to purchase equity securities totaling $13,846,229 and no agreements had been entered into to sell existing securities. If approved by the issuers’, the Fund would record such purchase amounts as increases in costs of investment and such sale amounts as decreases in costs of investments, including recording the respective gains/loss on sale of investments.
At December 31, 2022, the Fund reasonably believes its assets will provide adequate coverage to satisfy all its unfunded commitments. The Fund’s policies and procedures prohibit it from entering into an unfunded commitment unless it has reserved enough cash and/or short-term investments to meet the funding requirements thereof. At December 31, 2022, the Fund had total unfunded capital commitments of $4,600,000 for investments in special purpose vehicles/private funds.
10. Offering price per share
A maximum front-end sales load of 5.75% for Class A shares and 4.25% for Class L is imposed on purchases. Class I shares are not subject to sales charge. For the year ended December 31, 2022, various broker dealers received $771,095 of sales charges from sales of the Fund’s shares.
11. Recent Market and Economic Developments
Social, political, economic and other conditions and events (such as natural disasters, epidemics and pandemics, terrorism, conflicts and social unrest) that occur from time to time will create uncertainty and may have significant impacts on issuers, industries, governments and other systems, including the financial markets, to which the Fund and the issuers in which it invests are exposed. As global systems, economies and financial markets are increasingly interconnected, events that once had only local impact are now more likely to have regional or even global effects. Events that occur in one country, region or financial market will, more
38
THE PRIVATE SHARES FUND
Notes to the Financial Statements (Continued)
December 31, 2022
11. Recent Market and Economic Developments — (continued)
frequently, adversely impact issuers in other countries, regions or markets, including in established markets such as the United States. These impacts can be exacerbated by failures of governments and societies to adequately respond to an emerging event or threat.
In early 2020, a novel coronavirus (SARS-CoV-2) and related respiratory disease (COVID-19) spread rapidly across the world, including to the United States. The coronavirus outbreak has resulted in, among other consequences, the closing of borders, the imposition of travel restrictions, enhanced health screenings, the need for accelerated acute healthcare service preparation and delivery, disruptions and delays in healthcare services, quarantines and “shelter at home” orders, restrictions on gatherings of people, event and service cancellations, business closures, disruptions to supply chains and customer activity, lower consumer demand for certain goods and services, as well as general heightened uncertainty. This outbreak has led and is likely to continue to lead to disruptions in the worldwide economy, particularly with respect to economies of nations where the novel coronavirus has arisen and also the global markets. This outbreak and any future outbreaks as well as any variants or mutations, could have a further adverse impact on the global economy in general. The ongoing effects of COVID-19 are unpredictable and its impact will depend on future developments and actions taken by authorities to contain such outbreak, and could result in significant and prolonged effects on the Fund and the issuers in which it invests.
Russia’s invasion of Ukraine in February, 2022, the resulting responses by the United States and other countries, and the potential for wider conflict, have increased and may continue to increase volatility and uncertainty in financial markets worldwide. The United States and other countries have imposed broad-ranging economic sanctions on Russia and Russian entities and individuals, and may impose additional sanctions, including on other countries that provide military or economic support to Russia. These sanctions, among other things, restrict companies from doing business with Russia and Russian issuers, and may adversely affect companies with economic or financial exposure to Russia and Russian issuers. The extent and duration of Russia’s military actions and the repercussions of such actions are not known. The invasion may widen beyond Ukraine and may escalate, including through retaliatory actions and cyberattacks by Russia and even other countries. These events may result in further and significant market disruptions and may adversely affect regional and global economies including those of Europe and the United States. Certain industries and markets, such as those involving oil, natural gas and other commodities, as well as global supply chains, may be particularly adversely affected. Whether or not the Fund invests in securities of issuers located in Russia, Ukraine and adjacent countries or with significant exposure to issuers in these countries, these events could negatively affect the value and liquidity of the Fund’s investments.
12. Recent Accounting Pronouncements
In December 2020, the SEC adopted a new rule providing a framework for fund valuation practices (“Rule 2a-5”). Rule 2a-5 establishes requirements for determining fair value in good faith for purposes of the 1940 Act. Rule 2a-5 will permit fund boards to designate certain parties to perform fair value determinations, subject to board oversight and certain other conditions. Rule 2a-5 also defines when market quotations are “readily available” for purposes of the 1940 Act and the threshold for determining whether a fund must fair value a security. In connection with Rule 2a-5, the SEC also adopted related recordkeeping requirements and is rescinding previously issued guidance, including with respect to the role of a board in determining fair value and the accounting and auditing of fund investments. The Fund has adopted procedures in accordance with Rule 2a-5.
On June 30, 2022, the FASB issued ASU 2022-03, which (1) clarifies the guidance in ASC 820 on the fair value measurement of an equity security that is subject to a contractual sale restriction and (2) requires specific disclosures related to such an equity security. ASU 2022-03’s amendments are effective for annual periods beginning after December 15, 2023, and interim periods within those fiscal periods. Early adoption is permitted.
39
THE PRIVATE SHARES FUND
Notes to the Financial Statements (Continued)
December 31, 2022
13. Subsequent events
In preparing these financial statements, management has evaluated subsequent events through the date of issuance of the financial statements included herein and has determined that there are no subsequent events that require disclosure or adjustment to the financial statements.
40
THE PRIVATE SHARES FUND
Report of Independent Registered Public Accounting Firm
To the Shareholders and Board of Trustees
The Private Shares Fund:
Opinion on the Financial Statements
We have audited the accompanying statement of assets and liabilities of The Private Shares Fund (the Fund), including the schedule of investments, as of December 31, 2022, the related statements of operations and cash flows for the year then ended, the statements of changes in net assets for each of the years in the two-year period then ended, and the related notes (collectively, the financial statements) and the financial highlights for each of the years in the five-year period then ended. In our opinion, the financial statements and financial highlights present fairly, in all material respects, the financial position of the Fund as of December 31, 2022, the results of its operations and its cash flows for the year then ended, the changes in its net assets for each of the years in the two-year period then ended, and the financial highlights for each of the years in the five-year period then ended, in conformity with U.S. generally accepted accounting principles.
Basis for Opinion
These financial statements and financial highlights are the responsibility of the Fund’s management. Our responsibility is to express an opinion on these financial statements and financial highlights based on our audits. We are a public accounting firm registered with the Public Company Accounting Oversight Board (United States) (PCAOB) and are required to be independent with respect to the Fund in accordance with the U.S. federal securities laws and the applicable rules and regulations of the Securities and Exchange Commission and the PCAOB.
We conducted our audits in accordance with the standards of the PCAOB. Those standards require that we plan and perform the audit to obtain reasonable assurance about whether the financial statements and financial highlights are free of material misstatement, whether due to error or fraud. Our audits included performing procedures to assess the risks of material misstatement of the financial statements and financial highlights, whether due to error or fraud, and performing procedures that respond to those risks. Such procedures included examining, on a test basis, evidence regarding the amounts and disclosures in the financial statements and financial highlights. Such procedures also included confirmation of securities owned as of December 31, 2022, by correspondence with custodians, issuers of securities, or other appropriate auditing procedures when replies from the issuers were not received. Our audits also included evaluating the accounting principles used and significant estimates made by management, as well as evaluating the overall presentation of the financial statements and financial highlights. We believe that our audits provide a reasonable basis for our opinion.

We have served as the Fund’s auditor since 2013.
Los Angeles, California
March 1, 2023
41
THE PRIVATE SHARES FUND
Trustees and Officers
December 31, 2022 (Unaudited)
The Board of Trustees of the Fund has overall responsibilty for monitoring the Fund’s investment program and its management and operations. The names of the Trustees and Officers of the Fund, their addresses, ages and principal occupations during the past five years are provided in the tables below. Trustees who are deemed “interested persons,” as defined in the 1940 Act, are included in the table titled “Interested Trustee and Officer.” Trustees who are not “interested persons” are referred to as “Independent Trustees.” The Fund’s Statement of Additional Information includes additional information about the Fund’s Trustees and is available, without charge and upon request, by calling 1-855-551-5510.
Name, Address(1)
and Age | Position(s)
held with
the Fund | Term of
Office and Length
of Time Served | Principal Occupation(s)
During Past Five Years | Number of
Portfolios in
Fund Complex
Overseen by
Trustee | Other
Directorships
Held by
Director |
INDEPENDENT TRUSTEES: | | | | |
Robert Boulware Age: 66 | Independent Trustee | Since
inception(2) | Professional board director and trustee. Managing Director, Pilgrim Funds, LLC | 1 | Brighthouse Financial, Trustee of Vertical Capital Fund |
Mark Radcliffe Age: 70 | Independent Trustee | Since
inception(2) | Partner, DLA Piper | 1 | N/A |
OFFICERS: | | | | | |
Kevin Moss Age: 53 | President | Since
April 11, 2019 | Managing Director of Liberty Street Advisors, Inc. since December 2020; Prior thereto, President and Chief Operating Officer of SP Investments Management LLC through December 2020. | N/A | N/A |
Jack Sweeney Age: 37 | Treasurer and Chief Financial Officer | Since
April 29, 2019 | Vice President of Liberty Street Advisors since December 2020; Chief Financial Officer at SP Investments Management LLC, March 2019 through December 2020; Finance Manager at Venrock, August 2016 to March 2019 and Senior Associate at Ernst &Young LLP, prior thereto. | N/A | N/A |
Peter Guarino Age: 64 | Chief Compliance Officer | Since
May 7, 2019 | President and Chief Compliance Officer, Compliance4 LLC (independent compliance consultancy) November 2008 to the present | N/A | N/A |
(1) | All addresses c/o The Private Shares Fund Fund, 88 Pine Street, Floor 31, Suite 3101, New York, NY 10005. |
(2) | Each Trustee will serve for the duration of the Fund, or until death, resignation, termination, removal or retirement. |
42
THE PRIVATE SHARES FUND
Additional Information
December 31, 2022 (Unaudited)
Proxy voting — A description of the policies and procedures that the Fund uses to determine how to vote proxies relating to portfolio securities and information regarding how the Fund voted proxies during the 12-month period ended June 30 are available without charge upon request by (1) calling the Fund at 1-855-551-5510 and (2) from Fund documents filed with the Securities and Exchange Commission (“SEC”) on the SEC’s website at www.sec.gov.
Portfolio holdings — The Fund files its complete schedule of portfolio holdings with the SEC for the first and third quarters of each fiscal year on form N-PORT-P. The Fund’s Form N-PORT-P is available on the SEC’s website at http://sec.gov. You may also obtain copies by calling the Fund at 1-855-551-5510.
Additional tax disclosure (unaudited) — Pursuant to IRC 852(b)(3) of the Internal Revenue Code, The Private Shares Fund hereby designates $14,486,991 as long-term capital gains distributed during the year ended, December 31, 2022.
Consideration for renewal of the Investment Advisory agreement — At the meeting of the board of trustees held on November 8, 2022 (the “Meeting”), the Board of Trustees of the Fund (including the trustees who are not “interested” within the meaning of Section 2(a)(19) of the Investment Company Act of 1940 (the “Independent Trustees”, voting separately) renewed the Investment Advisory Agreement (the “Advisory Agreement”) with Liberty Street Advisors, Inc. (the “Adviser”).
In the course of their consideration of the Advisory Agreement, the Independent Trustees met in executive session and were advised throughout the process by their independent counsel. The Independent Trustees evaluated the terms of the Advisory Agreement and reviewed with counsel their duties and responsibilities in evaluating and approving the continuation of the Advisory Agreement. In considering the Advisory Agreement, the Board reviewed the materials provided to it by the Adviser, as supplemented based on requests of the Independent Trustees and by information provided orally at the Meeting. As part of its evaluation, the Board, including the Independent Trustees, considered, among other things, the following factors: (1) the nature, extent, and quality of the services to be provided by the Advisor; (2) the investment performance of the Fund; (3) the costs of the services to be provided and profits to be realized by the Adviser and their affiliates from the relationship with the Fund; (4) the extent to which economies of scale would be realized as the Fund grows; and (5) any other benefits received by the Adviser serving the Fund. The Independent Trustees considered the Adviser’s written response, as supplemented by the Adviser’s additional oral responses at the meeting, and determined that the content of the Adviser’s responses satisfied their requests for information to support their decision to consider and approve the Advisory Agreement.
The Board, including the Independent Trustees, concluded that the Advisory Agreement should enable the Fund to obtain high quality services at a cost that is appropriate, reasonable, and in the interests of investors. They concluded that prudent exercise of judgment warranted the approval of the continuation of the Advisory Agreement. It also was noted that the Board’s decision to approve the Advisory Agreement was not based on any single factor, but rather was based on a comprehensive consideration of all the information provided to the Board. Upon consideration of these and other factors, the Board, including the Independent Trustees, also determined:
The nature, extent and quality of the advisory services to be provided. The Board considered: the background and experience of key investment personnel and the Adviser’s ability to retain them; addition of certain Adviser personnel; the Adviser’s focus on analysis of a complex asset category; the Adviser’s disciplined investment process; the Adviser’s investment in and commitment to personnel; the Adviser’s internal compliance efforts and the Adviser’s risk and general oversight; and the Adviser’s oversight of and interaction with service providers. The Board concluded that the nature, extent and quality of the management and advisory service to be provided are appropriate and thus support a decision to approve the Advisory Agreement.
The investment performance of the Fund. The Board evaluated the historical performance of the Fund and comparative information provided regarding the Fund’s investment performance and information on the performance of other investment funds and various indices. The Board also considered the various performance reports received throughout the year. The Board noted the limitations of comparisons to other registered funds in light of the Fund’s relatively unique portfolio and strategy in the registered
43
THE PRIVATE SHARES FUND
Additional Information (Continued)
December 31, 2022 (Unaudited)
fund context and the limitations inherent in peer analysis under such circumstances. On the basis of the Board’s assessment, the Board concluded that the Adviser was capable of generating a level of long-term investment performance that is consistent with the Fund’s investment objective, policies and strategies.
The cost of advisory service to be provided and profits to be realized by the Advisor. In analyzing the cost of services and profitability of the Adviser, the Board considered the revenues and expenses of the Adviser and the Fund’s size. The Board took into account the entrepreneurial investment by and cost to the Adviser regarding investment management infrastructure to support the Fund and other support for Fund investors. In addition, the Board recognized the subjective nature of determining profitability and recognized the difficulties in making comparisons, as the profitability of similar advisers generally is not publicly available and the profitability information that is available for certain advisers or management firms may not be representative of the industry and may be affected by, among other considerations, the Adviser’s particular business mix, capital costs, types of funds managed and expense allocations. On the basis of the Board’s review of the fees charged by the Adviser for investment advisory and related services (including to their other clients), the specialized nature of the Fund’s investment program, the Adviser’s financial information, and the costs associated with managing the Fund, the Board concluded that the investment management fee and the Adviser’s profitability are reasonable in light of the services provided and the management fees and overall expense ratios of comparable funds and other clients of the Adviser.
The extent to which economies of scale would be realized as the Fund grows and whether fee levels reflect these economies of scale. The Board noted the expense limitation agreements put in place by the Adviser, under which the Adviser continues to pay a portion of the Fund’s expenses, and concluded that the Fund’s management fee is reasonable and fair under the current circumstances. The Board noted that it will have the opportunity to periodically re-examine whether the Fund has achieved economies of scale, as well as the appropriateness of management fees payable to the Adviser.
Benefits to the Adviser from its relationship with the Fund. The Board considered the other benefits derived by the Adviser from its relationship with the Fund, to the extent such benefits are identifiable or determinable. The Board reviewed the potential for other fall-out benefits to the Adviser, including reputational benefits and the potential for growth of the Adviser’s other business lines through association with the Fund, and concluded that such benefits are reasonable and typical of those potentially received by managers of publicly offered funds. The Board also noted that the Adviser does not receive soft dollars. Thus, the Board concluded that other benefits derived by the Adviser from its relationship with the Fund, to the extent such benefits are identifiable or determinable, are reasonable and fair, result from the provision of appropriate services to the Fund and investors therein, and are consistent with industry practice and the best interests of the Fund and its shareholders.
Other considerations. The Board determined that the Adviser has made a substantial commitment to managing the Fund’s assets, monitoring compliance and provision of service, as well as the financial and operational resources reasonably necessary to manage the Fund in a professional manner that is consistent with the best interests of the Fund and its shareholders.
44
THIS PAGE INTENTIONALLY LEFT BLANK
THIS PAGE INTENTIONALLY LEFT BLANK

Board of Trustees
Robert J. Boulware
Mark Radcliffe
Investment Adviser
Liberty Street Advisors, Inc.
88 Pine Street, 31st Floor, Suite 3101
New York, NY 10005
Dividend Paying Agent, Transfer Agent
UMB Fund Services
235 West Galena Street
Milwaukee, WI 53212
Custodian
UMB Bank National Association
1010 Grand Boulevard
Kansas City, MO 64106
Distributor
Foreside Fund Services, LLC
Three Canal Plaza, Suite 100
Portland, ME 04101
Independent Auditors
KPMG LLP
550 South Hope Street, Suite 1500
Los Angeles, CA 90071
This report has been prepared for the general information of the shareholders. It is not authorized for distribution to prospective investors unless preceded or accompanied by a current prospectus. The Fund’s prospectus contains more complete information about the objectives, policies, expenses and risks of the Funds. The Fund is not a bank deposit, not FDIC insured and may lose value. Please read the prospectus carefully before investing or sending money.
This report contains certain forward looking statements which are subject to known and unknown risks and uncertainties that could cause actual results to differ materially from those expressed or implied by such statements. Forward looking statements generally include words such as ‘‘believes’’, ‘‘expects’’, ‘‘anticipates’’ and other words of similar import. Such risks and uncertainties include, among other things, the Risk Factors noted in the Fund’s filings with the Securities and Exchange Commission. The Fund undertakes no obligation to update any forward looking statement.
(b) There were no notices transmitted to stockholders in reliance on Rule 30e-3 under the Investment Company Act of 1940, as amended, that contained disclosures specified by paragraph (c)(3) of that rule.
Item 2. Code of Ethics.
The Registrant has a code of ethics (the “Code”) that applies to the Registrant’s principal executive officer and principal financial officer. During the period covered by this report, there were no material amendments to the provisions of the Code, nor were there any implicit or explicit waivers to the provisions of the Code. The Code is filed herewith.
Item 3. Audit Committee Financial Expert.
The Registrant does not have an audit committee financial expert. The Board of Trustees of the Registrant has determined that the members of its Audit Committee have sufficient financial experience to ensure the proper functioning of that committee, but that neither of the members has the requisite expertise or experience to be deemed an “audit committee financial expert” for purposes of the definition of such term in the Instructions to this Item 3 on Form N-CSR.
Item 4. Principal Accountant Fees and Services.
The aggregate fees for professional services by KPMG LLP during the fiscal year 2022 and 2021 were as follows:
(a) Audit Fees.
| Fiscal year ended December 31, 2022: | $ 450,000 |
| Fiscal year ended December 31, 2021: | $ 340,000 |
(b) Audit-Related Fees.
| Fiscal year ended December 31, 2022: | $ 0.00 |
| Fiscal year ended December 31, 2021: | $ 0.00 |
(c) Tax Fees. These are fees billed for professional services rendered by the Registrant’s independent auditors for tax compliance, tax advice, and tax planning.
| Fiscal year ended December 31, 2022: | $ 24,500 |
| Fiscal year ended December 31, 2021: | $ 15,100 |
(d) All Other Fees.
| Fiscal year ended December 31, 2022: | $ 0.00 |
| Fiscal year ended December 31, 2021: | $ 0.00 |
(e) Audit Committee’s pre-approval policies and procedures.
| | (1) | The Audit Committee has adopted pre-approval policies and procedures that require the Audit Committee to pre-approve all audit and non-audit services of the Registrant, including services provided to the Registrant’s investment adviser or any entity controlling, controlled by or under common control with the Registrant’s investment adviser that provides ongoing services to the Registrant with respect to any engagement that directly relates to the operations and financial reporting of the Registrant. |
| | (2) | Services approved pursuant to paragraph (c)(7)(i)(C) of Rule 2-01 of Regulation S-X: 100% of these fees were approved by the Audit Committee as required pursuant to paragraph (c)(7)(ii) of Rule 2-01 of Regulation S-X. |
(f) None.
(g) During the last two fiscal years, there were no other non-audit services rendered by the Registrant’s independent auditors to the Registrant, its investment adviser or any entity controlling, controlled by or under the common control with the investment adviser that provides ongoing services to the Registrant.
(h) Not applicable.
Item 5. Audit Committee of Listed Registrants.
Not applicable.
Item 6. Schedule of Investments.
Included as part of the report to shareholders filed under Item 1 of this Form N-CSR.
Item 7. Disclosure of Proxy Voting Policies and Procedures for Closed-End Management Investment Companies.
The Board of Trustees of the Registrant has adopted the Proxy Voting Policy of Liberty Street Advisors, Inc (“Liberty”), the Registrant’s investment adviser, as the Registrant’s Proxy Voting Procedures. Subject to the oversight of the Registrant’s Board of Trustees, the Registrant has delegated responsibility to the Adviser to vote any proxies the Registrant may receive. The Adviser’s general policy is to vote proxy proposals, amendments, consents or resolutions relating to the Registrant in a manner that serves the best interests of the Registrant.
Adviser’s Proxy Voting Policy
Liberty, as a matter of policy and as a fiduciary to its clients that are registered management investment companies (“Clients”), permits Clients to delegate proxy voting authority to Liberty, consistent with the best economic interests of the Clients. All Client proxies are voted in accordance with the Adviser’s Proxy Voting Guidelines, as described below.
As part of its fiduciary duties to the Registrant, Liberty will vote proxies. With respect to each proxy proposal, Liberty will consider the period of time that the particular security is expected to be held for an account, the size of the holding, the costs involved with the proxy proposal, the existing corporate governance structure, and the current management and operations for the particular company. Typically, Liberty will vote proxies in accordance with management’s recommendations. However, in situations where Liberty believes that management is acting on its own behalf or acting in a manner that is adverse to the rights of the company’s shareholders, Liberty will not vote with management.
For each proxy, Liberty also considers whether there are any specific facts and circumstances that may give rise to a material conflict of interest on the part of Liberty in voting the proxy. If it is determined that a material conflict of interest may exist, the proxy will be referred to Liberty’s Investment Committee to decide if Liberty may vote the proxy or if the proxy should be referred to the Registrant to vote. All instances where Liberty determines a material conflict of interest may exist are resolved in the best interests of the Registrant. Liberty retains final authority and fiduciary responsibility for proxy voting.
Item 8. Portfolio Managers of Closed-End Management Investment Companies.
(a)(1) Identification of Portfolio Manager(s) and Description of Role of Portfolio Manager(s).
As of December 31, 2022, the portfolio management team of the Registrant was comprised of Kevin Moss, Christian Munafo and Sven Jonas Grankvist (the “Portfolio Management Team”). The Portfolio Management Team was primarily responsible for the day-to-day portfolio management of the Registrant.
Mr. Moss is a Managing Director of Liberty Street Advisors, Inc. and serves as both a portfolio manager and member of the Liberty Investment Committee. Prior to joining Liberty, he was with SP Investments Management, LLC (“SPIM”), a registered investment adviser and wholly owned subsidiary of SharesPost, Inc. For eight years he served as SPIM’s President and COO overseeing the operations and trading of SPIM. He is also one of the creators of the SharesPost 100 Fund and continues to serve as the President of the Fund and is one of the portfolio managers. Prior to joining SPIM, Kevin was a senior portfolio manager at First New York Securities, where he managed a global macro book. With over 20 years of senior level experience in financial services, Kevin’s specific areas of expertise include the management of client relationships, investment research coverage, block and position trading, and operations management. Kevin began his career as an institutional equity sales trader working for Instinet, and later Commerzbank. His client base included hedge funds, pension funds and proprietary trading desks. Subsequently, Kevin held a series of distinguished posts at leading hedge funds and proprietary trading firms including serving as the head of international trading for Libra Advisors and Opus Trading Funds. Mr. Moss holds a Bachelor of Science from Tulane University and an MBA from Columbia University.
Mr. Munafo is the Chief Investment Officer of Liberty Street Advisors, Inc. and serves as both a portfolio manager and member of the Liberty Investment Committee. Prior to joining Liberty, he was Chief Investment Officer of SP Investments Management, LLC. Mr. Munafo joined SP Investments Management in August 2019, where he also served as one of the portfolio managers and members of the investment committee. Prior to his position with the Investment Adviser, Mr. Munafo was Co-Head of the Global Private Equity Secondary Practice at HQ Capital based in New York, where he was also a member of the senior leadership team. Prior to that, he served as Head of Secondaries at Thomas Weisel Partners. Mr. Munafo has over 20 years of experience in finance, with the last 18 years focused on secondary investments involving venture-backed and growth equity-oriented companies and funds. During this time, he has also served on the boards of many of these companies and funds. In aggregate, Mr. Munafo has helped raise more than $2 billion globally from institutional investors, corporations, pensions, endowments and family offices. In addition, Mr. Munafo has overseen the completion of more than 100 secondary transactions representing over $2 billion in capital commitments, ranging from traditional purchases of limited partnership interests to more complex non-traditional transactions including fund restructurings, recapitalizations, tender programs, preferred equity/loan facilities and purchases of company securities. Mr. Munafo began his career as an investment banker focused on mergers and acquisitions at Banc of America Securities. Mr. Munafo holds a Bachelor of Arts from Rutgers College in Economics and Finance.
Mr. Grankvist is a Managing Director of Liberty Street Advisors, Inc. and serves as both a portfolio manager and a member of the Liberty Investment Committee. Prior to joining Liberty, he was with SP Investments Management, LLC, a registered investment adviser, for eight years. He is also an initial member of the SharesPost 100 Fund team and has been instrumental in developing and overseeing the daily valuation procedures. During his tenure as portfolio manager, he has led or helped lead hundreds of primary and secondary direct transactions for over 60 leading growth stage private companies, with responsibilities including due diligence, originating, negotiating and deal execution. Jonas began his career as a technology investment banker at Berman Capital. Jonas received his LLM from Uppsala University and MBA from Golden Gate University, magna cum laude.
(a)(2) Other Accounts Managed by Portfolio Manager(s) or Management Team Member and Potential Conflicts of Interest.
(i) As of December 31st, 2022, Messrs. Moss, Munafo, and Grankvist were the portfolio managers for, and primarily responsible for the day-to-day portfolio management of, the Private Shares Opportunities Fund LLC (“Private Shares Opportunity Fund”) and the GAM LSA Private Shares (Cayman) Master Fund.
(ii) (A) Zero.
(B) Two (1), Private Shares Opportunity Fund. Total assets of Private Shares Opportunity Fund managed by Messrs. Moss, Munafo, and Grankvist as of December 31, 2022 were approximately $38,600,000. (2), GAM LSA Private Shares (Cayman) Master Fund. Total assets of GAM LSA Private Shares (Cayman) Master Fund managed by Messrs. Moss, Munafo, and Grankvist as of December 31, 2022 were approximately $18,415,736.
(C) Zero.
(iii) Two (2) accounts. As of December 31, 2022, $33,200,000 of the assets in the Private Shares Opportunity Fund were subject to performance fee. As of December 31, 2022, $0 of the assets in the GAM Master Fund were subject to performance fee.
(iv) A material conflict could arise in respect of the allocation of investment opportunities between the Registrant, Private Shares Opportunity Fund, and the GAM LSA Private Shares (Cayman) Master Fund as all entities have a substantially similar investment strategy to invest in the equity securities of private companies. However, to address such potential conflict of interest, Liberty has adopted allocation policies and procedures designed to address such conflict. It is Liberty’s practice to allocate investments among the portfolios of clients managed by Liberty, (collectively, “Client accounts”) on a fair and equitable basis in a manner that is consistent with the investment objective(s) of the Client accounts. The policy prohibits any allocation of investments in a manner that Liberty’s proprietary accounts or affiliated accounts (“Affiliate accounts”), or any particular client(s) or group of clients receive more favorable treatment than other Client accounts. Liberty considers an Affiliate account to include accounts and funds in which Liberty, or any partner or officer of Liberty or any portfolio manager of the client funds (“Affiliate personnel”), directly or indirectly has a material ownership interest, or where Liberty Street or Affiliate personnel receive a management fee or participate in a performance fee or allocation as advisor, member, and/or portfolio manager to such account.
In general, the proposed allocation will be pro rata among eligible participating Client accounts that are not Affiliate accounts. Affiliate accounts will be allocated such securities only after all eligible participating Client accounts have received their allocation. Specific to the Registrant, Affiliate accounts, including the Private Shares Opportunity Fund, will be allocated such securities only after the Registrant has received its allocation. However, the proposed allocation will also take into consideration other relevant factors including, but not limited to, the size of each Client and Affiliate account’s proposed allocation, liquidity needs, cash flow, investment or regulatory restrictions and previous allocations. While Liberty will endeavor to allocate pro rata in the first instance based on the relative size of the participating Client account(s), Liberty may use other methods of allocation – provided that such methods are fair and equitable.
(a)(3) Compensation Structure of Portfolio Manager(s).
As of December 31, 2022, compensation for the Registrant’s Portfolio Management Team consists of base salary and bonus, which is in part dependent upon the overall performance of Liberty. The compensation is monitored to ensure competitiveness in the external marketplace.
(a)(4) Disclosure of Securities Ownership.
The following table sets forth the dollar range of equity securities beneficially owned by the Portfolio Management Team in the Registrant as of December 31, 2022:
| Portfolio Manager | Dollar Range of Registrant Shares Beneficially Owned |
| Kevin Moss | $10,000 - $50,000 |
| Christian Munafo | $10,000 - $50,000 |
| Sven Jonas Grankvist | $10,000 - $50,000 |
Item 9. Purchases of Equity Securities by Closed-End Management Investment Company and Affiliated Purchasers.
REGISTRANT PURCHASES OF EQUITY SECURITIES
Class A
Period | | (a) Total Number of Shares (or Units) Purchased | | | (b) Average Price Paid
per Share (of Unit) | | | (c) Total Number of Shares (or Units) Purchased as Part of Publicly Announced Plans or Programs | | | (d) Maximum
Number (or Approximate Dollar Value) of Shares (or Units) that May Yet Be Purchased Under the Plans or Programs | |
| Jan. 1-31, 2022 | | | 0 | | | | 0 | | | | 0 | | | | 0 | |
| Feb. 1-28, 2022 | | | 0 | | | | 0 | | | | 0 | | | | 0 | |
| Mar. 1-31, 2022 | | | 167,082 | | | $ | 43.44 | | | | 0 | | | | 0 | |
| Apr. 1-30, 2022 | | | 0 | | | | 0 | | | | 0 | | | | 0 | |
| May 1-31, 2022 | | | 0 | | | | 0 | | | | 0 | | | | 0 | |
| Jun. 1-30, 2022 | | | 366,456 | | | $ | 43.28 | | | | 0 | | | | 0 | |
| Jul. 1-31, 2022 | | | 0 | | | | 0 | | | | 0 | | | | 0 | |
| Aug. 1-31, 2022 | | | 0 | | | | 0 | | | | 0 | | | | 0 | |
| Sep. 1-30, 2022 | | | 104,308 | | | $ | 42.73 | | | | 0 | | | | 0 | |
| Oct. 1-31, 2022 | | | 0 | | | | 0 | | | | 0 | | | | 0 | |
| Nov. 1-30, 2022 | | | 0 | | | | 0 | | | | 0 | | | | 0 | |
| Dec. 1-31, 2022 | | | 145,882 | | | $ | 41.80 | | | | 0 | | | | 0 | |
| Total | | | 783,728 | | | $ | 42.97 | | | | 0 | | | | 0 | |
Class I
Period | | (a) Total Number of Shares (or Units) Purchased | | | (b) Average Price Paid per Share (of Unit) | | | (c) Total Number of Shares (or Units) Purchased as Part of Publicly Announced Plans or Programs | | | (d) Maximum Number (or Approximate Dollar Value) of Shares (or Units) that May Yet Be Purchased Under the Plans or Programs | |
| Jan. 1-31, 2022 | | | 0 | | | | 0 | | | | 0 | | | | 0 | |
| Feb. 1-28, 2022 | | | 0 | | | | 0 | | | | 0 | | | | 0 | |
| Mar. 1-31, 2022 | | | 762,815 | | | $ | 43.94 | | | | 0 | | | | 0 | |
| Apr. 1-30, 2022 | | | 0 | | | | 0 | | | | 0 | | | | 0 | |
| May 1-31, 2022 | | | 0 | | | | 0 | | | | 0 | | | | 0 | |
| Jun. 1-30, 2022 | | | 1,285,148 | | | $ | 43.81 | | | | 0 | | | | 0 | |
| Jul. 1-31, 2022 | | | 0 | | | | 0 | | | | 0 | | | | 0 | |
| Aug. 1-31, 2022 | | | 0 | | | | 0 | | | | 0 | | | | 0 | |
| Sep. 1-30, 2022 | | | 758,714 | | | $ | 43.27 | | | | 0 | | | | 0 | |
| Oct. 1-31, 2022 | | | 0 | | | | 0 | | | | 0 | | | | 0 | |
| Nov. 1-30, 2022 | | | 0 | | | | 0 | | | | 0 | | | | 0 | |
| Dec. 1-31, 2022 | | | 1,606,737 | | | $ | 42.37 | | | | 0 | | | | 0 | |
| Total | | | 4,413,414 | | | $ | 43.22 | | | | 0 | | | | 0 | |
Class L
Period | | (a) Total Number of Shares (or Units) Purchased | | | (b) Average Price Paid per Share (of Unit) | | | (c) Total Number of Shares (or Units) Purchased as Part of Publicly Announced Plans or Programs | | | (d) Maximum Number (or Approximate Dollar Value) of Shares (or Units) that May Yet Be Purchased Under the Plans or Programs | |
| Jan. 1-31, 2022 | | | 0 | | | | 0 | | | | 0 | | | | 0 | |
| Feb. 1-28, 2022 | | | 0 | | | | 0 | | | | 0 | | | | 0 | |
| Mar. 1-31, 2022 | | | 3,435 | | | $ | 42.96 | | | | 0 | | | | 0 | |
| Apr. 1-30, 2022 | | | 0 | | | | 0 | | | | 0 | | | | 0 | |
| May 1-31, 2022 | | | 0 | | | | 0 | | | | 0 | | | | 0 | |
| Jun. 1-30, 2022 | | | 359 | | | $ | 42.78 | | | | 0 | | | | 0 | |
| Jul. 1-31, 2022 | | | 0 | | | | 0 | | | | 0 | | | | 0 | |
| Aug. 1-31, 2022 | | | 0 | | | | 0 | | | | 0 | | | | 0 | |
| Sep. 1-30, 2022 | | | 6,931 | | | $ | 42.20 | | | | 0 | | | | 0 | |
| Oct. 1-31, 2022 | | | 0 | | | | 0 | | | | 0 | | | | 0 | |
| Nov. 1-30, 2022 | | | 0 | | | | 0 | | | | 0 | | | | 0 | |
| Dec. 1-31, 2022 | | | 20,533 | | | $ | 41.26 | | | | 0 | | | | 0 | |
| Total | | | 31,258 | | | $ | 41.67 | | | | 0 | | | | 0 | |
On February 23, 2022, May 26, 2022, August 25, 2022, and November 23, 2022, the Registrant offered to repurchase 933,332, 1,651,963, 869,953, and 1,773,152 shares, respectively, pursuant to its periodic repurchase plan.
Item 10. Submission of Matters to a Vote of Security Holders.
Not applicable.
Item 11. Controls and Procedures.
| (a) | Assessment of the Registrant’s Control Environment The Registrant’s disclosure controls and procedures are designed to ensure that information required to be disclosed in the reports that the Registrant files or submits under the Securities Exchange Act of 1934, as amended (the “Exchange Act”), and the Investment Company Act of 1940, as amended, is recorded, processed, summarized and reported within the time periods specified in the rules and forms of the Securities and Exchange Commission. Disclosure controls and procedures include, without limitation, controls and procedures designed to ensure that such information is accumulated and communicated to the Registrant’s management (“Management”), including its principal executive officer and principal financial officer, as appropriate, to allow timely decisions regarding required disclosure. Management, including the principal executive officer and principal financial officer, recognizes that any set of controls and procedures, no matter how well designed and operated, can provide only reasonable assurance of achieving the desired control objectives. Within 90 days prior to the filing date of the Shareholder Report on Form N-CSR, Management carried out an evaluation of the effectiveness of the design and operation of the Registrant’s disclosure controls and procedures. Based on this evaluation, the principal executive officer and principal financial officer concluded that the Registrant’s disclosure controls and procedures were effective, except as disclosed below. A material weakness (as defined in Rule 12b-2 under the Exchange Act) is a deficiency, or a combination of deficiencies, in internal control over financial reporting such that there is a reasonable possibility that a material misstatement of the Registrant’s annual or interim financial statements will not be prevented or detected on a timely basis. Management and the Registrant’s independent registered public accounting firm identified a material weakness specific to the Registrant’s design and operation of controls relating to the valuation of a private equity investment in accordance with U.S. GAAP. Specifically, for one of the portfolio investments, Management ascribed a higher weighting to unobservable inputs than to available observable inputs, resulting in an audit adjustment, which is reflected in the financial statements included herein, to decrease the fair value of the private equity investment and net change in unrealized gain on the investment for the year ended December 31, 2022. This material weakness did not result in a misstatement of previously issued financial statements. |
| | Management’s Remediation Plan |
| | Management is implementing enhancements to the Registrant’s fair value controls and procedures to remediate the material weakness described above. The Registrant uses established Valuation Procedures to value level 3 portfolio securities, which follow the standards prescribed in Accounting Standards Codification Topic 820 Fair Value Measurements. In determining fair values of equity securities of private portfolio companies, Management uses a process that incorporates in its valuation model a combination of observable and unobservable inputs. Although Management believes that the overall valuation model and process are operating effectively, in the instance with respect to the Registrant’s portfolio investment described above, the valuation model ascribed a lesser weighting to certain observable inputs than to certain inputs that were classified as unobservable for which sufficient documentation was unavailable. Management, through its Valuation Committee, has undertaken steps to implement enhancements to its review processes that incorporate additional control activities to assess fair value models related to private equity securities. These additional controls include assessment of the observable inputs used in the fair value models, as well as review of the weighting of unobservable inputs compared to observable inputs to prevent weighting discrepancy such as that described above from occurring. Management will not consider the material weakness to be remediated until the applicable controls have operated for a sufficient period of time and Management has concluded, through testing, that these controls are designed and operating effectively. |
| (b) | Other than the enhancements to controls noted above, there were no changes in the Registrant’s internal control over financial reporting (as defined in Rule 30a-3(d) under the Act (17 CFR 270.30a-3(d)) that occurred during the period covered by this report that materially affected, or were reasonably likely to materially affect, the Registrant’s internal control over financial reporting. |
Item 12. Disclosure of Securities Lending Activities for Closed-End Management Investment Companies
The Fund has not engaged in Security Lending Activities.
Item 13. Exhibits.
| (a) (4) | Change in the registrant’s independent public accountant. Not applicable. |
SIGNATURES
Pursuant to the requirements of the Securities Exchange Act of 1934 and the Investment Company Act of 1940, the Registrant has duly caused this report to be signed on its behalf by the undersigned, thereunto duly authorized.
The Private Shares Fund
| /s/ Kevin Moss | |
| By: Kevin Moss | |
| President | |
| March 10, 2023 | |
Pursuant to the requirements of the Securities Exchange Act of 1934 and the Investment Company Act of 1940, this report has been signed below by the following persons on behalf of the Registrant and in the capacities and on the dates indicated.
| /s/ Kevin Moss | |
| By: Kevin Moss | |
| President | |
| March 10, 2023 | |
| /s/ Jack Sweeney | |
| By: Jack Sweeney | |
| Principal Financial Officer | |
| March 10, 2023 | |