UNITED STATES
SECURITIES AND EXCHANGE COMMISSION
Washington, D.C. 20549
FORM N-CSR
CERTIFIED SHAREHOLDER REPORT OF REGISTERED
MANAGEMENT INVESTMENT COMPANIES
Investment Company Act File Number 811-22759
The Private Shares Fund
(Exact name of registrant as specified in charter)
88 Pine Street, 31st Floor, Suite 3101
New York, NY 10005
(Address of principal executive offices) (Zip code)
Cogency Global, Inc.
c/o The Private Shares Fund
850 New Burton Rd. Ste. 201
City of Dover, County of Kent, Delaware 19904
(Name and address of agent for service)
Copies to:
Dechert LLP
One Bush Street, Suite 1600
San Francisco, CA 94104-4446
Registrant's telephone number, including area code: (800) 279-7754
Date of fiscal year end: December 31
Date of reporting period: December 31, 2021
Item 1. Reports to Stockholders.
(a) The following is a copy of the report transmitted to shareholders pursuant to Rule 30e-1 under the Investment Company Act of 1940, as amended.

THE PRIVATE SHARES FUND
Table of Contents | |
Shareholder Letter | 2 |
Fund Performance | 9 |
Fund Performance & Portfolio Diversification | 10 |
Schedule of Investments | 13 |
Statement of Assets and Liabilities | 20 |
Statement of Operations | 21 |
Statements of Changes in Net Assets | 22 |
Statement of Cash Flows | 23 |
Financial Highlights | 24 |
Notes to the Financial Statements | 27 |
Report of Independent Registered Public Accounting Firm | 37 |
Trustees and Officers | 38 |
Additional Information | 39 |
1
THE PRIVATE SHARES FUND
Shareholder Letter
PORTFOLIO MANAGER 2021 COMMENTARY
The Private Shares Fund (the “Fund”) is pleased to report that for calendar year 2021, the Fund generated a total return of 24.13% as measured by the Fund’s Institutional Class (PIIVX), and was able to achieve those returns with a significantly lower level of volatility than the broader market. The strong results were generated during another unusual year in the financial markets.
The National Venture Capital Association (NVCA) reported approximately 17,054 U.S. Venture Capital (VC)-backed deals closed in 2021, representing total deal value of $329.6 billion, nearly double the previous record of $166.6 billion in 2020. While the number of deals also increased meaningfully compared to 2020, the average deal size continued to trend higher. Despite ongoing headwinds from the COVID-19 pandemic, the U.S. VC Industry remained resilient, posting records for both investments into high-growth private companies and proceeds generated by exits for 2021.
While late-stage investment activity has been rising over the last decade as many companies have continued to stay private for longer, we believe the impacts of COVID-19 made this segment of the market even more attractive. There has been less perceived risk compared to earlier stage companies and investors are looking to allocate more capital to their perceived winners. In parallel, the trend of significant capital inflows from nontraditional investor groups, including sovereign wealth funds, mutual funds, hedge funds and crossover investors has continued through the pandemic. To be more specific, nontraditional investors participated in an estimated 6,483 deals representing $253.5 billion in deal value during 2021.
Late-stage Venture Capital investment in 2021 easily surpassed previous full-year records and has been the largest contributor to overall VC deal value. An estimated 5,055 late-stage deals representing $228.3 billion of deal value was deployed in 2021 (representing 69% of total US VC-backed deal value), compared to the prior full-year record in 2020 of $112.6 billion across 3,444 deals. Mega-deal value (VC late-stage deals over $100 million) also recorded a new high with $190.6 billion deployed across 819 deals, more than doubling the prior record in 2020 of $76.5 billion across 335 deals. These outsized mega-deals represented 83% of all Late-Stage VC deal activity for 2021 and benefited from increased participation of non-traditional investors.
As an aside, it is worth noting that early-stage VC activity in 2021 also set a new annual record, with total value of $84.3 billion across 5,351 deals, which exceeds all prior full-year record totals and eclipsing $80 billion for the first time ever. This is nearly double the prior record when early-stage VC deal value hovered just above $40 billion for the last three consecutive years. This data supports a clear trend of larger investors entering companies at earlier stages in the traditional venture lifecycle, which has also resulted in larger median and average valuations.
In terms of liquidity, VC exit activity for 2021 also set a new annual record with total exit value of $774 billion realized across 1,875 deals, representing a 238% increase from the previous record set in 2020. This also marks the first-year exit deal value surpassed $500 billion. Initial Public Offerings (IPOs) represented most of the exit value with $681.5 billion realized through 296 VC-backed public listings, representing a 114.5% YoY Growth. Special Purpose Acquisition Companies (SPACs) activity set a new annual record with 556 new vehicles and roughly $134.9 billion in capital raised for 2021. That said, sentiment regarding SPACs began to trend negative earlier this year with underperformance and increasing questions on long-term viability. Lastly, Mergers & Acquisitions (M&As) activity remained robust with $79 billion in total exit value realized across 1,007 exits, representing a 15% increase in exit value and a 33% increase in number of exits from the prior annual record set in 2020.
In the ending months of 2021, the CBOE Volatility Index (VIX) began to increase but remained well below peak levels as compared to March 2020. Recent increases in volatility and pressure on major public market indices has been largely driven by a combination of rising inflation, anticipated Fed rate hikes and balance sheet tightening, labor market challenges, ongoing Covid-19 variants, and general concerns around the impacts these measures may have on both the sustainability of corporate growth rates and earnings. We expect to see increased pressure heading into 2022 while these factors persist.
While our portfolio of late-stage VC-backed growth companies is not immune to what may happen if these challenges persist over a longer time period, we have been pleased by the overall performance and resiliency thus far and will continue to monitor developments. In our view, we believe the bigger implication will be that companies planning to raise capital may face greater pressure on valuation and terms, and it may take companies longer to exit.
2
THE PRIVATE SHARES FUND
Shareholder Letter (Continued)
As long-term investors in private market technology innovation and disruption, we believe the Fund could potentially continue to benefit from value creation across sectors including fintech, artificial intelligence, cyber-security, cloud, data storage and analytics, online education, supply chain optimization, e-commerce, digital health, and the space economy. During 2021, the Fund invested approximately $300 million across 33 new positions and 15 add-ons to existing positions. The Fund also benefitted by generating roughly $95.2 million in liquidity proceeds as several portfolio companies went public or were acquired. We believe that many of the companies held by the Fund have differentiated business models, are operated by seasoned management teams, backed by strong VCs, and have healthy balance sheets to help manage through market cycles.
Historically, the Fund’s Net Asset Value (NAV) has been relatively stable during periods of public market stress like those in 2016 and 2018, during which we were able to invest in some very strong names at attractive prices. Similarly, the Fund’s NAV has remained relatively stable in this COVID-19 environment, and we have continued investing throughout this cycle. It is the experience of the Fund’s portfolio managers that periods of increased volatility and uncertainty in the public equity markets and overall macro environment are often good catalysts for increasing the supply of opportunities in the private markets. In other words, these catalysts may improve supply and demand imbalances in favor of buyers and investors as owners of illiquid assets tend to become more risk averse and prefer liquidity. These types of enviroments often result in more attractive risk adjusted entry points. As a result, vintages involving periods of increased public market activity and macro uncertainty have the potential to generate outperformance. So, while this may appear a bit counter intuitive, these environments could create great buying and investing opportunities in the private markets while simultaneously maintaining discipline, relying upon our comprehensive diligence process and leveraging our relationships across the private market ecosystem.
NEW PORTFOLIO ADDITIONS
As mentioned previously, the Fund added 33 new positions during 2021. Below is a brief summary of those companies:
Betterment (Q1)
Provider of an independent online financial adviser designed to help customers manage their financial assets.
Invaio Sciences (Q1)
Operator of multi-platform technology company intended to solve pressing agriculture, nutrition, and environmental challenges.
Crossover Health (Q1)
Operator of a platform intended to identify and provide personalized employee care experiences for a healthy and motivated workforce.
Beta Technologies (Q2)
Developer of aerospace technologies designed to be used in electric vertical takeoff and landing (eVTOL) aircraft and recharging pad systems.
Pavilion Data (Q2)
Provider of data processing solutions for data-driven applications.
Domino Data Labs (Q2)
Provides data science teams with a platform that allows enterprises to manage and scale data.
Collective Health (Q2)
Provides an integrated solution that allows self-funded employers to administer plans, control costs, and offer better options for their people.
3
THE PRIVATE SHARES FUND
Shareholder Letter (Continued)
Tradeshift (Q2)
Developer of a financial platform software intended to help facilitate supply chain innovations for the digitally connected economy.
Kraken (Q2)
Financial platform for cryptocurrency
Lyst (Q3)
Operator of an online fashion retail platform designed to connect shoppers globally with fashion designers and fashion stores.
MasterClass (Q3)
Operator of an online education platform designed to offer video-based online vocational courses taught by celebrities, athletes and business executives.
Cybereason (Q3)
Operator of cloud-based endpoint detection and cyber-security platform intended to protect companies from advanced cyber attacks.
Relativity Space (Q3)
Operator of an aerospace company intended to build an autonomous rocket factory and launch services for satellites.
BlockFi (Q3)
Developer of a wealth management platform designed to seamlessly manage crypto and other digital assets.
Automation Anywhere (Q3)
Provider of robotic process automation designed to work side by side with humans to handle repetitive routines and tasks found within many industries.
Eruditus Learning (Q3)
Provider of executive education programs intended for mid-career professionals.
CiBO (Q3)
Operator of a land information platform intended to facilitate agriculture scaling with unbiased information and direct connections.
Ocrolus (Q3)
Developer of a human-in-the-loop fintech infrastructure platform intended to automate back-office tasks with precision.
GOAT (Q3)
Provider of an online footwear marketplace intended to buy and sell sneakers online.
Stealth Investment Company (Q3)
Developer of space systems designed to simplify interplanetary transportation.
Farmer’s Business Network (Q3)
Farmers Business Network is a provider of a farmer-to-farmer agronomic information network designed to help farmers in the management of their data and gain insights from each other.
4
THE PRIVATE SHARES FUND
Shareholder Letter (Continued)
EquipmentShare (Q4)
Developer of a fleet management platform intended to serve contractors and original equipment manufacturers.
Impossible Foods (Q4)
Producer of plant-based meat substitutes intended to combine natural ingredients into food products.
Verbit (Q4)
Developer of interactive transcription and captioning platform intended to generate detailed speech-to-text files.
CaaStle (Q4)
Operator of a subscription rental platform designed to permit retailers to offer Clothing as a Service (CaaS) to their consumers.
Mynd (Q4)
Operator of a property management platform intended to ease property rental management services.
Fathom Digital Manufacturing Corporation (Q4)
Fathom is a leading on-demand digital manufacturing platform in North America, providing comprehensive product development and on-demand manufacturing services to many of the largest and most innovative companies in the world.
Omada Health (Q4)
Operator of a digital care platform intended to empower people to achieve their health goals through sustainable lifestyle change.
Arctic Wolf (Q4)
Arctic Wolf helps companies end cyber risk by providing security operations as a concierge service.
TMGcore (Q4)
TMGcore is an award-winning U.S. based provider of High-Performance Computing solutions.
Invenia Technical Computing (Q4)
Developer of a cloud-based machine learning software designed to use data and algorithms in order to add efficiency in electricity transmission.
PORTFOLIO COMPANY LIQUIDITY ACTIVITY
HIMS (Q1)
On January 21, 2021, Hims & Hers Health (HIMS) began trading on the NYSE via a de-SPAC with Oaktree Acquisition Corp. HIMS started trading at $17.08 and closed at $15.06. The Fund fully exited its position in HIMS in Q4 2021.
ChargePoint (Q1)
On March 1, 2021, ChargePoint (CHPT) began trading on the NYSE via a de-SPAC with Switchback Energy Acquisition Corp. CHPT started trading at $32.30 and closed at $30.11. The Fund fully exited its position in CHPT in Q2 2021.
DigitalOcean (Q1)
On March 24, 2021, DigitalOcean (DOCN) began trading on the NYSE. DOCN initially priced its shares at $47.00, started trading at $41.50, and closed at $42.50 (valuing the company at roughly $4.5 billion). The Fund fully exited its position in DOCN in Q4 2021.
5
THE PRIVATE SHARES FUND
Shareholder Letter (Continued)
Sprinklr (Q2)
On April 4, 2021, the fund completed a secondary sale of its stake in Sprinklr.
Darktrace (Q2)
On April 30, 2021, Darktrace (DARK) began trading on the London Stock Exchange. DARK initially priced its shares at £250, started trading at £350, and closed at £330 (valuing the company at roughly £3 billion). The Fund fully exited its position in DARK in Q3 2021.
SoFi (Q2)
On June 1, 2021, SoFI (SOFI) began trading on the Nasdaq via a de-SPAC with Social Capital Hedosophia Corp V. SOFI started trading at $21.97 and closed at $22.65. The Fund fully exited its position in SOFI in Q3 2021.
Marqeta (Q2)
On June 9, 2021, Marqeta (MQ) began trading on the Nasdaq. MQ initially priced its shares at $27.00, started trading at $32.50, and closed at $30.52 (valuing the company at roughly $16 billion).
23andMe (Q2)
On June 17, 2021, 23andMe (ME) began trading on the Nasdaq via a de-SPAC with VG Acquisition Corp. ME started trading at $11.13 and closed at $13.32.
Blend Labs (Q3)
On July 16, 2021, Blend Labs (BLND) began trading on the NYSE. BLND initially priced its shares at $18.00, started trading at $20.00, and closed at $20.90 (valuing the company at roughly $4 billion).
Robinhood (Q3)
On July 29, 2021, Robinhood (HOOD) began trading on the Nasdaq. HOOD initially priced its shares at $38.00, started trading at $38.00, and closed at $34.82 (valuing the company at roughly $29 billion).
XANT (Q3)
On August 2, 2021, Aurea Software announced that it had acquired XANT, Inc. The Fund fully wrote off its position in Q3 2021.
Chartboost (Q3)
On August 4, 2021, Zynga announced that it had acquired Chartboost for approximately $250 million. The Fund fully exited its position in Q3 2021.
Udemy (Q4)
On October 29, 2021, Udemy (UDMY) began trading on the Nasdaq. UDMY initially priced its shares at $29.00, started trading at $27.00, and closed at $27.50 (valuing the company at roughly $3.7 billion).
Nextdoor (Q4)
On November 8, 2021, Nextdoor (KIND) began trading on the NYSE via a de-SPAC with Khosla Ventures Acquisition Co. II. KIND started trading at $11.74 and closed at $13.01.
6
THE PRIVATE SHARES FUND
Shareholder Letter (Continued)
Planet Labs (Q4)
On December 8, 2021, Planet Labs (PL) began trading on the NYSE via a de-SPAC with dMY Technology Group IV. PL started trading at $11.25 and closed at $11.35.
Fathom (Q4)
On December 23, 2021, Fathom (FATH) began trading on the NYSE via a de-SPAC with Altimar Acquisition Corp. II. FATH started trading at $9.50 and closed at $10.53.
CBOE Volatility Index measures the stock market’s expectation of volatility based on S&P 500 index options. One cannot invest in an index.
A SPAC is a publicly traded company with no commercial operations that raises investment capital via an initial public offering (IPO) for the purpose of identifying and acquiring one or more operating businesses or assets.
IMPORTANT DISCLOSURE
Investment in the Fund involves substantial risk. The Fund is not suitable for investors who cannot bear the risk of loss of all or part of their investment. The Fund is appropriate only for investors who can tolerate a high degree of risk and do not require a liquid investment. All investing involves risk including the possible loss of principal. Shares in the Fund are highly illiquid, and can be sold by shareholders only in the quarterly repurchase program of the Fund which allows for up to 5% of the Fund’s outstanding shares at NAV to be redeemed each quarter. As a result, you may not be able to sell your shares when, or in the amount that, you desire. The Fund intends to primarily invest in securities of private, late-stage, venture-backed growth companies. There are significant potential risks relating to investing in such securities. Because most of the securities in which the Fund invests are not publicly traded, the Fund’s investments will be valued by Liberty Street Advisors, Inc. (the “Investment Adviser”) pursuant to fair valuation procedures and methodologies adopted by the Board of Trustees, as set forth in the prospectus. As a consequence, the value determined for a security may differ materially from the value that could be realized upon the sale of the security. There are significant potential risks associated with investing in venture capital and private equity-backed companies with complex capital structures. The Fund focuses its investments in a limited number of securities, which could subject it to greater risk than that of a larger, more varied portfolio. There is a greater focus in technology securities that could adversely affect the Fund’s performance. The Fund is a non-diversified investment company, and as such, the Fund may invest a greater percentage of its assets in the securities of a smaller number of issuers than a diversified fund. The Fund’s quarterly repurchase policy may require the Fund to liquidate portfolio holdings earlier than the Investment Adviser would otherwise do so and may also result in an increase in the Fund’s expense ratio. Portfolio holdings of private companies that become publicly traded likely will be subject to more volatile market fluctuations than when private, and the Fund may not be able to sell shares at favorable prices. Such companies frequently impose lock-ups that would prohibit the Fund from selling shares for a period of time after an initial public offering (IPO). Market prices of public securities held by the Fund may decline substantially before the Investment Adviser is able to sell the securities. The Fund may invest in private securities utilizing special purpose vehicles (“SPVs”), private investments in public equity (“PIPE”) transactions where the issuer is a special purpose acquisition company (“SPAC”), and profit sharing agreements. The Fund will bear its pro rata portion of expenses on investments in SPVs or similar investment structures and will have no direct claim against underlying portfolio companies. PIPE transactions involve price risk, market risk, expense risk, and the Fund may not be able to sell the securities due to lock-ups or restrictions. Profit sharing agreements may expose the Fund to certain risks, including that the agreements could reduce the gain the Fund otherwise would have achieved on its investment, may be difficult to value and may result in contractual disputes. Certain conflicts of interest involving the Fund and its affiliates could impact the Fund’s investment returns and limit the flexibility of its investment policies. This is not a complete enumeration of the Fund’s risks. Please read the Fund prospectus for other risk factors related to the Fund.
7
THE PRIVATE SHARES FUND
Shareholder Letter (Continued)
All investing involves risk including the possible loss of principal. Shares in the Fund are highly illiquid, and you may not be able to sell your shares when, or in the amount that, you desire. The Fund intends to primarily invest in securities of private, late-stage, venture-backed growth companies. There are significant potential risks relating to investing in such securities. Because most of the securities in which the Fund invests are not publicly traded, the Fund’s investments will be valued by the Investment Adviser pursuant to fair valuation procedures and methodologies adopted by the Board of Trustees.
There are significant potential risks associated with investing in venture capital and private equity-backed companies with complex capital structures. The Fund focuses its investments on a limited number of securities, which could subject it to greater risk than that of a larger, more varied portfolio. There is a greater focus in technology securities which could adversely affect the Fund’s performance. The inclusion of various indices is for comparison purposes only. The performance of an index is not an exact representation of any particular investment, as you cannot invest directly in an index.
The Fund’s quarterly repurchase policy may require the Fund to liquidate portfolio holdings earlier than the Investment Adviser would otherwise do so, and may also result in an increase in the Fund’s expense ratio. This is not a complete enumeration of the Fund’s risks. Please read the Fund prospectus for other risk factors related to the Fund, its investment strategy and your investment in the Fund, and other additional details.
8
THE PRIVATE SHARES FUND
Fund Performance
December 31, 2021 (Unaudited)
As of December 31, 2021, the Fund’s performance is as follows:
Total Return Information (Unaudited) |
The Private Shares Fund
– Class A
(Inception Date: 03/25/2014) | Five
Years | Three
Years | One Year | Annualized
Since Inception | Cumulative
Since Inception |
Returns based on Purchase Without Any Sales Charge (NAV) | 11.33% | 17.30% | 23.85% | 11.28% | 129.48% |
Returns based on Purchase With Maximum Sales Charge of 5.75% (POP) | 10.02% | 15.00% | 16.71% | 10.44% | 116.28% |
Fund Benchmark | | | | | |
Russell 2000® Index | 12.02% | 20.02% | 14.82% | 10.11% | 111.38% |
The Private Shares Fund – Class I
(Inception Date: 11/17/2017) | Three
Years | One Year | Annualized
Since Inception | Cumulative
Since Inception |
Returns based on Purchase Without Any Sales Charge (NAV) | 17.58% | 24.13% | 14.67% | 75.76% |
Fund Benchmark | | | | |
Russell 2000® Index | 20.02% | 14.82% | 11.84% | 58.57% |
The Private Shares Fund – Class L
(Inception Date: 05/11/2018) | Three
Years | One Year | Annualized
Since Inception | Cumulative
Since Inception |
Returns based on Purchase Without Any Sales Charge (NAV) | 16.99% | 23.52% | 13.82% | 60.21% |
Returns based on Purchase With Maximum Sales Charge of 4.25% (POP) | 15.30% | 18.27% | 12.47% | 53.40% |
Fund Benchmark | | | | |
Russell 2000® Index | 20.02% | 14.82% | 11.05% | 46.44% |
Performance data quoted represents past performance and is no guarantee of future results. POP performance assumes a maximum sales load of 5.75% (Class A) and 4.25% (Class L) on all sales. Investment return and principal value will fluctuate so that an investor’s shares, when redeemed, may be worth more or less than original cost. Current performance may be lower or higher than the performance data quoted. For performance as of the most recent month-end, please call 1-855-551-5510. Some of the Fund’s fees were waived or expenses reimbursed; otherwise, returns would have been lower. The Fund’s total annual expenses per the currently stated prospectus are 2.56% (Class A), 2.38% (Class I), and 2.75% (Class L). The Adviser has contractually agreed to waive fees and/or reimburse expenses such that the total expenses do not exceed 2.50% (Class A), 2.25% (Class I), and 2.75% (Class L) through December 9, 2022.
9
THE PRIVATE SHARES FUND
Fund Performance & Portfolio Diversification
December 31, 2021 (Unaudited)
Growth of $10,000 Investment

This graph illustrates the hypothetical investment of $10,000 in the Class A from March 25, 2014 (Class inception) to December 31, 2021. The Total Return Information table and Growth of $10,000 Investment graph do not reflect the deduction of taxes that a shareholder would pay on fund distributions or the redemption of fund shares. The Public Offering Price (“POP”) assumes an initial investment of $9,425 ($10,000 less the maximum sales load of 5.75%). The Net Asset Value (“NAV”) assumes no sales load.
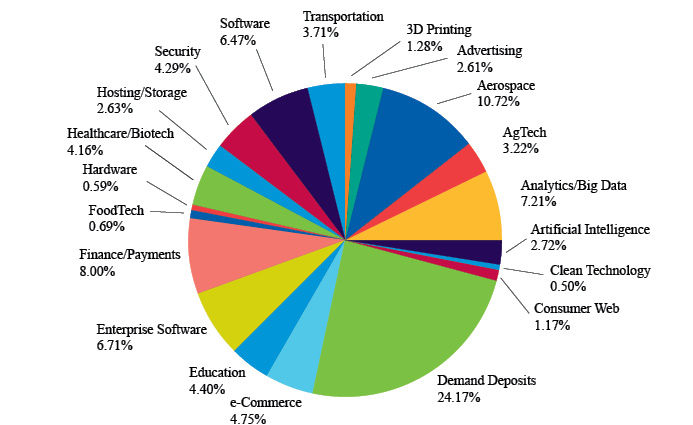
Fund Sector Diversification
The following chart provides a visual breakdown of the Fund by the industry sectors that underlying securities represent as a percentage of the total investments.
10
THE PRIVATE SHARES FUND
Portfolio Composition
December 31, 2021 (Unaudited)
Fund Holdings
11
THE PRIVATE SHARES FUND
Portfolio Composition (Continued)
December 31, 2021 (Unaudited)
Fund Holdings (Continued)

12
THE PRIVATE SHARES FUND
Schedule of Investments
December 31, 2021
| | Acquisition
Date | | Shares | | | Cost | | | Fair Value | |
COMMON STOCK IN PUBLIC COMPANIES — 5.1% | | | | | | | | | | | | |
3D PRINTING — 0.7% | | | | | | | | | | | | | |
Fathom Digital Manufacturing, Corp.(a)(b)(c) | Dec 2021 | | | 500,000 | | | $ | 5,000,000 | | | $ | 5,000,000 | |
| | | | | | | | | | | | | | |
ANALYTICS/BIG DATA — 0.1% | | | | | | | | | | | | | |
Planet Labs, Inc.(a) | Mar 2018 | | | 141,479 | | | | 540,302 | | | | 870,096 | |
| | | | | | | | | | | | | | |
CONSUMER WEB — 1.0% | | | | | | | | | | | | | |
Nextdoor(a)(c) | Nov 2018 | | | 925,479 | | | | 5,037,326 | | | | 7,042,895 | |
| | | | | | | | | | | | | | |
EDUCATION — 1.1% | | | | | | | | | | | | | |
Udemy, Inc.(a)(c) | Aug 2019 | | | 424,326 | | | | 6,024,987 | | | | 8,087,653 | |
| | | | | | | | | | | | | | |
ENTERPRISE SOFTWARE — 0.2% | | | | | | | | | | | | | |
Blend Labs, Inc.(a) | Aug 2018 | | | 200,216 | | | | 645,279 | | | | 1,469,585 | |
| | | | | | | | | | | | | | |
FINANCE/PAYMENTS — 1.2% | | | | | | | | | | | | | |
Marqeta, Inc.(a) | Jul 2018 | | | 452,133 | | | | 528,996 | | | | 7,763,124 | |
Robinhood Markets, Inc.(a) | Jul 2019 | | | 65,500 | | | | 870,298 | | | | 1,163,280 | |
| | | | | | | | | 1,399,294 | | | | 8,926,404 | |
HEALTHCARE/BIOTECH — 0.8% | | | | | | | | | | | | | |
23andMe, Inc.(a) | Oct 2017 | | | 874,260 | | | | 5,575,973 | | | | 5,822,571 | |
TOTAL COMMON STOCK IN PUBLIC COMPANIES | | | | | | | | 24,223,161 | | | | 37,219,204 | |
| | | | | | | | | | | | | | |
COMMON STOCK IN PRIVATE COMPANIES(c) — 30.6% | | | | | | | | | | | | |
3D PRINTING — 0.6% | | | | | | | | | | | | | |
Carbon, Inc.(a) | Jun 2019 | | | 158,853 | | | | 2,125,214 | | | | 4,271,557 | |
| | | | | | | | | | | | | | |
ADVERTISING — 2.6% | | | | | | | | | | | | | |
GroundTruth (f.k.a. xAd, Inc.)(a) | Oct 2016 | | | 1,659,427 | | | | 446,424 | | | | 497,828 | |
NextRoll (f.k.a. AdRoll)(a) | Mar 2017 | | | 1,073,155 | | | | 6,079,050 | | | | 13,178,344 | |
OpenX(a) | Jun 2015 | | | 2,899,297 | | | | 2,615,386 | | | | 3,566,135 | |
WideOrbit, Inc. (a) | Oct 2015 | | | 400,000 | | | | 1,100,000 | | | | 1,556,000 | |
| | | | | | | | | 10,240,860 | | | | 18,798,307 | |
AEROSPACE — 5.9% | | | | | | | | | | | | | |
Axiom Space, Inc.(a) | Mar 2021 | | | 29,543 | | | | 5,099,983 | | | | 5,505,633 | |
Relativity Space(a) | Oct 2021 | | | 437,922 | | | | 9,999,993 | | | | 9,999,993 | |
SpaceX(a) | May 2019 | | | 49,020 | | | | 10,049,100 | | | | 27,451,200 | |
| | | | | | | | | 25,149,076 | | | | 42,956,826 | |
AGTECH — 0.7% | | | | | | | | | | | | | |
Farmers Business Network(a) | Sep 2021 | | | 87,500 | | | | 5,042,625 | | | | 5,438,808 | |
See accompanying Notes to the Financial Statements
13
THE PRIVATE SHARES FUND
Schedule of Investments (Continued)
December 31, 2021
| | | Acquisition
Date | | | Shares | | | Cost | | | Fair Value | |
COMMON STOCK IN PRIVATE COMPANIES(c) — 30.6% (Continued) | | | | | | | | | | | | |
ANALYTICS/BIG DATA — 4.1% | | | | | | | | | | | | | | | | |
Baktus, Inc(a) | | | Apr 2015 | | | | 9,740 | | | $ | 1,500,951 | | | $ | 20,406 | |
Dataminr, Inc.(a) | | | Sep 2015 | | | | 189,583 | | | | 1,559,716 | | | | 8,191,882 | |
Domino Data Labs, Inc.(a) | | | Apr 2021 | | | | 330,000 | | | | 4,118,400 | | | | 5,355,900 | |
INRIX, Inc.(a) | | | May 2014 | | | | 133,238 | | | | 3,026,249 | | | | 7,545,268 | |
SingleStore (f.k.a. MemSQL)(a) | | | May 2020 | | | | 308,000 | | | | 616,000 | | | | 1,629,320 | |
Tealium(a) | | | Sep 2020 | | | | 200,000 | | | | 1,300,000 | | | | 2,664,000 | |
ThoughtSpot, Inc.(a) | | | Oct 2018 | | | | 162,087 | | | | 1,745,758 | | | | 4,186,707 | |
| | | | | | | | | | | | 13,867,074 | | | | 29,593,483 | |
ARTIFICIAL INTELLIGENCE — 0.4% | | | | | | | | | | | | | | | | |
Brain Corp.(a) | | | Dec 2020 | | | | 500,000 | | | | 2,040,000 | | | | 2,760,000 | |
| | | | | | | | | | | | | | | | | |
CLEAN TECHNOLOGY — 0.1% | | | | | | | | | | | | | | | | |
WiTricity(a)(f) | | | Mar 2021 | | | | 166,667 | | | | 1,667 | | | | 521,668 | |
| | | | | | | | | | | | | | | | | |
CONSUMER WEB — 0.2% | | | | | | | | | | | | | | | | |
Wag Labs, Inc.(a) | | | Oct 2018 | | | | 438,828 | | | | 2,314,001 | | | | 1,364,755 | |
| | | | | | | | | | | | | | | | | |
E-COMMERCE — 0.1% | | | | | | | | | | | | | | | | |
GOAT(a)(f) | | | Sep 2021 | | | | 128,148 | | | | 760,724 | | | | 753,510 | |
| | | | | | | | | | | | | | | | | |
EDUCATION — 2.4% | | | | | | | | | | | | | | | | |
Course Hero(a) | | | Jun 2020 | | | | 270,000 | | | | 3,429,200 | | | | 9,795,600 | |
Eruditus Learning(a)(f) | | | Aug 2021 | | | | 36,265 | | | | 5,065,228 | | | | 5,015,450 | |
Udacity, Inc.(a) | | | Nov 2018 | | | | 448,075 | | | | 2,884,586 | | | | 2,939,372 | |
| | | | | | | | | | | | 11,379,014 | | | | 17,750,422 | |
ENTERPRISE SOFTWARE — 4.0% | | | | | | | | | | | | | | | | |
Algolia(a) | | | Jan 2020 | | | | 45,000 | | | | 420,000 | | | | 1,307,250 | |
Automation Anywhere(a) | | | Jul 2021 | | | | 50,000 | | | | 1,545,000 | | | | 1,375,500 | |
D2iQ (f.k.a. Mesosphere, Inc.)(a) | | | Feb 2019 | | | | 165,000 | | | | 1,605,450 | | | | 869,550 | |
EquipmentShare(a) | | | Oct 2021 | | | | 86,850 | | | | 9,985,874 | | | | 9,887,004 | |
KeepTruckin(a) | | | May 2019 | | | | 788,562 | | | | 3,420,734 | | | | 5,685,532 | |
Tebra (a) | | | Nov 2020 | | | | 190,009 | | | | 1,235,126 | | | | 1,723,391 | |
Trax Ltd. (a) | | | Mar 2020 | | | | 149,970 | | | | 5,100,000 | | | | 8,585,782 | |
| | | | | | | | | | | | 23,312,184 | | | | 29,434,009 | |
See accompanying Notes to the Financial Statements
14
THE PRIVATE SHARES FUND
Schedule of Investments (Continued)
December 31, 2021
| | | Acquisition
Date | | | Shares | | | Cost | | | Fair Value | |
COMMON STOCK IN PRIVATE COMPANIES(c) — 30.6% (Continued) | | | | | | | | | | | | |
FINANCE/PAYMENTS — 2.8% | | | | | | | | | | | | | | | | |
Betterment(a) | | | Mar 2021 | | | | 588,235 | | | $ | 4,999,998 | | | $ | 7,390,349 | |
Circle Internet Financial, Inc.(a) | | | Apr 2018 | | | | 290,200 | | | | 2,604,825 | | | | 7,580,024 | |
Kraken(a) | | | Jun 2021 | | | | 105,218 | | | | 5,079,228 | | | | 5,463,971 | |
Prosper Marketplace, Inc.(a) | | | Jan 2016 | | | | 244,130 | | | | 1,307,998 | | | | 183,097 | |
| | | | | | | | | | | | 13,992,049 | | | | 20,617,441 | |
HARDWARE — 0.6% | | | | | | | | | | | | | | | | |
Tempo Automation, Inc.(a) | | | Aug 2019 | | | | 550,000 | | | | 1,868,000 | | | | 4,301,000 | |
| | | | | | | | | | | | | | | | | |
HEALTHCARE/BIOTECH — 0.6% | | | | | | | | | | | | | | | | |
Click Therapeutics, Inc. (a) | | | Nov 2020 | | | | 1,000,000 | | | | 3,500,000 | | | | 3,470,000 | |
ZocDoc, Inc.(a) | | | Feb 2015 | | | | 61,016 | | | | 1,321,708 | | | | 1,177,609 | |
| | | | | | | | | | | | 4,821,708 | | | | 4,647,609 | |
HOSTING/STORAGE — 1.8% | | | | | | | | | | | | | | | | |
Rubrik(a) | | | Sep 2019 | | | | 126,281 | | | | 3,220,166 | | | | 3,083,782 | |
TMGcore, Inc.(a) | | | Dec 2021 | | | | 1,596 | | | | 10,000,000 | | | | 9,998,940 | |
| | | | | | | | | | | | 13,220,166 | | | | 13,082,722 | |
SECURITY — 2.7% | | | | | | | | | | | | | | | | |
Arctic Wolf(a) | | | Dec 2021 | | | | 900,901 | | | | 10,000,000 | | | | 9,351,352 | |
Code 42 Software, Inc.(a) | | | May 2016 | | | | 330,000 | | | | 754,500 | | | | 1,277,100 | |
Exabeam, Inc.(a) | | | Jul 2021 | | | | 54,500 | | | | 1,590,855 | | | | 1,570,145 | |
Tanium(a) | | | Apr 2019 | | | | 640,000 | | | | 4,787,200 | | | | 7,379,200 | |
| | | | | | | | | | | | 17,132,555 | | | | 19,577,797 | |
SOFTWARE — 1.0% | | | | | | | | | | | | | | | | |
Docker, Inc.(a) | | | May 2017 | | | | 2,500 | | | | 531,250 | | | | 15,850 | |
Malwarebytes(a) | | | Dec 2019 | | | | 188,173 | | | | 1,129,038 | | | | 4,181,204 | |
Mynd Management(a) | | | Dec 2021 | | | | 166,390 | | | | 3,060,012 | | | | 3,161,410 | |
| | | | | | | | | | | | 4,720,300 | | | | 7,358,464 | |
TOTAL COMMON STOCK IN PRIVATE COMPANIES | | | | | | | | | | | 151,987,217 | | | | 223,228,378 | |
| | | | | | | | | | | | | | | | | |
PREFERRED STOCK IN PRIVATE COMPANIES(c) — 30.4% | | | | | | | | | | | | |
ADVERTISING — 0.0% | | | | | | | | | | | | | | | | |
GroundTruth (f.k.a. xAd, Inc.), Preferred Series B-1(a) | | | Jan 2017 | | | | 600,000 | | | | 149,200 | | | | 180,000 | |
| | | | | | | | | | | | | | | | | |
AEROSPACE — 2.8% | | | | | | | | | | | | | | | | |
Axiom Space, Inc., Preferred Series B(a) | | | Dec 2020 | | | | 32,221 | | | | 2,019,958 | | | | 6,004,706 | |
Beta Technologies, Preferred Series A(a) | | | Apr 2021 | | | | 40,944 | | | | 2,999,967 | | | | 3,003,242 | |
Stealth Company Investment, Preferred Series Seed 2(a) | | | Sep 2021 | | | | 303,668 | | | | 999,999 | | | | 1,000,009 | |
Relativity Space, Preferred Series E(a) | | | Jul 2021 | | | | 437,922 | | | | 10,299,992 | | | | 9,999,993 | |
| | | | | | | | | | | | 16,319,916 | | | | 20,007,950 | |
See accompanying Notes to the Financial Statements
15
THE PRIVATE SHARES FUND
Schedule of Investments (Continued)
December 31, 2021
| | | Acquisition
Date | | | Shares | | | Cost | | | Fair Value | |
PREFERRED STOCK IN PRIVATE COMPANIES(c) — 30.4% (Continued) | | | | | | | | | | | | |
AGTECH — 2.5% | | | | | | | | | | | | | | | | |
Cibo, Preferred Series C(a)(f) | | | Aug 2021 | | | | 600,000 | | | $ | 3,090,000 | | | $ | 3,000,000 | |
Farmers Business Network, Preferred Series G(a) | | | Sep 2021 | | | | 160,880 | | | | 10,199,946 | | | | 9,999,947 | |
Invaio Sciences, Inc., Preferred Series C(a)(f) | | | Mar 2021 | | | | 1,061,390 | | | | 5,150,000 | | | | 4,967,305 | |
| | | | | | | | | | | | 18,439,946 | | | | 17,967,252 | |
ANALYTICS/BIG DATA — 2.3% | | | | | | | | | | | | | | | | |
Dataminr, Inc., Preferred Series A(a) | | | Apr 2019 | | | | 20,000 | | | | 198,000 | | | | 864,200 | |
Dataminr, Inc., Preferred Series B(a) | | | Apr 2019 | | | | 87,496 | | | | 866,211 | | | | 3,780,702 | |
Heap, Preferred Series C(a) | | | May 2019 | | | | 1,361,503 | | | | 4,999,997 | | | | 11,520,494 | |
Heap, Preferred Series D(a) | | | Nov 2021 | | | | 84,047 | | | | 711,170 | | | | 711,172 | |
| | | | | | | | | | | | 6,775,378 | | | | 16,876,568 | |
ARTIFICIAL INTELLIGENCE — 2.3% | | | | | | | | | | | | | | | | |
Invenia, Preferred Series B-2(a)(f) | | | Dec 2021 | | | | 117,119 | | | | 10,000,000 | | | | 10,000,000 | |
Verbit, Preferred Series A(a) | | | Nov 2021 | | | | 2,382 | | | | 693,256 | | | | 693,329 | |
Verbit, Preferred Series B(a) | | | Nov 2021 | | | | 14,409 | | | | 4,194,173 | | | | 4,194,028 | |
Verbit, Preferred Series E-1(a) | | | Nov 2021 | | | | 4,008 | | | | 1,166,667 | | | | 1,166,608 | |
Verbit, Preferred Series Seed 2(a) | | | Nov 2021 | | | | 3,250 | | | | 945,904 | | | | 945,977 | |
| | | | | | | | | | | | 17,000,000 | | | | 16,999,942 | |
CLEAN TECHNOLOGY — 0.4% | | | | | | | | | | | | | | | | |
WiTricity, Preferred Series A(a) | | | Oct 2020 | | | | 1,000,000 | | | | 1,020,000 | | | | 3,130,000 | |
| | | | | | | | | | | | | | | | | |
CONSUMER WEB — 0.0% | | | | | | | | | | | | | | | | |
Musely, Preferred Series B(a) | | | Oct 2014 | | | | 7,961 | | | | 100,012 | | | | 88,367 | |
| | | | | | | | | | | | | | | | | |
E-COMMERCE — 4.6% | | | | | | | | | | | | | | | | |
Caastle, Preferred Series A-12(a) | | | Dec 2021 | | | | 806,460 | | | | 5,000,052 | | | | 5,000,052 | |
GOAT, Preferred Series A-1(a)(f) | | | Sep 2021 | | | | 112,563 | | | | 668,206 | | | | 661,870 | |
GOAT, Preferred Series A-5(a)(f) | | | Sep 2021 | | | | 2,394 | | | | 14,211 | | | | 14,077 | |
GOAT, Preferred Series A-7(a)(f) | | | Sep 2021 | | | | 146,495 | | | | 869,637 | | | | 861,391 | |
GOAT, Preferred Series B(a)(f) | | | Sep 2021 | | | | 231,687 | | | | 1,375,362 | | | | 1,362,320 | |
GOAT, Preferred Series C(a)(f) | | | Sep 2021 | | | | 237,913 | | | | 1,412,322 | | | | 1,398,928 | |
GrubMarket, Preferred Series D(a) | | | Oct 2020 | | | | 440,742 | | | | 1,999,999 | | | | 4,347,030 | |
GrubMarket, Preferred Series E(a) | | | Jun 2021 | | | | 1,520,838 | | | | 14,999,995 | | | | 14,999,995 | |
Lyst, Preferred Series E(a) | | | Jul 2021 | | | | 401,929 | | | | 5,172,500 | | | | 5,120,575 | |
| | | | | | | | | | | | 31,512,284 | | | | 33,766,238 | |
EDUCATION — 0.9% | | | | | | | | | | | | | | | | |
MasterClass, Preferred Series 1(a) | | | Jul 2021 | | | | 193,100 | | | | 6,146,189 | | | | 6,121,270 | |
See accompanying Notes to the Financial Statements
16
THE PRIVATE SHARES FUND
Schedule of Investments (Continued)
December 31, 2021
| | | Acquisition
Date | | | Shares | | | Cost | | | Fair Value | |
PREFERRED STOCK IN PRIVATE COMPANIES(c) — 30.4% (Continued) | | | | | | | | | | | | |
ENTERPRISE SOFTWARE — 2.5% | | | | | | | | | | | | |
Checkr, Inc., Preferred Series A-1(a) | | | Mar 2020 | | | | 50,000 | | | $ | 1,405,000 | | | $ | 2,683,500 | |
Cohere Technologies, Preferred Series D-2(a) | | | Dec 2020 | | | | 386,038 | | | | 2,071,233 | | | | 2,071,233 | |
KeepTruckin, Preferred Series E(a) | | | May 2021 | | | | 638,843 | | | | 4,599,996 | | | | 4,606,058 | |
Ocrolus, Inc., Preferred Series C(a)(f) | | | Sep 2021 | | | | 438,327 | | | | 3,030,000 | | | | 2,998,157 | |
Tebra, Preferred Series Seed 2(a) | | | Nov 2020 | | | | 123,819 | | | | 804,870 | | | | 1,123,047 | |
Trax Ltd., Pre IPO(a) | | | Mar 2021 | | | | 76,722 | | | | 3,999,978 | | | | 4,392,335 | |
| | | | | | | | | | | | 15,911,077 | | | | 17,874,330 | |
FINANCE/PAYMENTS — 3.8% | | | | | | | | | | | | | | | | |
Betterment, Preferred Series F(a) | | | Sep 2021 | | | | 318,380 | | | | 3,999,999 | | | | 3,999,999 | |
BlockFi, Preferred Series E(a)(f) | | | Jul 2021 | | | | 40,201 | | | | 3,045,000 | | | | 2,987,738 | |
Fundbox, Preferred Series C(a) | | | Jun 2019 | | | | 439,552 | | | | 4,999,992 | | | | 6,197,683 | |
Fundbox, Preferred Series D(a) | | | Sep 2021 | | | | 531,914 | | | | 7,499,988 | | | | 7,499,988 | |
Kraken, Preferred Series A(a) | | | Nov 2021 | | | | 100,000 | | | | 5,310,000 | | | | 5,193,000 | |
Prosper Marketplace, Inc., Preferred Series A(a) | | | Jan 2016 | | | | 55,395 | | | | 305,781 | | | | 41,546 | |
Prosper Marketplace, Inc., Preferred Series A-1(a) | | | Jan 2016 | | | | 58,165 | | | | 116 | | | | 87,248 | |
Ripple, Preferred Series A(a) | | | Dec 2018 | | | | 42,000 | | | | 504,000 | | | | 1,566,600 | |
| | | | | | | | | | | | 25,664,876 | | | | 27,573,802 | |
FOODTECH — 0.7% | | | | | | | | | | | | | | | | |
Impossible Foods, Inc., Preferred Series H-1(a)(f) | | | Nov 2021 | | | | 153,494 | | | | 3,746,778 | | | | 3,708,660 | |
Impossible Foods, Inc., Preferred Series H-2(a)(f) | | | Nov 2021 | | | | 53,389 | | | | 1,303,222 | | | | 1,289,964 | |
| | | | | | | | | | | | 5,050,000 | | | | 4,998,624 | |
HEALTHCARE/BIOTECH — 2.7% | | | | | | | | | | | | | | | | |
Click Therapeutics, Inc., Preferred Series A(a) | | | Nov 2020 | | | | 60,087 | | | | 210,305 | | | | 208,502 | |
Collective Health, Inc., Preferred Series F(a) | | | May 2021 | | | | 3,989,361 | | | | 3,120,000 | | | | 2,792,552 | |
Crossover Health, Inc., Preferred Series D(a) | | | Mar 2021 | | | | 224,976 | | | | 7,999,966 | | | | 8,119,384 | |
Omada Health, Preferred Series E(a) | | | Dec 2021 | | | | 1,334,400 | | | | 7,999,995 | | | | 7,999,995 | |
ZocDoc, Inc., Preferred Series A(a) | | | Feb 2015 | | | | 35,000 | | | | 875,000 | | | | 675,500 | |
| | | | | | | | | | | | 20,205,266 | | | | 19,795,933 | |
HOSTING/STORAGE — 0.8% | | | | | | | | | | | | | | | | |
Pavilion Data Systems, Inc., Preferred Series C-1(a) | | | Apr 2021 | | | | 2,038,687 | | | | 6,059,997 | | | | 6,059,997 | |
| | | | | | | | | | | | | | | | | |
SECURITY — 1.6% | | | | | | | | | | | | | | | | |
Cybereason, Preferred Series F(a)(f) | | | Jul 2021 | | | | 1,510,600 | | | | 7,631,457 | | | | 7,099,820 | |
Exabeam, Preferred Series A(a) | | | Nov 2020 | | | | 80,000 | | | | 1,020,000 | | | | 2,304,800 | |
Lookout, Inc., Preferred Series A(a) | | | Feb 2015 | | | | 204,000 | | | | 1,927,800 | | | | 2,172,600 | |
| | | | | | | | | | | | 10,579,257 | | | | 11,577,220 | |
SOFTWARE — 0.9% | | | | | | | | | | | | | | | | |
SoundHound, Inc., Preferred Series D(a) | | | Sep 2016 | | | | 107,484 | | | | 2,200,767 | | | | 5,552,623 | |
SoundHound, Inc., Preferred Series D-3(a) | | | Nov 2020 | | | | 25,000 | | | | 1,000,000 | | | | 1,291,500 | |
| | | | | | | | | | | | 3,200,767 | | | | 6,844,123 | |
See accompanying Notes to the Financial Statements
17
THE PRIVATE SHARES FUND
Schedule of Investments (Continued)
December 31, 2021
| | | Acquisition
Date | | | Shares/
Principal/ Units | | | Cost | | | Fair Value | |
PREFERRED STOCK IN PRIVATE COMPANIES(c) — 30.4% (Continued) | | | | | | | | | | | | |
TRANSPORTATION — 1.6% | | | | | | | | | | | | | | | | |
Lime (Neutron Holdings, Inc.), Preferred Series 1-D(a) | | | Mar 2019 | | | | 20,618,556 | | | $ | 5,000,000 | | | $ | 2,268,041 | |
Turo, Preferred Series D-1(a) | | | Jun 2018 | | | | 642,535 | | | | 2,999,996 | | | | 9,252,504 | |
Virgin Hyperloop One, Preferred Series B-1(a) | | | Jun 2017 | | | | 4,144 | | | | 999,999 | | | | 136,876 | |
Virgin Hyperloop One, Preferred Series C(a) | | | May 2019 | | | | 12,992 | | | | 37,938 | | | | 37,938 | |
| | | | | | | | | | | | 9,037,933 | | | | 11,695,359 | |
TOTAL PREFERRED STOCK IN PRIVATE COMPANIES | | | | | | | | | | | 193,172,098 | | | | 221,556,975 | |
| | | | | | | | | | | | | | | | | |
CONVERTIBLE NOTES OF PRIVATE COMPANIES(c) — 6.2% | | | | | | | | |
AEROSPACE — 2.1% | | | | | | | | | | | | | | | | |
Axiom Space, Inc., 3.00% 8/11/2023 | | | Aug 2021 | | | $ | 15,000,000 | | | | 15,000,000 | | | | 15,000,000 | |
| | | | | | | | | | | | | | | | | |
SOFTWARE — 2.0% | | | | | | | | | | | | | | | | |
Tradeshift, 3.00% 6/16/2023 | | | Jun 2021 | | | $ | 10,000,000 | | | | 10,072,740 | | | | 10,000,000 | |
Tradeshift, 5.00% 11/22/2023(d) | | | Nov 2021 | | | $ | 5,000,000 | | | | 5,000,000 | | | | 5,000,000 | |
| | | | | | | | | | | | 15,072,740 | | | | 15,000,000 | |
TRANSPORTATION — 2.1% | | | | | | | | | | | | | | | | |
Lime (Neutron Holdings, Inc.), 4.00% 10/29/2025 | | | Oct 2021 | | | $ | 15,000,000 | | | | 15,000,000 | | | | 15,000,000 | |
Lime (Neutron Holdings, Inc.), 4.00% 6/1/2027 | | | Jun 2020 | | | $ | 253,169 | | | | 253,169 | | | | 253,169 | |
| | | | | | | | | | | | 15,253,169 | | | | 15,253,169 | |
TOTAL CONVERTIBLE NOTES OF PRIVATE COMPANIES | | | | | | | 45,325,909 | | | | 45,253,169 | |
| | | | | | | | | | | | | | | | | |
WARRANTS OF PRIVATE COMPANIES(c) — 1.9% | | | | | | | | | | | | | | | | |
FINANCE/PAYMENTS — 0.1% | | | | | | | | | | | | | | | | |
BlockFi, Exercise Price $75.74, Exercise Date 8/15/2028(a)(f) | | | Jul 2021 | | | | 20,100 | | | | 0 | | | | 1,014,580 | |
| | | | | | | | | | | | | | | | | |
SOFTWARE — 1.8% | | | | | | | | | | | | | | | | |
Tradeshift, Exercise Price $0.001, Exercise Date 11/20/2031(a) | | | Nov 2021 | | | | 213,797 | | | | 0 | | | | 4,229,418 | |
Tradeshift, Exercise Price $0.001, Exercise Date 9/8/2031(a) | | | Dec 2021 | | | | 427,594 | | | | 0 | | | | 8,458,835 | |
| | | | | | | | | | | | 0 | | | | 12,688,253 | |
TRANSPORTATION — 0.0% | | | | | | | | | | | | | | | | |
Lime (Neutron Holdings, Inc.), Exercise Price $0.01, Exercise Date 6/2/2027(a) | | | Jun 2020 | | | | 1,016,483 | | | | 0 | | | | 2,656 | |
TOTAL WARRANTS OF PRIVATE COMPANIES | | | | | | | | | | | 0 | | | | 13,705,489 | |
| | | | | | | | | | | | | | | | | |
SPECIAL PURPOSE VEHICLES(c) — 1.4% | | | | | | | | | | | | | | | | |
ANALYTICS/BIG DATA — 0.7% | | | | | | | | | | | | | | | | |
KVC Select, LLC(a)(g) | | | Aug 2021 | | | | 5,050,000 | | | | 5,050,000 | | | | 5,050,000 | |
| | | | | | | | | | | | | | | | | |
SOFTWARE — 0.7% | | | | | | | | | | | | | | | | |
Artist Edge Partners IV LP(a)(g) | | | Dec 2021 | | | | 5,125,792 | | | | 5,125,792 | | | | 5,125,792 | |
TOTAL SPECIAL PURPOSE VEHICLES | | | | | | | | | | | 10,175,792 | | | | 10,175,792 | |
See accompanying Notes to the Financial Statements
18
THE PRIVATE SHARES FUND
Schedule of Investments (Continued)
December 31, 2021
| | | Acquisition
Date | | | Shares | | | Cost | | | Fair Value | |
SHORT-TERM INVESTMENTS — 24.2% | | | | | | | | | | | | | | | | |
MUTUAL FUND — 24.2% | | | | | | | | | | | | | | | | |
Goldman Sachs Government Fund, 0.03%(e) | | | | | | | | | | $ | 175,918,136 | | | $ | 175,918,136 | |
TOTAL SHORT-TERM INVESTMENTS | | | | | | | | | | | 175,918,136 | | | | 175,918,136 | |
| | | | | | | | | | | | | | | | | |
TOTAL INVESTMENTS — 99.8% | | | | | | | | | | | 600,802,313 | | | | 727,057,143 | |
Other assets less liabilities— 0.2 % | | | | | | | | | | | | | | | 1,427,367 | |
| | | | | | | | | | | | | | | | | |
NET ASSETS — 100.0% | | | | | | | | | | | | | | $ | 728,484,510 | |
(b) | Fathom Digital is classified as common stock in public companies in the Schedule of Investments. However, the Fathom Digital securities held by the Fund are unregistered securities that were purchased through a PIPE (private investment in public equity) offering. |
(c) | Investments in private companies, and in some cases public companies, may be subject to restrictions on disposition imposed by the issuer. As of December 31, 2021, restricted securities represented 73.31% of the net assets of the Fund. |
(d) | Denotes a variable rate security. The rate shown is the current interest rate as of December 31, 2021. |
(e) | Represents the 7-day effective yield as of December 31, 2021. |
(f) | These securities have been purchased through Special Purpose Vehicles in which the Fund has a direct investment of ownership units of the Vehicles. The shares, cost basis and fair value stated are determined based on the underlying securities purchased by the Vehicle and the Fund’s ownership percentage of the Vehicle. |
(g) | These investments in Special Purpose Vehicles are expected to be invested into Portfolio Companies’ common and preferred shares. |
All issuers are based in the United States, except for Lyst, Ltd. and OpenX, which are based in the UK, and Trax Ltd., Eruditus Learning, Invenia and Fundbox, which are based in the Cayman Islands, Singapore, Canada and Israel, respectively.
See accompanying Notes to the Financial Statements
19
THE PRIVATE SHARES FUND
Statement of Assets and Liabilities
December 31, 2021
Assets: | | | | |
Investments, at fair value (Note 3) | | $ | 727,057,143 | |
Receivable for investments sold | | | 916,944 | |
Receivable for fund shares sold | | | 1,566,296 | |
Interest receivable | | | 460,799 | |
Prepaid expenses and other assets | | | 335,857 | |
Total assets | | | 730,337,039 | |
| | | | |
Liabilities: | | | | |
Advisory fees | | | 1,057,621 | |
Payable for shareholder servicing fees - Class L | | | 805 | |
Payable for shareholder servicing fees - Class A | | | 33,539 | |
Payable for audit and tax fees | | | 330,000 | |
Payable for transfer agent fees | | | 203,994 | |
Payable for 12b-1 fees - Class L | | | 805 | |
Other accrued liabilities | | | 225,765 | |
Total liabilities | | | 1,852,529 | |
Commitments and contingencies (Note 9) | | | | |
Net assets | | $ | 728,484,510 | |
| | | | |
Net assets consist of: | | | | |
Capital stock (unlimited shares authorized, 25,000,000 shares registered, no par value) | | $ | 590,710,271 | |
Total distributable earnings | | | 137,774,239 | |
Net assets | | $ | 728,484,510 | |
| | | | |
Net assets: | | | | |
Class A | | $ | 158,432,551 | |
Class I | | | 566,271,709 | |
Class L | | | 3,780,250 | |
Total net assets | | $ | 728,484,510 | |
| | | | |
Shares outstanding: | | | | |
Class A | | | 3,793,389 | |
Class I | | | 13,411,310 | |
Class L | | | 91,469 | |
Total shares outstanding | | | 17,296,168 | |
| | | | |
Net asset value, public offering price, and redemption proceeds per share: | | | | |
Class A - Net asset value and redemption proceeds per share | | $ | 41.77 | |
Class I - Net asset value and redemption proceeds per share | | $ | 42.22 | |
Class L - Net asset value and redemption proceeds per share | | $ | 41.33 | |
Class A - Public offering price per share(a) | | $ | 44.32 | |
Class L - Public offering price per share(b) | | $ | 43.16 | |
| | | | |
Cost of investments | | $ | 600,802,313 | |
(a) | Computation of public offering price per share 100/94.25 of net asset value. (See Note 10). |
(b) | Computation of public offering price per share 100/95.75 of net asset value. (See Note 10). |
See accompanying Notes to the Financial Statements
20
THE PRIVATE SHARES FUND
Statement of Operations
For the year ended December 31, 2021
Investment Income: | | | | |
Interest | | $ | 543,634 | |
Total investment income | | | 543,634 | |
| | | | |
Expenses: | | | | |
Investment advisory fees (Note 5) | | | 9,974,853 | |
Transfer agent fees | | | 731,309 | |
Legal fees1 | | | 716,416 | |
Audit and tax fees | | | 408,325 | |
Fund accounting & administration fees | | | 343,431 | |
Printing & postage | | | 296,725 | |
Shareholder servicing fees - Class A | | | 193,604 | |
Insurance fees | | | 165,877 | |
Trustee fees | | | 157,200 | |
Registration fees | | | 122,002 | |
Chief compliance officer fees | | | 93,500 | |
Miscellaneous expenses | | | 57,060 | |
Custodian fees | | | 42,290 | |
Distribution fees - Class L | | | 7,096 | |
Shareholder servicing fees - Class L | | | 2,580 | |
Total expenses | | | 13,312,268 | |
Less: Contractual waiver of fees and reimbursement of expenses (Note 4) | | | (1,073,207 | ) |
Net expenses | | | 12,239,061 | |
Net investment loss | | $ | (11,695,427 | ) |
| | | | |
Net realized gain on investments | | | 65,538,431 | |
Net change in unrealized gain on investments | | | 40,658,916 | |
Net realized & change in unrealized gain on investments | | | 106,197,347 | |
Net change in net assets from operations | | $ | 94,501,920 | |
1 | Includes extraordinary expenses incurred during the fiscal year. Extraordinary expenses related to Legal expenses incurred in the amount of $66,717 were excluded from the contractual waiver of fees due to their nature. Please see Note 4 in the Notes to the Financial Statements for additional information. |
See accompanying Notes to the Financial Statements
21
THE PRIVATE SHARES FUND
Statements of Changes in Net Assets
| | | Year ended
December 31,2021 | | | Year ended
December 31,2020 | |
Operations: | | | | | | | | |
Net investment loss | | $ | (11,695,427 | ) | | $ | (5,159,407 | ) |
Net realized gain on investments | | | 65,538,431 | | | | 6,126,301 | |
Net change in unrealized gain on investments | | | 40,658,916 | | | | 51,184,979 | |
Net change in net assets resulting from operations | | | 94,501,920 | | | | 52,151,873 | |
| | | | | | | | |
Distributions to Shareholders: | | | | | | | | |
Distributions from return of capital | | | — | | | | (546,574 | ) |
Distributions from long term capital gain | | | (51,227,704 | ) | | | (5,071,155 | ) |
Net change in net assets from distributions | | | (51,227,704 | ) | | | (5,617,729 | ) |
| | | | | | | | |
Fund share transactions: | | | | | | | | |
Proceeds from shares issued - Class A | | | 62,603,597 | | | | 31,989,710 | |
Proceeds from shares issued - Class I | | | 351,778,917 | | | | 95,838,436 | |
Proceeds from shares issued - Class L | | | 2,173,960 | | | | 763,686 | |
Reinvested distributions - Class A | | | 5,041,316 | | | | 956,585 | |
Reinvested distributions - Class I | | | 21,362,256 | | | | 1,933,478 | |
Reinvested distributions - Class L | | | 204,652 | | | | 17,901 | |
Cost of shares redeemed - Class A | | | (28,951,952 | ) | | | (56,972,217 | ) |
Cost of shares redeemed - Class I | | | (32,099,168 | ) | | | (9,208,975 | ) |
Cost of shares redeemed - Class L | | | (346,778 | ) | | | (278,561 | ) |
Net change in net assets from fund share transactions | | | 381,766,800 | | | | 65,040,043 | |
Net change in net assets | | $ | 425,041,016 | | | $ | 111,574,187 | |
| | | | | | | | |
Net assets: | | | | | | | | |
Beginning of year | | $ | 303,443,494 | | | $ | 191,869,307 | |
End of year | | $ | 728,484,510 | | | $ | 303,443,494 | |
| | | | | | | | |
Transactions in shares: | | | | | | | | |
Issuance of shares - Class A | | | 1,500,815 | | | | 990,071 | |
Issuance of shares - Class I | | | 8,243,895 | | | | 2,878,957 | |
Issuance of shares - Class L | | | 52,196 | | | | 23,983 | |
Reinvested distributions - Class A | | | 120,808 | | | | 27,183 | |
Reinvested distributions - Class I | | | 506,455 | | | | 54,541 | |
Reinvested distributions - Class L | | | 4,955 | | | | 512 | |
Redemption of shares - Class A | | | (690,399 | ) | | | (1,761,574 | ) |
Redemption of shares - Class I | | | (745,246 | ) | | | (283,050 | ) |
Redemption of shares - Class L | | | (8,342 | ) | | | (8,989 | ) |
Net change in shares | | | 8,985,137 | | | | 1,921,634 | |
See accompanying Notes to the Financial Statements
22
THE PRIVATE SHARES FUND
Statement of Cash Flows
For the year ended December 31, 2021
Cash flows from operating activities: | | | | |
Net change in net assets from operations | | $ | 94,501,920 | |
Adjustments to reconcile net change in net assets from operations to net cash used in operating activities: | | | | |
Purchases of investments | | | (302,783,586 | ) |
Net purchases of short-term investments | | | (109,500,075 | ) |
Proceeds from sales of investments | | | 93,613,878 | |
Net change in unrealized gain on investments | | | (40,658,916 | ) |
Net realized gain on investments | | | (65,538,431 | ) |
Change in operating assets and liabilities: | | | | |
Increase in interest receivable | | | (453,685 | ) |
Increase in prepaid expenses and other assets | | | (221,266 | ) |
Increase in net payable to adviser | | | 707,632 | |
Increase in other accrued liabilities | | | 476,459 | |
Net cash used in operating activities | | | (329,856,070 | ) |
| | | | |
Cash flows from financing activities: | | | | |
Proceeds from shares issued, net of change in receivable for fund shares sold | | | 398,278,115 | |
Cost of shares redeemed | | | (43,802,565 | ) |
Cash distributions paid | | | (24,619,480 | ) |
Net cash provided by financing activities | | | 329,856,070 | |
| | | | |
Net change in cash | | | — | |
| | | | |
Cash at beginning of year | | | — | |
Cash at end of year | | $ | — | |
| | | | |
Supplemental disclosure of noncash financing activities | | | | |
Transfer in and out between share classes | | $ | 17,595,333 | |
Purchases of shares through reinvested distributions | | | 26,608,224 | |
See accompanying Notes to the Financial Statements
23
THE PRIVATE SHARES FUND
Financial Highlights – Class A
For a capital share outstanding throughout each period
| | | Year ended
December 31,
2021 | | | Year ended
December 31,
2020 | | | Year ended
December 31,
2019 | | | Year ended
December 31,
2018 | | | Year ended
December 31,
2017 | |
Per share operating performance | | | | | | | | | | | | | | | | | | | | |
Net asset value, beginning of year | | $ | 36.33 | | | $ | 29.96 | | | $ | 28.44 | | | $ | 26.85 | | | $ | 26.83 | |
| | | | | | | | | | | | | | | | | | | | |
Change in net assets from operations: | | | | | | | | | | | | | | | | | | | | |
Net investment loss | | | (0.88 | ) | | | (0.90 | ) | | | (0.88 | ) | | | (0.71 | ) | | | (0.63 | ) |
Net realized and unrealized gain on investments | | | 9.54 | | | | 7.98 | | | | 2.40 | | | | 2.30 | | | | 0.65 | |
Total change in net assets from operations | | | 8.66 | | | | 7.08 | | | | 1.52 | | | | 1.59 | | | | 0.02 | |
| | | | | | | | | | | | | | | | | | | | |
Distributions: | | | | | | | | | | | | | | | | | | | | |
From net return of capital | | | — | | | | (0.07 | ) | | | — | | | | — | | | | — | |
From net realized gain on investments | | | (3.22 | ) | | | (0.64 | ) | | | — | | | | — | | | | — | |
Total distributions | | | (3.22 | ) | | | (0.71 | ) | | | — | | | | — | | | | — | |
Net increase in net asset value | | | 5.44 | | | | 6.37 | | | | 1.52 | | | | 1.59 | | | | 0.02 | |
Net asset value, end of year | | $ | 41.77 | | | $ | 36.33 | | | $ | 29.96 | | | $ | 28.44 | | | $ | 26.85 | |
| | | | | | | | | | | | | | | | | | | | |
Total return(a) | | | 23.85 | % | | | 23.69 | % | | | 5.34 | % | | | 5.92 | % | | | 0.07 | % |
| | | | | | | | | | | | | | | | | | | | |
Ratios and supplemental data | | | | | | | | | | | | | | | | | | | | |
Net assets, end of year (in thousands) | | $ | 158,433 | | | $ | 103,984 | | | $ | 108,068 | | | $ | 109,902 | | | $ | 101,248 | |
Ratio of net expenses to average net assets | | | 2.51 | %(b)(c) | | | 2.50 | %(b) | | | 2.79 | %(b)(d) | | | 2.50 | %(b) | | | 2.50 | %(b) |
Ratio of gross expenses before reimbursement to average net assets | | | 2.64 | % | | | 2.97 | % | | | 3.56 | % | | | 3.29 | % | | | 3.69 | % |
Ratio of net investment loss to average net assets | | | (2.42 | )% | | | (2.48 | )% | | | (2.71 | )% | | | (2.44 | )% | | | (2.52 | )% |
Portfolio turnover | | | 26.20 | % | | | 6.97 | % | | | 14.76 | % | | | 24.75 | % | | | 8.78 | % |
(a) | The Fund’s total investment returns do not include a sales load. |
(b) | The ratio of net expenses are the result of $171,876, $492,357, $916,804, $887,579, and $1,120,912, respectively, in contractual waivers and expense reimbursement representing (0.12)%, (0.47)%, (0.78)%, (0.79)%, and (1.19)%, respectively. Please see Note 4 in the Notes to the Financial Statements for additional information. |
(c) | During the calendar year ended December 31, 2021, there were legal expenses incurred by the Fund that were distinguishable in their characterization as being unusual in nature as well as not expected to be recurring in future periods. The exclusion of these extraordinary expenses from the Fund’s expense limitation agreement caused the expense ratio to exceed the contractual expense limit by $17,584 or 0.01%. |
(d) | During the calendar year ended December 31, 2019, there were certain expenses incurred by the Fund that were distinguishable in their characterization as being unusual in nature as well as not expected to be recurring in future periods. The exclusion of these extraordinary expenses from the Fund’s expense limitation agreement caused the expense ratio to exceed the contractual expense limit by $336,193 or 0.29%. |
See accompanying Notes to the Financial Statements
24
THE PRIVATE SHARES FUND
Financial Highlights – Class I
For a capital share outstanding throughout each period
| | | Year ended
December 31,
2021 | | | Year ended
December 31,
2020 | | | Year ended
December 31,
2019 | | | Year ended
December 31,
2018 | | | Period ended
December 31,
2017* | |
Per share operating performance | | | | | | | | | | | | | | | | | | | | |
Net asset value, beginning of period | | $ | 36.61 | | | $ | 30.12 | | | $ | 28.51 | | | $ | 26.85 | | | $ | 26.37 | |
| | | | | | | | | | | | | | | | | | | | |
Change in net assets from operations: | | | | | | | | | | | | | | | | | | | | |
Net investment loss | | | (0.62 | ) | | | (0.47 | ) | | | (0.59 | ) | | | (0.20 | ) | | | (0.01 | ) |
Net realized and unrealized gain on investments | | | 9.45 | | | | 7.67 | | | | 2.20 | | | | 1.86 | | | | 0.49 | |
Total change in net assets from operations | | | 8.83 | | | | 7.20 | | | | 1.61 | | | | 1.66 | | | | 0.48 | |
| | | | | | | | | | | | | | | | | | | | |
Distributions: | | | | | | | | | | | | | | | | | | | | |
From net return of capital | | | — | | | | (0.07 | ) | | | — | | | | — | | | | — | |
From net realized gain on investments | | | (3.22 | ) | | | (0.64 | ) | | | — | | | | — | | | | — | |
Total distributions | | | (3.22 | ) | | | (0.71 | ) | | | — | | | | — | | | | — | |
Net increase in net asset value | | | 5.61 | | | | 6.49 | | | | 1.61 | | | | 1.66 | | | | 0.48 | |
Net asset value, end of period | | $ | 42.22 | | | $ | 36.61 | | | $ | 30.12 | | | $ | 28.51 | | | $ | 26.85 | |
| | | | | | | | | | | | | | | | | | | | |
Total return | | | 24.13 | % | | | 23.97 | % | | | 5.65 | % | | | 6.18 | % | | | 1.82 | %(a) |
| | | | | | | | | | | | | | | | | | | | |
Ratios and supplemental data | | | | | | | | | | | | | | | | | | | | |
Net assets, end of period (in thousands) | | $ | 566,272 | | | $ | 197,921 | | | $ | 82,992 | | | $ | 33,945 | | | $ | 1,115 | |
Ratio of net expenses to average net assets | | | 2.26 | %(b)(c) | | | 2.25 | %(b) | | | 2.54 | %(b)(d) | | | 2.25 | %(b) | | | 2.25 | %(b)(e) |
Ratio of gross expenses before reimbursement to average net assets | | | 2.50 | % | | | 2.75 | % | | | 3.36 | % | | | 3.10 | % | | | 3.50 | %(e) |
Ratio of net investment loss to average net assets | | | (2.15 | )% | | | (2.24 | )% | | | (2.46 | )% | | | (2.17 | )% | | | (2.25 | )%(e) |
Portfolio turnover | | | 26.20 | % | | | 6.97 | % | | | 14.76 | % | | | 24.75 | % | | | 8.78 | %(a) |
* | Reflects operations for the period from November 17, 2017 (inception date) to December 31, 2017. |
(a) | Not annualized for periods less than one year. |
(b) | The ratio of net expenses are the result of $899,197, $567,388, $546,174, $94,654, and $109, respectively, in contractual waivers and expense reimbursement representing (0.23)%, (0.50)%, (0.82)%, (0.85)%, and (1.25)%, respectively. Please see Note 4 in the Notes to the Financial Statements for additional information. |
(c) | During the calendar year ended December 31, 2021, there were legal expenses incurred by the Fund that were distinguishable in their characterization as being unusual in nature as well as not expected to be recurring in future periods. The exclusion of these extraordinary expenses from the Fund’s expense limitation agreement caused the expense ratio to exceed the contractual expense limit by $48,772 or 0.01%. |
(d) | During the calendar year ended December 31, 2019, there were certain expenses incurred by the Fund that were distinguishable in their characterization as being unusual in nature as well as not expected to be recurring in future periods. The exclusion of these extraordinary expenses from the Fund’s expense limitation agreement caused the expense ratio to exceed the contractual expense limit by $189,435 or 0.29%. |
(e) | Annualized for period less than one year. |
See accompanying Notes to the Financial Statements
25
THE PRIVATE SHARES FUND
Financial Highlights – Class L
For a capital share outstanding throughout each period
| | | Year ended
December 31,
2021 | | | Year ended
December 31,
2020 | | | Year ended
December 31,
2019 | | | Period ended
December 31,
2018* | |
Per share operating performance | | | | | | | | | | | | | | | | |
Net asset value, beginning of period | | $ | 36.07 | | | $ | 29.83 | | | $ | 28.39 | | | $ | 28.37 | |
| | | | | | | | | | | | | | | | |
Change in net assets from operations: | | | | | | | | | | | | | | | | |
Net investment loss | | | (0.82 | ) | | | (0.67 | ) | | | (0.58 | ) | | | (0.49 | ) |
Net realized and unrealized gain on investments | | | 9.30 | | | | 7.62 | | | | 2.02 | | | | 0.51 | |
Total change in net assets from operations | | | 8.48 | | | | 6.95 | | | | 1.44 | | | | 0.02 | |
| | | | | | | | | | | | | | | | |
Distributions: | | | | | | | | | | | | | | | | |
From net return of capital | | | — | | | | (0.07 | ) | | | — | | | | — | |
From net realized gain on investments | | | (3.22 | ) | | | (0.64 | ) | | | — | | | | — | |
Total distributions | | | (3.22 | ) | | | (0.71 | ) | | | — | | | | — | |
Net increase in net asset value | | | 5.26 | | | | 6.24 | | | | 1.44 | | | | 0.02 | |
Net asset value, end of period | | $ | 41.33 | | | $ | 36.07 | | | $ | 29.83 | | | $ | 28.39 | |
| | | | | | | | | | | | | | | | |
Total return(a) | | | 23.52 | % | | | 23.36 | % | | | 5.07 | % | | | 0.07 | %(b) |
| | | | | | | | | | | | | | | | |
Ratios and supplemental data | | | | | | | | | | | | | | | | |
Net assets, end of period (in thousands) | | $ | 3,780 | | | $ | 1,539 | | | $ | 810 | | | $ | 1 | |
Ratio of net expenses to average net assets | | | 2.76 | %(c)(d) | | | 2.75 | %(c) | | | 3.04 | %(c)(e) | | | 2.75 | %(c)(f) |
Ratio of gross expenses before reimbursement to average net assets | | | 2.84 | % | | | 3.18 | % | | | 3.86 | % | | | 3.60 | %(f) |
Ratio of net investment loss to average net assets | | | (2.66 | )% | | | (2.74 | )% | | | (2.97 | )% | | | (2.68 | )%(f) |
Portfolio turnover | | | 26.20 | % | | | 6.97 | % | | | 14.76 | % | | | 24.75 | %(b) |
* | Reflects operations for the period from May 11, 2018 (inception date) to December 31, 2018. |
(a) | The Fund’s total investment returns do not include a sales load. |
(b) | Not annualized for periods less than one year. |
(c) | The ratio of net expenses are the result of $2,134, $4,514, $4,364, and $6, respectively, in contractual waivers and expense reimbursement representing (0.08)%, (0.43)%, (0.82)%, and (0.85)%, respectively. Please see Note 4 in the Notes to the Financial Statements for additional information. |
(d) | During the calendar year ended December 31, 2021, there were legal expenses incurred by the Fund that were distinguishable in their characterization as being unusual in nature as well as not expected to be recurring in future periods. The exclusion of these extraordinary expenses from the Fund’s expense limitation agreement caused the expense ratio to exceed the contractual expense limit by $361 or 0.01%. |
(e) | During the calendar year ended December 31, 2019, there were certain expenses incurred by the Fund that were distinguishable in their characterization as being unusual in nature as well as not expected to be recurring in future periods. The exclusion of these extraordinary expenses from the Fund’s expense limitation agreement caused the expense ratio to exceed the contractual expense limit by $1,514 or 0.29%. |
(f) | Annualized for period less than one year. |
See accompanying Notes to the Financial Statements
26
THE PRIVATE SHARES FUND
Notes to the Financial Statements
December 31, 2021
1. Organization
The Private Shares Fund (the “Fund”) was established as a limited liability company under the laws of the State of Delaware on August 20, 2012 and converted into a Delaware statutory trust on March 22, 2013. The Fund is registered with the Securities and Exchange Commission (the “SEC”) as a non-diversified, closed-end management investment company that operates as an “interval fund” under the Investment Company Act of 1940, as amended (the “1940 Act”). The shares of beneficial interest of the Fund (the “Shares”) will be continuously offered under Rule 415 of the Securities Act of 1933, as amended (the “Securities Act”). As an interval fund, the Fund makes quarterly repurchase offers for 5% of the Fund’s outstanding Shares at net asset value (“NAV”), with no repurchase fee incurred. The Fund’s inception date was March 25, 2014. Prior to March 25, 2014, the Fund had been inactive except for matters relating to the Fund’s establishment, designation and planned registration of the Fund’s Shares under the Securities Act and the sale of 5,000 Shares (“Initial Shares”) for $100,000 to the Fund’s then-current investment adviser, which occurred on July 30, 2013. On December 1, 2020, the Fund’s shareholders approved a new investment advisory agreement appointing Liberty Street Advisors, Inc. (“Liberty”) as the investment adviser to the Fund. Accordingly, Liberty (the “Investment Adviser”) has replaced SP Investments Management, LLC as the investment adviser, effective December 9, 2020.
The investment objective of the Fund is to provide investors capital appreciation, which it seeks by primarily investing, under normal market conditions, at least 80% of (i) the value of its net assets, plus (ii) the amount of any borrowings for investment purposes, in the equity securities (e.g., common and/or preferred stock, or equity-linked securities convertible into such equity securities) of private, operating growth companies (each, a “Portfolio Company”). The Investment Adviser’s primary strategy is to invest in Portfolio Companies and to hold such securities until a liquidity event with respect to such Portfolio Company occurs, such as an initial public offering, or a merger or acquisition transaction. The Fund currently offers three different classes of shares: Class A, Class I, and Class L shares. The separate classes of shares differ principally in the applicable sales charges (if any) and shareholder servicing fees. Generally, shareholders of each class also bear certain expenses that pertain to that particular class. All shareholders bear the common expenses of the Fund and earn income and realized gains/ losses pro rata based on the daily ending net assets of each class, without discrimination between share classes. Expenses that are specific to a class are charged directly to that class. Dividends are determined separately for each class based on income and expenses allocated to each class. Realized gain distributions are allocated to each class pro rata based on the shares outstanding of each class on the date of distribution. Differences in per share dividend rates generally result from the differences in separate class expenses, including distribution and shareholder servicing fees.
2. Significant accounting policies
The Fund is an investment company and follows the accounting and reporting guidance under Financial Accounting Standards Board (“FASB”) Accounting Standards Codification (“ASC”) Topic 946, Financial Services – Investment Companies. The following is a summary of significant accounting policies consistently followed by the Fund in the preparation of its financial statements.
Investment transactions and income recognition — Investment transactions are accounted for on a trade date basis. Net realized gains and losses on securities are computed on a specific identification basis. Dividend income is recorded on the ex-dividend date or as soon as known if after the ex-dividend date. Non-cash dividends included in dividend income, if any, are recorded at fair market value. Interest income and estimated expenses are accrued daily.
Use of estimates — The preparation of the financial statements in accordance with US generally accepted accounting principles (“GAAP”) requires management to make estimates and assumptions that affect the reported amounts of assets and liabilities and disclosure of contingent assets and liabilities at the date of the financial statements, as well as reported amounts of increases and decreases in net assets from operations during the reporting period. Actual results could differ from these estimates.
Investment valuation — The Fund’s NAV is based in large part on the value of its securities which are carried at fair value in accordance with the provisions of FASB ASC Topic 820, Fair Value Measurements and Disclosures. Where reliable market prices are available for those securities, the Investment Adviser will rely on those prices. However, because the securities in which the Fund invests are often illiquid, market prices may not be readily available or, where available, may be unreliable. At any point in
27
THE PRIVATE SHARES FUND
Notes to the Financial Statements (Continued)
December 31, 2021
2. Significant accounting policies — (continued)
time, there may be few recent purchase or sale transactions or offers on which to base the value of a given Portfolio Company’s security. In addition, the prices reflected in recent transactions or offers may be extremely sensitive to changes in supply or demand, including changes fueled by investor perceptions or other conditions.
When reliable market values are not available, the Fund’s investments will be valued by the Investment Adviser, under the supervision of the Board of Trustees, pursuant to fair valuation procedures and methodologies adopted by the Board of Trustees. While the Fund and the Investment Adviser will use good faith efforts to determine the fair value of the Fund’s securities, fair value will be dependent on the judgment of the Investment Adviser. The Investment Adviser may also rely to some extent on information provided by the Portfolio Companies.
From time to time, the Fund may determine that it should modify its estimates or assumptions, as new information becomes available. As a consequence, the value of the securities, and therefore the Fund’s NAV, may vary. This may adversely affect Shareholders. Because of the uncertainty and judgment involved in the valuation of the Portfolio Company securities, which do not have a readily available market, the estimated fair value of such securities may be different from values that would have been used had a readily available market existed for such securities. In addition, in the event that the Fund desires to sell Portfolio Company shares, the Fund may also not be able to sell these securities at the prices at which they are carried on the Fund’s books or may have to delay their sale in order to do so. This may adversely affect the Fund’s NAV.
The Board of Trustees has delegated the day-to-day responsibility for determining these fair values to the Investment Adviser, but the Board of Trustees has the ultimate responsibility for determining the fair value of the portfolio of the Fund. The Investment Adviser has developed the Fund’s fair valuation procedures and methodologies, which have been approved by the Board of Trustees, and will make fair valuation determinations and act in accordance with those procedures and methodologies, and in accordance with the 1940 Act. Fair valuation determinations are to be reviewed and, as necessary, ratified or revised quarterly by the Board of Trustees (or more frequently if necessary), including in connection with any quarterly repurchase offer.
There were no changes to the valuation approaches or techniques applied during 2021.
Federal income taxes — The Fund’s policy is to comply with Subchapter M of the Internal Revenue Code of 1986, as amended (the “Code”), and to distribute to shareholders each year substantially all of its net investment income and any net realized capital gain. Therefore, a federal income tax or excise tax provision is not required.
Management has evaluated all tax positions taken or expected to be taken by the Fund to determine whether each tax position is more likely than not (i.e. greater than 50%) to be sustained upon examination by the applicable taxing authority, including resolution of any related appeals or litigation processes, based on the technical merits of the position. Tax positions that do not meet the more likely than not threshold may result in a tax benefit or expense in the current year. If the Fund were to incur an income tax liability in the future, interest on any income tax liability would be reported as interest expense and penalties on any income tax liability would be reported as income taxes. No interest expense or penalties have been recognized as of or for the year ended December 31, 2021. Management of the Fund also is not aware of any tax positions for which it is reasonably possible that the total amounts of recognized tax benefits will significantly change in the next twelve months. Management has determined that the Fund has not taken any tax positions which do not meet the more likely than not threshold and as such, no liabilities related to uncertain tax positions have been reflected in the Fund’s financial statements.
Management analyzed all open tax years, as defined by the applicable statute of limitations for all major jurisdictions in which it files tax returns, which includes federal and certain states. The Fund’s 2017 - 2020 tax years are open to examination as of December 31, 2021.
Distributions to shareholders — The Fund distributes net investment income and net realized gains (net of any capital loss carryovers), if any, annually. The timing and character of income and capital gain distributions are determined in accordance with income tax regulations, which may differ from GAAP. These differences are due in part to differing treatment of net operating loss,
28
THE PRIVATE SHARES FUND
Notes to the Financial Statements (Continued)
December 31, 2021
2. Significant accounting policies — (continued)
wash sales, non-deductible offering costs and capital loss carryforwards. To the extent that differences arise that are permanent in nature, such amounts are reclassified within the capital accounts on the Statement of Assets and Liabilities, based on their federal tax treatment. Temporary differences do not require reclassification.
Shareholder service fee plan — Under the terms of the Fund’s Shareholder Services Plan, the Fund may compensate financial industry professionals for providing ongoing services with respect to clients to whom they have distributed Class A and Class L Shares of the Fund. Both Class A and Class L may incur shareholder servicing fees on an annual basis up to 0.25% of its daily average NAV. Class I is not subject to a shareholder servicing fee. For the year ended December 31, 2021, Class A and Class L incurred $193,604 and $2,580, respectively, in shareholder servicing fees.
Distribution fee plan — Under the terms of the Fund’s Distribution Plan, the Fund may compensate financial industry professionals for providing ongoing services in respect to certain activities relating to the distribution of Class L to investors and maintenance of shareholder accounts, as well as for payments to the Class L platform sponsors. Although the Fund is not an open-end investment company, it has undertaken to comply with the terms of Rule 12b-1 as a condition of an exemptive order under the 1940 Act which permits it to have asset based distribution fees. Under the Distribution Plan, Class L pays the Distributor a Distribution Fee at an annual rate of 0.25% of its average daily NAV. Class A and Class I are not subject to a distribution fee. For the year ended December 31, 2021, Class L incurred $7,096 in distribution fees.
The Investment Adviser’s affiliated broker-dealer, HRC Fund Associates, LLC (“HRC”), Member FINRA/SIPC, markets the Fund shares to financial intermediaries pursuant to a marketing agreement with the Investment Adviser. The marketing agreement between the Investment Adviser and HRC is not part of the Distribution Plan. The Investment Adviser pays HRC out of its own resources and without additional cost to the Fund or its shareholders.
Line of credit — On June 15, 2021, the Fund entered into a Credit Facility Agreement (“Facility”) of $22,000,000 (“Committed Facility”) and $8,000,000 (“Uncommitted Facility”) with UMB Bank, N. A. (the “Bank”). No more than once per quarter, the Fund is permitted to increase the Committed Facility to an amount equal to the greater of (i) $22,000,000 and (ii) 5% of the Fund’s assets under management. The Fund’s Uncommitted Facility will increase or decrease so that the aggregate Commitments do not exceed $30,000,000 unless consented to by the Bank. The purpose of the Facility is to finance temporarily the redemption of shares of the Fund. Borrowings under this agreement bear interest at the WSJ Prime Rate, minus 0.25%, subject to a minimum interest rate floor of 3.00%. Any interest derived from usage of the line of credit should be treated as exclusive of the expense cap. As compensation for holding the lending commitment available, the Fund is charged a commitment fee on the average daily unused balance of the Committed Facility at the rate of 0.20% per annum. Commitment fees for the period June 15, 2021 through December 31, 2021 were $23,880 and are included within Miscellaneous expenses on the Statement of Operations. The Fund did not borrow under the line of credit agreement during the period ended December 31, 2021.
Transactions with affiliates — To the extent any affiliate of the Investment Adviser or the Fund (“Affiliated Broker”) receives any fee, payment, commission, or other financial incentive of any type (“Broker Fees”) in connection with the purchase and sale of securities by the Fund, such Broker Fees will be subject to policies and procedures adopted by the Board of Trustees pursuant to Section 17(e) and Rule 17e-1 of the 1940 Act. These policies and procedures include a quarterly review of Broker Fees by the Board of Trustees. Among other things, Section 17(e) and those procedures provide that, when acting as broker for the Fund in connection with the purchase or sale of securities to or by the Fund, an affiliated broker may not receive any compensation exceeding the following limits: (1) if the transaction is effected on a securities exchange, the compensation may not exceed the “usual and customary broker’s commission” (as defined in Rule 17e-1 under the 1940 Act); (2) in the case of the purchase of securities by the Fund in connection with a secondary distribution, the compensation cannot exceed 2% of the sale price; and (iii) the compensation for transactions otherwise effected cannot exceed 1% of the purchase or sale price. Rule 17e-1 defines a “usual and customary broker’s commission” as one that is fair compared to the commission received by other brokers in connection with comparable transactions involving similar securities being purchased or sold on an exchange during a comparable period of time. Notwithstanding the foregoing, no Affiliated Broker will receive any undisclosed fees from the Fund in connection with any
29
THE PRIVATE SHARES FUND
Notes to the Financial Statements (Continued)
December 31, 2021
2. Significant accounting policies — (continued)
transaction involving the Fund and such Affiliated Broker, and to the extent any transactions involving the Fund are effected by an Affiliated Broker, such Affiliated Broker’s Broker Fees for such transactions shall be limited in accordance with Section 17(e)(2) of the 1940 Act and the Fund’s policies and procedures concerning Affiliated Brokers. The Fund did not conduct any transactions with an Affiliated Broker for the year ended December 31, 2021.
The Fund has implemented certain written policies and procedures to ensure that the Fund does not engage in any transactions with any prohibited affiliates. Under the 1940 Act, our Board of Trustees has a duty to evaluate, and shall oversee the analysis of, all conflicts of interest involving the Fund and its affiliates, and shall do so in accordance with the aforementioned policies and procedures.
Investments in private investments in public equities - The Fund invests in equity securities of an issuer that are issued through a private investment in public equity (“PIPE”) transaction. PIPE transactions typically involve the purchase of securities directly from a publicly traded company or its affiliates in a private placement transaction, typically at a discount to the market price of the issuer’s common stock. Securities purchased through PIPE transactions will be restricted from trading and generally considered illiquid until a registration statement for the shares is filed and declared effective. These securities are valued the same as other equity securities as noted above. Securities purchased through PIPE transactions are classified as Level 2 of the fair value hierarchy until such time as the trading restriction is removed.
Investments in special purpose vehicles - Special purpose vehicles (“SPVs”) consist of an investment by the Fund in an entity that invests directly in the common or preferred stock of a Portfolio Company. Investments in SPVs are generally valued using the same fair value techniques for our securities held by the Fund once the investment has been made by the SPV into the underlying Portfolio Company and are categorized as Level 3 of the fair value hierarchy. The investments in an SPV that have yet to purchase the underlying securities are held at cost and are categorized in Level 3 of the fair value hierarchy.
3. Fair value measurements
GAAP defines fair value, establishes a three-tier framework for measuring fair value based on a hierarchy of inputs, and expands disclosure about fair value measurements. It also provides guidance on determining when there has been a significant decrease in the volume and level of activity for an asset or liability, when a transaction is not orderly and how that information must be incorporated into a fair value measurement. The hierarchy distinguishes between market data obtained from independent sources (observable inputs) and the Fund’s own market assumptions (unobservable inputs). These inputs are used in determining the fair value of the Fund’s investments. These inputs are summarized in the three broad levels listed below:
| | ● | Level 1 — quoted prices for active markets for identical securities. An active market for the security is a market in which transactions occur with sufficient frequency and volume to provide pricing information on an ongoing basis. A quoted price in an active market provides the most reliable evidence of fair value. |
| | ● | Level 2 — other significant observable inputs (including quoted prices for similar securities, interest rates, prepayment speeds, credit risk, etc. and quoted prices for identical or similar assets in markets that are not active). Inputs that are derived principally from or corroborated by observable market data. An adjustment to any observable input that is significant to the fair value may render the measurement a Level 3 measurement. |
| | ● | Level 3 — significant unobservable inputs, including the Fund’s own assumptions in determining the fair value of investments. |
For the year ended December 31, 2021, there were transfers of $93,889,962 out of Level 3 and into Level 2, due to changes in the liquidity restrictions of private holdings.
30
THE PRIVATE SHARES FUND
Notes to the Financial Statements (Continued)
December 31, 2021
3. Fair value measurements — (continued)
The following is a description of the valuation techniques applied to the Fund’s major categories of assets and liabilities measured at fair value on a recurring basis. There were no changes to these techniques or approaches during the year ended December 31, 2021.
Securities traded on a national exchange (or reported on the NYSE and NASDAQ national market) are stated at the last reported sales price on the day of valuation. To the extent these securities are actively traded, and valuation adjustments are not applied, they are categorized in Level 1 of the fair value hierarchy. Stocks traded on inactive markets or valued by reference to similar instruments which are marketable and to the extent the inputs are observable and timely, are categorized in Level 2 of the fair value hierarchy.
The Fund’s portfolio holdings are primarily in Level 3 investments. As they are not publicly traded, and many are subject to restrictions on resale, the investments are less liquid than publicly traded securities, resulting in increased liquidity risk to the Fund.
The Fund’s portfolio investments will generally not be in publicly traded securities. Investments for which observable market prices in active markets do not exist are reported at fair value, as determined in good faith by the Investment Adviser under consistently applied policies and procedures approved by the Board of Trustees in accordance with GAAP. In connection with that determination, members of the Investment Adviser’s portfolio management team will prepare Portfolio Company valuations using the most recent Portfolio Company financial statements and forecasts when and if available. The types of factors that the Investment Adviser will take into account in determining fair value, subject to review and ratification where required by the Board of Trustees with respect to such non-traded investments, will include, as relevant and, to the extent available, the Portfolio Company’s earnings, the markets in which the Portfolio Company does business, comparison to valuations of publicly traded companies in the Portfolio Company’s industry, comparisons to recent sales of comparable companies, the discounted value of the cash flows of the Portfolio Company, the rights and preferences of the specific securities held, and other relevant factors. This information may not be available because it is difficult to obtain financial and other information with respect to private companies. In considering the extent and nature of information utilized in the valuation process, management will generally apply a greater weighting to that information which is recent and observable. Because such valuations are inherently uncertain and may be based on estimates, the determinations of fair value may differ materially from the values that would be assessed if a readily available market for these securities existed. Based on these factors, the investments in private companies will generally be presented as a Level 3 investment. Changes in accounting standards, such as the recent change in revenue recognition policies, may not be adopted consistently by issuers or at the same time, and as a result varied implementation may make it more difficult for the Fund to properly evaluate or compare financial information provided by Portfolio Companies of the Fund or to determine the validity of data of publicly traded company comparables for purposes of valuing the Fund’s portfolio holdings.
The inputs or methodology used for valuing securities are not necessarily an indication of the risk associated with investing in those securities. The following is a summary of the inputs used to determine fair value of the Fund’s investments as of December 31, 2021:
31
THE PRIVATE SHARES FUND
Notes to the Financial Statements (Continued)
December 31, 2021
3. Fair value measurements — (continued)
Investment in Securities | | Level 1
Quoted Prices | | | Level 2
Other Significant
Observable Inputs | | | Level 3
Significant
Unobservable Inputs | | | Total | |
Security Type | | | | | | | | | | | | | | | | |
Common stock in public companies* | | $ | 17,088,656 | | | $ | 20,130,548 | | | $ | — | | | $ | 37,219,204 | |
Common stock in private companies* | | | — | | | | — | | | | 223,228,378 | | | | 223,228,378 | |
Preferred stock in private companies* | | | — | | | | — | | | | 221,556,975 | | | | 221,556,975 | |
Convertible notes of private companies* | | | — | | | | — | | | | 45,253,169 | | | | 45,253,169 | |
Special purpose vehicles | | | — | | | | — | | | | 10,175,792 | | | | 10,175,792 | |
Warrants of private companies* | | | — | | | | — | | | | 13,705,489 | | | | 13,705,489 | |
Total | | $ | 17,088,656 | | | $ | 20,130,548 | | | $ | 513,919,803 | | | $ | 551,139,007 | |
Money Market holdings valued using the practical expedient and not subject to the fair value hierarchy | | | | | | | | | | | | | | | 175,918,136 | |
Total | | | | | | | | | | | | | | $ | 727,057,143 | |
* | All sub-categories within the security type represent their respective evaluation status. For a detailed breakout by industry, please refer to the Schedule of Investments. |
The following is a rollforward of the activity in investments in which significant unobservable inputs (Level 3) were used in determining fair value on a recurring basis:
| | | Beginning
balance
January 1,
2021 | | | Transfers
into Level 3
during the
period | | | Transfers
out of Level 3
during the
period | | | Purchases or
Conversions | | | (Sales or
Conversions) | | | Net
realized
gain/(loss) | | | Change in net
unrealized
gain/(loss) | | | Ending
balance
December 31,
2021 | | | Change in
Unrealized
gains for the
period for
investments
still held at
December 31,
2021 | |
The Private Shares Fund | | | | | | | | | | | | | | | | | | | | | | | | | | | | | | | | |
Common stock in private companies | | $ | 139,773,577 | | | $ | — | | | $ | (67,802,817 | ) | | $ | 102,009,940 | ** | | $ | (17,575,640 | ) | | $ | 7,044,190 | | | $ | 59,779,128 | | | $ | 223,228,378 | | | $ | 48,002,587 | |
Preferred stock in private companies | | | 77,379,271 | | | | — | | | | (26,087,145 | ) | | | 157,590,857 | ** | | | (9,903,171 | )** | | | (519,299 | ) | | | 23,096,462 | | | | 221,556,975 | | | | 27,080,453 | |
Convertible notes of private companies | | | 2,253,169 | | | | — | | | | — | | | | 45,072,740 | | | | (2,000,000 | )** | | | — | | | | (72,740 | ) | | | 45,253,169 | | | | (72,740 | ) |
Special purpose Vehicles | | | — | | | | — | | | | — | | | | 10,175,792 | | | | — | | | | — | | | | — | | | | 10,175,792 | | | | — | |
Warrant of private companies | | | 165,760 | | | | — | | | | — | | | | — | | | | — | | | | — | | | | 13,539,729 | | | | 13,705,489 | | | | 13,705,329 | |
| | | $ | 219,571,777 | | | $ | — | | | $ | (93,889,962 | ) | | $ | 314,849,329 | | | $ | (29,478,811 | ) | | $ | 6,524,891 | | | $ | 96,342,579 | | | $ | 513,919,803 | | | $ | 88,715,629 | |
** | Amounts include $9,903,172 in preferred stock converted into $9,903,172 of common stock, $5,172,500 in common stock converted to $5,172,500 in preferred stock, and $2,000,000 in convertible notes in private companies converted into $2,071,233 of preferred stocks. |
32
THE PRIVATE SHARES FUND
Notes to the Financial Statements (Continued)
December 31, 2021
3. Fair value measurements — (continued)
The following is a summary of quantitative information about significant unobservable valuation inputs for Level 3 Fair Value Measurements for investments held as of December, 31,2021:
Type of Level 3
Investment | | Fair Value as of
December 31, 2021 | | Valuation
Technique* | Unobservable
Inputs | | Range (Avg) | |
Common stock in private companies | | $ | 223,228,378 | | Precedent Transactions | Precedent Transactions | | | N/A | |
| | | | | | | | | | | |
| | | | | | Revenue Model | Revenue Multiples | | | 1.86 - 37.97 (9.49) | |
| | | | | | | Stage Discount Rates | | | 10% - 80% (23.04%) | |
| | | | | | | Execution Discount Rates | | | 25% - 90% (43.48%) | |
| | | | | | | Discounts For Lack of Marketability | | | 15.00% (15.00%) | |
Preferred stock in private companies | | | 221,556,975 | | Precedent Transactions | Precedent Transactions | | | N/A | |
| | | | | | | | | | | |
| | | | | | Revenue Model | Revenue Multiples | | | 1.23 - 21.13 (7.27) | |
| | | | | | | Stage Discount Rates | | | 10% - 80% (28.25%) | |
| | | | | | | Execution Discount Rates | | | 25% - 70% (41.67%) | |
| | | | | | | Discounts For Lack of Marketability | | | 15.00% (15.00%) | |
Warrants of private companies | | | 13,705,489 | | Option Pricing Model | Industry Volatility | | | 57.03% - 122.83% (78.01%) | |
| | | | | | | Estimated Time to Exit | | | 5.50 - 9.93 (7.95) Years | |
Convertible notes of private companies | | | 45,253,169 | | Market Approach | Precedent Transactions | | | N/A | |
To the extent the revenue multiples increase, there is a corresponding increase in fair value; while as discount rates increase, there is a decrease in fair value.
4. Expense limitation agreement
The Investment Adviser has contractually agreed to waive management fees and/or reimburse the Fund for expenses the Fund incurs, but only to the extent necessary to maintain the Fund’s total annual operating expenses after fee waivers and/or reimbursement (exclusive of any taxes, interest, brokerage commissions, acquired fund fees and expenses, and extraordinary expenses, such as litigation or reorganization costs, but inclusive of organizational costs and offering costs) to an annual rate of 2.50%, 2.25%, and 2.75% of the average daily net assets of the Fund (the “Expense Limitation”) attributable to Class A, Class I and Class L Shares, respectively, until December 9, 2022.
Under the terms of the Expense Limitation Agreement, the Investment Adviser retains the right to seek reimbursement for any fees previously waived and/or expenses previously assumed, to the extent that such reimbursement will not cause Class A, Class I or Class L Shares’ annualized expenses to exceed the applicable Expense Limitation. The Fund is not obligated to reimburse the Investment Adviser for fees previously waived or expenses previously assumed by the Investment Adviser more than three years after the date of such waiver or expense reimbursement. For the year ended December 31, 2019 and period between January 1, 2020 and December 9, 2020 , the Fund’s previous investment adviser waived and/or reimbursed $1,467,342 and $1,048,038 of investment advisory fees and Fund expenses. These amounts are not subject to possible recoupment by the Investment Adviser. Under the new expense limitation agreement, Liberty is eligible to recoup the amount waived between December 9, 2020 and December 31, 2020. For the periods between December 9, 2020 and December 31, 2020 and between January 1, 2021 and December
33
THE PRIVATE SHARES FUND
Notes to the Financial Statements (Continued)
December 31, 2021
4. Expense limitation agreement — (continued)
31, 2021, the Investment Adviser waived investment advisory fees and/or reimbursed expenses in the amount of $16,222 and $1,073,207 respectively. These amounts are subject to possible recoupment by the Investment Adviser through December 31, 2023 and December 31, 2024, respectively.
During the year ended December 31, 2021, there were legal expenses incurred by the Fund that were distinguishable in their characterization as being unusual in nature as well as not expected to be recurring in future periods. The amount caused the ratio of net expenses to average net assets of the Class A, Class I and Class L shares to exceed the contractual expense limitation. These certain expenses are not expected to be incurred in future periods. Please refer to the Financial Highlights for the Class A, Class I and Class L shares for the effect on the respective expense ratios.
5. Investment advisory agreement
The Fund has entered into an Investment Advisory Agreement with the Investment Adviser, pursuant to which the Investment Adviser provides general investment advisory services for the Fund. For providing these services, the Investment Adviser receives a fee from the Fund, accrued daily and paid monthly in arrears, at an annual rate equal to 1.90% of the Fund’s average daily net assets. For the year ended December 31, 2021, the Fund accrued $9,974,853 in investment advisory fees.
Certain officers of the Fund are also employees of the Investment Adviser. None of the Fund officers who are affiliated with the Investment Adviser receives any compensation from the Fund.
6. Capital share transactions
The Fund Shares will be continuously offered under Rule 415 of the Securities Act of 1933, as amended. As of December 31, 2021, the Fund had registered 25,000,000 shares.
Investors may purchase shares each business day at a price equal to the NAV per share next determined after receipt of a purchase order. Any sales load will be deducted from the proceeds to the Fund.
As of December 31, 2021, ownership from affiliated parties represents 0.02% of the Fund.
The Fund’s shares are not redeemable each business day, are not listed for trading on an exchange, and no secondary market currently exists for Fund shares. As an interval fund and as described in the Fund’s prospectus, the Fund will make quarterly repurchase offers of 5% of the total number of shares outstanding at its NAV, unless postponed in accordance with regulatory requirements, and each repurchase pricing shall occur no later than the 14th day after the repurchase request deadline, or the next business day if the 14th day is not a business day. Rule 23c-3 of the 1940 Act permits repurchases between 5% and 25% of the Fund’s outstanding shares at NAV.
In every full quarter since the commencement of operations, the Fund has offered shareholders the opportunity to participate in this program. During the year ended December 31, 2021, the Fund had Repurchase Offers as follows:
Repurchase Offer
Notice | | Repurchase Request
Deadline | | | Repurchase Pricing
Date | | | Repurchase Offer
Amount | | | % of Shares
Repurchased | | | Number of Shares
Repurchased | |
February 23, 2021 | | | March 25, 2021 | | | | March 25, 2021 | | | | 5% | | | | 1.59% | | | | 157,502 | |
May 26, 2021 | | | June 25, 2021 | | | | June 25, 2021 | | | | 5% | | | | 1.31% | | | | 154,917 | |
August 25, 2021 | | | September 24, 2021 | | | | September 24, 2021 | | | | 5% | | | | 2.39% | | | | 344,362 | |
November 23, 2021 | | | December 23, 2021 | | | | December 23, 2021 | | | | 5% | | | | 1.95% | | | | 336,319 | |
34
THE PRIVATE SHARES FUND
Notes to the Financial Statements (Continued)
December 31, 2021
7. Purchases and sales of securities
Purchases and sales of investments for the year ended December 31, 2021, were $302,800,914 and $94,352,800, respectively.
8. Federal tax information
At December 31, 2021, gross unrealized appreciation and depreciation of investments based on cost for federal income tax purposes were as follows:
Cost of investments | | $ | 600,802,313 | |
Gross unrealized appreciation | | $ | 139,704,463 | |
Gross unrealized depreciation | | | (13,449,633 | ) |
Net unrealized appreciation on investments | | $ | 126,254,830 | |
GAAP requires that certain components of net assets be reclassified between financial and tax reporting. These reclassifications have no effect on net assets or net asset value per share. For the year ended December 31, 2021, permanent differences in book and tax accounting have been reclassified to paid-in capital and total distributable income/(loss) as follows:
Increase (Decrease) |
Paid in Capital | Total Distributable Income/(Loss) |
$(8,914,041) | $8,914,041 |
As of December 31, 2021, the components of accumulated earnings on a tax basis were as follows:
Undistributed ordinary income | | $ | — | |
Undistributed long-term capital gains | | | 11,529,341 | |
Tax accumulated earnings | | | 11,529,341 | |
Accumulated capital and other losses | | | — | |
Net unrealized gain | | | 126,254,830 | |
Payable for withholding attributed to profit sharing agreement | | | (9,932 | ) |
Total accumulated earnings | | $ | 137,774,239 | |
The tax character of distributions paid during the fiscal years ended, December 31, 2021 and December 31, 2020 were as follows:
| | | The Private Shares Fund | |
| | | 2021 | | | 2020 | |
Distributions Paid from: | | | | | | | | |
Ordinary Income | | $ | — | | | $ | — | |
Net Long Term Capital Gains | | | 51,227,704 | | | | 5,071,155 | |
Return of Capital | | | — | | | | 546,574 | |
Total Taxable Distributions Paid | | $ | 51,227,704 | | | $ | 5,617,729 | |
ADDITIONAL INFORMATION (UNAUDITED)
Pursuant to IRC 852(b)(3) of the Internal Revenue Code, The Private Shares Fund hereby designates $51,227,704 as long-term capital gains distributed during the year ended, December 31, 2021.
35
THE PRIVATE SHARES FUND
Notes to the Financial Statements (Continued)
December 31, 2021
9. Commitments and contingencies
In the normal course of business, the Fund will enter into contracts that contain a variety of representations, provide general indemnifications, set forth termination provisions and compel the contracting parties to arbitration in the event of dispute. From time to time, the Fund may be a party to arbitration, or legal proceedings, in the ordinary course of business, including proceedings relating to the enforcement of provisions of such contracts. The Fund’s maximum exposure under these arrangements is unknown, as this would involve future claims that may be made against the Fund that would be subject to arbitration, generally.
In the normal course of business, the Company may enter into agreements to purchase and sell investments. Such agreements are subject to certain rights of the issuer’s and ultimately, issuer approval. At December 31, 2021, the Fund had entered into agreements to purchase equity securities totaling $10,999,999 and no agreements had been entered into to sell existing securities. If approved by the issuer, the Fund would record such purchase amounts as increases in costs of investment and such sale amounts as decreases in costs of investments, including recording the respective gains/loss on sale of investments.
At December 31, 2021, the Fund reasonably believes its assets will provide adequate cover to satisfy all its unfunded commitments. The Fund has ensured through its policies and procedures that it does not enter into an unfunded commitment unless it has reserved enough cash and/or short-term investments to meet the funding requirements thereof.
10. Offering price per share
A maximum front-end sales load of 5.75% for Class A shares and 4.25% for Class L is imposed on purchases. Class I shares are not subject to sales charge. For the year ended December 31, 2021, the Fund was advised that various broker dealers received $857,079 of sales charges from sales of the Fund’s shares.
11. Recent Market and Economic Developments
Certain impacts to public health conditions particular to the coronavirus (COVID-19) may have a significant negative impact on the operations and profitability of the Fund’s investments. The extent of the impact to the financial performance of the Fund will depend on future developments, including (i) the duration and spread of the outbreak, (ii) the restrictions and advisories, (iii) the effects on the financial markets, and (iv) the effects on the economy overall, all of which are highly uncertain and cannot be predicted. The Investment Adviser has taken these matters into consideration when valuing the Fund’s Investment in the portfolio companies.
12. Subsequent events
In preparing these financial statements, management has evaluated subsequent events through the date of issuance of the financial statements included herein and has determined that there are no subsequent events that require disclosure or adjustment to the financial statements.
36
THE PRIVATE SHARES FUND
Report of Independent Registered Public Accounting Firm
To the Shareholders and Board of Trustees
The Private Shares Fund:
Opinion on the Financial Statements
We have audited the accompanying statement of assets and liabilities of The Private Shares Fund (the Fund), including the schedule of investments, as of December 31, 2021, the related statements of operations and cash flows for the year then ended, the statements of changes in net assets for each of the years in the two-year period then ended, and the related notes (collectively, the financial statements) and the financial highlights for each of the years in the five-year period then ended. In our opinion, the financial statements and financial highlights present fairly, in all material respects, the financial position of the Fund as of December 31, 2021, the results of its operations and its cash flows for the year then ended, the changes in its net assets for each of the years in the two-year period then ended, and the financial highlights for each of the years in the five-year period then ended, in conformity with U.S. generally accepted accounting principles.
Basis for Opinion
These financial statements and financial highlights are the responsibility of the Fund’s management. Our responsibility is to express an opinion on these financial statements and financial highlights based on our audits. We are a public accounting firm registered with the Public Company Accounting Oversight Board (United States) (PCAOB) and are required to be independent with respect to the Fund in accordance with the U.S. federal securities laws and the applicable rules and regulations of the Securities and Exchange Commission and the PCAOB.
We conducted our audits in accordance with the standards of the PCAOB. Those standards require that we plan and perform the audit to obtain reasonable assurance about whether the financial statements and financial highlights are free of material misstatement, whether due to error or fraud. Our audits included performing procedures to assess the risks of material misstatement of the financial statements and financial highlights, whether due to error or fraud, and performing procedures that respond to those risks. Such procedures included examining, on a test basis, evidence regarding the amounts and disclosures in the financial statements and financial highlights. Such procedures also included confirmation of securities owned as of December 31, 2021, by correspondence with custodians, issuers of securities, or other appropriate auditing procedures when replies from the issuers were not received. Our audits also included evaluating the accounting principles used and significant estimates made by management, as well as evaluating the overall presentation of the financial statements and financial highlights. We believe that our audits provide a reasonable basis for our opinion.

We have served as the Fund’s auditor since 2013.
Los Angeles, California
February 28, 2022
37
THE PRIVATE SHARES FUND
Trustees and Officers
December 31, 2021 (Unaudited)
The Board of Trustees of the Fund has overall responsibilty for monitoring the Fund’s investment program and its management and operations. The names of the Trustees and Officers of the Fund, their addresses, ages and principal occupations during the past five years are provided in the tables below. Trustees who are deemed “interested persons,” as defined in the 1940 Act, are included in the table titled “Interested Trustee and Officer.” Trustees who are not “interested persons” are referred to as “Independent Trustees.” The Fund’s Statement of Additional Information includes additional information about the Fund’s Trustees and is available, without charge and upon request, by calling 1-800-834-8707.
Name, Address(1)
and Age | Position(s)
held with
the Fund | Term of
Office and Length
of Time Served | Principal Occupation(s)
During Past Five Years | Number of
Portfolios in
Fund Complex
Overseen by
Trustee | Other
Directorships
Held by
Director |
INDEPENDENT TRUSTEES: | | | | |
Robert Boulware Age: 65 | Independent Trustee | Since
inception(2) | Professional board director and trustee. Managing Director, Pilgrim Funds, LLC | 1 | Brighthouse Financial, Trustee of Vertical Capital Fund |
Mark Radcliffe Age: 69 | Independent Trustee | Since
inception(2) | Partner, DLA Piper | 1 | N/A |
OFFICERS: | | | | | |
Kevin Moss Age: 52 | President | Since
April 11, 2019 | Managing Director of Liberty Street Advisors, Inc. since December 2020; Prior thereto, President and Chief Operating Officer of SP Investments Management LLC through December 2020. | N/A | N/A |
Jack Sweeney Age: 36 | Treasurer and Chief Financial Officer | Since
April 29, 2019 | Vice President of Liberty Street Advisors since December 2020; Chief Financial Officer at SP Investments Management LLC, March 2019 through December 2020; Finance Manager at Venrock, August 2016 to March 2019 and Senior Associate at Ernst &Young LLP, prior thereto. | N/A | N/A |
Peter Guarino Age: 63 | Chief Compliance Officer | Since
May 7, 2019 | President and Chief Compliance Officer, Compliance4 LLC (independent compliance consultancy) November 2008 to the present | N/A | N/A |
(1) | All addresses c/o The Private Shares Fund Fund, 88 Pine Street, Floor 31, Suite 3101, New York, NY 10005. |
(2) | Each Trustee will serve for the duration of the Fund, or until death, resignation, termination, removal or retirement. |
38
THE PRIVATE SHARES FUND
Additional Information
December 31, 2021 (Unaudited)
Proxy voting — A description of the policies and procedures that the Fund uses to determine how to vote proxies relating to portfolio securities and information regarding how the Fund voted proxies during the 12-month period ended June 30 are available without charge upon request by (1) calling the Fund at 1-800-834-8707 and (2) from Fund documents filed with the Securities and Exchange Commission (“SEC”) on the SEC’s website at www.sec.gov.
Portfolio holdings — The Fund files its complete schedule of portfolio holdings with the SEC for the first and third quarters of each fiscal year on form N-PORT-P. The Fund’s Form N-PORT-P is available on the SEC’s website at http://sec.gov. You may also obtain copies by calling the Fund at 1-800-834-8707.
39
THE PRIVATE SHARES FUND
40
THIS PAGE INTENTIONALLY LEFT BLANK
THIS PAGE INTENTIONALLY LEFT BLANK

Board of Trustees
Robert J. Boulware
Mark Radcliffe
Investment Adviser
Liberty Street Advisors, Inc.
88 Pine Street, 31st Floor, Suite 3101
New York, NY 10005
Dividend Paying Agent, Transfer Agent
UMB Fund Services
235 West Galena Street
Milwaukee, WI 53212
Custodian
UMB Bank National Association
1010 Grand Boulevard
Kansas City, MO 64106
Distributor
Foreside Fund Services, LLC
Three Canal Plaza, Suite 100
Portland, ME 04101
Independent Auditors
KPMG LLP
550 South Hope Street, Suite 1500
Los Angeles, CA 90071
This report has been prepared for the general information of the shareholders. It is not authorized for distribution to prospective investors unless preceded or accompanied by a current prospectus. The Fund’s prospectus contains more complete information about the objectives, policies, expenses and risks of the Funds. The Fund is not a bank deposit, not FDIC insured and may lose value. Please read the prospectus carefully before investing or sending money.
This report contains certain forward looking statements which are subject to known and unknown risks and uncertainties that could cause actual results to differ materially from those expressed or implied by such statements. Forward looking statements generally include words such as ‘‘believes’’, ‘‘expects’’, ‘‘anticipates’’ and other words of similar import. Such risks and uncertainties include, among other things, the Risk Factors noted in the Fund’s filings with the Securities and Exchange Commission. The Fund undertakes no obligation to update any forward looking statement.
(b) There were no notices transmitted to stockholders in reliance on Rule 30e-3 under the Investment Company Act of 1940, as amended, that contained disclosures specified by paragraph (c)(3) of that rule.
Item 2. Code of Ethics.
The Registrant has a code of ethics (the “Code”) that applies to the Registrant’s principal executive officer and principal financial officer. During the period covered by this report, there were no material amendments to the provisions of the Code, nor were there any implicit or explicit waivers to the provisions of the Code. The Code is filed herewith.
Item 3. Audit Committee Financial Expert.
The Registrant does not have an audit committee financial expert. The Board of Trustees of the Registrant has determined that the members of its Audit Committee have sufficient financial experience to ensure the proper functioning of that committee, but that neither of the members has the requisite expertise or experience to be deemed an “audit committee financial expert” for purposes of the definition of such term in the Instructions to this Item 3 on Form N-CSR.
Item 4. Principal Accountant Fees and Services.
The aggregate fees for professional services by KPMG LLP during the fiscal year 2021 and 2020 were as follows:
(a) Audit Fees.
| Fiscal year ended December 31, 2021: | $ 340,000 |
| Fiscal year ended December 31, 2020: | $ 246,000 |
(b) Audit-Related Fees.
| Fiscal year ended December 31, 2021: | $ 0.00 |
| Fiscal year ended December 31, 2020: | $ 0.00 |
(c) Tax Fees. These are fees billed for professional services rendered by the Registrant’s independent auditors for tax compliance, tax advice, and tax planning.
| Fiscal year ended December 31, 2021: | $ 15,100 |
| Fiscal year ended December 31, 2020: | $ 14,325 |
(d) All Other Fees.
| Fiscal year ended December 31, 2021 | $ 0.00 |
| Fiscal year ended December 31, 2020 | $ 0.00 |
(e) Audit Committee’s pre-approval policies and procedures.
| | (1) | The Audit Committee has adopted pre-approval policies and procedures that require the Audit Committee to pre-approve all audit and non-audit services of the Registrant, including services provided to the Registrant’s investment adviser or any entity controlling, controlled by or under common control with the Registrant’s investment adviser that provides ongoing services to the Registrant with respect to any engagement that directly relates to the operations and financial reporting of the Registrant. |
| | (2) | Services approved pursuant to paragraph (c)(7)(i)(C) of Rule 2-01 of Regulation S-X: 100% of these fees were approved by the Audit Committee as required pursuant to paragraph (c)(7)(ii) of Rule 2-01 of Regulation S-X. |
(f) None.
(g) During the last two fiscal years, there were no other non-audit services rendered by the Registrant’s independent auditors to the Registrant, its investment adviser or any entity controlling, controlled by or under the common control with the investment adviser that provides ongoing services to the Registrant.
(h) Not applicable.
Item 5. Audit Committee of Listed Registrants.
Not applicable.
Item 6. Schedule of Investments.
Included as part of the report to shareholders filed under Item 1 of this Form N-CSR.
Item 7. Disclosure of Proxy Voting Policies and Procedures for Closed-End Management Investment Companies.
The Board of Trustees of the Registrant has adopted the Proxy Voting Policy of Liberty Street Advisors, Inc (“Liberty”), the Registrant’s investment adviser, as the Registrant’s Proxy Voting Procedures. Subject to the oversight of the Registrant’s Board of Trustees, the Registrant has delegated responsibility to the Adviser to vote any proxies the Registrant may receive. The Adviser’s general policy is to vote proxy proposals, amendments, consents or resolutions relating to the Registrant in a manner that serves the best interests of the Registrant.
Adviser’s Proxy Voting Policy
Liberty, as a matter of policy and as a fiduciary to its clients that are registered management investment companies (“Clients”), permits Clients to delegate proxy voting authority to Liberty, consistent with the best economic interests of the Clients. All Client proxies are voted in accordance with the Adviser’s Proxy Voting Guidelines, as described below.
As part of its fiduciary duties to the Registrant, Liberty will vote proxies. It is not expected that the Registrant will own securities in its portfolio that may require the voting of proxies, but if that should occur, these procedures would apply. The Adviser will vote proxies on behalf of the Registrant. With respect to each proxy proposal, Liberty will consider the period of time that the particular security is expected to be held for an account, the size of the holding, the costs involved with the proxy proposal, the existing corporate governance structure, and the current management and operations for the particular company. Typically, Liberty will vote proxies in accordance with management’s recommendations. However, in situations where Liberty believes that management is acting on its own behalf or acting in a manner that is adverse to the rights of the company’s shareholders, Liberty will not vote with management.
For each proxy, Liberty also considers whether there are any specific facts and circumstances that may give rise to a material conflict of interest on the part of Liberty in voting the proxy. If it is determined that a material conflict of interest may exist, the proxy will be referred to Liberty’s Investment Committee to decide if Liberty may vote the proxy or if the proxy should be referred to the Registrant to vote. All instances where Liberty determines a material conflict of interest may exist are resolved in the best interests of the Registrant. Liberty retains final authority and fiduciary responsibility for proxy voting.
Item 8. Portfolio Managers of Closed-End Management Investment Companies.
(a)(1) Identification of Portfolio Manager(s) and Description of Role of Portfolio Manager(s).
As of December 31, 2021, the portfolio management team of the Registrant was comprised of Kevin Moss, Christian Munafo and Sven Jonas Grankvist (the “Portfolio Management Team”). The Portfolio Management Team was primarily responsible for the day-to-day portfolio management of the Registrant.
Mr. Moss is a Managing Director of Liberty Street Advisors, Inc. and serves as both a portfolio manager and member of the Liberty Investment Committee. Prior to joining Liberty, he was with SP Investments Management, LLC (“SPIM”), a registered investment adviser and wholly owned subsidiary of SharesPost, Inc. For eight years he served as SPIM’s President and COO overseeing the operations and trading of SPIM. He is also one of the creators of the SharesPost 100 Fund and continues to serve as the President of the Fund and is one of the portfolio managers. He is also a member of the Liberty investment committee. Prior to joining SPIM, Kevin was a senior portfolio manager at First New York Securities, where he managed a global macro book. With over 20 years of senior level experience in financial services, Kevin’s specific areas of expertise include the management of client relationships, investment research coverage, block and position trading, and operations management. Kevin began his career as an institutional equity sales trader working for Instinet, and later Commerzbank. His client base included hedge funds, pension funds and proprietary trading desks. Subsequently, Kevin held a series of distinguished posts at leading hedge funds and proprietary trading firms including serving as the head of international trading for Libra Advisors and Opus Trading Funds. Mr. Moss holds a Bachelor of Science from Tulane University and an MBA from Columbia University.
Mr. Munafo is the Chief Investment Officer of Liberty Street Advisors, Inc. and serves as both a portfolio manager and member of the Liberty Investment Committee. Prior to joining Liberty, he was Chief Investment Officer of SP Investments Management, LLC. Mr. Munafo joined SP Investments Management
in August 2019, where he also served as one of the portfolio managers and members of the investment committee. Prior to his position with the Investment Adviser, Mr. Munafo was Co-Head of the Global Private Equity Secondary Practice at HQ Capital based in New York, where he was also a member of the senior leadership team. Prior to that, he served as Head of Secondaries at Thomas Weisel Partners. Mr. Munafo has 21 years of experience in finance, with the last 16 years focused on secondary investments involving venture-backed and growth equity-oriented companies and funds. During this time, he has also served on the boards of many of these companies and funds. In aggregate, Mr. Munafo has helped raise more than $1 billion globally from institutional investors, corporations, pensions, endowments and family offices. In addition, Mr. Munafo has overseen the completion of more than 100 secondary transactions representing over $1 billion in capital commitments, ranging from traditional purchases of limited partnership interests to more complex non-traditional transactions including fund restructurings, recapitalizations, tender programs, preferred equity/loan facilities and purchases of company securities. Mr. Munafo began his career as an investment banker focused on mergers and acquisitions at Banc of America Securities. Mr. Munafo holds a Bachelor of Arts from Rutgers College in Economics and Finance.
Mr. Grankvist is a Director of Liberty Street Advisors, Inc. and serves as both a portfolio manager and a member of the Liberty Investment Committee. Prior to joining Liberty, he was with SP Investments Management, LLC, a registered investment adviser, for eight years. He is also an initial member of the SharesPost 100 Fund team and has been instrumental in developing and overseeing the daily valuation procedures. During his tenure as portfolio manager, he has led or helped lead hundreds of primary and secondary direct transactions for over 60 leading growth stage private companies, with responsibilities including due diligence, originating, negotiating and deal execution. Jonas began his career as a technology investment banker at Berman Capital. Jonas received his LLM from Uppsala University and MBA from Golden Gate University, magna cum laude. He holds FINRA series 7 and 63 licenses.
(a)(2) Other Accounts Managed by Portfolio Manager(s) or Management Team Member and Potential Conflicts of Interest.
(i) As of December 31st, 2021, Messrs. Moss, Munafo, and Grankvist were the portfolio managers of the Private Shares Opportunities Fund LLC (“Private Shares Opportunity Fund”) and are primarily responsible for the day-to-day portfolio management of Private Shares Opportunity Fund.
(ii) (A) Zero.
(B) One (1), Private Shares Opportunity Fund. Total assets of Private Shares Opportunity Fund managed by Messrs. Moss, Munafo, and Grankvist as of December 31, 2021 were approximately $26,900,000.
(C) Zero.
(iii) Two (2) accounts. As of December 31, 2021, $26,900,000 of the assets in the Private Shares Opportunity Fund were subject to performance fee.
(iv) A material conflict could arise in respect of the allocation of investment opportunities between the Registrant and Private Shares Opportunity Fund, as both entities have a substantially similar investment strategy to invest in the equity securities of private companies. However, to address such potential conflict of interest, Liberty has adopted compliance policies and procedures designed to address such conflict. It is Liberty’s general policy to allocate purchase or sale opportunities on a pro rata basis to all applicable Clients, measured by reference to each Client’s relative net asset value as of the beginning of the month in which the purchase or sale is executed. However, with respect to Private Shares Opportunity Fund, only after the Liberty Investment Committee has made its decision to pursue a purchase or sale opportunity in a given security on behalf the Registrant and the rationale for such decision has been documented by the Investment Committee and reviewed and approved by Liberty’s Chief Compliance Officer, may Private
Shares Opportunity Fund, or any other overage fund structure advised by Liberty, be permitted to pursue a purchase or sale opportunity in any additionally available interests or shares of such security.
(a)(3) Compensation Structure of Portfolio Manager(s).
As of December 31, 2021, compensation for the Registrant’s Portfolio Management Team consists of base salary and bonus, which is in part dependent upon the overall performance of Liberty. The compensation is monitored to ensure competitiveness in the external marketplace.
(a)(4) Disclosure of Securities Ownership.
The following table sets forth the dollar range of equity securities beneficially owned by the Portfolio Management Team in the Registrant as of December 31, 2021:
| Portfolio Manager | Dollar Range of Registrant Shares Beneficially Owned |
| Kevin Moss | $10,000 - $50,000 |
| Christian Munafo | $10,000 - $50,000 |
| Sven Jonas Grankvist | $10,000 - $50,000 |
Item 9. Purchases of Equity Securities by Closed-End Management Investment Company and Affiliated Purchasers.
REGISTRANT PURCHASES OF EQUITY SECURITIES
| Class A | (a) Total Number of Shares (or Units) Purchased | (b) Average Price Paid per Share (of Unit) | (c) Total Number of Shares (or Units) Purchased as Part of Publicly Announced Plans or Programs | (d) Maximum Number (or Approximate Dollar Value) of Shares (or Units) that May Yet Be Purchased Under the Plans or Programs |
| Period | | | | |
| Jan. 1-31, 2021 | 0 | 0 | 0 | 0 |
| Feb. 1-28, 2021 | 0 | 0 | 0 | 0 |
| Mar. 1-31, 2021 | 36,905 | $40.49 | 0 | 0 |
| Apr. 1-30, 2021 | 0 | 0 | 0 | 0 |
| May 1-31, 2021 | 0 | 0 | 0 | 0 |
| Jun. 1-30, 2021 | 51,802 | $42.85 | 0 | 0 |
| Jul. 1-31, 2021 | 0 | 0 | 0 | 0 |
| Aug. 1-31, 2021 | 0 | 0 | 0 | 0 |
| Sep. 1-30, 2021 | 107,096 | $44.56 | 0 | 0 |
| Oct. 1-31, 2021 | 0 | 0 | 0 | 0 |
| Nov. 1-30, 2021 | 0 | 0 | 0 | 0 |
| Dec. 1-31, 2021 | 45,576 | $41.94 | 0 | 0 |
| Total | 241,379 | $43.08 | 0 | 0 |
| Class I | (a) Total Number of Shares (or Units) Purchased | (b) Average Price Paid per Share (of Unit) | (c) Total Number of Shares (or Units) Purchased as Part of Publicly Announced Plans or Programs | (d) Maximum Number (or Approximate Dollar Value) of Shares (or Units) that May Yet Be Purchased Under the Plans or Programs |
| Period | | | | |
| Jan. 1-31, 2021 | 0 | 0 | 0 | 0 |
| Feb. 1-28, 2021 | 0 | 0 | 0 | 0 |
| Mar. 1-31, 2021 | 120,597 | $40.83 | 0 | 0 |
| Apr. 1-30, 2021 | 0 | 0 | 0 | 0 |
| May 1-31, 2021 | 0 | 0 | 0 | 0 |
| Jun. 1-30, 2021 | 102,462 | $43.23 | 0 | 0 |
| Jul. 1-31, 2021 | 0 | 0 | 0 | 0 |
| Aug. 1-31, 2021 | 0 | 0 | 0 | 0 |
| Sep. 1-30, 2021 | 237,266 | $44.98 | 0 | 0 |
| Oct. 1-31, 2021 | 0 | 0 | 0 | 0 |
| Nov. 1-30, 2021 | 0 | 0 | 0 | 0 |
| Dec. 1-31, 2021 | 283,178 | $42.39 | 0 | 0 |
| Total | 743,503 | $43.08 | 0 | 0 |
| Class L | (a) Total Number of Shares (or Units) Purchased | (b) Average Price Paid per Share (of Unit) | (c) Total Number of Shares (or Units) Purchased as Part of Publicly Announced Plans or Programs | (d) Maximum Number (or Approximate Dollar Value) of Shares (or Units) that May Yet Be Purchased Under the Plans or Programs |
| Period | | | | |
| Jan. 1-31, 2021 | 0 | 0 | 0 | 0 |
| Feb. 1-28, 2021 | 0 | 0 | 0 | 0 |
| Mar. 1-31, 2021 | 0 | 0 | 0 | 0 |
| Apr. 1-30, 2021 | 0 | 0 | 0 | 0 |
| May 1-31, 2021 | 0 | 0 | 0 | 0 |
| Jun. 1-30, 2021 | 653 | $42.49 | 0 | 0 |
| Jul. 1-31, 2021 | 0 | 0 | 0 | 0 |
| Aug. 1-31, 2021 | 0 | 0 | 0 | 0 |
| Sep. 1-30, 2021 | 0 | 0 | 0 | 0 |
| Oct. 1-31, 2021 | 0 | 0 | 0 | 0 |
| Nov. 1-30, 2021 | 0 | 0 | 0 | 0 |
| Dec. 1-31, 2021 | 7,565 | $41.50 | 0 | 0 |
| Total | 8,217 | $41.58 | 0 | 0 |
On February 23, 2021, May 26, 2021, August 25, 2021, and November 23, 2021 the Registrant offered to repurchase 157,502, 154,917, 344,362, and 336,319 shares, respectively, pursuant to its periodic repurchase plan.
Item 10. Submission of Matters to a Vote of Security Holders.
Not applicable.
Item 11. Controls and Procedures.
| (a) | The Registrant’s Principal Executive Officer and Principal Financial Officer have reviewed the Registrant's disclosure controls and procedures (as defined in Rule 30a-3(c) under the Investment Company Act of 1940, as amended, (the “Act”)) as of a date within 90 days of the filing of this report, as required by Rule 30a-3(b) under the Act. Based on their review, such officers have concluded that the disclosure controls and procedures were effective in ensuring that information required to be disclosed in this report was appropriately recorded, processed, summarized and reported and made known to them by others within the Registrant and by the Registrant’s service providers. |
| (b) | There were no changes in the Registrant’s internal control over financial reporting (as defined in Rule 30a-3(d) under the Act (17 CFR 270.30a-3(d)) that occurred during the period covered by this report that materially affected, or were reasonably likely to materially affect, the Registrant’s internal control over financial reporting. |
Item 12. Disclosure of Securities Lending Activities for Closed-End Management Investment Companies
The Fund has not engaged in Security Lending Activities.
Item 13. Exhibits.
| (a) (4) | Change in the registrant’s independent public accountant. Not applicable. |
SIGNATURES
Pursuant to the requirements of the Securities Exchange Act of 1934 and the Investment Company Act of 1940, the Registrant has duly caused this report to be signed on its behalf by the undersigned, thereunto duly authorized.
The Private Shares Fund
| /s/ Kevin Moss | |
| By: Kevin Moss | |
| President | |
| March 08, 2022 | |
Pursuant to the requirements of the Securities Exchange Act of 1934 and the Investment Company Act of 1940, this report has been signed below by the following persons on behalf of the Registrant and in the capacities and on the dates indicated.
| /s/ Kevin Moss | |
| By: Kevin Moss | |
| President | |
| March 08, 2022 | |
| /s/ Jack Sweeney | |
| By: Jack Sweeney | |
| Principal Financial Officer | |
| March 08, 2022 | |