UNITED STATES
SECURITIES AND EXCHANGE COMMISSION
Washington, D.C. 20549
FORM N-CSR
CERTIFIED SHAREHOLDER REPORT OF REGISTERED
MANAGEMENT INVESTMENT COMPANIES
811-22742
(Investment Company Act File Number)
Principal Real Estate Income Fund
(Exact Name of Registrant as Specified in Charter)
1290 Broadway, Suite 1000
Denver, CO 80203
(Address of Principal Executive Offices)
Jennifer Craig
Principal Real Estate Income Fund
1290 Broadway, Suite 1000
Denver, CO 80203
(Name and Address of Agent for Service)
(303) 623-2577
(Registrant’s Telephone Number)
Date of Fiscal Year End: October 31
Date of Reporting Period: April 30, 2021
| Item 1. | Reports to Stockholders. |
(a)

Section 19(b) disclosure
April 30, 2021 (Unaudited)
The Principal Real Estate Income Fund (the “Fund”), acting pursuant to a Securities and Exchange Commission (“SEC”) exemptive order and with the approval of the Fund’s Board of Trustees (the “Board”), have adopted a plan, consistent with the Fund’s investment objectives and policies, to support a level monthly distribution of income, capital gains and/or return of capital (the “Plan”). In accordance with the Plan, the Fund distributed $0.08 per share on a monthly basis during the six months ended April 30, 2021.
The fixed amount distributed per share is subject to change at the discretion of the Fund’s Board. Effective May 2021 the monthly distribution rate was changed to $0.0825 per share. Under the Plan, the Fund will distribute all available investment income to its shareholders, consistent with the Fund’s primary investment objectives and as required by the Internal Revenue Code of 1986, as amended (the “Code”). If sufficient investment income is not available on a monthly basis, the Fund will distribute long-term capital gains and/or return of capital to shareholders in order to maintain a level distribution. Each monthly distribution to shareholders is expected to be at the fixed amount established by the Board, except for extraordinary distributions and potential distribution rate increases or decreases to enable the Fund to comply with the distribution requirements imposed by the Code.
Shareholders should not draw any conclusions about the Fund’s investment performance from the amount of these distributions or from the terms of the Plan. The Fund’s total return performance on net asset value is presented in its financial highlights table.
The Board may amend, suspend or terminate the Fund’s Plan at any time without prior notice if it deems such action to be in the best interest of either the Fund or its shareholders. The suspension or termination of the Plan could have the effect of creating a trading discount (if a Fund’s stock is trading at or above net asset value) or widening an existing trading discount. The Fund is subject to risks that could have an adverse impact on its ability to maintain level distributions. Examples of potential risks include, but are not limited to, economic downturns impacting the markets, increased market volatility, companies suspending or decreasing corporate dividend distributions and changes in the Code. Please refer to the Fund’s prospectus for a more complete description of its risks.
Please refer to the Additional Information section in this shareholder report for a cumulative summary of the Section 19(a) notices for the Fund’s current fiscal period. Section 19(a) notices for the Fund, as applicable, are available on the Principal Real Estate Income Fund’s website; www.principalcef.com.
Table of contents
| Performance Overview | 2 |
| Statement of Investments | 9 |
| Statement of Assets and Liabilities | 15 |
| Statement of Operations | 16 |
| Statements of Changes in Net Assets | 17 |
| Statement of Cash Flows | 18 |
| Financial Highlights | 20 |
| Notes to Financial Statements | 22 |
| Dividend Reinvestment Plan | 32 |
| Additional Information | |
| Portfolio holdings | 34 |
| Proxy voting | 34 |
| Section 19(a) notices | 34 |
| Stockholder meeting results | 35 |
| Unaudited tax information | 35 |
| Licensing agreement | 36 |
| Custodian and transfer agent | 36 |
| Legal counsel | 36 |
| Independent registered public accounting firm | 36 |
| Privacy Policy | 37 |
Beginning on January 1, 2021, as permitted by regulations adopted by the U.S. Securities and Exchange Commission, paper copies of the Fund’s annual and semi-annual shareholder reports will no longer be sent by mail, unless you specifically request paper copies of the reports. Instead, the reports will be made available on the Fund’s website at www.principalcef.com and you will be notified by mail each time a report is posted and provided with a website link to access the report.
You may elect to receive all future shareholder reports in paper free of charge. If you invest through a financial intermediary, you can contact your financial intermediary or, if you invest directly with the Fund, you can call 855-552-6280 to request that you continue to receive paper copies of your shareholder reports.
If you already elected to receive shareholder reports electronically, you will not be affected by this change and you need not take any action. You may elect to receive shareholder reports and other communications from the Fund electronically anytime by contacting your financial intermediary (such as a broker-dealer or bank) or, if you are a direct investor, by contacting the Fund directly at 855-552-6280.
www.principalcef.com
| Principal Real Estate Income Fund | Performance Overview |
| | April 30, 2021 (Unaudited) |
PERFORMANCE OVERVIEW
Principal Real Estate Income Fund (“PGZ” or the “Fund”) was launched June 25, 2013. As of April 30, 2021, the Fund was 63% allocated to commercial mortgage backed securities (“CMBS”) and 37% in U.S. and International real estate securities, primarily real estate investment trusts (“REITs”). For the 6-month period ended April 30, 2021, the Fund delivered a net return, at market price, of 66.59%, assuming dividends are reinvested back into the Fund, based on the closing share price of $15.19 on April 30, 2021. This compares to the return of the S&P 500® Index, over the same time-period, of 28.86% assuming dividends are reinvested into the index. This also compares to the return of the Bloomberg Barclays U.S. Aggregate Bond Index of -1.52%.
The April 30, 2021 closing market price of $15.19 represented a 9.31% discount to the Fund’s Net Asset Value (“NAV”). This compares to an average 1.82% discount for equity real estate closed-end funds and a 3.79% premium for mortgage-backed securities closed-end funds (source: Bloomberg). These discounts to NAV reflect the recovery from the COVID-19 induced volatility that occurred in the closed-end fund market in 2020.
Based on NAV, the Fund returned 26.57%, including dividends, for the 6-month period ended April 30, 2020. The theme that dominated the market during this period was the relief after the vaccines were announced in early November and the recovery of the outlook for commercial real estate as the vaccines began being distributed in early 2021. The unexpected availability of the vaccines helped the market become more confident in the prospects of the economy re-opening and pull forward economic growth expectations to the second half of 2021. The response to the events surrounding the vaccine was interest rates being driven higher by 100bps to a peak of 1.74% at the end of March and 1.63% to end the period, CMBS credit spreads gapping tighter and a strong recovery in REIT prices. While still elevated, volatility trended lower reflecting the optimism that came into the market. During the period, the VIX averaged 22 with a spike to 37 at the end of January. Volatility subsided after this spike to end the period just under 19 after starting the period at 38.
Commercial real estate, including CMBS, has been one of the asset classes most impacted by the economic shut down associated with the nation’s response to COVID-19 and most impacted by the distribution of multiple vaccines that is leading to the re-opening of the economy. Hotel and retail properties that were basically shut down due to COVID-19 and have since reopened stand to benefit the most from leisure travel resuming and consumers back out shopping. These were the property types that were most under stress with CMBS loan delinquencies peaking in July at 25% for hotels and 15%. Since then, delinquencies have been trending lower as some borrowers have been granted forbearance by the special servicers to get them to other side of COVID-19, some borrowers have brought loans current and the most distressed loans have started to be liquidated through foreclosure. The pace of new defaults has slowed materially as well as borrowers who were able to make it through the crisis are in a better position with the re-opening of the economy starting sooner than expected. This positive change in performance and market sentiment over the past six months has allowed lower rated BBB and BB bonds, which lagged the recovery in higher rated bonds prior to November, to outperform as loan level loss expectations have been revised lower by the market.
Among real estate stocks, higher leveraged, higher volatility stocks outperformed, reflecting improved risk sentiment after the vaccine news. In the last six months, there was a clear change in leadership towards value and cyclical sectors across all regions, with lodging and retail performing best, while the past year’s biggest outperformers that performed defensively through the year (data centers and industrial) lagged.
| Principal Real Estate Income Fund | Performance Overview |
| | April 30, 2021 (Unaudited) |
All major regions had positive performance. The Americas region was lifted by the tailwind of stronger USD and rising treasury yields as the U.S. recovery and scale of economic stimulus is far outpacing the rest of the world. Reopening plays outperformed, especially in retail and hotels. Performance in Asia was led by retail heavy Australia, and higher beta non-REIT property stocks in Hong Kong. Singapore was the weakest performance on a rotation from bond proxies to cyclicals. Continental Europe performance was led by retail heavy Dutch stocks while defensive German residential were among the worst performers despite solid earnings results.
CMBS
The CMBS holdings within the Fund returned 13.87% for the 6 months ended April 30, 2021. The main driver of returns for the period was the flattening of the credit curve and the material increase in interest rates BBB- and BB rated CMBS bonds were the beneficiaries of the market lowering loan level loss expectations in response to the potential for the economy to re-open sooner and stronger with the availability of vaccines. The lower loss projections were driven by the potential for more favorable outcomes on loans that had gone delinquent post-Covid and for fewer performing loans being at risk of defaulting over the next 12-24 months. While uncertainty remains around how the re-opening of the economy might impact different markets and property types, there is much more confidence on the resolution of the health crisis. This change helped lower the systematic risk associated with Covid-19 and leaves the market to price the idiosyncratic risk associated with each individual pool of loans.
For the 6 month period ending April 30, 2021, AAA spreads tightened 30-35bps, AA spreads tightened 40-45bps, A spreads tightened 65-70bps, BBB- spreads tightened 250bps and BB spreads tightened over 800bps in response to the change in market sentiment, higher interest rates and limited new issue supply. CMBS delinquencies peaked in July at just over 9.3% and has since leveled off and improved, ending the period at 6.8% driven by the re-opening of the economy and the stimulus programs. Even with this strong recovery in CMBS spreads, BBB- and BB spreads remain wide of the tights in the 1st quarter of 2020 reflecting the fact that lower rated CMBS remain exposed to the fundamental credit risk in the CMBS market until the economy fully recovers. This is also true for what extent do changes in consumer and business behavior in response to COVID-19 that might negatively impact the demand for commercial real estate become permanent even after the crisis is over.
The performance of the CMBS holdings within the Fund reflect the dramatic tightening of BBB- and BB- rated CMBS spreads in response to the improved outlook for recovery from the crisis. The continued price recovery for the portfolio holdings will be driven by how quickly economic activity does recover due to the vaccine and how many distressed borrowers are able to start making payments again as demand returns for their properties. This is especially true for hotel and retail properties and how long owners can make up for missed payments and protect their properties from foreclosure during this period. The recovery in market prices assume that more owners will be able to do that than before the vaccine which is resulting in lower expected pool level loan losses.
| | |
| Semi-Annual Report | April 30, 2021 | 3 |
| Principal Real Estate Income Fund | Performance Overview |
| | April 30, 2021 (Unaudited) |
GLOBAL REAL ESTATE SECURITIES
The global real estate securities holdings within the fund returned approximately 30.1%, during the trailing six months ending April 30th, 2021.
Exposure to U.S. apartments were notable contributors, as the sector performed well with coastal landlords releasing data pointing to stabilization in demand and as renters plan their return to coastal cities. Other large contributors to performance in the Americas include net lease, healthcare, industrial and shopping centers. In Australia currency tailwinds further boosted results as stocks in the portfolio posted solid results. Strong performance from Japan REITS was another notable contributors in the region. In Europe, key contributors to performance were Spanish property stocks and UK industrial.
As we cycled through the tail end of winter in the Northern hemisphere, investors are looking through the recent resurgence of COVID-19 cases in Europe and focusing on the rollout of vaccines, the potential for an additional US$2.5 trillion of infrastructure stimulus on top of the US$1.4 trillion COVID-19 relief bill that just passed, and the dovish overtures of global central banks. With low base effects providing the setup for a strong rebound in economic data and vaccinations paving the way for a more substantive economic reopening in the second half of the year, the global recovery that is already underway looks firmly ensconced.
However, as we look to the rest of the year, there are a number of risks that investors will have to grapple with. First, easier comps will be behind us by the second half of 2021, making it more difficult for earnings revisions to surprise to the upside. Second, even if additional U.S. infrastructure stimulus is passed, the spending is likely to be phased out over a multi-year timeframe. Meanwhile, the U.S. will face a fiscal cliff next year as the effect of this years’ spending binge wears off and corporate tax rates look slated to rise, nullifying to some degree the effects of stimulus. Third, to the extent that economic data, especially on employment continue to come in strong, the Fed could start to guide for a tapering of its bond purchase program even as it continues to hold down short rates until its inflation target is reached. Fourth, the extent of post-COVID-19 scarring remains unclear. Within real estate, these issues include the potential for longer-term behavioral changes that may adversely and structurally impact space market demand.
On balance, we are cautiously optimistic going forward but will continue to evaluate relative valuations as we expect that uncertainty and policy-induced volatility is likely here to stay. Rather than attempting to forecast sentiment shifts, our investment decisions are guided by fundamental valuation levels and we will continue to search for opportunities using our bottom-up, stock selection focused approach. While we acknowledge it is possible value stocks could continue to rally and further narrow the value/growth valuation gap, we do not believe a further narrowing is warranted nor sustainable. We believe stocks with superior earnings prospects and favorable structural demand drivers are best positioned, based on current valuation levels, to outperform in the intermediate to longer-term future. That said, we have selectively added to cyclical themes on weakness, particularly where we feel consensus has been too bearish and there is scope for earning upgrades, given some of the more near-term cyclically supportive factors highlighted earlier.
| Principal Real Estate Income Fund | Performance Overview |
| | April 30, 2021 (Unaudited) |
References:
The Premium/Discount is the amount (stated in dollars or percent) by which the selling or purchase price of a fund is greater than (premium) or less than (discount) its face amount/value or net asset value (NAV).
Duration is a measure of the sensitivity of the price (the value of principal) of a fixed-income investment to a change in interest rates. Duration is expressed as a number of years. The duration number is a calculation involving present value, yield, coupon, final maturity and call features. The bigger the duration number, the greater the interest-rate risk or reward for bond prices. Rising interest rates mean falling bond prices, while declining interest rates mean rising bond prices.
S&P 500® Index – A large cap U.S. equities index that includes 500 leading companies and captures approximately 80% coverage of available market capitalization.
Bloomberg Barclays U.S. Aggregate Bond Index – A broad-based benchmark that measures the investment grade, U.S. dollar-denominated, fixed rate taxable bond market, including Treasuries, government related and corporate securities, MBS (agency fixed-rate and hybrid ARM pass throughs), ABS, and CMBS.
Morningstar Developed Markets Index – An index that captures the performance of the stocks located in the developed countries across the world. Stocks in the index are weighted by their float capital, which removes corporate cross ownership, government holdings and other locked-in shares.
Basis point (bps) refers to a common unit of measure for interest rates and other percentages in finance. One basis point is equal to 1/100th of 1%, or 0.01%, or 0.0001, and is used to denote the percentage change in a financial instrument.
A bond rating is a grade given to bonds by private, independent ratings services that indicates their credit quality. Investment grade bonds range from AAA to BBB- and will usually see bond yields increase as ratings decrease.
Issuance information – JPMorgan
| | |
| Semi-Annual Report | April 30, 2021 | 5 |
| Principal Real Estate Income Fund | Performance Overview |
| | April 30, 2021 (Unaudited) |
PERFORMANCE as of April 30, 2021
| TOTAL RETURNS(1) | CUMULATIVE | AVERAGE ANNUAL |
| Fund | 6 Month | 1 Year | 3 Year | 5 Year | Since Inception(2) |
| Net Asset Value (NAV)(3)(5) | 26.57% | 26.11% | 3.45% | 6.13% | 7.29% |
| Market Price(4) | 66.59% | 34.64% | 4.92% | 6.28% | 5.34% |
| Bloomberg Barclays U.S. | | | | | |
| Aggregate Bond Index | -1.52% | -0.27% | 5.19% | 3.19% | 3.45% |
| Morningstar Developed | | | | | |
| Markets Index | 30.16% | 47.39% | 14.34% | 14.50% | 12.49% |
| (1) | Total returns assume reinvestment of all distributions |
| (2) | The Fund commenced operations on June 25, 2013. |
| (3) | Performance returns are net of management fees and other Fund expenses. |
| (4) | Market price is the value at which the Fund trades on an exchange. This market price can be higher or lower than its NAV. |
| (5) | Excludes adjustments in accordance with accounting principles generally accepted in the United States of America and as such the NAV and total return for shareholder transactions reported to the market may differ from the NAV for financial reporting purposes. |
Performance data quoted represents past performance. Past performance does not guarantee future results. Investment return and principal value of an investment will fluctuate so that an investor’s shares, when sold or redeemed, may be worth more or less than the original cost. Current performance data may be higher or lower than actual data quoted. For the most current month-end performance data please call 855.838.9485.
Total Annual Expense Ratio as a Percentage of Net Assets Attributable to Common Shares including interest expense, as of April 30, 2021, 2.64%.
Total Annual Expense Ratio as a Percentage of Net Assets Attributable to Common Shares excluding interest expense, as of April 30, 2021, 2.18%.
The Fund is a closed-end fund and does not continuously issue shares for sale as open-end mutual funds do. Since the initial public offering, the Fund now trades only in the secondary market. Investors wishing to buy or sell shares need to place orders through an intermediary or broker and additional charges or commissions will apply. The share price of a closed-end fund is based on the market’s value.
Distributions may be paid from sources of income other than ordinary income, such as net realized short-term capital gains, net realized long-term capital gains and return of capital. Based on current estimates, distributions have been paid in the current fiscal year from net investment income and return of capital. The actual amounts and sources of the amounts for tax purposes will depend upon a Fund’s investment experience during the remainder of its fiscal year and may be subject to changes based on tax regulations. If a distribution includes anything other than net investment income, the Fund provides a Section 19(a) notice of the best estimate of its distribution sources at that time. These estimates may not match the final tax characterization (for the full year’s distributions) contained in shareholders’ 1099-DIV forms after the end of the year.
Indices are unmanaged; their returns do not reflect any fees, expenses, or sales charges.
An investor cannot invest directly in an index.
ALPS Advisors, Inc. is the investment adviser to the Fund. ALPS Portfolio Solutions Distributor, Inc. is a FINRA member.
Principal Real Estate Investors, LLC is the investment sub-adviser to the Fund. Principal Real Estate Investors, LLC is not affiliated with ALPS Advisors, Inc. or any of its affiliates.
Secondary market support provided to the Fund by ALPS Advisors, Inc.’s affiliate, ALPS Portfolio Solutions Distributor, Inc., FINRA Member
| Principal Real Estate Income Fund | Performance Overview |
| | April 30, 2021 (Unaudited) |
GROWTH OF A HYPOTHETICAL $10,000 INVESTMENT
The graph below illustrates the growth of a hypothetical $10,000 investment assuming the purchase of common shares of beneficial interest at the closing market price (NYSE: PGZ) of $20.00 on June 25, 2013 (the date of commencement of operations), and tracking its progress through April 30, 2021.
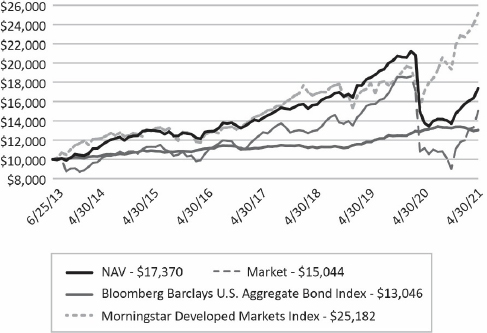
Past performance does not guarantee future results. Performance will fluctuate with changes in market conditions. Current performance may be lower or higher than the performance data shown. Performance information does not reflect the deduction of taxes that shareholders would pay on Fund distributions or the sale of Fund shares. An investment in the Fund involves risk, including loss of principal.
SECTOR ALLOCATION^
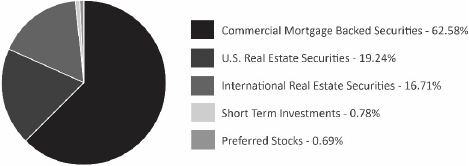
^ Holdings are subject to change.
Percentages are based on total investments of the Fund.
| | |
| Semi-Annual Report | April 30, 2021 | 7 |
| Principal Real Estate Income Fund | Performance Overview |
| | April 30, 2021 (Unaudited) |
GEOGRAPHIC BREAKDOWN as of April 30, 2021
| | % of Total Investments |
| United States | 83.29% |
| Canada | 2.81% |
| Japan | 2.69% |
| Australia | 2.58% |
| Great Britain | 1.81% |
| Hong Kong | 1.71% |
| Singapore | 1.21% |
| Germany | 0.97% |
| China | 0.86% |
| Spain | 0.62% |
| Netherlands | 0.49% |
| France | 0.48% |
| Poland | 0.22% |
| South Korea | 0.15% |
| Ireland | 0.11% |
| | 100.00% |
Holdings are subject to change.
| Principal Real Estate Income Fund | Statement of Investments |
| | April 30, 2021 (Unaudited) |
| | | | | | Value | |
| Description | | Shares | | | (Note 2) | |
| COMMON STOCKS (49.97%) | | | | | | |
| Hotels & Motels (0.21%) | | | | | | |
| Travel + Leisure Co. | | | 3,733 | | | $ | 240,891 | |
| | | | | | | | | |
| Investment Management/Advisory Services (0.64%) | | | | | | | | |
| Centuria Capital Group | | | 357,111 | | | | 734,519 | |
| | | | | | | | | |
| Real Estate Management/Services (0.89%) | | | | | | | | |
| ESR Kendall Square REIT Co., Ltd.(a) | | | 40,621 | | | | 235,907 | |
| Mitsubishi Estate Co., Ltd. | | | 47,400 | | | | 778,724 | |
| | | | | | | | 1,014,631 | |
| Real Estate Operation/Development (4.53%) | | | | | | | | |
| Echo Investment SA(a) | | | 318,924 | | | | 355,743 | |
| LEG Immobilien SE | | | 5,730 | | | | 797,048 | |
| Midea Real Estate Holding, Ltd.(b)(c) | | | 279,400 | | | | 637,375 | |
| New World Development Co., Ltd. | | | 218,500 | | | | 1,156,107 | |
| Sun Hung Kai Properties, Ltd. | | | 50,500 | | | | 762,595 | |
| TAG Immobilien AG | | | 23,766 | | | | 734,607 | |
| Zhongliang Holdings Group Co., Ltd.(c) | | | 1,077,000 | | | | 720,981 | |
| | | | | | | | 5,164,456 | |
| REITS-Apartments (7.11%) | | | | | | | | |
| American Campus Communities, Inc. | | | 7,617 | | | | 344,364 | |
| Apartment Income REIT Corp. | | | 17,961 | | | | 810,939 | |
| AvalonBay Communities, Inc. | | | 5,800 | | | | 1,113,600 | |
| Essex Property Trust, Inc. | | | 2,738 | | | | 795,444 | |
| Independence Realty Trust, Inc. | | | 137,650 | | | | 2,318,026 | |
| Invitation Homes, Inc. | | | 61,328 | | | | 2,150,160 | |
| Irish Residential Properties REIT PLC | | | 90,761 | | | | 177,426 | |
| UNITE Group PLC | | | 24,949 | | | | 401,408 | |
| | | | | | | | 8,111,367 | |
| REITS-Diversified (10.24%) | | | | | | | | |
| Arena REIT | | | 387,503 | | | | 967,183 | |
| Broadstone Net Lease, Inc. | | | 33,012 | | | | 666,182 | |
| Charter Hall Group | | | 24,767 | | | | 267,110 | |
| CoreSite Realty Corp. | | | 5,927 | | | | 720,071 | |
| Covivio | | | 4,195 | | | | 374,225 | |
| Cromwell European Real Estate Investment Trust(c) | | | 1,149,300 | | | | 656,332 | |
| Crown Castle International Corp. | | | 2,393 | | | | 452,421 | |
| Dexus | | | 63,000 | | | | 493,571 | |
| Equinix, Inc. | | | 270 | | | | 194,605 | |
| Ingenia Communities Group | | | 39,723 | | | | 161,571 | |
| Irongate Group | | | 273,891 | | | | 294,334 | |
| Klepierre SA | | | 14,638 | | | | 388,226 | |
| LondonMetric Property PLC | | | 85,649 | | | | 266,615 | |
| Mapletree Logistics Trust | | | 214,505 | | | | 320,770 | |
| Merlin Properties Socimi SA | | | 53,963 | | | | 596,482 | |
| | |
| Semi-Annual Report | April 30, 2021 | 9 |
| Principal Real Estate Income Fund | Statement of Investments |
| | April 30, 2021 (Unaudited) |
| | | | | | Value | |
| Description | | Shares | | | (Note 2) | |
| REITS-Diversified (continued) | | | | | | |
| Nomura Real Estate Master Fund | | | 655 | | | $ | 1,035,630 | |
| NSI NV | | | 19,058 | | | | 774,445 | |
| Sekisui House Reit, Inc. | | | 416 | | | | 346,381 | |
| United Urban Investment Corp. | | | 604 | | | | 903,043 | |
| VICI Properties, Inc. | | | 49,328 | | | | 1,563,698 | |
| Weyerhaeuser Co. | | | 6,180 | | | | 239,599 | |
| | | | | | | | 11,682,494 | |
| REITS-Health Care (3.70%) | | | | | | | | |
| Healthcare Trust of America, Inc. | | | 28,732 | | | | 843,859 | |
| Healthpeak Properties, Inc. | | | 22,625 | | | | 776,943 | |
| Physicians Realty Trust | | | 18,696 | | | | 350,176 | |
| Sabra Health Care REIT, Inc. | | | 40,535 | | | | 736,521 | |
| Welltower, Inc. | | | 20,107 | | | | 1,508,628 | |
| | | | | | | | 4,216,127 | |
| REITS-Hotels (2.63%) | | | | | | | | |
| Far East Hospitality Trust | | | 371,000 | | | | 175,638 | |
| Japan Hotel REIT Investment Corp. | | | 360 | | | | 206,204 | |
| MGM Growth Properties LLC | | | 45,395 | | | | 1,635,128 | |
| Park Hotels & Resorts, Inc.(a) | | | 31,865 | | | | 710,908 | |
| Sunstone Hotel Investors, Inc.(a) | | | 20,289 | | | | 267,003 | |
| | | | | | | | 2,994,881 | |
| REITS-Manufactured Homes (1.47%) | | | | | | | | |
| Sun Communities, Inc. | | | 10,087 | | | | 1,682,814 | |
| | | | | | | | | |
| REITS-Office Property (3.14%) | | | | | | | | |
| Alexandria Real Estate Equities, Inc. | | | 5,046 | | | | 913,831 | |
| Allied Properties Real Estate Investment Trust | | | 12,500 | | | | 433,735 | |
| American Assets Trust, Inc. | | | 9,876 | | | | 346,154 | |
| Brandywine Realty Trust | | | 24,401 | | | | 330,145 | |
| Centuria Office REIT | | | 71,050 | | | | 120,413 | |
| City Office REIT, Inc. | | | 39,821 | | | | 435,244 | |
| Cousins Properties, Inc. | | | 6,578 | | | | 241,215 | |
| Daiwa Office Investment Corp. | | | 50 | | | | 361,881 | |
| Inmobiliaria Colonial SA | | | 38,880 | | | | 394,283 | |
| | | | | | | | 3,576,901 | |
| REITS-Shopping Centers (2.11%) | | | | | | | | |
| Lendlease Global Commercial REIT | | | 174,900 | | | | 107,115 | |
| Link REIT | | | 84,000 | | | | 794,284 | |
| NewRiver REIT PLC(a) | | | 161,874 | | | | 227,132 | |
| Saul Centers, Inc. | | | 29,700 | | | | 1,282,446 | |
| | | | | | | | 2,410,977 | |
| REITS-Single Tenant (0.83%) | | | | | | | | |
| Agree Realty Corp. | | | 3,924 | | | | 276,092 | |
| Principal Real Estate Income Fund | Statement of Investments |
| | April 30, 2021 (Unaudited) |
| | | | | | Value | |
| Description | | Shares | | | (Note 2) | |
| REITS-Single Tenant (continued) | | | | | | |
| STORE Capital Corp. | | | 18,801 | | | $ | 672,888 | |
| | | | | | | | 948,980 | |
| REITS-Storage (1.28%) | | | | | | | | |
| Big Yellow Group PLC | | | 28,571 | | | | 471,916 | |
| CubeSmart | | | 23,327 | | | | 987,665 | |
| | | | | | | | 1,459,581 | |
| REITS-Warehouse/Industrials (10.88%) | | | | | | | | |
| AIMS AMP Capital Industrial REIT | | | 535,900 | | | | 563,787 | |
| ARA LOGOS Logistics Trust | | | 150,672 | | | | 87,748 | |
| Centuria Industrial REIT | | | 303,369 | | | | 813,278 | |
| CRE Logistics REIT, Inc. | | | 45 | | | | 74,526 | |
| CyrusOne, Inc. | | | 3,454 | | | | 251,555 | |
| Dream Industrial Real Estate Investment Trust | | | 96,600 | | | | 1,071,194 | |
| Goodman Group | | | 16,400 | | | | 238,904 | |
| Industrial & Infrastructure Fund Investment Corp. | | | 306 | | | | 554,658 | |
| Industrial Logistics Properties Trust | | | 76,280 | | | | 1,891,744 | |
| Plymouth Industrial REIT, Inc. | | | 38,783 | | | | 722,915 | |
| Prologis, Inc. | | | 21,205 | | | | 2,471,019 | |
| Segro PLC | | | 59,728 | | | | 829,407 | |
| Summit Industrial Income REIT | | | 40,373 | | | | 512,730 | |
| Tritax Big Box REIT PLC | | | 123,766 | | | | 325,273 | |
| WPT Industrial Real Estate Investment Trust | | | 119,884 | | | | 2,009,256 | |
| | | | | | | | 12,417,994 | |
| Storage/Warehousing (0.31%) | | | | | | | | |
| Safestore Holdings PLC | | | 29,692 | | | | 349,166 | |
| | | | | | | | | |
| TOTAL COMMON STOCKS | | | | | | | | |
| (Cost $45,855,662) | | | | | | | 57,005,779 | |
| | | | | | | | | |
| PREFERRED STOCKS (0.94%) | | | | | | | | |
| REITS-Shopping Centers (0.94%) | | | | | | | | |
| RPT Realty, 7.25%(d) | | | 19,000 | | | | 1,087,750 | |
| | | | | | | | | |
| TOTAL PREFERRED STOCKS | | | | | | | | |
| (Cost $738,700) | | | | | | | 1,087,750 | |
| | | | | Maturity | | | Principal | | | Value | |
| Description | | Rate | | Date | | | Amount | | | (Note 2) | |
| COMMERCIAL MORTGAGE BACKED SECURITIES (86.97%) |
| Commercial Mortgage Backed Securities-Other (10.21%) | | | | | | | | | | | | | | |
| BANK 2020-BNK29 2020-BN29(b)(e)(f) | | 0.803% | | | 12/15/30 | | | $ | 11,896,750 | | | $ | 697,288 | |
| Bank of America Commercial Mortgage Trust 2008-1(e) | | 6.786% | | | 02/10/51 | | | | 81,510 | | | | 80,760 | |
| Benchmark 2020-B20 Mortgage Trust 2020-B20(b)(e)(f) | | 1.665% | | | 10/15/30 | | | | 7,126,000 | | | | 869,613 | |
| | |
| Semi-Annual Report | April 30, 2021 | 11 |
| Principal Real Estate Income Fund | Statement of Investments |
| | April 30, 2021 (Unaudited) |
| | | | | Maturity | | | Principal | | | Value | |
| Description | | Rate | | Date | | | Amount | | | (Note 2) | |
| Commercial Mortgage Backed Securities-Other (continued) | | | | | | | | | | | |
| Benchmark 2020-B22 Mortgage Trust 2020-B22(b)(e)(f) | | 1.536% | | | 10/15/30 | | | $ | 7,717,000 | | | $ | 896,624 | |
| Citigroup Commercial Mortgage Trust:2019-GC43(b)(e)(f) | | 0.742% | | | 11/10/29 | | | | 2,500,000 | | | | 108,440 | |
| FHLMC Multifamily Structured Pass Through Certificates: | | | | | | | | | | | | | | |
| 2012-K052(e)(f) | | 1.668% | | | 01/25/26 | | | | 9,690,000 | | | | 653,796 | |
| 2011-KAIV(e)(f) | | 3.591% | | | 06/25/21 | | | | 9,000,000 | | | | 844 | |
| Freddie Mac Multifamily Structured Pass Through Certificates: | | | | | | | | | | | | | | |
| 2020-K740(e)(f) | | 2.567% | | | 10/25/27 | | | | 13,500,000 | | | | 1,898,911 | |
| 2020-K739(e)(f) | | 2.947% | | | 10/25/27 | | | | 12,207,500 | | | | 1,915,317 | |
| GS Mortgage Securities Trust 2020-GSA2 | | | | | | | | | | | | | | |
| 2020-GSA2(b)(e)(f) | | 1.479% | | | 01/10/31 | | | | 7,000,000 | | | | 785,585 | |
| JPMBB Commercial Mortgage Securities Trust 2015-C28 2015-C28(e)(f) | | 1.107% | | | 03/15/25 | | | | 28,850,866 | | | | 854,208 | |
| JPMorgan Chase Commercial Mortgage Securities Trust: | | | | | | | | | | | | | | |
| 2013-C15(b)(e)(f) | | 1.809% | | | 10/15/23 | | | | 11,499,973 | | | | 398,221 | |
| 2006-CB17(e) | | 5.489% | | | 12/12/43 | | | | 514,860 | | | | 383,571 | |
| Morgan Stanley Bank of America Merrill Lynch Trust 2015-C20(b)(e)(f) | | 1.756% | | | 02/15/25 | | | | 23,967,000 | | | | 1,202,460 | |
| Morgan Stanley Capital I Trust 2016-UB11(b)(e)(f) | | 1.500% | | | 08/15/26 | | | | 13,495,500 | | | | 898,003 | |
| | | | | | | | | | | | | | 11,643,641 | |
| | | | | | | | | | | | | | | |
| Commercial Mortgage Backed Securities-Subordinated (76.76%) | | | | | | | | | | | | | | |
| | | | | | | | | | | | | | | |
| BANK: | | | | | | | | | | | | | | |
| 2018-BN12(b)(e) | | 3.049% | | | 05/15/28 | | | | 2,500,000 | | | | 1,690,478 | |
| 2017-BNK5(b)(e) | | 3.078% | | | 06/15/27 | | | | 2,450,000 | | | | 2,215,765 | |
| 2017-BNK5(b)(e) | | 4.396% | | | 07/15/27 | | | | 7,500,000 | | | | 5,942,764 | |
| BANK 2020-BNK29 2020-BN29(b) | | 2.500% | | | 12/15/30 | | | | 3,300,000 | | | | 2,799,203 | |
| Benchmark 2020-B20 Mortgage Trust 2020-B20(b) | | 2.000% | | | 10/15/30 | | | | 1,800,000 | | | | 1,416,730 | |
| Benchmark 2020-B22 Mortgage Trust 2020-B22(b) | | 2.000% | | | 01/15/31 | | | | 1,900,000 | | | | 1,460,166 | |
| BENCHMARK Mortgage Trust 2018-B1(b)(e) | | 3.000% | | | 01/15/28 | | | | 11,500,000 | | | | 7,488,710 | |
| CFCRE Commercial Mortgage Trust 2016-C3(b)(e) | | 3.052% | | | 01/10/26 | | | | 6,484,000 | | | | 4,946,422 | |
| Citigroup Commercial Mortgage Trust: | | | | | | | | | | | | | | |
| 2019-GC41(b) | | 3.000% | | | 08/10/29 | | | | 2,800,000 | | | | 1,854,111 | |
| 2019-GC43(b) | | 3.000% | | | 11/10/29 | | | | 2,500,000 | | | | 1,682,550 | |
| Citigroup Commercial Mortgage Trust 2013-GC15 2013-GC15(b)(e) | | 5.353% | | | 09/10/46 | | | | 1,000,000 | | | | 1,012,295 | |
| Principal Real Estate Income Fund | Statement of Investments |
| | April 30, 2021 (Unaudited) |
| | | | | Maturity | | | Principal | | | Value | |
| Description | | Rate | | Date | | | Amount | | | (Note 2) | |
| Commercial Mortgage Backed Securities-Subordinated (continued) | | | | | | |
| COMM 2012-CCRE1 Mortgage Trust 2012-CR1(b)(e) | | 5.533% | | | 05/15/22 | | | $ | 4,774,000 | | | $ | 3,869,299 | |
| COMM 2012-CCRE5 Mortgage Trust 2012-CR5(b)(e) | | 4.464% | | | 12/10/22 | | | | 4,500,000 | | | | 4,172,443 | |
| COMM 2013-CCRE6 Mortgage Trust:2013-CR6(b)(e) | | 4.225% | | | 02/10/23 | | | | 8,568,000 | | | | 7,653,224 | |
| Commercial Mortgage Trust: | | | | | | | | | | | | | | |
| 2014-UBS5(b) | | 3.495% | | | 09/10/24 | | | | 2,715,000 | | | | 2,264,221 | |
| 2013-LC6(b) | | 3.500% | | | 01/10/23 | | | | 1,350,000 | | | | 920,885 | |
| 2012-CR2(b) | | 4.250% | | | 08/15/22 | | | | 1,900,000 | | | | 1,210,131 | |
| 2012-CR5(b)(e) | | 4.464% | | | 12/10/22 | | | | 5,492,405 | | | | 3,834,404 | |
| 2014-CR17(b)(e) | | 4.508% | | | 05/10/24 | | | | 2,600,000 | | | | 1,381,004 | |
| 2014-UBS2(b)(e) | | 5.162% | | | 02/10/24 | | | | 2,932,500 | | | | 2,936,207 | |
| Goldman Sachs Mortgage Securities Trust: | | | | | | | | | | | | | | |
| 2013-GC14(b)(e) | | 4.900% | | | 08/10/23 | | | | 2,000,000 | | | | 1,312,218 | |
| 2014-GC20(b)(e) | | 5.123% | | | 04/10/47 | | | | 8,505,000 | | | | 4,981,955 | |
| 2013-GC16(b)(e) | | 5.488% | | | 11/10/46 | | | | 2,342,405 | | | | 2,347,778 | |
| | | | | | | | | | | | | | | |
| GS Mortgage Securities Trust 2010-C1 2010-C1(b)(e) | | 5.635% | | | 07/10/21 | | | | 2,750,000 | | | | 2,588,657 | |
| | | | | | | | | | | | | | | |
| GS Mortgage Securities Trust 2012-GCJ7 2012-GCJ7(b)(e) | | 5.806% | | | 05/10/22 | | | | 1,500,000 | | | | 1,393,994 | |
| | | | | | | | | | | | | | | |
| GS Mortgage Securities Trust 2013-GCJ14 2013-GC14(b)(e) | | 4.900% | | | 08/10/23 | | | | 1,250,000 | | | | 1,232,192 | |
| | | | | | | | | | | | | | | |
| GS Mortgage Securities Trust 2020-GSA2 2020-GSA2(b) | | 2.250% | | | 01/10/31 | | | | 2,000,000 | | | | 1,595,780 | |
| | | | | | | | | | | | | | | |
| JPMBB Commercial Mortgage Securities Trust 2015-C32 2015-C32(e) | | 4.389% | | | 10/15/25 | | | | 2,000,000 | | | | 2,039,496 | |
| | | | | | | | | | | | | | | |
| JPMorgan Chase Commercial Mortgage Securities Trust 2013-C15(b) | | 3.500% | | | 10/15/23 | | | | 2,500,000 | | | | 2,370,691 | |
| | | | | | | | | | | | | | | |
| Morgan Stanley Bank of America Merrill Lynch Trust 2013-C11 2013-C11(e) | | 4.497% | | | 07/15/23 | | | | 3,000,000 | | | | 2,955,716 | |
| | | | | | | | | | | | | | | |
| Wells Fargo Commercial Mortgage Trust 2015-NXS3(b) | | 3.153% | | | 09/15/57 | | | | 1,500,000 | | | | 1,455,494 | |
| | | | | | | | | | | | | | | |
| Wells Fargo Commercial Mortgage Trust 2017-C40 2017-C40(e) | | 4.470% | | | 09/15/27 | | | | 2,500,000 | | | | 2,551,984 | |
| | | | | | | | | | | | | | 87,576,967 | |
| | | | | | | | | | | | | | | |
| TOTAL COMMERCIAL MORTGAGE BACKED SECURITIES | | | | | | | | | | | | | | |
| (Cost $98,812,118) | | | | | | | | | | | | | 99,220,608 | |
| | |
| Semi-Annual Report | April 30, 2021 | 13 |
| Principal Real Estate Income Fund | Statement of Investments |
| | April 30, 2021 (Unaudited) |
| | | 7-Day | | | | | | Value | |
| Description | | Yield | | | Shares | | | (Note 2) | |
| SHORT TERM INVESTMENTS (1.09%) | | | | | | | | | |
| State Street Institutional Treasury Plus Money Market Fund | | | 0.020% | | | | 1,232,156 | | | $ | 1,232,156 | |
| | | | | | | | | | | | | |
| TOTAL SHORT TERM INVESTMENTS | | | | | | | | | | | | |
| (Cost $1,232,156) | | | | | | | | | | | 1,232,156 | |
| | | | | | | | | | | | | |
| TOTAL INVESTMENTS (138.97%) | | | | | | | | | | | | |
| (Cost $146,638,636) | | | | | | | | | | $ | 158,546,293 | |
| | | | | | | | | | | | | |
| Liabilities in Excess of Other Assets (-38.97%) | | | | | | | | | | | (44,462,934 | ) |
| NET ASSETS (100.00%) | | | | | | | | | | $ | 114,083,359 | |
| (a) | Non-income producing security. |
| (b) | Security exempt from registration under Rule 144A of the Securities Act of 1933. Such securities may normally be sold to qualified institutional buyers in transactions exempt from registration. The total value of Rule 144A securities amounts to $86,523,380, which represents approximately 75.84% of net assets as of April 30, 2021. |
| (c) | Securities were purchased pursuant to Regulation S under the Securities Act of 1933, which exempts securities offered and sold outside of the United States from registration. Such securities cannot be sold in the United States without either an effective registration statement filed pursuant to the Securities Act of 1933, or pursuant to an exemption from registration. As of April 30, 2021, the aggregate value of those securities was $2,014,688 representing 1.77% of net assets. |
| (d) | Security has no contractual maturity date, is not redeemable and contractually pays an indefinite stream of interest. |
| (e) | Variable rate investment. Interest rates reset periodically. Interest rate shown reflects the rate in effect at April 30, 2021. Certain variable rate securities are not based on a published reference rate and spread but are determined by the issuer or agent and are based on current market conditions. These securities do not indicate a reference rate and spread in their description above. |
| (f) | Interest only security. |
See Notes to Financial Statements.
| Principal Real Estate Income Fund | |
| Statement of Assets and Liabilities | April 30, 2021 (Unaudited) |
| ASSETS: | | | |
| Investments, at value | | $ | 158,546,293 | |
| Cash denominated in foreign currency, at value (Cost $15,147) | | | 15,011 | |
| Receivable for investments sold | | | 347,514 | |
| Interest receivable | | | 584,310 | |
| Dividends receivable | | | 120,130 | |
| Prepaid and other assets | | | 30,040 | |
| Total Assets | | | 159,643,298 | |
| | | | | |
| LIABILITIES: | | | | |
| Loan payable (Note 3) | | | 45,000,000 | |
| Interest and commitment fee due on loan payable | | | 35,041 | |
| Payable for investments purchased | | | 247,480 | |
| Payable to adviser | | | 134,969 | |
| Payable to administrator | | | 31,229 | |
| Payable to transfer agent | | | 4,633 | |
| Payable for trustee fees | | | 39,756 | |
| Other payables | | | 66,831 | |
| Total Liabilities | | | 45,559,939 | |
| Net Assets | | $ | 114,083,359 | |
| | | | | |
| NET ASSETS CONSIST OF: | | | | |
| Paid-in capital | | $ | 125,978,790 | |
| Total distributable earnings/(accumulated deficit) | | | (11,895,431 | ) |
| Net Assets | | $ | 114,083,359 | |
| | | | | |
| PRICING OF SHARES: | | | | |
| Net Assets | | $ | 114,083,359 | |
| Common Shares of beneficial interest outstanding (unlimited number of shares authorized, no par value per share) | | | 6,812,922 | |
| Net asset value per share | | $ | 16.75 | |
| | | | | |
| Cost of Investments | | $ | 146,638,636 | |
See Notes to Financial Statements.
| | |
| Semi-Annual Report | April 30, 2021 | 15 |
| Principal Real Estate Income Fund | Statement of Operations |
| | For the Six Months Ended April 30, 2021 (Unaudited) |
| INVESTMENT INCOME: | | | |
| Interest | | $ | 2,662,606 | |
| Dividends (net of foreign withholding tax of $42,991) | | | 1,716,092 | |
| Total Investment Income | | | 4,378,698 | |
| | | | | |
| EXPENSES: | | | | |
| Investment advisory fees | | | 769,455 | |
| Interest on loan | | | 239,835 | |
| Commitment fee on loan | | | 22,094 | |
| Administration fees | | | 127,758 | |
| Transfer agent fees | | | 12,734 | |
| Audit fees | | | 17,477 | |
| Legal fees | | | 41,309 | |
| Custodian fees | | | 13,585 | |
| Trustee fees | | | 77,801 | |
| Printing fees | | | 25,203 | |
| Insurance fees | | | 16,428 | |
| Other | | | 15,741 | |
| Total Expenses | | | 1,379,420 | |
| Net Investment Income | | | 2,999,278 | |
|
| |
| REALIZED AND UNREALIZED GAIN/(LOSS) ON INVESTMENTS AND FOREIGN CURRENCY: |
| Net realized gain/(loss) on: | | | | |
| Investments | | | (6,116,747 | ) |
| Foreign currency transactions | | | (2,714 | ) |
| Net realized loss | | | (6,119,461 | ) |
| Net change in unrealized appreciation/depreciation on: | | | | |
| Investments | | | 26,106,419 | |
| Translation of assets and liabilities denominated in foreign currencies | | | (2,357 | ) |
| Net change in unrealized appreciation/depreciation | | | 26,104,062 | |
| Net Realized and Unrealized Gain on Investments and Foreign Currency | | | 19,984,601 | |
| Net Increase in Net Assets Resulting from Operations | | $ | 22,983,879 | |
See Notes to Financial Statements.
| Principal Real Estate Income Fund |
| Statements of Changes in Net Assets |
| | | For the Six Months Ended April 30, 2021
(Unaudited) | | | For the Year Ended October 31, 2020 | |
| OPERATIONS: | | | | | | |
| Net investment income | | $ | 2,999,278 | | | $ | 6,750,283 | |
| Net realized loss on investments and foreign currency transactions | | | (6,119,461 | ) | | | (16,078,718 | ) |
| Net change in unrealized appreciation/depreciation on investments and translation of assets and liabilities denominated in foreign currencies | | | 26,104,062 | | | | (43,767,887 | ) |
| Net increase/(decrease) in net assets resulting from operations | | | 22,983,879 | | | | (53,096,322 | ) |
| | | | | | | | | |
| DISTRIBUTIONS TO SHAREHOLDERS: | | | | | | | | |
| Distributions to shareholders | | | (3,296,224 | ) | | | (7,219,577 | ) |
| From tax return of capital | | | – | | | | (1,888,159 | ) |
| Decrease in net assets from distributions to shareholders | | | (3,296,224 | ) | | | (9,107,736 | ) |
| | | | | | | | | |
| CAPITAL SHARE TRANSACTIONS (NOTE 8): | | | | | | | | |
| Cost of shares repurchased | | | (1,117,244 | ) | | | – | |
| Net decrease in net assets from capital share transactions | | | (1,117,244 | ) | | | – | |
| | | | | | | | | |
| Net Increase/(Decrease) in Net Assets | | | 18,570,411 | | | | (62,204,058 | ) |
| | | | | | | | | |
| NET ASSETS: | | | | | | | | |
| Beginning of period | | | 95,512,948 | | | | 157,717,006 | |
| End of period | | $ | 114,083,359 | | | $ | 95,512,948 | |
| | | | | | | | | |
| OTHER INFORMATION: | | | | | | | | |
| Share Transactions: | | | | | | | | |
| Shares outstanding - beginning of period | | | 6,899,800 | | | | 6,899,800 | |
| Shares repurchased | | | (86,878 | ) | | | – | |
| Net decrease in shares outstanding | | | (86,878 | ) | | | – | |
| Shares outstanding - end of period | | | 6,812,922 | | | | 6,899,800 | |
See Notes to Financial Statements.
| | |
| Semi-Annual Report | April 30, 2021 | 17 |
| Principal Real Estate Income Fund | Statement of Cash Flows |
| | For the Six Months Ended April 30, 2021 (Unaudited) |
| CASH FLOWS FROM OPERATING ACTIVITIES: | | | |
| Net increase in net assets resulting from operations | | $ | 22,983,879 | |
| Adjustments to reconcile net increase in net assets from operations to net cash used in operating activities: | | | | |
| Purchases of investment securities | | | (38,310,747 | ) |
| Proceeds from disposition of investment securities | | | 33,615,510 | |
| Net proceeds from short-term investment securities | | | 1,170,765 | |
| Net realized loss on: | | | | |
| Investments | | | 6,116,747 | |
| Net change in unrealized appreciation/depreciation on: | | | | |
| Investments | | | (26,106,419 | ) |
| Amortization of premiums and accretion of discounts on investments | | | 460,191 | |
| (Increase)/Decrease in assets: | | | | |
| Interest receivable | | | (27,055 | ) |
| Dividends receivable | | | 2,233 | |
| Prepaid and other assets | | | 7,918 | |
| Increase/(Decrease) in liabilities: | | | | |
| Interest and commitment fee due on loan payable | | | (2,637 | ) |
| Payable to transfer agent | | | 193 | |
| Payable to adviser | | | 11,801 | |
| Payable to administrator | | | (528 | ) |
| Payable for trustee fees | | | 426 | |
| Other payables | | | (496 | ) |
| Net cash used in operating activities | | $ | (78,219 | ) |
| | | | | |
| CASH FLOWS PROVIDED BY FINANCING ACTIVITIES: | | | | |
| Proceeds from bank borrowing | | $ | 4,500,000 | |
| Cost of shares repurchased | | | (1,117,244 | ) |
| Cash distributions paid | | | (3,296,224 | ) |
| Net cash provided by financing activities | | $ | 86,532 | |
| | | | | |
| Effect of exchange rates on cash | | $ | (136 | ) |
| | | | | |
| Net increase in cash | | $ | 8,177 | |
| Cash and Foreign Currency, beginning balance | | $ | 6,834 | |
| Cash and Foreign Currency, ending balance | | $ | 15,011 | |
| | | | | |
| SUPPLEMENTAL DISCLOSURE OF CASH FLOW INFORMATION: | | | | |
| Cash paid during the period for interest from bank borrowing | | $ | 242,472 | |
See Notes to Financial Statements.
Intentionally Left Blank
Principal Real Estate Income Fund
| Net asset value - beginning of period |
| Income/(loss) from investment operations: |
| Net investment income(a) |
| Net realized and unrealized gain/(loss) on investments |
| Total income/(loss) from investment operations |
| |
| Less distributions to shareholders: |
| From net investment income |
| From net realized gains |
| From tax return of capital |
| Total distributions |
| Net increase/(decrease) in net asset value |
| Net asset value - end of period |
| Market price -end of period |
| |
| Total Return(b) |
| Total Return -Market Price(b) |
| |
| Supplemental Data: |
| Net assets, end of period (in thousands) |
| Ratios to Average Net Assets: |
| Total expenses |
| Total expenses excluding interest expense |
| Net investment income |
| Total expenses to average managed assets(d) |
| Portfolio turnover rate Borrowings at End of Period |
| Aggregate Amount Outstanding (in thousands) |
| Asset Coverage Per $1,000 (in thousands) |
| (a) | Calculated using average shares throughout the period. |
| (b) | Total investment return is calculated assuming a purchase of common share at the opening on the first day and a sale at closing on the last day of each period reported. For purposes of this calculation, dividends and distributions, if any, are assumed to be reinvested at prices obtained under the Fund’s dividend reinvestment plan. Total investment returns do not reflect brokerage commissions, if any. |
| (d) | Average managed assets represent net assets applicable to common shares plus average amount of borrowings during the period |
See Notes to Financial Statements.
| Financial Highlights |
| For a share outstanding throughout the periods presented. |
For the
Six Months
Ended April 30, 2021
(Unaudited) | | | For the
Year Ended
October 31,
2020 | | | For the
Year Ended
��October 31,
2019 | | | For the
Year Ended
October 31,
2018 | | | For the
Year Ended
October 31,
2017 | | | For the
Year Ended
October 31,
2016 | |
| | | | | | | | | | | | | | | | | |
| $ | 13.84 | | | $ | 22.86 | | | $ | 19.54 | | | $ | 19.40 | | | $ | 19.02 | | | $ | 19.88 | |
| | | | | | | | | | | | | | | | | | | | | | | |
| | 0.44 | | | | 0.98 | | | | 1.12 | | | | 1.08 | | | | 0.99 | | | | 1.35 | |
| | 2.95 | | | | (8.68 | ) | | | 3.52 | | | | 0.38 | | | | 1.10 | | | | (0.47 | ) |
| | 3.39 | | | | (7.70 | ) | | | 4.64 | | | | 1.46 | | | | 2.09 | | | | 0.88 | |
| | | | | | | | | | | | | | | | | | | | | | | |
| | | | | | | | | | | | | | | | | | | | | | | |
| | (0.48 | ) | | | (0.95 | ) | | | (1.32 | ) | | | (1.18 | ) | | | (1.51 | ) | | | (1.74 | ) |
| | — | | | | (0.10 | ) | | | — | | | | — | | | | (0.03 | ) | | | — | |
| | — | | | | (0.27 | ) | | | — | | | | (0.14 | ) | | | (0.17 | ) | | | — | |
| | (0.48 | ) | | | (1.32 | ) | | | (1.32 | ) | | | (1.32 | ) | | | (1.71 | ) | | | (1.74 | ) |
| | 2.91 | | | | (9.02 | ) | | | 3.32 | | | | 0.14 | | | | 0.38 | | | | (0.86 | ) |
| $ | 16.75 | | | $ | 13.84 | | | $ | 22.86 | | | $ | 19.54 | | | $ | 19.40 | | | $ | 19.02 | |
| $ | 15.19 | | | $ | 9.46 | | | $ | 21.40 | | | $ | 16.97 | | | $ | 17.09 | | | $ | 16.62 | |
| | | | | | | | | | | | | | | | | | | | | | | |
| | 25.56 | % | | | (33.27 | %) | | | 25.53 | % | | | 8.67 | % | | | 12.46 | % | | | 5.94 | % |
| | 66.59 | % | | | (51.28 | %) | | | 35.31 | % | | | 7.13 | % | | | 13.37 | % | | | 4.80 | % |
| | | | | | | | | | | | | | | | | | | | | | | |
| | | | | | | | | | | | | | | | | | | | | | | |
| $ | 114,083 | | | $ | 95,513 | | | $ | 157,717 | | | $ | 134,820 | | | $ | 133,886 | | | $ | 131,260 | |
| | | | | | | | | | | | | | | | | | | | | | | |
| | 2.64 | %(c) | | | 2.92 | % | | | 3.45 | % | | | 3.41 | % | | | 3.03 | % | | | 2.82 | % |
| | 2.18 | %(c) | | | 2.13 | % | | | 2.02 | % | | | 2.09 | % | | | 2.06 | % | | | 2.07 | % |
| | 5.73 | %(c) | | | 5.59 | % | | | 5.31 | % | | | 5.49 | % | | | 5.18 | % | | | 7.04 | % |
| | 1.89 | %(c) | | | 2.08 | % | | | 2.44 | % | | | 2.36 | % | | | 2.09 | % | | | 1.94 | % |
| | 23 | %(e) | | | 38 | % | | | 17 | % | | | 37 | % | | | 45 | % | | | 41 | % |
| | | | | | | | | | | | | | | | | | | | | | | |
| $ | 45,000 | | | $ | 40,500 | | | $ | 60,000 | | | $ | 60,000 | | | $ | 60,000 | | | $ | 60,000 | |
| $ | 3,535 | | | $ | 3,358 | | | $ | 3,629 | | | $ | 3,247 | | | $ | 3,231 | | | $ | 3,188 | |
| | |
| Semi-Annual Report | April 30, 2021 | 21 |
| Principal Real Estate Income Fund | Notes to Financial Statements |
| | April 30, 2021 (Unaudited) |
1. ORGANIZATION
Principal Real Estate Income Fund (the ‘‘Fund’’) is a Delaware statutory trust registered as a non-diversified, closed-end management investment company under the Investment Company Act of 1940, as amended (the ‘‘1940 Act’’).
The Fund’s investment objective is to seek to provide high current income, with capital appreciation as a secondary investment objective, by investing in commercial real estate related securities.
Investing in the Fund involves risks, including exposure to below-investment grade investments. The Fund’s net asset value per share will vary and its distribution rate may vary and both may be affected by numerous factors, including changes in the market spread over a specified benchmark, market interest rates and performance of the broader equity markets. Fluctuations in net asset value may be magnified as a result of the Fund’s use of leverage.
2. SIGNIFICANT ACCOUNTING POLICIES
Use of Estimates: The financial statements are prepared in accordance with accounting principles generally accepted in the United States of America (“GAAP”), which requires management to make estimates and assumptions that affect the reported amounts of assets and liabilities and disclosures of contingent assets and liabilities at the date of the financial statements and reported amount of increase or decrease in net assets from operations during the period reported. Management believes the estimates and security valuations are appropriate; however, actual results may differ from those estimates, and the security valuations reflected in the financial statements may differ from the value the Fund ultimately realizes upon sale of the securities. The Fund is considered an investment company under GAAP and follows the accounting and reporting guidance applicable to investment companies in the Financial Accounting Standards Board Accounting Standards Codification Topic 946 Financial Services – Investment Companies. The financial statements have been prepared as of the close of the New York Stock Exchange (“NYSE”) on April 30, 2021.
Portfolio Valuation: The net asset value per common share of the Fund is determined no less frequently than daily, on each day that the NYSE is open for trading, as of the close of regular trading on the NYSE (normally 4:00 p.m. New York time). The Fund’s net asset value per common share is calculated in the manner authorized by the Fund’s Board of Trustees (the “Board”). Net asset value per share is computed by dividing the value of the Fund’s total assets, less its liabilities by the number of shares outstanding.
The Board has established the following procedures for valuation of the Fund’s assets under normal market conditions. Marketable securities listed on foreign or U.S. securities exchanges generally are valued at closing sale prices or, if there were no sales, at the mean between the closing bid and ask prices on the exchange where such securities are primarily traded.
The Fund values commercial mortgage-backed securities ("CMBS") and other debt securities not traded in an organized market on the basis of valuations provided by an independent pricing service, approved by the Board, which uses information with respect to transactions in such securities, interest rate movements, new issue information, cash flows, yields, spreads, credit quality, and other pertinent information as determined by the pricing service, in determining value. If the independent primary or secondary pricing service is unable to provide a price for a security, if the price provided by the independent primary or secondary pricing service is deemed unreliable, or if events occurring after the close of the market for a security but before the time as of which the Fund values its common shares would materially affect net asset value, such security will be valued at its fair value as determined in good faith under procedures approved by the Board.
| Principal Real Estate Income Fund | Notes to Financial Statements |
| | April 30, 2021 (Unaudited) |
When applicable, fair value of an investment is determined by the Fund’s Fair Valuation Committee as a designee of the Board. In fair valuing the Fund’s investments, consideration is given to several factors, which may include, among others, the following: the fundamental business data relating to the issuer, borrower, or counterparty; an evaluation of the forces which influence the market in which the investments are purchased and sold; the type, size and cost of the investment; the information as to any transactions in or offers for the investment; the price and extent of public trading in similar securities (or equity securities) of the issuer, or comparable companies; the coupon payments, yield data/cash flow data; the quality, value and salability of collateral, if any, securing the investment; the business prospects of the issuer, borrower, or counterparty, as applicable, including any ability to obtain money or resources from a parent or affiliate and an assessment of the issuer’s, borrower’s, or counterparty’s management; the prospects for the industry of the issuer, borrower, or counterparty, as applicable, and multiples (of earnings and/or cash flow) being paid for similar businesses in that industry; one or more independent broker quotes for the sale price of the portfolio security; and other relevant factors.
Securities Transactions and Investment Income: Investment security transactions are accounted for on a trade date basis. Dividend income is recorded on the ex-dividend date. Certain dividend income from foreign securities will be recorded, in the exercise of reasonable diligence, as soon as the Fund is informed of the dividend if such information is obtained subsequent to the ex-dividend date and may be subject to withholding taxes in these jurisdictions. Withholding taxes on foreign dividends have been provided for in accordance with the Fund's understanding of the applicable country's tax rules and rates. Interest income, which includes amortization of premium and accretion of discount, is recorded on the accrual basis. Discounts and premiums on commercial mortgage backed securities purchased are accreted or amortized using the effective interest method. Realized gains and losses from securities transactions and unrealized appreciation and depreciation of securities are determined using the specific identification method for both financial reporting and tax purposes.
Fair Value Measurements: Investments in the Fund are recorded at their estimated fair value. The Fund discloses the classification of its fair value measurements following a three-tier hierarchy based on the inputs used to measure fair value. Inputs refer broadly to the assumptions that market participants would use in pricing the asset or liability, including assumptions about risk. Inputs may be observable or unobservable. Observable inputs reflect the assumptions market participants would use in pricing the asset or liability that are developed based on market data obtained from sources independent of the reporting entity. Unobservable inputs reflect the reporting entity’s own assumptions about the assumptions market participants would use in pricing the asset or liability that are developed based on the best information available.
Various inputs are used in determining the value of the Fund’s investments as of the end of the reporting period. When inputs used fall into different levels of the fair value hierarchy, the level in the hierarchy within which the fair value measurement falls is determined based on the lowest level input that is significant to the fair value measurement in its entirety. The designated input levels are not necessarily an indication of the risk or liquidity associated with these investments. These inputs are categorized in the following hierarchy under applicable financial accounting standards:
| | |
| Semi-Annual Report | April 30, 2021 | 23 |
| Principal Real Estate Income Fund | Notes to Financial Statements |
| | April 30, 2021 (Unaudited) |
| Level 1 – | Unadjusted quoted prices in active markets for identical investments, unrestricted assets or liabilities that a Fund has the ability to access at the measurement date; |
| | |
| Level 2 – | Quoted prices which are not active, quoted prices for similar assets or liabilities in active markets or inputs other than quoted prices that are observable (either directly or indirectly) for substantially the full term of the asset or liability; and |
| | |
| Level 3 – | Significant unobservable prices or inputs (including the Fund’s own assumptions in determining the fair value of investments) where there is little or no market activity for the asset or liability at the measurement date. |
The following is a summary of the inputs used to value the Fund’s investments as of April 30, 2021.
| Investments in Securities at Value* | | Level 1 -
Quoted Prices | | | Level 2 -
Other Significant
Observable Inputs | | | Level 3 -
Significant
Unobservable
Inputs | | | Total | |
| Common Stocks | | $ | 57,005,779 | | | $ | — | | | $ | — | | | $ | 57,005,779 | |
| Preferred Stocks | | | 1,087,750 | | | | — | | | | — | | | | 1,087,750 | |
| Commercial Mortgage Backed | | | | | | | | | | | | | | | | |
| Securities | | | — | | | | 99,220,608 | | | | — | | | | 99,220,608 | |
| Short Term Investments | | | 1,232,156 | | | | — | | | | — | | | | 1,232,156 | |
| Total | | $ | 59,325,685 | | | $ | 99,220,608 | | | $ | — | | | $ | 158,546,293 | |
| * | See Statement of Investments for industry classifications. |
The Fund did not have any securities that used significant unobservable inputs (Level 3) in determining fair value, and there were no transfers into or out of Level 3, during the six months ended April 30, 2021.
Commercial Mortgage Backed Securities: As part of its investments in commercial real estate related securities, the Fund will invest in CMBS which are subject to certain risks associated with direct investments in CMBS. A CMBS is a type of mortgage-backed security that is secured by a loan (or loans) on one or more interests in commercial real estate property. Investments in CMBS are subject to the various risks which relate to the pool of underlying assets in which the CMBS represents an interest. CMBS may be backed by obligations (including certificates of participation in obligations) that are principally secured by commercial real estate loans or interests therein having multi-family or commercial use. Securities backed by commercial real estate assets are subject to securities market risks as well as risks similar to those of direct ownership of commercial real estate loans because those securities derive their cash flows and value from the performance of the commercial real estate underlying such investments and/or the owners of such real estate.
| Principal Real Estate Income Fund | Notes to Financial Statements |
| | April 30, 2021 (Unaudited) |
Real Estate Investment Trusts (“REITs”): As part of its investments in real estate related securities, the Fund will invest in REITs and is subject to certain risks associated with direct investment in REITs. REITs possess certain risks which differ from an investment in common stocks. REITs are financial vehicles that pool investors’ capital to acquire, develop and/or finance real estate and provide services to their tenants. REITs may concentrate their investments in specific geographic areas or in specific property types, e.g., regional malls, shopping centers, office buildings, apartment buildings and industrial warehouses. REITs may be affected by changes in the value of their underlying properties and by defaults by borrowers or tenants. REITs depend generally on their ability to generate cash flow to make distributions to shareowners, and certain REITs have self-liquidation provisions by which mortgages held may be paid in full and distributions of capital returns may be made at any time.
As REITs generally pay a higher rate of dividends than most other operating companies, to the extent application of the Fund’s investment strategy results in the Fund investing in REIT shares, the percentage of the Fund’s dividend income received from REIT shares will likely exceed the percentage of the Fund’s portfolio that is comprised of REIT shares. Distributions received by the Fund from REITs may consist of dividends, capital gains and/or return of capital.
Dividend income from REITs is recognized on the ex-dividend date. The calendar year-end amounts of ordinary income, capital gains, and return of capital included in distributions received from the Fund’s investments in REITs are reported to the Fund after the end of the calendar year; accordingly, the Fund estimates these amounts for accounting purposes until the characterization of REIT distributions is reported to the Fund after the end of the calendar year. Estimates are based on the most recent REIT distribution information available.
The performance of a REIT may be affected by its failure to qualify for tax-free pass-through of income under the Internal Revenue Code of 1986, as amended (the “Code”), or its failure to maintain exemption from registration under the 1940 Act. Due to the Fund’s investments in REITs, the Fund may also make distributions in excess of the Fund’s earnings and capital gains. Distributions, if any, in excess of the Fund’s earnings and profits will first reduce the adjusted tax basis of a holder’s common shares and, after that basis has been reduced to zero, will constitute capital gains to the common shareholder.
Concentration Risk: The Fund invests in companies in the real estate industry, which may include CMBS, REITs, REIT-like structures, and other securities that are secured by, or otherwise have exposure to, real estate. Any fund that concentrates in a particular segment of the market will generally be more volatile than a fund that invests more broadly. Any market price movements, regulatory changes, or economic conditions affecting CMBS, REITs, REIT-like structures, and real estate more generally, will have a significant impact on the Fund’s performance.
Foreign Currency Risk: The Fund expects to invest in securities denominated or quoted in currencies other than the U.S. dollar. Changes in foreign currency exchange rates may affect the value of securities owned by the Fund, the unrealized appreciation or depreciation of investments and gains on and income from investments. Currencies of certain countries may be volatile and therefore may affect the value of securities denominated in such currencies, which means that the Fund’s net asset value could decline as a result of changes in the exchange rates between foreign currencies and the U.S. dollar. These risks often are heightened for investments in smaller, emerging capital markets.
| | |
| Semi-Annual Report | April 30, 2021 | 25 |
| Principal Real Estate Income Fund | Notes to Financial Statements |
| | April 30, 2021 (Unaudited) |
The accounting records of the Fund are maintained in U.S. dollars. Prices of securities denominated in foreign currencies are translated into U.S. dollars at the closing rates of the exchanges at period end. Amounts related to the purchase and sale of foreign securities and investment income are translated at the rates of exchange prevailing on the respective dates of such transactions.
The Fund does not isolate that portion of the results of operations resulting from changes in foreign exchange rates on investments from the fluctuations arising from changes in market prices of securities held. Such fluctuations are included with the net realized and unrealized gain or loss from investments.
Reported net realized foreign exchange gains or losses arise from sales of foreign currencies, currency gains or losses realized between the trade and settlement dates on securities transactions, and the difference between the amounts of dividends, interest, and foreign withholding taxes recorded on the Fund's books and the U.S. dollar equivalent of the amounts actually received or paid. Net unrealized foreign exchange gains and losses arise from changes in the fair values of assets and liabilities, other than investments in securities at fiscal period-end, resulting from changes in exchange rates.
A foreign currency contract is a commitment to purchase or sell a foreign currency at a future date, at a negotiated rate. The Fund may enter into foreign currency contracts to settle specific purchases or sales of securities denominated in a foreign currency and for protection from adverse exchange rate fluctuation. Risks to a Fund include the potential inability of the counterparty to meet the terms of the contract.
Market and Geopolitical Risk: The value of your investment in the Fund is based on the market prices of the securities the Fund holds. These prices change daily due to economic and other events that affect markets generally, as well as those that affect particular regions, countries, industries, companies or governments. These price movements, sometimes called volatility, may be greater or less depending on the types of securities the Fund owns and the markets in which the securities trade. The increasing interconnectivity between global economies and financial markets increases the likelihood that events or conditions in one region or financial market may adversely impact issuers in a different country, region or financial market. Securities in the Fund’s portfolio may underperform due to inflation (or expectations for inflation), interest rates, global demand for particular products or resources, natural disasters, pandemics, epidemics, terrorism, regulatory events and governmental or quasi-governmental actions. The occurrence of global events similar to those in recent years, such as terrorist attacks around the world, natural disasters, social and political discord or debt crises and downgrades, among others, may result in market volatility and may have long term effects on both the U.S. and global financial markets. The extent and nature of the impact on supply chains or economies and markets from these events is unknown, particularly if a health emergency or other similar event, such as the recent COVID-19 outbreak, persists for an extended period of time. It is difficult to predict when similar events affecting the U.S. or global financial markets may occur, the effects that such events may have and the duration of those effects. Any such event(s) could have a significant adverse impact on the value and risk profile of the Fund’s portfolio. There is a risk that you may lose money by investing in the Fund.
See Notes to Financial Statements.
| Principal Real Estate Income Fund | Notes to Financial Statements |
| | April 30, 2021 (Unaudited) |
3. LEVERAGE
Under normal market conditions, the Fund’s policy is to utilize leverage through Borrowings and the issuance of preferred shares in an amount that represents approximately 33 1/3% of the Fund’s total assets, including proceeds from such Borrowings and issuances (or approximately 50% of the Fund’s net assets). It is possible that the assets of the Fund will decline due to market conditions such that this 33 1/3% limit will be exceeded. In that case, the leverage risk to shareholders will increase. Borrowings will be subject to interest costs, which may or may not be recovered by appreciation of the securities purchased. In certain cases, interest costs may exceed the return received on the securities purchased.
The Fund maintains a $60,000,000 line of credit with State Street Bank and Trust Company (“SSB”), which by its terms expires on September 10, 2021, subject to the restrictions and terms of the credit agreement. As of April 30, 2021 the Fund has drawn down $45,000,000 from the SSB line of credit, which was the maximum borrowing outstanding during the period. The Fund is charged an interest rate of 1.00% (per annum) above the one-month LIBOR (London Interbank Offered Rate) or 1.11%, as of the last renewal date, for borrowing under this credit agreement, on the last day of the interest period. The Fund was charged a commitment fee on the average daily unused balance of the line of credit at a rate of 0.25% (per annum). The Fund pledges its investment securities as the collateral for the line of credit per the terms of the agreement. The average annualized interest rate charged and the average outstanding loan payable for the six months ended April 30, 2021, was as follows:
| Average Interest Rate | | | 1.14 | % |
| Average Outstanding Loan Payable | | $ | 42,339,779 | |
| 4. INVESTMENT ADVISORY AND OTHER AGREEMENTS |
ALPS Advisors, Inc. (“AAI”) serves as the Fund’s investment adviser pursuant to an Investment Advisory Agreement with the Fund. As compensation for its services to the Fund, AAI receives an annual investment advisory fee of 1.05% based on the Fund’s average Total Managed Assets (as defined below). Pursuant to an Investment Sub-Advisory Agreement, AAI has retained Principal Real Estate Investors, LLC (‘‘PrinRei’’) as the Fund’s sub-advisor and pays PrinRei an annual fee of 0.55% based on the Fund’s average Total Managed Assets.
ALPS Fund Services, Inc. (‘‘AFS’’), an affiliate of AAI, serves as administrator to the Fund. Under an Administration, Bookkeeping and Pricing Services Agreement, AFS is responsible for calculating the net asset values, providing additional fund accounting and tax services, and providing fund administration and compliance-related services to the Fund. AFS is entitled to receive a monthly fee, accrued daily based on the Fund’s average Total Managed Assets, as defined below, plus a fixed fee for completion of certain regulatory filings and reimbursement for certain out-of-pocket expenses.
DST Systems, Inc. (‘‘DST’’), the parent company of AAI and AFS, serves as the Transfer Agent to the Fund. Under the Transfer Agency Agreement, DST is responsible for maintaining all shareholder records of the Fund. DST is entitled to receive an annual minimum fee of $22,500 plus out-of-pocket expenses. DST is a wholly-owned subsidiary of SS&C Technologies Holdings, Inc. (“SS&C”), a publicly traded company listed on the NASDAQ Global Select Market.
| | |
| Semi-Annual Report | April 30, 2021 | 27 |
| Principal Real Estate Income Fund | Notes to Financial Statements |
| | April 30, 2021 (Unaudited) |
The Fund pays no salaries or compensation to any of its Officers. The three independent Trustees and the interested Trustee of the Fund each receive an annual retainer of $21,000 and an additional $4,000 for attending each meeting of the Board. In addition to the attendance fee, the Chairman of the Board will be paid a meeting fee of $1,125 for each Board meeting and the Chairman of the Audit Committee of the Board will be paid a meeting attendance fee of $1,125 for each meeting of the Audit Committee of the Board. The Trustees are also reimbursed for all reasonable out-of-pocket expenses relating to attendance at meetings of the Board.
Certain Officers of the Fund are also officers of AAI and AFS.
Total Managed Assets: For these purposes, the term Total Managed Assets is defined as the value of the total assets of the Fund minus the sum of all accrued liabilities of the Fund (other than aggregate liabilities representing Limited Leverage, as defined below), calculated as of 4:00 p.m. Eastern time on such day or as of such other time or times as the Board may determine in accordance with the provisions of applicable law and of the declaration and bylaws of the Fund and with resolutions of the Board as from time to time in force. Under normal market conditions, the Fund’s policy is to utilize leverage through Borrowings (as defined below) and through the issuance of preferred shares (if any) in an amount that represents approximately 33 1/3% of the Fund’s total assets, including proceeds from such Borrowings and issuances (or approximately 50% of the Fund’s net assets) (collectively, ‘‘Limited Leverage’’). ‘‘Borrowings’’ are defined to include: amounts received by the Fund pursuant to loans from banks or other financial institutions; amounts borrowed from banks or other parties through reverse repurchase agreements; amounts received by the Fund from the Fund’s issuance of any senior notes or similar debt securities. Other than with respect to reverse repurchase agreements, Borrowings do not include trading practices or instruments that, according to the SEC or its staff, may cause senior securities concerns, and are intended to include transactions that are subject to the asset coverage requirements in Section 18 of the 1940 Act for the issuance of senior securities evidencing indebtedness (e.g., bank borrowings and the Fund’s issuance of any senior notes or similar securities) and senior securities in the form of stock (e.g., the Fund’s issuance of preferred shares).
5. DISTRIBUTIONS
The Fund intends to make a monthly distribution to common shareholders after payment of interest on any outstanding borrowings or dividends on any outstanding preferred shares. Distributions to shareholders are recorded by the Fund on ex-dividend date. The Fund may also retain cash reserves if deemed appropriate by PrinRei to meet the terms of any leverage or derivatives transactions. Such distributions shall be administered by DST. While a portion of the Fund’s distributed income may qualify as qualified dividend income, all or a portion of the Fund’s distributed income may also be fully taxable. Any such income distributions, as well as any distributions by the Fund of net realized short-term capital gains, will be taxed as ordinary income. A portion of the distributions the Fund receives from its investments may be treated as return of capital. While the Fund anticipates distributing some or all of such return of capital, it is not required to do so in order to maintain its status as a regulated investment company under Subchapter M of the Code.
The Fund has a managed distribution plan in accordance with AAI’s Section 19(b) exemptive order described below (the “Managed Distribution Plan”). Under the Managed Distribution Plan, to the extent that sufficient investment income is not available on a monthly basis, the Fund will make regular monthly distributions, which may consist of long-term capital gains and/or return of capital in order to maintain the distribution rate. In accordance with the Managed Distribution Plan, the Fund made monthly distributions to common shareholders at a fixed monthly rate of $0.08 per common share for the six months ended April 30, 2021.
| Principal Real Estate Income Fund | Notes to Financial Statements |
| | April 30, 2021 (Unaudited) |
The amount of the Fund's distributions pursuant to the Managed Distribution Plan are not related to the Fund's performance and, therefore, investors should not make any conclusions about the Fund’s investment performance from the amount of the Fund’s distributions or from the terms of the Fund’s Managed Distribution Plan. The Board may amend, suspend or terminate the Managed Distribution Plan at any time without notice to shareholders.
AAI has received an order granting an exemption from Section 19(b) of the 1940 Act and Rule 19b-1 thereunder to permit the Fund, subject to certain terms and conditions, to include realized long-term capital gains as a part of its regular distributions to its stockholders more frequently than would otherwise be permitted by the 1940 Act (generally once per taxable year). To the extent that the Fund relies on the exemptive order, the Fund will be required to comply with the terms and conditions therein, which, among other things, requires the Fund to make certain disclosures to shareholders and prospective shareholders regarding distributions, and would require the Board to make determinations regarding the appropriateness of the use of the distribution policy. Under such a distribution policy, it is possible that the Fund might distribute more than its income and net realized capital gains; therefore, distributions to shareholders may result in a return of capital. The amount treated as a return of capital will reduce a shareholder’s adjusted basis in the shareholder’s shares, thereby increasing the potential gain or reducing the potential loss on the sale of shares. There is no assurance that the Fund will continue to rely on the exemptive order in the future.
The Fund is a statutory trust established under the laws of the state of Delaware by an Agreement and Declaration of Trust dated August 31, 2012, as amended and restated through the date hereof. The Declaration of Trust provides that the Trustees of the Fund may authorize separate classes of shares of beneficial interest. The Trustees have authorized an unlimited number of common shares. The Fund intends to hold annual meetings of common shareholders in compliance with the requirements of the NYSE.
Additional shares of the Fund may be issued under certain circumstances pursuant to the Fund’s Dividend Reinvestment Plan, as defined within the Fund’s organizational documents. Additional information concerning the Dividend Reinvestment Plan is included within this report.
On December 16, 2020, the Board announced that it approved a share repurchase program. Under the share repurchase program, the Fund may purchase up to 5% of its outstanding common shares beginning January 19, 2021 in the open market, until January 19, 2022. During the six months ended April 30, 2021, the Fund repurchased 86,878 shares (1.28% of the shares outstanding at April 30, 2021) of its shares for a total cost of $1,117,244 at an average discount of 18.02% of net asset value.
| | |
| Semi-Annual Report | April 30, 2021 | 29 |
| Principal Real Estate Income Fund | Notes to Financial Statements |
| | April 30, 2021 (Unaudited) |
For the six months ended April 30, 2021, the cost of purchases and proceeds from sales of securities, excluding short-term securities, were as follows:
| Purchases | | | Sales | |
| $ 36,479,445 | | | | $ 33,648,872 | |
8. TAXES
Classification of Distributions: Net investment income/(loss) and net realized gain/(loss) may differ for financial statement and tax purposes. The character of distributions made during the year from net investment income or net realized gains may differ from its ultimate characterization for federal income tax purposes. Also, due to the timing of dividend distributions, the fiscal year in which amounts are distributed may differ from the fiscal year in which the income or realized gain was recorded by the Fund.
The amounts and characteristics of tax basis distributions and composition of distributable earnings/(accumulated losses) are finalized at fiscal year-end and are not available for the six months ended April 30, 2021.
The tax character of distributions paid during the year ended October 31, 2020 were as follows:
| | | For the Year Ended October 31, 2020 | |
| Ordinary Income | | $ | 6,500,092 | |
| Long-Term Capital Gain | | | 719,485 | |
| Return of Capital | | | 1,888,159 | |
| Total | | $ | 9,107,736 | |
Tax Basis of Investments: Net unrealized appreciation/(depreciation) of investments based on federal tax cost as of April 30, 2021, were as follows:
| Cost of investments for income tax purposes | | $ | 146,873,475 | |
| Gross appreciation on investments (excess of value over tax cost) | | $ | 17,291,622 | |
| Gross depreciation on investments (excess of tax cost over value) | | | (5,618,804 | ) |
| Net unrealized appreciation on investments | | $ | 11,672,818 | |
These differences are primarily attributed to the different tax treatment of wash sales. In addition, certain tax cost basis adjustments are finalized at fiscal year-end and therefore have not been determined as of April 30, 2021.
| Principal Real Estate Income Fund | Notes to Financial Statements |
| | April 30, 2021 (Unaudited) |
Federal Income Tax Status: For federal income tax purposes, the Fund currently qualifies, and intends to remain qualified, as a regulated investment company under the provisions of Subchapter M of the Code by distributing substantially all of its investment company taxable net income and realized gain, not offset by capital loss carryforwards, if any, to its shareholders. No provision for federal income taxes has been made.
As of and during the six months ended April 30, 2021, the Fund did not have a liability for any unrecognized tax benefits. The Fund files U.S. federal, state, and local tax returns as required. The Fund’s tax returns are subject to examination by the relevant tax authorities until expiration of the applicable statute of limitations, which is generally three years after the filing of the tax return. Tax returns for open years have incorporated no uncertain tax positions that require a provision for income taxes.
The Fund recognizes interest and penalties, if any, related to unrecognized tax benefits as income tax expense in the Statement of Operations. During the six months ended April 30, 2021, the Fund did not incur any interest or penalties.
Subsequent to April 30, 2021, the Fund paid the following distributions:
| Ex-Date | Record Date | Payable Date | Rate (per share) |
| May 13, 2021 | May 14, 2021 | May 28, 2021 | $0.0825 |
| June 15, 2021 | June 16, 2021 | June 30, 2021 | $0.0825 |
| | |
| Semi-Annual Report | April 30, 2021 | 31 |
| Principal Real Estate Income Fund | Dividend Reinvestment Plan |
| | April 30, 2021 (Unaudited) |
Unless the registered owner of Common Shares elects to receive cash by contacting DST Systems, Inc. (the “Plan Administrator”), all dividends declared on Common Shares will be automatically reinvested by the Plan Administrator for shareholders in the Fund’s Automatic Dividend Reinvestment Plan (the “Plan”), in additional Common Shares. Common Shareholders who elect not to participate in the Plan will receive all dividends and other distributions in cash paid by check mailed directly to the shareholder of record (or, if the Common Shares are held in street or other nominee name, then to such nominee) by the Plan Administrator as dividend disbursing agent. Participation in the Plan is completely voluntary and may be terminated or resumed at any time without penalty by notice if received and processed by the Plan Administrator prior to the dividend record date; otherwise such termination or resumption will be effective with respect to any subsequently declared dividend or other distribution. Such notice will be effective with respect to a particular dividend or other distribution (together, a “Dividend”). Some brokers may automatically elect to receive cash on behalf of Common Shareholders and may re-invest that cash in additional Common Shares.
The Plan Administrator will open an account for each Common Shareholder under the Plan in the same name in which such Common Shareholder’s Common Shares are registered. Whenever the Fund declares a Dividend payable in cash, non-participants in the Plan will receive cash and participants in the Plan will receive the equivalent in Common Shares. The Common Shares will be acquired by the Plan Administrator for the participants’ accounts, depending upon the circumstances described below, either (i) through receipt of additional unissued but authorized Common Shares from the Fund (“Newly Issued Common Shares”) or (ii) by purchase of outstanding Common Shares on the open market (“Open-Market Purchases”) on the NYSE or elsewhere. If, on the payment date for any Dividend, the closing market price plus estimated brokerage commissions per Common Share is equal to or greater than the NAV per Common Share, the Plan Administrator will invest the Dividend amount in Newly Issued Common Shares on behalf of the participants. The number of Newly Issued Common Shares to be credited to each participant’s account will be determined by dividing the dollar amount of the Dividend by the NAV per Common Share on the payment date; provided that, if the NAV is less than or equal to 95% of the closing market value on the payment date, the dollar amount of the Dividend will be divided by 95% of the closing market price per Common Share on the payment date. If, on the payment date for any Dividend, the NAV per Common Share is greater than the closing market value plus estimated brokerage commissions, the Plan Administrator will invest the Dividend amount in Common Shares acquired on behalf of the participants in Open-Market Purchases.
In the event of a market discount on the payment date for any Dividend, the Plan Administrator will have until the last business day before the next date on which the Common Shares trade on an “ex-dividend” basis or 30 days after the payment date for such Dividend, whichever is sooner (the “Last Purchase Date”), to invest the Dividend amount in Common Shares acquired in Open-Market Purchases. It is contemplated that the Fund will pay monthly income Dividends. If, before the Plan Administrator has completed its Open-Market Purchases, the market price per Common Share exceeds the NAV per Common Share, the average per Common Share purchase price paid by the Plan Administrator may exceed the NAV of the Common Shares, resulting in the acquisition of fewer Common Shares than if the Dividend had been paid in Newly Issued Common Shares on the Dividend payment date. Because of the foregoing difficulty with respect to Open-Market Purchases, the Plan provides that if the Plan Administrator is unable to invest the full Dividend amount in Open-Market Purchases during the purchase period or if the market discount shifts to a market premium during the purchase period, the Plan Administrator may cease making Open-Market Purchases and may invest the uninvested portion of the Dividend amount in Newly Issued Common Shares at the NAV per Common Share at the close of business on the Last Purchase Date provided that, if the NAV is less than or equal to 95% of the then current market price per Common Share, the dollar amount of the Dividend will be divided by 95% of the market price on the payment date for purposes of determining the number of shares issuable under the Plan.
| Principal Real Estate Income Fund | Dividend Reinvestment Plan |
| | April 30, 2021 (Unaudited) |
The Plan Administrator maintains all shareholders’ accounts in the Plan and furnishes written confirmation of all transactions in the accounts, including information needed by shareholders for tax records. Common Shares in the account of each Plan participant will be held by the Plan Administrator on behalf of the Plan participant, and each shareholder proxy will include those shares purchased or received pursuant to the Plan. The Plan Administrator will forward all proxy solicitation materials to participants and vote proxies for shares held under the Plan in accordance with the instructions of the participants.
In the case of Common Shareholders such as banks, brokers or nominees which hold shares for others who are the beneficial owners, the Plan Administrator will administer the Plan on the basis of the number of Common Shares certified from time to time by the record shareholder’s name and held for the account of beneficial owners who participate in the Plan.
There will be no brokerage charges with respect to Common Shares issued directly by the Fund. However, each participant will pay a pro rata share of brokerage commissions incurred in connection with Open-Market Purchases. The automatic reinvestment of Dividends will not relieve participants of any federal, state or local income tax that may be payable (or required to be withheld) on such Dividends. Participants that request a sale of Common Shares through the Plan Administrator are subject to brokerage commissions.
The Fund reserves the right to amend or terminate the Plan. There is no direct service charge to participants with regard to purchases in the Plan; however, the Fund reserves the right to amend the Plan to include a service charge payable by the participants.
All correspondence or questions concerning the Plan should be directed to the Plan Administrator.
| | |
| Semi-Annual Report | April 30, 2021 | 33 |
| Principal Real Estate Income Fund | Additional Information |
| | April 30, 2021 (Unaudited) |
PORTFOLIO HOLDINGS
The Fund files a complete schedule of portfolio holdings with the U.S. Securities and Exchange Commission (“SEC”) for the first and third quarters of each fiscal year on Form N-PORT within 60 days after the end of the period. Copies of the Fund’s Form N-PORT are available without a charge, upon request, by contacting the Fund at 1-855-838-9485 and on the SEC’s website at http://www.sec.gov.
PROXY VOTING
A description of the Fund’s proxy voting policies and procedures is available (1) without charge, upon request, by calling 1-855-838-9485, (2) on the Fund’s website located at http://www.principalcef.com, or (3) on the SEC’s website at http://www.sec.gov. Information regarding how the Fund voted proxies relating to portfolio securities during the twelve-month period ended June 30th is available on the SEC’s website at http://www.sec.gov.
SECTION 19(a) NOTICES
The following table sets forth the estimated amount of the sources of distribution for purposes of Section 19 of the Investment Company Act of 1940, as amended, and the related rules adopted there under. The Fund estimates the following percentages, of the total distribution amount per share, attributable to (i) current and prior fiscal year net investment income, (ii) net realized short-term capital gain, (iii) net realized long-term capital gain and (iv) return of capital or other capital source as a percentage of the total distribution amount. These percentages are disclosed for the fiscal year-to-date cumulative distribution amount per share for the Fund. The amounts and sources of distributions reported in these 19(a) notices are only estimates and not for tax reporting purposes. The actual amounts and sources of the amounts for tax reporting purposes will depend upon the Fund’s investment experience during the remainder of the calendar year and may be subject to changes based on tax regulations. The Fund will send you a Form 1099-DIV for the calendar year that will tell you how to report these distributions for federal income tax purposes.
Per Share Cumulative Distributions
for the Six Months Ended April 30, 2021 | | | Percentage of the Total
Cumulative Distributions for the
Six Months Ended April 30, 2021 |
Net
Investment
Income | | | Short-
Term
Capital
Gains | | | Long-
Term
Capital
Gains | | | Return
of
Capital | | | Total
Per
Share | | | Net
Investment
Income | | Short-
Term
Capital
Gains | | | Long-
Term
Capital
Gains | | | Return
of
Capital | | | Total
Per Share | |
| $ | 0.4109 | | | $ | 0.0000 | | | $ | 0.0000 | | | $ | 0.0691 | | | $ | 0.4800 | | | 85.58% | | | 0.00 | % | | | 0.00 | % | | | 14.42 | % | | | 100.00 | % |
| Principal Real Estate Income Fund | Additional Information |
| | April 30, 2021 (Unaudited) |
STOCKHOLDER MEETING RESULTS
On April 9, 2021 the Fund held a Meeting of Stockholders to consider the proposal set forth below. The following votes were recorded:
Proposal 1: The election of two (2) Trustees of the Fund to a three-year term to expire at the Fund’s 2024 Annual Meeting of Stockholders or until his successor is duly elected and qualified.
Election of Rick A. Pederson as a Trustee of the Fund to a three-year term to expire at the Fund’s 2024 Annual Meeting of Stockholders or until his successor is duly elected and qualified
| | | | Shares voted | | | % of Shares voted | |
| | For | | | | 4,965,172 | | | | 96.811 | % |
| | Against | | | | 163,564 | | | | 3.189 | % |
| | Abstain | | | | — | | | | 0.000 | % |
| | Total | | | | 5,128,736 | | | | 100.000 | % |
Election of Jeremy Held as a Trustee of the Fund to a three-year term to expire at the Fund’s 2024 Annual Meeting of Stockholders or until his successor is duly elected and qualified
| | | | Shares voted | | | % of Shares voted | |
| | For | | | | 5,020,298 | | | | 97.886 | % |
| | Against | | | | 108,438 | | | | 2.114 | % |
| | Abstain | | | | — | | | | 0.000 | % |
| | Total | | | | 5,128,736 | | | | 100.000 | % |
UNAUDITED TAX INFORMATION
Of the distributions paid by the Fund from ordinary income for the calendar year ended December 31, 2020, the following percentages met the requirements to be treated as qualifying for the corporate dividends received deduction and qualified dividend income:
| | | Dividend Received Deduction | | | Qualified Dividend Income | |
| Principal Real Estate Income Fund | | | 0.00 | % | | | 5.32 | % |
Of the distributions paid by the Fund for the calendar year ended December 31, 2020, pursuant to Section 852(b)(3) of the Internal Revenue Code, the Fund designates the amount of $719,485 as long-term capital gain dividends.
In early 2021, if applicable, shareholders of record should have received this information for the distributions paid to them by the Fund during the calendar year 2020 via Form 1099. The Fund will notify shareholders in early 2022 of amounts paid to them by the Fund, if any, during the calendar year 2021.
| | |
| Semi-Annual Report | April 30, 2021 | 35 |
| Principal Real Estate Income Fund | Additional Information |
| | April 30, 2021 (Unaudited) |
LICENSING AGREEMENT
Morningstar
The Fund is not sponsored, endorsed, sold or promoted by Morningstar, Inc. or any of its affiliates (all such entities, collectively, “Morningstar Entities”). The Morningstar Entities make no representation or warranty, express or implied, to the owners of the Fund or any member of the public regarding the advisability of investing in mutual funds generally or in the Fund in particular or the ability of the Morningstar Index Data to track general mutual fund market performance.
THE MORNINGSTAR ENTITIES DO NOT GUARANTEE THE ACCURACY AND/OR THE COMPLETENESS OF THE MORNINGSTAR INDEX DATA OR ANY DATA INCLUDED THEREIN AND MORNINGSTAR ENTITIES SHALL HAVE NO LIABILITY FOR ANY ERRORS, OMISSIONS, OR INTERRUPTIONS THEREIN.
CUSTODIAN AND TRANSFER AGENT
State Street Bank and Trust Company, located at State Street Financial Center, One Lincoln Street, Boston, MA 02111, serves as the Fund’s custodian and will maintain custody of the securities and cash of the Fund.
DST Systems, Inc., located at 333 West 11th Street, 5th Floor, Kansas City, Missouri 64105, serves as the Fund’s transfer agent and registrar.
LEGAL COUNSEL
Dechert LLP, located at 1095 Avenue of the Americas, New York, New York 10036, serves as legal counsel to the Trust.
INDEPENDENT REGISTERED PUBLIC ACCOUNTING FIRM
Cohen & Company, Ltd. is the independent registered public accounting firm for the Fund.
| Principal Real Estate Income Fund | Privacy Policy |
| | April 30, 2021 (Unaudited) |
| FACTS | WHAT DOES PRINCIPAL REAL ESTATE INCOME FUND DO WITH YOUR PERSONAL INFORMATION? |
| WHY? | Financial companies choose how they share your personal information. Federal law gives consumers the right to limit some but not all sharing. Federal law also requires us to tell you how we collect, share, and protect your personal information. Please read this notice carefully to understand what we do. |
| WHAT? | The types of personal information we collect and share depend on the product or service you have with us. This information can include: |
| | · | Social Security number |
| | · | Assets |
| | · | Retirement Assets |
| | · | Transaction History |
| | · | Checking Account Information |
| | · | Purchase History |
| | · | Account Balances |
| | · | Account Transactions |
| | · | Wire Transfer Instructions |
| | When you are no longer our customer, we continue to share your information as described in this notice. |
| HOW? | All financial companies need to share customers’ personal information to run their everyday business. In the section below, we list the reasons financial companies can share their customers’ personal information; the reasons Principal Real Estate Income Fund chooses to share; and whether you can limit this sharing. |
REASONS WE CAN SHARE YOUR
PERSONAL INFORMATION | DOES PRINCIPAL
REAL ESTATE
INCOME FUND
SHARE? | CAN YOU LIMIT
THIS SHARING? |
| For our everyday business purposes – | | |
| such as to process your transactions, maintain your | | |
| account(s), respond to court orders and legal investigations, | Yes | No |
| or report to credit bureaus | | |
| | | |
| For our marketing purposes – | | |
| to offer our products and services to you | No | We don't share |
| | | |
| For joint marketing with other financial companies | No | We don't share |
| | | |
| For our affiliates’ everyday business purposes – | | |
| information about your transactions and experiences | No | We don't share |
| | | |
| For our affiliates’ everyday business purposes – | | |
| information about your creditworthiness | No | We don't share |
| | | |
| For non-affiliates to market to you | No | We don't share |
| QUESTIONS? | Call 1-855-838-9485 | | |
| | |
| Semi-Annual Report | April 30, 2021 | 37 |
| Principal Real Estate Income Fund | Privacy Policy |
| | April 30, 2021 (Unaudited) |
| WHO WE ARE | |
| Who is providing this notice? | Principal Real Estate Income Fund |
| WHAT WE DO | |
How does Principal Real Estate
Income protect my
personal information? | To protect your personal information from unauthorized access and use, we use security measures that comply with federal law. These measures include computer safeguards and secured files and buildings. Our service providers are held accountable for adhering to strict policies and procedures to prevent any misuse of your nonpublic personal information. |
How does Principal Real Estate
Income collect my
personal information? | We collect your personal information, for example, when you · Open an account · Provide account information · Give us your contact information · Make deposits or withdrawals from your account · Make a wire transfer · Tell us where to send the money · Tells us who receives the money · Show your government-issued ID · Show your driver’s license We also collect your personal information from other companies. |
| Why can’t I limit all sharing? | Federal law gives you the right to limit only: · Sharing for affiliates’ everyday business purposes
– information about your creditworthiness · Affiliates from using your information to market to you · Sharing for nonaffiliates to market to you State laws and individual companies may give you additional rights to limit sharing. |
| Principal Real Estate Income Fund | Privacy Policy |
| | April 30, 2021 (Unaudited) |
| DEFINITIONS |
| Affiliates | Companies related by common ownership or control. They can be financial and nonfinancial companies. · Principal Real Estate Income Fund does not share with our affiliates for marketing purposes. |
| Non-affiliates | Companies not related by common ownership or control. They can be financial and nonfinancial companies. · Principal Real Estate Income Fund does not share with nonaffiliates so they can market to you. |
| Joint marketing | A formal agreement between nonaffiliated financial companies that together market financial products or services to you. · Principal Real Estate Income Fund does not jointly market. |
| | |
| Semi-Annual Report | April 30, 2021 | 39 |

Not applicable to semi-annual report.
| Item 3. | Audit Committee Financial Expert. |
Not applicable to semi-annual report.
| Item 4. | Principal Accountant Fees and Services. |
Not applicable to semi-annual report.
| Item 5. | Audit Committee of Listed Registrants. |
Not applicable.
| Item 6. | Schedule of Investments. |
| (a) | Schedule of Investments is included as part of the Report to Stockholders filed under Item 1(a) of this form. |
| (b) | Not applicable to the Registrant. |
| Item 7. | Disclosure of Proxy Voting Policies and Procedures for Closed-End Management Investment Companies. |
Not applicable to semi-annual report.
| Item 8. | Portfolio Managers of Closed-End Management Investment Companies. |
| (a) | Not applicable to semi-annual report. |
| Item 9. | Purchases of Equity Securities by Closed-End Management Company and Affiliated Purchasers. |
Period | | (a) Total Number of Shares (or Units) Purchased | | (b) Average Price Paid per Share (or Unit) | | | (c) Total Number of Shares (or Units) Purchased as Part of Publicly Announced Plans or Programs | | | (d) Maximum Number (or Approximate Dollar Value) of Shares (or Units) that May Yet Be Purchased Under the Plans or Programs |
November 1, 2020 – November 30, 2020 | | – | | $ | – | | | $ | – | | | 344,990 |
December 1, 2020 – December 31, 2020 | | – | | $ | – | | | $ | – | | | 344,990 |
January 1, 2021 – January 31, 2021 | | 21,494 | | $ | 12.22 | | | | 21,494 | | | 323,496 |
February 1, 2021 – February 28, 2021 | | 36,644 | | $ | 12.84 | | | | 36,644 | | | 286,852 |
March 1, 2021 – March 31, 2021 | | 27,960 | | $ | 13.33 | | | | 27.960 | | | 258,892 |
April 1, 2021 – April 30, 2021 | | 780 | | $ | 13.58 | | | | 780 | | | 258,112 |
| Total | | 86,878 | | $ | 12.93 | | | | 86,878 | | | 258,112 |
The Repurchase program was announced on December 16, 2020.
The Fund was approved to purchase up to 5% of its outstanding shares (344,990 shares) during the period January 19, 2021 through January 19, 2022.
| Item 10. | Submission of Matters to a Vote of Security Holders. |
There have been no material changes to procedures by which shareholders may recommend nominees to the registrant’s board of directors.
| Item 11. | Controls and Procedures. |
| (a) | The Registrant’s principal executive officer and principal financial officer have concluded that the Registrant’s disclosure controls and procedures (as defined in Rule 30a-3(c) under the Investment Company Act of 1940, as amended) are effective based on their evaluation of these controls and procedures as of a date within 90 days of the filing date of this document. |
| (b) | There was no change in the Registrant's internal control over financial reporting (as defined in Rule 30a-3(d) under the Investment Company Act of 1940, as amended) during the period covered by this report that has materially affected, or is reasonably likely to materially affect, the Registrant's internal control over financial reporting. |
| Item 12. | Disclosure of Securities Lending Activities for Closed-End Management Investment Companies. |
(a) Not applicable to semi-annual report.
| (b) | Not applicable to semi-annual report. |
| (a)(1) | Not applicable to semi-annual report |
SIGNATURES
Pursuant to the requirements of the Securities Exchange Act of 1934 and the Investment Company Act of 1940, the registrant has duly caused this report to be signed on its behalf by the undersigned, thereunto duly authorized.
PRINCIPAL REAL ESTATE INCOME FUND
By: | /s/ Kathryn Burns | |
| | Kathryn Burns | |
| | President (Principal Executive Officer) | |
| | | |
| Date: | July 7, 2021 | |
Pursuant to the requirements of the Securities Exchange Act of 1934 and the Investment Company Act of 1940, this report has been signed below by the following persons on behalf of the registrant and in the capacities and on the dates indicated.
By: | /s/ Kathryn Burns | |
| | Kathryn Burns | |
| | President (Principal Executive Officer) | |
| | | |
| Date: | July 7, 2021 | |
| By: | /s/ Jill Kerschen | |
| | Jill Kerschen | |
| | Treasurer (Principal Financial Officer) | |
| | | |
| Date: | July 7, 2021 | |