UNITED STATES
SECURITIES AND EXCHANGE COMMISSION
WASHINGTON, D.C. 20549
FORM N-CSR
CERTIFIED SHAREHOLDER REPORT OF REGISTERED
MANAGEMENT INVESTMENT COMPANIES
811-22749
(Investment Company Act file number)
Resource Real Estate Diversified Income Fund
(Exact name of Registrant as specified in charter)
717 Fifth Avenue, 14th Floor
New York, NY 10022
(Address of principal executive offices) (Zip code)
The Corporation Trust Company
Corporation Trust Center, 1209 Orange Street
Wilmington, DE 19801
(Name and address of agent for service)
Registrant's telephone number, including area code:(212) 506-3899
Date of fiscal year end:September 30
Date of reporting period:October 1, 2018 – September 30, 2019
Item 1. Reports to Stockholders.

TABLE OF CONTENTS
| Shareholder Letter | 1 |
| Portfolio Update | 3 |
| Portfolio of Investments | 5 |
| Statement of Assets and Liabilities | 10 |
| Statement of Operations | 12 |
| Statements of Changes in Net Assets | 13 |
| Statement of Cash Flows | 16 |
| Financial Highlights | |
| Class A | 17 |
| Class C | 18 |
| Class W | 19 |
| Class I | 20 |
| Class U | 21 |
| Class T | 22 |
| Class D | 23 |
| Class L | 24 |
| Notes to Financial Statements | 25 |
| Report of Independent Registered Public Accounting Firm | 34 |
| Additional Information | 36 |
| Trustees & Officers | 37 |
| Privacy Notice | 40 |
Beginning in 2021, as permitted by regulations adopted by the Securities and Exchange Commission, paper copies of the Fund’s shareholder reports will no longer be sent by mail, unless you specifically request paper copies of the reports from the Fund or from your financial intermediary, such as a broker-dealer or bank. Instead, the reports will be made available on a website, and you will be notified by mail each time a report is posted and provided with a website link to access the report.
If you already elected to receive shareholder reports electronically, you will not be affected by this change and you need not take any action. You may elect to receive shareholder reports and other communications from the Fund electronically by calling the Fund at 855-747-9559, or submit a signed letter of instruction requesting paperless reports to PO Box 219169, Kansas City, MO 64121. If you own shares through a financial intermediary, you may contact your financial intermediary to request your shareholder reports electronically.
You may elect to receive all future reports in paper free of charge. You can inform the Fund that you wish to continue receiving paper copies of your shareholder reports by calling the Fund at 855-747-9559, or by submitting a signed letter of instruction requesting paper reports to PO Box 219169, Kansas City, MO 64121. If you own shares through a financial intermediary, contact the financial intermediary to request paper copies. Your election to receive reports in paper will apply to all funds held with the fund complex or your financial intermediary.

| Resource Real Estate Diversified Income Fund | Shareholder Letter |
September 30, 2019 (Unaudited)
Dear Shareholders,
We are proud that the Resource Real Estate Diversified Income Fund’s (the “Fund”) Class A shares achieved a net total return of 8.17% during its fiscal year ended September 30, 2019. This compares to a 10.46% net total return for the Wells Fargo Hybrid and Preferred Securities REIT Index and a 10.30% net total return for the Fund’s new primary benchmark, the Bloomberg Barclays U.S. Aggregate Bond Index. We attribute this result to active management within the interval fund structure, which enables the Fund to shift investment allocations between its three main portfolio strategies (Credit, Private Equity and Public Equity) as the commercial real estate cycle evolves.
Overall, commercial real estate fundamentals remain healthy with steady leasing activity, near-peak level occupancy rates and modest rent growth. Building values are also buoyed by a healthy lending environment and strong liquidity, whereby London-based alternative research firm Preqin Ltd. estimates that private equity firms had $211 billion in cash available to invest in North American real estate as of March 31, 2019.1 Nevertheless, manageable new supply that is keeping up with demand, along with moderating job growth and rent growth, point to a maturing cycle. In such an environment, we implemented important refinements to the Fund’s portfolio that we hope will lead to favorable results in the year ahead.
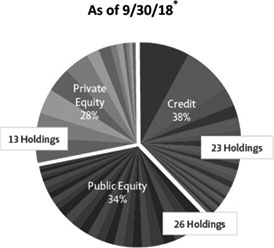
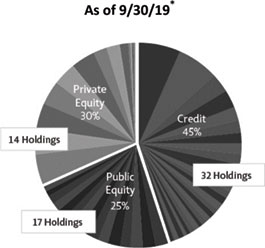
| * | Holdings are subject to change without notice. Diversification does not ensure profit or prevent losses. |
Over the course of the fiscal year, we increased the Fund’s Credit allocation to 45%, which is the highest level in the Fund’s six-plus-year history. Because credit investments sit higher in the capital structure than equity investments, we believe a greater allocation to Credit enhances the Fund’s defensive posture. We also believe that returns from income may be more dependable than returns from capital appreciation in the year ahead because asset volatility usually picks up as a cycle matures.
Within the Credit strategy, we have also sought to reduce the Fund’s volatility by reducing its sensitivity to changes in interest rates. This was done through a meaningful allocation to shorter-duration, floating-rate credit investments, which are intended to balance the interest rate sensitivity of the Fund’s longer-duration equity and credit investments.
In concert with increasing the Fund’s Credit allocation, we reduced the Fund’s Public Equity allocation to 25% by selling select positions that exceeded pricing targets. The Fund had opportunistically increased its Public Equity allocation during the broad market correction of December 2018 but accelerated its Public Equity dispositions in September 2019 as REIT indices reached all-time highs.
The composition of the Public Equity allocation was also rebalanced, ending the fiscal year with a near-even split between long-duration equity REITs and shorter-duration, floating-rate commercial real estate mortgage REITs that predominantly own first mortgages. This rebalance was driven by valuation as well as efforts to reduce the Fund’s interest rate sensitivity.
At the sub-sector level within the Public Equity strategy, the Fund’s allocation to publicly traded Healthcare REITs increased to about one-fifth of the Fund’s entire Public Equity strategy. From a fundamental perspective, we believe that the Senior Housing sub-sector may be in a more favorable stage of the commercial real estate cycle, with new supply decelerating and demographic trends pointing to a pickup in demand. From a technical perspective, we view publicly traded Healthcare REITs as an alternative asset class that is both liquid and less correlated to the broader economy.
| Annual Report | September 30, 2019 | 1 |
| Resource Real Estate Diversified Income Fund | Shareholder Letter |
September 30, 2019 (Unaudited)
Finally, we continued rebalancing the Fund’s Private Equity allocation by exiting selected Core funds and initiating new positions in Specialty and Value Add funds. We were particularly concerned that some Core fund third party appraisers were not moving quickly enough to adjust their valuation assumptions relative to what we were seeing in the market. While transparency on third party appraisals is limited, we believe the valuation discrepancy is potentially most pronounced in the retail sector, where we have seen cap rates rise over the past year.
Going forward, we hope to deliver consistent performance by remaining responsive to fundamental data and market conditions. We also intend to maintain discipline around structural Fund risks related to diversification, real-time capital deployment and liquidity. At the security level, we are committed to thorough fundamental research as a means of identifying investments that complement the Fund’s income, volatility, distribution coverage, liquidity and total return profiles.
Thank you for being a shareholder of the Resource Real Estate Diversified Income Fund.
Sincerely,
Justin Milberg & Gene Nusinzon
Co-Portfolio Managers
Resource Real Estate Diversified Income Fund
| 1 | Preqin Quarterly Update: Real Estate Q2 2019. |
| Resource Real Estate Diversified Income Fund | Portfolio Update |
September 30, 2019 (Unaudited)
The Fund’s performance figures for the periods ended September 30, 2019,* compared to its benchmarks:
| Resource Real Estate Diversified Income Fund | 6 Month | 1 Year | 3 Year | 5 Year | Since
Inception | Inception |
| Class A Shares – Without Load | 5.43% | 8.17% | 7.60% | 8.01% | 7.22% | 3/12/2013 |
| Class A Shares – With Load | -0.67% | 1.94% | 5.23% | 6.57% | 6.26% | 3/12/2013 |
| Class C Shares | 4.93% | 7.24% | 6.79% | 7.19% | 6.71% | 8/1/2014 |
| Class C Shares – With Load(a) | 2.36% | 4.64% | 6.24% | 6.87% | 6.40% | 8/1/2014 |
| Class W Shares | 5.39% | 8.13% | 7.56% | – | 7.18% | 11/21/2014 |
| Class I Shares | 5.46% | 8.35% | 7.67% | 7.76% | 7.28% | 8/1/2014 |
| Class U Shares – Without Load1 | 5.42% | 8.16% | 7.63% | 8.03% | 7.23% | 2/12/2015 |
| Class U Shares – With Load | -1.47% | 1.12% | 5.25% | 6.59% | 6.13% | 2/12/2015 |
| Class T Shares – Without Load2 | 5.03% | 7.35% | 6.82% | 7.17% | 6.69% | 2/12/2015 |
| Class T Shares – With Load | 3.44% | 5.73% | 6.27% | 6.85% | 6.38% | 2/12/2015 |
| Class D Shares3 | 5.12% | 7.48% | 7.07% | – | 6.88% | 2/12/2015 |
| Class L Shares – Without Load | 5.30% | 7.79% | – | – | 7.98% | 7/10/2017 |
| Class L Shares – With Load | 0.85% | 3.16% | – | – | 5.91% | 7/10/2017 |
| Bloomberg Barclays U.S. Aggregate Bond Index4,6 | 5.42% | 10.30% | 2.92% | 3.38% | 2.97% | 3/12/2013 |
| S&P 500 Total Return Index5 | 6.08% | 4.25% | 13.39% | 10.84% | 12.74% | 3/12/2013 |
| Wells Fargo® Hybrid and Preferred Securities REIT Index7 | 5.63% | 10.46% | 5.36% | 6.59% | 6.26% | 3/12/2013 |
| * | Returns for periods greater than one year are annualized. |
| (a) | Effective as of December 23, 2016, Class C shares no longer have a sales load. |
| 1 | Returns shown prior to 2/12/2015 are based on the returns of Class A Shares. If Class U Shares had been available during periods prior to 2/12/2015, the performance shown may have been different. |
| 2 | Returns shown prior to 2/12/2015 are based on the returns of Class C Shares. If Class T Shares had been available during periods prior to 2/12/2015, the performance shown may have been different. |
| 3 | Returns shown prior to 2/12/2015 are based on the returns of Class W Shares. If Class D Shares had been available during periods prior to 2/12/2015, the performance shown may have been different. |
| 4 | The Bloomberg Barclays U.S. Aggregate Bond Index is a market value-weighted index of investment grade fixed-rated debt issues, including government, corporate, asset-backed and mortgage-backed securities. |
| 5 | The S&P 500 Total Return Index is an unmanaged, market-value weighted index of 500 common stocks chosen for market size, liquidity and industry group representation. |
| 6 | Effective upon publication of this Annual Report, the Fund changed its primary benchmark to the Bloomberg Barclays U.S. Aggregate Bond Index. This change was made to align the Fund’s primary benchmark with the primary benchmark used by its real estate interval fund peer group. |
| 7 | The Wells Fargo® Hybrid and Preferred Securities REIT (“WHPSR”) Index is designed to track the performance of preferred securities issued in the U.S. market by real estate investment trusts. The WHPSR Index is composed exclusively of preferred shares and depositary shares. Investors cannot invest directly in an index. |
Past performance is not indicative of future results. The investment return and principal value of an investment will fluctuate. An investor’s shares when redeemed may be worth more or less than the original cost. Total return is calculated assuming reinvestment of all dividends and distributions. Performance figures for periods greater than one year are annualized. As of the Fund’s most recent prospectus dated February 1, 2019, the Fund’s total annual operating expense, including acquired fund fees and expenses, before fee waivers is 2.97% for Class A, 3.73% for Class C, 2.96% for Class W, 2.75% for Class I, 2.95% for Class U, 3.71% for Class T, 3.38% for Class D and 3.22% for Class L shares. After fee waivers, the Fund’s total annual operating expense is 2.76% for Class A, 3.51% for Class C, 2.76% for Class W, 2.49% for Class I, 2.76% for Class U, 3.51% for Class T, 3.27% for Class D and 2.99% for Class L shares. Class A shares are subject to a maximum sales load of 5.75% imposed on purchases. Class U shares are subject to a maximum sales load of 6.50% imposed on purchases. Class T shares are subject to a maximum sales load of 1.50% imposed on purchases. Class L shares are subject to a maximum sales load of 4.25% imposed on purchases. Repurchases of shares within 365 days of the purchase may be assessed an early withdrawal charge of 0.50% for Class A, 1.00% for Class C, 1.00% for Class T and 0.50% for Class U shares. For performance information current to the most recent month-end, please call toll-free 1-855-747-9559.
| Annual Report | September 30, 2019 | 3 |
| Resource Real Estate Diversified Income Fund | Portfolio Update |
September 30, 2019 (Unaudited)
Comparison of the Change in Value of a $10,000 Investment
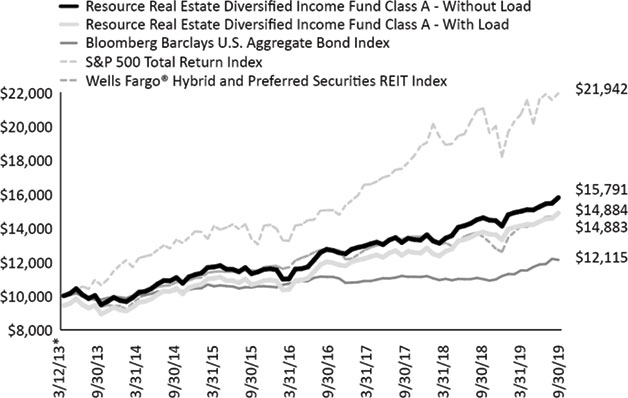
| * | Commencement of operations for Class A Shares. |
Portfolio Composition as of September 30, 2019
| Asset Type | Percent of Net Assets |
| Real Estate Investment Trusts - Common Equity | 91.92% |
| Preferred Stocks | 21.35% |
| Short Term Investment | 0.63% |
| Purchased Options | 0.45% |
| Bonds & Notes | 0.03% |
| Total Investments | 114.38% |
| Other Liabilities in Excess of Other Assets | -14.38% |
| Net Assets | 100.00% |
Please see the Portfolio of Investments for a detailed listing of the Fund’s holdings.
| Resource Real Estate Diversified Income Fund | Portfolio of Investments |
September 30, 2019
| | | Interest /Dividend Rate | | | Maturity | | | Principal | | | Value | |
| BONDS & NOTES (0.03%) | | | | | | | | | | | | | | | |
| COMMERCIAL MORTGAGE-BACKED SECURITIES (0.03%) | | | | | | | | | | | | | | | |
| Morgan Stanley Capital I Trust, Class B | | | 5.538 | % | | 02/12/2044 | | | $ | 81,730 | | | $ | 81,654 | |
| | | | | | | | | | | | | | | | |
| TOTAL BONDS & NOTES | | | | | | | | | | | | | | | |
| (Cost $80,934) | | | | | | | | | | | | | | 81,654 | |
| | | | | | | | | | Shares | | | Value | |
| PREFERRED STOCKS (21.35%) | | | | | | | | | | | | | | | |
| TRADED REAL ESTATE INVESTMENT TRUSTS (21.35%) | | | | | | | | | | | | | | | |
| AGNC Investment Corp., Series E | | | 6.500 | % | | | | | | 263,000 | | | | 6,588,149 | |
| American Finance Trust, Inc., Series A(a) | | | 7.500 | % | | | | | | 185,000 | | | | 4,750,800 | |
| American Homes 4 Rent, Series D(a) | | | 6.500 | % | | | | | | 118,835 | | | | 3,220,429 | |
| Annaly Capital Management, Inc., Series F(a) | | | 6.950 | % | | | | | | 250,000 | | | | 6,437,500 | |
| ARMOUR Residential REIT, Inc., Series B(a) | | | 7.875 | % | | | | | | 115,000 | | | | 2,880,750 | |
| Brookfield Property Partners LP, Series A2(a) | | | 6.375 | % | | | | | | 207,025 | | | | 5,374,369 | |
| Chimera Investment Corp., Series D(a) | | | 8.000 | % | | | | | | 100,000 | | | | 2,594,000 | |
| Chimera Investment Corp., Series B(a) | | | 8.000 | % | | | | | | 120,000 | | | | 3,135,600 | |
| City Office REIT, Inc., Series A(a) | | | 6.625 | % | | | | | | 45,000 | | | | 1,186,650 | |
| Colony Capital, Inc., Series E(a) | | | 8.750 | % | | | | | | 75,921 | | | | 1,920,042 | |
| Dynex Capital, Inc., Series B(a) | | | 7.625 | % | | | | | | 200,000 | | | | 4,988,000 | |
| Global Medical REIT, Inc., Series A(a) | | | 7.500 | % | | | | | | 98,378 | | | | 2,615,291 | |
| Global Net Lease, Inc., Series A(a) | | | 7.250 | % | | | | | | 75,000 | | | | 1,920,000 | |
| Monmouth Real Estate Investment Corp., Series C(a) | | | 6.125 | % | | | | | | 99,948 | | | | 2,503,697 | |
| New Residential Investment Corp., Series A(a) | | | 7.500 | % | | | | | | 200,000 | | | | 5,262,000 | |
| New York Mortgage Trust, Inc., Series C(a) | | | 7.875 | % | | | | | | 105,000 | | | | 2,656,500 | |
| Pebblebrook Hotel Trust, Series F(a) | | | 6.300 | % | | | | | | 100,000 | | | | 2,536,000 | |
| Sotherly Hotels, Inc., Series B(a) | | | 8.000 | % | | | | | | 120,000 | | | | 3,054,000 | |
| Two Harbors Investment Corp., Series A(a) | | | 8.125 | % | | | | | | 150,000 | | | | 4,275,000 | |
| Two Harbors Investment Corp., Series C(a) | | | 7.250 | % | | | | | | 110,000 | | | | 2,851,200 | |
| UMH Properties, Inc., Series C(a) | | | 6.750 | % | | | | | | 160,000 | | | | 4,180,800 | |
| | | | | | | | | | | | | | | | |
| TOTAL PREFERRED STOCKS | | | | | | | | | | | | | | | |
| (Cost $71,190,203) | | | | | | | | | | | | | | 74,930,777 | |
| | | | | | | | | | | | | | | | |
| REAL ESTATE INVESTMENT TRUSTS - COMMON EQUITY (91.92%) | | | | | | | | | | | | | | | |
| PUBLIC NON-TRADED REAL ESTATE INVESTMENT TRUSTS (0.78%) | | | | | | | | | | | | | | | |
| CIM Real Estate Finance Trust, Inc.(b)(c)(d) | | | | | | | | | | 2,058 | | | | 17,799 | |
| InvenTrust Properties Corp.(b)(c)(d) | | | | | | | | | | 446,837 | | | | 1,398,734 | |
| NorthStar Healthcare Income, Inc.(b)(c)(d) | | | | | | | | | | 168,566 | | | | 1,201,380 | |
| Phillips Edison & Company, Inc.(b)(c)(d) | | | | | | | | | | 11,182 | | | | 124,123 | |
| | | | | | | | | | | | | | | 2,742,036 | |
| | | | | | | | | | | | | | | |
| PRIVATE REAL ESTATE INVESTMENT TRUSTS & PRIVATE INVESTMENT FUNDS (62.91%) | | | | | | | | | | | | | | | |
| ACRES Capital Debt Opportunity Fund, LP(d) | | | | | | | | | | N/A | | | | 12,083,722 | |
| Ares Real Estate Enhanced Income Fund(d) | | | | | | | | | | 5,948 | | | | 5,947,749 | |
| Ares US Real Estate Fund IX(d) | | | | | | | | | | N/A | | | | 5,812,294 | |
| Bain Capital Real Estate I-B, LP(d) | | | | | | | | | | N/A | | | | 841,898 | |
| Broadstone Net Lease, Inc.(d) | | | | | | | | | | 189,426 | | | | 16,101,224 | |
| Brookfield Real Estate Finance Fund V(d) | | | | | | | | | | N/A | | | | 8,562,060 | |
| Carlyle Property Investors L.P.(d) | | | | | | | | | | 6,411 | | | | 8,469,861 | |
See Notes to Financial Statements.
| Annual Report | September 30, 2019 | 5 |
| Resource Real Estate Diversified Income Fund | Portfolio of Investments |
September 30, 2019
| | | Shares | | | Value | |
| PRIVATE REAL ESTATE INVESTMENT TRUSTS & PRIVATE INVESTMENT FUNDS (continued) | | | | | | | | |
| Clarion Lion Industrial Trust(d) | | | 7,203 | | | $ | 14,845,168 | |
| Clarion Lion Properties Fund, LP(d) | | | 11,258 | | | | 17,275,549 | |
| Clarion Partners Debt Investment Fund, LP(d) | | | N/A | | | | 7,377,207 | |
| Clarion Ventures 4(d) | | | N/A | | | | 14,713,861 | |
| Harrison Street Core Property Fund(d) | | | 10,490 | | | | 14,570,541 | |
| Heitman Core Real Estate Debt Income Trust, LP(d) | | | 24,624 | | | | 25,285,160 | |
| Menlo Equities Absolute Return Fund(d) | | | 14,086 | | | | 16,051,244 | |
| Metlife Commercial Mortgage Income Fund, LP(d) | | | 9,800 | | | | 10,065,218 | |
| Nuveen US Core Plus Real Estate Debt Fund(d) | | | 32 | | | | 2,755,702 | |
| PGIM Real Estate US Debt Fund(d) | | | 21,809 | | | | 25,082,994 | |
| Sculptor Real Estate Credit Fund(d) | | | N/A | | | | 5,898,817 | |
| Truman 2016 SC5, LLC(d) | | | N/A | | | | 952,064 | |
| UBS Trumbull Property Fund(d) | | | 758 | | | | 8,071,379 | |
| | | | | | | | 220,763,712 | |
| TRADED REAL ESTATE INVESTMENT TRUSTS (28.23%) | | | | | | | | |
| Apollo Commercial Real Estate Finance, Inc.(a) | | | 309,500 | | | | 5,933,115 | |
| Ares Commercial Real Estate Corp.(a) | | | 235,775 | | | | 3,590,853 | |
| Blackstone Mortgage Trust, Inc., Class A | | | 205,000 | | | | 7,349,250 | |
| Brookfield Property Partners LP(a) | | | 151,539 | | | | 3,076,242 | |
| Granite Point Mortgage Trust, Inc.(a) | | | 370,000 | | | | 6,933,800 | |
| HCP, Inc.(a) | | | 160,098 | | | | 5,704,292 | |
| KKR Real Estate Finance Trust, Inc.(a) | | | 250,000 | | | | 4,882,500 | |
| Ladder Capital Corp., Class A(a) | | | 395,000 | | | | 6,821,650 | |
| Medical Properties Trust, Inc.(a) | | | 335,000 | | | | 6,552,600 | |
| New Residential Investment Corp.(a) | | | 370,000 | | | | 5,801,600 | |
| Park Hotels & Resorts, Inc.(a) | | | 204,790 | | | | 5,113,606 | |
| Spirit Realty Capital, Inc.(a) | | | 150,000 | | | | 7,179,000 | |
| STAG Industrial, Inc.(a) | | | 173,160 | | | | 5,104,756 | |
| Starwood Property Trust, Inc.(a) | | | 275,000 | | | | 6,660,500 | |
| TPG RE Finance Trust, Inc.(a) | | | 337,000 | | | | 6,686,080 | |
| Ventas, Inc.(a) | | | 85,000 | | | | 6,207,550 | |
| Welltower, Inc.(a) | | | 60,000 | | | | 5,439,000 | |
| | | | | | | | 99,036,394 | |
| TOTAL REAL ESTATE INVESTMENT TRUSTS - COMMON EQUITY | | | | | | | | |
| (Cost $298,444,011) | | | | | | | 322,542,142 | |
| | | | | | | | | | | | |
| | | Clearing Firm | | Notional Amount | | | Number of
Contracts | | | Value | |
| PURCHASED OPTIONS (0.45%) | | | | | | | | | | | | | | |
| iShares U.S. Real Estate ETF, Put, Exercise Price $90, (expiring 12/20/19) | | BNP Paribas | | $ | 98,217,000 | | | | 10,500 | | | | 1,585,500 | |
| | | | | | | | | | | | | | | |
| TOTAL PURCHASED OPTIONS | | | | | | | | | | | | | | |
| (Cost $1,722,400) | | | | | | | | | | | | | 1,585,500 | |
See Notes to Financial Statements.
| Resource Real Estate Diversified Income Fund | Portfolio of Investments |
| | | Shares | | | Value | |
| SHORT TERM INVESTMENT (0.63%) | | | | | | | | |
| Dreyfus Treasury Cash Management, Institutional Class, 1.82%(e) | | | 2,214,985 | | | $ | 2,214,985 | |
| | | | | | | | | |
| TOTAL SHORT TERM INVESTMENT | | | | | | | | |
| (Cost $2,214,985) | | | | | | | 2,214,985 | |
| | | | | | | | | |
| INVESTMENTS, AT VALUE (114.38%) | | | | | | | | |
| (Cost $373,652,533) | | | | | | $ | 401,355,058 | |
| | | | | | | | | |
| LINE OF CREDIT (-12.39%) | | | | | | | (43,482,332 | ) |
| Other Liabilities In Excess Of Other Assets (-1.99%)(f) | | | | | | | (6,971,775 | ) |
| | | | | | | | | |
| NET ASSETS (100.00%) | | | | | | $ | 350,900,951 | |
| (a) | All or a portion of each of these securities have been segregated as collateral for written options and the Fund's line of credit. The aggregate market value of those securities was $160,027,147. |
| (b) | As a result of the use of significant unobservable inputs to determine fair value, these investments have been classified as Level 3 assets. |
| (c) | Fair value estimated using fair valuation procedures adopted by the Board of Trustees. Total value of such securities is $2,742,036, representing 0.78% of net assets. |
| (d) | Illiquid/restricted security. See chart below. |
| (e) | Money market fund; interest rate reflects seven-day effective yield on September 30, 2019. |
| (f) | Includes cash held as collateral for written options. |
See Notes to Financial Statements.
| Annual Report | September 30, 2019 | 7 |
| Resource Real Estate Diversified Income Fund | Portfolio of Investments |
September 30, 2019
Securities determined to be illiquid/restricted under the procedures approved by the Fund's Board of Trustees are as follows.
| Date(s) of Purchase | | Security | | Cost | | | Value | | | % of Net
Assets | |
| 08/16/18 - 12/27/18 | | ACRES Capital Debt Opportunity Fund, LP | | $ | 12,000,000 | | | $ | 12,083,722 | | | | 3.44 | % |
| 02/22/19 - 05/23/19 | | Ares Real Estate Enhanced Income Fund | | | 5,947,749 | | | | 5,947,749 | | | | 1.70 | % |
| 12/14/18 - 06/21/19 | | Ares US Real Estate Fund IX | | | 5,891,691 | | | | 5,812,294 | | | | 1.66 | % |
| 11/14/18 - 03/25/19 | | Bain Capital Real Estate I-B, LP | | | 1,091,300 | | | | 841,898 | | | | 0.24 | % |
| 10/31/16 - 04/25/19 | | Broadstone Net Lease, Inc. | | | 14,101,371 | | | | 16,101,224 | | | | 4.59 | % |
| 06/26/17 - 06/24/19 | | Brookfield Real Estate Finance Fund V | | | 8,772,712 | | | | 8,562,060 | | | | 2.44 | % |
| 07/01/2019 | | Carlyle Property Investors L.P. | | | 8,401,745 | | | | 8,469,861 | | | | 2.41 | % |
| 05/22/13 | | CIM Real Estate Finance Trust, Inc. | | | 15,404 | | | | 17,799 | | | | 0.00 | % |
| 01/01/14 - 04/03/17 | | Clarion Lion Industrial Trust | | | 10,104,713 | | | | 14,845,168 | | | | 4.23 | % |
| 01/01/14 - 05/31/19 | | Clarion Lion Properties Fund, LP | | | 14,379,784 | | | | 17,275,549 | | | | 4.92 | % |
| 02/14/17 - 05/21/19 | | Clarion Partners Debt Investment Fund, LP | | | 7,419,214 | | | | 7,377,207 | | | | 2.10 | % |
| 07/01/16 - 12/14/18 | | Clarion Ventures 4 | | | 12,086,183 | | | | 14,713,861 | | | | 4.19 | % |
| 01/03/18 | | Harrison Street Core Property Fund | | | 14,087,291 | | | | 14,570,541 | | | | 4.15 | % |
| 07/27/17 - 11/13/17 | | Heitman Core Real Estate Debt Income Trust, LP | | | 25,000,000 | | | | 25,285,160 | | | | 7.21 | % |
| 02/06/15 | | InvenTrust Properties Corp. | | | 1,331,032 | | | | 1,398,734 | | | | 0.40 | % |
| 06/28/19 | | Menlo Equities Absolute Return Fund | | | 16,000,000 | | | | 16,051,244 | | | | 4.57 | % |
| 01/02/17 - 04/02/18 | | Metlife Commercial Mortgage Income Fund, LP | | | 9,999,875 | | | | 10,065,218 | | | | 2.87 | % |
| 11/27/13 - 03/12/15 | | NorthStar Healthcare Income, Inc. | | | 1,195,477 | | | | 1,201,380 | | | | 0.34 | % |
| 05/31/19 | | Nuveen US Core Plus Real Estate Debt Fund | | | 2,767,000 | | | | 2,755,702 | | | | 0.79 | % |
| 07/31/17 - 03/29/18 | | PGIM Real Estate US Debt Fund | | | 25,000,000 | | | | 25,082,994 | | | | 7.15 | % |
| 08/07/13 - 11/25/13 | | Phillips Edison & Company, Inc. | | | 75,326 | | | | 124,123 | | | | 0.04 | % |
| 06/28/17 - 06/13/19 | | Sculptor Real Estate Credit Fund | | | 6,233,487 | | | | 5,898,817 | | | | 1.68 | % |
| 06/24/16 - 03/20/19 | | Truman 2016 SC5, LLC | | | 444,928 | | | | 952,064 | | | | 0.27 | % |
| 01/04/16 - 10/01/18 | | UBS Trumbull Property Fund | | | 8,200,000 | | | | 8,071,379 | | | | 2.30 | % |
| | | Total | | $ | 210,546,282 | | | $ | 223,505,748 | | | | 63.69 | % |
Additional information on investments in private real estate investment funds:
| Security | | | Value | | | Redemption
Frequency | | Redemption
Notice (Days) | | | Unfunded
Commitments
as of
September 30,
2019 | |
| ACRES Capital Debt Opportunity Fund, LP | | $ | 12,083,722 | | | N/A | | | N/A | | | $ | – | |
| Ares Real Estate Enhanced Income Fund(a) | | | 5,947,749 | | | Quarterly | | | 90 | | | | 8,052,251 | |
| Ares US Real Estate Fund IX | | | 5,812,294 | | | N/A | | | N/A | | | | 6,608,309 | |
| Bain Capital Real Estate I-B, LP | | | 841,898 | | | N/A | | | N/A | | | | 9,151,859 | |
| Broadstone Net Lease, Inc. | | | 16,101,224 | | | Quarterly | | | 10 | | | | – | |
| Brookfield Real Estate Finance Fund V | | | 8,562,060 | | | N/A | | | N/A | | | | 16,002,238 | |
| Carlyle Property Investors L.P.(b) | | | 8,469,861 | | | Quarterly | | | 90 | | | | 8,598,255 | |
| Clarion Lion Industrial Trust | | | 14,845,168 | | | Quarterly | | | 90 | | | | 3,000,000 | |
| Clarion Lion Properties Fund, LP | | | 17,275,549 | | | Quarterly | | | 90 | | | | – | |
| Clarion Partners Debt Investment Fund, LP | | | 7,377,207 | | | N/A | | | N/A | | | | 4,607,979 | |
| Clarion Ventures 4 | | | 14,713,861 | | | N/A | | | N/A | | | | 963,242 | |
| Harrison Street Core Property Fund | | | 14,570,541 | | | Quarterly | | | 45 | | | | 1,000,000 | |
| Heitman Core Real Estate Debt Income Trust, LP(c) | | | 25,285,160 | | | Quarterly | | | 90 | | | | – | |
| Menlo Equities Absolute Return Fund(d) | | | 16,051,244 | | | Annually | | | 31 | | | | – | |
| Metlife Commercial Mortgage Income Fund, LP | | | 10,065,218 | | | Quarterly | | | 90 | | | | 4,000,000 | |
| Nuveen US Core Plus Real Estate Debt Fund(e) | | | 2,755,702 | | | Quarterly | | | 45 | | | | 7,233,000 | |
| PGIM Real Estate US Debt Fund | | | 25,082,994 | | | Quarterly | | | 90 | | | | – | |
| Sculptor Real Estate Credit Fund | | | 5,898,817 | | | N/A | | | N/A | | | | 14,910,565 | |
| Truman 2016 SC5, LLC | | | 952,064 | | | N/A | | | N/A | | | | – | |
| UBS Trumbull Property Fund | | | 8,071,379 | | | Quarterly | | | 60 | | | | – | |
See Notes to Financial Statements.
| Resource Real Estate Diversified Income Fund | Portfolio of Investments |
September 30, 2019
| (a) | Redemptions are subject to a two-year holding period from the underlying fund's initial capital call on December 17, 2018. |
| (b) | Redemptions are subject to a two-year holding period from the underlying fund’s initial capital call on July 1, 2019. |
| (c) | Redemptions are subject to a three-year holding period from the date of the underlying fund's initial close on July 27, 2017. |
| (d) | Redemptions are subject to a two-year holding period from the underlying fund’s initial capital call on June 28, 2019. |
| (e) | Redemptions are subject to a two-year holding period from the underlying fund’s initial capital call on May 31, 2019. |
Schedule Of Written Options
At September 30, 2019, the Fund had the following outstanding written options:
| | | Counterparty | | Number of
Contracts | | | Exercise Price | | | Maturity Date | | Notional Value | | | Value | |
| Call Options | | | | | | | | | | | | | | | | | | | | |
| iShares U.S. Real Estate ETF | | BNP Paribas | | | (10,500 | ) | | $ | 97.00 | | | 12/20/2019 | | $ | (98,217,000 | ) | | $ | (908,250 | ) |
| | | | | | | | | | | | | | | | | | | | | |
| Put Options | | | | | | | | | | | | | | | | | | | | |
| iShares U.S. Real Estate ETF | | BNP Paribas | | | (10,500 | ) | | $ | 87.00 | | | 12/20/2019 | | | (98,217,000 | ) | | | (955,500 | ) |
| | | | | | | | | | | | | | | | | | | | | |
| Total Written Options (Premiums $1,616,166) | | | | | | | $ | (196,434,000 | ) | | $ | (1,863,750 | ) |
See Notes to Financial Statements.
| Annual Report | September 30, 2019 | 9 |
| Resource Real Estate Diversified Income Fund | Statement of Assets and Liabilities |
September 30, 2019
| ASSETS | | | |
| Investments, at value (Cost $373,652,533) | | $ | 401,355,058 | |
| Cash collateral for written options | | | 113,227 | |
| Dividends and interest receivable | | | 3,523,173 | |
| Receivable for investments sold | | | 6,794 | |
| Receivable for fund shares sold | | | 293,816 | |
| Prepaid expenses and other assets | | | 29,647 | |
| Total assets | | | 405,321,715 | |
| | | | | |
| LIABILITIES | | | | |
| Written options, at value (Proceeds $1,616,166) | | | 1,863,750 | |
| Line of credit payable | | | 43,482,332 | |
| Interest on line of credit payable | | | 160,175 | |
| Payable to custodian | | | 1,555,642 | |
| Payable for investments purchased | | | 6,569,602 | |
| Payable due to adviser | | | 340,461 | |
| Administration fees payable | | | 62,492 | |
| Custody fees payable | | | 24,609 | |
| Payable for compliance services fees | | | 16,668 | |
| Distribution and dealer manager fees payable | | | 54,274 | |
| Shareholder servicing fees payable | | | 59,901 | |
| Payable for transfer agency fees | | | 54,699 | |
| Accrued expenses and other liabilities | | | 176,159 | |
| Total liabilities | | | 54,420,764 | |
| NET ASSETS | | $ | 350,900,951 | |
| | | | | |
| NET ASSETS CONSISTS OF | | | | |
| Paid-in capital | | $ | 316,463,772 | |
| Total distributable earnings | | | 34,437,179 | |
| NET ASSETS | | $ | 350,900,951 | |
| Commitments (Note 9) | | | | |
See Notes to Financial Statements.
| Resource Real Estate Diversified Income Fund | Statement of Assets and Liabilities (continued) |
September 30, 2019
| PRICING OF SHARES | | | |
| Class A | | | | |
| Net Assets | | $ | 96,114,202 | |
| Shares of beneficial interest outstanding (unlimited number of shares, no par value common stock authorized) | | | 8,994,679 | |
| Net Asset Value and redemption price per share(a) | | $ | 10.69 | |
| Maximum Offering Price Per Share (Maximum Sales Charge of 5.75%) | | $ | 11.34 | |
| Class C | | | | |
| Net Assets | | $ | 74,608,773 | |
| Shares of beneficial interest outstanding (unlimited number of shares, no par value common stock authorized) | | | 6,983,972 | |
| Net Asset Value, offering and redemption price per share(a) | | $ | 10.68 | |
| Class W | | | | |
| Net Assets | | $ | 92,006,455 | |
| Shares of beneficial interest outstanding (unlimited number of shares, no par value common stock authorized) | | | 8,481,116 | |
| Net Asset Value, offering and redemption price per share | | $ | 10.85 | |
| Class I | | | | |
| Net Assets | | $ | 55,137,820 | |
| Shares of beneficial interest outstanding (unlimited number of shares, no par value common stock authorized) | | | 4,952,110 | |
| Net Asset Value, offering and redemption price per share | | $ | 11.13 | |
| Class U | | | | |
| Net Assets | | $ | 9,375,391 | |
| Shares of beneficial interest outstanding (unlimited number of shares, no par value common stock authorized) | | | 876,602 | |
| Net Asset Value and redemption price per share(a) | | $ | 10.70 | |
| Maximum Offering Price Per Share (Maximum Sales Charge of 6.50%) | | $ | 11.44 | |
| Class T | | | | |
| Net Assets | | $ | 7,079,489 | |
| Shares of beneficial interest outstanding (unlimited number of shares, no par value common stock authorized) | | | 663,747 | |
| Net Asset Value and redemption price per share(a) | | $ | 10.67 | |
| Maximum Offering Price Per Share (Maximum Sales Charge of 1.50%) | | $ | 10.83 | |
| Class D | | | | |
| Net Assets | | $ | 6,176,332 | |
| Shares of beneficial interest outstanding (unlimited number of shares, no par value common stock authorized) | | | 569,179 | |
| Net Asset Value, offering and redemption price per share | | $ | 10.85 | |
| Class L | | | | |
| Net Assets | | $ | 10,402,489 | |
| Shares of beneficial interest outstanding (unlimited number of shares, no par value common stock authorized) | | | 973,373 | |
| Net Asset Value and redemption price per share | | $ | 10.69 | |
| Maximum Offering Price Per Share (Maximum Sales Charge of 4.25%) | | $ | 11.16 | |
| (a) | Redemption price varies based on length of time held (Note 1). |
See Notes to Financial Statements.
| Annual Report | September 30, 2019 | 11 |
| Resource Real Estate Diversified Income Fund | Statement of Operations |
For the Year Ended September 30, 2019
| INVESTMENT INCOME | | | |
| Dividends(a) | | $ | 20,223,184 | |
| Interest | | | 52,201 | |
| Total investment income | | | 20,275,385 | |
| EXPENSES | | | | |
| Investment advisory fees (Note 3) | | | 3,793,109 | |
| Administrative fees (Note 3) | | | 318,409 | |
| Distribution fees (Note 3): | | | | |
| Class C | | | 498,875 | |
| Class T | | | 46,986 | |
| Class L | | | 17,589 | |
| Shareholder servicing fees (Note 3): | | | | |
| Class A | | | 220,567 | |
| Class C | | | 166,292 | |
| Class W | | | 201,356 | |
| Class U | | | 25,486 | |
| Class T | | | 15,662 | |
| Class D | | | 13,804 | |
| Class L | | | 17,589 | |
| Dealer manager fees (Note 3): | | | | |
| Class D | | | 31,595 | |
| Interest expense (Note 8) | | | 1,781,874 | |
| Dividend expense on securities sold short | | | 790,742 | |
| Transfer agent fees (Note 3) | | | 360,537 | |
| Audit fees | | | 28,000 | |
| Legal fees | | | 72,301 | |
| Printing expense | | | 240,580 | |
| Registration fees | | | 109,661 | |
| Custody fees | | | 112,315 | |
| Trustee fees and expenses (Note 3) | | | 42,915 | |
| Compliance services fees (Note 3) | | | 200,000 | |
| Networking Fees: | | | | |
| Class A | | | 39,819 | |
| Class C | | | 24,596 | |
| Class W | | | 15,513 | |
| Class I | | | 9,068 | |
| Class L | | | 1,341 | |
| Other expenses | | | 96,117 | |
| Total expenses | | | 9,292,698 | |
| Less fees waived/expenses reimbursed by investment adviser (Note 3) | | | (173,757 | ) |
| Recoupment of previously waived fees (Note 3) | | | 1,923 | |
| Total net expenses | | | 9,120,864 | |
| NET INVESTMENT INCOME | | | 11,154,521 | |
| REALIZED AND UNREALIZED GAIN/(LOSS) ON INVESTMENTS | | | | |
| Net realized gain on investments | | | 7,683,360 | |
| Net realized gain on written options | | | 853,113 | |
| Net realized loss on securities sold short | | | (423,071 | ) |
| Net realized loss on foreign currency transactions | | | (233,349 | ) |
| Total net realized gain | | | 7,880,053 | |
| Net change in unrealized appreciation on investments | | | 5,928,933 | |
| Net change in unrealized depreciation on written options | | | (440,888 | ) |
| Net change in unrealized appreciation on translation of assets and liabilities in foreign currencies | | | 3 | |
| Total net change in unrealized appreciation | | | 5,488,048 | |
| NET REALIZED AND UNREALIZED GAIN ON INVESTMENTS | | | 13,368,101 | |
| NET INCREASE IN NET ASSETS RESULTING FROM OPERATIONS | | $ | 24,522,622 | |
| (a) | Net of foreign tax withholding in the amount of $2,033. |
See Notes to Financial Statements.
| Resource Real Estate Diversified Income Fund | Statements of Changes in Net Assets |
| | | For the Year Ended September 30, 2019 | | | For the Year Ended September 30, 2018 | |
| OPERATIONS | | | | | | |
| Net investment income | | $ | 11,154,521 | | | $ | 6,882,506 | |
| Net realized gain | | | 7,880,053 | | | | 1,480,021 | |
| Net change in unrealized appreciation | | | 5,488,048 | | | | 12,998,190 | |
| Net increase in net assets resulting from operations | | | 24,522,622 | | | | 21,360,717 | |
| | | | | | | | | |
| DISTRIBUTIONS TO SHAREHOLDERS | | | | | | | | |
| Total Distributable Earnings | | | | | | | | |
| Class A | | | (3,994,204 | ) | | | (3,174,296 | ) |
| Class C | | | (2,618,689 | ) | | | (1,954,018 | ) |
| Class W | | | (3,730,424 | ) | | | (2,391,342 | ) |
| Class I | | | (1,835,557 | ) | | | (668,785 | ) |
| Class U | | | (445,458 | ) | | | (437,968 | ) |
| Class T | | | (248,861 | ) | | | (192,158 | ) |
| Class D | | | (255,121 | ) | | | (250,554 | ) |
| Class L | | | (330,150 | ) | | | (116,282 | ) |
| From return of capital: | | | | | | | | |
| Class A | | | (1,153,777 | ) | | | (1,743,504 | ) |
| Class C | | | (747,260 | ) | | | (1,045,908 | ) |
| Class W | | | (1,104,767 | ) | | | (1,348,909 | ) |
| Class I | | | (519,261 | ) | | | (449,161 | ) |
| Class U | | | (133,691 | ) | | | (244,700 | ) |
| Class T | | | (78,236 | ) | | | (102,898 | ) |
| Class D | | | (73,525 | ) | | | (132,459 | ) |
| Class L | | | (93,724 | ) | | | (74,212 | ) |
| Net decrease in net assets from distributions | | | (17,362,705 | ) | | | (14,327,154 | ) |
| | | | | | | | | |
| CAPITAL SHARE TRANSACTIONS | | | | | | | | |
| Class A | | | | | | | | |
| Proceeds from sales of shares | | | 13,039,162 | | | | 13,680,821 | |
| Distributions reinvested | | | 2,516,605 | | | | 2,483,378 | |
| Cost of shares redeemed | | | (8,132,489 | ) | | | (11,098,578 | ) |
| Net Transferred in/(out) | | | (218,915 | ) | | | (4,490,045 | ) |
| Net increase from capital shares transactions | | | 7,204,363 | | | | 575,576 | |
| | | | | | | | | |
| Class C | | | | | | | | |
| Proceeds from sales of shares | | | 14,689,128 | | | | 10,074,220 | |
| Distributions reinvested | | | 2,037,232 | | | | 1,878,771 | |
| Cost of shares redeemed | | | (4,235,609 | ) | | | (8,383,522 | ) |
| Net Transferred in/(out) | | | (1,764,422 | ) | | | (302,336 | ) |
| Net increase from capital shares transactions | | | 10,726,329 | | | | 3,267,133 | |
| | | | | | | | | |
| Class W | | | | | | | | |
| Proceeds from sales of shares | | | 27,638,555 | | | | 22,102,057 | |
| Distributions reinvested | | | 2,974,798 | | | | 2,300,048 | |
| Cost of shares redeemed | | | (5,313,340 | ) | | | (14,081,528 | ) |
| Net Transferred in/(out) | | | (4,687,265 | ) | | | 896,811 | |
| Net increase from capital shares transactions | | | 20,612,748 | | | | 11,217,388 | |
| | | | | | | | | |
| Class I | | | | | | | | |
| Proceeds from sales of shares | | | 26,092,038 | | | | 9,224,928 | |
| Distributions reinvested | | | 1,443,152 | | | | 715,396 | |
| Cost of shares redeemed | | | (1,965,835 | ) | | | (5,104,391 | ) |
| Net Transferred in/(out) | | | 6,223,099 | | | | 8,248,092 | |
| Net increase from capital shares transactions | | | 31,792,454 | | | | 13,084,025 | |
| | | | | | | | | |
| Class U | | | | | | | | |
| Distributions reinvested | | | 193,216 | | | | 225,027 | |
| Cost of shares redeemed | | | (1,808,920 | ) | | | (990,979 | ) |
| Net Transferred in/(out) | | | (618,052 | ) | | | (98,811 | ) |
| Net decrease from capital shares transactions | | | (2,233,756 | ) | | | (864,763 | ) |
See Notes to Financial Statements.
| Annual Report | September 30, 2019 | 13 |
| Resource Real Estate Diversified Income Fund | Statements of Changes in Net Assets (continued) |
| | | For the Year Ended September 30, 2019 | | | For the Year Ended September 30, 2018 | |
| Class T | | | | | | | | |
| Distributions reinvested | | $ | 183,528 | | | $ | 145,760 | |
| Cost of shares redeemed | | | (341,048 | ) | | | (457,499 | ) |
| Net Transferred in/(out) | | | 1,556,738 | | | | (275,588 | ) |
| Net increase/(decrease) from capital shares transactions | | | 1,399,218 | | | | (587,327 | ) |
| | | | | | | | | |
| Class D | | | | | | | | |
| Distributions reinvested | | | 186,784 | | | | 204,540 | |
| Cost of shares redeemed | | | (374,820 | ) | | | (378,814 | ) |
| Net Transferred in/(out) | | | (482,114 | ) | | | (3,910,516 | ) |
| Net decrease from capital shares transactions | | | (670,150 | ) | | | (4,084,790 | ) |
| | | | | | | | | |
| Class L | | | | | | | | |
| Proceeds from sales of shares | | | 5,532,741 | | | | 3,785,619 | |
| Distributions reinvested | | | 193,991 | | | | 89,456 | |
| Cost of shares redeemed | | | (116,546 | ) | | | (176,607 | ) |
| Net Transferred in/(out) | | | (9,069 | ) | | | (67,607 | ) |
| Net increase from capital shares transactions | | | 5,601,117 | | | | 3,630,861 | |
| | | | | | | | | |
| Net increase in net assets | | | 81,592,240 | | | | 33,271,666 | |
| | | | | | | | | |
| NET ASSETS | | | | | | | | |
| Beginning of year | | | 269,308,711 | | | | 236,037,045 | |
| End of year | | $ | 350,900,951 | | | $ | 269,308,711 | |
| | | | | | | | | |
| OTHER INFORMATION | | | | | | | | |
| Capital Shares Transactions | | | | | | | | |
| Class A | | | | | | | | |
| Issued | | | 1,248,889 | | | | 1,291,742 | |
| Distributions reinvested | | | 243,649 | | | | 246,168 | |
| Redeemed | | | (780,112 | ) | | | (1,097,733 | ) |
| Net Transferred in/(out) | | | (21,132 | ) | | | (399,459 | ) |
| Net increase in capital shares | | | 691,294 | | | | 40,718 | |
| | | | | | | | | |
| Class C | | | | | | | | |
| Issued | | | 1,404,406 | | | | 994,254 | |
| Distributions reinvested | | | 197,254 | | | | 186,242 | |
| Redeemed | | | (406,869 | ) | | | (832,571 | ) |
| Net Transferred in/(out) | | | (168,104 | ) | | | (39,336 | ) |
| Net increase in capital shares | | | 1,026,687 | | | | 308,589 | |
| | | | | | | | | |
| Class W | | | | | | | | |
| Issued | | | 2,609,999 | | | | 2,165,783 | |
| Distributions reinvested | | | 283,477 | | | | 224,371 | |
| Redeemed | | | (500,980 | ) | | | (1,376,110 | ) |
| Net Transferred in/(out) | | | (438,774 | ) | | | 60,818 | |
| Net increase in capital shares | | | 1,953,722 | | | | 1,074,862 | |
| | | | | | | | | |
| Class I | | | | | | | | |
| Issued | | | 2,390,258 | | | | 879,388 | |
| Distributions reinvested | | | 133,482 | | | | 67,976 | |
| Redeemed | | | (181,120 | ) | | | (484,526 | ) |
| Net Transferred in/(out) | | | 568,635 | | | | 788,565 | |
| Net increase in capital shares | | | 2,911,255 | | | | 1,251,403 | |
| | | | | | | | | |
| Class U | | | | | | | | |
| Distributions reinvested | | | 18,718 | | | | 22,466 | |
| Redeemed | | | (172,998 | ) | | | (96,573 | ) |
| Net Transferred in/(out) | | | (58,972 | ) | | | (9,498 | ) |
| Net decrease in capital shares | | | (213,252 | ) | | | (83,605 | ) |
See Notes to Financial Statements.
| Resource Real Estate Diversified Income Fund | Statements of Changes in Net Assets (continued) |
| | | For the Year Ended September 30, 2019 | | | For the Year Ended September 30, 2018 | |
| OTHER INFORMATION | | | | | | | | |
| Capital Shares Transactions | | | | | | | | |
| Class T | | | | | | | | |
| Distributions reinvested | | | 17,735 | | | | 14,491 | |
| Redeemed | | | (32,736 | ) | | | (45,546 | ) |
| Net Transferred in/(out) | | | 148,576 | | | | (26,978 | ) |
| Net increase/(decrease) in capital shares | | | 133,575 | | | | (58,033 | ) |
| | | | | | | | | |
| Class D | | | | | | | | |
| Distributions reinvested | | | 17,828 | | | | 19,974 | |
| Redeemed | | | (35,293 | ) | | | (36,792 | ) |
| Net Transferred in/(out) | | | (45,610 | ) | | | (379,137 | ) |
| Net decrease in capital shares | | | (63,075 | ) | | | (395,955 | ) |
| | | | | | | | | |
| Class L | | | | | | | | |
| Issued | | | 526,390 | | | | 361,637 | |
| Distributions reinvested | | | 18,625 | | | | 8,819 | |
| Redeemed | | | (11,167 | ) | | | (17,031 | ) |
| Net Transferred in/(out) | | | (875 | ) | | | 5,025 | |
| Net increase in capital shares | | | 532,973 | | | | 358,450 | |
See Notes to Financial Statements.
| Annual Report | September 30, 2019 | 15 |
| Resource Real Estate Diversified Income Fund | Statement of Cash Flows |
For the Year Ended September 30, 2019
| CASH FLOWS FROM OPERATING ACTIVITIES: | | | |
| Net increase in net assets from operations | | $ | 24,522,622 | |
| Adjustments to reconcile net increase/(decrease) in net assets resulting from operations to net cash used in operating activities: | | | | |
| Purchase of investment securities | | | (296,156,459 | ) |
| Proceeds from sale of investment securities | | | 237,706,087 | |
| Purchase of option contracts | | | (4,929,350 | ) |
| Proceeds from sale of option contracts | | | 202,095 | |
| Proceeds from securities sold short transactions | | | 117,342,313 | |
| Cover securities sold short transactions | | | (117,765,385 | ) |
| Premiums received from written options transactions | | | 6,442,780 | |
| Premiums paid from closing written options transactions | | | (5,804,805 | ) |
| Net (purchase) proceeds from short-term investment securities | | | (1,763,841 | ) |
| Amortization of discount and accretion of discount on investments | | | (88 | ) |
| Net realized (gain)/loss on: | | | | |
| Investments | | | (7,683,360 | ) |
| Securities sold short | | | 423,071 | |
| Written options | | | (853,113 | ) |
| Net change in unrealized (appreciation)/depreciation on: | | | | |
| Investments | | | (5,928,933 | ) |
| Written options | | | 440,888 | |
| (Increase)/Decrease in assets: | | | | |
| Dividends and interest receivable | | | (394,726 | ) |
| Prepaid expenses and other assets | | | (4,510 | ) |
| Increase/(Decrease) in liabilities: | | | | |
| Interest on line of credit payable | | | 131,439 | |
| Payable due to adviser | | | 105,696 | |
| Administration fees payable | | | 10,143 | |
| Custody fees payable | | | (1,847 | ) |
| Shareholder servicing fees payable | | | (62,588 | ) |
| Payable for compliance services fees | | | 1 | |
| Distribution and dealer manager fees payable | | | 9,709 | |
| Payable for transfer agency fees | | | 653 | |
| Accrued expenses and other liabilities | | | (252,136 | ) |
| Net cash used in operating activities | | | (54,263,644 | ) |
| | | | | |
| CASH FLOWS FROM FINANCING ACTIVITIES: | | | | |
| Payments on line of credit | | | (4,622,064 | ) |
| Proceeds from sale of shares | | | 87,189,020 | |
| Cost of shares redeemed | | | (22,288,607 | ) |
| Increase in payable to custodian | | | 1,555,642 | |
| Cash distributions paid | | | (7,633,399 | ) |
| Net cash provided by financing activities | | | 54,200,592 | |
| | | | | |
| Net Change in cash & cash equivalents | | | (63,052 | ) |
| | | | | |
| Restricted and unrestricted cash, beginning of year | | $ | 176,279 | |
| Restricted and unrestricted cash, end of year | | $ | 113,227 | |
| | | | | |
| SUPPLEMENTAL DISCLOSURE OF CASH FLOW INFORMATION: | | | | |
| Non-cash financing activities not included herin consist of reinvestment of distributions of: | | $ | 9,729,306 | |
| Cash paid for interest on line of credit during the year was: | | $ | 1,650,435 | |
| RECONCILIATION OF RESTRICTED AND UNRESTRICTED CASH AT THE BEGINNING OF YEAR TO THE STATEMENT OF ASSETS AND LIABILITIES | | | | |
| Cash | | $ | 64,920 | |
| Due from broker | | | | |
| Written options | | $ | 111,359 | |
| RECONCILIATION OF RESTRICTED AND UNRESTRICTED CASH AT THE END OF YEAR TO THE STATEMENT OF ASSETS AND LIABILITIES | | | | |
| Cash | | $ | – | |
| Due from broker | | | | |
| Written options | | $ | 113,227 | |
See Notes to Financial Statements.
| Resource Real Estate Diversified Income Fund – Class A | Financial Highlights |
For a Share Outstanding Throughout the Years or Periods Presented
| | | Year Ended
September 30,
2019 | | | Year Ended
September 30,
2018 | | | Year Ended
September 30,
2017 | | | Year Ended
September 30,
2016 | | | For the Period Ended
September 30,
2015(a) | | Year Ended
February 28,
2015 |
| NET ASSET VALUE, BEGINNING OF YEAR OR PERIOD | | $ | 10.47 | | | $ | 10.19 | | | $ | 10.26 | | | $ | 9.81 | | | $ | 10.52 | | | $ | 9.75 | |
| INCOME FROM INVESTMENT OPERATIONS | | | | | | | | | | | | | | | | | | | | | | | | |
| Net investment income(b)(c) | | | 0.40 | | | | 0.30 | | | | 0.39 | | | | 0.34 | | | | 0.21 | | | | 0.33 | |
| Net realized and unrealized gain/(loss) on investments | | | 0.42 | | | | 0.58 | | | | 0.17 | | | | 0.71 | | | | (0.47 | ) | | | 1.05 | |
| | | | | | | | | | | | | | | | | | | | | | | | | |
| Total income/(loss) from investment operations | | | 0.82 | | | | 0.88 | | | | 0.56 | | | | 1.05 | | | | (0.26 | ) | | | 1.38 | |
| | | | | | | | | | | | | | | | | | | | | | | | | |
| DISTRIBUTIONS TO SHAREHOLDERS | | | | | | | | | | | | | | | | | | | | | | | | |
| From net investment income | | | (0.26 | ) | | | (0.24 | ) | | | (0.31 | ) | | | (0.32 | ) | | | (0.17 | ) | | | (0.48 | ) |
| From net realized gain on investments | | | (0.21 | ) | | | (0.15 | ) | | | (0.12 | ) | | | – | | | | (0.03 | ) | | | (0.05 | ) |
| From return of capital | | | (0.13 | ) | | | (0.21 | ) | | | (0.20 | ) | | | (0.28 | ) | | | (0.25 | ) | | | (0.08 | ) |
| Total distributions | | | (0.60 | ) | | | (0.60 | ) | | | (0.63 | ) | | | (0.60 | ) | | | (0.45 | ) | | | (0.61 | ) |
| INCREASE/DECREASE IN NET ASSET VALUE | | | 0.22 | | | | 0.28 | | | | (0.07 | ) | | | 0.45 | | | | (0.71 | ) | | | 0.77 | |
| NET ASSET VALUE, END OF YEAR OR PERIOD | | $ | 10.69 | | | $ | 10.47 | | | $ | 10.19 | | | $ | 10.26 | | | $ | 9.81 | | | $ | 10.52 | |
| TOTAL RETURN(d)(e) | | | 8.17 | % | | | 9.00 | % | | | 5.67 | % | | | 11.09 | % | | | (2.50 | )% | | | 14.70 | % |
| | | | | | | | | | | | | | | | | | | | | | | | | |
| RATIOS AND SUPPLEMENTAL DATA | | | | | | | | | | | | | | | | | | | | | | | | |
| Net assets, end of year or period (in 000s) | | $ | 96,114 | | | $ | 86,965 | | | $ | 84,231 | | | $ | 61,470 | | | $ | 37,399 | | | $ | 27,830 | |
| | | | | | | | | | | | | | | | | | | | | | | | | |
| RATIOS TO AVERAGE NET ASSETS(f) | | | | | | | | | | | | | | | | | | | | | | | | |
| | | | | | | | | | | | | | | | | | | | | | | | | |
| Including interest and dividend expense: | | | | | | | | | | | | | | | | | | | | | | | | |
| Expenses, gross | | | 2.90 | % | | | 2.97 | % | | | 2.90 | % | | | 2.78 | % | | | 3.30 | %(g) | | 4.81 | % |
| Expenses, net of fees waived/expenses reimbursed by investment adviser | | | 2.83 | % | | | 2.76 | % | | | 2.69 | % | | | 2.39 | % | | | 2.24 | %(g) | | 2.29 | % |
| Excluding interest and dividend expense: | | | | | | | | | | | | | | | | | | | | | | | |
| Expenses, gross | | | 2.06 | % | | | 2.20 | % | | | 2.20 | % | | | 2.38 | % | | | 3.05 | %(g) | | 4.51 | % |
| Expenses, net of fees waived/expenses reimbursed by investment adviser | | | 1.99 | % | | | 1.99 | % | | | 1.99 | % | | | 1.99 | % | | | 1.99 | %(g) | | 1.99 | % |
| Net investment income(c) | | | 3.83 | % | | | 2.97 | % | | | 3.81 | % | | | 3.47 | % | | | 3.57 | %(g) | | 3.21 | % |
| | | | | | | | | | | | | | | | | | | | | | | | | |
| PORTFOLIO TURNOVER RATE | | | 65 | % | | | 78 | % | | | 11 | % | | | 21 | % | | | 5 | %(h) | | 91 | % |
| | | | | | | | | | | | | | | | | | | | | | | | | |
| BORROWINGS AT END OF YEAR OR PERIOD | | | | | | | | | | | | | | | | | | | | | | | | |
| Aggregate amount outstanding (000s) | | $ | 43,482 | | | $ | 48,104 | | | $ | 60,415 | | | $ | 36,821 | | | $ | 12,373 | | | $ | 5,188 | |
| Asset coverage per $1,000 (000s) | | $ | 9,070 | | | $ | 6,515 | | | $ | 4,912 | | | $ | 4,808 | | | $ | 6,249 | | | $ | 7,319 | |
| (a) | With the approval of the Board of Trustees, effective September 30, 2015, the Fund's fiscal year end was changed from February 28 to September 30. |
| (b) | Per share numbers have been calculated using the average shares method. |
| (c) | Recognition of net investment income is affected by timing and declaration of dividends by underlying REITs and private investment funds. |
| (d) | Total returns shown are historical in nature and assume changes in share price, reinvestment of dividends and capital gains distribution, if any. Had the Adviser not absorbed a portion of Fund expenses, total returns would have been lower. Total returns for periods less than one year are not annualized. Returns shown exclude applicable sales charges. |
| (e) | Includes adjustments in accordance with accounting principles generally accepted in the United States of America and, as such, the net asset values for financial reporting purposes and the returns based upon those net asset values may differ from net asset values and returns for shareholder transactions. |
| (f) | Ratios do not include expenses of underlying investment companies and private investment funds in which the Fund invests. |
See Notes to Financial Statements.
| Annual Report | September 30, 2019 | 17 |
| Resource Real Estate Diversified Income Fund – Class C | Financial Highlights |
For a Share Outstanding Throughout the Years or Periods Presented
| | | Year Ended
September 30,
2019 | | | Year Ended
September 30,
2018 | | | Year Ended
September 30,
2017 | | | Year Ended
September 30,
2016 | | | For the Period Ended
September 30,
2015(a) | | For the Period Ended
February 28,
2015(b) |
| NET ASSET VALUE, BEGINNING OF YEAR OR PERIOD | | $ | 10.47 | | | $ | 10.19 | | | $ | 10.25 | | | $ | 9.81 | | | $ | 10.50 | | | $ | 10.06 | |
| | | | | | | | | | | | | | | | | | | | | | | | | |
| INCOME FROM INVESTMENT OPERATIONS | | | | | | | | | | | | | | | | | | | | | | | | |
| Net investment income(c)(d) | | | 0.32 | | | | 0.23 | | | | 0.32 | | | | 0.28 | | | | 0.18 | | | | 0.14 | |
| Net realized and unrealized gain/(loss) on investments | | | 0.41 | | | | 0.57 | | | | 0.18 | | | | 0.68 | | | | (0.48 | ) | | | 0.58 | |
| Total income/(loss) from investment operations | | | 0.73 | | | | 0.80 | | | | 0.50 | | | | 0.96 | | | | (0.30 | ) | | | 0.72 | |
| DISTRIBUTIONS TO SHAREHOLDERS | | | | | | | | | | | | | | | | | | | | | | | | |
| From net investment income | | | (0.22 | ) | | | (0.20 | ) | | | (0.27 | ) | | | (0.27 | ) | | | (0.14 | ) | | | (0.20 | ) |
| From net realized gain on investments | | | (0.18 | ) | | | (0.14 | ) | | | (0.12 | ) | | | – | | | | (0.03 | ) | | | (0.05 | ) |
| From return of capital | | | (0.12 | ) | | | (0.18 | ) | | | (0.17 | ) | | | (0.25 | ) | | | (0.22 | ) | | | (0.03 | ) |
| Total distributions | | | (0.52 | ) | | | (0.52 | ) | | | (0.56 | ) | | | (0.52 | ) | | | (0.39 | ) | | | (0.28 | ) |
| INCREASE/DECREASE IN NET ASSET VALUE | | | 0.21 | | | | 0.28 | | | | (0.06 | ) | | | 0.44 | | | | (0.69 | ) | | | 0.44 | |
| NET ASSET VALUE, END OF YEAR OR PERIOD | | $ | 10.68 | | | $ | 10.47 | | | $ | 10.19 | | | $ | 10.25 | | | $ | 9.81 | | | $ | 10.50 | |
| TOTAL RETURN(e)(f) | | | 7.24 | % | | | 8.17 | % | | | 4.97 | % | | | 10.15 | % | | | (2.86 | )% | | | 7.33 | % |
| | | | | | | | | | | | | | | | | | | | | | | | | |
| RATIOS AND SUPPLEMENTAL DATA | | | | | | | | | | | | | | | | | | | | | | | | |
| Net assets, end of year or period (in 000s) | | $ | 74,609 | | | $ | 62,367 | | | $ | 57,559 | | | $ | 33,114 | | | $ | 13,436 | | | $ | 3,732 | |
| | | | | | | | | | | | | | | | | | | | | | | | | |
| RATIOS TO AVERAGE NET ASSETS(g) | | | | | | | | | | | | | | | | | | | | | | | | |
| Including interest and dividend expense: | | | | | | | | | | | | | | | | | | | | | | | | |
| Expenses, gross | | | 3.64 | % | | | 3.73 | % | | | 3.71 | % | | | 3.53 | % | | | 4.04 | %(h) | | | 6.37 | %(h) |
| Expenses, net of fees waived/expenses reimbursed by investment adviser | | | 3.58 | % | | | 3.51 | % | | | 3.47 | % | | | 3.14 | % | | | 2.99 | %(h) | | | 3.04 | %(h) |
| Excluding interest and dividend expense: | | | | | | | | | | | | | | | | | | | | | | | | |
| Expenses, gross | | | 2.80 | % | | | 2.96 | % | | | 2.98 | % | | | 3.13 | % | | | 3.79 | %(h) | | | 6.07 | %(h) |
| Expenses, net of fees waived/expenses reimbursed by investment adviser | | | 2.74 | % | | | 2.74 | % | | | 2.74 | % | | | 2.74 | % | | | 2.74 | %(h) | | | 2.74 | %(h) |
| Net investment income(d) | | | 3.08 | % | | | 2.24 | % | | | 3.11 | % | | | 2.87 | % | | | 2.97 | %(h) | | | 2.34 | %(h) |
| | | | | | | | | | | | | | | | | | | | | | | | | |
| PORTFOLIO TURNOVER RATE | | | 65 | % | | | 78 | % | | | 11 | % | | | 21 | % | | | 5 | %(i) | | | 91 | % |
| | | | | | | | | | | | | | | | | | | | | | | | | |
| BORROWINGS AT END OF YEAR OR PERIOD | | | | | | | | | | | | | | | | | | | | | | | | |
| Aggregate amount outstanding (000s) | | $ | 43,482 | | | $ | 48,104 | | | $ | 60,415 | | | $ | 36,821 | | | $ | 12,373 | | | $ | 5,188 | |
| Asset coverage per $1,000 (000s) | | $ | 9,070 | | | $ | 6,515 | | | $ | 4,912 | | | $ | 4,808 | | | $ | 6,249 | | | $ | 7,319 | |
| (a) | With the approval of the Board of Trustees, effective September 30, 2015, the Fund's fiscal year end was changed from February 28 to September 30. |
| (b) | The Fund's Class C commenced operations on August 1, 2014. |
| (c) | Per share numbers have been calculated using the average shares method. |
| (d) | Recognition of net investment income is affected by timing and declaration of dividends by underlying REITs and private investment funds. |
| (e) | Total returns shown are historical in nature and assume changes in share price, reinvestment of dividends and capital gains distribution, if any. Had the Adviser not absorbed a portion of Fund expenses, total returns would have been lower. Total returns for periods less than one year are not annualized. |
| (f) | Includes adjustments in accordance with accounting principles generally accepted in the United States of America and, as such, the net asset values for financial reporting purposes and the returns based upon those net asset values may differ from net asset values and returns for shareholder transactions. |
| (g) | Ratios do not include expenses of underlying investment companies and private investment funds in which the Fund invests. |
See Notes to Financial Statements.
| Resource Real Estate Diversified Income Fund – Class W | Financial Highlights |
For a Share Outstanding Throughout the Years or Periods Presented
| | | Year Ended September 30, 2019 | | | Year Ended September 30, 2018 | | | Year Ended September 30, 2017 | | | Year Ended September 30, 2016 | | | For the Period Ended September 30, 2015(a) | | For the Period Ended February 28, 2015(b) |
| NET ASSET VALUE, BEGINNING OF YEAR OR PERIOD | | $ | 10.63 | | | $ | 10.35 | | | $ | 10.41 | | | $ | 9.96 | | | $ | 10.67 | | | $ | 10.18 | |
| | | | | | | | | | | | | | | | | | | | | | | | | |
| INCOME FROM INVESTMENT OPERATIONS | | | | | | | | | | | | | | | | | | | | | | | | |
| Net investment income(c)(d) | | | 0.41 | | | | 0.31 | | | | 0.39 | | | | 0.32 | | | | 0.20 | | | | 0.03 | |
| Net realized and unrealized gain/(loss) on investments | | | 0.42 | | | | 0.58 | | | | 0.17 | | | | 0.69 | | | | (0.49 | ) | | | 0.46 | |
| Total income/(loss) from investment operations | | | 0.83 | | | | 0.89 | | | | 0.56 | | | | 1.01 | | | | (0.29 | ) | | | 0.49 | |
| | | | | | | | | | | | | | | | | | | | | | | | | |
| DISTRIBUTIONS TO SHAREHOLDERS | | | | | | | | | | | | | | | | | | | | | | | | |
| From net investment income | | | (0.26 | ) | | | (0.23 | ) | | | (0.30 | ) | | | (0.30 | ) | | | (0.15 | ) | | | – | |
| From net realized gain on investments | | | (0.21 | ) | | | (0.16 | ) | | | (0.12 | ) | | | – | | | | (0.03 | ) | | | – | |
| From return of capital | | | (0.14 | ) | | | (0.22 | ) | | | (0.20 | ) | | | (0.26 | ) | | | (0.24 | ) | | | – | |
| Total distributions | | | (0.61 | ) | | | (0.61 | ) | | | (0.62 | ) | | | (0.56 | ) | | | (0.42 | ) | | | – | |
| INCREASE/DECREASE IN NET ASSET VALUE | | | 0.22 | | | | 0.28 | | | | (0.06 | ) | | | 0.45 | | | | (0.71 | ) | | | 0.49 | |
| NET ASSET VALUE, END OF YEAR OR PERIOD | | $ | 10.85 | | | $ | 10.63 | | | $ | 10.35 | | | $ | 10.41 | | | $ | 9.96 | | | $ | 10.67 | |
| TOTAL RETURN(e)(f) | | | 8.13 | % | | | 8.95 | % | | | 5.64 | % | | | 10.46 | % | | | (2.79 | )% | | | 4.81 | % |
| | | | | | | | | | | | | | | | | | | | | | | | | |
| RATIOS AND SUPPLEMENTAL DATA | | | | | | | | | | | | | | | | | | | | | | | | |
| Net assets, end of year or period (in 000s) | | $ | 92,006 | | | $ | 69,400 | | | $ | 56,427 | | | $ | 31,076 | | | $ | 11,421 | | | $ | 1,211 | |
| | | | | | | | | | | | | | | | | | | | | | | | | |
| RATIOS TO AVERAGE NET ASSETS(g) | | | | | | | | | | | | | | | | | | | | | | | | |
| Including interest and dividend expense: | | | | | | | | | | | | | | | | | | | | | | | | |
| Expenses, gross | | | 2.88 | % | | | 2.96 | % | | | 3.06 | % | | | 3.30 | % | | | 3.78 | %(h) | | | 11.30 | %(h) |
| Expenses, net of fees waived/expenses reimbursed by investment adviser | | | 2.84 | % | | | 2.76 | % | | | 2.83 | %(i) | | 2.89 | % | | | 2.74 | %(h) | | | 2.79 | %(h) |
| Excluding interest and dividend expense: | | | | | | | | | | | | | | | | | | | | | | | | |
| Expenses, gross | | | 2.03 | % | | | 2.19 | % | | | 2.32 | % | | | 2.90 | % | | | 3.53 | %(h) | | 11.00 | %(h) |
| Expenses, net of fees waived/expenses reimbursed by investment adviser | | | 1.99 | % | | | 1.99 | % | | | 2.09 | %(i) | | 2.49 | % | | | 2.49 | %(h) | | | 2.49 | %(h) |
| Net investment income(d) | | | 3.85 | % | | | 3.01 | % | | | 3.79 | % | | | 3.17 | % | | | 3.28 | %(h) | | 1.31 | %(h) |
| | | | | | | | | | | | | | | | | | | | | | | | | |
| PORTFOLIO TURNOVER RATE | | | 65 | % | | | 78 | % | | | 11 | % | | | 21 | % | | | 5 | %(j) | | | 91 | % |
| | | | | | | | | | | | | | | | | | | | | | | | | |
| BORROWINGS AT END OF YEAR OR PERIOD | | | | | | | | | | | | | | | | | | | | | | | | |
| Aggregate amount outstanding (000s) | | $ | 43,482 | | | $ | 48,104 | | | $ | 60,415 | | | $ | 36,821 | | | $ | 12,373 | | | $ | 5,188 | |
| Asset coverage per $1,000 (000s) | | $ | 9,070 | | | $ | 6,515 | | | $ | 4,912 | | | $ | 4,808 | | | $ | 6,249 | | | $ | 7,319 | |
| (a) | With the approval of the Board of Trustees, effective September 30, 2015, the Fund's fiscal year end was changed from February 28 to September 30. |
| (b) | The Fund's Class W commenced operations on November 24, 2014. |
| (c) | Per share numbers have been calculated using the average shares method. |
| (d) | Recognition of net investment income is affected by timing and declaration of dividends by underlying REITs and private investment funds. |
| (e) | Total returns shown are historical in nature and assume changes in share price, reinvestment of dividends and capital gains distribution, if any. Had the Adviser not absorbed a portion of Fund expenses, total returns would have been lower. Total returns for periods less than one year are not annualized. |
| (f) | Includes adjustments in accordance with accounting principles generally accepted in the United States of America and, as such, the net asset values for financial reporting purposes and the returns based upon those net asset values may differ from net asset values and returns for shareholder transactions. |
| (g) | Ratios do not include expenses of underlying investment companies and private investment funds in which the Fund invests. |
| (i) | Effective January 5, 2017, the annual expense limitation changed from 2.49% to 1.99%. |
See Notes to Financial Statements.
| Annual Report | September 30, 2019 | 19 |
| Resource Real Estate Diversified Income Fund – Class I | Financial Highlights |
For a Share Outstanding Throughout the Years or Periods Presented
| | | Year Ended
September 30,
2019 | | | Year Ended
September 30,
2018 | | | Year Ended
September 30,
2017 | | | Year Ended
September 30,
2016 | | | For the Period Ended
September 30,
2015(a) | | For the Period Ended
February 28,
2015(b) |
| NET ASSET VALUE, BEGINNING OF YEAR OR PERIOD | | $ | 10.91 | | | $ | 10.62 | | | $ | 10.74 | | | $ | 10.36 | | | $ | 10.79 | | | $ | 10.06 | |
| | | | | | | | | | | | | | | | | | | | | | | | | |
| INCOME FROM INVESTMENT OPERATIONS | | | | | | | | | | | | | | | | | | | | | | | | |
| Net investment income(c)(d) | | | 0.45 | | | | 0.36 | | | | 0.48 | | | | 0.04 | | | | 0.27 | | | | 0.14 | |
| Net realized and unrealized gain/(loss) on investments | | | 0.42 | | | | 0.59 | | | | 0.09 | | | | 0.97 | | | | (0.54 | ) | | | 0.59 | |
| Total income/(loss) from investment operations | | | 0.87 | | | | 0.95 | | | | 0.57 | | | | 1.01 | | | | (0.27 | ) | | | 0.73 | |
| | | | | | | | | | | | | | | | | | | | | | | | | |
| DISTRIBUTIONS TO SHAREHOLDERS | | | | | | | | | | | | | | | | | | | | | | | | |
| From net investment income | | | (0.27 | ) | | | (0.26 | ) | | | (0.34 | ) | | | (0.33 | ) | | | (0.04 | ) | | | – | |
| From net realized gain on investments | | | (0.23 | ) | | | (0.16 | ) | | | (0.12 | ) | | | – | | | | (0.03 | ) | | | – | |
| From return of capital | | | (0.15 | ) | | | (0.24 | ) | | | (0.23 | ) | | | (0.30 | ) | | | (0.09 | ) | | | – | |
| Total distributions | | | (0.65 | ) | | | (0.66 | ) | | | (0.69 | ) | | | (0.63 | ) | | | (0.16 | ) | | | – | |
| INCREASE/DECREASE IN NET ASSET VALUE | | | 0.22 | | | | 0.29 | | | | (0.12 | ) | | | 0.38 | | | | (0.43 | ) | | | 0.73 | |
| NET ASSET VALUE, END OF YEAR OR PERIOD | | $ | 11.13 | | | $ | 10.91 | | | $ | 10.62 | | | $ | 10.74 | | | $ | 10.36 | | | $ | 10.79 | |
| TOTAL RETURN(e)(f) | | | 8.35 | % | | | 9.25 | % | | | 5.45 | % | | | 10.12 | % | | | (2.51 | )% | | | 7.26 | % |
| | | | | | | | | | | | | | | | | | | | | | | | | |
| RATIOS AND SUPPLEMENTAL DATA | | | | | | | | | | | | | | | | | | | | | | | | |
| Net assets, end of year or period (in 000s) | | $ | 55,138 | | | $ | 22,273 | | | $ | 8,385 | | | $ | 0 | (g) | | $ | 49 | | | $ | 0 | (g) |
| | | | | | | | | | | | | | | | | | | | | | | | | |
| RATIOS TO AVERAGE NET ASSETS(h) | | | | | | | | | | | | | | | | | | | | | | | | |
| Including interest and dividend expense: | | | | | | | | | | | | | | | | | | | | | | | | |
| Expenses, gross | | | 2.68 | % | | | 2.75 | % | | | 3.23 | % | | | 2.49 | % | | | 2.96 | %(i) | | | 3.94 | %(i) |
| Expenses, net of fees waived/expenses reimbursed by investment adviser | | | 2.63 | % | | | 2.49 | % | | | 2.56 | % | | | 2.14 | % | | | 1.99 | %(i) | | | 2.08 | %(i) |
| Excluding interest and dividend expense: | | | | | | | | | | | | | | | | | | | | | | | | |
| Expenses, gross | | | 1.79 | % | | | 2.00 | % | | | 2.41 | % | | | 2.09 | % | | | 2.71 | %(i) | | | 3.60 | %(i) |
| Expenses, net of fees waived/expenses reimbursed by investment adviser | | | 1.74 | % | | | 1.74 | % | | | 1.74 | % | | | 1.74 | % | | | 1.74 | %(i) | | | 1.74 | %(i) |
| Net investment income(d) | | | 4.10 | % | | | 3.35 | % | | | 4.48 | % | | | 0.36 | % | | | 4.46 | %(i) | | | 2.36 | %(i) |
| | | | | | | | | | | | | | | | | | | | | | | | | |
| PORTFOLIO TURNOVER RATE | | | 65 | % | | | 78 | % | | | 11 | % | | | 21 | % | | | 5 | %(j) | | | 91 | % |
| | | | | | | | | | | | | | | | | | | | | | | | | |
| BORROWINGS AT END OF YEAR OR PERIOD | | | | | | | | | | | | | | | | | | | | | | | | |
| Aggregate amount outstanding (000s) | | $ | 43,482 | | | $ | 48,104 | | | $ | 60,415 | | | $ | 36,821 | | | $ | 12,373 | | | $ | 5,188 | |
| Asset coverage per $1,000 (000s) | | $ | 9,070 | | | $ | 6,515 | | | $ | 4,912 | | | $ | 4,808 | | | $ | 6,249 | | | $ | 7,319 | |
| (a) | With the approval of the Board of Trustees, effective September 30, 2015, the Fund's fiscal year end was changed from February 28 to September 30. |
| (b) | The Fund's Class I commenced operations on August 1, 2014. |
| (c) | Per share numbers have been calculated using the average shares method. |
| (d) | Recognition of net investment income is affected by timing and declaration of dividends by underlying REITs and private investment funds. |
| (e) | Total returns shown are historical in nature and assume changes in share price, reinvestment of dividends and capital gains distribution, if any. Had the Adviser not absorbed a portion of Fund expenses, total returns would have been lower. Total returns for periods less than one year are not annualized. |
| (f) | Includes adjustments in accordance with accounting principles generally accepted in the United States of America and, as such, the net asset values for financial reporting purposes and the returns based upon those net asset values may differ from net asset values and returns for shareholder transactions. |
| (g) | Amount less than $500. |
| (h) | Ratios do not include expenses of underlying investment companies and private investment funds in which the Fund invests. |
See Notes to Financial Statements.
| Resource Real Estate Diversified Income Fund – Class U | Financial Highlights |
For a Share Outstanding Throughout the Years or Periods Presented
| | | Year Ended
September 30,
2019 | | | Year Ended
September 30,
2018 | | | Year Ended
September 30,
2017 | | | Year Ended
September 30,
2016 | | | For the Period Ended
September 30,
2015(a) | | For the Period Ended
February 28,
2015(b) |
| NET ASSET VALUE, BEGINNING OF YEAR OR PERIOD | | $ | 10.48 | | | $ | 10.20 | | | $ | 10.26 | | | $ | 9.82 | | | $ | 10.52 | | | $ | 10.57 | |
| | | | | | | | | | | | | | | | | | | | | | | | | |
| INCOME FROM INVESTMENT OPERATIONS | | | | | | | | | | | | | | | | | | | | | | | | |
| Net investment income(c)(d) | | | 0.40 | | | | 0.30 | | | | 0.39 | | | | 0.50 | | | | 0.27 | | | | 0.00 | (e) |
| Net realized and unrealized gain/(loss) on investments | | | 0.42 | | | | 0.58 | | | | 0.18 | | | | 0.54 | | | | (0.52 | ) | | | (0.05 | ) |
| Total income/(loss) from investment operations | | | 0.82 | | | | 0.88 | | | | 0.57 | | | | 1.04 | | | | (0.25 | ) | | | (0.05 | ) |
| | | | | | | | | | | | | | | | | | | | | | | | | |
| DISTRIBUTIONS TO SHAREHOLDERS | | | | | | | | | | | | | | | | | | | | | | | | |
| From net investment income | | | (0.26 | ) | | | (0.24 | ) | | | (0.31 | ) | | | (0.32 | ) | | | (0.17 | ) | | | – | |
| From net realized gain on investments | | | (0.21 | ) | | | (0.15 | ) | | | (0.12 | ) | | | – | | | | (0.03 | ) | | | – | |
| From return of capital | | | (0.13 | ) | | | (0.21 | ) | | | (0.20 | ) | | | (0.28 | ) | | | (0.25 | ) | | | – | |
| Total distributions | | | (0.60 | ) | | | (0.60 | ) | | | (0.63 | ) | | | (0.60 | ) | | | (0.45 | ) | | | – | |
| EARLY WITHDRAWAL CHARGE ADDED TO PAID-IN CAPITAL | | | 0.00 | | | | 0.00 | | | | 0.00 | (e) | | | 0.00 | | | | 0.00 | | | | 0.00 | |
| INCREASE/DECREASE IN NET ASSET VALUE | | | 0.22 | | | | 0.28 | | | | (0.06 | ) | | | 0.44 | | | | (0.70 | ) | | | (0.05 | ) |
| NET ASSET VALUE, END OF YEAR OR PERIOD | | $ | 10.70 | | | $ | 10.48 | | | $ | 10.20 | | | $ | 10.26 | | | $ | 9.82 | | | $ | 10.52 | |
| TOTAL RETURN(f)(g) | | | 8.16 | % | | | 8.99 | % | | | 5.76 | % | | | 10.98 | % | | | (2.40 | )% | | | (0.47 | )% |
| | | | | | | | | | | | | | | | | | | | | | | | | |
| RATIOS AND SUPPLEMENTAL DATA | | | | | | | | | | | | | | | | | | | | | | | | |
| Net assets, end of year or period (in 000s) | | $ | 9,375 | | | $ | 11,424 | | | $ | 11,971 | | | $ | 5,766 | | | $ | 61 | | | $ | 2 | |
| | | | | | | | | | | | | | | | | | | | | | | | | |
| RATIOS TO AVERAGE NET ASSETS(h) | | | | | | | | | | | | | | | | | | | | | | | | |
| Including interest and dividend expense: | | | | | | | | | | | | | | | | | | | | | | | | |
| Expenses, gross | | | 2.85 | % | | | 2.95 | % | | | 2.93 | % | | | 2.78 | % | | | 3.42 | %(i) | | 7.74 | %(i) |
| Expenses, net of fees waived/expenses reimbursed by investment adviser | | | 2.81 | % | | | 2.76 | % | | | 2.73 | % | | | 2.39 | % | | | 2.24 | %(i) | | 2.28 | %(i) |
| Excluding interest and dividend expense: | | | | | | | | | | | | | | | | | | | | | | | | |
| Expenses, gross | | | 2.03 | % | | | 2.18 | % | | | 2.19 | % | | | 2.38 | % | | | 3.17 | %(i) | | 7.45 | %(i) |
| Expenses, net of fees waived/expenses reimbursed by investment adviser | | | 1.99 | % | | | 1.99 | % | | | 1.99 | % | | | 1.99 | % | | | 1.99 | %(i) | | 1.99 | %(i) |
| Net investment income(d) | | | 3.85 | % | | | 2.95 | % | | | 3.82 | % | | | 5.00 | % | | | 4.64 | %(i) | | 0.97 | %(i) |
| | | | | | | | | | | | | | | | | | | | | | | | | |
| PORTFOLIO TURNOVER RATE | | | 65 | % | | | 78 | % | | | 11 | % | | | 21 | % | | | 5 | %(j) | | 91 | % |
| | | | | | | | | | | | | | | | | | | | | | | | | |
| BORROWINGS AT END OF YEAR OR PERIOD | | | | | | | | | | | | | | | | | | | | | | | | |
| Aggregate amount outstanding (000s) | | $ | 43,482 | | | $ | 48,104 | | | $ | 60,415 | | | $ | 36,821 | | | $ | 12,373 | | | $ | 5,188 | |
| Asset coverage per $1,000 (000s) | | $ | 9,070 | | | $ | 6,515 | | | $ | 4,912 | | | $ | 4,808 | | | $ | 6,249 | | | $ | 7,319 | |
| (a) | With the approval of the Board of Trustees, effective September 30, 2015, the Fund's fiscal year end was changed from February 28 to September 30. |
| (b) | The Fund's Class U commenced operations on February 13, 2015. |
| (c) | Per share numbers have been calculated using the average shares method. |
| (d) | Recognition of net investment income is affected by timing and declaration of dividends by underlying REITs and private investment funds. |
| (e) | Amount is less than $0.005. |
| (f) | Total returns shown are historical in nature and assume changes in share price, reinvestment of dividends and capital gains distribution, if any. Had the Adviser not absorbed a portion of Fund expenses, total returns would have been lower. Total returns for periods less than one year are not annualized. Returns shown exclude applicable sales charges. |
| (g) | Includes adjustments in accordance with accounting principles generally accepted in the United States of America and, as such, the net asset values for financial reporting purposes and the returns based upon those net asset values may differ from net asset values and returns for shareholder transactions. |
| (h) | Ratios do not include expenses of underlying investment companies and private investment funds in which the Fund invests. |
See Notes to Financial Statements.
| Annual Report | September 30, 2019 | 21 |
| Resource Real Estate Diversified Income Fund – Class T | Financial Highlights |
For a Share Outstanding Throughout the Years or Periods Presented
| | | Year Ended
September 30,
2019 | | | Year Ended
September 30,
2018 | | | Year Ended
September 30,
2017 | | | Year Ended
September 30,
2016 | | | For the Period Ended
September 30,
2015(a) | | For the Period Ended
February 28,
2015(b) |
| NET ASSET VALUE, BEGINNING OF YEAR OR PERIOD | | $ | 10.45 | | | $ | 10.17 | | | $ | 10.23 | | | $ | 9.80 | | | $ | 10.50 | | | $ | 10.55 | |
| | | | | | | | | | | | | | | | | | | | | | | | | |
| INCOME FROM INVESTMENT OPERATIONS | | | | | | | | | | | | | | | | | | | | | | | | |
| Net investment income(c)(d) | | | 0.33 | | | | 0.22 | | | | 0.31 | | | | 0.33 | | | | 0.22 | | | | 0.00 | (e) |
| Net realized and unrealized gain/(loss) on investments | | | 0.41 | | | | 0.58 | | | | 0.19 | | | | 0.62 | | | | (0.53 | ) | | | (0.05 | ) |
| Total income/(loss) from investment operations | | | 0.74 | | | | 0.80 | | | | 0.50 | | | | 0.95 | | | | (0.31 | ) | | | (0.05 | ) |
| | | | | | | | | | | | | | | | | | | | | | | | | |
| DISTRIBUTIONS TO SHAREHOLDERS | | | | | | | | | | | | | | | | | | | | | | | | |
| From net investment income | | | (0.22 | ) | | | (0.20 | ) | | | (0.27 | ) | | | (0.27 | ) | | | (0.14 | ) | | | – | |
| From net realized gain on investments | | | (0.18 | ) | | | (0.14 | ) | | | (0.12 | ) | | | – | | | | (0.03 | ) | | | – | |
| From return of capital | | | (0.12 | ) | | | (0.18 | ) | | | (0.17 | ) | | | (0.25 | ) | | | (0.22 | ) | | | – | |
| Total distributions | | | (0.52 | ) | | | (0.52 | ) | | | (0.56 | ) | | | (0.52 | ) | | | (0.39 | ) | | | – | |
| EARLY WITHDRAWAL CHARGE ADDED TO PAID-IN CAPITAL | | | 0.00 | | | | 0.00 | | | | 0.00 | (e) | | | 0.00 | | | | 0.00 | | | | 0.00 | |
| INCREASE/DECREASE IN NET ASSET VALUE | | | 0.22 | | | | 0.28 | | | | (0.06 | ) | | | 0.43 | | | | (0.70 | ) | | | (0.05 | ) |
| NET ASSET VALUE, END OF YEAR OR PERIOD | | $ | 10.67 | | | $ | 10.45 | | | $ | 10.17 | | | $ | 10.23 | | | $ | 9.80 | | | $ | 10.50 | |
| TOTAL RETURN(f)(g) | | | 7.35 | % | | | 8.18 | % | | | 4.97 | % | | | 10.05 | % | | | (2.96 | )% | | | (0.47 | )% |
| | | | | | | | | | | | | | | | | | | | | | | | | |
| RATIOS AND SUPPLEMENTAL DATA | | | | | | | | | | | | | | | | | | | | | | | | |
| Net assets, end of year or period (in 000s) | | $ | 7,079 | | | $ | 5,542 | | | $ | 5,983 | | | $ | 3,187 | | | $ | 447 | | | $ | 2 | |
| | | | | | | | | | | | | | | | | | | | | | | | | |
| RATIOS TO AVERAGE NET ASSETS(h) | | | | | | | | | | | | | | | | | | | | | | | | |
| Including interest and dividend expense: | | | | | | | | | | | | | | | | | | | | | | | | |
| Expenses, gross | | | 3.64 | % | | | 3.71 | % | | | 3.69 | % | | | 3.51 | % | | | 4.10 | %(i) | | | 8.49 | %(i) |
| Expenses, net of fees waived/expenses reimbursed by investment adviser | | | 3.61 | % | | | 3.51 | % | | | 3.48 | % | | | 3.14 | % | | | 2.99 | %(i) | | | 3.03 | %(i) |
| Excluding interest and dividend expense: | | | | | | | | | | | | | | | | | | | | | | | | |
| Expenses, gross | | | 2.77 | % | | | 2.94 | % | | | 2.95 | % | | | 3.11 | % | | | 3.85 | %(i) | | | 8.20 | %(i) |
| Expenses, net of fees waived/expenses reimbursed by investment adviser | | | 2.74 | % | | | 2.74 | % | | | 2.74 | % | | | 2.74 | % | | | 2.74 | %(i) | | | 2.74 | %(i) |
| Net investment income(d) | | | 3.12 | % | | | 2.19 | % | | | 3.07 | % | | | 3.31 | % | | | 3.87 | %(i) | | | 0.22 | %(i) |
| | | | | | | | | | | | | | | | | | | | | | | | | |
| PORTFOLIO TURNOVER RATE | | | 65 | % | | | 78 | % | | | 11 | % | | | 21 | % | | | 5 | %(j) | | | 91 | % |
| | | | | | | | | | | | | | | | | | | | | | | | | |
| BORROWINGS AT END OF YEAR OR PERIOD | | | | | | | | | | | | | | | | | | | | | | | | |
| Aggregate amount outstanding (000s) | | $ | 43,482 | | | $ | 48,104 | | | $ | 60,415 | | | $ | 36,821 | | | $ | 12,373 | | | $ | 5,188 | |
| Asset coverage per $1,000 (000s) | | $ | 9,070 | | | $ | 6,515 | | | $ | 4,912 | | | $ | 4,808 | | | $ | 6,249 | | | $ | 7,319 | |
| (a) | With the approval of the Board of Trustees, effective September 30, 2015, the Fund's fiscal year end was changed from February 28 to September 30. |
| (b) | The Fund's Class T commenced operations on February 13, 2015. |
| (c) | Per share numbers have been calculated using the average shares method. |
| (d) | Recognition of net investment income is affected by timing and declaration of dividends by underlying REITs and private investment funds. |
| (e) | Amount is less than $0.005. |
| (f) | Total returns shown are historical in nature and assume changes in share price, reinvestment of dividends and capital gains distribution, if any. Had the Adviser not absorbed a portion of Fund expenses, total returns would have been lower. Total returns for periods less than one year are not annualized. Returns shown exclude applicable sales charges. |
| (g) | Includes adjustments in accordance with accounting principles generally accepted in the United States of America and, as such, the net asset values for financial reporting purposes and the returns based upon those net asset values may differ from net asset values and returns for shareholder transactions. |
| (h) | Ratios do not include expenses of underlying investment companies and private investment funds in which the Fund invests. |
See Notes to Financial Statements.
| Resource Real Estate Diversified Income Fund – Class D | Financial Highlights |
For a Share Outstanding Throughout the Years or Periods Presented
| | | Year Ended
September 30,
2019 | | | Year Ended
September 30,
2018 | | | Year Ended
September 30,
2017 | | | Year Ended
September 30,
2016 | | | For the Period Ended
September 30,
2015(a) | | For the Period Ended
February 28,
2015(b) |
| NET ASSET VALUE, BEGINNING OF YEAR OR PERIOD | | $ | 10.64 | | | $ | 10.35 | | | $ | 10.41 | | | $ | 9.97 | | | $ | 10.67 | | | $ | 10.72 | |
| | | | | | | | | | | | | | | | | | | | | | | | | |
| INCOME FROM INVESTMENT OPERATIONS | | | | | | | | | | | | | | | | | | | | | | | | |
| Net investment income(c)(d) | | | 0.35 | | | | 0.24 | | | | 0.35 | | | | 0.31 | | | | 0.24 | | | | 0.00 | (e) |
| Net realized and unrealized gain/(loss) on investments | | | 0.42 | | | | 0.61 | | | | 0.17 | | | | 0.69 | | | | (0.52 | ) | | | (0.05 | ) |
| Total income/(loss) from investment operations | | | 0.77 | | | | 0.85 | | | | 0.52 | | | | 1.00 | | | | (0.28 | ) | | | (0.05 | ) |
| | | | | | | | | | | | | | | | | | | | | | | | | |
| DISTRIBUTIONS TO SHAREHOLDERS | | | | | | | | | | | | | | | | | | | | | | | | |
| From net investment income | | | (0.25 | ) | | | (0.21 | ) | | | (0.28 | ) | | | (0.30 | ) | | | (0.15 | ) | | | – | |
| From net realized gain on investments | | | (0.19 | ) | | | (0.15 | ) | | | (0.12 | ) | | | – | | | | (0.03 | ) | | | – | |
| From return of capital | | | (0.12 | ) | | | (0.20 | ) | | | (0.18 | ) | | | (0.26 | ) | | | (0.24 | ) | | | – | |
| Total distributions | | | (0.56 | ) | | | (0.56 | ) | | | (0.58 | ) | | | (0.56 | ) | | | (0.42 | ) | | | – | |
| INCREASE/DECREASE IN NET ASSET VALUE | | | 0.21 | | | | 0.29 | | | | (0.06 | ) | | | 0.44 | | | | (0.70 | ) | | | (0.05 | ) |
| NET ASSET VALUE, END OF YEAR OR PERIOD | | $ | 10.85 | | | $ | 10.64 | | | $ | 10.35 | | | $ | 10.41 | | | $ | 9.97 | | | $ | 10.67 | |
| TOTAL RETURN(f)(g) | | | 7.48 | % | | | 8.50 | % | | | 5.24 | % | | | 10.35 | % | | | (2.69 | )% | | | (0.47 | )% |
| | | | | | | | | | | | | | | | | | | | | | | | | |
| RATIOS AND SUPPLEMENTAL DATA | | | | | | | | | | | | | | | | | | | | | | | | |
| Net assets, end of year or period (in 000s) | | $ | 6,176 | | | $ | 6,725 | | | $ | 10,645 | | | $ | 5,605 | | | $ | 2,131 | | | $ | 2 | |
| | | | | | | | | | | | | | | | | | | | | | | | | |
| RATIOS TO AVERAGE NET ASSETS(h) | | | | | | | | | | | | | | | | | | | | | | | | |
| Including interest and dividend expense: | | | | | | | | | | | | | | | | | | | | | | | | |
| Expenses, gross | | | 3.31 | % | | | 3.38 | % | | | 3.45 | % | | | 3.25 | % | | | 3.85 | %(i) | | | 8.19 | %(i) |
| Expenses, net of fees waived/expenses reimbursed by investment adviser | | | 3.31 | % | | | 3.27 | % | | | 3.23 | % | | | 2.89 | % | | | 2.74 | %(i) | | | 2.78 | %(i) |
| Excluding interest and dividend expense: | | | | | | | | | | | | | | | | | | | | | | | | |
| Expenses, gross | | | 2.49 | % | | | 2.60 | % | | | 2.71 | % | | | 2.85 | % | | | 3.60 | %(i) | | | 7.90 | %(i) |
| Expenses, net of fees waived/expenses reimbursed by investment adviser | | | 2.49 | % | | | 2.49 | % | | | 2.49 | % | | | 2.49 | % | | | 2.49 | %(i) | | | 2.49 | %(i) |
| Net investment income(d) | | | 3.32 | % | | | 2.35 | % | | | 3.40 | % | | | 3.12 | % | | | 4.13 | %(i) | | | 0.47 | %(i) |
| | | | | | | | | | | | | | | | | | | | | | | | | |
| PORTFOLIO TURNOVER RATE | | | 65 | % | | | 78 | % | | | 11 | % | | | 21 | % | | | 5 | %(j) | | | 91 | % |
| | | | | | | | | | | | | | | | | | | | | | | | | |
| BORROWINGS AT END OF YEAR OR PERIOD | | | | | | | | | | | | | | | | | | | | | | | | |
| Aggregate amount outstanding (000s) | | $ | 43,482 | | | $ | 48,104 | | | $ | 60,415 | | | $ | 36,821 | | | $ | 12,373 | | | $ | 5,188 | |
| Asset coverage per $1,000 (000s) | | $ | 9,070 | | | $ | 6,515 | | | $ | 4,912 | | | $ | 4,808 | | | $ | 6,249 | | | $ | 7,319 | |
| (a) | With the approval of the Board of Trustees, effective September 30, 2015, the Fund's fiscal year end was changed from February 28 to September 30. |
| (b) | The Fund's Class D commenced operations on February 13, 2015. |
| (c) | Per share numbers have been calculated using the average shares method. |
| (d) | Recognition of net investment income is affected by timing and declaration of dividends by underlying REITs and private investment funds. |
| (e) | Amount is less than $0.005. |
| (f) | Total returns shown are historical in nature and assume changes in share price, reinvestment of dividends and capital gains distribution, if any. Had the Adviser not absorbed a portion of Fund expenses, total returns would have been lower. Total returns for periods less than one year are not annualized. |
| (g) | Includes adjustments in accordance with accounting principles generally accepted in the United States of America and, as such, the net asset values for financial reporting purposes and the returns based upon those net asset values may differ from net asset values and returns for shareholder transactions. |
| (h) | Ratios do not include expenses of underlying investment companies and private investment funds in which the Fund invests. |
See Notes to Financial Statements.
| Annual Report | September 30, 2019 | 23 |
| Resource Real Estate Diversified Income Fund – Class L | Financial Highlights |
For a Share Outstanding Throughout the Years or Periods Presented
| | | For the Year Ended
September 30, 2019 | | | For the Year Ended
September 30, 2018 | | | For the Period Ended
September 30,
2017(a) | |
| NET ASSET VALUE, BEGINNING OF YEAR OR PERIOD | | $ | 10.48 | | | $ | 10.20 | | | $ | 10.22 | |
| | | | | | | | | | | | | |
| INCOME/(LOSS) FROM INVESTMENT OPERATIONS | | | | | | | | | | | | |
| Net investment income(b)(c) | | | 0.38 | | | | 0.30 | | | | 0.26 | |
| Net realized and unrealized gain/(loss) on investments | | | 0.40 | | | | 0.55 | | | | (0.14 | )(d) |
| Total income from investment operations | | | 0.78 | | | | 0.85 | | | | 0.12 | |
| | | | | | | | | | | | | |
| DISTRIBUTIONS TO SHAREHOLDERS | | | | | | | | | | | | |
| From net investment income | | | (0.24 | ) | | | (0.22 | ) | | | (0.05 | ) |
| From net realized gain on investments | | | (0.20 | ) | | | (0.15 | ) | | | (0.02 | ) |
| From return of capital | | | (0.13 | ) | | | (0.20 | ) | | | (0.07 | ) |
| Total distributions | | | (0.57 | ) | | | (0.57 | ) | | | (0.14 | ) |
| INCREASE/(DECREASE) IN NET ASSET VALUE | | | 0.21 | | | | 0.28 | | | | (0.02 | ) |
| NET ASSET VALUE, END OF YEAR OR PERIOD | | $ | 10.69 | | | $ | 10.48 | | | $ | 10.20 | |
| | | | | | | | | | | | | |
| TOTAL RETURN(e)(f) | | | 7.79 | % | | | 8.72 | % | | | 1.22 | % |
| | | | | | | | | | | | | |
| RATIOS AND SUPPLEMENTAL DATA | | | | | | | | | | | | |
| Net assets, end of year or period (in 000s) | | $ | 10,402 | | | $ | 4,613 | | | $ | 836 | |
| | | | | | | | | | | | | |
| RATIOS TO AVERAGE NET ASSETS(g) | | | | | | | | | | | | |
| Including interest and dividend expense: | | | | | | | | | | | | |
| Expenses, gross | | | 3.17 | % | | | 3.22 | % | | | 3.83 | %(h) |
| Expenses, net of fees waived/expenses reimbursed by investment advisor | | | 3.13 | % | | | 2.99 | % | | | 3.07 | %(h) |
| Excluding interest and dividend expense: | | | | | | | | | | | | |
| Expenses, gross | | | 2.28 | % | | | 2.47 | % | | | 3.00 | %(h) |
| Expenses, net of fees waived/expenses reimbursed by investment advisor | | | 2.24 | % | | | 2.24 | % | | | 2.24 | %(h) |
| Net investment income (c) | | | 3.60 | % | | | 2.91 | % | | | 11.62 | %(h) |
| | | | | | | | | | | | | |
| PORTFOLIO TURNOVER RATE | | | 65 | % | | | 78 | % | | | 11 | %(i) |
| | | | | | | | | | | | | |
| BORROWINGS AT END OF YEAR OR PERIOD | | | | | | | | | | | | |
| Aggregate amount outstanding (000s) | | $ | 43,482 | | | $ | 48,104 | | | $ | 60,415 | |
| Asset coverage per $1,000 (000s) | | $ | 9,070 | | | $ | 6,515 | | | $ | 4,912 | |
| (a) | The Fund's Class L commenced operations on July 10, 2017. |
| (b) | Per share numbers have been calculated using the average shares method. |
| (c) | Recognition of net investment income is affected by timing and declaration of dividends by underlying REITs and private investment funds. |
| (d) | Realized and unrealized losses per share do not correlate to the aggregate of the net realized and unrealized gains on the Statement of Operations for the period ended September 30, 2017, primarily due to the timing of sales and repurchases of the Fund's shares in relation to fluctuating market values for the Fund's portfolio. |
| (e) | Total returns shown are historical in nature and assume changes in share price, reinvestment of dividends and capital gains distribution, if any. Had the Adviser not absorbed a portion of Fund expenses, total returns would have been lower. Total returns for periods less than one year are not annualized. Returns shown exclude applicable sales charges. |
| (f) | Includes adjustments in accordance with accounting principles generally accepted in the United States of America and, as such, the net asset values for financial reporting purposes and the returns based upon those net asset values may differ from net asset values and returns for shareholder transactions. |
| (g) | Ratios do not include expenses of underlying investment companies and private investment funds in which the Fund invests. |
| (i) | Portfolio turnover rate is calculated at the Fund level and represents the year ended September 30, 2017. |
See Notes to Financial Statements.
| Resource Real Estate Diversified Income Fund | Notes to Financial Statements |
September 30, 2019
1. ORGANIZATION
Resource Real Estate Diversified Income Fund (the “Trust” or the “Fund”) was organized as a Delaware statutory trust on August 1, 2012 and is registered under the Investment Company Act of 1940, as amended (the “1940 Act”), as a closed-end management investment company that operates as an interval fund with a continuous offering of Fund shares. The Fund’s investment adviser is Resource Real Estate, LLC (the “Adviser”). The Fund’s investment objectives are to produce income and to achieve capital appreciation with low to moderate volatility and low to moderate correlation to the broader equity markets. The Fund is diversified and pursues its investment objectives by investing, under normal circumstances, at least 80% of assets (defined as net assets plus the amount of any borrowing for investment purposes) in real estate and real estate related industry securities, primarily in income producing equity and debt securities.
The Fund currently offers Class A, Class C, Class W, Class I, Class U, Class T, Class D and Class L shares. Class A shares commenced operations on March 12, 2013; Class C and Class I shares commenced operations on August 1, 2014; Class W shares commenced operations on November 24, 2014; Class U, Class T and Class D shares commenced operations on February 13, 2015; and Class L shares commenced operations on July 10, 2017. Class C, Class W, Class I and Class D shares are offered at net asset value (“NAV”). Class A shares are offered at NAV plus a maximum sales charge of 5.75% and may also be subject to a 0.50% early withdrawal charge, which will be deducted from repurchase proceeds, for shareholders tendering shares fewer than 365 days after the original purchase date, if (i) the original purchase was for amounts of $1 million or more and (ii) the selling broker received the reallowance of the dealer-manager fee. Class U shares are offered at NAV plus a maximum sales charge of 6.50% and may also be subject to a 0.50% early withdrawal charge, which will be deducted from repurchase proceeds, for shareholders tendering shares fewer than 365 days after the original purchase date, if (i) the original purchase was for amounts of $1 million or more and (ii) the selling broker received the reallowance of the dealer-manager fee. Class T shares are offered at NAV plus a maximum sales charge of 1.50% and may also be subject to a 1.00% early withdrawal charge, which will be deducted from repurchase proceeds, for shareholders tendering shares fewer than 365 days after the original purchase date. Class C Shares are subject to a 1.00% early withdrawal charge. Class L shares are offered at NAV plus a maximum sales charge of 4.25%. Each class represents an interest in the same assets of the Fund and classes are identical except for differences in their sales charge structures, ongoing service and distribution charges and early withdrawal fees. All classes of shares have equal voting privileges except that each class has exclusive voting rights with respect to its service and/or distribution plans. The Fund’s income, expenses (other than class-specific distribution fees) and realized and unrealized gains and losses are allocated proportionately each day based upon the relative net assets of each class.
2. SIGNIFICANT ACCOUNTING POLICIES
The following is a summary of significant accounting policies followed by the Fund in preparation of its financial statements. These policies are in conformity with accounting principles generally accepted in the United States of America (“GAAP”). The Fund is considered an investment company for financial reporting purposes under GAAP. The Fund follows the investment company accounting and reporting guidance of the Financial Accounting Standards Board (“FASB”) Accounting Standard Codification (“ASC”) Topic 946 “Financial Services – Investment Companies”, including FASB Accounting Standards Update (“ASU”) 2013-08. The preparation of financial statements requires management to make estimates and assumptions that affect the reported amounts of assets and liabilities and disclosure of contingent assets and liabilities at the date of the financial statements and the reported amounts of income and expenses for the period. Actual results could differ from those estimates.
Securities Valuation – Securities listed on an exchange are valued at the last reported sale price at the close of the regular trading session of the exchange on the business day the value is being determined, or in the case of securities listed on NASDAQ, at the NASDAQ Official Closing Price. In the absence of a sale, such securities shall be valued at the last bid price. Futures are valued based on their daily settlement value. Short-term investments that mature in 60 days or less may be valued at amortized cost, provided such valuations represent fair value.
When price quotations for certain securities are not readily available, or if the available quotations are not believed to be reflective of market value by the Adviser, those securities will be valued at “fair value” as determined in good faith by the Fund’s Fair Value Committee (the “Valuation Committee”) using procedures adopted by and under the supervision of the Fund’s Board of Trustees (the “Board” or “Trustees”). There can be no assurance that the Fund could purchase or sell a portfolio security at the price used to calculate the Fund’s NAV.
Fair valuation procedures may be used to value a substantial portion of the assets of the Fund. The Fund may use the fair value of a security to calculate its NAV when, for example, (1) a portfolio security is not traded in a public market or the principal market in which the security trades is closed, (2) trading in a portfolio security is suspended and not resumed prior to the normal market close, (3) a portfolio security is not traded in significant volume for a substantial period, or (4) the Adviser determines that the quotation or price for a portfolio security provided by a broker-dealer or independent pricing service is inaccurate.
The “fair value” of securities may be difficult to determine and thus judgment plays a greater role in the valuation process. The fair valuation methodology may include or consider the following guidelines, as appropriate: (1) evaluation of all relevant factors, including but not limited to, pricing history, current market level, supply and demand of the respective security; (2) comparison to the values and current pricing of securities that have comparable characteristics; (3) knowledge of historical market information with respect to the security; and (4) other factors relevant to the security which would include, but not be limited to, duration, yield, fundamental analytical data, the Treasury yield curve, and credit quality.
| Annual Report | September 30, 2019 | 25 |
| Resource Real Estate Diversified Income Fund | Notes to Financial Statements |
September 30, 2019
Valuation of Private REITs– The Fund invests a portion of its assets in Private Real Estate Investment Trusts (“Private REITs”). Private REITs report their investment assets at fair value, and report a NAV per share on a calendar quarter basis. In accordance with ASC 820-10, the Fund has elected to apply the practical expedient and to value its investments in Private REITs at their respective NAVs at each quarter. For non-calendar quarter days, the Valuation Committee estimates the fair value of each Private REIT by adjusting the most recent NAV for each Private REIT, as necessary, by the change in a relevant benchmark that the Valuation Committee has deemed to be representative of the entire Private REIT market.
Valuation of Public Non-Traded REITs – The Fund invests a portion of its assets in Public Non-Traded Real Estate Investment Trusts (“Public Non-Traded REITs”). Public Non-Traded REITs do not timely report periodic NAVs and therefore cannot be valued using the practical expedient. The Valuation Committee determines the fair value of Public Non-Traded REITs by considering various factors such as the most recent published NAV, the transaction price, secondary market trades, shareholder redemption and dividend reinvestment programs, discounted cash flows and potential illiquidity discounts.
Valuation of Private Investment Funds – The Fund invests a portion of its assets in Private Investment Funds. Private Investment Funds measure their investment assets at fair value, and report a NAV per share on a calendar quarter basis. In accordance with ASC 820-10, the Fund has elected to apply the practical expedient and to value its investments in Private Investment Funds at their respective NAVs at each quarter. For non-calendar quarter days, the Valuation Committee determines the fair value of each Private Investment Fund by adjusting the most recent NAV for each Private Investment Fund, as necessary, by the change in a relevant benchmark that the Valuation Committee has deemed to be representative of the market.
Short Sales – The Fund may sell securities short. To do this, the Fund will borrow and then sell (take short positions in) securities. To complete such a transaction, the Fund must borrow the security to deliver to the buyer. The Fund is then obligated to replace, or cover, the security borrowed by purchasing it in the open market at some later date. The Fund bears the risk of a loss if the market price of the security increases between the date of the short sale and the date on which the Fund replaces the borrowed security. The Fund will realize a gain if the security declines in value between those dates. There can be no assurance that securities necessary to cover a short position will be available for purchase. To mitigate leverage risk, the Fund will segregate liquid assets (which may include its long positions) at least equal to its short position exposure, marked-to-market daily. The Fund is liable for any dividends or interest payable on securities while those securities are in a short position.
Fair Value Measurements – A three-tier hierarchy has been established to classify fair value measurements for disclosure purposes. Inputs refer broadly to the assumptions that market participants would use in pricing the asset or liability, including assumptions about risk. Inputs may be observable or unobservable. Observable inputs are inputs that reflect the assumptions market participants would use in pricing the asset or liability that are developed based on market data obtained from sources independent of the reporting entity. Unobservable inputs are inputs that reflect the reporting entity’s own assumptions about the assumptions market participants would use in pricing the asset or liability that are developed based on the best information available. In accordance with the authoritative guidance on fair value measurements and disclosure under GAAP, the Fund discloses the fair value of its investments in a hierarchy that prioritizes the inputs to valuation techniques used to measure the fair value.
Various inputs are used in determining the value of the Fund’s investments as of the reporting period end. These inputs are categorized in the following hierarchy under applicable financial accounting standards:
| Level 1 – | Unadjusted quoted prices in active markets for identical, unrestricted assets or liabilities that the Fund has the ability to access at the measurement date; |
| Level 2 – | Quoted prices which are not active, quoted prices for similar assets or liabilities in active markets or inputs other than quoted prices that are observable (either directly or indirectly) for substantially the full term of the asset or liability at the measurement date; and |
| Level 3 – | Significant unobservable prices or inputs (including the Fund’s own assumptions in determining the fair value of investments) where there is little or no market activity for the asset or liability at the measurement date. |
The availability of observable inputs can vary from security to security and is affected by a wide variety of factors, including, for example, the type of security, whether the security is new and not yet established in the marketplace, the liquidity of markets and other characteristics particular to the security. To the extent that valuation is based on models or inputs that are less observable or unobservable in the market, the determination of fair value requires more judgment. Accordingly, the degree of judgment exercised in determining fair value is greatest for instruments categorized in Level 3.
| Resource Real Estate Diversified Income Fund | Notes to Financial Statements |
September 30, 2019
An investment level within the fair value hierarchy is based on the lowest level input, individually or in the aggregate, that is significant to fair value measurement. The valuation techniques used by the Fund to measure fair value during the year ended September 30, 2019 maximized the use of observable inputs and minimized the use of unobservable inputs.
The inputs or methodologies used for valuing securities are not necessarily an indication of the risk or liquidity associated with investing in those securities. The following is a summary of the fair values according to the inputs used in valuing the Fund’s investments as of September 30, 2019:
| Investments in Securities at Value | | Level 1 | | Level 2 | | Level 3 | | Other | | Total |
| Bonds & Notes(a) | | $ | – | | | $ | 81,654 | | | $ | – | | | $ | – | | | $ | 81,654 | |
| Preferred Stocks(a) | | | 74,930,777 | | | | – | | | | – | | | | – | | | | 74,930,777 | |
| Real Estate Investment Trusts - Common Equity(a) | | | | | | | | | | | | | | | | | | | | |
| Public Non-Traded Real Estate Investment Trusts | | | – | | | | – | | | | 2,742,036 | | | | – | | | | 2,742,036 | |
| Private Real Estate Investment Trusts & Private Investment Funds (Measured at net asset value)(b) | | | – | | | | – | | | | – | | | | 220,763,712 | | | | 220,763,712 | |
| Traded Real Estate Investment Trusts | | | 99,036,394 | | | | – | | | | – | | | | – | | | | 99,036,394 | |
| Purchased Options | | | 1,585,500 | | | | – | | | | – | | | | – | | | | 1,585,500 | |
| Short Term Investments | | | 2,214,985 | | | | – | | | | – | | | | – | | | | 2,214,985 | |
| TOTAL | | $ | 177,767,656 | | | $ | 81,654 | | | $ | 2,742,036 | | | $ | 220,763,712 | | | $ | 401,355,058 | |
| | | | | | | | | | | | | | | | | | | | | |
| Other Financial Instruments | | | Level 1 | | | | Level 2 | | | | Level 3 | | | | Other | | | | Total | |
| Liabilities | | | | | | | | | | | | | | | | | | | | |
| Written Options | | $ | (1,863,750 | ) | | $ | – | | | $ | – | | | $ | – | | | $ | (1,863,750 | ) |
| TOTAL | | $ | (1,863,750 | ) | | $ | – | | | $ | – | | | $ | – | | | $ | (1,863,750 | ) |
| (a) | For detailed descriptions, see the accompanying Portfolio of Investments. |
| (b) | In accordance with ASC 820-10, certain investments that are measured at fair value using the net asset value per share (or its equivalent) practical expedient have not been classified in the fair value hierarchy. The fair value amounts presented in this table are intended to permit reconciliation of the fair value hierarchy to the amounts presented in the Portfolio of Investments and Statement of Assets and Liabilities. |
The following is a reconciliation of assets in which Level 3 inputs were used in determining value:
| Asset Type | | Balance as of
September 30,
2018 | | Accrued
Discount/
premium | | Return of
Capital | | Realized
Gain/(Loss) | | Change in
Unrealized
Appreciation/
Depreciation | | Purchases | | Sales Proceeds | | Transfer into
Level 3 | | Transfer Out
of Level 3 | | Balance as of
September 30,
2019 | | Net change in unrealized
appreciation/(depreciation)
included in the Statements of
Operations attributable to
Level 3 investments held at
September 30, 2019 |
| Commercial Mortgage Backed Securities | | $ | 1,290,367 | | | $ | – | | | $ | – | | | $ | (748,203 | ) | | $ | 245,092 | | | $ | – | | | $ | (787,256 | ) | | $ | – | | | $ | – | | | $ | – | | | $ | – | |
| Public Non-Traded Real Estate Investment Trusts | | | 2,992,370 | | | | – | | | | (32,229 | ) | | | 230 | | | | (205,114 | ) | | | – | | | | (13,221 | ) | | | – | | | | – | | | | 2,742,036 | | | | (205,114 | ) |
| | | $ | 4,282,737 | | | $ | – | | | $ | (32,229 | ) | | $ | (747,973 | ) | | $ | 39,978 | | | $ | – | | | $ | (800,477 | ) | | $ | – | | | $ | – | | | $ | 2,742,036 | | | $ | (205,114 | ) |
Significant unobservable valuation inputs for material Level 3 investments as of September 30, 2019 are as follows:
| | Fair Value at
9/30/2019 | Valuation Technique | Unobservable Input | Range |
| Public Non-Traded Real Estate Investment Trusts | $2,742,036 | Net Asset Value | Proprietary Benchmark | $99.89 – $100.94 |
| Annual Report | September 30, 2019 | 27 |
| Resource Real Estate Diversified Income Fund | Notes to Financial Statements |
September 30, 2019
A change to the unobservable input may result in a significant change to the value of the investment as follows:
| Unobservable Input | Impact to Value if Input Increases | Impact to Value if Input Decreases |
| Proprietary Benchmark | Increase | Decrease |
Securities Transactions and Investment Income– Investment security transactions are accounted for on a trade date basis. Cost is determined and gains and losses are based upon the specific identification method for both financial statement and federal income tax purposes. Dividend income is recorded on the ex-dividend date and interest income is recorded on the accrual basis. Premiums on securities are accreted to the earliest call date and purchase discounts are amortized over the life of the respective securities. Note that distributions received from REITs may be classified as dividends, capital gains and/or return of capital. The Fund does not estimate how much of the distributions from REITs is considered net investment income, capital gains, and/or return of capital at the time distributions are received; instead, the Fund completes this classification based on estimates at the end of each semi-annual period and at the end of each fiscal year. The Fund also makes interim estimates as appropriate to complete other financial reporting.
Industry Concentration – As of September 30, 2019, the Fund had 114% of its net assets invested within the real estate industry. Any development affecting that industry will have a greater impact on the value of the net assets of the Fund than would be the case if the Fund did not have significant investments in that industry. This may increase the risk of loss in the Fund and increase the volatility of the Fund’s NAV per share. Occasionally, market conditions, regulatory changes or other developments may negatively impact this industry, and therefore the value of the Fund’s portfolio will be adversely affected.
Concentration of Credit Risk – The Fund places its cash with one banking institution, which is insured by the Federal Deposit Insurance Corporation (“FDIC”). The FDIC insurance limit is $250,000 per deposit. At various times throughout the year, the amount on deposit may exceed the FDIC limit and subject the Fund to credit risk.
Federal and Other Taxes – No provision for income taxes is included in the accompanying financial statements, as the Fund intends to distribute to shareholders all taxable investment income and realized gains and otherwise comply with Subchapter M of the Internal Revenue Code of 1986, as amended (the “Code”), applicable to regulated investment companies.
The Fund evaluates tax positions taken (or expected to be taken) in the course of preparing the Fund’s tax provisions to determine whether these positions meet a “more-likely-than-not” standard that, based on the technical merits, have a more than fifty percent likelihood of being sustained by a taxing authority upon examination. A tax position that meets the “more-likely-than-not” recognition threshold is measured to determine the amount of benefit to recognize in the financial statements.
As of and during the year ended September 30, 2019, the Fund did not have a liability for any unrecognized tax benefits. The Fund files U.S. federal, state and local tax returns as required. The Fund’s tax returns are subject to examination by the relevant tax authorities until expiration of the applicable statute of limitations, which is generally three years after the filing of the tax return for federal purposes and four years for most state returns. Tax returns for open years have incorporated no uncertain tax positions that require a provision for income taxes.
Foreign Currency – The accounting records of the Fund are maintained in U.S. dollars. Investment securities and other assets and liabilities denominated in a foreign currency and income receipts and expense payments are translated into U.S. dollars using the prevailing exchange rate at the London market close. Purchases and sales of securities are translated into U.S. dollars at the contractual currency rates established at the approximate time of the trade. Net realized gains and losses on foreign currency transactions represent net gains and losses from currency realized between the trade and settlement dates on securities transactions and the difference between income accrued versus income received. The effects of changes in foreign currency exchange rates on investments in securities are included with the net realized and unrealized gain or loss on investment securities.
Distributions to Shareholders – Distributions from investment income are declared and paid quarterly. Distributions from net realized capital gains, if any, are declared and paid annually and are recorded on the ex-dividend date. The character of income and gains to be distributed is determined in accordance with income tax regulations, which may differ from GAAP.
Early Withdrawal Charge – Selling brokers, or other financial intermediaries that have entered into distribution agreements with the Distributor (as defined in Note 3), will receive a commission of up to 1.00% of the purchase price of Class C and T shares and up to 0.50% on the purchase of Class A and Class U shares of $1 million or more. Shareholders who tender for repurchase of such shareholder’s Class C and T shares fewer than 365 days after the original purchase date will be subject to an early withdrawal charge of 1.00% of the original purchase price. Shareholders tendering Class A and U shares fewer than 365 days after the original purchase date may be subject to an early withdrawal charge of 0.50% of the original purchase price, which will be deducted from repurchase proceeds, if (i) the original purchase was for amounts of $1 million or more and (ii) the selling broker received the reallowance of the dealer-manager fee. The Distributor may waive the imposition of the early withdrawal charge in in the event of shareholder death or shareholder disability. Any such waiver does not imply that the early withdrawal charge will be waived at any time in the future or that such early withdrawal charge will be waived for any other shareholder. Class W, Class I, Class D and Class L shares will not be subject to an early withdrawal charge.
| Resource Real Estate Diversified Income Fund | Notes to Financial Statements |
September 30, 2019
Indemnification– The Trust indemnifies its officers and trustees for certain liabilities that may arise from the performance of their duties to the Trust. Additionally, in the normal course of business, the Fund enters into contracts that contain a variety of representations and warranties and which provide general indemnities. The Fund’s maximum exposure under these arrangements is unknown, as this would involve future claims that may be made against the Fund that have not yet occurred. However, based on industry experience, the Trust expects the risk of loss due to these warranties and indemnities to be remote.
3. ADVISORY FEES AND OTHER RELATED PARTY TRANSACTIONS
Advisory Fees –Pursuant to an investment advisory agreement (the “Advisory Agreement”), investment advisory services are provided to the Fund by the Adviser. Under the terms of the Advisory Agreement, the Adviser receives monthly fees calculated at an annual rate of 1.25% of the average daily net assets of the Fund. During the year ended September 30, 2019, the Fund accrued $3,793,109 in advisory fees.
The Adviser has contractually agreed to waive all or part of its advisory fees and/or make payments to limit Fund expenses (excluding interest, dividend expense, amortization/accretion on securities sold short, brokerage commissions, acquired fund fees and expenses and extraordinary expenses) at least until January 31, 2021, such that the total annual operating expenses of the Fund do not exceed 1.99% per annum of Class A average daily net assets, 2.74% per annum of Class C average daily net assets, 1.99% per annum of Class W average daily net assets, 1.74% per annum of Class I average daily net assets, 1.99% per annum of Class U average daily net assets, 2.74% per annum of Class T average daily net assets, 2.49% per annum of Class D average daily net assets and 2.24% per annum of Class L average daily net assets. Fee waivers and expense payments may be recouped by the Adviser from the Fund within three years of when the amounts were waived or reimbursed, to the extent that overall expenses fall below the expense limitation. During the year ended September 30, 2019, the Adviser waived fees and reimbursed expenses of $173,757 and recouped $1,923 of expenses pursuant to its contractual agreement.
As of September 30, 2019, the following amounts were available for recoupment by the Adviser based upon their potential expiration dates:
| | 2021 | 2022 | 2023 |
| | $426,265 | $513,660 | $173,757 |
CCO/Compliance Services –For the period October 1, 2017 through February 28, 2018, the Fund reimbursed the Adviser for a portion of the costs (including compensation and benefits) related to the Fund’s Chief Compliance Officer.
Effective March 1, 2018, pursuant to a Compliance Services Agreement between the Fund and Resource America, Inc. (acting together with the Adviser and certain other affiliates (collectively, “Resource”)), dated March 1, 2018 (the “CSA”), Resource provides compliance services to the Fund. The services under the CSA are designed to ensure compliance by the Fund with its investment objectives, policies and restrictions, as disclosed in the Fund’s Prospectuses and Statement of Additional Information.
The CSA also covers, among other items, services associated with monitoring the Fund’s compliance with its policies and procedures and applicable federal, state and foreign securities laws and the rules and regulations thereunder. The initial term of the CSA is two years and will remain in full force from year to year thereafter, subject to annual approval by Resource and the Board.
In return for the services provided under the CSA, the Fund pays Resource a flat, annual fee of $200,000, payable monthly in twelve (12) equal installments (the “Flat Fee”), provided that each such monthly installment of the Flat Fee shall not exceed a monthly fee calculated at an annual rate of 0.10% of the Fund’s average daily net assets (the “Asset-Based Fee”). For purposes of determining whether the Fund will pay the Asset-Based Fee in any given month, Resource compares the amount of the Flat Fee and Asset-Based Fee that would be due for the given month and charges the Fund the applicable Asset-Based Fee only if such Asset-Based Fee is lower than the monthly installment of the Flat Fee, which is $16,667 (1/12 of $200,000).
| Annual Report | September 30, 2019 | 29 |
| Resource Real Estate Diversified Income Fund | Notes to Financial Statements |
September 30, 2019
For the year ended September 30, 2019, the Fund incurred $200,000 with respect to costs associated with the Fund’s Chief Compliance Officer and fees associated with compliance services under the CSA.
Fund Accounting Fees and Expenses – ALPS Fund Services, Inc. (“ALPS”) serves as the Fund’s administrator and accounting agent (the “Administrator”) and receives customary fees from the Fund for such services.
Transfer Agent – DST Systems Inc. (the “Transfer Agent”), an affiliate of ALPS, serves as transfer, dividend paying and shareholder servicing agent for the Fund and receives customary fees from the Fund for such services.
Distributor– ALPS Distributors, Inc. (the “Distributor”), an affiliate of ALPS, serves as the Fund’s distributor. There are no fees paid to the Distributor pursuant to the distribution agreement. The Board has adopted, on behalf of the Fund, a shareholder servicing plan under which the Fund may compensate financial industry professionals for providing ongoing services in respect of clients with whom they have distributed shares of the Fund. Under the shareholder servicing plan, the Fund’s Class A, Class C, Class W, Class U, Class T, Class D and Class L shares are subject to a shareholder servicing fee at an annual rate of 0.25% of the average daily net assets attributable to that share class. For the year ended September 30, 2019, the Fund incurred shareholder servicing fees of $660,756. The Class C, Class T and Class L shares also pay to the Distributor a distribution fee, payable under a distribution plan adopted by the Board, that accrues at an annual rate equal to 0.75%, 0.75% and 0.25%, respectively, of the Fund’s average daily net assets attributable to Class C, Class T and Class L shares, respectively, and is payable on a quarterly basis. In addition, Class D shares pay to Resource Securities LLC (the “Dealer Manager”), an affiliate of the Adviser, a dealer manager fee, payable under a distribution plan adopted by the Board, that accrues at an annual rate equal to 0.50% of the Fund’s average daily net assets attributable to Class D shares and is payable on a quarterly basis. Class A, Class W, Class I and Class U shares are not currently subject to a distribution fee. For the year ended September 30, 2019, the Fund accrued $563,450 in distribution fees and $31,595 in dealer manager fees.
The Distributor acts as the Fund’s principal underwriter in a continuous public offering of the Fund’s shares. During the year ended September 30, 2019, no fees were retained by the Distributor.
Trustees– Each trustee who is not affiliated with the Trust or the Adviser receives an annual fee of $10,000, $2,000 for attending the annual in-person meeting of the Board, and $500 for attending each of the remaining telephonic meetings, as well as reimbursement for any reasonable expenses incurred attending the meetings. None of the interested Trustees or executive officers receive compensation from the Trust, except as noted above with respect to the Fund’s Chief Compliance Officer for the period October 1, 2017 through February 28, 2018.
4. INVESTMENT TRANSACTIONS
The cost of purchases and proceeds from the sale of securities, other than short-term securities, for the year ended September 30, 2019 amounted to $302,131,832 and $232,794,466, respectively.
5. DERIVATIVE TRANSACTIONS
Derivative Instruments and Hedging Activities – The following discloses the Fund’s use of derivative instruments and hedging activities:
The Fund’s investment objectives permit the Fund to enter into various types of derivative contracts, such as options. In doing so, the Adviser may employ strategies in differing combinations to permit the Fund to increase, decrease or change the level or types of exposure to market factors. Central to those strategies are features inherent to derivatives that make them more attractive for this purpose than equity or debt securities; they require little or no initial cash investment, they can focus exposure on only certain selected risk factors, and they may not require the ultimate receipt or delivery of the underlying security (or securities) to the contract. This may allow the Fund to pursue its objectives more quickly and efficiently than if it were to make direct purchases or sales of securities capable of effecting a similar response to market factors.
Market Risk Factors – In pursuit of its investment objectives, the Adviser may seek to use derivatives to increase or decrease the Fund’s exposure to the following market risk factor:
Foreign Exchange Rate Risk: Foreign exchange rate risk relates to the change in the U.S. dollar value of a security held that is denominated in a foreign currency. The value of a foreign currency denominated security will decrease as the dollar appreciates against the currency, while the value of the foreign currency denominated security will increase as the dollar depreciates against the currency.
| Resource Real Estate Diversified Income Fund | Notes to Financial Statements |
September 30, 2019
Risk of Investing in Derivatives: The Fund’s use of derivatives can result in losses due to unanticipated changes in the market risk factors and the overall market.
Derivatives may have little or no initial cash investment relative to their market value exposure and therefore can produce significant gains or losses in excess of their cost. This use of embedded leverage allows the Fund to increase its market value exposure relative to its net assets and can substantially increase the volatility of the Fund’s performance.
Additional associated risks from investing in derivatives also exist and potentially could have significant effects on the valuation of the derivative and the Fund. Typically, the associated risks are not the risks to which the Fund is attempting to increase or decrease exposure, per its investment objectives, but are the additional risks from investing in derivatives.
Examples of these associated risks are liquidity risk, which is the risk that the Fund will not be able to sell the derivative in the open market in a timely manner, and counterparty credit risk, which is the risk that the counterparty will not fulfill its obligation to the Fund.
Option Contracts– The Fund may enter into options transactions for hedging purposes and for non-hedging purposes, such as seeking to enhance return. The Fund may write covered put and call options on any stocks or stock indices, currencies traded on domestic and foreign securities exchanges, or futures contracts on stock indices, interest rates and currencies traded on domestic and, to the extent permitted by the CFTC and foreign exchanges. A written call option obligates the Fund to sell the specified asset to the holder (purchaser) at a stated price (the exercise price) if the option is exercised before a specified date (the expiration date). A written put option obligates the Fund to buy the specified asset from the purchaser at the exercise price if the option is exercised before the expiration date. Premiums received when writing options are recorded as liabilities and are subsequently adjusted to the current value of the options written. Premiums received from writing options that expire are treated as realized gains. Premiums received from writing options, which are either exercised or closed, are offset against the proceeds received or amount paid on the transaction to determine realized gains or losses which are recorded on the Statement of Operations.
The location in the Statement of Assets and Liabilities of the Fund’s derivative positions as of September 30, 2019 are as follows:
| Risk Exposure | | Statement of Assets
and Liabilities
Assets | | Value | | Statement of Assets
and Liabilities
Liabilities | | Value |
| Purchased Options (Equity contracts) | | Investments, at value | | $ | 1,585,500 | | | N/A | | | | |
| Written Options (Equity contracts) | | N/A | | | | | | Written options, at value | | $ | 1,863,750 | |
| Total | | | | $ | 1,585,500 | | | | | $ | 1,863,750 | |
The location in the Statement of Operations of the Fund’s derivative activity for the year ended September 30, 2019 are as follows:
| Risk Exposure | | Statement of Operations Location | | Realized
Gain/(Loss)
on Derivatives
Recognized
in Income | | Change in
Unrealized
Gain/(Loss)
on Derivatives
Recognized
in Income |
| Purchased Options (Equity contracts) | | Net realized gain/loss on investments/Net change in unrealized appreciation on investments | | $ | (5,226,495 | ) | | $ | (632,276 | ) |
| Written Options (Equity contracts) | | Net realized gain/loss on investments/Net change in unrealized appreciation on investments | | | 853,113 | | | | (440,888 | ) |
| Total | | | | $ | (4,373,382 | ) | | $ | (1,073,164 | ) |
During the year ended September 30, 2019, the average purchased and written option contracts volume was 11,892 and 24,083 contracts, respectively.
| Annual Report | September 30, 2019 | 31 |
| Resource Real Estate Diversified Income Fund | Notes to Financial Statements |
September 30, 2019
6. TAX BASIS INFORMATION
For the year ended September 30, 2019, the following reclassifications, which had no impact on results of operations or net assets, were recorded to reflect tax character.
| | | Distributable
Earnings | | Paid-in Capital |
| | $ | 132,710 | | | $ | (132,710 | ) |
The tax character of distributions paid for the years ended September 30, 2019 and September 30, 2018 were as follows:
| September 30, 2019 | | Ordinary Income | | Long-Term Capital Gain | | Return of Capital |
| | $ | 8,732,190 | | | $ | 4,726,274 | | | $ | 3,904,241 | |
| September 30, 2018 | | Ordinary Income | | Long-Term Capital Gain | | Return of Capital |
| | $ | 7,918,027 | | | $ | 1,267,376 | | | $ | 5,141,751 | |
As of September 30, 2019, the components of accumulated earnings/(deficit) on a tax basis were as follows:
| Undistributed ordinary income | | $ | – | |
| Accumulated capital gains | | | – | |
| Net unrealized appreciation on securities | | | 34,437,179 | |
| Total distributable earnings | | $ | 34,437,179 | |
The following information is computed on a tax basis for each item as of September 30, 2019:
| | | Gross Appreciation
(excess of value over
tax cost) | | Gross Depreciation
(excess of tax cost
over value) | | Net Unrealized
Appreciation | | Cost of Investments
for Income Tax
Purposes |
| | $ | 38,461,618 | | | $ | (4,024,439 | ) | | $ | 34,437,179 | | | $ | 366,916,616 | |
The difference between book basis and tax basis distributable earnings and unrealized appreciation/(depreciation) is primarily attributable to the tax deferral of losses on wash sales, investments in partnerships and certain other investments.
7. REPURCHASE OFFERS
Pursuant to Rule 23c-3 under the 1940 Act, the Fund offers shareholders on a quarterly basis the option of redeeming shares, at NAV, of up to 5% of the Fund’s issued and outstanding shares as of the close of regular business hours on the New York Stock Exchange on the Repurchase Pricing Date (defined below). If shareholders tender for repurchase more than 5% of the outstanding shares of the Fund, the Fund may, but is not required to, repurchase up to an additional 2% of the outstanding shares of the Fund. If the Fund determines not to repurchase an additional 2% of the outstanding shares of the Fund, or if more than 7% of the outstanding shares of the Fund are tendered, then the Fund will repurchase shares on a pro rata basis based upon the number of shares tendered by each shareholder. There can be no assurance that the Fund will be able to repurchase all shares that each shareholder has tendered, even if all of the shares in a shareholder’s account are tendered. In the event of an oversubscribed offer, you may not be able to tender all shares that you wish to tender and you may have to wait until the next quarterly repurchase offer to tender the remaining shares. Subsequent repurchase requests will not be given priority over other shareholder requests.
| Resource Real Estate Diversified Income Fund | Notes to Financial Statements |
September 30, 2019
During the year ended September 30, 2019, the Fund completed four quarterly repurchase offers. In these offers, the Fund offered to repurchase up to 5% of the number of its outstanding shares (up to 7% at the discretion of the officers of the Fund) as of the Repurchase Pricing Dates. For the year ended September 30, 2019, none of the quarterly repurchase offers were oversubscribed. The result of those repurchase offers were as follows:
| | Repurchase Offer #1 | Repurchase Offer #2 | Repurchase Offer #3 | Repurchase Offer #4 |
| Commencement Date | September 17, 2018 | December 17, 2018 | March 18, 2019 | June 17, 2019 |
| Repurchase Request Deadline | October 17, 2018 | January 16, 2019 | April 17, 2019 | July 17, 2019 |
| Repurchase Pricing Date | October 17, 2018 | January 16, 2019 | April 17, 2019 | July 17, 2019 |
| Amount Repurchased | $6,260,041 | $4,613,558 | $5,025,531 | $6,389,477 |
| Shares Repurchased | 600,312 | 441,195 | 479,068 | 600,700 |
8. BANK LINE OF CREDIT
The Fund has a secured revolving bank line of credit through BNP Paribas Prime Brokerage International, Ltd. (the “Bank”) for purpose of investment purchases subject to the limitations of the 1940 Act for borrowings.
Borrowings under this arrangement bear interest at the Bank’s 1 month LIBOR plus 90 basis points at the time of borrowing. During the year ended September 30, 2019, the Fund incurred $1,781,874 of interest expense related to the borrowings. Average borrowings and the average interest rate during the year ended September 30, 2019 were $54,781,574 and 3.27%, respectively. The largest outstanding borrowing during the year ended September 30, 2019 was $86,629,339. As of September 30, 2019, the Fund had $43,482,332 of outstanding borrowings.
As collateral security for the Bank line of credit, the Fund grants the Bank a first position security interest in a lien on all securities of any kind or description held by the Fund in the pledge account. As of September 30, 2019, the Fund had $43,482,332 in publicly traded securities pledged as collateral for the line of credit and written options, as well as, $116,544,815 in publicly traded securities available as collateral for future borrowings.
9. UNFUNDED COMMITMENTS
As of September 30, 2019, in addition to the unfunded commitments for investments currently held as of the reporting date (Refer to Portfolio of Investments footnote disclosures), the Fund had $47,000,000 of unfunded commitments relating to potential future investments not currently held as reported below. The value of unfunded commitments reported as of September 30, 2019 approximates fair value.
| Security | Unfunded Commitments as of September 30, 2019 |
| Brookfield Premier Real Estate Partners | $14,000,000 |
| Prologis Targeted U.S. Logistics Fund LP | $15,000,000 |
| Voya Commercial Mortgage Lending Fund LP | $18,000,000 |
10. NEW ACCOUNTING PRONOUNCEMENTS
In March 2017, the FASB issued ASU “Premium Amortization on Purchased Callable Debt Securities” which amends the amortization period for a callable debt security held at a premium from the maturity date to the earliest call date. The guidance is effective for annual periods beginning after December 15, 2018, and interim periods within those annual periods. The Fund has adopted and applied ASU 2017-08 noting that it had no effect on the financial statements.
In August 2018, FASB issued ASU 2018-13, which changes the fair value measurement disclosure requirements of FASB Accounting Standards Codification Topic 820, Fair Value Measurement. The update to Topic 820 includes new, eliminated, and modified disclosure requirements. ASU 2018-13 is effective for fiscal years beginning after December 15, 2019, including interim periods. Early adoption is permitted for any eliminated or modified disclosures. The Fund adopted the added, eliminated, and modified disclosure under the ASU.
11. SUBSEQUENT EVENTS
Subsequent events after the date of the Statement of Assets and Liabilities have been evaluated through the date the financial statements were issued.
The Fund completed a quarterly repurchase offer on October 16, 2019, which resulted in 770,280 Fund shares being repurchased for $8,386,727.
Management has determined that there were no other subsequent events to report through the issuance of these financial statements.
| Annual Report | September 30, 2019 | 33 |
| Resource Real Estate Diversified Income Fund | Report of Independent Registered
Public Accounting Firm |

To the Board of Trustees and the Shareholders of
Resource Real Estate Diversified Income Fund
Opinion on the Financial Statements
We have audited the accompanying statement of assets and liabilities of Resource Real Estate Diversified Income Fund (the“Fund”), including the portfolio of investments, as of September 30, 2019, and the related statements of operations and cash flows for the year then ended, the statements of changes in net assets for each of the years in the two-year period then ended and the financial highlights as noted in the table below, and the related notes (collectively referred to as the“financial statements”). In our opinion, the financial statements present fairly, in all material respects, the financial position of the Fund as of September 30, 2019, and the results of its operations and cash flows for the year then ended, the changes in its net assets for each of the years in the two-year period then ended and its financial highlights as noted in the table below, in conformity with accounting principles generally accepted in the United States of America.
| Share Class | Financial Highlights |
| Class A | For each of the years in the four-year period ended September 30, 2019, for the period from March 1, 2015 through September 30, 2015, and for the year ended February 28, 2015 |
| Class C | For each of the years in the four-year period ended September 30, 2019, for the period from March 1, 2015 through September 30, 2015, and for the period from August 1, 2014 (commencement of operations) through February 28, 2015 |
| Class W | For each of the years in the four-year period ended September 30, 2019, for the period from March 1, 2015 through September 30, 2015, and for the period from November 24, 2014 (commencement of operations) through February 28, 2015 |
| Class I | For each of the years in the four-year period ended September 30, 2019, for the period from March 1, 2015 through September 30, 2015, and for the period from August 1, 2014 (commencement of operations) through February 28, 2015 |
| Class U | For each of the years in the four-year period ended September 30, 2019, for the period from March 1, 2015 through September 30, 2015, and for the period from February 13, 2015 (commencement of operations) through February 28, 2015 |
| Class T | For each of the years in the four-year period ended September 30, 2019, for the period from March 1, 2015 through September 30, 2015, and for the period from February 13, 2015 (commencement of operations) through February 28, 2015 |
| Class D | For each of the years in the four-year period ended September 30, 2019, for the period from March 1, 2015 through September 30, 2015, and for the period from February 13, 2015 (commencement of operations) through February 28, 2015 |
| Class L | For each of the years in the two-year period ended September 30, 2019 and for the period from July 10, 2017 (commencement of operations) through September 30, 2017 |
Basis for Opinion
These financial statements are the responsibility of the Fund's management. Our responsibility is to express an opinion on the Fund’s financial statements based on our audits. We are a public accounting firm registered with the Public Company Accounting Oversight Board (United States) (“PCAOB”) and are required to be independent with respect to the Fund in accordance with the U.S. federal securities law and the applicable rules and regulations of the Securities and Exchange Commission and the PCAOB. We conducted our audits in accordance with the standards of the PCAOB. Those standards require that we plan and perform the audits to obtain reasonable assurance about whether the financial statements are free of material misstatement, whether due to error or fraud. The Fund is not required to have, nor were we engaged to perform, an audit of its internal control over financial reporting. As part of our audits we are required to obtain an understanding of internal control over financial reporting but not for the purpose of expressing an opinion on the effectiveness of the Fund’s internal control over financial reporting. Accordingly, we express no such opinion.
| Resource Real Estate Diversified Income Fund | Report of Independent Registered
Public Accounting Firm |
Our audits included performing procedures to assess the risk of material misstatement of the financial statements, whether due to error or fraud, and performing procedures that respond to those risks. Such procedures include examining, on a test basis, evidence regarding the amounts and disclosures in the financial statements. Our procedures included confirmation of securities owned as of September 30, 2019 by correspondence with the custodian, brokers, and other appropriate parties. Our audits also included evaluating the accounting principles used and significant estimates made by management, as well as evaluating the overall presentation of the financial statements. We believe that our audits provide a reasonable basis for our opinion.

BBD, LLP
We have served as the auditor of the Resource Real Estate Diversified Income Fund since 2015.
Philadelphia, Pennsylvania
November 29, 2019
| Annual Report | September 30, 2019 | 35 |
| Resource Real Estate Diversified Income Fund | Additional Information |
September 30, 2019 (Unaudited)
1. PROXY VOTING POLICIES AND VOTING RECORD
A description of the policies and procedures that the Fund uses to vote proxies relating to portfolio securities is available without charge upon request by calling toll-free 855-747-9559, or on the Securities and Exchange Commission’s (“SEC”) website at http://www.sec.gov. Information regarding how the Fund voted proxies relating to portfolio securities during the most recent 12-month period ended June 30th is available without charge upon request by calling toll-free 855-747-9559, or on the SEC’s website at http://www.sec.gov.
2. QUARTERLY PORTFOLIO HOLDINGS
The Fund files a complete listing of portfolio holdings for the Fund with the SEC as of the first and third quarters of each fiscal year on Form N-Q. The filings are available upon request by calling 855-747-9559. Furthermore, you may obtain a copy of the filing on the SEC’s website at http://www.sec.gov. The Fund’s Form N-Q may also be reviewed and copied at the SEC’s Public Reference Room in Washington, D.C., and information on the operation of the Public Reference Room may be obtained by calling 1-800-SEC-0330.
3. TAX INFORMATION
Pursuant to Section 852(b)(3) of the Code, the Fund designated $4,726,274 as long-term capital gain distribution for the year ended September 30, 2019.
4. DISTRIBUTABLE CASH FLOW
The information presented below regarding Distributable Cash Flow is supplemental non-GAAP financial information, which is meaningful to understanding the operating performance of the Fund. Distributable Cash Flow is the functional equivalent of EBITDA for non-investment companies. Management believes it is an important supplemental measure of performance. This information is supplemental, unaudited, and is not inclusive of required financial disclosures (such as Total Expense Ratio), and should be read in conjunction with our full financial statements.
| | | For the
Year Ended September 30, 2019 | | | For the
Year Ended September 30, 2018 | |
| Dividends and Interest from the Statement of Operations | | $ | 20,275,385 | | | $ | 14,157,108 | |
| Add: Tax adjustments attributable to REIT and other investments(1) | | | 1,933,926 | | | | 6,504,693 | |
| Dividends and Interest before REIT adjustments | | | 22,209,311 | | | | 20,661,801 | |
| | | | | | | | | |
| Total Expenses | | | 9,292,698 | | | | 7,785,342 | |
| Less Fees (Waived)/Recouped | | | (171,834 | ) | | | (510,742 | ) |
| Total Net Expenses | | | 9,120,864 | | | | 7,274,601 | |
| | | | | | | | | |
| Distributable Cash Flow | | | 13,088,447 | | | | 13,387,199 | |
| | | | | | | | | |
| Distribution to Shareholders | | | 17,362,705 | | | | 14,327,154 | |
| | | | | | | | | |
| Distribution Coverage Ratio | | | 75 | % | | | 93 | % |
| | | | | | | | | |
| Net Realized Gain from the Statement of Operations(2) | | | 7,880,053 | | | | 1,480,021 | |
| | | | | | | | | |
| Distribution Coverage Ratio including Net Realized Gain | | | 121 | % | | | 104 | % |
| 1 | Tax adjustments attributable to REITs and other investments are adjustments to reflect the tax character of distributions received from underlying investments. Specifically, a portion of distributions received from REITs are often treated as non-taxable return of capital for book and tax purposes and distributions received from investments structured as partnerships are also treated as return of capital to the extent the distributions received exceed the income reported to the Fund on the Forms K-1 received from the underlying investments. |
| 2 | The Fund is subject to a 4% nondeductible excise tax on certain undistributed amounts of ordinary income and capital gain under a prescribed formula contained in Section 4982 of the Code. The formula requires payment to shareholders during a calendar year of distributions representing at least 98% of the Fund's ordinary income for the calendar year and at least 98.2% of its capital gain net income (i.e., the excess of its capital gains over capital losses) realized during the one-year period ending October 31 during such year plus 100% of any income that was neither distributed nor taxed to the Fund during the preceding calendar year. Under ordinary circumstances, the Fund expects to time its distributions so as to avoid liability for this tax. |
| Resource Real Estate Diversified Income Fund | Trustees & Officers |
September 30, 2019 (Unaudited)
The business and affairs of the Fund are managed under the direction of the Trustees. Information concerning the Trustees and officers of the Fund is set forth below. Generally, each Trustee and officer serves an indefinite term or until certain circumstances such as his resignation, death or otherwise as specified in the Fund’s organizational documents. Any Trustee may be removed at a meeting of shareholders by a vote meeting the requirements of the Fund’s organizational documents. The Statement of Additional Information of the Fund includes additional information about the Trustees and officers and is available, without charge, upon request by calling the Fund’s toll-free at 855-747-9559. Refer to Footnote 3 of the Fund’s financial statements for additional information on Independent Trustee compensation. The Interested Trustees and officers do not receive compensation from the Fund for their services to the Fund.
Name, Address* and Year of Birth | Position/Term of Office** | Principal Occupation During the Past Five Years | Number of Portfolios in Fund Complex*** Overseen by Trustee | Other Directorships held by Trustee During Last 5 Years |
| INDEPENDENT TRUSTEES | | | |
Fred Berlinsky 1959 | Trustee since 2012, Chairman of the Board since 2012 | Markeim-Chalmers, Inc. (commercial real estate firm), President (since March 1986) | 2 | Resource Credit Income Fund (since February 2015) |
Enrique Casanova 1973 | Trustee since 2012 | MKTG (marketing company), Vice President (since December 2003) | 2 | Resource Credit Income Fund (since February 2015) |
David Burns 1974 | Trustee since 2015 | Ampure Capital, LLC (business consulting and investment banking), President (since June 2004)
GT Securities (registered broker-dealer), Registered Representative (since June 2010)
Anthrotect (environmental conservation), Acting CFO (since December 2012); Doorways, LTD (residential real estate firm) (since January 2001) | 2 | Doorways, LTD (since January 2001)
RCP Regents Center (June 2006 to August 2016)
Resource Credit Income Fund (since February 2015) |
| Annual Report | September 30, 2019 | 37 |
| Resource Real Estate Diversified Income Fund | Trustees & Officers |
September 30, 2019 (Unaudited)
Name, Address* and Year of Birth | Position/Term of Office** | Principal Occupation During the Past Five Years | Number of Portfolios in Fund Complex*** Overseen by Trustee | Other Directorships held by Trustee During Last 5 Years |
| INTERESTED TRUSTEES AND OFFICERS | | |
Alan Feldman 1963 | Trustee since 2012 and CEO since 2012 | Resource Real Estate, LLC (the Fund's adviser) – Chief Executive Officer (since May 2004) | 2 | Resource Real Estate, LLC, since 2004 |
| | | Resource America, Inc. – Senior Vice President (since August 2002) | | Resource Credit Income Fund, since February 2015 |
Justin Milberg 1966 | President since 2017 | Resource Liquid Alternatives (a business unit of Resource America, Inc.), Chief Operating Officer (since November 2014); President (since July 2018) | N/A | N/A |
| | | Resource Real Estate, LLC (the Fund's adviser) – Managing Director (since December 2015) | | |
| | | Resource Alternative Advisor, LLC (investment adviser to Resource Credit Income Fund), an affiliate of Resource Real Estate, LLC, Managing Director (since August 2017) and Senior Vice President (November 2016 to August 2017) | | |
| | | Bank of America Merrill Lynch (public bank), Managing Director (2005 to 2011) | | |
Steven Saltzman 1963 | Treasurer since 2012 and Senior Vice President since 2012 | Resource Real Estate, LLC, Senior Vice President and Chief Financial Officer (since January 2014) | N/A | N/A |
| | | Resource Real Estate, LLC, Vice President – Finance (May 2004 to December 2013) | | |
| | | Resource Credit Income Fund, Treasurer and Senior Vice President (February 2015 to May 2016) | | |
| Resource Real Estate Diversified Income Fund | Trustees & Officers |
September 30, 2019 (Unaudited)
Name, Address* and Year of Birth | Position/Term of Office** | Principal Occupation During the Past Five Years | Number of Portfolios in Fund Complex*** Overseen by Trustee | Other Directorships held by Trustee During Last 5 Years |
| INTERESTED TRUSTEES AND OFFICERS | | |
Lawrence S. Block 1967 | Secretary, Chief Compliance Officer and Senior Vice President since March 2018 | Island Capital Group (real estate merchant bank), C-III Capital Partners LLC (real estate holding company) and C-III Investment Management LLC, Managing Director, Counsel and Chief Compliance Officer (since January 2011) | N/A | N/A |
| | | Anubis Securities LLC (a registered broker-dealer), President and Chief Compliance Officer (since January 2011) | | |
| | | Resource America, Inc., Senior Vice President and Assistant Secretary (since September 2016) | | |
| | | Resource Real Estate, LLC (the Fund's investment adviser), Senior Vice President and Assistant Secretary (since September 2016), Chief Compliance Officer (since March 2018) and Board of Managers (since January 2019) | | |
| | | Resource Alternative Advisor, LLC (adviser to Resource Credit Income Fund) and Exantas Capital Manager Inc., Senior Vice President and Assistant Secretary (since September 2016), Chief Compliance Officer (since March 2018) | | |
| | | Resource Securities LLC (a registered broker-dealer), Chief Compliance Officer (since September 2019), President (since March 2018), Vice President (May 2017 to February 2018) and Board Member (since September 2016) | | |
| * | Unless otherwise noted, the address of each Trustee and Officer is c/o Resource Real Estate, LLC, 717 Fifth Avenue, 14th Floor, New York, NY 10022. |
| ** | The term of office for each Trustee and officer listed above will continue indefinitely. |
| *** | The term "Fund Complex" refers to the Resource Real Estate Diversified Income Fund and the Resource Credit Income Fund. |
| Annual Report | September 30, 2019 | 39 |
| Resource Real Estate Diversified Income Fund | Privacy Notice |
(Unaudited)
Rev. 5/2014
| FACTS | WHAT DOES RESOURCE REAL ESTATE DIVERSIFIED INCOME FUND DO WITH YOUR PERSONAL INFORMATION? |
| Why? | Financial companies choose how they share your personal information. Federal law gives consumers the right to limit some but not all sharing. Federal law also requires us to tell you how we collect, share, and protect your personal information. Please read this notice carefully to understand what we do. |
| What? | The types of personal information we collect and share depend on the product or service you have with us. This information can include: |
| | ▪ Social Security number ▪ Assets ▪ Retirement Assets ▪ Transaction History ▪ Checking Account Information | ▪ Purchase History ▪ Account Balances ▪ Account Transactions ▪ Wire Transfer Instructions |
| | When you areno longer our customer, we continue to share your information as described in this notice. |
| How? | All financial companies need to share customers’ personal information to run their everyday business. In the section below, we list the reasons financial companies can share their customers’ personal information; the reasons Resource Real Estate Diversified Income Fund chooses to share; and whether you can limit this sharing. |
| Reasons we can share your personal information | Does Resource Real Estate Diversified Income Fund share? | Can you limit this sharing? |
For our everyday business purposes –
such as to process your transactions, maintain your account(s), respond to court orders and legal investigations, or report to credit bureaus | Yes | No |
For our marketing purposes –
to offer our products and services to you | No | We don't share |
| For joint marketing with other financial companies | No | We don't share |
For our affiliates' everyday business purposes –
information about your transactions and experiences | No | We don't share |
For our affiliates' everyday business purposes –
information about your creditworthiness | No | We don't share |
| For non-affiliates to market to you | No | We don't share |
| Questions? | Call 1-855-747-9559 |
| Resource Real Estate Diversified Income Fund | Privacy Notice |
(Unaudited)
| Who we are | |
| Who is providing this notice? | Resource Real Estate Diversified Income Fund |
| What we do | |
| How does Resource Real Estate Diversified Income Fund protect my personal information? | To protect your personal information from unauthorized access and use, we use security measures that comply with federal law. These measures include computer safeguards and secured files and buildings. Our service providers are held accountable for adhering to strict policies and procedures to prevent any misuse of your nonpublic personal information. |
| How does Resource Real Estate Diversified Income Fund collect my personal information? | We collect your personal information, for example, when you ▪ Open an account ▪ Provide account information ▪ Give us your contact information ▪ Make deposits or withdrawals from your account ▪ Make a wire transfer ▪ Tell us where to send the money ▪ Tells us who receives the money ▪ Show your government-issued ID ▪ Show your driver's license We also collect your personal information from other companies. |
| Why can't I limit all sharing? | Federal law gives you the right to limit only ▪ Sharing for affiliates' everyday business purposes – information about your creditworthiness ▪ Affiliates from using your information to market to you ▪ Sharing for non-affiliates to market to you State laws and individual companies may give you additional rights to limit sharing. |
| Definitions | |
| Affiliates | Companies related by common ownership or control. They can be financial and nonfinancial companies. ▪ Resource Real Estate Diversified Income Fund does not share with our affiliates. |
| Non-affiliates | Companies not related by common ownership or control. They can be financial and nonfinancial companies ▪ Resource Real Estate Diversified Income Fund does not share with non-affiliates so they can market to you. |
| Joint marketing | A formal agreement between nonaffiliated financial companies that together market financial products or services to you. ▪ Resource Real Estate Diversified Income Fund doesn’t jointly market. |
| Annual Report | September 30, 2019 | 41 |

INVESTMENT ADVISER
Resource Real Estate, LLC
717 Fifth Avenue, 14th Floor
New York, New York 10022
DISTRIBUTOR
ALPS Distributors, Inc.
1290 Broadway, Suite 1100
Denver, Colorado 80203
LEGAL COUNSEL
Thompson Hine LLP
41 South High Street, Suite 1700
Columbus, Ohio 43215
INDEPENDENT REGISTERED
PUBLIC ACCOUNTING FIRM
BBD, LLP
1835 Market Street, 3rd Floor
Philadelphia, Pennsylvania 19103
Must be accompanied or preceded by a Prospectus.
ALPS Distributors, Inc. is the Distributor for Resource Real Estate Diversified Income Fund.
Item 2. Code of Ethics.
| (a) | As of the end of the period covered by this report, the Registrant has adopted a Code of Ethics that applies to the Registrant's principal executive officer, principal financial officer, principal accounting officer or controller, or persons performing similar functions, regardless of whether these individuals are employed by the Registrant or a third party (“Registrant’s Code of Ethics”). |
| (c) | During the period covered by this report, there have not been any amendments to the provisions of the code of ethics adopted in Item 2(a) of this report. |
| (d) | During the period covered by this report, the Registrant had not granted any express or implicit waivers from the provisions of the Code of Ethics adopted in Item 2(a) of this report. |
| (f) | The Registrant’s Code of Ethics was previously filed December 3, 2018 in the Registrant’s Certified Shareholder Report on Form NCSR and is hereby incorporated by reference. |
Item 3. Audit Committee Financial Expert.
| (a)(1)(ii) | The Board of Trustees of the Registrant has determined that the Registrant has at least one Audit Committee Financial Expert serving on its audit committee. |
| (a)(2) | The Board of Trustees of the Registrant has designated Mr. David M. Burns as the Registrant’s Audit Committee Financial Expert. Mr. Burns is “independent” as defined in paragraph (a)(2) of Item 3 to Form N-CSR. |
Item 4. Principal Accountant Fees and Services.
| (a) | Audit Fees: For the Registrant’s fiscal years ended September 30, 2019 and September 30, 2018, the aggregate fees billed for professional services rendered by the principal accountant for the audit of the Registrant’s annual financial statements or services that are normally provided by the accountant in connection with statutory and regulatory filings or engagements were $25,000 and $22,000, respectively. |
| (b) | Audit-Related Fees: For the Registrant’s fiscal years ended September 30, 2019 and September 30, 2018, the aggregate fees billed for assurance and related services by the principal accountant that are reasonably related to the performance of the audit of the Registrant’s financial statements and are not otherwise reported under paragraph (a) of this Item 4 were $0 and $0, respectively. |
| (c) | Tax Fees: For the Registrant’s fiscal years ended September 30, 2019 and September 30, 2018, the aggregate fees billed for professional services rendered by the principal accountant for tax compliance, tax advice and tax planning, which were comprised of the preparation of Federal and state income tax returns, assistance with calculation of required income, capital gain and excise distributions and preparation of Federal excise tax returns, were $3,000 and $3,000, respectively. |
| (d) | All Other Fees: For the Registrant’s fiscal years ended September 2019 and September 30, 2018, the aggregate fees billed for products and services provided by the principal accountant, other than the services reported in paragraphs (a) through (c) of this Item 4, were $0 and $0, respectively. |
| (e) (1) | The Registrant’s audit committee is required to pre-approve all audit services and, when appropriate, any non-audit services (including audit-related, tax and all other services) to the Registrant. The Registrant’s audit committee also is required to pre-approve, when appropriate, any non-audit services (including audit-related, tax and all other services) to its investment adviser, or any entity controlling, controlled by or under common control with the investment adviser that provides ongoing services to the Registrant, to the extent that the services may be determined to have an impact on the operations or financial reporting of the Registrant. Services are reviewed on an engagement by engagement basis by the audit committee. |
| (2) | No services described in paragraphs (b) through (d) of this Item 4 were approved by the Registrant’s audit committee pursuant to paragraph (c)(7)(i)(C) of Rule 2-01 of Regulation S-X. |
| (f) | During the audit of Registrant's financial statements for the most recent fiscal year, less than 50 percent of the hours expended on the principal accountant's engagement were attributed to work performed by persons other than the principal accountant's full-time, permanent employees. |
| (g) | For the Registrant’s fiscal years ended September 30, 2019 and September 30, 2018, the aggregate non-audit fees for services billed by the Registrant’s accountant for services rendered to the Registrant and rendered to the Registrant’s investment adviser (not including any sub-adviser whose role is primarily portfolio management and is subcontracted with or overseen by another investment adviser) and any entity controlling, controlled by, or under common control with the adviser that provides ongoing services to the Registrant were $0 and $0, respectively. |
| (h) | The Registrant's audit committee has considered whether the provision of non-audit services to the Registrant's investment adviser (not including any sub-adviser whose role is primarily portfolio management and is subcontracted with or overseen by another investment adviser), and any entity controlling, controlled by, or under common control with the investment adviser that provides ongoing services to the Registrant, that were not pre-approved pursuant to paragraph (c)(7)(ii) of Rule 2-01 of Regulation S-X, is compatible with maintaining the principal accountant's independence. |
Item 5. Audit Committee of Listed Registrants.
Not applicable to the Registrant.
Item 6. Investments.
| (a) | The schedule of investments is included as part of the Reports to Stockholders filed under Item 1 of this report. |
| (b) | Not applicable to the Registrant. |
Item 7. Disclosure of Proxy Voting Policies and Procedures for Closed-End Management Investment Companies.
A. GENERAL POLICY
Rule 206(4)-6 requires a registered investment adviser that exercises voting authority over Client securities to implement proxy voting policies and describe those policies to their Clients. In any instance in which Resource Real Estate Diversified Income Fund or Resource Credit Income Fund (individually “Client” or collectively “Clients”) owns any class of shares of a portfolio company for which proxies are solicited, the applicable Adviser will vote proxies for such shares on behalf of its Clients in accordance with these Proxy Voting Policies and Procedures.
Resource Real Estate, LLC’s and Resource Alternative Advisor, LLC’s (individually “Adviser” or collectively “Advisers”) general policy is to vote proxies in a manner that serves the best interest of the Client and in accordance with the Client’s governing documents, as determined by the applicable Adviser in its discretion, taking into account relevant factors, including:
| ● | The impact on the value of the returns to the relevant Client; |
| ● | Alignment of the interest of the issuer’s management with the relevant Client’s interest, including establishing appropriate incentives for management; |
| ● | The ongoing relationship between the relevant Client and issuer in which it invests, including the continued or increased availability of information; and |
| ● | Industry and business practices. |
In addition, the Advisers pay particular attention to the following matters in exercising their proxy voting responsibilities as a fiduciary for their Clients:
| ● | Accountability. Each company should have effective means in place to hold those entrusted with running a company’s business accountable for their actions. Management of a company should be accountable to its board of directors and the board should be accountable to shareholders. |
| ● | Alignment of Management and Shareholder Interests. Each company should endeavor to align the interests of management and the board of directors with the interests of the company’s shareholders. For example, we generally believe that compensation should be designed to reward management for doing a good job of creating value for the shareholders of the company. |
| ● | Transparency. Promotion of timely disclosure of important information about a company’s business operations and financial performance enables investors to evaluate the performance of a company and to make informed decisions about the purchase and sale of a company’s securities. |
B. SUMMARY OF PROXY VOTING GUIDELINES
1. ELECTION OF THE BOARD OF DIRECTORS
The Advisers believe that good corporate governance generally starts with a board composed primarily of independent directors, unfettered by significant ties to management, all of whose members are elected annually. The Advisers also believe that some measure of turnover in board composition typically promotes more independent board action and fresh perspectives on governance. Of greater importance is the skill set of the proposed board member. The Advisers will also look at the backgrounds of the directors to gauge their business acumen and any special talent or experience that may add value to their participation on the board.
The election of a company’s board of directors is one of the most fundamental rights held by shareholders. Because a classified board structure prevents shareholders from electing a full slate of directors annually, we will pay special attention to efforts to declassify boards or other measures that permit shareholders to remove a majority of directors at any time.
2. APPROVAL OF INDEPENDENT AUDITORS
The Advisers believe that the relationship between a company and its auditors should be limited primarily to the audit engagement, although it may include certain closely related activities that do not raise an appearance of impaired independence.
The Advisers will evaluate on a case-by-case basis instances in which the audit firm has a substantial non-audit relationship with a company to determine whether we believe independence has been, or could be, compromised.
3. EQUITY-BASED COMPENSATION PLANS
The Advisers believe that appropriately designed equity-based compensation plans, approved by shareholders, can be an effective way to align the interests of shareholders and the interests of directors, management, and employees by providing incentives to increase shareholder value. Conversely, the Advisers are opposed to plans that substantially dilute ownership interests in the company, provide participants with excessive awards, or have inherently objectionable structural features.
The Advisers will generally support measures intended to increase stock ownership by executives and the use of employee stock purchase plans to increase company stock ownership by employees. These may include:
| ● | Requiring senior executives to hold stock in a company. |
| ● | Requiring stock acquired through option exercise to be held for a certain period of time. |
These are guidelines, and we consider other factors, such as the nature of the industry and size of the company, when assessing a plan’s impact on ownership interests.
4. CORPORATE STRUCTURE
The Advisers view the exercise of shareholders’ rights, including the rights to act by written consent, to call special meetings and to remove directors, to be fundamental to good corporate governance.
Because classes of common stock with unequal voting rights limit the rights of certain shareholders, the Advisers generally believe that shareholders should have voting power equal to their equity interest in the company and should be able to approve or reject changes to a company’s by-laws by a simple majority vote.
The Advisers will generally support the ability of shareholders to cumulate their votes for the election of directors.
5. SHAREHOLDER RIGHTS PLANS
There are arguments both in favor of and against shareholder rights plans, also known as poison pills. For example, such measures may tend to entrench or provide undue compensation to current management, which the Advisers generally consider to have a negative impact on shareholder value. Therefore, the Advisers’ preference is for a plan that places shareholder value in a priority position above interests of management.
C. CONFLICTS OF INTEREST
As stated above, in evaluating how to vote a proxy, the applicable portfolio manager will first determine whether there is a conflict of interest related to the proxy in question between the applicable Adviser and the Clients. This examination will include (but will not be limited to) an evaluation of whether the Adviser (or any affiliate of the Adviser) has any relationship with the company (or an affiliate of the company) to which the proxy relates outside of an investment in such company by a Client of the applicable Adviser.
If a conflict is identified and deemed “material” by the PM, the applicable Adviser will determine whether voting in accordance with the proxy voting guidelines outlined below is in the best interests of the Client (which may include utilizing an independent third party to vote such proxies).
With respect to material conflicts, an Adviser will determine whether it is appropriate to disclose the conflict to affected clients to give such clients the opportunity to vote the proxies in question themselves. However, with respect to ERISA clients whose advisory contract reserves the right to vote proxies when an Adviser has determined that a material conflict exists that affects its best judgment as a fiduciary to the ERISA client, such Adviser will:
| ● | Give the ERISA client the opportunity to vote the proxies in question themselves; or |
| ● | Follow designated special proxy voting procedures related to voting proxies pursuant to the terms of the investment management agreement with such ERISA clients (if any). |
D. PROCEDURES FOR PROXIES
An Adviser will generally adhere to the following procedures for voting proxies:
| ● | A written record of each proxy received by the applicable Adviser (on behalf of its Clients) will be kept in such Adviser’s files; |
| ● | Prior to voting any proxies, the applicable portfolio manager will determine if there are any conflicts of interest related to the proxy in question in accordance with the general guidelines set forth above. If a conflict is identified, the applicable portfolio manager will then make a determination (which may be in consultation with outside legal counsel) as to whether the conflict is material. |
E. RECORD OF PROXY VOTING
The applicable Adviser and the CCO will be responsible for maintaining files relating to its proxy voting procedures. Records will be maintained and preserved for five years from the end of the fiscal year during which the last entry was made on a record, with records for the first two years kept in the offices of the Adviser. Records of the following will be included in the files:
| ● | Copies of these proxy voting policies and procedures, and any amendments thereto; |
| ● | A copy of each proxy statement that an Adviser received; provided, however, that the Adviser may rely on obtaining a copy of proxy statements from the SEC’s EDGAR system for those proxy statements that are so available; |
| ● | With respect to DIF and CIF, a copy of the most recently filed Form N-PX, which will be available to Clients upon request; |
| ● | A record of each vote that an Adviser casts; |
| ● | A copy of any document that an Adviser created that was material to making a decision how to vote the proxies, or memorializes that decision (if any); and |
| ● | A copy of each written request for information on how an Adviser voted such client’s proxies and a copy of any written response to any request for information on how an Adviser voted proxies on behalf of clients. |
Item 8. Portfolio Managers of Closed-End Management Investment Companies.
Justin Milberg serves as a Portfolio Manager of the Fund and has served in this capacity since February 2017. Mr. Milberg has served as Chief Operating Officer, Resource Liquid Alternatives (a business unit of Resource America, Inc.) since November 2014 to July 2018 and President since July 2018. Mr. Milberg has over 20 years of experience in financial services and joined Resource America, Inc. in April of 2012 with the title of Managing Director, Resource Financial Fund Management. Prior to joining Resource America, Inc., Mr. Milberg was a Managing Director of the Financial Institutions Group at Bank of America Merrill Lynch from March 2005 until July 2011. Previously, Mr. Milberg was a Managing Director at Lazard Freres from April 2002 until March 2005. Mr. Milberg earned a Bachelor of Arts degree in Economics from Cornell University and a Master of Business Administration from the Wharton School of Business.
As of September 30, 2019, Mr. Milberg owned between $50,001 and $100,000 in Fund shares.
As of September 30, 2019, in addition to the Fund, Mr. Milberg manages $267.35 million for one other registered investment company, the Resource Credit Income Fund.
Gene Nusinzon serves as a Portfolio Manager for the Fund and has served in that capacity since August 2017. Mr. Nusinzon has over 10 years of experience as a business and financial analyst and joined the Adviser in August 2017. Prior to joining the Adviser, Mr. Nusinzon was a Senior Equity Research Associate at J.P. Morgan Securities from May 2014 until August 2017 and was a Senior Credit Rating Agency Analyst at Standard & Poor’s Financial Services from July 2009 until May 2014. Mr. Nusinzon earned a Bachelor of Science degree in Computer Science from Pennsylvania State University and a Master of Business Administration degree with a triple specialization in Finance, Accounting and Management from New York University’s Leonard N. Stern School of Business.
As of September 30, 2019, Mr. Nusinzon owned owned between $0 and $50,000 in Fund shares.
As compensation, Mr. Milberg and Mr. Nusinzon receive fixed base salaries and retirement account matching benefits. Mr. Milberg and Mr. Nusinzon are also entitled to receive discretionary bonuses which may be based upon, among other things, each of their individual performance and the performance of the Fund and Adviser.
Item 9. Purchases of Equity Securities by Closed-End Management Investment Company and Affiliates Purchasers.
None.
Item 10. Submission of Matters to a Vote of Security Holders.
None.
Item 11. Controls and Procedures.
| (a) | Based on an evaluation of the Registrant’s disclosure controls and procedures as of a date within 90 days of the filing date of this report, the Registrant’s principal executive officer and principal financial officer have concluded that the disclosure controls and procedures are reasonably designed to ensure that the information required in filings on Form N-CSR is recorded, processed, summarized and reported by the filing date, including that information required to be disclosed is accumulated and communicated to the Registrant’s management, including the Registrant’s principal executive officer and principal financial officer, as appropriate to allow timely decisions regarding required disclosure. |
| (b) | There were no significant changes in the Registrant’s internal control over financial reporting that occurred during the Registrant’s last fiscal half-year that have materially affected, or are reasonably likely to materially affect, the Registrant’s internal control over financial reporting. |
Item 12. Disclosure of Securities Lending Activities for Closed-End Management Investment Companies.
None.
Item 13. Exhibits.
| (a)(1) | Registrant’s Code of Ethics was previously filed December 3, 2018 in the Registrant’s Certified Shareholder Report on Form NCSR and is hereby incorporated by reference. |
| (a)(2) | Certifications required by Item 13(a)(2) of Form N-CSR are filed herewith as Exhibit 99.CERT. |
| (b) | The certifications for the Registrant’s Principal Executive Officer and Principal Financial Officer, as required by Rule 30a-2(b) of the Investment Company Act of 1940, as amended, and Section 906 of the Sarbanes-Oxley Act of 2002 are attached hereto as Exhibit 99.906.CERT. |
SIGNATURES
Pursuant to the requirements of the Securities Exchange Act of 1934 and the Investment Company Act of 1940, the Registrant has duly caused this report to be signed on its behalf by the undersigned, thereunto duly authorized.
| RESOURCE REAL ESTATE DIVERSIFIED INCOME FUND |
| | | |
| By: | /s/ Alan Feldman | |
| | Alan Feldman | |
| | Chief Executive Officer (Principal Executive Officer) |
Date: December 4, 2019
Pursuant to the requirements of the Securities Exchange Act of 1934 and the Investment Company Act of 1940, this report has been signed below by the following persons on behalf of the Registrant and in the capacities and on the dates indicated.
| By (Signature and Title) | |
| | | |
| By: | /s/Alan Feldman | |
| | Alan Feldman | |
| | Chief Executive Officer (Principal Executive Officer) |
Date: December 4, 2019
| By (Signature and Title) | |
| | | |
| By: | /s/ Steven R. Saltzman | |
| | Steven Saltzman | |
| | Treasurer (Principal Financial Officer) |
Date: December 4, 2019