Table of Contents
UNITED STATES
SECURITIES AND EXCHANGE COMMISSION
Washington, D.C. 20549
FORM N-CSR
CERTIFIED SHAREHOLDER REPORT OF REGISTERED
MANAGEMENT INVESTMENT COMPANIES
Investment Company Act file number 811-22743
Blackstone Alternative Investment Funds
(Exact Name of Registrant as Specified in Charter)
345 Park Avenue
28th Floor
New York, NY 10154
(Address of Principal Executive Offices)
Registrant’s telephone number, including area code: (212) 583-5000
Peter Koffler, Esq.
c/o Blackstone Alternative Investment Advisors LLC
345 Park Avenue
28th Floor
New York, NY 10154
(Name and Address of Agent for Service)
With a copy to:
James E. Thomas, Esq.
Ropes & Gray LLP
Prudential Tower
800 Boylston Street
Boston, MA 02199-3600
Date of fiscal year end: March 31
Date of reporting period: March 31, 2023
Table of Contents
Item 1. Reports to Stockholders.
| (a) | The following is a copy of the report transmitted to shareholders pursuant to Rule 30e-1 under the Investment Company Act of 1940, as amended (the “1940 Act”): |
| (b) | Not applicable. |
Table of Contents
Blackstone
|
Blackstone Alternative Multi-Strategy Fund
a series of Blackstone Alternative Investment Funds
Annual Report For the Year Ended March 31, 2023
|
Table of Contents
| 1 | |||||
| 7 | |||||
| 8 | |||||
| 12 | |||||
| 246 | |||||
| 248 | |||||
| 249 | |||||
| 251 | |||||
| 253 | |||||
| 256 | |||||
| 287 | |||||
| 288 | |||||
| 289 |
All investors should consider the investment objectives, risks, charges and expenses of the Blackstone Alternative Multi-Strategy Fund (the “Fund”) carefully before investing. The prospectus and the summary prospectus contain this and other information about the Fund. You can obtain a prospectus and a summary prospectus from the Fund’s website (www.bxmix.com). All investors are urged to carefully read the prospectus and the summary prospectus in its entirety before investing. Interests in the Fund are offered through Blackstone Securities Partners L.P., a member of FINRA and an affiliate of Blackstone Alternative Investment Advisors LLC, the Fund’s investment adviser (“BAIA” or the “Investment Adviser”).
Important Risks: An investment in the Fund should be considered a speculative investment that entails substantial risks; you may lose part or all of your investment or your investment may not perform as well as other investments. The Fund’s investments involve special risks including, but not limited to, loss of all or a significant portion of the investment due to leveraging, short-selling, or other speculative practices lack of liquidity and volatility of returns. The following is a summary description of certain additional principal risks of investing in the Fund:
Allocation Risk - BAIA’s judgment about the attractiveness, value or market trends affecting a particular asset class, investment style, sub-adviser or security may be incorrect and this may have a negative impact upon performance. Debt Securities Risk - investments in debt securities, such as bonds and certain assetbacked securities involve certain risks which may cause the securities to lose value, including credit risk, liquidity risk, extension risk, interest rate risk, prepayment risk, event risk, inflation risk, and variable and floating rate instrument risk. Derivatives Risk - the use of derivatives involves the risk that their value may not move as expected relative to the value of the relevant underlying assets, rates, or indices. Derivatives can be volatile and illiquid, can subject to counterparty credit risk, and may entail investment exposure greater than their notional amount. Distressed Securities Risk - investments in securities of business enterprises involved in workouts, liquidations, reorganizations, bankruptcies and similar situations involve a high degree of risk of loss since there is typically substantial uncertainty concerning the outcome of such situations. Equity Securities Risk - there is a risk of loss associated with price fluctuations of equity and preferred securities which change based on a company’s financial condition and overall market and economic environment. Event-Driven Trading Risk - involves the risk that the specific event identified may not occur as anticipated and that this may have a negative impact upon the market price of the securities involved. Foreign Investments/Emerging Markets Risk - involves special risks caused by foreign political, social and economic factors, including exposure to currency fluctuations, less liquidity, less developed and less efficient trading markets, political instability and less developed legal and auditing standards. High Portfolio Turnover Risk - active trading of securities can increase transaction costs (thus lowering performance) and taxable distributions. Inflation Risk - Inflation, and investors’ expectation of future inflation, can impact the current value of portfolio investments, resulting in lower asset values and losses to Fund investors. Investment Style Risk - Different investment styles tend to shift in and out of favor depending on market and economic conditions and investor sentiment, and the Fund could underperform other funds that invest in similar asset classes but employ different investment styles.
Table of Contents
Large Purchase and Redemption Risk - large purchase or redemption activity could result in the Fund incurring additional costs, selling portfolio securities, investing cash, or holding a relatively large amount of cash at times when it would not otherwise do so, which could have an adverse effect on performance. Leverage Risk - use of leverage can produce volatility and may exaggerate changes in the net asset value of Fund shares and in the return on the Fund’s portfolio, which may increase the risk that the Fund will lose more than it has invested. Liquidity Risk - some securities held by the Fund, including, but not limited to, restricted, distressed, non-exchange traded, and/or privately placed securities, may be difficult to sell, or illiquid, particularly during times of market turmoil. Illiquid securities may be difficult to value and if the Fund is forced to sell an illiquid asset to meet redemption requests or other cash needs, the Fund may be forced to sell at a loss. Market Risk and Selection Risk - one or more markets in which the Fund invests may go down in value, possibly sharply and unpredictably, affecting the values of individual securities held by the Fund. Significant shocks to or disruptions of the financial markets or the real economy could adversely affect the liquidity and volatility of securities held by the Fund. Mortgage- and Asset-Based Securities Risk - these securities are subject to credit, interest rate, valuation, liquidity, prepayment and extension risks. These securities also are subject to risk of default on the underlying mortgage or asset, particularly during periods of economic downturn. Small movements in interest rates may quickly and significantly reduce the value of certain mortgage-backed securities. Model and Technology Risk - involves the risk that model-based strategies, data gathering systems, order execution and trade allocation systems and risk management systems may not be successful on an ongoing basis or could contains errors, omissions, imperfections or malfunctions. Multi-Manager Risk - managers may make investment decisions which conflict with each other and as a result, the Fund could incur transaction costs without accomplishing any net investment result.
Table of Contents
BLACKSTONE ALTERNATIVE INVESTMENT FUNDS
Dear Blackstone Investor,
We are pleased to present this annual shareholder report for Blackstone Alternative Investment Funds (“BAIF”) and its series, Blackstone Alternative Multi-Strategy Fund (the “Fund”). This report includes portfolio commentary, a listing of the Fund’s investments, and the Fund’s audited financial statements. The audited financial statements for the Fund cover the period from April 1, 2022 to March 31, 2023 (the “Reporting Period”).
The Fund’s investment objective is to seek capital appreciation. The Fund seeks to achieve this objective by allocating its assets among a variety of nontraditional, or “alternative,” investment strategies. Blackstone Alternative Investment Advisors LLC (the “Investment Adviser” or “BAIA”) determines the allocations of the Fund’s assets and allocates a majority of the Fund’s assets among a number of affiliated and unaffiliated sub-advisers (each, a “Sub-Adviser” and together, the “Sub-Advisers”) with experience managing alternative investment strategies and among investment funds generally employing alternative investment strategies. BAIA also manages a portion of the Fund’s assets directly and, from time to time, may instruct Sub-Advisers with respect to particular investments.1 The Investment Adviser may allocate the Fund’s assets among discretionary and non-discretionary Sub-Advisers. Each discretionary Sub-Adviser is responsible for the day-to-day management of the portion of Fund’s assets that the Investment Adviser allocates to it. The Investment Adviser has responsibility to oversee each Sub-Adviser, subject to the ultimate oversight of the Fund’s Board of Trustees. The Investment Adviser is also responsible for recommending the hiring, termination, and replacement of Sub-Advisers. In pursuing the Fund’s investment objective, BAIA focuses on the mitigation of market risk and seeks to maintain an investment portfolio with, on average, lower volatility relative to the broader equity markets.
Fund Performance2
The Reporting Period was comprised of two consecutive quarters of global equity market decline followed by two consecutive quarters of appreciation, resulting in mixed, yet ultimately negative, performance across financial assets. Increasing inflation became exacerbated by the geopolitical events that kicked off in the beginning of 2022, which brought heightened focus towards economic data and decisions coming out of a firmly hawkish Federal Reserve (the “Fed”). The Fund’s collection of alternative strategies and hedge fund vehicles, in the aggregate, exhibited negative returns over the Reporting Period but still outperformed the broader hedge fund universe by 0.70%.3 As we look ahead to the next 12 months, we intend to continue leveraging our due diligence, risk management, and investment expertise, accumulated over our 25+ years’ experience in alternative investing, to identify compelling investment strategies and skilled Sub-Advisers that we believe may advance the Fund in pursuit of its objective.
| 1 | BAIA manages a portion of the Fund’s assets directly. Such investments include, among other things, allocations to funds managed by Asgard Asset Management, Aeolus Capital Management Ltd., PIMCO Investment Management Company LLC, Islet Management, L.P., Atreides Management, L.P., Rokos Capital Management LLP, and opportunistic trades. |
| 2 | Performance is shown net of the Expense Ratio less waived expenses for Class I shares. Performance data quoted represents past performance and does not guarantee future results. The investment return and principal value of an investment will fluctuate so that an investor’s shares, when redeemed, may be worth more or less than their original cost and current performance may be lower or higher than the performance data above. There can be no assurance that the Fund will achieve its goals or avoid losses. Because of the historically broadly diversified and low beta nature of the portfolio, the Fund is not expected to participate in the full upside of broader equity and fixed income markets. The indices referenced herein are not benchmarks or targets for the Fund. |
| 3 | As measured by the HFRX Global Hedge Fund Index. |
1
Table of Contents
During the Reporting Period, the Fund generated a cumulative return, net of fees and expenses, of -2.77%. Over the same period, the HFRX Global Hedge Fund Index, a measure of hedge fund performance, returned -3.47%; the MSCI World Total Return Index, a measure of global equity market performance, returned -6.54%; and the Bloomberg Barclays Global Aggregate Bond Index, a measure of investment grade bond performance, returned -8.07%.4
Market and Portfolio Commentary
The Reporting Period was characterized by elevated volatility amidst a highly uncertain macroeconomic environment. Increasing worries of inflation and geopolitical events drove market sentiment towards a negative tilt as equity valuations contracted and growth expectations waned. Decisions of monetary policy in response to rising inflation likely had a great deal of influence on market direction as the Fed attempted to get inflation back to its desired target rate. However, the tightening of financial conditions have begun to demonstrate results in some unexpected ways, as seen in the U.S. regional banking crisis that began in the first quarter of 2023. While the banking situation has seemingly been contained after government intervention, fears of a recession have not yet dissipated, making readings of economic data and monetary policy decisions key components to watch over the course of the next 12 months.
The beginning of the Reporting Period commenced with a continuation of global macroeconomic uncertainty in the second quarter of 2022. Major equity indices moved into bear market territory with the MSCI World index returning -16.05% on the quarter, bringing year to date returns to -20.29%.5 The impacts of rising inflation, lingering effects of geopolitical events, and a more aggressive tone to monetary policy likely weighed on asset prices entering the second quarter as fears of a potential recession crept into the news cycle. Reverberations from the ongoing Russia-Ukraine conflict, along with supply chain disruptions in China, exacerbated inflationary pressures. In fact, the U.S. Consumer Price Index (“CPI”) rose 9.1% year-over-year (“YoY”) in June–the highest reading since November 1981.6 While there was potential for some of the supply-driven issues related to inflation to fade throughout the remainder of 2022, these inflationary pressures had major implications for monetary policy. At the same time, the labor market remained tight, demonstrated by the 3.6% unemployment rate posted in May (just above its 50-year low in 2019).7 While the labor market was a boon to the labor force, the excess demand for workers had potential to contribute to continued gains in wages. A trend of sustained wage growth could limit the possibility of inflation receding to a more manageable level in the near-term, likely contributing to a more aggressive leaning Fed. The Fed reaffirmed its hawkish stance in the second quarter amongst a strong labor market and persistent inflation, increasing the federal funds rate by 50bps in May, the largest increase to the target rate in 22 years.8 In the subsequent June Federal Open Market Committee (“FOMC”) meeting, the federal funds rate was raised 75bps and the Fed announced its intention to increase the pace of quantitative tightening to up to $95 billion/month by September.9 On the back of this monetary policy development, bond yields continued to climb in the second quarter, resulting in negative returns across fixed income markets.10 Combine that with the poor performance of equity markets, and the result was the worst year-to-date (“YTD”) performance for the 60/40 portfolio since the 1960s.11 With the uncertain global macroeconomic environment, the general outlook for the U.S. economy had begun to teeter. In gauging the risk of a recession, we focused on several indicators,
| 4 | The volatility of the indices presented may be materially different from that of the performance of the Fund. In addition, the indices employ different investment guidelines and criteria than the Fund; as a result, the holdings in the Fund may differ significantly from the securities that comprise the indices. The indices have not been selected to represent benchmarks for the Fund, but rather are disclosed to allow for comparison of the Fund’s performance to that of well-known and widely recognized indices. In the case of equity indices, performance of the indices reflects the reinvestment of dividends. |
| 5 | Source: Bloomberg as of June 30, 2022. |
| 6 | Source: Bureau of Labor Statistics: Consumer Price Index as of June 10, 2022. |
| 7 | Source: United States Bureau of Labor Statistics as of June 3, 2022. |
| 8 | Federal Open Market Committee as of May 4, 2022. |
| 9 | Federal Open Market Committee as of June 15, 2022. |
| 10 | Source: J.P. Morgan: “Economic & Market Update” as of June 30, 2022. |
| 11 | Deutsche Bank, as of July 4, 2022. |
2
Table of Contents
one of which being the signal from the yield curve.12 The 10s/2s12 portion of the curve briefly inverted in June 2022 for the second time in 3 months. Over the past 50 years, this portion of the curve has inverted six times, and six recessions followed, implying that this may be a signal markets are pricing in economic turmoil.13 While the inversion of the yield curve may suggest an impending economic downturn, there was a potential case for continued near-term momentum in the economy due to the cushion provided by household and corporate balance sheets. Liquid financial assets on household and nonfinancial corporate balances were $5.8 trillion and $1.1 trillion higher in 1Q’22 vs. the same period in 2019.14 While this strong cash buffer may have existed, the personal savings rate had fallen in recent months, implying that households were feeling the effects of higher inflation and lower real wages.15
Global markets continued to decline in the third quarter of 2022, with the MSCI World index returning -6.1% on the quarter, bringing year to date returns to -25.1%.16 Inflation remained at the top of headlines as the market looked to anticipate the Fed’s stance ahead of key meetings in the third quarter, being influenced directionally with their policy decisions. Outside of the United States, rising geopolitical tensions had deteriorated Europe’s economic outlook as the Russia-Ukraine conflict continued to put pressures on supply. Together, these factors posed significant challenges for global markets, likely contributing to negative performance on the quarter. After rallying in July and the first half of August on perceived peak inflation data, major market indices pivoted mid-month to finish broadly lower following hawkish comments from Fed Chairman Jerome Powell that effectively quashed the popular narrative of a near-term pivot in the Fed’s policy stance. The August 10th reading of July CPI at 8.5% (vs. the expected 8.7%)17 added credence to the peak inflation narrative, which hinted at the possibility for the Fed to ease the aggressiveness of their monetary policy decisions through the end of the year. Despite this lower-than-expected CPI reading, Chairman Powell reiterated the need for sustained higher interest rates in an effort to avoid the resurgence of inflation seen in the 1980s after the Fed cut rates prematurely. Following these comments from the Fed, markets sold-off strongly into a multi-week losing streak before bouncing back ahead of the subsequent release of inflation data. The rebound was short lived as markets declined sharply after August CPI numbers came in 20bps higher than expected for both headline (8.3% vs. 8.1%) and Core (6.3% vs. 6.1%).18 Geopolitical events also weighed on major indices as tensions abroad continued to escalate. Russia leaned further into the conflict in Ukraine, holding referendums in occupied territories and announcing a 300,000 person “mobilization” from the general Russian population. Additionally, Russia completely shut off gas flows through the Nord Stream 1 pipeline at the beginning of September, adding to the concerns surrounding the ongoing European energy crisis. While import levels in Liquid Natural Gas (“LNG”) to the region had increased, the supply constraints had seen energy prices rise exponentially (as much as +700% YTD in Germany)19, forcing policy makers to intervene on behalf of households.19 Despite two consecutive quarters of negative growth in gross domestic product (“GDP”)20, the U.S. economy had remained resilient throughout the third quarter on the back of a strong labor market and record high corporate profits. With more jobs added and initial jobless claims low and falling in recent weeks, tight labor markets likely continued to drive elevated wage growth with average hourly earnings having grown 5.2% year-over-year in August and sustained momentum in the U.S. jobs market (315,00 payroll jobs added in August).21 Corporate
| 12 | The yield curve refers to the curve in which the yield of fixed-interest securities is plotted against the length of time they have to run to maturity. The 10s/2s portion of the yield curve refers to the portion of the curve that plots the 10-year treasury rate and the 2-year treasury rate. An inversion of the 10s/2s portion of the curve occurs when the yield of the shorter duration 2-year treasuries is at a higher level than the longer duration 10-year treasuries, creating a negative spread. |
| 13 | Source: Joe Zidle, “The Optimist Plays the Long Game” as of July 4, 2022. |
| 14 | Source: Joe Zidle, “The Optimist Plays the Long Game” as of July 4, 2022. |
| 15 | Source: Blackstone Investment Strategy, Federal Reserve and Haver Analytics, as of March 31, 2022. |
| 16 | Source: Bloomberg as of September 30, 2022. |
| 17 | Source: United States Bureau of Labor Statistics: Consumer Price Index as of August 10, 2022. |
| 18 | Source: United States Bureau of Labor Statistics as of September 13, 2022. |
| 19 | Source: J.P. Morgan: “Exploring the economics of Europe’s energy crisis” as of September 9, 2022. |
| 20 | Source: Joe Zidle, “Play the Hands the Markets Deal” as of October 3, 2022. |
| 21 | Source: US Bureau of Labor Statistics as of July 26, 2022. |
3
Table of Contents
profits in the United States rose 6.2% to $2.53 trillion.22 However stickier inflation, elevated wage growth, and a higher cost of capital were all ingredients that may place downward pressure on profit margins.23 While analysts continued to forecast record profit margins for the S&P 500 next year, the coming earnings season may result in some downward revisions in the coming months.23
Global markets reversed three consecutive quarters of negative performance in the fourth quarter of 2022, with the MSCI World Index returning 9.9% in the fourth quarter, bringing year to date returns to -17.7%.24 As with much of 2022, inflation and the policy direction of the Fed continued to draw the attention of investors through the end of the year. As such, economic data was particularly impactful in a sensitive and volatile market as investors attempted to anticipate a pivot in the Fed’s rate hiking path. Even with the bright spots throughout the fourth quarter, negative performance in equity markets during December ensured that 2022 was the worst year for stocks since 2008.24 The quarter started with a turbulent October for equity markets. On October 13th, September CPI data came in higher than expected for both headline (8.2% vs. 8.1%) and Core (6.6% vs. 6.5%)25, likely prompting equity markets to reach fresh YTD lows on the day.26 However, markets reversed into bullish behavior that continued into the rest of the month with the MSCI World Index returning 7.2% for October.27 Despite the higher-than-expected reading of inflation data, sentiment in the market presumed the Fed was nearing its victory in the war on inflation and consequently approaching the end of the rate hiking cycle. In November, presumptions of peak inflation were bolstered as October CPI (released November 10, 2022) data came in lower than expected for both headline (7.7% vs. 7.9%) and Core (6.3% vs. 6.5%).28 The MSCI World Index finished the month of November up 7.00%, marking two strong months of equity performance in the fourth quarter.29 Ideas of inflation potentially receding likely boosted investor sentiment in October and November despite the Fed implementing a 75bps rate hike in November.30 Positive performance in equity markets followed FOMC commentary alluding to the possibility of a more dovish outlook should key statistics (unemployment, inflation, etc.) show signs of easing. The uptrend continued into December, likely in anticipation of a more dovish Fed. The hopes brought on by the 50bps increase at the December FOMC meeting were quickly dashed as Chairman Powell reemphasized the need for continued higher rates until inflation showed stronger signs of waning.31 Equity markets declined for the remainder of the year, with the MSCI World Index returning -4.12% on the month.24 The U.S. economic situation had shown evidence it had remained resilient, reversing two consecutive quarters of negative GDP growth with a positive revision of 3.2% for the third quarter.32 However, the effects of tighter financial conditions had begun to show. Increased borrowing costs were starting to take their toll on housing activity and the appreciation of the U.S. dollar was potentially weighing on U.S. corporate profit margins.33 With the Fed potentially approaching peak rates within the next 12-18 months, equity market discourse had begun to focus more on the coming earnings season.33
Global markets started 2023 with positive performance in the first quarter, with the MSCI World Index returning 7.9%.34 While performance was positive during the first quarter, inflation and monetary policy continued to be a focus in the beginning of 2023. Readings of economic data and FOMC meetings were accompanied by instances of heightened volatility indicating that the market is probably sensitive to the status of inflation and the accompanying views of the Fed. Financial assets experienced a broad rally in
| 22 | Source: US Bureau of Economic Analysis as of October 5, 2022. |
| 23 | Source: Joe Zidle, “Play the Hands the Markets Deal” as of October 3, 2022. |
| 24 | Source: Bloomberg as of December 31, 2022. |
| 25 | Source: United States Bureau of Labor Statistics: Consumer Price Index as of October 13, 2022. |
| 26 | Source: Bloomberg as of October 13, 2022. |
| 27 | Source: Bloomberg as of October 31, 2022. |
| 28 | Source: United States Bureau of Labor Statistics: Consumer Price Index as of November 10, 2022. |
| 29 | Source: Bloomberg as of November 30, 2022. |
| 30 | Source: Federal Open Market Committee as of November 2, 2022. |
| 31 | Source: Federal Open Market Committee as of December 14, 2022. |
| 32 | Source: Bureau of Economic Analysis as of December 12, 2022. |
| 33 | Source: New York Times: “Wall Street Braces for a Weak Earnings Season” as of January 9, 2023. |
| 34 | Source: Bloomberg as of March 31, 2023. |
4
Table of Contents
January as expectations of falling inflation cast doubt over the Fed’s target terminal rate and the possibility of a coming recession. December CPI released on January 12th came in line with consensus for both headline (6.5% vs. 6.5%) and Core (5.7% vs. 5.7%)35, possibly contributing the rally across assets. Bullish sentiment continued into the beginning of February as the market anticipated the outcome of the next FOMC meeting. On February 1st, the Fed raised the Fed Funds rate 25bps36, which was accompanied by dovish commentary from Chairman Powell during the subsequent press conference. However, hopes for a more dovish Fed in 2023 were short lived as January CPI released on February 14th came in hotter than expected for both Headline (+6.4% YoY vs. 6.2% expected) and Core (5.6% YoY vs. 5.5% expected).37 In light of new data, Fed rhetoric pivoted back to hawkish, with commentary from members pushing likelihood for a 50bp rate hike at the March meeting over 50%.38 Global markets reversed the positive performance seen in January, with the MSCI World Index and the Barclays Global Aggregate Index finishing the month down -2.5% and -3.5%, respectively.39 While the month’s inflation data and the public viewpoints of committee members likely would have led to a reinforcement of Fed hawkishness, the failure of Silicon Valley Bank and Signature Bank on the weekend of March 10th introduced new considerations for financial markets in the first quarter. The failure of Silicon Valley Bank that likely triggered the subsequent stress on the regional banking system appeared to be due to the rate sensitivity of both its assets and liabilities that became mismatched during the aggressive rate hiking cycle.40 As this knowledge became public, expectations of a 50bp rate hike in the March FOMC meeting quickly reversed to expectations of 25bps or a pause in rate hikes.41 On March 22nd, the Fed raised the Fed Funds rate by another 25bps, making the target range 4.75%-5.00%.42 While the Fed affirmed their position on returning inflation to a 2% target over time, Chairman Powell emphasized that the tightening of lending practices coming out of the stress on regional banks would be taken into consideration when implementing monetary policy going forward.43 The market likely interpreted these comments to be dovish as the broader market rallied through the end of the quarter, with the MSCI World Index and Barclays Global Aggregate both finishing March up 3.2%.44 The U.S. economic situation began to show signs of stress as financial conditions have been tightened, most notably through the failures of the regional banks. However, the labor market has remained stubbornly strong with the unemployment rate standing at just 3.6% as of the last reading on March 10th.45 With the Fed firmly committed to its battle against inflation, there will likely be a focus on signs of a weakening labor market and mitigated wage growth as inflation remains elevated above the target rate, in our view.
Over the Reporting Period, the Fund’s Macro strategies detracted from performance (-0.16%). Commodity Energy sub-strategies added to gains, continuing to profit from increased prices in the energy sector resulting from geopolitical events. Additional performance accretion came from active trading in rates during a volatile rate environment during the Reporting Period. Performance for these strategies was slightly offset from trading losses during the regional banking crisis as short interest rate positions suffered. Negative performance in this portion of the book resulted from European sovereign and quasi sovereign debt strategies which detracted as bond spreads widened during certain intervals in 2022. Fund exposure to emerging market debt suffered during the period as rising global yields weighed on emerging market debt price performance.
Quantitative strategies contributed positively to Fund performance (+0.15%) during the Reporting Period. Quantitative trading strategies benefited from the sustained levels of elevated volatility during the Reporting
| 35 | Source: United States Bureau of Labor Statistics: Consumer Price Index as of January 12, 2023. |
| 36 | Source: Federal Open Market Committee as of February 1, 2023. |
| 37 | Source: United States Bureau of Labor Statistics: Consumer Price Index as of February 14, 2023. |
| 38 | Source: Bloomberg Fed Funds Futures as of March 7, 2023. |
| 39 | Source: Bloomberg as of February 28, 2023. |
| 40 | Source: Bloomberg: “Silicon Valley Bank’s Fall and the Way Forward for US Banking” as of April 1, 2023. |
| 41 | Source: Bloomberg: Fed Funds Futures as of March 13, 2023. |
| 42 | Source: Federal Open Market Committee as of March 22, 2023. |
| 43 | Source: Federal Open Market Committee as of March 22, 2023. |
| 44 | Source: Bloomberg as of March 31, 2023. |
| 45 | Source: United States Bureau of Labor Statistics as of March 10, 2023. |
5
Table of Contents
Period, contributing to Fund performance. Much of this performance was driven by strong asset class selection equities in the Technology and Financial sectors. Losses in this portion of the Fund’s portfolio were inversely driven by adverse asset selection during certain months of 2022. Regional exposures to Asian equities detracted from the Fund’s results amid the Chinese equity market sell-off over the period.
Credit strategies contributed positively to performance (+1.04%) during the Reporting Period. Agency mortgage strategies added to performance, benefiting from the Mortgage Basis spread widening throughout the performance period. These gains were slightly offset when the Mortgage Basis spread narrowed in the first quarter of 2023. Relative Value strategies had mixed performance during the Reporting Period, experiencing losses as corporate bond positions declined along with contracting company valuations. However, these strategies ultimately contributed positively to overall performance as several long bond positions gained during broader credit market rebounds in 2022 and the first quarter of 2023 that the strategy was able to capitalize on. Exposures to reinsurance strategies detracted from Fund performance in Q3 2022 as a result of damages from Hurricane Ian towards the end of the third quarter.
Equity strategies were the greatest detractor to Fund performance over the Reporting Period (-0.74%). Equity Long/Short sub-strategies saw mostly negative performance during the period along with the broader decline in global equity markets. Long equity exposures to multiple sectors (Media, Software, Biotech, etc.) suffered, ultimately detracting from overall, Fund performance. Negative performance was offset in some areas, as sector exposures in the Technology, Financials, and Biotech sectors rebounded at points throughout the period. Long exposure to Chinese equities added to losses as the Fund’s positions struggled over the last twelve months.
Sincerely,
| • | Riad Abrahams |
| • | David Ben-Ur |
| • | Max Jaffe |
| • | Ian Morris |
| • | Alberto Santulin |
| • | Winfield Sickles |
| • | Stephen Sullens |
6
Table of Contents
Performance quoted represents past performance, which may be higher or lower than current performance. Past performance is not indicative of future results. Investment returns and principal value of an investment will fluctuate so that an investor’s shares, when redeemed, may be worth more or less than their original cost. The returns shown do not reflect taxes that an investor would pay on fund distributions or on the sale of fund shares. To obtain the most recent month-end performance, visit www.bxmix.com.
Value of a $100,000 Investment Since Inception at Net Asset Value*
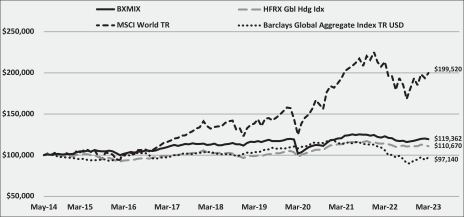
None of the indices presented are benchmarks or targets for the Fund.
| * | The line graph represents historical performance of a hypothetical investment of $100,000 from Inception (June 16, 2014) to March 31, 2023, assuming the reinvestment of distributions. |
Cumulative Total Return
| For the Year Ended March 31, 2023 | Since Inception (June 16, 2014) | |||||||||
Class I Shares (“BXMIX”) | (2.77 | )% | 19.36% | |||||||
HFRX Global Hedge Fund Index | (3.10 | )% | 10.67% | |||||||
MSCI World Total Return Index | (6.54 | )% | 99.52% | |||||||
Bloomberg Barclays Global Aggregate Bond Index | (8.07 | )% | (2.86)% | |||||||
7
Table of Contents
Blackstone Alternative Multi-Strategy Fund and Subsidiaries
March 31, 2023
Geographic Breakdown | Percentage of Total Net Assets | ||||
North America | 89.9 | % | |||
Europe | 2.5 | ||||
Asia | 2.0 | ||||
South America | 1.4 | ||||
Africa | 0.3 | ||||
Middle East | 0.3 | ||||
Other 1, 2 | 13.0 | ||||
Securities Sold Short | (27.3 | ) | |||
Other Assets and Liabilities 3 | 17.9 | ||||
|
| ||||
Total | 100.0 | % | |||
|
| ||||
| 1 | Includes Sovereign Debt, Exchange-Traded Funds, Warrants, Rights, Commodities, Repurchase Agreements and Purchased Options. |
| 2 | See the below table for a geographic breakdown of Sovereign Debt. |
| 3 | Assets, other than investments in securities, net of other liabilities. See Consolidated Statement of Assets and Liabilities. A significant portion of the balance represents cash collateral for derivatives. |
Sovereign Debt Geographic Breakdown | Percentage of Total Net Assets | ||||
Middle East | 1.6 | % | |||
Europe | 1.5 | ||||
North America | 0.5 | ||||
South America | 0.5 | ||||
Africa | 0.4 | ||||
Asia | 0.2 | ||||
|
| ||||
Total | 4.7 | % | |||
|
| ||||
See Notes to Consolidated Financial Statements.
8
Table of Contents
Blackstone Alternative Multi-Strategy Fund and Subsidiaries
Portfolio Information (Continued)
March 31, 2023
Portfolio Composition | Percentage of Total Net Assets | ||||
Mortgage-Backed Securities1 | 50.7 | % | |||
Common Stock | 15.6 | ||||
Investments in Investee Funds | 11.8 | ||||
Corporate Bonds & Notes | 10.2 | ||||
Sovereign Debt | 4.7 | ||||
Bank Debt | 3.7 | ||||
Asset-Backed Securities | 3.4 | ||||
Repurchase Agreement | 2.8 | ||||
U.S. Treasury Notes | 0.5 | ||||
Exchange-Traded Funds | 0.3 | ||||
U.S. Government Sponsored Agency Securities | 0.2 | ||||
Preferred Stock | 0.2 | ||||
Convertible Bonds | 0.1 | ||||
Warrants | 0.0 | 3 | |||
Rights | 0.0 | 3 | |||
Municipals | 0.0 | 3 | |||
Other 2 | 5.2 | ||||
Securities Sold Short | (27.3 | ) | |||
Other Assets and Liabilities 4 | 17.9 | ||||
|
| ||||
Total | 100.0 | % | |||
|
| ||||
| 1 | Includes Agency-Guaranteed TBA securities held long, that are guaranteed by the Federal National Mortgage Association or the Government National Mortgage Association, which represents 44.2% of Total Net Assets. |
| 2 | Includes Commodities and Purchased Options. |
| 3 | Represents less than 0.1%. |
| 4 | Assets, other than investments in securities, net of other liabilities. See Consolidated Statement of Assets and Liabilities. A significant portion of the balance represents cash collateral for derivatives. |
Credit Quality Allocation1 | Percentage of Total Net Assets | ||||
AAA/Aaa2 | 1.5 | % | |||
AA/Aa | 0.1 | ||||
A | 1.1 | ||||
BBB/Baa | 3.3 | ||||
BB/Ba | 4.6 | ||||
BBB/B | 0.3 | ||||
B | 5.8 | ||||
CCC/Caa | 3.5 | ||||
CCC/Ca | 0.2 | ||||
CC/Ca | 0.2 | ||||
C | 0.4 | ||||
D | 0.1 | ||||
Not Rated3 | 51.7 | ||||
Other4 | 27.2 | ||||
|
| ||||
Total Investments in Securities | 100.0 | % | |||
|
| ||||
| 1 | Using the higher of Standard & Poor’s (“S&P’s”) or Moody’s Investor Service (“Moody’s”) ratings. |
| 2 | Includes U.S. Government Sponsored Agency Securities which are deemed AAA/Aaa by the Investment Adviser. |
| 3 | Includes Agency-Guaranteed TBA securities held long, that are guaranteed by the Federal National Mortgage Association or the Government National Mortgage Association, which represents 44.2% of Total Net Assets. |
| 4 | Includes all Non-Fixed Income securities and Fixed Income securities held short. |
Industry | Percentage of Total Net Assets | ||||
Financial Services | 5.1 | % | |||
Software & Technology Services | 2.7 | ||||
Health Care | 2.0 | ||||
Banking | 1.4 | ||||
Media | 1.2 | ||||
Consumer Discretionary Services | 1.0 | ||||
Integrated Oils | 0.8 | ||||
Software & Services | 0.8 | ||||
Refining & Marketing | 0.7 | ||||
See Notes to Consolidated Financial Statements.
9
Table of Contents
Blackstone Alternative Multi-Strategy Fund and Subsidiaries
Portfolio Information (Continued)
March 31, 2023
Industry | Percentage of Total Net Assets | ||||
Tech Hardware & Semiconductors | 0.7 | % | |||
Industrial Products | 0.6 | ||||
Transportation & Logistics | 0.6 | ||||
Health Care Facilities & Services | 0.6 | ||||
Medical Equipment & Devices Manufacturing | 0.6 | ||||
Oil & Gas | 0.6 | ||||
Travel & Lodging | 0.6 | ||||
Industrial Services | 0.6 | ||||
Metals & Mining | 0.5 | ||||
Chemicals | 0.5 | ||||
Retail & Wholesale - Discretionary | 0.5 | ||||
Machinery Manufacturing | 0.5 | ||||
Restaurants | 0.5 | ||||
Internet Media | 0.5 | ||||
Pipeline | 0.4 | ||||
Banks | 0.4 | ||||
Entertainment Resources | 0.3 | ||||
Utilities | 0.3 | ||||
Industrial Other | 0.3 | ||||
Pharmaceuticals | 0.3 | ||||
Real Estate | 0.3 | ||||
Consumer Services | 0.3 | ||||
Airlines | 0.3 | ||||
Materials | 0.2 | ||||
Consumer Discretionary Products | 0.2 | ||||
Property & Casualty Insurance | 0.2 | ||||
Automobiles Manufacturing | 0.2 | ||||
Consumer Products | 0.2 | ||||
Publishing & Broadcasting | 0.2 | ||||
Commercial Finance | 0.2 | ||||
Consumer Finance | 0.2 | ||||
Home Improvement | 0.2 | ||||
Containers & Packaging | 0.2 | ||||
Retail—Consumer Discretionary | 0.2 | ||||
Supermarkets | 0.1 | ||||
Renewable Energy | 0.1 | ||||
Consumer Staple Products | 0.1 | ||||
Construction Materials Manufacturing | 0.1 | ||||
Exploration & Production | 0.1 | ||||
Food & Beverage | 0.1 | ||||
Railroad | 0.1 | ||||
Insurance | 0.1 | ||||
Retail & Wholesale - Staples | 0.1 | ||||
Mining | 0.1 | ||||
Waste & Environmental Services & Equipment | 0.1 | ||||
Private Equity | 0.0 | 1 | |||
See Notes to Consolidated Financial Statements.
10
Table of Contents
Blackstone Alternative Multi-Strategy Fund and Subsidiaries
Portfolio Information (Continued)
March 31, 2023
Industry | Percentage of Total Net Assets | ||||
Power Generation | 0.0 | 1% | |||
Apparel & Textile Products | 0.0 | 1 | |||
Hardware | 0.0 | 1 | |||
Telecommunications | 0.0 | 1 | |||
Manufactured Goods | 0.0 | 1 | |||
Biotechnology & Pharmaceuticals | 0.0 | 1 | |||
Life Insurance | 0.0 | 1 | |||
Other2 | 79.6 | ||||
Securities Sold Short | (27.3 | ) | |||
Other Assets and Liabilities3 | 17.9 | ||||
|
| ||||
Total Investments | 100.0 | % | |||
|
| ||||
| 1 | Represents less than 0.1%. |
| 2 | Includes Asset-Backed Securities, Sovereign Debt, Mortgage-Backed Securities, U.S. Government Sponsored Agency Securities, Exchange-Traded Funds, Warrants, Rights, Investments in Investee Funds, Commodities, Repurchase Agreements and Purchased Options. |
| 3 | Assets, other than investments in securities, net of other liabilities. See Consolidated Statement of Assets and Liabilities. A significant portion of the balance represents cash collateral for derivatives. |
See Notes to Consolidated Financial Statements.
11
Table of Contents
Blackstone Alternative Multi-Strategy Fund and Subsidiaries
Consolidated Schedule of Investments ^
March 31, 2023
Security Description | Shares | Value | ||||||||||
INVESTMENTS IN SECURITIES — 109.4% |
| |||||||||||
COMMON STOCK — 15.6% |
| |||||||||||
Africa — 0.0% |
| |||||||||||
Materials — 0.0% |
| |||||||||||
Gold Fields Ltd., ADR | 17,100 | $ | 227,772 | |||||||||
Harmony Gold Mining Co., Ltd., ADR | 200 | 820 | ||||||||||
IAMGOLD Corp. (a) | 81,100 | 219,781 | ||||||||||
Sasol Ltd., ADR | 300 | 4,095 | ||||||||||
|
| |||||||||||
| 452,468 | ||||||||||||
|
| |||||||||||
Total Africa |
| 452,468 | ||||||||||
|
| |||||||||||
Asia — 0.2% |
| |||||||||||
Consumer Discretionary Products — 0.0% |
| |||||||||||
Kandi Technologies Group, Inc. (a) | 200 | 552 | ||||||||||
Li Auto, Inc., ADR (a) | 24,700 | 616,265 | ||||||||||
NIO, Inc., ADR (a) | 4,400 | 46,244 | ||||||||||
Niu Technologies, ADR (a) | 2,900 | 12,006 | ||||||||||
|
| |||||||||||
| 675,067 | ||||||||||||
|
| |||||||||||
Consumer Discretionary Services — 0.0% |
| |||||||||||
New Oriental Education & Technology Group, Inc., ADR (a) | 31,910 | 1,232,045 | ||||||||||
TAL Education Group, ADR (a) | 90,000 | 576,900 | ||||||||||
|
| |||||||||||
| 1,808,945 | ||||||||||||
|
| |||||||||||
Financial Services — 0.1% |
| |||||||||||
FinVolution Group, ADR | 3,800 | 15,846 | ||||||||||
Futu Holdings Ltd., ADR (a) | 15,800 | 819,230 | ||||||||||
L Catterton Asia Acquisition Corp., Class A (a),(b) | 100,000 | 1,022,500 | ||||||||||
Noah Holdings Ltd., ADR (a) | 1,400 | 23,170 | ||||||||||
|
| |||||||||||
| 1,880,746 | ||||||||||||
|
| |||||||||||
Health Care — 0.0% |
| |||||||||||
Dr Reddy's Laboratories Ltd., ADR | 200 | 11,386 | ||||||||||
I-Mab, ADR (a) | 7,400 | 25,604 | ||||||||||
Sinovac Biotech Ltd. (a),(c) | 200 | 1,294 | ||||||||||
|
| |||||||||||
| 38,284 | ||||||||||||
|
| |||||||||||
Industrial Products — 0.0% |
| |||||||||||
China Yuchai International Ltd. | 245 | 1,933 | ||||||||||
Hollysys Automation Technologies Ltd. | 2,700 | 46,791 | ||||||||||
|
| |||||||||||
| 48,724 | ||||||||||||
|
| |||||||||||
Industrial Services — 0.0% |
| |||||||||||
Euro Tech Holdings Co., Ltd. | 150 | 171 | ||||||||||
|
| |||||||||||
See Notes to Consolidated Financial Statements.
12
Table of Contents
Blackstone Alternative Multi-Strategy Fund and Subsidiaries
Consolidated Schedule of Investments ^ (Continued)
March 31, 2023
Security Description | Shares | Value | ||||||||||
Media — 0.1% | ||||||||||||
Autohome, Inc., ADR | 7,600 | $ | 254,372 | |||||||||
GigaMedia Ltd. (a) | 100 | 142 | ||||||||||
Hello Group, Inc., ADR | 30,000 | 273,000 | ||||||||||
HUYA, Inc., ADR (a) | 1,500 | 5,415 | ||||||||||
iQIYI, Inc., ADR (a) | 70,000 | 509,600 | ||||||||||
Kanzhun Ltd., ADR (a) | 600 | 11,418 | ||||||||||
Tencent Music Entertainment Group, ADR (a) | 137,000 | 1,134,360 | ||||||||||
Weibo Corp., ADR (a) | 2,600 | 52,156 | ||||||||||
|
| |||||||||||
| 2,240,463 | ||||||||||||
|
| |||||||||||
Real Estate — 0.0% |
| |||||||||||
KE Holdings, Inc., ADR (a) | 23,600 | 444,624 | ||||||||||
|
| |||||||||||
Retail & Wholesale—Discretionary — 0.0% |
| |||||||||||
MINISO Group Holding Ltd., ADR | 1,100 | 19,514 | ||||||||||
PDD Holdings, Inc., ADR (a) | 3,000 | 227,700 | ||||||||||
|
| |||||||||||
| 247,214 | ||||||||||||
|
| |||||||||||
Software & Technology Services — 0.0% |
| |||||||||||
Agora, Inc., ADR (a) | 9,600 | 34,752 | ||||||||||
Baozun, Inc., ADR (a) | 2,800 | 16,856 | ||||||||||
Wipro Ltd., ADR | 34 | 153 | ||||||||||
|
| |||||||||||
| 51,761 | ||||||||||||
|
| |||||||||||
Tech Hardware & Semiconductors — 0.0% |
| |||||||||||
ChipMOS Technologies, Inc., ADR | 400 | 10,044 | ||||||||||
Kulicke & Soffa Industries, Inc. | 700 | 36,883 | ||||||||||
MagnaChip Semiconductor Corp. (a) | 6,900 | 64,032 | ||||||||||
NXP Semiconductors NV | 700 | 130,532 | ||||||||||
Silicon Motion Technology Corp., ADR | 1,400 | 91,728 | ||||||||||
United Microelectronics Corp., ADR (a) | 1,300 | 11,388 | ||||||||||
Zepp Health Corp., ADR (a) | 300 | 393 | ||||||||||
|
| |||||||||||
| 345,000 | ||||||||||||
|
| |||||||||||
Total Asia |
| 7,780,999 | ||||||||||
|
| |||||||||||
Europe — 0.4% |
| |||||||||||
Consumer Discretionary Products — 0.0% |
| |||||||||||
On Holding AG, Class A (a) | 24,100 | 747,823 | ||||||||||
|
| |||||||||||
Consumer Discretionary Services — 0.0% |
| |||||||||||
Manchester United PLC, Class A | 3,200 | 70,880 | ||||||||||
|
| |||||||||||
Consumer Staple Products — 0.0% |
| |||||||||||
Coca-Cola Europacific Partners PLC | 3,100 | 183,489 | ||||||||||
See Notes to Consolidated Financial Statements.
13
Table of Contents
Blackstone Alternative Multi-Strategy Fund and Subsidiaries
Consolidated Schedule of Investments ^ (Continued)
March 31, 2023
Security Description | Shares | Value | ||||||||
Nomad Foods Ltd. (a) | 1,900 | $ | 35,606 | |||||||
|
| |||||||||
| 219,095 | ||||||||||
|
| |||||||||
Financial Services — 0.1% |
| |||||||||
AerCap Holdings NV (a) | 37,499 | 2,108,569 | ||||||||
IX Acquisition Corp., Class A (a) | 20,004 | 205,841 | ||||||||
|
| |||||||||
| 2,314,410 | ||||||||||
|
| |||||||||
Health Care — 0.0% |
| |||||||||
Aduro Biotech, Inc. (a),(c) | 1,040 | 0 | ||||||||
Affimed NV (a) | 8,900 | 6,636 | ||||||||
Altamira Therapeutics Ltd. (a) | 15 | 19 | ||||||||
Amarin Corp. PLC, ADR (a) | 56,500 | 84,750 | ||||||||
Artelo Biosciences, Inc. (a) | 494 | 1,146 | ||||||||
ATAI Life Sciences NV (a) | 10,000 | 18,100 | ||||||||
Bicycle Therapeutics PLC, ADR (a) | 3,800 | 80,826 | ||||||||
Compass Pathways PLC, ADR (a) | 2,000 | 19,860 | ||||||||
EDAP TMS SA, ADR (a) | 100 | 1,107 | ||||||||
Galecto, Inc. (a) | 1,000 | 1,990 | ||||||||
Genfit SA, ADR (a) | 100 | 403 | ||||||||
Immunocore Holdings PLC, ADR (a) | 100 | 4,944 | ||||||||
Merus NV (a) | 2,900 | 53,360 | ||||||||
ProQR Therapeutics NV (a) | 8,100 | 17,253 | ||||||||
Prothena Corp. PLC (a) | 5,600 | 271,432 | ||||||||
Verona Pharma PLC, ADR (a) | 6,000 | 120,480 | ||||||||
|
| |||||||||
| 682,306 | ||||||||||
|
| |||||||||
Industrial Products — 0.0% |
| |||||||||
Airbus SE (b) | 13,236 | 1,767,899 | ||||||||
Arrival SA (a) | 27,400 | 3,672 | ||||||||
Luxfer Holdings PLC | 1,400 | 23,660 | ||||||||
|
| |||||||||
| 1,795,231 | ||||||||||
|
| |||||||||
Industrial Services — 0.1% |
| |||||||||
Ardmore Shipping Corp. | 11,200 | 166,544 | ||||||||
Euronav NV | 1,400 | 23,506 | ||||||||
Frontline PLC | 66,300 | 1,097,928 | ||||||||
GasLog Partners LP | 8,500 | 71,570 | ||||||||
Golden Ocean Group Ltd. | 20 | 190 | ||||||||
Scorpio Tankers, Inc. | 17,700 | 996,687 | ||||||||
SFL Corp. Ltd. | 3,100 | 29,450 | ||||||||
StealthGas, Inc. (a) | 1,400 | 3,654 | ||||||||
TORM PLC, Class A | 4,900 | 152,537 | ||||||||
Tsakos Energy Navigation Ltd. | 6,200 | 120,466 | ||||||||
|
| |||||||||
| 2,662,532 | ||||||||||
|
| |||||||||
See Notes to Consolidated Financial Statements.
14
Table of Contents
Blackstone Alternative Multi-Strategy Fund and Subsidiaries
Consolidated Schedule of Investments ^ (Continued)
March 31, 2023
Security Description | Shares | Value | ||||||||||
Materials — 0.0% |
| |||||||||||
ArcelorMittal SA | 32,500 | $ | 978,900 | |||||||||
Orion Engineered Carbons SA | 800 | 20,872 | ||||||||||
|
| |||||||||||
| 999,772 | ||||||||||||
|
| |||||||||||
Oil & Gas — 0.2% |
| |||||||||||
BP PLC (b) | 52,395 | 331,164 | ||||||||||
BP PLC, ADR | 63,600 | 2,412,984 | ||||||||||
Eni SpA (b) | 25,365 | 353,749 | ||||||||||
Equinor ASA (b) | 9,157 | 260,319 | ||||||||||
Shell PLC (b) | 74,204 | 2,126,023 | ||||||||||
TechnipFMC PLC (a) | 109,400 | 1,493,310 | ||||||||||
TotalEnergies SE (b) | 15,288 | 901,437 | ||||||||||
|
| |||||||||||
| 7,878,986 | ||||||||||||
|
| |||||||||||
Renewable Energy — 0.0% |
| |||||||||||
FREYR Battery SA (a) | 9,000 | 80,010 | ||||||||||
|
| |||||||||||
Software & Technology Services — 0.0% |
| |||||||||||
Endava PLC, ADR (a) | 1,300 | 87,334 | ||||||||||
Materialise NV, ADR (a) | 2,800 | 23,240 | ||||||||||
|
| |||||||||||
| 110,574 | ||||||||||||
|
| |||||||||||
Total Europe |
| 17,561,619 | ||||||||||
|
| |||||||||||
Middle East — 0.0% |
| |||||||||||
Consumer Discretionary Products — 0.0% |
| |||||||||||
Mobileye Global, Inc., Class A (a) | 19,796 | 856,573 | ||||||||||
|
| |||||||||||
Health Care — 0.0% |
| |||||||||||
Compugen Ltd. (a) | 9,898 | 6,948 | ||||||||||
Oramed Pharmaceuticals, Inc. (a) | 8,700 | 18,966 | ||||||||||
|
| |||||||||||
| 25,914 | ||||||||||||
|
| |||||||||||
Industrial Products — 0.0% |
| |||||||||||
Camtek Ltd. (a) | 100 | 2,835 | ||||||||||
Ituran Location and Control Ltd. | 200 | 4,356 | ||||||||||
Kornit Digital Ltd. (a) | 7,000 | 135,520 | ||||||||||
|
| |||||||||||
| 142,711 | ||||||||||||
|
| |||||||||||
Industrial Services — 0.0% |
| |||||||||||
ZIM Integrated Shipping Services Ltd. | 300 | 7,074 | ||||||||||
|
| |||||||||||
Materials — 0.0% |
| |||||||||||
Eldorado Gold Corp. (a) | 18,000 | 186,480 | ||||||||||
|
| |||||||||||
See Notes to Consolidated Financial Statements.
15
Table of Contents
Blackstone Alternative Multi-Strategy Fund and Subsidiaries
Consolidated Schedule of Investments ^ (Continued)
March 31, 2023
Security Description | Shares | Value | ||||||||||
Software & Technology Services — 0.0% |
| |||||||||||
JFrog Ltd. (a) | 11,500 | $ | 226,550 | |||||||||
Radware Ltd. (a) | 1,900 | 40,926 | ||||||||||
Sapiens International Corp. NV | 200 | 4,344 | ||||||||||
Wix.com Ltd. (a) | 1,700 | 169,660 | ||||||||||
|
| |||||||||||
| 441,480 | ||||||||||||
|
| |||||||||||
Tech Hardware & Semiconductors — 0.0% |
| |||||||||||
AudioCodes Ltd. | 900 | 13,572 | ||||||||||
Silicom Ltd. (a) | 100 | 3,748 | ||||||||||
|
| |||||||||||
| 17,320 | ||||||||||||
|
| |||||||||||
Telecommunications — 0.0% |
| |||||||||||
Allot Ltd. (a) | 1,300 | 3,497 | ||||||||||
|
| |||||||||||
Total Middle East |
| 1,681,049 | ||||||||||
|
| |||||||||||
North America — 15.0% |
| |||||||||||
Banking — 1.4% |
| |||||||||||
1st Source Corp. | 300 | 12,945 | ||||||||||
ACNB Corp. | 100 | 3,255 | ||||||||||
Alerus Financial Corp. | 400 | 6,420 | ||||||||||
American National Bankshares, Inc. | 18,522 | 587,147 | ||||||||||
Ameris Bancorp | 177,106 | 6,478,537 | ||||||||||
Ames National Corp. | 500 | 10,400 | ||||||||||
Arrow Financial Corp. | 401 | 9,989 | ||||||||||
Banc of California, Inc. | 1,800 | 22,554 | ||||||||||
Bancorp, Inc. (a) | 300 | 8,355 | ||||||||||
Bank of Marin Bancorp | 600 | 13,134 | ||||||||||
Bank of NT Butterfield & Son Ltd. | 200 | 5,400 | ||||||||||
BankFinancial Corp. | 255 | 2,231 | ||||||||||
Bankwell Financial Group, Inc. | 200 | 4,972 | ||||||||||
Banner Corp. | 100 | 5,437 | ||||||||||
Bar Harbor Bankshares | 200 | 5,290 | ||||||||||
BayCom Corp. | 300 | 5,124 | ||||||||||
Blue Ridge Bankshares, Inc. | 200 | 2,040 | ||||||||||
Bridgewater Bancshares, Inc. (a) | 500 | 5,420 | ||||||||||
Brookline Bancorp, Inc. | 2,496 | 26,213 | ||||||||||
Business First Bancshares, Inc. | 1,000 | 17,130 | ||||||||||
Byline Bancorp, Inc. | 1,100 | 23,782 | ||||||||||
Cadence Bank | 21,067 | 437,351 | ||||||||||
Camden National Corp. | 300 | 10,857 | ||||||||||
Capital Bancorp, Inc. | 600 | 9,984 | ||||||||||
Capital City Bank Group, Inc. | 300 | 8,793 | ||||||||||
Capstar Financial Holdings, Inc. | 500 | 7,575 | ||||||||||
Carter Bankshares, Inc. (a) | 700 | 9,800 | ||||||||||
Central Pacific Financial Corp. | 1,600 | 28,640 | ||||||||||
See Notes to Consolidated Financial Statements.
16
Table of Contents
Blackstone Alternative Multi-Strategy Fund and Subsidiaries
Consolidated Schedule of Investments ^ (Continued)
March 31, 2023
Security Description | Shares | Value | ||||||||
Central Valley Community Bancorp | 300 | $ | 6,174 | |||||||
Citigroup, Inc. | 93,758 | 4,396,313 | ||||||||
Civista Bancshares, Inc. | 300 | 5,064 | ||||||||
CNB Financial Corp. | 8,117 | 155,846 | ||||||||
Coastal Financial Corp. (a) | 500 | 18,005 | ||||||||
Codorus Valley Bancorp, Inc. | 100 | 2,075 | ||||||||
Colony Bankcorp, Inc. | 500 | 5,100 | ||||||||
Columbia Banking System, Inc. | 37,465 | 802,500 | ||||||||
Comerica, Inc. | 51,097 | 2,218,632 | ||||||||
Community Trust Bancorp, Inc. | 400 | 15,180 | ||||||||
ConnectOne Bancorp, Inc. | 1,200 | 21,216 | ||||||||
CrossFirst Bankshares, Inc. (a) | 1,200 | 12,576 | ||||||||
Customers Bancorp, Inc. (a) | 1,400 | 25,928 | ||||||||
CVB Financial Corp. | 400 | 6,672 | ||||||||
Eagle Bancorp, Inc. | 1,900 | 63,593 | ||||||||
East West Bancorp, Inc. | 300 | 16,650 | ||||||||
Eastern Bankshares, Inc. | 100 | 1,262 | ||||||||
ECB Bancorp, Inc. (a) | 100 | 1,388 | ||||||||
Equity Bancshares, Inc., Class A | 300 | 7,311 | ||||||||
Esquire Financial Holdings, Inc. | 300 | 11,730 | ||||||||
Farmers National Banc Corp. | 1,500 | 18,960 | ||||||||
Fifth Third Bancorp | 52,427 | 1,396,655 | ||||||||
Financial Institutions, Inc. | 700 | 13,496 | ||||||||
First Bancorp | 600 | 21,312 | ||||||||
First Bancshares, Inc. (The) | 84,037 | 2,170,676 | ||||||||
First Busey Corp. | 1,200 | 24,408 | ||||||||
First Business Financial Services, Inc. | 200 | 6,102 | ||||||||
First Citizens BancShares, Inc., Class A | 1,320 | 1,284,492 | ||||||||
First Community Bankshares, Inc. | 200 | 5,010 | ||||||||
First Community Corp. | 100 | 2,000 | ||||||||
First Financial Bankshares, Inc. | 3,500 | 111,650 | ||||||||
First Financial Corp. | 600 | 22,488 | ||||||||
First Foundation, Inc. | 4,100 | 30,545 | ||||||||
First Hawaiian, Inc. | 700 | 14,441 | ||||||||
First Horizon National Corp. | 79,375 | 1,411,288 | ||||||||
First Internet Bancorp | 200 | 3,330 | ||||||||
First of Long Island Corp. (The) | 600 | 8,100 | ||||||||
Five Star Bancorp | 100 | 2,134 | ||||||||
FS Bancorp, Inc. | 300 | 9,003 | ||||||||
FVCBankcorp, Inc. (a) | 1,175 | 12,514 | ||||||||
German American Bancorp, Inc. | 300 | 10,011 | ||||||||
Great Southern Bancorp, Inc. | 200 | 10,136 | ||||||||
Guaranty Bancshares, Inc. | 200 | 5,574 | ||||||||
Heartland Financial USA, Inc. | 400 | 15,344 | ||||||||
Heritage Commerce Corp. | 6,400 | 53,312 | ||||||||
Heritage Financial Corp. | 2,400 | 51,360 | ||||||||
Hilltop Holdings, Inc. | 58,422 | 1,733,381 | ||||||||
See Notes to Consolidated Financial Statements.
17
Table of Contents
Blackstone Alternative Multi-Strategy Fund and Subsidiaries
Consolidated Schedule of Investments ^ (Continued)
March 31, 2023
Security Description | Shares | Value | ||||||||
HomeTrust Bancshares, Inc. | 600 | $ | 14,754 | |||||||
Hope Bancorp, Inc. | 700 | 6,874 | ||||||||
Horizon Bancorp, Inc. | 1,500 | 16,590 | ||||||||
Independent Bank Corp. | 900 | 15,993 | ||||||||
Independent Bank Group, Inc. | 13,674 | 633,790 | ||||||||
International Bancshares Corp. | 129,310 | 5,537,054 | ||||||||
Investar Holding Corp. | 100 | 1,396 | ||||||||
Kearny Financial Corp. | 700 | 5,684 | ||||||||
Lakeland Bancorp, Inc. | 2,235 | 34,955 | ||||||||
LCNB Corp. | 200 | 3,268 | ||||||||
Live Oak Bancshares, Inc. | 3,900 | 95,043 | ||||||||
Luther Burbank Corp. (a) | 500 | 4,740 | ||||||||
M&T Bank Corp. | 4,879 | 583,382 | ||||||||
Macatawa Bank Corp. | 800 | 8,176 | ||||||||
Mercantile Bank Corp. | 400 | 12,232 | ||||||||
Merchants Bancorp | 650 | 16,926 | ||||||||
Meridian Corp. | 200 | 2,520 | ||||||||
Metrocity Bankshares, Inc. | 300 | 5,127 | ||||||||
Metropolitan Bank Holding Corp. (a) | 800 | 27,112 | ||||||||
Mid Penn Bancorp, Inc. | 400 | 10,244 | ||||||||
Midland States Bancorp, Inc. | 800 | 17,136 | ||||||||
MidWestOne Financial Group, Inc. | 200 | 4,884 | ||||||||
NBT Bancorp, Inc. | 300 | 10,113 | ||||||||
Northeast Bank | 100 | 3,366 | ||||||||
Northrim BanCorp, Inc. | 400 | 18,872 | ||||||||
OceanFirst Financial Corp. | 2,000 | 36,960 | ||||||||
OFG Bancorp | 2,400 | 59,856 | ||||||||
Old Second Bancorp, Inc. | 2,400 | 33,744 | ||||||||
OP Bancorp | 200 | 1,782 | ||||||||
Origin Bancorp, Inc. | 100 | 3,215 | ||||||||
PacWest Bancorp | 24,000 | 233,520 | ||||||||
PCB Bancorp | 700 | 10,143 | ||||||||
Peapack Gladstone Financial Corp. | 23,381 | 692,545 | ||||||||
Peoples Bancorp, Inc. | 1,200 | 30,900 | ||||||||
Pinnacle Financial Partners, Inc. | 43,856 | 2,419,097 | ||||||||
PNC Financial Services Group, Inc. | 19,151 | 2,434,092 | ||||||||
Preferred Bank | 400 | 21,924 | ||||||||
Premier Financial Corp. | 48 | 995 | ||||||||
Primis Financial Corp. | 700 | 6,741 | ||||||||
Provident Bancorp, Inc. | 700 | 4,788 | ||||||||
QCR Holdings, Inc. | 200 | 8,782 | ||||||||
RBB Bancorp | 400 | 6,200 | ||||||||
Renasant Corp. | 1,600 | 48,928 | ||||||||
Republic First Bancorp, Inc. (a) | 3,400 | 4,624 | ||||||||
Riverview Bancorp, Inc. | 200 | 1,068 | ||||||||
S&T Bancorp, Inc. | 600 | 18,870 | ||||||||
See Notes to Consolidated Financial Statements.
18
Table of Contents
Blackstone Alternative Multi-Strategy Fund and Subsidiaries
Consolidated Schedule of Investments ^ (Continued)
March 31, 2023
Security Description | Shares | Value | ||||||||
Seacoast Banking Corp. of Florida | 271,851 | $ | 6,442,869 | |||||||
Shore Bancshares, Inc. | 800 | 11,424 | ||||||||
Sierra Bancorp | 400 | 6,888 | ||||||||
Silvergate Capital Corp., Class A (a) | 9,300 | 15,066 | ||||||||
SmartFinancial, Inc. | 300 | 6,942 | ||||||||
South Plains Financial, Inc. | 500 | 10,705 | ||||||||
Southern First Bancshares, Inc. (a) | 200 | 6,140 | ||||||||
Southern Missouri Bancorp, Inc. | 500 | 18,705 | ||||||||
Synovus Financial Corp. | 237,195 | 7,312,722 | ||||||||
Territorial Bancorp, Inc. | 100 | 1,931 | ||||||||
Texas Capital Bancshares, Inc. (a) | 18,187 | 890,436 | ||||||||
Third Coast Bancshares, Inc. (a) | 100 | 1,571 | ||||||||
Trico Bancshares | 700 | 29,113 | ||||||||
Triumph Financial, Inc. (a) | 1,200 | 69,672 | ||||||||
TrustCo Bank Corp. | 620 | 19,803 | ||||||||
Trustmark Corp. | 1,000 | 24,700 | ||||||||
Univest Financial Corp. | 1,100 | 26,114 | ||||||||
US Bancorp | 46,003 | 1,658,408 | ||||||||
USCB Financial Holdings, Inc. (a) | 200 | 1,978 | ||||||||
Washington Trust Bancorp, Inc. | 100 | 3,466 | ||||||||
Wells Fargo & Co. | 139,234 | 5,204,567 | ||||||||
Westamerica BanCorp | 1,800 | 79,740 | ||||||||
West BanCorp, Inc. | 300 | 5,481 | ||||||||
Western New England Bancorp, Inc. | 400 | 3,284 | ||||||||
Wintrust Financial Corp. | 50,697 | 3,698,346 | ||||||||
Zions Bancorp NA | 2,000 | 59,860 | ||||||||
|
| |||||||||
| 62,788,648 | ||||||||||
|
| |||||||||
Biotechnology & Pharmaceuticals — 0.0% |
| |||||||||
Omthera Pharmaceutical, Inc. (a),(c) | 700 | 0 | ||||||||
|
| |||||||||
Consumer Discretionary Products — 0.2% |
| |||||||||
ACCO Brands Corp. | 9,300 | 49,476 | ||||||||
Acushnet Holdings Corp. | 1,000 | 50,940 | ||||||||
Aeva Technologies, Inc. (a) | 10,700 | 12,733 | ||||||||
American Outdoor Brands, Inc. (a) | 500 | 4,920 | ||||||||
Arhaus, Inc. (a) | 3,900 | 32,331 | ||||||||
Beazer Homes USA, Inc. (a) | 3,100 | 49,228 | ||||||||
Brilliant Earth Group, Inc., Class A (a) | 100 | 391 | ||||||||
Caesarstone Ltd. | 1,300 | 5,369 | ||||||||
Camping World Holdings, Inc., Class A | 1,800 | 37,566 | ||||||||
Charles & Colvard Ltd. (a) | 1,300 | 1,209 | ||||||||
Cooper-Standard Holding, Inc. (a) | 3,500 | 49,840 | ||||||||
Crocs, Inc. (a) | 10,600 | 1,340,264 | ||||||||
Culp, Inc. (a) | 200 | 1,040 | ||||||||
Dana, Inc. | 5,300 | 79,765 | ||||||||
Delta Apparel, Inc. (a) | 400 | 4,400 | ||||||||
See Notes to Consolidated Financial Statements.
19
Table of Contents
Blackstone Alternative Multi-Strategy Fund and Subsidiaries
Consolidated Schedule of Investments ^ (Continued)
March 31, 2023
Security Description | Shares | Value | ||||||||
Escalade, Inc. | 200 | $ | 2,920 | |||||||
Flexsteel Industries, Inc. | 100 | 1,926 | ||||||||
Ford Motor Co. | 279,800 | 3,525,480 | ||||||||
Forestar Group, Inc. (a) | 1,600 | 24,896 | ||||||||
Fossil Group, Inc. (a) | 9,000 | 28,800 | ||||||||
General Motors Co. | 38,500 | 1,412,180 | ||||||||
Griffon Corp. | 4,700 | 150,447 | ||||||||
Hasbro, Inc. | 100 | 5,369 | ||||||||
HNI Corp. | 300 | 8,352 | ||||||||
Hooker Furnishings Corp. | 700 | 12,733 | ||||||||
Interface, Inc. | 3,300 | 26,796 | ||||||||
JAKKS Pacific, Inc. (a) | 1,800 | 31,140 | ||||||||
Kimball International, Inc., Class B | 1,800 | 22,320 | ||||||||
Lakeland Industries, Inc. | 200 | 2,920 | ||||||||
Landsea Homes Corp. (a) | 600 | 3,636 | ||||||||
Lear Corp. | 1,600 | 223,184 | ||||||||
Levi Strauss & Co., Class A | 1,600 | 29,168 | ||||||||
Malibu Boats, Inc., Class A (a) | 200 | 11,290 | ||||||||
Masterbrand, Inc. (a) | 5,200 | 41,808 | ||||||||
MasterCraft Boat Holdings, Inc. (a) | 2,000 | 60,860 | ||||||||
Methode Electronics, Inc. | 100 | 4,388 | ||||||||
Miller Industries, Inc. | 300 | 10,605 | ||||||||
Motorcar Parts of America, Inc. (a) | 100 | 744 | ||||||||
Nautilus, Inc. (a) | 4,600 | 6,164 | ||||||||
Peloton Interactive, Inc., Class A (a) | 98,100 | 1,112,454 | ||||||||
Polaris, Inc. | 1,900 | 210,197 | ||||||||
PVH Corp. | 600 | 53,496 | ||||||||
QuantumScape Corp. (a) | 4,200 | 34,356 | ||||||||
Scotts Miracle-Gro Co. | 300 | 20,922 | ||||||||
Solid Power, Inc. (a) | 1,700 | 5,117 | ||||||||
Standard Motor Products, Inc. | 600 | 22,146 | ||||||||
Steelcase, Inc., Class A | 400 | 3,368 | ||||||||
Steven Madden Ltd. | 3,300 | 118,800 | ||||||||
Superior Group of Cos., Inc. | 200 | 1,574 | ||||||||
Superior Industries International, Inc. (a) | 1,300 | 6,435 | ||||||||
TRI Pointe Homes, Inc. (a) | 5,200 | 131,664 | ||||||||
Tupperware Brands Corp. (a) | 2,700 | 6,750 | ||||||||
Twin Vee PowerCats Co. (a) | 200 | 337 | ||||||||
Under Armour, Inc., Class A(a) | 55,200 | 523,848 | ||||||||
Urban Outfitters, Inc. (a) | 10,600 | 293,832 | ||||||||
Westport Fuel Systems, Inc. (a) | 12,000 | 11,430 | ||||||||
|
| |||||||||
| 9,924,324 | ||||||||||
|
| |||||||||
Consumer Discretionary Services — 0.3% |
| |||||||||
2U, Inc. (a) | 11,800 | 80,830 | ||||||||
Allied Gaming & Entertainment, Inc. (a) | 800 | 964 | ||||||||
See Notes to Consolidated Financial Statements.
20
Table of Contents
Blackstone Alternative Multi-Strategy Fund and Subsidiaries
Consolidated Schedule of Investments ^ (Continued)
March 31, 2023
Security Description | Shares | Value | ||||||||
American Public Education, Inc. (a) | 1,800 | $ | 9,756 | |||||||
AZEK Co., Inc. (The) (a) | 2,000 | 47,080 | ||||||||
BJ's Restaurants, Inc. (a) | 4,100 | 119,474 | ||||||||
Bluegreen Vacations Holding Corp. | 700 | 19,166 | ||||||||
Bowlero Corp. (a) | 23,400 | 396,630 | ||||||||
Carnival Corp. (a) | 128,800 | 1,307,320 | ||||||||
Carriage Services, Inc. | 1,000 | 30,520 | ||||||||
Carrols Restaurant Group, Inc. (a) | 500 | 1,115 | ||||||||
Century Casinos, Inc. (a) | 700 | 5,131 | ||||||||
Chegg, Inc. (a) | 17,700 | 288,510 | ||||||||
Chuy's Holdings, Inc. (a) | 1,100 | 39,435 | ||||||||
Coursera, Inc. (a) | 5,100 | 58,752 | ||||||||
Cracker Barrel Old Country Store, Inc. | 1,000 | 113,600 | ||||||||
Denny's Corp. (a) | 6,500 | 72,540 | ||||||||
Dine Brands Global, Inc. | 2,100 | 142,044 | ||||||||
DraftKings, Inc., Class A (a) | 33,070 | 640,235 | ||||||||
El Pollo Loco Holdings, Inc. | 900 | 8,631 | ||||||||
Everi Holdings, Inc. (a) | 11,200 | 192,080 | ||||||||
Fiesta Restaurant Group, Inc. (a) | 400 | 3,288 | ||||||||
Full House Resorts, Inc. (a) | 1,400 | 10,122 | ||||||||
GAN Ltd. (a) | 5,500 | 7,095 | ||||||||
Golden Entertainment, Inc. (a) | 1,100 | 47,861 | ||||||||
International Game Technology PLC | 19,800 | 530,640 | ||||||||
Kura Sushi USA, Inc., Class A (a) | 200 | 13,168 | ||||||||
Lincoln Educational Services Corp. (a) | 1,000 | 5,660 | ||||||||
Lindblad Expeditions Holdings, Inc. (a) | 500 | 4,780 | ||||||||
Live Nation Entertainment, Inc. (a) | 500 | 35,000 | ||||||||
Madison Square Garden Sports Corp. | 1,400 | 272,790 | ||||||||
Marcus Corp. | 3,100 | 49,600 | ||||||||
McDonald's Corp. | 24,500 | 6,850,445 | ||||||||
Monarch Casino & Resort, Inc. | 500 | 37,075 | ||||||||
Noodles & Co. (a) | 2,100 | 10,185 | ||||||||
Norwegian Cruise Line Holdings Ltd. (a) | 3,800 | 51,110 | ||||||||
ONE Group Hospitality, Inc. (The) (a) | 1,500 | 12,150 | ||||||||
OneSpaWorld Holdings Ltd. (a) | 5,700 | 68,343 | ||||||||
Playa Hotels & Resorts NV (a) | 27,500 | 264,000 | ||||||||
Portillo's, Inc., Class A (a) | 3,900 | 83,343 | ||||||||
Red Robin Gourmet Burgers, Inc. (a) | 4,600 | 65,872 | ||||||||
Ruth's Hospitality Group, Inc. | 3,300 | 54,186 | ||||||||
SeaWorld Entertainment, Inc. (a) | 1,400 | 85,834 | ||||||||
Shake Shack, Inc., Class A (a) | 7,600 | 421,724 | ||||||||
Starbucks Corp. | 1,300 | 135,369 | ||||||||
Universal Technical Institute, Inc. (a) | 2,500 | 18,450 | ||||||||
Virgin Galactic Holdings, Inc. (a) | 3,600 | 14,580 | ||||||||
Wingstop, Inc. | 1,200 | 220,296 | ||||||||
WW International, Inc. (a) | 21,100 | 86,932 | ||||||||
Wynn Resorts Ltd. (a) | 200 | 22,382 | ||||||||
See Notes to Consolidated Financial Statements.
21
Table of Contents
Blackstone Alternative Multi-Strategy Fund and Subsidiaries
Consolidated Schedule of Investments ^ (Continued)
March 31, 2023
Security Description | Shares | Value | ||||||||
Xponential Fitness, Inc., Class A (a) | 3,900 | $ | 118,521 | |||||||
|
| |||||||||
| 13,174,614 | ||||||||||
|
| |||||||||
Consumer Staple Products — 0.1% |
| |||||||||
AquaBounty Technologies, Inc. (a) | 8,900 | 5,294 | ||||||||
Cadiz, Inc. (a) | 600 | 2,424 | ||||||||
Clorox Co. (The) | 2,200 | 348,128 | ||||||||
Colgate-Palmolive Co. | 29,190 | 2,193,628 | ||||||||
Conagra Brands, Inc. | 5,700 | 214,092 | ||||||||
Duckhorn Portfolio, Inc. (The) (a) | 2,500 | 39,750 | ||||||||
elf Beauty, Inc. (a) | 2,800 | 230,580 | ||||||||
Hershey Co. | 400 | 101,764 | ||||||||
John B. Sanfilippo & Son, Inc. | 100 | 9,692 | ||||||||
Keurig Dr Pepper, Inc. | 8,600 | 303,408 | ||||||||
Kimberly-Clark Corp. | 15,600 | 2,093,832 | ||||||||
Limoneira Co. | 800 | 13,328 | ||||||||
MGP Ingredients, Inc. | 500 | 48,360 | ||||||||
Molson Coors Beverage Co., Class B | 200 | 10,336 | ||||||||
Nature's Sunshine Products, Inc. (a) | 600 | 6,126 | ||||||||
Olaplex Holdings, Inc. (a) | 52,900 | 225,883 | ||||||||
Quanex Building Products Corp. | 600 | 12,918 | ||||||||
Tejon Ranch Co. (a) | 500 | 9,135 | ||||||||
|
| |||||||||
| 5,868,678 | ||||||||||
|
| |||||||||
Financial Services — 4.2% |
| |||||||||
Accretion Acquisition Corp. (a) | 22,421 | 231,160 | ||||||||
ACRES Commercial Realty Corp. (a) | 233 | 2,265 | ||||||||
Acropolis Infrastructure Acquisition Corp., Class A (a),(b) | 500,001 | 5,065,010 | ||||||||
Air Lease Corp. | 5,500 | 216,535 | ||||||||
Ally Financial, Inc. | 2,600 | 66,274 | ||||||||
Alpha Partners Technology Merger Corp., Class A (a),(b) | 500,001 | 5,180,010 | ||||||||
AltC Acquisition Corp., Class A (a),(b) | 375,000 | 3,806,250 | ||||||||
AltEnergy Acquisition Corp., Class A (a) | 12,170 | 126,325 | ||||||||
Anthemis Digital Acquisitions I Corp. (a),(b) | 472,500 | 4,937,625 | ||||||||
Apollo Strategic Growth Capital, Class A (a),(b) | 450,000 | 4,612,500 | ||||||||
Ares Capital Corp. | 15,100 | 275,952 | ||||||||
Arlington Asset Investment Corp., Class A (a) | 1,400 | 4,004 | ||||||||
ARYA Sciences Acquisition Corp., Class A (a),(b) | 147,703 | 1,511,002 | ||||||||
AssetMark Financial Holdings, Inc. (a) | 1,200 | 37,740 | ||||||||
Atlantic Coastal Acquisition Corp., Class A (a) | 55,000 | 571,450 | ||||||||
Atlanticus Holdings Corp. (a) | 200 | 5,426 | ||||||||
Avantax, Inc. (a) | 2,800 | 73,696 | ||||||||
B Riley Principal 250 Merger Corp., Class A (a),(b) | 247,911 | 2,518,776 | ||||||||
Bain Capital Specialty Finance, Inc. | 900 | 10,728 | ||||||||
See Notes to Consolidated Financial Statements.
22
Table of Contents
Blackstone Alternative Multi-Strategy Fund and Subsidiaries
Consolidated Schedule of Investments ^ (Continued)
March 31, 2023
Security Description | Shares | Value | ||||||||
Bank of New York Mellon Corp. | 71,122 | $ | 3,231,784 | |||||||
BGC Partners, Inc., Class A | 29,300 | 153,239 | ||||||||
Bilander Acquisition Corp., Class A (a),(b) | 365,048 | 3,683,334 | ||||||||
Black Mountain Acquisition Corp., Class A (a),(b) | 472,500 | 4,909,275 | ||||||||
BlackRock Capital Investment Corp. | 4,481 | 15,459 | ||||||||
BlackRock TCP Capital Corp. | 4,300 | 44,290 | ||||||||
BlackRock, Inc. | 100 | 66,912 | ||||||||
Brightsphere Investment Group, Inc. | 120,489 | 2,841,131 | ||||||||
BrightSpire Capital, Inc. | 7,600 | 44,840 | ||||||||
Broadmark Realty Capital, Inc. | 100 | 470 | ||||||||
Bullpen Parlay Acquisition Co., Class A (a),(b) | 378,000 | 3,934,980 | ||||||||
C5 Acquisition Corp., Class A (a) | 200,100 | 2,089,044 | ||||||||
Capital Southwest Corp. | 2,500 | 44,450 | ||||||||
Carlyle Secured Lending, Inc. | 5,900 | 80,358 | ||||||||
Cboe Global Markets, Inc. | 40,625 | 5,453,500 | ||||||||
Charles Schwab Corp. | 70,284 | 3,681,476 | ||||||||
Cherry Hill Mortgage Investment Corp. | 1,800 | 9,936 | ||||||||
Chicago Atlantic Real Estate Finance, Inc. | 300 | 4,053 | ||||||||
Churchill Capital Corp., Class A (a),(b) | 461,695 | 4,672,682 | ||||||||
CME Group, Inc. | 20,500 | 3,926,160 | ||||||||
Coinbase Global, Inc., Class A (a) | 20,800 | 1,405,456 | ||||||||
Compass Digital Acquisition Corp. (a),(b) | 375,018 | 3,825,183 | ||||||||
Concord Acquisition Corp. III, Class A (a),(b) | 378,000 | 3,919,860 | ||||||||
Consumer Portfolio Services, Inc. (a) | 400 | 4,276 | ||||||||
Corsair Partnering Corp., Class A (a),(b) | 375,000 | 3,828,750 | ||||||||
Credit Acceptance Corp. (a) | 200 | 87,208 | ||||||||
Credit Suisse Group AG, ADR | 113,200 | 100,725 | ||||||||
Crescent Capital BDC, Inc. | 2,300 | 31,326 | ||||||||
dMY Technology Group, Inc. (a),(b) | 217,060 | 2,218,375 | ||||||||
DP Cap Acquisition Corp., Class A (a),(b) | 472,500 | 4,937,625 | ||||||||
Ellington Residential Mortgage REIT | 1,900 | 13,870 | ||||||||
ExcelFin Acquisition Corp., Class A (a),(b) | 468,700 | 4,869,793 | ||||||||
EZCORP, Inc., Class A (a) | 9,300 | 79,980 | ||||||||
FG Acquisition Corp., Class A (a),(b) | 189,198 | 1,891,980 | ||||||||
Fidus Investment Corp. | 1,600 | 30,512 | ||||||||
Fifth Wall Acquisition Corp. III, Class A (a),(b) | 299,136 | 3,057,170 | ||||||||
Finnovate Acquisition Corp., Class A (a) | 6,701 | 69,891 | ||||||||
First Western Financial, Inc. (a) | 41,832 | 828,274 | ||||||||
Flywire Corp. (a) | 8,000 | 234,880 | ||||||||
Focus Impact Acquisition Corp., Class A (a) | 26,955 | 279,793 | ||||||||
Forum Merger IV Corp., Class A (a),(b) | 120,000 | 1,220,400 | ||||||||
G Squared Asend II, Inc., Class A (a),(b) | 276,531 | 2,867,626 | ||||||||
GATX Corp. | 1,000 | 110,020 | ||||||||
GCM Grosvenor, Inc., Class A | 69,034 | 539,155 | ||||||||
Gladstone Capital Corp. | 2,100 | 19,740 | ||||||||
Gladstone Investment Corp. | 2,800 | 37,100 | ||||||||
Goldman Sachs Group, Inc. (The) | 2,208 | 722,259 | ||||||||
See Notes to Consolidated Financial Statements.
23
Table of Contents
Blackstone Alternative Multi-Strategy Fund and Subsidiaries
Consolidated Schedule of Investments ^ (Continued)
March 31, 2023
Security Description | Shares | Value | ||||||||
Golub Capital BDC, Inc. | 3,200 | $ | 43,392 | |||||||
Granite Point Mortgage Trust, Inc. | 2,200 | 10,912 | ||||||||
Great Ajax Corp. | 1,100 | 7,238 | ||||||||
Greenhill & Co., Inc. | 1,400 | 12,418 | ||||||||
Growth For Good Acquisition Corp. (a),(b) | 378,000 | 3,866,940 | ||||||||
Hercules Capital, Inc. | 2,400 | 30,936 | ||||||||
Horizon Technology Finance Corp. | 400 | 4,512 | ||||||||
Intercontinental Exchange, Inc. | 1,300 | 135,577 | ||||||||
Investcorp India Acquisition Corp., Class A (a),(b) | 162,382 | 1,706,635 | ||||||||
Jaguar Global Growth Corp., Class A (a),(b) | 214,600 | 2,229,694 | ||||||||
Janus Henderson Group PLC | 10,600 | 282,384 | ||||||||
Jaws Hurricane Acquisition Corp., Class A (a),(b) | 262,600 | 2,668,016 | ||||||||
Jaws Juggernaut Acquisition Corp., Class A (a),(b) | 328,200 | 3,359,127 | ||||||||
Khosla Ventures Acquisition Co. (a) | 117,412 | 1,190,558 | ||||||||
Khosla Ventures Acquisition Co., Class A (a), (b) | 310,000 | 3,146,500 | ||||||||
Lazard Ltd., Class A | 3,400 | 112,574 | ||||||||
Learn CW Investment Corp., Class A (a),(b) | 398,000 | 4,087,460 | ||||||||
LendingClub Corp. (a) | 27,300 | 196,833 | ||||||||
LendingTree, Inc. (a) | 3,600 | 95,976 | ||||||||
LIV Capital Acquisition Corp., Class A (a),(b) | 331,200 | 3,454,416 | ||||||||
Logistics Innovation Technologies Corp., Class A (a),(b) | 305,916 | 3,105,047 | ||||||||
Medallion Financial Corp. | 900 | 6,903 | ||||||||
MidCap Financial Investment Corp. | 3,900 | 44,460 | ||||||||
Monroe Capital Corp. | 1,300 | 9,945 | ||||||||
Nasdaq, Inc. | 31,200 | 1,705,704 | ||||||||
New Mountain Finance Corp. | 3,600 | 43,812 | ||||||||
New Providence Acquisition Corp., Class A (a) | 40,000 | 414,600 | ||||||||
NewtekOne, Inc. | 1,500 | 19,200 | ||||||||
Oaktree Specialty Lending Corp. | 6,631 | 124,464 | ||||||||
Ocwen Financial Corp. (a) | 294 | 7,973 | ||||||||
OFS Capital Corp. | 800 | 8,232 | ||||||||
Oppenheimer Holdings, Inc., Class A | 700 | 27,405 | ||||||||
Orchid Island Capital, Inc. | 20 | 215 | ||||||||
Oxford Square Capital Corp. | 4,100 | 12,956 | ||||||||
Panacea Acquisition Corp. II, Class A (a),(b) | 310,000 | 3,162,000 | ||||||||
PennantPark Floating Rate Capital Ltd. | 2,000 | 21,220 | ||||||||
PennantPark Investment Corp. | 4,100 | 21,648 | ||||||||
Piper Sandler Cos. | 2,487 | 344,723 | ||||||||
PJT Partners, Inc., Class A | 100 | 7,219 | ||||||||
Plum Acquisition Corp. I, Class A (a),(b) | 125,000 | �� | 1,287,500 | |||||||
Pontem Corp., Class A (a),(b) | 465,000 | 4,803,450 | ||||||||
Portage Fintech Acquisition Corp., Class A (a),(b) | 500,001 | 5,115,010 | ||||||||
Portman Ridge Finance Corp. | 300 | 6,183 | ||||||||
PowerUp Acquisition Corp., Class A (a),(b) | 260,216 | 2,727,064 | ||||||||
RCF Acquisition Corp., Class A (a) | 140,000 | 1,460,200 | ||||||||
See Notes to Consolidated Financial Statements.
24
Table of Contents
Blackstone Alternative Multi-Strategy Fund and Subsidiaries
Consolidated Schedule of Investments ^ (Continued)
March 31, 2023
Security Description | Shares | Value | ||||||||
Regional Management Corp. | 200 | $ | 5,218 | |||||||
Robinhood Markets, Inc., Class A (a) | 23,600 | 229,156 | ||||||||
ROC Energy Acquisition Corp. (a),(b) | 378,000 | 3,942,540 | ||||||||
Runway Growth Finance Corp. | 1,900 | 23,047 | ||||||||
Safeguard Scientifics, Inc. (a) | 200 | 344 | ||||||||
Saratoga Investment Corp. | 700 | 17,696 | ||||||||
Schultze Special Purpose Acquisition Corp., Class A (a) | 6,940 | 72,454 | ||||||||
SilverBox Corp. III (a) | 70,034 | 704,542 | ||||||||
Silvercrest Asset Management Group, Inc., Class A | 400 | 7,272 | ||||||||
Sixth Street Specialty Lending, Inc. | 2,900 | 53,070 | ||||||||
Skydeck Acquisition Corp., Class A (a),(b) | 243,900 | 2,497,536 | ||||||||
Sprott, Inc. | 300 | 10,926 | ||||||||
ST Energy Transition I Ltd. (a),(b) | 378,000 | 3,923,640 | ||||||||
State Street Corp. | 11,168 | 845,306 | ||||||||
Stellus Capital Investment Corp. | 1,900 | 26,771 | ||||||||
Stewart Information Services Corp. | 500 | 20,175 | ||||||||
Stifel Financial Corp. | 7,591 | 448,552 | ||||||||
StoneX Group, Inc. (a) | 1,300 | 134,589 | ||||||||
SuRo Capital Corp. (a) | 2,569 | 9,300 | ||||||||
T Rowe Price Group, Inc. | 500 | 56,450 | ||||||||
TCV Acquisition Corp., Class A (a),(b) | 326,088 | 3,339,141 | ||||||||
TG Venture Acquisition Corp. (a) | 3,258 | 33,720 | ||||||||
TMT Acquisition Corp. (a) | 23,968 | 244,474 | ||||||||
TPG Pace Beneficial II Corp., Class A (a),(b) | 228,473 | 2,277,899 | ||||||||
TPG RE Finance Trust, Inc. | 2,500 | 18,150 | ||||||||
Tradeweb Markets, Inc., Class A | 7,300 | 576,846 | ||||||||
Trinity Capital, Inc. | 3,500 | 44,555 | ||||||||
TriplePoint Venture Growth BDC Corp., Class B | 2,800 | 33,824 | ||||||||
Tristar Acquisition I Corp., Class A (a) | 87,311 | 901,923 | ||||||||
Victory Capital Holdings, Inc., Class A | 12,956 | 379,222 | ||||||||
VMG Consumer Acquisition Corp., Class A (a),(b) | 356,402 | 3,695,889 | ||||||||
Waverley Capital Acquisition Corp., Class A (a),(b) | 375,000 | 3,825,000 | ||||||||
Westwood Holdings Group, Inc. | 100 | 1,121 | ||||||||
WhiteHorse Finance, Inc. | 1,100 | 13,772 | ||||||||
|
| |||||||||
| 184,914,679 | ||||||||||
|
| |||||||||
Health Care — 2.0% | ||||||||||
23andMe Holding Co., Class A (a) | �� | 6,300 | 14,364 | |||||||
4D Molecular Therapeutics, Inc. (a) | 2,200 | 37,818 | ||||||||
89bio, Inc. (a) | 14,900 | 226,927 | ||||||||
AbCellera Biologics, Inc. (a) | 9,700 | 73,138 | ||||||||
Accelerate Diagnostics, Inc. (a) | 1,800 | 1,260 | ||||||||
Accolade, Inc. (a) | 4,600 | 66,148 | ||||||||
Accuray, Inc. (a) | 8,345 | 24,785 | ||||||||
Achieve Life Sciences, Inc. (a) | 100 | 680 | ||||||||
See Notes to Consolidated Financial Statements.
25
Table of Contents
Blackstone Alternative Multi-Strategy Fund and Subsidiaries
Consolidated Schedule of Investments ^ (Continued)
March 31, 2023
Security Description | Shares | Value | ||||||||
Actinium Pharmaceuticals, Inc. (a) | 4,414 | $ | 41,712 | |||||||
Adicet Bio, Inc. (a) | 3,642 | 20,978 | ||||||||
ADMA Biologics, Inc. (a) | 36,700 | 121,477 | ||||||||
Adverum Biotechnologies, Inc. (a) | 10,271 | 7,368 | ||||||||
Aeglea BioTherapeutics, Inc. (a) | 8,900 | 2,581 | ||||||||
Aethlon Medical, Inc. (a) | 700 | 270 | ||||||||
Alaunos Therapeutics, Inc. (a) | 26,700 | 16,821 | ||||||||
Aldeyra Therapeutics, Inc. (a) | 8,900 | 88,377 | ||||||||
Alector, Inc. (a) | 8,400 | 51,996 | ||||||||
Aligos Therapeutics, Inc. (a) | 1,500 | 1,311 | ||||||||
Alkermes PLC (a) | 19,700 | 555,343 | ||||||||
Allogene Therapeutics, Inc. (a) | 26,100 | 128,934 | ||||||||
Alnylam Pharmaceuticals, Inc. (a) | 2,400 | 480,768 | ||||||||
Alphatec Holdings, Inc. (a) | 13,800 | 215,280 | ||||||||
Alpine Immune Sciences, Inc. (a) | 1,000 | 7,720 | ||||||||
Altimmune, Inc. (a) | 14,700 | 62,034 | ||||||||
ALX Oncology Holdings, Inc. (a) | 2,600 | 11,752 | ||||||||
Amedisys, Inc. (a) | 300 | 22,065 | ||||||||
American Shared Hospital Services (a) | 100 | 281 | ||||||||
Amgen, Inc. | 24,800 | 5,995,400 | ||||||||
Amneal Pharmaceuticals, Inc. (a) | 3,800 | 5,282 | ||||||||
Amphastar Pharmaceuticals, Inc. (a) | 1,300 | 48,750 | ||||||||
AnaptysBio, Inc. (a) | 800 | 17,408 | ||||||||
Anavex Life Sciences Corp. (a) | 1,500 | 12,855 | ||||||||
AngioDynamics, Inc. (a) | 4,900 | 50,666 | ||||||||
ANI Pharmaceuticals, Inc. (a) | 600 | 23,832 | ||||||||
Anika Therapeutics, Inc. (a) | 1,000 | 28,720 | ||||||||
Annexon, Inc. (a) | 2,500 | 9,625 | ||||||||
Annovis Bio, Inc. (a) | 600 | 9,246 | ||||||||
Apexigen, Inc. (a) | 100 | 50 | ||||||||
Applied Molecular Transport, Inc. (a) | 3,900 | 1,248 | ||||||||
Applied Therapeutics, Inc. (a) | 3,800 | 3,082 | ||||||||
Aptinyx, Inc. (a) | 3,000 | 374 | ||||||||
Aptose Biosciences, Inc. (a) | 1,900 | 1,216 | ||||||||
Aravive, Inc. (a) | 2,700 | 5,400 | ||||||||
Arcellx, Inc. (a) | 500 | 15,405 | ||||||||
Arcus Biosciences, Inc. (a) | 800 | 14,592 | ||||||||
Ardelyx, Inc. (a) | 34,300 | 164,297 | ||||||||
Arrowhead Pharmaceuticals, Inc. (a) | 200 | 5,080 | ||||||||
ARS Pharmaceuticals, Inc. (a) | 4,100 | 26,691 | ||||||||
Assertio Holdings, Inc. (a) | 2,250 | 14,333 | ||||||||
Astria Therapeutics, Inc. (a) | 3,300 | 43,890 | ||||||||
Athira Pharma, Inc. (a) | 7,800 | 19,500 | ||||||||
AtriCure, Inc. (a) | 4,800 | 198,960 | ||||||||
aTyr Pharma, Inc. (a) | 2,400 | 5,040 | ||||||||
Aurinia Pharmaceuticals, Inc. (a) | 5,000 | 54,800 | ||||||||
Avadel Pharmaceuticals PLC, ADR (a) | 2,000 | 18,320 | ||||||||
See Notes to Consolidated Financial Statements.
26
Table of Contents
Blackstone Alternative Multi-Strategy Fund and Subsidiaries
Consolidated Schedule of Investments ^ (Continued)
March 31, 2023
Security Description | Shares | Value | ||||||||
Avanos Medical, Inc. (a) | 1,900 | $ | 56,506 | |||||||
Avid Bioservices, Inc. (a) | 1,700 | 31,892 | ||||||||
Avidity Biosciences, Inc. (a) | 1,400 | 21,490 | ||||||||
Avita Medical, Inc. (a) | 600 | 8,382 | ||||||||
Avrobio, Inc. (a) | 5,700 | 5,700 | ||||||||
Axogen, Inc. (a) | 400 | 3,780 | ||||||||
Axonics, Inc. (a) | 4,500 | 245,520 | ||||||||
Baxter International, Inc. | 126,200 | 5,118,672 | ||||||||
Bio-Rad Laboratories, Inc., Class A (a) | 200 | 95,804 | ||||||||
Bio-Techne Corp. | 3,500 | 259,665 | ||||||||
BioAtla, Inc. (a) | 9,300 | 24,924 | ||||||||
BioCryst Pharmaceuticals, Inc. (a) | 47,500 | 396,150 | ||||||||
Biogen, Inc. (a) | 1,100 | 305,833 | ||||||||
BioMarin Pharmaceutical, Inc. (a) | 16,000 | 1,555,840 | ||||||||
Biomea Fusion, Inc. (a) | 1,199 | 37,181 | ||||||||
BioRestorative Therapies, Inc. (a) | 300 | 1,020 | ||||||||
Bioxcel Therapeutics, Inc. (a) | 1,500 | 27,990 | ||||||||
Black Diamond Therapeutics, Inc. (a) | 3,100 | 5,859 | ||||||||
Blueprint Medicines Corp. (a) | 1,500 | 67,485 | ||||||||
Bridgebio Pharma, Inc. (a) | 7,000 | 116,060 | ||||||||
Bright Health Group, Inc. (a) | 600 | 132 | ||||||||
Brookdale Senior Living, Inc. (a) | 3,009 | 8,877 | ||||||||
C4 Therapeutics, Inc. (a) | 8,500 | 26,690 | ||||||||
Cardiff Oncology, Inc. (a) | 3,500 | 5,775 | ||||||||
Cardiovascular Systems, Inc. (a) | 800 | 15,888 | ||||||||
CareDx, Inc. (a) | 11,300 | 103,282 | ||||||||
Castle Biosciences, Inc. (a) | 2,600 | 59,072 | ||||||||
Catalyst Pharmaceuticals, Inc. (a) | 28,800 | 477,504 | ||||||||
Celldex Therapeutics, Inc. (a) | 1,700 | 61,166 | ||||||||
Centene Corp. (a) | 2,500 | 158,025 | ||||||||
Century Therapeutics, Inc. (a) | 700 | 2,429 | ||||||||
Chimerix, Inc. (a) | 1,200 | 1,512 | ||||||||
Chinook Therapeutics, Inc. (a) | 3,020 | 69,913 | ||||||||
ChromaDex Corp. (a) | 1,300 | 1,989 | ||||||||
Clearside Biomedical, Inc. (a) | 2,200 | 2,288 | ||||||||
Cogent Biosciences, Inc. (a) | 4,000 | 43,160 | ||||||||
Cohbar, Inc. (a) | 283 | 507 | ||||||||
Coherus Biosciences, Inc. (a) | 400 | 2,736 | ||||||||
Collegium Pharmaceutical, Inc. (a) | 1,800 | 43,182 | ||||||||
Community Health Systems, Inc. (a) | 36,000 | 176,400 | ||||||||
Context Therapeutics, Inc. (a) | 100 | 56 | ||||||||
ContraFect Corp. (a) | 27 | 49 | ||||||||
CorMedix, Inc. (a) | 1,200 | 4,968 | ||||||||
Corvus Pharmaceuticals, Inc. (a) | 3,200 | 2,912 | ||||||||
Crinetics Pharmaceuticals, Inc. (a) | 900 | 14,454 | ||||||||
Cue Biopharma, Inc. (a) | 1,700 | 6,069 | ||||||||
See Notes to Consolidated Financial Statements.
27
Table of Contents
Blackstone Alternative Multi-Strategy Fund and Subsidiaries
Consolidated Schedule of Investments ^ (Continued)
March 31, 2023
Security Description | Shares | Value | ||||||||
Cumberland Pharmaceuticals, Inc. (a) | 300 | $ | 585 | |||||||
Curis, Inc. (a) | 13,400 | 7,986 | ||||||||
Cutera, Inc. (a) | 5,500 | 129,910 | ||||||||
CVRx, Inc. (a) | 400 | 3,728 | ||||||||
CVS Health Corp. | 89,000 | 6,613,590 | ||||||||
Cymabay Therapeutics, Inc. (a) | 26,800 | 233,696 | ||||||||
Cyteir Therapeutics, Inc. (a) | 500 | 910 | ||||||||
Cytokinetics, Inc. (a) | 8,200 | 288,558 | ||||||||
CytomX Therapeutics, Inc. (a) | 13,000 | 19,630 | ||||||||
CytoSorbents Corp. (a) | 300 | 1,011 | ||||||||
Danaher Corp. | 12,900 | 3,251,316 | ||||||||
Deciphera Pharmaceuticals, Inc. (a) | 9,400 | 145,230 | ||||||||
Denali Therapeutics, Inc. (a) | 2,000 | 46,080 | ||||||||
DermTech, Inc. (a) | 4,500 | 16,560 | ||||||||
Design Therapeutics, Inc. (a) | 300 | 1,731 | ||||||||
DexCom, Inc. (a) | 7,500 | 871,350 | ||||||||
DiaMedica Therapeutics, Inc. (a) | 100 | 153 | ||||||||
Dominari Holdings, Inc. (a) | 700 | 2,254 | ||||||||
Durect Corp. (a) | 530 | 2,401 | ||||||||
Dynavax Technologies Corp. (a) | 16,600 | 162,846 | ||||||||
Dyne Therapeutics, Inc. (a) | 3,900 | 44,928 | ||||||||
Editas Medicine, Inc. (a) | 17,800 | 129,050 | ||||||||
Edwards Lifesciences Corp. (a) | 45,100 | 3,731,123 | ||||||||
Electromed, Inc. (a) | 100 | 1,040 | ||||||||
Eledon Pharmaceuticals, Inc. (a) | 300 | 708 | ||||||||
Elevance Health, Inc. | 2,400 | 1,103,544 | ||||||||
Emergent BioSolutions, Inc. (a) | 7,200 | 74,592 | ||||||||
Enanta Pharmaceuticals, Inc. (a) | 1,000 | 40,440 | ||||||||
Enochian Biosciences, Inc. (a) | 1,000 | 915 | ||||||||
enVVeno Medical Corp. (a) | 200 | 946 | ||||||||
Erasca, Inc. (a) | 6,100 | 18,361 | ||||||||
Esperion Therapeutics, Inc. (a) | 17,800 | 28,302 | ||||||||
Essa Pharma, Inc. (a) | 4,000 | 11,880 | ||||||||
Establishment Labs Holdings, Inc. (a) | 2,000 | 135,480 | ||||||||
Exact Sciences Corp. (a) | 400 | 27,124 | ||||||||
Exelixis, Inc. (a) | 18,000 | 349,380 | ||||||||
EyePoint Pharmaceuticals, Inc. (a) | 1,700 | 4,998 | ||||||||
Fate Therapeutics, Inc. (a) | 29,400 | 167,580 | ||||||||
Fennec Pharmaceuticals, Inc. (a) | 700 | 5,824 | ||||||||
FibroGen, Inc. (a) | 12,500 | 233,250 | ||||||||
FONAR Corp. (a) | 100 | 1,620 | ||||||||
Forte Biosciences, Inc. (a) | 1,000 | 1,010 | ||||||||
Fulcrum Therapeutics, Inc. (a) | 6,100 | 17,385 | ||||||||
Fusion Pharmaceuticals, Inc. (a) | 400 | 1,508 | ||||||||
G1 Therapeutics, Inc. (a) | 6,600 | 17,688 | ||||||||
GeneDx Holdings Corp. (a) | 2,800 | 1,022 | ||||||||
Gilead Sciences, Inc. | 99,400 | 8,247,218 | ||||||||
See Notes to Consolidated Financial Statements.
28
Table of Contents
Blackstone Alternative Multi-Strategy Fund and Subsidiaries
Consolidated Schedule of Investments ^ (Continued)
March 31, 2023
Security Description | Shares | Value | ||||||||
Globus Medical, Inc., Class A (a) | 600 | $ | 33,984 | |||||||
GlycoMimetics, Inc. (a) | 12,200 | 15,372 | ||||||||
GoodRx Holdings, Inc., Class A (a) | 23,500 | 146,875 | ||||||||
Gossamer Bio, Inc. (a) | 28,400 | 35,784 | ||||||||
Graphite Bio, Inc. (a) | 3,800 | 9,310 | ||||||||
Guardant Health, Inc. (a) | 7,000 | 164,080 | ||||||||
Haemonetics Corp. (a) | 3,900 | 322,725 | ||||||||
Halozyme Therapeutics, Inc. (a) | 8,200 | 313,158 | ||||||||
Harmony Biosciences Holdings, Inc. (a) | 6,400 | 208,960 | ||||||||
Harrow Health, Inc. (a) | 5,400 | 114,264 | ||||||||
Harvard Bioscience, Inc. (a) | 1,300 | 5,460 | ||||||||
Heska Corp. (a) | 1,100 | 107,382 | ||||||||
iCAD, Inc. (a) | 1,800 | 2,232 | ||||||||
Ideaya Biosciences, Inc. (a) | 4,900 | 67,277 | ||||||||
Illumina, Inc. (a) | 9,400 | 2,185,970 | ||||||||
Immunic, Inc. (a) | 9,900 | 14,751 | ||||||||
ImmunoGen, Inc. (a) | 55,100 | 211,584 | ||||||||
Immunovant, Inc. (a) | 14,000 | 217,140 | ||||||||
Imunon, Inc. (a) | 115 | 144 | ||||||||
Inari Medical, Inc. (a) | 100 | 6,174 | ||||||||
Incyte Corp. (a) | 17,000 | 1,228,590 | ||||||||
Infinity Pharmaceuticals, Inc. (a) | 1,300 | 208 | ||||||||
InfuSystem Holdings, Inc. (a) | 800 | 6,200 | ||||||||
Inhibrx, Inc. (a) | 4,700 | 88,689 | ||||||||
Inmode Ltd. (a) | 7,000 | 223,720 | ||||||||
Inogen, Inc. (a) | 1,400 | 17,472 | ||||||||
Inovio Pharmaceuticals, Inc. (a) | 2,700 | 2,214 | ||||||||
Insmed, Inc. (a) | 5,800 | 98,890 | ||||||||
Instil Bio, Inc. (a) | 22,200 | 14,670 | ||||||||
Integra LifeSciences Holdings Corp. (a) | 3,600 | 206,676 | ||||||||
Intellia Therapeutics, Inc. (a) | 13,000 | 484,510 | ||||||||
Intercept Pharmaceuticals, Inc. (a) | 8,900 | 119,527 | ||||||||
Ionis Pharmaceuticals, Inc. (a) | 1,500 | 53,610 | ||||||||
Iovance Biotherapeutics, Inc. (a) | 29,900 | 182,689 | ||||||||
IQVIA Holdings, Inc. (a) | 1,100 | 218,779 | ||||||||
iRadimed Corp. | 400 | 15,740 | ||||||||
Ironwood Pharmaceuticals, Inc. (a) | 26,500 | 278,780 | ||||||||
Jazz Pharmaceuticals PLC (a) | 2,700 | 395,091 | ||||||||
Johnson & Johnson | 33,900 | 5,254,500 | ||||||||
Joint Corp. (The) (a) | 2,400 | 40,392 | ||||||||
Jounce Therapeutics, Inc. (a) | 2,400 | 4,440 | ||||||||
KalVista Pharmaceuticals, Inc. (a) | 2,200 | 17,292 | ||||||||
Karyopharm Therapeutics, Inc. (a) | 13,900 | 54,071 | ||||||||
Kezar Life Sciences, Inc. (a) | 12,700 | 39,751 | ||||||||
Kodiak Sciences, Inc. (a) | 4,100 | 25,420 | ||||||||
Kronos Bio, Inc. (a) | 4,900 | 7,154 | ||||||||
See Notes to Consolidated Financial Statements.
29
Table of Contents
Blackstone Alternative Multi-Strategy Fund and Subsidiaries
Consolidated Schedule of Investments ^ (Continued)
March 31, 2023
Security Description | Shares | Value | ||||||||
Kura Oncology, Inc. (a) | 600 | $ | 7,338 | |||||||
Kymera Therapeutics, Inc. (a) | 4,600 | 136,298 | ||||||||
Lannett Co., Inc. (a) | 150 | 261 | ||||||||
Lantern Pharma, Inc. (a) | 200 | 966 | ||||||||
Lantheus Holdings, Inc. (a) | 5,200 | 429,312 | ||||||||
Larimar Therapeutics, Inc. (a) | 4,233 | 19,175 | ||||||||
Leap Therapeutics, Inc. (a) | 3,500 | 1,190 | ||||||||
LeMaitre Vascular, Inc. | 1,000 | 51,470 | ||||||||
Lipocine, Inc. (a) | 3,700 | 1,177 | ||||||||
Liquidia Corp. (a) | 11,000 | 76,010 | ||||||||
LivaNova PLC (a) | 3,800 | 165,604 | ||||||||
Lyell Immunopharma, Inc. (a) | 300 | 708 | ||||||||
Lyra Therapeutics, Inc. (a) | 600 | 1,242 | ||||||||
MacroGenics, Inc. (a) | 15,300 | 109,701 | ||||||||
Magenta Therapeutics, Inc. (a) | 3,805 | 3,024 | ||||||||
MannKind Corp. (a) | 36,800 | 150,880 | ||||||||
Maravai LifeSciences Holdings, Inc., Class A (a) | 25,500 | 357,255 | ||||||||
Masimo Corp. (a) | 4,400 | 811,976 | ||||||||
Medpace Holdings, Inc. (a) | 300 | 56,415 | ||||||||
Medtronic PLC | 80,300 | 6,473,786 | ||||||||
Merrimack Pharmaceuticals, Inc. (a) | 200 | 2,458 | ||||||||
Mersana Therapeutics, Inc. (a) | 16,400 | 67,404 | ||||||||
Milestone Pharmaceuticals, Inc. (a) | 600 | 2,364 | ||||||||
MiMedx Group, Inc. (a) | 3,000 | 10,230 | ||||||||
Mirum Pharmaceuticals, Inc. (a) | 1,500 | 36,030 | ||||||||
Molecular Templates, Inc. (a) | 28 | 11 | ||||||||
Myomo, Inc. (a) | 600 | 450 | ||||||||
NanoString Technologies, Inc. (a) | 13,900 | 137,610 | ||||||||
Natera, Inc. (a) | 10,200 | 566,304 | ||||||||
National HealthCare Corp. | 100 | 5,807 | ||||||||
Nektar Therapeutics (a) | 37,000 | 26,007 | ||||||||
NeoGenomics, Inc. (a) | 15,500 | 269,855 | ||||||||
Neoleukin Therapeutics, Inc. (a) | 3,900 | 2,730 | ||||||||
Neurocrine Biosciences, Inc. (a) | 10,200 | 1,032,444 | ||||||||
Neuronetics, Inc. (a) | 4,400 | 12,804 | ||||||||
Nevro Corp. (a) | 9,900 | 357,885 | ||||||||
Nexgel, Inc. (a) | 300 | 390 | ||||||||
NextCure, Inc. (a) | 2,000 | 2,960 | ||||||||
NGM Biopharmaceuticals, Inc. (a) | 6,400 | 26,112 | ||||||||
Nkarta, Inc. (a) | 3,600 | 12,780 | ||||||||
NuVasive, Inc. (a) | 15,400 | 636,174 | ||||||||
Nuvation Bio, Inc. (a) | 12,200 | 20,252 | ||||||||
Ocular Therapeutix, Inc. (a) | 7,000 | 36,890 | ||||||||
Olema Pharmaceuticals, Inc. (a) | 3,200 | 11,104 | ||||||||
Omeros Corp. (a) | 5,700 | 26,505 | ||||||||
Omnicell, Inc. (a) | 400 | 23,468 | ||||||||
See Notes to Consolidated Financial Statements.
30
Table of Contents
Blackstone Alternative Multi-Strategy Fund and Subsidiaries
Consolidated Schedule of Investments ^ (Continued)
March 31, 2023
Security Description | Shares | Value | ||||||||
Onconova Therapeutics, Inc. (a) | 933 | $ | 682 | |||||||
Oncorus, Inc. (a) | 1,600 | 551 | ||||||||
Oncternal Therapeutics, Inc. (a) | 4,800 | 3,768 | ||||||||
OPKO Health, Inc. (a) | 28,701 | 41,903 | ||||||||
OraSure Technologies, Inc. (a) | 300 | 1,815 | ||||||||
Organogenesis Holdings, Inc. (a) | 16,100 | 34,293 | ||||||||
ORIC Pharmaceuticals, Inc. (a) | 600 | 3,420 | ||||||||
Orthofix Medical, Inc. (a) | 2,306 | 38,626 | ||||||||
Oscar Health, Inc., Class A (a) | 25,600 | 167,424 | ||||||||
Pacific Biosciences of California, Inc. (a) | 31,656 | 366,576 | ||||||||
Paratek Pharmaceuticals, Inc. (a) | 6,000 | 15,240 | ||||||||
Passage Bio, Inc. (a) | 4,700 | 4,501 | ||||||||
PDS Biotechnology Corp. (a) | 8,500 | 52,275 | ||||||||
Pennant Group, Inc. (The) (a) | 900 | 12,852 | ||||||||
Perrigo Co. PLC | 1,700 | 60,979 | ||||||||
Personalis, Inc. (a) | 6,700 | 18,492 | ||||||||
PetIQ, Inc. (a) | 900 | 10,296 | ||||||||
PhenomeX, Inc. (a) | 10,105 | 11,722 | ||||||||
Phibro Animal Health Corp., Class A | 1,200 | 18,384 | ||||||||
Pliant Therapeutics, Inc. (a) | 5,900 | 156,940 | ||||||||
PMV Pharmaceuticals, Inc. (a) | 400 | 1,908 | ||||||||
Poseida Therapeutics, Inc. (a) | 500 | 1,540 | ||||||||
Praxis Precision Medicines, Inc. (a) | 6,200 | 5,016 | ||||||||
Prelude Therapeutics, Inc. (a) | 1,000 | 5,700 | ||||||||
Prestige Consumer Healthcare, Inc. (a) | 100 | 6,263 | ||||||||
Progyny, Inc. (a) | 2,400 | 77,088 | ||||||||
Prometheus Biosciences, Inc. (a) | 1,300 | 139,516 | ||||||||
Protagonist Therapeutics, Inc. (a) | 10,300 | 236,900 | ||||||||
Protara Therapeutics, Inc. (a) | 400 | 1,240 | ||||||||
PTC Therapeutics, Inc. (a) | 7,000 | 339,080 | ||||||||
Pulmonx Corp. (a) | 5,900 | 65,962 | ||||||||
Puma Biotechnology, Inc. (a) | 6,900 | 21,321 | ||||||||
QIAGEN NV (a) | 2,700 | 124,011 | ||||||||
Quanterix Corp. (a) | 6,300 | 71,001 | ||||||||
Quince Therapeutics, Inc. (a) | 8,200 | 12,792 | ||||||||
RadNet, Inc. (a) | 2,000 | 50,060 | ||||||||
RAPT Therapeutics, Inc. (a) | 3,500 | 64,225 | ||||||||
Reata Pharmaceuticals, Inc., Class A (a) | 400 | 36,368 | ||||||||
Regeneron Pharmaceuticals, Inc. (a) | 3,100 | 2,547,177 | ||||||||
Relmada Therapeutics, Inc. (a) | 6,400 | 14,464 | ||||||||
Replimune Group, Inc. (a) | 4,800 | 84,768 | ||||||||
Revance Therapeutics, Inc. (a) | 24,600 | 792,366 | ||||||||
REVOLUTION Medicines, Inc. (a) | 1,900 | 41,154 | ||||||||
Rigel Pharmaceuticals, Inc. (a) | 52,000 | 68,640 | ||||||||
Rocket Pharmaceuticals, Inc. (a) | 8,800 | 150,744 | ||||||||
Roivant Sciences Ltd. (a) | 2,900 | 21,402 | ||||||||
See Notes to Consolidated Financial Statements.
31
Table of Contents
Blackstone Alternative Multi-Strategy Fund and Subsidiaries
Consolidated Schedule of Investments ^ (Continued)
March 31, 2023
Security Description | Shares | Value | ||||||||
Sage Therapeutics, Inc. (a) | 1,800 | $ | 75,528 | |||||||
Salarius Pharmaceuticals, Inc. (a) | 44 | 84 | ||||||||
Sangamo Therapeutics, Inc. (a) | 21,700 | 38,192 | ||||||||
Sarepta Therapeutics, Inc. (a) | 21,900 | 3,018,477 | ||||||||
Satsuma Pharmaceuticals, Inc. (a) | 4,200 | 2,934 | ||||||||
Savara, Inc. (a) | 2,100 | 4,095 | ||||||||
Science 37 Holdings, Inc. (a) | 500 | 141 | ||||||||
scPharmaceuticals, Inc. (a) | 3,000 | 27,210 | ||||||||
Selecta Biosciences, Inc. (a) | 12,600 | 17,514 | ||||||||
Sensei Biotherapeutics, Inc. (a) | 400 | 600 | ||||||||
Sensus Healthcare, Inc. (a) | 800 | 4,168 | ||||||||
Shattuck Labs, Inc. (a) | 400 | 1,176 | ||||||||
SIGA Technologies, Inc. | 700 | 4,025 | ||||||||
Silk Road Medical, Inc. (a) | 1,400 | 54,782 | ||||||||
Singular Genomics Systems, Inc. (a) | 600 | 726 | ||||||||
Solid Biosciences, Inc. (a) | 173 | 820 | ||||||||
Sotera Health Co. (a) | 2,300 | 41,193 | ||||||||
SpringWorks Therapeutics, Inc. (a) | 2,500 | 64,350 | ||||||||
Spruce Biosciences, Inc. (a) | 600 | 1,326 | ||||||||
STAAR Surgical Co. (a) | 2,300 | 147,085 | ||||||||
Star Equity Holdings, Inc. (a) | 400 | 372 | ||||||||
Stereotaxis, Inc. (a) | 4,400 | 8,976 | ||||||||
Supernus Pharmaceuticals, Inc. (a) | 4,600 | 166,658 | ||||||||
Surmodics, Inc. (a) | 800 | 18,224 | ||||||||
Sutro Biopharma, Inc. (a) | 7,300 | 33,726 | ||||||||
Syndax Pharmaceuticals, Inc. (a) | 5,400 | 114,048 | ||||||||
Syneos Health, Inc. (a) | 15,800 | 562,796 | ||||||||
Synlogic, Inc. (a) | 2,600 | 1,643 | ||||||||
Syros Pharmaceuticals, Inc. (a) | 40 | 107 | ||||||||
Tactile Systems Technology, Inc. (a) | 2,500 | 41,050 | ||||||||
Talaris Therapeutics, Inc. (a) | 100 | 188 | ||||||||
Tandem Diabetes Care, Inc. (a) | 18,300 | 743,163 | ||||||||
TCR2 Therapeutics, Inc. (a) | 1,300 | 1,950 | ||||||||
Teladoc Health, Inc. (a) | 44,200 | 1,144,780 | ||||||||
Tenaya Therapeutics, Inc. (a) | 200 | 570 | ||||||||
TG Therapeutics, Inc. (a) | 13,200 | 198,528 | ||||||||
Theravance Biopharma, Inc. (a) | 7,000 | 75,950 | ||||||||
Tracon Pharmaceuticals, Inc. (a) | 500 | 945 | ||||||||
TransMedics Group, Inc. (a) | 800 | 60,584 | ||||||||
Travere Therapeutics, Inc. (a) | 14,500 | 326,105 | ||||||||
Twist Bioscience Corp. (a) | 1,000 | 15,080 | ||||||||
Ultragenyx Pharmaceutical, Inc. (a) | 8,700 | 348,870 | ||||||||
Vanda Pharmaceuticals, Inc. (a) | 8,000 | 54,320 | ||||||||
Varex Imaging Corp. (a) | 3,200 | 58,208 | ||||||||
Vaxart, Inc. (a) | 23,900 | 18,085 | ||||||||
Vaxcyte, Inc. (a) | 500 | 18,740 | ||||||||
See Notes to Consolidated Financial Statements.
32
Table of Contents
Blackstone Alternative Multi-Strategy Fund and Subsidiaries
Consolidated Schedule of Investments ^ (Continued)
March 31, 2023
Security Description | Shares | Value | ||||||||
Verastem, Inc. (a) | 17,200 | $ | 7,141 | |||||||
Vericel Corp. (a) | 3,800 | 111,416 | ||||||||
Verrica Pharmaceuticals, Inc. (a) | 300 | 1,950 | ||||||||
Vertex Pharmaceuticals, Inc. (a) | 200 | 63,014 | ||||||||
Viatris, Inc. | 96,300 | 926,406 | ||||||||
Viemed Healthcare, Inc. (a) | 1,800 | 17,388 | ||||||||
ViewRay, Inc. (a) | 10,700 | 37,022 | ||||||||
Viking Therapeutics, Inc. (a) | 20,500 | 341,325 | ||||||||
Viracta Therapeutics, Inc. (a) | 200 | 318 | ||||||||
Waters Corp. (a) | 1,200 | 371,556 | ||||||||
XBiotech, Inc. (a) | 700 | 2,415 | ||||||||
Xencor, Inc. (a) | 3,400 | 94,826 | ||||||||
Y-mAbs Therapeutics, Inc. (a) | 4,100 | 20,541 | ||||||||
Zynerba Pharmaceuticals, Inc. (a) | 3,200 | 1,376 | ||||||||
|
| |||||||||
| 85,906,227 | ||||||||||
|
| |||||||||
Industrial Products — 0.6% | ||||||||||
A O Smith Corp. | 100 | 6,915 | ||||||||
Advanced Emissions Solutions, Inc. (a) | 1,400 | 2,772 | ||||||||
Allegion PLC | 3,600 | 384,228 | ||||||||
Allied Motion Technologies, Inc. | 400 | 15,460 | ||||||||
Allison Transmission Holdings, Inc. | 2,700 | 122,148 | ||||||||
AMETEK, Inc. | 3,400 | 494,122 | ||||||||
Archer Aviation, Inc., Class A (a) | 3,200 | 9,152 | ||||||||
Argan, Inc. | 700 | 28,329 | ||||||||
Art's-Way Manufacturing Co., Inc. (a) | 100 | 197 | ||||||||
Astronics Corp. (a) | 1,300 | 17,368 | ||||||||
Barnes Group, Inc. | 700 | 28,196 | ||||||||
Bel Fuse, Inc., Class B | 800 | 30,064 | ||||||||
Bloom Energy Corp., Class A (a) | 41,538 | 827,852 | ||||||||
Boeing Co. (a) | 25,200 | 5,353,236 | ||||||||
BWX Technologies, Inc. | 1,100 | 69,344 | ||||||||
CECO Environmental Corp. (a) | 5,600 | 78,344 | ||||||||
Chase Corp. | 100 | 10,473 | ||||||||
Columbus McKinnon Corp. | 1,500 | 55,740 | ||||||||
Commercial Vehicle Group, Inc. (a) | 1,100 | 8,030 | ||||||||
CVD Equipment Corp. (a) | 200 | 2,660 | ||||||||
Douglas Dynamics, Inc. | 600 | 19,134 | ||||||||
Dover Corp. | 100 | 15,194 | ||||||||
Ducommun, Inc. (a) | 200 | 10,942 | ||||||||
Emerson Electric Co. | 27,500 | 2,396,350 | ||||||||
Energy Recovery, Inc. (a) | 4,100 | 94,505 | ||||||||
FARO Technologies, Inc. (a) | 200 | 4,922 | ||||||||
Federal Signal Corp. | 3,400 | 184,314 | ||||||||
Gates Industrial Corp. PLC (a) | 300 | 4,167 | ||||||||
Generac Holdings, Inc. (a) | 5,400 | 583,254 | ||||||||
See Notes to Consolidated Financial Statements.
33
Table of Contents
Blackstone Alternative Multi-Strategy Fund and Subsidiaries
Consolidated Schedule of Investments ^ (Continued)
March 31, 2023
Security Description | Shares | Value | ||||||||
General Dynamics Corp. | 6,100 | $ | 1,392,081 | |||||||
Gibraltar Industries, Inc. (a) | 1,000 | 48,500 | ||||||||
Gorman-Rupp Co. (The) | 800 | 20,000 | ||||||||
Hayward Holdings, Inc. (a) | 700 | 8,204 | ||||||||
HEICO Corp. | 1,900 | 324,976 | ||||||||
Helios Technologies, Inc. | 100 | 6,540 | ||||||||
Hillman Solutions Corp. (a) | 54,931 | 462,519 | ||||||||
Honeywell International, Inc. | 31,100 | 5,943,832 | ||||||||
Hurco Cos., Inc. | 100 | 2,532 | ||||||||
Hydrofarm Holdings Group, Inc. (a) | 8,700 | 15,051 | ||||||||
Hyliion Holdings Corp. (a) | 7,400 | 14,652 | ||||||||
Insteel Industries, Inc. | 400 | 11,128 | ||||||||
Intevac, Inc. (a) | 500 | 3,665 | ||||||||
Janus International Group, Inc. (a) | 1,700 | 16,762 | ||||||||
Johnson Controls International PLC | 26,600 | 1,601,852 | ||||||||
Kaman Corp. | 300 | 6,858 | ||||||||
Kimball Electronics, Inc. (a) | 200 | 4,820 | ||||||||
LB Foster Co., Class A (a) | 100 | 1,148 | ||||||||
Lennox International, Inc. | 500 | 125,640 | ||||||||
Leonardo DRS, Inc. (a) | 500 | 6,485 | ||||||||
Lockheed Martin Corp. | 4,900 | 2,316,377 | ||||||||
LSI Industries, Inc. | 2,900 | 40,397 | ||||||||
Manitowoc Co., Inc. (The) (a) | 4,900 | 83,741 | ||||||||
Mayville Engineering Co., Inc. (a) | 900 | 13,428 | ||||||||
MSA Safety, Inc. | 100 | 13,350 | ||||||||
NEXTracker, Inc., Class A (a) | 46,979 | 1,703,459 | ||||||||
Nikola Corp. (a) | 239,679 | 290,012 | ||||||||
nLight, Inc. (a) | 6,100 | 62,098 | ||||||||
NN, Inc. (a) | 3,100 | 3,317 | ||||||||
Nordson Corp. | 200 | 44,452 | ||||||||
nVent Electric PLC | 12,400 | 532,456 | ||||||||
Otis Worldwide Corp. | 2,800 | 236,320 | ||||||||
Powell Industries, Inc. | 300 | 12,777 | ||||||||
Proto Labs, Inc. (a) | 2,400 | 79,560 | ||||||||
Sarcos Technology and Robotics Corp. (a) | 1,800 | 854 | ||||||||
Shyft Group, Inc. (The) | 2,500 | 56,875 | ||||||||
Standex International Corp. | 200 | 24,488 | ||||||||
Stanley Black & Decker, Inc. | 2,300 | 185,334 | ||||||||
Stoneridge, Inc. (a) | 200 | 3,740 | ||||||||
Tennant Co. | 200 | 13,706 | ||||||||
Thermon Group Holdings, Inc. (a) | 3,200 | 79,744 | ||||||||
Titan International, Inc. (a) | 4,300 | 45,064 | ||||||||
Trimble, Inc. (a) | 800 | 41,936 | ||||||||
Triumph Group, Inc. (a) | 1,100 | 12,749 | ||||||||
TuSimple Holdings, Inc., Class A (a) | 55,900 | 82,173 | ||||||||
Wabash National Corp. | 3,700 | 90,983 | ||||||||
See Notes to Consolidated Financial Statements.
34
Table of Contents
Blackstone Alternative Multi-Strategy Fund and Subsidiaries
Consolidated Schedule of Investments ^ (Continued)
March 31, 2023
Security Description | Shares | Value | ||||||||
Watts Water Technologies, Inc., Class A | 100 | $ | 16,832 | |||||||
Xylem, Inc. | 3,100 | 324,570 | ||||||||
Zurn Elkay Water Solutions Corp. | 400 | 8,544 | ||||||||
|
| |||||||||
| 27,293,993 | ||||||||||
|
| |||||||||
Industrial Services — 0.4% | ||||||||||
Alarm.com Holdings, Inc. (a) | 100 | 5,028 | ||||||||
Alta Equipment Group, Inc. | 1,900 | 30,115 | ||||||||
American Airlines Group, Inc. (a) | 184,000 | 2,714,000 | ||||||||
Atlas Technical Consultants, Inc. (a) | 400 | 4,876 | ||||||||
Avalon Holdings Corp., Class A (a) | 200 | 530 | ||||||||
Barrett Business Services, Inc. | 400 | 35,456 | ||||||||
BGSF, Inc. | 300 | 3,195 | ||||||||
Brady Corp., Class A | 200 | 10,746 | ||||||||
BrightView Holdings, Inc. (a) | 2,300 | 12,926 | ||||||||
CBIZ, Inc. (a) | 100 | 4,949 | ||||||||
Concrete Pumping Holdings, Inc. (a) | 1,900 | 12,920 | ||||||||
CoreCivic, Inc. (a) | 1,800 | 16,560 | ||||||||
CorVel Corp. (a) | 200 | 38,056 | ||||||||
Covenant Logistics Group, Inc. | 100 | 3,542 | ||||||||
CRA International, Inc. | 200 | 21,564 | ||||||||
CSX Corp. | 55,700 | 1,667,658 | ||||||||
Daseke, Inc. (a) | 5,600 | 43,288 | ||||||||
DHT Holdings, Inc. | 47,500 | 513,475 | ||||||||
Dorian LPG Ltd. | �� | 2,100 | 41,874 | |||||||
DXP Enterprises, Inc. (a) | 500 | 13,460 | ||||||||
Eagle Bulk Shipping, Inc. | 1,097 | 49,913 | ||||||||
Emerald Holding, Inc. (a) | 500 | 1,860 | ||||||||
Ennis, Inc. | 300 | 6,327 | ||||||||
EVI Industries, Inc. (a) | 100 | 1,980 | ||||||||
Exponent, Inc. | 100 | 9,969 | ||||||||
Fluor Corp. (a) | 9,500 | 293,645 | ||||||||
Franklin Covey Co. (a) | 700 | 26,929 | ||||||||
Frontier Group Holdings, Inc. (a) | 1,300 | 12,792 | ||||||||
Geo Group, Inc. (The) (a) | 37,300 | 294,297 | ||||||||
Great Lakes Dredge & Dock Corp. (a) | 3,900 | 21,177 | ||||||||
H&E Equipment Services, Inc. | 2,500 | 110,575 | ||||||||
Hackett Group, Inc. | 3,000 | 55,440 | ||||||||
Harsco Corp. (a) | 4,600 | 31,418 | ||||||||
Heidrick & Struggles International, Inc. | 500 | 15,180 | ||||||||
Herc Holdings, Inc. | 100 | 11,390 | ||||||||
Hudson Technologies, Inc. (a) | 5,800 | 50,634 | ||||||||
Huron Consulting Group, Inc. (a) | 1,800 | 144,666 | ||||||||
Information Services Group, Inc. | 2,600 | 13,234 | ||||||||
Insperity, Inc. | 1,400 | 170,170 | ||||||||
International Seaways, Inc. | 9,200 | 383,456 | ||||||||
See Notes to Consolidated Financial Statements.
35
Table of Contents
Blackstone Alternative Multi-Strategy Fund and Subsidiaries
Consolidated Schedule of Investments ^ (Continued)
March 31, 2023
Security Description | Shares | Value | ||||||||
JetBlue Airways Corp. (a) | 28,000 | $ | 203,840 | |||||||
Kelly Services, Inc., Class A | 1,700 | 28,203 | ||||||||
Legalzoom.com, Inc. (a) | 600 | 5,628 | ||||||||
Limbach Holdings, Inc. (a) | 200 | 3,460 | ||||||||
Marten Transport Ltd. | 3,399 | 71,209 | ||||||||
Mesa Air Group, Inc. (a) | 7,500 | 17,775 | ||||||||
Mistras Group, Inc. (a) | 900 | 6,102 | ||||||||
MRC Global, Inc. (a) | 8,900 | 86,508 | ||||||||
MYR Group, Inc. (a) | 300 | 37,803 | ||||||||
Navigator Holdings Ltd. (a) | 100 | 1,400 | ||||||||
Nordic American Tankers Ltd. | 62,300 | 246,708 | ||||||||
Norfolk Southern Corp. | 2,700 | 572,400 | ||||||||
Orion Group Holdings, Inc. (a) | 500 | 1,295 | ||||||||
Overseas Shipholding Group, Inc., Class A (a) | 11,500 | 44,850 | ||||||||
PAM Transportation Services, Inc. (a) | 100 | 2,863 | ||||||||
Pangaea Logistics Solutions Ltd. | 4,400 | 25,828 | ||||||||
Primoris Services Corp. | 900 | 22,194 | ||||||||
Radiant Logistics, Inc. (a) | 2,600 | 17,056 | ||||||||
Republic Services, Inc. | 14,300 | 1,933,646 | ||||||||
Resources Connection, Inc. | 400 | 6,824 | ||||||||
RXO, Inc. (a) | 700 | 13,748 | ||||||||
Schneider National, Inc., Class B | 2,200 | 58,850 | ||||||||
Schnitzer Steel Industries, Inc., Class A | 400 | 12,440 | ||||||||
ShotSpotter, Inc. (a) | 300 | 11,796 | ||||||||
SP Plus Corp. (a) | 100 | 3,429 | ||||||||
Stericycle, Inc. (a) | 800 | 34,888 | ||||||||
Sterling Infrastructure, Inc. (a) | 3,600 | 136,368 | ||||||||
Target Hospitality Corp. (a) | 12,600 | 165,564 | ||||||||
Teekay Corp. (a) | 29,600 | 182,928 | ||||||||
Teekay Tankers Ltd., Class A (a) | 8,763 | 376,196 | ||||||||
Titan Machinery, Inc. (a) | 2,300 | 70,035 | ||||||||
Transcat, Inc. (a) | 300 | 26,817 | ||||||||
TriNet Group, Inc. (a) | 1,500 | 120,915 | ||||||||
Triton International Ltd. | 800 | 50,576 | ||||||||
TrueBlue, Inc. (a) | 600 | 10,680 | ||||||||
Tutor Perini Corp. (a) | 5,100 | 31,467 | ||||||||
Union Pacific Corp. | 32,400 | 6,520,824 | ||||||||
Universal Logistics Holdings, Inc. | 600 | 17,490 | ||||||||
US Xpress Enterprises, Inc., Class A (a) | 2,000 | 11,880 | ||||||||
Viad Corp. (a) | 100 | 2,084 | ||||||||
Wilhelmina International, Inc. (a) | 100 | 409 | ||||||||
WillScot Mobile Mini Holdings Corp. (a) | 18,500 | 867,280 | ||||||||
Yellow Corp. (a) | 15,400 | 31,262 | ||||||||
|
| |||||||||
| 18,992,788 | ||||||||||
|
| |||||||||
See Notes to Consolidated Financial Statements.
36
Table of Contents
Blackstone Alternative Multi-Strategy Fund and Subsidiaries
Consolidated Schedule of Investments ^ (Continued)
March 31, 2023
Security Description | Shares | Value | ||||||||
Insurance — 0.1% | ||||||||||
Argo Group International Holdings Ltd. (a) | 10,500 | $ | 307,545 | |||||||
Brighthouse Financial, Inc. (a) | 3,200 | 141,152 | ||||||||
Citizens, Inc. (a) | 800 | 2,968 | ||||||||
Donegal Group, Inc., Class A | 100 | 1,528 | ||||||||
eHealth, Inc. (a) | 7,600 | 71,136 | ||||||||
Employers Holdings, Inc. | 300 | 12,507 | ||||||||
F&G Annuities & Life, Inc. | 2,400 | 43,488 | ||||||||
Greenlight Capital Re Ltd., Class A (a) | 1,700 | 15,963 | ||||||||
Hallmark Financial Services, Inc. (a) | 90 | 585 | ||||||||
HCI Group, Inc. | 400 | 21,440 | ||||||||
Heritage Insurance Holdings, Inc. | 2,800 | 8,624 | ||||||||
Jackson Financial, Inc., Class A | 14,000 | 523,740 | ||||||||
Lemonade, Inc. (a) | 327 | 4,663 | ||||||||
Lincoln National Corp. | 3,600 | 80,892 | ||||||||
Maiden Holdings Ltd. (a) | 100 | 209 | ||||||||
MBIA, Inc. (a) | 600 | 5,556 | ||||||||
Mercury General Corp. | 2,800 | 88,872 | ||||||||
ProAssurance Corp. | 2,700 | 49,896 | ||||||||
Progressive Corp. | 5,700 | 815,442 | ||||||||
Selectquote, Inc. (a) | 4,200 | 9,114 | ||||||||
SiriusPoint Ltd. (a) | 4,400 | 35,772 | ||||||||
Skyward Specialty Insurance Group, Inc. (a) | 21,697 | 474,513 | ||||||||
Tiptree, Inc. | 900 | 13,113 | ||||||||
Trean Insurance Group, Inc. (a) | 3,200 | 19,584 | ||||||||
United Insurance Holdings Corp. (a) | 2,100 | 5,922 | ||||||||
Universal Insurance Holdings, Inc. | 2,500 | 45,550 | ||||||||
Unum Group | 20,900 | 826,804 | ||||||||
Voya Financial, Inc. | 1,900 | 135,774 | ||||||||
|
| |||||||||
| 3,762,352 | ||||||||||
|
| |||||||||
Materials — 0.2% | ||||||||||
AdvanSix, Inc. | 600 | 22,962 | ||||||||
Alamos Gold, Inc., Class A | 26,000 | 317,980 | ||||||||
Alcoa Corp. | 1 | 43 | ||||||||
Alpha Metallurgical Resources, Inc. | 300 | 46,800 | ||||||||
American Vanguard Corp. | 1,300 | 28,444 | ||||||||
Apogee Enterprises, Inc. | 500 | 21,625 | ||||||||
B2Gold Corp. | 13,200 | 52,008 | ||||||||
Carpenter Technology Corp. | 1,800 | 80,568 | ||||||||
Century Aluminum Co. (a) | 800 | 8,000 | ||||||||
Clearwater Paper Corp. (a) | 400 | 13,368 | ||||||||
Codexis, Inc. (a) | 15,900 | 65,826 | ||||||||
Coeur Mining, Inc. (a) | 54,500 | 217,455 | ||||||||
CONSOL Energy, Inc. | 800 | 46,616 | ||||||||
Eagle Materials, Inc. | 200 | 29,350 | ||||||||
See Notes to Consolidated Financial Statements.
37
Table of Contents
Blackstone Alternative Multi-Strategy Fund and Subsidiaries
Consolidated Schedule of Investments ^ (Continued)
March 31, 2023
Security Description | Shares | Value | ||||||||
Eastman Chemical Co. | 4,600 | $ | 387,964 | |||||||
Ecolab, Inc. | 7,400 | 1,224,922 | ||||||||
Ecovyst, Inc. (a) | 11,300 | 124,865 | ||||||||
Element Solutions, Inc. | 1,300 | 25,103 | ||||||||
Endeavour Silver Corp. (a) | 600 | 2,328 | ||||||||
Gatos Silver, Inc. (a) | 6,700 | 43,751 | ||||||||
Glatfelter Corp. (a) | 12,300 | 39,237 | ||||||||
Graphic Packaging Holding Co. | 24,800 | 632,152 | ||||||||
Haynes International, Inc. | 100 | 5,009 | ||||||||
HB Fuller Co. | 2,300 | 157,435 | ||||||||
Hudbay Minerals, Inc. | 600 | 3,150 | ||||||||
Innospec, Inc. | 300 | 30,801 | ||||||||
Intrepid Potash, Inc. (a) | 3,600 | 99,360 | ||||||||
Kinross Gold Corp. | 7,800 | 36,738 | ||||||||
Livent Corp. (a) | 5,600 | 121,632 | ||||||||
LSB Industries, Inc. (a) | 9,500 | 98,135 | ||||||||
McEwen Mining, Inc. (a) | 3,900 | 33,033 | ||||||||
Myers Industries, Inc. | 800 | 17,144 | ||||||||
NACCO Industries, Inc., Class A | 200 | 7,214 | ||||||||
New Gold, Inc. (a) | 29,800 | 32,780 | ||||||||
Newmont Corp. | 24,300 | 1,191,186 | ||||||||
Northwest Pipe Co. (a) | 400 | 12,492 | ||||||||
O-I Glass, Inc. (a) | 6,900 | 156,699 | ||||||||
Osisko Gold Royalties Ltd. | 1,000 | 15,820 | ||||||||
Pan American Silver Corp. | 19,700 | 358,540 | ||||||||
Park Aerospace Corp. | 900 | 12,105 | ||||||||
PolyMet Mining Corp. (a) | 600 | 1,290 | ||||||||
Ramaco Resources, Inc. | 8,500 | 74,885 | ||||||||
Ranpak Holdings Corp. (a) | 7,100 | 37,062 | ||||||||
Rayonier Advanced Materials, Inc. (a) | 6,200 | 38,874 | ||||||||
Ryerson Holding Corp. | 1,500 | 54,570 | ||||||||
Sandstorm Gold Ltd. | 2,000 | 11,620 | ||||||||
Seabridge Gold, Inc. (a) | 100 | 1,295 | ||||||||
Sherwin-Williams Co. | 800 | 179,816 | ||||||||
Silgan Holdings, Inc. | 1,400 | 75,138 | ||||||||
Silvercorp Metals, Inc. | 27,700 | 105,814 | ||||||||
SunCoke Energy, Inc. | 9,100 | 81,718 | ||||||||
Sylvamo Corp. | 4,500 | 208,170 | ||||||||
Tecnoglass, Inc. | 4,200 | 176,232 | ||||||||
Ternium SA, ADR | 1,800 | 74,268 | ||||||||
TimkenSteel Corp. (a) | 4,600 | 84,364 | ||||||||
Trex Co., Inc. (a) | 5,100 | 248,217 | ||||||||
Tronox Holdings PLC, Class A | 8,500 | 122,230 | ||||||||
Unifi, Inc. (a) | 2,600 | 21,242 | ||||||||
United States Steel Corp. | 68,100 | 1,777,410 | ||||||||
Valvoline, Inc. | 5,300 | 185,182 | ||||||||
See Notes to Consolidated Financial Statements.
38
Table of Contents
Blackstone Alternative Multi-Strategy Fund and Subsidiaries
Consolidated Schedule of Investments ^ (Continued)
March 31, 2023
Security Description | Shares | Value | ||||||||
Warrior Met Coal, Inc. | 6,900 | $ | 253,299 | |||||||
|
| |||||||||
| 9,633,336 | ||||||||||
|
| |||||||||
Media — 1.1% | ||||||||||
Activision Blizzard, Inc. | 10,582 | 905,713 | ||||||||
Airbnb, Inc., Class A (a) | 40,600 | 5,050,640 | ||||||||
Alphabet, Inc., Class A (a) | 26,700 | 2,769,591 | ||||||||
Angi, Inc. (a) | 23,100 | 52,437 | ||||||||
AppLovin Corp., Class A (a) | 1,000 | 15,750 | ||||||||
Audacy, Inc. (a) | 12,400 | 1,670 | ||||||||
Bumble, Inc., Class A (a) | 4,700 | 91,885 | ||||||||
Charter Communications, Inc., Class A (a) | 1,240 | 443,437 | ||||||||
Clear Channel Outdoor Holdings, Inc. (a) | 29,800 | 35,760 | ||||||||
DHI Group, Inc. (a) | 2,700 | 10,476 | ||||||||
DoorDash, Inc., Class A (a) | 10,200 | 648,312 | ||||||||
Eventbrite, Inc., Class A (a) | 18,900 | 162,162 | ||||||||
Fiverr International Ltd. (a) | 9,000 | 314,280 | ||||||||
Fluent, Inc. (a) | 1,800 | 1,476 | ||||||||
GoDaddy, Inc., Class A (a) | 3,000 | 233,160 | ||||||||
Harte Hanks, Inc. (a) | 1,300 | 12,233 | ||||||||
HealthStream, Inc. | 1,400 | 37,940 | ||||||||
IMAX Corp. (a) | 4,900 | 93,982 | ||||||||
Liberty Media Corp-Liberty SiriusXM, Class A (a),(b) | 21,554 | 605,452 | ||||||||
Liberty Media Corp-Liberty SiriusXM, Class C (a) | 33,974 | 950,932 | ||||||||
Lions Gate Entertainment Corp., Class A (a) | 200 | 2,214 | ||||||||
Lyft, Inc., Class A (a) | 54,977 | 509,637 | ||||||||
Magnite, Inc. (a) | 5,500 | 50,930 | ||||||||
Marqeta, Inc., Class A (a) | 101,300 | 462,941 | ||||||||
Match Group, Inc. (a) | 200 | 7,678 | ||||||||
Meta Platforms, Inc., Class A (a) | 8,487 | 1,798,735 | ||||||||
Netflix, Inc. (a) | 28,700 | 9,915,276 | ||||||||
OptimizeRx Corp. (a) | 2,700 | 39,501 | ||||||||
Pinterest, Inc., Class A (a) | 155,500 | 4,240,485 | ||||||||
Quotient Technology, Inc. (a) | 11,500 | 37,720 | ||||||||
ROBLOX Corp., Class A (a) | 152,600 | 6,863,948 | ||||||||
Roku, Inc. (a) | 36,800 | 2,422,176 | ||||||||
Sciplay Corp., Class A (a) | 3,800 | 64,448 | ||||||||
Shutterstock, Inc. | 3,200 | 232,320 | ||||||||
Snap, Inc., Class A (a) | 398,100 | 4,462,701 | ||||||||
Spotify Technology SA (a) | 17,900 | 2,391,798 | ||||||||
TechTarget, Inc. (a) | 4,100 | 148,092 | ||||||||
Townsquare Media, Inc., Class A | 500 | 4,000 | ||||||||
TripAdvisor, Inc. (a) | 100 | 1,986 | ||||||||
TrueCar, Inc. (a) | 3,400 | 7,820 | ||||||||
Upwork, Inc. (a) | 26,000 | 294,320 | ||||||||
See Notes to Consolidated Financial Statements.
39
Table of Contents
Blackstone Alternative Multi-Strategy Fund and Subsidiaries
Consolidated Schedule of Investments ^ (Continued)
March 31, 2023
Security Description | Shares | Value | ||||||||
Urban One, Inc. (a) | 300 | $ | 1,650 | |||||||
VeriSign, Inc. (a) | 5,000 | 1,056,650 | ||||||||
World Wrestling Entertainment, Inc., Class A | 1,100 | 100,386 | ||||||||
|
| |||||||||
| 47,554,700 | ||||||||||
|
| |||||||||
Oil & Gas — 0.4% | ||||||||||
Antero Resources Corp. (a) | 22,800 | 526,452 | ||||||||
Archrock, Inc. | 100 | 977 | ||||||||
Berry Corp. | 13,300 | 104,405 | ||||||||
Cheniere Energy, Inc. | 20,700 | 3,262,320 | ||||||||
Civeo Corp. (a) | 425 | 8,776 | ||||||||
Clean Energy Fuels Corp. (a) | 30,100 | 131,236 | ||||||||
ConocoPhillips | 13,200 | 1,309,572 | ||||||||
Crescent Point Energy Corp. | 2,800 | 19,768 | ||||||||
CVR Energy, Inc. | 2,700 | 88,506 | ||||||||
Delek US Holdings, Inc. | 12,100 | 277,695 | ||||||||
DMC Global, Inc. (a) | 700 | 15,379 | ||||||||
EnLink Midstream LLC | 8,300 | 89,972 | ||||||||
Epsilon Energy Ltd. | 1,600 | 8,544 | ||||||||
EQT Corp. | 41,500 | 1,324,265 | ||||||||
Evolution Petroleum Corp. | 4,700 | 29,657 | ||||||||
Forum Energy Technologies, Inc. (a) | 1,400 | 35,602 | ||||||||
Golar LNG Ltd. (a) | 2,600 | 56,160 | ||||||||
Helix Energy Solutions Group, Inc. (a) | 31,800 | 246,132 | ||||||||
HF Sinclair Corp. | 19,314 | 934,411 | ||||||||
Independence Contract Drilling, Inc. (a) | 3,200 | 10,432 | ||||||||
Kosmos Energy Ltd. (a) | 92,700 | 689,688 | ||||||||
Magnolia Oil & Gas Corp., Class A | 18,200 | 398,216 | ||||||||
Mammoth Energy Services, Inc. (a) | 4,600 | 19,412 | ||||||||
Marathon Oil Corp. | 24,500 | 587,020 | ||||||||
Matrix Service Co. (a) | 2,200 | 11,880 | ||||||||
Murphy Oil Corp. | 7,400 | 273,652 | ||||||||
Murphy USA, Inc. | 400 | 103,220 | ||||||||
Nabors Industries Ltd. (a) | 1,200 | 146,292 | ||||||||
Natural Gas Services Group, Inc. (a) | 400 | 4,124 | ||||||||
Newpark Resources, Inc. (a) | 13,300 | 51,205 | ||||||||
NextDecade Corp. (a) | 200 | 994 | ||||||||
NexTier Oilfield Solutions, Inc. (a) | 14,546 | 115,641 | ||||||||
Nine Energy Service, Inc. (a) | 100 | 556 | ||||||||
North American Construction Group Ltd. | 200 | 3,340 | ||||||||
NOW, Inc. (a) | 6,700 | 74,705 | ||||||||
Oceaneering International, Inc. (a) | 5,200 | 91,676 | ||||||||
Oil States International, Inc. (a) | 11,500 | 95,795 | ||||||||
Par Pacific Holdings, Inc. (a) | 6,600 | 192,720 | ||||||||
Patterson-UTI Energy, Inc. | 8,000 | 93,600 | ||||||||
PBF Energy, Inc., Class A | 38,500 | 1,669,360 | ||||||||
See Notes to Consolidated Financial Statements.
40
Table of Contents
Blackstone Alternative Multi-Strategy Fund and Subsidiaries
Consolidated Schedule of Investments ^ (Continued)
March 31, 2023
Security Description | Shares | Value | ||||||||
Permian Resources Corp. | 72,300 | $ | 759,150 | |||||||
PHX Minerals, Inc. | 1,600 | 4,192 | ||||||||
Plains GP Holdings LP, Class A (a) | 46,000 | 603,520 | ||||||||
Precision Drilling Corp. (a) | 800 | 41,136 | ||||||||
ProPetro Holding Corp. (a) | 2,600 | 18,694 | ||||||||
Ranger Oil Corp., Class A | 1,000 | 40,840 | ||||||||
Ring Energy, Inc. (a) | 28,100 | 53,390 | ||||||||
Select Energy Services, Inc., Class A | 8,000 | 55,680 | ||||||||
SM Energy Co. | 1,100 | 30,976 | ||||||||
Smart Sand, Inc. (a) | 3,400 | 5,984 | ||||||||
Solaris Oilfield Infrastructure, Inc., Class A | 2,800 | 23,912 | ||||||||
Talos Energy, Inc. (a) | 12,800 | 189,952 | ||||||||
TETRA Technologies, Inc. (a) | 2,600 | 6,890 | ||||||||
Tidewater, Inc. (a) | 2,500 | 110,200 | ||||||||
Transocean Ltd. (a) | 219,533 | 1,396,230 | ||||||||
US Silica Holdings, Inc. (a) | 200 | 2,388 | ||||||||
Viper Energy Partners LP | 3,200 | 89,600 | ||||||||
Vitesse Energy, Inc. | 200 | 3,806 | ||||||||
W&T Offshore, Inc. (a) | 35,300 | 179,324 | ||||||||
Weatherford International PLC (a) | 12,600 | 747,810 | ||||||||
World Fuel Services Corp. | 4,500 | 114,975 | ||||||||
|
| |||||||||
| 17,582,006 | ||||||||||
|
| |||||||||
Pharmaceuticals — 0.0% | ||||||||||
Contra StrongBridge (a),(c) | 5,000 | 0 | ||||||||
|
| |||||||||
Private Equity — 0.0% | ||||||||||
Millennium Equity Private Equity (a),(b),(c) | 60,879 | 1,400,217 | ||||||||
|
| |||||||||
Real Estate — 0.1% | ||||||||||
Agree Realty Corp. | 9,700 | 665,517 | ||||||||
Alpine Income Property Trust, Inc. | 2,500 | 42,075 | ||||||||
American Tower Corp. | 1,000 | 204,340 | ||||||||
Braemar Hotels & Resorts, Inc. | 2,800 | 10,808 | ||||||||
Chatham Lodging Trust | 1,600 | 16,784 | ||||||||
Community Healthcare Trust, Inc. | 600 | 21,960 | ||||||||
CTO Realty Growth, Inc. | 2,400 | 41,424 | ||||||||
Diversified Healthcare Trust | 70,200 | 94,770 | ||||||||
EastGroup Properties, Inc. | 900 | 148,788 | ||||||||
Equity Commonwealth | 13,700 | 283,727 | ||||||||
Essential Properties Realty Trust, Inc. | 400 | 9,940 | ||||||||
eXp World Holdings, Inc. | 5,500 | 69,795 | ||||||||
Farmland Partners, Inc. | 6,500 | 69,550 | ||||||||
Four Corners Property Trust, Inc. | 3,200 | 85,952 | ||||||||
Franklin Street Properties Corp. | 400 | 628 | ||||||||
Getty Realty Corp. | 5,700 | 205,371 | ||||||||
Gladstone Land Corp. | 4,400 | 73,260 | ||||||||
See Notes to Consolidated Financial Statements.
41
Table of Contents
Blackstone Alternative Multi-Strategy Fund and Subsidiaries
Consolidated Schedule of Investments ^ (Continued)
March 31, 2023
Security Description | Shares | Value | ||||||||
Hersha Hospitality Trust, Class A | 7,700 | $ | 51,744 | |||||||
Industrial Logistics Properties Trust | 6,100 | 18,727 | ||||||||
Legacy Housing Corp. (a) | 600 | 13,656 | ||||||||
Life Storage, Inc. | 2,500 | 327,725 | ||||||||
McGrath RentCorp | 1,200 | 111,972 | ||||||||
Medalist Diversified REIT, Inc. | 900 | 752 | ||||||||
NETSTREIT Corp. | 3,300 | 60,324 | ||||||||
Park Hotels & Resorts, Inc. | 12 | 148 | ||||||||
Pebblebrook Hotel Trust | 19,000 | 266,760 | ||||||||
Plymouth Industrial REIT, Inc. | 1,900 | 39,919 | ||||||||
Power REIT (a) | 200 | 747 | ||||||||
Presidio Property Trust, Inc., Class A | 500 | 520 | ||||||||
Rafael Holdings, Inc., Class B (a) | 1,200 | 1,860 | ||||||||
RE/MAX Holdings, Inc., Class A | 1,800 | 33,768 | ||||||||
Redfin Corp. (a) | 32,900 | 298,074 | ||||||||
Retail Opportunity Investments Corp. | 13,300 | 185,668 | ||||||||
RLJ Lodging Trust | 2,700 | 28,620 | ||||||||
RMR Group, Inc. (The), Class A | 100 | 2,624 | ||||||||
SBA Communications Corp. | 1,000 | 261,070 | ||||||||
Summit Hotel Properties, Inc. | 3,200 | 22,400 | ||||||||
Terreno Realty Corp. | 5,500 | 355,300 | ||||||||
UMH Properties, Inc. | 200 | 2,958 | ||||||||
Universal Health Realty Income Trust | 400 | 19,244 | ||||||||
Wheeler Real Estate Investment Trust, Inc. (a) | 200 | 254 | ||||||||
Whitestone REIT | 600 | 5,520 | ||||||||
|
| |||||||||
| 4,155,043 | ||||||||||
|
| |||||||||
Renewable Energy — 0.1% | ||||||||||
Alto Ingredients, Inc. (a) | 200 | 300 | ||||||||
Broadwind Energy, Inc. (a) | 1,100 | 4,224 | ||||||||
Eneti, Inc. | 5,190 | 48,527 | ||||||||
Enphase Energy, Inc. (a) | 20,200 | 4,247,656 | ||||||||
FuelCell Energy, Inc. (a) | 4,771 | 13,597 | ||||||||
FutureFuel Corp. | 2,900 | 21,402 | ||||||||
Gevo, Inc. (a) | 22,000 | 33,880 | ||||||||
Maxeon Solar Technologies Ltd. (a) | 4,500 | 119,430 | ||||||||
SolarEdge Technologies, Inc. (a) | 5,068 | 1,540,419 | ||||||||
TPI Composites, Inc. (a) | 8,200 | 107,010 | ||||||||
|
| |||||||||
| 6,136,445 | ||||||||||
|
| |||||||||
Retail & Wholesale—Discretionary — 0.4% | ||||||||||
1-800-Flowers.com, Inc., Class A (a) | 4,300 | 49,450 | ||||||||
Allbirds, Inc., Class A (a) | 14,500 | 17,400 | ||||||||
Amazon.com, Inc. (a) | 66,900 | 6,910,101 | ||||||||
Aspen Aerogels, Inc. (a) | 8,000 | 59,600 | ||||||||
AutoZone, Inc. (a) | 200 | 491,630 | ||||||||
See Notes to Consolidated Financial Statements.
42
Table of Contents
Blackstone Alternative Multi-Strategy Fund and Subsidiaries
Consolidated Schedule of Investments ^ (Continued)
March 31, 2023
Security Description | Shares | Value | ||||||||
Avis Budget Group, Inc. (a) | 6,700 | $ | 1,305,160 | |||||||
Barnes & Noble Education, Inc. (a) | 5,300 | 8,056 | ||||||||
Bassett Furniture Industries, Inc. | 400 | 7,120 | ||||||||
BlueLinx Holdings, Inc. (a) | 1,500 | 101,940 | ||||||||
Build-A-Bear Workshop, Inc. | 1,000 | 23,240 | ||||||||
Cato Corp., Class A | 2,000 | 17,680 | ||||||||
Chewy, Inc., Class A (a) | 34,700 | 1,297,086 | ||||||||
Chico's FAS, Inc. (a) | 23,300 | 128,150 | ||||||||
Conn's, Inc. (a) | 4,400 | 26,664 | ||||||||
Destination XL Group, Inc. (a) | 10,400 | 57,304 | ||||||||
Dick's Sporting Goods, Inc. | 1,800 | 255,402 | ||||||||
Etsy, Inc. (a) | 37,300 | 4,152,609 | ||||||||
G-III Apparel Group Ltd. (a) | 2,700 | 41,985 | ||||||||
Gaia, Inc. (a) | 700 | 1,939 | ||||||||
Guess?, Inc. | 4,200 | 81,732 | ||||||||
Haverty Furniture Cos., Inc. | 1,700 | 54,247 | ||||||||
La-Z-Boy, Inc. | 2,400 | 69,792 | ||||||||
Lumber Liquidators Holdings, Inc. (a) | 1,800 | 6,840 | ||||||||
Monro, Inc. | 1,700 | 84,031 | ||||||||
National Vision Holdings, Inc. (a) | 1,700 | 32,028 | ||||||||
Overstock.com, Inc. (a) | 5,000 | 101,350 | ||||||||
PC Connection, Inc. | 100 | 4,496 | ||||||||
Petco Health & Wellness Co., Inc. (a) | 5,400 | 48,600 | ||||||||
PetMed Express, Inc. | 200 | 3,248 | ||||||||
Qurate Retail, Inc., Class A (a) | 112,300 | 110,930 | ||||||||
Revolve Group, Inc. (a) | 11,000 | 289,300 | ||||||||
Rush Enterprises, Inc., Class A | 2,700 | 147,420 | ||||||||
ScanSource, Inc. (a) | 200 | 6,088 | ||||||||
Shoe Carnival, Inc. | 1,900 | 48,735 | ||||||||
Stitch Fix, Inc., Class A (a) | 21,800 | 111,398 | ||||||||
TJX Cos., Inc. (b) | 16,441 | 1,288,317 | ||||||||
Vera Bradley, Inc. (a) | 5,200 | 31,148 | ||||||||
Veritiv Corp. | 200 | 27,028 | ||||||||
Wayfair, Inc., Class A (a) | 5,100 | 175,134 | ||||||||
|
| |||||||||
| 17,674,378 | ||||||||||
|
| |||||||||
Retail & Wholesale—Staples — 0.1% | ||||||||||
Arko Corp. | 2,300 | 19,527 | ||||||||
Laird Superfood, Inc. (a) | 400 | 324 | ||||||||
Natural Grocers by Vitamin Cottage, Inc. | 1,000 | 11,750 | ||||||||
Ollie's Bargain Outlet Holdings, Inc. (a) | 5,800 | 336,052 | ||||||||
PriceSmart, Inc. | 300 | 21,444 | ||||||||
Rite Aid Corp. (a) | 16,400 | 36,736 | ||||||||
Village Super Market, Inc., Class A | 200 | 4,576 | ||||||||
Walmart, Inc. | 21,634 | 3,189,933 | ||||||||
Weis Markets, Inc. | 300 | 25,401 | ||||||||
|
| |||||||||
| 3,645,743 | ||||||||||
|
| |||||||||
See Notes to Consolidated Financial Statements.
43
Table of Contents
Blackstone Alternative Multi-Strategy Fund and Subsidiaries
Consolidated Schedule of Investments ^ (Continued)
March 31, 2023
Security Description | Shares | Value | ||||||||
Software & Technology Services — 2.5% | ||||||||||
8x8, Inc. (a) | 1,600 | $ | 6,672 | |||||||
ACI Worldwide, Inc. (a) | 74,919 | 2,021,315 | ||||||||
Adobe, Inc. (a) | 18,800 | 7,244,956 | ||||||||
Agilysys, Inc. (a) | 400 | 33,004 | ||||||||
Akerna Corp. (a) | 35 | 27 | ||||||||
Alignment Healthcare, Inc. (a) | 3,300 | 20,988 | ||||||||
Alteryx, Inc., Class A (a) | 4,500 | 264,780 | ||||||||
American Software, Inc., Class A | 2,000 | 25,220 | ||||||||
Appian Corp., Class A (a) | 300 | 13,314 | ||||||||
Asana, Inc., Class A (a) | 22,700 | 479,651 | ||||||||
Asure Software, Inc. (a) | 2,000 | 29,000 | ||||||||
Atlassian Corp., Class A (a) | 4,600 | 787,382 | ||||||||
Autodesk, Inc. (a) | 15,700 | 3,268,112 | ||||||||
Automatic Data Processing, Inc. | 20,200 | 4,497,126 | ||||||||
AvidXchange Holdings, Inc. (a) | 429,302 | 3,348,555 | ||||||||
Bandwidth, Inc., Class A (a) | 6,900 | 104,880 | ||||||||
BigCommerce Holdings, Inc., Series 1 (a) | 4,700 | 42,018 | ||||||||
Box, Inc., Class A (a) | 14,500 | 388,455 | ||||||||
Brightcove, Inc. (a) | 3,100 | 13,795 | ||||||||
C3.ai, Inc., Class A (a) | 4,500 | 151,065 | ||||||||
Calix, Inc. (a) | 2,100 | 112,539 | ||||||||
Cardlytics, Inc. (a) | 10,000 | 33,950 | ||||||||
Cass Information Systems, Inc. | 400 | 17,324 | ||||||||
Cerence, Inc. (a) | 6,200 | 174,158 | ||||||||
Clear Secure, Inc., Class A | 5,600 | 146,552 | ||||||||
Clearwater Analytics Holdings, Inc., Class A (a) | 275,004 | 4,389,064 | ||||||||
Cloudflare, Inc., Class A (a) | 28,400 | 1,751,144 | ||||||||
CommVault Systems, Inc. (a) | 1,800 | 102,132 | ||||||||
CompoSecure, Inc. (a) | 2,300 | 16,928 | ||||||||
Computer Programs & Systems, Inc. (a) | 500 | 15,100 | ||||||||
comScore, Inc. (a) | 5,000 | 6,150 | ||||||||
Conduent, Inc. (a) | 4,400 | 15,092 | ||||||||
Confluent, Inc., Class A (a) | 1,300 | 31,291 | ||||||||
Crowdstrike Holdings, Inc., Class A (a) | 31,400 | 4,309,964 | ||||||||
CSG Systems International, Inc. | 800 | 42,960 | ||||||||
CyberArk Software Ltd. (a) | 300 | 44,394 | ||||||||
Datadog, Inc., Class A (a) | 5,300 | 385,098 | ||||||||
Definitive Healthcare Corp. (a) | 500 | 5,165 | ||||||||
Digi International, Inc. (a) | 3,100 | 104,408 | ||||||||
Digimarc Corp. (a) | 1,100 | 21,615 | ||||||||
DigitalOcean Holdings, Inc. (a) | 13,100 | 513,127 | ||||||||
DocuSign, Inc. (a) | 60,500 | 3,527,150 | ||||||||
Domo, Inc., Class B (a) | 4,100 | 58,179 | ||||||||
Donnelley Financial Solutions, Inc. (a) | 900 | 36,774 | ||||||||
DoubleVerify Holdings, Inc. (a) | 21,396 | 645,089 | ||||||||
See Notes to Consolidated Financial Statements.
44
Table of Contents
Blackstone Alternative Multi-Strategy Fund and Subsidiaries
Consolidated Schedule of Investments ^ (Continued)
March 31, 2023
Security Description | Shares | Value | ||||||||
Duolingo, Inc. (a) | 3,200 | $ | 456,288 | |||||||
Dynatrace, Inc. (a) | 42,300 | 1,789,290 | ||||||||
Ebix, Inc. | 2,300 | 30,337 | ||||||||
eGain Corp. (a) | 700 | 5,313 | ||||||||
Elastic NV (a) | 300 | 17,370 | ||||||||
Enfusion, Inc., Class A (a) | 900 | 9,450 | ||||||||
EngageSmart, Inc. (a) | 26,884 | 517,517 | ||||||||
Everbridge, Inc. (a) | 1,200 | 41,604 | ||||||||
Evertec, Inc. | 1,600 | 54,000 | ||||||||
ExlService Holdings, Inc. (a) | 1,000 | 161,830 | ||||||||
FactSet Research Systems, Inc. | 1,500 | 622,635 | ||||||||
Fair Isaac Corp. (a) | 200 | 140,538 | ||||||||
Fastly, Inc., Class A (a) | 34,500 | 612,720 | ||||||||
Fidelity National Information Services, Inc. | 20,161 | 1,095,347 | ||||||||
Forrester Research, Inc. (a) | 500 | 16,175 | ||||||||
Fortinet, Inc. (a) | 45,900 | 3,050,514 | ||||||||
Gartner, Inc. (a) | 1,700 | 553,809 | ||||||||
Genpact Ltd. | 200 | 9,244 | ||||||||
Global Payments, Inc. | 52,629 | 5,538,676 | ||||||||
Green Dot Corp., Class A (a) | 5,900 | 101,362 | ||||||||
Grid Dynamics Holdings, Inc. (a) | 3,600 | 41,256 | ||||||||
Guidewire Software, Inc. (a) | 1,500 | 123,075 | ||||||||
HashiCorp, Inc., Class A (a) | 1,600 | 46,864 | ||||||||
Health Catalyst, Inc. (a) | 7,900 | 92,193 | ||||||||
Hims & Hers Health, Inc. (a) | 6,600 | 65,472 | ||||||||
IBEX Holdings Ltd. (a) | 400 | 9,760 | ||||||||
ICF International, Inc. | 400 | 43,880 | ||||||||
Immersion Corp. | 6,900 | 61,686 | ||||||||
Intapp, Inc. (a) | 300 | 13,452 | ||||||||
Jamf Holding Corp. (a) | 1,900 | 36,898 | ||||||||
Kubient, Inc. (a) | 300 | 207 | ||||||||
Kyndryl Holdings, Inc. (a) | 4,400 | 64,944 | ||||||||
Limelight Networks, Inc. (a) | 15,100 | 11,946 | ||||||||
LivePerson, Inc. (a) | 13,500 | 59,535 | ||||||||
LiveRamp Holdings, Inc. (a) | 3,500 | 76,755 | ||||||||
Manhattan Associates, Inc. (a) | 3,000 | 464,550 | ||||||||
Mitek Systems, Inc. (a) | 2,600 | 24,934 | ||||||||
Model N, Inc. (a) | 5,200 | 174,044 | ||||||||
Momentive Global, Inc. (a) | 20,600 | 191,992 | ||||||||
Monday.com Ltd. (a) | 2,900 | 413,975 | ||||||||
MoneyGram International, Inc. (a) | 9,900 | 103,158 | ||||||||
Moneylion, Inc. (a) | 400 | 227 | ||||||||
MSCI, Inc. | 2,700 | 1,511,163 | ||||||||
NetSol Technologies, Inc. (a) | 200 | 528 | ||||||||
New Relic, Inc. (a) | 4,900 | 368,921 | ||||||||
NextGen Healthcare, Inc. (a) | 5,700 | 99,237 | ||||||||
See Notes to Consolidated Financial Statements.
45
Table of Contents
Blackstone Alternative Multi-Strategy Fund and Subsidiaries
Consolidated Schedule of Investments ^ (Continued)
March 31, 2023
Security Description | Shares | Value | ||||||||
Nutanix, Inc., Class A (a) | 10,000 | $ | 259,900 | |||||||
Nuvei Corp. (a) | 200 | 8,705 | ||||||||
ON24, Inc. (a) | 1,300 | 11,388 | ||||||||
OneSpan, Inc. (a) | 1,400 | 24,500 | ||||||||
Open Lending Corp., Class A (a) | 17,100 | 120,384 | ||||||||
Outset Medical, Inc. (a) | 2,300 | 42,320 | ||||||||
PagerDuty, Inc. (a) | 12,200 | 426,756 | ||||||||
Palo Alto Networks, Inc. (a) | 22,700 | 4,534,098 | ||||||||
Parsons Corp. (a) | 300 | 13,422 | ||||||||
Paycom Software, Inc. (a) | 3,600 | 1,094,436 | ||||||||
Paylocity Holding Corp. (a) | 5,000 | 993,900 | ||||||||
Paymentus Holdings, Inc., Class A (a) | 300 | 2,658 | ||||||||
Payoneer Global, Inc. (a) | 39,800 | 249,944 | ||||||||
PayPal Holdings, Inc. (a) | 125,200 | 9,507,688 | ||||||||
Paysafe Ltd. (a) | 1,375 | 23,746 | ||||||||
PDF Solutions, Inc. (a) | 1,600 | 67,840 | ||||||||
Pegasystems, Inc. | 900 | 43,632 | ||||||||
PFSweb, Inc. | 700 | 2,968 | ||||||||
Phreesia, Inc. (a) | 3,800 | 122,702 | ||||||||
PowerSchool Holdings, Inc., Class A (a) | 100 | 1,982 | ||||||||
Privia Health Group, Inc. (a) | 2,400 | 66,264 | ||||||||
PROS Holdings, Inc. (a) | 700 | 19,180 | ||||||||
Q2 Holdings, Inc. (a) | 136,098 | 3,350,733 | ||||||||
Qualys, Inc. (a) | 4,100 | 533,082 | ||||||||
Rackspace Technology, Inc. (a) | 3,300 | 6,204 | ||||||||
Rapid7, Inc. (a) | 4,200 | 192,822 | ||||||||
Red Violet, Inc. (a) | 200 | 3,520 | ||||||||
Repay Holdings Corp. (a) | 17,724 | 116,447 | ||||||||
Rimini Street, Inc. (a) | 3,600 | 14,832 | ||||||||
RingCentral, Inc., Class A (a) | 300 | 9,201 | ||||||||
Sabre Corp. (a) | 16,900 | 72,501 | ||||||||
Samsara, Inc., Class A (a) | 1,300 | 25,636 | ||||||||
Schrodinger, Inc. (a) | 800 | 21,064 | ||||||||
SecureWorks Corp., Class A (a) | 800 | 6,856 | ||||||||
SEMrush Holdings, Inc., Class A (a) | 2,600 | 26,130 | ||||||||
Shopify, Inc., Class A (a) | 400 | 19,176 | ||||||||
Smartsheet, Inc., Class A (a) | 8,500 | 406,300 | ||||||||
SolarWinds Corp. (a) | 3,100 | 26,660 | ||||||||
Splunk, Inc. (a) | 200 | 19,176 | ||||||||
Sprinklr, Inc., Class A (a) | 400 | 5,184 | ||||||||
Sprout Social, Inc., Class A (a) | 6,000 | 365,280 | ||||||||
SPS Commerce, Inc. (a) | 500 | 76,150 | ||||||||
Squarespace, Inc., Class A (a) | 9,200 | 292,284 | ||||||||
Synopsys, Inc. (a) | 200 | 77,250 | ||||||||
Tabula Rasa HealthCare, Inc. (a) | 1,800 | 10,062 | ||||||||
Telos Corp. (a) | 4,500 | 11,385 | ||||||||
See Notes to Consolidated Financial Statements.
46
Table of Contents
Blackstone Alternative Multi-Strategy Fund and Subsidiaries
Consolidated Schedule of Investments ^ (Continued)
March 31, 2023
Security Description | Shares | Value | ||||||||
Tenable Holdings, Inc. (a) | 7,000 | $ | 332,570 | |||||||
Teradata Corp. (a) | 5,600 | 225,568 | ||||||||
TTEC Holdings, Inc. | 900 | 33,507 | ||||||||
Twilio, Inc., Class A (a) | 19,300 | 1,285,959 | ||||||||
Tyler Technologies, Inc. (a) | 100 | 35,464 | ||||||||
UiPath, Inc., Class A (a) | 13,900 | 244,084 | ||||||||
Unisys Corp. (a) | 20,300 | 78,764 | ||||||||
Varonis Systems, Inc. (a) | 17,900 | 465,579 | ||||||||
Veeva Systems, Inc., Class A (a) | 4,700 | 863,813 | ||||||||
Veradigm, Inc. (a) | 8,500 | 110,925 | ||||||||
Verisk Analytics, Inc. | 10,400 | 1,995,344 | ||||||||
Verra Mobility Corp. (a) | 5,300 | 89,676 | ||||||||
Vertex, Inc., Class A (a) | 700 | 14,483 | ||||||||
Vimeo, Inc. (a) | 36,200 | 138,646 | ||||||||
VirnetX Holding Corp. (a) | 3,100 | 4,061 | ||||||||
Visa, Inc., Class A | 52,200 | 11,769,012 | ||||||||
VMware, Inc., Class A (a) | 15,300 | 1,910,205 | ||||||||
Workiva, Inc. (a) | 3,100 | 317,471 | ||||||||
Yext, Inc. (a) | 13,400 | 128,774 | ||||||||
Zedge, Inc., Class B (a) | 1,200 | 2,340 | ||||||||
Zoom Video Communications, Inc., Class A (a) | 70,900 | 5,235,256 | ||||||||
ZoomInfo Technologies, Inc. (a) | 6,500 | 160,615 | ||||||||
Zscaler, Inc. (a) | 22,700 | 2,652,041 | ||||||||
Zuora, Inc., Class A (a) | 21,100 | 208,468 | ||||||||
|
| |||||||||
| 109,799,306 | ||||||||||
|
| |||||||||
Tech Hardware & Semiconductors — 0.7% | ||||||||||
A10 Networks, Inc. | 7,800 | 120,822 | ||||||||
ACM Research, Inc., Class A (a) | 500 | 5,850 | ||||||||
Airgain, Inc. (a) | 300 | 1,611 | ||||||||
Alpha & Omega Semiconductor Ltd. (a) | 2,000 | 53,900 | ||||||||
Ambarella, Inc. (a) | 6,700 | 518,714 | ||||||||
Amtech Systems, Inc. (a) | 500 | 4,770 | ||||||||
Applied Optoelectronics, Inc. (a) | 4,300 | 9,503 | ||||||||
Arista Networks, Inc. (a) | 13,800 | 2,316,468 | ||||||||
Arlo Technologies, Inc. (a) | 7,300 | 44,238 | ||||||||
Aviat Networks, Inc. (a) | 1,000 | 34,460 | ||||||||
AXT, Inc. (a) | 2,600 | 10,348 | ||||||||
Benchmark Electronics, Inc. | 1,800 | 42,642 | ||||||||
CalAmp Corp. (a) | 4,000 | 14,360 | ||||||||
Cambium Networks Corp. (a) | 1,400 | 24,808 | ||||||||
Casa Systems, Inc. (a) | 2,100 | 2,667 | ||||||||
Celestica, Inc. (a) | 7,200 | 92,880 | ||||||||
CEVA, Inc. (a) | 500 | 15,215 | ||||||||
Cisco Systems, Inc. | 122,400 | 6,398,460 | ||||||||
Comtech Telecommunications Corp. | 1,200 | 14,976 | ||||||||
See Notes to Consolidated Financial Statements.
47
Table of Contents
Blackstone Alternative Multi-Strategy Fund and Subsidiaries
Consolidated Schedule of Investments ^ (Continued)
March 31, 2023
Security Description | Shares | Value | ||||||||
Daktronics, Inc. (a) | 2,500 | $ | 14,175 | |||||||
Diebold Nixdorf, Inc. (a) | 9,200 | 11,040 | ||||||||
EMCORE Corp. (a) | 8,200 | 9,430 | ||||||||
Enovix Corp. (a) | 15,100 | 225,141 | ||||||||
Everspin Technologies, Inc. (a) | 1,500 | 10,215 | ||||||||
Extreme Networks, Inc. (a) | 4,400 | 84,128 | ||||||||
FormFactor, Inc. (a) | 4,600 | 146,510 | ||||||||
GLOBALFOUNDRIES, Inc. (a) | 19,796 | 1,428,875 | ||||||||
GoPro, Inc., Class A (a) | 25,500 | 128,265 | ||||||||
Harmonic, Inc. (a) | 16,000 | 233,440 | ||||||||
Hewlett Packard Enterprise Co. | 9,900 | 157,707 | ||||||||
Identiv, Inc. (a) | 1,400 | 8,596 | ||||||||
Impinj, Inc. (a) | 5,900 | 799,568 | ||||||||
Infinera Corp. (a) | 45,100 | 349,976 | ||||||||
Inseego Corp. (a) | 6,000 | 3,495 | ||||||||
Intel Corp. | 300,200 | 9,807,534 | ||||||||
Intellicheck, Inc. (a) | 800 | 2,000 | ||||||||
InterDigital, Inc. | 1,700 | 123,930 | ||||||||
inTEST Corp. (a) | 800 | 16,592 | ||||||||
IPG Photonics Corp. (a) | 2,400 | 295,944 | ||||||||
Kopin Corp. (a) | 11,100 | 12,099 | ||||||||
Lattice Semiconductor Corp. (a) | 3,400 | 324,700 | ||||||||
Lumentum Holdings, Inc. (a) | 8,600 | 464,486 | ||||||||
Luna Innovations, Inc. (a) | 800 | 5,752 | ||||||||
MaxLinear, Inc. (a) | 6,900 | 242,949 | ||||||||
Motorola Solutions, Inc. | 1,100 | 314,743 | ||||||||
NetApp, Inc. | 8,700 | 555,495 | ||||||||
NETGEAR, Inc. (a) | 1,600 | 29,616 | ||||||||
Netscout Systems, Inc. (a) | 400 | 11,460 | ||||||||
Ouster, Inc. (a) | 610 | 510 | ||||||||
Photronics, Inc. (a) | 9,400 | 155,852 | ||||||||
Pixelworks, Inc. (a) | 6,200 | 9,176 | ||||||||
PlayAGS, Inc. (a) | 11,300 | 80,795 | ||||||||
Power Integrations, Inc. | 800 | 67,712 | ||||||||
Pure Storage, Inc., Class A (a) | 18,300 | 466,833 | ||||||||
Quantum Corp. (a) | 400 | 460 | ||||||||
Ribbon Communications, Inc. (a) | 3,800 | 12,996 | ||||||||
Sanmina Corp. (a) | 900 | 54,891 | ||||||||
Semtech Corp. (a) | 12,000 | 289,680 | ||||||||
SiTime Corp. (a) | 2,600 | 369,798 | ||||||||
SkyWater Technology, Inc. (a) | 1,600 | 18,208 | ||||||||
Skyworks Solutions, Inc. | 5,500 | 648,890 | ||||||||
SMART Global Holdings, Inc. (a) | 600 | 10,344 | ||||||||
Sonos, Inc. (a) | 500 | 9,810 | ||||||||
Stratasys Ltd. (a) | 7,200 | 119,016 | ||||||||
Synaptics, Inc. (a) | 5,000 | 555,750 | ||||||||
TESSCO Technologies, Inc. (a) | 200 | 960 | ||||||||
See Notes to Consolidated Financial Statements.
48
Table of Contents
Blackstone Alternative Multi-Strategy Fund and Subsidiaries
Consolidated Schedule of Investments ^ (Continued)
March 31, 2023
Security Description | Shares | Value | ||||||||||
Universal Electronics, Inc. (a) | 1,400 | $ | 14,196 | |||||||||
Veeco Instruments, Inc. (a) | 4,430 | 93,606 | ||||||||||
Vicor Corp. (a) | 1,300 | 61,022 | ||||||||||
Vishay Precision Group, Inc. (a) | 800 | 33,408 | ||||||||||
VOXX International Corp. (a) | 629 | 7,756 | ||||||||||
Xerox Holdings Corp. | 15,700 | 241,780 | ||||||||||
|
| |||||||||||
| 28,868,002 | ||||||||||||
|
| |||||||||||
Telecommunications — 0.0% | ||||||||||||
AST SpaceMobile, Inc. (a) | 1,200 | 6,096 | ||||||||||
Cogent Communications Holdings, Inc. | 700 | 44,604 | ||||||||||
EchoStar Corp., Class A (a) | 3,600 | 65,844 | ||||||||||
Globalstar, Inc. (a) | 45,000 | 52,200 | ||||||||||
Gogo, Inc. (a) | 7,800 | 113,100 | ||||||||||
Lumen Technologies, Inc. (a) | 98,500 | 261,025 | ||||||||||
NII Holdings, Inc. (a),(c) | 50,677 | 13,176 | ||||||||||
Ooma, Inc. (a) | 1,300 | 16,263 | ||||||||||
Spok Holdings, Inc. | 4,100 | 41,533 | ||||||||||
|
| |||||||||||
| 613,841 | ||||||||||||
|
| |||||||||||
Utilities — 0.1% | ||||||||||||
American Electric Power Co., Inc. | 1,400 | 127,386 | ||||||||||
American Water Works Co., Inc. | 14,848 | 2,175,083 | ||||||||||
Consolidated Water Co., Ltd. | 600 | 9,858 | ||||||||||
NextEra Energy, Inc. | 5,100 | 393,108 | ||||||||||
SJW Group | 100 | 7,613 | ||||||||||
Southwest Gas Holdings, Inc. | 9,902 | 618,380 | ||||||||||
Unitil Corp. | 300 | 17,112 | ||||||||||
York Water Co. (The) | 600 | 26,820 | ||||||||||
|
| |||||||||||
| 3,375,360 | ||||||||||||
|
| |||||||||||
Total North America |
| 663,064,680 | ||||||||||
|
| |||||||||||
South America — 0.0% |
| |||||||||||
Banking — 0.0% | ||||||||||||
Bancolombia SA, ADR | 1,100 | 27,643 | ||||||||||
|
| |||||||||||
Consumer Discretionary Services — 0.0% | ||||||||||||
Arcos Dorados Holdings, Inc., Class A | 18,463 | 142,350 | ||||||||||
|
| |||||||||||
Consumer Staple Products — 0.0% | ||||||||||||
BRF SA, ADR (a) | 400 | 512 | ||||||||||
|
| |||||||||||
Financial Services — 0.0% | ||||||||||||
XP, Inc., Class A (a) | 19 | 226 | ||||||||||
|
| |||||||||||
Materials — 0.0% | ||||||||||||
Nexa Resources SA | 2,100 | 13,188 | ||||||||||
|
| |||||||||||
See Notes to Consolidated Financial Statements.
49
Table of Contents
Blackstone Alternative Multi-Strategy Fund and Subsidiaries
Consolidated Schedule of Investments ^ (Continued)
March 31, 2023
Security Description | Shares | Value | ||||||||||
Media — 0.0% | ||||||||||||
Liberty Latin America Ltd., Class C (a) | 3,200 | $ | 26,432 | |||||||||
|
| |||||||||||
Oil & Gas — 0.0% | ||||||||||||
Geopark Ltd. | 2,100 | 23,856 | ||||||||||
Gran Tierra Energy, Inc. (a) | 68,400 | 60,130 | ||||||||||
|
| |||||||||||
| 83,986 | ||||||||||||
|
| |||||||||||
Retail & Wholesale—Staples — 0.0% | ||||||||||||
Cia Brasileira de Distribuicao, ADR | 6,100 | 17,934 | ||||||||||
|
| |||||||||||
Software & Technology Services — 0.0% | ||||||||||||
Dlocal Ltd. (a) | 2,500 | 40,550 | ||||||||||
Pagseguro Digital Ltd., Class A (a) | 100 | 857 | ||||||||||
StoneCo Ltd., Class A (a) | 78,100 | 745,074 | ||||||||||
|
| |||||||||||
| 786,481 | ||||||||||||
|
| |||||||||||
Total South America |
| 1,098,752 | ||||||||||
|
| |||||||||||
TOTAL COMMON STOCK |
| 691,639,567 | ||||||||||
|
| |||||||||||
PREFERRED STOCK — 0.2% |
| |||||||||||
North America — 0.2% |
| |||||||||||
Consumer Discretionary Services — 0.0% |
| |||||||||||
Journey Group PLC (a),(b),(c) | 15,329 | 1,573,120 | ||||||||||
|
| |||||||||||
Financial Services — 0.1% |
| |||||||||||
ATI EQUITY (a),(b),(c) | 3,039 | 2,849,063 | ||||||||||
|
| |||||||||||
Retail & Wholesale—Discretionary — 0.1% |
| |||||||||||
Guitar Center, Inc. (a),(b),(c) | 38,645 | 4,666,384 | ||||||||||
|
| |||||||||||
Total North America |
| 9,088,567 | ||||||||||
|
| |||||||||||
TOTAL PREFERRED STOCK |
| 9,088,567 | ||||||||||
|
| |||||||||||
Security Description | Principal Amount | Value | ||||||||||
ASSET-BACKED SECURITIES — 3.4% |
| |||||||||||
North America — 3.4% |
| |||||||||||
ACE Securities Corp. Home Equity Loan Trust, Series 2005-AG1, Class M2, 1 mo. USD LIBOR + .69%, 5.54%, 08/25/35 (b),(d) | $ | 762,461 | 593,149 | |||||||||
Ajax Mortgage Loan Trust, Series 2021-E, Class B2, 3.42%, 12/25/60 (b),(d),(e) | 762,000 | 572,110 | ||||||||||
See Notes to Consolidated Financial Statements.
50
Table of Contents
Blackstone Alternative Multi-Strategy Fund and Subsidiaries
Consolidated Schedule of Investments ^ (Continued)
March 31, 2023
Security Description | Principal Amount | Value | ||||||||||
Allegro CLO XI Ltd., Series 2019-2A, Class D, 3 mo. USD LIBOR + 3.95%, 8.75%, 01/19/33 (b),(d),(e) | $ | 1,500,000 | $ | 1,391,817 | ||||||||
Allegro CLO XII Ltd., Series 2020-1A, Class E, 3 mo. USD LIBOR + 7.10%, 11.92%, 01/21/32 (b),(d),(e) | 1,000,000 | 881,708 | ||||||||||
AMSR Trust, Series 2022-SFR3, Class E1, 4.00%, 10/17/39 (b),(e) | 118,000 | 100,968 | ||||||||||
Arbor Realty Collateralized Loan Obligation Ltd., Series 2020-FL1, Class C, 1 mo. TSFR + 2.16%, 6.99%, 02/15/35 (b),(d),(e) | 1,792,000 | 1,745,501 | ||||||||||
Ares LIV CLO Ltd., Series 2019-54A, Class E, 3 mo. USD LIBOR + 7.34%, 12.13%, 10/15/32 (b),(d),(e) | 250,000 | 222,678 | ||||||||||
Ares LXI CLO Ltd., Series 2021-61A, Class E, 3 mo. USD LIBOR + 6.25%, 11.06%, 10/20/34 (b),(d),(e) | 1,000,000 | 868,789 | ||||||||||
Ares LXVIII CLO Ltd., Series 2023-68A, Class E, 3 mo. TSFR + 8.55%, 0.00%, 04/25/35 (b),(d),(e),(f),(g) | 1,000,000 | 960,000 | ||||||||||
Ares XLIII CLO Ltd., Series 2017-43A, Class ER, 3 mo. USD LIBOR + 6.86%, 11.65%, 07/15/34 (b),(d),(e) | 1,500,000 | 1,297,914 | ||||||||||
Bain Capital Credit CLO Ltd., Series 2022-1A, Class A1, 3 mo. TSFR + 1.32%, 5.95%, 04/18/35 (b),(d),(e) | 7,000,000 | 6,798,981 | ||||||||||
Balboa Bay Loan Funding Ltd., | ||||||||||||
Series 2021-1A, Class E, 3 mo. USD LIBOR + 6.16%, 10.97%, 07/20/34 (b),(d),(e) | 1,000,000 | 841,261 | ||||||||||
Series 2023-1A, Class D, 3 mo. TSFR + 5.5%, 10.38%, 04/20/35 (b),(d),(e) | 1,000,000 | 977,266 | ||||||||||
Barings CLO Ltd., | ||||||||||||
Series 2018-4A, Class D, 3 mo. USD LIBOR + 2.90%, 7.69%, 10/15/30 (b),(d),(e) | 1,000,000 | 897,306 | ||||||||||
Series 2019-2A, Class DR, 3 mo. USD LIBOR + 6.78%, 11.57%, 04/15/36 (b),(d),(e) | 500,000 | 441,292 | ||||||||||
Series 2019-4A, Class E, 3 mo. USD LIBOR + 7.39%, 12.18%, 01/15/33 (b),(d),(e) | 500,000 | 463,407 | ||||||||||
Series 2021-2A, Class E, 3 mo. USD LIBOR + 6.25%, 11.04%, 07/15/34 (b),(d),(e) | 1,000,000 | 884,779 | ||||||||||
Benefit Street Partners CLO IV Ltd., | 1,000,000 | 905,767 | ||||||||||
See Notes to Consolidated Financial Statements.
51
Table of Contents
Blackstone Alternative Multi-Strategy Fund and Subsidiaries
Consolidated Schedule of Investments ^ (Continued)
March 31, 2023
Security Description | Principal Amount | Value | ||||||||||
Benefit Street Partners CLO X Ltd., | ||||||||||||
Series 2016-10A, Class CRR, 3 mo. USD LIBOR + 3.50%, 8.31%, 04/20/34 (b),(d),(e) | $ | 2,000,000 | $ | 1,798,926 | ||||||||
Series 2016-10A, Class DRR, 3 mo. USD LIBOR + 6.75%, 11.56%, 04/20/34 (b),(d),(e) | 1,000,000 | 885,413 | ||||||||||
Benefit Street Partners CLO XX Ltd., Series 2020-20A, Class ER, 3 mo. USD LIBOR + 6.75%, 11.54%, 07/15/34 (b),(d),(e) | 1,000,000 | 877,031 | ||||||||||
Benefit Street Partners CLO XXI Ltd., Series 2020-21A, Class ER, 3 mo. USD LIBOR + 6.70%, 11.49%, 10/15/34 (b),(d),(e) | 1,000,000 | 898,937 | ||||||||||
Benefit Street Partners CLO XXIII Ltd., Series 2021-23A, Class D, 3 mo. USD LIBOR + 3.65%, 8.47%, 04/25/34 (b),(d),(e) | 1,500,000 | 1,364,754 | ||||||||||
BlueMountain CLO XXIX Ltd., Series 2020-29A, Class ER, 3 mo. USD LIBOR + 6.86%, 11.68%, 07/25/34 (b),(d),(e) | 1,000,000 | 882,303 | ||||||||||
BlueMountain CLO XXVIII Ltd., Series 2021-28A, Class E, 3 mo. USD LIBOR + 6.40%, 11.19%, 04/15/34 (b),(d),(e) | 250,000 | 218,433 | ||||||||||
BlueMountain CLO XXX Ltd., Series 2020-30A, Class AR, 3 mo. TSFR + 1.37%, 6.03%, 04/15/35 (b),(d),(e) | 7,250,000 | 7,063,022 | ||||||||||
BlueMountain CLO XXXII Ltd., Series 2021-32A, Class D, 3 mo. USD LIBOR + 3.40%, 8.19%, 10/15/34 (b),(d),(e) | 2,000,000 | 1,808,120 | ||||||||||
BPCRE 2022-FL2 Ltd., | ||||||||||||
Series 2022-FL2, Class AS, 1 mo. TSFR + 3.10%, 7.79%, 01/16/37 (b),(d),(e) | 1,000,000 | 989,056 | ||||||||||
Series 2022-FL2, Class B, 1 mo. TSFR + 3.8%, 8.49%, 01/16/37 (b),(d),(e) | 1,000,000 | 980,272 | ||||||||||
Broad River Bsl Funding CLO Ltd., Series 2020-1A, Class ER, 3 mo. USD LIBOR + 6.50%, 11.31%, 07/20/34 (b),(d),(e) | 2,000,000 | 1,698,984 | ||||||||||
BSPRT 2022-FL9 Issuer Ltd., Series 2022-FL9, Class C, 1 mo. TSFR + 3.92%, 8.74%, 07/15/39 (b),(d),(e) | 1,277,000 | 1,216,772 | ||||||||||
Capital Four US CLO III Ltd., Series 2022-2A, Class D1, 3 mo. TSFR + 5.8%, 10.43%, 01/21/35 (b),(d),(e) | 1,000,000 | 946,094 | ||||||||||
Carlyle US CLO Ltd., | ||||||||||||
Series 2019-2A, Class CR, 3 mo. USD LIBOR + 3.20%, 7.99%, 07/15/32 (b),(d),(e) | 1,500,000 | 1,379,257 | ||||||||||
See Notes to Consolidated Financial Statements.
52
Table of Contents
Blackstone Alternative Multi-Strategy Fund and Subsidiaries
Consolidated Schedule of Investments ^ (Continued)
March 31, 2023
Security Description | Principal Amount | Value | ||||||||
Series 2020-1A, Class DR, 3 mo. USD LIBOR + 6.25%, 11.06%, 07/20/34 (b),(d),(e) | $ | 1,000,000 | $ | 892,649 | ||||||
CarVal CLO I Ltd., Series 2018-1A, Class E, 3 mo. USD LIBOR + 5.77%, 10.56%, 07/16/31 (b),(d),(e) | 2,000,000 | 1,673,694 | ||||||||
CarVal CLO II Ltd., Series 2019-1A, Class ER, 3 mo. USD LIBOR + 6.57%, 11.38%, 04/20/32 (b),(d),(e) | 2,500,000 | 2,183,615 | ||||||||
CarVal CLO IV Ltd., Series 2021-1A, Class E, 3 mo. USD LIBOR + 6.60%, 11.41%, 07/20/34 (b),(d),(e) | 1,000,000 | 845,215 | ||||||||
Cedar Funding IV CLO Ltd., Series 2014-4A, Class ERR, 3 mo. USD LIBOR + 6.61%, 11.43%, 07/23/34 (b),(d),(e) | 1,500,000 | 1,294,087 | ||||||||
Cedar Funding VI CLO Ltd., |
| |||||||||
Series 2016-6A, Class DRR, 3 mo. USD LIBOR + 3.31%, 8.12%, 04/20/34 (b),(d),(e) | 1,000,000 | 899,057 | ||||||||
Series 2016-6A, Class ERR, 3 mo. USD LIBOR + 6.72%, 11.53%, 04/20/34 (b),(d),(e) | 1,250,000 | 1,096,250 | ||||||||
Cedar Funding XII CLO Ltd., Series 2020-12A, Class A1R, 3 mo. USD LIBOR + 1.13%, 5.95%, 10/25/34 (b),(d),(e) | 8,325,000 | 8,124,984 | ||||||||
CIFC Funding Ltd., Series 2019-3A, Class DR, 3 mo. USD LIBOR + 6.80%, 11.59%, 10/16/34 (b),(d),(e) | 1,000,000 | 894,696 | ||||||||
CoreVest American Finance Trust, | ||||||||||
Series 2017-2, Class M, 5.37%, 12/25/27 (b),(d),(e) | 1,000,000 | 929,857 | ||||||||
Series 2019-2, Class XA, 2.41%, 06/15/52 (b),(d),(e),(h) | 4,247,860 | �� | 309,325 | |||||||
Series 2019-3, Class XA, 2.05%, 10/15/52 (b),(d),(e),(h) | 8,832,506 | 296,348 | ||||||||
Series 2020-1, Class E, 4.68%, 03/15/50 (b),(d),(e) | 125,000 | 109,622 | ||||||||
Series 2020-4, Class XB, 2.79%, 12/15/52 (b),(d),(e),(h) | 1,000,000 | 112,782 | ||||||||
Series 2020-4, Class XA, 3.84%, 12/15/52 (b),(d),(e),(h) | 809,170 | 92,328 | ||||||||
Series 2021-1, Class XA, 2.94%, 04/15/53 (b),(d),(e),(h) | 797,619 | 56,141 | ||||||||
Series 2021-2, Class XA, 3.01%, 07/15/54 (b),(d),(e),(h) | 828,759 | 79,870 | ||||||||
See Notes to Consolidated Financial Statements.
53
Table of Contents
Blackstone Alternative Multi-Strategy Fund and Subsidiaries
Consolidated Schedule of Investments ^ (Continued)
March 31, 2023
Security Description | Principal Amount | Value | ||||||||
Dryden 95 CLO Ltd., Series 2021-95A, Class E, 3 mo. USD LIBOR + 6.15%, 11.05%, 08/20/34 (b),(d),(e) | $ | 1,000,000 | $ | 839,444 | ||||||
FBR Securitization Trust, Series 2005-5, Class M4, 1 mo. USD LIBOR + .98%, 5.82%, 11/25/35 (b),(d) | 512,000 | 301,978 | ||||||||
FFMLT Trust, Series 2005-FF11, Class M3, 1 mo. USD LIBOR + .93%, 5.78%, 11/25/35 (b),(d) | 289,165 | 240,990 | ||||||||
FirstKey Homes 2022-SFR1 Trust, Series 2022-SFR1, Class E1, 5.00%, 05/17/39 (b),(e) | 1,000,000 | 921,334 | ||||||||
Fort Washington CLO Ltd., Series 2021-2A, Class E, 3 mo. USD LIBOR + 6.61%, 11.42%, 10/20/34 (b),(d),(e) | 1,500,000 | 1,309,417 | ||||||||
FS Rialto Issuer LLC, | ||||||||||
Series 2022-FL4, Class C, 1 mo. SOFR + 3.25%, 7.81%, 01/19/39 (b),(d),(e) | 1,000,000 | 960,400 | ||||||||
Series 2022-FL5, Class B, 1 mo. TSFR + 3.37%, 8.06%, 06/19/37 (b),(d),(e) | 155,000 | 150,002 | ||||||||
Series 2022-FL5, Class C, 1 mo. TSFR + 3.92%, 8.61%, 06/19/37 (b),(d),(e) | 1,000,000 | 973,213 | ||||||||
Galaxy 30 CLO Ltd., Series 2022-30A, Class E, 3 mo. TSFR + 6.95%, 11.61%, 04/15/35 (b),(d),(e) | 1,000,000 | 875,008 | ||||||||
Galaxy 31 CLO Ltd., | ||||||||||
Series 2023-31A, Class D, 3 mo. TSFR + 5.25%, 10.03%, 04/15/36 (b),(d),(e) | 1,500,000 | 1,465,899 | ||||||||
Series 2023-31A, Class E, 3 mo. TSFR + 8.43%, 13.21%, 04/15/36 (b),(d),(e) | 2,000,000 | 1,924,476 | ||||||||
Galaxy XXII CLO Ltd., Series 2016-22A, Class ERR, 3 mo. USD LIBOR + 6.50%, 11.29%, 04/16/34 (b),(d),(e) | 500,000 | 431,644 | ||||||||
Galaxy XXVII CLO Ltd., Series 2018-27A, Class E, 3 mo. USD LIBOR + 5.78%, 10.65%, 05/16/31 (b),(d),(e) | 1,000,000 | 842,218 | ||||||||
Goldentree Loan Management US Clo 8 Ltd., Series 2020-8A, Class ER, 3 mo. USD LIBOR + 6.15%, 10.96%, 10/20/34 (b),(d),(e) | 1,000,000 | 863,895 | ||||||||
Greywolf CLO II Ltd., Series 2013-1A, Class C1RR, 3 mo. USD LIBOR + 3.35%, 8.14%, 04/15/34 (b),(d),(e) | 1,000,000 | 917,694 | ||||||||
GSAA Home Equity Trust, | ||||||||||
Series 2004-5, Class M2, 4.40%, 06/25/34 (b),(i) | 295,319 | 239,856 | ||||||||
Series 2006-8, Class 2A3B, 1 mo. USD LIBOR + .56%, 5.41%, 05/25/36 (b),(d) | 1,527,000 | 305,369 | ||||||||
See Notes to Consolidated Financial Statements.
54
Table of Contents
Blackstone Alternative Multi-Strategy Fund and Subsidiaries
Consolidated Schedule of Investments ^ (Continued)
March 31, 2023
Security Description | Principal Amount | Value | ||||||||
Gulf Stream Meridian 5 Ltd., Series 2021-5A, Class D, 3 mo. USD LIBOR + 6.33%, 11.12%, 07/15/34 (b),(d),(e) | $ | 1,500,000 | $ | 1,280,558 | ||||||
Halsey Point CLO I Ltd., Series 2019-1A, Class E, 3 mo. USD LIBOR + 7.70%, 12.51%, 01/20/33 (b),(d),(e) | 1,000,000 | 902,484 | ||||||||
HalseyPoint CLO 4 Ltd., Series 2021-4A, Class E, 3 mo. USD LIBOR + 6.71%, 11.52%, 04/20/34 (b),(d),(e) | 1,500,000 | 1,287,311 | ||||||||
Halseypoint Clo 5 Ltd., Series 2021-5A, Class E, 3 mo. USD LIBOR + 6.94%, 11.74%, 01/30/35 (b),(d),(e) | 1,000,000 | 855,277 | ||||||||
Jamestown CLO XIV Ltd., Series 2019-14A, Class DR, 3 mo. USD LIBOR + 7.20%, 12.01%, 10/20/34 (b),(d),(e) | 1,500,000 | 1,309,858 | ||||||||
Lehman XS Trust, Series 2007-9, Class 1A3, 1 mo. USD LIBOR + .60%, 5.45%, 06/25/37 (b),(d) | 734,580 | 633,928 | ||||||||
Long Beach Mortgage Loan Trust, | ||||||||||
Series 2006-10, Class 2A3, 1 mo. USD LIBOR + .32%, 5.17%, 11/25/36 (b),(d) | 2,980,978 | 988,480 | ||||||||
Series 2006-4, Class 2A4, 1 mo. USD LIBOR + .52%, 5.37%, 05/25/36 (b),(d) | 6,882,719 | 2,093,035 | ||||||||
Magnetite XXVIII Ltd., Series 2020-28A, Class AR, 3 mo. USD LIBOR + 1.13%, 5.94%, 01/20/35 (b),(d),(e) | 10,000,000 | 9,731,070 | ||||||||
Mastr Asset Backed Securities Trust, | ||||||||||
Series 2006-WMC3, Class A4, 1 mo. USD LIBOR + .32%, 5.17%, 08/25/36 (b),(d) | 474,295 | 171,976 | ||||||||
Series 2006-WMC4, Class A5, 1 mo. USD LIBOR + .15%, 5.00%, 10/25/36 (b),(d) | 509,830 | 170,326 | ||||||||
Merrill Lynch First Franklin Mortgage Loan Trust, Series 2007-H1, Class 2A2, 1 mo. USD LIBOR + 3.50%, 8.35%, 10/25/37 (b),(d) | 706,487 | 480,156 | ||||||||
Merrill Lynch Mortgage Investors Trust, | ||||||||||
Series 2006-RM5, Class A2B, 1 mo. USD LIBOR + .24%, 5.09%, 10/25/37 (b),(d) | 1,521,040 | 269,090 | ||||||||
Series 2006-RM5, Class A2C, 1 mo. USD LIBOR + .36%, 5.21%, 10/25/37 (b),(d) | 2,215,654 | 396,649 | ||||||||
MF1 LLC, | ||||||||||
Series 2022-FL9, Class B, 1 mo. TSFR + 3.15%, 7.91%, 06/19/37 (b),(d),(e) | 1,213,000 | 1,180,358 | ||||||||
Series 2022-FL9, Class C, 1 mo. TSFR + 3.7%, 8.46%, 06/19/37 (b),(d),(e) | 1,000,000 | 965,216 | ||||||||
MF1 Ltd., Series 2021-FL7, Class C, 1 mo. USD LIBOR + 2.05%, 6.81%, 10/16/36 (b),(d),(e) | 310,000 | 287,693 | ||||||||
See Notes to Consolidated Financial Statements.
55
Table of Contents
Blackstone Alternative Multi-Strategy Fund and Subsidiaries
Consolidated Schedule of Investments ^ (Continued)
March 31, 2023
Security Description | Principal Amount | Value | ||||||||
MidOcean Credit CLO XI Ltd., Series 2022-11A, Class E, 3 mo. TSFR + 9.11%, 13.17%, 10/18/33 (b),(d),(e) | $ | 1,817,500 | $ | 1,706,738 | ||||||
MidOcean Credit CLO XII Ltd., Series 2023-12A, Class E, 3 mo. TSFR + 8.66%, 0.00%, 04/18/34 (b),(d),(e),(f),(g) | 1,000,000 | 975,000 | ||||||||
Neuberger Berman Loan Advisers CLO 31 Ltd., Series 2019-31A, Class ER, 3 mo. USD LIBOR + 6.50%, 11.31%, 04/20/31 (b),(d),(e) | 1,000,000 | 878,989 | ||||||||
Neuberger Berman Loan Advisers CLO 38 Ltd., Series 2020-38A, Class ER, 3 mo. USD LIBOR + 6.25%, 11.06%, 10/20/35 (b),(d),(e) | 1,000,000 | 861,258 | ||||||||
New Mountain CLO 2 Ltd., Series CLO-2A, Class E, 3 mo. USD LIBOR + 6.36%, 11.15%, 04/15/34 (b),(d),(e) | 1,000,000 | 866,206 | ||||||||
New Residential Mortgage Loan Trust, Series 2022-SFR2, Class E1, 4.00%, 09/04/39 (b),(e) | 161,000 | 136,987 | ||||||||
OCP CLO Ltd., | ||||||||||
Series 2015-10A, Class DR2, 3 mo. USD LIBOR + 2.95%, 7.77%, 01/26/34 (b),(d),(e) | 1,000,000 | 900,142 | ||||||||
Series 2020-18A, Class ER, 3 mo. USD LIBOR + 6.43%, 11.24%, 07/20/32 (b),(d),(e) | 1,000,000 | 887,198 | ||||||||
Series 2021-22A, Class E, 3 mo. USD LIBOR + 6.60%, 11.41%, 12/02/34 (b),(d),(e) | 2,000,000 | 1,749,698 | ||||||||
Series 2022-25A, Class E1, 3 mo. TSFR + 6.15%, 9.63%, 07/20/35 (b),(d),(e) | 1,000,000 | 928,876 | ||||||||
Palmer Square CLO Ltd., Series 2022-3A, Class E, 3 mo. TSFR + 7.98%, 12.62%, 07/20/35 (b),(d),(e) | 1,000,000 | 930,125 | ||||||||
Parallel Ltd., | ||||||||||
Series 2019-1A, Class E, 3 mo. USD LIBOR + 6.72%, 11.53%, 07/20/32 (b),(d),(e) | 666,500 | 551,068 | ||||||||
Series 2021-2A, Class D, 3 mo. USD LIBOR + 7.20%, 12.01%, 10/20/34 (b),(d),(e) | 1,000,000 | 851,686 | ||||||||
Park Avenue Institutional Advisers CLO Ltd., Series 2022-1A, Class D, 3 mo. TSFR + 7.29%, 11.93%, 04/20/35 (b),(d),(e) | 1,000,000 | 849,001 | ||||||||
People's Choice Home Loan Securities Trust, Series 2005-2, Class M5, 1 mo. USD LIBOR + ..98%, 5.82%, 05/25/35 (b),(d) | 488,000 | 264,322 | ||||||||
See Notes to Consolidated Financial Statements.
56
Table of Contents
Blackstone Alternative Multi-Strategy Fund and Subsidiaries
Consolidated Schedule of Investments ^ (Continued)
March 31, 2023
Security Description | Principal Amount | Value | ||||||||
Pikes Peak CLO 6, Series 2020-6A, Class ER2, 3 mo. USD LIBOR + 6.43%, 11.35%, 05/18/34 (b),(d),(e) | $ | 1,000,000 | $ | 868,205 | ||||||
Point Securitization Trust 2021-1, Series 2021-1, Class A2, 5.56%, 02/25/52 (b),(d),(e),(h) | 1,000,000 | 904,574 | ||||||||
Post CLO 2021-1 Ltd., Series 2021-1A, Class E, 3 mo. USD LIBOR + 6.45%, 11.24%, 10/15/34 (b),(d),(e) | 1,000,000 | 888,429 | ||||||||
PPM CLO 2 Ltd., Series 2019-2A, Class E, 3 mo. USD LIBOR + 6.55%, 11.34%, 04/16/32 (b),(d),(e) | 1,750,000 | 1,508,785 | ||||||||
PPM CLO 3 Ltd., Series 2019-3A, Class ER, 3 mo. USD LIBOR + 6.61%, 11.40%, 04/17/34 (b),(d),(e) | 500,000 | 402,651 | ||||||||
PRET 2021-NPL3 LLC, Series 2021-NPL3, Class A2, 3.72%, 07/25/51 (b),(e),(i) | 101,000 | 82,715 | ||||||||
Progress Residential Trust, | ||||||||||
Series 2021-SFR11, Class F, | 100,000 | 83,247 | ||||||||
Series 2021-SFR8, Class E1, | 100,000 | 85,755 | ||||||||
Series 2021-SFR9, Class F, | 100,000 | 84,454 | ||||||||
Series 2022-SFR1, Class G, | 100,000 | 83,792 | ||||||||
Series 2022-SFR2, Class E1, | 100,000 | 91,370 | ||||||||
Series 2022-SFR3, Class E1, | 1,000,000 | 926,259 | ||||||||
Series 2022-SFR3, Class E2, | 1,000,000 | 925,071 | ||||||||
Series 2022-SFR4, Class E1, | 100,000 | 93,007 | ||||||||
Rad CLO 2 Ltd., Series 2018-2A, Class ER, 3 mo. USD LIBOR + 6.00%, 10.79%, 10/15/31 (b),(d),(e) | 416,667 | 368,255 | ||||||||
Rad CLO 3 Ltd., Series 2019-3A, Class ER, 3 mo. USD LIBOR + 6.50%, 11.29%, 04/15/32 (b),(d),(e) | 1,000,000 | 859,566 | ||||||||
Rad CLO Ltd., Series 2023-18A, Class E, 3 mo. TSFR + 8.48%, 13.20%, 04/15/36 (b),(d),(e) | 1,000,000 | 946,671 | ||||||||
RAMP Trust, Series 2005-RS4, Class M7, 1 mo. USD LIBOR + 1.28%, 6.77%, 04/25/35 (b),(d) | 2,253,000 | 1,659,686 | ||||||||
See Notes to Consolidated Financial Statements.
57
Table of Contents
Blackstone Alternative Multi-Strategy Fund and Subsidiaries
Consolidated Schedule of Investments ^ (Continued)
March 31, 2023
Security Description | Principal Amount | Value | ||||||||
RASC Trust, | ||||||||||
Series 2006-KS1, Class M4, 1 mo. USD LIBOR + .53%, 5.64%, 02/25/36 (b),(d) | $ | 321,574 | $ | 234,938 | ||||||
Series 2006-KS8, Class M1, 1 mo. USD LIBOR + .29%, 5.14%, 10/25/36 (b),(d) | 283,303 | 234,234 | ||||||||
Ready Capital Mortgage Financing LLC, | ||||||||||
Series 2021-FL7, Class D, 1 mo. USD LIBOR + 2.95%, 7.80%, 11/25/36 (b),(d),(e) | 100,000 | 89,113 | ||||||||
Series 2022-FL9, Class B, 1 mo. TSFR + 3.61%, 8.40%, 06/25/37 (b),(d),(e) | 290,000 | 280,130 | ||||||||
Rockford Tower CLO Ltd., Series 2020-1A, Class E, 3 mo. USD LIBOR + 6.90%, 11.71%, 01/20/32 (b),(d),(e) | 1,500,000 | 1,317,541 | ||||||||
Romark CLO II Ltd., Series 2018-2A, Class D, 3 mo. USD LIBOR + 6.25%, 11.07%, 07/25/31 (b),(d),(e) | 2,250,000 | 1,870,400 | ||||||||
Romark CLO IV Ltd., Series 2021-4A, Class D, 3 mo. USD LIBOR + 6.95%, 11.76%, 07/10/34 (b),(d),(e) | 500,000 | 422,054 | ||||||||
RR 2 Ltd., Series 2017-2A, Class DR, 3 mo. USD LIBOR + 5.80%, 10.59%, 04/15/36 (b),(d),(e) | 1,000,000 | 838,380 | ||||||||
RR15 Ltd., Series 2021-15A, Class C, 3 mo. USD LIBOR + 2.90%, 7.69%, 04/15/36 (b),(d),(e) | 1,000,000 | 893,092 | ||||||||
Shackleton CLO Ltd., Series 2019-14A, Class ER, 3 mo. USD LIBOR + 7.32%, 12.13%, 07/20/34 (b),(d),(e) | 500,000 | 427,310 | ||||||||
Signal Peak CLO 7 Ltd., Series 2019-1A, Class D, 3 mo. USD LIBOR + 3.85%, 8.65%, 04/30/32 (b),(d),(e) | 1,500,000 | 1,383,802 | ||||||||
Sound Point CLO XXIII, Series 2019-2A, Class ER, 3 mo. USD LIBOR + 6.47%, 11.26%, 07/15/34 (b),(d),(e) | 2,400,000 | 1,887,413 | ||||||||
STAR Trust, | ||||||||||
Series 2022-SFR3, Class E1, 1 mo. TSFR + 3.20%, 7.89%, 05/17/24 (b),(d),(e) | 1,000,000 | 989,094 | ||||||||
Series 2022-SFR3, Class E2, 1 mo. TSFR + 3.70%, 8.39%, 05/17/24 (b),(d),(e) | 1,000,000 | 978,112 | ||||||||
Symphony CLO XXIII Ltd., Series 2020-23A, Class DR, 3 mo. USD LIBOR + 3.15%, 7.94%, 01/15/34 (b),(d),(e) | 1,000,000 | 942,676 | ||||||||
TCI-Flatiron CLO Ltd., Series 2017-1A, Class E, 3 mo. USD LIBOR + 6.35%, 11.23%, 11/18/30 (b),(d),(e) | 750,000 | 676,922 | ||||||||
See Notes to Consolidated Financial Statements.
58
Table of Contents
Blackstone Alternative Multi-Strategy Fund and Subsidiaries
Consolidated Schedule of Investments ^ (Continued)
March 31, 2023
Security Description | Principal Amount | Value | ||||||||||
Trinitas CLO IV Ltd., Series 2021-4A, Class E, 3 mo. USD LIBOR + 6.25%, 11.07%, 07/21/34 (b),(d),(e) | $ | 1,000,000 | $ | 874,222 | ||||||||
Trinitas CLO V Ltd., Series 2021-5A, Class E, 3 mo. USD LIBOR + 6.35%, 11.16%, 10/20/34 (b),(d),(e) | 1,500,000 | 1,307,452 | ||||||||||
Trinitas CLO VI Ltd., Series 2017-6A, Class ER, 3 mo. USD LIBOR + 6.82%, 11.63%, 01/25/34 (b),(d),(e) | 1,000,000 | 839,712 | ||||||||||
TRTX Issuer Ltd., Series 2022-FL5, Class AS, 1 mo. SOFR + 2.15%, 6.71%, 02/15/39 (b),(d),(e) | 1,000,000 | 959,002 | ||||||||||
Vericrest Opportunity Loan Transferee, Series 2021-NP11, Class A2, 4.21%, 08/25/51 (b),(e),(i) | 100,000 | 83,552 | ||||||||||
Vibrant CLO XII Ltd., Series 2021-12A, Class C, 3 mo. USD LIBOR + 3.65%, 8.46%, 01/20/34 (b),(d),(e) | 1,000,000 | 879,808 | ||||||||||
Vibrant CLO XIII Ltd., Series 2021-13A, Class D, 3 mo. USD LIBOR + 7.06%, 11.85%, 07/15/34 (b),(d),(e) | 1,500,000 | 1,288,568 | ||||||||||
VOLT CIII LLC, Series 2021-CF1, Class A2, 3.97%, 08/25/51 (b),(e),(i) | 124,000 | 102,546 | ||||||||||
Voya CLO Ltd., | ||||||||||||
Series 2018-3A, Class E, 3 mo. USD LIBOR + 5.75%, 10.54%, 10/15/31 (b),(d),(e) | 1,500,000 | 1,212,200 | ||||||||||
Series 2020-3A, Class DR, 3 mo. USD LIBOR + 3.25%, 8.06%, 10/20/34 (b),(d),(e) | 1,100,000 | 997,580 | ||||||||||
Series 2021-1A, Class E, 3 mo. USD LIBOR + 6.35%, 11.14%, 07/15/34 (b),(d),(e) | 1,000,000 | 868,482 | ||||||||||
Wells Fargo Home Equity Asset-Backed Securities Trust, Series 2006-1, Class M6, 1 mo. USD LIBOR + .68%, 5.52%, 05/25/36 (b),(d) | 2,974,216 | 2,615,998 | ||||||||||
|
| |||||||||||
Total North America |
| 150,003,008 | ||||||||||
|
| |||||||||||
TOTAL ASSET-BACKED SECURITIES |
| 150,003,008 | ||||||||||
|
| |||||||||||
CONVERTIBLE BONDS — 0.1% | ||||||||||||
North America — 0.1% | ||||||||||||
Financial Services — 0.1% |
| |||||||||||
RWT Holdings, Inc., 5.75%, 10/01/25 (b) | 3,418,000 | 3,067,581 | ||||||||||
|
| |||||||||||
Total North America |
| 3,067,581 | ||||||||||
|
| |||||||||||
TOTAL CONVERTIBLE BONDS |
| 3,067,581 | ||||||||||
|
| |||||||||||
See Notes to Consolidated Financial Statements.
59
Table of Contents
Blackstone Alternative Multi-Strategy Fund and Subsidiaries
Consolidated Schedule of Investments ^ (Continued)
March 31, 2023
Security Description | Principal Amount | Value | ||||||||||
BANK DEBT — 3.7% |
| |||||||||||
Europe — 0.3% |
| |||||||||||
Pharmaceuticals — 0.2% |
| |||||||||||
Mallinckrodt International Finance SA, | ||||||||||||
2022 USD Exit Term Loan, 10.24%, 09/30/27 (b),(d) | $ | 1,744,005 | $ | 1,251,637 | ||||||||
2022 USD Term Loan, 9.99%, 09/30/27 (b),(d) | 12,612,744 | 9,065,410 | ||||||||||
|
| |||||||||||
| 10,317,047 | ||||||||||||
|
| |||||||||||
Travel & Lodging — 0.1% | ||||||||||||
TCG AcquisitionCo BV, 2023 EUR Term Loan B, 5.00%, 09/14/28 (b),(d),(j) | 3,646,478 | EUR | 3,824,419 | |||||||||
|
| |||||||||||
Total Europe |
| 14,141,466 | ||||||||||
|
| |||||||||||
North America — 2.9% |
| |||||||||||
Apparel & Textile Products — 0.0% |
| |||||||||||
Mad Engine Global LLC Term Loan, 11.730%, 07/15/27 (b),(d) | $ | 1,533,463 | 1,122,495 | |||||||||
|
| |||||||||||
Consumer Discretionary Services — 0.4% | ||||||||||||
HB Acquisitions LLC 2022 Term Loan, 10.307%, 02/15/25 (b),(c),(d) | 21,079,817 | AUD | 13,808,990 | |||||||||
Journey Beyond Term Loan, 9.065%, 02/15/25 (b),(c),(d) | 5,791,944 | AUD | 3,871,625 | |||||||||
|
| |||||||||||
| 17,680,615 | ||||||||||||
|
| |||||||||||
Entertainment Resources — 0.2% | ||||||||||||
Alterra Mountain Co., 2021 Series B-2 Consenting Term Loan, 1 mo. LIBOR + 3.50%, 8.13%, 08/17/28 (b),(d) | 0 | 0 | ||||||||||
Equinox Holdings, Inc., | ||||||||||||
2017 1st Lien Term Loan, 7.73%, 03/08/24 (b),(d) | 10,538,561 | 9,521,590 | ||||||||||
2017 2nd Lien Term Loan, 11.73%, 09/06/24 (b),(d) | 989,485 | 696,350 | ||||||||||
|
| |||||||||||
| 10,217,940 | ||||||||||||
|
| |||||||||||
Entertainment Resources — 0.1% | ||||||||||||
Bulldog Purchaser, Inc., 2018 Term Loan, SOFR CME + 3.75%, 8.47%, 09/05/25 (b),(d) | 4,295,711 | 3,829,326 | ||||||||||
|
| |||||||||||
See Notes to Consolidated Financial Statements.
60
Table of Contents
Blackstone Alternative Multi-Strategy Fund and Subsidiaries
Consolidated Schedule of Investments ^ (Continued)
March 31, 2023
Security Description | Principal Amount | Value | ||||||||
Exploration & Production — 0.1% | ||||||||||
Par Petroleum LLC 2023 Term Loan B, 4.250%, 02/28/30 (b),(d),(j) | $ | 5,186,602 | $ | 5,082,870 | ||||||
|
| |||||||||
Financial Services — 0.0% | ||||||||||
Indy US Bidco LLC, 2023 6th Amendment Incremental Term Loan, 6.25%, 03/06/28 (b),(d),(j) | 558,941 | 484,183 | ||||||||
|
| |||||||||
Food & Beverage — 0.0% | ||||||||||
8th Avenue Food & Provisions, Inc. 2018 1st Lien Term Loan, 8.385%, 10/01/25 (b),(d) | 2,332,748 | 2,046,614 | ||||||||
|
| |||||||||
Hardware — 0.0% | ||||||||||
Atlas CC Acquisition Corp., | ||||||||||
Term Loan B, 9.40%, 05/25/28 (b),(d) | 906,978 | 776,763 | ||||||||
Term Loan C, 9.40%, 05/25/28 (b),(d) | 184,481 | 157,995 | ||||||||
|
| |||||||||
| 934,758 | ||||||||||
|
| |||||||||
Health Care Facilities & Services — 0.0% | ||||||||||
Covetrus, Inc. Term Loan, 9.580%, 10/13/29 (b),(c),(d) | 1,354,776 | 1,275,183 | ||||||||
|
| |||||||||
Health Care Facilities & Services — 0.2% | ||||||||||
MED ParentCo LP 1st Lien Term Loan, 8.885%, 08/31/26 (b),(d) | 705,279 | 616,591 | ||||||||
Team Health Holdings, Inc., | ||||||||||
1st Lien Term Loan, 7.38%, 02/06/24 (b),(d) | 2,629,009 | 2,232,475 | ||||||||
2022 Term Loan B, 9.87%, 03/02/27 (b),(d) | 3,135,214 | 2,139,784 | ||||||||
U.S. Renal Care, Inc. 2019 Term Loan B, 9.688%, 06/26/26 (b),(d) | 2,481,628 | 1,668,894 | ||||||||
|
| |||||||||
| 6,657,744 | ||||||||||
|
| |||||||||
Home Improvement — 0.1% | ||||||||||
Stitch Aquisition Corp. Term Loan B, 11.480%, 07/28/28 (b),(d) | 1,546,471 | 1,206,248 | ||||||||
Weber-Stephen Products LLC, | ||||||||||
2022 Incremental Term Loan B, 4.25%, 10/30/27 (b),(d),(j) | 875,633 | 751,582 | ||||||||
Term Loan B, 7.88%, 10/30/27 (b),(d) | 709,270 | 607,553 | ||||||||
|
| |||||||||
| 2,565,383 | ||||||||||
|
| |||||||||
Industrial Other — 0.3% |
| |||||||||
Brand Energy & Infrastructure Services, Inc. 2017 Term Loan, 9.062%, 06/21/24 (b),(d) | 7,418,211 | 6,900,494 | ||||||||
See Notes to Consolidated Financial Statements.
61
Table of Contents
Blackstone Alternative Multi-Strategy Fund and Subsidiaries
Consolidated Schedule of Investments ^ (Continued)
March 31, 2023
Security Description | Principal Amount | Value | ||||||||
PECF USS Intermediate Holding III Corp. Term Loan B, 8.885%, 12/15/28 (b),(d) | $ | 1,214,966 | $ | 1,018,603 | ||||||
QualTek USA LLC 2018 1st Lien Term Loan, 11.080%, 07/18/25 (b),(d) | 7,680,216 | 4,531,328 | ||||||||
|
| |||||||||
| 12,450,425 | ||||||||||
|
| |||||||||
Industrial Products — 0.0% |
| |||||||||
Magenta Buyer LLC 2022 Incremental Term Loan, 12.000%, 07/27/28 (b),(c),(d) | 473,431 | 418,986 | ||||||||
|
| |||||||||
Industrial Services — 0.1% |
| |||||||||
TKC Holdings, Inc. 2022 PIK Toggle Holdco Term Loan, 12.717%, 02/15/27 (b),(c),(d) | 3,831,149 | 2,202,910 | ||||||||
|
| |||||||||
Machinery Manufacturing — 0.4% |
| |||||||||
Arcline FM Holdings LLC 2021 2nd Lien Term Loan, 12.980%, 06/23/29 (b),(c),(d) | 4,416,711 | 3,975,040 | ||||||||
Engineered Machinery Holdings, Inc., | ||||||||||
2021 USD 2nd Lien Incremental Term Loan, 11.23%, 05/21/29 (b),(c),(d) | 1,122,433 | 1,027,025 | ||||||||
2021 USD 2nd Lien Term Loan, 10.73%, 05/21/29 (b),(c),(d) | 11,545,028 | 10,621,426 | ||||||||
Titan Acquisition Ltd. 2018 Term Loan B, 3.000%, 03/28/25 (b),(d),(j) | 320,974 | 303,456 | ||||||||
|
| |||||||||
| 15,926,947 | ||||||||||
|
| |||||||||
Manufactured Goods — 0.0% |
| |||||||||
Werner FinCo LP 2017 Term Loan, 8.730%, 07/24/24 (b),(d) | 510,368 | 475,602 | ||||||||
|
| |||||||||
Property & Casualty Insurance — 0.1% | ||||||||||
Asurion LLC, | ||||||||||
2020 Term Loan B8, 7.88%, 12/23/26 (b),(d) | 1,992,374 | 1,843,663 | ||||||||
2021 2nd Lien Term Loan B3, 9.88%, 01/31/28 (b),(d) | 172,993 | 143,411 | ||||||||
2021 Second Lien Term Loan B4, 9.88%, 01/20/29 (b),(d) | 1,795,888 | 1,476,220 | ||||||||
2023 Term Loan B11, 8.91%, 08/19/28 (b),(d) | 961,388 | 888,987 | ||||||||
|
| |||||||||
| 4,352,281 | ||||||||||
|
| |||||||||
Publishing & Broadcasting — 0.2% | ||||||||||
A-L Parent LLC 2016 1st Lien Term Loan, 7.890%, 12/01/23 (b),(d) | 11,738,354 | 8,194,897 | ||||||||
|
| |||||||||
See Notes to Consolidated Financial Statements.
62
Table of Contents
Blackstone Alternative Multi-Strategy Fund and Subsidiaries
Consolidated Schedule of Investments ^ (Continued)
March 31, 2023
Security Description | Principal Amount | Value | ||||||||
Refining & Marketing — 0.1% | ||||||||||
Gulf Finance LLC, | ||||||||||
2021 Term Loan, SOFR CME + 6.75%, 11.43%, 08/25/26 (d) | $ | 2,710,833 | $ | 2,625,117 | ||||||
2021 Term Loan, SOFR CME + 6.75%, 11.43%, 08/25/26 (b),(d) | 2,695,902 | 2,610,657 | ||||||||
|
| |||||||||
| 5,235,774 | ||||||||||
|
| |||||||||
Retail—Consumer Discretionary — 0.0% | ||||||||||
Michaels Companies, Inc. 2021 Term Loan B, 8.980%, 04/15/28 (b),(d) | 747,052 | 683,979 | ||||||||
|
| |||||||||
Software & Services — 0.2% | ||||||||||
Cloud Software Group, Inc. 2022 USD Term Loan A, 4.500%, 09/29/28 (b),(d),(j) | 2,601,406 | 2,340,798 | ||||||||
Constant Contact, Inc., | ||||||||||
Second Lien Term Loan, 12.31%, 02/12/29 (b),(d) | 3,619,479 | 2,907,636 | ||||||||
Term Loan, 4.00%, 02/10/28 (b),(d),(j) | 114,971 | 108,456 | ||||||||
CoreLogic, Inc. Term Loan, 8.188%, 06/02/28 (b),(d) | 295,138 | 250,973 | ||||||||
DMT Solutions Global Corp. 2020 Incremental Term Loan, 10.726%, 07/02/24 (b),(c),(d) | 1,543,111 | 1,450,523 | ||||||||
Indy US Bidco LLC, 2023 USD Incremental Fifth Amendment Term Loan, 6.25%, 03/06/28 (b),(d),(j) | 270,915 | 234,680 | ||||||||
|
| |||||||||
| 7,293,066 | ||||||||||
|
| |||||||||
Software & Technology Services — 0.2% | ||||||||||
Puccini Bidco BV, GBP Term Loan B, 0.00%, 05/31/29 (b),(j) | 2,122,116 | GBP | 2,259,537 | |||||||
Qualtek Buyer LLC, | ||||||||||
2023 Revolver, 12.00%, 03/01/28 (b),(c),(d),(j) | $ | 2,908,923 | 2,908,923 | |||||||
Amendment No. 3 Term Loan, 6.25%, 07/18/25 (b),(c),(j) | 5,326,251 | 4,527,314 | ||||||||
|
| |||||||||
| 9,695,774 | ||||||||||
|
| |||||||||
Travel & Lodging — 0.1% | ||||||||||
Hornblower Sub LLC, | ||||||||||
2020 Repriced Term Loan B, 8.92%, 04/27/25 (b),(d) | 10,457,395 | 6,065,289 | ||||||||
2020 Super Priority Term Loan, 12.99%, 11/10/25 (b),(c),(d) | 108,047 | 107,237 | ||||||||
|
| |||||||||
| 6,172,526 | ||||||||||
|
| |||||||||
See Notes to Consolidated Financial Statements.
63
Table of Contents
Blackstone Alternative Multi-Strategy Fund and Subsidiaries
Consolidated Schedule of Investments ^ (Continued)
March 31, 2023
Security Description | Principal Amount | Value | ||||||||||
Utilities — 0.0% | ||||||||||||
Brazos Electric Power Cooperative, Inc., Revolver, 3 mo. LIBOR + 1.00%, 3.91%, 09/28/23 (b),(c),(d) | $ | 675,477 | $ | 452,569 | ||||||||
|
| |||||||||||
Waste & Environmental Services & Equipment — 0.1% |
| |||||||||||
Gopher Resource LLC 1st Lien Term Loan, 7.885%, 03/06/25 (b),(d) | 2,824,145 | 2,128,699 | ||||||||||
|
| |||||||||||
Total North America |
| 127,581,546 | ||||||||||
|
| |||||||||||
South America — 0.5% |
| |||||||||||
Consumer Discretionary Services — 0.3% |
| |||||||||||
Infinity Bidco US LLC, | ||||||||||||
2021 Incremental Fixed Term Loan, 9.50%, 04/01/28 (b),(c) | 2,485,904 | 2,473,475 | ||||||||||
Fixed Term Loan, 9.50%, 12/23/22 (b),(c) | 5,801,119 | 5,772,113 | ||||||||||
McLaren Racing Ltd., GBP Term Loan, 0.00%, 12/31/35 (b),(c) | 2,150,814 | GBP | 2,743,082 | |||||||||
|
| |||||||||||
| 10,988,670 | ||||||||||||
|
| |||||||||||
Health Care — 0.0% | ||||||||||||
New Millennium HoldCo, Inc. 2020 Term Loan, 5.500%, 05/01/25 (b),(c),(d),(j) | $ | 1,994,869 | 1,984,894 | |||||||||
|
| |||||||||||
Health Care Facilities & Services — 0.1% |
| |||||||||||
Gordian Medical, Inc. Term Loan B, 10.980%, 01/31/27 (b),(d) | 5,764,925 | 4,338,106 | ||||||||||
|
| |||||||||||
Materials — 0.0% | ||||||||||||
Samarco Mineracao SA, | ||||||||||||
Fixed Rate Term Loan 2, 2.17%, 08/31/22 (b) | 730,380 | 228,244 | ||||||||||
Term Loan, 1.67%, 12/31/22 (b) | 719,110 | 224,722 | ||||||||||
|
| |||||||||||
| 452,966 | ||||||||||||
|
| |||||||||||
Media — 0.0% | ||||||||||||
McLaren Racing Ltd., Exit Term Loan, 3 mo. LIBOR + 7.50%, 12.30%, 10/15/24 (b),(c),(d) | 328,120 | 96,795 | ||||||||||
|
| |||||||||||
Mining — 0.1% | ||||||||||||
Samarco Mineracao SA, Fixed Rate Term Loan, 1.67%, 08/30/24 (b) | 11,623,127 | 3,632,227 | ||||||||||
|
| |||||||||||
See Notes to Consolidated Financial Statements.
64
Table of Contents
Blackstone Alternative Multi-Strategy Fund and Subsidiaries
Consolidated Schedule of Investments ^ (Continued)
March 31, 2023
Security Description | Principal Amount | Value | ||||||||||
Travel & Lodging — 0.0% | ||||||||||||
Hornblower Sub LLC 2021 Incremental Term Loan, 12.997%, 11/10/25 (b),(c),(d) | $ | 450,371 | $ | 446,994 | ||||||||
|
| |||||||||||
Total South America |
| 21,940,652 | ||||||||||
|
| |||||||||||
TOTAL BANK DEBT |
| 163,663,664 | ||||||||||
|
| |||||||||||
CORPORATE BONDS & NOTES — 10.2% |
| |||||||||||
Africa — 0.3% |
| |||||||||||
Chemicals — 0.2% |
| |||||||||||
Sasol Financing USA LLC, | ||||||||||||
4.38%, 09/18/26 (b) | 3,856,000 | 3,485,283 | ||||||||||
5.88%, 03/27/24 (b) | 6,960,000 | 6,876,480 | ||||||||||
|
| |||||||||||
| 10,361,763 | ||||||||||||
|
| |||||||||||
Railroad — 0.1% | ||||||||||||
Transnet SOC Ltd., 8.25%, 02/06/28 (b),(k) | 4,420,000 | 4,397,546 | ||||||||||
|
| |||||||||||
Total Africa | 14,759,309 | |||||||||||
|
| |||||||||||
Asia — 1.8% |
| |||||||||||
Chemicals — 0.2% |
| |||||||||||
GC Treasury Center Co., Ltd., | ||||||||||||
MTN, 4.40%, 03/30/32 (b),(k) | 4,145,000 | 3,710,154 | ||||||||||
MTN, 5.20%, 03/30/52 (b),(k) | 3,614,000 | 2,985,460 | ||||||||||
|
| |||||||||||
| 6,695,614 | ||||||||||||
|
| |||||||||||
Financial Services — 0.5% |
| |||||||||||
Gaci First Investment Co., | ||||||||||||
5.13%, 02/14/53 (b),(k),(l) | 7,645,000 | 6,976,062 | ||||||||||
5.38%, 10/13/22 (k) | 8,459,000 | 7,884,465 | ||||||||||
Huarong Finance 2017 Co., Ltd., | ||||||||||||
MTN, 4.25%, 11/07/27 (b),(k) | 2,446,000 | 1,883,420 | ||||||||||
MTN, 4.95%, 11/07/47 (b),(k) | 280,000 | 168,015 | ||||||||||
Huarong Finance 2019 Co., Ltd., | ||||||||||||
5 year CMT + 6.98%, 4.25%, 09/30/25 (b),(d),(k),(m) | 207,000 | 169,646 | ||||||||||
MTN, 3.38%, 02/24/30 (b),(k) | 776,000 | 525,740 | ||||||||||
MTN, 3.63%, 09/30/30 (b),(k) | 825,000 | 556,875 | ||||||||||
MTN, 3.88%, 11/13/29 (b),(k) | 200,000 | 138,169 | ||||||||||
MTN, 4.50%, 05/29/29 (b),(k) | 1,551,000 | 1,118,659 | ||||||||||
Huarong Finance II Co., Ltd., | ||||||||||||
MTN, 4.63%, 06/03/26 (b),(k) | 1,291,000 | 1,077,985 | ||||||||||
MTN, 4.88%, 11/22/26 (b),(k) | 1,762,000 | 1,454,952 | ||||||||||
See Notes to Consolidated Financial Statements.
65
Table of Contents
Blackstone Alternative Multi-Strategy Fund and Subsidiaries
Consolidated Schedule of Investments ^ (Continued)
March 31, 2023
Security Description | Principal Amount | Value | ||||||||
MTN, 5.00%, 11/19/25 (b),(k) | $ | 1,575,000 | $ | 1,360,604 | ||||||
|
| |||||||||
| 23,314,592 | ||||||||||
|
| |||||||||
Internet Media — 0.5% | ||||||||||
Prosus NV, | ||||||||||
2.09%, 01/19/30 (b),(k) | 1,913,000 | EUR | 1,624,640 | |||||||
3.26%, 01/19/27 (b),(k) | $ | 3,158,000 | 2,867,389 | |||||||
3.68%, 01/21/30 (b),(k) | 1,179,000 | 1,001,104 | ||||||||
3.83%, 02/08/51 (k) | 12,791,000 | 8,200,203 | ||||||||
4.19%, 01/19/32 (b),(k) | 1,151,000 | 977,846 | ||||||||
MTN, 3.06%, 07/13/31 (b),(k) | 1,867,000 | 1,470,401 | ||||||||
MTN, 4.03%, 08/03/50 (b),(k) | 2,834,000 | 1,860,669 | ||||||||
Tencent Holdings Ltd., MTN, 3.84%, 04/22/51 (b),(k) | 2,981,000 | 2,162,333 | ||||||||
|
| |||||||||
| 20,164,585 | ||||||||||
|
| |||||||||
Metals & Mining — 0.4% | ||||||||||
Freeport Indonesia PT, | ||||||||||
6.20%, 04/14/52 (b),(k) | 3,865,000 | 3,536,436 | ||||||||
MTN, 4.76%, 04/14/27 (b),(k) | 2,926,000 | 2,846,744 | ||||||||
MTN, 5.32%, 04/14/32 (b),(k) | 9,997,000 | 9,308,117 | ||||||||
Indonesia Asahan Aluminium Persero PT, | ||||||||||
4.75%, 05/15/25 (b),(k) | 986,000 | 971,169 | ||||||||
6.76%, 11/15/48 (k) | 3,012,000 | 2,963,028 | ||||||||
|
| |||||||||
| 19,625,494 | ||||||||||
|
| |||||||||
Real Estate — 0.0% | ||||||||||
China Evergrande Group, | ||||||||||
8.75%, 06/28/25 (b),(k) | 853,000 | 65,041 | ||||||||
9.50%, 04/11/22 (b),(k),(n) | 1,800,000 | 136,646 | ||||||||
10.00%, 04/11/23 (b),(k) | 400,000 | 30,122 | ||||||||
Scenery Journey Ltd., | ||||||||||
11.50%, 10/24/22 (b),(k) | 3,901,000 | 338,803 | ||||||||
12.00%, 10/24/23 (b),(k) | 400,000 | 33,939 | ||||||||
13.00%, 11/06/22 (b),(k) | 800,000 | 69,474 | ||||||||
|
| |||||||||
| 674,025 | ||||||||||
|
| |||||||||
Refining & Marketing — 0.1% | ||||||||||
Thaioil Treasury Center Co., Ltd., | ||||||||||
MTN, 3.50%, 10/17/49 (b),(k) | 1,650,000 | 1,007,329 | ||||||||
MTN, 5.38%, 11/20/48 (b),(k) | 1,970,000 | 1,619,019 | ||||||||
|
| |||||||||
| 2,626,348 | ||||||||||
|
| |||||||||
See Notes to Consolidated Financial Statements.
66
Table of Contents
Blackstone Alternative Multi-Strategy Fund and Subsidiaries
Consolidated Schedule of Investments ^ (Continued)
March 31, 2023
Security Description | Principal Amount | Value | ||||||||||
Transportation & Logistics — 0.0% | ||||||||||||
Adani Ports & Special Economic Zone Ltd., 3.10%, 02/02/31 (b),(k) | $ | 1,752,000 | $ | 1,127,672 | ||||||||
|
| |||||||||||
Utilities — 0.1% | ||||||||||||
Perusahaan Perseroan Persero PT Perusahaan Listrik Negara, 3.88%, 07/17/29 (b),(k) | 728,000 | 659,209 | ||||||||||
PT Perusahaan Perseroan Persero Perusahaan Listrik Negara, | ||||||||||||
6.25%, 01/25/49 (b),(k) | 512,000 | 496,464 | ||||||||||
MTN, 4.00%, 06/30/50 (k) | 1,113,000 | 793,787 | ||||||||||
MTN, 4.38%, 02/05/50 (k) | 1,000,000 | 754,104 | ||||||||||
MTN, 5.25%, 05/15/47 (b),(k) | 3,345,000 | 2,884,448 | ||||||||||
|
| |||||||||||
| 5,588,012 | ||||||||||||
|
| |||||||||||
Total Asia | 79,816,342 | |||||||||||
|
| |||||||||||
Europe — 1.1% | ||||||||||||
Automobiles Manufacturing — 0.2% | ||||||||||||
Aston Martin Capital Holdings Ltd., 10.50%, 11/30/25 (b),(e) | 7,248,000 | 7,134,697 | ||||||||||
Mclaren Finance PLC, 7.50%, 08/01/26 (b),(e) | 2,523,000 | 2,075,168 | ||||||||||
|
| |||||||||||
| 9,209,865 | ||||||||||||
|
| |||||||||||
Banks — 0.1% | ||||||||||||
Credit Suisse AG, | ||||||||||||
0.50%, 02/02/24 (b) | 1,430,000 | 1,348,204 | ||||||||||
2.95%, 04/09/25 (b) | 452,000 | 419,474 | ||||||||||
1 mo. SOFR + 3.90%, 5.07%, 02/02/24 (b),(d) | 311,000 | 301,792 | ||||||||||
MTN, 3.63%, 09/09/24 (b) | 1,013,000 | 963,890 | ||||||||||
|
| |||||||||||
| 3,033,360 | ||||||||||||
|
| |||||||||||
Entertainment Resources — 0.0% | ||||||||||||
CPUK Finance Ltd., 6.50%, 08/28/26 (b),(k) | 1,147,000 | GBP | 1,337,117 | |||||||||
|
| |||||||||||
Food & Beverage — 0.1% | ||||||||||||
Forno d'Asolo SpA, 3 mo. EURIBOR + 5.50%, 8.52%, 04/30/27 (b),(d),(e) | 3,404,000 | EUR | 3,211,725 | |||||||||
MHP Lux SA, | ||||||||||||
6.25%, 09/19/29 (b),(e) | $ | 689,000 | 327,275 | |||||||||
6.95%, 04/03/26 (b),(k) | 2,257,000 | 1,108,864 | ||||||||||
MHP SE, 7.750%, 05/10/24 (b),(e),(k) | 2,813,000 | 1,493,872 | ||||||||||
|
| |||||||||||
| 6,141,736 | ||||||||||||
|
| |||||||||||
See Notes to Consolidated Financial Statements.
67
Table of Contents
Blackstone Alternative Multi-Strategy Fund and Subsidiaries
Consolidated Schedule of Investments ^ (Continued)
March 31, 2023
Security Description | Principal Amount | Value | ||||||||||
Real Estate — 0.1% | ||||||||||||
Blackstone Property Partners Europe Holdings S.a.r.l., | ||||||||||||
3.63%, 10/29/29 (b),(k) | 1,111,000 | EUR | $ | 984,059 | ||||||||
4.88%, 04/29/32 (b),(k) | 1,120,000 | GBP | 1,084,518 | |||||||||
Sagax Euro Mtn NL BV, MTN, 1.00%, 05/17/29 (b),(k) | 1,000,000 | EUR | 742,585 | |||||||||
|
| |||||||||||
| 2,811,162 | ||||||||||||
|
| |||||||||||
Restaurants — 0.4% | ||||||||||||
Stonegate Pub Co. Financing 2019 PLC, 8.250%, 07/31/25 (b),(e),(k) | 11,588,000 | 13,303,165 | ||||||||||
Wheel Bidco Ltd., 6.75%, 07/15/26 (b),(k) | 3,047,000 | GBP | 3,127,378 | |||||||||
|
| |||||||||||
| 16,430,543 | ||||||||||||
|
| |||||||||||
Supermarkets — 0.1% | ||||||||||||
Bellis Acquisition Co. PLC, 3.25%, 02/16/26 (b),(k) | 2,593,000 | GBP | 2,615,276 | |||||||||
Iceland Bondco PLC, 4.63%, 03/15/25 (b),(k) | 3,389,000 | GBP | 3,702,633 | |||||||||
|
| |||||||||||
| 6,317,909 | ||||||||||||
|
| |||||||||||
Transportation & Logistics — 0.1% |
| |||||||||||
Heathrow Finance PLC, | ||||||||||||
3.88%, 03/01/27 (b),(i),(k) | 2,393,000 | GBP | 2,566,028 | |||||||||
4.13%, 09/01/29 (b),(i),(k) | 2,009,000 | GBP | 2,056,990 | |||||||||
|
| |||||||||||
| 4,623,018 | ||||||||||||
|
| |||||||||||
Total Europe |
| 49,904,710 | ||||||||||
|
| |||||||||||
Middle East — 0.3% | ||||||||||||
Banks — 0.3% | ||||||||||||
Bank Hapoalim BM, 5 year CMT + 2.16%, 3.26%, 01/21/32 (b),(d),(k) | $ | 3,296,000 | 2,741,613 | |||||||||
Bank Leumi Le-Israel BM, 5 year CMT + 3.47%, 7.13%, 07/18/33 (b),(d),(k) | 3,094,000 | 2,996,539 | ||||||||||
Israel Discount Bank Ltd., 5.38%, 01/26/28 (b),(k) | 5,157,000 | 5,058,615 | ||||||||||
|
| |||||||||||
| 10,796,767 | ||||||||||||
|
| |||||||||||
Total Middle East |
| 10,796,767 | ||||||||||
|
| |||||||||||
North America — 5.8% | ||||||||||||
Automobiles Manufacturing — 0.0% |
| |||||||||||
Rivian Holdings LLC / Rivian LLC / Rivian Automotive LLC, 6 mo. USD LIBOR + 5.63%, 10.16%, 10/15/26 (b),(d),(e) | 783,000 | 772,328 | ||||||||||
|
| |||||||||||
See Notes to Consolidated Financial Statements.
68
Table of Contents
Blackstone Alternative Multi-Strategy Fund and Subsidiaries
Consolidated Schedule of Investments ^ (Continued)
March 31, 2023
Security Description | Principal Amount | Value | ||||||||
Chemicals — 0.1% | ||||||||||
GPD Cos., Inc., 10.13%, 04/01/26 (b),(e) | $ | 1,692,000 | $ | 1,538,451 | ||||||
WR Grace Holdings LLC, | ||||||||||
5.63%, 08/15/29 (b),(e) | 3,844,000 | 3,257,790 | ||||||||
7.38%, 03/01/31 (b),(e) | 752,000 | 754,843 | ||||||||
|
| |||||||||
| 5,551,084 | ||||||||||
|
| |||||||||
Commercial Finance — 0.2% | ||||||||||
Fortress Transportation and Infrastructure Investors LLC, | ||||||||||
5.50%, 05/01/28 (b),(e) | 2,380,000 | 2,171,369 | ||||||||
9.75%, 08/01/27 (b),(e) | 6,148,000 | 6,486,694 | ||||||||
|
| |||||||||
| 8,658,063 | ||||||||||
|
| |||||||||
Construction Materials Manufacturing — 0.1% | ||||||||||
Cemex SAB de CV, 7.38%, 06/05/27 (b),(e) | 5,824,000 | 6,025,802 | ||||||||
|
| |||||||||
Consumer Finance — 0.2% | ||||||||||
Curo Group Holdings Corp., 7.50%, 08/01/28 (b),(e) | 14,015,000 | 5,591,454 | ||||||||
PHH Mortgage Corp., 7.88%, 03/15/26 (b),(e) | 3,107,000 | 2,703,145 | ||||||||
|
| |||||||||
| 8,294,599 | ||||||||||
|
| |||||||||
Consumer Products — 0.2% | ||||||||||
Kronos Acquisition Holdings, Inc. / KIK Custom Products, Inc., 7.00%, 12/31/27 (b),(e) | 11,259,000 | 9,823,477 | ||||||||
|
| |||||||||
Consumer Services — 0.3% | ||||||||||
TKC Holdings, Inc., | ||||||||||
6.88%, 05/15/28 (b),(e) | 6,816,000 | 5,754,209 | ||||||||
10.50%, 05/15/29 (b),(e) | 8,928,000 | 5,571,391 | ||||||||
|
| |||||||||
| 11,325,600 | ||||||||||
|
| |||||||||
Containers & Packaging — 0.2% | ||||||||||
LABL, Inc., | ||||||||||
8.25%, 11/01/29 (b),(e) | 1,978,000 | 1,686,690 | ||||||||
10.50%, 07/15/27 (b),(e) | 268,000 | 247,900 | ||||||||
Mauser Packaging Solutions Holding Co., 9.25%, 04/15/27 (b),(e) | 6,760,000 | 6,246,172 | ||||||||
|
| |||||||||
| 8,180,762 | ||||||||||
|
| |||||||||
Financial Services — 0.0% |
| |||||||||
Charles Schwab Corp. (The), Series I, 5 year CMT + 3.17%, 4.00%, 06/01/26 (b),(d),(m) | 774,000 | 631,019 | ||||||||
See Notes to Consolidated Financial Statements.
69
Table of Contents
Blackstone Alternative Multi-Strategy Fund and Subsidiaries
Consolidated Schedule of Investments ^ (Continued)
March 31, 2023
Security Description | Principal Amount | Value | ||||||||
MF Global Holdings Ltd., 6.75%, 08/08/16 (b),(c),(i),(n) | $ | 436,000 | $ | 125,350 | ||||||
|
| |||||||||
| 756,369 | ||||||||||
|
| |||||||||
Health Care Facilities & Services — 0.3% | ||||||||||
Akumin Escrow, Inc., 7.50%, 08/01/28 (b),(e) | 5,577,000 | 3,903,340 | ||||||||
Akumin, Inc., 7.00%, 11/01/25 (b),(e) | 3,344,000 | 2,633,400 | ||||||||
Team Health Holdings, Inc., 6.38%, 02/01/25 (b),(e) | 11,840,000 | 7,123,418 | ||||||||
U.S. Renal Care, Inc., 10.63%, 07/15/27 (b),(e) | 3,352,000 | 877,140 | ||||||||
|
| |||||||||
| 14,537,298 | ||||||||||
|
| |||||||||
Home Improvement — 0.1% |
| |||||||||
Werner FinCo LP / Werner FinCo, Inc., 8.75%, 07/15/25 (b),(e) | 2,967,000 | 2,403,270 | ||||||||
|
| |||||||||
Integrated Oils — 0.3% | ||||||||||
Petroleos Mexicanos, | ||||||||||
5.63%, 01/23/46 (b) | 245,000 | 145,653 | ||||||||
6.35%, 02/12/48 (b) | 1,543,000 | 948,945 | ||||||||
6.38%, 01/23/45 (b) | 1,024,000 | 646,739 | ||||||||
6.75%, 09/21/47 (b) | 2,216,000 | 1,440,535 | ||||||||
6.95%, 01/28/60 (b) | 993,000 | 641,887 | ||||||||
7.69%, 01/23/50 | 13,127,000 | 9,263,571 | ||||||||
|
| |||||||||
| 13,087,330 | ||||||||||
|
| |||||||||
Machinery Manufacturing — 0.1% |
| |||||||||
Husky III Holding Ltd., PIK, 13.00%, 02/15/25 (b),(e) | 5,930,000 | 5,010,850 | ||||||||
Titan Acquisition Ltd., 7.75%, 04/15/26 (b),(e) | 564,000 | 472,350 | ||||||||
|
| |||||||||
| 5,483,200 | ||||||||||
|
| |||||||||
Medical Equipment & Devices Manufacturing — 0.6% | ||||||||||
Medline Borrower LP, 5.25%, 10/01/29 (e) | 30,545,000 | 26,501,224 | ||||||||
|
| |||||||||
Pharmaceuticals — 0.1% | ||||||||||
1375209 BC Ltd., 9.00%, 01/30/28 (b),(e) | 2,067,000 | 2,049,430 | ||||||||
|
| |||||||||
Pipeline — 0.4% | ||||||||||
Martin Midstream Partners LP, 11.50%, 02/15/28 (e) | 19,152,000 | 18,338,040 | ||||||||
|
| |||||||||
Power Generation — 0.0% | ||||||||||
NRG Energy, Inc., 3.88%, 02/15/32 (b),(e) | 1,623,000 | 1,298,400 | ||||||||
|
| |||||||||
See Notes to Consolidated Financial Statements.
70
Table of Contents
Blackstone Alternative Multi-Strategy Fund and Subsidiaries
Consolidated Schedule of Investments ^ (Continued)
March 31, 2023
Security Description | Principal Amount | Value | ||||||||
Property & Casualty Insurance — 0.1% | ||||||||||
Acrisure LLC, 6.00%, 08/01/29 (b),(e) | $ | 1,427,000 | $ | 1,179,161 | ||||||
Highlands Holdings Bond Issuer Ltd. / Highlands Holdings Bond Co-Issuer, Inc., PIK, 7.63%, 10/15/25 (b),(e) | 5,023,873 | 4,638,860 | ||||||||
|
| |||||||||
| 5,818,021 | ||||||||||
|
| |||||||||
Publishing & Broadcasting — 0.0% |
| |||||||||
Clear Channel Outdoor Holdings, Inc., | ||||||||||
7.50%, 06/01/29 (b),(e) | 305,000 | 216,763 | ||||||||
7.75%, 04/15/28 (b),(e) | 509,000 | 381,750 | ||||||||
|
| |||||||||
| 598,513 | ||||||||||
|
| |||||||||
Real Estate — 0.1% | ||||||||||
Kennedy-Wilson, Inc., | ||||||||||
4.75%, 03/01/29—02/01/30 (b) | 1,474,000 | 1,105,844 | ||||||||
5.00%, 03/01/31 (b) | 557,000 | 408,723 | ||||||||
Park Intermediate Holdings LLC / PK Domestic Property LLC / PK Finance Co-Issuer, | ||||||||||
4.88%, 05/15/29 (b),(e) | 1,219,000 | 1,048,706 | ||||||||
5.88%, 10/01/28 (b),(e) | 1,146,000 | 1,055,179 | ||||||||
XHR LP, 4.88%, 06/01/29 (b),(e) | 168,000 | 142,479 | ||||||||
|
| |||||||||
| 3,760,931 | ||||||||||
|
| |||||||||
Refining & Marketing — 0.5% |
| |||||||||
Calumet Specialty Products Partners LP, 8.13%, 01/15/27 (e) | 18,500,000 | 17,606,196 | ||||||||
Citgo Holding, Inc., 9.25%, 08/01/24 (b),(e) | 335,000 | 335,633 | ||||||||
CITGO Petroleum Corp., 7.00%, 06/15/25 (b),(e) | 437,000 | 431,144 | ||||||||
Petroleos del Peru SA, 5.63%, 06/19/47 (k) | 7,000,000 | 4,534,250 | ||||||||
|
| |||||||||
| 22,907,223 | ||||||||||
|
| |||||||||
Restaurants — 0.1% | ||||||||||
GPS Hospitality Holding Co. LLC / GPS Finco, Inc., 7.00%, 08/15/28 (b),(e) | 7,346,000 | 4,481,060 | ||||||||
|
| |||||||||
Retail—Consumer Discretionary — 0.2% | ||||||||||
LSF9 Atlantis Holdings LLC, 7.75%, 02/15/26 (b),(e) | 1,095,000 | 994,622 | ||||||||
Michaels Cos., Inc. (The), | ||||||||||
5.25%, 05/01/28 (b),(e) | 878,000 | 731,765 | ||||||||
7.88%, 05/01/29 (b),(e) | 5,151,000 | 3,605,700 | ||||||||
PetSmart, Inc./PetSmart Finance Corp., 7.75%, 02/15/29 (b),(e) | 1,343,000 | 1,318,302 | ||||||||
|
| |||||||||
| 6,650,389 | ||||||||||
|
| |||||||||
See Notes to Consolidated Financial Statements.
71
Table of Contents
Blackstone Alternative Multi-Strategy Fund and Subsidiaries
Consolidated Schedule of Investments ^ (Continued)
March 31, 2023
Security Description | Principal Amount | Value | ||||||||||
Software & Services — 0.6% | ||||||||||||
AthenaHealth Group, Inc., 6.50%, 02/15/30 (b),(e) | $ | 4,864,000 | $ | 3,944,021 | ||||||||
Cloud Software Group, Inc., 6.50%, 03/31/29 (e) | 25,964,000 | 22,967,857 | ||||||||||
CoreLogic, Inc., 4.50%, 05/01/28 (b),(e) | 877,000 | 665,424 | ||||||||||
|
| |||||||||||
| 27,577,302 | ||||||||||||
|
| |||||||||||
Transportation & Logistics — 0.5% | ||||||||||||
Rand Parent LLC, 8.50%, 02/15/30 (e) | 23,165,000 | 21,775,100 | ||||||||||
|
| |||||||||||
Travel & Lodging — 0.4% | ||||||||||||
Marriott Ownership Resorts, Inc., 4.50%, 06/15/29 (b),(e) | 136,000 | 115,770 | ||||||||||
Travel + Leisure Co., 4.63%, 03/01/30 (b),(e) | 187,000 | 160,035 | ||||||||||
Viking Cruises Ltd., | ||||||||||||
5.88%, 09/15/27 (b),(e) | 8,462,000 | 7,286,459 | ||||||||||
6.25%, 05/15/25 (b),(e) | 6,284,000 | 5,904,026 | ||||||||||
7.00%, 02/15/29 (b),(e) | 1,740,000 | 1,492,659 | ||||||||||
|
| |||||||||||
| 14,958,949 | ||||||||||||
|
| |||||||||||
Utilities — 0.1% | ||||||||||||
Ferrellgas LP / Ferrellgas Finance Corp., 5.88%, 04/01/29 (b),(e) | 4,515,000 | 3,860,325 | ||||||||||
|
| |||||||||||
Total North America |
| 255,474,089 | ||||||||||
|
| |||||||||||
South America — 0.9% | ||||||||||||
Airlines — 0.3% | ||||||||||||
Azul Investments LLP, | ||||||||||||
5.88%, 10/26/24 (b),(e),(k) | 8,625,000 | 6,853,836 | ||||||||||
7.25%, 06/15/26 (b),(e),(k) | 2,780,000 | 1,822,763 | ||||||||||
Latam Airlines Group SA, 13.38%, 10/15/29 (b),(e) | 2,547,000 | 2,661,615 | ||||||||||
|
| |||||||||||
| 11,338,214 | ||||||||||||
|
| |||||||||||
Chemicals — 0.0% | ||||||||||||
Braskem Netherlands Finance BV, 7.25%, 02/13/33 (b),(k) | 1,373,000 | 1,318,766 | ||||||||||
|
| |||||||||||
Integrated Oils — 0.5% | ||||||||||||
Ecopetrol SA, 8.88%, 01/13/33 (b) | 2,197,000 | 2,223,913 | ||||||||||
Petrobras Global Finance BV, | ||||||||||||
5.09%, 01/15/30 | 6,040,000 | 5,614,180 | ||||||||||
5.30%, 01/27/25 (b) | 5,916,000 | 5,857,201 | ||||||||||
6.00%, 01/27/28 (b) | 2,124,000 | 2,091,040 | ||||||||||
7.38%, 01/17/27 (b) | 5,861,000 | 6,038,782 | ||||||||||
See Notes to Consolidated Financial Statements.
72
Table of Contents
Blackstone Alternative Multi-Strategy Fund and Subsidiaries
Consolidated Schedule of Investments ^ (Continued)
March 31, 2023
Security Description | Principal Amount | Value | ||||||||||
8.75%, 05/23/26 (b) | $ | 1,669,000 | $ | 1,794,601 | ||||||||
|
| |||||||||||
| 23,619,717 | ||||||||||||
|
| |||||||||||
Metals & Mining — 0.1% | ||||||||||||
Corp. Nacional del Cobre de Chile, 3.70%, 01/30/50 (k) | 5,050,000 | 3,805,171 | ||||||||||
Samarco Mineracao SA, 4.13%, 11/01/22 (b),(k),(n) | 1,600,000 | 596,559 | ||||||||||
|
| |||||||||||
| 4,401,730 | ||||||||||||
|
| |||||||||||
Total South America |
| 40,678,427 | ||||||||||
|
| |||||||||||
TOTAL CORPORATE BONDS & NOTES |
| 451,429,644 | ||||||||||
|
| |||||||||||
SOVEREIGN DEBT — 4.7% |
| |||||||||||
Bahrain Government International Bond, MTN, 6.25%, 01/25/51 (b),(k) | 1,780,000 | 1,389,279 | ||||||||||
Colombia Government International Bond, | ||||||||||||
4.13%, 02/22/42—05/15/51 (b) | 14,020,000 | 8,744,599 | ||||||||||
7.38%, 09/18/37 (b) | 1,579,000 | 1,515,022 | ||||||||||
7.50%, 02/02/34 (b) | 2,850,000 | 2,796,842 | ||||||||||
Dominican Republic International Bond, 5.88%, 01/30/60 (k) | 8,000,000 | 6,106,408 | ||||||||||
Ecuador Government International Bond, 2.50%, 07/31/35 (i),(k) | 6,400,000 | 2,126,560 | ||||||||||
Egypt Government International Bond, | ||||||||||||
7.90%, 02/21/48 (k) | 4,348,000 | 2,401,018 | ||||||||||
8.50%, 01/31/47 (k) | 10,048,000 | 5,809,131 | ||||||||||
MTN, 7.50%, 02/16/61 (k) | 6,980,000 | 3,760,112 | ||||||||||
MTN, 8.15%, 11/20/59 (k) | 22,510,000 | 12,482,245 | ||||||||||
French Republic Government Bond OAT, Series OATE, 0.10%, 03/01/29 (b),(k) | 3,477,975 | EUR | 3,761,755 | |||||||||
Guatemala Government Bond, 6.13%, 06/01/50 (k) | $ | 2,000,000 | 1,889,146 | |||||||||
Hazine Mustesarligi Varlik Kiralama AS, 9.76%, 11/13/25 (b),(k) | 5,170,000 | 5,308,297 | ||||||||||
Hungary Government International Bond, | ||||||||||||
3.13%, 09/21/51 (k) | 10,766,000 | 6,588,835 | ||||||||||
5.00%, 02/22/27 (b),(k) | 0 | EUR | 0 | |||||||||
6.25%, 09/22/32 (k) | $ | 8,982,000 | 9,153,736 | |||||||||
6.75%, 09/25/52 (b),(k) | 1,872,000 | 1,934,712 | ||||||||||
7.63%, 03/29/41 (b) | 6,078,000 | 6,824,986 | ||||||||||
Indonesia Government International Bond, | ||||||||||||
3.35%, 03/12/71 (b) | 701,000 | 483,935 | ||||||||||
MTN, 4.13%, 01/15/25 (b),(k) | 1,118,000 | 1,110,739 | ||||||||||
See Notes to Consolidated Financial Statements.
73
Table of Contents
Blackstone Alternative Multi-Strategy Fund and Subsidiaries
Consolidated Schedule of Investments ^ (Continued)
March 31, 2023
Security Description | Principal Amount | Value | ||||||||
Iraq International Bond, 5.800%, 01/15/28 (b),(e),(k) | $ | 15,570,625 | $ | 14,478,190 | ||||||
Israel Government International Bond, 4.50%, 01/17/33 (b),(l) | 5,845,000 | 5,815,775 | ||||||||
Ivory Coast Government International Bond, 6.13%, 06/15/33 (k) | 3,000,000 | 2,591,484 | ||||||||
Jordan Government International Bond, | ||||||||||
7.38%, 10/10/47 (k) | 2,000,000 | 1,684,576 | ||||||||
7.75%, 01/15/28 (b),(k) | 1,680,000 | 1,703,436 | ||||||||
KSA Sukuk Ltd., 5.27%, 10/25/28 (b),(k) | 4,806,000 | 4,999,922 | ||||||||
Lebanon Government International Bond, | ||||||||||
5.80%, 04/14/20 (b),(k),(n) | 3,567,000 | 222,046 | ||||||||
MTN, 6.38%, 03/09/20 (b),(n) | 28,060,000 | 1,746,735 | ||||||||
MTN, 8.25%, 04/12/21 (b),(k),(n) | 3,525,000 | 215,906 | ||||||||
Mexican Udibonos, Series S, 4.50%, 11/22/35 (b) | 48,204,300 | MXN | 2,748,876 | |||||||
Mexico Government International Bond, 5.40%, 02/09/28 (b),(l) | $ | 8,843,000 | 9,102,996 | |||||||
Morocco Government International Bond, 4.00%, 12/15/50 (k) | 8,000,000 | 5,440,000 | ||||||||
Nigeria Government International Bond, MTN, 8.25%, 09/28/51 (k) | 4,000,000 | 2,640,000 | ||||||||
Oman Government International Bond, | ||||||||||
6.50%, 03/08/47 (k) | 1,000,000 | 918,750 | ||||||||
7.00%, 01/25/51 (k) | 3,000,000 | 2,915,628 | ||||||||
Panama Government International Bond, 4.50%, 04/16/50 | 3,000,000 | 2,279,668 | ||||||||
Paraguay Government International Bond, 5.60%, 03/13/48 (k) | 3,000,000 | 2,659,412 | ||||||||
Republic of Poland Government International Bond, | ||||||||||
3.88%, 02/14/33 (b),(k),(l) | 11,219,000 | EUR | 11,929,407 | |||||||
4.25%, 02/14/43 (b),(k),(l) | 6,000,000 | EUR | 6,303,057 | |||||||
4.88%, 10/04/33 (b) | $ | 1,500,000 | 1,493,100 | |||||||
5.50%, 04/04/53 (b) | 2,010,000 | 2,034,120 | ||||||||
Republic of South Africa Government International Bond, | ||||||||||
4.67%, 01/17/24 (b) | 4,285,000 | 4,237,008 | ||||||||
5.65%, 09/27/47 | 8,000,000 | 5,901,600 | ||||||||
Romania Government International Bond, 7.63%, 01/17/53 (k) | 5,700,000 | 6,095,238 | ||||||||
Romanian Government International Bond, | ||||||||||
6.63%, 09/27/29 (b),(k),(l) | 4,421,000 | EUR | 4,895,260 | |||||||
7.13%, 01/17/33 (b),(k) | $ | 2,402,000 | 2,544,679 | |||||||
Serbia International Bond, 6.25%, 05/26/28 (b),(k) | 2,947,000 | 2,975,586 | ||||||||
See Notes to Consolidated Financial Statements.
74
Table of Contents
Blackstone Alternative Multi-Strategy Fund and Subsidiaries
Consolidated Schedule of Investments ^ (Continued)
March 31, 2023
Security Description | Principal Amount | Value | ||||||||||
Turkey Government International Bond, 9.38%, 03/14/29 (b) | $ | 12,635,000 | $ | 12,857,629 | ||||||||
|
| |||||||||||
TOTAL SOVEREIGN DEBT |
| 207,617,441 | ||||||||||
|
| |||||||||||
MORTGAGE-BACKED SECURITIES — 50.7% | ||||||||||||
Europe — 0.1% | ||||||||||||
Collateralized Mortgage Obligation (Residential) — 0.0% |
| |||||||||||
Mulcair Securities No 3 DAC, Series 3, Class D, 3 mo. EURIBOR + 2.00%, 4.42%, 04/24/65 (b),(d),(k) | 158,000 | 160,264 | ||||||||||
|
| |||||||||||
Commercial Mortgage-Backed Securities — 0.1% |
| |||||||||||
Atom Mortgage Securities DAC, | ||||||||||||
Series 1A, Class E, 3 mo. SONIO + 2.8%, 6.72%, 07/22/31 (b),(d),(e) | 786,707 | GBP | 820,057 | |||||||||
Series 1X, Class D, 3 mo. SONIO + 1.9%, 5.82%, 07/22/31 (b),(d),(k) | 84,178 | GBP | 90,771 | |||||||||
Series 1X, Class E, 3 mo. SONIO + 2.8%, 6.72%, 07/22/31 (b),(d),(k) | 78,671 | GBP | 82,006 | |||||||||
Last Mile Securities PE DAC, Series 2021-1X, Class A2, 3 mo. EURIBOR + 1.05%, 3.73%, 08/17/31 (b),(d),(k) | 1,986,591 | EUR | 2,034,579 | |||||||||
Taurus NL DAC, | ||||||||||||
Series 2020-NL1X, Class C, 3 mo. EURIBOR + 1.55%, 4.25%, 02/20/30 (b),(d),(k) | 61,645 | EUR | 61,147 | |||||||||
Series 2020-NL1X, Class D, 3 mo. EURIBOR + 2.00%, 4.70%, 02/20/30 (b),(d),(k) | 616,450 | EUR | 595,045 | |||||||||
|
| |||||||||||
| 3,683,605 | ||||||||||||
|
| |||||||||||
Total Europe | 3,843,869 | |||||||||||
|
| |||||||||||
North America — 50.6% | ||||||||||||
Collateralized Mortgage Obligation (Residential) — 1.6% |
| |||||||||||
Ajax Mortgage Loan Trust, Series 2021-E, Class B1, 3.73%, 12/25/60 (b),(d),(e) | $ | 972,000 | 783,644 | |||||||||
Alternative Loan Trust, | ||||||||||||
Series 2004-16CB, Class M, 5.75%, 08/25/34 (b),(d) | 325,697 | 263,732 | ||||||||||
Series 2004-2CB, Class M, 5.77%, 03/25/34 (b),(d) | 425,244 | 339,667 | ||||||||||
Series 2004-4CB, Class M, 5.77%, 04/25/34 (b),(d) | 210,221 | 170,799 | ||||||||||
See Notes to Consolidated Financial Statements.
75
Table of Contents
Blackstone Alternative Multi-Strategy Fund and Subsidiaries
Consolidated Schedule of Investments ^ (Continued)
March 31, 2023
Security Description | Principal Amount | Value | ||||||||
Series 2005-10CB, Class 1A1, 1 mo. USD LIBOR + .50%, 5.35%, 05/25/35 (b),(d) | $ | 322,045 | $ | 243,906 | ||||||
Series 2005-46CB, Class A9, 5.50%, 10/25/35 (b) | 1,722,941 | 1,465,506 | ||||||||
Series 2005-56, Class 1A2, 1 mo. USD LIBOR + 1.16%, 6.01%, 11/25/35 (b),(d) | 328,298 | 282,553 | ||||||||
Series 2005-76, Class 1A2, 12 mo. MTA + 2.00%, 5.14%, 01/25/36 (b),(d) | 1,914,293 | 1,776,720 | ||||||||
Series 2005-AR1, Class 2A3A, 1 mo. USD LIBOR + .70%, 5.55%, 12/25/35 (b),(d) | 273,392 | 239,909 | ||||||||
Series 2006-13T1 SEQ, Class A15, 6.00%, 05/25/36 (b) | 417,951 | 235,476 | ||||||||
Series 2006-23CB, Class 2A3, 6.50%, 08/25/36 (b) | 714,969 | 249,324 | ||||||||
Series 2006-29T1, Class 3A1, 6.50%, 10/25/36 (b) | 563,821 | 185,957 | ||||||||
Series 2006-39CB, Class 1A6, 1 mo. USD LIBOR + .60%, 5.45%, 01/25/37 (b),(d) | 327,087 | 252,756 | ||||||||
Series 2006-H, Class 5A1, 1 mo. USD LIBOR + .36%, 5.12%, 10/20/36 (b),(d) | 4,030,555 | 1,433,644 | ||||||||
Series 2006-J1, Class 1A4, 1 mo. USD LIBOR + .50%, 5.35%, 02/25/36 (b),(d) | 392,326 | 247,654 | ||||||||
Series 2006-OA12, Class A2, 1 mo. USD LIBOR + .21%, 4.97%, 09/20/46 (b),(d) | 224,860 | 186,942 | ||||||||
Series 2006-OA12 SEQ, Class A1C, 1 mo. USD LIBOR + .28%, 5.04%, 09/20/46 (b),(d) | 323,127 | 241,917 | ||||||||
Series 2006-OA17, Class 1A1D, 1 mo. USD LIBOR + .29%, 5.05%, 12/20/46 (b),(d) | 314,573 | 277,276 | ||||||||
Series 2006-OA19, Class A1, 1 mo. USD LIBOR + .18%, 4.94%, 02/20/47 (b),(d) | 370,000 | 281,379 | ||||||||
Series 2006-OA19, Class A4, 1 mo. USD LIBOR + .21%, 4.97%, 02/20/47 (b),(d) | 355,926 | 269,480 | ||||||||
Series 2006-OA2, Class A1, 1 mo. USD LIBOR + .42%, 5.18%, 05/20/46 (b),(d) | 597,408 | 528,254 | ||||||||
Series 2006-OA8, Class 2A3, 1 mo. USD LIBOR + .38%, 5.23%, 07/25/46 (b),(d) | 248,275 | 228,781 | ||||||||
Series 2006-OA8, Class 2A4, 1 mo. USD LIBOR + .52%, 5.37%, 07/25/46 (b),(d) | 371,167 | 271,438 | ||||||||
Series 2006-OA9, Class 2A1A, 1 mo. USD LIBOR + .21%, 4.97%, 07/20/46 (b),(d) | 229,215 | 172,372 | ||||||||
Series 2007-18CB, Class 1A2, 1 mo. USD LIBOR + .47%, 5.32%, 08/25/37 (b),(d) | 732,455 | 248,746 | ||||||||
See Notes to Consolidated Financial Statements.
76
Table of Contents
Blackstone Alternative Multi-Strategy Fund and Subsidiaries
Consolidated Schedule of Investments ^ (Continued)
March 31, 2023
Security Description | Principal Amount | Value | ||||||||
Series 2007-20, Class A1, 1 mo. USD LIBOR + .50%, 5.35%, 08/25/47 (b),(d) | $ | 657,933 | $ | 255,939 | ||||||
Series 2007-23CB, Class A3, 1 mo. USD LIBOR + .50%, 5.35%, 09/25/37 (b),(d) | 598,908 | 228,539 | ||||||||
Series 2007-2CB, Class 1A7, 1 mo. USD LIBOR + .50%, 5.35%, 03/25/37 (b),(d) | 600,382 | 260,494 | ||||||||
Series 2007-OA11, Class A1A, 12 mo. MTA + 1.38%, 4.52%, 11/25/47 (b),(d) | 396,791 | 314,543 | ||||||||
Series 2007-OA2, Class 1A1, 12 mo. MTA + .84%, 3.98%, 03/25/47 (b),(d) | 277,963 | 222,155 | ||||||||
Series 2007-OH2, Class A2B, 1 mo. USD LIBOR + .36%, 5.21%, 08/25/47 (b),(d) | 172,291 | 145,164 | ||||||||
American Home Mortgage Investment Trust, Series 2005-2, Class 5A4C, 5.91%, 09/25/35 (b),(i) | 812,638 | 484,023 | ||||||||
Angel Oak Mortgage Trust, Series 2021-8, Class B1, 4.11%, 11/25/66 (b),(d),(e) | 109,000 | 80,378 | ||||||||
Banc of America Funding Trust, | ||||||||||
Series 2005-B, Class 3M2, 1 mo. USD LIBOR + 1.05%, 5.81%, 04/20/35 (b),(d) | 1,536,356 | 1,355,954 | ||||||||
Series 2006-H, Class 6A1, 1 mo. USD LIBOR + .38%, 5.14%, 10/20/36 (b),(d) | 396,296 | 321,428 | ||||||||
Barclays Mortgage Loan Trust, Series 2021-NQM1, Class B2, 5.43%, 09/25/51 (b),(e) | 100,000 | 76,606 | ||||||||
Bear Stearns ALT-A Trust, Series 2006-4, Class 13A1, 1 mo. USD LIBOR + .32%, 5.17%, 08/25/36 (b),(d) | 300,431 | 275,791 | ||||||||
Bear Stearns ARM Trust, Series 2004-3, Class B1, 3.52%, 07/25/34 (b),(d) | 206,208 | 189,151 | ||||||||
BRAVO Residential Funding Trust, Series 2022-NQM, Class B1, 4.72%, 09/25/61 (b),(d),(e) | 1,000,000 | 787,271 | ||||||||
Chase Mortgage Finance Trust, Series 2007-A1, Class 1M, 3.87%, 02/25/37 (b),(d) | 259,612 | 216,022 | ||||||||
CHL Mortgage Pass-Through Trust, Series 2005-3, Class 1A4, 1 mo. USD LIBOR + .72%, 5.57%, 04/25/35 (b),(d) | 543,671 | 484,763 | ||||||||
Citigroup Mortgage Loan Trust, | ||||||||||
Series 2006-AR6, Class 2A4, 1 mo. USD LIBOR + .44%, 5.29%, 09/25/36 (b),(d) | 809,988 | 251,480 | ||||||||
Series 2019-E, Class A2, 7.88%, 11/25/70 (b),(e),(i) | 1,030,627 | 1,023,763 | ||||||||
COLT Mortgage Loan Trust, | ||||||||||
Series 2021-HX1, Class B1, 3.11%, 10/25/66 (b),(d),(e) | 118,000 | 81,782 | ||||||||
See Notes to Consolidated Financial Statements.
77
Table of Contents
Blackstone Alternative Multi-Strategy Fund and Subsidiaries
Consolidated Schedule of Investments ^ (Continued)
March 31, 2023
Security Description | Principal Amount | Value | ||||||||
Series 2021-HX1, Class B3A, 4.21%, 10/25/66 (b),(d),(e) | $ | 100,000 | $ | 60,891 | ||||||
Series 2022-1, Class B1, 4.12%, 12/27/66 (b),(d),(e) | 100,000 | 75,478 | ||||||||
Series 2022-1, Class B2, 4.12%, 12/27/66 (b),(d),(e) | 100,000 | 71,475 | ||||||||
Series 2022-2, Class B1, 3.99%, 02/25/67 (b),(d),(e) | 100,000 | 72,859 | ||||||||
Series 2022-5, Class B1, 4.72%, 03/25/67 (b),(d),(e) | 1,000,000 | 864,812 | ||||||||
COLT Trust, | ||||||||||
Series 2021-RPL1, Class B2, 4.76%, 09/25/61 (b),(d),(e) | 446,000 | 345,961 | ||||||||
Series 2021-RPL1, Class B1, 4.76%, 09/25/61 (b),(d),(e) | 100,000 | 86,389 | ||||||||
Credit Suisse First Boston Mortgage Securities Corp., Series 2003-AR26, Class CB1, 4.15%, 11/25/33 (b),(d) | 280,168 | 246,395 | ||||||||
CSMC, | ||||||||||
Series 2021-NQM3, Class B1, 3.43%, 04/25/66 (b),(d),(e) | 211,000 | 137,796 | ||||||||
Series 2021-NQM7, Class B1, 3.72%, 10/25/66 (b),(d),(e) | 100,000 | 70,567 | ||||||||
Series 2021-NQM8, Class B2, 4.20%, 10/25/66 (b),(d),(e) | 100,000 | 71,176 | ||||||||
Series 2021-NQM8, Class B1, 4.21%, 10/25/66 (b),(d),(e) | 226,899 | 151,325 | ||||||||
Deephaven Residential Mortgage Trust, | ||||||||||
Series 2020-2, Class B3, 5.83%, 05/25/65 (b),(d),(e) | 263,000 | 228,056 | ||||||||
Series 2021-2, Class B1, 3.17%, 04/25/66 (b),(d),(e) | 117,000 | 81,295 | ||||||||
Series 2021-2, Class B2, 3.93%, 04/25/66 (b),(d),(e) | 100,000 | 72,754 | ||||||||
Series 2021-4, Class B2, 4.47%, 11/25/66 (b),(d),(e) | 100,000 | 63,638 | ||||||||
Series 2022-1, Class B2, 4.30%, 01/25/67 (b),(d),(e) | 100,000 | 62,920 | ||||||||
Series 2022-1, Class B1, 4.30%, 01/25/67 (b),(d),(e) | 100,000 | 74,878 | ||||||||
Series 2022-2, Class M1, 4.34%, 03/25/67 (b),(d),(e) | 100,000 | 77,832 | ||||||||
DSLA Mortgage Loan Trust, Series 2005-AR2, Class 2A1A, 1 mo. USD LIBOR + .42%, 5.18%, 03/19/45 (b),(d) | 1,228,972 | 1,130,470 | ||||||||
See Notes to Consolidated Financial Statements.
78
Table of Contents
Blackstone Alternative Multi-Strategy Fund and Subsidiaries
Consolidated Schedule of Investments ^ (Continued)
March 31, 2023
Security Description | Principal Amount | Value | ||||||||
Eagle RE Ltd., Series 2020-1, Class M2, 1 mo. USD LIBOR + 2.00%, 6.85%, 01/25/30 (b),(d),(e) | $ | 10,192,000 | $ | 9,841,293 | ||||||
Federal Home Loan Mortgage Corp., | ||||||||||
Series 2017-HQA2, Class M2AI, 2.00%, 12/25/29 (b),(h) | 657,105 | 8,492 | ||||||||
Series 2018-HQA1, Class M2AI, 1.50%, 09/25/30 (b),(h) | 34,167 | 291 | ||||||||
Series 5093, Class AI, 3.50%, 04/25/51 (h) | 14,502,651 | 2,324,325 | ||||||||
Series 5146, Class BI, 4.00%, 08/25/50 (h) | 24,532,402 | 4,597,642 | ||||||||
Federal National Mortgage Association, | ||||||||||
Series 2017-C02, Class 2X3, 2.30%, 09/25/29 (b),(h) | 348,265 | 6,087 | ||||||||
Series 2017-C02, Class 2X4, 2.80%, 09/25/29 (b),(h) | 1,029,803 | 21,912 | ||||||||
Series 2017-C03, Class 1X2, 1.80%, 10/25/29 (b),(h) | 1,545,165 | 23,538 | ||||||||
Series 2017-C04, Class 2X2, 1.75%, 11/25/29 (b),(h) | 4,846,465 | 90,988 | ||||||||
Series 2017-C07, Class 1X3, 1.00%, 05/25/30 (b),(h) | 930,752 | 5,936 | ||||||||
Series 409, Class C14, 3.50%, 04/25/42 (h) | 14,515,321 | 2,311,173 | ||||||||
Series 413, Class C35, 4.50%, 10/25/40 (h) | 11,810,877 | 2,118,541 | ||||||||
Flagstar Mortgage Trust, Series 2018-4, Class B4, 4.20%, 07/25/48 (b),(d),(e) | 228,809 | 180,200 | ||||||||
FREDDIEMAC STRIP FHS 303 C28, Series 303, Class C28, 4.50%, 01/15/43 (h) | 10,392,923 | 2,019,366 | ||||||||
GCAT Trust, | ||||||||||
Series 2022-HX1, Class M1, 4.02%, 12/27/66 (b),(d),(e) | 100,000 | 76,633 | ||||||||
Series 2022-HX1, Class B1, 4.02%, 12/27/66 (b),(d),(e) | 100,000 | 73,516 | ||||||||
Series 2022-NQM4, Class M1, 5.75%, 08/25/67 (b),(d),(e) | 145,000 | 126,812 | ||||||||
GSR Mortgage Loan Trust, | ||||||||||
Series 2005-AR6, Class B1, 4.18%, 09/25/35 (b),(d) | 299,635 | 213,557 | ||||||||
Series 2006-OA1, Class 1A1, 1 mo. USD LIBOR + .44%, 5.29%, 08/25/46 (b),(d) | 8,122,442 | 1,876,828 | ||||||||
HarborView Mortgage Loan Trust, | ||||||||||
Series 2005-10, Class 2A1B, 1 mo. USD LIBOR + .76%, 5.52%, 11/19/35 (b),(d) | 821,287 | 565,735 | ||||||||
Series 2006-4, Class 1A1A, 1 mo. USD LIBOR + .36%, 5.12%, 05/19/46 (b),(d) | 555,517 | 298,415 | ||||||||
See Notes to Consolidated Financial Statements.
79
Table of Contents
Blackstone Alternative Multi-Strategy Fund and Subsidiaries
Consolidated Schedule of Investments ^ (Continued)
March 31, 2023
Security Description | Principal Amount | Value | ||||||||
Homeward Opportunities Fund Trust, Series 2022-1, Class M1, 5.05%, 07/25/67 (b),(d),(e) | $ | 179,000 | $ | 153,770 | ||||||
Imperial Fund Mortgage Trust, Series 2023-NQM1, Class M1, 8.27%, 02/25/68 (b),(d),(e) | 256,000 | 251,514 | ||||||||
IndyMac INDX Mortgage Loan Trust, | ||||||||||
Series 2006-AR7, Class 3A1, 3.34%, 05/25/36 (b),(d) | 227,670 | 179,995 | ||||||||
Series 2007-FLX2, Class A2, 1 mo. USD LIBOR + .19%, 5.04%, 04/25/37 (b),(d) | 268,384 | 245,215 | ||||||||
JP Morgan Alternative Loan Trust, Series 2006-A6, Class 1A1, 1 mo. USD LIBOR + .32%, 5.17%, 11/25/36 (b),(d) | 320,771 | 254,076 | ||||||||
JP Morgan Mortgage Trust, Series 2018-5, Class B4, 3.73%, 10/25/48 (b),(d),(e) | 262,334 | 192,955 | ||||||||
Legacy Mortgage Asset Trust, | ||||||||||
Series 2020-GS4, Class A2, 4.00%, 02/25/60 (b),(e),(i) | 1,000,000 | 931,986 | ||||||||
Series 2021-GS3, Class A2, 3.25%, 07/25/61 (b),(e),(i) | 556,000 | 482,598 | ||||||||
Lehman Mortgage Trust, Series 2007-1, Class 1A2, 5.75%, 02/25/37 (b) | 595,020 | 630,389 | ||||||||
Lehman XS Trust, | ||||||||||
Series 2007-15N, Class 4A1, 1 mo. USD LIBOR + .90%, 5.75%, 08/25/47 (b),(d) | 306,530 | 256,560 | ||||||||
Series 2007-4N, Class 2A, 1 mo. USD LIBOR + .40%, 5.25%, 03/25/47 (b),(d) | 511,519 | 458,339 | ||||||||
LHOME Mortgage Trust, | ||||||||||
Series 2021-RTL1, Class M, 4.46%, 02/25/26 (b),(d),(e) | 1,884,000 | 1,625,643 | ||||||||
Series 2021-RTL2, Class M, 4.61%, 06/25/26 (b),(e),(i) | 684,000 | 607,343 | ||||||||
Merrill Lynch Alternative Note Asset Trust, Series 2007-A2, Class A2A, 1 mo. USD LIBOR + .40%, 5.25%, 03/25/37 (b),(d) | 785,726 | 248,105 | ||||||||
Merrill Lynch Mortgage Investors Trust, Series 2005-A5, Class M1, 3.47%, 06/25/35 (b),(d) | 644,805 | 620,942 | ||||||||
MFA Trust, | ||||||||||
Series 2021-INV2, Class B1, 4.39%, 11/25/56 (b),(d),(e) | 100,000 | 69,646 | ||||||||
Series 2022-NQM, Class M1, 4.28%, 12/25/66 (b),(d),(e) | 1,000,000 | 791,689 | ||||||||
Morgan Stanley Mortgage Loan Trust, Series 2004-7AR, Class B1, 4.67%, 09/25/34 (b),(d) | 279,664 | 240,799 | ||||||||
See Notes to Consolidated Financial Statements.
80
Table of Contents
Blackstone Alternative Multi-Strategy Fund and Subsidiaries
Consolidated Schedule of Investments ^ (Continued)
March 31, 2023
Security Description | Principal Amount | Value | ||||||||
New Residential Mortgage Loan Trust, | ||||||||||
Series 2022-NQM1, Class B2, 3.82%, 04/25/61 (b),(d),(e) | $ | 100,000 | $ | 66,084 | ||||||
Series 2022-NQM1, Class B1, 3.82%, 04/25/61 (b),(d),(e) | 100,000 | 69,122 | ||||||||
Nomura Asset Acceptance Corp. Alternative Loan Trust, Series 2006-AR3, Class A3A, 1 mo. USD LIBOR + 0.34%, 5.19%, 10/25/36 (b),(d) | 346,482 | 289,413 | ||||||||
PMT Credit Risk Transfer Trust, Series 2019-2R, Class A, 1 mo. USD LIBOR + 2.75%, 7.60%, 05/27/23 (b),(d),(e) | 1,804,702 | 1,782,796 | ||||||||
PRPM LLC, | ||||||||||
Series 2021-6, Class A2, 3.47%, 07/25/26 (b),(e),(i) | 100,000 | 83,359 | ||||||||
Series 2021-7, Class A2, 3.67%, 08/25/26 (b),(e),(i) | 207,000 | 176,014 | ||||||||
Series 2021-8, Class A2, 3.60%, 09/25/26 (b),(d),(e) | 129,000 | �� | 107,770 | |||||||
Series 2021-9 SEQ, Class A2, 3.97%, 10/25/26 (b),(d),(e) | 244,000 | 205,643 | ||||||||
Residential Accredit Loans, Inc. Trust, Series 2006-QO7, Class 1A1, 12 mo. MTA + .80%, 3.94%, 09/25/46 (b),(d) | 323,474 | 271,882 | ||||||||
STACR Trust, Series 2018-HRP2, Class M3AI, 1.75%, 02/25/47 (b),(e),(h) | 942,801 | 12,351 | ||||||||
Starwood Mortgage Residential Trust, | ||||||||||
Series 2020-INV1, Class B1, 3.26%, 11/25/55 (b),(e) | 123,000 | 91,764 | ||||||||
Series 2021-3, Class B1, 3.35%, 06/25/56 (b),(d),(e) | 100,000 | 70,192 | ||||||||
Series 2021-6, Class B2, 3.94%, 11/25/66 (b),(d),(e) | 100,000 | 64,165 | ||||||||
Series 2021-6, Class B1, 3.94%, 11/25/66 (b),(d),(e) | 100,000 | 69,973 | ||||||||
Series 2022-1, Class B1, 3.96%, 12/25/66 (b),(d),(e) | 135,000 | 95,300 | ||||||||
Structured Asset Securities Corp Mortgage Pass-Through CTFS, Series 2003-26A, Class B1II, 4.93%, 09/25/33 (b),(d) | 253,640 | 203,094 | ||||||||
Thornburg Mortgage Securities Trust, Series 2005-3, Class B1, 3.61%, 10/25/45 (b),(d) | 571,701 | 481,997 | ||||||||
TRK Trust, | ||||||||||
Series 2021-INV2, Class B1, 4.10%, 11/25/56 (b),(d),(e) | 117,000 | 72,467 | ||||||||
See Notes to Consolidated Financial Statements.
81
Table of Contents
Blackstone Alternative Multi-Strategy Fund and Subsidiaries
Consolidated Schedule of Investments ^ (Continued)
March 31, 2023
Security Description | Principal Amount | Value | ||||||||
Series 2021-INV2, Class B2, 4.44%, 11/25/56 (b),(d),(e) | $ | 1,000,000 | $ | 544,432 | ||||||
Series 2022-INV1, Class B2, 4.05%, 02/25/57 (b),(d),(e) | 100,000 | 65,334 | ||||||||
Series 2022-INV1, Class B1, 4.05%, 02/25/57 (b),(d),(e) | 111,000 | 79,242 | ||||||||
Verus Securitization Trust, | ||||||||||
Series 2022-1, Class B2, 3.99%, 01/25/67 (b),(d),(e) | 1,000,000 | 606,494 | ||||||||
Series 2022-4, Class B1, 4.72%, 04/25/67 (b),(d),(e) | 1,000,000 | 845,661 | ||||||||
Series 2022-8, Class M1, 6.19%, 09/25/67 (b),(d),(e) | 1,000,000 | 879,802 | ||||||||
Series 2022-INV1, Class M1, 5.88%, 08/25/67 (b),(d),(e) | 1,000,000 | 853,628 | ||||||||
Series 2022-INV1, Class B1, 5.88%, 08/25/67 (b),(d),(e) | 1,000,000 | 780,842 | ||||||||
WaMu Mortgage Pass-Through Certificates Series, | ||||||||||
Series 2005-AR17, Class A1C4, 1 mo. USD LIBOR + .80%, 5.65%, 12/25/45 (b),(d) | 583,367 | 356,729 | ||||||||
Series 2005-AR2, Class B1, 1 mo. USD LIBOR + .80%, 5.64%, 01/25/45 (b),(d) | 275,742 | 208,316 | ||||||||
Series 2005-AR6, Class B1, 1 mo. USD LIBOR + .90%, 5.75%, 04/25/45 (b),(d) | 488,022 | 385,507 | ||||||||
Series 2005-AR9, Class B1, 1 mo. USD LIBOR + .95%, 5.79%, 07/25/45 (b),(d) | 187,462 | 172,360 | ||||||||
Series 2006-AR1, Class 2A1C, 12 mo. MTA + 1.07%, 4.21%, 01/25/46 (b),(d) | 236,706 | 205,647 | ||||||||
WaMu Mortgage Pass-Through Certificates Trust, | ||||||||||
Series 2005-AR1, Class B1, 1 mo. USD LIBOR + .83%, 5.67%, 01/25/45 (b),(d) | 303,405 | 261,456 | ||||||||
Series 2006-AR17, Class 1A, 12 mo. MTA + .82%, 3.61%, 12/25/46 (b),(d) | 1,446,258 | 1,201,341 | ||||||||
Series 2007-OA5, Class 2A, 12 mo. MTA + .80%, 3.94%, 06/25/47 (b),(d) | 413,164 | 340,016 | ||||||||
Washington Mutual Mortgage Pass-Through Certificates WMALT Trust, | ||||||||||
Series 2005-11, Class A2, 5.75%, 01/25/36 (b) | 241,483 | 205,250 | ||||||||
Series 2007-3, Class 1A9, 6.00%, 04/25/37 (b) | 574,454 | 486,229 | ||||||||
Series 2007-OA3, Class 2A, 12 mo. MTA + .75%, 3.89%, 02/25/47 (b),(d) | 202,460 | 174,673 | ||||||||
|
| |||||||||
| 69,869,234 | ||||||||||
|
| |||||||||
See Notes to Consolidated Financial Statements.
82
Table of Contents
Blackstone Alternative Multi-Strategy Fund and Subsidiaries
Consolidated Schedule of Investments ^ (Continued)
March 31, 2023
Security Description | Principal Amount | Value | ||||||||
Commercial Mortgage-Backed Securities — 4.3% | ||||||||||
Arbor Multifamily Mortgage Securities Trust, Series 2022-MF4, Class E, 2.00%, 02/15/55 (b),(e) | $ | 130,000 | $ | 71,061 | ||||||
AREIT LLC, Series 2022-CRE7, Class C, 1 mo. TSFR + 3.84%, 8.59%, 06/17/39 (b),(d),(e) | 1,000,000 | 965,349 | ||||||||
Ashford Hospitality Trust, Series 2018-KEYS, Class D, 1 mo. USD LIBOR + 2.75%, 7.44%, 06/15/35 (b),(d),(e) | 90,000 | 83,441 | ||||||||
BAMLL Commercial Mortgage Securities Trust, | ||||||||||
Series 2019-BPR, Class FMP, 3.89%, 11/05/32 (b),(d),(e) | 4,408,000 | 3,353,699 | ||||||||
Series 2019-BPR, Class EMP, 3.89%, 11/05/32 (b),(d),(e) | 8,817,000 | 6,933,997 | ||||||||
Benchmark Mortgage Trust, Series 2018-B7, Class D, 3.00%, 05/15/53 (b),(e) | 290,000 | 204,966 | ||||||||
BHMS Mortgage Trust, | ||||||||||
Series 2018-ATLS, Class C, 1 mo. USD LIBOR + 1.90%, 6.58%, 07/15/35 (b),(d),(e) | 525,000 | 484,505 | ||||||||
Series 2018-ATLS, Class E, 1 mo. USD LIBOR + 3.00%, 7.68%, 07/15/35 (b),(d),(e) | 2,103,000 | 1,850,057 | ||||||||
BOCA Commercial Mortgage Trust, | ||||||||||
Series 2022-BOCA, Class D, 1 mo. TSFR + 3.32%, 8.15%, 05/15/39 (b),(d),(e) | 1,000,000 | 967,688 | ||||||||
Series 2022-BOCA, Class E, 1 mo. TSFR + 4.22%, 9.04%, 05/15/39 (b),(d),(e) | 1,040,000 | 1,012,183 | ||||||||
BX Commercial Mortgage Trust, | ||||||||||
Series 2020-VIVA, Class E, 3.55%, 03/11/44 (b),(d),(e) | 1,000,000 | 705,877 | ||||||||
Series 2020-VIVA, Class D, 3.55%, 03/11/44 (b),(d),(e) | 5,039,000 | 3,875,958 | ||||||||
Series 2021-CIP, Class F, 1 mo. USD LIBOR + 3.22%, 7.90%, 12/15/38 (b),(d),(e) | 100,000 | 91,320 | ||||||||
Series 2021-MC, Class G, 1 mo. USD LIBOR + 3.09%, 7.77%, 04/15/34 (b),(d),(e) | 100,000 | 88,646 | ||||||||
Series 2021-SOAR, Class E, 1 mo. USD LIBOR + 1.80%, 6.49%, 06/15/38 (b),(d),(e) | 2,798,886 | 2,606,625 | ||||||||
Series 2021-SOAR, Class G, 1 mo. USD LIBOR + 2.80%, 7.49%, 06/15/38 (b),(d),(e) | 234,225 | 214,730 | ||||||||
See Notes to Consolidated Financial Statements.
83
Table of Contents
Blackstone Alternative Multi-Strategy Fund and Subsidiaries
Consolidated Schedule of Investments ^ (Continued)
March 31, 2023
Security Description | Principal Amount | Value | ||||||||
Series 2021-SOAR, Class J, 1 mo. USD LIBOR + 3.75%, 8.44%, 06/15/38 (b),(d),(e) | $ | 984,137 | $ | 903,034 | ||||||
Series 2022-AHP, Class E, 1 mo. TSFR + 3.04%, 7.87%, 01/17/39 (b),(d),(e) | 216,000 | 201,976 | ||||||||
Series BX 2021-SOAR, Class F, 1 mo. USD LIBOR + 2.35%, 7.04%, 06/15/38 (b),(d),(e) | 1,392,554 | 1,281,555 | ||||||||
BX Trust, Series 2018-GW, Class F, 1 mo. USD LIBOR + 2.42%, 7.10%, 05/15/35 (b),(d),(e) | 106,000 | 101,085 | ||||||||
BXSC Commercial Mortgage Trust, Series 2022-WSS, Class E, 1 mo. TSFR + 4.13%, 8.96%, 03/15/35 (b),(d),(e) | 148,000 | 143,195 | ||||||||
CAMB Commercial Mortgage Trust, | ||||||||||
Series 2019-LIFE, Class E, 1 mo. USD LIBOR + 2.15%, 6.83%, 12/15/37 (b),(d),(e) | 1,000,000 | 965,133 | ||||||||
Series 2019-LIFE, Class F, 1 mo. USD LIBOR + 2.55%, 7.23%, 12/15/37 (b),(d),(e) | 1,000,000 | 957,661 | ||||||||
Series 2019-LIFE, Class G, 1 mo. USD LIBOR + 3.25%, 7.93%, 12/15/37 (b),(d),(e) | 129,000 | 123,441 | ||||||||
Series 2021-CX2, Class C, 2.77%, 11/10/46 (b),(d),(e) | 1,332,000 | 973,892 | ||||||||
Cascade Funding Mortgage Trust, Series 2021-FRR1, Class BK98, 0.00%, 08/29/29 (b),(e),(g) | 1,000,000 | 596,419 | ||||||||
Citigroup Commercial Mortgage Trust, | ||||||||||
Series 2012-GC8, Class C, 4.91%, 09/10/45 (b),(d),(e) | 103,179 | 95,956 | ||||||||
Series 2015-GC29, Class D, 3.11%, 04/10/48 (b),(e) | 1,000,000 | 835,482 | ||||||||
Series 2016-C3, Class D, 3.00%, 11/15/49 (b),(e) | 1,826,000 | 943,795 | ||||||||
Series 2016-GC37, Class D, 2.79%, 04/10/49 (b),(e) | 100,000 | 79,616 | ||||||||
Series 2019-C7, Class E, 2.75%, 12/15/72 (b),(e) | 697,000 | 415,073 | ||||||||
Series 2020-420K, Class E, 3.31%, 11/10/42 (b),(d),(e) | 100,000 | 67,606 | ||||||||
Cold Storage Trust, Series 2020-ICE5, Class F, 1 mo. USD LIBOR + 3.49%, 8.18%, 11/15/37 (b),(d),(e) | 982,991 | 950,640 | ||||||||
COMM Mortgage Trust, | ||||||||||
Series 2014-CR14, Class D, 4.59%, 02/10/47 (b),(d),(e) | 591,000 | 559,304 | ||||||||
See Notes to Consolidated Financial Statements.
84
Table of Contents
Blackstone Alternative Multi-Strategy Fund and Subsidiaries
Consolidated Schedule of Investments ^ (Continued)
March 31, 2023
Security Description | Principal Amount | Value | ||||||||
Series 2014-CR18, Class D, 4.76%, 07/15/47 (b),(d),(e) | $ | 2,161,000 | $ | 1,939,649 | ||||||
Series 2014-CR21, Class E, 3.00%, 12/10/47 (e) | 1,686,000 | 1,313,976 | ||||||||
Series 2015-CR27, Class E, 3.25%, 10/10/48 (b),(e) | 1,439,000 | 1,116,983 | ||||||||
Series 2019-GC44, Class 180D, 3.40%, 08/15/57 (b),(d),(e) | 231,000 | 205,516 | ||||||||
Series 2019-GC44, Class 180C, 3.40%, 08/15/57 (b),(d),(e) | 386,000 | 354,645 | ||||||||
Series 2019-GC44, Class 180B, 3.40%, 08/15/57 (b),(d),(e) | 160,000 | 145,251 | ||||||||
Commercial Mortgage Trust, | ||||||||||
Series 2015-CR22, Class E, 3.00%, 03/10/48 (b),(e) | 239,000 | 192,251 | ||||||||
Series 2015-CR23, Class E, 3.23%, 05/10/48 (b),(e) | 4,794,000 | 3,751,243 | ||||||||
Series 2015-CR23, Class D, 4.30%, 05/10/48 (b),(d) | 502,000 | 438,404 | ||||||||
Series 2015-CR23, Class C, 4.30%, 05/10/48 (b),(d) | 123,000 | 113,941 | ||||||||
Series 2015-CR25, Class D, 3.77%, 08/10/48 (b),(d) | 479,000 | 394,565 | ||||||||
Series 2015-CR27, Class D, 3.45%, 10/10/48 (b),(d),(e) | 3,065,000 | 2,591,470 | ||||||||
Series 2015-LC21, Class D, 4.33%, 07/10/48 (b),(d) | 1,348,000 | 1,135,330 | ||||||||
Series 2015-LC21, Class C, 4.33%, 07/10/48 (b),(d) | 1,113,000 | 1,020,012 | ||||||||
Series 2016-CD1, Class D, 2.78%, 08/10/49 (b),(d),(e) | 2,075,000 | 1,585,111 | ||||||||
Crescent Capital Trust, Series 2021-MOON, Class E, 1 mo. USD LIBOR + 2.55%, 7.24%, 04/15/36 (b),(d),(e) | 1,000,000 | 840,137 | ||||||||
CSAIL 2015-C4 Commercial Mortgage Trust, Series 2015-C4, Class E, 3.56%, 11/15/48 (b),(d) | 100,000 | 85,708 | ||||||||
CSAIL Commercial Mortgage Trust, | ||||||||||
Series 2015-C2, Class D, 4.18%, 06/15/57 (b),(d) | 843,000 | 514,163 | ||||||||
Series 2015-C3, Class D, 3.36%, 08/15/48 (b),(d) | 3,139,000 | 1,802,273 | ||||||||
Series 2015-C4, Class F, 3.50%, 11/15/48 (b),(d),(e) | 5,568,000 | 4,440,575 | ||||||||
Series 2016-C5, Class C, 4.64%, 11/15/48 (b),(d) | 355,000 | 327,055 | ||||||||
See Notes to Consolidated Financial Statements.
85
Table of Contents
Blackstone Alternative Multi-Strategy Fund and Subsidiaries
Consolidated Schedule of Investments ^ (Continued)
March 31, 2023
Security Description | Principal Amount | Value | ||||||||
Series 2018-CX11, Class D, 2.75%, 04/15/51 (b),(d),(e) | $ | 604,000 | $ | 411,239 | ||||||
Series 2019-C16, Class D, 3.00%, 06/15/52 (b),(e) | 163,000 | 101,897 | ||||||||
Series 2019-C17, Class D, 2.50%, 09/15/52 (b),(e) | 1,409,000 | 942,446 | ||||||||
DBWF Mortgage Trust, | ||||||||||
Series 2018-GLKS, Class D, 1 mo. USD LIBOR + 2.50%, 7.26%, 12/19/30 (b),(d),(e) | 138,000 | 133,719 | ||||||||
Series 2018-GLKS, Class E, 1 mo. USD LIBOR + 3.12%, 7.88%, 12/19/30 (b),(d),(e) | 45,000 | 43,548 | ||||||||
Series 2018-GLKS, Class F, 1 mo. USD LIBOR + 3.59%, 8.35%, 12/19/30 (b),(d),(e) | 2,202,000 | 2,055,323 | ||||||||
ELP Commercial Mortgage Trust, | ||||||||||
Series 2021-ELP, Class D, 1 mo. USD LIBOR + 1.52%, 6.20%, 11/15/38 (b),(d),(e) | 2,931,000 | 2,751,614 | ||||||||
Series 2021-ELP, Class F, 1 mo. USD LIBOR + 2.67%, 7.35%, 11/15/38 (b),(d),(e) | 100,000 | 91,247 | ||||||||
Series 2021-ELP, Class J, 1 mo. USD LIBOR + 3.61%, 8.30%, 11/15/38 (b),(d),(e) | 1,004,000 | 897,646 | ||||||||
EQUS Mortgage Trust, | ||||||||||
Series 2021-EQAZ, Class D, 1 mo. USD LIBOR + 1.65%, 6.33%, 10/15/38 (b),(d),(e) | 2,030,959 | 1,868,615 | ||||||||
Series 2021-EQAZ, Class E, 1 mo. USD LIBOR + 2.30%, 6.98%, 10/15/38 (b),(d),(e) | 128,997 | 117,719 | ||||||||
Federal Home Loan Mortgage Corp., | ||||||||||
Series 2021-MN1, Class M2, 1 mo. SOFR + 3.75%, 8.23%, 01/25/51 (b),(d),(e) | 102,000 | 87,147 | ||||||||
Series 2021-MN2, Class M2, 1 mo. SOFR + 3.35%, 7.91%, 07/25/41 (b),(d),(e) | 128,000 | 105,026 | ||||||||
Series K142, Class X3, 3.10%, 03/25/32 (b),(d),(h) | 1,000,000 | 191,504 | ||||||||
Fontainebleau Miami Beach Trust, | ||||||||||
Series 2019-FBLU, Class F, 3.96%, 12/10/36 (b),(d),(e) | 3,344,000 | 3,055,948 | ||||||||
Series 2019-FBLU, Class G, 3.96%, 12/10/36 (b),(d),(e) | 724,000 | 651,478 | ||||||||
See Notes to Consolidated Financial Statements.
86
Table of Contents
Blackstone Alternative Multi-Strategy Fund and Subsidiaries
Consolidated Schedule of Investments ^ (Continued)
March 31, 2023
Security Description | Principal Amount | Value | ||||||||
Series 2019-FBLU, Class H, 3.96%, 12/10/36 (b),(d),(e) | $ | 111,000 | $ | 98,728 | ||||||
FREMF Mortgage Trust, | ||||||||||
Series 2017-KGX1, Class CFX, 3.59%, 10/25/27 (b),(d),(e) | 1,000,000 | 888,479 | ||||||||
Series 2019-KL4L, Class BCR, 1 mo. USD LIBOR + 3.50%, 8.17%, 11/25/25 (b),(d),(e) | 12,168 | 12,052 | ||||||||
Great Wolf Trust, Series 2019-WOLF, Class F, 1 mo. TSFR + 3.25%, 8.07%, 12/15/36 (b),(d),(e) | 1,336,000 | 1,259,869 | ||||||||
GS Mortgage Securities Corp. Trust, | ||||||||||
Series 2021-DM, Class F, 1 mo. USD LIBOR + 3.44%, 8.12%, 11/15/36 (b),(d),(e) | 211,000 | 189,862 | ||||||||
Series 2021-ROSS, Class F, 1 mo. USD LIBOR + 3.90%, 8.59%, 05/15/26 (b),(d),(e) | 1,019,000 | 890,853 | ||||||||
Series 2021-ROSS, Class G, 1 mo. USD LIBOR + 4.65%, 9.34%, 05/15/26 (b),(d),(e) | 1,000,000 | 840,837 | ||||||||
Series 2021-ROSS, Class H, 1 mo. USD LIBOR + 5.90%, 10.59%, 05/15/26 (b),(d),(e) | 1,000,000 | 823,870 | ||||||||
GS Mortgage Securities Trust, | ||||||||||
Series 2012-GCJ9, Class D, 4.65%, 11/10/45 (b),(d),(e) | 188,867 | 175,113 | ||||||||
Series 2013-GC10, Class E, 4.61%, 02/10/46 (b),(d),(e) | 3,900,000 | 2,864,940 | ||||||||
Series 2014-GC20, Class D, 5.00%, 04/10/47 (b),(d),(e) | 503,911 | 387,568 | ||||||||
Series 2014-GC20, Class C, 5.00%, 04/10/47 (b),(d) | 1,874,000 | 1,757,061 | ||||||||
Series 2014-GC24, Class B, 4.51%, 09/10/47 (b),(d) | 100,000 | 91,959 | ||||||||
Series 2014-GC24, Class C, 4.53%, 09/10/47 (b),(d) | 303,000 | 265,421 | ||||||||
Series 2016-GS2, Class D, 2.75%, 05/10/49 (b),(e) | 1,415,000 | 1,067,568 | ||||||||
Series 2016-GS4, Class D, 3.23%, 11/10/49 (b),(d),(e) | 151,000 | 103,778 | ||||||||
Series 2017-GS8, Class D, 2.70%, 11/10/50 (b),(e) | 1,593,000 | 1,209,530 | ||||||||
Series 2018-HULA, Class G, 1 mo. USD LIBOR + 3.40%, 8.08%, 07/15/25 (b),(d),(e) | 974,233 | 884,613 | ||||||||
See Notes to Consolidated Financial Statements.
87
Table of Contents
Blackstone Alternative Multi-Strategy Fund and Subsidiaries
Consolidated Schedule of Investments ^ (Continued)
March 31, 2023
Security Description | Principal Amount | Value | ||||||||
Series 2019-70P, Class C, 1 mo. USD LIBOR + 1.50%, 6.18%, 10/15/36 (b),(d),(e) | $ | 138,000 | $ | 124,224 | ||||||
Hawaii Hotel Trust, | ||||||||||
Series 2019-MAUI, Class F, 1 mo. USD LIBOR + 2.75%, 7.43%, 05/15/38 (b),(d),(e) | 1,399,000 | 1,329,215 | ||||||||
Series 2019-MAUI, Class G, 1 mo. USD LIBOR + 3.15%, 7.83%, 05/15/38 (b),(d),(e) | 1,000,000 | 916,359 | ||||||||
Hilton USA Trust, | ||||||||||
Series 2016-HHV, Class E, 4.19%, 11/05/38 (b),(d),(e) | 982,000 | 850,270 | ||||||||
Series 2016-HHV, Class F, 4.19%, 11/05/38 (b),(d),(e) | 20,252,000 | 16,988,896 | ||||||||
Series 2016-SFP, Class F, 6.16%, 11/05/35 (b),(e) | 1,068,000 | 953,114 | ||||||||
IMT Trust, Series 2017-APTS, Class FFX, 3.50%, 06/15/34 (b),(d),(e) | 625,000 | 585,186 | ||||||||
JP Morgan Chase Commercial Mortgage Securities Corp., Series 2019-MARG, Class F, 1 mo. USD LIBOR + 3.00%, 7.68%, 05/15/34 (b),(d),(e) | 156,000 | 149,871 | ||||||||
JP Morgan Chase Commercial Mortgage Securities Trust, | ||||||||||
Series 2015-JP1, Class C, 4.73%, 01/15/49 (b),(d) | 102,000 | 94,688 | ||||||||
Series 2016-JP3, Class D, 3.40%, 08/15/49 (b),(d),(e) | 100,000 | 76,470 | ||||||||
Series 2020-NNNZ SEQ, Class M, 8.54%, 01/16/37 (e) | 172,013 | 151,402 | ||||||||
Series 2021-MHC, Class E, 1 mo. USD LIBOR + 2.45%, 7.13%, 04/15/38 (b),(d),(e) | 100,000 | 93,007 | ||||||||
Series 2021-MHC, Class F, 1 mo. USD LIBOR + 2.95%, 7.63%, 04/15/38 (b),(d),(e) | 1,000,000 | 930,696 | ||||||||
JPMBB Commercial Mortgage Securities Trust, | ||||||||||
Series 2014-C23, Class D, 3.98%, 09/15/47 (b),(d),(e) | 100,000 | 86,459 | ||||||||
Series 2014-C26, Class C, 4.37%, 01/15/48 (b),(d) | 642,000 | 596,053 | ||||||||
Series 2015-C28, Class D, 3.64%, 10/15/48 (b),(d),(e) | 2,537,000 | 1,817,644 | ||||||||
Series 2015-C29, Class D, 3.69%, 05/15/48 (b),(d) | 112,000 | 81,603 | ||||||||
See Notes to Consolidated Financial Statements.
88
Table of Contents
Blackstone Alternative Multi-Strategy Fund and Subsidiaries
Consolidated Schedule of Investments ^ (Continued)
March 31, 2023
Security Description | Principal Amount | Value | ||||||||
Series 2015-C30, Class D, 3.73%, 07/15/48 (b),(d) | $ | 2,964,000 | $ | 2,526,801 | ||||||
Series 2015-C31, Class E, 4.62%, 08/15/48 (b),(d),(e) | 1,093,000 | 655,288 | ||||||||
Series 2016-C1, Class E, 4.74%, 03/17/49 (b),(d),(e) | 3,126,000 | 2,387,564 | ||||||||
Series 2016-C1, Class C, 4.74%, 03/17/49 (b),(d) | 651,000 | 590,443 | ||||||||
KKR Industrial Portfolio Trust, | ||||||||||
Series 2021-KDIP, Class F, 1 mo. TSFR + 2.16%, 6.99%, 12/15/37 (b),(d),(e) | 3,184,500 | 2,929,963 | ||||||||
Series 2021-KDIP, Class G, 1 mo. TSFR + 3.86%, 8.69%, 12/15/37 (b),(d),(e) | 750,000 | 706,204 | ||||||||
LAQ Mortgage Trust, | ||||||||||
Series 2023-LAQ, Class D, 1 mo. TSFR + 4.19%, 8.84%, 03/15/36 (b),(d),(e) | 1,000,000 | 975,258 | ||||||||
Series 2023-LAQ, Class E, 1 mo. TSFR + 5.19%, 9.84%, 03/15/36 (b),(d),(e) | 1,000,000 | 979,591 | ||||||||
Life 2021-BMR Mortgage Trust, Series 2021-BMR, Class F, 1 mo. TSFR + 2.46%, 7.29%, 03/15/38 (b),(d),(e) | 1,130,416 | 1,051,577 | ||||||||
LSTAR Commercial Mortgage Trust, | ||||||||||
Series 2015-3, Class E, 3.15%, 04/20/48 (b),(d),(e) | 121,000 | 103,924 | ||||||||
Series 2017-5, Class D, 4.67%, 03/10/50 (b),(d),(e) | 1,125,000 | 902,143 | ||||||||
Series 2017-5, Class C, 4.67%, 03/10/50 (b),(d),(e) | 967,000 | 824,717 | ||||||||
LUXE Trust, | ||||||||||
Series 2021-TRIP, Class E, 1 mo. USD LIBOR + 2.75%, 7.43%, 10/15/38 (b),(d),(e) | 1,000,000 | 949,557 | ||||||||
Series 2021-TRIP, Class F, 1 mo. USD LIBOR + 3.25%, 7.93%, 10/15/38 (b),(d),(e) | 1,347,000 | 1,272,198 | ||||||||
Series 2021-TRIP, Class G, 1 mo. USD LIBOR + 4.25%, 8.93%, 10/15/38 (b),(d),(e) | 1,128,000 | 1,042,546 | ||||||||
MBRT, | ||||||||||
Series 2019-MBR, Class D, 1 mo. USD LIBOR + 2.05%, 6.73%, 11/15/36 (b),(d),(e) | 411,000 | 398,690 | ||||||||
Series 2019-MBR, Class G, 1 mo. USD LIBOR + 3.25%, 7.93%, 11/15/36 (b),(d),(e) | 1,009,000 | 971,936 | ||||||||
See Notes to Consolidated Financial Statements.
89
Table of Contents
Blackstone Alternative Multi-Strategy Fund and Subsidiaries
Consolidated Schedule of Investments ^ (Continued)
March 31, 2023
Security Description | Principal Amount | Value | ||||||||
MHC Commercial Mortgage Trust, | ||||||||||
Series 2021-MHC, Class E, 1 mo. USD LIBOR + 2.10%, 6.79%, 04/15/38 (b),(d),(e) | $ | 1,000,000 | $ | 937,555 | ||||||
Series 2021-MHC, Class F, 1 mo. USD LIBOR + 2.60%, 7.29%, 04/15/38 (b),(d),(e) | 1,128,000 | 1,046,292 | ||||||||
Series 2021-MHC, Class G, 1 mo. USD LIBOR + 3.20%, 7.89%, 04/15/38 (b),(d),(e) | 1,083,000 | 1,007,887 | ||||||||
MHC Trust, | ||||||||||
Series 2021-MHC2, Class E, 1 mo. USD LIBOR + 1.95%, 6.63%, 05/15/38 (b),(d),(e) | 332,000 | 307,951 | ||||||||
Series 2021-MHC2, Class F, 1 mo. USD LIBOR + 2.40%, 7.08%, 05/15/38 (b),(d),(e) | 1,095,000 | 999,271 | ||||||||
MHP 2021-STOR, | ||||||||||
Series 2021-STOR, Class E, 1 mo. USD LIBOR + 1.75%, 6.43%, 07/15/38 (b),(d),(e) | 398,000 | 368,175 | ||||||||
Series 2021-STOR, Class F, 1 mo. USD LIBOR + 2.20%, 6.88%, 07/15/38 (b),(d),(e) | 311,000 | 283,033 | ||||||||
Series 2021-STOR, Class G, 1 mo. USD LIBOR + 2.75%, 7.43%, 07/15/38 (b),(d),(e) | 100,000 | 91,572 | ||||||||
MHP 2022-MHIL, | ||||||||||
Series 2022-MHIL, Class F, 1 mo. TSFR + 3.26%, 8.09%, 01/15/27 (b),(d),(e) | 1,002,751 | 912,556 | ||||||||
Series 2022-MHIL, Class G, 1 mo. TSFR + 3.96%, 8.78%, 01/15/27 (b),(d),(e) | 971,658 | 896,186 | ||||||||
Morgan Stanley Bank of America Merrill Lynch Trust, | ||||||||||
Series 2014-C17, Class D, 4.72%, 08/15/47 (b),(d),(e) | 100,000 | 89,663 | ||||||||
Series 2015-C20, Class D, 3.07%, 02/15/48 (b),(e) | 393,000 | 344,859 | ||||||||
Series 2015-C21, Class D, 4.13%, 03/15/48 (b),(d),(e) | 3,575,000 | 2,291,725 | ||||||||
Series 2016-C30, Class D, 3.00%, 09/15/49 (b),(d),(e) | 1,323,000 | 825,447 | ||||||||
Series 2016-C31, Class D, 3.00%, 11/15/49 (b),(d),(e) | 1,441,000 | 858,064 | ||||||||
See Notes to Consolidated Financial Statements.
90
Table of Contents
Blackstone Alternative Multi-Strategy Fund and Subsidiaries
Consolidated Schedule of Investments ^ (Continued)
March 31, 2023
Security Description | Principal Amount | Value | ||||||||
Series 2016-C32, Class D, 3.40%, 12/15/49 (b),(d),(e) | $ | 991,000 | $ | 635,797 | ||||||
Morgan Stanley Capital I Trust, | ||||||||||
Series 2016-UB11, Class E, 2.60%, 08/15/49 (b),(d),(e) | 3,200,500 | 1,667,486 | ||||||||
Series 2016-UB12, Class D, 3.31%, 12/15/49 (b),(e) | 1,761,000 | 1,052,271 | ||||||||
Series 2018-SUN, Class F, 1 mo. USD LIBOR + 2.55%, 7.23%, 07/15/35 (b),(d),(e) | 1,000,000 | 967,812 | ||||||||
Natixis Commercial Mortgage Securities Trust, | ||||||||||
Series 2019-MILE, Class D, 1 mo. TSFR + 2.83%, 7.66%, 07/15/36 (b),(d),(e) | 102,000 | 91,776 | ||||||||
Series 2019-MILE, Class E, 1 mo. TSFR + 3.58%, 8.41%, 07/15/36 (b),(d),(e) | 135,000 | 120,087 | ||||||||
Series 2022-RRI, Class C, 1 mo. TSFR + 3.10%, 7.92%, 03/15/35 (b),(d),(e) | 113,864 | 109,280 | ||||||||
Series 2022-RRI, Class E, 1 mo. TSFR + 5.19%, 10.02%, 03/15/35 (b),(d),(e) | 86,919 | 83,004 | ||||||||
New Orleans Hotel Trust, Series 2019-HNLA, Class E, 1 mo. USD LIBOR + 2.69%, 7.37%, 04/15/32 (b),(d),(e) | 1,301,000 | 1,190,490 | ||||||||
OPG Trust, | ||||||||||
Series 2021-PORT, Class D, 1 mo. USD LIBOR + 1.13%, 5.82%, 10/15/36 (b),(d),(e) | 68,537 | 63,572 | ||||||||
Series 2021-PORT, Class E, 1 mo. USD LIBOR + 1.53%, 6.21%, 10/15/36 (b),(d),(e) | 68,537 | 63,230 | ||||||||
Series 2021-PORT, Class G, 1 mo. USD LIBOR + 2.40%, 7.08%, 10/15/36 (b),(d),(e) | 260,443 | 235,069 | ||||||||
Pearl Finance DAC, Series 2020-1, Class C, 3 mo. EURIBOR + 2.85%, 5.53%, 11/17/32 (b),(d),(k) | 650,453 | EUR | 670,714 | |||||||
Prima Capital CRE Securitization Ltd., | ||||||||||
Series 2019-1S, Class C, 5.50%, 10/01/33 (b),(e) | $ | 1,000,000 | 891,657 | |||||||
Series 2019-RK1, Class CG, 4.00%, 04/15/38 (b),(e) | 339,000 | 258,931 | ||||||||
Series 2019-RK1, Class CT, 4.45%, 04/15/38 (b),(e) | 121,000 | 94,477 | ||||||||
Series 2019-RK1, Class BT, 4.45%, 04/15/38 (b),(e) | 1,173,000 | 948,813 | ||||||||
See Notes to Consolidated Financial Statements.
91
Table of Contents
Blackstone Alternative Multi-Strategy Fund and Subsidiaries
Consolidated Schedule of Investments ^ (Continued)
March 31, 2023
Security Description | Principal Amount | Value | ||||||||
Ready Capital Mortgage Financing LLC, Series 2022-FL9, Class C, 1 mo. TSFR + 4.31%, 9.10%, 06/25/37 (b),(d),(e) | $ | 1,000,000 | $ | 980,702 | ||||||
ReadyCap Commercial Mortgage Trust, | ||||||||||
Series 2019-6, Class C, 4.13%, 10/25/52 (b),(d),(e) | 1,691,000 | 1,470,790 | ||||||||
Series 2019-6, Class D, 4.71%, 10/25/52 (b),(d),(e) | 227,000 | 176,276 | ||||||||
SG Commercial Mortgage Securities Trust, | ||||||||||
Series 2016-C5, Class D, 4.83%, 10/10/48 (b),(d),(e) | 295,000 | 228,273 | ||||||||
Series 2019-PREZ, Class E, 3.48%, 09/15/39 (b),(d),(e) | 1,720,000 | 1,316,674 | ||||||||
SREIT Trust, | ||||||||||
Series 2021-IND, Class G, 1 mo. USD LIBOR + 3.27%, 7.95%, 10/15/38 (b),(d),(e) | 1,366,000 | 1,290,356 | ||||||||
Series 2021-MFP, Class G, 1 mo. USD LIBOR + 2.97%, 7.66%, 11/15/38 (b),(d),(e) | 1,000,000 | 894,537 | ||||||||
STWD Mortgage Trust, | ||||||||||
Series 2021-LIH, Class E, 1 mo. USD LIBOR + 2.90%, 7.59%, 11/15/36 (b),(d),(e) | 1,000,000 | 913,827 | ||||||||
Series 2021-LIH, Class F, 1 mo. USD LIBOR + 3.55%, 8.24%, 11/15/36 (b),(d),(e) | 125,000 | 117,608 | ||||||||
Series 2021-LIH SEQ, Class G, 1 mo. USD LIBOR + 4.20%, 8.88%, 11/15/36 (b),(d),(e) | 1,000,000 | 914,939 | ||||||||
STWD Trust, | ||||||||||
Series 2021-FLWR, Class E, 1 mo. USD LIBOR + 1.92%, 6.61%, 07/15/36 (b),(d),(e) | 836,000 | 767,071 | ||||||||
Series 2021-FLWR, Class G, 1 mo. USD LIBOR + 3.67%, 8.35%, 07/15/23 (b),(d),(e) | 223,000 | 204,000 | ||||||||
TPGI Trust, | ||||||||||
Series 2021-DGWD, Class E, 1 mo. USD LIBOR + 2.35%, 7.03%, 06/15/26 (b),(d),(e) | 1,189,000 | 1,082,080 | ||||||||
Series 2021-DGWD, Class F, 1 mo. USD LIBOR + 3.00%, 7.68%, 06/15/26 (b),(d),(e) | 1,143,000 | 1,058,265 | ||||||||
Series 2021-DGWD, Class G, 1 mo. USD LIBOR + 3.85%, 8.53%, 06/15/26 (b),(d),(e) | 1,390,000 | 1,277,032 | ||||||||
See Notes to Consolidated Financial Statements.
92
Table of Contents
Blackstone Alternative Multi-Strategy Fund and Subsidiaries
Consolidated Schedule of Investments ^ (Continued)
March 31, 2023
Security Description | Principal Amount | Value | ||||||||
UBS Commercial Mortgage Trust, |
| |||||||||
Series 2018-C11, Class D, 3.00%, 06/15/51 (b),(d),(e) | $ | 112,000 | $ | 67,872 | ||||||
Series 2018-C9, Class D, 4.95%, 03/15/51 (b),(d),(e) | 331,000 | 247,916 | ||||||||
Series 2019-C17, Class D, 2.50%, 10/15/52 (b),(e) | 103,000 | 68,400 | ||||||||
Wells Fargo Commercial Mortgage Trust, | ||||||||||
Series 2014-LC18, Class D, 3.96%, 12/15/47 (b),(d),(e) | 992,000 | 885,460 | ||||||||
Series 2015-C26, Class D, 3.59%, 02/15/48 (b),(e) | 4,590,000 | 4,059,681 | ||||||||
Series 2015-C27, Class D, 3.77%, 02/15/48 (b),(e) | 5,146,000 | 3,257,305 | ||||||||
Series 2015-C31, Class D, 3.85%, 11/15/48 (b) | 2,058,000 | 1,618,864 | ||||||||
Series 2015-NXS4, Class D, 3.69%, 12/15/48 (b),(d) | 100,000 | 82,107 | ||||||||
Series 2016-C32, Class D, 3.79%, 01/15/59 (b),(d),(e) | 465,000 | 385,544 | ||||||||
Series 2016-LC24, Class D, 3.21%, 10/15/49 (b),(e) | 4,253,000 | 3,170,875 | ||||||||
Series 2016-NXS5, Class E, 4.99%, 01/15/59 (b),(d),(e) | 100,000 | 79,943 | ||||||||
Series 2019-JWDR, Class D, 3.33%, 09/15/31 (b),(d),(e) | 100,000 | 86,272 | ||||||||
Series 2019-JWDR, Class E, 3.86%, 09/15/31 (b),(d),(e) | 2,022,000 | 1,710,161 | ||||||||
Series 2019-JWDR, Class F, 4.56%, 09/15/31 (b),(d),(e) | 2,300,000 | 1,918,469 | ||||||||
Series 2019-JWDR, Class G, 5.38%, 09/15/31 (b),(d),(e) | 2,074,000 | 1,732,618 | ||||||||
WFRBS Commercial Mortgage Trust, | ||||||||||
Series 2014-C19, Class D, 4.23%, 03/15/47 (b),(e) | 379,000 | 342,716 | ||||||||
Series 2014-C22, Class D, 3.91%, 09/15/57 (b),(d),(e) | 4,703,000 | 3,680,422 | ||||||||
WMRK Commercial Mortgage Trust, | ||||||||||
Series 2022-WMRK, Class D, 1 mo. TSFR + 4.93%, 9.76%, 11/15/27 (b),(d),(e) | 1,000,000 | 980,011 | ||||||||
Series 2022-WMRK, Class E, 1 mo. TSFR + 5.68%, 10.50%, 11/15/27 (b),(d),(e) | 1,000,000 | 975,013 | ||||||||
Worldwide Plaza Trust, Series 2017-WWP, Class F, 3.60%, 11/10/36 (b),(d),(e) | 109,000 | 59,530 | ||||||||
|
| |||||||||
| 188,931,308 | ||||||||||
|
| |||||||||
See Notes to Consolidated Financial Statements.
93
Table of Contents
Blackstone Alternative Multi-Strategy Fund and Subsidiaries
Consolidated Schedule of Investments ^ (Continued)
March 31, 2023
Security Description | Principal Amount | Value | ||||||||
Inverse Interest Only Collateralized Mortgage Obligations — 0.5% |
| |||||||||
BBCMS Mortgage Trust 2022-C16, Series 2022-C16, Class XD, 2.18%, 06/15/55 (b),(d),(e),(h) | $ | 4,299,000 | $ | 648,332 | ||||||
CFK Trust, Series 2020-MF2, Class X, 0.77%, 03/15/39 (b),(d),(e),(h) | 19,612,000 | 521,032 | ||||||||
Citigroup Commercial Mortgage Trust, | ||||||||||
Series 2019-C7, Class XD, 1.20%, 12/15/72 (b),(d),(e),(h) | 5,347,000 | 348,977 | ||||||||
Series 2019-GC43, Class XD, 0.62%, 11/10/52 (b),(d),(e),(h) | 5,918,000 | 195,466 | ||||||||
Commercial Mortgage Trust, Series 2014-UBS4, Class XA, 1.09%, 08/10/47 (b),(d),(h) | 15,345,417 | 129,792 | ||||||||
CSAIL Commercial Mortgage Trust, | ||||||||||
Series 2015-C2, Class XA, 0.72%, 06/15/57 (b),(d),(h) | 33,417,142 | 368,023 | ||||||||
Series 2015-C3, Class XA, 0.67%, 08/15/48 (b),(d),(h) | 90,600,578 | 1,045,802 | ||||||||
Series 2019-C18, Class XD, 1.46%, 12/15/52 (b),(d),(e),(h) | 4,452,333 | 329,869 | ||||||||
DC Office Trust, Series 2019-MTC, Class X, 0.11%, 09/15/45 (b),(d),(e),(h) | 64,579,000 | 503,716 | ||||||||
Federal Home Loan Mortgage Corp., | ||||||||||
Series K-1514, Class X3, 2.77%, 10/25/34 (b),(d),(h) | 13,043,739 | 2,624,374 | ||||||||
Series K049, Class X3, 1.55%, 10/25/43 (b),(d),(h) | 2,177,000 | 64,742 | ||||||||
Series K061, Class X1, 0.15%, 11/25/26 (b),(d),(h) | 16,099,733 | 92,622 | ||||||||
Series K071, Class X1, 0.29%, 11/25/27 (b),(d),(h) | 87,791,001 | 985,015 | ||||||||
Series K085, Class X3, 2.31%, 12/25/45 (b),(d),(h) | 1,000,000 | 102,751 | ||||||||
Series K095, Class X3, 2.10%, 08/25/47 (b),(d),(h) | 9,297,000 | 954,346 | ||||||||
Series K102, Class X3, 1.89%, 12/25/46 (b),(d),(h) | 1,000,000 | 96,285 | ||||||||
Series K115, Class X3, 2.96%, 09/25/48 (b),(d),(h) | 1,000,000 | 159,021 | ||||||||
Series K118, Class X3, 2.69%, 10/25/48 (b),(d),(h) | 652,000 | 96,299 | ||||||||
Series K119, Class X3, 2.73%, 09/25/48 (b),(d),(h) | 1,525,000 | 229,917 | ||||||||
Series K122, Class X3, 2.63%, 01/25/49 (b),(d),(h) | 1,000,000 | 146,871 | ||||||||
See Notes to Consolidated Financial Statements.
94
Table of Contents
Blackstone Alternative Multi-Strategy Fund and Subsidiaries
Consolidated Schedule of Investments ^ (Continued)
March 31, 2023
Security Description | Principal Amount | Value | ||||||||
Series K126, Class X3, 2.63%, 01/25/49 (b),(d),(h) | $ | 1,148,000 | $ | 174,136 | ||||||
Series K128, Class X3, 2.78%, 04/25/31 (b),(d),(h) | 1,000,000 | 160,145 | ||||||||
Series K143, Class X3, 3.14%, 04/25/50 (b),(d),(h) | 1,000,000 | 195,660 | ||||||||
Series K148, Class X3, 4.15%, 08/25/54 (b),(d),(h) | 751,000 | 198,480 | ||||||||
Series K154, Class X1, 0.30%, 11/25/32 (b),(d),(h) | 31,186,615 | 636,488 | ||||||||
Series K725, Class X1, 0.70%, 01/25/24 (b),(d),(h) | 127,199,790 | 488,320 | ||||||||
Series KLU1, Class X3, 4.05%, 01/25/31 (b),(d),(h) | 21,228,909 | 2,441,303 | ||||||||
Series KLU2, Class X1, 0.95%, 08/25/29 (b),(d),(h) | 56,012,175 | 2,564,405 | ||||||||
Series KLU2, Class X3, 3.91%, 08/25/29 (b),(d),(h) | 8,319,142 | 1,251,033 | ||||||||
Series KS11, Class XFX, 1.60%, 06/25/29 (b),(d),(h) | 25,265,000 | 1,856,978 | ||||||||
Series KW10, Class X3, 2.72%, 10/25/32 (b),(d),(h) | 5,935,000 | 796,608 | ||||||||
GS Mortgage Securities Corp. Trust, Series 2020-DUNE, Class XCP, 0.00%, 12/15/36 (b),(d),(e),(h) | 15,243,000 | 152 | ||||||||
GS Mortgage Securities Trust, Series 2019-GC40, Class XD, 1.16%, 07/10/52 (b),(d),(e),(h) | 2,219,000 | 135,738 | ||||||||
JPMDB Commercial Mortgage Securities Trust, Series 2019-COR6, Class XD, 1.42%, 11/13/52 (b),(d),(e),(h) | 4,231,000 | 312,442 | ||||||||
MFT Trust, Series 2020-ABC, Class XA, 0.12%, 02/10/42 (b),(d),(e),(h) | 20,401,000 | 179,712 | ||||||||
STACR Trust, Series 2018-DNA3, Class M2AI, 1.50%, 09/25/48 (b),(e),(h) | 551,410 | 6,367 | ||||||||
|
| |||||||||
| 21,041,219 | ||||||||||
|
| |||||||||
Mortgage Securities — 6.9% | ||||||||||
Government National Mortgage Association, | ||||||||||
TBA, 30 Year Maturity, 3.00%, 04/20/53 (b),(f) | 1,000,000 | 909,688 | ||||||||
TBA, 30 Year Maturity, 6.00%, 04/20/53 (f) | 300,000,000 | 305,777,400 | ||||||||
|
| |||||||||
| 306,687,088 | ||||||||||
|
| |||||||||
See Notes to Consolidated Financial Statements.
95
Table of Contents
Blackstone Alternative Multi-Strategy Fund and Subsidiaries
Consolidated Schedule of Investments ^ (Continued)
March 31, 2023
Security Description | Principal Amount | Value | ||||||||||
Uniform Mortgage-Backed Securities — 37.3% |
| |||||||||||
Federal National Mortgage Association, | ||||||||||||
TBA, 30 Year Maturity, 5.00%, 04/13/53 (f) | $ | 155,500,000 | $ | 155,026,192 | ||||||||
5.50%, 04/13/53 - 05/11/53 TBA, 30 Year Maturity (f) | 410,000,000 | 414,082,400 | ||||||||||
6.00%, 04/13/53 - 05/11/53 TBA, 30 Year Maturity (f) | 1,064,000,000 | 1,085,715,492 | ||||||||||
|
| |||||||||||
| 1,654,824,084 | ||||||||||||
|
| |||||||||||
Total North America |
| 2,241,352,933 | ||||||||||
|
| |||||||||||
TOTAL MORTGAGE-BACKED SECURITIES |
| 2,245,196,802 | ||||||||||
|
| |||||||||||
U.S. GOVERNMENT SPONSORED AGENCY SECURITIES — 0.2% |
| |||||||||||
North America — 0.2% |
| |||||||||||
Mortgage Securities — 0.2% |
| |||||||||||
Federal National Mortgage Association, Series 2020-62, Class GI, 4.00%, 06/25/48 (h) | 9,897,534 | 1,905,364 | ||||||||||
Government National Mortgage Association, | ||||||||||||
Series 2021-158, Class DI, 4.50%, 09/20/51 (h) | 21,406,252 | 4,117,493 | ||||||||||
Series 2022-125, Class CI, 5.00%, 06/20/52 (h) | 25,221,919 | 4,707,974 | ||||||||||
|
| |||||||||||
| 10,730,831 | ||||||||||||
|
| |||||||||||
Total North America |
| 10,730,831 | ||||||||||
|
| |||||||||||
TOTAL U.S. GOVERNMENT SPONSORED AGENCY SECURITIES |
| 10,730,831 | ||||||||||
|
| |||||||||||
MUNICIPALS — 0.0% |
| |||||||||||
North America — (0.0)% |
| |||||||||||
California Housing Finance Agency, Rev., Series 2019 X, (SER X), 0.29%, 01/15/35 (b),(d) | 14,677,719 | 223,782 | ||||||||||
|
| |||||||||||
TOTAL MUNICIPALS |
| 223,782 | ||||||||||
|
| |||||||||||
Security Description | Shares | Value | ||||||||||
U.S. TREASURY NOTES — 0.5% |
| |||||||||||
North America — 0.5% | ||||||||||||
U.S. Treasury Notes, | ||||||||||||
1.88%, 02/28/27 (b),(l) | 14,535,500 | 13,562,871 | ||||||||||
2.75%, 08/15/32 (b),(l) | 1,680,600 | 1,581,602 | ||||||||||
See Notes to Consolidated Financial Statements.
96
Table of Contents
Blackstone Alternative Multi-Strategy Fund and Subsidiaries
Consolidated Schedule of Investments ^ (Continued)
March 31, 2023
Security Description | Shares | Value | ||||||||||
3.50%, 01/31/28 (b),(l) | 832,900 | $ | 828,540 | |||||||||
3.88%, 12/31/27 (b),(l) | 4,088,900 | 4,131,865 | ||||||||||
4.13%, 11/15/32 (b),(l) | 1,911,000 | 2,008,043 | ||||||||||
|
| |||||||||||
Total North America |
| 22,112,921 | ||||||||||
|
| |||||||||||
TOTAL U.S. TREASURY NOTES |
| 22,112,921 | ||||||||||
|
| |||||||||||
EXCHANGE-TRADED FUNDS — 0.3% |
| |||||||||||
CION Investment Corp. | 2,100 | 20,727 | ||||||||||
Pershing Square Holdings Ltd. | 423,768 | 14,802,961 | ||||||||||
SPDR S&P Biotech ETF (a) | 3,711 | 282,815 | ||||||||||
|
| |||||||||||
TOTAL EXCHANGE-TRADED FUNDS |
| 15,106,503 | ||||||||||
|
| |||||||||||
WARRANTS — 0.0% |
| |||||||||||
Acropolis Infrastructure Acquisition Corp. (a),(b) | 239,443 | 40,945 | ||||||||||
Alpha Partners Technology Merger Corp. (a),(b) | 166,667 | 18,350 | ||||||||||
Anthemis Digital Acquisitions I Corp. (a),(b) | 375,000 | 15,000 | ||||||||||
Apollo Strategic Growth Capital, Class A (a),(b) | 186,352 | 18,188 | ||||||||||
Athena Consumer Acquisition Corp. (a),(b) | 162,343 | 11,932 | ||||||||||
ATI Penny Warrant (a),(b) | 111,184 | 27,796 | ||||||||||
ATI Warrant (a),(b) | 100,595 | 0 | ||||||||||
B Riley Principal 250 Merger Corp. (a),(b) | 82,637 | 5,479 | ||||||||||
Black Mountain Acquisition Corp. (a),(b) | 590,640 | 39,750 | ||||||||||
BlueRiver Acquisition Corp., Class A (a),(b) | 47,634 | 1,786 | ||||||||||
Bullpen Parlay Acquisition Co. (a),(b) | 189,000 | 6,766 | ||||||||||
Compass Digital Acquisition Corp. (a),(b) | 125,006 | 16,263 | ||||||||||
Compute Health Acquisition Corp., A Shares (a),(b) | 121,250 | 48,500 | ||||||||||
Concord Acquisition Corp., Class A (a),(b) | 189,000 | 20,752 | ||||||||||
Corner Growth Acquisition Corp. (a),(b) | 125,000 | 9,375 | ||||||||||
Corsair Partnering Corp., Class A (a),(b) | 52,082 | 8,338 | ||||||||||
Direct Selling Acquisition Corp. (a),(b) | 329,221 | 26,338 | ||||||||||
DP Cap Acquisition Corp., A Shares (a),(b) | 236,250 | 9,450 | ||||||||||
Elliott Opportunity II Corp. (a),(b) | 91,574 | 6,969 | ||||||||||
Enterprise 4.0 Technology Acquisition Corp. (a),(b) | 250,000 | 10,000 | ||||||||||
ExcelFin Acquisition Corp. (a),(b) | 221,078 | 13,021 | ||||||||||
FG Acquisition Corp. (a),(b) | 94,599 | 108,789 | ||||||||||
Forum Merger IV Corp., Class A (a),(b) | 77,500 | 9,688 | ||||||||||
Growth For Good Acquisition Corp. (a),(b) | 189,000 | 18,031 | ||||||||||
Investcorp India Acquisition Corp. (a),(b) | 81,191 | 4,141 | ||||||||||
Jaguar Global Growth Corp. (a),(b) | 107,300 | 10,730 | ||||||||||
Jaws Hurricane Acquisition Corp. (a),(b) | 65,650 | 10,182 | ||||||||||
Jaws Mustang Acquisition Corp., C Shares (a),(b) | 66,487 | 7,227 | ||||||||||
Landcadia Holdings IV, Inc. (a),(b) | 116,250 | 19,123 | ||||||||||
Learn CW Investment Corp., Class A (a),(b) | 199,000 | 4,537 | ||||||||||
See Notes to Consolidated Financial Statements.
97
Table of Contents
Blackstone Alternative Multi-Strategy Fund and Subsidiaries
Consolidated Schedule of Investments ^ (Continued)
March 31, 2023
Security Description | Shares | Value | ||||||||||
LIV Capital Acquisition Corp. (a),(b) | 371,548 | $ | 18,986 | |||||||||
Logistics Innovation Technologies Corp. (a),(b) | 101,972 | 11,227 | ||||||||||
McLaren Racing Ltd. (a),(b),(c) | 22,935 | 246,796 | ||||||||||
Motive Capital Corp. II, A Shares (a),(b) | 200,000 | 31,380 | ||||||||||
Northern Star Investment Corp., Class A (a),(b) | 51,667 | 2,583 | ||||||||||
Northern Star Investment Corp., Class A (a),(b) | 51,664 | 1,860 | ||||||||||
OCA Acquisition Corp., A Shares (a),(b) | 127,824 | 10,226 | ||||||||||
Osiris Acquisition Corp. (a),(b) | 290,880 | 34,993 | ||||||||||
Parabellum Acquisition Corp. (a),(b) | 292,500 | 2,925 | ||||||||||
Phoenix Biotech Acquisition Corp. (a),(b) | 76,900 | 3,845 | ||||||||||
Pivotal Investment Corp. III, A Shares (a),(b) | 60,000 | 3,000 | ||||||||||
Plum Acquisition Corp. I, A Shares (a),(b) | 62,000 | 11,780 | ||||||||||
Pontem Corp., A Shares (a),(b) | 155,000 | 26,613 | ||||||||||
PowerUp Acquisition Corp. (a),(b) | 130,108 | 5,439 | ||||||||||
Rigel Resource Acquisition Corp., A Shares (a),(b) | 289,168 | 38,170 | ||||||||||
Skydeck Acquisition Corp., Class A (a),(b) | 81,300 | 4,065 | ||||||||||
Slam Corp., A Shares (a),(b) | 112,325 | 25,835 | ||||||||||
ST Energy Transition I Ltd. (a),(b) | 521,933 | 88,729 | ||||||||||
Tailwind International Acquisition Corp. (a),(b) | 100,000 | 2,000 | ||||||||||
Thunder Bridge Capital Partners III, Inc., A Shares (a),(b) | 39,640 | 4,761 | ||||||||||
VMG Consumer Acquisition Corp. (a),(b) | 178,201 | 5,364 | ||||||||||
Waverley Capital Acquisition Corp., Class A (a),(b) | 125,000 | 11,738 | ||||||||||
|
| |||||||||||
TOTAL WARRANTS |
| 1,139,761 | ||||||||||
|
| |||||||||||
INVESTMENTS IN INVESTEE FUNDS — 11.8% |
| |||||||||||
Europe — 0.6% |
| |||||||||||
Qube Torus | 1 | 27,526,527 | ||||||||||
|
| |||||||||||
Total Europe |
| 27,526,527 | ||||||||||
|
| |||||||||||
North America — 11.2% |
| |||||||||||
Aeolus Property Catastrophe Keystone PF Fund LP (cost $16,285,187) (a),(o) | 4 | 15,313,810 | ||||||||||
Asgard Fixed Income Risk Premia Fund (cost $151,281,273) (a),(o) | 153,764 | 146,173,102 | ||||||||||
Atreides Co. Series K DIs - SpaceX (Common) (cost $1,762,684) (a),(o) | 1 | 2,132,764 | ||||||||||
Centiva Offshore Fund Ltd. | 1 | 30,893,888 | ||||||||||
Pimco ILS Fund SP II | 6 | 20,360,394 | ||||||||||
Rokos Global Macro Fund Ltd. (cost $93,000,000) (a),(o) | 1 | 99,219,825 | ||||||||||
Ruffer SICAV - Ruffer Total Return International (cost $136,650,000) (a),(b) | 70,080,517 | 136,614,960 | ||||||||||
See Notes to Consolidated Financial Statements.
98
Table of Contents
Blackstone Alternative Multi-Strategy Fund and Subsidiaries
Consolidated Schedule of Investments ^ (Continued)
March 31, 2023
Security Description | Shares | Value | ||||||||||
Statar Capital LLC | 36,730 | $ | 43,688,270 | |||||||||
|
| |||||||||||
Total North America |
| 494,397,013 | ||||||||||
|
| |||||||||||
TOTAL INVESTMENTS IN INVESTEE FUNDS |
| 521,923,540 | ||||||||||
|
| |||||||||||
RIGHTS — 0.0% | ||||||||||||
Growth For Good Acquisition Corp. (a),(b) | 378,000 | 68,040 | ||||||||||
Jaguar Global Growth Corp. (a),(b) | 214,600 | 36,697 | ||||||||||
Pershing Square Tontine Holdings Ltd. (a),(c) | 2,020,101 | 0 | ||||||||||
ROC Energy Acquisition Corp. (a),(b) | 450,707 | 157,747 | ||||||||||
|
| |||||||||||
TOTAL RIGHTS |
| 262,484 | ||||||||||
|
| |||||||||||
TOTAL LONG-TERM INVESTMENTS |
| 4,493,206,096 | ||||||||||
|
| |||||||||||
Security Description | Contracts | Value | ||||||||||
COMMODITIES — 4.4% |
| |||||||||||
California Carbon Allowance Vintage Specific 2021 (a),(b) | 2,366,000 | 70,601,440 | ||||||||||
California Carbon Allowance Vintage Specific 2022 (a),(b) | 1,161,000 | 34,644,240 | ||||||||||
California Carbon Allowance Vintage Specific 2023 (a),(b) | 525,000 | 15,666,000 | ||||||||||
California Carbon Allowance Vintage Specific 2024 (a),(b) | 2,482,000 | 74,236,620 | ||||||||||
California Carbon Allowance Vintage Specific 2025 (a),(b) | 689 | 20,828 | ||||||||||
|
| |||||||||||
TOTAL COMMODITIES |
| 195,169,128 | ||||||||||
|
| |||||||||||
| Strike | Expiration Date | Contracts | Notional Amount | Premium Paid | Market Value | Unrealized Appreciation (Depreciation) | |||||||||||||||||||||||||||||
PURCHASED OPTIONS — 0.8% |
| ||||||||||||||||||||||||||||||||||
Exchange-Traded Call Options — 0.3% |
| ||||||||||||||||||||||||||||||||||
CBOE SPX VOLATILITY INDX JUN 23 | 27.00 USD | 06/21/23 | 4,094 | 4,094 | $ | 1,687,383 | $ | 814,706 | $ | (872,677 | ) | ||||||||||||||||||||||||
CBOE SPX VOLATILITY INDX SEP 23 | 26.00 USD | 09/20/23 | 250 | 250 | 89,632 | 80,000 | (9,632 | ) | |||||||||||||||||||||||||||
See Notes to Consolidated Financial Statements.
99
Table of Contents
Blackstone Alternative Multi-Strategy Fund and Subsidiaries
Consolidated Schedule of Investments ^ (Continued)
March 31, 2023
| Strike | Expiration Date | Contracts | Notional Amount | Premium Paid | Market Value | Unrealized Appreciation (Depreciation) | |||||||||||||||||||||||||||||
CBOE SPX VOLATILITY INDX SEP 23 | 28.00 USD | 09/20/23 | 1,637 | 1,637 | $ | 487,661 | $ | 455,086 | $ | (32,575 | ) | ||||||||||||||||||||||||
COPPER FUTURE 05/01/23 | 403.00 USD | 04/25/23 | 260 | 260 | 756,215 | 825,500 | 69,285 | ||||||||||||||||||||||||||||
COPPER FUTURE 07/20/23 | 440.00 USD | 06/27/23 | 260 | 260 | 751,418 | 617,500 | (133,918 | ) | |||||||||||||||||||||||||||
CRUDE OIL FUT OPT DEC 23 | 85.00 USD | 11/15/23 | 30 | 2,206,500 | 234,045 | 134,400 | (99,645 | ) | |||||||||||||||||||||||||||
CRUDE OIL FUT OPT DEC 23 | 150.00 USD | 11/15/23 | 60 | 4,413,000 | 92,491 | 10,200 | (82,291 | ) | |||||||||||||||||||||||||||
CRUDE OIL FUT OPT DEC23 | 90.00 USD | 11/15/23 | 192 | 14,121,600 | 868,132 | 620,160 | (247,972 | ) | |||||||||||||||||||||||||||
CRUDE OIL FUT OPT JUN23 | 150.00 USD | 05/17/23 | 429 | 32,518,200 | 1,137,502 | 4,290 | (1,133,212 | ) | |||||||||||||||||||||||||||
FTSE 100 INDEX APR 23 | 7,725.00 GBP | 04/21/23 | 410 | 410 | 267,213 | 227,599 | (39,614 | ) | |||||||||||||||||||||||||||
FTSE 100 INDEX APR 23 | 8,000.00 GBP | 04/21/23 | 820 | 820 | 296,826 | 15,173 | (281,653 | ) | |||||||||||||||||||||||||||
FTSE 100 INDEX JUN 23 | 7,800.00 GBP | 06/16/23 | 655 | 655 | 866,258 | 856,489 | (9,769 | ) | |||||||||||||||||||||||||||
NAT GAS EURO OPT APR24 | 5.00 USD | 03/25/24 | 1 | 32,240 | 4,403 | 2,535 | (1,868 | ) | |||||||||||||||||||||||||||
NAT GAS EURO OPT AUG23 | 3.50 USD | 07/26/23 | 42 | 1,168,860 | 202,262 | 80,262 | (122,000 | ) | |||||||||||||||||||||||||||
NAT GAS EURO OPT AUG23 | 5.00 USD | 07/26/23 | 2 | 55,660 | 5,205 | 778 | (4,427 | ) | |||||||||||||||||||||||||||
NAT GAS EURO OPT AUG23 | 8.00 USD | 07/26/23 | 4 | 111,320 | 11,451 | 204 | (11,247 | ) | |||||||||||||||||||||||||||
NAT GAS EURO OPT AUG24 | 5.00 USD | 07/26/24 | 1 | 35,500 | 4,403 | 3,194 | (1,209 | ) | |||||||||||||||||||||||||||
NAT GAS EURO OPT JUL23 | 3.50 USD | 06/27/23 | 2 | 54,640 | 5,805 | 2,840 | (2,965 | ) | |||||||||||||||||||||||||||
NAT GAS EURO OPT JUL23 | 4.50 USD | 06/27/23 | 164 | 4,480,480 | 567,368 | 67,568 | (499,800 | ) | |||||||||||||||||||||||||||
NAT GAS EURO OPT JUL23 | 5.00 USD | 06/27/23 | 2 | 54,640 | 5,205 | 490 | (4,715 | ) | |||||||||||||||||||||||||||
NAT GAS EURO OPT JUL23 | 8.00 USD | 06/27/23 | 4 | 109,280 | 16,411 | 136 | (16,275 | ) | |||||||||||||||||||||||||||
NAT GAS EURO OPT JUL24 | 5.00 USD | 06/25/24 | 1 | 35,150 | 4,403 | 3,001 | (1,402 | ) | |||||||||||||||||||||||||||
NAT GAS EURO OPT JUN23 | 3.50 USD | 05/25/23 | 2 | 49,300 | 38,155 | 1,190 | (36,965 | ) | |||||||||||||||||||||||||||
NAT GAS EURO OPT JUN23 | 4.50 USD | 05/25/23 | 164 | 4,042,600 | 567,368 | 27,060 | (540,308 | ) | |||||||||||||||||||||||||||
NAT GAS EURO OPT JUN23 | 5.00 USD | 05/25/23 | 2 | 49,300 | 5,205 | 200 | (5,005 | ) | |||||||||||||||||||||||||||
NAT GAS EURO OPT JUN23 | 8.00 USD | 05/25/23 | 5 | 123,250 | 20,513 | 60 | (20,453 | ) | |||||||||||||||||||||||||||
See Notes to Consolidated Financial Statements.
100
Table of Contents
Blackstone Alternative Multi-Strategy Fund and Subsidiaries
Consolidated Schedule of Investments ^ (Continued)
March 31, 2023
| Strike | Expiration Date | Contracts | Notional Amount | Premium Paid | Market Value | Unrealized Appreciation (Depreciation) | |||||||||||||||||||||||||||||
NAT GAS EURO OPT JUN24 | 5.00 USD | 05/28/24 | 1 | 33,720 | $ | 4,403 | $ | 2,584 | $ | (1,819 | ) | ||||||||||||||||||||||||
NAT GAS EURO OPT MAY23 | 4.50 USD | 04/25/23 | 164 | 3,634,240 | 567,368 | 6,068 | (561,300 | ) | |||||||||||||||||||||||||||
NAT GAS EURO OPT MAY23 | 5.00 USD | 04/25/23 | 2 | 44,320 | 5,205 | 44 | (5,161 | ) | |||||||||||||||||||||||||||
NAT GAS EURO OPT MAY23 | 8.00 USD | 04/25/23 | 3 | 66,480 | 12,308 | 12 | (12,296 | ) | |||||||||||||||||||||||||||
NAT GAS EURO OPT MAY24 | 5.00 USD | 04/25/24 | 1 | 32,220 | 4,403 | 2,187 | (2,216 | ) | |||||||||||||||||||||||||||
NAT GAS EURO OPT OCT23 | 3.50 USD | 09/26/23 | 2 | 56,940 | 38,155 | 5,642 | (32,513 | ) | |||||||||||||||||||||||||||
NAT GAS EURO OPT OCT23 | 4.50 USD | 09/26/23 | 164 | 4,669,080 | 567,368 | 190,732 | (376,636 | ) | |||||||||||||||||||||||||||
NAT GAS EURO OPT OCT23 | 5.00 USD | 09/26/23 | 202 | 5,750,940 | 275,519 | 157,762 | (117,757 | ) | |||||||||||||||||||||||||||
NAT GAS EURO OPT OCT23 | 8.00 USD | 09/26/23 | 4 | 113,880 | 16,411 | 532 | (15,879 | ) | |||||||||||||||||||||||||||
NAT GAS EURO OPT OCT24 | 5.00 USD | 09/25/24 | 1 | 35,850 | 4,403 | 3,638 | (765 | ) | |||||||||||||||||||||||||||
NAT GAS EURO OPT SEP23 | 3.50 USD | 08/28/23 | 2 | 55,000 | 38,155 | 4,452 | (33,703 | ) | |||||||||||||||||||||||||||
NAT GAS EURO OPT SEP23 | 4.50 USD | 08/28/23 | 164 | 4,510,000 | 567,368 | 135,300 | (432,068 | ) | |||||||||||||||||||||||||||
NAT GAS EURO OPT SEP23 | 5.00 USD | 08/28/23 | 2 | 55,000 | 5,205 | 1,072 | (4,133 | ) | |||||||||||||||||||||||||||
NAT GAS EURO OPT SEP23 | 6.00 USD | 08/28/23 | 1 | 27,500 | 4,803 | 258 | (4,545 | ) | |||||||||||||||||||||||||||
NAT GAS EURO OPT SEP23 | 8.00 USD | 08/28/23 | 3 | 82,500 | 12,308 | 261 | (12,047 | ) | |||||||||||||||||||||||||||
NAT GAS EURO OPT SEP24 | 5.00 USD | 08/27/24 | 1 | 35,090 | 4,403 | 3,221 | (1,182 | ) | |||||||||||||||||||||||||||
NAT GAS EURO OPT APR 23 | 9.50 USD | 04/25/23 | 40 | 886,400 | 28,107 | 80 | (28,027 | ) | |||||||||||||||||||||||||||
NAT GAS EURO OPT APR 23 | 9.50 USD | 05/25/23 | 40 | 986,000 | 28,107 | 240 | (27,867 | ) | |||||||||||||||||||||||||||
NAT GAS EURO OPT APR 23 | 9.50 USD | 06/27/23 | 40 | 1,092,800 | 28,107 | 720 | (27,387 | ) | |||||||||||||||||||||||||||
NAT GAS EURO OPT APR 23 | 9.50 USD | 07/26/23 | 40 | 1,113,200 | 28,107 | 1,160 | (26,947 | ) | |||||||||||||||||||||||||||
NAT GAS EURO OPT APR 23 | 9.50 USD | 08/28/23 | 40 | 1,100,000 | 28,107 | 1,960 | (26,147 | ) | |||||||||||||||||||||||||||
NAT GAS EURO OPT APR 23 | 9.50 USD | 09/26/23 | 40 | 1,138,800 | 28,107 | 3,080 | (25,027 | ) | |||||||||||||||||||||||||||
NAT GAS EURO OPT APR 23 | 10.50 USD | 04/25/23 | 40 | 886,400 | 21,107 | 80 | (21,027 | ) | |||||||||||||||||||||||||||
NAT GAS EURO OPT APR 23 | 10.50 USD | 05/25/23 | 40 | 986,000 | 21,107 | 160 | (20,947 | ) | |||||||||||||||||||||||||||
NAT GAS EURO OPT APR 23 | 10.50 USD | 06/27/23 | 40 | 1,092,800 | 21,107 | 520 | (20,587 | ) | |||||||||||||||||||||||||||
See Notes to Consolidated Financial Statements.
101
Table of Contents
Blackstone Alternative Multi-Strategy Fund and Subsidiaries
Consolidated Schedule of Investments ^ (Continued)
March 31, 2023
| Strike | Expiration Date | Contracts | Notional Amount | Premium Paid | Market Value | Unrealized Appreciation (Depreciation) | |||||||||||||||||||||||||||||
NAT GAS EURO OPT APR 23 | 10.50 USD | 07/26/23 | 40 | 1,113,200 | $ | 21,107 | $ | 840 | $ | (20,267 | ) | ||||||||||||||||||||||||
NAT GAS EURO OPT APR 23 | 10.50 USD | 08/28/23 | 40 | 1,100,000 | 21,107 | 1,480 | (19,627 | ) | |||||||||||||||||||||||||||
NAT GAS EURO OPT APR 23 | 10.50 USD | 09/26/23 | 40 | 1,138,800 | 21,107 | 2,320 | (18,787 | ) | |||||||||||||||||||||||||||
NAT GAS EURO OPT APR25 | 5.00 USD | 03/26/25 | 40 | 1,529,600 | 280,607 | 196,640 | (83,967 | ) | |||||||||||||||||||||||||||
NAT GAS EURO OPT AUG25 | 5.00 USD | 07/28/25 | 40 | 1,644,000 | 280,607 | 216,000 | (64,607 | ) | |||||||||||||||||||||||||||
NAT GAS EURO OPT AUG25 | 5.50 USD | 07/26/23 | 480 | 13,358,400 | 155,281 | 120,960 | (34,321 | ) | |||||||||||||||||||||||||||
NAT GAS EURO OPT DEC25 | 5.00 USD | 11/24/25 | 40 | 1,940,000 | 280,607 | 411,600 | 130,993 | ||||||||||||||||||||||||||||
NAT GAS EURO OPT FEB25 | 5.00 USD | 01/28/25 | 40 | 1,832,400 | 280,607 | 414,200 | 133,593 | ||||||||||||||||||||||||||||
NAT GAS EURO OPT JAN24 | 7.00 USD | 12/26/23 | 120 | 4,706,400 | 384,320 | 326,040 | (58,280 | ) | |||||||||||||||||||||||||||
NAT GAS EURO OPT JAN25 | 5.00 USD | 12/26/24 | 40 | 1,882,400 | 280,607 | 419,280 | 138,673 | ||||||||||||||||||||||||||||
NAT GAS EURO OPT JUL 23 | 8.50 USD | 06/27/23 | 100 | 2,732,000 | 226,267 | 2,700 | (223,567 | ) | |||||||||||||||||||||||||||
NAT GAS EURO OPT JUL25 | 5.00 USD | 06/25/25 | 40 | 1,629,600 | 280,607 | 208,280 | (72,327 | ) | |||||||||||||||||||||||||||
NAT GAS EURO OPT JUN23 | 3.00 USD | 05/25/23 | 220 | 5,423,000 | 268,987 | 290,400 | 21,413 | ||||||||||||||||||||||||||||
NAT GAS EURO OPT JUN25 | 5.00 USD | 05/27/25 | 40 | 1,581,200 | 280,607 | 190,640 | (89,967 | ) | |||||||||||||||||||||||||||
NAT GAS EURO OPT MAR25 | 5.00 USD | 02/25/25 | 40 | 1,692,400 | 280,607 | 355,480 | 74,873 | ||||||||||||||||||||||||||||
NAT GAS EURO OPT MAY 23 | 6.00 USD | 04/25/23 | 1 | 22,160 | 63 | 10 | (53 | ) | |||||||||||||||||||||||||||
NAT GAS EURO OPT MAY23 | 2.75 USD | 04/25/23 | 100 | 2,216,000 | 50,267 | 59,200 | 8,933 | ||||||||||||||||||||||||||||
NAT GAS EURO OPT MAY23 | 3.55 USD | 04/25/23 | 20 | 443,200 | 17,853 | 2,500 | (15,353 | ) | |||||||||||||||||||||||||||
NAT GAS EURO OPT MAY23 | 3.95 USD | 04/25/23 | 20 | 443,200 | 11,253 | 1,420 | (9,833 | ) | |||||||||||||||||||||||||||
NAT GAS EURO OPT MAY25 | 5.00 USD | 04/25/25 | 40 | 1,520,400 | 280,607 | 172,640 | (107,967 | ) | |||||||||||||||||||||||||||
NAT GAS EURO OPT NOV23 | 5.50 USD | 10/26/23 | 18 | 582,840 | 29,608 | 23,796 | (5,812 | ) | |||||||||||||||||||||||||||
NAT GAS EURO OPT NOV25 | 5.00 USD | 10/28/25 | 40 | 1,792,800 | 280,607 | 313,680 | 33,073 | ||||||||||||||||||||||||||||
NAT GAS EURO OPT OCT23 | 4.00 USD | 09/26/23 | 110 | 3,131,700 | 310,194 | 196,790 | (113,404 | ) | |||||||||||||||||||||||||||
NAT GAS EURO OPT OCT23 | 4.25 USD | 09/26/23 | 164 | 4,669,080 | 374,158 | 235,668 | (138,490 | ) | |||||||||||||||||||||||||||
NAT GAS EURO OPT OCT25 | 5.00 USD | 09/25/25 | 40 | 1,661,600 | 280,607 | 233,760 | (46,847 | ) | |||||||||||||||||||||||||||
See Notes to Consolidated Financial Statements.
102
Table of Contents
Blackstone Alternative Multi-Strategy Fund and Subsidiaries
Consolidated Schedule of Investments ^ (Continued)
March 31, 2023
| Strike | Expiration Date | Contracts | Notional Amount | Premium Paid | Market Value | Unrealized Appreciation (Depreciation) | |||||||||||||||||||||||||||||
NAT GAS EURO OPT SEP23 | 4.00 USD | 08/28/23 | 140 | 3,850,000 | $ | 235,174 | $ | 186,620 | $ | (48,554 | ) | ||||||||||||||||||||||||
NAT GAS EURO OPT SEP25 | 5.00 USD | 08/26/25 | 40 | 1,632,000 | 280,607 | 214,000 | (66,607 | ) | |||||||||||||||||||||||||||
PHE 05312023 C3.25 PHE APR23 | 3.25 USD | 04/25/23 | 960 | 5,318,400 | 595,718 | 49,680 | (546,038 | ) | |||||||||||||||||||||||||||
PHE 10312023 C4 SEP23 | 4.00 USD | 09/26/23 | 160 | 1,138,800 | 116,086 | 71,560 | (44,526 | ) | |||||||||||||||||||||||||||
VIX US JUN 23 | 30.00 USD | 06/21/23 | 3,300 | 3,300 | 693,096 | 537,900 | (155,196 | ) | |||||||||||||||||||||||||||
|
|
|
|
|
| ||||||||||||||||||||||||||||||
| $ | 18,251,611 | $ | 10,828,470 | $ | (7,423,141 | ) | |||||||||||||||||||||||||||||
|
|
|
|
|
| ||||||||||||||||||||||||||||||
Exchange-Traded Put Options — 0.2% |
| ||||||||||||||||||||||||||||||||||
CRUDE OIL FUT OPT DEC 23 | 40.00 USD | 11/15/23 | 60 | 4,413,000 | $ | 150,091 | $ | 42,600 | $ | (107,491 | ) | ||||||||||||||||||||||||
NAT GAS EURO OPT APR24 | 2.75 USD | 03/25/24 | 2 | 64,480 | 4,655 | 8,654 | 3,999 | ||||||||||||||||||||||||||||
NAT GAS EURO OPT AUG24 | 2.75 USD | 07/26/24 | 2 | 71,000 | 4,655 | 6,646 | 1,991 | ||||||||||||||||||||||||||||
NAT GAS EURO OPT JUL24 | 2.75 USD | 06/25/24 | 2 | 70,300 | 4,655 | 6,640 | 1,985 | ||||||||||||||||||||||||||||
NAT GAS EURO OPT JUN24 | 2.75 USD | 05/28/24 | 2 | 67,440 | 4,655 | 7,254 | 2,599 | ||||||||||||||||||||||||||||
NAT GAS EURO OPT MAY24 | 2.75 USD | 04/25/24 | 2 | 64,440 | 4,655 | 7,976 | 3,321 | ||||||||||||||||||||||||||||
NAT GAS EURO OPT NOV23 | 2.00 USD | 10/26/23 | 485 | 15,704,300 | 652,245 | 705,190 | 52,945 | ||||||||||||||||||||||||||||
NAT GAS EURO OPT OCT24 | 2.75 USD | 09/25/24 | 2 | 71,700 | 4,655 | 7,046 | 2,391 | ||||||||||||||||||||||||||||
NAT GAS EURO OPT SEP24 | 2.75 USD | 08/27/24 | 2 | 70,180 | 4,655 | 7,074 | 2,419 | ||||||||||||||||||||||||||||
NAT GAS EURO OPT APR 23 | 4.95 USD | 07/26/23 | 20 | 556,600 | 184,054 | 434,740 | 250,686 | ||||||||||||||||||||||||||||
NAT GAS EURO OPT APR 23 | 5.00 USD | 10/26/23 | 40 | 1,295,200 | 414,107 | 757,280 | 343,173 | ||||||||||||||||||||||||||||
NAT GAS EURO OPT APR 23 | 5.00 USD | 11/27/23 | 40 | 1,488,000 | 414,107 | 644,320 | 230,213 | ||||||||||||||||||||||||||||
NAT GAS EURO OPT APR24 | 2.25 USD | 03/25/24 | 20 | 644,800 | 40,253 | 47,380 | 7,127 | ||||||||||||||||||||||||||||
NAT GAS EURO OPT APR25 | 2.50 USD | 03/26/25 | 20 | 764,800 | 48,053 | 45,220 | (2,833 | ) | |||||||||||||||||||||||||||
NAT GAS EURO OPT APR25 | 3.00 USD | 03/26/25 | 20 | 764,800 | 76,054 | 81,340 | 5,286 | ||||||||||||||||||||||||||||
NAT GAS EURO OPT AUG24 | 2.25 USD | 07/26/24 | 20 | 710,000 | 40,253 | 35,400 | (4,853 | ) | |||||||||||||||||||||||||||
NAT GAS EURO OPT AUG25 | 2.50 USD | 07/28/25 | 20 | 822,000 | 48,053 | 31,160 | (16,893 | ) | |||||||||||||||||||||||||||
NAT GAS EURO OPT AUG25 | 3.00 USD | 07/28/25 | 20 | 822,000 | 76,053 | 59,700 | (16,353 | ) | |||||||||||||||||||||||||||
NAT GAS EURO OPT DEC25 | 2.50 USD | 11/24/25 | 20 | 970,000 | 48,053 | 29,920 | (18,133 | ) | |||||||||||||||||||||||||||
See Notes to Consolidated Financial Statements.
103
Table of Contents
Blackstone Alternative Multi-Strategy Fund and Subsidiaries
Consolidated Schedule of Investments ^ (Continued)
March 31, 2023
| Strike | Expiration Date | Contracts | Notional Amount | Premium Paid | Market Value | Unrealized Appreciation (Depreciation) | |||||||||||||||||||||||||||||
NAT GAS EURO OPT DEC25 | 3.00 USD | 11/24/25 | 20 | 970,000 | $ | 76,053 | $ | 53,960 | $ | (22,093 | ) | ||||||||||||||||||||||||
NAT GAS EURO OPT FEB25 | 2.50 USD | 01/28/25 | 20 | 916,200 | 48,053 | 41,720 | (6,333 | ) | |||||||||||||||||||||||||||
NAT GAS EURO OPT FEB25 | 3.00 USD | 01/28/25 | 20 | 916,200 | 76,054 | 73,420 | (2,634 | ) | |||||||||||||||||||||||||||
NAT GAS EURO OPT JAN25 | 2.50 USD | 12/26/24 | 20 | 941,200 | 48,053 | 34,460 | (13,593 | ) | |||||||||||||||||||||||||||
NAT GAS EURO OPT JAN25 | 3.00 USD | 12/26/24 | 20 | 941,200 | 76,054 | 62,820 | (13,234 | ) | |||||||||||||||||||||||||||
NAT GAS EURO OPT JUL24 | 2.25 USD | 06/25/24 | 20 | 703,000 | 40,253 | 35,080 | (5,173 | ) | |||||||||||||||||||||||||||
NAT GAS EURO OPT JUL25 | 2.50 USD | 06/25/25 | 20 | 814,800 | 48,053 | 31,380 | (16,673 | ) | |||||||||||||||||||||||||||
NAT GAS EURO OPT JUL25 | 3.00 USD | 06/25/25 | 20 | 814,800 | 76,054 | 60,340 | (15,714 | ) | |||||||||||||||||||||||||||
NAT GAS EURO OPT JUN23 | 1.80 USD | 05/25/23 | 220 | 5,423,000 | 185,587 | 174,020 | (11,567 | ) | |||||||||||||||||||||||||||
NAT GAS EURO OPT JUN23 | 2.40 USD | 05/25/23 | 100 | 2,465,000 | 308,567 | 277,300 | (31,267 | ) | |||||||||||||||||||||||||||
NAT GAS EURO OPT JUN24 | 2.25 USD | 05/28/24 | 20 | 674,400 | 40,254 | 38,460 | (1,794 | ) | |||||||||||||||||||||||||||
NAT GAS EURO OPT JUN25 | 2.50 USD | 05/27/25 | 20 | 790,600 | 48,053 | 34,440 | (13,613 | ) | |||||||||||||||||||||||||||
NAT GAS EURO OPT JUN25 | 3.00 USD | 05/27/25 | 20 | 790,600 | 76,053 | 65,700 | (10,353 | ) | |||||||||||||||||||||||||||
NAT GAS EURO OPT MAR25 | 2.50 USD | 02/25/25 | 20 | 846,200 | 48,053 | 52,460 | 4,407 | ||||||||||||||||||||||||||||
NAT GAS EURO OPT MAR25 | 3.00 USD | 02/25/25 | 20 | 846,200 | 76,054 | 89,420 | 13,366 | ||||||||||||||||||||||||||||
NAT GAS EURO OPT MAY23 | 1.00 USD | 04/25/23 | 160 | 3,545,600 | 21,247 | 15,680 | (5,567 | ) | |||||||||||||||||||||||||||
NAT GAS EURO OPT MAY23 | 2.00 USD | 04/25/23 | 80 | 1,772,800 | 116,374 | 92,480 | (23,894 | ) | |||||||||||||||||||||||||||
NAT GAS EURO OPT MAY23 | 2.25 USD | 04/25/23 | 90 | 1,994,400 | 180,760 | 203,400 | 22,640 | ||||||||||||||||||||||||||||
NAT GAS EURO OPT MAY23 | 2.35 USD | 04/25/23 | 188 | 4,166,080 | 366,502 | 536,552 | 170,050 | ||||||||||||||||||||||||||||
NAT GAS EURO OPT MAY24 | 2.25 USD | 04/25/24 | 20 | 644,400 | 40,253 | 42,480 | 2,227 | ||||||||||||||||||||||||||||
NAT GAS EURO OPT MAY25 | 2.50 USD | 04/25/25 | 20 | 760,200 | 48,053 | 39,800 | (8,253 | ) | |||||||||||||||||||||||||||
NAT GAS EURO OPT MAY25 | 3.00 USD | 04/25/25 | 20 | 760,200 | 76,054 | 74,240 | (1,814 | ) | |||||||||||||||||||||||||||
NAT GAS EURO OPT NOV25 | 2.50 USD | 10/28/25 | 20 | 896,400 | 48,053 | 30,480 | (17,573 | ) | |||||||||||||||||||||||||||
NAT GAS EURO OPT NOV25 | 3.00 USD | 10/28/25 | 20 | 896,400 | 76,054 | 56,440 | (19,614 | ) | |||||||||||||||||||||||||||
NAT GAS EURO OPT OCT23 | 2.50 USD | 09/26/23 | 40 | 1,138,800 | 114,107 | 141,320 | 27,213 | ||||||||||||||||||||||||||||
See Notes to Consolidated Financial Statements.
104
Table of Contents
Blackstone Alternative Multi-Strategy Fund and Subsidiaries
Consolidated Schedule of Investments ^ (Continued)
March 31, 2023
| Strike | Expiration Date | Contracts | Notional Amount | Premium Paid | Market Value | Unrealized Appreciation (Depreciation) | |||||||||||||||||||||||||||||
NAT GAS EURO OPT OCT23 | 2.75 USD | 09/26/23 | 60 | 1,708,200 | $ | 304,360 | $ | 279,240 | $ | (25,120 | ) | ||||||||||||||||||||||||
NAT GAS EURO OPT OCT23 | 3.00 USD | 09/26/23 | 10 | 284,700 | 60,027 | 59,710 | (317 | ) | |||||||||||||||||||||||||||
NAT GAS EURO OPT OCT24 | 2.25 USD | 09/25/24 | 20 | 717,000 | 40,253 | 38,560 | (1,693 | ) | |||||||||||||||||||||||||||
NAT GAS EURO OPT OCT25 | 2.50 USD | 09/25/25 | 20 | 830,800 | 48,053 | 32,820 | (15,233 | ) | |||||||||||||||||||||||||||
NAT GAS EURO OPT OCT25 | 3.00 USD | 09/25/25 | 20 | 830,800 | 76,053 | 61,740 | (14,313 | ) | |||||||||||||||||||||||||||
NAT GAS EURO OPT SEP23 | 1.00 USD | 08/28/23 | 160 | 4,400,000 | 56,427 | 50,560 | (5,867 | ) | |||||||||||||||||||||||||||
NAT GAS EURO OPT SEP23 | 2.40 USD | 08/28/23 | 220 | 6,050,000 | 626,288 | 683,100 | 56,812 | ||||||||||||||||||||||||||||
NAT GAS EURO OPT SEP24 | 2.25 USD | 08/27/24 | 20 | 701,800 | 40,254 | 38,300 | (1,954 | ) | |||||||||||||||||||||||||||
NAT GAS EURO OPT SEP25 | 2.50 USD | 08/26/25 | 20 | 816,000 | 48,053 | 32,540 | (15,513 | ) | |||||||||||||||||||||||||||
NAT GAS EURO OPT SEP25 | 3.00 USD | 08/26/25 | 20 | 816,000 | 76,053 | 61,880 | (14,173 | ) | |||||||||||||||||||||||||||
PHE 05312023 P0.75 APR23 | 0.75 USD | 04/25/23 | 320 | 1,772,800 | 17,773 | 4,640 | (13,133 | ) | |||||||||||||||||||||||||||
PHE 05312023 P1.25 APR23 | 1.25 USD | 04/25/23 | 320 | 1,772,800 | 27,373 | 13,600 | (13,773 | ) | |||||||||||||||||||||||||||
PHE 06302023 P0.75 MAY23 | 0.75 USD | 05/25/23 | 320 | 1,972,000 | 17,773 | 7,360 | (10,413 | ) | |||||||||||||||||||||||||||
PHE 06302023 P1.25 MAY23 | 1.25 USD | 05/25/23 | 320 | 1,972,000 | 27,373 | 17,680 | (9,693 | ) | |||||||||||||||||||||||||||
PHE 07312023 P0.75 JUN23 | 0.75 USD | 06/27/23 | 320 | 2,185,600 | 17,773 | 5,840 | (11,933 | ) | |||||||||||||||||||||||||||
PHE 07312023 P1.25 JUN23 | 1.25 USD | 06/27/23 | 320 | 2,185,600 | 27,373 | 18,640 | (8,733 | ) | |||||||||||||||||||||||||||
PHE 08312023 P0.75 JUL23 | 0.75 USD | 07/26/23 | 320 | 2,226,400 | 17,773 | 8,560 | (9,213 | ) | |||||||||||||||||||||||||||
PHE 08312023 P1.25 JUL23 | 1.25 USD | 07/26/23 | 320 | 2,226,400 | 27,373 | 24,880 | (2,493 | ) | |||||||||||||||||||||||||||
PHE 09302023 P0.75 AUG23 | 0.75 USD | 08/28/23 | 320 | 2,200,000 | 17,773 | 19,120 | 1,347 | ||||||||||||||||||||||||||||
PHE 09302023 P1.25 AUG23 | 1.25 USD | 08/28/23 | 320 | 2,200,000 | 27,373 | 38,000 | 10,627 | ||||||||||||||||||||||||||||
PHE 10312023 P0.75 SEP23 | 0.75 USD | 09/26/23 | 320 | 2,277,600 | 17,773 | 12,480 | (5,293 | ) | |||||||||||||||||||||||||||
PHE 10312023 P1.25 SEP23 | 1.25 USD | 09/26/23 | 320 | 2,277,600 | 27,373 | 46,320 | 18,947 | ||||||||||||||||||||||||||||
|
|
|
|
|
| ||||||||||||||||||||||||||||||
| $ | 6,229,363 | $ | 6,878,962 | $ | 649,599 | ||||||||||||||||||||||||||||||
|
|
|
|
|
| ||||||||||||||||||||||||||||||
See Notes to Consolidated Financial Statements.
105
Table of Contents
Blackstone Alternative Multi-Strategy Fund and Subsidiaries
Consolidated Schedule of Investments ^ (Continued)
March 31, 2023
Counterparty | Strike | Expiration Date | Contracts | Notional Amount | Premium Paid | Market Value | Unrealized Appreciation (Depreciation) | |||||||||||||||||||||||
OTC Call Options — 0.2% |
| |||||||||||||||||||||||||||||
Cap Call 0.5 Jan24 | Morgan Stanley Capital Services LLC | 1 USD | 01/10/24 | 2,930,400,000 | 2,930,400,000 | $ | 3,080,000 | $ | 2,864,905 | $ | (215,095 | ) | ||||||||||||||||||
CDX IG39 Call 65 5/17/23 | Barclays Bank PLC | 65 USD | 05/17/23 | 68,190,000 | 68,190,000 | 110,809 | 41,042 | (69,767 | ) | |||||||||||||||||||||
Dual Digital Option iShares China Large-Cap ETF 37.1142 Crude oil 93.62 | Citi Bank N.A. | 37 USD | 06/14/23 | 11,440,000 | 11,440,000 | 1,144,000 | 105,317 | (1,038,683 | ) | |||||||||||||||||||||
EUR CHF FX Option Call 0.975 6/15/23 | Citi Bank N.A. | 1 EUR | 06/15/23 | 1,312,000 | 1,312,000 | 307,679 | 1,032,848 | 725,169 | ||||||||||||||||||||||
iShares China Large-Cap ETF Call 35 8/18/23 | Bank of America N.A. | 35 USD | 08/18/23 | 1,463,040 | 1,463,040 | 1,521,562 | 795,737 | (725,825 | ) | |||||||||||||||||||||
iShares China Large-Cap ETF Call 39 12/15/23 | Goldman Sachs & Co. LLC | 39 USD | 12/15/23 | 1,146,566 | 1,146,566 | 1,868,902 | 554,073 | (1,314,829 | ) | |||||||||||||||||||||
LME Copper 3M Call | Morgan Stanley & Co. LLC | 16,500 USD | 12/04/24 | 7,500 | 7,500 | 2,430,000 | 613,521 | (1,816,479 | ) | |||||||||||||||||||||
LME Nickel 3M Call | Morgan Stanley & Co. LLC | 40,000 USD | 12/04/24 | 1,260 | 1,260 | 2,431,800 | 1,824,155 | (607,645 | ) | |||||||||||||||||||||
Russell 2000 Index Call 3 12/15/23 | Bank of America N.A. | 3 USD | 12/15/23 | 69,520,000 | 69,520,000 | 2,120,360 | 266,887 | (1,853,473 | ) | |||||||||||||||||||||
Russell 2000 Index Call 3 7/21/23 | Citi Bank N.A. | 3 USD | 07/21/23 | 79,999,999 | 79,999,999 | 2,200,000 | 40,480 | (2,159,520 | ) | |||||||||||||||||||||
USD TRY FX Option Call 20.05 4/5/23 | Citi Bank N.A. | 20 USD | 04/05/23 | 26,000,000 | 26,000,000 | 645,710 | 17,086 | (628,624 | ) | |||||||||||||||||||||
USD ZAR FX Option Call 20 5/30/23 | Goldman Sachs & Co. LLC | 20 USD | 05/30/23 | 65,600,000 | 65,600,000 | 647,800 | 163,587 | (484,213 | ) | |||||||||||||||||||||
USD ZAR FX Option Call 20.5 4/28/23 | Citi Bank N.A. | 21 USD | 04/28/23 | 65,600,000 | 65,600,000 | 195,816 | 11,528 | (184,288 | ) | |||||||||||||||||||||
XPD USD FX Option Call 1800 5/17/23 | JPMorgan Chase Bank, N.A. | 1,800 USD | 05/17/23 | 6,600 | 6,600 | 244,200 | 110,821 | (133,379 | ) | |||||||||||||||||||||
|
|
|
|
|
| |||||||||||||||||||||||||
| $ | 18,948,638 | $ | 8,441,987 | $ | (10,506,651 | ) | ||||||||||||||||||||||||
|
|
|
|
|
| |||||||||||||||||||||||||
See Notes to Consolidated Financial Statements.
106
Table of Contents
Blackstone Alternative Multi-Strategy Fund and Subsidiaries
Consolidated Schedule of Investments ^ (Continued)
March 31, 2023
Counterparty | Strike | Expiration Date | Contracts | Notional Amount | Premium Paid | Market Value | Unrealized Appreciation (Depreciation) | |||||||||||||||||||||||
OTC Put Options — 0.1% |
| |||||||||||||||||||||||||||||
Buy Euro Digital Put USD Call JPY at 123 Jun23 | Deutsche Bank AG | 123 USD | 06/16/23 | 2,200,000 | 2,200,000 | $ | 217,800 | $ | 249,693 | $ | 31,893 | |||||||||||||||||||
Buy Euro Digital Put USD Call JPY at 123 Jun23 | Bank of America N.A. | 123 USD | 06/16/23 | 2,200,000 | 2,200,000 | 216,700 | 249,693 | 32,993 | ||||||||||||||||||||||
DJ EURO STOXX 50 06/16/23 3788.38P | JPMorgan Chase N.A. | 3,788 EUR | 06/16/23 | 17,450 | 17,450 | 398,004 | 273,147 | (124,857 | ) | |||||||||||||||||||||
EO-USDBRL(USD) 04/03/23 5.1P | JPMorgan Chase Bank, N.A. | 5 USD | 04/03/23 | 65,000,000 | 65,000,000 | 922,350 | 562,503 | (359,847 | ) | |||||||||||||||||||||
FTSE 100 INDEX SEP 23 6700P KO | JPMorgan Chase N.A. | 6,700 GBP | 09/15/23 | 4,370 | 4,370 | 176,812 | 104,928 | (71,884 | ) | |||||||||||||||||||||
Interest Rate Swaption 1Y by 1Y EU 12/20/2023 to Pay Fixed 5% Receive SOFR 1Y BISL Adjst RFR | Barclays Bank PLC | 5 USD | 12/20/23 | 1,999,976,000 | 195,637,652,320 | 2,199,974 | 2,372,572 | 172,598 | ||||||||||||||||||||||
SPX DUAL DIGITAL BARRIER 07/21/23 3804.18P SPDR GO | Goldman Sachs & Co. LLC | 3,804 USD | 07/21/23 | 656,000 | 656,000 | 64,944 | 59,040 | (5,904 | ) | |||||||||||||||||||||
SX5E DUAL DIGITAL BARRIER 06/16/23 3835P | JPMorgan Chase Bank, N.A. | 3,835 EUR | 06/16/23 | 1,600,000 | 1,600,000 | 97,957 | 39,180 | (58,777 | ) | |||||||||||||||||||||
USD BRL FX Option Put 4.9 4/3/23 | Citi Bank N.A. | 5 USD | 04/03/23 | 65,000,000 | 65,000,000 | 1,950 | 2,117 | 167 | ||||||||||||||||||||||
USD JPY Digital FX Option Put at 114.25 12/20/23 | Bank of America N.A. | 114 USD | 12/20/23 | 6,160,000 | 6,160,000 | 609,224 | 609,729 | 505 | ||||||||||||||||||||||
USD JPY Digital FX Option Put at 120 7/20/23 | Bank of America N.A. | 120 USD | 07/20/23 | 6,160,000 | 6,160,000 | 1,207,360 | 589,032 | (618,328 | ) | |||||||||||||||||||||
USD JPY FX Option Put 122 6/21/23 | Goldman Sachs & Co. LLC | 122 USD | 06/21/23 | 1,650,000 | 1,650,000 | — | 159,563 | 159,563 | ||||||||||||||||||||||
USD THB FX Option Put 32.5 5/29/23 | Citi Bank N.A. | 33 USD | 05/29/23 | 1,319,999 | 1,319,999 | 83,160 | 134,440 | 51,280 | ||||||||||||||||||||||
USD TRY FX Option Put 20.05 4/5/23 | Citi Bank N.A. | 20 USD | 04/05/23 | 26,000,000 | 26,000,000 | 645,710 | 997,038 | 351,328 | ||||||||||||||||||||||
|
|
|
|
|
| |||||||||||||||||||||||||
| $ | 6,841,945 | $ | 6,402,675 | $ | (439,270 | ) | ||||||||||||||||||||||||
|
|
|
|
|
| |||||||||||||||||||||||||
Total Purchased Options Outstanding |
| $ | 50,271,557 | $ | 32,552,094 | $ | (17,719,463 | ) | ||||||||||||||||||||||
|
|
|
|
|
| |||||||||||||||||||||||||
See Notes to Consolidated Financial Statements.
107
Table of Contents
Blackstone Alternative Multi-Strategy Fund and Subsidiaries
Consolidated Schedule of Investments ^ (Continued)
March 31, 2023
Security Description | Shares | Value | ||||||||||
REPURCHASE AGREEMENTS (p) — 2.8% |
| |||||||||||
Barclays Capital, Inc., 4.05%, dated 08/16/2022, due On Demand (collateralized by Turkey Government Bond, 7.38% due 02/05/2025, market value $1,367,867) (q) | 1,361,100 | $ | 1,361,100 | |||||||||
Barclays Capital, Inc., 3.00%, dated 07/15/2022, due On Demand (collateralized by Industrial and Commercial Bank of China Limited Bond, 3.20% due 03/24/2170, market value $1,925,165) (q) | 2,004,128 | 2,004,128 | ||||||||||
Barclays Capital, Inc., 1.75%, dated 07/22/2022, due On Demand (collateralized by Egypt International Bond, 5.88% due 06/11/2025, market value $1,630,980) (q) | 1,663,862 | 1,663,862 | ||||||||||
Barclays Capital, Inc., 2.25%, dated 10/04/2022, due On Demand (collateralized by People’s Republic of China, 1.20% due 10/21/2030, market value $844,242) (q) | 857,269 | 857,269 | ||||||||||
Barclays Capital, Inc., 4.05%, dated 06/24/2022, due On Demand (collateralized by Turkey Government Bond, 7.38% due 02/05/2025, market value $5,003,485) (q) | 5,035,820 | 5,035,820 | ||||||||||
Barclays Capital, Inc., 3.50%, dated 07/27/2022, due On Demand (collateralized by Indonesian International Bond, 5.35% due 02/11/2049, market value $2,747,199) (q) | 2,890,633 | 2,890,633 | ||||||||||
Barclays Capital, Inc., 4.60%, dated 06/23/2022, due On Demand (collateralized by Bahrain International Bond, 7.00% due 10/12/2028, market value $4,280,171) (q) | 4,444,714 | 4,444,714 | ||||||||||
Barclays Capital, Inc., 4.50%, dated 09/07/2022, due On Demand (collateralized by Peru International Bond, 8.75% due 11/21/2033, market value $3,520,294) (q) | 3,739,500 | 3,739,500 | ||||||||||
Barclays Capital, Inc., 4.05%, dated 02/08/2023, due On Demand (collateralized by Turkey Government Bond, 7.38% due 02/05/2025, market value $1,104,314) (q) | 1,124,277 | 1,124,277 | ||||||||||
Barclays Capital, Inc., 2.75%, dated 01/30/2023, due On Demand (collateralized by Alibaba Group Holding Limited, 2.13% due 02/09/2031, market value $296,224) (q) | 307,752 | 307,752 | ||||||||||
Barclays Capital, Inc., 2.75%, dated 01/31/2023, due On Demand (collateralized by Alibaba Group Holding Limited, 2.13% due 02/09/2031, market value $1,380,999) (q) | 1,430,266 | 1,430,266 | ||||||||||
See Notes to Consolidated Financial Statements.
108
Table of Contents
Blackstone Alternative Multi-Strategy Fund and Subsidiaries
Consolidated Schedule of Investments ^ (Continued)
March 31, 2023
Security Description | Shares | Value | ||||||||
Barclays Capital, Inc., 2.75%, dated 02/01/2023, due On Demand (collateralized by Alibaba Group Holding Limited, 2.13% due 02/09/2031, market value $1,004,513) (q) | 1,042,315 | $ | 1,042,315 | |||||||
Barclays Capital, Inc., 2.25%, dated 07/06/2022, due On Demand (collateralized by Turkey Government Bond, 7.25% due 12/23/2023, market value $2,166,125) (q) | 2,176,632 | 2,176,632 | ||||||||
Barclays Capital, Inc., 4.50%, dated 11/10/2022, due On Demand (collateralized by Peru International Bond, 6.55% due 03/14/2037, market value $199,785) (q) | 193,576 | 193,576 | ||||||||
Barclays Capital, Inc., 4.00%, dated 02/03/2023, due On Demand (collateralized by Petroleos Mexicanos Bond, 10.00% due 02/07/2033, market value $7,330,944) (q) | 7,898,709 | 7,898,709 | ||||||||
Barclays Capital, Inc., 4.45%, dated 01/04/2023, due On Demand (collateralized by Peru International Bond, 5.63% due 11/18/2050, market value $478,549) (q) | 490,329 | 490,329 | ||||||||
Barclays Capital, Inc., 4.45%, dated 01/05/2023, due On Demand (collateralized by Peru International Bond, 5.63% due 11/18/2050, market value $1,983,566) (q) | 2,032,393 | 2,032,393 | ||||||||
Barclays Capital, Inc., 4.45%, dated 01/10/2023, due On Demand (collateralized by Peru International Bond, 5.63% due 11/18/2050, market value $484,581) (q) | 503,520 | 503,520 | ||||||||
Barclays Capital, Inc., 4.45%, dated 01/31/2023, due On Demand (collateralized by Alibaba Group Holding Limited, 3.40% due 12/06/2027, market value $428,147) (q) | 440,264 | 440,264 | ||||||||
Barclays Capital, Inc., 4.50%, dated 01/04/2023, due On Demand (collateralized by Peru International Bond, 3.00% due 01/15/2034, market value $370,832) (q) | 377,638 | 377,638 | ||||||||
Barclays Capital, Inc., 4.50%, dated 01/06/2023, due On Demand (collateralized by Indonesian International Bond, 4.45% due 04/15/2070, market value $392,995) (q) | 390,495 | 390,495 | ||||||||
Barclays Capital, Inc., 4.50%, dated 01/10/2023, due On Demand (collateralized by Alibaba Group Holding Limited, 3.40% due 12/06/2027, market value $2,146,396) (q) | 2,206,051 | 2,206,051 | ||||||||
See Notes to Consolidated Financial Statements.
109
Table of Contents
Blackstone Alternative Multi-Strategy Fund and Subsidiaries
Consolidated Schedule of Investments ^ (Continued)
March 31, 2023
Security Description | Shares | Value | ||||||||
Barclays Capital, Inc., 4.50%, dated 01/13/2023, due On Demand (collateralized by Alibaba Group Holding Limited, 3.40% due 12/06/2027, market value $1,001,526) (q) | 1,036,490 | $ | 1,036,490 | |||||||
Barclays Capital, Inc., 4.50%, dated 01/27/2023, due On Demand (collateralized by Brazilian International Bond, 8.25% due 01/20/2034, market value $3,255,360) (q) | 3,365,070 | 3,365,070 | ||||||||
Barclays Capital, Inc., 4.50%, dated 12/22/2022, due On Demand (collateralized by Peru International Bond, 3.00% due 01/15/2034, market value $2,757,198) (q) | 2,835,330 | 2,835,330 | ||||||||
Barclays Capital, Inc., 4.50%, dated 12/29/2022, due On Demand (collateralized by Peru International Bond, 5.63% due 11/18/2050, market value $1,198,384) (q) | 1,229,591 | 1,229,591 | ||||||||
Barclays Capital, Inc., 4.60%, dated 12/29/2022, due On Demand (collateralized by Bahrain International Bond, 7.38% due 05/14/2030, market value $1,855,924) (q) | 1,900,035 | 1,900,035 | ||||||||
Barclays Capital, Inc., 4.45%, dated 03/10/2023, due On Demand (collateralized by Bahrain International Bond, 5.25% due 01/25/2033, market value $3,745,049) (q) | 3,851,567 | 3,851,567 | ||||||||
Barclays Capital, Inc., 4.50%, dated 02/02/2023, due On Demand (collateralized by Colombian International Bond, 5.63% due 02/26/2044, market value $1,418,359) (q) | 1,557,917 | 1,557,917 | ||||||||
Barclays Capital, Inc., 4.50%, dated 02/08/2023, due On Demand (collateralized by Indonesian International Bond, 5.25% due 01/08/2047, market value $682,995) (q) | 712,869 | 712,869 | ||||||||
Barclays Capital, Inc., 4.50%, dated 03/22/2023, due On Demand (collateralized by Peru International Bond, 3.00% due 01/15/2034, market value $2,510,248) (q) | 2,577,892 | 2,577,892 | ||||||||
Citigroup Global Markets Limited, 1.25%, dated 01/11/2023, due On Demand (collateralized by Egypt International Bond, 5.88% due 06/11/2025, market value $3,373,682) (q) | 4,090,700 | 4,090,700 | ||||||||
Citigroup Global Markets Limited, 2.25%, dated 01/11/2023, due On Demand (collateralized by Turkey Government Bond, 7.38% due 02/05/2025, market value $2,505,250) (q) | 2,697,996 | 2,697,996 | ||||||||
See Notes to Consolidated Financial Statements.
110
Table of Contents
Blackstone Alternative Multi-Strategy Fund and Subsidiaries
Consolidated Schedule of Investments ^ (Continued)
March 31, 2023
Security Description | Shares | Value | ||||||||
JPMorgan Chase Bank, N.A., 2.00%, dated 02/08/2023, due 04/28/2023 (collateralized by Turkey Government Bond, 7.25% due 12/23/2023, market value $2,382,738) | 2,512,463 | $ | 2,512,463 | |||||||
JPMorgan Chase Bank, N.A., 3.00%, dated 01/04/2023, due 04/28/2023 (collateralized by Bank of China Bond, 3.60% Perpetual Maturity, market value $3,470,760) | 3,757,131 | 3,757,131 | ||||||||
JPMorgan Chase Bank, N.A., 2.25%, dated 01/04/2023, due 04/28/2023 (collateralized by Alibaba Group Holding Limited, 2.13% due 02/09/2031, market value $1,837,746) | 1,880,965 | 1,880,965 | ||||||||
JPMorgan Chase Bank, N.A., 3.50%, dated 01/04/2023, due 04/28/2023 (collateralized by Industrial and Commercial Bank of China Limited Bond, 3.20% Perpetual Maturity, market value $10,042,835) | 10,651,460 | 10,651,460 | ||||||||
JPMorgan Chase Bank, N.A., 1.75%, dated 01/03/2023, 04/28/2023 (collateralized by China International Bond, 2.13% due 12/03/2029, market value $4,525,545) | 4,720,054 | 4,720,054 | ||||||||
JPMorgan Chase Bank, N.A., 3.75%, dated 01/04/2023, due 04/28/2023 (collateralized by Tencent Holdings Bond, 1.81% due 01/26/2026, market value $1,704,601) | 1,808,681 | 1,808,681 | ||||||||
JPMorgan Chase Bank, N.A., 3.50%, dated 02/10/2023, due 04/28/2023 (collateralized by Petroleos Mexicanos Bond, 10.00% due 02/07/2033, market value $1,118,621) | 1,210,850 | 1,210,850 | ||||||||
JPMorgan Chase Bank, N.A., 4.00%, dated 01/04/2023, due 04/17/2023 (collateralized by Bahrain International Bond, 5.45% due 09/16/2032, market value $3,180,907) | 3,411,689 | 3,411,689 | ||||||||
JPMorgan Chase Bank, N.A., 4.00%, dated 01/04/2023, due 04/28/2023 (collateralized by Tencent Holdings Bond, 3.28% due 04/11/2024, market value $4,485,448) | 4,716,429 | 4,716,429 | ||||||||
JPMorgan Chase Bank, N.A., 4.20%, dated 01/19/2023, due 04/28/2023 (collateralized by Alibaba Group Holding Limited, 3.40% due 12/06/2027, market value $1,002,469) | 1,064,837 | 1,064,837 | ||||||||
JPMorgan Chase Bank, N.A., 4.20%, dated 01/30/2023, due 04/28/2023 (collateralized by Alibaba Group Holding Limited, 3.40% due 12/06/2027, market value $858,181) | 903,348 | 903,348 | ||||||||
See Notes to Consolidated Financial Statements.
111
Table of Contents
Blackstone Alternative Multi-Strategy Fund and Subsidiaries
Consolidated Schedule of Investments ^ (Continued)
March 31, 2023
Security Description | Shares | Value | ||||||||
JPMorgan Chase Bank, N.A., 4.20%, dated 02/01/2023, due 04/28/2023 (collateralized by Colombian International Bond, 5.63% due 02/26/2044, market value $830,774) | 912,306 | $ | 912,306 | |||||||
JPMorgan Chase Bank, N.A., 4.15%, dated 02/09/2023, due 04/28/2023 (collateralized by Colombian International Bond, 5.63% due 02/26/2044, market value $1,329,239) | 1,456,455 | 1,456,455 | ||||||||
JPMorgan Chase Bank, N.A., 4.50%, dated 01/04/2023, due 04/17/2023 (collateralized by Bahrain International Bond, 5.63% due 09/30/2031, market value $1,845,240) | 1,968,750 | 1,968,750 | ||||||||
JPMorgan Chase Bank, N.A., 4.50%, dated 01/04/2023, due 04/28/2023 (collateralized by Brazilian International Bond, 5.63% due 02/21/2047, market value $2,577,892) | 2,661,178 | 2,661,178 | ||||||||
JPMorgan Chase Bank, N.A., 4.50%, dated 01/24/2023, due 04/28/2023 (collateralized by Brazilian International Bond, 3.88% due 06/12/2030, market value $679,358) | 717,756 | 717,756 | ||||||||
JPMorgan Chase Bank, N.A., 4.50%, dated 01/25/2023, due 04/28/2023 (collateralized by Brazilian International Bond, 3.88% due 06/12/2030, market value $3,395,000) | 3,581,343 | 3,581,343 | ||||||||
JPMorgan Chase Bank, N.A., 4.50%, dated 01/26/2023, due 04/28/2023 (collateralized by Brazilian International Bond, 3.88% due 06/12/2030, market value $1,357,821) | 1,425,352 | 1,425,352 | ||||||||
JPMorgan Chase Bank, N.A., 4.65%, dated 01/04/2023, due 04/28/2023 (collateralized by Brazilian International Bond, 5.00% due 01/27/2045, market value $649,067) | 674,780 | 674,780 | ||||||||
JPMorgan Chase Bank, N.A., 4.50%, dated 03/29/2023, due 04/28/2023 (collateralized by Bahrain International Bond, 7.50% due 09/30/2047, market value $635,381) | 671,468 | 671,468 | ||||||||
JPMorgan Chase Bank, N.A., 4.76%, dated 03/29/2023, due 04/05/2023 (collateralized by US Treasury Notes, 3.00% due 08/15/2052, market value $2,520,062) | 2,494,044 | 2,494,044 | ||||||||
See Notes to Consolidated Financial Statements.
112
Table of Contents
Blackstone Alternative Multi-Strategy Fund and Subsidiaries
Consolidated Schedule of Investments ^ (Continued)
March 31, 2023
Security Description | Shares | Value | ||||||||||
JPMorgan Chase Bank, N.A., 4.77%, dated 03/29/2023, due 04/05/2023 (collateralized by US Treasury Notes, 2.88% due 05/15/2052, market value $1,847,470) | 1,844,537 | $ | 1,844,537 | |||||||||
|
|
|
| |||||||||
TOTAL REPURCHASE AGREEMENTS | 123,512,576 | $ | 123,512,576 | |||||||||
|
|
|
| |||||||||
TOTAL INVESTMENTS IN SECURITIES — 109.4% |
| 4,844,439,894 | ||||||||||
|
| |||||||||||
TOTAL SECURITIES SOLD SHORT — (27.3)% |
| (1,207,819,941 | ) | |||||||||
|
| |||||||||||
Other Assets (r) — 17.9% |
| 793,527,105 | ||||||||||
|
| |||||||||||
Net Assets — 100.0% |
| $ | 4,430,147,058 | |||||||||
|
| |||||||||||
SECURITIES SOLD SHORT — (27.3)% |
| |||||||||||
COMMON STOCK — (11.3)% |
| |||||||||||
Africa — (0.0)% |
| |||||||||||
Industrial Services — (0.0)% |
| |||||||||||
IHS Holding Ltd. (a) | 2,100 | $ | (18,396 | ) | ||||||||
|
| |||||||||||
Materials — (0.0)% |
| |||||||||||
Caledonia Mining Corp. PLC | 200 | (3,040 | ) | |||||||||
Platinum Group Metals Ltd. (a) | 1,100 | (1,573 | ) | |||||||||
|
| |||||||||||
| (4,613 | ) | |||||||||||
|
| |||||||||||
Software & Technology Services — (0.0)% |
| |||||||||||
Lesaka Technologies, Inc. (a) | 800 | (3,840 | ) | |||||||||
|
| |||||||||||
Total Africa |
| (26,849 | ) | |||||||||
|
| |||||||||||
Asia — (0.7)% |
| |||||||||||
Banking — (0.1)% |
| |||||||||||
HDFC Bank Ltd., ADR | 20,900 | (1,393,403 | ) | |||||||||
KB Financial Group, Inc., ADR | 4,000 | (145,680 | ) | |||||||||
Mitsubishi UFJ Financial Group, Inc., ADR | 93,300 | (596,187 | ) | |||||||||
Shinhan Financial Group Co., Ltd., ADR | 2,600 | (70,044 | ) | |||||||||
Sumitomo Mitsui Financial Group, Inc., ADR | 55,600 | (444,800 | ) | |||||||||
|
| |||||||||||
| (2,650,114 | ) | |||||||||||
|
| |||||||||||
Consumer Discretionary Products — (0.0)% |
| |||||||||||
Ezgo Technologies Ltd. (a) | 800 | (1,432 | ) | |||||||||
Gogoro, Inc. (a) | 4,600 | (18,630 | ) | |||||||||
Polestar Automotive Holding UK PLC, Class A ADR (a) | 400 | (1,516 | ) | |||||||||
See Notes to Consolidated Financial Statements.
113
Table of Contents
Blackstone Alternative Multi-Strategy Fund and Subsidiaries
Consolidated Schedule of Investments ^ (Continued)
March 31, 2023
Security Description | Shares | Value | ||||||||
Toyota Motor Corp., ADR | 3,300 | $ | (467,577 | ) | ||||||
|
| |||||||||
| (489,155 | ) | |||||||||
|
| |||||||||
Consumer Discretionary Services — (0.1)% |
| |||||||||
51 Talk Online Education Group, ADR (a) | 50 | (343 | ) | |||||||
China Liberal Education Holdings Ltd. (a) | 700 | (424 | ) | |||||||
H World Group Ltd., ADR (a) | 20,900 | (1,023,682 | ) | |||||||
Meta Data Ltd., ADR (a) | 500 | (524 | ) | |||||||
Meten Holding Group Ltd. (a) | 1,620 | (356 | ) | |||||||
Skillful Craftsman Education Technology Ltd. (a) | 800 | (1,528 | ) | |||||||
Tarena International, Inc., ADR (a) | 133 | (436 | ) | |||||||
Yum China Holdings, Inc. | 21,800 | (1,381,902 | ) | |||||||
|
| |||||||||
| (2,409,195 | ) | |||||||||
|
| |||||||||
Consumer Staple Products — (0.0)% | ||||||||||
Farmmi, Inc. (a) | 5,656 | (2,566 | ) | |||||||
RLX Technology, Inc., ADR (a) | 25,800 | (74,820 | ) | |||||||
TDH Holdings, Inc. (a) | 760 | (950 | ) | |||||||
|
| |||||||||
| (78,336 | ) | |||||||||
|
| |||||||||
Financial Services — (0.0)% | ||||||||||
360 DigiTech, Inc., ADR | 5,500 | (106,700 | ) | |||||||
Bit Digital, Inc. (a) | 26,400 | (40,656 | ) | |||||||
Jianpu Technology, Inc., ADR (a) | 400 | (616 | ) | |||||||
Lufax Holding Ltd., ADR | 39,600 | (80,784 | ) | |||||||
Nomura Holdings, Inc., ADR | 500 | (1,900 | ) | |||||||
ORIX Corp., ADR | 100 | (8,208 | ) | |||||||
Qudian, Inc., ADR (a) | 10,000 | (12,000 | ) | |||||||
SOS Ltd., ADR (a) | 1,904 | (7,883 | ) | |||||||
Up Fintech Holding Ltd., ADR (a) | 1,400 | (4,662 | ) | |||||||
X Financial, ADR (a) | 200 | (624 | ) | |||||||
|
| |||||||||
| (264,033 | ) | |||||||||
|
| |||||||||
Health Care — (0.0)% | ||||||||||
Aesthetic Medical International Holdings Group Ltd., ADR (a) | 300 | (378 | ) | |||||||
Anpac Bio-Medical Science Co., Ltd., ADR (a) | 495 | (2,178 | ) | |||||||
BeiGene Ltd., ADR (a) | 3,700 | (797,461 | ) | |||||||
Burning Rock Biotech Ltd., ADR (a) | 3,000 | (8,430 | ) | |||||||
Connect Biopharma Holdings Ltd., ADR (a) | 1,200 | (1,200 | ) | |||||||
Hutchmed China Ltd., ADR (a) | 1,000 | (13,020 | ) | |||||||
MEDIROM Healthcare Technologies, Inc., ADR (a) | 100 | (629 | ) | |||||||
Qilian International Holding Group Ltd. | 300 | (387 | ) | |||||||
Scilex Holding Co. (a) | 11,154 | (91,463 | ) | |||||||
Zai Lab Ltd., ADR (a) | 900 | (29,934 | ) | |||||||
|
| |||||||||
| (945,080 | ) | |||||||||
|
| |||||||||
See Notes to Consolidated Financial Statements.
114
Table of Contents
Blackstone Alternative Multi-Strategy Fund and Subsidiaries
Consolidated Schedule of Investments ^ (Continued)
March 31, 2023
Security Description | Shares | Value | ||||||||
Industrial Products — (0.0)% | ||||||||||
Asia Pacific Wire & Cable Corp., Ltd. (a) | 40 | $ | (59 | ) | ||||||
|
| |||||||||
Industrial Services — (0.0)% | ||||||||||
BEST, Inc., ADR (a) | 3,660 | (2,891 | ) | |||||||
EHang Holdings Ltd., ADR (a) | 11,300 | (123,509 | ) | |||||||
Full Truck Alliance Co., Ltd., ADR (a) | 111,400 | (847,754 | ) | |||||||
Grindrod Shipping Holdings Ltd. | 700 | (7,364 | ) | |||||||
Guardforce AI Co., Ltd. (a) | 300 | (2,124 | ) | |||||||
MingZhu Logistics Holdings Ltd. (a) | 2,259 | (2,621 | ) | |||||||
Pop Culture Group Co., Ltd., Class A (a) | 600 | (480 | ) | |||||||
|
| |||||||||
| (986,743 | ) | |||||||||
|
| |||||||||
Insurance — (0.0)% | ||||||||||
Huize Holding Ltd., ADR (a) | 700 | (910 | ) | |||||||
Prudential PLC, ADR | 200 | (5,468 | ) | |||||||
TIAN RUIXIANG Holdings Ltd., Class A (a) | 240 | (264 | ) | |||||||
|
| |||||||||
| (6,642 | ) | |||||||||
|
| |||||||||
Materials — (0.0)% | ||||||||||
Ikonics Corp. (a),(c) | 100 | 0 | ||||||||
Origin Agritech Ltd. (a) | 300 | (1,776 | ) | |||||||
POSCO Holdings, Inc., ADR | 1,400 | (97,566 | ) | |||||||
Tantech Holdings Ltd. (a) | 387 | (743 | ) | |||||||
ZK International Group Co., Ltd. (a) | 1,200 | (781 | ) | |||||||
|
| |||||||||
| (100,866 | ) | |||||||||
|
| |||||||||
Media — (0.1)% | ||||||||||
Baidu, Inc., ADR (a) | 100 | (15,092 | ) | |||||||
Baosheng Media Group Holding Ltd. (a) | 139 | (480 | ) | |||||||
Dada Nexus Ltd., ADR (a) | 12,000 | (101,640 | ) | |||||||
DouYu International Holdings Ltd., ADR (a) | 4,400 | (5,236 | ) | |||||||
Grab Holdings Ltd., Class A (a) | 335,300 | (1,009,253 | ) | |||||||
iClick Interactive Asia Group Ltd., ADR (a) | 250 | (850 | ) | |||||||
MakeMyTrip Ltd. (a) | 4,800 | (117,456 | ) | |||||||
NetEase, Inc., ADR | 13,500 | (1,193,940 | ) | |||||||
Phoenix New Media Ltd., ADR (a) | 16 | (36 | ) | |||||||
Pintec Technology Holdings Ltd., ADR (a) | 300 | (324 | ) | |||||||
So-Young International, Inc., ADR (a) | 900 | (1,935 | ) | |||||||
Sohu.com Ltd., ADR (a) | 800 | (11,784 | ) | |||||||
The9 Ltd., ADR (a) | 4,400 | (3,430 | ) | |||||||
Trip.com Group Ltd., ADR (a) | 75,700 | (2,851,619 | ) | |||||||
Uxin Ltd., ADR (a) | 4,080 | (9,139 | ) | |||||||
Zhihu, Inc., ADR (a) | 26,400 | (33,528 | ) | |||||||
|
| |||||||||
| (5,355,742 | ) | |||||||||
|
| |||||||||
See Notes to Consolidated Financial Statements.
115
Table of Contents
Blackstone Alternative Multi-Strategy Fund and Subsidiaries
Consolidated Schedule of Investments ^ (Continued)
March 31, 2023
Security Description | Shares | Value | ||||||||
Oil & Gas — (0.0)% | ||||||||||
Recon Technology Ltd., Class A (a) | 2,300 | $ | (788 | ) | ||||||
|
| |||||||||
Real Estate — (0.0)% | ||||||||||
Fangdd Network Group Ltd., ADR (a) | 940 | (926 | ) | |||||||
FLJ Group Ltd., ADR (a) | 4,600 | (3,406 | ) | |||||||
|
| |||||||||
| (4,332 | ) | |||||||||
|
| |||||||||
Renewable Energy — (0.1)% | ||||||||||
Daqo New Energy Corp., ADR (a) | 17,700 | (829,068 | ) | |||||||
Emeren Group Ltd., ADR (a) | 11,800 | (52,510 | ) | |||||||
JinkoSolar Holding Co., Ltd., ADR (a) | 10,800 | (551,016 | ) | |||||||
|
| |||||||||
| (1,432,594 | ) | |||||||||
|
| |||||||||
Retail & Wholesale—Discretionary — (0.3)% | ||||||||||
ATRenew, Inc., ADR (a) | 5,400 | (16,470 | ) | |||||||
Boqii Holding Ltd., ADR (a) | 533 | (605 | ) | |||||||
Coupang, Inc. (a) | 133,400 | (2,134,400 | ) | |||||||
DingDong Cayman Ltd., ADR (a) | 13,400 | (51,724 | ) | |||||||
E-Home Household Service Holdings Ltd. (a) | 60 | (6 | ) | |||||||
Future Fintech Group, Inc. (a) | 260 | (278 | ) | |||||||
JD.com, Inc., ADR | 37,300 | (1,637,097 | ) | |||||||
JX Luxventure Ltd. (a) | 1,000 | (520 | ) | |||||||
Kaixin Auto Holdings (a) | 3,200 | (1,748 | ) | |||||||
LightInTheBox Holding Co., Ltd., ADR (a) | 1,000 | (1,610 | ) | |||||||
Moxian BVI, Inc. (a) | 800 | (776 | ) | |||||||
Sea Ltd., ADR (a) | 90,900 | (7,867,395 | ) | |||||||
Vipshop Holdings Ltd., ADR (a) | 3,600 | (54,648 | ) | |||||||
Yatsen Holding Ltd., ADR (a) | 21,000 | (31,080 | ) | |||||||
|
| |||||||||
| (11,798,357 | ) | |||||||||
|
| |||||||||
Retail & Wholesale—Staples — (0.0)% |
| |||||||||
Meiwu Technology Co., Ltd. (a) | 200 | (36 | ) | |||||||
|
| |||||||||
Software & Technology Services — (0.0)% |
| |||||||||
17 Education & Technology Group, Inc., ADR (a) | 625 | (631 | ) | |||||||
BIT Mining Ltd., ADR (a) | 4,450 | (10,947 | ) | |||||||
Bit Origin Ltd. (a) | 2,300 | (644 | ) | |||||||
Borqs Technologies, Inc. (a) | 14,700 | (3,675 | ) | |||||||
Cloopen Group Holding Ltd., ADR (a) | 566 | (979 | ) | |||||||
Datasea, Inc. (a) | 500 | (605 | ) | |||||||
Gaotu Techedu, Inc., ADR (a) | 35,300 | (148,966 | ) | |||||||
Infosys Ltd., ADR | 3,100 | (54,064 | ) | |||||||
Kingsoft Cloud Holdings Ltd., ADR (a) | 27,700 | (246,253 | ) | |||||||
Link Motion, Inc., ADR (a),(c) | 11,000 | 0 | ||||||||
Metalpha Technology Holding Ltd. (a) | 700 | (725 | ) | |||||||
See Notes to Consolidated Financial Statements.
116
Table of Contents
Blackstone Alternative Multi-Strategy Fund and Subsidiaries
Consolidated Schedule of Investments ^ (Continued)
March 31, 2023
Security Description | Shares | Value | ||||||||||
OneConnect Financial Technology Co., Ltd., ADR (a) | 1,640 | $ | (8,725 | ) | ||||||||
Powerbridge Technologies Co., Ltd. (a) | 12,300 | (1,150 | ) | |||||||||
Qutoutiao, Inc., ADR (a) | 1,160 | (211 | ) | |||||||||
Sify Technologies Ltd., ADR (a) | 500 | (630 | ) | |||||||||
Taoping, Inc. (a) | 500 | (315 | ) | |||||||||
TaskUS, Inc., Class A (a) | 5,000 | (72,200 | ) | |||||||||
TDCX, Inc., ADR (a) | 1,900 | (16,910 | ) | |||||||||
TELUS International CDA, Inc. (a) | 400 | (8,092 | ) | |||||||||
Tuya, Inc., ADR (a) | 18,500 | (34,965 | ) | |||||||||
WiMi Hologram Cloud, Inc., ADR (a) | 3,700 | (3,996 | ) | |||||||||
Youdao, Inc., ADR (a) | 2,800 | (23,800 | ) | |||||||||
|
| |||||||||||
| (638,483 | ) | |||||||||||
|
| |||||||||||
Tech Hardware & Semiconductors — (0.0)% | ||||||||||||
Canaan, Inc., ADR (a) | 44,800 | (120,960 | ) | |||||||||
Ebang International Holdings, Inc., Class A (a) | 616 | (4,318 | ) | |||||||||
Himax Technologies, Inc., ADR | 7,600 | (61,788 | ) | |||||||||
SemiLEDs Corp. (a) | 300 | (657 | ) | |||||||||
Sony Group Corp., ADR | 12,400 | (1,124,060 | ) | |||||||||
|
| |||||||||||
| (1,311,783 | ) | |||||||||||
|
| |||||||||||
Telecommunications — (0.0)% | ||||||||||||
Chindata Group Holdings Ltd., ADR (a) | 8,700 | (60,813 | ) | |||||||||
Chunghwa Telecom Co., Ltd., ADR | 1,400 | (54,740 | ) | |||||||||
GDS Holdings Ltd., ADR (a) | 19,700 | (367,602 | ) | |||||||||
KT Corp., ADR | 15,500 | (175,770 | ) | |||||||||
SK Telecom Co., Ltd., ADR | 200 | (4,102 | ) | |||||||||
Telkom Indonesia Persero Tbk PT, ADR | 4,200 | (114,534 | ) | |||||||||
Vnet Group, Inc., ADR (a) | 24,000 | (77,760 | ) | |||||||||
|
| |||||||||||
| (855,321 | ) | |||||||||||
|
| |||||||||||
Utilities — (0.0)% |
| |||||||||||
Azure Power Global Ltd. (a) | 5,800 | (14,442 | ) | |||||||||
Korea Electric Power Corp., ADR | 4,300 | (29,842 | ) | |||||||||
ReNew Energy Global PLC, Class A (a) | 21,100 | (118,582 | ) | |||||||||
|
| |||||||||||
| (162,866 | ) | |||||||||||
|
| |||||||||||
Total Asia |
| (29,490,525 | ) | |||||||||
|
| |||||||||||
Europe — (0.3)% |
| |||||||||||
Banking — (0.1)% |
| |||||||||||
Barclays PLC, ADR | 61,900 | (445,061 | ) | |||||||||
Deutsche Bank AG | 47,900 | (489,059 | ) | |||||||||
HSBC Holdings PLC, ADR | 48,500 | (1,655,305 | ) | |||||||||
ING Groep NV, ADR | 12,000 | (142,440 | ) | |||||||||
Lloyds Banking Group PLC, ADR | 40,400 | (93,728 | ) | |||||||||
See Notes to Consolidated Financial Statements.
117
Table of Contents
Blackstone Alternative Multi-Strategy Fund and Subsidiaries
Consolidated Schedule of Investments ^ (Continued)
March 31, 2023
Security Description | Shares | Value | ||||||||
NatWest Group PLC, ADR | 600 | $ | (3,960 | ) | ||||||
Safe Bulkers, Inc. | 600 | (2,214 | ) | |||||||
|
| |||||||||
| (2,831,767 | ) | |||||||||
|
| |||||||||
Consumer Discretionary Services — (0.0)% | ||||||||||
InterContinental Hotels Group PLC, ADR | 800 | (53,280 | ) | |||||||
Sportradar Holding AG, Class A (a) | 1,600 | (18,608 | ) | |||||||
Super Group SGHC Ltd. (a) | 100 | (403 | ) | |||||||
|
| |||||||||
| (72,291 | ) | |||||||||
|
| |||||||||
Consumer Staple Products — (0.1)% | ||||||||||
Anheuser-Busch InBev SA, ADR | 23,600 | (1,574,828 | ) | |||||||
Unilever PLC, ADR | 41,000 | (2,129,130 | ) | |||||||
|
| |||||||||
| (3,703,958 | ) | |||||||||
|
| |||||||||
Financial Services — (0.0)% | ||||||||||
AerCap Holdings NV | 7,800 | (438,594 | ) | |||||||
Argo Blockchain PLC, ADR (a) | 100 | (167 | ) | |||||||
UBS Group AG | 56,900 | (1,214,246 | ) | |||||||
|
| |||||||||
| (1,653,007 | ) | |||||||||
|
| |||||||||
Health Care — (0.1)% | ||||||||||
ADC Therapeutics SA (a) | 500 | (975 | ) | |||||||
Alcon, Inc. | 900 | (63,486 | ) | |||||||
Amryt Pharma PLC, ADR (a) | 500 | (7,290 | ) | |||||||
Aptorum Group Ltd., Class A (a) | 130 | (347 | ) | |||||||
Ascendis Pharma A/S, ADR (a) | 4,700 | (503,934 | ) | |||||||
Babylon Holdings Ltd., Class A (a) | 904 | (4,601 | ) | |||||||
BioNTech SE, ADR (a) | 13,200 | (1,644,324 | ) | |||||||
CureVac NV (a) | 1,200 | (8,364 | ) | |||||||
Galapagos NV, ADR (a) | 1,700 | (65,688 | ) | |||||||
GH Research PLC (a) | 600 | (4,794 | ) | |||||||
ICON PLC, ADR (a) | 5,200 | (1,110,668 | ) | |||||||
InflaRx NV (a) | 1,300 | (2,522 | ) | |||||||
Mereo Biopharma Group PLC, ADR (a) | 18,200 | (12,866 | ) | |||||||
Molecular Partners AG, ADR (a) | 100 | (600 | ) | |||||||
NuCana PLC, ADR (a) | 1,600 | (1,536 | ) | |||||||
Olink Holding AB, ADR (a) | 2,200 | (49,566 | ) | |||||||
Smith & Nephew PLC, ADR | 1,200 | (33,492 | ) | |||||||
Trinity Biotech PLC, ADR (a) | 800 | (752 | ) | |||||||
uniQure NV (a) | 2,300 | (46,322 | ) | |||||||
|
| |||||||||
| (3,562,127 | ) | |||||||||
|
| |||||||||
Industrial Products — (0.0)% | ||||||||||
Wallbox NV (a) | 3,600 | (17,604 | ) | |||||||
|
| |||||||||
See Notes to Consolidated Financial Statements.
118
Table of Contents
Blackstone Alternative Multi-Strategy Fund and Subsidiaries
Consolidated Schedule of Investments ^ (Continued)
March 31, 2023
Security Description | Shares | Value | ||||||||||
Industrial Services — (0.0)% |
| |||||||||||
Cimpress PLC (a) | 900 | $ | (39,438 | ) | ||||||||
Costamare, Inc. | 9,800 | (92,218 | ) | |||||||||
Danaos Corp. | 100 | (5,462 | ) | |||||||||
Global Ship Lease, Inc., Class A | 1,800 | (33,732 | ) | |||||||||
KNOT Offshore Partners LP | 100 | (536 | ) | |||||||||
Rentokil Initial PLC, ADR | 4,000 | (146,040 | ) | |||||||||
Ryanair Holdings PLC, ADR (a) | 6,600 | (622,314 | ) | |||||||||
|
| |||||||||||
| (939,740 | ) | |||||||||||
|
| |||||||||||
Insurance — (0.0)% |
| |||||||||||
Aegon NV | 45,100 | (193,930 | ) | |||||||||
|
| |||||||||||
Materials — (0.0)% |
| |||||||||||
Atlas Lithium Corp. (a) | 200 | (3,462 | ) | |||||||||
CRH PLC, ADR | 9,900 | (503,613 | ) | |||||||||
Mercer International, Inc. | 300 | (2,933 | ) | |||||||||
|
| |||||||||||
| (510,008 | ) | |||||||||||
|
| |||||||||||
Media — (0.0)% |
| |||||||||||
Jumia Technologies AG, ADR (a) | 41,900 | (137,851 | ) | |||||||||
Liberty Global PLC, Class A (a) | 1,000 | (19,500 | ) | |||||||||
Spark Networks SE, ADR (a) | 1,000 | (671 | ) | |||||||||
WPP PLC, ADR | 800 | (47,616 | ) | |||||||||
|
| |||||||||||
| (205,638 | ) | |||||||||||
|
| |||||||||||
Retail & Wholesale—Discretionary — (0.0)% |
| |||||||||||
Cazoo Group Ltd. (a) | 1,545 | (3,847 | ) | |||||||||
Farfetch Ltd., Class A (a) | 148,000 | (726,680 | ) | |||||||||
MYT Netherlands Parent BV, ADR (a) | 1,700 | (11,951 | ) | |||||||||
|
| |||||||||||
| (742,478 | ) | |||||||||||
|
| |||||||||||
Software & Technology Services — (0.0)% |
| |||||||||||
Kaleyra, Inc. (a) | 1,342 | (2,214 | ) | |||||||||
RELX PLC, ADR | 5,900 | (191,396 | ) | |||||||||
SAP SE, ADR | 1,700 | (215,135 | ) | |||||||||
Sophia Genetics SA (a) | 300 | (1,491 | ) | |||||||||
|
| |||||||||||
| (410,236 | ) | |||||||||||
|
| |||||||||||
Tech Hardware & Semiconductors — (0.0)% |
| |||||||||||
Logitech International SA | 1,100 | (63,866 | ) | |||||||||
|
| |||||||||||
Utilities — (0.0)% |
| |||||||||||
National Grid PLC, ADR | 4,800 | (326,352 | ) | |||||||||
|
| |||||||||||
Total Europe |
| (15,233,002 | ) | |||||||||
|
| |||||||||||
See Notes to Consolidated Financial Statements.
119
Table of Contents
Blackstone Alternative Multi-Strategy Fund and Subsidiaries
Consolidated Schedule of Investments ^ (Continued)
March 31, 2023
Security Description | Shares | Value | ||||||||||
Middle East — (0.0)% |
| |||||||||||
Consumer Discretionary Products — (0.0)% |
| |||||||||||
Foresight Autonomous Holdings Ltd., ADR (a) | 4,200 | $ | (1,722 | ) | ||||||||
Innoviz Technologies Ltd. (a) | 100 | (350 | ) | |||||||||
|
| |||||||||||
| (2,072 | ) | |||||||||||
|
| |||||||||||
Consumer Discretionary Services — (0.0)% |
| |||||||||||
NEOGAMES SA (a) | 200 | (3,040 | ) | |||||||||
|
| |||||||||||
Health Care — (0.0)% |
| |||||||||||
Can-Fite BioPharma Ltd., ADR (a) | 30 | (69 | ) | |||||||||
Collplant Biotechnologies Ltd., ADR (a) | 300 | (2,106 | ) | |||||||||
Gamida Cell Ltd. (a) | 9,800 | (7,938 | ) | |||||||||
InspireMD, Inc. (a) | 173 | (192 | ) | |||||||||
Nano-X Imaging Ltd. (a) | 9,300 | (53,661 | ) | |||||||||
|
| |||||||||||
| (63,966 | ) | |||||||||||
|
| |||||||||||
Industrial Products — (0.0)% |
| |||||||||||
Elbit Systems Ltd. | 200 | (34,042 | ) | |||||||||
|
| |||||||||||
Industrial Services — (0.0)% |
| |||||||||||
Castor Maritime, Inc. (a) | 13,960 | (11,021 | ) | |||||||||
|
| |||||||||||
Materials — (0.0)% |
| |||||||||||
Evogene Ltd. (a) | 2,500 | (1,575 | ) | |||||||||
|
| |||||||||||
Media — (0.0)% |
| |||||||||||
Innovid Corp. (a) | 4,636 | (6,537 | ) | |||||||||
Taboola.com Ltd. (a) | 2,400 | (6,528 | ) | |||||||||
|
| |||||||||||
| (13,065 | ) | |||||||||||
|
| |||||||||||
Renewable Energy — (0.0)% |
| |||||||||||
Eco Wave Power Global AB, ADR (a) | 200 | (538 | ) | |||||||||
|
| |||||||||||
Software & Technology Services — (0.0)% |
| |||||||||||
Cognyte Software Ltd. (a) | 4,800 | (16,272 | ) | |||||||||
Global-e Online Ltd. (a) | 5,800 | (186,934 | ) | |||||||||
Yalla Group Ltd., ADR (a) | 3,300 | (13,002 | ) | |||||||||
|
| |||||||||||
| (216,208 | ) | |||||||||||
|
| |||||||||||
Tech Hardware & Semiconductors — (0.0)% |
| |||||||||||
Ceragon Networks Ltd. (a) | 4,100 | (6,847 | ) | |||||||||
Gilat Satellite Networks Ltd. (a) | 1,000 | (5,120 | ) | |||||||||
SuperCom Ltd. (a) | 610 | (854 | ) | |||||||||
|
| |||||||||||
| (12,821 | ) | |||||||||||
|
| |||||||||||
Total Middle East |
| (358,348 | ) | |||||||||
|
| |||||||||||
See Notes to Consolidated Financial Statements.
120
Table of Contents
Blackstone Alternative Multi-Strategy Fund and Subsidiaries
Consolidated Schedule of Investments ^ (Continued)
March 31, 2023
Security Description | Shares | Value | ||||||||||
North America — (10.1)% |
| |||||||||||
Banking — (1.7)% |
| |||||||||||
Associated Banc-Corp. | 700 | $ | (12,586 | ) | ||||||||
Atlantic Union Bankshares Corp. | 107,246 | (3,758,972 | ) | |||||||||
Axos Financial, Inc. (a) | 163,846 | (6,049,194 | ) | |||||||||
Banc of California, Inc. | 24,293 | (304,391 | ) | |||||||||
Bancorp, Inc. | 83,770 | (2,332,995 | ) | |||||||||
Bank of Montreal | 10,600 | (944,566 | ) | |||||||||
Bank of Nova Scotia | 37,400 | (1,883,464 | ) | |||||||||
Bank of NT Butterfield & Son Ltd. | 41,405 | (1,117,935 | ) | |||||||||
Bank OZK | 151,308 | (5,174,734 | ) | |||||||||
Bankwell Financial Group, Inc. | 4,121 | (102,448 | ) | |||||||||
Banner Corp. | 8,277 | (450,020 | ) | |||||||||
Blue Ridge Bankshares, Inc. | 6,747 | (68,819 | ) | |||||||||
Byline Bancorp, Inc. | 3,520 | (76,102 | ) | |||||||||
Canadian Imperial Bank of Commerce | 17,780 | (754,228 | ) | |||||||||
Carver Bancorp, Inc. (a) | 400 | (1,596 | ) | |||||||||
Cathay General Bancorp | 3,450 | (119,094 | ) | |||||||||
Citizens Financial Group, Inc. | 125,149 | (3,800,775 | ) | |||||||||
City Holding Co. | 45,791 | (4,161,486 | ) | |||||||||
Civista Bancshares, Inc. | 7,364 | (124,304 | ) | |||||||||
Columbia Banking System, Inc. | 7,700 | (164,934 | ) | |||||||||
Commerce Bancshares, Inc. | 1,796 | (104,797 | ) | |||||||||
CrossFirst Bankshares, Inc. | 44,995 | (471,548 | ) | |||||||||
CVB Financial Corp. | 76,790 | (1,280,857 | ) | |||||||||
Eagle Bancorp, Inc. | 7,986 | (267,291 | ) | |||||||||
East West Bancorp, Inc. | 78,447 | (4,353,809 | ) | |||||||||
Enterprise Financial Services Corp. | 2,496 | (111,297 | ) | |||||||||
Fifth Third Bancorp | 2,630 | (70,063 | ) | |||||||||
First Citizens BancShares, Inc., Class A | 800 | (778,480 | ) | |||||||||
First Horizon Corp. | 118,900 | (2,114,042 | ) | |||||||||
First Interstate BancSystem, Inc., Class A | 5,100 | (152,286 | ) | |||||||||
FNB Corp. | 500 | (5,800 | ) | |||||||||
Frost Bankers, Inc. | 900 | (94,806 | ) | |||||||||
Home BancShares, Inc. | 130,991 | (2,843,815 | ) | |||||||||
Huntington Bancshares, Inc. | 79,899 | (894,869 | ) | |||||||||
Independent Bank Corp. | 1,100 | (72,182 | ) | |||||||||
JPMorgan Chase & Co. | 2,979 | (388,193 | ) | |||||||||
KeyCorp (b) | 14,897 | (186,510 | ) | |||||||||
Live Oak Bancshares, Inc. | 26,963 | (657,088 | ) | |||||||||
M&T Bank Corp. | 301 | (35,991 | ) | |||||||||
New York Community Bancorp, Inc. | 232,896 | (2,105,380 | ) | |||||||||
Old National Bancorp | 41,894 | (604,111 | ) | |||||||||
Pacific Premier Bancorp, Inc. | 22,981 | (552,004 | ) | |||||||||
Park National Corp. | 100 | (11,857 | ) | |||||||||
Pathward Financial, Inc. | 38,313 | (1,589,606 | ) | |||||||||
See Notes to Consolidated Financial Statements.
121
Table of Contents
Blackstone Alternative Multi-Strategy Fund and Subsidiaries
Consolidated Schedule of Investments ^ (Continued)
March 31, 2023
Security Description | Shares | Value | ||||||||
Peoples Bancorp, Inc. | 1,685 | $ | (43,389 | ) | ||||||
Preferred Bank | 50,858 | (2,787,527 | ) | |||||||
Prosperity Bancshares, Inc. | 57,882 | (3,560,901 | ) | |||||||
Regions Financial Corp. | 53,428 | (991,624 | ) | |||||||
Royal Bank of Canada | 18,700 | (1,787,346 | ) | |||||||
Sandy Spring Bancorp, Inc. | 25,784 | (669,868 | ) | |||||||
ServisFirst Bancshares, Inc. | 1,200 | (65,556 | ) | |||||||
Simmons First National Corp., Class A | 31,022 | (542,575 | ) | |||||||
South State Corp. | 61,106 | (4,354,414 | ) | |||||||
Stellar Bancorp, Inc. | 100 | (2,461 | ) | |||||||
TFS Financial Corp. | 3,400 | (42,942 | ) | |||||||
Toronto-Dominion Bank | 11,500 | (688,850 | ) | |||||||
Towne Bank | 23,334 | (621,851 | ) | |||||||
Truist Financial Corp. (b) | 371 | (12,651 | ) | |||||||
UMB Financial Corp. | 500 | (28,860 | ) | |||||||
United Bankshares, Inc. | 2,400 | (84,480 | ) | |||||||
United Community Banks, Inc. | 37,408 | (1,051,913 | ) | |||||||
Valley National Bancorp | 7,900 | (72,996 | ) | |||||||
Veritex Holdings, Inc. | 123,497 | (2,255,055 | ) | |||||||
Webster Financial Corp. | 15,200 | (599,184 | ) | |||||||
Westamerica BanCorp. | 137 | (6,069 | ) | |||||||
Western Alliance Bancorp | 14,565 | (517,640 | ) | |||||||
WSFS Financial Corp. | 2,800 | (105,308 | ) | |||||||
Zions BanCorp. | 92,273 | (2,761,731 | ) | |||||||
|
| |||||||||
| (74,804,516 | ) | |||||||||
|
| |||||||||
Biotechnology & Pharmaceuticals — (0.0)% | ||||||||||
Contra Gemini Therapeutics, Inc. (a),(c) | 1,300 | 0 | ||||||||
Neurobo Pharmaceuticals, Inc. (a),(c) | 92 | (29 | ) | |||||||
|
| |||||||||
| (29 | ) | |||||||||
|
| |||||||||
Consumer Discretionary Products — (0.7)% | ||||||||||
Adient PLC (a) | 3,800 | (155,648 | ) | |||||||
Aterian, Inc. (a) | 2,200 | (1,892 | ) | |||||||
Aurora Innovation, Inc. (a) | 36,400 | (50,596 | ) | |||||||
Axon Enterprise, Inc. (a) | 3,700 | (831,945 | ) | |||||||
BRP, Inc. | 200 | (15,640 | ) | |||||||
Canoo, Inc. (a) | 68,700 | (44,834 | ) | |||||||
Carter's, Inc. | 10,900 | (783,928 | ) | |||||||
CBAK Energy Technology, Inc. (a) | 4,200 | (3,696 | ) | |||||||
Century Communities, Inc. | 1,800 | (115,056 | ) | |||||||
Cepton, Inc. (a) | 5,700 | (2,647 | ) | |||||||
Columbia Sportswear Co. | 1,700 | (153,408 | ) | |||||||
Deckers Outdoor Corp. (a) | 2,000 | (899,100 | ) | |||||||
DR Horton, Inc. | 41,900 | (4,093,211 | ) | |||||||
Dream Finders Homes, Inc., Class A (a) | 2,500 | (33,125 | ) | |||||||
See Notes to Consolidated Financial Statements.
122
Table of Contents
Blackstone Alternative Multi-Strategy Fund and Subsidiaries
Consolidated Schedule of Investments ^ (Continued)
March 31, 2023
Security Description | Shares | Value | ||||||||
Embark Technology, Inc. (a) | 300 | $ | (843 | ) | ||||||
Fox Factory Holding Corp. (a) | 1,500 | (182,055 | ) | |||||||
Gildan Activewear, Inc. | 11,500 | (381,685 | ) | |||||||
Goodyear Tire & Rubber Co. (a) | 17,500 | (192,850 | ) | |||||||
Green Brick Partners, Inc. (a) | 500 | (17,530 | ) | |||||||
Hanesbrands, Inc. | 80,900 | (425,534 | ) | |||||||
Harley-Davidson, Inc. | 3,900 | (148,083 | ) | |||||||
Holley, Inc. (a) | 3,300 | (9,042 | ) | |||||||
iRobot Corp. (a) | 700 | (30,548 | ) | |||||||
Kontoor Brands, Inc. | 900 | (43,551 | ) | |||||||
LCI Industries | 1,900 | (208,753 | ) | |||||||
Lennar Corp., Class A | 20,300 | (2,133,733 | ) | |||||||
LGI Homes, Inc. (a) | 3,200 | (364,896 | ) | |||||||
Lordstown Motors Corp., Class A (a) | 59,500 | (39,454 | ) | |||||||
Luminar Technologies, Inc. (a) | 5,300 | (34,397 | ) | |||||||
Mattel, Inc. (a) | 200 | (3,682 | ) | |||||||
Microvast Holdings, Inc. (a) | 23,700 | (29,388 | ) | |||||||
MillerKnoll, Inc. | 700 | (14,315 | ) | |||||||
NIKE, Inc., Class B (b) | 10,069 | (1,234,862 | ) | |||||||
PLBY Group, Inc. (a) | 22,064 | (43,687 | ) | |||||||
Rivian Automotive, Inc., Class A (a) | 144,900 | (2,243,052 | ) | |||||||
SES AI Corp. (a) | 8,600 | (25,370 | ) | |||||||
Skyline Champion Corp. (a) | 3,100 | (233,213 | ) | |||||||
Smith & Wesson Brands, Inc. | 3,600 | (44,316 | ) | |||||||
Tempur Sealy International, Inc. | 13,600 | (537,064 | ) | |||||||
Tesla, Inc. (a) | 57,300 | (11,887,458 | ) | |||||||
Thor Industries, Inc. | 7,700 | (613,228 | ) | |||||||
Topgolf Callaway Brands Corp. (a) | 4,200 | (90,804 | ) | |||||||
Torrid Holdings, Inc. (a) | 2,000 | (8,720 | ) | |||||||
Traeger, Inc. (a) | 7,200 | (29,592 | ) | |||||||
Vinco Ventures, Inc. (a) | 104,500 | (33,576 | ) | |||||||
Visteon Corp. (a) | 1,000 | (156,830 | ) | |||||||
Volcon, Inc. (a) | 1,300 | (1,950 | ) | |||||||
Winnebago Industries, Inc. | 8,000 | (461,600 | ) | |||||||
Worksport Ltd. (a) | 1,500 | (2,190 | ) | |||||||
XPEL, Inc. (a) | 1,800 | (122,310 | ) | |||||||
|
| |||||||||
| (29,214,887 | ) | |||||||||
|
| |||||||||
Consumer Discretionary Services — (0.4)% | ||||||||||
Bally's Corp. (a) | 5,100 | (99,552 | ) | |||||||
Bird Global, Inc., Class A (a) | 44,600 | (12,483 | ) | |||||||
Boyd Gaming Corp. | 1,300 | (83,356 | ) | |||||||
Bright Horizons Family Solutions, Inc. (a) | 100 | (7,699 | ) | |||||||
Brinker International, Inc. (a) | 100 | (3,800 | ) | |||||||
BurgerFi International, Inc. (a) | 800 | (944 | ) | |||||||
Caesars Entertainment, Inc. (a) | 56,176 | (2,741,951 | ) | |||||||
See Notes to Consolidated Financial Statements.
123
Table of Contents
Blackstone Alternative Multi-Strategy Fund and Subsidiaries
Consolidated Schedule of Investments ^ (Continued)
March 31, 2023
Security Description | Shares | Value | ||||||||
Carnival PLC, ADR (a) | 600 | $ | (5,490 | ) | ||||||
Chipotle Mexican Grill, Inc. (a) | 1,100 | (1,879,119 | ) | |||||||
Choice Hotels International, Inc. | 200 | (23,438 | ) | |||||||
Cinemark Holdings, Inc. (a) | 100 | (1,479 | ) | |||||||
Dave & Buster's Entertainment, Inc. (a) | 12,500 | (459,875 | ) | |||||||
Domino's Pizza, Inc. | 1,600 | (527,792 | ) | |||||||
European Wax Center, Inc., Class A | 800 | (15,200 | ) | |||||||
F45 Training Holdings, Inc. (a) | 10,992 | (12,751 | ) | |||||||
Grand Canyon Education, Inc. (a) | 2,100 | (239,190 | ) | |||||||
Hall of Fame Resort & Entertainment Co. (a) | 581 | (5,316 | ) | |||||||
Helbiz, Inc. (a) | 984 | (3,601 | ) | |||||||
Hilton Grand Vacations, Inc. (a) | 100 | (4,443 | ) | |||||||
Las Vegas Sands Corp. (a) | 6,500 | (373,425 | ) | |||||||
Life Time Group Holdings, Inc. (a) | 600 | (9,576 | ) | |||||||
Light & Wonder, Inc. (a) | 1,900 | (114,095 | ) | |||||||
Live Nation Entertainment, Inc. | 7,555 | (528,850 | ) | |||||||
Madison Square Garden Entertainment Corp. (a) | 2,600 | (153,582 | ) | |||||||
Marriott Vacations Worldwide Corp. | 1,600 | (215,776 | ) | |||||||
Medifast, Inc. | 200 | (20,734 | ) | |||||||
MGM Resorts International | 16,000 | (710,720 | ) | |||||||
Papa John's International, Inc. | 2,200 | (164,846 | ) | |||||||
Penn Entertainment, Inc. (a) | 14,900 | (441,934 | ) | |||||||
Rent the Runway, Inc., Class A (a) | 9,000 | (25,650 | ) | |||||||
Restaurant Brands International, Inc. | 15,200 | (1,020,528 | ) | |||||||
Royal Caribbean Cruises Ltd. (a) | 63,600 | (4,153,080 | ) | |||||||
Service Corp. International | 2,500 | (171,950 | ) | |||||||
Six Flags Entertainment Corp. (a) | 20,400 | (544,884 | ) | |||||||
Sonder Holdings, Inc. (a) | 24,600 | (18,625 | ) | |||||||
Strategic Education, Inc. | 100 | (8,983 | ) | |||||||
Super League Gaming, Inc. (a) | 2,700 | (1,498 | ) | |||||||
Udemy, Inc. (a) | 4,100 | (36,203 | ) | |||||||
Vail Resorts, Inc. | 2,200 | (514,096 | ) | |||||||
XWELL, Inc. (a) | 1,400 | (505 | ) | |||||||
|
| |||||||||
| (15,357,019 | ) | |||||||||
|
| |||||||||
Consumer Staple Products — (0.2)% | ||||||||||
22nd Century Group, Inc. (a) | 21,500 | (16,534 | ) | |||||||
Alkaline Water Co., Inc. (The) (a) | 16,200 | (2,595 | ) | |||||||
Aurora Cannabis, Inc. (a) | 136,200 | (94,972 | ) | |||||||
B&G Foods, Inc. | 7,600 | (118,028 | ) | |||||||
Beachbody Co., Inc. (The) (a) | 11,300 | (5,449 | ) | |||||||
Benson Hill, Inc. (a) | 12,000 | (13,800 | ) | |||||||
Boston Beer Co., Inc., Class A (a) | 100 | (32,870 | ) | |||||||
BRC, Inc., Class A (a) | 12,800 | (65,792 | ) | |||||||
Bright Green Corp. (a) | 2,544 | (2,396 | ) | |||||||
Celsius Holdings, Inc. (a) | 3,100 | (288,114 | ) | |||||||
See Notes to Consolidated Financial Statements.
124
Table of Contents
Blackstone Alternative Multi-Strategy Fund and Subsidiaries
Consolidated Schedule of Investments ^ (Continued)
March 31, 2023
Security Description | Shares | Value | ||||||||
Central Garden & Pet Co., Class A (a) | 1,400 | $ | (54,698 | ) | ||||||
Clever Leaves Holdings, Inc. (a) | 4,800 | (1,833 | ) | |||||||
Constellation Brands, Inc., Class A | 16,800 | (3,794,952 | ) | |||||||
Coty, Inc., Class A (a) | 53,200 | (641,592 | ) | |||||||
Cronos Group, Inc. (a) | 10,400 | (20,176 | ) | |||||||
Darling Ingredients, Inc. (a) | 8,200 | (478,880 | ) | |||||||
Dole PLC | 8,200 | (96,268 | ) | |||||||
Eastside Distilling, Inc. (a) | 1,200 | (420 | ) | |||||||
Energizer Holdings, Inc. | 5,900 | (204,730 | ) | |||||||
Estee Lauder Cos., Inc. (The), Class A | 4,100 | (1,010,486 | ) | |||||||
Farmer Bros Co. (a) | 300 | (1,158 | ) | |||||||
Flora Growth Corp. (a) | 100 | (29 | ) | |||||||
Herbalife Nutrition Ltd. (a) | 2,000 | (32,200 | ) | |||||||
HEXO Corp. (a) | 7,521 | (10,078 | ) | |||||||
Honest Co., Inc. (The) (a) | 4,800 | (8,640 | ) | |||||||
Hormel Foods Corp. | 600 | (23,928 | ) | |||||||
IM Cannabis Corp. (a) | 370 | (265 | ) | |||||||
Ingredion, Inc. | 600 | (61,038 | ) | |||||||
J & J Snack Foods Corp. | 400 | (59,288 | ) | |||||||
Kraft Heinz Co. | 2,400 | (92,808 | ) | |||||||
Krispy Kreme, Inc. | 11,900 | (185,045 | ) | |||||||
Lamb Weston Holdings, Inc. | 3,200 | (334,464 | ) | |||||||
Lancaster Colony Corp. | 100 | (20,288 | ) | |||||||
Leafly Holdings, Inc. (a) | 700 | (280 | ) | |||||||
National Beverage Corp. (a) | 800 | (42,176 | ) | |||||||
Nu Skin Enterprises, Inc., Class A | 1,100 | (43,241 | ) | |||||||
Oatly Group AB, ADR (a) | 1,000 | (2,420 | ) | |||||||
Organigram Holdings, Inc. (a) | 28,100 | (17,984 | ) | |||||||
Pilgrim's Pride Corp. (a) | 12,700 | (294,386 | ) | |||||||
Post Holdings, Inc. (a) | 2,300 | (206,701 | ) | |||||||
RiceBran Technologies (a) | 380 | (353 | ) | |||||||
Seneca Foods Corp., Class A (a) | 100 | (5,227 | ) | |||||||
Simply Good Foods Co. (The) (a) | 1,400 | (55,678 | ) | |||||||
Spectrum Brands Holdings, Inc. | 4,300 | (284,746 | ) | |||||||
Stryve Foods, Inc., Class A (a) | 1,800 | (873 | ) | |||||||
Tilray Brands, Inc., Class 2 (a) | 258,500 | (654,005 | ) | |||||||
TreeHouse Foods, Inc. (a) | 1,400 | (70,602 | ) | |||||||
Upexi, Inc. (a) | 600 | (2,430 | ) | |||||||
Utz Brands, Inc. | 5,400 | (88,938 | ) | |||||||
Village Farms International, Inc. (a) | 100 | (83 | ) | |||||||
Vintage Wine Estates, Inc. (a) | 1,600 | (1,712 | ) | |||||||
Vita Coco Co., Inc. (The) (a) | 3,300 | (64,746 | ) | |||||||
Whole Earth Brands, Inc. (a) | 5,000 | (12,800 | ) | |||||||
Zevia PBC, Class A (a) | 2,900 | (11,165 | ) | |||||||
|
| |||||||||
| (9,634,360 | ) | |||||||||
|
| |||||||||
See Notes to Consolidated Financial Statements.
125
Table of Contents
Blackstone Alternative Multi-Strategy Fund and Subsidiaries
Consolidated Schedule of Investments ^ (Continued)
March 31, 2023
Security Description | Shares | Value | ||||||||
Financial Services — (0.7)% | ||||||||||
AG Mortgage Investment Trust, Inc. | 2,000 | $ | (11,500 | ) | ||||||
AGNC Investment Corp. | 7,300 | (73,584 | ) | |||||||
Altisource Portfolio Solutions SA (a) | 2,200 | (10,120 | ) | |||||||
American Express Co. | 6,964 | (1,148,712 | ) | |||||||
Ameriprise Financial, Inc. | 400 | (122,600 | ) | |||||||
Annaly Capital Management, Inc. | 170,950 | (3,266,855 | ) | |||||||
Apollo Commercial Real Estate Finance, Inc. | 5,400 | (50,274 | ) | |||||||
Apollo Global Management, Inc. | 26,500 | (1,673,740 | ) | |||||||
Applied Digital Corp. (a) | 11,800 | (26,432 | ) | |||||||
Arbor Realty Trust, Inc. | 38,400 | (441,216 | ) | |||||||
Ares Management Corp., Class A | 1,400 | (116,816 | ) | |||||||
Artisan Partners Asset Management, Inc., Class A | 1,500 | (47,970 | ) | |||||||
Ault Alliance, Inc. (a) | 117,900 | (12,321 | ) | |||||||
BlackRock, Inc. | 3,143 | (2,103,044 | ) | |||||||
Blackstone Mortgage Trust, Inc., Class A | 40,700 | (726,495 | ) | |||||||
Blue Owl Capital, Inc. | 12,900 | (142,932 | ) | |||||||
Bread Financial Holdings, Inc. | 8,500 | (257,720 | ) | |||||||
Brookfield Asset Management Ltd., Class A | 800 | (26,176 | ) | |||||||
Brookfield Business Corp., Class A | 100 | (1,982 | ) | |||||||
Brookfield Corp., Class A | 72,767 | (2,371,477 | ) | |||||||
Capital One Financial Corp. | 28,897 | (2,778,736 | ) | |||||||
Chimera Investment Corp. | 27,500 | (155,100 | ) | |||||||
Compass Diversified Holdings | 1,000 | (19,080 | ) | |||||||
Contra Cvr Catalyst (a),(c) | 4,600 | 0 | ||||||||
Dave, Inc. (a) | 500 | (3,030 | ) | |||||||
Discover Financial Services | 18,851 | (1,863,233 | ) | |||||||
Doma Holdings, Inc. (a) | 14,400 | (5,868 | ) | |||||||
Dynex Capital, Inc. | 100 | (1,212 | ) | |||||||
Ellington Financial, Inc. | 13,600 | (166,056 | ) | |||||||
Encore Capital Group, Inc. (a) | 400 | (20,180 | ) | |||||||
Enova International, Inc. (a) | 16,670 | (740,648 | ) | |||||||
Federal Agricultural Mortgage Corp., Class C | 100 | (13,319 | ) | |||||||
Finance Of America Cos., Inc., Class A (a) | 1,600 | (1,984 | ) | |||||||
Flywire Corp. | 7,515 | (220,640 | ) | |||||||
Forge Global Holdings, Inc. (a) | 7,300 | (12,775 | ) | |||||||
Franklin BSP Realty Trust, Inc. | 4,400 | (52,492 | ) | |||||||
FTAI Infrastructure, Inc. | 8,300 | (24,900 | ) | |||||||
Greenpro Capital Corp. (a) | 580 | (864 | ) | |||||||
Home Point Capital, Inc. | 500 | (965 | ) | |||||||
Interactive Brokers Group, Inc., Class A | 12,097 | (998,728 | ) | |||||||
Invesco Mortgage Capital, Inc. | 4,020 | (44,582 | ) | |||||||
Kinetik Holdings, Inc. | 420 | (13,146 | ) | |||||||
KKR & Co., Inc. | 59,500 | (3,124,940 | ) | |||||||
KKR Real Estate Finance Trust, Inc. | 100 | (1,139 | ) | |||||||
LendingClub Corp. | 60,345 | (435,087 | ) | |||||||
See Notes to Consolidated Financial Statements.
126
Table of Contents
Blackstone Alternative Multi-Strategy Fund and Subsidiaries
Consolidated Schedule of Investments ^ (Continued)
March 31, 2023
Security Description | Shares | Value | ||||||||
loanDepot, Inc., Class A | 11,900 | $ | (19,159 | ) | ||||||
LPL Financial Holdings, Inc. | 4,300 | (870,320 | ) | |||||||
MFA Financial, Inc. | 25 | (248 | ) | |||||||
Moelis & Co., Class A | 3,000 | (115,320 | ) | |||||||
Mogo, Inc. (a) | 2,900 | (1,906 | ) | |||||||
Morgan Stanley | 9,400 | (825,320 | ) | |||||||
Mr. Cooper Group, Inc. (a) | 7,100 | (290,887 | ) | |||||||
Nelnet, Inc., Class A | 500 | (45,945 | ) | |||||||
NerdWallet, Inc., Class A (a) | 1,500 | (24,270 | ) | |||||||
New York Mortgage Trust, Inc. | 12,925 | (128,733 | ) | |||||||
OMNIQ Corp. (a) | 100 | (486 | ) | |||||||
OneMain Holdings, Inc. | 5,700 | (211,356 | ) | |||||||
Oportun Financial Corp. (a) | 100 | (386 | ) | |||||||
OppFi, Inc. (a) | 1,200 | (2,460 | ) | |||||||
P10, Inc., Class A | 400 | (4,044 | ) | |||||||
Patria Investments Ltd., Class A | 1,300 | (19,240 | ) | |||||||
PennyMac Financial Services, Inc. | 5,800 | (345,738 | ) | |||||||
PennyMac Mortgage Investment Trust | 16,100 | (198,513 | ) | |||||||
Perella Weinberg Partners | 1,500 | (13,650 | ) | |||||||
Raymond James Financial, Inc. | 5,700 | (531,639 | ) | |||||||
Ready Capital Corp. | 20,300 | (206,451 | ) | |||||||
Redwood Trust, Inc. | 18,800 | (126,712 | ) | |||||||
Regional Management Corp. | 15,114 | (394,324 | ) | |||||||
Rithm Capital Corp. | 38,100 | (304,800 | ) | |||||||
Sculptor Capital Management, Inc. | 1,000 | (8,610 | ) | |||||||
SEI Investments Co. | 5,400 | (310,770 | ) | |||||||
Sesen Bio, Inc. (a) | 25,568 | 0 | ||||||||
SLM Corp. | 2,100 | (26,019 | ) | |||||||
SoFi Technologies, Inc. (a) | 160,200 | (972,414 | ) | |||||||
Starwood Property Trust, Inc. | 57,400 | (1,015,406 | ) | |||||||
State Street Corp. | 10,600 | (802,314 | ) | |||||||
Sunlight Financial Holdings, Inc. (a) | 4,700 | (1,468 | ) | |||||||
Tradeweb Markets, Inc., Class A | 6,945 | (548,794 | ) | |||||||
Two Harbors Investment Corp. | 16,050 | (236,095 | ) | |||||||
UWM Holdings Corp. | 7,400 | (36,334 | ) | |||||||
Walker & Dunlop, Inc. | 500 | (38,085 | ) | |||||||
Western Asset Mortgage Capital Corp. | 50 | (456 | ) | |||||||
|
| |||||||||
| (32,009,342 | ) | |||||||||
|
| |||||||||
Health Care — (0.6)% |
| |||||||||
10X Genomics, Inc., Class A (a) | 700 | (39,053 | ) | |||||||
2seventy bio, Inc. (a) | 3,700 | (37,740 | ) | |||||||
Aadi Bioscience, Inc. (a) | 600 | (4,344 | ) | |||||||
Abeona Therapeutics, Inc. (a) | 4,828 | (13,615 | ) | |||||||
Absci Corp. (a) | 100 | (175 | ) | |||||||
AcelRx Pharmaceuticals, Inc. (a) | 1,070 | (704 | ) | |||||||
See Notes to Consolidated Financial Statements.
127
Table of Contents
Blackstone Alternative Multi-Strategy Fund and Subsidiaries
Consolidated Schedule of Investments ^ (Continued)
March 31, 2023
Security Description | Shares | Value | ||||||||
Acer Therapeutics, Inc. (a) | 1,200 | $ | (910 | ) | ||||||
Aceragen, Inc. (a) | 135 | (309 | ) | |||||||
Acorda Therapeutics, Inc. (a) | 600 | (352 | ) | |||||||
Acurx Pharmaceuticals, Inc. (a) | 300 | (1,038 | ) | |||||||
Acutus Medical, Inc. (a) | 4,600 | (3,468 | ) | |||||||
Adamis Pharmaceuticals Corp. (a) | 14,700 | (1,704 | ) | |||||||
AdaptHealth Corp. (a) | 8,600 | (106,898 | ) | |||||||
Adaptimmune Therapeutics PLC, ADR (a) | 9,000 | (9,810 | ) | |||||||
Adial Pharmaceuticals, Inc. (a) | 1,600 | (560 | ) | |||||||
Aerovate Therapeutics, Inc. (a) | 200 | (4,034 | ) | |||||||
Aeterna Zentaris, Inc. (a) | 248 | (647 | ) | |||||||
Agenus, Inc. (a) | 20,300 | (30,856 | ) | |||||||
AgeX Therapeutics, Inc. (a) | 1,000 | (663 | ) | |||||||
Agiliti, Inc. (a) | 3,700 | (59,126 | ) | |||||||
agilon health, Inc. (a) | 29,200 | (693,500 | ) | |||||||
Agios Pharmaceuticals, Inc. (a) | 2,800 | (64,316 | ) | |||||||
Akebia Therapeutics, Inc. (a) | 36,600 | (20,511 | ) | |||||||
Akoya Biosciences, Inc. (a) | 900 | (7,362 | ) | |||||||
Align Technology, Inc. (a) | 6,100 | (2,038,254 | ) | |||||||
Allakos, Inc. (a) | 200 | (890 | ) | |||||||
Alpha Teknova, Inc. (a) | 500 | (1,480 | ) | |||||||
Alzamend Neuro, Inc. (a) | 5,200 | (2,210 | ) | |||||||
American Well Corp., Class A (a) | 800 | (1,888 | ) | |||||||
AmerisourceBergen Corp. | 200 | (32,022 | ) | |||||||
Amylyx Pharmaceuticals, Inc. (a) | 10,700 | (313,938 | ) | |||||||
Apellis Pharmaceuticals, Inc. (a) | 22,300 | (1,470,908 | ) | |||||||
Aptevo Therapeutics, Inc. (a) | 1,000 | (2,040 | ) | |||||||
Apyx Medical Corp. (a) | 2,200 | (6,336 | ) | |||||||
Aquestive Therapeutics, Inc. (a) | 7,200 | (8,208 | ) | |||||||
Arcturus Therapeutics Holdings, Inc. (a) | 2,800 | (67,116 | ) | |||||||
Asensus Surgical, Inc. (a) | 15,730 | (10,350 | ) | |||||||
Assembly Biosciences, Inc. (a) | 100 | (84 | ) | |||||||
Atara Biotherapeutics, Inc. (a) | 100 | (290 | ) | |||||||
Atea Pharmaceuticals, Inc. (a) | 3,600 | (12,060 | ) | |||||||
Athenex, Inc. (a) | 1,937 | (2,576 | ) | |||||||
Athersys, Inc. (a) | 2,800 | (3,444 | ) | |||||||
ATI Physical Therapy, Inc. (a) | 11,500 | (2,923 | ) | |||||||
Atossa Therapeutics, Inc. (a) | 2,900 | (2,102 | ) | |||||||
Atreca, Inc., Class A (a) | 2,500 | (2,850 | ) | |||||||
Avalon GloboCare Corp. (a) | 250 | (495 | ) | |||||||
Aveanna Healthcare Holdings, Inc. (a) | 4,600 | (4,784 | ) | |||||||
Avinger, Inc. (a) | 997 | (798 | ) | |||||||
Axcella Health, Inc. (a) | 3,422 | (1,643 | ) | |||||||
Axsome Therapeutics, Inc. (a) | 2,100 | (129,528 | ) | |||||||
Aytu BioPharma, Inc. (a) | 121 | (272 | ) | |||||||
Azenta, Inc. (a) | 1,802 | (80,405 | ) | |||||||
See Notes to Consolidated Financial Statements.
128
Table of Contents
Blackstone Alternative Multi-Strategy Fund and Subsidiaries
Consolidated Schedule of Investments ^ (Continued)
March 31, 2023
Security Description | Shares | Value | ||||||||
Bausch + Lomb Corp. (a) | 6,100 | $ | (106,201 | ) | ||||||
Bausch Health Cos., Inc. (a) | 17,700 | (143,370 | ) | |||||||
Bellicum Pharmaceuticals, Inc. (a) | 570 | (188 | ) | |||||||
BELLUS Health, Inc. (a) | 100 | (720 | ) | |||||||
Better Choice Co., Inc. (a) | 400 | (148 | ) | |||||||
Beyondspring, Inc. (a) | 1,725 | (1,932 | ) | |||||||
BioCardia, Inc. (a) | 200 | (392 | ) | |||||||
Biocept, Inc. (a) | 10 | (3 | ) | |||||||
Biofrontera, Inc. (a) | 2,400 | (1,464 | ) | |||||||
Biohaven Ltd. (a) | 11,500 | (157,090 | ) | |||||||
Biolase, Inc. (a) | 76 | (21 | ) | |||||||
BioLife Solutions, Inc. (a) | 1,000 | (21,750 | ) | |||||||
Biomerica, Inc. (a) | 800 | (1,496 | ) | |||||||
Bionano Genomics, Inc. (a) | 128,600 | (142,746 | ) | |||||||
Biora Therapeutics, Inc. (a) | 32 | (89 | ) | |||||||
BioSig Technologies, Inc. (a) | 4,200 | (4,788 | ) | |||||||
Biotricity, Inc. (a) | 1,500 | (698 | ) | |||||||
Bluebird Bio, Inc. (a) | 16,400 | (52,152 | ) | |||||||
Bluejay Diagnostics, Inc. (a) | 900 | (368 | ) | |||||||
Brainstorm Cell Therapeutics, Inc. (a) | 700 | (2,310 | ) | |||||||
BriaCell Therapeutics Corp. (a) | 2,900 | (21,605 | ) | |||||||
Butterfly Network, Inc. (a) | 14,200 | (26,696 | ) | |||||||
Cabaletta Bio, Inc. (a) | 800 | (6,616 | ) | |||||||
Cano Health, Inc. (a) | 53,300 | (48,503 | ) | |||||||
Capricor Therapeutics, Inc. (a) | 1,900 | (8,018 | ) | |||||||
CareMax, Inc. (a) | 6,400 | (17,088 | ) | |||||||
Caribou Biosciences, Inc. (a) | 100 | (531 | ) | |||||||
Carisma Therapeutics, Inc. | 1,678 | (5,202 | ) | |||||||
CASI Pharmaceuticals Holdings, Inc. (a) | 430 | (989 | ) | |||||||
Cassava Sciences, Inc. (a) | 11,300 | (272,556 | ) | |||||||
Catalent, Inc. (a) | 30,600 | (2,010,726 | ) | |||||||
cbdMD, Inc. (a) | 4,000 | (780 | ) | |||||||
CEL-SCI Corp. (a) | 2,900 | (6,728 | ) | |||||||
Celularity, Inc. (a) | 1,500 | (930 | ) | |||||||
Centessa Pharmaceuticals PLC, ADR (a) | 2,000 | (7,700 | ) | |||||||
Cerevel Therapeutics Holdings, Inc. (a) | 1,500 | (36,585 | ) | |||||||
Certara, Inc. (a) | 100 | (2,411 | ) | |||||||
Cerus Corp. (a) | 400 | (1,188 | ) | |||||||
Check Cap Ltd. (a) | 490 | (701 | ) | |||||||
Checkpoint Therapeutics, Inc. (a) | 600 | (1,350 | ) | |||||||
Chembio Diagnostics, Inc. (a) | 8,000 | (3,538 | ) | |||||||
Cidara Therapeutics, Inc. (a) | 800 | (1,016 | ) | |||||||
Citius Pharmaceuticals, Inc. (a) | 13,400 | (15,678 | ) | |||||||
ClearPoint Neuro, Inc. (a) | 700 | (5,908 | ) | |||||||
Clover Health Investments Corp. (a) | 4,600 | (3,887 | ) | |||||||
Co-Diagnostics, Inc. (a) | 2,300 | (3,404 | ) | |||||||
See Notes to Consolidated Financial Statements.
129
Table of Contents
Blackstone Alternative Multi-Strategy Fund and Subsidiaries
Consolidated Schedule of Investments ^ (Continued)
March 31, 2023
Security Description | Shares | Value | ||||||||
Congent Biosciences, Inc. (a),(c) | 1,000 | $ | 0 | |||||||
Corbus Pharmaceuticals Holdings, Inc. (a) | 1,009 | (7,335 | ) | |||||||
Cosmos Health, Inc. (a) | 700 | (2,478 | ) | |||||||
CTI BioPharma Corp. (a) | 5,100 | (21,420 | ) | |||||||
Cue Health, Inc. (a) | 5,400 | (9,828 | ) | |||||||
Cytek Biosciences, Inc. (a) | 1,200 | (11,028 | ) | |||||||
Dare Bioscience, Inc. (a) | 7,100 | (7,384 | ) | |||||||
Decibel Therapeutics, Inc. (a) | 300 | (906 | ) | |||||||
DICE Therapeutics, Inc. (a) | 2,800 | (80,220 | ) | |||||||
Disc Medicine, Inc. (a) | 30 | (636 | ) | |||||||
DocGo, Inc. (a) | 2,100 | (18,165 | ) | |||||||
Dyadic International, Inc. (a) | 800 | (1,424 | ) | |||||||
Eagle Pharmaceuticals, Inc. (a) | 500 | (14,185 | ) | |||||||
Eargo, Inc. (a) | 1,930 | (9,032 | ) | |||||||
Edgewise Therapeutics, Inc. (a) | 700 | (4,669 | ) | |||||||
Eliem Therapeutics, Inc. (a) | 200 | (580 | ) | |||||||
Embecta Corp. | 6,900 | (194,028 | ) | |||||||
ENDRA Life Sciences, Inc. (a) | 245 | (556 | ) | |||||||
Entrada Therapeutics, Inc. (a) | 400 | (5,800 | ) | |||||||
Enzo Biochem, Inc. (a) | 400 | (972 | ) | |||||||
EQRx, Inc. (a) | 33,500 | (64,990 | ) | |||||||
Eton Pharmaceuticals, Inc. (a) | 1,300 | (5,005 | ) | |||||||
Foghorn Therapeutics, Inc. (a) | 800 | (4,960 | ) | |||||||
Fortress Biotech, Inc. (a) | 4,200 | (3,444 | ) | |||||||
Frequency Therapeutics, Inc. (a) | 2,500 | (1,258 | ) | |||||||
Fresh Tracks Therapeutics, Inc. (a) | 6 | (4 | ) | |||||||
Fulgent Genetics, Inc. (a) | 2,600 | (81,172 | ) | |||||||
Galectin Therapeutics, Inc. (a) | 500 | (1,050 | ) | |||||||
Genprex, Inc. (a) | 2,000 | (1,820 | ) | |||||||
Geovax Labs, Inc. (a) | 1,900 | (1,264 | ) | |||||||
Geron Corp. (a) | 13,900 | (30,163 | ) | |||||||
Ginkgo Bioworks Holdings, Inc. (a) | 202,400 | (269,192 | ) | |||||||
Greenwich Lifesciences, Inc. (a) | 700 | (9,653 | ) | |||||||
Gritstone bio, Inc. (a) | 1,300 | (3,614 | ) | |||||||
GT Biopharma, Inc. (a) | 600 | (330 | ) | |||||||
Guardion Health Sciences, Inc. (a) | 318 | (1,943 | ) | |||||||
Harpoon Therapeutics, Inc. (a) | 9,800 | (7,293 | ) | |||||||
Henry Schein, Inc. (a) | 9,400 | (766,476 | ) | |||||||
Hepion Pharmaceuticals, Inc. (a) | 3,300 | (2,562 | ) | |||||||
Heron Therapeutics, Inc. (a) | 23,900 | (36,089 | ) | |||||||
HilleVax, Inc. (a) | 500 | (8,265 | ) | |||||||
Histogen, Inc. (a) | 28 | (34 | ) | |||||||
Homology Medicines, Inc. (a) | 2,500 | (2,575 | ) | |||||||
Hookipa Pharma, Inc. (a) | 300 | (221 | ) | |||||||
Humacyte, Inc. (a) | 3,400 | (10,506 | ) | |||||||
Humanigen, Inc. (a) | 25,000 | (3,588 | ) | |||||||
See Notes to Consolidated Financial Statements.
130
Table of Contents
Blackstone Alternative Multi-Strategy Fund and Subsidiaries
Consolidated Schedule of Investments ^ (Continued)
March 31, 2023
Security Description | Shares | Value | ||||||||
iBio, Inc. (a) | 12 | $ | (25 | ) | ||||||
Icosavax, Inc. (a) | 1,100 | (6,380 | ) | |||||||
IDEXX Laboratories, Inc. (a) | 400 | (200,032 | ) | |||||||
IGM Biosciences, Inc. (a) | 100 | (1,374 | ) | |||||||
Ikena Oncology, Inc. (a) | 800 | (2,760 | ) | |||||||
ImmunityBio, Inc. (a) | 20,000 | (36,400 | ) | |||||||
ImmunoPrecise Antibodies Ltd. (a) | 200 | (554 | ) | |||||||
Inmune Bio, Inc. (a) | 1,100 | (7,106 | ) | |||||||
Innovage Holding Corp. (a) | 400 | (3,192 | ) | |||||||
Inotiv, Inc. (a) | 400 | (1,732 | ) | |||||||
Insulet Corp. (a) | 4,000 | (1,275,840 | ) | |||||||
Intra-Cellular Therapies, Inc. (a) | 1,300 | (70,395 | ) | |||||||
Invitae Corp. (a) | 63,300 | (85,455 | ) | |||||||
Invivyd, Inc. (a) | 5,300 | (6,360 | ) | |||||||
iRhythm Technologies, Inc. (a) | 4,200 | (520,926 | ) | |||||||
iTeos Therapeutics, Inc. (a) | 3,200 | (43,552 | ) | |||||||
Iterum Therapeutics PLC (a) | 1,413 | (1,413 | ) | |||||||
IVERIC bio, Inc. (a) | 600 | (14,598 | ) | |||||||
Jaguar Health, Inc. (a) | 5,803 | (3,641 | ) | |||||||
JanOne, Inc. (a) | 1,438 | (1,639 | ) | |||||||
Janux Therapeutics, Inc. (a) | 600 | (7,260 | ) | |||||||
Jupiter Wellness, Inc. (a) | 2,600 | (1,158 | ) | |||||||
Keros Therapeutics, Inc. (a) | 100 | (4,270 | ) | |||||||
Kiniksa Pharmaceuticals Ltd., Class A (a) | 1,000 | (10,760 | ) | |||||||
Kinnate Biopharma, Inc. (a) | 400 | (2,500 | ) | |||||||
KORU Medical Systems, Inc. (a) | 300 | (1,266 | ) | |||||||
Krystal Biotech, Inc. (a) | 2,100 | (168,126 | ) | |||||||
Legend Biotech Corp., ADR (a) | 6,300 | (303,786 | ) | |||||||
Lexaria Bioscience Corp. (a) | 300 | (816 | ) | |||||||
Lexicon Pharmaceuticals, Inc. (a) | 3,800 | (9,234 | ) | |||||||
LianBio, ADR (a) | 3,700 | (7,215 | ) | |||||||
Lifecore Biomedical, Inc. (a) | 300 | (1,133 | ) | |||||||
LifeStance Health Group, Inc. (a) | 8,400 | (62,412 | ) | |||||||
Liminal BioSciences, Inc. (a) | 140 | (494 | ) | |||||||
Lisata Therapeutics, Inc. (a) | 200 | (650 | ) | |||||||
Longboard Pharmaceuticals, Inc. (a) | 100 | (393 | ) | |||||||
Longeveron, Inc. (a) | 900 | (2,403 | ) | |||||||
Lucid Diagnostics, Inc. (a) | 1,600 | (2,240 | ) | |||||||
Marpai, Inc., Class A (a) | 700 | (667 | ) | |||||||
Matinas BioPharma Holdings, Inc. (a) | 7,000 | (3,290 | ) | |||||||
Microbot Medical, Inc. (a) | 200 | (416 | ) | |||||||
Milestone Scientific, Inc. (a) | 1,300 | (1,170 | ) | |||||||
Mind Medicine MindMed, Inc. (a) | 2,706 | (8,578 | ) | |||||||
MiNK Therapeutics, Inc. (a) | 400 | (768 | ) | |||||||
Mirati Therapeutics, Inc. (a) | 200 | (7,436 | ) | |||||||
Moderna, Inc. (a) | 48,900 | (7,510,062 | ) | |||||||
See Notes to Consolidated Financial Statements.
131
Table of Contents
Blackstone Alternative Multi-Strategy Fund and Subsidiaries
Consolidated Schedule of Investments ^ (Continued)
March 31, 2023
Security Description | Shares | Value | ||||||||
ModivCare, Inc. (a) | 500 | $ | (42,040 | ) | ||||||
Monte Rosa Therapeutics, Inc. (a) | 2,100 | (16,359 | ) | |||||||
Morphic Holding, Inc. (a) | 800 | (30,112 | ) | |||||||
Motus GI Holdings, Inc. (a) | 200 | (194 | ) | |||||||
MyMD Pharmaceuticals, Inc. (a) | 1,100 | (1,892 | ) | |||||||
Myriad Genetics, Inc. (a) | 4,200 | (97,566 | ) | |||||||
Nabriva Therapeutics PLC (a) | 176 | (304 | ) | |||||||
NanoVibronix, Inc. (a) | 600 | (2,028 | ) | |||||||
Nautilus Biotechnology, Inc. (a) | 2,300 | (6,371 | ) | |||||||
Neogen Corp. (a) | 2,800 | (51,856 | ) | |||||||
Neovasc, Inc. (a) | 16 | (466 | ) | |||||||
NRX Pharmaceuticals, Inc. (a) | 5,200 | (3,427 | ) | |||||||
Nuvalent, Inc., Class A (a) | 1,600 | (41,744 | ) | |||||||
Ocugen, Inc. (a) | 3,600 | (3,071 | ) | |||||||
Omega Therapeutics, Inc. (a) | 400 | (2,412 | ) | |||||||
OmniAb, Inc. (a) | 5,800 | (21,344 | ) | |||||||
Oncocyte Corp. (a) | 6,000 | (2,126 | ) | |||||||
OpGen, Inc. (a) | 2,105 | (2,800 | ) | |||||||
Optinose, Inc. (a) | 1,800 | (3,474 | ) | |||||||
Oragenics, Inc. (a) | 10 | (33 | ) | |||||||
Organon & Co. | 4,100 | (96,432 | ) | |||||||
Orgenesis, Inc. (a) | 600 | (708 | ) | |||||||
OrthoPediatrics Corp. (a) | 400 | (17,716 | ) | |||||||
Outlook Therapeutics, Inc. (a) | 200 | (218 | ) | |||||||
Ovid therapeutics, Inc. (a) | 1,800 | (4,644 | ) | |||||||
Owens & Minor, Inc. (a) | 1,000 | (14,550 | ) | |||||||
P3 Health Partners, Inc. (a) | 100 | (106 | ) | |||||||
Pacific Biosciences of California, Inc. | 10,500 | (121,590 | ) | |||||||
Palatin Technologies, Inc. (a) | 576 | (1,584 | ) | |||||||
Palisade Bio, Inc. (a) | 200 | (704 | ) | |||||||
Paragon 28, Inc. (a) | 800 | (13,656 | ) | |||||||
Pardes Biosciences, Inc. (a) | 3,000 | (3,960 | ) | |||||||
Patterson Cos., Inc. | 600 | (16,062 | ) | |||||||
PAVmed, Inc. (a) | 14,600 | (5,453 | ) | |||||||
PDL BioPharma, Inc. (a),(c) | 4,500 | (11,115 | ) | |||||||
Penumbra, Inc. (a) | 3,900 | (1,086,891 | ) | |||||||
Petros Pharmaceuticals, Inc. (a) | 190 | (270 | ) | |||||||
PetVivo Holdings, Inc. (a) | 400 | (1,116 | ) | |||||||
Pluri, Inc. (a) | 1,500 | (1,530 | ) | |||||||
Precision BioSciences, Inc. (a) | 1,500 | (1,130 | ) | |||||||
Provention Bio, Inc. (a) | 200 | (4,820 | ) | |||||||
Pyxis Oncology, Inc. (a) | 3,900 | (15,639 | ) | |||||||
Quantum-Si, Inc. (a) | 7,400 | (13,024 | ) | |||||||
QuidelOrtho Corp. (a) | 1,556 | (138,624 | ) | |||||||
Rallybio Corp. (a) | 200 | (1,142 | ) | |||||||
Recursion Pharmaceuticals, Inc., Class A (a) | 1,500 | (10,005 | ) | |||||||
See Notes to Consolidated Financial Statements.
132
Table of Contents
Blackstone Alternative Multi-Strategy Fund and Subsidiaries
Consolidated Schedule of Investments ^ (Continued)
March 31, 2023
Security Description | Shares | Value | ||||||||
REGENXBIO, Inc. (a) | 700 | $ | (13,237 | ) | ||||||
Regulus Therapeutics, Inc. (a) | 200 | (169 | ) | |||||||
Repligen Corp. (a) | 400 | (67,344 | ) | |||||||
Retractable Technologies, Inc. (a) | 500 | (875 | ) | |||||||
Reviva Pharmaceuticals Holdings, Inc. (a) | 87 | (365 | ) | |||||||
Rhythm Pharmaceuticals, Inc. (a) | 700 | (12,488 | ) | |||||||
Rockwell Medical, Inc. (a) | 1,036 | (1,875 | ) | |||||||
SAB Biotherapeutics, Inc. (a) | 100 | (44 | ) | |||||||
Sanara Medtech, Inc. (a) | 100 | (4,125 | ) | |||||||
Scholar Rock Holding Corp. (a) | 2,500 | (20,000 | ) | |||||||
SCYNEXIS, Inc. (a) | 4,400 | (13,200 | ) | |||||||
Seagen, Inc. (a) | 100 | (20,247 | ) | |||||||
Seelos Therapeutics, Inc. (a) | 13,400 | (9,262 | ) | |||||||
Seer, Inc. (a) | 3,800 | (14,668 | ) | |||||||
Select Medical Holdings Corp. | 400 | (10,340 | ) | |||||||
SELLAS Life Sciences Group, Inc. (a) | 667 | (954 | ) | |||||||
Senseonics Holdings, Inc. (a) | 83,500 | (59,285 | ) | |||||||
Seres Therapeutics, Inc. (a) | 200 | (1,134 | ) | |||||||
Sientra, Inc. (a) | 1,000 | (1,540 | ) | |||||||
SmileDirectClub, Inc. (a) | 48,200 | (20,726 | ) | |||||||
SNDL, Inc. (a) | 99,340 | (158,944 | ) | |||||||
Sobr Safe, Inc. (a) | 146 | (288 | ) | |||||||
SomaLogic, Inc. (a) | 100 | (255 | ) | |||||||
Sonendo, Inc. (a) | 2,300 | (4,600 | ) | |||||||
Spectrum Pharmaceuticals, Inc. (a) | 35,100 | (26,325 | ) | |||||||
Spero Therapeutics, Inc. (a) | 8,000 | (11,600 | ) | |||||||
Standard BioTools, Inc. (a) | 6,500 | (12,675 | ) | |||||||
STERIS PLC | 800 | (153,024 | ) | |||||||
Stryker Corp. | 3,200 | (913,504 | ) | |||||||
Surgalign Holdings, Inc. (a) | 140 | (224 | ) | |||||||
T2 Biosystems, Inc. (a) | 548 | (252 | ) | |||||||
Tango Therapeutics, Inc. (a) | 1,200 | (4,740 | ) | |||||||
Taro Pharmaceutical Industries Ltd. (a) | 100 | (2,432 | ) | |||||||
Taysha Gene Therapies, Inc. (a) | 11,300 | (9,013 | ) | |||||||
Tempest Therapeutics, Inc. (a) | 400 | (928 | ) | |||||||
Tenet Healthcare Corp. (a) | 9,500 | (564,490 | ) | |||||||
TFF Pharmaceuticals, Inc. (a) | 1,500 | (1,028 | ) | |||||||
TherapeuticsMD, Inc. (a) | 930 | (3,488 | ) | |||||||
Thorne HealthTech, Inc. (a) | 800 | (3,696 | ) | |||||||
Titan Pharmaceuticals, Inc. (a) | 300 | (248 | ) | |||||||
Tonix Pharmaceuticals Holding Corp. (a) | 6,900 | (4,079 | ) | |||||||
Tyra Biosciences, Inc. (a) | 200 | (3,214 | ) | |||||||
UNITY Biotechnology, Inc. (a) | 6,010 | (9,796 | ) | |||||||
UpHealth, Inc. (a) | 530 | (790 | ) | |||||||
UroGen Pharma Ltd. (a) | 800 | (7,392 | ) | |||||||
Vaccinex, Inc. (a) | 1,000 | (400 | ) | |||||||
See Notes to Consolidated Financial Statements.
133
Table of Contents
Blackstone Alternative Multi-Strategy Fund and Subsidiaries
Consolidated Schedule of Investments ^ (Continued)
March 31, 2023
Security Description | Shares | Value | ||||||||
Vapotherm, Inc. (a) | 100 | $ | (66 | ) | ||||||
Vaxxinity, Inc., Class A (a) | 3,000 | (6,810 | ) | |||||||
VBI Vaccines, Inc. (a) | 12,300 | (3,727 | ) | |||||||
Ventyx Biosciences, Inc. (a) | 100 | (3,350 | ) | |||||||
Veracyte, Inc. (a) | 3,100 | (69,130 | ) | |||||||
Veru, Inc. (a) | 18,200 | (21,112 | ) | |||||||
Vicarious Surgical, Inc. (a) | 2,000 | (4,540 | ) | |||||||
Vir Biotechnology, Inc. (a) | 12,100 | (281,567 | ) | |||||||
VistaGen Therapeutics, Inc. (a) | 21,500 | (2,681 | ) | |||||||
Vivani Medical, Inc. (a) | 966 | (966 | ) | |||||||
VolitionRX Ltd. (a) | 900 | (1,719 | ) | |||||||
Vor BioPharma, Inc. (a) | 1,100 | (5,918 | ) | |||||||
Voyager Therapeutics, Inc. (a) | 500 | (3,855 | ) | |||||||
vTv Therapeutics, Inc., Class A (a) | 1,300 | (1,050 | ) | |||||||
VYNE Therapeutics, Inc. (a) | 266 | (819 | ) | |||||||
WaVe Life Sciences Ltd. (a) | 200 | (866 | ) | |||||||
X4 Pharmaceuticals, Inc. (a) | 2,300 | (2,001 | ) | |||||||
Xenon Pharmaceuticals, Inc. (a) | 100 | (3,579 | ) | |||||||
Xeris Biopharma Holdings, Inc. (a) | 21,942 | (35,765 | ) | |||||||
Zentalis Pharmaceuticals, Inc. (a) | 800 | (13,760 | ) | |||||||
Zevra Therapeutics, Inc. (a) | 2,900 | (15,950 | ) | |||||||
Zimvie, Inc. (a) | 100 | (723 | ) | |||||||
Zivo Bioscience, Inc. (a) | 200 | (612 | ) | |||||||
Zomedica Corp. (a) | 171,900 | (36,391 | ) | |||||||
Zynex, Inc. (a) | 800 | (9,600 | ) | |||||||
|
| |||||||||
| (25,168,011 | ) | |||||||||
|
| |||||||||
Industrial Products — (0.2)% |
| |||||||||
Advanced Energy Industries, Inc. | 400 | (39,200 | ) | |||||||
AeroVironment, Inc. (a) | 600 | (54,996 | ) | |||||||
AerSale Corp. (a) | 200 | (3,444 | ) | |||||||
AEye, Inc. (a) | 10,000 | (3,148 | ) | |||||||
AgEagle Aerial Systems, Inc. (a) | 14,600 | (6,570 | ) | |||||||
Alpine 4 Holdings, Inc. (a) | 14,100 | (7,191 | ) | |||||||
AMMO, Inc. (a) | 26,400 | (52,008 | ) | |||||||
Astec Industries, Inc. | 100 | (4,125 | ) | |||||||
Astra Space, Inc. (a) | 1,100 | (467 | ) | |||||||
Atkore, Inc. (a) | 4,000 | (561,920 | ) | |||||||
Babcock & Wilcox Enterprises, Inc. (a) | 600 | (3,636 | ) | |||||||
Berkshire Grey, Inc. (a) | 25,000 | (34,500 | ) | |||||||
Blink Charging Co. (a) | 13,900 | (120,235 | ) | |||||||
Blue Bird Corp. (a) | 900 | (18,387 | ) | |||||||
Byrna Technologies, Inc. (a) | 1,300 | (9,867 | ) | |||||||
CAE, Inc. (a) | 4,300 | (97,309 | ) | |||||||
Cemtrex, Inc. (a) | 311 | (2,566 | ) | |||||||
Chart Industries, Inc. (a) | 100 | (12,540 | ) | |||||||
See Notes to Consolidated Financial Statements.
134
Table of Contents
Blackstone Alternative Multi-Strategy Fund and Subsidiaries
Consolidated Schedule of Investments ^ (Continued)
March 31, 2023
Security Description | Shares | Value | ||||||||
Deere & Co. | 100 | $ | (41,288 | ) | ||||||
Eastman Kodak Co. (a) | 4,100 | (16,810 | ) | |||||||
Energous Corp. (a) | 6,400 | (3,456 | ) | |||||||
Evolv Technologies Holdings, Inc. (a) | 9,700 | (30,264 | ) | |||||||
FreightCar America, Inc. (a) | 700 | (2,184 | ) | |||||||
Fuel Tech, Inc. (a) | 1,300 | (1,664 | ) | |||||||
General Electric Co. | 51,000 | (4,875,600 | ) | |||||||
GrafTech International Ltd. | 5,500 | (26,730 | ) | |||||||
GreenPower Motor Co., Inc. (a) | 800 | (1,848 | ) | |||||||
Hillenbrand, Inc. | 400 | (19,012 | ) | |||||||
Hillman Solutions Corp. | 1,200 | (10,104 | ) | |||||||
Hyzon Motors, Inc. (a) | 13,300 | (10,841 | ) | |||||||
Ichor Holdings Ltd. (a) | 100 | (3,274 | ) | |||||||
Ideal Power, Inc. (a) | 300 | (3,135 | ) | |||||||
Ingersoll Rand, Inc. | 38,752 | (2,254,591 | ) | |||||||
John Bean Technologies Corp. | 100 | (10,929 | ) | |||||||
Kelso Technologies, Inc. (a) | 1,800 | (504 | ) | |||||||
Knightscope, Inc., Class A (a) | 8,600 | (7,662 | ) | |||||||
Lightning eMotors, Inc. (a) | 3,500 | (1,003 | ) | |||||||
Lion Electric Co. (The) (a) | 11,800 | (21,948 | ) | |||||||
Mirion Technologies, Inc. (a) | 14,000 | (119,560 | ) | |||||||
Momentus, Inc. (a) | 10,000 | (5,850 | ) | |||||||
Nikola Corp. | 101,800 | (123,178 | ) | |||||||
Novanta, Inc. (a) | 1,500 | (238,635 | ) | |||||||
NuScale Power Corp. (a) | 2,800 | (25,452 | ) | |||||||
PACCAR, Inc. | 50 | (3,660 | ) | |||||||
Proterra, Inc. (a) | 16,600 | (25,232 | ) | |||||||
RBC Bearings, Inc. (a) | 300 | (69,819 | ) | |||||||
Redwire Corp. (a) | 1,000 | (3,030 | ) | |||||||
Research Frontiers, Inc. (a) | 600 | (1,026 | ) | |||||||
SKYX Platforms Corp. (a) | 2,300 | (7,958 | ) | |||||||
SmartRent, Inc. (a) | 11,900 | (30,345 | ) | |||||||
TAT Technologies Ltd. (a) | 100 | (590 | ) | |||||||
Transphorm, Inc. (a) | 100 | (399 | ) | |||||||
Trinity Industries, Inc. | 1,800 | (43,848 | ) | |||||||
Urban-Gro, Inc. (a) | 1,000 | (2,700 | ) | |||||||
Vertiv Holdings Co. | 43,800 | (626,778 | ) | |||||||
VirTra, Inc. (a) | 100 | (403 | ) | |||||||
Vontier Corp. | 5,100 | (139,434 | ) | |||||||
Workhorse Group, Inc. (a) | 600 | (798 | ) | |||||||
Wrap Technologies, Inc. (a) | 2,000 | (3,440 | ) | |||||||
Xometry, Inc., Class A (a) | 5,500 | (82,335 | ) | |||||||
Xos, Inc. (a) | 5,300 | (2,782 | ) | |||||||
|
| |||||||||
| (9,932,208 | ) | |||||||||
|
| |||||||||
See Notes to Consolidated Financial Statements.
135
Table of Contents
Blackstone Alternative Multi-Strategy Fund and Subsidiaries
Consolidated Schedule of Investments ^ (Continued)
March 31, 2023
Security Description | Shares | Value | ||||||||
Industrial Services — (0.4)% |
| |||||||||
Alaska Air Group, Inc. (a) | 16,700 | $ | (700,732 | ) | ||||||
Alight, Inc., Class A (a) | 12,400 | (114,204 | ) | |||||||
Allegiant Travel Co. (a) | 500 | (45,990 | ) | |||||||
AMN Healthcare Services, Inc. (a) | 100 | (8,296 | ) | |||||||
Aqua Metals, Inc. (a) | 4,400 | (4,400 | ) | |||||||
Aramark | 41,300 | (1,478,540 | ) | |||||||
Arcosa, Inc. | 800 | (50,488 | ) | |||||||
Canadian Pacific Railway Ltd. | 34,730 | (2,672,126 | ) | |||||||
Centrus Energy Corp., Class A (a) | 1,500 | (48,300 | ) | |||||||
ClearSign Technologies Corp. (a) | 100 | (80 | ) | |||||||
Core & Main, Inc., Class A (a) | 1,700 | (39,270 | ) | |||||||
Cross Country Healthcare, Inc. (a) | 2,600 | (58,032 | ) | |||||||
Delta Air Lines, Inc. (a) | 61,700 | (2,154,564 | ) | |||||||
Deluxe Corp. | 800 | (12,800 | ) | |||||||
Denison Mines Corp. (a) | 140,700 | (153,363 | ) | |||||||
FedEx Corp. | 5,700 | (1,302,393 | ) | |||||||
Ferguson PLC | 6,300 | (842,625 | ) | |||||||
frontdoor, Inc. (a) | 300 | (8,364 | ) | |||||||
H&R Block, Inc. | 18,600 | (655,650 | ) | |||||||
Hawaiian Holdings, Inc. (a) | 500 | (4,580 | ) | |||||||
JB Hunt Transport Services, Inc. | 800 | (140,368 | ) | |||||||
Landstar System, Inc. | 1,100 | (197,186 | ) | |||||||
Latham Group, Inc. (a) | 7,800 | (22,308 | ) | |||||||
Li-Cycle Holdings Corp. (a) | 28,300 | (159,329 | ) | |||||||
Lightbridge Corp. (a) | 990 | (4,039 | ) | |||||||
Matson, Inc. | 4,200 | (250,614 | ) | |||||||
Montrose Environmental Group, Inc. (a) | 1,600 | (57,072 | ) | |||||||
NV5 Global, Inc. (a) | 100 | (10,397 | ) | |||||||
Old Dominion Freight Line, Inc. | 3,700 | (1,261,108 | ) | |||||||
Quad/Graphics, Inc. (a) | 300 | (1,287 | ) | |||||||
Quanta Services, Inc. | 12,500 | (2,083,000 | ) | |||||||
R1 RCM, Inc. (a) | 2,100 | (31,500 | ) | |||||||
Ritchie Bros Auctioneers, Inc. | 37 | (2,083 | ) | |||||||
Ryder System, Inc. | 800 | (71,392 | ) | |||||||
Saia, Inc. (a) | 3,800 | (1,033,904 | ) | |||||||
Seanergy Maritime Holdings Corp. | 5,170 | (26,160 | ) | |||||||
Spirit Airlines, Inc. | 43,400 | (745,178 | ) | |||||||
Sterling Check Corp. (a) | 2,100 | (23,415 | ) | |||||||
Sun Country Airlines Holdings, Inc. (a) | 2,200 | (45,100 | ) | |||||||
Team, Inc. (a) | 600 | (3,288 | ) | |||||||
Tetra Tech, Inc. | 300 | (44,073 | ) | |||||||
TFI International, Inc. | 1,300 | (155,077 | ) | |||||||
United Airlines Holdings, Inc. (a) | 200 | (8,850 | ) | |||||||
United Rentals, Inc. | 1,200 | (474,912 | ) | |||||||
WESCO International, Inc. | 3,900 | (602,706 | ) | |||||||
See Notes to Consolidated Financial Statements.
136
Table of Contents
Blackstone Alternative Multi-Strategy Fund and Subsidiaries
Consolidated Schedule of Investments ^ (Continued)
March 31, 2023
Security Description | Shares | Value | ||||||||
Wheels Up Experience, Inc. (a) | 13,400 | $ | (8,480 | ) | ||||||
Willdan Group, Inc. (a) | 600 | (9,372 | ) | |||||||
WW Grainger, Inc. | 100 | (68,881 | ) | |||||||
|
| |||||||||
| (17,895,876 | ) | |||||||||
|
| |||||||||
Insurance — (0.3)% |
| |||||||||
Ambac Financial Group, Inc. (a) | 500 | (7,740 | ) | |||||||
American International Group, Inc. | 22,100 | (1,112,956 | ) | |||||||
Arthur J Gallagher & Co. | 3,600 | (688,716 | ) | |||||||
Assurant, Inc. | 2,000 | (240,140 | ) | |||||||
Atlantic American Corp. | 200 | (490 | ) | |||||||
Berkshire Hathaway, Inc., Class B (a) | 19,700 | (6,082,769 | ) | |||||||
BRP Group, Inc., Class A (a) | 1,100 | (28,006 | ) | |||||||
Cincinnati Financial Corp. | 2,500 | (280,200 | ) | |||||||
Corebridge Financial, Inc. | 10,500 | (168,210 | ) | |||||||
Enstar Group Ltd. (a) | 100 | (23,179 | ) | |||||||
GoHealth, Inc., Class A (a) | 1,219 | (19,845 | ) | |||||||
Hagerty, Inc., Class A (a) | 2,000 | (17,480 | ) | |||||||
Hippo Holdings, Inc. (a) | 1,224 | (19,866 | ) | |||||||
Kemper Corp. | 300 | (16,398 | ) | |||||||
Manulife Financial Corp. | 92,200 | (1,692,792 | ) | |||||||
Primerica, Inc. | 300 | (51,672 | ) | |||||||
Principal Financial Group, Inc. | 13,600 | (1,010,752 | ) | |||||||
Radian Group, Inc. | 500 | (11,050 | ) | |||||||
Root, Inc., Class A (a) | 417 | (1,881 | ) | |||||||
Selective Insurance Group, Inc. | 200 | (19,066 | ) | |||||||
Sun Life Financial, Inc. | 12,100 | (565,070 | ) | |||||||
Willis Towers Watson PLC | 1,800 | (418,284 | ) | |||||||
|
| |||||||||
| (12,476,562 | ) | |||||||||
|
| |||||||||
Materials — (0.6)% |
| |||||||||
5E Advanced Materials, Inc. (a) | 2,700 | (14,634 | ) | |||||||
A-Mark Precious Metals, Inc. | 2,300 | (79,695 | ) | |||||||
Advanced Drainage Systems, Inc. | 1,500 | (126,315 | ) | |||||||
Agnico Eagle Mines Ltd. | 12,600 | (642,222 | ) | |||||||
Albemarle Corp. | 12,700 | (2,807,208 | ) | |||||||
Algoma Steel Group, Inc. | 27,200 | (219,776 | ) | |||||||
American Resources Corp. (a) | 6,100 | (9,150 | ) | |||||||
Amyris, Inc. (a) | 17,000 | (23,120 | ) | |||||||
Arconic Corp. (a) | 5,700 | (149,511 | ) | |||||||
Ardagh Metal Packaging SA | 41,800 | (170,544 | ) | |||||||
Axalta Coating Systems Ltd. (a) | 1,000 | (30,290 | ) | |||||||
Ball Corp. | 15,400 | (848,694 | ) | |||||||
Cameco Corp. | 79,100 | (2,070,047 | ) | |||||||
CF Industries Holdings, Inc. | 700 | (50,743 | ) | |||||||
Cleveland-Cliffs, Inc. (a) | 126,800 | (2,324,244 | ) | |||||||
See Notes to Consolidated Financial Statements.
137
Table of Contents
Blackstone Alternative Multi-Strategy Fund and Subsidiaries
Consolidated Schedule of Investments ^ (Continued)
March 31, 2023
Security Description | Shares | Value | ||||||||
Commercial Metals Co. | 300 | $ | (14,670 | ) | ||||||
Corteva, Inc. | 11,400 | (687,534 | ) | |||||||
CPS Technologies Corp. (a) | 800 | (2,272 | ) | |||||||
Dakota Gold Corp. (a) | 2,600 | (9,412 | ) | |||||||
Danimer Scientific, Inc. (a) | 23,900 | (82,455 | ) | |||||||
Diversey Holdings Ltd. (a) | 7,400 | (59,866 | ) | |||||||
EMX Royalty Corp. (a) | 300 | (597 | ) | |||||||
Encore Wire Corp. | 2,100 | (389,193 | ) | |||||||
Energy Fuels, Inc. (a) | 51,300 | (286,254 | ) | |||||||
Equinox Gold Corp. (a) | 42,100 | (216,815 | ) | |||||||
Freeport-McMoRan, Inc. | 26,900 | (1,100,479 | ) | |||||||
Gold Resource Corp. | 800 | (840 | ) | |||||||
Golden Minerals Co. (a) | 1,400 | (284 | ) | |||||||
GreenLight Biosciences Holdings PBC (a) | 2,700 | (1,168 | ) | |||||||
Hallador Energy Co. (a) | 900 | (8,271 | ) | |||||||
Hecla Mining Co. | 8,740 | (55,324 | ) | |||||||
Hycroft Mining Holding Corp. (a) | 63,800 | (27,587 | ) | |||||||
International Flavors & Fragrances, Inc. | 5,800 | (533,368 | ) | |||||||
International Paper Co. | 23,000 | (829,380 | ) | |||||||
Ivanhoe Electric, Inc. (a) | 1,500 | (18,225 | ) | |||||||
Kaiser Aluminum Corp. | 600 | (44,778 | ) | |||||||
Largo, Inc. (a) | 800 | (4,144 | ) | |||||||
Lightwave Logic, Inc. (a) | 200 | (1,046 | ) | |||||||
Louisiana-Pacific Corp. | 2,900 | (157,209 | ) | |||||||
MAG Silver Corp. (a) | 5,300 | (67,151 | ) | |||||||
Mativ Holdings, Inc. | 600 | (12,882 | ) | |||||||
Metalla Royalty & Streaming Ltd. (a) | 2,600 | (14,534 | ) | |||||||
Methanex Corp. | 100 | (4,653 | ) | |||||||
Mosaic Co. | 2,300 | (105,524 | ) | |||||||
MP Materials Corp. (a) | 2,300 | (64,837 | ) | |||||||
NexGen Energy Ltd. (a) | 1,200 | (4,596 | ) | |||||||
Nouveau Monde Graphite, Inc. (a) | 1,000 | (5,130 | ) | |||||||
Novagold Resources, Inc. (a) | 100 | (622 | ) | |||||||
Nucor Corp. | 23,400 | (3,614,598 | ) | |||||||
Nutrien Ltd. | 27,500 | (2,030,875 | ) | |||||||
Olin Corp. | 1,100 | (61,050 | ) | |||||||
Orla Mining Ltd. (a) | 2,300 | (10,925 | ) | |||||||
Peabody Energy Corp. (a) | 51,200 | (1,310,720 | ) | |||||||
Perimeter Solutions SA (a) | 9,100 | (73,528 | ) | |||||||
Piedmont Lithium, Inc. (a) | 500 | (30,025 | ) | |||||||
Quaker Chemical Corp. | 400 | (79,180 | ) | |||||||
Reliance Steel & Aluminum Co. | 600 | (154,044 | ) | |||||||
Reto Eco-solutions, Inc. (a) | 1,900 | (741 | ) | |||||||
Royal Gold, Inc. | 3,100 | (402,101 | ) | |||||||
RPM International, Inc. | 100 | (8,724 | ) | |||||||
SilverCrest Metals, Inc. (a) | 23,900 | (170,646 | ) | |||||||
See Notes to Consolidated Financial Statements.
138
Table of Contents
Blackstone Alternative Multi-Strategy Fund and Subsidiaries
Consolidated Schedule of Investments ^ (Continued)
March 31, 2023
Security Description | Shares | Value | ||||||||
Solitario Zinc Corp. (a) | 100 | $ | (66 | ) | ||||||
Southern Copper Corp. | 1,100 | (83,875 | ) | |||||||
SSR Mining, Inc. | 16,300 | (246,456 | ) | |||||||
Steel Dynamics, Inc. | 12,200 | (1,379,332 | ) | |||||||
Summit Materials, Inc., Class A (a) | 5 | (143 | ) | |||||||
TMC the metals Co., Inc. (a) | 100 | (83 | ) | |||||||
Trinseo PLC | 1,700 | (35,445 | ) | |||||||
UFP Industries, Inc. | 1,400 | (111,258 | ) | |||||||
Ur-Energy, Inc. (a) | 37,800 | (40,068 | ) | |||||||
Uranium Energy Corp. (a) | 126,100 | (363,168 | ) | |||||||
Uranium Royalty Corp. (a) | 6,000 | (12,360 | ) | |||||||
View, Inc. (a) | 24,400 | (12,200 | ) | |||||||
WD-40 Co. | 300 | (53,415 | ) | |||||||
Westlake Corp. | 5,200 | (603,096 | ) | |||||||
Westwater Resources, Inc. (a) | 100 | (111 | ) | |||||||
Worthington Industries, Inc. | 700 | (45,255 | ) | |||||||
|
| |||||||||
| (25,310,781 | ) | |||||||||
|
| |||||||||
Media — (0.3)% |
| |||||||||
Advantage Solutions, Inc. (a) | 3,900 | (6,162 | ) | |||||||
AMC Networks, Inc., Class A (a) | 500 | (8,790 | ) | |||||||
Arena Group Holdings Inc. (The) (a) | 400 | (1,700 | ) | |||||||
Blade Air Mobility, Inc. (a) | 7,300 | (24,674 | ) | |||||||
Boston Omaha Corp., Class A (a) | 300 | (7,101 | ) | |||||||
Cars.com, Inc. (a) | 1,600 | (30,880 | ) | |||||||
Chicken Soup For The Soul Entertainment, Inc. (a) | 1,900 | (3,800 | ) | |||||||
Cinedigm Corp., Class A (a) | 17,300 | (7,266 | ) | |||||||
Cumulus Media, Inc., Class A (a) | 100 | (369 | ) | |||||||
CuriosityStream, Inc. (a) | 2,500 | (3,375 | ) | |||||||
DISH Network Corp., Class A (a) | 14,900 | (139,017 | ) | |||||||
Engine Gaming and Media, Inc. (a) | 900 | (1,215 | ) | |||||||
Enthusiast Gaming Holdings, Inc. (a) | 3,700 | (2,146 | ) | |||||||
Entravision Communications Corp., Class A | 700 | (4,235 | ) | |||||||
EverQuote, Inc., Class A (a) | 1,200 | (16,680 | ) | |||||||
EW Scripps Co., Class A (a) | 3,600 | (33,876 | ) | |||||||
FaZe Holdings, Inc. (a) | 800 | (368 | ) | |||||||
Focus Universal, Inc. (a) | 900 | (2,250 | ) | |||||||
fuboTV, Inc. (a) | 49,700 | (60,137 | ) | |||||||
Gannett Co., Inc. (a) | 5,600 | (10,472 | ) | |||||||
Gray Television, Inc. | 12,300 | (107,256 | ) | |||||||
Groupon, Inc. (a) | 6,800 | (28,628 | ) | |||||||
iHeartMedia, Inc., Class A (a) | 8,500 | (33,150 | ) | |||||||
Inspirato, Inc. (a) | 2,700 | (2,589 | ) | |||||||
Inuvo, Inc. (a) | 6,100 | (1,780 | ) | |||||||
iSpecimen, Inc. (a) | 100 | (135 | ) | |||||||
IZEA Worldwide, Inc. (a) | 3,600 | (2,343 | ) | |||||||
See Notes to Consolidated Financial Statements.
139
Table of Contents
Blackstone Alternative Multi-Strategy Fund and Subsidiaries
Consolidated Schedule of Investments ^ (Continued)
March 31, 2023
Security Description | Shares | Value | ||||||||
Liberty Broadband Corp., Class C (a) | 13,000 | $ | (1,062,100 | ) | ||||||
Liberty Media Corp-Liberty Formula One, Class A (a) | 1,200 | (81,000 | ) | |||||||
Liberty Media Corp-Liberty SiriusXM, Class C | 22,000 | (615,780 | ) | |||||||
Liberty TripAdvisor Holdings, Inc., Class A (a) | 5,587 | (4,799 | ) | |||||||
LiveOne, Inc. (a) | 2,300 | (2,622 | ) | |||||||
MediaAlpha, Inc., Class A (a) | 2,000 | (29,960 | ) | |||||||
Meta Platforms, Inc., Class A | 7,600 | (1,610,744 | ) | |||||||
National CineMedia, Inc. | 2,000 | (264 | ) | |||||||
Nerdy, Inc. (a) | 12,600 | (52,668 | ) | |||||||
News Corp., Class A | 46,800 | (808,236 | ) | |||||||
Nexstar Media Group, Inc. | 4,211 | (727,071 | ) | |||||||
Opendoor Technologies, Inc. (a) | 31,700 | (55,792 | ) | |||||||
Paramount Global, Class B | 17,600 | (392,656 | ) | |||||||
Playstudios, Inc. (a) | 3,400 | (12,546 | ) | |||||||
Playtika Holding Corp. (a) | 2,600 | (29,276 | ) | |||||||
QuinStreet, Inc. (a) | 300 | (4,761 | ) | |||||||
Remark Holdings, Inc. (a) | 4,440 | (6,083 | ) | |||||||
Reservoir Media, Inc. (a) | 800 | (5,216 | ) | |||||||
Rumble, Inc. (a) | 13,300 | (133,000 | ) | |||||||
RumbleON, Inc., Class B (a) | 2,800 | (16,968 | ) | |||||||
Salem Media Group, Inc. (a) | 600 | (654 | ) | |||||||
Scholastic Corp. | 1,500 | (51,330 | ) | |||||||
Shaw Communications, Inc., Class B | 18,700 | (559,317 | ) | |||||||
Sinclair Broadcast Group, Inc., Class A | 6,000 | (102,960 | ) | |||||||
Skillz, Inc. (a) | 12,900 | (7,652 | ) | |||||||
Stagwell, Inc. (a) | 200 | (1,484 | ) | |||||||
Stran & Co., Inc. (a) | 1,200 | (2,088 | ) | |||||||
Take-Two Interactive Software, Inc. (a) | 20,000 | (2,386,000 | ) | |||||||
TEGNA, Inc. | 6,800 | (114,988 | ) | |||||||
Trade Desk, Inc. (The), Class A (a) | 2,500 | (152,275 | ) | |||||||
Uber Technologies, Inc. (a) | 49,100 | (1,556,470 | ) | |||||||
Vacasa, Inc., Class A (a) | 16,100 | (15,492 | ) | |||||||
Walt Disney Co. (a) | 15,900 | (1,592,067 | ) | |||||||
Warner Bros Discovery, Inc. (a) | 20,774 | (313,688 | ) | |||||||
|
| |||||||||
| (13,048,401 | ) | |||||||||
|
| |||||||||
Oil & Gas — (0.7)% |
| |||||||||
Amplify Energy Corp. (a) | 434 | (2,982 | ) | |||||||
Antero Midstream Corp. | 27,000 | (283,230 | ) | |||||||
Aris Water Solution, Inc., Class A | 6,800 | (52,972 | ) | |||||||
California Resources Corp. | 7,300 | (281,050 | ) | |||||||
Callon Petroleum Co. (a) | 6,600 | (220,704 | ) | |||||||
Camber Energy, Inc. (a) | 6,636 | (10,485 | ) | |||||||
Chevron Corp. (b) | 6,294 | (1,026,929 | ) | |||||||
Chord Energy Corp. | 200 | (26,920 | ) | |||||||
See Notes to Consolidated Financial Statements.
140
Table of Contents
Blackstone Alternative Multi-Strategy Fund and Subsidiaries
Consolidated Schedule of Investments ^ (Continued)
March 31, 2023
Security Description | Shares | Value | ||||||||
Comstock Resources, Inc. | 600 | $ | (6,474 | ) | ||||||
Coterra Energy, Inc. | 122,500 | (3,006,150 | ) | |||||||
Crescent Energy Co., Class A | 6,820 | (77,134 | ) | |||||||
Denbury, Inc. (a) | 2,100 | (184,023 | ) | |||||||
Devon Energy Corp. | 27,483 | (1,390,915 | ) | |||||||
Diamond Offshore Drilling, Inc. (a) | 4,400 | (52,976 | ) | |||||||
DT Midstream, Inc. | 6,700 | (330,779 | ) | |||||||
Enbridge, Inc. | 65,200 | (2,487,380 | ) | |||||||
Equitrans Midstream Corp. | 41,400 | (239,292 | ) | |||||||
Excelerate Energy, Inc., Class A | 3,700 | (81,918 | ) | |||||||
Expro Group Holdings NV (a) | 9,900 | (181,764 | ) | |||||||
Exxon Mobil Corp. | 120,209 | (13,182,119 | ) | |||||||
EzFill Holdings, Inc. (a) | 400 | (122 | ) | |||||||
Gulfport Energy Corp. (a) | 1,800 | (144,000 | ) | |||||||
Hess Corp. | 4,800 | (635,232 | ) | |||||||
KLX Energy Services Holdings, Inc. (a) | 2,700 | (31,455 | ) | |||||||
New Fortress Energy, Inc. | 12,900 | (379,647 | ) | |||||||
Noble Corp. PLC (a) | 300 | (11,841 | ) | |||||||
Northern Oil and Gas, Inc. | 11,100 | (336,885 | ) | |||||||
Occidental Petroleum Corp. | 5,300 | (330,879 | ) | |||||||
ONEOK, Inc. | 24,600 | (1,563,084 | ) | |||||||
Ovintiv, Inc. | 82 | (2,958 | ) | |||||||
Pembina Pipeline Corp. | 15,900 | (515,160 | ) | |||||||
ProFrac Holding Corp., Class A (a) | 300 | (3,801 | ) | |||||||
SilverBow Resources, Inc. (a) | 1,500 | (34,275 | ) | |||||||
Sitio Royalties Corp., Class A | 307 | (6,938 | ) | |||||||
Superior Drilling Products, Inc. (a) | 100 | (89 | ) | |||||||
Targa Resources Corp. | 4,100 | (299,095 | ) | |||||||
TC Energy Corp. | 31,700 | (1,233,447 | ) | |||||||
TravelCenters of America, Inc. (a) | 60 | (5,190 | ) | |||||||
US Energy Corp. | 500 | (880 | ) | |||||||
VAALCO Energy, Inc. | 1,941 | (8,793 | ) | |||||||
Vertex Energy, Inc. (a) | 17,900 | (176,852 | ) | |||||||
Vital Energy, Inc. (a) | 4,950 | (225,423 | ) | |||||||
Williams Cos., Inc. | 51,900 | (1,549,734 | ) | |||||||
|
| |||||||||
| (30,621,976 | ) | |||||||||
|
| |||||||||
Real Estate — (0.6)% |
| |||||||||
Acadia Realty Trust | 1,200 | (16,740 | ) | |||||||
Alexander & Baldwin, Inc. | 800 | (15,128 | ) | |||||||
Alexandria Real Estate Equities, Inc. | 7,800 | (979,602 | ) | |||||||
Alset, Inc. (a) | 270 | (424 | ) | |||||||
Americold Realty Trust, Inc. | 20,800 | (591,760 | ) | |||||||
Anywhere Real Estate, Inc. (a) | 4,500 | (23,760 | ) | |||||||
Apartment Investment & Management Co., Class A | 1,200 | (9,228 | ) | |||||||
Apple Hospitality REIT, Inc. | 1,400 | (21,728 | ) | |||||||
See Notes to Consolidated Financial Statements.
141
Table of Contents
Blackstone Alternative Multi-Strategy Fund and Subsidiaries
Consolidated Schedule of Investments ^ (Continued)
March 31, 2023
Security Description | Shares | Value | ||||||||
Ashford Hospitality Trust, Inc. (a) | 9,300 | $ | (29,853 | ) | ||||||
Boston Properties, Inc. | 21,700 | (1,174,404 | ) | |||||||
Brandywine Realty Trust | 100 | (473 | ) | |||||||
CBL & Associates Properties, Inc. | 600 | (15,384 | ) | |||||||
CBRE Group, Inc., Class A (a) | 27,936 | (2,034,020 | ) | |||||||
Compass, Inc., Class A (a) | 900 | (2,907 | ) | |||||||
Corporate Office Properties Trust | 2,400 | (56,904 | ) | |||||||
Cousins Properties, Inc. | 1,800 | (38,484 | ) | |||||||
Cushman & Wakefield PLC (a) | 1,100 | (11,594 | ) | |||||||
DiamondRock Hospitality Co. | 2,600 | (21,138 | ) | |||||||
Digital Realty Trust, Inc. | 12,100 | (1,189,551 | ) | |||||||
Douglas Elliman, Inc. | 3,300 | (10,263 | ) | |||||||
Douglas Emmett, Inc. | 200 | (2,466 | ) | |||||||
Elme Communities | 2,800 | (50,008 | ) | |||||||
Empire State Realty Trust, Inc., Class A | 17,400 | (112,926 | ) | |||||||
Equinix, Inc. | 100 | (72,104 | ) | |||||||
Extra Space Storage, Inc. | 100 | (16,293 | ) | |||||||
Fathom Holdings, Inc. (a) | 800 | (3,400 | ) | |||||||
Federal Realty Investment Trust | 5,500 | (543,565 | ) | |||||||
Healthcare Realty Trust, Inc., Class A | 69,400 | (1,341,502 | ) | |||||||
Highwoods Properties, Inc. | 3,700 | (85,803 | ) | |||||||
Host Hotels & Resorts, Inc. | 152,500 | (2,514,725 | ) | |||||||
Howard Hughes Corp. (The) (a) | 2,000 | (160,000 | ) | |||||||
Hudson Pacific Properties, Inc. | 18,900 | (125,685 | ) | |||||||
Independence Realty Trust, Inc. | 1,000 | (16,030 | ) | |||||||
Innovative Industrial Properties, Inc. | 1,400 | (106,386 | ) | |||||||
InvenTrust Properties Corp. | 3,100 | (72,540 | ) | |||||||
Invitation Homes, Inc. | 700 | (21,861 | ) | |||||||
iStar, Inc. | 640 | (18,797 | ) | |||||||
Jones Lang LaSalle, Inc. (a) | 900 | (130,941 | ) | |||||||
Kennedy-Wilson Holdings, Inc. | 2,500 | (41,475 | ) | |||||||
Kimco Realty Corp. | 31,000 | (605,430 | ) | |||||||
Kite Realty Group Trust | 10,100 | (211,292 | ) | |||||||
Lamar Advertising Co., Class A | 1,500 | (149,835 | ) | |||||||
Macerich Co. | 7,000 | (74,200 | ) | |||||||
Medical Properties Trust, Inc. | 97,400 | (800,628 | ) | |||||||
Necessity Retail REIT, Inc. | 1,400 | (8,792 | ) | |||||||
NexPoint Diversified Real Estate Trust | 800 | (8,304 | ) | |||||||
Offerpad Solutions, Inc. (a) | 18,500 | (9,749 | ) | |||||||
Office Properties Income Trust | 2,500 | (30,750 | ) | |||||||
Omega Healthcare Investors, Inc. | 500 | (13,705 | ) | |||||||
Orion Office REIT, Inc. | 5,600 | (37,520 | ) | |||||||
Outfront Media, Inc. | 25,900 | (420,357 | ) | |||||||
Paramount Group, Inc. | 18,600 | (84,816 | ) | |||||||
Physicians Realty Trust | 9,100 | (135,863 | ) | |||||||
PotlatchDeltic Corp. | 4,721 | (233,690 | ) | |||||||
See Notes to Consolidated Financial Statements.
142
Table of Contents
Blackstone Alternative Multi-Strategy Fund and Subsidiaries
Consolidated Schedule of Investments ^ (Continued)
March 31, 2023
Security Description | Shares | Value | ||||||||
Prologis, Inc. | 6,100 | $ | (761,097 | ) | ||||||
Rayonier, Inc. | 2,400 | (79,824 | ) | |||||||
Regency Centers Corp. | 5,600 | (342,608 | ) | |||||||
Ryman Hospitality Properties, Inc. | 200 | (17,946 | ) | |||||||
Sabra Health Care REIT, Inc. | 4,700 | (54,050 | ) | |||||||
Saul Centers, Inc. | 100 | (3,900 | ) | |||||||
Simon Property Group, Inc. | 21,400 | (2,396,158 | ) | |||||||
SITE Centers Corp. | 900 | (11,052 | ) | |||||||
SL Green Realty Corp. | 22,051 | (518,640 | ) | |||||||
Star Holdings (a) | 612 | (10,643 | ) | |||||||
Sun Communities, Inc. | 2,700 | (380,376 | ) | |||||||
Sunstone Hotel Investors, Inc. | 19,200 | (189,696 | ) | |||||||
Tanger Factory Outlet Centers, Inc. | 4,700 | (92,261 | ) | |||||||
Tricon Residential, Inc. | 13,800 | (106,950 | ) | |||||||
Uniti Group, Inc. | 8,900 | (31,595 | ) | |||||||
Urban Edge Properties | 4,300 | (64,758 | ) | |||||||
Urstadt Biddle Properties, Inc., Class A | 100 | (1,757 | ) | |||||||
Ventas, Inc. | 23,038 | (998,697 | ) | |||||||
VICI Properties, Inc. | 87,873 | (2,866,417 | ) | |||||||
Vornado Realty Trust | 54,700 | (840,739 | ) | |||||||
Welltower, Inc. | 32,600 | (2,337,094 | ) | |||||||
WeWork, Inc., Class A (a) | 45,400 | (35,289 | ) | |||||||
Weyerhaeuser Co. | 39,900 | (1,202,187 | ) | |||||||
|
| |||||||||
| (27,848,517 | ) | |||||||||
|
| |||||||||
Renewable Energy — (0.1)% |
| |||||||||
Advent Technologies Holdings, Inc. (a) | 7,200 | (7,632 | ) | |||||||
Ameresco, Inc., Class A (a) | 3,400 | (167,348 | ) | |||||||
Array Technologies, Inc. (a) | 11,400 | (249,432 | ) | |||||||
Beam Global (a) | 1,300 | (20,683 | ) | |||||||
Cleanspark, Inc. (a) | 1,800 | (5,004 | ) | |||||||
Comstock, Inc. (a) | 7,100 | (2,393 | ) | |||||||
Energy Vault Holdings, Inc. (a) | 22,600 | (48,364 | ) | |||||||
EnerSys | 200 | (17,376 | ) | |||||||
Enphase Energy, Inc. | 4,345 | (913,667 | ) | |||||||
Enviva, Inc. | 3,500 | (101,080 | ) | |||||||
Eos Energy Enterprises, Inc. (a) | 36,800 | (94,576 | ) | |||||||
ESS Tech, Inc. (a) | 5,400 | (7,506 | ) | |||||||
Fluence Energy, Inc. (a) | 13,900 | (281,475 | ) | |||||||
Flux Power Holdings, Inc. (a) | 400 | (1,944 | ) | |||||||
Green Plains, Inc. (a) | 5,700 | (176,643 | ) | |||||||
iSun, Inc. (a) | 100 | (103 | ) | |||||||
Montauk Renewables, Inc. (a) | 500 | (3,935 | ) | |||||||
Plug Power, Inc. (a) | 10,100 | (118,372 | ) | |||||||
Shoals Technologies Group, Inc., Class A (a) | 16,600 | (378,314 | ) | |||||||
SolarEdge Technologies, Inc. | 8,200 | (2,492,390 | ) | |||||||
See Notes to Consolidated Financial Statements.
143
Table of Contents
Blackstone Alternative Multi-Strategy Fund and Subsidiaries
Consolidated Schedule of Investments ^ (Continued)
March 31, 2023
Security Description | Shares | Value | ||||||||
Spruce Power Holding Corp. (a) | 11,700 | $ | (9,594 | ) | ||||||
Stem, Inc. (a) | 500 | (2,835 | ) | |||||||
Sunnova Energy International, Inc. (a) | 200 | (3,124 | ) | |||||||
Sunrun, Inc. (a) | 31,015 | (624,952 | ) | |||||||
Sunworks, Inc. (a) | 14,000 | (20,160 | ) | |||||||
|
| |||||||||
| (5,748,902 | ) | |||||||||
|
| |||||||||
Retail & Wholesale—Discretionary — (0.8)% |
| |||||||||
1stdibs.com, Inc. (a) | 1,600 | (6,352 | ) | |||||||
Academy Sports & Outdoors, Inc. | 23,200 | (1,513,800 | ) | |||||||
aka Brands Holding Corp. (a) | 900 | (490 | ) | |||||||
American Eagle Outfitters, Inc. | 44,200 | (594,048 | ) | |||||||
Asbury Automotive Group, Inc. (a) | 700 | (147,000 | ) | |||||||
BARK, Inc. (a) | 11,200 | (16,240 | ) | |||||||
Best Buy Co., Inc. | 34,651 | (2,712,134 | ) | |||||||
Birks Group, Inc. (a) | 100 | (811 | ) | |||||||
Boot Barn Holdings, Inc. (a) | 5,900 | (452,176 | ) | |||||||
Builders FirstSource, Inc. (a) | 25,900 | (2,299,402 | ) | |||||||
Burlington Stores, Inc. (a) | 2,700 | (545,670 | ) | |||||||
Caleres, Inc. | 2,600 | (56,238 | ) | |||||||
CarParts.com, Inc. (a) | 3,400 | (18,156 | ) | |||||||
Carvana Co. (a) | 15,400 | (150,766 | ) | |||||||
Children's Place, Inc. (a) | 400 | (16,100 | ) | |||||||
Container Store Group, Inc. (a) | 1,900 | (6,517 | ) | |||||||
Designer Brands, Inc., Class A | 400 | (3,496 | ) | |||||||
Express, Inc. (a) | 3,400 | (2,680 | ) | |||||||
Figs, Inc., Class A (a) | 8,900 | (55,091 | ) | |||||||
Floor & Decor Holdings, Inc., Class A (a) | 7,800 | (766,116 | ) | |||||||
Franchise Group, Inc. | 4,100 | (111,725 | ) | |||||||
Freshpet, Inc. (a) | 700 | (46,333 | ) | |||||||
GrowGeneration Corp. (a) | 2,500 | (8,550 | ) | |||||||
Hertz Global Holdings, Inc. (a) | 74,100 | (1,207,089 | ) | |||||||
Hibbett, Inc. | 200 | (11,796 | ) | |||||||
Home Depot, Inc. (The) | 44,525 | (13,140,218 | ) | |||||||
Hour Loop, Inc. (a) | 300 | (600 | ) | |||||||
iPower, Inc. (a) | 800 | (431 | ) | |||||||
JOANN, Inc. | 2,700 | (4,293 | ) | |||||||
KAR Auction Services, Inc. (a) | 11,400 | (155,952 | ) | |||||||
Kirkland's, Inc. (a) | 2,100 | (5,985 | ) | |||||||
Kohl's Corp. | 10,200 | (240,108 | ) | |||||||
Leslie's, Inc. (a) | 10,000 | (110,100 | ) | |||||||
Lithia Motors, Inc. | 5,000 | (1,144,650 | ) | |||||||
Lowe's Cos., Inc. (b) | 8,350 | (1,669,750 | ) | |||||||
Lulu's Fashion Lounge Holdings, Inc. (a) | 2,000 | (4,760 | ) | |||||||
Lululemon Athletica, Inc. (a) | 2,600 | (946,894 | ) | |||||||
Macy's, Inc. | 1,300 | (22,737 | ) | |||||||
See Notes to Consolidated Financial Statements.
144
Table of Contents
Blackstone Alternative Multi-Strategy Fund and Subsidiaries
Consolidated Schedule of Investments ^ (Continued)
March 31, 2023
Security Description | Shares | Value | ||||||||
MarineMax, Inc. (a) | 300 | $ | (8,625 | ) | ||||||
Mister Car Wash, Inc. (a) | 7,400 | (63,788 | ) | |||||||
Newegg Commerce, Inc. (a) | 3,700 | (4,958 | ) | |||||||
Nordstrom, Inc. | 300 | (4,881 | ) | |||||||
ODP Corp. (a) | 4,000 | (179,920 | ) | |||||||
OneWater Marine, Inc., Class A (a) | 1,000 | (27,970 | ) | |||||||
Polished.com, Inc. (a) | 19,500 | (10,142 | ) | |||||||
Pool Corp. | 2,700 | (924,588 | ) | |||||||
RealReal, Inc. (a) | 40,400 | (50,904 | ) | |||||||
RH (a) | 1,100 | (267,905 | ) | |||||||
Rover Group, Inc. (a) | 6,900 | (31,257 | ) | |||||||
Shift Technologies, Inc. (a) | 6,020 | (6,742 | ) | |||||||
Signet Jewelers Ltd. | 12,000 | (933,360 | ) | |||||||
Sleep Number Corp. (a) | 5,400 | (164,214 | ) | |||||||
Solo Brands, Inc., Class A (a) | 200 | (1,436 | ) | |||||||
Sportsman's Warehouse Holdings, Inc. (a) | 6,700 | (56,816 | ) | |||||||
Takung Art Co., Ltd. (a) | 700 | (441 | ) | |||||||
ThredUp, Inc., Class A (a) | 4,500 | (11,385 | ) | |||||||
Tile Shop Holdings, Inc. (a) | 100 | (469 | ) | |||||||
Tilly's, Inc., Class A (a) | 2,400 | (18,504 | ) | |||||||
Tractor Supply Co. | 2,500 | (587,600 | ) | |||||||
Victoria's Secret & Co. (a) | 12,400 | (423,460 | ) | |||||||
Vroom, Inc. (a) | 58,100 | (52,214 | ) | |||||||
Williams-Sonoma, Inc. | 13,000 | (1,581,580 | ) | |||||||
|
| |||||||||
| (33,608,413 | ) | |||||||||
|
| |||||||||
Retail & Wholesale—Staples — (0.2)% |
| |||||||||
Albertsons Cos., Inc., Class A | 10,000 | (207,800 | ) | |||||||
Andersons, Inc. (The) | 600 | (24,792 | ) | |||||||
Archer-Daniels-Midland Co. | 13,300 | (1,059,478 | ) | |||||||
Big Lots, Inc. | 8,400 | (92,064 | ) | |||||||
Blue Apron Holdings, Inc., Class A (a) | 11,000 | (7,453 | ) | |||||||
Boxed, Inc. (a) | 28,300 | (5,371 | ) | |||||||
Bunge Ltd. | 18,200 | (1,738,464 | ) | |||||||
Calavo Growers, Inc. | 100 | (2,877 | ) | |||||||
Dollar Tree, Inc. (a) | 22,900 | (3,287,295 | ) | |||||||
Five Below, Inc. (a) | 5,900 | (1,215,223 | ) | |||||||
HF Foods Group, Inc. (a) | 400 | (1,568 | ) | |||||||
Ingles Markets, Inc., Class A | 100 | (8,870 | ) | |||||||
Mission Produce, Inc. (a) | 1,700 | (18,887 | ) | |||||||
Performance Food Group Co. (a) | 19,700 | (1,188,698 | ) | |||||||
Sysco Corp. | 1,800 | (139,014 | ) | |||||||
Target Corp. (b) | 9,353 | (1,549,137 | ) | |||||||
United Natural Foods, Inc. (a) | 2,000 | (52,700 | ) | |||||||
US Foods Holding Corp. (a) | 8,200 | (302,908 | ) | |||||||
|
| |||||||||
| (10,902,599 | ) | |||||||||
|
| |||||||||
See Notes to Consolidated Financial Statements.
145
Table of Contents
Blackstone Alternative Multi-Strategy Fund and Subsidiaries
Consolidated Schedule of Investments ^ (Continued)
March 31, 2023
Security Description | Shares | Value | ||||||||
Software — (0.0)% |
| |||||||||
Gitlab, Inc., Class A (a) | 13,700 | $ | (469,773 | ) | ||||||
|
| |||||||||
Software & Technology Services — (0.8)% |
| |||||||||
ACV Auctions, Inc., Class A (a) | 13,200 | (170,412 | ) | |||||||
Affirm Holdings, Inc. (a) | 32,200 | (362,894 | ) | |||||||
Alithya Group, Inc., Class A (a) | 300 | (597 | ) | |||||||
Alkami Technology, Inc. (a) | 700 | (8,862 | ) | |||||||
Amdocs Ltd. | 1,100 | (105,633 | ) | |||||||
Amplitude, Inc., Class A (a) | 200 | (2,488 | ) | |||||||
Aspen Technology, Inc. (a) | 2,300 | (526,401 | ) | |||||||
Auddia, Inc. (a) | 700 | (497 | ) | |||||||
AvePoint, Inc. (a) | 6,300 | (25,956 | ) | |||||||
AvidXchange Holdings, Inc. | 3,200 | (24,960 | ) | |||||||
Backblaze, Inc., Class A (a) | 900 | (4,545 | ) | |||||||
Bakkt Holdings, Inc. (a) | 33,000 | (56,760 | ) | |||||||
Bills Holdings, Inc. (a) | 17,300 | (1,403,722 | ) | |||||||
Bitfarms Ltd. (a) | 69,200 | (67,124 | ) | |||||||
Black Knight, Inc. (a) | 1,300 | (74,828 | ) | |||||||
Blend Labs, Inc., Class A (a) | 35,700 | (35,564 | ) | |||||||
Block, Inc. (a) | 43,200 | (2,965,680 | ) | |||||||
BM Technologies, Inc. (a) | 700 | (2,464 | ) | |||||||
Braze, Inc., Class A (a) | 2,800 | (96,796 | ) | |||||||
CareCloud, Inc. (a) | 700 | (2,345 | ) | |||||||
CDW Corp. | 500 | (97,445 | ) | |||||||
Ceridian HCM Holding, Inc. (a) | 6,100 | (446,642 | ) | |||||||
CGI, Inc. (a) | 1,500 | (144,405 | ) | |||||||
Cipher Mining, Inc. (a) | 4,000 | (9,320 | ) | |||||||
Clarivate PLC (a) | 88,700 | (832,893 | ) | |||||||
Concentrix Corp. | 2,100 | (255,255 | ) | |||||||
Consensus Cloud Solutions, Inc. (a) | 700 | (23,863 | ) | |||||||
Couchbase, Inc. (a) | 1,700 | (23,902 | ) | |||||||
CS Disco, Inc. (a) | 1,700 | (11,288 | ) | |||||||
DarioHealth Corp. (a) | 4,300 | (17,716 | ) | |||||||
Digital Turbine, Inc. (a) | 1,900 | (23,484 | ) | |||||||
DSS, Inc. (a) | 4,600 | (989 | ) | |||||||
Dun & Bradstreet Holdings, Inc. | 16,000 | (187,840 | ) | |||||||
DXC Technology Co. (a) | 10,500 | (268,380 | ) | |||||||
E2open Parent Holdings, Inc. (a) | 32,200 | (187,404 | ) | |||||||
EPAM Systems, Inc. (a) | 3,500 | (1,046,500 | ) | |||||||
Equifax, Inc. | 1,500 | (304,260 | ) | |||||||
Euronet Worldwide, Inc. (a) | 29,859 | (3,341,222 | ) | |||||||
EverCommerce, Inc. (a) | 2,900 | (30,682 | ) | |||||||
Exela Technologies, Inc. (a) | 17,075 | (664 | ) | |||||||
Expensify, Inc., Class A (a) | 200 | (1,630 | ) | |||||||
Faraday Future Intelligent Electric, Inc. (a) | 291,000 | (103,043 | ) | |||||||
See Notes to Consolidated Financial Statements.
146
Table of Contents
Blackstone Alternative Multi-Strategy Fund and Subsidiaries
Consolidated Schedule of Investments ^ (Continued)
March 31, 2023
Security Description | Shares | Value | ||||||||
Fiserv, Inc. (a) | 60,301 | $ | (6,815,822 | ) | ||||||
Five9, Inc. (a) | 8,100 | (585,549 | ) | |||||||
ForgeRock, Inc., Class A (a) | 10,400 | (214,240 | ) | |||||||
Genius Brands International, Inc. (a) | 4,760 | (12,995 | ) | |||||||
Glimpse Group, Inc. (The) (a) | 700 | (2,632 | ) | |||||||
Global Payments, Inc. | 7,400 | (778,776 | ) | |||||||
Globant SA (a) | 1,500 | (246,015 | ) | |||||||
Greenidge Generation Holdings, Inc. (a) | 2,600 | (1,175 | ) | |||||||
HireRight Holdings Corp. (a) | 800 | (8,488 | ) | |||||||
Hive Blockchain Technologies Ltd. (a) | 4,800 | (15,792 | ) | |||||||
Informatica, Inc., Class A (a) | 2,600 | (42,640 | ) | |||||||
Intrusion, Inc. (a) | 500 | (590 | ) | |||||||
Intuit, Inc. | 2,400 | (1,069,992 | ) | |||||||
IronNet, Inc. (a) | 24,800 | (8,720 | ) | |||||||
Jack Henry & Associates, Inc. | 10,578 | (1,594,316 | ) | |||||||
John Wiley & Sons, Inc., Class A | 200 | (7,754 | ) | |||||||
Kaltura, Inc. (a) | 400 | (768 | ) | |||||||
Katapult Holdings, Inc. (a) | 6,000 | (2,675 | ) | |||||||
Latch, Inc. (a) | 9,800 | (7,469 | ) | |||||||
LiveVox Holdings, Inc. (a) | 1,100 | (3,399 | ) | |||||||
Marathon Digital Holdings, Inc. (a) | 56,300 | (490,936 | ) | |||||||
MarketAxess Holdings, Inc. | 200 | (78,258 | ) | |||||||
Matterport, Inc. (a) | 17,900 | (48,867 | ) | |||||||
MeridianLink, Inc. (a) | 1,300 | (22,490 | ) | |||||||
Microsoft Corp. | 15,800 | (4,555,140 | ) | |||||||
Multiplan Corp. (a) | 31,300 | (33,178 | ) | |||||||
N-able, Inc. (a) | 4,300 | (56,760 | ) | |||||||
NantHealth, Inc. (a) | 100 | (200 | ) | |||||||
nCino, Inc. (a) | 65,693 | (1,627,873 | ) | |||||||
Nutex Health, Inc. (a) | 35,800 | (36,158 | ) | |||||||
Open Text Corp. | 8,600 | (331,530 | ) | |||||||
Oracle Corp. | 200 | (18,584 | ) | |||||||
Outbrain, Inc. (a) | 400 | (1,652 | ) | |||||||
Paycor HCM, Inc. (a) | 500 | (13,260 | ) | |||||||
Pear Therapeutics, Inc. (a) | 3,200 | (816 | ) | |||||||
Phunware, Inc. (a) | 31,700 | (22,507 | ) | |||||||
Porch Group, Inc. (a) | 14,200 | (20,306 | ) | |||||||
Priority Technology Holdings, Inc. (a) | 200 | (718 | ) | |||||||
PubMatic, Inc., Class A (a) | 5,200 | (71,864 | ) | |||||||
Quantum Computing, Inc. (a) | 6,100 | (7,991 | ) | |||||||
Red Cat Holdings, Inc. (a) | 4,600 | (4,784 | ) | |||||||
Remitly Global, Inc. (a) | 900 | (15,255 | ) | |||||||
Riot Platforms, Inc. (a) | 70,100 | (700,299 | ) | |||||||
Ryvyl, Inc. (a) | 5,600 | (2,289 | ) | |||||||
S&P Global, Inc. | 2,288 | (788,834 | ) | |||||||
Sharecare, Inc. (a) | 18,700 | (26,554 | ) | |||||||
See Notes to Consolidated Financial Statements.
147
Table of Contents
Blackstone Alternative Multi-Strategy Fund and Subsidiaries
Consolidated Schedule of Investments ^ (Continued)
March 31, 2023
Security Description | Shares | Value | ||||||||
Shift4 Payments, Inc., Class A (a) | 29,397 | $ | (2,228,293 | ) | ||||||
Skillsoft Corp. (a) | 7,800 | (15,600 | ) | |||||||
Smith Micro Software, Inc. (a) | 200 | (232 | ) | |||||||
Sobr Safe, Inc. (a) | 400 | (888 | ) | |||||||
Sphere 3D Corp. (a) | 10,900 | (3,849 | ) | |||||||
Spire Global, Inc. (a) | 12,100 | (8,083 | ) | |||||||
SurgePays, Inc. (a) | 1,800 | (8,082 | ) | |||||||
Synchronoss Technologies, Inc. (a) | 800 | (752 | ) | |||||||
System1, Inc. (a) | 900 | (3,870 | ) | |||||||
Talkspace, Inc. (a) | 5,500 | (3,823 | ) | |||||||
Thoughtworks Holding, Inc. (a) | 7,700 | (56,672 | ) | |||||||
Toast, Inc., Class A (a) | 49,800 | (883,950 | ) | |||||||
Unity Software, Inc. (a) | 16,800 | (544,992 | ) | |||||||
Usio, Inc. (a) | 200 | (348 | ) | |||||||
Verb Technology Co., Inc. (a) | 9,100 | (1,091 | ) | |||||||
Veritone, Inc. (a) | 1,700 | (9,911 | ) | |||||||
Viant Technology, Inc., Class A (a) | 1,100 | (4,785 | ) | |||||||
Vislink Technologies, Inc. (a) | 4,300 | (1,483 | ) | |||||||
Weave Communications, Inc. (a) | 700 | (3,479 | ) | |||||||
Wejo Group Ltd. (a) | 2,900 | (1,430 | ) | |||||||
WM Technology, Inc. (a) | 13,200 | (11,209 | ) | |||||||
|
| |||||||||
| (37,487,087 | ) | |||||||||
|
| |||||||||
Tech Hardware & Semiconductors — (0.6)% |
| |||||||||
ADTRAN Holdings, Inc. | 8,500 | (134,810 | ) | |||||||
Advanced Micro Devices, Inc. (a) | 33,800 | (3,312,738 | ) | |||||||
Aehr Test Systems (a) | 5,700 | (176,814 | ) | |||||||
Airspan Networks Holdings, Inc. (a) | 400 | (277 | ) | |||||||
AmpliTech Group, Inc. (a) | 600 | (1,626 | ) | |||||||
Analog Devices, Inc. | 4,200 | (828,324 | ) | |||||||
Apple, Inc. | 17,600 | (2,902,240 | ) | |||||||
Applied Materials, Inc. | 31,400 | (3,856,862 | ) | |||||||
Arrow Electronics, Inc. (a) | 100 | (12,487 | ) | |||||||
Broadcom, Inc. | 4,900 | (3,143,546 | ) | |||||||
Charge Enterprises, Inc. (a) | 8,800 | (9,680 | ) | |||||||
Ciena Corp. (a) | 8,900 | (467,428 | ) | |||||||
Clearfield, Inc. (a) | 1,700 | (79,186 | ) | |||||||
Cohu, Inc. (a) | 2,600 | (99,814 | ) | |||||||
ComSovereign Holding Corp. (a) | 1,100 | (2,365 | ) | |||||||
Corsair Gaming, Inc. (a) | 7,400 | (135,790 | ) | |||||||
Cricut, Inc., Class A | 300 | (3,060 | ) | |||||||
CTS Corp. | 200 | (9,892 | ) | |||||||
Desktop Metal, Inc., Class A (a) | 48,500 | (111,550 | ) | |||||||
Digital Ally, Inc. (a) | 155 | (716 | ) | |||||||
Draganfly, Inc. (a) | 3,200 | (4,096 | ) | |||||||
DZS, Inc. (a) | 100 | (789 | ) | |||||||
See Notes to Consolidated Financial Statements.
148
Table of Contents
Blackstone Alternative Multi-Strategy Fund and Subsidiaries
Consolidated Schedule of Investments ^ (Continued)
March 31, 2023
Security Description | Shares | Value | ||||||||
eMagin Corp. (a) | 4,200 | $ | (8,736 | ) | ||||||
HP, Inc. | 800 | (23,480 | ) | |||||||
Knowles Corp. (a) | 1,400 | (23,800 | ) | |||||||
KULR Technology Group, Inc. (a) | 11,300 | (9,914 | ) | |||||||
Lam Research Corp. | 1,100 | (583,132 | ) | |||||||
Lantronix, Inc. (a) | 300 | (1,302 | ) | |||||||
LightPath Technologies, Inc., Class A (a) | 800 | (1,128 | ) | |||||||
Markforged Holding Corp. (a) | 3,700 | (3,548 | ) | |||||||
MicroVision, Inc. (a) | 5,000 | (13,350 | ) | |||||||
Minim, Inc. (a) | 800 | (87 | ) | |||||||
Monolithic Power Systems, Inc. | 700 | (350,378 | ) | |||||||
Navitas Semiconductor Corp. (a) | 4,000 | (29,240 | ) | |||||||
NCR Corp. (a) | 11,500 | (271,285 | ) | |||||||
NextNav, Inc. (a) | 1,800 | (3,654 | ) | |||||||
ON Semiconductor Corp. (a) | 67,000 | (5,515,440 | ) | |||||||
Ondas Holdings, Inc. (a) | 5,600 | (6,048 | ) | |||||||
Pitney Bowes, Inc. | 4,200 | (16,338 | ) | |||||||
Rekor Systems, Inc. (a) | 4,200 | (5,250 | ) | |||||||
Rigetti Computing, Inc., Class A (a) | 6,300 | (4,557 | ) | |||||||
Seagate Technology Holdings PLC | 12,000 | (793,440 | ) | |||||||
Sight Sciences, Inc. (a) | 200 | (1,748 | ) | |||||||
SigmaTron International, Inc. (a) | 400 | (1,052 | ) | |||||||
Snap One Holdings Corp. (a) | 800 | (7,480 | ) | |||||||
Socket Mobile, Inc. (a) | 400 | (752 | ) | |||||||
Super Micro Computer, Inc. (a) | 2,500 | (266,375 | ) | |||||||
TD SYNNEX Corp. | 3,300 | (319,407 | ) | |||||||
Teledyne Technologies, Inc. (a) | 700 | (313,152 | ) | |||||||
Teradyne, Inc. | 100 | (10,751 | ) | |||||||
Terran Orbital Corp. (a) | 60,300 | (110,952 | ) | |||||||
Texas Instruments, Inc. | 300 | (55,803 | ) | |||||||
Tingo Group, Inc. (a) | 2,900 | (3,045 | ) | |||||||
Trio-Tech International (a) | 200 | (940 | ) | |||||||
Ubiquiti, Inc. | 600 | (163,014 | ) | |||||||
Velo3D, Inc. (a) | 21,000 | (47,670 | ) | |||||||
Vizio Holding Corp., Class A (a) | 6,700 | (61,506 | ) | |||||||
Xperi, Inc. (a) | 800 | (8,744 | ) | |||||||
|
| |||||||||
| (24,330,588 | ) | |||||||||
|
| |||||||||
Telecommunications — (0.1)% |
| |||||||||
ATN International, Inc. | 100 | (4,092 | ) | |||||||
BCE, Inc. | 21,700 | (971,943 | ) | |||||||
BlackSky Technology, Inc. (a) | 13,600 | (20,400 | ) | |||||||
Consolidated Communications Holdings, Inc. (a) | 1,600 | (4,128 | ) | |||||||
Cyxtera Technologies, Inc. (a) | 3,900 | (1,191 | ) | |||||||
DigitalBridge Group, Inc. | 21,406 | (256,658 | ) | |||||||
Frontier Communications Parent, Inc. (a) | 24,599 | (560,119 | ) | |||||||
IDT Corp., Class B (a) | 200 | (6,816 | ) | |||||||
Millicom International Cellular SA (a) | 100 | (1,892 | ) | |||||||
See Notes to Consolidated Financial Statements.
149
Table of Contents
Blackstone Alternative Multi-Strategy Fund and Subsidiaries
Consolidated Schedule of Investments ^ (Continued)
March 31, 2023
Security Description | Shares | Value | ||||||||||
Planet Labs PBC (a) | 7,200 | $ | (28,296 | ) | ||||||||
Rogers Communications, Inc., Class B | 4,100 | (190,076 | ) | |||||||||
Shenandoah Telecommunications Co. | 1,300 | (24,726 | ) | |||||||||
T-Mobile US, Inc. (a) | 25,932 | (3,755,991 | ) | |||||||||
Telesat Corp. (a) | 600 | (5,160 | ) | |||||||||
TELUS Corp. | 1,300 | (25,818 | ) | |||||||||
|
| |||||||||||
| (5,857,306 | ) | |||||||||||
|
| |||||||||||
Utilities — (0.1)% | ||||||||||||
AES Corp. | 3,900 | (93,912 | ) | |||||||||
Algonquin Power & Utilities Corp. | 84,900 | (713,160 | ) | |||||||||
Atmos Energy Corp. | 2,900 | (325,844 | ) | |||||||||
Brookfield Infrastructure Corp., Class A | 5,700 | (262,542 | ) | |||||||||
Brookfield Renewable Corp., Class A | 11,700 | (408,915 | ) | |||||||||
California Water Service Group | 1,700 | (98,940 | ) | |||||||||
CenterPoint Energy, Inc. | 25,800 | (760,068 | ) | |||||||||
FTC Solar, Inc. (a) | 24,200 | (54,450 | ) | |||||||||
NRG Energy, Inc. | 61,900 | (2,122,551 | ) | |||||||||
OGE Energy Corp. | 2,900 | (109,214 | ) | |||||||||
Southwest Gas Holdings, Inc. | 4,400 | (274,780 | ) | |||||||||
UGI Corp. | 17,200 | (597,872 | ) | |||||||||
Via Renewables, Inc. | 60 | (1,103 | ) | |||||||||
Vistra Corp. | 200 | (4,800 | ) | |||||||||
|
| |||||||||||
| (5,828,151 | ) | |||||||||||
|
| |||||||||||
Total North America |
| (447,555,304 | ) | |||||||||
|
| |||||||||||
Oceania — (0.0)% |
| |||||||||||
Health Care — (0.0)% |
| |||||||||||
Alterity Therapeutics Ltd., ADR (a) | 110 | (293 | ) | |||||||||
Immutep Ltd., ADR(a) | 1,600 | (2,688 | ) | |||||||||
Kazia Therapeutics Ltd., ADR (a) | 600 | (618 | ) | |||||||||
Opthea Ltd., ADR(a) | 100 | (396 | ) | |||||||||
|
| |||||||||||
| (3,995 | ) | |||||||||||
|
| |||||||||||
Industrial Products — (0.0)% | ||||||||||||
Cenntro Electric Group Ltd. (a) | 986 | (455 | ) | |||||||||
Tritium DCFC Ltd. (a) | 2,300 | (2,944 | ) | |||||||||
|
| |||||||||||
| (3,399 | ) | |||||||||||
|
| |||||||||||
Materials — (0.0)% | ||||||||||||
BHP Group Ltd., ADR | 1,400 | (88,774 | ) | |||||||||
|
| |||||||||||
Oil & Gas — (0.0)% | ||||||||||||
Imperial Petroleum, Inc. (a) | 10,600 | (2,052 | ) | |||||||||
Woodside Energy Group Ltd., ADR | 2,800 | (62,804 | ) | |||||||||
|
| |||||||||||
| (64,856 | ) | |||||||||||
|
| |||||||||||
See Notes to Consolidated Financial Statements.
150
Table of Contents
Blackstone Alternative Multi-Strategy Fund and Subsidiaries
Consolidated Schedule of Investments ^ (Continued)
March 31, 2023
Security Description | Shares | Value | ||||||||||
Software & Technology Services — (0.0)% | ||||||||||||
Advanced Health Intelligence Ltd., ADR (a) | 2,100 | $ | (756 | ) | ||||||||
|
| |||||||||||
Total Oceania |
| (161,780 | ) | |||||||||
|
| |||||||||||
South America — (0.2)% |
| |||||||||||
Banking — (0.1)% |
| |||||||||||
Banco Bradesco SA, ADR | 300,400 | (787,048 | ) | |||||||||
Banco Santander Chile, ADR | 15,900 | (283,497 | ) | |||||||||
Itau Unibanco Holding SA, ADR | 137,900 | (671,573 | ) | |||||||||
NU Holdings Ltd., Class A (a) | 171,400 | (815,864 | ) | |||||||||
|
| |||||||||||
| (2,557,982 | ) | |||||||||||
|
| |||||||||||
Consumer Staple Products — (0.0)% | ||||||||||||
Adecoagro SA | 13,300 | (107,597 | ) | |||||||||
AMBEV SA, ADR | 99,700 | (281,154 | ) | |||||||||
Cia Cervecerias Unidas SA, ADR | 2,300 | (35,949 | ) | |||||||||
|
| |||||||||||
| (424,700 | ) | |||||||||||
|
| |||||||||||
Financial Services — (0.0)% | ||||||||||||
Vinci Partners Investments Ltd., Class A | 500 | (4,065 | ) | |||||||||
|
| |||||||||||
Industrial Services — (0.0)% | ||||||||||||
Azul SA, ADR (a) | 45,300 | (323,895 | ) | |||||||||
Corporacion America Airports SA (a) | 1,000 | (10,180 | ) | |||||||||
|
| |||||||||||
| (334,075 | ) | |||||||||||
|
| |||||||||||
Materials — (0.0)% | ||||||||||||
Bioceres Crop Solutions Corp. (a) | 1,100 | (12,771 | ) | |||||||||
Sociedad Quimica y Minera de Chile SA, ADR | 200 | (16,212 | ) | |||||||||
Wheaton Precious Metals Corp. | 100 | (4,816 | ) | |||||||||
|
| |||||||||||
| (33,799 | ) | |||||||||||
|
| |||||||||||
Media — (0.0)% | ||||||||||||
Despegar.com Corp. (a) | 2,600 | (15,964 | ) | |||||||||
|
| |||||||||||
Oil & Gas — (0.0)% | ||||||||||||
Cosan SA, ADR | 2,700 | (31,914 | ) | |||||||||
|
| |||||||||||
Retail & Wholesale—Discretionary — (0.1)% | ||||||||||||
MercadoLibre, Inc. (a) | 2,600 | (3,426,956 | ) | |||||||||
|
| |||||||||||
| (3,426,956 | ) | |||||||||||
|
| |||||||||||
Software & Technology Services — (0.0)% | ||||||||||||
Arco Platform Ltd., Class A (a) | 1,100 | (12,056 | ) | |||||||||
CI&T, Inc., Class A (a) | 900 | (4,959 | ) | |||||||||
Vasta Platform Ltd. (a) | 200 | (642 | ) | |||||||||
See Notes to Consolidated Financial Statements.
151
Table of Contents
Blackstone Alternative Multi-Strategy Fund and Subsidiaries
Consolidated Schedule of Investments ^ (Continued)
March 31, 2023
Security Description | Shares | Value | ||||||||||
VTEX, Class A (a) | 2,100 | $ | (8,064 | ) | ||||||||
|
| |||||||||||
| (25,721 | ) | |||||||||||
|
| |||||||||||
Telecommunications — (0.0)% | ||||||||||||
TIM SA, ADR | 1,200 | (14,832 | ) | |||||||||
|
| |||||||||||
Utilities — (0.0)% | ||||||||||||
Cia de Saneamento Basico do Estado de Sao Paulo, ADR | 28,600 | (286,286 | ) | |||||||||
Cia Paranaense de Energia, ADR | 4,900 | (32,928 | ) | |||||||||
Enel Chile SA, ADR | 5,800 | (15,660 | ) | |||||||||
|
| |||||||||||
| (334,874 | ) | |||||||||||
|
| |||||||||||
Total South America |
| (7,204,882 | ) | |||||||||
|
| |||||||||||
TOTAL COMMON STOCK |
| (500,030,690 | ) | |||||||||
|
| |||||||||||
Security Description | Principal Amount | Value | ||||||||||
CORPORATE BONDS & NOTES — (0.9)% |
| |||||||||||
Asia — (0.7)% | ||||||||||||
Alibaba Group Holding Ltd. (b) | $ | 11,227,000 | (9,956,199 | ) | ||||||||
Bank of China Ltd. (b),(d),(k),(m) | 3,600,000 | (3,470,760 | ) | |||||||||
Industrial & Commercial Bank of China Ltd. (b),(d),(k),(m) | 12,800,000 | (11,968,000 | ) | |||||||||
Tencent Holdings Ltd., MTN (b),(k) | 1,856,000 | (1,704,602 | ) | |||||||||
Tencent Holdings Ltd., MTN (b),(k) | 4,566,000 | (4,485,448 | ) | |||||||||
|
| |||||||||||
Total Asia | (31,585,009 | ) | ||||||||||
|
| |||||||||||
North America — (0.2)% | ||||||||||||
Petroleos Mexicanos (b),(k) | 8,815,000 | (8,449,564 | ) | |||||||||
|
| |||||||||||
Total North America |
| (8,449,564 | ) | |||||||||
|
| |||||||||||
TOTAL CORPORATE BONDS & NOTES |
| (40,034,573 | ) | |||||||||
|
| |||||||||||
Security Description | Shares | Value | ||||||||||
EXCHANGE-TRADED FUNDS — (0.1)% | ||||||||||||
Consumer Staples Select Sector SPDR Fund | 5,903 | (441,013 | ) | |||||||||
Energy Select Sector SPDR Fund | 22,286 | (1,845,950 | ) | |||||||||
SPDR S&P Regional Banking ETF | 5,548 | (243,335 | ) | |||||||||
|
| |||||||||||
TOTAL EXCHANGE-TRADED FUNDS |
| (2,530,298 | ) | |||||||||
|
| |||||||||||
See Notes to Consolidated Financial Statements.
152
Table of Contents
Blackstone Alternative Multi-Strategy Fund and Subsidiaries
Consolidated Schedule of Investments ^ (Continued)
March 31, 2023
Security Description | Principal Amount | Value | ||||||||||
MORTGAGE-BACKED SECURITIES — (13.2)% |
| |||||||||||
North America — (13.2)% |
| |||||||||||
Uniform Mortgage-Backed Securities — (13.2)% |
| |||||||||||
Federal National Mortgage Association, TBA, 30 Year Maturity, 3.00%, 04/13/53 (b),(f) | $ | 900,000 | $ | (807,012 | ) | |||||||
Federal National Mortgage Association, TBA, 30 Year Maturity, 5.00%, 04/13/53 (f) | 434,000,000 | (432,677,602 | ) | |||||||||
Federal National Mortgage Association, TBA, 30 Year Maturity, 6.00%, 04/13/53 (f) | 150,000,000 | (153,105,450 | ) | |||||||||
|
| |||||||||||
| (586,590,064 | ) | |||||||||||
|
| |||||||||||
Total North America |
| (586,590,064 | ) | |||||||||
|
| |||||||||||
TOTAL MORTGAGE-BACKED SECURITIES |
| (586,590,064 | ) | |||||||||
|
| |||||||||||
SOVEREIGN DEBT — (1.6)% |
| |||||||||||
Bahrain Government International Bond (b),(k) | 3,569,000 | (3,180,907 | ) | |||||||||
Bahrain Government International Bond (b),(k) | 2,000,000 | (1,845,240 | ) | |||||||||
Bahrain Government International Bond (b),(k) | 4,217,000 | (4,280,171 | ) | |||||||||
Bahrain Government International Bond (b),(k) | 1,799,000 | (1,855,924 | ) | |||||||||
Bahrain Government International Bond (b),(k) | 705,000 | (635,381 | ) | |||||||||
Bahrain Government International Bond, MTN (b),(k) | 4,317,000 | (3,745,049 | ) | |||||||||
Brazilian Government International Bond (b) | 6,069,000 | (5,432,180 | ) | |||||||||
Brazilian Government International Bond (b) | 827,000 | (649,067 | ) | |||||||||
Brazilian Government International Bond (b) | 3,068,000 | (2,577,892 | ) | |||||||||
Brazilian Government International Bond (b) | 2,823,000 | (3,255,360 | ) | |||||||||
Chile Government International Bond (b),(k) | 1,000,000 | (844,242 | ) | |||||||||
China Government International Bond (b),(k) | 5,000,000 | (4,525,545 | ) | |||||||||
Colombia Government International Bond (b) | 4,738,000 | (3,578,372 | ) | |||||||||
Egypt Government International Bond (b),(k) | 6,137,000 | (5,004,662 | ) | |||||||||
Indonesia Government International Bond (b),(k) | 686,000 | (682,995 | ) | |||||||||
Indonesia Government International Bond (b) | 710,000 | (714,473 | ) | |||||||||
Peruvian Government International Bond (b) | 6,918,000 | (5,638,279 | ) | |||||||||
Peruvian Government International Bond (b) | 4,123,000 | (4,145,080 | ) | |||||||||
Peruvian Government International Bond (b) | 184,000 | (199,785 | ) | |||||||||
Peruvian Government International Bond (b) | 2,799,000 | (3,520,294 | ) | |||||||||
Turkey Government International Bond (b) | 4,515,000 | (4,548,862 | ) | |||||||||
Turkey Government International Bond (b) | 9,960,000 | (9,980,916 | ) | |||||||||
|
| |||||||||||
TOTAL SOVEREIGN DEBT |
| (70,840,676 | ) | |||||||||
|
| |||||||||||
See Notes to Consolidated Financial Statements.
153
Table of Contents
Blackstone Alternative Multi-Strategy Fund and Subsidiaries
Consolidated Schedule of Investments ^ (Continued)
March 31, 2023
Security Description | Principal Amount | Value | ||||||||||
U.S. TREASURY NOTES — (0.2)% |
| |||||||||||
North America — (0.2)% | ||||||||||||
U.S. Treasury Bonds, | ||||||||||||
2.88%, 05/15/52 (b) | $ | (2,159,600 | ) | $ | (1,847,470 | ) | ||||||
3.00%, 08/15/52 (b) | (2,868,800 | ) | (2,520,062 | ) | ||||||||
U.S. Treasury Notes, |
| |||||||||||
3.50%, 02/15/33 (b) | (140,000 | ) | (140,219 | ) | ||||||||
4.00%, 02/15/26 - 02/28/30 (b) | (2,677,000 | ) | (2,718,423 | ) | ||||||||
4.63%, 02/28/25 (b) | (562,000 | ) | (567,466 | ) | ||||||||
|
| |||||||||||
Total North America |
| (7,793,640 | ) | |||||||||
|
| |||||||||||
TOTAL U.S. TREASURY NOTES |
| (7,793,640 | ) | |||||||||
|
| |||||||||||
WARRANTS — (0.0)% |
| |||||||||||
North America — (0.0)% |
| |||||||||||
Galectin Therapeutics, Inc. (a),(c) | 1,340 | 0 | ||||||||||
Salarius Pharmaceuticals, Inc. (a),(c) | 1,000 | 0 | ||||||||||
|
| |||||||||||
Total North America |
| 0 | ||||||||||
|
| |||||||||||
TOTAL WARRANTS |
| 0 | ||||||||||
|
| |||||||||||
TOTAL SECURITIES SOLD SHORT — (27.3)% |
| (1,207,819,941 | ) | |||||||||
|
| |||||||||||
Footnote Legend:
| ^ | A balance indicated with a “0”, reflects either a zero balance or an amount that rounds to less than 1. |
| (a) | Non-income producing. |
| (b) | Security is held by a consolidated wholly-owned subsidiary of Blackstone Alternative Multi-Strategy Fund. |
| (c) | Security is valued using significant unobservable inputs. |
| (d) | Variable/Floating interest rate security. Certain variable/floating interest rate securities are not based on a published reference rate and spread but are determined by the issuer or agent and are based on current market conditions. These securities may not indicate a reference rate and spread in their description above. Rate presented is as of March 31, 2023. |
| (e) | Security is exempt from registration pursuant to Rule 144A under the Securities Act of 1933, as amended. Security may only be sold to qualified institutional buyers unless registered under the Securities Act of 1933, as amended, or otherwise exempt from registration. |
| (f) | When issued or delayed delivery security included. |
| (g) | Non-interest bearing bond. |
| (h) | Security is an Interest Only (IO) bond, which represents the “interest only” portion of payments on a pool of underlying mortgages or mortgage-backed securities. IO securities are subject to prepayment risk of the pool of underlying mortgages. |
| (i) | Represents a step-up bond. Coupon rate increases in increments to maturity. Rate presented is as of March 31, 2023. Maturity date presented is the ultimate maturity. |
See Notes to Consolidated Financial Statements.
154
Table of Contents
Blackstone Alternative Multi-Strategy Fund and Subsidiaries
Consolidated Schedule of Investments ^ (Continued)
March 31, 2023
| (j) | All or a portion of the security represents an unsettled loan commitment at March 31, 2023 where the rate will be determined at time of settlement. |
| (k) | Security is exempt from registration pursuant to Regulation S under the Securities Act of 1933, as amended. Security may only be offered or sold outside of the Unites States unless registered under the Securities Act of 1933, as amended, or otherwise exempt from registration. |
| (l) | All or a portion of this security is pledged as collateral in connection with reverse repurchase agreements. |
| (m) | Security is perpetual in nature and has no stated maturity. |
| (n) | Security is currently in default due to bankruptcy or failure to make payment of principal or interest. |
| (o) | Security is restricted per Rule 12-12.8 of Regulation S-X. First acquisition dates of Aeolus Property Catastrophe Keystone PF Fund LP, PIMCO ILS Fund SP II, Atreides Co., Asgard Fixed Income Risk Premia Fund, Rokos Global Macro Fund Ltd., Centiva Offshore Fund LLP, Qube Torus and Statar Capital Class A, 1/2/2019, 12/30/2019, 7/1/2021, 8/2/2021, 9/1/2021, 6/1/2022 and 7/1/2022. Amounts to $385,308,580 and represents 8.7% of Net Assets. |
| (p) | Repurchase agreements may additionally have cash collateral held to meet collateral requirements. |
| (q) | Open repurchase agreement with no specific maturity date. Either party may terminate the agreement upon demand. |
| (r) | Assets, other than investments in securities, less liabilities other than securities sold short. |
Options Written Contracts Outstanding at March 31, 2023
| Strike | Expiration Date | Contracts | Notional Amount | Premium Received | Market Value | Unrealized Appreciation (Depreciation) | ||||||||||||||||||||
Exchange-Traded Call Options Written |
| |||||||||||||||||||||||||
CBOE SPX VOLATILITY INDX JUN 23 | 45.00 USD | 06/21/23 | 4,094 | (4,094 | ) | $ | (613,363 | ) | $ | (249,734 | ) | $ | 363,629 | |||||||||||||
CBOE SPX VOLATILITY INDX SEP 23 | 36.00 USD | 09/20/23 | 250 | (250 | ) | (48,868 | ) | (43,000 | ) | 5,868 | ||||||||||||||||
CBOE SPX VOLATILITY INDX SEP 23 | 38.00 USD | 09/20/23 | 1,637 | (1,637 | ) | (264,492 | ) | (245,550 | ) | 18,942 | ||||||||||||||||
COPPER FUTURE 07/01/23 | 490.00 USD | 06/27/23 | 260 | (260 | ) | (278,832 | ) | (159,250 | ) | 119,582 | ||||||||||||||||
CRUDE OIL FUT OPT DEC 23 | 200.00 USD | 11/15/23 | 60 | (4,413,000 | ) | (34,291 | ) | (2,400 | ) | 31,891 | ||||||||||||||||
CRUDE OIL FUT OPT DEC 23 | 100.00 USD | 11/15/23 | 82 | (6,031,100 | ) | (280,325 | ) | (140,220 | ) | 140,105 | ||||||||||||||||
CRUDE OIL FUT OPT JUN 23 | 200.00 USD | 05/17/23 | 429 | (32,518,200 | ) | (408,202 | ) | (4,290 | ) | 403,912 | ||||||||||||||||
NAT GAS EURO OPT AUG 23 | 7.00 USD | 07/26/23 | 1 | (27,830 | ) | (4,813 | ) | (87 | ) | 4,726 | ||||||||||||||||
NAT GAS EURO OPT JUL 23 | 7.00 USD | 06/27/23 | 2 | (54,640 | ) | (9,625 | ) | (112 | ) | 9,513 | ||||||||||||||||
NAT GAS EURO OPT JUN 23 | 7.00 USD | 05/25/23 | 1 | (24,650 | ) | (4,813 | ) | (23 | ) | 4,790 | ||||||||||||||||
NAT GAS EURO OPT JUN 23 | 6.00 USD | 05/25/23 | 1 | (24,650 | ) | (8,103 | ) | (44 | ) | 8,059 | ||||||||||||||||
NAT GAS EURO OPT MAY 23 | 7.00 USD | 04/25/23 | 2 | (44,320 | ) | (9,625 | ) | (12 | ) | 9,613 | ||||||||||||||||
NAT GAS EURO OPT OCT 23 | 7.00 USD | 09/26/23 | 1 | (28,470 | ) | (4,813 | ) | (213 | ) | 4,600 | ||||||||||||||||
NAT GAS EURO OPT SEP 23 | 7.00 USD | 08/28/23 | 2 | (55,000 | ) | (9,625 | ) | (282 | ) | 9,343 | ||||||||||||||||
NAT GAS EURO OPT APR 25 | 6.00 USD | 03/26/25 | 20 | (764,800 | ) | (99,054 | ) | (65,060 | ) | 33,994 | ||||||||||||||||
See Notes to Consolidated Financial Statements.
155
Table of Contents
Blackstone Alternative Multi-Strategy Fund and Subsidiaries
Consolidated Schedule of Investments ^ (Continued)
March 31, 2023
| Strike | Expiration Date | Contracts | Notional Amount | Premium Received | Market Value | Unrealized Appreciation (Depreciation) | ||||||||||||||||||||
NAT GAS EURO OPT APR 25 | 8.00 USD | 03/26/25 | 20 | (764,800 | ) | $ | (56,054 | ) | $ | (31,760 | ) | $ | 24,294 | |||||||||||||
NAT GAS EURO OPT AUG 23 | 10.00 USD | 07/26/23 | 80 | (2,226,400 | ) | (48,214 | ) | (2,000 | ) | 46,214 | ||||||||||||||||
NAT GAS EURO OPT AUG 23 | 4.50 USD | 07/26/23 | 76 | (2,115,080 | ) | (55,483 | ) | (47,880 | ) | 7,603 | ||||||||||||||||
NAT GAS EURO OPT AUG23 | 4.95 USD | 07/26/23 | 20 | (556,600 | ) | (17,054 | ) | (8,140 | ) | 8,914 | ||||||||||||||||
NAT GAS EURO OPT AUG25 | 6.00 USD | 07/28/25 | 20 | (822,000 | ) | (99,053 | ) | (69,720 | ) | 29,333 | ||||||||||||||||
NAT GAS EURO OPT AUG25 | 8.00 USD | 07/28/25 | 20 | (822,000 | ) | (56,054 | ) | (32,340 | ) | 23,714 | ||||||||||||||||
NAT GAS EURO OPT DEC23 | 3.75 USD | 11/27/23 | 40 | (1,488,000 | ) | (300,107 | ) | (282,680 | ) | 17,427 | ||||||||||||||||
NAT GAS EURO OPT DEC23 | 5.00 USD | 11/27/23 | 120 | (4,464,000 | ) | (532,320 | ) | (445,200 | ) | 87,120 | ||||||||||||||||
NAT GAS EURO OPT DEC25 | 6.00 USD | 11/24/25 | 20 | (970,000 | ) | (99,053 | ) | (155,020 | ) | (55,967 | ) | |||||||||||||||
NAT GAS EURO OPT DEC25 | 8.00 USD | 11/24/25 | 20 | (970,000 | ) | (56,053 | ) | (95,260 | ) | (39,207 | ) | |||||||||||||||
NAT GAS EURO OPT FEB25 | 6.00 USD | 01/28/25 | 20 | (916,200 | ) | (99,053 | ) | (162,400 | ) | (63,347 | ) | |||||||||||||||
NAT GAS EURO OPT FEB25 | 8.00 USD | 01/28/25 | 20 | (916,200 | ) | (56,053 | ) | (107,720 | ) | (51,667 | ) | |||||||||||||||
NAT GAS EURO OPT JAN25 | 6.00 USD | 12/26/24 | 20 | (941,200 | ) | (99,053 | ) | (162,180 | ) | (63,127 | ) | |||||||||||||||
NAT GAS EURO OPT JAN25 | 8.00 USD | 12/26/24 | 20 | (941,200 | ) | (56,053 | ) | (105,080 | ) | (49,027 | ) | |||||||||||||||
NAT GAS EURO OPT JUL 23 | 10.00 USD | 06/27/23 | 80 | (2,185,600 | ) | (48,214 | ) | (1,200 | ) | 47,014 | ||||||||||||||||
NAT GAS EURO OPT JUL25 | 6.00 USD | 06/25/25 | 20 | (814,800 | ) | (99,054 | ) | (66,700 | ) | 32,354 | ||||||||||||||||
NAT GAS EURO OPT JUL25 | 8.00 USD | 06/25/25 | 20 | (814,800 | ) | (56,053 | ) | (30,620 | ) | 25,433 | ||||||||||||||||
NAT GAS EURO OPT JUN 23 | 10.00 USD | 05/25/23 | 80 | (1,972,000 | ) | (48,214 | ) | (400 | ) | 47,814 | ||||||||||||||||
NAT GAS EURO OPT JUN23 | 2.50 USD | 05/25/23 | 200 | (4,930,000 | ) | (492,534 | ) | (588,000 | ) | (95,466 | ) | |||||||||||||||
NAT GAS EURO OPT JUN23 | 4.00 USD | 05/25/23 | 540 | (13,311,000 | ) | (153,442 | ) | (159,840 | ) | (6,398 | ) | |||||||||||||||
NAT GAS EURO OPT JUN25 | 6.00 USD | 05/27/25 | 20 | (790,600 | ) | (99,053 | ) | (60,640 | ) | 38,413 | ||||||||||||||||
NAT GAS EURO OPT JUN25 | 8.00 USD | 05/27/25 | 20 | (790,600 | ) | (56,053 | ) | (27,720 | ) | 28,333 | ||||||||||||||||
NAT GAS EURO OPT MAR25 | 6.00 USD | 02/25/25 | 20 | (846,200 | ) | (99,053 | ) | (139,620 | ) | (40,567 | ) | |||||||||||||||
NAT GAS EURO OPT MAR25 | 8.00 USD | 02/25/25 | 20 | (846,200 | ) | (56,053 | ) | (92,980 | ) | (36,927 | ) | |||||||||||||||
NAT GAS EURO OPT MAY 23 | 10.00 USD | 04/25/23 | 80 | (1,772,800 | ) | (48,214 | ) | (160 | ) | 48,054 | ||||||||||||||||
NAT GAS EURO OPT MAY23 | 2.25 USD | 04/25/23 | 90 | (1,994,400 | ) | (148,740 | ) | (172,890 | ) | (24,150 | ) | |||||||||||||||
NAT GAS EURO OPT MAY23 | 2.35 USD | 04/25/23 | 28 | (620,480 | ) | (32,395 | ) | (42,532 | ) | (10,137 | ) | |||||||||||||||
NAT GAS EURO OPT MAY23 | 3.25 USD | 04/25/23 | 400 | (8,864,000 | ) | (429,548 | ) | (82,800 | ) | 346,748 | ||||||||||||||||
NAT GAS EURO OPT MAY23 | 3.00 USD | 04/25/23 | 120 | (2,659,200 | ) | (56,720 | ) | (40,920 | ) | 15,800 | ||||||||||||||||
NAT GAS EURO OPT MAY23 | 3.50 USD | 04/25/23 | 138 | (3,058,080 | ) | (35,209 | ) | (18,630 | ) | 16,579 | ||||||||||||||||
NAT GAS EURO OPT MAY25 | 6.00 USD | 04/25/25 | 20 | (760,200 | ) | (99,054 | ) | (54,800 | ) | 44,254 | ||||||||||||||||
NAT GAS EURO OPT MAY25 | 8.00 USD | 04/25/25 | 20 | (760,200 | ) | (56,053 | ) | (25,120 | ) | 30,933 | ||||||||||||||||
NAT GAS EURO OPT NOV23 | 4.50 USD | 10/26/23 | 80 | (2,590,400 | ) | (232,214 | ) | (199,040 | ) | 33,174 | ||||||||||||||||
See Notes to Consolidated Financial Statements.
156
Table of Contents
Blackstone Alternative Multi-Strategy Fund and Subsidiaries
Consolidated Schedule of Investments ^ (Continued)
March 31, 2023
| Strike | Expiration Date | Contracts | Notional Amount | Premium Received | Market Value | Unrealized Appreciation (Depreciation) | ||||||||||||||||||||
NAT GAS EURO OPT NOV23 | 5.25 USD | 10/26/23 | 80 | (2,590,400 | ) | $ | (209,214 | ) | $ | (122,960 | ) | $ | 86,254 | |||||||||||||
NAT GAS EURO OPT NOV23 | 4.00 USD | 10/26/23 | 20 | (647,600 | ) | (110,054 | ) | (70,160 | ) | 39,894 | ||||||||||||||||
NAT GAS EURO OPT NOV25 | 5.00 USD | 10/26/23 | 260 | (8,418,800 | ) | (771,094 | ) | (467,220 | ) | 303,874 | ||||||||||||||||
NAT GAS EURO OPT NOV25 | 6.00 USD | 10/28/25 | 20 | (896,400 | ) | (99,053 | ) | (115,500 | ) | (16,447 | ) | |||||||||||||||
NAT GAS EURO OPT NOV25 | 8.00 USD | 10/28/25 | 20 | (896,400 | ) | (56,053 | ) | (65,140 | ) | (9,087 | ) | |||||||||||||||
NAT GAS EURO OPT OCT 23 | 10.00 USD | 09/26/23 | 80 | (2,277,600 | ) | (48,214 | ) | (5,280 | ) | 42,934 | ||||||||||||||||
NAT GAS EURO OPT OCT25 | 6.00 USD | 09/25/25 | 20 | (830,800 | ) | (99,053 | ) | (77,260 | ) | 21,793 | ||||||||||||||||
NAT GAS EURO OPT OCT25 | 8.00 USD | 09/25/25 | 20 | (830,800 | ) | (56,053 | ) | (37,140 | ) | 18,913 | ||||||||||||||||
NAT GAS EURO OPT SEP 23 | 10.00 USD | 08/28/23 | 80 | (2,200,000 | ) | (48,214 | ) | (3,360 | ) | 44,854 | ||||||||||||||||
NAT GAS EURO OPT SEP25 | 6.00 USD | 08/26/25 | 20 | (816,000 | ) | (99,053 | ) | (69,400 | ) | 29,653 | ||||||||||||||||
NAT GAS EURO OPT SEP25 | 8.00 USD | 08/26/25 | 20 | (816,000 | ) | (56,053 | ) | (32,520 | ) | 23,533 | ||||||||||||||||
PHE 01312024 C7 | 7.00 USD | 12/26/23 | 480 | (4,706,400 | ) | (420,259 | ) | (326,040 | ) | 94,219 | ||||||||||||||||
PHE 10312023 C5 SEP23 5 CALL | 5.00 USD | 09/26/23 | 160 | (1,138,800 | ) | (47,287 | ) | (31,240 | ) | 16,047 | ||||||||||||||||
PHE 12312023 C3.75 NOV23 3.75 CALL | 3.75 USD | 11/27/23 | 160 | (1,488,000 | ) | (300,086 | ) | (282,680 | ) | 17,406 | ||||||||||||||||
VIX US JUN 23 37.5C | 37.50 USD | 06/21/23 | 3,300 | (3,300 | ) | (425,604 | ) | (315,150 | ) | 110,454 | ||||||||||||||||
|
|
|
|
|
| |||||||||||||||||||||
| $ | (8,899,715 | ) | $ | (6,443,319 | ) | $ | 2,456,396 | |||||||||||||||||||
|
|
|
|
|
| |||||||||||||||||||||
Exchange-Traded Put Options Written |
| |||||||||||||||||||||||||
CBOE SPX VOLATILITY INDX JUN 23 | 22.00 USD | 06/21/23 | 4,094 | (4,094 | ) | $ | (781,217 | ) | $ | (949,808 | ) | $ | (168,591 | ) | ||||||||||||
CBOE SPX VOLATILITY INDX SEP 23 | 19.00 USD | 09/20/23 | 1,887 | (1,887 | ) | (236,779 | ) | (198,135 | ) | 38,644 | ||||||||||||||||
COPPER FUTURE 07/01/23 | 350.00 USD | 06/27/23 | 260 | (260 | ) | (389,332 | ) | (198,250 | ) | 191,082 | ||||||||||||||||
CRUDE OIL FUT OPT DEC 23 | 45.00 USD | 11/15/23 | 60 | (4,413,000 | ) | (208,891 | ) | (67,200 | ) | 141,691 | ||||||||||||||||
NAT GAS EURO OPT AUG23 | 4.50 USD | 07/26/23 | 164 | (4,564,120 | ) | (685,738 | ) | (2,875,084 | ) | (2,189,346 | ) | |||||||||||||||
NAT GAS EURO OPT DEC23 | 2.00 USD | 11/27/23 | 55 | (4,564,120 | ) | (59,490 | ) | (45,265 | ) | 14,225 | ||||||||||||||||
NAT GAS EURO OPT JUL23 | 4.50 USD | 06/27/23 | 164 | (2,046,000 | ) | (685,738 | ) | (2,932,812 | ) | (2,247,074 | ) | |||||||||||||||
NAT GAS EURO OPT JUN23 | 4.50 USD | 05/25/23 | 164 | (4,480,480 | ) | (685,738 | ) | (3,339,860 | ) | (2,654,122 | ) | |||||||||||||||
NAT GAS EURO OPT MAY23 | 4.50 USD | 04/25/23 | 164 | (4,042,600 | ) | (685,738 | ) | (3,739,364 | ) | (3,053,626 | ) | |||||||||||||||
NAT GAS EURO OPT OCT23 | 4.50 USD | 09/26/23 | 164 | (3,634,240 | ) | (685,738 | ) | (2,837,200 | ) | (2,151,462 | ) | |||||||||||||||
NAT GAS EURO OPT SEP23 | 4.50 USD | 08/28/23 | 164 | (4,669,080 | ) | (685,738 | ) | (2,947,900 | ) | (2,262,162 | ) | |||||||||||||||
NAT GAS EURO OPT APR 23 | 3.95 USD | 04/25/23 | 20 | (4,510,000 | ) | (125,053 | ) | (347,060 | ) | (222,007 | ) | |||||||||||||||
NAT GAS EURO OPT APR 23 | 3.75 USD | 10/26/23 | 20 | (443,200 | ) | (67,053 | ) | (183,100 | ) | (116,047 | ) | |||||||||||||||
NAT GAS EURO OPT APR 23 | 3.75 USD | 11/27/23 | 60 | (647,600 | ) | (365,160 | ) | (441,480 | ) | (76,320 | ) | |||||||||||||||
NAT GAS EURO OPT APR24 | 2.00 USD | 03/25/24 | 20 | (2,232,000 | ) | (27,853 | ) | (32,760 | ) | (4,907 | ) | |||||||||||||||
See Notes to Consolidated Financial Statements.
157
Table of Contents
Blackstone Alternative Multi-Strategy Fund and Subsidiaries
Consolidated Schedule of Investments ^ (Continued)
March 31, 2023
| Strike | Expiration Date | Contracts | Notional Amount | Premium Received | Market Value | Unrealized Appreciation (Depreciation) | ||||||||||||||||||||
NAT GAS EURO OPT APR25 | 2.75 USD | 03/26/25 | 20 | (644,800 | ) | $ | (62,453 | ) | $ | (61,860 | ) | $ | 593 | |||||||||||||
NAT GAS EURO OPT APR25 | 3.50 USD | 03/26/25 | 20 | (764,800 | ) | (118,053 | ) | (127,960 | ) | (9,907 | ) | |||||||||||||||
NAT GAS EURO OPT AUG 23 | 3.50 USD | 07/26/23 | 40 | (764,800 | ) | (112,107 | ) | (358,760 | ) | (246,653 | ) | |||||||||||||||
NAT GAS EURO OPT AUG24 | 2.00 USD | 07/26/24 | 20 | (1,113,200 | ) | (27,853 | ) | (24,160 | ) | 3,693 | ||||||||||||||||
NAT GAS EURO OPT AUG25 | 2.75 USD | 07/28/25 | 20 | (710,000 | ) | (62,454 | ) | (43,960 | ) | 18,494 | ||||||||||||||||
NAT GAS EURO OPT AUG25 | 3.50 USD | 07/28/25 | 20 | (822,000 | ) | (118,054 | ) | (99,300 | ) | 18,754 | ||||||||||||||||
NAT GAS EURO OPT DEC25 | 2.75 USD | 11/24/25 | 20 | (822,000 | ) | (62,454 | ) | (40,760 | ) | 21,694 | ||||||||||||||||
NAT GAS EURO OPT DEC25 | 3.50 USD | 11/24/25 | 20 | (970,000 | ) | (118,054 | ) | (87,040 | ) | 31,014 | ||||||||||||||||
NAT GAS EURO OPT FEB25 | 2.75 USD | 01/28/25 | 20 | (970,000 | ) | (62,453 | ) | (56,320 | ) | 6,133 | ||||||||||||||||
NAT GAS EURO OPT FEB25 | 3.50 USD | 01/28/25 | 20 | (916,200 | ) | (118,053 | ) | (114,560 | ) | 3,493 | ||||||||||||||||
NAT GAS EURO OPT JAN25 | 2.75 USD | 12/26/24 | 20 | (916,200 | ) | (62,453 | ) | (47,400 | ) | 15,053 | ||||||||||||||||
NAT GAS EURO OPT JAN25 | 3.50 USD | 12/26/24 | 20 | (941,200 | ) | (118,054 | ) | (100,800 | ) | 17,254 | ||||||||||||||||
NAT GAS EURO OPT JUL24 | 2.00 USD | 06/25/24 | 20 | (941,200 | ) | (27,853 | ) | (23,800 | ) | 4,053 | ||||||||||||||||
NAT GAS EURO OPT JUL25 | 2.75 USD | 06/25/25 | 20 | (703,000 | ) | (62,453 | ) | (44,380 | ) | 18,073 | ||||||||||||||||
NAT GAS EURO OPT JUL25 | 3.50 USD | 06/25/25 | 20 | (814,800 | ) | (118,054 | ) | (100,520 | ) | 17,534 | ||||||||||||||||
NAT GAS EURO OPT JUN23 | 1.90 USD | 05/25/23 | 100 | (814,800 | ) | (116,367 | ) | (99,900 | ) | 16,467 | ||||||||||||||||
NAT GAS EURO OPT JUN24 | 2.00 USD | 05/28/24 | 20 | (2,465,000 | ) | (27,854 | ) | (26,140 | ) | 1,714 | ||||||||||||||||
NAT GAS EURO OPT JUN25 | 2.75 USD | 05/27/25 | 20 | (674,400 | ) | (62,453 | ) | (48,600 | ) | 13,853 | ||||||||||||||||
NAT GAS EURO OPT JUN25 | 3.50 USD | 05/27/25 | 20 | (790,600 | ) | (118,053 | ) | (108,120 | ) | 9,933 | ||||||||||||||||
NAT GAS EURO OPT MAR25 | 2.75 USD | 02/25/25 | 20 | (790,600 | ) | (62,453 | ) | (69,700 | ) | (7,247 | ) | |||||||||||||||
NAT GAS EURO OPT MAR25 | 3.50 USD | 02/25/25 | 20 | (846,200 | ) | (118,053 | ) | (136,020 | ) | (17,967 | ) | |||||||||||||||
NAT GAS EURO OPT MAY23 | 1.75 USD | 04/25/23 | 60 | (846,200 | ) | (42,370 | ) | (34,560 | ) | 7,810 | ||||||||||||||||
NAT GAS EURO OPT MAY23 | 3.55 USD | 04/25/23 | 20 | (1,329,600 | ) | (113,453 | ) | (268,420 | ) | (154,967 | ) | |||||||||||||||
NAT GAS EURO OPT MAY23 | 1.50 USD | 04/25/23 | 20 | (443,200 | ) | (6,854 | ) | (6,060 | ) | 794 | ||||||||||||||||
NAT GAS EURO OPT MAY24 | 2.00 USD | 04/25/24 | 20 | (443,200 | ) | (27,853 | ) | (28,900 | ) | (1,047 | ) | |||||||||||||||
NAT GAS EURO OPT MAY25 | 2.75 USD | 04/25/25 | 20 | (644,400 | ) | (62,453 | ) | (55,520 | ) | 6,933 | ||||||||||||||||
NAT GAS EURO OPT MAY25 | 3.50 USD | 04/25/25 | 20 | (760,200 | ) | (118,053 | ) | (119,780 | ) | (1,727 | ) | |||||||||||||||
NAT GAS EURO OPT NOV25 | 3.00 USD | 10/26/23 | 20 | (760,200 | ) | (90,803 | ) | (96,540 | ) | (5,737 | ) | |||||||||||||||
NAT GAS EURO OPT NOV25 | 2.75 USD | 10/28/25 | 20 | (647,600 | ) | (62,454 | ) | (42,160 | ) | 20,294 | ||||||||||||||||
NAT GAS EURO OPT NOV25 | 3.50 USD | 10/28/25 | 20 | (896,400 | ) | (118,053 | ) | (92,280 | ) | 25,773 | ||||||||||||||||
NAT GAS EURO OPT OCT23 | 2.25 USD | 09/26/23 | 110 | (896,400 | ) | (311,694 | ) | (286,880 | ) | 24,814 | ||||||||||||||||
NAT GAS EURO OPT OCT24 | 2.00 USD | 09/25/24 | 20 | (3,131,700 | ) | (27,853 | ) | (26,760 | ) | 1,093 | ||||||||||||||||
NAT GAS EURO OPT OCT25 | 2.75 USD | 09/25/25 | 20 | (717,000 | ) | (62,453 | ) | (45,860 | ) | 16,593 | ||||||||||||||||
See Notes to Consolidated Financial Statements.
158
Table of Contents
Blackstone Alternative Multi-Strategy Fund and Subsidiaries
Consolidated Schedule of Investments ^ (Continued)
March 31, 2023
| Strike | Expiration Date | Contracts | Notional Amount | Premium Received | Market Value | Unrealized Appreciation (Depreciation) | ||||||||||||||||||||
NAT GAS EURO OPT OCT25 | 3.50 USD | 09/25/25 | 20 | (830,800 | ) | $ | (118,054 | ) | $ | (101,380 | ) | $ | 16,674 | |||||||||||||
NAT GAS EURO OPT SEP24 | 2.00 USD | 08/27/24 | 20 | (830,800 | ) | (27,853 | ) | (26,400 | ) | 1,453 | ||||||||||||||||
NAT GAS EURO OPT SEP25 | 2.75 USD | 08/26/25 | 20 | (701,800 | ) | (62,453 | ) | (45,780 | ) | 16,673 | ||||||||||||||||
NAT GAS EURO OPT SEP25 | 3.50 USD | 08/26/25 | 20 | (816,000 | ) | (118,053 | ) | (102,180 | ) | 15,873 | ||||||||||||||||
PHE 05312023 PHE P1 APR23 | 1.00 USD | 04/25/23 | 640 | (816,000 | ) | (41,946 | ) | (15,680 | ) | 26,266 | ||||||||||||||||
PHE 06302023 PHE P1 MAY23 | 1.00 USD | 05/25/23 | 640 | (3,545,600 | ) | (41,946 | ) | (21,600 | ) | 20,346 | ||||||||||||||||
PHE 07312023 PHE P1 JUN23 | 1.00 USD | 06/27/23 | 640 | (3,944,000 | ) | (41,946 | ) | (22,400 | ) | 19,546 | ||||||||||||||||
PHE 08312023 PHE P1 JUL23 | 1.00 USD | 07/26/23 | 640 | (4,371,200 | ) | (41,946 | ) | (31,840 | ) | 10,106 | ||||||||||||||||
PHE 09302023 PHE P1 AUG23 | 1.00 USD | 08/28/23 | 640 | (4,452,800 | ) | (41,946 | ) | (50,560 | ) | (8,614 | ) | |||||||||||||||
PHE 10312023 PHE P1 SEP23 | 1.00 USD | 09/26/23 | 640 | (4,400,000 | ) | (41,946 | ) | (56,640 | ) | (14,694 | ) | |||||||||||||||
PHE 12312023 P3.75 NOV23 | 3.75 USD | 11/27/23 | 160 | (4,555,200 | ) | (300,086 | ) | (294,320 | ) | 5,766 | ||||||||||||||||
S&P 500 INDEX APR 23 | 3,865.00 USD | 04/21/23 | 148 | (1,488,000 | ) | (712,380 | ) | (154,956 | ) | 557,424 | ||||||||||||||||
VIX US JUN 23 20P | 20.00 USD | 06/21/23 | 3,300 | (148 | ) | (494,904 | ) | (392,700 | ) | 102,204 | ||||||||||||||||
| (3,300 | ) | |||||||||||||||||||||||||
|
|
|
|
|
| |||||||||||||||||||||
| $ | (11,261,149 | ) | $ | (25,375,494 | ) | $ | (14,114,345 | ) | ||||||||||||||||||
|
|
|
|
|
| |||||||||||||||||||||
Counterparty | Strike | Expiration Date | Contracts | Notional Amount | Premium Paid | Market Value | Unrealized Appreciation (Depreciation) | |||||||||||||||||||||||
OTC Call Options Written |
| |||||||||||||||||||||||||||||
Cap Call 0.95 Jan24 | Morgan Stanley Capital Services LLC | 0.95 USD | 01/10/24 | (2,930,400,000 | ) | $ | (2,930,400,000 | ) | $ | (882,200 | ) | $ | (1,587,427 | ) | $ | (705,227 | ) | |||||||||||||
Interest Rate Swaption 1Y by 1Y EU 12/20/2023 to Pay Fixed 6% Receive SOFR 1Y BISL Adjst RFR | Barclays Bank PLC | 6 USD | 12/20/23 | (1,999,976,000 | ) | (195,637,652,320 | ) | — | (446,935 | ) | (446,935 | ) | ||||||||||||||||||
iShares China Large-Cap ETF Call 41 8/18/23 | Bank of America N.A. | 41 USD | 08/18/23 | (1,463,040 | ) | (1,463,040 | ) | (321,869 | ) | (138,546 | ) | 183,323 | ||||||||||||||||||
iShares China Large-Cap ETF Call 45 12/15/23 | Goldman Sachs & Co. LLC | 45 USD | 12/15/23 | (1,146,566 | ) | (1,146,566 | ) | (745,268 | ) | (173,388 | ) | 571,880 | ||||||||||||||||||
LME Nickel 3M Call | Morgan Stanley & Co. LLC | 60,000 USD | 12/04/24 | (1,260 | ) | (123,253 | ) | (1,008,000 | ) | (532,820 | ) | 475,180 | ||||||||||||||||||
USD ZAR FX Option Call 19.5 4/28/23 | Citi Bank N.A. | 20 USD | 04/28/23 | 32,800,000 | (32,800,000 | ) | (261,744 | ) | (32,842 | ) | 228,902 | |||||||||||||||||||
See Notes to Consolidated Financial Statements.
159
Table of Contents
Blackstone Alternative Multi-Strategy Fund and Subsidiaries
Consolidated Schedule of Investments ^ (Continued)
March 31, 2023
Counterparty | Strike | Expiration Date | Contracts | Notional Amount | Premium Paid | Market Value | Unrealized Appreciation (Depreciation) | |||||||||||||||||||||||
XPD USD FX Option Call 2000 5/17/23 | JPMorgan Chase Bank N.A. | 2,000 USD | 05/17/23 | 6,600 | $ | (6,600 | ) | $ | (105,600 | ) | $ | (44,382 | ) | $ | 61,218 | |||||||||||||||
|
|
|
|
|
| |||||||||||||||||||||||||
| $ | (3,324,681 | ) | $ | (2,956,340 | ) | $ | 368,341 | |||||||||||||||||||||||
|
|
|
|
|
| |||||||||||||||||||||||||
OTC Put Options Written |
| |||||||||||||||||||||||||||||
EO-USDBRL | JPMorgan Chase Bank, N.A | 4.90 USD | 04/03/23 | 65,000,000 | (65,000,000 | ) | (268,450 | ) | (2,117 | ) | 266,333 | |||||||||||||||||||
USD BRL FX Option Put 5.1 4/3/23 | Citi Bank N.A. | 5.10 USD | 04/03/23 | 65,000,000 | (65,000,000 | ) | (193,050 | ) | (562,503 | ) | (369,453 | ) | ||||||||||||||||||
|
|
|
|
|
| |||||||||||||||||||||||||
| $ | (461,500 | ) | $ | (564,620 | ) | $ | (103,120 | ) | ||||||||||||||||||||||
|
|
|
|
|
| |||||||||||||||||||||||||
Total Options Written Outstanding |
| $ | (23,947,045 | ) | $ | (35,339,773 | ) | $ | (11,392,728 | ) | ||||||||||||||||||||
|
|
|
|
|
| |||||||||||||||||||||||||
At March 31, 2023, the Fund had the following unfunded loan commitment(s) for the loan agreement(s) noted, which could be extended at the option of the borrower:
Borrower | Unfunded Loan Commitment | Value | Unrealized | ||||||||||||
ATI Holdings Acquisition, Inc. 2023, 2nd Lien Delayed Draw Term Loan, 0.00%, 03/01/31 | $ | 782,441 | $ | 782,441 | $ | — | |||||||||
Qualtek Buyer LLC, 2023 Revolver, 12.00%, 03/01/28 | 1,057,791 | 1,057,791 | — | ||||||||||||
|
|
|
|
|
| ||||||||||
Total Unfunded Loan Commitment | $ | 1,840,232 | $ | 1,840,232 | $ | — | |||||||||
|
|
|
|
|
| ||||||||||
Reverse Repurchase Agreements Outstanding at March 31, 2023
Counterparty | Interest Rate | Trade Date | Maturity Date | Face Value | Face Value Including Accrued Interest | |||||||||||
Barclays Capital | 3.08% | 02/03/23 | On Demand | (a) | $ | 4,735,609 | $ | 4,750,167 | ||||||||
Barclays Capital | 3.05% | 02/13/23 | On Demand | (a) | 11,043,649 | 11,079,084 | ||||||||||
Barclays Capital | 3.05% | 02/13/23 | On Demand | (a) | 5,813,549 | 5,832,202 | ||||||||||
Barclays Capital | 5.00% | 01/23/23 | On Demand | (a) | 8,393,376 | 8,463,670 | ||||||||||
Barclays Capital | 5.00% | 03/03/23 | On Demand | (a) | 1,187,868 | 1,191,943 | ||||||||||
Barclays Capital | 5.00% | 03/13/23 | On Demand | (a) | 5,256,946 | 5,269,431 | ||||||||||
JPMorgan Chase Bank, N.A. | 5.02% | 03/29/23 | 04/05/23 | 1,569,819 | 1,570,476 | |||||||||||
JPMorgan Chase Bank, N.A. | 5.02% | 03/29/23 | 04/05/23 | 826,764 | 827,109 | |||||||||||
JPMorgan Chase Bank, N.A. | 5.02% | 03/29/23 | 04/05/23 | 2,016,267 | 2,017,110 | |||||||||||
JPMorgan Chase Bank, N.A. | 5.02% | 03/29/23 | 04/05/23 | 4,140,154 | 4,141,886 | |||||||||||
JPMorgan Chase Bank, N.A. | 5.02% | 03/29/23 | 04/05/23 | 13,485,909 | 13,491,551 | |||||||||||
JPMorgan Chase Bank, N.A. | 5.00% | 03/01/23 | On Demand | (a) | 1,162,393 | 1,166,994 | ||||||||||
|
|
|
| |||||||||||||
Total Reverse Repurchase Agreements Outstanding | $ | 59,632,303 | $ | 59,801,623 | ||||||||||||
|
|
|
| |||||||||||||
| (a) | Open reverse repurchase agreement with no specific maturity date. Either party may terminate the agreement upon demand. |
See Notes to Consolidated Financial Statements.
160
Table of Contents
Blackstone Alternative Multi-Strategy Fund and Subsidiaries
Consolidated Schedule of Investments ^ (Continued)
March 31, 2023
Futures Contracts Outstanding at March 31, 2023
Description | Contracts | Exchange | Notional Amount | Expiration Date | Value/ Unrealized Appreciaton (Depreciation) | |||||||||||||||
Long Futures | ||||||||||||||||||||
3 Month Eurodollar | 6 | ICE | 1,448,816 EUR | 06/19/23 | $ | (452 | ) | |||||||||||||
3 Month Eurodollar | 332 | ICE | 79,973,633 EUR | 09/18/23 | 28,107 | |||||||||||||||
3 Month Eurodollar | 615 | ICE | 149,228,125 EUR | 03/17/25 | 35,111 | |||||||||||||||
3 Month SOFR | 1 | CME | 240,913 USD | 03/18/25 | 1,275 | |||||||||||||||
3 Month SOFR | 2 | CME | 483,375 USD | 06/17/25 | 1,450 | |||||||||||||||
3 Month SOFR | 2 | CME | 483,063 USD | 09/16/25 | 1,987 | |||||||||||||||
3 Month SOFR | 2 | CME | 483,225 USD | 12/16/25 | 1,975 | |||||||||||||||
90 Day Eurodollar | 48 | CME | 11,421,883 USD | 09/18/23 | (5,683 | ) | ||||||||||||||
90 Day Eurodollar | 39 | CME | 9,379,662 USD | 03/18/24 | (35,750 | ) | ||||||||||||||
90 Day Eurodollar | 345 | CME | 83,324,917 USD | 03/17/25 | 83,146 | |||||||||||||||
Aluminium | 24 | LME | 1,416,691 USD | 06/21/23 | 29,609 | |||||||||||||||
Australian 10-Year Bond | 35 | SFE | 4,182,719 AUD | 06/15/23 | 79,082 | |||||||||||||||
Brent Crude | 330 | ICE | 234,300 USD | 04/25/23 | (207,900 | ) | ||||||||||||||
Brent Crude | 533 | ICE | 325,130 USD | 04/25/23 | (202,540 | ) | ||||||||||||||
Brent Crude | 164 | ICE | 12,151,128 USD | 04/28/23 | 950,832 | |||||||||||||||
Brent Crude | 192 | ICE | 15,275,580 USD | 05/31/23 | 32,580 | |||||||||||||||
Brent Crude | 5 | ICE | 405,005 USD | 10/31/23 | (15,456 | ) | ||||||||||||||
Brent Crude | 2 | ICE | 155,504 USD | 10/31/24 | (7,284 | ) | ||||||||||||||
Brent Crude | 71 | NYMEX | 5,137,496 USD | 10/31/24 | 124,314 | |||||||||||||||
Brent Crude | 1 | ICE | 73,552 USD | 10/31/25 | (2,372 | ) | ||||||||||||||
British Pound Currency | 53 | CME | 4,011,948 USD | 06/16/23 | 80,646 | |||||||||||||||
CAC40 Index | 3 | Euronext | 210,124 EUR | 04/21/23 | 10,733 | |||||||||||||||
Canadian Dollar Currency | 45 | CME | 3,270,981 USD | 06/20/23 | 58,569 | |||||||||||||||
CBOE Volatility Index | 54 | CFE | 1,302,761 USD | 04/19/23 | (181,494 | ) | ||||||||||||||
CBOE Volatility Index | 48 | CFE | 1,219,019 USD | 05/17/23 | (156,851 | ) | ||||||||||||||
CBOE Volatility Index | 161 | CFE | 3,929,040 USD | 08/16/23 | (113,501 | ) | ||||||||||||||
Chicago CG Basis | 31 | ICE | 17,798 USD | 10/03/23 | (415 | ) | ||||||||||||||
Chicago CG Basis | 31 | ICE | 5,398 USD | 03/04/24 | 1,135 | |||||||||||||||
Cocoa | 1,541 | ICE | 43,542,231 USD | 07/14/23 | 1,054,309 | |||||||||||||||
Coffee 'C' | 8 | ICE | 530,738 USD | 07/19/23 | (21,638 | ) | ||||||||||||||
Copper | 31 | COMEX | 3,023,619 USD | 05/26/23 | 149,618 | |||||||||||||||
Corn | 416 | CBOT | 12,870,528 USD | 05/12/23 | 867,872 | |||||||||||||||
Cotton No.2 | 24 | ICE | 1,012,725 USD | 07/07/23 | (15,525 | ) | ||||||||||||||
DAX Index | 10 | Eurex | 3,828,777 EUR | 06/16/23 | 130,653 | |||||||||||||||
DJIA mini E-CBOT | 35 | CBOT | 5,695,350 USD | 06/16/23 | 160,150 | |||||||||||||||
Dominion South Swing | 1 | ICE | 4,338 USD | 04/03/23 | 134 | |||||||||||||||
Dominion South Swing | 1 | ICE | 4,338 USD | 04/03/23 | 134 | |||||||||||||||
Dominion South Swing | 1 | ICE | 4,338 USD | 04/04/23 | 134 | |||||||||||||||
Dominion South Swing | 1 | ICE | 4,338 USD | 04/05/23 | 147 | |||||||||||||||
Dominion South Swing | 1 | ICE | 4,338 USD | 04/06/23 | 147 | |||||||||||||||
Dominion South Swing | 1 | ICE | 4,338 USD | 04/10/23 | 147 | |||||||||||||||
See Notes to Consolidated Financial Statements.
161
Table of Contents
Blackstone Alternative Multi-Strategy Fund and Subsidiaries
Consolidated Schedule of Investments ^ (Continued)
March 31, 2023
Description | Contracts | Exchange | Notional Amount | Expiration Date | Value/ Unrealized Appreciaton (Depreciation) | |||||||||||||||
Dominion South Swing | 1 | ICE | 4,338 USD | 04/10/23 | $ | 147 | ||||||||||||||
Dominion South Swing | 1 | ICE | 4,338 USD | 04/10/23 | 147 | |||||||||||||||
Dominion South Swing | 1 | ICE | 4,338 USD | 04/10/23 | 147 | |||||||||||||||
Dominion South Swing | 1 | ICE | 4,338 USD | 04/11/23 | 147 | |||||||||||||||
Dominion South Swing | 1 | ICE | 4,338 USD | 04/12/23 | 147 | |||||||||||||||
Dominion South Swing | 1 | ICE | 4,338 USD | 04/13/23 | 147 | |||||||||||||||
Dominion South Swing | 1 | ICE | 4,338 USD | 04/14/23 | 147 | |||||||||||||||
Dominion South Swing | 1 | ICE | 4,338 USD | 04/17/23 | 147 | |||||||||||||||
Dominion South Swing | 1 | ICE | 4,338 USD | 04/17/23 | 147 | |||||||||||||||
Dominion South Swing | 1 | ICE | 4,338 USD | 04/17/23 | 147 | |||||||||||||||
Dominion South Swing | 1 | ICE | 4,338 USD | 04/18/23 | 147 | |||||||||||||||
Dominion South Swing | 1 | ICE | 4,338 USD | 04/19/23 | 147 | |||||||||||||||
Dominion South Swing | 1 | ICE | 4,338 USD | 04/20/23 | 147 | |||||||||||||||
Dominion South Swing | 1 | ICE | 4,338 USD | 04/21/23 | 147 | |||||||||||||||
Dominion South Swing | 1 | ICE | 4,338 USD | 04/24/23 | 147 | |||||||||||||||
Dominion South Swing | 1 | ICE | 4,338 USD | 04/24/23 | 147 | |||||||||||||||
Dominion South Swing | 1 | ICE | 4,338 USD | 04/24/23 | 147 | |||||||||||||||
Dominion South Swing | 1 | ICE | 4,338 USD | 04/25/23 | 147 | |||||||||||||||
Dominion South Swing | 1 | ICE | 4,338 USD | 04/26/23 | 147 | |||||||||||||||
Dominion South Swing | 1 | ICE | 4,338 USD | 04/27/23 | 147 | |||||||||||||||
Dominion South Swing | 1 | ICE | 4,338 USD | 04/28/23 | 147 | |||||||||||||||
Dominion South Swing | 1 | ICE | 4,338 USD | 05/01/23 | 147 | |||||||||||||||
Dominion South Swing | 1 | ICE | 4,338 USD | 05/01/23 | 147 | |||||||||||||||
Dominion South Swing | 1 | ICE | 4,338 USD | 05/01/23 | 147 | |||||||||||||||
Dominion Sp | 31 | ICE | 96,654 USD | 07/05/23 | 54,417 | |||||||||||||||
Dominion Sp | 30 | ICE | 93,536 USD | 09/05/23 | 29,411 | |||||||||||||||
Dominion Sp | 150 | ICE | 369,639 USD | 11/02/23 | 15,264 | |||||||||||||||
Dominion Sp | 30 | ICE | 89,974 USD | 09/04/24 | 5,036 | |||||||||||||||
E-mini Russell 2000 | 18 | CME | 1,608,030 USD | 06/16/23 | 24,120 | |||||||||||||||
E-Mini S&P 500 Index | 59 | CME | 11,742,580 USD | 06/16/23 | 463,782 | |||||||||||||||
Euro FX | 16 | CME | 2,184,616 USD | 06/16/23 | (3,916 | ) | ||||||||||||||
FTSE 100 Index | 63 | ICE | 4,699,559 GBP | 06/16/23 | 139,410 | |||||||||||||||
FTSE China A50 | 283 | SGX | 3,724,351 USD | 04/27/23 | 41,247 | |||||||||||||||
FTSE/MIB Index | 1 | IDEM | 125,627 EUR | 06/16/23 | 8,299 | |||||||||||||||
Gasoline RBOB | 94 | NYMEX | 10,163,775 USD | 04/28/23 | 420,813 | |||||||||||||||
Gasoline RBOB | 102 | NYMEX | 11,146,117 USD | 05/31/23 | 112,235 | |||||||||||||||
Globex Natural Gas | 128 | NYMEX | 3,456,160 USD | 04/25/23 | (619,680 | ) | ||||||||||||||
Globex Natural Gas | 67 | NYMEX | 1,587,615 USD | 05/25/23 | 63,935 | |||||||||||||||
Globex Natural Gas | 137 | NYMEX | 4,964,736 USD | 10/26/23 | (528,676 | ) | ||||||||||||||
Globex Natural Gas | 37 | NYMEX | 1,431,764 USD | 11/27/23 | (55,364 | ) | ||||||||||||||
Gold 100 OZ | 19 | COMEX | 3,805,216 USD | 06/28/23 | (31,436 | ) | ||||||||||||||
Hang Seng China Enterprises Index | 10 | HKFE | 10,149,119 HKD | 04/27/23 | 11,641 | |||||||||||||||
Henry Hub | 89 | NYMEX | 618,628 USD | 04/25/23 | (125,568 | ) | ||||||||||||||
See Notes to Consolidated Financial Statements.
162
Table of Contents
Blackstone Alternative Multi-Strategy Fund and Subsidiaries
Consolidated Schedule of Investments ^ (Continued)
March 31, 2023
Description | Contracts | Exchange | Notional Amount | Expiration Date | Value/ Unrealized Appreciaton (Depreciation) | |||||||||||||||
Henry Hub | 30 | ICE | 271,751 USD | 10/27/23 | $ | (28,901 | ) | |||||||||||||
Henry Hub | 310 | ICE | 3,196,526 USD | 11/28/23 | (313,526 | ) | ||||||||||||||
Henry Hub | 372 | ICE | 4,210,591 USD | 12/27/24 | 165,989 | |||||||||||||||
Henry Hub | 651 | ICE | 5,785,976 USD | 12/29/25 | 2,465,449 | |||||||||||||||
Henry Hub | 588 | ICE | 5,226,043 USD | 01/28/26 | 1,903,457 | |||||||||||||||
Henry Hub | 651 | ICE | 5,785,976 USD | 02/25/26 | 1,399,436 | |||||||||||||||
Henry Hub | 630 | ICE | 5,599,332 USD | 03/27/26 | 440,793 | |||||||||||||||
Henry Hub | 651 | ICE | 5,785,976 USD | 04/28/26 | 439,211 | |||||||||||||||
Henry Hub | 630 | ICE | 5,599,332 USD | 05/27/26 | 580,968 | |||||||||||||||
Henry Hub | 651 | ICE | 5,785,976 USD | 06/26/26 | 759,829 | |||||||||||||||
Henry Hub | 651 | ICE | 5,785,976 USD | 07/29/26 | 795,634 | |||||||||||||||
Henry Hub | 630 | ICE | 5,599,332 USD | 08/27/26 | 722,718 | |||||||||||||||
Henry Hub | 651 | ICE | 5,785,976 USD | 09/28/26 | 859,106 | |||||||||||||||
Henry Hub | 630 | ICE | 5,599,332 USD | 10/28/26 | 1,354,293 | |||||||||||||||
Henry Hub | 651 | ICE | 5,785,976 USD | 11/25/26 | 2,009,749 | |||||||||||||||
Henry Hub | 61 | ICE | 651,227 USD | 12/29/26 | 110,968 | |||||||||||||||
Henry Hub | 52 | ICE | 554,766 USD | 01/27/27 | 70,014 | |||||||||||||||
Henry Hub | 61 | ICE | 651,227 USD | 02/24/27 | 15,045 | |||||||||||||||
Henry Hub | 58 | ICE | 619,066 USD | 03/29/27 | (68,211 | ) | ||||||||||||||
Henry Hub | 61 | ICE | 651,227 USD | 04/28/27 | (75,082 | ) | ||||||||||||||
Henry Hub | 58 | ICE | 619,066 USD | 05/26/27 | (62,411 | ) | ||||||||||||||
Henry Hub | 61 | ICE | 651,227 USD | 06/28/27 | (53,427 | ) | ||||||||||||||
Henry Hub | 61 | ICE | 651,227 USD | 07/28/27 | (48,242 | ) | ||||||||||||||
Henry Hub | 58 | ICE | 619,066 USD | 08/27/27 | (48,201 | ) | ||||||||||||||
Henry Hub | 61 | ICE | 651,227 USD | 09/28/27 | (35,280 | ) | ||||||||||||||
Henry Hub | 58 | ICE | 619,066 USD | 10/27/27 | 17,194 | |||||||||||||||
Henry Hub | 61 | ICE | 651,227 USD | 11/26/27 | 83,365 | |||||||||||||||
HH PENUL FIXED JAN24 IFED 20231226 | 144 | ICE | 1,508,526 USD | 12/26/23 | (96,606 | ) | ||||||||||||||
HSC Basis | 60 | ICE | 62,948 USD | 11/02/23 | (428 | ) | ||||||||||||||
ICE 3 Month Sonia | 177 | ICE | 42,395,096 GBP | 03/19/24 | (160,008 | ) | ||||||||||||||
ICE 3 month Sonia | 469 | ICE | 112,894,807 GBP | 06/17/25 | (73,114 | ) | ||||||||||||||
Japan Yen Currency | 41 | CME | 3,826,674 USD | 06/16/23 | 79,857 | |||||||||||||||
Japanese 10-Year Bond | 10 | OSE | 1,454,061,464 JPY | 06/13/23 | 204,395 | |||||||||||||||
Lean Hogs | 411 | CME | 14,749,435 USD | 06/14/23 | 313,715 | |||||||||||||||
Live Cattle | 989 | CME | 61,774,864 USD | 08/31/23 | 2,084,866 | |||||||||||||||
Low Sulphar Gasoil | 48 | ICE | 3,547,135 USD | 05/11/23 | 61,265 | |||||||||||||||
Low Sulphar Gasoil | 39 | ICE | 2,962,319 USD | 06/12/23 | (77,295 | ) | ||||||||||||||
Low Sulphar Gasoil | 22 | ICE | 1,672,608 USD | 07/12/23 | (56,708 | ) | ||||||||||||||
Mexican Peso Currency | 127 | CME | 3,370,312 USD | 06/16/23 | 101,233 | |||||||||||||||
Michcon Basis | 60 | ICE | 3,765 USD | 04/04/23 | 8,985 | |||||||||||||||
Michcon Basis | 93 | ICE | 58,431 USD | 08/02/23 | 3,794 | |||||||||||||||
Michcon Basis | 90 | ICE | 71,171 USD | 11/02/23 | 296 | |||||||||||||||
MSCI Emerging Market | 15 | ICE | 717,258 USD | 06/16/23 | 29,367 | |||||||||||||||
See Notes to Consolidated Financial Statements.
163
Table of Contents
Blackstone Alternative Multi-Strategy Fund and Subsidiaries
Consolidated Schedule of Investments ^ (Continued)
March 31, 2023
Description | Contracts | Exchange | Notional Amount | Expiration Date | Value/ Unrealized Appreciaton (Depreciation) | |||||||||||||||
NASDAQ 100 E-Mini | 26 | CME | 6,659,609 USD | 06/16/23 | $ | 257,301 | ||||||||||||||
Natural Gas | 458 | NYMEX | 10,836,181 USD | 04/26/23 | (686,901 | ) | ||||||||||||||
Natural Gas | 63 | NYMEX | 1,880,778 USD | 04/26/23 | (484,698 | ) | ||||||||||||||
Natural Gas | 51 | NYMEX | 2,162,598 USD | 05/26/23 | (905,448 | ) | ||||||||||||||
Natural Gas | 31 | NYMEX | 1,500,763 USD | 06/28/23 | (653,843 | ) | ||||||||||||||
Natural Gas | 208 | NYMEX | 5,675,738 USD | 06/28/23 | 6,822 | |||||||||||||||
Natural Gas | 40 | NYMEX | 1,405,671 USD | 07/27/23 | (292,471 | ) | ||||||||||||||
Natural Gas | 31 | NYMEX | 1,500,763 USD | 08/29/23 | (648,263 | ) | ||||||||||||||
Natural Gas | 17 | NYMEX | 480,821 USD | 08/29/23 | (13,321 | ) | ||||||||||||||
Natural Gas | 11 | NYMEX | 332,840 USD | 09/27/23 | (19,670 | ) | ||||||||||||||
Natural Gas | 41 | NYMEX | 1,480,641 USD | 10/27/23 | (153,061 | ) | ||||||||||||||
Natural Gas | 674 | NYMEX | 28,238,094 USD | 12/27/23 | (1,803,814 | ) | ||||||||||||||
Natural Gas | 201 | NYMEX | 9,651,546 USD | 01/29/24 | (1,983,396 | ) | ||||||||||||||
Natural Gas | 2 | NYMEX | 75,630 USD | 01/29/24 | 670 | |||||||||||||||
Natural Gas | 288 | NYMEX | 15,914,095 USD | 02/27/24 | (5,822,575 | ) | ||||||||||||||
Natural Gas | 203 | NYMEX | 7,159,558 USD | 02/27/24 | (46,438 | ) | ||||||||||||||
Natural Gas | 172 | NYMEX | 8,442,096 USD | 03/26/24 | (2,896,816 | ) | ||||||||||||||
Natural Gas | 171 | NYMEX | 8,339,274 USD | 04/26/24 | (2,829,654 | ) | ||||||||||||||
Natural Gas | 89 | NYMEX | 3,261,505 USD | 04/26/24 | (393,925 | ) | ||||||||||||||
Natural Gas | 171 | NYMEX | 8,339,274 USD | 05/29/24 | (2,573,154 | ) | ||||||||||||||
Natural Gas | 63 | NYMEX | 2,435,912 USD | 05/29/24 | (311,552 | ) | ||||||||||||||
Natural Gas | 171 | NYMEX | 8,339,274 USD | 06/26/24 | (2,328,624 | ) | ||||||||||||||
Natural Gas | 64 | NYMEX | 2,462,663 USD | 06/26/24 | (213,063 | ) | ||||||||||||||
Natural Gas | 171 | NYMEX | 8,339,274 USD | 07/29/24 | (2,268,774 | ) | ||||||||||||||
Natural Gas | 64 | NYMEX | 2,462,663 USD | 07/29/24 | (190,663 | ) | ||||||||||||||
Natural Gas | 171 | NYMEX | 8,339,274 USD | 08/28/24 | (2,338,884 | ) | ||||||||||||||
Natural Gas | 63 | NYMEX | 2,435,912 USD | 08/28/24 | (225,242 | ) | ||||||||||||||
Natural Gas | 298 | NYMEX | 13,177,763 USD | 09/26/24 | (2,494,463 | ) | ||||||||||||||
Natural Gas | 42 | NYMEX | 1,840,554 USD | 09/26/24 | (334,854 | ) | ||||||||||||||
Natural Gas | 196 | NYMEX | 9,512,937 USD | 10/29/24 | (1,763,097 | ) | ||||||||||||||
Natural Gas | 79 | NYMEX | 2,968,130 USD | 10/29/24 | 155,530 | |||||||||||||||
Natural Gas | 196 | NYMEX | 9,512,937 USD | 11/26/24 | (853,657 | ) | ||||||||||||||
Natural Gas | 116 | NYMEX | 5,506,205 USD | 11/26/24 | (381,325 | ) | ||||||||||||||
Natural Gas | 61 | NYMEX | 2,762,168 USD | 12/27/24 | 108,492 | |||||||||||||||
Natural Gas | 32 | NYMEX | 971,555 USD | 01/29/25 | 494,365 | |||||||||||||||
Natural Gas | 49 | NYMEX | 2,191,207 USD | 01/29/25 | 53,483 | |||||||||||||||
Natural Gas | 32 | NYMEX | 971,555 USD | 02/26/25 | 382,365 | |||||||||||||||
Natural Gas | 49 | NYMEX | 2,191,207 USD | 02/26/25 | (118,017 | ) | ||||||||||||||
Natural Gas | 28 | NYMEX | 919,648 USD | 03/27/25 | 151,072 | |||||||||||||||
Natural Gas | 39 | NYMEX | 1,780,469 USD | 03/27/25 | (289,109 | ) | ||||||||||||||
Natural Gas | 28 | NYMEX | 919,648 USD | 04/28/25 | 144,632 | |||||||||||||||
Natural Gas | 39 | NYMEX | 1,780,469 USD | 04/28/25 | (298,079 | ) | ||||||||||||||
Natural Gas | 28 | NYMEX | 919,648 USD | 05/28/25 | 187,192 | |||||||||||||||
Natural Gas | 39 | NYMEX | 1,780,469 USD | 05/28/25 | (238,799 | ) | ||||||||||||||
See Notes to Consolidated Financial Statements.
164
Table of Contents
Blackstone Alternative Multi-Strategy Fund and Subsidiaries
Consolidated Schedule of Investments ^ (Continued)
March 31, 2023
Description | Contracts | Exchange | Notional Amount | Expiration Date | Value/ Unrealized Appreciaton (Depreciation) | |||||||||||||||
Natural Gas | 28 | NYMEX | 919,648 USD | 06/26/25 | $ | 221,072 | ||||||||||||||
Natural Gas | 39 | NYMEX | 1,780,469 USD | 06/26/25 | (191,609 | ) | ||||||||||||||
Natural Gas | 28 | NYMEX | 919,648 USD | 07/29/25 | 231,152 | |||||||||||||||
Natural Gas | 39 | NYMEX | 1,780,469 USD | 07/29/25 | (177,569 | ) | ||||||||||||||
Natural Gas | 28 | NYMEX | 919,648 USD | 08/27/25 | 222,752 | |||||||||||||||
Natural Gas | 39 | NYMEX | 1,780,469 USD | 08/27/25 | (189,269 | ) | ||||||||||||||
Natural Gas | 28 | NYMEX | 919,648 USD | 09/26/25 | 243,472 | |||||||||||||||
Natural Gas | 39 | NYMEX | 1,780,469 USD | 09/26/25 | (160,409 | ) | ||||||||||||||
Natural Gas | 32 | NYMEX | 971,555 USD | 10/29/25 | 462,685 | |||||||||||||||
Natural Gas | 49 | NYMEX | 2,191,207 USD | 10/29/25 | 4,973 | |||||||||||||||
Natural Gas | 32 | NYMEX | 971,555 USD | 11/25/25 | 580,445 | |||||||||||||||
Natural Gas | 49 | NYMEX | 2,191,207 USD | 11/25/25 | 185,293 | |||||||||||||||
Natural Gas | 54 | NYMEX | 2,034,693 USD | 12/29/26 | 664,227 | |||||||||||||||
Natural Gas | 54 | NYMEX | 2,034,693 USD | 01/27/27 | 560,547 | |||||||||||||||
Natural Gas | 54 | NYMEX | 2,034,693 USD | 02/24/27 | 324,567 | |||||||||||||||
Natural Gas | 54 | NYMEX | 2,034,693 USD | 03/29/27 | 16,767 | |||||||||||||||
Natural Gas | 54 | NYMEX | 2,034,693 USD | 04/28/27 | 5,427 | |||||||||||||||
Natural Gas | 54 | NYMEX | 2,034,693 USD | 05/26/27 | 38,367 | |||||||||||||||
Natural Gas | 54 | NYMEX | 2,034,693 USD | 06/28/27 | 82,107 | |||||||||||||||
Natural Gas | 54 | NYMEX | 2,034,693 USD | 07/28/27 | 100,467 | |||||||||||||||
Natural Gas | 54 | NYMEX | 2,034,693 USD | 08/27/27 | 95,067 | |||||||||||||||
Natural Gas | 54 | NYMEX | 2,034,693 USD | 09/28/27 | 150,147 | |||||||||||||||
Natural Gas | 54 | NYMEX | 2,034,693 USD | 10/27/27 | 338,607 | |||||||||||||||
Natural Gas | 54 | NYMEX | 2,034,693 USD | 11/26/27 | 570,267 | |||||||||||||||
New Zealand Dollar | 124 | CME | 7,619,603 USD | 06/16/23 | 131,636 | |||||||||||||||
Nickel | 6 | LME | 860,603 USD | 06/21/23 | (2,759 | ) | ||||||||||||||
NY Harbor ULSD | 42 | NYMEX | 4,572,260 USD | 04/28/23 | 50,478 | |||||||||||||||
NY Harbor ULSD | 84 | NYMEX | 9,004,793 USD | 05/31/23 | 51,583 | |||||||||||||||
OMXS30 Index | 5 | Nasdaq OMX | 1,045,193 SEK | 04/21/23 | 6,087 | |||||||||||||||
S&P ASX Share Price Index 200 | 23 | SFE | 4,059,546 AUD | 06/15/23 | 50,320 | |||||||||||||||
S&P TSX 60 Index | 18 | CDE | 4,357,352 CAD | 06/15/23 | (3,131 | ) | ||||||||||||||
Silver | 6 | COMEX | 700,487 USD | 05/26/23 | 24,193 | |||||||||||||||
Soyabean | 350 | CBOT | 25,052,952 USD | 05/12/23 | 1,293,298 | |||||||||||||||
Soyabean Oil | 705 | CBOT | 23,613,108 USD | 05/12/23 | (140,839 | ) | ||||||||||||||
Soybean | 192 | CBOT | 8,867,559 USD | 07/14/23 | (10,599 | ) | ||||||||||||||
Sugar | 4,199 | ICE | 95,249,691 USD | 06/30/23 | 7,414,179 | |||||||||||||||
Swiss Franc Currency | 12 | CME | 1,654,355 USD | 06/16/23 | 220 | |||||||||||||||
TETCO M3 Basis | 30 | ICE | 59,974 USD | 09/05/23 | 2,599 | |||||||||||||||
TETCO M3 Basis | 31 | ICE | 80,922 USD | 10/03/23 | 128 | |||||||||||||||
Topix | 39 | OSE | 789,371,310 JPY | 06/08/23 | (60,300 | ) | ||||||||||||||
Trans Z4 Basis | 31 | ICE | 6,227 USD | 05/02/23 | (3,708 | ) | ||||||||||||||
Trans Z4 Basis | 30 | ICE | 13,526 USD | 06/02/23 | (1,339 | ) | ||||||||||||||
TTF Natural Gas | 40 | ICE | 1,479,371 EUR | 12/30/24 | 269,266 | |||||||||||||||
TTF Natural Gas | 40 | ICE | 1,336,206 EUR | 01/30/25 | 228,632 | |||||||||||||||
See Notes to Consolidated Financial Statements.
165
Table of Contents
Blackstone Alternative Multi-Strategy Fund and Subsidiaries
Consolidated Schedule of Investments ^ (Continued)
March 31, 2023
Description | Contracts | Exchange | Notional Amount | Expiration Date | Value/ Unrealized Appreciaton (Depreciation) | |||||||||||||||
TTF Natural Gas | 40 | ICE | 1,477,383 EUR | 02/27/25 | $ | 138,399 | ||||||||||||||
U.S. Treasury 10-Year Note | 151 | CBOT | 16,897,798 USD | 06/21/23 | 455,405 | |||||||||||||||
VSTOXX | 1,228 | Eurex | 439,010 EUR | 06/21/23 | (239,718 | ) | ||||||||||||||
Western Hub Real-Time Peak Daily Mini | 25 | ICE | 421,400 USD | 02/02/24 | 285,670 | |||||||||||||||
Western Hub Real-Time Peak Daily Mini | 25 | ICE | 482,680 USD | 02/02/24 | 225,720 | |||||||||||||||
Western Hub Real-Time Peak Daily Mini | 25 | ICE | 387,000 USD | 03/04/24 | 210,150 | |||||||||||||||
Western Hub Real-Time Peak Daily Mini | 25 | ICE | 460,740 USD | 03/04/24 | 161,700 | |||||||||||||||
Western Hub Real-Time Peak Daily Mini | 25 | ICE | 437,525 USD | 04/02/24 | (16,789 | ) | ||||||||||||||
Western Hub Real-Time Peak Daily Mini | 25 | ICE | 460,740 USD | 04/02/24 | (56,700 | ) | ||||||||||||||
Western Hub Real-Time Peak Daily Mini | 25 | ICE | 395,600 USD | 05/02/24 | (87,860 | ) | ||||||||||||||
Western Hub Real-Time Peak Daily Mini | 25 | ICE | 482,680 USD | 05/02/24 | (113,520 | ) | ||||||||||||||
Western Hub Real-Time Peak Daily Mini | 25 | ICE | 421,400 USD | 06/04/24 | (99,960 | ) | ||||||||||||||
Western Hub Real-Time Peak Daily Mini | 25 | ICE | 482,680 USD | 06/04/24 | (104,280 | ) | ||||||||||||||
Western Hub Real-Time Peak Daily Mini | 25 | ICE | 430,000 USD | 07/02/24 | (102,000 | ) | ||||||||||||||
Western Hub Real-Time Peak Daily Mini | 25 | ICE | 438,800 USD | 07/02/24 | (68,000 | ) | ||||||||||||||
Western Hub Real-Time Peak Daily Mini | 25 | ICE | 421,400 USD | 08/02/24 | (20,580 | ) | ||||||||||||||
Western Hub Real-Time Peak Daily Mini | 25 | ICE | 482,680 USD | 08/02/24 | 72,600 | |||||||||||||||
Western Hub Real-Time Peak Daily Mini | 25 | ICE | 421,400 USD | 09/04/24 | (51,940 | ) | ||||||||||||||
Western Hub Real-Time Peak Daily Mini | 25 | ICE | 482,680 USD | 09/04/24 | 38,280 | |||||||||||||||
Western Hub Real-Time Peak Daily Mini | 25 | ICE | 430,000 USD | 10/02/24 | (117,000 | ) | ||||||||||||||
Western Hub Real-Time Peak Daily Mini | 25 | ICE | 438,800 USD | 10/02/24 | (81,200 | ) | ||||||||||||||
Western Hub Real-Time Peak Daily Mini | 25 | ICE | 404,200 USD | 11/04/24 | (117,030 | ) | ||||||||||||||
Western Hub Real-Time Peak Daily Mini | 25 | ICE | 504,620 USD | 11/04/24 | (129,720 | ) | ||||||||||||||
See Notes to Consolidated Financial Statements.
166
Table of Contents
Blackstone Alternative Multi-Strategy Fund and Subsidiaries
Consolidated Schedule of Investments ^ (Continued)
March 31, 2023
Description | Contracts | Exchange | Notional Amount | Expiration Date | Value/ Unrealized Appreciaton (Depreciation) | |||||||||||||||
Western Hub Real-Time Peak Daily Mini | 25 | ICE | 431,075 USD | 12/03/24 | $ | (74,686 | ) | |||||||||||||
Western Hub Real-Time Peak Daily Mini | 25 | ICE | 438,800 USD | 12/03/24 | (84,800 | ) | ||||||||||||||
Western Hub Real-Time Peak Daily Mini | 25 | ICE | 438,600 USD | 01/03/25 | 50,490 | |||||||||||||||
Western Hub Real-Time Peak Daily Mini | 25 | ICE | 460,740 USD | 01/03/25 | 7,560 | |||||||||||||||
Wheat | 536 | CBOT | 18,615,777 USD | 05/12/23 | (63,478 | ) | ||||||||||||||
WTI Crude | 146 | NYMEX | 9,965,991 USD | 04/20/23 | 1,081,829 | |||||||||||||||
WTI Crude | 45 | NYMEX | 3,365,822 USD | 05/22/23 | 45,178 | |||||||||||||||
WTI Crude | 12 | NYMEX | 853,302 USD | 08/22/23 | 46,698 | |||||||||||||||
WTI Crude | 11 | NYMEX | 813,443 USD | 09/20/23 | 6,167 | |||||||||||||||
WTI Crude | 82 | NYMEX | 5,676,176 USD | 11/20/23 | 354,924 | |||||||||||||||
WTI Crude | 25 | NYMEX | 1,835,654 USD | 05/21/24 | (54,904 | ) | ||||||||||||||
WTI Crude | 4 | NYMEX | 290,370 USD | 11/20/24 | (13,010 | ) | ||||||||||||||
WTI Crude | 3 | NYMEX | 204,067 USD | 11/20/25 | (6,127 | ) | ||||||||||||||
Zinc | 18 | LME | 1,347,818 USD | 06/21/23 | (31,681 | ) | ||||||||||||||
|
| |||||||||||||||||||
| $ | (959,259 | ) | ||||||||||||||||||
|
| |||||||||||||||||||
Short Futures | ||||||||||||||||||||
3 Month Eurodollar | 268 | ICE | 64,631,985 EUR | 12/18/23 | $ | 4,105 | ||||||||||||||
3 Month Eurodollar | 274 | ICE | 66,313,814 EUR | 03/18/24 | 140,024 | |||||||||||||||
3 Month Eurodollar | 79 | ICE | 19,143,725 EUR | 06/17/24 | 33,254 | |||||||||||||||
3 Month Eurodollar | 102 | ICE | 24,732,482 EUR | 09/16/24 | 22,159 | |||||||||||||||
3 Month Eurodollar | 379 | ICE | 91,824,269 EUR | 12/16/24 | (100,539 | ) | ||||||||||||||
3 Month SOFR | 1 | CME | 237,381 USD | 06/20/23 | (437 | ) | ||||||||||||||
3 Month SOFR | 16 | CME | 3,811,788 USD | 09/19/23 | 6,788 | |||||||||||||||
3 Month SOFR | 13 | CME | 3,107,488 USD | 12/19/23 | 7,150 | |||||||||||||||
3 Month SOFR | 6 | CME | 1,437,825 USD | 03/19/24 | 2,325 | |||||||||||||||
3 Month SOFR | 9 | CME | 2,152,588 USD | 06/18/24 | (9,550 | ) | ||||||||||||||
3 Month SOFR | 9 | CME | 2,161,750 USD | 09/17/24 | (8,037 | ) | ||||||||||||||
3 Month SOFR | 4 | CME | 961,350 USD | 12/17/24 | (5,750 | ) | ||||||||||||||
3 Month SOFR | 6 | CME | 1,454,650 USD | 06/16/26 | (1,400 | ) | ||||||||||||||
3 Month SOFR | 4 | CME | 969,113 USD | 09/15/26 | (1,537 | ) | ||||||||||||||
3 Month SOFR | 3 | CME | 728,200 USD | 12/15/26 | 325 | |||||||||||||||
3 Month SOFR | 3 | CME | 728,150 USD | 03/16/27 | 313 | |||||||||||||||
3 Month SOFR | 2 | CME | 484,613 USD | 06/15/27 | (537 | ) | ||||||||||||||
3 Month SOFR | 1 | CME | 241,850 USD | 12/14/27 | (550 | ) | ||||||||||||||
3 Month SOFR | 2 | CME | 483,925 USD | 03/14/28 | (725 | ) | ||||||||||||||
90 Day Eurodollar | 48 | CME | 11,406,880 USD | 06/19/23 | 33,280 | |||||||||||||||
90 Day Eurodollar | 25 | CME | 5,932,885 USD | 09/18/23 | (13,053 | ) | ||||||||||||||
90 Day Eurodollar | 64 | CME | 15,237,466 USD | 12/18/23 | (32,934 | ) | ||||||||||||||
90 Day Eurodollar | 23 | CME | 5,497,177 USD | 03/18/24 | (13,335 | ) | ||||||||||||||
See Notes to Consolidated Financial Statements.
167
Table of Contents
Blackstone Alternative Multi-Strategy Fund and Subsidiaries
Consolidated Schedule of Investments ^ (Continued)
March 31, 2023
Description | Contracts | Exchange | Notional Amount | Expiration Date | Value/ Unrealized Appreciaton (Depreciation) | |||||||||||||||
90 Day Eurodollar | 130 | CME | 31,117,869 USD | 06/17/24 | $ | (139,006 | ) | |||||||||||||
90 Day Eurodollar | 211 | CME | 50,648,839 USD | 09/16/24 | (228,536 | ) | ||||||||||||||
90 Day Eurodollar | 74 | CME | 17,832,797 USD | 12/16/24 | (40,978 | ) | ||||||||||||||
90 Day Eurodollar | 11 | CME | 2,647,259 USD | 03/17/25 | (12,129 | ) | ||||||||||||||
90 Day Eurodollar | 11 | CME | 2,648,784 USD | 06/16/25 | (11,841 | ) | ||||||||||||||
90 Day Eurodollar | 10 | CME | 2,409,961 USD | 09/15/25 | (9,539 | ) | ||||||||||||||
90 Day Eurodollar | 7 | CME | 1,687,161 USD | 12/15/25 | (6,927 | ) | ||||||||||||||
90 Day Eurodollar | 12 | CME | 2,886,681 USD | 03/16/26 | (17,619 | ) | ||||||||||||||
90 Day Eurodollar | 4 | CME | 963,190 USD | 06/15/26 | (4,860 | ) | ||||||||||||||
90 Day Eurodollar | 6 | CME | 1,443,397 USD | 09/14/26 | (8,453 | ) | ||||||||||||||
90 Day Eurodollar | 3 | CME | 722,642 USD | 12/14/26 | (3,245 | ) | ||||||||||||||
90 Day Eurodollar | 4 | CME | 962,490 USD | 03/15/27 | (5,210 | ) | ||||||||||||||
90 Day Eurodollar | 5 | CME | 1,201,499 USD | 06/14/27 | (7,813 | ) | ||||||||||||||
90 Day Eurodollar | 3 | CME | 719,192 USD | 09/13/27 | (6,058 | ) | ||||||||||||||
Aluminium | 16 | LME | 909,939 USD | 06/21/23 | (54,261 | ) | ||||||||||||||
Australian Dollar Currency | 129 | CME | 8,622,654 USD | 06/16/23 | (21,636 | ) | ||||||||||||||
Brent Crude | 144 | ICE | 10,666,482 USD | 05/31/23 | (814,638 | ) | ||||||||||||||
Brent Crude | 24 | ICE | 1,801,019 USD | 06/30/23 | (105,781 | ) | ||||||||||||||
Brent Crude | 30 | ICE | 2,321,326 USD | 07/31/23 | (51,974 | ) | ||||||||||||||
Brent Crude | 15 | ICE | 1,089,091 USD | 08/31/23 | (91,559 | ) | ||||||||||||||
Brent Crude | 105 | ICE | 8,265,290 USD | 10/31/23 | 84,740 | |||||||||||||||
California Carbon Allowance Vintage Specific 2023 | 3,059 | ICE | 91,533,022 USD | 12/22/23 | (3,510,108 | ) | ||||||||||||||
Canadian Dollar Currency | 111 | CME | 8,094,729 USD | 06/20/23 | (118,161 | ) | ||||||||||||||
CBOE Volatility Index | 136 | CFE | 3,160,003 USD | 06/21/23 | 37,688 | |||||||||||||||
CBOE Volatility Index | 160 | CFE | 3,848,120 USD | 07/19/23 | 73,064 | |||||||||||||||
CBOE Volatility Index | 121 | CFE | 2,923,980 USD | 09/20/23 | 21,082 | |||||||||||||||
Chicago CG Basis | 30 | ICE | 3,776 USD | 04/02/24 | 1,849 | |||||||||||||||
Cocoa | 1,263 | ICE | 36,179,305 USD | 05/15/23 | (864,485 | ) | ||||||||||||||
Coffee 'C' | 16 | ICE | 1,075,292 USD | 05/18/23 | 52,292 | |||||||||||||||
Copper | 154 | CMX | 15,686,588 USD | 05/26/23 | (77,237 | ) | ||||||||||||||
Copper | 21 | COMEX | 2,031,524 USD | 07/27/23 | (122,289 | ) | ||||||||||||||
Corn | 446 | CBOT | 13,550,334 USD | 07/14/23 | (632,466 | ) | ||||||||||||||
Cotton No.2 | 30 | ICE | 1,226,008 USD | 05/08/23 | (15,692 | ) | ||||||||||||||
Dominion Sp | 30 | ICE | 42,776 USD | 06/02/23 | (7,339 | ) | ||||||||||||||
Dominion Sp | 31 | ICE | 88,338 USD | 10/03/23 | (3,088 | ) | ||||||||||||||
Dominion SP | 62 | ICE | 100,804 USD | 03/04/24 | (9,742 | ) | ||||||||||||||
E-Mini S&P 500 Index | 220 | CME | 44,739,302 USD | 06/16/23 | (775,948 | ) | ||||||||||||||
Euro BOBL | 26 | Eurex | 3,691,619 EUR | 06/08/23 | 31,731 | |||||||||||||||
Euro BOBL | 85 | Eurex | 10,035,925 EUR | 06/08/23 | 17,487 | |||||||||||||||
Euro BTP | 2 | Eurex | 228,879 EUR | 06/08/23 | (1,975 | ) | ||||||||||||||
Euro FX | 87 | CME | 11,601,840 USD | 06/16/23 | (255,716 | ) | ||||||||||||||
Euro Stoxx 50 | 512 | Eurex | 20,937,230 EUR | 06/16/23 | (953,373 | ) | ||||||||||||||
Euro-Bund | 35 | Eurex | 4,755,577 EUR | 06/08/23 | 1,276 | |||||||||||||||
See Notes to Consolidated Financial Statements.
168
Table of Contents
Blackstone Alternative Multi-Strategy Fund and Subsidiaries
Consolidated Schedule of Investments ^ (Continued)
March 31, 2023
Description | Contracts | Exchange | Notional Amount | Expiration Date | Value/ Unrealized Appreciaton (Depreciation) | |||||||||||||||
Euro-OAT | 11 | Eurex | 1,403,958 EUR | 06/08/23 | $ | (30,986 | ) | |||||||||||||
Euro-Schatz | 307 | Eurex | 32,468,737 EUR | 06/08/23 | 22,093 | |||||||||||||||
FTSE 100 Index | 435 | ICE | 32,615,291 GBP | 06/16/23 | (757,873 | ) | ||||||||||||||
Gasoline RBOB | 97 | NYMEX | 10,845,029 USD | 04/28/23 | (77,365 | ) | ||||||||||||||
Gasoline RBOB | 82 | NYMEX | 8,618,171 USD | 06/30/23 | (244,963 | ) | ||||||||||||||
Globex Natural Gas | 15 | NYMEX | 406,974 USD | 06/27/23 | (2,826 | ) | ||||||||||||||
Globex Natural Gas | 21 | NYMEX | 615,264 USD | 07/26/23 | 30,834 | |||||||||||||||
Globex Natural Gas | 7 | NYMEX | 199,488 USD | 08/28/23 | 6,988 | |||||||||||||||
Globex Natural Gas | 151 | NYMEX | 5,004,370 USD | 09/26/23 | 705,400 | |||||||||||||||
Globex Natural Gas | 241 | NYMEX | 9,740,585 USD | 12/26/23 | 288,566 | |||||||||||||||
Globex Natural Gas | 11 | NYMEX | 384,981 USD | 01/26/24 | (34,669 | ) | ||||||||||||||
Globex Natural Gas | 11 | NYMEX | 384,981 USD | 02/26/24 | (459 | ) | ||||||||||||||
Globex Natural Gas | 19 | NYMEX | 740,967 USD | 03/25/24 | 128,407 | |||||||||||||||
Globex Natural Gas | 19 | NYMEX | 740,967 USD | 04/25/24 | 128,787 | |||||||||||||||
Globex Natural Gas | 19 | NYMEX | 740,967 USD | 05/28/24 | 100,287 | |||||||||||||||
Globex Natural Gas | 19 | NYMEX | 740,967 USD | 06/25/24 | 73,117 | |||||||||||||||
Globex Natural Gas | 19 | NYMEX | 740,967 USD | 07/26/24 | 66,467 | |||||||||||||||
Globex Natural Gas | 19 | NYMEX | 740,967 USD | 08/27/24 | 74,257 | |||||||||||||||
Globex Natural Gas | 19 | NYMEX | 740,967 USD | 09/25/24 | 59,817 | |||||||||||||||
Globex Natural Gas | 11 | NYMEX | 384,981 USD | 10/28/24 | (49,959 | ) | ||||||||||||||
Globex Natural Gas | 11 | NYMEX | 384,981 USD | 11/25/24 | (100,999 | ) | ||||||||||||||
Globex Natural Gas | 32 | NYMEX | 1,261,145 USD | 12/26/24 | (244,775 | ) | ||||||||||||||
Globex Natural Gas | 32 | NYMEX | 1,261,145 USD | 01/28/25 | (204,775 | ) | ||||||||||||||
Globex Natural Gas | 32 | NYMEX | 1,261,145 USD | 02/25/25 | (92,775 | ) | ||||||||||||||
Globex Natural Gas | 32 | NYMEX | 1,261,145 USD | 03/26/25 | 37,465 | |||||||||||||||
Globex Natural Gas | 32 | NYMEX | 1,261,145 USD | 04/25/25 | 44,825 | |||||||||||||||
Globex Natural Gas | 32 | NYMEX | 1,261,145 USD | 05/27/25 | (3,815 | ) | ||||||||||||||
Globex Natural Gas | 32 | NYMEX | 1,261,145 USD | 06/25/25 | (42,535 | ) | ||||||||||||||
Globex Natural Gas | 32 | NYMEX | 1,261,145 USD | 07/28/25 | (54,055 | ) | ||||||||||||||
Globex Natural Gas | 32 | NYMEX | 1,261,145 USD | 08/26/25 | (44,455 | ) | ||||||||||||||
Globex Natural Gas | 32 | NYMEX | 1,261,145 USD | 09/25/25 | (68,135 | ) | ||||||||||||||
Globex Natural Gas | 32 | NYMEX | 1,261,145 USD | 10/28/25 | (173,095 | ) | ||||||||||||||
Globex Natural Gas | 32 | NYMEX | 1,261,145 USD | 11/24/25 | (290,855 | ) | ||||||||||||||
Henry Hub | 47 | ICE | 246,709 USD | 04/26/23 | (13,671 | ) | ||||||||||||||
Henry Hub | 34 | NYMEX | 482,770 USD | 05/25/23 | 273,245 | |||||||||||||||
Henry Hub | 351 | ICE | 4,341,293 USD | 05/26/23 | 2,178,255 | |||||||||||||||
Henry Hub | 87 | NYMEX | 1,212,324 USD | 06/27/23 | 618,114 | |||||||||||||||
Henry Hub | 109 | ICE | 1,492,405 USD | 06/28/23 | 747,935 | |||||||||||||||
Henry Hub | 87 | NYMEX | 1,212,324 USD | 07/26/23 | 607,021 | |||||||||||||||
Henry Hub | 357 | ICE | 4,417,038 USD | 07/27/23 | 1,933,210 | |||||||||||||||
Henry Hub | 87 | NYMEX | 1,212,324 USD | 08/28/23 | 614,199 | |||||||||||||||
Henry Hub | 291 | ICE | 3,191,145 USD | 08/29/23 | 1,190,520 | |||||||||||||||
Henry Hub | 69 | NYMEX | 909,190 USD | 09/26/23 | 418,082 | |||||||||||||||
Henry Hub | 1,074 | ICE | 9,350,855 USD | 09/27/23 | 1,706,660 | |||||||||||||||
See Notes to Consolidated Financial Statements.
169
Table of Contents
Blackstone Alternative Multi-Strategy Fund and Subsidiaries
Consolidated Schedule of Investments ^ (Continued)
March 31, 2023
Description | Contracts | Exchange | Notional Amount | Expiration Date | Value/ Unrealized Appreciaton (Depreciation) | |||||||||||||||
Henry Hub | 104 | NYMEX | 697,054 USD | 10/26/23 | $ | (144,826 | ) | |||||||||||||
Henry Hub | 86 | NYMEX | 537,769 USD | 11/27/23 | (262,031 | ) | ||||||||||||||
Henry Hub | 7 | ICE | 71,744 USD | 12/27/23 | 3,109 | |||||||||||||||
Henry Hub | 803 | ICE | 9,635,400 USD | 01/29/24 | 1,976,787 | |||||||||||||||
Henry Hub | 786 | ICE | 9,488,252 USD | 02/27/24 | 2,602,892 | |||||||||||||||
Henry Hub | 170 | NYMEX | 1,109,124 USD | 03/25/24 | (261,076 | ) | ||||||||||||||
Henry Hub | 716 | ICE | 8,722,098 USD | 03/26/24 | 2,951,138 | |||||||||||||||
Henry Hub | 170 | NYMEX | 1,109,124 USD | 04/25/24 | (260,226 | ) | ||||||||||||||
Henry Hub | 743 | ICE | 8,980,147 USD | 04/26/24 | 2,995,282 | |||||||||||||||
Henry Hub | 170 | NYMEX | 1,109,124 USD | 05/28/24 | (323,976 | ) | ||||||||||||||
Henry Hub | 716 | ICE | 8,722,098 USD | 05/29/24 | 2,686,218 | |||||||||||||||
Henry Hub | 170 | NYMEX | 1,109,124 USD | 06/25/24 | (384,751 | ) | ||||||||||||||
Henry Hub | 743 | ICE | 8,980,147 USD | 06/26/24 | 2,451,035 | |||||||||||||||
Henry Hub | 170 | NYMEX | 1,109,124 USD | 07/26/24 | (399,626 | ) | ||||||||||||||
Henry Hub | 743 | ICE | 8,980,147 USD | 07/29/24 | 2,386,022 | |||||||||||||||
Henry Hub | 170 | NYMEX | 1,109,124 USD | 08/27/24 | (382,201 | ) | ||||||||||||||
Henry Hub | 716 | ICE | 8,722,098 USD | 08/28/24 | 2,440,988 | |||||||||||||||
Henry Hub | 170 | NYMEX | 1,109,124 USD | 09/25/24 | (414,501 | ) | ||||||||||||||
Henry Hub | 991 | ICE | 11,108,855 USD | 09/26/24 | 2,227,018 | |||||||||||||||
Henry Hub | 1,230 | ICE | 13,134,533 USD | 10/29/24 | 975,983 | |||||||||||||||
Henry Hub | 1,251 | ICE | 13,319,868 USD | 11/26/24 | (497,427 | ) | ||||||||||||||
Henry Hub | 16 | NYMEX | 163,936 USD | 12/26/24 | (24,304 | ) | ||||||||||||||
Henry Hub | 16 | NYMEX | 163,936 USD | 01/28/25 | (19,304 | ) | ||||||||||||||
Henry Hub | 112 | ICE | 1,269,982 USD | 01/29/25 | (12,698 | ) | ||||||||||||||
Henry Hub | 16 | NYMEX | 163,936 USD | 02/25/25 | (5,304 | ) | ||||||||||||||
Henry Hub | 124 | ICE | 1,406,051 USD | 02/26/25 | 94,442 | |||||||||||||||
Henry Hub | 16 | NYMEX | 163,936 USD | 03/26/25 | 10,976 | |||||||||||||||
Henry Hub | 90 | ICE | 1,056,221 USD | 03/27/25 | 195,821 | |||||||||||||||
Henry Hub | 16 | NYMEX | 163,936 USD | 04/25/25 | 11,896 | |||||||||||||||
Henry Hub | 93 | ICE | 1,091,429 USD | 04/28/25 | 207,696 | |||||||||||||||
Henry Hub | 16 | NYMEX | 163,936 USD | 05/27/25 | 5,816 | |||||||||||||||
Henry Hub | 90 | ICE | 1,056,221 USD | 05/28/25 | 166,796 | |||||||||||||||
Henry Hub | 16 | NYMEX | 163,936 USD | 06/25/25 | 976 | |||||||||||||||
Henry Hub | 93 | ICE | 1,091,429 USD | 06/26/25 | 144,224 | |||||||||||||||
Henry Hub | 16 | NYMEX | 163,936 USD | 07/28/25 | (464 | ) | ||||||||||||||
Henry Hub | 93 | ICE | 1,091,429 USD | 07/29/25 | 135,854 | |||||||||||||||
Henry Hub | 16 | NYMEX | 163,936 USD | 08/26/25 | 736 | |||||||||||||||
Henry Hub | 90 | ICE | 1,056,221 USD | 08/27/25 | 138,221 | |||||||||||||||
Henry Hub | 16 | NYMEX | 163,936 USD | 09/25/25 | (2,224 | ) | ||||||||||||||
Henry Hub | 93 | ICE | 1,091,429 USD | 09/26/25 | 125,624 | |||||||||||||||
Henry Hub | 16 | NYMEX | 163,936 USD | 10/28/25 | (15,344 | ) | ||||||||||||||
Henry Hub | 120 | ICE | 1,360,695 USD | 10/29/25 | 16,095 | |||||||||||||||
Henry Hub | 16 | NYMEX | 163,936 USD | 11/24/25 | (30,064 | ) | ||||||||||||||
Henry Hub | 124 | ICE | 1,406,051 USD | 11/25/25 | (97,448 | ) | ||||||||||||||
See Notes to Consolidated Financial Statements.
170
Table of Contents
Blackstone Alternative Multi-Strategy Fund and Subsidiaries
Consolidated Schedule of Investments ^ (Continued)
March 31, 2023
Description | Contracts | Exchange | Notional Amount | Expiration Date | Value/ Unrealized Appreciaton (Depreciation) | |||||||||||||||
Henry Swing | 1 | ICE | 5,112 USD | 04/03/23 | $ | (130 | ) | |||||||||||||
Henry Swing | 1 | ICE | 5,112 USD | 04/03/23 | (130 | ) | ||||||||||||||
Henry Swing | 1 | ICE | 5,112 USD | 04/04/23 | (130 | ) | ||||||||||||||
Henry Swing | 1 | ICE | 5,112 USD | 04/05/23 | (56 | ) | ||||||||||||||
Henry Swing | 1 | ICE | 5,112 USD | 04/06/23 | (56 | ) | ||||||||||||||
Henry Swing | 1 | ICE | 5,112 USD | 04/10/23 | (56 | ) | ||||||||||||||
Henry Swing | 1 | ICE | 5,112 USD | 04/10/23 | (56 | ) | ||||||||||||||
Henry Swing | 1 | ICE | 5,112 USD | 04/10/23 | (56 | ) | ||||||||||||||
Henry Swing | 1 | ICE | 5,112 USD | 04/10/23 | (56 | ) | ||||||||||||||
Henry Swing | 1 | ICE | 5,112 USD | 04/11/23 | (56 | ) | ||||||||||||||
Henry Swing | 1 | ICE | 5,112 USD | 04/12/23 | (56 | ) | ||||||||||||||
Henry Swing | 1 | ICE | 5,112 USD | 04/13/23 | (56 | ) | ||||||||||||||
Henry Swing | 1 | ICE | 5,112 USD | 04/14/23 | (56 | ) | ||||||||||||||
Henry Swing | 1 | ICE | 5,112 USD | 04/17/23 | (56 | ) | ||||||||||||||
Henry Swing | 1 | ICE | 5,112 USD | 04/17/23 | (56 | ) | ||||||||||||||
Henry Swing | 1 | ICE | 5,112 USD | 04/17/23 | (56 | ) | ||||||||||||||
Henry Swing | 1 | ICE | 5,112 USD | 04/18/23 | (56 | ) | ||||||||||||||
Henry Swing | 1 | ICE | 5,112 USD | 04/19/23 | (56 | ) | ||||||||||||||
Henry Swing | 1 | ICE | 5,112 USD | 04/20/23 | (56 | ) | ||||||||||||||
Henry Swing | 1 | ICE | 5,112 USD | 04/21/23 | (56 | ) | ||||||||||||||
Henry Swing | 1 | ICE | 5,112 USD | 04/24/23 | (56 | ) | ||||||||||||||
Henry Swing | 1 | ICE | 5,112 USD | 04/24/23 | (56 | ) | ||||||||||||||
Henry Swing | 1 | ICE | 5,112 USD | 04/24/23 | (56 | ) | ||||||||||||||
Henry Swing | 1 | ICE | 5,112 USD | 04/25/23 | (56 | ) | ||||||||||||||
Henry Swing | 1 | ICE | 5,112 USD | 04/26/23 | (56 | ) | ||||||||||||||
Henry Swing | 1 | ICE | 5,112 USD | 04/27/23 | (56 | ) | ||||||||||||||
Henry Swing | 1 | ICE | 5,112 USD | 04/28/23 | (56 | ) | ||||||||||||||
Henry Swing | 1 | ICE | 5,112 USD | 05/01/23 | (56 | ) | ||||||||||||||
Henry Swing | 1 | ICE | 5,112 USD | 05/01/23 | (56 | ) | ||||||||||||||
Henry Swing | 1 | ICE | 5,112 USD | 05/01/23 | (56 | ) | ||||||||||||||
HH PENUL FIXED MAY23 IFED 20230425 | 432 | ICE | 3,120,822 USD | 04/25/23 | 727,542 | |||||||||||||||
HH PENUL FIXED OCT23 IFED 20230926 | 29 | ICE | 234,875 USD | 09/26/23 | 28,467 | |||||||||||||||
HSC Basis | 30 | ICE | 24,214 USD | 09/05/23 | (5,089 | ) | ||||||||||||||
HSC Basis | 62 | ICE | 60,117 USD | 10/03/23 | 4,983 | |||||||||||||||
ICE 3 Month Sonia | 15 | ICE | 3,577,491 GBP | 12/19/23 | (11 | ) | ||||||||||||||
ICE 3 Month Sonia | 263 | ICE | 63,153,831 GBP | 06/18/24 | 264,784 | |||||||||||||||
ICE 3 Month Sonia | 167 | ICE | 40,129,390 GBP | 09/17/24 | 89,254 | |||||||||||||||
ICE 3 Month Sonia | 243 | ICE | 58,374,025 GBP | 12/17/24 | (8,296 | ) | ||||||||||||||
ICE 3 Month Sonia | 49 | ICE | 11,793,194 GBP | 03/18/25 | 13,747 | |||||||||||||||
Japan Yen Currency | 17 | CME | 1,603,792 USD | 06/16/23 | (15,989 | ) | ||||||||||||||
Lean Hogs | 480 | CME | 17,774,357 USD | 07/17/23 | (278,443 | ) | ||||||||||||||
Live Cattle | 837 | CME | 52,252,392 USD | 06/30/23 | (2,027,058 | ) | ||||||||||||||
See Notes to Consolidated Financial Statements.
171
Table of Contents
Blackstone Alternative Multi-Strategy Fund and Subsidiaries
Consolidated Schedule of Investments ^ (Continued)
March 31, 2023
Description | Contracts | Exchange | Notional Amount | Expiration Date | Value/ Unrealized Appreciaton (Depreciation) | |||||||||||||||
Long Gilt | 6 | ICE | 623,366 GBP | 06/28/23 | $ | 4,029 | ||||||||||||||
Low Sulphar Gasoil | 20 | ICE | 1,575,762 USD | 05/11/23 | 72,262 | |||||||||||||||
Low Sulphar Gasoil | 78 | ICE | 5,849,162 USD | 08/10/23 | 141,512 | |||||||||||||||
Michcon Basis | 93 | ICE | 15,194 USD | 05/02/23 | (10,544 | ) | ||||||||||||||
Michcon Basis | 31 | ICE | 8,165 USD | 03/04/24 | (2,352 | ) | ||||||||||||||
Natural Gas | 1 | NYMEX | 6,769 USD | 04/26/23 | 1,229 | |||||||||||||||
Natural Gas | 159 | NYMEX | 3,870,454 USD | 04/26/23 | 347,014 | |||||||||||||||
Natural Gas | 2 | NYMEX | 13,546 USD | 05/26/23 | 1,221 | |||||||||||||||
Natural Gas | 633 | NYMEX | 16,765,085 USD | 05/26/23 | 1,161,635 | |||||||||||||||
Natural Gas | 1 | NYMEX | 6,769 USD | 06/28/23 | (61 | ) | ||||||||||||||
Natural Gas | 43 | NYMEX | 1,250,961 USD | 06/28/23 | 76,201 | |||||||||||||||
Natural Gas | 1 | NYMEX | 6,769 USD | 07/27/23 | (189 | ) | ||||||||||||||
Natural Gas | 10 | NYMEX | 297,512 USD | 07/27/23 | 19,212 | |||||||||||||||
Natural Gas | 85 | NYMEX | 5,014,854 USD | 07/27/23 | 2,649,304 | |||||||||||||||
Natural Gas | 2 | NYMEX | 13,546 USD | 08/29/23 | (204 | ) | ||||||||||||||
Natural Gas | 99 | NYMEX | 2,913,695 USD | 08/29/23 | 191,195 | |||||||||||||||
Natural Gas | 1 | NYMEX | 6,778 USD | 09/27/23 | (340 | ) | ||||||||||||||
Natural Gas | 174 | NYMEX | 4,891,382 USD | 09/27/23 | (62,398 | ) | ||||||||||||||
Natural Gas | 183 | NYMEX | 10,741,785 USD | 09/27/23 | 5,531,775 | |||||||||||||||
Natural Gas | 2 | NYMEX | 13,555 USD | 10/27/23 | (2,635 | ) | ||||||||||||||
Natural Gas | 35 | NYMEX | 1,138,907 USD | 10/27/23 | 5,607 | |||||||||||||||
Natural Gas | 1 | NYMEX | 6,778 USD | 11/28/23 | (2,522 | ) | ||||||||||||||
Natural Gas | 53 | NYMEX | 1,985,111 USD | 11/28/23 | 13,511 | |||||||||||||||
Natural Gas | 19 | NYMEX | 570,517 USD | 11/28/23 | (136,283 | ) | ||||||||||||||
Natural Gas | 386 | NYMEX | 15,960,675 USD | 12/27/23 | 821,755 | |||||||||||||||
Natural Gas | 93 | NYMEX | 3,533,895 USD | 01/29/24 | (14,055 | ) | ||||||||||||||
Natural Gas | 67 | NYMEX | 2,191,241 USD | 03/26/24 | 31,161 | |||||||||||||||
Natural Gas | 3 | NYMEX | 101,255 USD | 09/26/24 | (6,295 | ) | ||||||||||||||
Natural Gas | 88 | NYMEX | 3,968,649 USD | 12/27/24 | (172,631 | ) | ||||||||||||||
Natural Gas | 42 | NYMEX | 2,224,526 USD | 12/27/24 | 248,006 | |||||||||||||||
Natural Gas | 33 | NYMEX | 1,472,942 USD | 12/29/25 | (200,158 | ) | ||||||||||||||
Natural Gas | 141 | NYMEX | 5,123,357 USD | 12/29/25 | (2,025,343 | ) | ||||||||||||||
Natural Gas | 33 | NYMEX | 1,472,542 USD | 01/28/26 | (127,958 | ) | ||||||||||||||
Natural Gas | 141 | NYMEX | 5,123,357 USD | 01/28/26 | (1,715,143 | ) | ||||||||||||||
Natural Gas | 33 | NYMEX | 1,472,542 USD | 02/25/26 | 15,592 | |||||||||||||||
Natural Gas | 141 | NYMEX | 5,123,357 USD | 02/25/26 | (1,101,793 | ) | ||||||||||||||
Natural Gas | 33 | NYMEX | 1,472,942 USD | 03/27/26 | 207,392 | |||||||||||||||
Natural Gas | 141 | NYMEX | 5,123,357 USD | 03/27/26 | (283,992 | ) | ||||||||||||||
Natural Gas | 33 | NYMEX | 1,472,542 USD | 04/28/26 | 210,292 | |||||||||||||||
Natural Gas | 141 | NYMEX | 5,123,357 USD | 04/28/26 | (269,892 | ) | ||||||||||||||
Natural Gas | 33 | NYMEX | 1,472,942 USD | 05/27/26 | 178,022 | |||||||||||||||
Natural Gas | 141 | NYMEX | 5,123,357 USD | 05/27/26 | (409,482 | ) | ||||||||||||||
Natural Gas | 33 | NYMEX | 1,472,542 USD | 06/26/26 | 145,282 | |||||||||||||||
Natural Gas | 141 | NYMEX | 5,123,357 USD | 06/26/26 | (547,663 | ) | ||||||||||||||
See Notes to Consolidated Financial Statements.
172
Table of Contents
Blackstone Alternative Multi-Strategy Fund and Subsidiaries
Consolidated Schedule of Investments ^ (Continued)
March 31, 2023
Description | Contracts | Exchange | Notional Amount | Expiration Date | Value/ Unrealized Appreciaton (Depreciation) | |||||||||||||||
Natural Gas | 33 | NYMEX | 1,472,542 USD | 07/29/26 | $ | 138,022 | ||||||||||||||
Natural Gas | 141 | NYMEX | 5,123,357 USD | 07/29/26 | (578,683 | ) | ||||||||||||||
Natural Gas | 33 | NYMEX | 1,472,942 USD | 08/27/26 | 148,322 | |||||||||||||||
Natural Gas | 141 | NYMEX | 5,123,357 USD | 08/27/26 | (536,383 | ) | ||||||||||||||
Natural Gas | 33 | NYMEX | 1,472,542 USD | 09/28/26 | 125,152 | |||||||||||||||
Natural Gas | 141 | NYMEX | 5,123,357 USD | 09/28/26 | (633,673 | ) | ||||||||||||||
Natural Gas | 33 | NYMEX | 1,472,542 USD | 10/28/26 | 15,592 | |||||||||||||||
Natural Gas | 141 | NYMEX | 5,123,357 USD | 10/28/26 | (1,101,793 | ) | ||||||||||||||
Natural Gas | 33 | NYMEX | 1,472,542 USD | 11/25/26 | (108,158 | ) | ||||||||||||||
Natural Gas | 141 | NYMEX | 5,123,357 USD | 11/25/26 | (1,630,543 | ) | ||||||||||||||
Natural Gas | 53 | NYMEX | 2,370,900 USD | 12/29/26 | (278,040 | ) | ||||||||||||||
Natural Gas | 53 | NYMEX | 2,370,900 USD | 01/27/27 | (176,280 | ) | ||||||||||||||
Natural Gas | 53 | NYMEX | 2,370,900 USD | 02/24/27 | 55,330 | |||||||||||||||
Natural Gas | 53 | NYMEX | 2,370,900 USD | 03/29/27 | 357,430 | |||||||||||||||
Natural Gas | 53 | NYMEX | 2,370,900 USD | 04/28/27 | 368,560 | |||||||||||||||
Natural Gas | 53 | NYMEX | 2,370,900 USD | 05/26/27 | 336,230 | |||||||||||||||
Natural Gas | 53 | NYMEX | 2,370,900 USD | 06/28/27 | 293,300 | |||||||||||||||
Natural Gas | 53 | NYMEX | 2,370,900 USD | 07/28/27 | 275,280 | |||||||||||||||
Natural Gas | 53 | NYMEX | 2,370,900 USD | 08/27/27 | 284,290 | |||||||||||||||
Natural Gas | 53 | NYMEX | 2,370,900 USD | 09/28/27 | 230,230 | |||||||||||||||
Natural Gas | 53 | NYMEX | 2,370,900 USD | 10/27/27 | 45,260 | |||||||||||||||
Natural Gas | 53 | NYMEX | 2,370,900 USD | 11/26/27 | (182,110 | ) | ||||||||||||||
Nickel | 4 | LME | 543,585 USD | 06/21/23 | (28,311 | ) | ||||||||||||||
NY Harbor ULSD | 46 | NYMEX | 4,822,939 USD | 05/31/23 | (136,505 | ) | ||||||||||||||
NY Harbor ULSD | 68 | NYMEX | 7,230,961 USD | 08/31/23 | (44,414 | ) | ||||||||||||||
NY Harbor ULSD | 16 | NYMEX | 1,694,235 USD | 11/30/23 | (6,261 | ) | ||||||||||||||
Palladium | 10 | NYMEX | 1,490,335 USD | 06/28/23 | 22,335 | |||||||||||||||
Platinum | 2 | NYMEX | 97,616 USD | 07/27/23 | (2,694 | ) | ||||||||||||||
S&P 500 E-mini | 96 | CME | 19,193,630 USD | 06/16/23 | (667,570 | ) | ||||||||||||||
S+P Mid 400 EMINI | 3 | CME | 722,815 USD | 06/16/23 | (36,095 | ) | ||||||||||||||
Soyabean Oil | 753 | CBOT | 25,265,380 USD | 07/14/23 | 136,264 | |||||||||||||||
Soybean | 171 | CBOT | 8,008,468 USD | 05/12/23 | 39,868 | |||||||||||||||
Soybean | 360 | CBOT | 25,380,050 USD | 07/14/23 | (1,178,950 | ) | ||||||||||||||
Sugar | 3,524 | ICE | 82,291,107 USD | 04/28/23 | (5,526,973 | ) | ||||||||||||||
Swiss Franc Currency | 39 | CME | 5,265,825 USD | 06/16/23 | (111,544 | ) | ||||||||||||||
Trans Z4 Basis | 60 | ICE | 25,448 USD | 09/05/23 | 2,198 | |||||||||||||||
U.S. Treasury 10-Year Note | 3,402 | CBOT | 393,775,305 USD | 06/21/23 | 2,811,087 | |||||||||||||||
U.S. Treasury 2-Year Note | 108 | CBOT | 22,323,114 USD | 06/30/23 | 26,176 | |||||||||||||||
U.S. Treasury 5-Year Note | 182 | CBOT | 19,951,367 USD | 06/30/23 | 20,945 | |||||||||||||||
U.S. Treasury Long Bond | 6 | CBOT | 759,583 USD | 06/21/23 | (27,355 | ) | ||||||||||||||
U.S. Treasury Ultra Bond | 67 | CBOT | 9,457,070 USD | 06/21/23 | 1,695 | |||||||||||||||
VSTOXX | 82 | Eurex | 173,734 EUR | 04/19/23 | 3,887 | |||||||||||||||
VSTOXX | 1,228 | Eurex | 205,690 EUR | 06/21/23 | 113,200 | |||||||||||||||
VSTOXX | 1,228 | Eurex | 193,410 EUR | 06/21/23 | (99,882 | ) | ||||||||||||||
See Notes to Consolidated Financial Statements.
173
Table of Contents
Blackstone Alternative Multi-Strategy Fund and Subsidiaries
Consolidated Schedule of Investments ^ (Continued)
March 31, 2023
Description | Contracts | Exchange | Notional Amount | Expiration Date | Value/ Unrealized Appreciaton (Depreciation) | |||||||||||||||
VSTOXX | 237 | Eurex | 534,126 EUR | 06/21/23 | $ | 15,086 | ||||||||||||||
Wheat | 596 | CBOT | 21,025,702 USD | 07/14/23 | 31,602 | |||||||||||||||
WTI Crude | 6 | NYMEX | 452,469 USD | 04/20/23 | (1,551 | ) | ||||||||||||||
WTI Crude | 138 | NYMEX | 9,257,852 USD | 05/22/23 | (1,202,548 | ) | ||||||||||||||
WTI Crude | 32 | NYMEX | 2,199,841 USD | 06/20/23 | (223,519 | ) | ||||||||||||||
WTI Crude | 3 | NYMEX | 223,904 USD | 07/20/23 | (2,415 | ) | ||||||||||||||
WTI Crude | 80 | NYMEX | 5,297,368 USD | 11/20/24 | (249,832 | ) | ||||||||||||||
Zinc | 12 | LME | 860,354 USD | 06/21/23 | (17,071 | ) | ||||||||||||||
|
| |||||||||||||||||||
| $ | 17,209,680 | |||||||||||||||||||
|
| |||||||||||||||||||
Total Futures Contracts Outstanding |
| $ | 16,250,421 | |||||||||||||||||
|
| |||||||||||||||||||
Forward Foreign Currency Exchange Contracts Outstanding at March 31, 2023
Currency | Amount in | Currency | Amount in | Counterparty | Settlement | Unrealized | ||||||||||||||||
| USD | 44,200,000 | BRL | 228,535,009 | JPMorgan Chase Bank, N.A. | 04/05/23 | $ | (883,560 | ) | ||||||||||||||
| USD | 42,000,000 | TRY | 810,490,000 | Citigroup Global Markets, Inc. | 04/06/23 | (131,230 | ) | |||||||||||||||
| BRL | 117,606,600 | USD | 22,600,000 | Citigroup Global Markets, Inc. | 04/05/23 | 600,490 | ||||||||||||||||
| BRL | 112,184,880 | USD | 21,600,000 | Goldman Sachs International | 04/05/23 | 530,937 | ||||||||||||||||
| TRY | 309,224,200 | USD | 16,000,000 | Citigroup Global Markets, Inc. | 04/06/23 | 74,222 | ||||||||||||||||
| ZAR | 15,176,150 | USD | 820,000 | Citigroup Global Markets, Inc. | 05/03/23 | 30,156 | ||||||||||||||||
| ZAR | 193,952,796 | USD | 10,455,000 | Goldman Sachs International | 06/01/23 | 383,209 | ||||||||||||||||
| ZAR | 43,749,747 | USD | 2,460,000 | JPMorgan Chase Bank, N.A. | 04/03/23 | (2,839 | ) | |||||||||||||||
| USD | 2,870,000 | ZAR | 53,570,068 | JPMorgan Chase Bank, N.A. | 05/03/23 | (130,954 | ) | |||||||||||||||
| USD | 1,640,000 | ZAR | 30,161,240 | Citigroup Global Markets, Inc. | 05/03/23 | (49,610 | ) | |||||||||||||||
| USD | 2,460,000 | ZAR | 43,846,046 | JPMorgan Chase Bank, N.A. | 04/03/23 | (2,569 | ) | |||||||||||||||
| USD | 2,460,000 | ZAR | 43,780,750 | JPMorgan Chase Bank, N.A. | 04/11/23 | 2,575 | ||||||||||||||||
| BRL | 14,400,000 | USD | 2,748,586 | State Street Bank and Trust Company | 04/04/23 | 92,519 | ||||||||||||||||
| BRL | 14,400,000 | USD | 2,805,978 | State Street Bank and Trust Company | 05/03/23 | 21,300 | ||||||||||||||||
| CLP | 290,000,000 | USD | 357,033 | State Street Bank and Trust Company | 04/28/23 | 6,858 | ||||||||||||||||
| CNY | 36,750,000 | USD | 5,484,621 | State Street Bank and Trust Company | 04/28/23 | (125,833 | ) | |||||||||||||||
| COP | 2,800,000,000 | USD | 606,849 | State Street Bank and Trust Company | 04/28/23 | (8,475 | ) | |||||||||||||||
| CZK | 63,700,000 | USD | 2,882,768 | State Street Bank and Trust Company | 04/28/23 | 57,298 | ||||||||||||||||
See Notes to Consolidated Financial Statements.
174
Table of Contents
Blackstone Alternative Multi-Strategy Fund and Subsidiaries
Consolidated Schedule of Investments ^ (Continued)
March 31, 2023
Currency | Amount in | Currency | Amount | Counterparty | Settlement | Unrealized | ||||||||||||||||
| EUR | 1,590,100 | USD | 1,711,075 | Morgan Stanley Capital Services, Inc. | 04/13/23 | $ | 14,238 | |||||||||||||||
| EUR | 140,000 | USD | 150,888 | Morgan Stanley Capital Services, Inc. | 04/13/23 | 1,017 | ||||||||||||||||
| EUR | 140,000 | USD | 152,167 | Morgan Stanley Capital Services, Inc. | 04/13/23 | (262 | ) | |||||||||||||||
| HKD | 5,131,000 | USD | 657,345 | State Street Bank and Trust Company | 04/28/23 | (2,852 | ) | |||||||||||||||
| HUF | 200,000,000 | USD | 550,785 | State Street Bank and Trust Company | 04/28/23 | 15,590 | ||||||||||||||||
| IDR | 156,168,300,000 | USD | 10,397,357 | State Street Bank and Trust Company | 04/28/23 | 10,982 | ||||||||||||||||
| ILS | 2,700,000 | USD | 802,306 | State Street Bank and Trust Company | 04/28/23 | (51,018 | ) | |||||||||||||||
| INR | 378,600,000 | USD | 4,607,715 | State Street Bank and Trust Company | 04/28/23 | (6,687 | ) | |||||||||||||||
| JPY | 2,600,000 | USD | 20,161 | State Street Bank and Trust Company | 04/28/23 | (510 | ) | |||||||||||||||
| KRW | 14,039,500,000 | USD | 11,424,609 | State Street Bank and Trust Company | 04/28/23 | (616,047 | ) | |||||||||||||||
| MXN | 50,300,000 | USD | 2,769,170 | State Street Bank and Trust Company | 04/17/23 | 15,221 | ||||||||||||||||
| MXN | 6,400,000 | USD | 351,589 | State Street Bank and Trust Company | 04/28/23 | 1,963 | ||||||||||||||||
| NOK | 10,500,000 | USD | 1,008,869 | State Street Bank and Trust Company | 04/28/23 | (4,715 | ) | |||||||||||||||
| PEN | 7,870,000 | USD | 2,012,094 | State Street Bank and Trust Company | 04/28/23 | 76,030 | ||||||||||||||||
| PHP | 238,400,000 | USD | 4,365,431 | State Street Bank and Trust Company | 04/28/23 | 17,703 | ||||||||||||||||
| PLN | 8,900,000 | USD | 2,027,248 | State Street Bank and Trust Company | 04/28/23 | 31,720 | ||||||||||||||||
| SEK | 29,690,727 | USD | 2,914,256 | State Street Bank and Trust Company | 04/28/23 | (49,614 | ) | |||||||||||||||
| SGD | 5,777,500 | USD | 4,388,403 | State Street Bank and Trust Company | 04/28/23 | (43,677 | ) | |||||||||||||||
| THB | 64,000,000 | USD | 1,973,786 | State Street Bank and Trust Company | 04/28/23 | (97,102 | ) | |||||||||||||||
| TWD | 398,200,000 | USD | 13,327,578 | State Street Bank and Trust Company | 04/28/23 | (218,635 | ) | |||||||||||||||
| ZAR | 5,900,000 | USD | 324,416 | State Street Bank and Trust Company | 04/28/23 | 6,269 | ||||||||||||||||
| USD | 2,367,161 | AUD | 3,367,419 | State Street Bank and Trust Company | 04/28/23 | 114,331 | ||||||||||||||||
| USD | 17,836,962 | AUD | 25,789,000 | State Street Bank and Trust Company | 05/16/23 | 572,310 | ||||||||||||||||
See Notes to Consolidated Financial Statements.
175
Table of Contents
Blackstone Alternative Multi-Strategy Fund and Subsidiaries
Consolidated Schedule of Investments ^ (Continued)
March 31, 2023
Currency | Amount in | Currency | Amount in | Counterparty | Settlement | Unrealized | ||||||||||||||||
| USD | 133,017 | BRL | 700,000 | State Street Bank and Trust Company | 04/04/23 | $ | (5,093 | ) | ||||||||||||||
| USD | 136,402 | BRL | 700,000 | State Street Bank and Trust Company | 05/03/23 | (1,035 | ) | |||||||||||||||
| USD | 3,872,827 | CHF | 3,535,000 | State Street Bank and Trust Company | 04/28/23 | (920 | ) | |||||||||||||||
| USD | 1,061,957 | CLP | 867,800,000 | State Street Bank and Trust Company | 04/28/23 | (26,955 | ) | |||||||||||||||
| USD | 10,742,333 | CNY | 72,068,000 | State Street Bank and Trust Company | 04/28/23 | 233,567 | ||||||||||||||||
| USD | 498,705 | COP | 2,329,300,000 | State Street Bank and Trust Company | 04/28/23 | 922 | ||||||||||||||||
| USD | 319,584 | CZK | 7,000,000 | State Street Bank and Trust Company | 04/28/23 | (3,500 | ) | |||||||||||||||
| USD | 7,235,569 | EUR | 6,647,000 | State Street Bank and Trust Company | 04/25/23 | 18,446 | ||||||||||||||||
| USD | 172,504 | EUR | 158,000 | Citibank N.A. | 05/02/23 | 885 | ||||||||||||||||
| USD | 1,197,362 | EUR | 1,111,000 | Citibank N.A. | 05/10/23 | (9,955 | ) | |||||||||||||||
| USD | 2,818,505 | EUR | 2,637,000 | Citibank N.A. | 05/23/23 | (49,223 | ) | |||||||||||||||
| USD | 4,402,649 | EUR | 4,114,000 | Morgan Stanley Capital Services, Inc. | 04/13/23 | (61,186 | ) | |||||||||||||||
| USD | 723,049 | EUR | 669,000 | Morgan Stanley Capital Services, Inc. | 04/13/23 | (2,840 | ) | |||||||||||||||
| USD | 1,080,360 | EUR | 1,000,000 | Citibank N.A. | 04/17/23 | (4,921 | ) | |||||||||||||||
| USD | 722,572 | EUR | 678,000 | Citibank N.A. | 06/01/23 | (15,128 | ) | |||||||||||||||
| USD | 1,147,817 | GBP | 950,000 | Citibank N.A. | 05/02/23 | (24,786 | ) | |||||||||||||||
| USD | 1,358,806 | GBP | 1,120,000 | Citibank N.A. | 05/10/23 | (23,851 | ) | |||||||||||||||
| USD | 1,382,799 | GBP | 1,147,000 | Citibank N.A. | 06/07/23 | (33,963 | ) | |||||||||||||||
| USD | 31,739,556 | GBP | 25,971,000 | State Street Bank and Trust Company | 06/21/23 | (347,263 | ) | |||||||||||||||
| USD | 2,598,778 | HUF | 956,500,000 | State Street Bank and Trust Company | 04/28/23 | (109,909 | ) | |||||||||||||||
| USD | 7,840,572 | IDR | 117,400,000,000 | State Street Bank and Trust Company | 04/28/23 | 16,071 | ||||||||||||||||
| USD | 3,549,797 | ILS | 11,985,000 | State Street Bank and Trust Company | 04/28/23 | 214,915 | ||||||||||||||||
| USD | 2,028,296 | INR | 166,300,000 | State Street Bank and Trust Company | 04/28/23 | 7,295 | ||||||||||||||||
| USD | 19,158 | JPY | 2,600,000 | State Street Bank and Trust Company | 04/28/23 | (492 | ) | |||||||||||||||
| USD | 14,743,342 | KRW | 18,147,100,000 | State Street Bank and Trust Company | 04/28/23 | 772,469 | ||||||||||||||||
| USD | 333,926 | MXN | 6,400,000 | State Street Bank and Trust Company | 04/28/23 | (19,626 | ) | |||||||||||||||
| USD | 2,758,319 | MXN | 50,300,000 | State Street Bank and Trust Company | 04/17/23 | (26,072 | ) | |||||||||||||||
See Notes to Consolidated Financial Statements.
176
Table of Contents
Blackstone Alternative Multi-Strategy Fund and Subsidiaries
Consolidated Schedule of Investments ^ (Continued)
March 31, 2023
Currency | Amount in | Currency | Amount in | Counterparty | Settlement | Unrealized | ||||||||||||||
| USD | 2,959,970 | NOK | 29,713,334 | State Street Bank and Trust Company | 04/28/23 | $ | 118,372 | |||||||||||||
| USD | 1,438,611 | PEN | 5,500,000 | State Street Bank and Trust Company | 04/28/23 | (20,687 | ) | |||||||||||||
| USD | 1,667,912 | PHP | 90,900,000 | State Street Bank and Trust Company | 04/28/23 | (3,342 | ) | |||||||||||||
| USD | 733,254 | PLN | 3,200,000 | State Street Bank and Trust Company | 04/28/23 | (7,049 | ) | |||||||||||||
| USD | 4,183,159 | SEK | 43,300,000 | State Street Bank and Trust Company | 04/28/23 | 5,458 | ||||||||||||||
| USD | 1,585,265 | SGD | 2,100,000 | State Street Bank and Trust Company | 04/28/23 | 6,048 | ||||||||||||||
| USD | 4,647,556 | THB | 151,500,000 | State Street Bank and Trust Company | 04/28/23 | 205,093 | ||||||||||||||
| USD | 1,248,380 | TRY | 24,700,000 | State Street Bank and Trust Company | 04/28/23 | (2,797 | ) | |||||||||||||
| USD | 16,311,313 | TWD | 486,300,000 | State Street Bank and Trust Company | 04/28/23 | 302,073 | ||||||||||||||
| USD | 2,242,674 | ZAR | 39,300,000 | State Street Bank and Trust Company | 04/28/23 | 39,975 | ||||||||||||||
|
| |||||||||||||||||||
Total Forward Foreign Currency Exchange Contracts Outstanding | $ | 1,391,745 | ||||||||||||||||||
|
| |||||||||||||||||||
Centrally Cleared Credit Default Swaps on Single-Name Issuer (Buy Protection) — Outstanding at March 31, 2023
Reference | Financing Fee | Payment Frequency | Maturity | Counterparty | Notional Amount | Market Value | Upfront Premium Paid (Received) | Unrealized Appreciation (Depreciation) | ||||||||||||||||||||||
Mexico Government International Bonds | 1.00% | 3M | 1/10/2028 | | Merrill Lynch, Pierce, Fenner & Smith, Inc. | | 1,500,000 USD | $ | 5,482 | $ | 10,329 | $ | (4,847 | ) | ||||||||||||||||
|
|
|
|
|
| |||||||||||||||||||||||||
Total Centrally Cleared Credit Default Swaps on Single-Name Issuer (Buy Protection) |
| $ | 5,482 | $ | 10,329 | $ | (4,847 | ) | ||||||||||||||||||||||
|
|
|
|
|
| |||||||||||||||||||||||||
Centrally Cleared Credit Default Swaps on Index (Buy Protection) — Outstanding at March 31, 2023
Reference | Financing Fee | Payment Frequency | Maturity | Counterparty | Notional Amount | Market Value | Upfront Premium Paid (Received) | Unrealized Appreciation (Depreciation) | ||||||||||||||||||||
CDX.EM.39 | 1.00% | 3M | 6/20/2028 | Morgan Stanley & Co. LLC | 10,600,000 USD | $ | 610,022 | $ | 742,000 | $ | (131,978 | ) | ||||||||||||||||
CDX.EM.39 | 1.00% | 3M | 6/20/2028 | Morgan Stanley & Co. LLC | 24,500,000 USD | 1,409,957 | 1,886,500 | (476,543 | ) | |||||||||||||||||||
CDX.EM.39 | 1.00% | 3M | 6/20/2028 | Morgan Stanley & Co. LLC | 269,100,000 USD | 15,486,512 | 20,720,700 | (5,234,188 | ) | |||||||||||||||||||
See Notes to Consolidated Financial Statements.
177
Table of Contents
Blackstone Alternative Multi-Strategy Fund and Subsidiaries
Consolidated Schedule of Investments ^ (Continued)
March 31, 2023
Reference | Financing Fee | Payment Frequency | Maturity | Counterparty | Notional Amount | Market Value | Upfront Premium Paid (Received) | Unrealized Appreciation (Depreciation) | ||||||||||||||||||||
CDX.NA.HY.39 | 5.00% | 3M | 12/20/2027 | Morgan Stanley & Co. LLC | 8,200,000 USD | $ | (92,413 | ) | $ | 97,441 | $ | (189,854 | ) | |||||||||||||||
CDX.NA.HY.39 | 5.00% | 3M | 12/20/2027 | Morgan Stanley & Co. LLC | 16,400,000 USD | (184,826 | ) | 41,918 | (226,744 | ) | ||||||||||||||||||
CDX.NA.HY.40 | 5.00% | 3M | 6/20/2028 | Morgan Stanley & Co. LLC | 24,600,000 USD | (339,995 | ) | 93,480 | (433,475 | ) | ||||||||||||||||||
iTraxx Asia Ex-Japan IG Series 39 | 1.00% | 3M | 6/20/2028 | Morgan Stanley & Co. LLC | 13,700,000 USD | 190,771 | 243,427 | (52,656 | ) | |||||||||||||||||||
iTraxx Europe Crossover Series 38 | 5.00% | 3M | 12/20/2027 | Morgan Stanley & Co. LLC | 12,500,000 EUR | (485,570 | ) | (444,375 | ) | (41,195 | ) | |||||||||||||||||
iTraxx Europe Crossover Series 38 | 5.00% | 3M | 12/20/2027 | Morgan Stanley & Co. LLC | 5,000,000 EUR | (194,228 | ) | (192,963 | ) | (1,265 | ) | |||||||||||||||||
iTraxx Europe Crossover Series 38 | 5.00% | 3M | 12/20/2027 | Morgan Stanley & Co. LLC | 10,700,000 EUR | (415,648 | ) | (172,376 | ) | (243,272 | ) | |||||||||||||||||
|
|
|
|
|
| |||||||||||||||||||||||
Total Centrally Cleared Credit Default Swaps on Index (Buy Protection) |
| $ | 15,984,582 | $ | 23,015,752 | $ | (7,031,170 | ) | ||||||||||||||||||||
|
|
|
|
|
| |||||||||||||||||||||||
Centrally Cleared Credit Default Swaps on Index (Sell Protection) — Outstanding at March 31, 2023
Reference Obligation | Financing Fee | Payment Frequency | Maturity | Counterparty | Rating(1) | Notional Amount(2) | Market Value | Upfront Premium Paid (Received) | Unrealized Appreciation (Depreciation) | |||||||||||||||||||||
CDX.NA.HY.39 | 5.00% | 3M | 12/20/27 | Morgan Stanley & Co. LLC | NR | 24,600,000 USD | $ | 277,239 | $ | (188,190 | ) | $ | 465,429 | |||||||||||||||||
CDX.NA.HY.39 | 5.00% | 3M | 12/20/27 | Morgan Stanley & Co. LLC | NR | 5,000,000 USD | 56,349 | 96,500 | (40,151 | ) | ||||||||||||||||||||
CDX.NA.HY.40 | 5.00% | 3M | 06/20/28 | Morgan Stanley & Co. LLC | NR | 12,300,000 USD | 169,997 | 178,350 | (8,353 | ) | ||||||||||||||||||||
CDX.NA.HY.40 | 5.00% | 3M | 07/12/28 | Merrill Lynch, Pierce, Fenner & Smith, Inc. | NR | 1,700,000 USD | 23,496 | 11,900 | 11,596 | |||||||||||||||||||||
CDX.NA.IG.39 | 1.00% | 3M | 12/20/27 | Morgan Stanley & Co. LLC | NR | 24,843,750 USD | 306,931 | 268,082 | 38,849 | |||||||||||||||||||||
CDX.NA.IG.40 | 1.00% | 3M | 07/12/28 | Merrill Lynch, Pierce, Fenner & Smith, Inc. | NR | 56,200,000 USD | 625,191 | 421,669 | 203,522 | |||||||||||||||||||||
iTraxx Asia Ex-Japan IG Series 39 | 1.00% | 3M | 06/20/28 | Morgan Stanley & Co. LLC | NR | 13,700,000 USD | (190,771 | ) | (287,002 | ) | 96,231 | |||||||||||||||||||
iTraxx Europe Crossover Series 38 | 5.00% | 3M | 12/20/27 | Morgan Stanley & Co. LLC | NR | 6,900,000 EUR | 268,035 | 3,546 | 264,489 | |||||||||||||||||||||
iTraxx Europe Crossover Series 38 | 5.00% | 3M | 12/20/27 | Morgan Stanley & Co. LLC | NR | 300,000 EUR | 11,653 | (3,724 | ) | 15,377 | ||||||||||||||||||||
See Notes to Consolidated Financial Statements.
178
Table of Contents
Blackstone Alternative Multi-Strategy Fund and Subsidiaries
Consolidated Schedule of Investments ^ (Continued)
March 31, 2023
Reference Obligation | Financing Fee | Payment Frequency | Maturity | Counterparty | Rating(1) | Notional Amount(2) | Market Value | Upfront Premium Paid (Received) | Unrealized Appreciation (Depreciation) | |||||||||||||||||||||
iTraxx Europe Crossover Series 39 | 5.00% | 3M | 07/12/28 | Merrill Lynch, Pierce, Fenner & Smith, Inc. | NR | 2,500,000 EUR | $ | 70,583 | $ | 18,047 | $ | 52,536 | ||||||||||||||||||
iTraxx Europe Main Series 39 | 1.00% | 3M | 07/12/28 | Merrill Lynch, Pierce, Fenner & Smith, Inc. | NR | 43,000,000 EUR | 344,391 | 110,286 | 234,105 | |||||||||||||||||||||
|
|
|
|
|
| |||||||||||||||||||||||||
Total Centrally Cleared Credit Default Swaps on Index (Sell Protection) |
| $ | 1,963,094 | $ | 629,464 | $ | 1,333,630 | |||||||||||||||||||||||
|
|
|
|
|
| |||||||||||||||||||||||||
OTC Credit Default Swaps on Single-Name Issues (Buy Protection) — Outstanding at March 31, 2023
Reference | Financing Fee | Payment Frequency | Maturity | Counterparty | Notional Amount | Market Value | Upfront Premium Paid (Received) | Unrealized Appreciation (Depreciation) | ||||||||||||||||||||
Republic of | 1.00% | 3M | 6/20/2028 | Goldman Sachs International | 9,000,000 USD | $ | 700,411 | $ | 702,301 | $ | (1,890 | ) | ||||||||||||||||
Republic of China | 1.00% | 3M | 12/20/2028 | Goldman Sachs International | 31,400,000 USD | (323,952 | ) | (580,136 | ) | 256,184 | ||||||||||||||||||
Republic of China | 1.00% | 3M | 12/20/2027 | Citigroup Global Markets, Inc. | 36,100,000 USD | (482,412 | ) | (475,323 | ) | (7,089 | ) | |||||||||||||||||
Republic of China | 1.00% | 3M | 12/20/2024 | Morgan Stanley Capital Services LLC | 5,900,000 USD | (62,366 | ) | (59,634 | ) | (2,732 | ) | |||||||||||||||||
Republic of China | 1.00% | 3M | 6/20/2023 | Citigroup Global Markets, Inc. | 13,600,000 USD | (21,353 | ) | (128,116 | ) | 106,763 | ||||||||||||||||||
Republic of China | 1.00% | 3M | 6/20/2023 | Citigroup Global Markets, Inc. | 7,000,000 USD | (10,990 | ) | (66,403 | ) | 55,413 | ||||||||||||||||||
Republic of Indonesia | 1.00% | 3M | 6/20/2028 | Goldman Sachs International | 17,900,000 USD | (45,570 | ) | 47,518 | (93,088 | ) | ||||||||||||||||||
Republic of Turkey | 1.00% | 3M | 12/20/2027 | Goldman Sachs International | 1,500,000 USD | 232,176 | 255,127 | (22,951 | ) | |||||||||||||||||||
|
|
|
|
|
| |||||||||||||||||||||||
Total OTC Credit Default Swaps on Single-Name Issuer (Buy Protection) |
| $ | (14,056 | ) | $ | (304,666 | ) | $ | 290,610 | |||||||||||||||||||
|
|
|
|
|
| |||||||||||||||||||||||
OTC Credit Default Swaps on Single-Name Issues (Sell Protection) — Outstanding at March 31, 2023
Reference Obligation | Financing Fee | Payment Frequency | Maturity | Counterparty | Notional Amount | Market Value | Upfront Premium Paid (Received) | Unrealized Appreciation (Depreciation) | ||||||||||||||||||||
Republic of Turkey | 1.00% | 3M | 12/20/2027 | JPMorgan Chase Bank, N.A. | 1,500,000 USD | $ | (232,176 | ) | $ | (251,434 | ) | $ | 19,258 | |||||||||||||||
|
|
|
|
|
| |||||||||||||||||||||||
Total OTC Credit Default Swaps on Single-Name Issuer (Sell Protection) |
| $ | (232,176 | ) | $ | (251,434 | ) | $ | 19,258 | |||||||||||||||||||
|
|
|
|
|
| |||||||||||||||||||||||
See Notes to Consolidated Financial Statements.
179
Table of Contents
Blackstone Alternative Multi-Strategy Fund and Subsidiaries
Consolidated Schedule of Investments ^ (Continued)
March 31, 2023
OTC Credit Default Swaps on Index (Buy Protection) — Outstanding at March 31, 2023
Reference | Financing | Payment Frequency | Maturity Date | Counterparty | Notional Amount | Market Value | Upfront Premium Paid (Received) | Unrealized Appreciation (Depreciation) | ||||||||||||||||||
CMBX.NA.A.14 | 2.00% | 1M | 12/16/2072 | Goldman Sachs and Co., LLC | 201,000 USD | $ | 26,799 | $ | 22,110 | $ | 4,689 | |||||||||||||||
CMBX.NA.A.8 | 2.00% | 1M | 10/17/2057 | Goldman Sachs and Co., LLC | 229,000 USD | 9,352 | 962 | 8,390 | ||||||||||||||||||
CMBX.NA.BBB-.10 | 3.00% | 1M | 11/17/2059 | J.P. Morgan Securities LLC | 7,363,000 USD | 2,104,973 | 71,578 | 2,033,395 | ||||||||||||||||||
CMBX.NA.BBB-.10 | 3.00% | 1M | 11/17/2059 | Morgan Stanley Capital Services LLC | 1,102,000 USD | 315,046 | 374,805 | (59,759 | ) | |||||||||||||||||
CMBX.NA.BBB-.10 | 3.00% | 1M | 11/17/2059 | Morgan Stanley Capital Services LLC | 5,645,000 USD | 1,613,822 | 453,500 | 1,160,322 | ||||||||||||||||||
CMBX.NA.BBB-.8 | 2.00% | 1M | 10/17/2057 | Morgan Stanley Capital Services LLC | 73,000 USD | 2,981 | 2,202 | 779 | ||||||||||||||||||
CMBX.NA.BBB-.8 | 2.00% | 1M | 10/17/2057 | Goldman Sachs and Co., LLC | 38,000 USD | 1,552 | 351 | 1,201 | ||||||||||||||||||
CMBX.NA.BBB-.8 | 2.00% | 1M | 10/17/2057 | Goldman Sachs and Co., LLC | 38,000 USD | 1,552 | 427 | 1,125 | ||||||||||||||||||
CMBX.NA.BBB-.8 | 3.00% | 1M | 10/17/2057 | Morgan Stanley Capital Services LLC | 2,219,000 USD | 490,954 | 363,546 | 127,408 | ||||||||||||||||||
CMBX.NA.BBB-.9 | 3.00% | 1M | 9/17/2058 | Goldman Sachs International | 177,000 USD | 43,697 | 5,121 | 38,576 | ||||||||||||||||||
|
|
|
|
|
| |||||||||||||||||||||
Total OTC Credit Default Swaps on Index (Buy Protection) |
| $ | 4,610,728 | $ | 1,294,602 | $ | 3,316,126 | |||||||||||||||||||
|
|
|
|
|
| |||||||||||||||||||||
OTC Credit Default Swaps on Index (Sell Protection) — Outstanding at March 31, 2023
��
Reference | Financing Fee | Payment Frequency | Maturity | Counterparty | Rating(1) | Notional Amount(2) | Market Value | Upfront Premium Paid (Received) | Unrealized Appreciation (Depreciation) | |||||||||||||||||||||
CMBX.NA.BBB-.10 | 3.00% | 1M | 11/17/59 | Goldman Sachs and Co., LLC | BBB- | 1,096,000 USD | $ | (313,330 | ) | $ | (30,005 | ) | $ | (283,325 | ) | |||||||||||||||
CMBX.NA.BBB-.10 | 3.00% | 1M | 11/17/59 | Goldman Sachs International | BBB- | 18,066,000 USD | (5,164,803 | ) | (682,643 | ) | (4,482,160 | ) | ||||||||||||||||||
CMBX.NA.BBB-.11 | 3.00% | 1M | 11/18/54 | J.P. Morgan Securities LLC | BBB- | 7,500,000 USD | (2,033,805 | ) | (620,026 | ) | (1,413,779 | ) | ||||||||||||||||||
CMBX.NA.BBB-.13 | 3.00% | 1M | 12/16/72 | JPMorgan Chase Bank, N.A. | BBB- | 1,500,000 USD | (432,169 | ) | (448,250 | ) | 16,081 | |||||||||||||||||||
CMBX.NA.BBB-.15 | 3.00% | 1M | 11/18/64 | J.P. Morgan Securities LLC | BBB- | 2,000,000 USD | (571,250 | ) | (597,667 | ) | 26,417 | |||||||||||||||||||
CMBX.NA.BBB-.8 | 2.00% | 1M | 10/17/57 | Goldman Sachs International | BBB- | 246,000 USD | (10,046 | ) | (940 | ) | (9,106 | ) | ||||||||||||||||||
CMBX.NA.BBB-.8 | 2.00% | 1M | 10/17/57 | Goldman Sachs and Co., LLC | BBB- | 34,000 USD | (1,389 | ) | (523 | ) | (866 | ) | ||||||||||||||||||
CMBX.NA.BBB-.8 | 2.00% | 1M | 10/17/57 | Goldman Sachs and Co., LLC | BBB- | 132,000 USD | (5,391 | ) | (1,374 | ) | (4,017 | ) | ||||||||||||||||||
See Notes to Consolidated Financial Statements.
180
Table of Contents
Blackstone Alternative Multi-Strategy Fund and Subsidiaries
Consolidated Schedule of Investments ^ (Continued)
March 31, 2023
Reference | Financing Fee | Payment Frequency | Maturity | Counterparty | Rating(1) | Notional Amount(2) | Market Value | Upfront Premium Paid (Received) | Unrealized Appreciation (Depreciation) | |||||||||||||||||||||
CMBX.NA.BBB-.8 | 3.00% | 1M | 10/17/57 | Goldman Sachs International | BBB- | 59,000 USD | $ | (13,054 | ) | $ | (1,489 | ) | $ | (11,565 | ) | |||||||||||||||
CMBX.NA.BBB-.8 | 3.00% | 1M | 10/17/57 | J.P. Morgan Securities LLC | BBB- | 2,160,000 USD | (477,900 | ) | (114,150 | ) | (363,750 | ) | ||||||||||||||||||
CMBX.NA.BBB-.8 | 2.00% | 1M | 10/17/57 | Goldman Sachs International | BBB- | 398,000 USD | (16,254 | ) | (5,212 | ) | (11,042 | ) | ||||||||||||||||||
CMBX.NA.BBB-.9 | 3.00% | 1M | 09/17/58 | J.P. Morgan Securities LLC | BBB- | 177,000 USD | (43,697 | ) | (910 | ) | (42,787 | ) | ||||||||||||||||||
CNBX.NA.BBB-.8 | 2.00% | 1M | 12/16/72 | Morgan Stanley Capital Services LLC | BBB- | 402,000 USD | (53,597 | ) | (28,350 | ) | (25,247 | ) | ||||||||||||||||||
|
|
|
|
|
| |||||||||||||||||||||||||
Total OTC Credit Default Swaps on Index (Sell Protection) |
| $ | (9,136,685 | ) | $ | (2,531,539 | ) | $ | (6,605,146 | ) | ||||||||||||||||||||
|
|
|
|
|
| |||||||||||||||||||||||||
| (1) | Using the higher of the S&P’s or Moody’s ratings. NR represents a security that is not rated. |
| (2) | The maximum potential amount the Fund may pay should a negative credit event take place as defined under the terms of the agreement. |
Variance/Volatility Swaps (Buy Contracts) — Outstanding at March 31, 2023
Reference | Volatility Strike Rate | Payment | Maturity Date | Counterparty | Notional Amount | Market Value | Upfront Premium Paid (Received) | Unrealized Appreciation (Depreciation) | ||||||||||||||||||
FTSE Index | 11.80% | T | 9/15/2023 | Goldman Sachs International | 5,600 GBP | $ | (75,734 | ) | $ | — | $ | (75,734 | ) | |||||||||||||
J.P. Morgan US Short Vol Of Vol (JPOSSVV1) Index | 26.65% | T | 12/20/2024 | Morgan Stanley Capital Services LLC | 700,000 USD | 16,812 | — | 16,812 | ||||||||||||||||||
S&P 500 Index | 21.10% | T | 4/21/2023 | JPMorgan Chase Bank, N.A. | 1,555 USD | (237,512 | ) | — | (237,512 | ) | ||||||||||||||||
|
|
|
|
|
| |||||||||||||||||||||
Total Variance/Volatility Swaps (Buy Contracts) |
| $ | (296,434 | ) | $ | — | $ | (296,434 | ) | |||||||||||||||||
|
|
|
|
|
| |||||||||||||||||||||
Variance/Volatility Swaps (Sell Contracts) — Outstanding at March 31, 2023
Reference | Volatility Strike Rate | Payment | Maturity Date | Counterparty | Notional Amount | Market Value | Upfront Premium Paid (Received) | Unrealized Appreciation (Depreciation) | ||||||||||||||||||
FTSE Index | 17.20% | T | 12/15/2023 | Goldman Sachs International | 4,724 GBP | $ | (395,814 | ) | $ | — | $ | (395,814 | ) | |||||||||||||
FTSE Index | 22.95% | T | 6/16/2023 | JPMorgan Chase Bank, N.A. | 2,162 GBP | 580,237 | — | 580,237 | ||||||||||||||||||
FTSE Index | 17.65% | T | 6/16/2023 | JPMorgan Chase Bank, N.A. | 6,232 GBP | (245,329 | ) | — | (245,329 | ) | ||||||||||||||||
J.P. Morgan US Short Vol Of Vol (JPOSSVV1) Index | 26.47% | T | 12/20/2024 | Goldman Sachs International | 1,012,500 USD | 55,003 | — | 55,003 | ||||||||||||||||||
S&P 500 Index | 23.70% | T | 6/16/2023 | JPMorgan Chase Bank, N.A. | 3,903 USD | 644,007 | — | 644,007 | ||||||||||||||||||
See Notes to Consolidated Financial Statements.
181
Table of Contents
Blackstone Alternative Multi-Strategy Fund and Subsidiaries
Consolidated Schedule of Investments ^ (Continued)
March 31, 2023
Reference Obligation | Volatility Strike Rate | Payment | Maturity Date | Counterparty | Notional Amount | Market Value | Upfront Premium Paid (Received) | Unrealized Appreciation (Depreciation) | ||||||||||||||||||
S&P 500 Index | 24.95% | T | 9/15/2023 | JPMorgan Chase Bank, N.A. | 4,026 USD | $ | 408,932 | $ | — | $ | 408,932 | |||||||||||||||
S&P 500 Index | 24.55% | T | 9/15/2023 | JPMorgan Chase Bank, N.A. | 1,222 USD | 132,431 | — | 132,431 | ||||||||||||||||||
S&P 500 Index | 24.15% | T | 9/15/2023 | Citigroup Global Markets, Inc. | 2,070 USD | 187,776 | — | 187,776 | ||||||||||||||||||
S&P 500 Index | 23.80% | T | 9/15/2023 | JPMorgan Chase Bank, N.A. | 1,677 USD | 115,713 | — | 115,713 | ||||||||||||||||||
|
|
|
|
|
| |||||||||||||||||||||
Total Variance/Volatility Swaps (Sell Contracts) |
| $ | 1,482,956 | $ | — | $ | 1,482,956 | |||||||||||||||||||
|
|
|
|
|
| |||||||||||||||||||||
OTC Total Return Swaps Outstanding at March 31, 2023
Reference Instrument | Termination Date | Payment Frequency | Financing Rate | Counterparty | Notional Amount | Unrealized Appreciation (Depreciation) | ||||||||||||||||
Buys | ||||||||||||||||||||||
| Activision Blizzard, Inc. | 01/22/24 | M | 5.07 | % | JPMorgan Chase Bank, N.A. | 4,592,803 USD | $ | 336,326 | ||||||||||||||
Aerojet Rocketdyne Holdings, Inc. | 12/23/24 | M | 1.00 | % | JPMorgan Chase Bank, N.A. | 6,877,177 USD | 56,785 | |||||||||||||||
| Aisino Corp. | 01/15/25 | M | 1.81 | % | Morgan Stanley Capital Services LLC | 40,531 USD | 1,089 | |||||||||||||||
| Albertsons Cos., Inc. | 10/16/24 | M | 1.00 | % | JPMorgan Chase Bank, N.A. | 5,023,623 USD | 374,044 | |||||||||||||||
| Alpha Group | 03/26/25 | M | 5.22 | % | JPMorgan Chase Bank, N.A. | 20,797 USD | 21 | |||||||||||||||
Aluminum Corp. of China Ltd. | 03/12/25 | M | 5.06 | % | JPMorgan Chase Bank, N.A. | 135,356 USD | 2,567 | |||||||||||||||
Aluminum Corp. of China Ltd. | 01/15/25 | M | 1.00 | % | Morgan Stanley Capital Services LLC | 185,292 USD | 1,470 | |||||||||||||||
| An Hui Wenergy Co., Ltd. | 07/16/24 | M | 4.97 | % | JPMorgan Chase Bank, N.A. | 11,496 USD | 55 | |||||||||||||||
| Angang Steel Co., Ltd. | 03/24/25 | M | 5.18 | % | JPMorgan Chase Bank, N.A. | 280,667 USD | 3,762 | |||||||||||||||
Angang Steel Co., Ltd. | 01/15/25 | M | 3.19 | % | Morgan Stanley Capital Services LLC | 154,974 USD | 1,568 | |||||||||||||||
Angel Yeast Co., Ltd. | 03/26/25 | M | 1.00 | % | JPMorgan Chase Bank, N.A. | 41,057 USD | 2,079 | |||||||||||||||
Angel Yeast Co., Ltd. | 01/15/25 | M | 1.00 | % | Morgan Stanley Capital Services LLC | 88,097 USD | (2 | ) | ||||||||||||||
Anhui Anke Biotechnology Group Co., Ltd. | 02/06/25 | M | 5.07 | % | JPMorgan Chase Bank, N.A. | 116,997 USD | (2,024 | ) | ||||||||||||||
Anhui Annada Titanium Industry Co., Ltd. | 01/15/25 | M | 4.83 | % | Morgan Stanley Capital Services LLC | 127 USD | (8 | ) | ||||||||||||||
Anhui Conch Cement Co., Ltd. | 03/26/25 | M | 4.97 | % | JPMorgan Chase Bank, N.A. | 15,655 USD | (444 | ) | ||||||||||||||
Anhui Conch Cement Co., Ltd. | 01/15/25 | M | 4.83 | % | Morgan Stanley Capital Services LLC | 57,923 USD | (1,602 | ) | ||||||||||||||
Anhui Expressway Co., Ltd. | 01/15/25 | M | 1.00 | % | Morgan Stanley Capital Services LLC | 27,314 USD | 1,016 | |||||||||||||||
Anhui Expressway Co., Ltd. | 03/19/25 | M | 1.00 | % | JPMorgan Chase Bank, N.A. | 146,434 USD | 3,529 | |||||||||||||||
Anhui Honglu Steel Construction Group Co., Ltd. | 03/26/25 | M | 5.22 | % | JPMorgan Chase Bank, N.A. | 12,007 USD | (443 | ) | ||||||||||||||
Anhui Honglu Steel Construction Group Co., Ltd. | 01/15/25 | M | 1.81 | % | Morgan Stanley Capital Services LLC | 23,017 USD | (854 | ) | ||||||||||||||
See Notes to Consolidated Financial Statements.
182
Table of Contents
Blackstone Alternative Multi-Strategy Fund and Subsidiaries
Consolidated Schedule of Investments ^ (Continued)
March 31, 2023
Reference Instrument | Termination Date | Payment Frequency | Financing Rate | Counterparty | Notional Amount | Unrealized Appreciation (Depreciation) | ||||||||||||||||
Anhui Hyea Aromas Co., Ltd. | 03/31/25 | M | 5.22 | % | JPMorgan Chase Bank, N.A. | 38,909 USD | $ | (11 | ) | |||||||||||||
Anhui Hyea Aromas Co., Ltd. | 01/15/25 | M | 1.00 | % | Morgan Stanley Capital Services LLC | 2,109 USD | 13 | |||||||||||||||
Anhui Jiangnan Chemical Industry Co., Ltd. | 02/19/25 | M | 4.97 | % | JPMorgan Chase Bank, N.A. | 102,879 USD | (4,017 | ) | ||||||||||||||
Anhui Jiangnan Chemical Industry Co., Ltd. | 01/15/25 | M | 1.00 | % | Morgan Stanley Capital Services LLC | 69,917 USD | (2,734 | ) | ||||||||||||||
Anhui Province Natural Gas Development Co., Ltd. | 03/26/25 | M | 1.00 | % | JPMorgan Chase Bank, N.A. | 96,875 USD | 549 | |||||||||||||||
Anhui Province Natural Gas Development Co., Ltd. | 01/15/25 | M | 1.00 | % | Morgan Stanley Capital Services LLC | 45,872 USD | 288 | |||||||||||||||
Anhui Ronds Science & Technology, Inc., Co. | 04/02/25 | M | 1.00 | % | JPMorgan Chase Bank, N.A. | 39,163 USD | 701 | |||||||||||||||
Anhui Ronds Science & Technology, Inc., Co. | 01/15/25 | M | 1.81 | % | Morgan Stanley Capital Services LLC | 35,562 USD | 316 | |||||||||||||||
Anhui Sunhere Pharmaceutical Excipients Co., Ltd. | 03/26/25 | M | 1.00 | % | JPMorgan Chase Bank, N.A. | 405,605 USD | 22,494 | |||||||||||||||
Anhui Sunhere Pharmaceutical Excipients Co., Ltd. | 01/15/25 | M | 1.00 | % | Morgan Stanley Capital Services LLC | 228,313 USD | 11,741 | |||||||||||||||
Anhui Tongfeng Electronics Co., Ltd. | 02/26/25 | M | 4.97 | % | JPMorgan Chase Bank, N.A. | 17,059 USD | (515 | ) | ||||||||||||||
Anhui Tongyuan Environment Energy Saving Co., Ltd. | 04/02/25 | M | 5.22 | % | JPMorgan Chase Bank, N.A. | 26,770 USD | (217 | ) | ||||||||||||||
Anhui Tongyuan Environment Energy Saving Co., Ltd. | 01/15/25 | M | 1.00 | % | Morgan Stanley Capital Services LLC | 746 USD | 2 | |||||||||||||||
Anhui Xinbo Aluminum Co., Ltd. | 03/17/25 | M | 5.04 | % | JPMorgan Chase Bank, N.A. | 309,998 USD | (5,267 | ) | ||||||||||||||
Anhui Xinbo Aluminum Co., Ltd. | 01/15/25 | M | 1.00 | % | Morgan Stanley Capital Services LLC | 129,539 USD | (2,419 | ) | ||||||||||||||
Anhui Xinbo Aluminum Co., Ltd. | 03/05/25 | M | 4.97 | % | JPMorgan Chase Bank, N.A. | 177,437 USD | (3,984 | ) | ||||||||||||||
Anhui Xinbo Aluminum Co., Ltd. | 01/15/25 | M | 4.83 | % | Morgan Stanley Capital Services LLC | 64,422 USD | (1,456 | ) | ||||||||||||||
Anhui Xinli Finance Co., Ltd. | 01/15/25 | M | 4.72 | % | Morgan Stanley Capital Services LLC | 37,466 USD | (1,450 | ) | ||||||||||||||
Anhui Xinli Finance Co., Ltd. | 03/12/25 | M | 4.97 | % | JPMorgan Chase Bank, N.A. | 63,234 USD | (2,438 | ) | ||||||||||||||
Anhui Yingliu Electromechanical Co., Ltd. | 03/24/25 | M | 1.00 | % | JPMorgan Chase Bank, N.A. | 295 USD | (5 | ) | ||||||||||||||
Anhui Yingliu Electromechanical Co., Ltd. | 02/11/25 | M | 4.97 | % | JPMorgan Chase Bank, N.A. | 17,112 USD | (282 | ) | ||||||||||||||
Anhui Yingliu Electromechanical Co., Ltd. | 01/15/25 | M | 4.83 | % | Morgan Stanley Capital Services LLC | 266 USD | (4 | ) | ||||||||||||||
See Notes to Consolidated Financial Statements.
183
Table of Contents
Blackstone Alternative Multi-Strategy Fund and Subsidiaries
Consolidated Schedule of Investments ^ (Continued)
March 31, 2023
Reference Instrument | Termination Date | Payment Frequency | Financing Rate | Counterparty | Notional Amount | Unrealized Appreciation (Depreciation) | ||||||||||||||||
Anhui Yuanchen Environmental Protection Science & Technology Co., Ltd. | 04/02/25 | M | 1.00 | % | JPMorgan Chase Bank, N.A. | 44,939 USD | $ | 450 | ||||||||||||||
Anhui Yuanchen Environmental Protection Science & Technology Co., Ltd. | 01/15/25 | M | 4.83 | % | Morgan Stanley Capital Services LLC | 2,366 USD | 87 | |||||||||||||||
Anji Microelectronics Technology Shanghai Co., Ltd. | 01/15/25 | M | 1.38 | % | Morgan Stanley Capital Services LLC | 97,535 USD | (118 | ) | ||||||||||||||
Anji Microelectronics Technology Shanghai Co., Ltd. | 03/26/25 | M | 5.22 | % | JPMorgan Chase Bank, N.A. | 168,661 USD | 1,820 | |||||||||||||||
Anker Innovations Technology Co., Ltd. | 01/15/25 | M | 1.38 | % | Morgan Stanley Capital Services LLC | 31,442 USD | (512 | ) | ||||||||||||||
Anyuan Coal Industry Group Co., Ltd. | 04/02/25 | M | 1.00 | % | JPMorgan Chase Bank, N.A. | 14,981 USD | 79 | |||||||||||||||
Anyuan Coal Industry Group Co., Ltd. | 01/15/25 | M | 1.00 | % | Morgan Stanley Capital Services LLC | 514 USD | (1 | ) | ||||||||||||||
Aotecar New Energy Technology Co., Ltd. | 01/15/25 | M | 4.83 | % | Morgan Stanley Capital Services LLC | 28 USD | — | |||||||||||||||
Appotronics Corp., Ltd. | 03/17/25 | M | 4.97 | % | JPMorgan Chase Bank, N.A. | 13,971 USD | (205 | ) | ||||||||||||||
Appotronics Corp., Ltd. | 02/12/25 | M | 1.00 | % | JPMorgan Chase Bank, N.A. | 44,967 USD | (915 | ) | ||||||||||||||
APT Medical, Inc. | 03/25/25 | M | 5.14 | % | JPMorgan Chase Bank, N.A. | 889,320 USD | 45,799 | |||||||||||||||
APT Medical, Inc. | 01/15/25 | M | 1.00 | % | Morgan Stanley Capital Services LLC | 392,581 USD | 21,352 | |||||||||||||||
Arcplus Group PLC | 02/25/25 | M | 5.00 | % | JPMorgan Chase Bank, N.A. | 569,487 USD | (6,836 | ) | ||||||||||||||
Arcplus Group PLC | 01/15/25 | M | 1.00 | % | Morgan Stanley Capital Services LLC | 288,856 USD | (6,469 | ) | ||||||||||||||
Arctech Solar Holding Co., Ltd. | 03/17/25 | M | 4.98 | % | JPMorgan Chase Bank, N.A. | 46,645 USD | (1,395 | ) | ||||||||||||||
Arctech Solar Holding Co., Ltd. | 03/11/25 | M | 1.00 | % | JPMorgan Chase Bank, N.A. | 74,027 USD | (2,579 | ) | ||||||||||||||
Asia—Potash International Investment Guangzhou Co., Ltd. | 03/26/25 | M | 5.19 | % | JPMorgan Chase Bank, N.A. | 252,144 USD | (5,961 | ) | ||||||||||||||
Asia—Potash International Investment Guangzhou Co., Ltd. | 01/15/25 | M | 3.09 | % | Morgan Stanley Capital Services LLC | 193,418 USD | (5,301 | ) | ||||||||||||||
Asymchem Laboratories Tianjin Co., Ltd. | 01/15/25 | M | 4.83 | % | Morgan Stanley Capital Services LLC | 803 USD | (27 | ) | ||||||||||||||
Atlantic China Welding Consumables, Inc. | 01/15/25 | M | 4.83 | % | Morgan Stanley Capital Services LLC | 2,100 USD | 22 | |||||||||||||||
Aurisco Pharmaceutical Co., Ltd. | 04/02/25 | M | 5.22 | % | JPMorgan Chase Bank, N.A. | 91,559 USD | 676 | |||||||||||||||
Aurisco Pharmaceutical Co., Ltd. | 01/15/25 | M | 1.81 | % | Morgan Stanley Capital Services LLC | 47,504 USD | 350 | |||||||||||||||
Avary Holding Shenzhen Co., Ltd. | 01/15/25 | M | 1.00 | % | Morgan Stanley Capital Services LLC | 1,794 USD | 12 | |||||||||||||||
Avary Holding Shenzhen Co., Ltd. | 03/26/25 | M | 5.22 | % | JPMorgan Chase Bank, N.A. | 131,798 USD | (4,050 | ) | ||||||||||||||
Bank of Beijing Co., Ltd. | 03/26/25 | M | 1.00 | % | JPMorgan Chase Bank, N.A. | 421,449 USD | 1,250 | |||||||||||||||
See Notes to Consolidated Financial Statements.
184
Table of Contents
Blackstone Alternative Multi-Strategy Fund and Subsidiaries
Consolidated Schedule of Investments ^ (Continued)
March 31, 2023
Reference Instrument | Termination Date | Payment Frequency | Financing Rate | Counterparty | Notional Amount | Unrealized Appreciation (Depreciation) | ||||||||||||||||
Bank of Beijing Co., Ltd. | 01/15/25 | M | 1.00 | % | Morgan Stanley Capital Services LLC | 261,539 USD | $ | 405 | ||||||||||||||
Bank of China Ltd. | 04/02/25 | M | 5.22 | % | JPMorgan Chase Bank, N.A. | 196,130 USD | (221 | ) | ||||||||||||||
Bank of China Ltd. | 01/15/25 | M | 1.00 | % | Morgan Stanley Capital Services LLC | 6,999 USD | (15 | ) | ||||||||||||||
Bank of Communications Co., Ltd. | 03/26/25 | M | 5.22 | % | JPMorgan Chase Bank, N.A. | 554,320 USD | (1,845 | ) | ||||||||||||||
Bank of Communications Co., Ltd. | 01/15/25 | M | 1.00 | % | Morgan Stanley Capital Services LLC | 230,010 USD | (159 | ) | ||||||||||||||
Bank of Jiangsu Co., Ltd. | 01/15/25 | M | 1.00 | % | Morgan Stanley Capital Services LLC | 95 USD | 1 | |||||||||||||||
Bank of Ningbo Co., Ltd. | 01/15/25 | M | 1.38 | % | Morgan Stanley Capital Services LLC | 58,312 USD | (289 | ) | ||||||||||||||
Bank of Zhengzhou Co., Ltd. | 04/02/25 | M | 1.00 | % | JPMorgan Chase Bank, N.A. | 116,781 USD | (75 | ) | ||||||||||||||
Baoxiniao Holding Co., Ltd. | 01/15/25 | M | 1.00 | % | Morgan Stanley Capital Services LLC | 2,918 USD | (12 | ) | ||||||||||||||
BBMG Corp. | 04/02/25 | M | 1.00 | % | JPMorgan Chase Bank, N.A. | 18,492 USD | 12 | |||||||||||||||
Bear Electric Appliance Co., Ltd. | 03/26/25 | M | 5.19 | % | JPMorgan Chase Bank, N.A. | 325,679 USD | 13,420 | |||||||||||||||
Bear Electric Appliance Co., Ltd. | 01/15/25 | M | 3.19 | % | Morgan Stanley Capital Services LLC | 208,750 USD | 8,202 | |||||||||||||||
Beibuwan Port Co., Ltd. | 04/02/25 | M | 1.00 | % | JPMorgan Chase Bank, N.A. | 25,672 USD | 181 | |||||||||||||||
Beibuwan Port Co., Ltd. | 01/15/25 | M | 1.38 | % | Morgan Stanley Capital Services LLC | 30,331 USD | 253 | |||||||||||||||
Beijing Bohui Science & Technology Co., Ltd. | 04/02/25 | M | 5.22 | % | JPMorgan Chase Bank, N.A. | 33,479 USD | (1,484 | ) | ||||||||||||||
Beijing Capital Eco-Environment Protection Group Co., Ltd. | 01/15/25 | M | 1.81 | % | Morgan Stanley Capital Services LLC | 49,147 USD | 167 | |||||||||||||||
Beijing Century Real Technology Co., Ltd. | 03/26/25 | M | 5.22 | % | JPMorgan Chase Bank, N.A. | 309,115 USD | (3,048 | ) | ||||||||||||||
Beijing Century Real Technology Co., Ltd. | 01/15/25 | M | 1.00 | % | Morgan Stanley Capital Services LLC | 10,837 USD | 93 | |||||||||||||||
Beijing CONST Instruments Technology, Inc. | 01/15/25 | M | 1.00 | % | Morgan Stanley Capital Services LLC | 2,557 USD | 14 | |||||||||||||||
Beijing Easpring Material Technology Co., Ltd. | 02/06/25 | M | 5.17 | % | JPMorgan Chase Bank, N.A. | 3,351 USD | (3 | ) | ||||||||||||||
Beijing Haixin Energy Technology Co., Ltd. | 04/02/25 | M | 1.00 | % | JPMorgan Chase Bank, N.A. | 80,576 USD | (132 | ) | ||||||||||||||
Beijing Haixin Energy Technology Co., Ltd. | 01/15/25 | M | 1.00 | % | Morgan Stanley Capital Services LLC | 42,434 USD | (117 | ) | ||||||||||||||
Beijing Infosec Technologies Co., Ltd. | 01/15/25 | M | 1.00 | % | Morgan Stanley Capital Services LLC | 3,143 USD | 29 | |||||||||||||||
Beijing Jingyuntong Technology Co., Ltd. | 01/08/25 | M | 1.00 | % | JPMorgan Chase Bank, N.A. | 327,186 USD | 3,162 | |||||||||||||||
Beijing Jingyuntong Technology Co., Ltd. | 01/15/25 | M | 1.00 | % | Morgan Stanley Capital Services LLC | 194,201 USD | 1,806 | |||||||||||||||
Beijing Lier High-temperature Materials Co., Ltd. | 03/12/25 | M | 1.00 | % | JPMorgan Chase Bank, N.A. | 95,418 USD | (4,598 | ) | ||||||||||||||
Beijing Lier High-temperature Materials Co., Ltd. | 01/15/25 | M | 1.00 | % | Morgan Stanley Capital Services LLC | 3,292 USD | (4 | ) | ||||||||||||||
See Notes to Consolidated Financial Statements.
185
Table of Contents
Blackstone Alternative Multi-Strategy Fund and Subsidiaries
Consolidated Schedule of Investments ^ (Continued)
March 31, 2023
Reference Instrument | Termination Date | Payment Frequency | Financing Rate | Counterparty | Notional Amount | Unrealized Appreciation (Depreciation) | ||||||||||||||||
Beijing LongRuan Technologies, Inc. | 03/12/25 | M | 1.00 | % | JPMorgan Chase Bank, N.A. | 113,550 USD | $ | (166 | ) | |||||||||||||
Beijing LongRuan Technologies, Inc. | 01/15/25 | M | 4.78 | % | Morgan Stanley Capital Services LLC | 35,914 USD | (244 | ) | ||||||||||||||
Beijing Oriental Jicheng Co., Ltd. | 04/02/25 | M | 5.22 | % | JPMorgan Chase Bank, N.A. | 225,615 USD | 1,699 | |||||||||||||||
Beijing Oriental Jicheng Co., Ltd. | 01/15/25 | M | 1.81 | % | Morgan Stanley Capital Services LLC | 151,850 USD | 912 | |||||||||||||||
Beijing Originwater Technology Co., Ltd. | 01/15/25 | M | 1.81 | % | Morgan Stanley Capital Services LLC | 34,525 USD | 537 | |||||||||||||||
Beijing SDL Technology Co., Ltd. | 03/17/25 | M | 5.00 | % | JPMorgan Chase Bank, N.A. | 417,846 USD | (42,794 | ) | ||||||||||||||
Beijing SDL Technology Co., Ltd. | 01/15/25 | M | 3.48 | % | Morgan Stanley Capital Services LLC | 180,052 USD | (18,709 | ) | ||||||||||||||
Beijing Shougang Co., Ltd. | 02/19/25 | M | 5.22 | % | JPMorgan Chase Bank, N.A. | 18,025 USD | (61 | ) | ||||||||||||||
Beijing Sifang Automation Co., Ltd. | 03/25/25 | M | 1.00 | % | JPMorgan Chase Bank, N.A. | 574,186 USD | 14,926 | |||||||||||||||
Beijing Sifang Automation Co., Ltd. | 01/15/25 | M | 1.00 | % | Morgan Stanley Capital Services LLC | 313,828 USD | 7,966 | |||||||||||||||
Beijing Sun-Novo Pharmaceutical Research Co., Ltd. | 01/15/25 | M | 4.72 | % | Morgan Stanley Capital Services LLC | 2,342 USD | 19 | |||||||||||||||
Beijing Tongyizhong New Material Technology Corp. | 01/15/25 | M | 4.66 | % | Morgan Stanley Capital Services LLC | 68,692 USD | (3,405 | ) | ||||||||||||||
Beijing Tongyizhong New Material Technology Corp. | 03/18/25 | M | 5.10 | % | JPMorgan Chase Bank, N.A. | 161,914 USD | (5,584 | ) | ||||||||||||||
Beijing United Information Technology Co., Ltd. | 04/02/25 | M | 5.22 | % | JPMorgan Chase Bank, N.A. | 224,356 USD | (2,250 | ) | ||||||||||||||
Beijing Wantai Biological Pharmacy Enterprise Co., Ltd. | 01/15/25 | M | 4.83 | % | Morgan Stanley Capital Services LLC | 1,415 USD | (63 | ) | ||||||||||||||
Beijing WKW Automotive Parts Co., Ltd. | 01/15/25 | M | 1.00 | % | Morgan Stanley Capital Services LLC | 125,043 USD | 676 | |||||||||||||||
Beijing WKW Automotive Parts Co., Ltd. | 02/05/25 | M | 4.97 | % | JPMorgan Chase Bank, N.A. | 332,940 USD | 1,170 | |||||||||||||||
Beijing WKW Automotive Parts Co., Ltd. | 01/15/25 | M | 4.72 | % | Morgan Stanley Capital Services LLC | 97,300 USD | 327 | |||||||||||||||
Beijing WKW Automotive Parts Co., Ltd. | 03/17/25 | M | 5.01 | % | JPMorgan Chase Bank, N.A. | 176,484 USD | 1,092 | |||||||||||||||
Beijing Yupont Electric Power Technology Co., Ltd. | 01/15/25 | M | 4.72 | % | Morgan Stanley Capital Services LLC | 216 USD | (9 | ) | ||||||||||||||
Bestway Marine & Energy Technology Co., Ltd. | 11/13/24 | M | 1.00 | % | JPMorgan Chase Bank, N.A. | 187,661 USD | (4,385 | ) | ||||||||||||||
Bestway Marine & Energy Technology Co., Ltd. | 01/15/25 | M | 1.00 | % | Morgan Stanley Capital Services LLC | 5,478 USD | 10 | |||||||||||||||
Betta Pharmaceuticals Co., Ltd. | 02/12/25 | M | 5.06 | % | JPMorgan Chase Bank, N.A. | 63,185 USD | 3,511 | |||||||||||||||
Bichamp Cutting Technology Hunan Co., Ltd. | 03/03/25 | M | 5.13 | % | JPMorgan Chase Bank, N.A. | 373,377 USD | (2,301 | ) | ||||||||||||||
See Notes to Consolidated Financial Statements.
186
Table of Contents
Blackstone Alternative Multi-Strategy Fund and Subsidiaries
Consolidated Schedule of Investments ^ (Continued)
March 31, 2023
Reference Instrument | Termination Date | Payment Frequency | Financing Rate | Counterparty | Notional Amount | Unrealized Appreciation (Depreciation) | ||||||||||||||||
Bichamp Cutting Technology Hunan Co., Ltd. | 01/15/25 | M | 1.00 | % | Morgan Stanley Capital Services LLC | 175,010 USD | $ | (959 | ) | |||||||||||||
Black Knight, Inc. | 05/13/24 | M | 1.00 | % | JPMorgan Chase Bank, N.A. | 2,039,441 USD | 71,514 | |||||||||||||||
Bloomage Biotechnology Corp. Ltd. | 03/24/25 | M | 1.00 | % | JPMorgan Chase Bank, N.A. | 164,813 USD | 3,508 | |||||||||||||||
Bloomage Biotechnology Corp. Ltd. | 01/15/25 | M | 1.00 | % | Morgan Stanley Capital Services LLC | 245,799 USD | 5,033 | |||||||||||||||
Bluestar Adisseo Co. | 03/26/25 | M | 1.00 | % | JPMorgan Chase Bank, N.A. | 116,602 USD | (1,087 | ) | ||||||||||||||
Bluestar Adisseo Co. | 01/15/25 | M | 1.00 | % | Morgan Stanley Capital Services LLC | 49,012 USD | (368 | ) | ||||||||||||||
BOE Technology Group Co., Ltd. | 03/19/25 | M | 5.05 | % | JPMorgan Chase Bank, N.A. | 534,680 USD | 21,236 | |||||||||||||||
BOE Technology Group Co., Ltd. | 01/15/25 | M | 3.48 | % | Morgan Stanley Capital Services LLC | 304,932 USD | 11,405 | |||||||||||||||
Bright Real Estate Group Co., Ltd. | 04/02/25 | M | 5.22 | % | JPMorgan Chase Bank, N.A. | 28,673 USD | (18 | ) | ||||||||||||||
Bright Real Estate Group Co., Ltd. | 01/15/25 | M | 1.00 | % | Morgan Stanley Capital Services LLC | 28,148 USD | (77 | ) | ||||||||||||||
Bros Eastern Co., Ltd. | 04/02/25 | M | 1.00 | % | JPMorgan Chase Bank, N.A. | 66,916 USD | 154 | |||||||||||||||
Bros Eastern Co., Ltd. | 01/15/25 | M | 1.00 | % | Morgan Stanley Capital Services LLC | 33,281 USD | 103 | |||||||||||||||
BSM Chemical Co., Ltd. | 02/25/25 | M | 4.97 | % | JPMorgan Chase Bank, N.A. | 1,013 USD | 6 | |||||||||||||||
BSM Chemical Co., Ltd. | 01/15/25 | M | 4.83 | % | Morgan Stanley Capital Services LLC | 68 USD | — | |||||||||||||||
BTG Hotels Group Co., Ltd. | 01/15/25 | M | 1.00 | % | Morgan Stanley Capital Services LLC | 62,611 USD | 563 | |||||||||||||||
By-health Co., Ltd. | 03/05/25 | M | 1.00 | % | JPMorgan Chase Bank, N.A. | 153,442 USD | 4,698 | |||||||||||||||
By-health Co., Ltd. | 01/15/25 | M | 1.00 | % | Morgan Stanley Capital Services LLC | 266,835 USD | 8,124 | |||||||||||||||
BYD Co., Ltd. | 04/02/25 | M | 1.00 | % | JPMorgan Chase Bank, N.A. | 37,315 USD | (58 | ) | ||||||||||||||
C&S Paper Co., Ltd. | 04/02/25 | M | 1.00 | % | JPMorgan Chase Bank, N.A. | 9,136 USD | 20 | |||||||||||||||
CABIO Biotech Wuhan Co., Ltd. | 04/02/25 | M | 1.00 | % | JPMorgan Chase Bank, N.A. | 30,752 USD | (11 | ) | ||||||||||||||
CABIO Biotech Wuhan Co., Ltd. | 01/15/25 | M | 1.00 | % | Morgan Stanley Capital Services LLC | 13,703 USD | (40 | ) | ||||||||||||||
Caina Technology Co., Ltd. | 01/15/25 | M | 4.83 | % | Morgan Stanley Capital Services LLC | 4,874 USD | 19 | |||||||||||||||
Cambricon Technologies Corp. Ltd. | 03/26/25 | M | 5.22 | % | JPMorgan Chase Bank, N.A. | 20,789 USD | 859 | |||||||||||||||
CECEP Solar Energy Co., Ltd. | 04/02/25 | M | 1.00 | % | JPMorgan Chase Bank, N.A. | 20,500 USD | 35 | |||||||||||||||
Ceepower Co., Ltd. | 03/26/25 | M | 5.22 | % | JPMorgan Chase Bank, N.A. | 235,261 USD | (1,438 | ) | ||||||||||||||
Ceepower Co., Ltd. | 01/15/25 | M | 4.80 | % | Morgan Stanley Capital Services LLC | 98,615 USD | (583 | ) | ||||||||||||||
CETC Digital Technology Co., Ltd. | 03/19/25 | M | 4.97 | % | JPMorgan Chase Bank, N.A. | 115,395 USD | 1,858 | |||||||||||||||
Chahua Modern Housewares Co., Ltd. | 03/05/25 | M | 5.11 | % | JPMorgan Chase Bank, N.A. | 50,451 USD | (988 | ) | ||||||||||||||
Chahua Modern Housewares Co., Ltd. | 01/15/25 | M | 1.00 | % | Morgan Stanley Capital Services LLC | 1,678 USD | 2 | |||||||||||||||
Changchun BCHT Biotechnology Co., Ltd. | 03/19/25 | M | 1.00 | % | JPMorgan Chase Bank, N.A. | 86,126 USD | (4,444 | ) | ||||||||||||||
See Notes to Consolidated Financial Statements.
187
Table of Contents
Blackstone Alternative Multi-Strategy Fund and Subsidiaries
Consolidated Schedule of Investments ^ (Continued)
March 31, 2023
Reference Instrument | Termination Date | Payment Frequency | Financing Rate | Counterparty | Notional Amount | Unrealized Appreciation (Depreciation) | ||||||||||||||||
Changchun BCHT Biotechnology Co., Ltd. | 01/15/25 | M | 1.00 | % | Morgan Stanley Capital Services LLC | 43,702 USD | $ | (2,060 | ) | |||||||||||||
Changhong Meiling Co., Ltd. | 01/15/25 | M | 4.72 | % | Morgan Stanley Capital Services LLC | 264,722 USD | 26,396 | |||||||||||||||
Changhong Meiling Co., Ltd. | 01/21/25 | M | 4.98 | % | JPMorgan Chase Bank, N.A. | 582,577 USD | 58,026 | |||||||||||||||
Changsha DIALINE New Material Sci & Tech Co., Ltd. | 01/15/25 | M | 4.83 | % | Morgan Stanley Capital Services LLC | 220 USD | 7 | |||||||||||||||
Changsha Tongcheng Holdings Co., Ltd. | 01/15/25 | M | 4.83 | % | Morgan Stanley Capital Services LLC | 16,360 USD | 265 | |||||||||||||||
Changzhou NRB Corp. | 03/26/25 | M | 1.00 | % | JPMorgan Chase Bank, N.A. | 96,953 USD | (2,665 | ) | ||||||||||||||
Changzhou NRB Corp. | 01/15/25 | M | 1.00 | % | Morgan Stanley Capital Services LLC | 27,845 USD | (677 | ) | ||||||||||||||
Changzhou Tenglong Auto Parts Co., Ltd. | 04/02/25 | M | 1.00 | % | JPMorgan Chase Bank, N.A. | 92,887 USD | 1,405 | |||||||||||||||
Changzhou Tenglong Auto Parts Co., Ltd. | 01/15/25 | M | 1.00 | % | Morgan Stanley Capital Services LLC | 45,165 USD | 750 | |||||||||||||||
Chengdu Hi-tech Development Co., Ltd. | 03/31/25 | M | 5.22 | % | JPMorgan Chase Bank, N.A. | 76,474 USD | 941 | |||||||||||||||
Chengdu Hi-tech Development Co., Ltd. | 01/15/25 | M | 4.83 | % | Morgan Stanley Capital Services LLC | 58,088 USD | 515 | |||||||||||||||
Chengdu Hongqi Chain Co., Ltd. | 03/26/25 | M | 5.22 | % | JPMorgan Chase Bank, N.A. | 580,936 USD | 21,548 | |||||||||||||||
Chengdu Hongqi Chain Co., Ltd. | 01/15/25 | M | 3.09 | % | Morgan Stanley Capital Services LLC | 328,870 USD | 13,562 | |||||||||||||||
Chengdu Jiafaantai Education Technology Co., Ltd. | 03/12/25 | M | 1.00 | % | JPMorgan Chase Bank, N.A. | 418,069 USD | (3,905 | ) | ||||||||||||||
Chengdu Jiafaantai Education Technology Co., Ltd. | 01/15/25 | M | 1.00 | % | Morgan Stanley Capital Services LLC | 225,723 USD | (2,178 | ) | ||||||||||||||
Chengdu Xuguang Electronics Co., Ltd. | 03/31/25 | M | 1.00 | % | JPMorgan Chase Bank, N.A. | 565,572 USD | 7,049 | |||||||||||||||
Chengdu Xuguang Electronics Co., Ltd. | 01/15/25 | M | 1.00 | % | Morgan Stanley Capital Services LLC | 322,002 USD | 5,937 | |||||||||||||||
Chengzhi Co., Ltd. | 03/12/25 | M | 4.97 | % | JPMorgan Chase Bank, N.A. | 786 USD | 2 | |||||||||||||||
Chengzhi Co., Ltd. | 01/15/25 | M | 3.48 | % | Morgan Stanley Capital Services LLC | 5,110 USD | 15 | |||||||||||||||
China Bester Group Telecom Co., Ltd. | 04/02/25 | M | 1.00 | % | JPMorgan Chase Bank, N.A. | 15,066 USD | 184 | |||||||||||||||
China Bester Group Telecom Co., Ltd. | 01/15/25 | M | 1.00 | % | Morgan Stanley Capital Services LLC | 2,089 USD | 7 | |||||||||||||||
China Calxon Group Co., Ltd. | 02/10/25 | M | 4.97 | % | JPMorgan Chase Bank, N.A. | 2,779 USD | (125 | ) | ||||||||||||||
China CITIC Bank Corp., Ltd. | 04/02/25 | M | 1.00 | % | JPMorgan Chase Bank, N.A. | 55,333 USD | 59 | |||||||||||||||
China CITIC Bank Corp., Ltd. | 01/15/25 | M | 1.00 | % | Morgan Stanley Capital Services LLC | 24,240 USD | 19 | |||||||||||||||
China Construction Bank Corp. | 03/25/25 | M | 5.01 | % | JPMorgan Chase Bank, N.A. | 47,770 USD | (747 | ) | ||||||||||||||
China Construction Bank Corp. | 01/15/25 | M | 1.00 | % | Morgan Stanley Capital Services LLC | 178,110 USD | (736 | ) | ||||||||||||||
See Notes to Consolidated Financial Statements.
188
Table of Contents
Blackstone Alternative Multi-Strategy Fund and Subsidiaries
Consolidated Schedule of Investments ^ (Continued)
March 31, 2023
Reference Instrument | Termination Date | Payment Frequency | Financing Rate | Counterparty | Notional Amount | Unrealized Appreciation (Depreciation) | ||||||||||||||||
China Development Bank | 05/18/23 | M | 6.87 | % | Morgan Stanley Capital Services LLC | 33,000,000 CNY | $ | (79,627 | ) | |||||||||||||
China Eastern Airlines Corp. Ltd. | 03/19/25 | M | 5.14 | % | JPMorgan Chase Bank, N.A. | 368,569 USD | (4,494 | ) | ||||||||||||||
China Eastern Airlines Corp. Ltd. | 01/15/25 | M | 2.97 | % | Morgan Stanley Capital Services LLC | 92,395 USD | (964 | ) | ||||||||||||||
China Energy Engineering Corp., Ltd. | 03/26/25 | M | 1.00 | % | JPMorgan Chase Bank, N.A. | 554,573 USD | (2,316 | ) | ||||||||||||||
China Energy Engineering Corp., Ltd. | 01/15/25 | M | 1.00 | % | Morgan Stanley Capital Services LLC | 230,629 USD | (992 | ) | ||||||||||||||
China Enterprise Co., Ltd. | 03/19/25 | M | 1.00 | % | JPMorgan Chase Bank, N.A. | 309,001 USD | (9,514 | ) | ||||||||||||||
China Enterprise Co., Ltd. | 01/15/25 | M | 1.00 | % | Morgan Stanley Capital Services LLC | 81,603 USD | (4,253 | ) | ||||||||||||||
China Film Co., Ltd. | 04/02/25 | M | 1.00 | % | JPMorgan Chase Bank, N.A. | 2,192 USD | 52 | |||||||||||||||
China Film Co., Ltd. | 01/15/25 | M | 1.00 | % | Morgan Stanley Capital Services LLC | 7,751 USD | 206 | |||||||||||||||
China Fortune Land Development Co., Ltd. | 02/10/25 | M | 4.97 | % | JPMorgan Chase Bank, N.A. | 93,736 USD | (3,635 | ) | ||||||||||||||
China Fortune Land Development Co., Ltd. | 01/15/25 | M | 4.83 | % | Morgan Stanley Capital Services LLC | 111,816 USD | (4,352 | ) | ||||||||||||||
China Fortune Land Development Co., Ltd. | 03/17/25 | M | 4.97 | % | JPMorgan Chase Bank, N.A. | 17,034 USD | (662 | ) | ||||||||||||||
China Fortune Land Development Co., Ltd. | 01/15/25 | M | 1.00 | % | Morgan Stanley Capital Services LLC | 18,614 USD | (614 | ) | ||||||||||||||
China Great Wall Securities Co., Ltd. | 02/06/25 | M | 5.22 | % | JPMorgan Chase Bank, N.A. | 8,857 USD | (171 | ) | ||||||||||||||
China Green Electricity Investment of Tianjin Co., Ltd. | 03/26/25 | M | 5.22 | % | JPMorgan Chase Bank, N.A. | 128,121 USD | (4,439 | ) | ||||||||||||||
China Life Insurance Co., Ltd. | 04/02/25 | M | 1.00 | % | JPMorgan Chase Bank, N.A. | 170,032 USD | (2,900 | ) | ||||||||||||||
China Life Insurance Co., Ltd. | 01/15/25 | M | 1.00 | % | Morgan Stanley Capital Services LLC | 5,859 USD | (45 | ) | ||||||||||||||
China Merchants Energy Shipping Co., Ltd. | 01/15/25 | M | 1.00 | % | Morgan Stanley Capital Services LLC | 352,583 USD | (9,359 | ) | ||||||||||||||
China Merchants Energy Shipping Co., Ltd. | 02/19/25 | M | 5.07 | % | JPMorgan Chase Bank, N.A. | 670,474 USD | (18,015 | ) | ||||||||||||||
China Merchants Expressway Network & Technology Holdings Co., Ltd. | 03/26/25 | M | 5.22 | % | JPMorgan Chase Bank, N.A. | 175,272 USD | (864 | ) | ||||||||||||||
China Merchants Expressway Network & Technology Holdings Co., Ltd. | 01/15/25 | M | 1.00 | % | Morgan Stanley Capital Services LLC | 59,951 USD | (418 | ) | ||||||||||||||
China Merchants Port Group Co., Ltd. | 02/19/25 | M | 5.01 | % | JPMorgan Chase Bank, N.A. | 4,416 USD | 87 | |||||||||||||||
China Merchants Port Group Co., Ltd. | 01/15/25 | M | 1.81 | % | Morgan Stanley Capital Services LLC | 31,547 USD | (278 | ) | ||||||||||||||
China Merchants Property Operation & Service Co., Ltd. | 03/05/25 | M | 4.97 | % | JPMorgan Chase Bank, N.A. | 230,516 USD | (154 | ) | ||||||||||||||
See Notes to Consolidated Financial Statements.
189
Table of Contents
Blackstone Alternative Multi-Strategy Fund and Subsidiaries
Consolidated Schedule of Investments ^ (Continued)
March 31, 2023
Reference Instrument | Termination Date | Payment Frequency | Financing Rate | Counterparty | Notional Amount | Unrealized Appreciation (Depreciation) | ||||||||||||||||
China Merchants Property Operation & Service Co., Ltd. | 01/15/25 | M | 3.48 | % | Morgan Stanley Capital Services LLC | 80,790 USD | $ | (75 | ) | |||||||||||||
China National Software & Service Co., Ltd. | 01/15/25 | M | 1.38 | % | Morgan Stanley Capital Services LLC | 83,344 USD | 2,795 | |||||||||||||||
China Pacific Insurance Group Co., Ltd. | 03/12/25 | M | 5.02 | % | JPMorgan Chase Bank, N.A. | 59,867 USD | (1,402 | ) | ||||||||||||||
China Railway Construction Heavy Industry Corp. Ltd. | 03/26/25 | M | 5.22 | % | JPMorgan Chase Bank, N.A. | 14,652 USD | (81 | ) | ||||||||||||||
China Railway Construction Heavy Industry Corp. Ltd. | 01/15/25 | M | 3.09 | % | Morgan Stanley Capital Services LLC | 140,288 USD | (3,166 | ) | ||||||||||||||
China Railway Group Ltd. | 04/02/25 | M | 5.22 | % | JPMorgan Chase Bank, N.A. | 548,082 USD | 1,669 | |||||||||||||||
China Railway Group Ltd. | 01/15/25 | M | 1.00 | % | Morgan Stanley Capital Services LLC | 313,996 USD | (1,125 | ) | ||||||||||||||
China Railway Hi-tech Industry Co., Ltd. | 03/17/25 | M | 1.00 | % | JPMorgan Chase Bank, N.A. | 592 USD | (39 | ) | ||||||||||||||
China Railway Hi-tech Industry Co., Ltd. | 01/15/25 | M | 1.00 | % | Morgan Stanley Capital Services LLC | 2,215 USD | (141 | ) | ||||||||||||||
China Railway Signal & Communication Corp., Ltd. | 01/15/25 | M | 4.83 | % | Morgan Stanley Capital Services LLC | 4 USD | — | |||||||||||||||
China Railway Tielong Container Logistics Co., Ltd. | 01/15/25 | M | 1.00 | % | Morgan Stanley Capital Services LLC | 11,206 USD | 162 | |||||||||||||||
China Southern Airlines Co., Ltd. | 03/17/25 | M | 5.00 | % | JPMorgan Chase Bank, N.A. | 16,221 USD | 729 | |||||||||||||||
China Southern Airlines Co., Ltd. | 01/15/25 | M | 4.83 | % | Morgan Stanley Capital Services LLC | 61,819 USD | 1,514 | |||||||||||||||
China Southern Power Grid Energy Efficiency&Clean Energy Co., Ltd. | 01/15/25 | M | 1.00 | % | Morgan Stanley Capital Services LLC | 7,802 USD | 102 | |||||||||||||||
China Southern Power Grid Energy Storage Co., Ltd. | 01/15/25 | M | 4.72 | % | Morgan Stanley Capital Services LLC | 151,136 USD | (5,221 | ) | ||||||||||||||
China Southern Power Grid Energy Storage Co., Ltd. | 11/13/24 | M | 4.97 | % | JPMorgan Chase Bank, N.A. | 448,558 USD | (15,429 | ) | ||||||||||||||
China Southern Power Grid Energy Storage Co., Ltd. | 03/17/25 | M | 1.00 | % | JPMorgan Chase Bank, N.A. | 87,169 USD | (3,029 | ) | ||||||||||||||
China Southern Power Grid Energy Storage Co., Ltd. | 01/15/25 | M | 1.00 | % | Morgan Stanley Capital Services LLC | 36,443 USD | (994 | ) | ||||||||||||||
China Tourism & Culture Investment Group Co., Ltd. | 01/15/25 | M | 4.83 | % | Morgan Stanley Capital Services LLC | 3,667 USD | 64 | |||||||||||||||
China Vanke Co., Ltd. | 03/25/25 | M | 4.97 | % | JPMorgan Chase Bank, N.A. | 57,822 USD | (1,935 | ) | ||||||||||||||
China West Construction Group Co., Ltd. | 01/15/25 | M | 1.00 | % | Morgan Stanley Capital Services LLC | 10,401 USD | 34 | |||||||||||||||
China Wuyi Co., Ltd. | 04/02/25 | M | 5.22 | % | JPMorgan Chase Bank, N.A. | 120,821 USD | 354 | |||||||||||||||
China Wuyi Co., Ltd. | 01/15/25 | M | 1.00 | % | Morgan Stanley Capital Services LLC | 154,493 USD | 477 | |||||||||||||||
Chongqing Baiya Sanitary Products Co., Ltd. | 01/15/25 | M | 1.00 | % | Morgan Stanley Capital Services LLC | 75,787 USD | (67 | ) | ||||||||||||||
Chongqing Baiya Sanitary Products Co., Ltd. | 03/17/25 | M | 4.98 | % | JPMorgan Chase Bank, N.A. | 179,208 USD | (67 | ) | ||||||||||||||
Chongqing Department Store Co., Ltd. | 03/31/25 | M | 1.00 | % | JPMorgan Chase Bank, N.A. | 209,758 USD | 3,355 | |||||||||||||||
See Notes to Consolidated Financial Statements.
190
Table of Contents
Blackstone Alternative Multi-Strategy Fund and Subsidiaries
Consolidated Schedule of Investments ^ (Continued)
March 31, 2023
Reference Instrument | Termination Date | Payment Frequency | Financing Rate | Counterparty | Notional Amount | Unrealized Appreciation (Depreciation) | ||||||||||||||||
Chongqing Department Store Co., Ltd. | 01/15/25 | M | 1.00 | % | Morgan Stanley Capital Services LLC | 126,469 USD | $ | 2,583 | ||||||||||||||
Chongqing Lummy Pharmaceutical Co., Ltd. | 01/15/25 | M | 1.00 | % | Morgan Stanley Capital Services LLC | 119,486 USD | (2,538 | ) | ||||||||||||||
Chongqing Lummy Pharmaceutical Co., Ltd. | 02/12/25 | M | 1.00 | % | JPMorgan Chase Bank, N.A. | 323,838 USD | (7,033 | ) | ||||||||||||||
Chongqing Taiji Industry Group Co., Ltd. | 03/26/25 | M | 1.00 | % | JPMorgan Chase Bank, N.A. | 28,765 USD | 3,066 | |||||||||||||||
Chongqing Water Group Co., Ltd. | 01/15/25 | M | 1.00 | % | Morgan Stanley Capital Services LLC | 48,703 USD | (253 | ) | ||||||||||||||
Chongqing Water Group Co., Ltd. | 03/26/25 | M | 5.22 | % | JPMorgan Chase Bank, N.A. | 196,299 USD | (1,679 | ) | ||||||||||||||
Chongqing Yukaifa Co., Ltd. | 03/12/25 | M | 4.99 | % | JPMorgan Chase Bank, N.A. | 69,777 USD | (2,050 | ) | ||||||||||||||
Chongqing Yukaifa Co., Ltd. | 01/15/25 | M | 1.00 | % | Morgan Stanley Capital Services LLC | 24,437 USD | (686 | ) | ||||||||||||||
Chr Hansen Holding | 12/16/24 | M | 6.87 | % | JPMorgan Chase Bank, N.A. | 30,988,301 DKK | 190,406 | |||||||||||||||
Chutian Dragon Co., Ltd. | 03/19/25 | M | 1.00 | % | JPMorgan Chase Bank, N.A. | 21,777 USD | 122 | |||||||||||||||
Chutian Dragon Co., Ltd. | 01/15/25 | M | 1.00 | % | Morgan Stanley Capital Services LLC | 81,067 USD | 817 | |||||||||||||||
Cinda Real Estate Co., Ltd. | 03/18/25 | M | 1.00 | % | JPMorgan Chase Bank, N.A. | 181,197 USD | (11,442 | ) | ||||||||||||||
Cinda Real Estate Co., Ltd. | 01/15/25 | M | 1.00 | % | Morgan Stanley Capital Services LLC | 109,441 USD | (6,669 | ) | ||||||||||||||
Cisen Pharmaceutical Co., Ltd. | 03/19/25 | M | 5.06 | % | JPMorgan Chase Bank, N.A. | 364,207 USD | (13,548 | ) | ||||||||||||||
Cisen Pharmaceutical Co., Ltd. | 01/15/25 | M | 3.48 | % | Morgan Stanley Capital Services LLC | 104,704 USD | (3,924 | ) | ||||||||||||||
Citic Pacific Special Steel Group Co., Ltd. | 01/15/25 | M | 1.00 | % | Morgan Stanley Capital Services LLC | 21,014 USD | 203 | |||||||||||||||
Citic Pacific Special Steel Group Co., Ltd. | 04/02/25 | M | 1.00 | % | JPMorgan Chase Bank, N.A. | 159,068 USD | 1,090 | |||||||||||||||
Citychamp Dartong Co., Ltd. | 01/15/25 | M | 1.00 | % | Morgan Stanley Capital Services LLC | 46,594 USD | 320 | |||||||||||||||
Citychamp Dartong Co., Ltd. | 03/31/25 | M | 5.22 | % | JPMorgan Chase Bank, N.A. | 104,279 USD | 664 | |||||||||||||||
Cloud Live Technology Group Co., Ltd. | 03/31/25 | M | 5.22 | % | JPMorgan Chase Bank, N.A. | 172,519 USD | 1,204 | |||||||||||||||
Cloud Live Technology Group Co., Ltd. | 01/15/25 | M | 1.00 | % | Morgan Stanley Capital Services LLC | 75,361 USD | 507 | |||||||||||||||
CMOC Group Ltd. | 04/02/25 | M | 1.00 | % | JPMorgan Chase Bank, N.A. | 10,449 USD | 11 | |||||||||||||||
CMOC Group Ltd. | 01/15/25 | M | 1.00 | % | Morgan Stanley Capital Services LLC | 128,610 USD | (212 | ) | ||||||||||||||
CMST Development Co., Ltd. | 01/15/25 | M | 1.00 | % | Morgan Stanley Capital Services LLC | 4,076 USD | (4 | ) | ||||||||||||||
CNOOC Energy Technology & Services Ltd. | 03/31/25 | M | 5.22 | % | JPMorgan Chase Bank, N.A. | 434,281 USD | 16,549 | |||||||||||||||
CNOOC Energy Technology & Services Ltd. | 01/15/25 | M | 1.00 | % | Morgan Stanley Capital Services LLC | 262,313 USD | 9,107 | |||||||||||||||
CoCreation Grass Co., Ltd. | 01/15/25 | M | 3.19 | % | Morgan Stanley Capital Services LLC | 333 USD | (1 | ) | ||||||||||||||
CoCreation Grass Co., Ltd. | 03/12/25 | M | 5.08 | % | JPMorgan Chase Bank, N.A. | 17,734 USD | (798 | ) | ||||||||||||||
See Notes to Consolidated Financial Statements.
191
Table of Contents
Blackstone Alternative Multi-Strategy Fund and Subsidiaries
Consolidated Schedule of Investments ^ (Continued)
March 31, 2023
Reference Instrument | Termination Date | Payment Frequency | Financing Rate | Counterparty | Notional Amount | Unrealized Appreciation (Depreciation) | ||||||||||||||||
Columbia Banking System, Inc. | 03/05/25 | M | 5.07 | % | JPMorgan Chase Bank, N.A. | 20,870 USD | $ | (1,142 | ) | |||||||||||||
COSCO SHIPPING Development Co., Ltd. | 03/12/25 | M | 4.97 | % | JPMorgan Chase Bank, N.A. | 897 USD | (34 | ) | ||||||||||||||
COSCO SHIPPING Energy Transportation Co., Ltd. | 01/15/25 | M | 1.00 | % | Morgan Stanley Capital Services LLC | 417,568 USD | (19,162 | ) | ||||||||||||||
COSCO SHIPPING Energy Transportation Co., Ltd. | 03/19/25 | M | 1.00 | % | JPMorgan Chase Bank, N.A. | 781,350 USD | (32,614 | ) | ||||||||||||||
CPT Technology Group Co., Ltd. | 04/02/25 | M | 1.00 | % | JPMorgan Chase Bank, N.A. | 9,450 USD | 15 | |||||||||||||||
CPT Technology Group Co., Ltd. | 01/15/25 | M | 1.00 | % | Morgan Stanley Capital Services LLC | 159 USD | 1 | |||||||||||||||
Create Technology & Science Co., Ltd. | 04/02/25 | M | 5.22 | % | JPMorgan Chase Bank, N.A. | 115,139 USD | 1,354 | |||||||||||||||
Create Technology & Science Co., Ltd. | 01/15/25 | M | 1.00 | % | Morgan Stanley Capital Services LLC | 65,752 USD | 623 | |||||||||||||||
CSC Financial Co., Ltd. | 04/02/25 | M | 5.22 | % | JPMorgan Chase Bank, N.A. | 2,265 USD | (27 | ) | ||||||||||||||
CSC Financial Co., Ltd. | 01/15/25 | M | 1.38 | % | Morgan Stanley Capital Services LLC | 378 USD | (5 | ) | ||||||||||||||
Cscec Scimee Sci & Tech Co., Ltd. | 03/12/25 | M | 1.00 | % | JPMorgan Chase Bank, N.A. | 123,229 USD | (5,846 | ) | ||||||||||||||
CSPC Innovation Pharmaceutical Co., Ltd. | 01/15/25 | M | 4.83 | % | Morgan Stanley Capital Services LLC | 232 USD | 24 | |||||||||||||||
CTS International Logistics Corp., Ltd. | 01/15/25 | M | 1.00 | % | Morgan Stanley Capital Services LLC | 141,391 USD | 885 | |||||||||||||||
CTS International Logistics Corp., Ltd. | 03/26/25 | M | 1.00 | % | JPMorgan Chase Bank, N.A. | 297,013 USD | 1,948 | |||||||||||||||
Dalian Demaishi Precision Technology Co., Ltd. | 03/31/25 | M | 1.00 | % | JPMorgan Chase Bank, N.A. | 121,452 USD | 1,300 | |||||||||||||||
Dalian Demaishi Precision Technology Co., Ltd. | 01/15/25 | M | 1.00 | % | Morgan Stanley Capital Services LLC | 4,012 USD | 19 | |||||||||||||||
Dalian Friendship Group | 04/02/25 | M | 5.22 | % | JPMorgan Chase Bank, N.A. | 66,273 USD | 946 | |||||||||||||||
Dalian Friendship Group | 01/15/25 | M | 1.00 | % | Morgan Stanley Capital Services LLC | 22,010 USD | 109 | |||||||||||||||
Daoming Optics&Chemical Co., Ltd. | 01/14/25 | M | 4.98 | % | JPMorgan Chase Bank, N.A. | 259,152 USD | (6,347 | ) | ||||||||||||||
Daoming Optics&Chemical Co., Ltd. | 01/15/25 | M | 1.00 | % | Morgan Stanley Capital Services LLC | 64,132 USD | (1,553 | ) | ||||||||||||||
Dare Power Dekor Home Co., Ltd. | 03/18/25 | M | 4.97 | % | JPMorgan Chase Bank, N.A. | 26,492 USD | (1,617 | ) | ||||||||||||||
Dareway Software Co., Ltd. | 01/15/25 | M | 1.00 | % | Morgan Stanley Capital Services LLC | 121,219 USD | 2,587 | |||||||||||||||
Dareway Software Co., Ltd. | 04/02/25 | M | 5.22 | % | JPMorgan Chase Bank, N.A. | 228,515 USD | 4,316 | |||||||||||||||
Dasheng Times Cultural Investment Co., Ltd. | 03/11/25 | M | 4.97 | % | JPMorgan Chase Bank, N.A. | 439,845 USD | (3,212 | ) | ||||||||||||||
Dasheng Times Cultural Investment Co., Ltd. | 01/15/25 | M | 4.72 | % | Morgan Stanley Capital Services LLC | 185,184 USD | (1,338 | ) | ||||||||||||||
Datang International Power Generation Co., Ltd. | 12/04/24 | M | 4.98 | % | JPMorgan Chase Bank, N.A. | 249,069 USD | (3,339 | ) | ||||||||||||||
Datang International Power Generation Co., Ltd. | 01/15/25 | M | 1.00 | % | Morgan Stanley Capital Services LLC | 151,447 USD | (1,840 | ) | ||||||||||||||
Datang Telecom Technology Co., Ltd. | 03/17/25 | M | 5.14 | % | JPMorgan Chase Bank, N.A. | 51,250 USD | 877 | |||||||||||||||
See Notes to Consolidated Financial Statements.
192
Table of Contents
Blackstone Alternative Multi-Strategy Fund and Subsidiaries
Consolidated Schedule of Investments ^ (Continued)
March 31, 2023
Reference Instrument | Termination Date | Payment Frequency | Financing Rate | Counterparty | Notional Amount | Unrealized Appreciation (Depreciation) | ||||||||||||||||
Datang Telecom Technology Co., Ltd. | 01/15/25 | M | 1.00 | % | Morgan Stanley Capital Services LLC | 12,031 USD | $ | 102 | ||||||||||||||
Datang Telecom Technology Co., Ltd. | 02/06/25 | M | 4.97 | % | JPMorgan Chase Bank, N.A. | 25,640 USD | 986 | |||||||||||||||
Dazhong Transportation Group Co., Ltd. | 03/26/25 | M | 5.22 | % | JPMorgan Chase Bank, N.A. | 13,404 USD | (4 | ) | ||||||||||||||
Dazhong Transportation Group Co., Ltd. | 01/15/25 | M | 1.00 | % | Morgan Stanley Capital Services LLC | 586 USD | (2 | ) | ||||||||||||||
DB Fixed Income Index Swap—DBMBSUN | 08/29/23 | M | 0.00 | % | Deutsche Bank AG | 127,713,135 USD | 1,222,551 | |||||||||||||||
Delixi New Energy Technology Co., Ltd. | 01/15/25 | M | 1.81 | % | Morgan Stanley Capital Services LLC | 23,717 USD | 385 | |||||||||||||||
Deppon Logistics Co., Ltd. | 10/30/24 | M | 4.98 | % | JPMorgan Chase Bank, N.A. | 200,525 USD | (5,289 | ) | ||||||||||||||
Digital China Information Service Co., Ltd. | 03/19/25 | M | 4.97 | % | JPMorgan Chase Bank, N.A. | 516,344 USD | 31,672 | |||||||||||||||
Digital China Information Service Co., Ltd. | 01/15/25 | M | 3.48 | % | Morgan Stanley Capital Services LLC | 330,683 USD | 20,798 | |||||||||||||||
Dongguan Aohai Technology Co., Ltd. | 01/15/25 | M | 4.83 | % | Morgan Stanley Capital Services LLC | 334 USD | 5 | |||||||||||||||
Dongguan Development Holdings Co., Ltd. | 03/19/25 | M | 5.18 | % | JPMorgan Chase Bank, N.A. | 119,210 USD | (3,127 | ) | ||||||||||||||
Dongguan Development Holdings Co., Ltd. | 01/15/25 | M | 1.00 | % | Morgan Stanley Capital Services LLC | 20,256 USD | (697 | ) | ||||||||||||||
Dongguan Eontec Co., Ltd. | 02/26/25 | M | 4.97 | % | JPMorgan Chase Bank, N.A. | 20,326 USD | 222 | |||||||||||||||
Dongguan Eontec Co., Ltd. | 03/17/25 | M | 4.97 | % | JPMorgan Chase Bank, N.A. | 201 USD | 2 | |||||||||||||||
Dongguan Winnerway Industrial Zone Ltd. | 03/24/25 | M | 5.14 | % | JPMorgan Chase Bank, N.A. | 233,360 USD | (7,632 | ) | ||||||||||||||
Dongguan Winnerway Industrial Zone Ltd. | 01/15/25 | M | 4.78 | % | Morgan Stanley Capital Services LLC | 47,197 USD | (2,210 | ) | ||||||||||||||
Dongguan Yiheda Automation Co., Ltd. | 03/19/25 | M | 1.00 | % | JPMorgan Chase Bank, N.A. | 622,977 USD | 4,291 | |||||||||||||||
Dongguan Yiheda Automation Co., Ltd. | 01/15/25 | M | 1.00 | % | Morgan Stanley Capital Services LLC | 271,282 USD | 2,812 | |||||||||||||||
Eaglerise Electric & Electronic China Co., Ltd. | 03/17/25 | M | 1.00 | % | JPMorgan Chase Bank, N.A. | 597,179 USD | (6,566 | ) | ||||||||||||||
Eaglerise Electric & Electronic China Co., Ltd. | 01/15/25 | M | 3.48 | % | Morgan Stanley Capital Services LLC | 257,499 USD | (2,824 | ) | ||||||||||||||
Eastern Air Logistics Co., Ltd. | 01/15/25 | M | 1.00 | % | Morgan Stanley Capital Services LLC | 17,361 USD | 125 | |||||||||||||||
EGing Photovoltaic Technology Co., Ltd. | 03/19/25 | M | 1.00 | % | JPMorgan Chase Bank, N.A. | 14,127 USD | 32 | |||||||||||||||
EGing Photovoltaic Technology Co., Ltd. | 01/15/25 | M | 1.00 | % | Morgan Stanley Capital Services LLC | 52,677 USD | 190 | |||||||||||||||
Elite Color Environmental Resources Science & Technology Co., Ltd. | 04/02/25 | M | 5.22 | % | JPMorgan Chase Bank, N.A. | 83,935 USD | (737 | ) | ||||||||||||||
Elite Color Environmental Resources Science & Technology Co., Ltd. | 01/15/25 | M | 1.00 | % | Morgan Stanley Capital Services LLC | 20,403 USD | (179 | ) | ||||||||||||||
EMIS Group PLC | 06/19/24 | M | 0.78 | % | JPMorgan Chase Bank, N.A. | 3,979,379 GBP | (809,049 | ) | ||||||||||||||
Era Co., Ltd. | 03/19/25 | M | 5.12 | % | JPMorgan Chase Bank, N.A. | 242,599 USD | (4,474 | ) | ||||||||||||||
Era Co., Ltd. | 01/15/25 | M | 3.48 | % | Morgan Stanley Capital Services LLC | 151,079 USD | (3,038 | ) | ||||||||||||||
See Notes to Consolidated Financial Statements.
193
Table of Contents
Blackstone Alternative Multi-Strategy Fund and Subsidiaries
Consolidated Schedule of Investments ^ (Continued)
March 31, 2023
Reference Instrument | Termination Date | Payment Frequency | Financing Rate | Counterparty | Notional Amount | Unrealized Appreciation (Depreciation) | ||||||||||||||||
Espressif Systems Shanghai Co., Ltd. | 01/15/25 | M | 3.48 | % | Morgan Stanley Capital Services LLC | 1,869 USD | $ | (70 | ) | |||||||||||||
Euronav NV | 07/15/24 | M | 5.07 | % | JPMorgan Chase Bank, N.A. | 473,428 USD | (26,109 | ) | ||||||||||||||
Eve Energy Co., Ltd. | 02/25/25 | M | 4.97 | % | JPMorgan Chase Bank, N.A. | 13,733 USD | 467 | |||||||||||||||
Eve Energy Co., Ltd. | 01/15/25 | M | 1.00 | % | Morgan Stanley Capital Services LLC | 40,566 USD | 5 | |||||||||||||||
Everdisplay Optronics Shanghai Co., Ltd. | 03/11/25 | M | 4.97 | % | JPMorgan Chase Bank, N.A. | 90,864 USD | (2,004 | ) | ||||||||||||||
Everdisplay Optronics Shanghai Co., Ltd. | 03/17/25 | M | 4.97 | % | JPMorgan Chase Bank, N.A. | 104,096 USD | (2,371 | ) | ||||||||||||||
Evoqua Water Technologies Corp. | 01/27/25 | M | 5.07 | % | JPMorgan Chase Bank, N.A. | 5,903,492 USD | 368,338 | |||||||||||||||
Fangda Carbon New Material Co., Ltd. | 04/02/25 | M | 1.00 | % | JPMorgan Chase Bank, N.A. | 47,651 USD | (43 | ) | ||||||||||||||
Fangda Carbon New Material Co., Ltd. | 01/15/25 | M | 1.00 | % | Morgan Stanley Capital Services LLC | 31,976 USD | (19 | ) | ||||||||||||||
FAW Jiefang Group Co., Ltd. | 03/11/25 | M | 5.07 | % | JPMorgan Chase Bank, N.A. | 104,163 USD | (290 | ) | ||||||||||||||
FAW Jiefang Group Co., Ltd. | 01/15/25 | M | 2.97 | % | Morgan Stanley Capital Services LLC | 33,729 USD | 331 | |||||||||||||||
First Horizon Corp. | 03/01/24 | M | 5.07 | % | JPMorgan Chase Bank, N.A. | 1,692,327 USD | 173,115 | |||||||||||||||
First Tractor Co., Ltd. | 02/19/25 | M | 1.00 | % | JPMorgan Chase Bank, N.A. | 14,964 USD | (1,616 | ) | ||||||||||||||
Focus Media Information Technology Co., Ltd. | 04/02/25 | M | 5.22 | % | JPMorgan Chase Bank, N.A. | 5,871 USD | 227 | |||||||||||||||
Focus Media Information Technology Co., Ltd. | 01/15/25 | M | 4.83 | % | Morgan Stanley Capital Services LLC | 21,925 USD | 668 | |||||||||||||||
Foshan Electrical & Lighting Co., Ltd. | 03/26/25 | M | 5.22 | % | JPMorgan Chase Bank, N.A. | 151,543 USD | 2,302 | |||||||||||||||
Foshan Electrical & Lighting Co., Ltd. | 01/15/25 | M | 2.97 | % | Morgan Stanley Capital Services LLC | 90,790 USD | 1,571 | |||||||||||||||
Foshan Nationstar Optoelectronics Co., Ltd. | 01/15/25 | M | 1.00 | % | Morgan Stanley Capital Services LLC | 25,171 USD | 79 | |||||||||||||||
Founder Securities Co., Ltd. | 04/02/25 | M | 5.22 | % | JPMorgan Chase Bank, N.A. | 115,766 USD | (37 | ) | ||||||||||||||
Foxconn Industrial Internet Co., Ltd. | 04/02/25 | M | 1.00 | % | JPMorgan Chase Bank, N.A. | 57,740 USD | 1,398 | |||||||||||||||
Friend Co., Ltd. | 04/02/25 | M | 1.00 | % | JPMorgan Chase Bank, N.A. | 13,501 USD | (121 | ) | ||||||||||||||
Friend Co., Ltd. | 01/15/25 | M | 1.00 | % | Morgan Stanley Capital Services LLC | 3,231 USD | (27 | ) | ||||||||||||||
Frontier Biotechnologies, Inc. | 04/02/25 | M | 5.22 | % | JPMorgan Chase Bank, N.A. | 38,651 USD | 62 | |||||||||||||||
Frontier Biotechnologies, Inc. | 01/15/25 | M | 1.00 | % | Morgan Stanley Capital Services LLC | 3,349 USD | 1 | |||||||||||||||
FSPG Hi-Tech Co., Ltd. | 03/05/25 | M | 4.97 | % | JPMorgan Chase Bank, N.A. | 372,270 USD | (6,543 | ) | ||||||||||||||
FSPG Hi-Tech Co., Ltd. | 01/15/25 | M | 4.72 | % | Morgan Stanley Capital Services LLC | 137,131 USD | (2,329 | ) | ||||||||||||||
Fuan Pharmaceutical Group Co., Ltd. | 03/19/25 | M | 1.00 | % | JPMorgan Chase Bank, N.A. | 560,765 USD | 11,629 | |||||||||||||||
Fuan Pharmaceutical Group Co., Ltd. | 01/15/25 | M | 4.72 | % | Morgan Stanley Capital Services LLC | 271,803 USD | 5,612 | |||||||||||||||
Fujian Apex Software Co., Ltd. | 04/02/25 | M | 1.00 | % | JPMorgan Chase Bank, N.A. | 31,395 USD | 1,456 | |||||||||||||||
Fujian Apex Software Co., Ltd. | 01/15/25 | M | 1.38 | % | Morgan Stanley Capital Services LLC | 18,229 USD | 871 | |||||||||||||||
See Notes to Consolidated Financial Statements.
194
Table of Contents
Blackstone Alternative Multi-Strategy Fund and Subsidiaries
Consolidated Schedule of Investments ^ (Continued)
March 31, 2023
Reference Instrument | Termination Date | Payment Frequency | Financing Rate | Counterparty | Notional Amount | Unrealized Appreciation (Depreciation) | ||||||||||||||||
Fujian Funeng Co., Ltd. | 01/22/25 | M | 1.00 | % | JPMorgan Chase Bank, N.A. | 397,038 USD | $ | (13,280 | ) | |||||||||||||
Fujian Funeng Co., Ltd. | 01/15/25 | M | 1.00 | % | Morgan Stanley Capital Services LLC | 145,823 USD | (1,312 | ) | ||||||||||||||
Fujian Green Pine Co., Ltd. | 02/19/25 | M | 5.02 | % | JPMorgan Chase Bank, N.A. | 314,498 USD | (7,368 | ) | ||||||||||||||
Fujian Green Pine Co., Ltd. | 01/15/25 | M | 1.00 | % | Morgan Stanley Capital Services LLC | 44,976 USD | (1,266 | ) | ||||||||||||||
Fujian Minfa Aluminum Co., Ltd. | 03/31/25 | M | 5.22 | % | JPMorgan Chase Bank, N.A. | 134,950 USD | 367 | |||||||||||||||
Fujian Minfa Aluminum Co., Ltd. | 01/15/25 | M | 1.00 | % | Morgan Stanley Capital Services LLC | 57,352 USD | 161 | |||||||||||||||
Fujian Nanping Sun Cable Co., Ltd. | 04/02/25 | M | 5.22 | % | JPMorgan Chase Bank, N.A. | 43,316 USD | 667 | |||||||||||||||
Fujian Nanping Sun Cable Co., Ltd. | 01/15/25 | M | 1.38 | % | Morgan Stanley Capital Services LLC | 30,216 USD | 547 | |||||||||||||||
Fujian Septwolves Industry Co., Ltd. | 03/26/25 | M | 5.22 | % | JPMorgan Chase Bank, N.A. | 33,673 USD | (102 | ) | ||||||||||||||
Fujian Septwolves Industry Co., Ltd. | 01/15/25 | M | 1.00 | % | Morgan Stanley Capital Services LLC | 15,187 USD | (68 | ) | ||||||||||||||
Fujian Sunner Development Co., Ltd. | 03/12/25 | M | 1.00 | % | JPMorgan Chase Bank, N.A. | 659,316 USD | 39,016 | |||||||||||||||
Fujian Sunner Development Co., Ltd. | 01/15/25 | M | 1.00 | % | Morgan Stanley Capital Services LLC | 274,864 USD | 15,091 | |||||||||||||||
Fujian Yanjing Huiquan Brewery Co., Ltd. | 04/02/25 | M | 5.22 | % | JPMorgan Chase Bank, N.A. | 51,963 USD | 2,888 | |||||||||||||||
Fujian Yanjing Huiquan Brewery Co., Ltd. | 01/15/25 | M | 4.83 | % | Morgan Stanley Capital Services LLC | 69,694 USD | 2,261 | |||||||||||||||
Fullink Technology Co., Ltd. | 03/26/25 | M | 5.22 | % | JPMorgan Chase Bank, N.A. | 232,543 USD | (858 | ) | ||||||||||||||
Fullink Technology Co., Ltd. | 01/15/25 | M | 1.00 | % | Morgan Stanley Capital Services LLC | 29,985 USD | (25 | ) | ||||||||||||||
Ganfeng Lithium Group Co., Ltd. | 04/02/25 | M | 1.00 | % | JPMorgan Chase Bank, N.A. | 48,360 USD | 4 | |||||||||||||||
Gansu Guofang Industry & Trade Group Co., Ltd. | 04/02/25 | M | 5.22 | % | JPMorgan Chase Bank, N.A. | 962 USD | 20 | |||||||||||||||
Gansu Guofang Industry & Trade Group Co., Ltd. | 01/15/25 | M | 4.83 | % | Morgan Stanley Capital Services LLC | 192 USD | 4 | |||||||||||||||
Gansu Longshenrongfa Pharmaceutical Industry Co., Ltd. | 04/02/25 | M | 1.00 | % | JPMorgan Chase Bank, N.A. | 38,079 USD | 823 | |||||||||||||||
Gansu Longshenrongfa Pharmaceutical Industry Co., Ltd. | 01/15/25 | M | 1.00 | % | Morgan Stanley Capital Services LLC | 12,575 USD | 120 | |||||||||||||||
Gansu Qilianshan Cement Group Co., Ltd. | 01/15/25 | M | 1.00 | % | Morgan Stanley Capital Services LLC | 2 USD | — | |||||||||||||||
Gansu Yatai Industrial Development Co., Ltd. | 03/26/25 | M | 5.22 | % | JPMorgan Chase Bank, N.A. | 246,679 USD | (9,251 | ) | ||||||||||||||
Gansu Yatai Industrial Development Co., Ltd. | 01/15/25 | M | 1.00 | % | Morgan Stanley Capital Services LLC | 8,570 USD | (60 | ) | ||||||||||||||
GD Power Development Co., Ltd. | 04/02/25 | M | 5.22 | % | JPMorgan Chase Bank, N.A. | 258,071 USD | 503 | |||||||||||||||
GD Power Development Co., Ltd. | 01/15/25 | M | 1.81 | % | Morgan Stanley Capital Services LLC | 263,526 USD | 3,397 | |||||||||||||||
GHT Co., Ltd. | 03/24/25 | M | 5.14 | % | JPMorgan Chase Bank, N.A. | 139,260 USD | 41 | |||||||||||||||
See Notes to Consolidated Financial Statements.
195
Table of Contents
Blackstone Alternative Multi-Strategy Fund and Subsidiaries
Consolidated Schedule of Investments ^ (Continued)
March 31, 2023
Reference Instrument | Termination Date | Payment Frequency | Financing Rate | Counterparty | Notional Amount | Unrealized Appreciation (Depreciation) | ||||||||||||||||
GHT Co., Ltd. | 01/15/25 | M | 1.00 | % | Morgan Stanley Capital Services LLC | 4,596 USD | $ | 33 | ||||||||||||||
Giantec Semiconductor Corp. | 04/02/25 | M | 1.00 | % | JPMorgan Chase Bank, N.A. | 206,853 USD | (5,568 | ) | ||||||||||||||
Giantec Semiconductor Corp. | 01/15/25 | M | 1.38 | % | Morgan Stanley Capital Services LLC | 299,923 USD | (9,497 | ) | ||||||||||||||
Global Infotech Co., Ltd. | 03/18/25 | M | 1.00 | % | JPMorgan Chase Bank, N.A. | 567,659 USD | 6,649 | |||||||||||||||
Global Infotech Co., Ltd. | 01/15/25 | M | 1.00 | % | Morgan Stanley Capital Services LLC | 263,510 USD | 2,858 | |||||||||||||||
Gotion High-tech Co., Ltd. | 04/02/25 | M | 1.00 | % | JPMorgan Chase Bank, N.A. | 28,856 USD | 208 | |||||||||||||||
Grand Industrial Holding Group Co., Ltd. | 03/17/25 | M | 1.00 | % | JPMorgan Chase Bank, N.A. | 225,250 USD | (436 | ) | ||||||||||||||
Grand Industrial Holding Group Co., Ltd. | 01/15/25 | M | 1.00 | % | Morgan Stanley Capital Services LLC | 14,400 USD | 24 | |||||||||||||||
Grand Industrial Holding Group Co., Ltd. | 02/19/25 | M | 4.97 | % | JPMorgan Chase Bank, N.A. | 189,392 USD | (1,744 | ) | ||||||||||||||
Grand Industrial Holding Group Co., Ltd. | 01/15/25 | M | 4.83 | % | Morgan Stanley Capital Services LLC | 52,865 USD | (495 | ) | ||||||||||||||
Grandblue Environment Co., Ltd. | 03/26/25 | M | 1.00 | % | JPMorgan Chase Bank, N.A. | 14,694 USD | 112 | |||||||||||||||
Grandblue Environment Co., Ltd. | 01/15/25 | M | 1.00 | % | Morgan Stanley Capital Services LLC | 25,315 USD | 141 | |||||||||||||||
Great-Sun Foods Co., Ltd. | 04/02/25 | M | 1.00 | % | JPMorgan Chase Bank, N.A. | 3,112 USD | 24 | |||||||||||||||
Greattown Holdings Ltd. | 04/02/25 | M | 1.00 | % | JPMorgan Chase Bank, N.A. | 141,514 USD | (588 | ) | ||||||||||||||
Greattown Holdings Ltd. | 01/15/25 | M | 1.00 | % | Morgan Stanley Capital Services LLC | 77,650 USD | (401 | ) | ||||||||||||||
GS Equity Index Swap — GSCBBXC3 | 03/05/25 | M | 4.82 | % | Goldman Sachs International | 83,627,909 USD | 4,504,899 | |||||||||||||||
GSP Automotive Group Wenzhou Co., Ltd. | 01/15/25 | M | 4.83 | % | Morgan Stanley Capital Services LLC | 8,537 USD | 156 | |||||||||||||||
Guangdong Baolihua New Energy Stock Co., Ltd. | 04/02/25 | M | 1.00 | % | JPMorgan Chase Bank, N.A. | 3,171 USD | (2 | ) | ||||||||||||||
Guangdong Baolihua New Energy Stock Co., Ltd. | 01/15/25 | M | 1.00 | % | Morgan Stanley Capital Services LLC | 26,982 USD | 46 | |||||||||||||||
Guangdong Champion Asia Electronics Co., Ltd. | 01/15/25 | M | 4.83 | % | Morgan Stanley Capital Services LLC | 142 USD | 3 | |||||||||||||||
Guangdong Ellington Electronics Technology Co., Ltd. | 01/15/25 | M | 1.00 | % | Morgan Stanley Capital Services LLC | 11,837 USD | (3 | ) | ||||||||||||||
Guangdong Fangyuan New Materials Group Co., Ltd. | 01/15/25 | M | 1.00 | % | Morgan Stanley Capital Services LLC | 2,742 USD | 67 | |||||||||||||||
Guangdong Fangyuan New Materials Group Co., Ltd. | 01/15/25 | M | 4.83 | % | Morgan Stanley Capital Services LLC | 588 USD | (8 | ) | ||||||||||||||
Guangdong Ganhua Science & Industry Co., Ltd. | 03/25/25 | M | 5.08 | % | JPMorgan Chase Bank, N.A. | 410,573 USD | (4,689 | ) | ||||||||||||||
Guangdong Ganhua Science & Industry Co., Ltd. | 01/15/25 | M | 1.00 | % | Morgan Stanley Capital Services LLC | 224,847 USD | (2,145 | ) | ||||||||||||||
Guangdong Guangzhou Daily Media Co., Ltd. | 04/02/25 | M | 1.00 | % | JPMorgan Chase Bank, N.A. | 13,052 USD | 24 | |||||||||||||||
Guangdong Guangzhou Daily Media Co., Ltd. | 01/15/25 | M | 1.00 | % | Morgan Stanley Capital Services LLC | 77,705 USD | 415 | |||||||||||||||
See Notes to Consolidated Financial Statements.
196
Table of Contents
Blackstone Alternative Multi-Strategy Fund and Subsidiaries
Consolidated Schedule of Investments ^ (Continued)
March 31, 2023
Reference Instrument | Termination Date | Payment Frequency | Financing Rate | Counterparty | Notional Amount | Unrealized Appreciation (Depreciation) | ||||||||||||||||
Guangdong Guanhao High-Tech Co., Ltd. | 03/26/25 | M | 1.00 | % | JPMorgan Chase Bank, N.A. | 25,128 USD | $ | (393 | ) | |||||||||||||
Guangdong Guanhao High-Tech Co., Ltd. | 01/15/25 | M | 1.00 | % | Morgan Stanley Capital Services LLC | 7,278 USD | (25 | ) | ||||||||||||||
Guangdong Guanhao High-Tech Co., Ltd. | 01/15/25 | M | 4.83 | % | Morgan Stanley Capital Services LLC | 90,309 USD | (3,017 | ) | ||||||||||||||
Guangdong Guanhao High-Tech Co., Ltd. | 11/06/24 | M | 1.00 | % | JPMorgan Chase Bank, N.A. | 296,963 USD | (9,877 | ) | ||||||||||||||
Guangdong HEC Technology Holding Co., Ltd. | 01/15/25 | M | 1.00 | % | Morgan Stanley Capital Services LLC | 36,617 USD | (19 | ) | ||||||||||||||
Guangdong Homa Group Co., Ltd. | 02/06/25 | M | 1.00 | % | JPMorgan Chase Bank, N.A. | 178,057 USD | (146 | ) | ||||||||||||||
Guangdong Homa Group Co., Ltd. | 01/15/25 | M | 4.83 | % | Morgan Stanley Capital Services LLC | 68,208 USD | (66 | ) | ||||||||||||||
Guangdong Homa Group Co., Ltd. | 03/26/25 | M | 5.22 | % | JPMorgan Chase Bank, N.A. | 28,916 USD | (403 | ) | ||||||||||||||
Guangdong Homa Group Co., Ltd. | 01/15/25 | M | 1.00 | % | Morgan Stanley Capital Services LLC | 6,678 USD | (28 | ) | ||||||||||||||
Guangdong Hongda Holdings Group Co., Ltd. | 01/15/25 | M | 4.83 | % | Morgan Stanley Capital Services LLC | 8,737 USD | 241 | |||||||||||||||
Guangdong Hongda Holdings Group Co., Ltd. | 03/12/25 | M | 4.97 | % | JPMorgan Chase Bank, N.A. | 2,184 USD | 60 | |||||||||||||||
Guangdong Hybribio Biotech Co., Ltd. | 01/15/25 | M | 1.00 | % | Morgan Stanley Capital Services LLC | 5,507 USD | 3 | |||||||||||||||
Guangdong Jiaying Pharmaceutical Co., Ltd. | 01/22/25 | M | 4.97 | % | JPMorgan Chase Bank, N.A. | 194,134 USD | 6,062 | |||||||||||||||
Guangdong Jiaying Pharmaceutical Co., Ltd. | 01/15/25 | M | 4.72 | % | Morgan Stanley Capital Services LLC | 72,124 USD | 2,241 | |||||||||||||||
Guangdong Senssun Weighing Apparatus Group Ltd. | 03/26/25 | M | 5.22 | % | JPMorgan Chase Bank, N.A. | 101,319 USD | 1,071 | |||||||||||||||
Guangdong Senssun Weighing Apparatus Group Ltd. | 01/15/25 | M | 1.00 | % | Morgan Stanley Capital Services LLC | 38,295 USD | 326 | |||||||||||||||
Guangdong Shunna Electric Co., Ltd. | 03/31/25 | M | 5.22 | % | JPMorgan Chase Bank, N.A. | 81,274 USD | (79 | ) | ||||||||||||||
Guangdong Shunna Electric Co., Ltd. | 01/15/25 | M | 1.00 | % | Morgan Stanley Capital Services LLC | 26,756 USD | (192 | ) | ||||||||||||||
Guangdong Silver Age Sci & Tech Co., Ltd. | 03/26/25 | M | 5.22 | % | JPMorgan Chase Bank, N.A. | 571,128 USD | 1,880 | |||||||||||||||
Guangdong Silver Age Sci & Tech Co., Ltd. | 01/15/25 | M | 1.00 | % | Morgan Stanley Capital Services LLC | 112,934 USD | 1,135 | |||||||||||||||
Guangdong Zhongsheng Pharmaceutical Co., Ltd. | 01/15/25 | M | 1.00 | % | Morgan Stanley Capital Services LLC | 36,049 USD | 118 | |||||||||||||||
Guanghui Logistics Co., Ltd. | 04/02/25 | M | 5.22 | % | JPMorgan Chase Bank, N.A. | 99,336 USD | 1,593 | |||||||||||||||
Guanghui Logistics Co., Ltd. | 01/15/25 | M | 1.81 | % | Morgan Stanley Capital Services LLC | 79,540 USD | 1,429 | |||||||||||||||
Guanglian Aviation Industry Co., Ltd. | 12/17/24 | M | 4.97 | % | JPMorgan Chase Bank, N.A. | 1,889 USD | (74 | ) | ||||||||||||||
Guanglian Aviation Industry Co., Ltd. | 03/26/25 | M | 5.22 | % | JPMorgan Chase Bank, N.A. | 33,086 USD | (881 | ) | ||||||||||||||
Guangxi Hechi Chemical Co., Ltd. | 03/26/25 | M | 5.22 | % | JPMorgan Chase Bank, N.A. | 37,403 USD | (606 | ) | ||||||||||||||
See Notes to Consolidated Financial Statements.
197
Table of Contents
Blackstone Alternative Multi-Strategy Fund and Subsidiaries
Consolidated Schedule of Investments ^ (Continued)
March 31, 2023
Reference Instrument | Termination Date | Payment Frequency | Financing Rate | Counterparty | Notional Amount | Unrealized Appreciation (Depreciation) | ||||||||||||||||
Guangxi Hechi Chemical Co., Ltd. | 01/15/25 | M | 1.00 | % | Morgan Stanley Capital Services LLC | 1,175 USD | $ | (1 | ) | |||||||||||||
Guangxi LiuYao Group Co., Ltd. | 01/15/25 | M | 1.00 | % | Morgan Stanley Capital Services LLC | 152 USD | 6 | |||||||||||||||
Guangxi Nanning Waterworks Co., Ltd. | 01/15/25 | M | 1.00 | % | Morgan Stanley Capital Services LLC | 3,459 USD | (1 | ) | ||||||||||||||
GuangYuYuan Chinese Herbal Medicine Co., Ltd. | 01/15/25 | M | 1.00 | % | Morgan Stanley Capital Services LLC | 10,789 USD | 548 | |||||||||||||||
Guangzhou Automobile Group Co., Ltd. | 03/26/25 | M | 1.00 | % | JPMorgan Chase Bank, N.A. | 539,354 USD | 4,203 | |||||||||||||||
Guangzhou Automobile Group Co., Ltd. | 01/15/25 | M | 3.09 | % | Morgan Stanley Capital Services LLC | 260,419 USD | 2,362 | |||||||||||||||
Guangzhou Baiyun Electric Equipment Co., Ltd. | 11/04/24 | M | 1.00 | % | JPMorgan Chase Bank, N.A. | 203,795 USD | 463 | |||||||||||||||
Guangzhou Baiyun Electric Equipment Co., Ltd. | 01/15/25 | M | 1.00 | % | Morgan Stanley Capital Services LLC | 41,524 USD | 224 | |||||||||||||||
Guangzhou Baiyun International Airport Co., Ltd. | 04/02/25 | M | 1.00 | % | JPMorgan Chase Bank, N.A. | 297,723 USD | 2,055 | |||||||||||||||
Guangzhou Baiyun International Airport Co., Ltd. | 01/15/25 | M | 1.00 | % | Morgan Stanley Capital Services LLC | 221,597 USD | 2,668 | |||||||||||||||
Guangzhou Baiyunshan Pharmaceutical Holdings Co., Ltd. | 03/10/25 | M | 4.99 | % | JPMorgan Chase Bank, N.A. | 39,597 USD | 1,802 | |||||||||||||||
Guangzhou Development Group, Inc. | 03/17/25 | M | 1.00 | % | JPMorgan Chase Bank, N.A. | 739,165 USD | 4,331 | |||||||||||||||
Guangzhou Development Group, Inc. | 01/15/25 | M | 1.00 | % | Morgan Stanley Capital Services LLC | 302,253 USD | 2,198 | |||||||||||||||
Guangzhou Goaland Energy Conservation Tech Co., Ltd. | 03/12/25 | M | 1.00 | % | JPMorgan Chase Bank, N.A. | 50,088 USD | 813 | |||||||||||||||
Guangzhou GRG Metrology & Test Co., Ltd. | 03/19/25 | M | 5.12 | % | JPMorgan Chase Bank, N.A. | 139,721 USD | 408 | |||||||||||||||
Guangzhou GRG Metrology & Test Co., Ltd. | 01/15/25 | M | 3.09 | % | Morgan Stanley Capital Services LLC | 97,608 USD | 423 | |||||||||||||||
Guangzhou Guangri Stock Co., Ltd. | 01/15/25 | M | 1.00 | % | Morgan Stanley Capital Services LLC | 7,758 USD | (26 | ) | ||||||||||||||
Guangzhou Guangri Stock Co., Ltd. | 03/26/25 | M | 1.00 | % | JPMorgan Chase Bank, N.A. | 76,545 USD | (1,369 | ) | ||||||||||||||
Guangzhou Hengyun Enterprises Holdings Ltd. | 04/02/25 | M | 1.00 | % | JPMorgan Chase Bank, N.A. | 3,318 USD | 3 | |||||||||||||||
Guangzhou Hengyun Enterprises Holdings Ltd. | 01/15/25 | M | 4.83 | % | Morgan Stanley Capital Services LLC | 832 USD | (1 | ) | ||||||||||||||
Guangzhou Jiacheng International Logistics Co., Ltd. | 03/19/25 | M | 5.15 | % | JPMorgan Chase Bank, N.A. | 36,886 USD | (1,266 | ) | ||||||||||||||
Guangzhou Jiacheng International Logistics Co., Ltd. | 01/15/25 | M | 4.72 | % | Morgan Stanley Capital Services LLC | 8,728 USD | (528 | ) | ||||||||||||||
See Notes to Consolidated Financial Statements.
198
Table of Contents
Blackstone Alternative Multi-Strategy Fund and Subsidiaries
Consolidated Schedule of Investments ^ (Continued)
March 31, 2023
Reference Instrument | Termination Date | Payment Frequency | Financing Rate | Counterparty | Notional Amount | Unrealized Appreciation (Depreciation) | ||||||||||||||||
Guangzhou Jinyi Media Corp. | 01/15/25 | M | 4.83 | % | Morgan Stanley Capital Services LLC | 9,039 USD | $ | 57 | ||||||||||||||
Guangzhou Jinzhong Auto Parts Manufacturing Co., Ltd. | 03/10/25 | M | 5.16 | % | JPMorgan Chase Bank, N.A. | 8,823 USD | 272 | |||||||||||||||
Guangzhou Pearl River Industrial Development Co., Ltd. | 01/15/25 | M | 4.83 | % | Morgan Stanley Capital Services LLC | 12,682 USD | (581 | ) | ||||||||||||||
Guangzhou Pearl River Piano Group Co., Ltd. | 03/25/25 | M | 5.16 | % | JPMorgan Chase Bank, N.A. | 24,708 USD | (21 | ) | ||||||||||||||
Guangzhou Pearl River Piano Group Co., Ltd. | 01/15/25 | M | 1.00 | % | Morgan Stanley Capital Services LLC | 725 USD | 4 | |||||||||||||||
Guangzhou Port Co., Ltd. | 04/02/25 | M | 5.22 | % | JPMorgan Chase Bank, N.A. | 157,050 USD | 825 | |||||||||||||||
Guangzhou Port Co., Ltd. | 01/15/25 | M | 1.00 | % | Morgan Stanley Capital Services LLC | 93,585 USD | 439 | |||||||||||||||
Guangzhou Tech-Long Packaging Machinery Co., Ltd. | 04/02/25 | M | 1.00 | % | JPMorgan Chase Bank, N.A. | 103,201 USD | 248 | |||||||||||||||
Guangzhou Tech-Long Packaging Machinery Co., Ltd. | 01/15/25 | M | 1.00 | % | Morgan Stanley Capital Services LLC | 57,928 USD | 253 | |||||||||||||||
Guangzhou Tinci Materials Technology Co., Ltd. | 01/15/25 | M | 1.00 | % | Morgan Stanley Capital Services LLC | 79,797 USD | 192 | |||||||||||||||
Guangzhou Yuexiu Financial Holdings Group Co., Ltd. | 03/26/25 | M | 5.21 | % | JPMorgan Chase Bank, N.A. | 223,514 USD | (1,030 | ) | ||||||||||||||
Guangzhou Yuexiu Financial Holdings Group Co., Ltd. | 01/15/25 | M | 3.19 | % | Morgan Stanley Capital Services LLC | 131,224 USD | (514 | ) | ||||||||||||||
Guangzhou Zhiguang Electric Co., Ltd. | 02/12/25 | M | 0.72 | % | JPMorgan Chase Bank, N.A. | 608,142 USD | 2,213 | |||||||||||||||
Guangzhou Zhiguang Electric Co., Ltd. | 01/15/25 | M | 1.00 | % | Morgan Stanley Capital Services LLC | 338,621 USD | 1,754 | |||||||||||||||
Guangzhou Zhujiang Brewery Co., Ltd. | 01/15/25 | M | 1.00 | % | Morgan Stanley Capital Services LLC | 45,505 USD | 2,452 | |||||||||||||||
Guangzhou Zhujiang Brewery Co., Ltd. | 02/10/25 | M | 5.03 | % | JPMorgan Chase Bank, N.A. | 108,818 USD | 7,355 | |||||||||||||||
Guizhou Bailing Group Pharmaceutical Co., Ltd. | 03/11/25 | M | 5.02 | % | JPMorgan Chase Bank, N.A. | 60,684 USD | (749 | ) | ||||||||||||||
Guizhou Chanhen Chemical Corp. | 01/15/25 | M | 3.48 | % | Morgan Stanley Capital Services LLC | 223,230 USD | (1,421 | ) | ||||||||||||||
Guizhou Chanhen Chemical Corp. | 03/19/25 | M | 4.98 | % | JPMorgan Chase Bank, N.A. | 215,172 USD | (959 | ) | ||||||||||||||
Guizhou Xinbang Pharmaceutical Co., Ltd. | 01/15/25 | M | 1.00 | % | Morgan Stanley Capital Services LLC | 10,316 USD | 5 | |||||||||||||||
Guobang Pharma Ltd. | 04/02/25 | M | 1.00 | % | JPMorgan Chase Bank, N.A. | 62,097 USD | 679 | |||||||||||||||
Guobang Pharma Ltd. | 01/15/25 | M | 1.00 | % | Morgan Stanley Capital Services LLC | 38,925 USD | 354 | |||||||||||||||
Guodian Nanjing Automation Co., Ltd. | 01/15/25 | M | 1.00 | % | Morgan Stanley Capital Services LLC | 57,777 USD | (1,492 | ) | ||||||||||||||
Guotai Epoint Software Co., Ltd. | 04/02/25 | M | 1.00 | % | JPMorgan Chase Bank, N.A. | 152,047 USD | 2,489 | |||||||||||||||
Guotai Epoint Software Co., Ltd. | 01/15/25 | M | 1.00 | % | Morgan Stanley Capital Services LLC | 92,955 USD | 1,573 | |||||||||||||||
See Notes to Consolidated Financial Statements.
199
Table of Contents
Blackstone Alternative Multi-Strategy Fund and Subsidiaries
Consolidated Schedule of Investments ^ (Continued)
March 31, 2023
Reference Instrument | Termination Date | Payment Frequency | Financing Rate | Counterparty | Notional Amount | Unrealized Appreciation (Depreciation) | ||||||||||||||||
Guotai Junan Securities Co., Ltd. | 03/19/25 | M | 1.00 | % | JPMorgan Chase Bank, N.A. | 549,345 USD | $ | 3,168 | ||||||||||||||
Guotai Junan Securities Co., Ltd. | 01/15/25 | M | 1.00 | % | Morgan Stanley Capital Services LLC | 228,612 USD | 835 | |||||||||||||||
Guoyuan Securities Co., Ltd. | 03/12/25 | M | 5.05 | % | JPMorgan Chase Bank, N.A. | 12,065 USD | (162 | ) | ||||||||||||||
Guoyuan Securities Co., Ltd. | 01/15/25 | M | 1.00 | % | Morgan Stanley Capital Services LLC | 44,160 USD | 206 | |||||||||||||||
Hainan Haiqi Transportation Group Co., Ltd. | 03/05/25 | M | 1.00 | % | JPMorgan Chase Bank, N.A. | 183,129 USD | (6,312 | ) | ||||||||||||||
Hainan Haiqi Transportation Group Co., Ltd. | 01/15/25 | M | 1.00 | % | Morgan Stanley Capital Services LLC | 42,816 USD | (1,482 | ) | ||||||||||||||
Hainan Haiqi Transportation Group Co., Ltd. | 03/17/25 | M | 5.16 | % | JPMorgan Chase Bank, N.A. | 386,108 USD | 7,493 | |||||||||||||||
Hainan Haiqi Transportation Group Co., Ltd. | 01/15/25 | M | 1.00 | % | Morgan Stanley Capital Services LLC | 281,440 USD | 2,539 | |||||||||||||||
Hainan Haiyao Co., Ltd. | 03/19/25 | M | 1.00 | % | JPMorgan Chase Bank, N.A. | 419,966 USD | 35,899 | |||||||||||||||
Hainan Haiyao Co., Ltd. | 01/15/25 | M | 1.00 | % | Morgan Stanley Capital Services LLC | 219,045 USD | 19,663 | |||||||||||||||
Hainan Jinpan Smart Technology Co., Ltd. | 03/17/25 | M | 5.14 | % | JPMorgan Chase Bank, N.A. | 252,435 USD | 497 | |||||||||||||||
Hainan Jinpan Smart Technology Co., Ltd. | 01/15/25 | M | 1.00 | % | Morgan Stanley Capital Services LLC | 158,670 USD | 288 | |||||||||||||||
Hainan Jinpan Smart Technology Co., Ltd. | 03/05/25 | M | 4.97 | % | JPMorgan Chase Bank, N.A. | 313,994 USD | (19,073 | ) | ||||||||||||||
Hainan Jinpan Smart Technology Co., Ltd. | 01/15/25 | M | 4.72 | % | Morgan Stanley Capital Services LLC | 145,843 USD | (8,880 | ) | ||||||||||||||
Hainan Mining Co., Ltd. | 01/15/25 | M | 1.00 | % | Morgan Stanley Capital Services LLC | 3,997 USD | 134 | |||||||||||||||
Hainan Poly Pharm Co., Ltd. | 01/15/25 | M | 1.00 | % | Morgan Stanley Capital Services LLC | 31 USD | 1 | |||||||||||||||
Haitong Securities Co., Ltd. | 01/15/25 | M | 3.19 | % | Morgan Stanley Capital Services LLC | 129,740 USD | 387 | |||||||||||||||
Haitong Securities Co., Ltd. | 03/26/25 | M | 5.15 | % | JPMorgan Chase Bank, N.A. | 87,846 USD | 487 | |||||||||||||||
Haixin Foods Co., Ltd. | 04/02/25 | M | 1.00 | % | JPMorgan Chase Bank, N.A. | 54,820 USD | 758 | |||||||||||||||
Haixin Foods Co., Ltd. | 01/15/25 | M | 4.83 | % | Morgan Stanley Capital Services LLC | 6,606 USD | 134 | |||||||||||||||
Han’s Laser Technology Industry Group Co., Ltd. | 01/15/25 | M | 1.00 | % | Morgan Stanley Capital Services LLC | 30,894 USD | 22 | |||||||||||||||
Hangxiao Steel Structure Co., Ltd. | 03/05/25 | M | 1.00 | % | JPMorgan Chase Bank, N.A. | 35,938 USD | (511 | ) | ||||||||||||||
Hangxiao Steel Structure Co., Ltd. | 01/15/25 | M | 1.00 | % | Morgan Stanley Capital Services LLC | 134,536 USD | (2,454 | ) | ||||||||||||||
Hangzhou Advance Gearbox Group Co., Ltd. | 01/15/25 | M | 4.83 | % | Morgan Stanley Capital Services LLC | 8,505 USD | 63 | |||||||||||||||
Hangzhou Dadi Haiyang Environmental Protection Co., Ltd. | 03/26/25 | M | 5.22 | % | JPMorgan Chase Bank, N.A. | 9,290 USD | (38 | ) | ||||||||||||||
See Notes to Consolidated Financial Statements.
200
Table of Contents
Blackstone Alternative Multi-Strategy Fund and Subsidiaries
Consolidated Schedule of Investments ^ (Continued)
March 31, 2023
Reference Instrument | Termination Date | Payment Frequency | Financing Rate | Counterparty | Notional Amount | Unrealized Appreciation (Depreciation) | ||||||||||||||||
Hangzhou Electronic Soul Network Technology Co., Ltd. | 03/26/25 | M | 1.00 | % | JPMorgan Chase Bank, N.A. | 814 USD | $ | 14 | ||||||||||||||
Hangzhou Freely Communication Co., Ltd. | 04/02/25 | M | 1.00 | % | JPMorgan Chase Bank, N.A. | 51,769 USD | 217 | |||||||||||||||
Hangzhou Freely Communication Co., Ltd. | 01/15/25 | M | 1.00 | % | Morgan Stanley Capital Services LLC | 29,451 USD | 141 | |||||||||||||||
Hangzhou Haoyue Personal Care Co., Ltd. | 01/15/25 | M | 1.00 | % | Morgan Stanley Capital Services LLC | 55,376 USD | 136 | |||||||||||||||
Hangzhou Haoyue Personal Care Co., Ltd. | 04/02/25 | M | 1.00 | % | JPMorgan Chase Bank, N.A. | 93,414 USD | 220 | |||||||||||||||
Hangzhou Huaguang Advanced Welding Materials Co., Ltd. | 04/02/25 | M | 5.22 | % | JPMorgan Chase Bank, N.A. | 46,830 USD | (912 | ) | ||||||||||||||
Hangzhou Huaguang Advanced Welding Materials Co., Ltd. | 01/15/25 | M | 1.00 | % | Morgan Stanley Capital Services LLC | 6,799 USD | (79 | ) | ||||||||||||||
Hangzhou Huaxing Chuangye Communication Technology Co., Ltd. | 03/19/25 | M | 5.07 | % | JPMorgan Chase Bank, N.A. | 469,704 USD | (7,255 | ) | ||||||||||||||
Hangzhou Huaxing Chuangye Communication Technology Co., Ltd. | 01/15/25 | M | 4.72 | % | Morgan Stanley Capital Services LLC | 258,467 USD | (3,630 | ) | ||||||||||||||
Hangzhou Iron & Steel Co. | 04/02/25 | M | 1.00 | % | JPMorgan Chase Bank, N.A. | 4,413 USD | 25 | |||||||||||||||
Hangzhou Iron & Steel Co. | 01/15/25 | M | 1.00 | % | Morgan Stanley Capital Services LLC | 27,760 USD | 35 | |||||||||||||||
Hangzhou Jiebai Group Co., Ltd. | 01/15/25 | M | 4.80 | % | Morgan Stanley Capital Services LLC | 19,931 USD | (187 | ) | ||||||||||||||
Hangzhou Jiebai Group Co., Ltd. | 03/05/25 | M | 5.06 | % | JPMorgan Chase Bank, N.A. | 76,823 USD | (810 | ) | ||||||||||||||
Hangzhou Juheshun New Material Co., Ltd. | 04/02/25 | M | 5.22 | % | JPMorgan Chase Bank, N.A. | 59,602 USD | 1,032 | |||||||||||||||
Hangzhou Juheshun New Material Co., Ltd. | 01/15/25 | M | 1.00 | % | Morgan Stanley Capital Services LLC | 12,843 USD | 221 | |||||||||||||||
Hangzhou Oxygen Plant Group Co., Ltd. | 03/18/25 | M | 4.99 | % | JPMorgan Chase Bank, N.A. | 156,338 USD | (6,207 | ) | ||||||||||||||
Hangzhou Oxygen Plant Group Co., Ltd. | 01/15/25 | M | 1.00 | % | Morgan Stanley Capital Services LLC | 58,962 USD | (2,300 | ) | ||||||||||||||
Hanyu Group Joint-Stock Co., Ltd. | 04/02/25 | M | 1.00 | % | JPMorgan Chase Bank, N.A. | 104,096 USD | 1,258 | |||||||||||||||
Hanyu Group Joint-Stock Co., Ltd. | 01/15/25 | M | 1.00 | % | Morgan Stanley Capital Services LLC | 57,537 USD | 756 | |||||||||||||||
Harbin Electric Corp. Jiamusi Electric Machine Co., Ltd. | 03/25/25 | M | 5.20 | % | JPMorgan Chase Bank, N.A. | 586,759 USD | 2,468 | |||||||||||||||
Harbin Electric Corp. Jiamusi Electric Machine Co., Ltd. | 01/15/25 | M | 1.00 | % | Morgan Stanley Capital Services LLC | 224,668 USD | 1,768 | |||||||||||||||
Harbin Medisan Pharmaceutical Co., Ltd. | 02/26/25 | M | 5.02 | % | JPMorgan Chase Bank, N.A. | 218,636 USD | (1,232 | ) | ||||||||||||||
See Notes to Consolidated Financial Statements.
201
Table of Contents
Blackstone Alternative Multi-Strategy Fund and Subsidiaries
Consolidated Schedule of Investments ^ (Continued)
March 31, 2023
Reference Instrument | Termination Date | Payment Frequency | Financing Rate | Counterparty | Notional Amount | Unrealized Appreciation (Depreciation) | ||||||||||||||||
Harbin Medisan Pharmaceutical Co., Ltd. | 01/15/25 | M | 1.00 | % | Morgan Stanley Capital Services LLC | 77,853 USD | $ | (537 | ) | |||||||||||||
Harbin Pharmaceutical Group Co., Ltd. | 03/31/25 | M | 1.00 | % | JPMorgan Chase Bank, N.A. | 282,334 USD | 2,967 | |||||||||||||||
Harbin Pharmaceutical Group Co., Ltd. | 01/15/25 | M | 1.00 | % | Morgan Stanley Capital Services LLC | 156,136 USD | 1,313 | |||||||||||||||
Hebei Huatong Wires & Cables Group Co., Ltd. | 02/19/25 | M | 5.15 | % | JPMorgan Chase Bank, N.A. | 321,075 USD | 2,187 | |||||||||||||||
Hebei Huatong Wires & Cables Group Co., Ltd. | 01/15/25 | M | 1.00 | % | Morgan Stanley Capital Services LLC | 137,979 USD | 1,000 | |||||||||||||||
Hebei Jianxin Chemical Co., Ltd. | 01/15/25 | M | 1.00 | % | Morgan Stanley Capital Services LLC | 7,229 USD | (25 | ) | ||||||||||||||
Hefei Changqing Machinery Co., Ltd. | 03/26/25 | M | 5.22 | % | JPMorgan Chase Bank, N.A. | 21,234 USD | (162 | ) | ||||||||||||||
Hefei Changqing Machinery Co., Ltd. | 01/15/25 | M | 1.00 | % | Morgan Stanley Capital Services LLC | 454 USD | — | |||||||||||||||
Hefei Department Store Group Co., Ltd. | 03/26/25 | M | 5.22 | % | JPMorgan Chase Bank, N.A. | 45,251 USD | 1,513 | |||||||||||||||
Hefei Department Store Group Co., Ltd. | 01/15/25 | M | 1.00 | % | Morgan Stanley Capital Services LLC | 15,805 USD | 458 | |||||||||||||||
Hefei Jianghang Aircraft Equipment Co., Ltd. | 01/15/25 | M | 4.83 | % | Morgan Stanley Capital Services LLC | 490 USD | (35 | ) | ||||||||||||||
Henan Dayou Energy Co., Ltd. | 01/15/25 | M | 3.48 | % | Morgan Stanley Capital Services LLC | 21,064 USD | 207 | |||||||||||||||
Henan Dayou Energy Co., Ltd. | 03/18/25 | M | 5.03 | % | JPMorgan Chase Bank, N.A. | 5,740 USD | (67 | ) | ||||||||||||||
Henan Taloph Pharmaceutical Stock Co., Ltd. | 03/12/25 | M | 5.11 | % | JPMorgan Chase Bank, N.A. | 163,107 USD | 303 | |||||||||||||||
Henan Taloph Pharmaceutical Stock Co., Ltd. | 01/15/25 | M | 4.83 | % | Morgan Stanley Capital Services LLC | 54,513 USD | 755 | |||||||||||||||
Henan Thinker Automatic Equipment Co., Ltd. | 04/02/25 | M | 1.00 | % | JPMorgan Chase Bank, N.A. | 40,922 USD | 415 | |||||||||||||||
Henan Thinker Automatic Equipment Co., Ltd. | 01/15/25 | M | 1.00 | % | Morgan Stanley Capital Services LLC | 31,414 USD | 365 | |||||||||||||||
Henan Yicheng New Energy Co., Ltd. | 01/15/25 | M | 3.48 | % | Morgan Stanley Capital Services LLC | 152,694 USD | (6,555 | ) | ||||||||||||||
Henan Yicheng New Energy Co., Ltd. | 02/06/25 | M | 1.00 | % | JPMorgan Chase Bank, N.A. | 205,485 USD | (8,164 | ) | ||||||||||||||
Henan Zhongfu Industry Co., Ltd. | 03/26/25 | M | 1.00 | % | JPMorgan Chase Bank, N.A. | 55,052 USD | (1,045 | ) | ||||||||||||||
Henan Zhongfu Industry Co., Ltd. | 01/15/25 | M | 1.00 | % | Morgan Stanley Capital Services LLC | 16,217 USD | (189 | ) | ||||||||||||||
Hengdian Group DMEGC Magnetics Co., Ltd. | 01/02/25 | M | 4.97 | % | JPMorgan Chase Bank, N.A. | 229,183 USD | 6,580 | |||||||||||||||
Hengdian Group Tospo Lighting Co., Ltd. | 03/24/25 | M | 5.21 | % | JPMorgan Chase Bank, N.A. | 20,825 USD | (1,177 | ) | ||||||||||||||
Hengdian Group Tospo Lighting Co., Ltd. | 01/15/25 | M | 1.00 | % | Morgan Stanley Capital Services LLC | 7,601 USD | (62 | ) | ||||||||||||||
Hengdian Group Tospo Lighting Co., Ltd. | 03/04/25 | M | 4.97 | % | JPMorgan Chase Bank, N.A. | 209,100 USD | (10,104 | ) | ||||||||||||||
Hengdian Group Tospo Lighting Co., Ltd. | 01/15/25 | M | 4.83 | % | Morgan Stanley Capital Services LLC | 94,688 USD | (4,589 | ) | ||||||||||||||
See Notes to Consolidated Financial Statements.
202
Table of Contents
Blackstone Alternative Multi-Strategy Fund and Subsidiaries
Consolidated Schedule of Investments ^ (Continued)
March 31, 2023
Reference Instrument | Termination Date | Payment Frequency | Financing Rate | Counterparty | Notional Amount | Unrealized Appreciation (Depreciation) | ||||||||||||||||
Hengyi Petrochemical Co., Ltd. | 03/04/25 | M | 5.12 | % | JPMorgan Chase Bank, N.A. | 15,082 USD | $ | 988 | ||||||||||||||
Hisense Home Appliances Group Co., Ltd. | 03/19/25 | M | 4.98 | % | JPMorgan Chase Bank, N.A. | 346,285 USD | 26,873 | |||||||||||||||
Hisense Home Appliances Group Co., Ltd. | 01/15/25 | M | 3.48 | % | Morgan Stanley Capital Services LLC | 178,975 USD | 13,917 | |||||||||||||||
Hisense Visual Technology Co., Ltd. | 03/26/25 | M | 5.22 | % | JPMorgan Chase Bank, N.A. | 61,964 USD | 6,082 | |||||||||||||||
Hongfa Technology Co., Ltd. | 03/19/25 | M | 1.00 | % | JPMorgan Chase Bank, N.A. | 770,443 USD | (16,854 | ) | ||||||||||||||
Hongfa Technology Co., Ltd. | 01/15/25 | M | 1.00 | % | Morgan Stanley Capital Services LLC | 289,031 USD | (6,376 | ) | ||||||||||||||
Hongli Zhihui Group Co., Ltd. | 03/05/25 | M | 4.97 | % | JPMorgan Chase Bank, N.A. | 10,798 USD | 200 | |||||||||||||||
Hongli Zhihui Group Co., Ltd. | 01/15/25 | M | 4.83 | % | Morgan Stanley Capital Services LLC | 19,646 USD | 361 | |||||||||||||||
Hongli Zhihui Group Co., Ltd. | 03/19/25 | M | 5.21 | % | JPMorgan Chase Bank, N.A. | 10,987 USD | (106 | ) | ||||||||||||||
Hongli Zhihui Group Co., Ltd. | 01/15/25 | M | 1.00 | % | Morgan Stanley Capital Services LLC | 812 USD | 7 | |||||||||||||||
Horizon Therapeutics Plc | 12/16/24 | M | 1.00 | % | JPMorgan Chase Bank, N.A. | 5,056,038 USD | (4,166 | ) | ||||||||||||||
HPGC Renmintongtai Pharmaceutical Corp. | 03/12/25 | M | 5.02 | % | JPMorgan Chase Bank, N.A. | 200,607 USD | 4,034 | |||||||||||||||
HPGC Renmintongtai Pharmaceutical Corp. | 01/15/25 | M | 1.00 | % | Morgan Stanley Capital Services LLC | 58,457 USD | 1,003 | |||||||||||||||
Huaan Securities Co., Ltd. | 03/26/25 | M | 1.00 | % | JPMorgan Chase Bank, N.A. | 19,688 USD | 21 | |||||||||||||||
Huaan Securities Co., Ltd. | 01/15/25 | M | 1.00 | % | Morgan Stanley Capital Services LLC | 104,468 USD | (1,150 | ) | ||||||||||||||
Huabao Flavours & Fragrances Co., Ltd. | 03/19/25 | M | 5.21 | % | JPMorgan Chase Bank, N.A. | 183,655 USD | 220 | |||||||||||||||
Huabao Flavours & Fragrances Co., Ltd. | 01/15/25 | M | 2.97 | % | Morgan Stanley Capital Services LLC | 100,392 USD | 310 | |||||||||||||||
Huadian Power International Corp Ltd | 02/19/25 | M | 5.08 | % | JPMorgan Chase Bank, N.A. | 86,336 USD | (1,573 | ) | ||||||||||||||
Huadian Power International Corp. Ltd. | 01/15/25 | M | 3.19 | % | Morgan Stanley Capital Services LLC | 176,287 USD | (2,720 | ) | ||||||||||||||
Huali Industries Co., Ltd. | 03/26/25 | M | 1.00 | % | JPMorgan Chase Bank, N.A. | 280,707 USD | (8,374 | ) | ||||||||||||||
Huali Industries Co., Ltd. | 01/15/25 | M | 1.00 | % | Morgan Stanley Capital Services LLC | 9,680 USD | 38 | |||||||||||||||
Huaming Power Equipment Co., Ltd. | 04/02/25 | M | 5.22 | % | JPMorgan Chase Bank, N.A. | 154,465 USD | 906 | |||||||||||||||
Huaming Power Equipment Co., Ltd. | 01/15/25 | M | 1.00 | % | Morgan Stanley Capital Services LLC | 117,659 USD | 593 | |||||||||||||||
Huaneng Power International, Inc. | 02/26/25 | M | 4.97 | % | JPMorgan Chase Bank, N.A. | 27,375 USD | (312 | ) | ||||||||||||||
Huangshan Novel Co., Ltd. | 03/26/25 | M | 5.22 | % | JPMorgan Chase Bank, N.A. | 4,724 USD | (114 | ) | ||||||||||||||
Huangshan Novel Co., Ltd. | 01/15/25 | M | 1.00 | % | Morgan Stanley Capital Services LLC | 132 USD | — | |||||||||||||||
Huangshan Novel Co., Ltd. | 01/15/25 | M | 4.83 | % | Morgan Stanley Capital Services LLC | 53 USD | — | |||||||||||||||
HUANLEJIA Food Group Co., Ltd. | 04/02/25 | M | 1.00 | % | JPMorgan Chase Bank, N.A. | 103,901 USD | 1,819 | |||||||||||||||
HUANLEJIA Food Group Co., Ltd. | 01/15/25 | M | 1.81 | % | Morgan Stanley Capital Services LLC | 76,475 USD | 1,543 | |||||||||||||||
See Notes to Consolidated Financial Statements.
203
Table of Contents
Blackstone Alternative Multi-Strategy Fund and Subsidiaries
Consolidated Schedule of Investments ^ (Continued)
March 31, 2023
Reference Instrument | Termination Date | Payment Frequency | Financing Rate | Counterparty | Notional Amount | Unrealized Appreciation (Depreciation) | ||||||||||||||||
Huaren Pharmaceutical Co., Ltd. | 03/17/25 | M | 1.00 | % | JPMorgan Chase Bank, N.A. | 304,797 USD | $ | (7,775 | ) | |||||||||||||
Huaren Pharmaceutical Co., Ltd. | 01/15/25 | M | 1.00 | % | Morgan Stanley Capital Services LLC | 161,997 USD | (4,513 | ) | ||||||||||||||
Huatai Securities Co., Ltd. | 03/26/25 | M | 5.22 | % | JPMorgan Chase Bank, N.A. | 556,587 USD | 8,524 | |||||||||||||||
Huatai Securities Co., Ltd. | 01/15/25 | M | 1.00 | % | Morgan Stanley Capital Services LLC | 316,975 USD | 3,954 | |||||||||||||||
Huaxin Cement Co., Ltd. | 03/19/25 | M | 1.00 | % | JPMorgan Chase Bank, N.A. | 11,683 USD | (595 | ) | ||||||||||||||
Huaxin Cement Co., Ltd. | 01/15/25 | M | 1.00 | % | Morgan Stanley Capital Services LLC | 43,631 USD | (2,221 | ) | ||||||||||||||
Hubei Donper Electromechanical Group Co., Ltd. | 01/15/25 | M | 1.00 | % | Morgan Stanley Capital Services LLC | 635 USD | (1 | ) | ||||||||||||||
Hubei Donper Electromechanical Group Co., Ltd. | 03/05/25 | M | 4.98 | % | JPMorgan Chase Bank, N.A. | 13,181 USD | (562 | ) | ||||||||||||||
Hubei Energy Group Co., Ltd. | 03/11/25 | M | 4.98 | % | JPMorgan Chase Bank, N.A. | 38,523 USD | (1,036 | ) | ||||||||||||||
Hubei Huitian New Materials Co., Ltd. | 04/02/25 | M | 1.00 | % | JPMorgan Chase Bank, N.A. | 6,652 USD | 2 | |||||||||||||||
Hubei Huitian New Materials Co., Ltd. | 01/15/25 | M | 1.00 | % | Morgan Stanley Capital Services LLC | 36,357 USD | 133 | |||||||||||||||
Hubei Jumpcan Pharmaceutical Co., Ltd. | 03/26/25 | M | 1.00 | % | JPMorgan Chase Bank, N.A. | 686,918 USD | 13,493 | |||||||||||||||
Hubei Jumpcan Pharmaceutical Co., Ltd. | 01/15/25 | M | 1.00 | % | Morgan Stanley Capital Services LLC | 395,198 USD | 8,056 | |||||||||||||||
Hubei Kailong Chemical Group Co., Ltd. | 01/15/25 | M | 1.00 | % | Morgan Stanley Capital Services LLC | 16,961 USD | (420 | ) | ||||||||||||||
Hubei Zhenhua Chemical Co., Ltd. | 03/19/25 | M | 5.16 | % | JPMorgan Chase Bank, N.A. | 339,303 USD | (17,794 | ) | ||||||||||||||
Hubei Zhenhua Chemical Co., Ltd. | 01/15/25 | M | 3.48 | % | Morgan Stanley Capital Services LLC | 180,991 USD | (10,077 | ) | ||||||||||||||
Huida Sanitary Ware Co., Ltd. | 03/12/25 | M | 1.00 | % | JPMorgan Chase Bank, N.A. | 9,403 USD | (248 | ) | ||||||||||||||
Hunan Corun New Energy Co., Ltd. | 03/31/25 | M | 1.00 | % | JPMorgan Chase Bank, N.A. | 345,944 USD | 2,897 | |||||||||||||||
Hunan Corun New Energy Co., Ltd. | 01/15/25 | M | 1.00 | % | Morgan Stanley Capital Services LLC | 188,751 USD | 1,266 | |||||||||||||||
Hunan Heshun Petroleum Co., Ltd. | 09/10/24 | M | 5.22 | % | JPMorgan Chase Bank, N.A. | 204 USD | (2 | ) | ||||||||||||||
Hunan Investment Group Co., Ltd. | 03/19/25 | M | 5.16 | % | JPMorgan Chase Bank, N.A. | 49,683 USD | (1,905 | ) | ||||||||||||||
Hunan Investment Group Co., Ltd. | 01/15/25 | M | 1.00 | % | Morgan Stanley Capital Services LLC | 1,674 USD | 2 | |||||||||||||||
Hunan Jiudian Pharmaceutical Co., Ltd. | 04/02/25 | M | 1.00 | % | JPMorgan Chase Bank, N.A. | 131,648 USD | 1,054 | |||||||||||||||
Hunan Jiudian Pharmaceutical Co., Ltd. | 01/15/25 | M | 1.38 | % | Morgan Stanley Capital Services LLC | 76,735 USD | 743 | |||||||||||||||
Hunan Valin Steel Co., Ltd. | 02/19/25 | M | 4.97 | % | JPMorgan Chase Bank, N.A. | 60,328 USD | 463 | |||||||||||||||
Hunan Xiangjia Animal Husbandry Co., Ltd. | 04/02/25 | M | 1.00 | % | JPMorgan Chase Bank, N.A. | 15,611 USD | 141 | |||||||||||||||
See Notes to Consolidated Financial Statements.
204
Table of Contents
Blackstone Alternative Multi-Strategy Fund and Subsidiaries
Consolidated Schedule of Investments ^ (Continued)
March 31, 2023
Reference Instrument | Termination Date | Payment Frequency | Financing Rate | Counterparty | Notional Amount | Unrealized Appreciation (Depreciation) | ||||||||||||||||
Hunan Xiangjia Animal Husbandry Co., Ltd. | 01/15/25 | M | 4.83 | % | Morgan Stanley Capital Services LLC | 6,842 USD | $ | 89 | ||||||||||||||
Hunan Yussen Energy Technology Co., Ltd. | 03/26/25 | M | 5.22 | % | JPMorgan Chase Bank, N.A. | 326,907 USD | (1,024 | ) | ||||||||||||||
Hunan Yussen Energy Technology Co., Ltd. | 01/15/25 | M | 1.00 | % | Morgan Stanley Capital Services LLC | 165,523 USD | (1,149 | ) | ||||||||||||||
Hundsun Technologies, Inc. | 02/11/25 | M | 5.03 | % | JPMorgan Chase Bank, N.A. | 109,275 USD | 18,512 | |||||||||||||||
HVSEN Biotechnology Co., Ltd. | 01/15/25 | M | 1.00 | % | Morgan Stanley Capital Services LLC | 7,378 USD | (34 | ) | ||||||||||||||
HVSEN Biotechnology Co., Ltd. | 02/19/25 | M | 5.18 | % | JPMorgan Chase Bank, N.A. | 202,217 USD | 3,412 | |||||||||||||||
IFE Elevators Co., Ltd. | 01/15/25 | M | 1.00 | % | Morgan Stanley Capital Services LLC | 76,978 USD | (1,545 | ) | ||||||||||||||
IFE Elevators Co., Ltd. | 03/26/25 | M | 5.22 | % | JPMorgan Chase Bank, N.A. | 176,559 USD | (3,161 | ) | ||||||||||||||
IKD Co., Ltd. | 04/02/25 | M | 1.00 | % | JPMorgan Chase Bank, N.A. | 37,240 USD | 58 | |||||||||||||||
Infund Holding Co., Ltd. | 04/02/25 | M | 1.00 | % | JPMorgan Chase Bank, N.A. | 59,965 USD | 848 | |||||||||||||||
Infund Holding Co., Ltd. | 01/15/25 | M | 1.00 | % | Morgan Stanley Capital Services LLC | 25,754 USD | 282 | |||||||||||||||
Inner Mongolia Furui Medical Science Co., Ltd. | 03/19/25 | M | 5.00 | % | JPMorgan Chase Bank, N.A. | 25,019 USD | (1,288 | ) | ||||||||||||||
Inner Mongolia Furui Medical Science Co., Ltd. | 03/03/25 | M | 4.97 | % | JPMorgan Chase Bank, N.A. | 34,852 USD | (1,962 | ) | ||||||||||||||
Inner Mongolia Yuan Xing Energy Co., Ltd. | 04/02/25 | M | 1.00 | % | JPMorgan Chase Bank, N.A. | 16,979 USD | (886 | ) | ||||||||||||||
Inner Mongolia Yuan Xing Energy Co., Ltd. | 01/15/25 | M | 1.00 | % | Morgan Stanley Capital Services LLC | 63,932 USD | (3,833 | ) | ||||||||||||||
Innovation New Material Technology Co., Ltd. | 01/15/25 | M | 4.83 | % | Morgan Stanley Capital Services LLC | 113,702 USD | 4,469 | |||||||||||||||
Innovation New Material Technology Co., Ltd. | 03/26/25 | M | 5.22 | % | JPMorgan Chase Bank, N.A. | 82,460 USD | 1,357 | |||||||||||||||
Innovation New Material Technology Co., Ltd. | 01/15/25 | M | 1.00 | % | Morgan Stanley Capital Services LLC | 48,230 USD | 783 | |||||||||||||||
Innovation New Material Technology Co., Ltd. | 02/06/25 | M | 1.00 | % | JPMorgan Chase Bank, N.A. | 293,728 USD | 11,592 | |||||||||||||||
Innuovo Technology Co., Ltd. | 02/19/25 | M | 4.97 | % | JPMorgan Chase Bank, N.A. | 37,116 USD | (304 | ) | ||||||||||||||
Innuovo Technology Co., Ltd. | 01/15/25 | M | 3.48 | % | Morgan Stanley Capital Services LLC | 107,004 USD | (882 | ) | ||||||||||||||
Insigma Technology Co., Ltd. | 01/15/25 | M | 1.00 | % | Morgan Stanley Capital Services LLC | 17 USD | 1 | |||||||||||||||
Intco Medical Technology Co., Ltd. | 04/02/25 | M | 5.22 | % | JPMorgan Chase Bank, N.A. | 38,448 USD | (499 | ) | ||||||||||||||
iRobot Corp. | 08/07/24 | M | 5.07 | % | JPMorgan Chase Bank, N.A. | 1,306,107 USD | (6,551 | ) | ||||||||||||||
iShares Russell 2000 ETF | 03/19/25 | M | 1.00 | % | Goldman Sachs International | 45,576,583 USD | 451,509 | |||||||||||||||
J.P. Morgan Equity Index Swap — JPOSSVV1 | 08/23/23 | T | 1.00 | % | JPMorgan Chase Bank, N.A. | 6,645,527 USD | (241,459 | ) | ||||||||||||||
JA Solar Technology Co., Ltd. | 04/02/25 | M | 1.00 | % | JPMorgan Chase Bank, N.A. | 113,660 USD | 2,324 | |||||||||||||||
Jack Technology Co., Ltd. | 01/15/25 | M | 1.00 | % | Morgan Stanley Capital Services LLC | 9,591 USD | 33 | |||||||||||||||
See Notes to Consolidated Financial Statements.
205
Table of Contents
Blackstone Alternative Multi-Strategy Fund and Subsidiaries
Consolidated Schedule of Investments ^ (Continued)
March 31, 2023
Reference Instrument | Termination Date | Payment Frequency | Financing Rate | Counterparty | Notional Amount | Unrealized Appreciation (Depreciation) | ||||||||||||||||
Jade Bird Fire Co., Ltd. | 01/15/25 | M | 1.00 | % | Morgan Stanley Capital Services LLC | 198,440 USD | $ | (6,387 | ) | |||||||||||||
Jangho Group Co., Ltd. | 03/17/25 | M | 1.00 | % | JPMorgan Chase Bank, N.A. | 364,619 USD | (16,614 | ) | ||||||||||||||
Jangho Group Co., Ltd. | 01/15/25 | M | 1.00 | % | Morgan Stanley Capital Services LLC | 123,165 USD | (5,635 | ) | ||||||||||||||
JDE Peet’s NV | 02/12/25 | M | 0.92 | % | Morgan Stanley Capital Services LLC | 31,341 EUR | 885 | |||||||||||||||
Jiangling Motors Corp. Ltd. | 02/06/25 | M | 5.00 | % | JPMorgan Chase Bank, N.A. | 181,636 USD | (766 | ) | ||||||||||||||
Jiangsu Aidea Pharmaceutical Co., Ltd. | 01/15/25 | M | 4.83 | % | Morgan Stanley Capital Services LLC | 259 USD | (10 | ) | ||||||||||||||
Jiangsu Aidea Pharmaceutical Co., Ltd. | 04/02/25 | M | 1.00 | % | JPMorgan Chase Bank, N.A. | 7,253 USD | 109 | |||||||||||||||
Jiangsu Asia-Pacific Light Alloy Technology Co., Ltd. | 01/15/25 | M | 4.83 | % | Morgan Stanley Capital Services LLC | 135,907 USD | (3,482 | ) | ||||||||||||||
Jiangsu Asia-Pacific Light Alloy Technology Co., Ltd. | 03/26/25 | M | 5.22 | % | JPMorgan Chase Bank, N.A. | 5,338 USD | (66 | ) | ||||||||||||||
Jiangsu Asia-Pacific Light Alloy Technology Co., Ltd. | 01/15/25 | M | 1.00 | % | Morgan Stanley Capital Services LLC | 9,243 USD | 6 | |||||||||||||||
Jiangsu Asia-Pacific Light Alloy Technology Co., Ltd. | 12/26/24 | M | 4.97 | % | JPMorgan Chase Bank, N.A. | 293,593 USD | (7,478 | ) | ||||||||||||||
Jiangsu Bojun Industrial Technology Co., Ltd. | 03/17/25 | M | 5.06 | % | JPMorgan Chase Bank, N.A. | 380,113 USD | 80,503 | |||||||||||||||
Jiangsu Bojun Industrial Technology Co., Ltd. | 01/15/25 | M | 4.83 | % | Morgan Stanley Capital Services LLC | 159,273 USD | 34,004 | |||||||||||||||
Jiangsu Changbao Steeltube Co., Ltd. | 03/17/25 | M | 5.14 | % | JPMorgan Chase Bank, N.A. | 159,057 USD | (1,475 | ) | ||||||||||||||
Jiangsu Changbao Steeltube Co., Ltd. | 01/15/25 | M | 1.00 | % | Morgan Stanley Capital Services LLC | 58,693 USD | (831 | ) | ||||||||||||||
Jiangsu Changbao Steeltube Co., Ltd. | 01/15/25 | M | 4.83 | % | Morgan Stanley Capital Services LLC | 175,210 USD | (12,310 | ) | ||||||||||||||
Jiangsu Changbao Steeltube Co., Ltd. | 11/13/24 | M | 4.97 | % | JPMorgan Chase Bank, N.A. | 487,033 USD | (34,149 | ) | ||||||||||||||
Jiangsu Changhai Composite Materials Co., Ltd. | 04/02/25 | M | 5.22 | % | JPMorgan Chase Bank, N.A. | 177,217 USD | 3,821 | |||||||||||||||
Jiangsu Changhai Composite Materials Co., Ltd. | 01/15/25 | M | 1.81 | % | Morgan Stanley Capital Services LLC | 119,586 USD | 2,423 | |||||||||||||||
Jiangsu Changqing Agrochemical Co., Ltd. | 04/02/25 | M | 5.22 | % | JPMorgan Chase Bank, N.A. | 25,182 USD | 26 | |||||||||||||||
Jiangsu Changqing Agrochemical Co., Ltd. | 01/15/25 | M | 1.00 | % | Morgan Stanley Capital Services LLC | 4,497 USD | (10 | ) | ||||||||||||||
Jiangsu Changshu Automotive Trim Group Co., Ltd. | 04/02/25 | M | 5.22 | % | JPMorgan Chase Bank, N.A. | 12,735 USD | 1 | |||||||||||||||
Jiangsu Changshu Automotive Trim Group Co., Ltd. | 01/15/25 | M | 1.00 | % | Morgan Stanley Capital Services LLC | 82,830 USD | 667 | |||||||||||||||
Jiangsu Etern Co., Ltd. | 03/24/25 | M | 1.00 | % | JPMorgan Chase Bank, N.A. | 97,082 USD | 858 | |||||||||||||||
See Notes to Consolidated Financial Statements.
206
Table of Contents
Blackstone Alternative Multi-Strategy Fund and Subsidiaries
Consolidated Schedule of Investments ^ (Continued)
March 31, 2023
Reference Instrument | Termination Date | Payment Frequency | Financing Rate | Counterparty | Notional Amount | Unrealized Appreciation (Depreciation) | ||||||||||||||||
Jiangsu Expressway Co., Ltd. | 03/10/25 | M | 5.19 | % | JPMorgan Chase Bank, N.A. | 2,783 USD | $ | (110 | ) | |||||||||||||
Jiangsu Expressway Co., Ltd. | 01/15/25 | M | 3.48 | % | Morgan Stanley Capital Services LLC | 14,301 USD | (692 | ) | ||||||||||||||
Jiangsu Guoxin Corp. Ltd. | 01/22/25 | M | 4.97 | % | JPMorgan Chase Bank, N.A. | 5,882 USD | (243 | ) | ||||||||||||||
Jiangsu Huaxin New Material Co., Ltd. | 04/02/25 | M | 5.22 | % | JPMorgan Chase Bank, N.A. | 42,849 USD | (33 | ) | ||||||||||||||
Jiangsu Huaxin New Material Co., Ltd. | 01/15/25 | M | 1.00 | % | Morgan Stanley Capital Services LLC | 5,693 USD | 1 | |||||||||||||||
Jiangsu Jiangyin Rural Commercial Bank Co., Ltd. | 03/12/25 | M | 4.97 | % | JPMorgan Chase Bank, N.A. | 278,944 USD | (7,790 | ) | ||||||||||||||
Jiangsu Jiangyin Rural Commercial Bank Co., Ltd. | 01/15/25 | M | 1.00 | % | Morgan Stanley Capital Services LLC | 176,856 USD | (4,700 | ) | ||||||||||||||
Jiangsu Kanion Pharmaceutical Co., Ltd. | 01/15/25 | M | 1.81 | % | Morgan Stanley Capital Services LLC | 47,067 USD | 5,137 | |||||||||||||||
Jiangsu Libert, Inc. | 03/24/25 | M | 1.00 | % | JPMorgan Chase Bank, N.A. | 138,117 USD | (1,218 | ) | ||||||||||||||
Jiangsu Libert, Inc. | 01/15/25 | M | 1.00 | % | Morgan Stanley Capital Services LLC | 23,055 USD | (280 | ) | ||||||||||||||
Jiangsu Lihua Animal Husbandry Stock Co., Ltd. | 04/02/25 | M | 1.00 | % | JPMorgan Chase Bank, N.A. | 101,592 USD | (195 | ) | ||||||||||||||
Jiangsu New Energy Development Co., Ltd. | 03/12/25 | M | 4.97 | % | JPMorgan Chase Bank, N.A. | 78,108 USD | (1,368 | ) | ||||||||||||||
Jiangsu New Energy Development Co., Ltd. | 03/19/25 | M | 5.13 | % | JPMorgan Chase Bank, N.A. | 18,509 USD | (177 | ) | ||||||||||||||
Jiangsu Olive Sensors High-Tech Co., Ltd. | 03/18/25 | M | 5.19 | % | JPMorgan Chase Bank, N.A. | 14,847 USD | 235 | |||||||||||||||
Jiangsu Rainbow Heavy Industries Co., Ltd. | 03/26/25 | M | 5.22 | % | JPMorgan Chase Bank, N.A. | 169,586 USD | (5,086 | ) | ||||||||||||||
Jiangsu Rainbow Heavy Industries Co., Ltd. | 01/15/25 | M | 1.00 | % | Morgan Stanley Capital Services LLC | 51,390 USD | (1,705 | ) | ||||||||||||||
Jiangsu Rijiu Optoelectronics Jointstock Co., Ltd. | 04/02/25 | M | 5.22 | % | JPMorgan Chase Bank, N.A. | 42,503 USD | 126 | |||||||||||||||
Jiangsu Rijiu Optoelectronics Jointstock Co., Ltd. | 01/15/25 | M | 1.00 | % | Morgan Stanley Capital Services LLC | 1,401 USD | 11 | |||||||||||||||
Jiangsu SINOJIT Wind Energy Technology Co., Ltd. | 03/31/25 | M | 5.22 | % | JPMorgan Chase Bank, N.A. | 29,441 USD | 70 | |||||||||||||||
Jiangsu SINOJIT Wind Energy Technology Co., Ltd. | 01/15/25 | M | 4.83 | % | Morgan Stanley Capital Services LLC | 22,509 USD | (157 | ) | ||||||||||||||
Jiangsu Sopo Chemical Co. | 04/02/25 | M | 1.00 | % | JPMorgan Chase Bank, N.A. | 11,909 USD | 9 | |||||||||||||||
Jiangsu Sopo Chemical Co. | 01/15/25 | M | 1.00 | % | Morgan Stanley Capital Services LLC | 10,200 USD | 50 | |||||||||||||||
Jiangsu Transimage Technology Co., Ltd. | 03/18/25 | M | 4.99 | % | JPMorgan Chase Bank, N.A. | 349,993 USD | 7,510 | |||||||||||||||
Jiangsu Transimage Technology Co., Ltd. | 01/15/25 | M | 1.00 | % | Morgan Stanley Capital Services LLC | 218,784 USD | 4,480 | |||||||||||||||
See Notes to Consolidated Financial Statements.
207
Table of Contents
Blackstone Alternative Multi-Strategy Fund and Subsidiaries
Consolidated Schedule of Investments ^ (Continued)
March 31, 2023
Reference Instrument | Termination Date | Payment Frequency | Financing Rate | Counterparty | Notional Amount | Unrealized Appreciation (Depreciation) | ||||||||||||||||
Jiangsu Wujin Stainless Steel Pipe Group Co., Ltd. | 01/15/25 | M | 1.00 | % | Morgan Stanley Capital Services LLC | 126,623 USD | $ | 1,905 | ||||||||||||||
Jiangsu Wujin Stainless Steel Pipe Group Co., Ltd. | 02/26/25 | M | 1.00 | % | JPMorgan Chase Bank, N.A. | 231,449 USD | 4,030 | |||||||||||||||
JiangSu WuZhong Pharmaceutical Development Co., Ltd. | 01/15/25 | M | 4.83 | % | Morgan Stanley Capital Services LLC | 1 USD | — | |||||||||||||||
Jiangsu Xiehe Electronic Co., Ltd. | 04/02/25 | M | 1.00 | % | JPMorgan Chase Bank, N.A. | 8,596 USD | 39 | |||||||||||||||
Jiangsu Xinquan Automotive Trim Co., Ltd. | 03/17/25 | M | 1.00 | % | JPMorgan Chase Bank, N.A. | 36,712 USD | 4,434 | |||||||||||||||
Jiangsu Xinquan Automotive Trim Co., Ltd. | 01/15/25 | M | 1.00 | % | Morgan Stanley Capital Services LLC | 151,594 USD | 14,889 | |||||||||||||||
Jiangsu Yinhe Electronics Co., Ltd. | 03/19/25 | M | 4.97 | % | JPMorgan Chase Bank, N.A. | 127,927 USD | (102 | ) | ||||||||||||||
Jiangsu Yinhe Electronics Co., Ltd. | 01/15/25 | M | 1.00 | % | Morgan Stanley Capital Services LLC | 72,540 USD | 241 | |||||||||||||||
Jiangsu Yoke Technology Co., Ltd. | 04/02/25 | M | 5.22 | % | JPMorgan Chase Bank, N.A. | 67,104 USD | (385 | ) | ||||||||||||||
Jiangsu Yuxing Film Technology Co., Ltd. | 01/15/25 | M | 1.00 | % | Morgan Stanley Capital Services LLC | 1,758 USD | 2 | |||||||||||||||
Jiangsu Zhangjiagang Rural Commercial Bank Co., Ltd. | 03/18/25 | M | 4.98 | % | JPMorgan Chase Bank, N.A. | 313,729 USD | (8,559 | ) | ||||||||||||||
Jiangsu Zhangjiagang Rural Commercial Bank Co., Ltd. | 01/15/25 | M | 3.48 | % | Morgan Stanley Capital Services LLC | 147,713 USD | (3,961 | ) | ||||||||||||||
Jiangxi Hongcheng Environment Co., Ltd. | 04/02/25 | M | 5.22 | % | JPMorgan Chase Bank, N.A. | 29,008 USD | 79 | |||||||||||||||
Jiangxi Hongcheng Environment Co., Ltd. | 01/15/25 | M | 1.00 | % | Morgan Stanley Capital Services LLC | 13,558 USD | 44 | |||||||||||||||
Jiangyin Electrical Alloy Co., Ltd. | 04/02/25 | M | 5.22 | % | JPMorgan Chase Bank, N.A. | 156 USD | (1 | ) | ||||||||||||||
Jiangyin Haida Rubber & Plastic Co., Ltd. | 03/19/25 | M | 1.00 | % | JPMorgan Chase Bank, N.A. | 159,568 USD | (5,891 | ) | ||||||||||||||
Jiangyin Haida Rubber & Plastic Co., Ltd. | 01/15/25 | M | 1.00 | % | Morgan Stanley Capital Services LLC | 60,237 USD | (2,085 | ) | ||||||||||||||
Jiangyin Hengrun Heavy Industries Co., Ltd. | 03/25/25 | M | 5.15 | % | JPMorgan Chase Bank, N.A. | 33,754 USD | 595 | |||||||||||||||
Jiangyin Pivot Automotive Products Co., Ltd. | 01/15/25 | M | 1.00 | % | Morgan Stanley Capital Services LLC | 14,925 USD | 372 | |||||||||||||||
Jiangzhong Pharmaceutical Co., Ltd. | 01/15/25 | M | 1.00 | % | Morgan Stanley Capital Services LLC | 202 USD | 16 | |||||||||||||||
Jianmin Pharmaceutical Group Co., Ltd. | 01/15/25 | M | 4.83 | % | Morgan Stanley Capital Services LLC | 317 USD | 17 | |||||||||||||||
Jiayou International Logistics Co., Ltd. | 04/02/25 | M | 1.00 | % | JPMorgan Chase Bank, N.A. | 224,851 USD | 2,707 | |||||||||||||||
Jiayou International Logistics Co., Ltd. | 01/15/25 | M | 1.38 | % | Morgan Stanley Capital Services LLC | 130,685 USD | 1,705 | |||||||||||||||
Jihua Group Corp., Ltd. | 01/15/25 | M | 1.00 | % | Morgan Stanley Capital Services LLC | 48,884 USD | 375 | |||||||||||||||
See Notes to Consolidated Financial Statements.
208
Table of Contents
Blackstone Alternative Multi-Strategy Fund and Subsidiaries
Consolidated Schedule of Investments ^ (Continued)
March 31, 2023
Reference Instrument | Termination Date | Payment Frequency | Financing Rate | Counterparty | Notional Amount | Unrealized Appreciation (Depreciation) | ||||||||||||||||
Jilin Chemical Fibre | 02/19/25 | M | 1.00 | % | JPMorgan Chase Bank, N.A. | 4,638 USD | $ | (51 | ) | |||||||||||||
Jilin Expressway Co., Ltd. | 03/26/25 | M | 5.22 | % | JPMorgan Chase Bank, N.A. | 113,188 USD | (2,714 | ) | ||||||||||||||
Jilin Expressway Co., Ltd. | 01/15/25 | M | 1.00 | % | Morgan Stanley Capital Services LLC | 8,670 USD | (14 | ) | ||||||||||||||
Jilin Jian Yisheng Pharmaceutical Co., Ltd. | 03/12/25 | M | 4.97 | % | JPMorgan Chase Bank, N.A. | 24,055 USD | (245 | ) | ||||||||||||||
Jilin University Zhengyuan Information Technologies Co., Ltd. | 03/26/25 | M | 5.22 | % | JPMorgan Chase Bank, N.A. | 567,221 USD | (24,156 | ) | ||||||||||||||
Jilin University Zhengyuan Information Technologies Co., Ltd. | 01/15/25 | M | 1.00 | % | Morgan Stanley Capital Services LLC | 295,526 USD | (12,957 | ) | ||||||||||||||
Jinan Shengquan Group Share Holding Co., Ltd. | 03/31/25 | M | 1.00 | % | JPMorgan Chase Bank, N.A. | 583,719 USD | 5,746 | |||||||||||||||
Jinan Shengquan Group Share Holding Co., Ltd. | 01/15/25 | M | 1.00 | % | Morgan Stanley Capital Services LLC | 367,849 USD | 2,278 | |||||||||||||||
Jinduicheng Molybdenum Co., Ltd. | 02/19/25 | M | 4.97 | % | JPMorgan Chase Bank, N.A. | 57,601 USD | (250 | ) | ||||||||||||||
Jinduicheng Molybdenum Co., Ltd. | 03/17/25 | M | 5.03 | % | JPMorgan Chase Bank, N.A. | 8,476 USD | 8 | |||||||||||||||
Jinduicheng Molybdenum Co., Ltd. | 01/15/25 | M | 4.83 | % | Morgan Stanley Capital Services LLC | 167 USD | (1 | ) | ||||||||||||||
JinFu Technology Co., Ltd. | 03/18/25 | M | 5.22 | % | JPMorgan Chase Bank, N.A. | 1,207 USD | (93 | ) | ||||||||||||||
Jinhong Gas Co., Ltd. | 03/31/25 | M | 1.00 | % | JPMorgan Chase Bank, N.A. | 461,621 USD | 5,026 | |||||||||||||||
Jinhong Gas Co., Ltd. | 01/15/25 | M | 1.00 | % | Morgan Stanley Capital Services LLC | 280,175 USD | 3,724 | |||||||||||||||
Jinko Solar Co., Ltd. | 04/02/25 | M | 1.00 | % | JPMorgan Chase Bank, N.A. | 163,616 USD | (231 | ) | ||||||||||||||
Jinko Solar Co., Ltd. | 01/15/25 | M | 1.00 | % | Morgan Stanley Capital Services LLC | 38,594 USD | (79 | ) | ||||||||||||||
Jinlei Technology Co., Ltd. | 03/31/25 | M | 5.22 | % | JPMorgan Chase Bank, N.A. | 465,932 USD | 2,974 | |||||||||||||||
Jinlei Technology Co., Ltd. | 01/15/25 | M | 1.00 | % | Morgan Stanley Capital Services LLC | 322,043 USD | 3,817 | |||||||||||||||
Jinling Hotel Corp. Ltd. | 03/19/25 | M | 1.00 | % | JPMorgan Chase Bank, N.A. | 265,251 USD | (1,213 | ) | ||||||||||||||
Jinling Hotel Corp. Ltd. | 01/15/25 | M | 4.80 | % | Morgan Stanley Capital Services LLC | 109,073 USD | (583 | ) | ||||||||||||||
JinXianDai Information Industry Co., Ltd. | 04/02/25 | M | 5.22 | % | JPMorgan Chase Bank, N.A. | 496,517 USD | 3,574 | |||||||||||||||
JinXianDai Information Industry Co., Ltd. | 01/15/25 | M | 1.00 | % | Morgan Stanley Capital Services LLC | 352,271 USD | 2,531 | |||||||||||||||
Jinzhou Jixiang Molybdenum Co., Ltd. | 01/15/25 | M | 4.72 | % | Morgan Stanley Capital Services LLC | 46,966 USD | (720 | ) | ||||||||||||||
Jinzhou Jixiang Molybdenum Co., Ltd. | 03/17/25 | M | 1.00 | % | JPMorgan Chase Bank, N.A. | 41,252 USD | (345 | ) | ||||||||||||||
Jinzhou Jixiang Molybdenum Co., Ltd. | 01/15/25 | M | 1.00 | % | Morgan Stanley Capital Services LLC | 52,136 USD | (360 | ) | ||||||||||||||
Joincare Pharmaceutical Group Industry Co., Ltd. | 04/02/25 | M | 1.00 | % | JPMorgan Chase Bank, N.A. | 641,173 USD | 9,599 | |||||||||||||||
Joincare Pharmaceutical Group Industry Co., Ltd. | 01/15/25 | M | 1.00 | % | Morgan Stanley Capital Services LLC | 375,860 USD | 7,634 | |||||||||||||||
Joinn Laboratories China Co., Ltd. | 01/15/25 | M | 1.00 | % | Morgan Stanley Capital Services LLC | 319,227 USD | (10,333 | ) | ||||||||||||||
See Notes to Consolidated Financial Statements.
209
Table of Contents
Blackstone Alternative Multi-Strategy Fund and Subsidiaries
Consolidated Schedule of Investments ^ (Continued)
March 31, 2023
Reference Instrument | Termination Date | Payment Frequency | Financing Rate | Counterparty | Notional Amount | Unrealized Appreciation (Depreciation) | ||||||||||||||||
Joinn Laboratories China Co., Ltd. | 11/04/24 | M | 1.00 | % | JPMorgan Chase Bank, N.A. | 878,095 USD | $ | (30,366 | ) | |||||||||||||
Jointo Energy Investment Co., Ltd. Hebei | 01/15/25 | M | 1.00 | % | Morgan Stanley Capital Services LLC | 43,024 USD | (3,163 | ) | ||||||||||||||
Jointo Energy Investment Co., Ltd. Hebei | 12/11/24 | M | 5.08 | % | JPMorgan Chase Bank, N.A. | 45,200 USD | (645 | ) | ||||||||||||||
Joyoung Co., Ltd. | 01/15/25 | M | 3.19 | % | Morgan Stanley Capital Services LLC | 174,012 USD | 4,618 | |||||||||||||||
Joyvio Food Co., Ltd. | 04/02/25 | M | 1.00 | % | JPMorgan Chase Bank, N.A. | 71,633 USD | (580 | ) | ||||||||||||||
Joyvio Food Co., Ltd. | 01/15/25 | M | 4.83 | % | Morgan Stanley Capital Services LLC | 37,030 USD | (207 | ) | ||||||||||||||
Juewei Food Co., Ltd. | 03/12/25 | M | 4.98 | % | JPMorgan Chase Bank, N.A. | 68,290 USD | (1,349 | ) | ||||||||||||||
Kailuan Energy Chemical Co., Ltd. | 03/19/25 | M | 1.00 | % | JPMorgan Chase Bank, N.A. | 389,298 USD | (8,294 | ) | ||||||||||||||
Kailuan Energy Chemical Co., Ltd. | 01/15/25 | M | 1.00 | % | Morgan Stanley Capital Services LLC | 151,952 USD | (3,959 | ) | ||||||||||||||
KAISA JiaYun Technology, Inc. | 02/05/25 | M | 5.07 | % | JPMorgan Chase Bank, N.A. | 426,336 USD | 8,892 | |||||||||||||||
KAISA JiaYun Technology, Inc. | 01/15/25 | M | 4.72 | % | Morgan Stanley Capital Services LLC | 75,346 USD | 1,511 | |||||||||||||||
Kangda New Materials Group Co., Ltd. | 03/31/25 | M | 5.22 | % | JPMorgan Chase Bank, N.A. | 294,216 USD | 3,150 | |||||||||||||||
Kangda New Materials Group Co., Ltd. | 01/15/25 | M | 1.00 | % | Morgan Stanley Capital Services LLC | 204,460 USD | 1,601 | |||||||||||||||
Kangping Technology Suzhou Co., Ltd. | 04/02/25 | M | 1.00 | % | JPMorgan Chase Bank, N.A. | 30,125 USD | 6 | |||||||||||||||
Kangping Technology Suzhou Co., Ltd. | 01/15/25 | M | 1.00 | % | Morgan Stanley Capital Services LLC | 898 USD | (3 | ) | ||||||||||||||
Kewell Technology Co., Ltd. | 01/15/25 | M | 1.00 | % | Morgan Stanley Capital Services LLC | 4,344 USD | (10 | ) | ||||||||||||||
Kuaijishan Shaoxing Wine Co., Ltd. | 03/19/25 | M | 1.00 | % | JPMorgan Chase Bank, N.A. | 12,647 USD | 117 | |||||||||||||||
Kuaijishan Shaoxing Wine Co., Ltd. | 01/15/25 | M | 1.00 | % | Morgan Stanley Capital Services LLC | 41,002 USD | 571 | |||||||||||||||
Kunwu Jiuding Investment Holdings Co., Ltd. | 03/26/25 | M | 1.00 | % | JPMorgan Chase Bank, N.A. | 302,106 USD | (25 | ) | ||||||||||||||
Kunwu Jiuding Investment Holdings Co., Ltd. | 01/15/25 | M | 1.00 | % | Morgan Stanley Capital Services LLC | 64,753 USD | 110 | |||||||||||||||
Lakeland Bancorp, Inc. | 10/01/24 | M | 5.07 | % | JPMorgan Chase Bank, N.A. | 370,351 USD | (23,300 | ) | ||||||||||||||
Landai Technology Group Corp., Ltd. | 03/19/25 | M | 4.97 | % | JPMorgan Chase Bank, N.A. | 1,612 USD | 10 | |||||||||||||||
Landai Technology Group Corp., Ltd. | 01/15/25 | M | 3.19 | % | Morgan Stanley Capital Services LLC | 6,097 USD | 42 | |||||||||||||||
Lanzhou Huanghe Enterprise Co. | 01/15/25 | M | 1.00 | % | Morgan Stanley Capital Services LLC | 13,570 USD | 155 | |||||||||||||||
Leaguer Shenzhen Microelectronics Corp. | 01/15/25 | M | 4.72 | % | Morgan Stanley Capital Services LLC | 879 USD | 2 | |||||||||||||||
Leedarson IoT Technology, Inc. | 01/15/25 | M | 4.72 | % | Morgan Stanley Capital Services LLC | 6,324 USD | 325 | |||||||||||||||
Leedarson IoT Technology, Inc. | 02/06/25 | M | 5.01 | % | JPMorgan Chase Bank, N.A. | 117,239 USD | 4,892 | |||||||||||||||
Lens Technology Co., Ltd. | 02/18/25 | M | 5.08 | % | JPMorgan Chase Bank, N.A. | 124,858 USD | 769 | |||||||||||||||
See Notes to Consolidated Financial Statements.
210
Table of Contents
Blackstone Alternative Multi-Strategy Fund and Subsidiaries
Consolidated Schedule of Investments ^ (Continued)
March 31, 2023
Reference Instrument | Termination Date | Payment Frequency | Financing Rate | Counterparty | Notional Amount | Unrealized Appreciation (Depreciation) | ||||||||||||||||
Lens Technology Co., Ltd. | 01/15/25 | M | 4.83 | % | Morgan Stanley Capital Services LLC | 73 USD | $ | 6 | ||||||||||||||
Leyard Optoelectronic Co., Ltd. | 01/15/25 | M | 2.82 | % | Morgan Stanley Capital Services LLC | 81,230 USD | (464 | ) | ||||||||||||||
Lianhe Chemical Technology Co., Ltd. | 01/22/25 | M | 4.97 | % | JPMorgan Chase Bank, N.A. | 162,525 USD | (5,670 | ) | ||||||||||||||
Lianhe Chemical Technology Co., Ltd. | 01/15/25 | M | 4.83 | % | Morgan Stanley Capital Services LLC | 6 USD | — | |||||||||||||||
Liaoning Cheng Da Co., Ltd. | 01/15/25 | M | 1.00 | % | Morgan Stanley Capital Services LLC | 18,970 USD | (23 | ) | ||||||||||||||
Lier Chemical Co., Ltd. | 01/15/25 | M | 4.83 | % | Morgan Stanley Capital Services LLC | 198 USD | (3 | ) | ||||||||||||||
Lifan Technology Group Co., Ltd. | 04/02/25 | M | 1.00 | % | JPMorgan Chase Bank, N.A. | 41,417 USD | 110 | |||||||||||||||
Lifan Technology Group Co., Ltd. | 01/15/25 | M | 1.00 | % | Morgan Stanley Capital Services LLC | 19,687 USD | 51 | |||||||||||||||
Lijiang Yulong Tourism Co., Ltd. | 03/19/25 | M | 5.18 | % | JPMorgan Chase Bank, N.A. | 544,153 USD | 11,990 | |||||||||||||||
Lijiang Yulong Tourism Co., Ltd. | 01/15/25 | M | 1.00 | % | Morgan Stanley Capital Services LLC | 284,125 USD | 5,814 | |||||||||||||||
Lijiang Yulong Tourism Co., Ltd. | 03/05/25 | M | 4.97 | % | JPMorgan Chase Bank, N.A. | 1,417 USD | 26 | |||||||||||||||
Lijiang Yulong Tourism Co., Ltd. | 01/15/25 | M | 4.83 | % | Morgan Stanley Capital Services LLC | 6,032 USD | 110 | |||||||||||||||
Lingyi iTech Guangdong Co. | 11/05/24 | M | 1.00 | % | JPMorgan Chase Bank, N.A. | 109,797 USD | 1,359 | |||||||||||||||
Linkage Software Co., Ltd. | 04/02/25 | M | 5.22 | % | JPMorgan Chase Bank, N.A. | 141,130 USD | 10,127 | |||||||||||||||
Linkage Software Co., Ltd. | 01/15/25 | M | 4.83 | % | Morgan Stanley Capital Services LLC | 117,757 USD | 8,197 | |||||||||||||||
Liuzhou Iron & Steel Co., Ltd. | 03/17/25 | M | 5.04 | % | JPMorgan Chase Bank, N.A. | 39,431 USD | (254 | ) | ||||||||||||||
Liuzhou Iron & Steel Co., Ltd. | 01/15/25 | M | 1.00 | % | Morgan Stanley Capital Services LLC | 123 USD | — | |||||||||||||||
Liuzhou Iron & Steel Co., Ltd. | 02/10/25 | M | 1.00 | % | JPMorgan Chase Bank, N.A. | 150,194 USD | (4,058 | ) | ||||||||||||||
Liuzhou Liangmianzhen Co., Ltd. | 03/19/25 | M | 5.14 | % | JPMorgan Chase Bank, N.A. | 157,490 USD | (2,218 | ) | ||||||||||||||
Liuzhou Liangmianzhen Co., Ltd. | 01/15/25 | M | 4.73 | % | Morgan Stanley Capital Services LLC | 37,481 USD | (1,047 | ) | ||||||||||||||
Livzon Pharmaceutical Group, Inc. | 03/24/25 | M | 5.20 | % | JPMorgan Chase Bank, N.A. | 38,716 USD | 2,625 | |||||||||||||||
Longshine Technology Group Co., Ltd. | 01/15/25 | M | 2.97 | % | Morgan Stanley Capital Services LLC | 64,707 USD | (1,304 | ) | ||||||||||||||
Longshine Technology Group Co., Ltd. | 04/02/25 | M | 5.22 | % | JPMorgan Chase Bank, N.A. | 189,144 USD | 1,844 | |||||||||||||||
Longxing Chemical Industry Co., Ltd. | 04/02/25 | M | 1.00 | % | JPMorgan Chase Bank, N.A. | 46,517 USD | (98 | ) | ||||||||||||||
Longxing Chemical Industry Co., Ltd. | 01/15/25 | M | 1.00 | % | Morgan Stanley Capital Services LLC | 6,547 USD | (4 | ) | ||||||||||||||
Lu Thai Textile Co., Ltd. | 01/15/25 | M | 1.00 | % | Morgan Stanley Capital Services LLC | 112,760 USD | 719 | |||||||||||||||
Lu Thai Textile Co., Ltd. | 03/31/25 | M | 5.22 | % | JPMorgan Chase Bank, N.A. | 243,251 USD | 1,831 | |||||||||||||||
See Notes to Consolidated Financial Statements.
211
Table of Contents
Blackstone Alternative Multi-Strategy Fund and Subsidiaries
Consolidated Schedule of Investments ^ (Continued)
March 31, 2023
Reference Instrument | Termination Date | Payment Frequency | Financing Rate | Counterparty | Notional Amount | Unrealized Appreciation (Depreciation) | ||||||||||||||||
Luoniushan Co., Ltd. | 01/15/25 | M | 1.81 | % | Morgan Stanley Capital Services LLC | 74,234 USD | $ | 2,498 | ||||||||||||||
Luoyang Xinqianglian Slewing Bearing Co., Ltd. | 01/15/25 | M | 3.19 | % | Morgan Stanley Capital Services LLC | 253,957 USD | (19,367 | ) | ||||||||||||||
Luoyang Xinqianglian Slewing Bearing Co., Ltd. | 03/25/25 | M | 5.15 | % | JPMorgan Chase Bank, N.A. | 327,852 USD | (30,559 | ) | ||||||||||||||
Lushang Health Industry Development Co., Ltd. | 01/15/25 | M | 1.00 | % | Morgan Stanley Capital Services LLC | 98,523 USD | 2,109 | |||||||||||||||
Lushang Health Industry Development Co., Ltd. | 03/24/25 | M | 5.00 | % | JPMorgan Chase Bank, N.A. | 16,599 USD | 353 | |||||||||||||||
Luxshare Precision Industry Co., Ltd. | 01/14/25 | M | 4.98 | % | JPMorgan Chase Bank, N.A. | 54,364 USD | 3,858 | |||||||||||||||
Luyin Investment Group Co., Ltd. | 01/15/25 | M | 1.00 | % | Morgan Stanley Capital Services LLC | 21,930 USD | (168 | ) | ||||||||||||||
Luyin Investment Group Co., Ltd. | 12/04/24 | M | 5.06 | % | JPMorgan Chase Bank, N.A. | 208,247 USD | (1,551 | ) | ||||||||||||||
Maanshan Iron & Steel Co., Ltd. | 01/15/25 | M | 1.00 | % | Morgan Stanley Capital Services LLC | 4,746 USD | 74 | |||||||||||||||
Mabwell Shanghai Bioscience Co., Ltd. | 01/15/25 | M | 4.83 | % | Morgan Stanley Capital Services LLC | 5,037 USD | 19 | |||||||||||||||
Mercedes-Benz Group AG | 02/12/25 | M | 0.92 | % | Morgan Stanley Capital Services LLC | 168,163 EUR | 1,547 | |||||||||||||||
Mesnac Co., Ltd. | 03/17/25 | M | 5.21 | % | JPMorgan Chase Bank, N.A. | 378,669 USD | 4,096 | |||||||||||||||
Mesnac Co., Ltd. | 01/15/25 | M | 1.00 | % | Morgan Stanley Capital Services LLC | 162,318 USD | 1,423 | |||||||||||||||
Metallurgical Corp. of China Ltd. | 01/15/25 | M | 2.82 | % | Morgan Stanley Capital Services LLC | 82,575 USD | 2,612 | |||||||||||||||
Minfeng Special Paper Co., Ltd. | 03/26/25 | M | 5.22 | % | JPMorgan Chase Bank, N.A. | 5,598 USD | 1,084 | |||||||||||||||
Minfeng Special Paper Co., Ltd. | 01/15/25 | M | 4.83 | % | Morgan Stanley Capital Services LLC | 158 USD | 32 | |||||||||||||||
Monalisa Group Co., Ltd. | 01/15/25 | M | 3.48 | % | Morgan Stanley Capital Services LLC | 257,286 USD | (25,069 | ) | ||||||||||||||
Monalisa Group Co., Ltd. | 03/12/25 | M | 1.00 | % | JPMorgan Chase Bank, N.A. | 447,285 USD | (44,633 | ) | ||||||||||||||
Moon Environment Technology Co., Ltd. | 03/24/25 | M | 5.10 | % | JPMorgan Chase Bank, N.A. | 601,632 USD | 678 | |||||||||||||||
Moon Environment Technology Co., Ltd. | 01/15/25 | M | 1.00 | % | Morgan Stanley Capital Services LLC | 254,314 USD | 373 | |||||||||||||||
MS Alpha Swap | 03/28/24 | M | 0.00 | % | Morgan Stanley Capital Services LLC | 150,000,000 USD | (322,584 | ) | ||||||||||||||
MS Alpha Swap | 12/27/23 | M | 1.00 | % | Morgan Stanley Capital Services LLC | 118,721,914 USD | 2,591,431 | |||||||||||||||
MS Alpha Swap | 08/14/24 | M | 1.00 | % | Morgan Stanley Capital Services LLC | 406,171 USD | 228 | |||||||||||||||
MS Alpha Swap | 12/28/23 | M | 1.00 | % | Morgan Stanley Capital Services LLC | 130,794,440 USD | 1,248,251 | |||||||||||||||
MYS Group Co., Ltd. | 04/02/25 | M | 1.00 | % | JPMorgan Chase Bank, N.A. | 11,482 USD | 31 | |||||||||||||||
MYS Group Co., Ltd. | 01/15/25 | M | 1.00 | % | Morgan Stanley Capital Services LLC | 11,642 USD | 33 | |||||||||||||||
Nanjing Cosmos Chemical Co., Ltd. | 03/26/25 | M | 5.22 | % | JPMorgan Chase Bank, N.A. | 21,774 USD | (19,618 | ) | ||||||||||||||
Nanjing Cosmos Chemical Co., Ltd. | 01/15/25 | M | 1.00 | % | Morgan Stanley Capital Services LLC | 36,500 USD | 125 | |||||||||||||||
See Notes to Consolidated Financial Statements.
212
Table of Contents
Blackstone Alternative Multi-Strategy Fund and Subsidiaries
Consolidated Schedule of Investments ^ (Continued)
March 31, 2023
Reference Instrument | Termination Date | Payment Frequency | Financing Rate | Counterparty | Notional Amount | Unrealized Appreciation (Depreciation) | ||||||||||||||||
Nanjing Cosmos Chemical Co., Ltd. | 01/15/25 | M | 4.83 | % | Morgan Stanley Capital Services LLC | 380 USD | $ | 9 | ||||||||||||||
Nanjing Cosmos Chemical Co., Ltd. | 12/26/24 | M | 1.00 | % | JPMorgan Chase Bank, N.A. | 6,846 USD | 168 | |||||||||||||||
Nanjing Iron & Steel Co., Ltd. | 03/19/25 | M | 1.00 | % | JPMorgan Chase Bank, N.A. | 16,574 USD | 238 | |||||||||||||||
Nanjing Iron & Steel Co., Ltd. | 01/15/25 | M | 1.00 | % | Morgan Stanley Capital Services LLC | 62,236 USD | 486 | |||||||||||||||
Nanjing OLO Home Furnishing Co., Ltd. | 01/15/25 | M | 1.00 | % | Morgan Stanley Capital Services LLC | 4,730 USD | 9 | |||||||||||||||
Nanjing OLO Home Furnishing Co., Ltd. | 03/26/25 | M | 5.22 | % | JPMorgan Chase Bank, N.A. | 146,790 USD | (9,108 | ) | ||||||||||||||
Nanjing Pharmaceutical Co., Ltd. | 03/19/25 | M | 1.00 | % | JPMorgan Chase Bank, N.A. | 154,180 USD | (5,304 | ) | ||||||||||||||
Nanjing Pharmaceutical Co., Ltd. | 01/15/25 | M | 3.19 | % | Morgan Stanley Capital Services LLC | 107,533 USD | (3,660 | ) | ||||||||||||||
NanJing Public Utilities Development Co., Ltd. | 04/02/25 | M | 1.00 | % | JPMorgan Chase Bank, N.A. | 14,921 USD | 67 | |||||||||||||||
NanJing Public Utilities Development Co., Ltd. | 01/15/25 | M | 1.00 | % | Morgan Stanley Capital Services LLC | 436 USD | — | |||||||||||||||
Nanjing Tanker Corp. | 01/15/25 | M | 1.00 | % | Morgan Stanley Capital Services LLC | 110,633 USD | (8,699 | ) | ||||||||||||||
Nanjing Tanker Corp. | 03/18/25 | M | 5.01 | % | JPMorgan Chase Bank, N.A. | 192,073 USD | (14,838 | ) | ||||||||||||||
Nanjing Tanker Corp. | 01/15/25 | M | 4.83 | % | Morgan Stanley Capital Services LLC | 180,092 USD | (10,869 | ) | ||||||||||||||
Nanjing Tanker Corp. | 02/25/25 | M | 4.97 | % | JPMorgan Chase Bank, N.A. | 79,658 USD | (6,252 | ) | ||||||||||||||
Nanjing Textiles Import & Export Corp., Ltd. | 03/26/25 | M | 5.22 | % | JPMorgan Chase Bank, N.A. | 246,062 USD | 1,243 | |||||||||||||||
Nanjing Textiles Import & Export Corp., Ltd. | 01/15/25 | M | 1.00 | % | Morgan Stanley Capital Services LLC | 8,859 USD | 33 | |||||||||||||||
Nanjing Yunhai Special Metals Co., Ltd. | 01/15/25 | M | 1.81 | % | Morgan Stanley Capital Services LLC | 49,686 USD | (815 | ) | ||||||||||||||
Nanning Department Store Co., Ltd. | 01/15/25 | M | 1.00 | % | Morgan Stanley Capital Services LLC | 2,629 USD | 3 | |||||||||||||||
Nantong Acetic Acid Chemical Co., Ltd. | 01/15/25 | M | 1.00 | % | Morgan Stanley Capital Services LLC | 1,710 USD | (4 | ) | ||||||||||||||
Nantong Jianghai Capacitor Co., Ltd. | 10/16/24 | M | 1.00 | % | JPMorgan Chase Bank, N.A. | 570,788 USD | 2,685 | |||||||||||||||
Nantong Jianghai Capacitor Co., Ltd. | 01/15/25 | M | 1.00 | % | Morgan Stanley Capital Services LLC | 230,929 USD | 1,077 | |||||||||||||||
Nanya New Material Technology Co., Ltd. | 01/15/25 | M | 4.72 | % | Morgan Stanley Capital Services LLC | 515 USD | 40 | |||||||||||||||
NAURA Technology Group Co., Ltd. | 02/19/25 | M | 1.00 | % | JPMorgan Chase Bank, N.A. | 59,439 USD | (1,408 | ) | ||||||||||||||
NBTM New Materials Group Co., Ltd. | 03/17/25 | M | 1.00 | % | JPMorgan Chase Bank, N.A. | 88,875 USD | (2,457 | ) | ||||||||||||||
NBTM New Materials Group Co., Ltd. | 01/15/25 | M | 1.00 | % | Morgan Stanley Capital Services LLC | 4 USD | — | |||||||||||||||
NBTM New Materials Group Co., Ltd. | 09/04/24 | M | 4.97 | % | JPMorgan Chase Bank, N.A. | 6,448 USD | (256 | ) | ||||||||||||||
New China Life Insurance Co., Ltd. | 03/26/25 | M | 1.00 | % | JPMorgan Chase Bank, N.A. | 556,775 USD | 27,762 | |||||||||||||||
See Notes to Consolidated Financial Statements.
213
Table of Contents
Blackstone Alternative Multi-Strategy Fund and Subsidiaries
Consolidated Schedule of Investments ^ (Continued)
March 31, 2023
Reference Instrument | Termination Date | Payment Frequency | Financing Rate | Counterparty | Notional Amount | Unrealized Appreciation (Depreciation) | ||||||||||||||||
New China Life Insurance Co., Ltd. | 01/15/25 | M | 1.00 | % | Morgan Stanley Capital Services LLC | 318,353 USD | $ | 14,083 | ||||||||||||||
New Journey Health Technology Group Co., Ltd. | 03/26/25 | M | 5.22 | % | JPMorgan Chase Bank, N.A. | 428,930 USD | (921 | ) | ||||||||||||||
New Journey Health Technology Group Co., Ltd. | 01/15/25 | M | 1.38 | % | Morgan Stanley Capital Services LLC | 190,565 USD | (119 | ) | ||||||||||||||
Neway CNC Equipment Suzhou Co., Ltd. | 01/15/25 | M | 1.00 | % | Morgan Stanley Capital Services LLC | 15,156 USD | 20 | |||||||||||||||
Ninestar Corp. | 01/15/25 | M | 1.38 | % | Morgan Stanley Capital Services LLC | 76,673 USD | 290 | |||||||||||||||
Ningbo Boway Alloy Material Co., Ltd. | 04/02/25 | M | 1.00 | % | JPMorgan Chase Bank, N.A. | 2,037 USD | 11 | |||||||||||||||
Ningbo Boway Alloy Material Co., Ltd. | 03/05/25 | M | 4.97 | % | JPMorgan Chase Bank, N.A. | 240 USD | (12 | ) | ||||||||||||||
Ningbo Energy Group Co., Ltd. | 01/15/25 | M | 1.00 | % | Morgan Stanley Capital Services LLC | 3,036 USD | 6 | |||||||||||||||
Ningbo Fuda Co., Ltd. | 03/19/25 | M | 5.06 | % | JPMorgan Chase Bank, N.A. | 75,732 USD | (3,159 | ) | ||||||||||||||
Ningbo Fuda Co., Ltd. | 01/15/25 | M | 4.72 | % | Morgan Stanley Capital Services LLC | 19,259 USD | (891 | ) | ||||||||||||||
Ningbo Hengshuai Co., Ltd. | 01/15/25 | M | 1.00 | % | Morgan Stanley Capital Services LLC | 13,349 USD | (176 | ) | ||||||||||||||
Ningbo Joyson Electronic Corp. | 01/15/25 | M | 1.00 | % | Morgan Stanley Capital Services LLC | 339,635 USD | 9,873 | |||||||||||||||
Ningbo Joyson Electronic Corp. | 02/06/25 | M | 1.00 | % | JPMorgan Chase Bank, N.A. | 262,910 USD | 4,596 | |||||||||||||||
Ningbo Menovo Pharmaceutical Co., Ltd. | 03/19/25 | M | 5.05 | % | JPMorgan Chase Bank, N.A. | 639,398 USD | (6,709 | ) | ||||||||||||||
Ningbo Menovo Pharmaceutical Co., Ltd. | 01/15/25 | M | 1.00 | % | Morgan Stanley Capital Services LLC | 323,070 USD | (3,638 | ) | ||||||||||||||
Ningbo Sanxing Medical Electric Co., Ltd. | 01/15/25 | M | 1.00 | % | Morgan Stanley Capital Services LLC | 95 USD | (2 | ) | ||||||||||||||
Ningbo United Group Co., Ltd. | 03/31/25 | M | 5.22 | % | JPMorgan Chase Bank, N.A. | 193,167 USD | (1,887 | ) | ||||||||||||||
Ningbo United Group Co., Ltd. | 01/15/25 | M | 1.00 | % | Morgan Stanley Capital Services LLC | 6,738 USD | (7 | ) | ||||||||||||||
Ningbo Xusheng Group Co., Ltd. | 04/02/25 | M | 1.00 | % | JPMorgan Chase Bank, N.A. | 64,876 USD | 273 | |||||||||||||||
Ningbo Zhenyu Technology Co., Ltd. | 01/15/25 | M | 1.00 | % | Morgan Stanley Capital Services LLC | 4,252 USD | 28 | |||||||||||||||
Ningbo Zhongbai Co., Ltd. | 03/19/25 | M | 5.03 | % | JPMorgan Chase Bank, N.A. | 42,738 USD | (1,599 | ) | ||||||||||||||
Ningbo Zhongbai Co., Ltd. | 01/15/25 | M | 4.69 | % | Morgan Stanley Capital Services LLC | 4,985 USD | (198 | ) | ||||||||||||||
Ningbo Zhoushan Port Co., Ltd. | 01/15/25 | M | 1.38 | % | Morgan Stanley Capital Services LLC | 6,370 USD | 4 | |||||||||||||||
Ningbo Zhoushan Port Co., Ltd. | 04/02/25 | M | 1.00 | % | JPMorgan Chase Bank, N.A. | 17,500 USD | (11 | ) | ||||||||||||||
Ningxia Jiaze New Energy Co., Ltd. | 03/31/25 | M | 1.00 | % | JPMorgan Chase Bank, N.A. | 47,349 USD | 1,120 | |||||||||||||||
Ningxia Jiaze New Energy Co., Ltd. | 01/15/25 | M | 2.82 | % | Morgan Stanley Capital Services LLC | 74,803 USD | 1,075 | |||||||||||||||
See Notes to Consolidated Financial Statements.
214
Table of Contents
Blackstone Alternative Multi-Strategy Fund and Subsidiaries
Consolidated Schedule of Investments ^ (Continued)
March 31, 2023
Reference Instrument | Termination Date | Payment Frequency | Financing Rate | Counterparty | Notional Amount | Unrealized Appreciation (Depreciation) | ||||||||||||||||
Ningxia Orient Tantalum Industry Co., Ltd. | 03/17/25 | M | 5.06 | % | JPMorgan Chase Bank, N.A. | 378,451 USD | $ | 4,871 | ||||||||||||||
Ningxia Orient Tantalum Industry Co., Ltd. | 01/15/25 | M | 4.72 | % | Morgan Stanley Capital Services LLC | 233,139 USD | 3,055 | |||||||||||||||
Noblelift Intelligent Equipment Co., Ltd. | 01/15/25 | M | 1.00 | % | Morgan Stanley Capital Services LLC | 21,107 USD | (10 | ) | ||||||||||||||
Noblelift Intelligent Equipment Co., Ltd. | 04/02/25 | M | 1.00 | % | JPMorgan Chase Bank, N.A. | 3,909 USD | 8 | |||||||||||||||
North China Pharmaceutical Co., Ltd. | 01/15/25 | M | 1.00 | % | Morgan Stanley Capital Services LLC | 2,875 USD | (3 | ) | ||||||||||||||
North Copper Co., Ltd. | 01/15/25 | M | 1.00 | % | Morgan Stanley Capital Services LLC | 43,498 USD | (30 | ) | ||||||||||||||
North Copper ShanXi Co., Ltd. | 04/02/25 | M | 1.00 | % | JPMorgan Chase Bank, N.A. | 67,251 USD | 3 | |||||||||||||||
Northeast Pharmaceutical Group Co., Ltd. | 03/31/25 | M | 5.22 | % | JPMorgan Chase Bank, N.A. | 2,611 USD | 60 | |||||||||||||||
Northeast Pharmaceutical Group Co., Ltd. | 01/15/25 | M | 1.00 | % | Morgan Stanley Capital Services LLC | 9,848 USD | 231 | |||||||||||||||
Northeast Securities Co., Ltd. | 01/15/25 | M | 1.00 | % | Morgan Stanley Capital Services LLC | 2,073 USD | (1 | ) | ||||||||||||||
Novogene Co., Ltd. | 04/02/25 | M | 1.00 | % | JPMorgan Chase Bank, N.A. | 202,318 USD | (1,778 | ) | ||||||||||||||
Novogene Co., Ltd. | 01/15/25 | M | 1.38 | % | Morgan Stanley Capital Services LLC | 126,618 USD | (954 | ) | ||||||||||||||
NSFOCUS Technologies Group Co., Ltd. | 02/12/25 | M | 5.03 | % | JPMorgan Chase Bank, N.A. | 54,523 USD | 2,923 | |||||||||||||||
NuVasive, Inc. | 02/12/25 | M | 5.07 | % | JPMorgan Chase Bank, N.A. | 4,782,246 USD | 450,988 | |||||||||||||||
Oak Street Health, Inc. | 02/12/25 | M | 5.07 | % | JPMorgan Chase Bank, N.A. | 4,481,016 USD | 363,190 | |||||||||||||||
Offshore Oil Engineering Co., Ltd. | 03/05/25 | M | 5.05 | % | JPMorgan Chase Bank, N.A. | 94,155 USD | (44 | ) | ||||||||||||||
OKE Precision Cutting Tools Co., Ltd. | 04/02/25 | M | 5.22 | % | JPMorgan Chase Bank, N.A. | 447,766 USD | 30,590 | |||||||||||||||
OKE Precision Cutting Tools Co., Ltd. | 01/15/25 | M | 1.81 | % | Morgan Stanley Capital Services LLC | 272,384 USD | 16,476 | |||||||||||||||
Olympic Circuit Technology Co., Ltd. | 01/15/25 | M | 4.83 | % | Morgan Stanley Capital Services LLC | 183 USD | 12 | |||||||||||||||
Olympic Circuit Technology Co., Ltd. | 04/02/25 | M | 1.00 | % | JPMorgan Chase Bank, N.A. | 21,549 USD | (163 | ) | ||||||||||||||
Omnijoi Media Corp. | 03/26/25 | M | 1.00 | % | JPMorgan Chase Bank, N.A. | 62,364 USD | 1,761 | |||||||||||||||
Omnijoi Media Corp. | 01/15/25 | M | 1.00 | % | Morgan Stanley Capital Services LLC | 43,822 USD | 1,029 | |||||||||||||||
OPT Machine Vision Tech Co., Ltd. | 01/15/25 | M | 3.48 | % | Morgan Stanley Capital Services LLC | 3,747 USD | (156 | ) | ||||||||||||||
Orient Securities Co., Ltd. | 03/05/25 | M | 1.00 | % | JPMorgan Chase Bank, N.A. | 561,945 USD | (2,769 | ) | ||||||||||||||
Orient Securities Co., Ltd. | 01/15/25 | M | 1.00 | % | Morgan Stanley Capital Services LLC | 319,818 USD | (1,721 | ) | ||||||||||||||
Ovctek China, Inc. | 03/19/25 | M | 4.98 | % | JPMorgan Chase Bank, N.A. | 428,335 USD | 6,881 | |||||||||||||||
Ovctek China, Inc. | 01/15/25 | M | 3.48 | % | Morgan Stanley Capital Services LLC | 263,216 USD | 4,275 | |||||||||||||||
OZ Minerals Ltd. | 12/27/24 | M | 3.92 | % | JPMorgan Chase Bank, N.A. | 6,600,160AUD | 17,332 | |||||||||||||||
PCI Technology Group Co., Ltd. | 03/11/25 | M | 4.98 | % | JPMorgan Chase Bank, N.A. | 87,922 USD | 10,660 | |||||||||||||||
People's Insurance Co., Group of China Ltd. | 02/25/25 | M | 4.97 | % | JPMorgan Chase Bank, N.A. | 59,352 USD | (1,161 | ) | ||||||||||||||
See Notes to Consolidated Financial Statements.
215
Table of Contents
Blackstone Alternative Multi-Strategy Fund and Subsidiaries
Consolidated Schedule of Investments ^ (Continued)
March 31, 2023
Reference Instrument | Termination Date | Payment Frequency | Financing Rate | Counterparty | Notional Amount | Unrealized Appreciation (Depreciation) | ||||||||||||||||
Perfect Group Corp., Ltd. | 03/19/25 | M | 5.20 | % | JPMorgan Chase Bank, N.A. | 87,897 USD | $ | 5,892 | ||||||||||||||
Perfect World Co., Ltd. | 03/31/25 | M | 5.22 | % | JPMorgan Chase Bank, N.A. | 853,738 USD | 31,956 | |||||||||||||||
Perfect World Co., Ltd. | 01/15/25 | M | 1.00 | % | Morgan Stanley Capital Services LLC | 424,263 USD | 17,593 | |||||||||||||||
Ping An Insurance Group Co. of China Ltd. | 04/02/25 | M | 5.22 | % | JPMorgan Chase Bank, N.A. | 3,303 USD | 14 | |||||||||||||||
Pingdingshan Tianan Coal Mining Co., Ltd. | 01/15/25 | M | 1.00 | % | Morgan Stanley Capital Services LLC | 31,202 USD | 36 | |||||||||||||||
PNC Process Systems Co., Ltd. | 01/15/25 | M | 1.00 | % | Morgan Stanley Capital Services LLC | 19,898 USD | 53 | |||||||||||||||
Pnm Resources, Inc. | 10/23/24 | M | 5.07 | % | JPMorgan Chase Bank, N.A. | 6,641,158 USD | (35,282 | ) | ||||||||||||||
Poly Developments & Holdings Group Co., Ltd. | 04/02/25 | M | 5.22 | % | JPMorgan Chase Bank, N.A. | 437,699 USD | (5,483 | ) | ||||||||||||||
Poly Developments & Holdings Group Co., Ltd. | 01/15/25 | M | 1.81 | % | Morgan Stanley Capital Services LLC | 264,537 USD | (1,958 | ) | ||||||||||||||
Postal Savings Bank of China Co., Ltd. | 03/25/25 | M | 5.03 | % | JPMorgan Chase Bank, N.A. | 394,677 USD | (14,522 | ) | ||||||||||||||
Postal Savings Bank of China Co., Ltd. | 01/15/25 | M | 3.09 | % | Morgan Stanley Capital Services LLC | 55,211 USD | (1,754 | ) | ||||||||||||||
Primarius Technologies Co., Ltd. | 01/15/25 | M | 1.81 | % | Morgan Stanley Capital Services LLC | 58,955 USD | 1,265 | |||||||||||||||
Provention Bio, Inc. | 03/17/25 | M | 1.00 | % | JPMorgan Chase Bank, N.A. | 2,575,347 USD | 18,295 | |||||||||||||||
Pubang Landscape Architecture Co., Ltd. | 01/15/25 | M | 1.00 | % | Morgan Stanley Capital Services LLC | 2,154 USD | (3 | ) | ||||||||||||||
Puyang Huicheng Electronic Material Co., Ltd. | 03/19/25 | M | 1.00 | % | JPMorgan Chase Bank, N.A. | 233,349 USD | (1,068 | ) | ||||||||||||||
Puyang Huicheng Electronic Material Co., Ltd. | 01/15/25 | M | 3.41 | % | Morgan Stanley Capital Services LLC | 206,323 USD | (872 | ) | ||||||||||||||
Pylon Technologies Co., Ltd. | 01/15/25 | M | 1.00 | % | Morgan Stanley Capital Services LLC | 295,142 USD | 12,097 | |||||||||||||||
Pylon Technologies Co., Ltd. | 04/02/25 | M | 1.00 | % | JPMorgan Chase Bank, N.A. | 261,748 USD | 9,766 | |||||||||||||||
Qi An Xin Technology Group, Inc. | 03/19/25 | M | 4.98 | % | JPMorgan Chase Bank, N.A. | 120,421 USD | (564 | ) | ||||||||||||||
Qianhe Condiment & Food Co., Ltd. | 01/15/25 | M | 1.00 | % | Morgan Stanley Capital Services LLC | 378,724 USD | 7,627 | |||||||||||||||
Qianhe Condiment and Food Co., Ltd. | 03/12/25 | M | 5.15 | % | JPMorgan Chase Bank, N.A. | 770,053 USD | 27,036 | |||||||||||||||
Qianjiang Water Resources Development Co., Ltd. | 01/15/25 | M | 4.83 | % | Morgan Stanley Capital Services LLC | 3,401 USD | 17 | |||||||||||||||
Qifeng New Material Co., Ltd. | 01/15/25 | M | 4.83 | % | Morgan Stanley Capital Services LLC | 2,246 USD | (18 | ) | ||||||||||||||
Qingdao Daneng Environmental Protection Equipment Co., Ltd. | 03/31/25 | M | 5.22 | % | JPMorgan Chase Bank, N.A. | 307,657 USD | 10,360 | |||||||||||||||
Qingdao Daneng Environmental Protection Equipment Co., Ltd. | 01/15/25 | M | 1.00 | % | Morgan Stanley Capital Services LLC | 94,108 USD | 3,285 | |||||||||||||||
Qingdao Gaoce Technology Co., Ltd. | 01/15/25 | M | 1.00 | % | Morgan Stanley Capital Services LLC | 344,611 USD | 15,732 | |||||||||||||||
Qingdao Gaoce Technology Co., Ltd. | 03/31/25 | M | 1.00 | % | JPMorgan Chase Bank, N.A. | 521,537 USD | 25,223 | |||||||||||||||
Qingdao Haier Biomedical Co., Ltd. | 01/15/25 | M | 3.19 | % | Morgan Stanley Capital Services LLC | 49,377 USD | (991 | ) | ||||||||||||||
See Notes to Consolidated Financial Statements.
216
Table of Contents
Blackstone Alternative Multi-Strategy Fund and Subsidiaries
Consolidated Schedule of Investments ^ (Continued)
March 31, 2023
Reference Instrument | Termination Date | Payment Frequency | Financing Rate | Counterparty | Notional Amount | Unrealized Appreciation (Depreciation) | ||||||||||||||||
Qingdao Huicheng Environmental Technology Group Co., Ltd. | 04/02/25 | M | 1.00 | % | JPMorgan Chase Bank, N.A. | 8,899 USD | $ | 32 | ||||||||||||||
Qingdao Huijintong Power Equipment Co., Ltd. | 03/19/25 | M | 1.00 | % | JPMorgan Chase Bank, N.A. | 35,271 USD | (780 | ) | ||||||||||||||
Qingdao Huijintong Power Equipment Co., Ltd. | 01/15/25 | M | 1.00 | % | Morgan Stanley Capital Services LLC | 1,205 USD | — | |||||||||||||||
Qingdao Yunlu Advanced Materials Technology Co., Ltd. | 03/24/25 | M | 1.00 | % | JPMorgan Chase Bank, N.A. | 131,838 USD | (4,526 | ) | ||||||||||||||
Qingdao Yunlu Advanced Materials Technology Co., Ltd. | 01/15/25 | M | 2.97 | % | Morgan Stanley Capital Services LLC | 20,608 USD | (853 | ) | ||||||||||||||
Qinhuangdao Port Co., Ltd. | 01/15/25 | M | 3.42 | % | Morgan Stanley Capital Services LLC | 30,294 USD | (1,383 | ) | ||||||||||||||
Qinhuangdao Port Co., Ltd. | 03/19/25 | M | 5.04 | % | JPMorgan Chase Bank, N.A. | 125,832 USD | (5,620 | ) | ||||||||||||||
Range Intelligent Computing Technology Group Co., Ltd. | 03/18/25 | M | 5.22 | % | JPMorgan Chase Bank, N.A. | 60,143 USD | 157 | |||||||||||||||
Red Star Macalline Group Corp. Ltd. | 03/04/25 | M | 5.22 | % | JPMorgan Chase Bank, N.A. | 303,198 USD | 9,310 | |||||||||||||||
Red Star Macalline Group Corp. Ltd. | 01/15/25 | M | 2.97 | % | Morgan Stanley Capital Services LLC | 180,036 USD | 4,962 | |||||||||||||||
Repsol S.A | 12/04/24 | M | 2.90 | % | Morgan Stanley Capital Services LLC | 380,161EUR | 1,166 | |||||||||||||||
Rianlon Corp. | 01/15/25 | M | 2.97 | % | Morgan Stanley Capital Services LLC | 18,333 USD | (47 | ) | ||||||||||||||
Risen Energy Co., Ltd. | 03/12/25 | M | 4.98 | % | JPMorgan Chase Bank, N.A. | 58,853 USD | (346 | ) | ||||||||||||||
Rising Nonferrous Metals Share Co., Ltd. | 03/26/25 | M | 1.00 | % | JPMorgan Chase Bank, N.A. | 23,114 USD | 94 | |||||||||||||||
Rising Nonferrous Metals Share Co., Ltd. | 01/15/25 | M | 1.00 | % | Morgan Stanley Capital Services LLC | 132,298 USD | (594 | ) | ||||||||||||||
Ritchie Bros Auctioneers, Inc. | 03/25/25 | M | 5.07 | % | JPMorgan Chase Bank, N.A. | 264,372 USD | 10,154 | |||||||||||||||
Riyue Heavy Industry Co., Ltd. | 01/15/25 | M | 4.83 | % | Morgan Stanley Capital Services LLC | 233 USD | 3 | |||||||||||||||
Rockchip Electronics Co., Ltd. | 04/02/25 | M | 5.22 | % | JPMorgan Chase Bank, N.A. | 605,671 USD | (3,012 | ) | ||||||||||||||
Rockchip Electronics Co., Ltd. | 01/15/25 | M | 1.00 | % | Morgan Stanley Capital Services LLC | 364,372 USD | (1,467 | ) | ||||||||||||||
Rongan Property Co., Ltd. | 01/14/25 | M | 4.97 | % | JPMorgan Chase Bank, N.A. | 68,084 USD | (2,701 | ) | ||||||||||||||
Rongan Property Co., Ltd. | 01/15/25 | M | 1.00 | % | Morgan Stanley Capital Services LLC | 46,347 USD | (1,773 | ) | ||||||||||||||
Ruida Futures Co., Ltd. | 03/26/25 | M | 5.22 | % | JPMorgan Chase Bank, N.A. | 162,763 USD | (6,547 | ) | ||||||||||||||
Ruida Futures Co., Ltd. | 01/15/25 | M | 3.09 | % | Morgan Stanley Capital Services LLC | 78,973 USD | (3,176 | ) | ||||||||||||||
Ruitai Materials Technology Co., Ltd. | 03/18/25 | M | 5.10 | % | JPMorgan Chase Bank, N.A. | 30,054 USD | (378 | ) | ||||||||||||||
Ruitai Materials Technology Co., Ltd. | 01/15/25 | M | 4.72 | % | Morgan Stanley Capital Services LLC | 57,962 USD | (316 | ) | ||||||||||||||
Saimo Technology Co., Ltd. | 03/19/25 | M | 1.00 | % | JPMorgan Chase Bank, N.A. | 225,078 USD | (3,535 | ) | ||||||||||||||
Saimo Technology Co., Ltd. | 01/15/25 | M | 1.00 | % | Morgan Stanley Capital Services LLC | 64,534 USD | (1,150 | ) | ||||||||||||||
See Notes to Consolidated Financial Statements.
217
Table of Contents
Blackstone Alternative Multi-Strategy Fund and Subsidiaries
Consolidated Schedule of Investments ^ (Continued)
March 31, 2023
Reference Instrument | Termination Date | Payment Frequency | Financing Rate | Counterparty | Notional Amount | Unrealized Appreciation (Depreciation) | ||||||||||||||||
Sanchuan Wisdom Technology Co., Ltd. | 03/19/25 | M | 5.15 | % | JPMorgan Chase Bank, N.A. | 261,693 USD | $ | 3,616 | ||||||||||||||
Sanchuan Wisdom Technology Co., Ltd. | 01/15/25 | M | 3.09 | % | Morgan Stanley Capital Services LLC | 151,078 USD | 2,089 | |||||||||||||||
Sangfor Technologies, Inc. | 04/02/25 | M | 1.00 | % | JPMorgan Chase Bank, N.A. | 175,557 USD | 1,000 | |||||||||||||||
Sanjiang Shopping Club Co., Ltd. | 03/26/25 | M | 5.22 | % | JPMorgan Chase Bank, N.A. | 23,959 USD | 11,709 | |||||||||||||||
Sanxiang Impression Co., Ltd. | 03/25/25 | M | 4.97 | % | JPMorgan Chase Bank, N.A. | 7,348 USD | (179 | ) | ||||||||||||||
SDIC Capital Co., Ltd. | 03/12/25 | M | 1.00 | % | JPMorgan Chase Bank, N.A. | 2,104 USD | 17 | |||||||||||||||
SDIC Capital Co., Ltd. | 01/15/25 | M | 1.00 | % | Morgan Stanley Capital Services LLC | 4,709 USD | 37 | |||||||||||||||
Seagen, Inc. | 03/17/25 | M | 5.07 | % | JPMorgan Chase Bank, N.A. | 4,093,957 USD | 52,426 | |||||||||||||||
Seazen Holdings Co., Ltd. | 03/24/25 | M | 1.00 | % | JPMorgan Chase Bank, N.A. | 566,235 USD | (14,819 | ) | ||||||||||||||
Seazen Holdings Co., Ltd. | 01/15/25 | M | 1.00 | % | Morgan Stanley Capital Services LLC | 321,199 USD | (8,278 | ) | ||||||||||||||
Senba Sensing Technology Co., Ltd. | 04/02/25 | M | 1.00 | % | JPMorgan Chase Bank, N.A. | 39,988 USD | 105 | |||||||||||||||
Senba Sensing Technology Co., Ltd. | 01/15/25 | M | 1.00 | % | Morgan Stanley Capital Services LLC | 848 USD | 5 | |||||||||||||||
ShaanXi Provincial Natural Gas Co., Ltd. | 04/02/25 | M | 1.00 | % | JPMorgan Chase Bank, N.A. | 12,044 USD | 88 | |||||||||||||||
ShaanXi Provincial Natural Gas Co., Ltd. | 01/15/25 | M | 1.00 | % | Morgan Stanley Capital Services LLC | 3,239 USD | 31 | |||||||||||||||
Shan Xi Hua Yang Group New Energy Co., Ltd. | 04/02/25 | M | 5.22 | % | JPMorgan Chase Bank, N.A. | 476,875 USD | 2,170 | |||||||||||||||
Shan Xi Hua Yang Group New Energy Co., Ltd. | 01/15/25 | M | 1.00 | % | Morgan Stanley Capital Services LLC | 240,546 USD | 1,949 | |||||||||||||||
Shandong Fengyuan Chemical Co., Ltd. | 01/15/25 | M | 1.00 | % | Morgan Stanley Capital Services LLC | 382 USD | (16 | ) | ||||||||||||||
Shandong Gold Mining Co., Ltd. | 01/15/25 | M | 2.82 | % | Morgan Stanley Capital Services LLC | 38,309 USD | 525 | |||||||||||||||
Shandong Gold Phoenix Group Co., Ltd. | 01/15/25 | M | 1.00 | % | Morgan Stanley Capital Services LLC | 9,441 USD | (71 | ) | ||||||||||||||
Shandong Gold Phoenix Group Co., Ltd. | 11/04/24 | M | 1.00 | % | JPMorgan Chase Bank, N.A. | 271,613 USD | (4,805 | ) | ||||||||||||||
Shandong Hongchuang Aluminum Industry Holding Co., Ltd. | 03/05/25 | M | 1.00 | % | JPMorgan Chase Bank, N.A. | 355,407 USD | (23,254 | ) | ||||||||||||||
Shandong Hongchuang Aluminum Industry Holding Co., Ltd. | 01/15/25 | M | 1.00 | % | Morgan Stanley Capital Services LLC | 164,678 USD | (10,173 | ) | ||||||||||||||
Shandong Hualu Hengsheng Chemical Co., Ltd. | 03/26/25 | M | 1.00 | % | JPMorgan Chase Bank, N.A. | 190,242 USD | 9,814 | |||||||||||||||
Shandong Hualu Hengsheng Chemical Co., Ltd. | 01/15/25 | M | 1.00 | % | Morgan Stanley Capital Services LLC | 139,708 USD | 6,215 | |||||||||||||||
Shandong Huifa Foodstuff Co., Ltd. | 01/15/25 | M | 1.00 | % | Morgan Stanley Capital Services LLC | 7,421 USD | 11 | |||||||||||||||
Shandong Huifa Foodstuff Co., Ltd. | 03/26/25 | M | 1.00 | % | JPMorgan Chase Bank, N.A. | 210,959 USD | (1,362 | ) | ||||||||||||||
Shandong Humon Smelting Co., Ltd. | 03/31/25 | M | 5.22 | % | JPMorgan Chase Bank, N.A. | 66,937 USD | 1,566 | |||||||||||||||
See Notes to Consolidated Financial Statements.
218
Table of Contents
Blackstone Alternative Multi-Strategy Fund and Subsidiaries
Consolidated Schedule of Investments ^ (Continued)
March 31, 2023
Reference Instrument | Termination Date | Payment Frequency | Financing Rate | Counterparty | Notional Amount | Unrealized Appreciation (Depreciation) | ||||||||||||||||
Shandong Humon Smelting Co., Ltd. | 01/15/25 | M | 4.83 | % | Morgan Stanley Capital Services LLC | 35 USD | $ | (1 | ) | |||||||||||||
Shandong Iron and Steel Co., Ltd. | 03/26/25 | M | 5.22 | % | JPMorgan Chase Bank, N.A. | 97,065 USD | 944 | |||||||||||||||
Shandong Iron and Steel Co., Ltd. | 01/15/25 | M | 1.00 | % | Morgan Stanley Capital Services LLC | 10,433 USD | 76 | |||||||||||||||
Shandong Jinling Mining Co., Ltd. | 01/15/25 | M | 1.00 | % | Morgan Stanley Capital Services LLC | 180,986 USD | (9,292 | ) | ||||||||||||||
Shandong Jinling Mining Co., Ltd. | 01/22/25 | M | 5.02 | % | JPMorgan Chase Bank, N.A. | 540,379 USD | (24,190 | ) | ||||||||||||||
Shandong Linglong Tyre Co., Ltd. | 08/14/24 | M | 1.00 | % | JPMorgan Chase Bank, N.A. | 77,731 USD | (957 | ) | ||||||||||||||
Shandong Lukang Pharma | 02/19/25 | M | 4.97 | % | JPMorgan Chase Bank, N.A. | 13,024 USD | 29 | |||||||||||||||
Shandong Publishing & Media Co., Ltd. | 04/02/25 | M | 5.22 | % | JPMorgan Chase Bank, N.A. | 54,821 USD | 361 | |||||||||||||||
Shandong Publishing & Media Co., Ltd. | 01/15/25 | M | 1.00 | % | Morgan Stanley Capital Services LLC | 46,802 USD | 447 | |||||||||||||||
Shandong Shengli Co. | 03/05/25 | M | 4.97 | % | JPMorgan Chase Bank, N.A. | 49,651 USD | (2,854 | ) | ||||||||||||||
Shandong Shengli Co. | 01/15/25 | M | 4.72 | % | Morgan Stanley Capital Services LLC | 1,924 USD | (114 | ) | ||||||||||||||
Shandong Shuangyi Technology Co., Ltd. | 03/26/25 | M | 1.00 | % | JPMorgan Chase Bank, N.A. | 163,386 USD | (2,703 | ) | ||||||||||||||
Shandong Shuangyi Technology Co., Ltd. | 01/15/25 | M | 1.00 | % | Morgan Stanley Capital Services LLC | 46,050 USD | (545 | ) | ||||||||||||||
Shandong Sinocera Functional Material Co., Ltd. | 03/11/25 | M | 4.97 | % | JPMorgan Chase Bank, N.A. | 6,924 USD | (326 | ) | ||||||||||||||
Shandong Sunway Chemical Group Co., Ltd. | 01/15/25 | M | 1.00 | % | Morgan Stanley Capital Services LLC | 2,622 USD | 32 | |||||||||||||||
Shandong WIT Dyne Health Co., Ltd. | 03/05/25 | M | 4.97 | % | JPMorgan Chase Bank, N.A. | 6,656 USD | (332 | ) | ||||||||||||||
Shandong Wohua Pharmaceutical Co., Ltd. | 03/12/25 | M | 4.99 | % | JPMorgan Chase Bank, N.A. | 177,750 USD | 4,029 | |||||||||||||||
Shandong Wohua Pharmaceutical Co., Ltd. | 01/15/25 | M | 4.72 | % | Morgan Stanley Capital Services LLC | 37,283 USD | 939 | |||||||||||||||
Shandong Xiantan Co., Ltd. | 03/11/25 | M | 5.19 | % | JPMorgan Chase Bank, N.A. | 4,309 USD | 85 | |||||||||||||||
Shandong Zhangqiu Blower Co., Ltd. | 01/15/25 | M | 4.83 | % | Morgan Stanley Capital Services LLC | 5,423 USD | 149 | |||||||||||||||
Shanghai Aiko Solar Energy Co., Ltd. | 01/15/25 | M | 4.83 | % | Morgan Stanley Capital Services LLC | 5 USD | — | |||||||||||||||
Shanghai Aiyingshi Co., Ltd. | 01/15/25 | M | 4.83 | % | Morgan Stanley Capital Services LLC | 1,809 USD | 42 | |||||||||||||||
Shanghai AJ Group Co., Ltd. | 03/26/25 | M | 5.22 | % | JPMorgan Chase Bank, N.A. | 193,840 USD | (7,074 | ) | ||||||||||||||
Shanghai AJ Group Co., Ltd. | 01/15/25 | M | 3.09 | % | Morgan Stanley Capital Services LLC | 52,410 USD | (2,007 | ) | ||||||||||||||
Shanghai Allist Pharmaceuticals Co., Ltd. | 03/19/25 | M | 4.97 | % | JPMorgan Chase Bank, N.A. | 82,955 USD | (812 | ) | ||||||||||||||
Shanghai Allist Pharmaceuticals Co., Ltd. | 01/15/25 | M | 1.00 | % | Morgan Stanley Capital Services LLC | 35,907 USD | (312 | ) | ||||||||||||||
Shanghai Allist Pharmaceuticals Co., Ltd. | 03/12/25 | M | 1.00 | % | JPMorgan Chase Bank, N.A. | 103,083 USD | (1,772 | ) | ||||||||||||||
See Notes to Consolidated Financial Statements.
219
Table of Contents
Blackstone Alternative Multi-Strategy Fund and Subsidiaries
Consolidated Schedule of Investments ^ (Continued)
March 31, 2023
Reference Instrument | Termination Date | Payment Frequency | Financing Rate | Counterparty | Notional Amount | Unrealized Appreciation (Depreciation) | ||||||||||||||||
Shanghai Anlogic Infotech Co., Ltd. | 01/15/25 | M | 4.83 | % | Morgan Stanley Capital Services LLC | 1,292 USD | $ | 133 | ||||||||||||||
Shanghai AtHub Co., Ltd. | 01/15/25 | M | 1.00 | % | Morgan Stanley Capital Services LLC | 296 USD | 20 | |||||||||||||||
Shanghai Baolong Automotive Corp. | 03/12/25 | M | 5.04 | % | JPMorgan Chase Bank, N.A. | 59,262 USD | 1,517 | |||||||||||||||
Shanghai Baosight Software Co., Ltd. | 03/26/25 | M | 1.00 | % | JPMorgan Chase Bank, N.A. | 549,641 USD | 22,462 | |||||||||||||||
Shanghai Baosight Software Co., Ltd. | 01/15/25 | M | 1.00 | % | Morgan Stanley Capital Services LLC | 311,745 USD | 12,800 | |||||||||||||||
Shanghai Chinafortune Co., Ltd. | 03/26/25 | M | 1.00 | % | JPMorgan Chase Bank, N.A. | 13,070 USD | 74 | |||||||||||||||
Shanghai Chinafortune Co., Ltd. | 01/15/25 | M | 1.00 | % | Morgan Stanley Capital Services LLC | 94,582 USD | 628 | |||||||||||||||
Shanghai Construction Group Co., Ltd. | 01/15/25 | M | 1.00 | % | Morgan Stanley Capital Services LLC | 4,627 USD | (19 | ) | ||||||||||||||
Shanghai Construction Group Co., Ltd. | 02/19/25 | M | 1.00 | % | JPMorgan Chase Bank, N.A. | 200,395 USD | (1,997 | ) | ||||||||||||||
Shanghai DZH Ltd. | 04/02/25 | M | 5.22 | % | JPMorgan Chase Bank, N.A. | 132,695 USD | 977 | |||||||||||||||
Shanghai DZH Ltd. | 01/15/25 | M | 1.00 | % | Morgan Stanley Capital Services LLC | 73,227 USD | 653 | |||||||||||||||
Shanghai Electric Power Co., Ltd. | 03/11/25 | M | 5.03 | % | JPMorgan Chase Bank, N.A. | 31,203 USD | (713 | ) | ||||||||||||||
Shanghai Fengyuzhu Culture & Technology Co., Ltd. | 04/02/25 | M | 1.00 | % | JPMorgan Chase Bank, N.A. | 76,949 USD | 1,736 | |||||||||||||||
Shanghai Friendess Electronic Technology Corp., Ltd. | 04/02/25 | M | 1.00 | % | JPMorgan Chase Bank, N.A. | 120,780 USD | (3,414 | ) | ||||||||||||||
Shanghai Friendess Electronic Technology Corp., Ltd. | 01/15/25 | M | 1.81 | % | Morgan Stanley Capital Services LLC | 81,726 USD | (1,704 | ) | ||||||||||||||
Shanghai Fudan-Zhangjiang Bio-Pharmaceutical Co., Ltd. | 02/18/25 | M | 5.04 | % | JPMorgan Chase Bank, N.A. | 92,340 USD | (3,055 | ) | ||||||||||||||
Shanghai Fudan-Zhangjiang Bio-Pharmaceutical Co., Ltd. | 01/15/25 | M | 1.00 | % | Morgan Stanley Capital Services LLC | 3,065 USD | (5 | ) | ||||||||||||||
Shanghai Haishun New Pharmaceutical Packaging Co., Ltd. | 03/18/25 | M | 1.00 | % | JPMorgan Chase Bank, N.A. | 152,863 USD | (9,305 | ) | ||||||||||||||
Shanghai Haishun New Pharmaceutical Packaging Co., Ltd. | 01/15/25 | M | 1.00 | % | Morgan Stanley Capital Services LLC | 121,292 USD | (6,446 | ) | ||||||||||||||
Shanghai Haixin Group Co. | 03/26/25 | M | 5.22 | % | JPMorgan Chase Bank, N.A. | 307,568 USD | 1,673 | |||||||||||||||
Shanghai Haixin Group Co. | 01/15/25 | M | 1.00 | % | Morgan Stanley Capital Services LLC | 14,728 USD | 32 | |||||||||||||||
Shanghai Haixin Group Co. | 01/15/25 | M | 4.83 | % | Morgan Stanley Capital Services LLC | 22,473 USD | 200 | |||||||||||||||
Shanghai Haixin Group Co. | 02/19/25 | M | 4.97 | % | JPMorgan Chase Bank, N.A. | 110,058 USD | 994 | |||||||||||||||
Shanghai Hajime Advanced Material Technology Co., Ltd. | 04/02/25 | M | 5.22 | % | JPMorgan Chase Bank, N.A. | 2,108 USD | — | |||||||||||||||
See Notes to Consolidated Financial Statements.
220
Table of Contents
Blackstone Alternative Multi-Strategy Fund and Subsidiaries
Consolidated Schedule of Investments ^ (Continued)
March 31, 2023
Reference Instrument | Termination Date | Payment Frequency | Financing Rate | Counterparty | Notional Amount | Unrealized Appreciation (Depreciation) | ||||||||||||||||
Shanghai Hile Bio-Technology Co., Ltd. | 02/19/25 | M | 1.00 | % | JPMorgan Chase Bank, N.A. | 40,950 USD | $ | 762 | ||||||||||||||
Shanghai Hile Bio-Technology Co., Ltd. | 03/18/25 | M | 5.07 | % | JPMorgan Chase Bank, N.A. | 74,038 USD | 1,078 | |||||||||||||||
Shanghai Huace Navigation Technology Ltd. | 04/02/25 | M | 1.00 | % | JPMorgan Chase Bank, N.A. | 46,252 USD | 89 | |||||||||||||||
Shanghai Huace Navigation Technology Ltd. | 01/15/25 | M | 1.00 | % | Morgan Stanley Capital Services LLC | 7,989 USD | 15 | |||||||||||||||
Shanghai Huaming Intelligent Terminal Equipment Co., Ltd. | 03/26/25 | M | 1.00 | % | JPMorgan Chase Bank, N.A. | 55,978 USD | (1,493 | ) | ||||||||||||||
Shanghai Huaming Intelligent Terminal Equipment Co., Ltd. | 01/15/25 | M | 1.00 | % | Morgan Stanley Capital Services LLC | 2,049 USD | 28 | |||||||||||||||
Shanghai Huayi Group Co., Ltd. | 04/02/25 | M | 1.00 | % | JPMorgan Chase Bank, N.A. | 18,946 USD | 159 | |||||||||||||||
Shanghai Huayi Group Co., Ltd. | 01/15/25 | M | 1.00 | % | Morgan Stanley Capital Services LLC | 17,443 USD | 154 | |||||||||||||||
Shanghai Industrial Development Co., Ltd. | 03/17/25 | M | 1.00 | % | JPMorgan Chase Bank, N.A. | 273,191 USD | (5,389 | ) | ||||||||||||||
Shanghai Industrial Development Co., Ltd. | 01/15/25 | M | 1.00 | % | Morgan Stanley Capital Services LLC | 132,959 USD | (2,572 | ) | ||||||||||||||
Shanghai International Port Group Co., Ltd. | 04/02/25 | M | 5.22 | % | JPMorgan Chase Bank, N.A. | 84,156 USD | 10 | |||||||||||||||
Shanghai International Port Group Co., Ltd. | 01/15/25 | M | 1.38 | % | Morgan Stanley Capital Services LLC | 57,603 USD | 39 | |||||||||||||||
Shanghai Jiaoda Onlly Co., Ltd. | 01/15/25 | M | 1.00 | % | Morgan Stanley Capital Services LLC | 4,581 USD | (11 | ) | ||||||||||||||
Shanghai Jiaoda Onlly Co., Ltd. | 03/26/25 | M | 5.22 | % | JPMorgan Chase Bank, N.A. | 128,489 USD | (1,455 | ) | ||||||||||||||
Shanghai Jin Jiang Online Network Service Co., Ltd. | 04/02/25 | M | 5.22 | % | JPMorgan Chase Bank, N.A. | 30,791 USD | 446 | |||||||||||||||
Shanghai Jin Jiang Online Network Service Co., Ltd. | 01/15/25 | M | 4.83 | % | Morgan Stanley Capital Services LLC | 16,049 USD | 249 | |||||||||||||||
Shanghai Jinfeng Wine Co., Ltd. | 03/19/25 | M | 5.07 | % | JPMorgan Chase Bank, N.A. | 279,805 USD | 5,754 | |||||||||||||||
Shanghai Jinfeng Wine Co., Ltd. | 01/15/25 | M | 4.72 | % | Morgan Stanley Capital Services LLC | 187,941 USD | 3,978 | |||||||||||||||
Shanghai Jinjiang International Hotels Co., Ltd. | 04/02/25 | M | 1.00 | % | JPMorgan Chase Bank, N.A. | 547,909 USD | (4,117 | ) | ||||||||||||||
Shanghai Jinjiang International Hotels Co., Ltd. | 01/15/25 | M | 1.00 | % | Morgan Stanley Capital Services LLC | 309,952 USD | (521 | ) | ||||||||||||||
Shanghai Jinqiao Export Processing Zone Development Co., Ltd. | 01/15/25 | M | 1.00 | % | Morgan Stanley Capital Services LLC | 2,772 USD | 3 | |||||||||||||||
Shanghai Junshi Biosciences Co., Ltd. | 01/15/25 | M | 2.82 | % | Morgan Stanley Capital Services LLC | 75,757 USD | (1,542 | ) | ||||||||||||||
Shanghai Junshi Biosciences Co., Ltd. | 03/26/25 | M | 5.22 | % | JPMorgan Chase Bank, N.A. | 9,883 USD | (95 | ) | ||||||||||||||
Shanghai Kai Kai Industrial Co., Ltd. | 01/15/25 | M | 4.78 | % | Morgan Stanley Capital Services LLC | 6,258 USD | (169 | ) | ||||||||||||||
See Notes to Consolidated Financial Statements.
221
Table of Contents
Blackstone Alternative Multi-Strategy Fund and Subsidiaries
Consolidated Schedule of Investments ^ (Continued)
March 31, 2023
Reference Instrument | Termination Date | Payment Frequency | Financing Rate | Counterparty | Notional Amount | Unrealized Appreciation (Depreciation) | ||||||||||||||||
Shanghai Laiyifen Co., Ltd. | 03/26/25 | M | 1.00 | % | JPMorgan Chase Bank, N.A. | 4,098 USD | $ | (42 | ) | |||||||||||||
Shanghai Lujiazui Finance & Trade Zone Development Co., Ltd. | 04/02/25 | M | 1.00 | % | JPMorgan Chase Bank, N.A. | 3,481 USD | 8 | |||||||||||||||
Shanghai M&G Stationery, Inc. | 03/24/25 | M | 1.00 | % | JPMorgan Chase Bank, N.A. | 567,177 USD | (4,144 | ) | ||||||||||||||
Shanghai M&G Stationery, Inc. | 01/15/25 | M | 1.00 | % | Morgan Stanley Capital Services LLC | 320,037 USD | (651 | ) | ||||||||||||||
Shanghai Maling Aquarius Co., Ltd. | 03/19/25 | M | 1.00 | % | JPMorgan Chase Bank, N.A. | 5,243 USD | 73 | |||||||||||||||
Shanghai Maling Aquarius Co., Ltd. | 01/15/25 | M | 1.00 | % | Morgan Stanley Capital Services LLC | 19,467 USD | 241 | |||||||||||||||
Shanghai Mechanical & Electrical Industry Co., Ltd. | 03/17/25 | M | 4.97 | % | JPMorgan Chase Bank, N.A. | 165,400 USD | (3,021 | ) | ||||||||||||||
Shanghai Mechanical & Electrical Industry Co., Ltd. | 01/15/25 | M | 3.48 | % | Morgan Stanley Capital Services LLC | 56,575 USD | (1,000 | ) | ||||||||||||||
Shanghai MicroPort Endovascular MedTech Group Co., Ltd. | 03/24/25 | M | 1.00 | % | JPMorgan Chase Bank, N.A. | 15,111 USD | (63 | ) | ||||||||||||||
Shanghai MicroPort Endovascular MedTech Group Co., Ltd. | 01/15/25 | M | 3.09 | % | Morgan Stanley Capital Services LLC | 81,002 USD | (744 | ) | ||||||||||||||
Shanghai New Power Automotive Technology Co., Ltd. | 03/26/25 | M | 1.00 | % | JPMorgan Chase Bank, N.A. | 5,003 USD | 14 | |||||||||||||||
Shanghai New Power Automotive Technology Co., Ltd. | 01/15/25 | M | 1.00 | % | Morgan Stanley Capital Services LLC | 3,037 USD | 50 | |||||||||||||||
Shanghai No 1 Pharmacy Co., Ltd. | 03/19/25 | M | 5.05 | % | JPMorgan Chase Bank, N.A. | 515 USD | 1 | |||||||||||||||
Shanghai No. 1 Pharmacy Co., Ltd. | 01/15/25 | M | 1.00 | % | Morgan Stanley Capital Services LLC | 10,062 USD | (77 | ) | ||||||||||||||
Shanghai Pharmaceuticals Holding Co., Ltd. | 02/19/25 | M | 5.22 | % | JPMorgan Chase Bank, N.A. | 69,480 USD | 476 | |||||||||||||||
Shanghai Pret Composites Co., Ltd. | 01/15/25 | M | 0.72 | % | Morgan Stanley Capital Services LLC | 49,774 USD | 229 | |||||||||||||||
Shanghai Pret Composites Co., Ltd. | 12/16/24 | M | 4.97 | % | JPMorgan Chase Bank, N.A. | 34,771 USD | 189 | |||||||||||||||
Shanghai Pudong Construction Co., Ltd. | 01/15/25 | M | 1.00 | % | Morgan Stanley Capital Services LLC | 65 USD | (4 | ) | ||||||||||||||
Shanghai Pudong Development Bank Co., Ltd. | 04/02/25 | M | 1.00 | % | JPMorgan Chase Bank, N.A. | 62,851 USD | 32 | |||||||||||||||
Shanghai Pudong Development Bank Co., Ltd. | 01/15/25 | M | 1.00 | % | Morgan Stanley Capital Services LLC | 16,435 USD | (8 | ) | ||||||||||||||
Shanghai Putailai New Energy Technology Co., Ltd. | 03/12/25 | M | 4.98 | % | JPMorgan Chase Bank, N.A. | 544,813 USD | 18,067 | |||||||||||||||
See Notes to Consolidated Financial Statements.
222
Table of Contents
Blackstone Alternative Multi-Strategy Fund and Subsidiaries
Consolidated Schedule of Investments ^ (Continued)
March 31, 2023
Reference Instrument | Termination Date | Payment Frequency | Financing Rate | Counterparty | Notional Amount | Unrealized Appreciation (Depreciation) | ||||||||||||||||
Shanghai Putailai New Energy Technology Co., Ltd. | 01/15/25 | M | 1.00 | % | Morgan Stanley Capital Services LLC | 272,760 USD | $ | 6,864 | ||||||||||||||
Shanghai Rongtai Health Technology Corp., Ltd. | 01/15/25 | M | 4.83 | % | Morgan Stanley Capital Services LLC | 10,553 USD | 73 | |||||||||||||||
Shanghai Shyndec Pharmaceutical Co., Ltd. | 03/17/25 | M | 1.00 | % | JPMorgan Chase Bank, N.A. | 279,545 USD | 12,906 | |||||||||||||||
Shanghai Shyndec Pharmaceutical Co., Ltd. | 01/15/25 | M | 1.00 | % | Morgan Stanley Capital Services LLC | 208,760 USD | 9,345 | |||||||||||||||
Shanghai Shyndec Pharmaceutical Co., Ltd. | 01/15/25 | M | 4.72 | % | Morgan Stanley Capital Services LLC | 457 USD | 20 | |||||||||||||||
Shanghai Smith Adhesive New Material Co., Ltd. | 02/19/25 | M | 5.07 | % | JPMorgan Chase Bank, N.A. | 495,190 USD | 1,120 | |||||||||||||||
Shanghai Smith Adhesive New Material Co., Ltd. | 01/15/25 | M | 1.00 | % | Morgan Stanley Capital Services LLC | 69,625 USD | (147 | ) | ||||||||||||||
Shanghai Tianchen Co., Ltd. | 01/15/25 | M | 1.00 | % | Morgan Stanley Capital Services LLC | 10,728 USD | 168 | |||||||||||||||
Shanghai Tongji Science & Technology Industrial Co., Ltd. | 01/15/25 | M | 1.00 | % | Morgan Stanley Capital Services LLC | 8,100 USD | (79 | ) | ||||||||||||||
Shanghai Xinhua Media Co., Ltd. | 03/24/25 | M | 5.14 | % | JPMorgan Chase Bank, N.A. | 285,344 USD | 3,036 | |||||||||||||||
Shanghai Xinhua Media Co., Ltd. | 01/15/25 | M | 4.72 | % | Morgan Stanley Capital Services LLC | 220,499 USD | 2,476 | |||||||||||||||
Shanghai Yaohua Pilkington Glass Group Co., Ltd. | 01/15/25 | M | 4.72 | % | Morgan Stanley Capital Services LLC | 154,579 USD | (5,880 | ) | ||||||||||||||
Shanghai Yaohua Pilkington Glass Group Co., Ltd. | 03/19/25 | M | 5.08 | % | JPMorgan Chase Bank, N.A. | 149,706 USD | (5,651 | ) | ||||||||||||||
Shanghai Yatong Co., Ltd. | 03/24/25 | M | 5.22 | % | JPMorgan Chase Bank, N.A. | 622 USD | 3 | |||||||||||||||
Shanghai Yatong Co., Ltd. | 01/15/25 | M | 4.83 | % | Morgan Stanley Capital Services LLC | 89 USD | — | |||||||||||||||
Shanghai Yct Electronics Group Co., Ltd. | 04/02/25 | M | 5.22 | % | JPMorgan Chase Bank, N.A. | 406,990 USD | 1,140 | |||||||||||||||
Shanghai Yct Electronics Group Co., Ltd. | 01/15/25 | M | 1.00 | % | Morgan Stanley Capital Services LLC | 238,788 USD | 632 | |||||||||||||||
Shanghai Yongmaotai Automotive Technology Co., Ltd. | 04/02/25 | M | 5.22 | % | JPMorgan Chase Bank, N.A. | 49,159 USD | 1,282 | |||||||||||||||
Shanghai Yongmaotai Automotive Technology Co., Ltd. | 01/15/25 | M | 4.83 | % | Morgan Stanley Capital Services LLC | 27,355 USD | 624 | |||||||||||||||
Shanghai Zhenhua Heavy Industries Co., Ltd. | 01/15/25 | M | 2.82 | % | Morgan Stanley Capital Services LLC | 23,821 USD | 501 | |||||||||||||||
Shanghai Zhonggu Logistics Co., Ltd. | 01/15/25 | M | 1.38 | % | Morgan Stanley Capital Services LLC | 60,376 USD | 1,477 | |||||||||||||||
Shanghai Zhonggu Logistics Co., Ltd. | 04/02/25 | M | 1.00 | % | JPMorgan Chase Bank, N.A. | 35,544 USD | 557 | |||||||||||||||
Shantou Dongfeng Printing Co., Ltd. | 01/15/25 | M | 1.00 | % | Morgan Stanley Capital Services LLC | 2,242 USD | (6 | ) | ||||||||||||||
Shantou Wanshun New Material Group Co., Ltd. | 04/02/25 | M | 5.22 | % | JPMorgan Chase Bank, N.A. | 237,042 USD | 4,530 | |||||||||||||||
Shantou Wanshun New Material Group Co., Ltd. | 01/15/25 | M | 1.00 | % | Morgan Stanley Capital Services LLC | 124,072 USD | 1,971 | |||||||||||||||
See Notes to Consolidated Financial Statements.
223
Table of Contents
Blackstone Alternative Multi-Strategy Fund and Subsidiaries
Consolidated Schedule of Investments ^ (Continued)
March 31, 2023
Reference Instrument | Termination Date | Payment Frequency | Financing Rate | Counterparty | Notional Amount | Unrealized Appreciation (Depreciation) | ||||||||||||||||
Shantui Construction Machinery Co., Ltd. | 03/04/25 | M | 4.97 | % | JPMorgan Chase Bank, N.A. | 11,099 USD | $ | (248 | ) | |||||||||||||
Shanxi Antai Group Co., Ltd. | 01/15/25 | M | 1.00 | % | Morgan Stanley Capital Services LLC | 4,210 USD | (10 | ) | ||||||||||||||
Shanxi Antai Group Co., Ltd. | 03/10/25 | M | 5.15 | % | JPMorgan Chase Bank, N.A. | 119,769 USD | (1,790 | ) | ||||||||||||||
Shanxi Lu'an Environmental Energy Development Co., Ltd. | 12/03/24 | M | 5.17 | % | JPMorgan Chase Bank, N.A. | 35,093 USD | 985 | |||||||||||||||
Shaw Communications, Inc. | 03/19/25 | M | 5.48 | % | JPMorgan Chase Bank, N.A. | 9,250,669 CAD | 234,577 | |||||||||||||||
Shen Zhen Australis Electronic Technology Co., Ltd. | 04/02/25 | M | 5.22 | % | JPMorgan Chase Bank, N.A. | 31,900 USD | 156 | |||||||||||||||
Shen Zhen Australis Electronic Technology Co., Ltd. | 01/15/25 | M | 4.83 | % | Morgan Stanley Capital Services LLC | 21,211 USD | 67 | |||||||||||||||
Shengyi Technology Co., Ltd. | 03/18/25 | M | 1.00 | % | JPMorgan Chase Bank, N.A. | 358,168 USD | 3,142 | |||||||||||||||
Shengyi Technology Co., Ltd. | 01/15/25 | M | 1.00 | % | Morgan Stanley Capital Services LLC | 216,255 USD | (812 | ) | ||||||||||||||
Shenyang Jinbei Automotive Co., Ltd. | 04/02/25 | M | 5.22 | % | JPMorgan Chase Bank, N.A. | 70,426 USD | 2,570 | |||||||||||||||
Shenyang Jinbei Automotive Co., Ltd. | 01/15/25 | M | 1.38 | % | Morgan Stanley Capital Services LLC | 37,755 USD | 1,359 | |||||||||||||||
Shenzhen Absen Optoelectronic Co., Ltd. | 03/05/25 | M | 1.00 | % | JPMorgan Chase Bank, N.A. | 563,774 USD | 26,395 | |||||||||||||||
Shenzhen Absen Optoelectronic Co., Ltd. | 01/15/25 | M | 1.00 | % | Morgan Stanley Capital Services LLC | 276,322 USD | 12,343 | |||||||||||||||
Shenzhen Chuangyitong Technology Co., Ltd. | 01/15/25 | M | 4.83 | % | Morgan Stanley Capital Services LLC | 20,088 USD | (12,743 | ) | ||||||||||||||
Shenzhen Click Technology Co., Ltd. | 03/12/25 | M | 5.02 | % | JPMorgan Chase Bank, N.A. | 47,962 USD | (424 | ) | ||||||||||||||
Shenzhen Click Technology Co., Ltd. | 01/15/25 | M | 3.39 | % | Morgan Stanley Capital Services LLC | 71,424 USD | (1,312 | ) | ||||||||||||||
Shenzhen Crastal Technology Co., Ltd. | 03/26/25 | M | 1.00 | % | JPMorgan Chase Bank, N.A. | 104,636 USD | 5,273 | |||||||||||||||
Shenzhen Crastal Technology Co., Ltd. | 01/15/25 | M | 4.83 | % | Morgan Stanley Capital Services LLC | 3,903 USD | 219 | |||||||||||||||
Shenzhen Das Intellitech Co., Ltd. | 02/19/25 | M | 4.97 | % | JPMorgan Chase Bank, N.A. | 28,294 USD | 1,076 | |||||||||||||||
Shenzhen Dynanonic Co., Ltd. | 03/26/25 | M | 5.22 | % | JPMorgan Chase Bank, N.A. | 55,775 USD | (645 | ) | ||||||||||||||
Shenzhen Dynanonic Co., Ltd. | 01/15/25 | M | 2.82 | % | Morgan Stanley Capital Services LLC | 216,523 USD | (7,032 | ) | ||||||||||||||
Shenzhen Everwin Precision Technology Co., Ltd. | 11/04/24 | M | 4.98 | % | JPMorgan Chase Bank, N.A. | 48,048 USD | 2,628 | |||||||||||||||
Shenzhen Fastprint Circuit Tech Co., Ltd. | 04/02/25 | M | 5.22 | % | JPMorgan Chase Bank, N.A. | 334,155 USD | (14,379 | ) | ||||||||||||||
Shenzhen Fastprint Circuit Tech Co., Ltd. | 01/15/25 | M | 1.81 | % | Morgan Stanley Capital Services LLC | 381,843 USD | (15,388 | ) | ||||||||||||||
Shenzhen Fortune Trend Technology Co., Ltd. | 04/02/25 | M | 1.00 | % | JPMorgan Chase Bank, N.A. | 11,940 USD | 580 | |||||||||||||||
See Notes to Consolidated Financial Statements.
224
Table of Contents
Blackstone Alternative Multi-Strategy Fund and Subsidiaries
Consolidated Schedule of Investments ^ (Continued)
March 31, 2023
Reference Instrument | Termination Date | Payment Frequency | Financing Rate | Counterparty | Notional Amount | Unrealized Appreciation (Depreciation) | ||||||||||||||||
Shenzhen Fortune Trend Technology Co., Ltd. | 01/15/25 | M | 1.00 | % | Morgan Stanley Capital Services LLC | 40,816 USD | $ | 2,398 | ||||||||||||||
Shenzhen Glory Medical Co., Ltd. | 01/15/25 | M | 1.00 | % | Morgan Stanley Capital Services LLC | 20,396 USD | 110 | |||||||||||||||
Shenzhen Glory Medical Co., Ltd. | 04/02/25 | M | 5.22 | % | JPMorgan Chase Bank, N.A. | 49,229 USD | 233 | |||||||||||||||
Shenzhen H&T Intelligent Control Co., Ltd. | 03/19/25 | M | 5.07 | % | JPMorgan Chase Bank, N.A. | 329,874 USD | (5,417 | ) | ||||||||||||||
Shenzhen H&T Intelligent Control Co., Ltd. | 01/15/25 | M | 1.00 | % | Morgan Stanley Capital Services LLC | 155,232 USD | (3,901 | ) | ||||||||||||||
Shenzhen Hepalink Pharmaceutical Group Co., Ltd. | 01/15/25 | M | 1.00 | % | Morgan Stanley Capital Services LLC | 77,967 USD | (723 | ) | ||||||||||||||
Shenzhen Hepalink Pharmaceutical Group Co., Ltd. | 03/19/25 | M | 1.00 | % | JPMorgan Chase Bank, N.A. | 271,923 USD | (3,015 | ) | ||||||||||||||
Shenzhen Heungkong Holding Co., Ltd. | 03/31/25 | M | 1.00 | % | JPMorgan Chase Bank, N.A. | 22,542 USD | (409 | ) | ||||||||||||||
Shenzhen Heungkong Holding Co., Ltd. | 01/15/25 | M | 1.00 | % | Morgan Stanley Capital Services LLC | 15,729 USD | (616 | ) | ||||||||||||||
Shenzhen Honor Electronic Co., Ltd. | 04/02/25 | M | 1.00 | % | JPMorgan Chase Bank, N.A. | 180,779 USD | (8,113 | ) | ||||||||||||||
Shenzhen Honor Electronic Co., Ltd. | 01/15/25 | M | 1.00 | % | Morgan Stanley Capital Services LLC | 125,269 USD | (4,823 | ) | ||||||||||||||
Shenzhen Hopewind Electric Co., Ltd. | 03/26/25 | M | 1.00 | % | JPMorgan Chase Bank, N.A. | 37,608 USD | 335 | |||||||||||||||
Shenzhen Hopewind Electric Co., Ltd. | 01/15/25 | M | 2.97 | % | Morgan Stanley Capital Services LLC | 118,617 USD | 349 | |||||||||||||||
Shenzhen Huakong SEG Co., Ltd. | 01/15/25 | M | 1.00 | % | Morgan Stanley Capital Services LLC | 4,300 USD | 15 | |||||||||||||||
Shenzhen Huakong SEG Co., Ltd. | 02/26/25 | M | 5.14 | % | JPMorgan Chase Bank, N.A. | 132,516 USD | (1,011 | ) | ||||||||||||||
Shenzhen Huaqiang Industry Co., Ltd. | 01/15/25 | M | 1.00 | % | Morgan Stanley Capital Services LLC | 113 USD | 7 | |||||||||||||||
Shenzhen Invt Electric Co., Ltd. | 01/15/25 | M | 1.00 | % | Morgan Stanley Capital Services LLC | 44,772 USD | (150 | ) | ||||||||||||||
Shenzhen Jinxinnong Technology Co., Ltd. | 01/15/25 | M | 1.00 | % | Morgan Stanley Capital Services LLC | 243,706 USD | (1,690 | ) | ||||||||||||||
Shenzhen Jinxinnong Technology Co., Ltd. | 04/02/25 | M | 5.22 | % | JPMorgan Chase Bank, N.A. | 425,375 USD | (4,919 | ) | ||||||||||||||
Shenzhen JPT Opto-Electronics Co., Ltd. | 01/15/25 | M | 4.83 | % | Morgan Stanley Capital Services LLC | 10,309 USD | (1,139 | ) | ||||||||||||||
Shenzhen Jt Automation Equipment Co., Ltd. | 01/15/25 | M | 1.00 | % | Morgan Stanley Capital Services LLC | 7,967 USD | 14 | |||||||||||||||
Shenzhen King Explorer Science & Technology Corp. | 01/15/25 | M | 1.00 | % | Morgan Stanley Capital Services LLC | 16 USD | (1 | ) | ||||||||||||||
Shenzhen Kingdom Sci-Tech Co., Ltd. | 01/15/25 | M | 1.00 | % | Morgan Stanley Capital Services LLC | 5,300 USD | 23 | |||||||||||||||
Shenzhen Kingkey Smart Agriculture Times Co., Ltd. | 11/06/24 | M | 4.97 | % | JPMorgan Chase Bank, N.A. | 8,447 USD | 1,327 | |||||||||||||||
See Notes to Consolidated Financial Statements.
225
Table of Contents
Blackstone Alternative Multi-Strategy Fund and Subsidiaries
Consolidated Schedule of Investments ^ (Continued)
March 31, 2023
Reference Instrument | Termination Date | Payment Frequency | Financing Rate | Counterparty | Notional Amount | Unrealized Appreciation (Depreciation) | ||||||||||||||||
Shenzhen Kingkey Smart Agriculture Times Co., Ltd. | 01/15/25 | M | 4.83 | % | Morgan Stanley Capital Services LLC | 12 USD | $ | 2 | ||||||||||||||
Shenzhen Longtech Smart Control Co., Ltd. | 01/15/25 | M | 1.00 | % | Morgan Stanley Capital Services LLC | 5,698 USD | 19 | |||||||||||||||
Shenzhen Moso Power Supply Technology Co., Ltd. | 01/15/25 | M | 1.00 | % | Morgan Stanley Capital Services LLC | 4,636 USD | 54 | |||||||||||||||
Shenzhen MTC Co., Ltd. | 03/26/25 | M | 5.14 | % | JPMorgan Chase Bank, N.A. | 352,109 USD | 6,744 | |||||||||||||||
Shenzhen MTC Co., Ltd. | 01/15/25 | M | 1.00 | % | Morgan Stanley Capital Services LLC | 160,558 USD | 2,153 | |||||||||||||||
Shenzhen Nanshan Power Co., Ltd. | 03/26/25 | M | 5.22 | % | JPMorgan Chase Bank, N.A. | 242,999 USD | 600 | |||||||||||||||
Shenzhen Nanshan Power Co., Ltd. | 01/15/25 | M | 1.00 | % | Morgan Stanley Capital Services LLC | 127,639 USD | 212 | |||||||||||||||
Shenzhen New Industries Biomedical Engineering Co., Ltd. | 01/15/25 | M | 1.38 | % | Morgan Stanley Capital Services LLC | 43,001 USD | 616 | |||||||||||||||
Shenzhen Prince New Materials Co., Ltd. | 01/15/25 | M | 1.00 | % | Morgan Stanley Capital Services LLC | 24,573 USD | 141 | |||||||||||||||
Shenzhen Prince New Materials Co., Ltd. | 04/02/25 | M | 5.22 | % | JPMorgan Chase Bank, N.A. | 41,234 USD | 189 | |||||||||||||||
Shenzhen Rapoo Technology Co., Ltd. | 03/26/25 | M | 5.22 | % | JPMorgan Chase Bank, N.A. | 289,522 USD | 930 | |||||||||||||||
Shenzhen Rapoo Technology Co., Ltd. | 01/15/25 | M | 1.00 | % | Morgan Stanley Capital Services LLC | 97,362 USD | (56 | ) | ||||||||||||||
Shenzhen Salubris Pharmaceuticals Co., Ltd. | 01/15/25 | M | 4.83 | % | Morgan Stanley Capital Services LLC | 353 USD | (3 | ) | ||||||||||||||
Shenzhen Sunlord Electronics Co., Ltd. | 01/15/25 | M | 4.83 | % | Morgan Stanley Capital Services LLC | 309 USD | 2 | |||||||||||||||
Shenzhen Sunrise New Energy Co., Ltd. | 04/02/25 | M | 1.00 | % | JPMorgan Chase Bank, N.A. | 212,699 USD | 3,815 | |||||||||||||||
Shenzhen Sunrise New Energy Co., Ltd. | 01/15/25 | M | 1.81 | % | Morgan Stanley Capital Services LLC | 126,279 USD | 2,318 | |||||||||||||||
Shenzhen Sunshine Laser & Electronics Technology Co., Ltd. | 03/26/25 | M | 5.22 | % | JPMorgan Chase Bank, N.A. | 115,760 USD | (478 | ) | ||||||||||||||
Shenzhen Sunshine Laser & Electronics Technology Co., Ltd. | 01/15/25 | M | 4.83 | % | Morgan Stanley Capital Services LLC | 78,160 USD | (233 | ) | ||||||||||||||
Shenzhen Tagen Group Co., Ltd. | 04/02/25 | M | 5.22 | % | JPMorgan Chase Bank, N.A. | 134,245 USD | (86 | ) | ||||||||||||||
Shenzhen Tagen Group Co., Ltd. | 01/15/25 | M | 1.00 | % | Morgan Stanley Capital Services LLC | 91,147 USD | 113 | |||||||||||||||
Shenzhen Textile Holdings Co., Ltd. | 02/12/25 | M | 4.98 | % | JPMorgan Chase Bank, N.A. | 533,354 USD | 7,508 | |||||||||||||||
Shenzhen Textile Holdings Co., Ltd. | 01/15/25 | M | 4.72 | % | Morgan Stanley Capital Services LLC | 245,527 USD | 3,667 | |||||||||||||||
Shenzhen Topband Co., Ltd. | 03/11/25 | M | 5.11 | % | JPMorgan Chase Bank, N.A. | 712,363 USD | (6,013 | ) | ||||||||||||||
Shenzhen Topband Co., Ltd. | 01/15/25 | M | 1.00 | % | Morgan Stanley Capital Services LLC | 374,093 USD | (3,756 | ) | ||||||||||||||
Shenzhen Weiye Decoration Group Co., Ltd. | 03/25/25 | M | 1.00 | % | JPMorgan Chase Bank, N.A. | 151,042 USD | (2,926 | ) | ||||||||||||||
See Notes to Consolidated Financial Statements.
226
Table of Contents
Blackstone Alternative Multi-Strategy Fund and Subsidiaries
Consolidated Schedule of Investments ^ (Continued)
March 31, 2023
Reference Instrument | Termination Date | Payment Frequency | Financing Rate | Counterparty | Notional Amount | Unrealized Appreciation (Depreciation) | ||||||||||||||||
Shenzhen Weiye Decoration Group Co., Ltd. | 01/15/25 | M | 4.80 | % | Morgan Stanley Capital Services LLC | 17,389 USD | $ | (664 | ) | |||||||||||||
Shenzhen Wenke Landscape Co., Ltd. | 03/10/25 | M | 1.00 | % | JPMorgan Chase Bank, N.A. | 338,315 USD | (11,241 | ) | ||||||||||||||
Shenzhen Wenke Landscape Co., Ltd. | 01/15/25 | M | 1.00 | % | Morgan Stanley Capital Services LLC | 45,233 USD | (234 | ) | ||||||||||||||
Shenzhen Wote Advanced Materials Co., Ltd. | 04/02/25 | M | 1.00 | % | JPMorgan Chase Bank, N.A. | 25,096 USD | 75 | |||||||||||||||
Shenzhen Wote Advanced Materials Co., Ltd. | 01/15/25 | M | 4.83 | % | Morgan Stanley Capital Services LLC | 14,067 USD | 59 | |||||||||||||||
Shenzhen XFH Technology Co., Ltd. | 03/26/25 | M | 5.22 | % | JPMorgan Chase Bank, N.A. | 1,240 USD | (9 | ) | ||||||||||||||
Shenzhen XFH Technology Co., Ltd. | 01/15/25 | M | 4.83 | % | Morgan Stanley Capital Services LLC | 15,796 USD | 197 | |||||||||||||||
Shenzhen Yinghe Technology Co., Ltd. | 03/18/25 | M | 4.97 | % | JPMorgan Chase Bank, N.A. | 9,574 USD | 124 | |||||||||||||||
Shenzhen Yinghe Technology Co., Ltd. | 01/15/25 | M | 4.83 | % | Morgan Stanley Capital Services LLC | 35,975 USD | 321 | |||||||||||||||
Shenzhen Ysstech Info-tech Co., Ltd. | 02/10/25 | M | 4.97 | % | JPMorgan Chase Bank, N.A. | 28,275 USD | 994 | |||||||||||||||
Shenzhen Ysstech Info-tech Co., Ltd. | 01/15/25 | M | 4.83 | % | Morgan Stanley Capital Services LLC | 57 USD | 1 | |||||||||||||||
Shenzhen Zhongjin Lingnan Nonfemet Co., Ltd. | 04/02/25 | M | 5.22 | % | JPMorgan Chase Bank, N.A. | 532,179 USD | 9,233 | |||||||||||||||
Shenzhen Zhongjin Lingnan Nonfemet Co., Ltd. | 01/15/25 | M | 1.00 | % | Morgan Stanley Capital Services LLC | 317,107 USD | 4,934 | |||||||||||||||
Shijiazhuang Kelin Electric Co., Ltd. | 01/15/25 | M | 1.00 | % | Morgan Stanley Capital Services LLC | 4,046 USD | 87 | |||||||||||||||
Shinva Medical Instrument Co., Ltd. | 03/25/25 | M | 5.22 | % | JPMorgan Chase Bank, N.A. | 62,145 USD | 4,702 | |||||||||||||||
Shinva Medical Instrument Co., Ltd. | 01/15/25 | M | 3.09 | % | Morgan Stanley Capital Services LLC | 258,342 USD | 9,450 | |||||||||||||||
Shunfa Hengye Corp. | 02/06/25 | M | 5.08 | % | JPMorgan Chase Bank, N.A. | 259,087 USD | (6,124 | ) | ||||||||||||||
Shunfa Hengye Corp. | 01/15/25 | M | 1.00 | % | Morgan Stanley Capital Services LLC | 148,963 USD | (3,515 | ) | ||||||||||||||
Sichuan Kelun Pharmaceutical Co., Ltd. | 01/15/25 | M | 1.00 | % | Morgan Stanley Capital Services LLC | 76,429 USD | (332 | ) | ||||||||||||||
Sichuan Kexin Mechanical & Electrical Equipment Co., Ltd. | 03/19/25 | M | 5.12 | % | JPMorgan Chase Bank, N.A. | 315,760 USD | (5,206 | ) | ||||||||||||||
Sichuan Kexin Mechanical & Electrical Equipment Co., Ltd. | 01/15/25 | M | 4.80 | % | Morgan Stanley Capital Services LLC | 143,643 USD | (1,859 | ) | ||||||||||||||
Sichuan Mingxing Electric Power Co. | 03/25/25 | M | 5.06 | % | JPMorgan Chase Bank, N.A. | 38,848 USD | (953 | ) | ||||||||||||||
Sichuan Mingxing Electric Power Co. | 01/15/25 | M | 4.80 | % | Morgan Stanley Capital Services LLC | 20,313 USD | (499 | ) | ||||||||||||||
Sichuan Road & Bridge Group Co., Ltd. | 01/15/25 | M | 1.00 | % | Morgan Stanley Capital Services LLC | 249,421 USD | 15,259 | |||||||||||||||
Sichuan Road and Bridge Group Co., Ltd. | 02/06/25 | M | 1.00 | % | JPMorgan Chase Bank, N.A. | 717,498 USD | 43,004 | |||||||||||||||
Sichuan Teway Food Group Co., Ltd. | 01/15/25 | M | 4.83 | % | Morgan Stanley Capital Services LLC | 72 USD | — | |||||||||||||||
See Notes to Consolidated Financial Statements.
227
Table of Contents
Blackstone Alternative Multi-Strategy Fund and Subsidiaries
Consolidated Schedule of Investments ^ (Continued)
March 31, 2023
Reference Instrument | Termination Date | Payment Frequency | Financing Rate | Counterparty | Notional Amount | Unrealized Appreciation (Depreciation) | ||||||||||||||||
Sichuan Teway Food Group Co., Ltd. | 02/25/25 | M | 1.00 | % | JPMorgan Chase Bank, N.A. | 148,038 USD | $ | 519 | ||||||||||||||
Sichuan Xichang Electric Power Co., Ltd. | 01/15/25 | M | 4.83 | % | Morgan Stanley Capital Services LLC | 4,675 USD | (7 | ) | ||||||||||||||
Sieyuan Electric Co., Ltd. | 04/02/25 | M | 1.00 | % | JPMorgan Chase Bank, N.A. | 11,263 USD | 47 | |||||||||||||||
Sino-Platinum Metals Co., Ltd. | 04/02/25 | M | 1.00 | % | JPMorgan Chase Bank, N.A. | 158,398 USD | 160 | |||||||||||||||
Sino-Platinum Metals Co., Ltd. | 01/15/25 | M | 1.00 | % | Morgan Stanley Capital Services LLC | 105,155 USD | 676 | |||||||||||||||
Sinocelltech Group Ltd. | 01/15/25 | M | 4.83 | % | Morgan Stanley Capital Services LLC | 254 USD | (3 | ) | ||||||||||||||
Sinolink Securities Co., Ltd. | 01/15/25 | M | 4.97 | % | JPMorgan Chase Bank, N.A. | 10,242 USD | (71 | ) | ||||||||||||||
Sinoma International Engineering Co. | 01/15/25 | M | 1.00 | % | Morgan Stanley Capital Services LLC | 34 USD | — | |||||||||||||||
Sinomach Precision Industry Co., Ltd. | 04/02/25 | M | 1.00 | % | JPMorgan Chase Bank, N.A. | 134,591 USD | 1,406 | |||||||||||||||
Sinomach Precision Industry Co., Ltd. | 01/15/25 | M | 1.81 | % | Morgan Stanley Capital Services LLC | 85,136 USD | 1,030 | |||||||||||||||
Sinopec Oilfield Service Corp. | 01/15/25 | M | 1.00 | % | Morgan Stanley Capital Services LLC | 257,684 USD | (4,438 | ) | ||||||||||||||
Sinopec Oilfield Service Corp. | 03/12/25 | M | 1.00 | % | JPMorgan Chase Bank, N.A. | 792,322 USD | (14,492 | ) | ||||||||||||||
Sinosteel Engineering & Technology Co., Ltd. | 03/25/25 | M | 4.98 | % | JPMorgan Chase Bank, N.A. | 64,066 USD | (5,598 | ) | ||||||||||||||
Sinosteel Engineering & Technology Co., Ltd. | 01/15/25 | M | 4.83 | % | Morgan Stanley Capital Services LLC | 48 USD | (5 | ) | ||||||||||||||
SPDR S&P Biotech ETF | 09/25/24 | M | 4.83 | % | Morgan Stanley Capital Services LLC | 19,647,521 USD | 49,106 | |||||||||||||||
SPIC Industry-Finance Holdings Co., Ltd. | 01/15/25 | M | 1.00 | % | Morgan Stanley Capital Services LLC | 199,425 USD | (6,521 | ) | ||||||||||||||
SPIC Industry-Finance Holdings Co., Ltd. | 12/18/24 | M | 4.99 | % | JPMorgan Chase Bank, N.A. | 479,670 USD | (16,699 | ) | ||||||||||||||
Spirit Airlines, Inc. | 02/09/24 | M | 5.07 | % | JPMorgan Chase Bank, N.A. | 4,786,530 USD | 28,041 | |||||||||||||||
Star Lake Bioscience Co., Inc. | 03/19/25 | M | 5.09 | % | JPMorgan Chase Bank, N.A. | 43,707 USD | (371 | ) | ||||||||||||||
Star Lake Bioscience Co., Inc. | 01/15/25 | M | 1.00 | % | Morgan Stanley Capital Services LLC | 27,946 USD | (207 | ) | ||||||||||||||
Star Lake Bioscience Co., Inc. | 02/05/25 | M | 4.97 | % | JPMorgan Chase Bank, N.A. | 405,155 USD | (2,986 | ) | ||||||||||||||
Star Lake Bioscience Co., Inc. | 01/15/25 | M | 4.72 | % | Morgan Stanley Capital Services LLC | 171,534 USD | (1,290 | ) | ||||||||||||||
State Grid Information & Communication Co., Ltd. | 01/15/25 | M | 1.00 | % | Morgan Stanley Capital Services LLC | 258 USD | (6 | ) | ||||||||||||||
Strait Innovation Internet Co., Ltd. | 02/19/25 | M | 5.01 | % | JPMorgan Chase Bank, N.A. | 337,471 USD | 2,546 | |||||||||||||||
Strait Innovation Internet Co., Ltd. | 01/15/25 | M | 1.00 | % | Morgan Stanley Capital Services LLC | 85,933 USD | 917 | |||||||||||||||
Sumec Corp., Ltd. | 04/02/25 | M | 5.22 | % | JPMorgan Chase Bank, N.A. | 59,253 USD | 255 | |||||||||||||||
Sumec Corp., Ltd. | 01/15/25 | M | 1.81 | % | Morgan Stanley Capital Services LLC | 52,142 USD | 514 | |||||||||||||||
Sunflower Pharmaceutical Group Co., Ltd. | 01/15/25 | M | 1.38 | % | Morgan Stanley Capital Services LLC | 9,263 USD | 346 | |||||||||||||||
Suning Universal Co., Ltd. | 04/02/25 | M | 1.00 | % | JPMorgan Chase Bank, N.A. | 5,169 USD | 13 | |||||||||||||||
See Notes to Consolidated Financial Statements.
228
Table of Contents
Blackstone Alternative Multi-Strategy Fund and Subsidiaries
Consolidated Schedule of Investments ^ (Continued)
March 31, 2023
Reference Instrument | Termination Date | Payment Frequency | Financing Rate | Counterparty | Notional Amount | Unrealized Appreciation (Depreciation) | ||||||||||||||||
Suning Universal Co., Ltd. | 01/15/25 | M | 1.00 | % | Morgan Stanley Capital Services LLC | 2,571 USD | $ | (2 | ) | |||||||||||||
Sunstone Development Co., Ltd. | 03/17/25 | M | 4.97 | % | JPMorgan Chase Bank, N.A. | 6,340 USD | (286 | ) | ||||||||||||||
Sunstone Development Co., Ltd. | 01/15/25 | M | 1.00 | % | Morgan Stanley Capital Services LLC | 2,818 USD | (127 | ) | ||||||||||||||
Sunstone Development Co., Ltd. | 02/19/25 | M | 4.97 | % | JPMorgan Chase Bank, N.A. | 3,874 USD | (175 | ) | ||||||||||||||
Sunstone Development Co., Ltd. | 01/15/25 | M | 4.83 | % | Morgan Stanley Capital Services LLC | 35,575 USD | (1,609 | ) | ||||||||||||||
Suntront Techonology Co., Ltd. | 03/19/25 | M | 5.07 | % | JPMorgan Chase Bank, N.A. | 283,147 USD | (1,762 | ) | ||||||||||||||
Suntront Techonology Co., Ltd. | 01/15/25 | M | 1.00 | % | Morgan Stanley Capital Services LLC | 111,586 USD | (801 | ) | ||||||||||||||
Suofeiya Home Collection Co., Ltd. | 03/26/25 | M | 5.17 | % | JPMorgan Chase Bank, N.A. | 811,135 USD | 1,098 | |||||||||||||||
Suofeiya Home Collection Co., Ltd. | 01/15/25 | M | 1.00 | % | Morgan Stanley Capital Services LLC | 367,890 USD | 4,695 | |||||||||||||||
Suzhou Anjie Technology Co., Ltd. | 01/15/25 | M | 2.97 | % | Morgan Stanley Capital Services LLC | 17,039 USD | (36 | ) | ||||||||||||||
Suzhou Architecture Research Institute Group Co., Ltd. | 04/02/25 | M | 1.00 | % | JPMorgan Chase Bank, N.A. | 66,141 USD | (380 | ) | ||||||||||||||
Suzhou Architecture Research Institute Group Co., Ltd. | 01/15/25 | M | 1.00 | % | Morgan Stanley Capital Services LLC | 16,307 USD | (116 | ) | ||||||||||||||
Suzhou Hailu Heavy Industry Co., Ltd. | 04/02/25 | M | 1.00 | % | JPMorgan Chase Bank, N.A. | 34,594 USD | (127 | ) | ||||||||||||||
Suzhou Hailu Heavy Industry Co., Ltd. | 01/15/25 | M | 4.83 | % | Morgan Stanley Capital Services LLC | 34,136 USD | (164 | ) | ||||||||||||||
Suzhou Hengmingda Electronic Technology Co., Ltd. | 03/05/25 | M | 4.97 | % | JPMorgan Chase Bank, N.A. | 122,492 USD | 1,855 | |||||||||||||||
Suzhou Hengmingda Electronic Technology Co., Ltd. | 01/15/25 | M | 1.00 | % | Morgan Stanley Capital Services LLC | 98,973 USD | 1,461 | |||||||||||||||
Suzhou Hesheng Special Material Co., Ltd. | 03/19/25 | M | 5.16 | % | JPMorgan Chase Bank, N.A. | 29,521 USD | (1,044 | ) | ||||||||||||||
Suzhou Hesheng Special Material Co., Ltd. | 01/15/25 | M | 4.83 | % | Morgan Stanley Capital Services LLC | 1,012 USD | (30 | ) | ||||||||||||||
Suzhou Recodeal Interconnect System Co., Ltd. | 03/31/25 | M | 1.00 | % | JPMorgan Chase Bank, N.A. | 568,294 USD | 1,218 | |||||||||||||||
Suzhou Recodeal Interconnect System Co., Ltd. | 01/15/25 | M | 1.00 | % | Morgan Stanley Capital Services LLC | 336,925 USD | (1,627 | ) | ||||||||||||||
Suzhou Sushi Testing Group Co., Ltd. | 01/15/25 | M | 1.00 | % | Morgan Stanley Capital Services LLC | 262,457 USD | 1,072 | |||||||||||||||
Suzhou Sushi Testing Group Co., Ltd. | 04/02/25 | M | 5.22 | % | JPMorgan Chase Bank, N.A. | 447,681 USD | 2,412 | |||||||||||||||
Suzhou Victory Precision Manufacture Co., Ltd. | 04/02/25 | M | 5.22 | % | JPMorgan Chase Bank, N.A. | 103,814 USD | 1,681 | |||||||||||||||
See Notes to Consolidated Financial Statements.
229
Table of Contents
Blackstone Alternative Multi-Strategy Fund and Subsidiaries
Consolidated Schedule of Investments ^ (Continued)
March 31, 2023
Reference Instrument | Termination Date | Payment Frequency | Financing Rate | Counterparty | Notional Amount | Unrealized Appreciation (Depreciation) | ||||||||||||||||
Suzhou Victory Precision Manufacture Co., Ltd. | 01/15/25 | M | 1.00 | % | Morgan Stanley Capital Services LLC | 63,556 USD | $ | 1,250 | ||||||||||||||
Swancor Advanced Materials Co., Ltd. | 03/26/25 | M | 5.22 | % | JPMorgan Chase Bank, N.A. | 14,798 USD | (678 | ) | ||||||||||||||
Tangrenshen Group Co., Ltd. | 01/15/25 | M | 5.22 | % | JPMorgan Chase Bank, N.A. | 26,791 USD | 2,896 | |||||||||||||||
Tangrenshen Group Co., Ltd. | 01/15/25 | M | 0.72 | % | Morgan Stanley Capital Services LLC | 92 USD | 11 | |||||||||||||||
Tangshan Jidong Cement Co., Ltd. | 04/02/25 | M | 5.22 | % | JPMorgan Chase Bank, N.A. | 51,766 USD | 149 | |||||||||||||||
TangShan Port Group Co., Ltd. | 01/15/25 | M | 1.00 | % | Morgan Stanley Capital Services LLC | 36,108 USD | (1,146 | ) | ||||||||||||||
Tasly Pharmaceutical Group Co., Ltd. | 03/17/25 | M | 4.98 | % | JPMorgan Chase Bank, N.A. | 49,364 USD | 570 | |||||||||||||||
Tasly Pharmaceutical Group Co., Ltd. | 01/15/25 | M | 3.42 | % | Morgan Stanley Capital Services LLC | 58,573 USD | 1,435 | |||||||||||||||
Tayho Advanced Materials Group Co., Ltd. | 01/15/25 | M | 4.83 | % | Morgan Stanley Capital Services LLC | 150 USD | 14 | |||||||||||||||
TCL Technology Group Corp. | 01/15/25 | M | 1.81 | % | Morgan Stanley Capital Services LLC | 11,760 USD | 101 | |||||||||||||||
Tederic Machinery Co., Ltd. | 04/02/25 | M | 1.00 | % | JPMorgan Chase Bank, N.A. | 91,867 USD | 374 | |||||||||||||||
Tederic Machinery Co., Ltd. | 01/15/25 | M | 1.00 | % | Morgan Stanley Capital Services LLC | 60,781 USD | 660 | |||||||||||||||
Tengda Construction Group Co., Ltd. | 04/02/25 | M | 5.22 | % | JPMorgan Chase Bank, N.A. | 17,368 USD | 12 | |||||||||||||||
Tengda Construction Group Co., Ltd. | 01/15/25 | M | 1.00 | % | Morgan Stanley Capital Services LLC | 21,091 USD | (109 | ) | ||||||||||||||
Three's Co. Media Group Co., Ltd. | 04/02/25 | M | 1.00 | % | JPMorgan Chase Bank, N.A. | 84,085 USD | (90 | ) | ||||||||||||||
Tianjin 712 Communication & Broadcasting Co., Ltd. | 03/26/25 | M | 1.00 | % | JPMorgan Chase Bank, N.A. | 613,286 USD | (22,499 | ) | ||||||||||||||
Tianjin 712 Communication & Broadcasting Co., Ltd. | 01/15/25 | M | 1.00 | % | Morgan Stanley Capital Services LLC | 360,294 USD | (15,541 | ) | ||||||||||||||
Tianjin Chase Sun Pharmaceutical Co., Ltd. | 01/15/25 | M | 1.81 | % | Morgan Stanley Capital Services LLC | 67,748 USD | 798 | |||||||||||||||
Tianjin Jinbin Development Co., Ltd. | 03/26/25 | M | 5.22 | % | JPMorgan Chase Bank, N.A. | 101,303 USD | 485 | |||||||||||||||
Tianjin Jinbin Development Co., Ltd. | 01/15/25 | M | 1.00 | % | Morgan Stanley Capital Services LLC | 7,172 USD | (35 | ) | ||||||||||||||
Tianjin Lvyin Landscape & Ecology Construction Co., Ltd. | 01/15/25 | M | 1.00 | % | Morgan Stanley Capital Services LLC | 10,003 USD | 27 | |||||||||||||||
Tianjin Lvyin Landscape and Ecology Construction Co., Ltd. | 03/26/25 | M | 1.00 | % | JPMorgan Chase Bank, N.A. | 290,292 USD | (6,535 | ) | ||||||||||||||
Tianjin Printronics Circuit Corp. | 01/15/25 | M | 4.83 | % | Morgan Stanley Capital Services LLC | 37 USD | (1 | ) | ||||||||||||||
Tianjin Ringpu Bio-Technology Co., Ltd. | 03/26/25 | M | 5.22 | % | JPMorgan Chase Bank, N.A. | 280,370 USD | 8,086 | |||||||||||||||
Tianjin Ringpu Bio-Technology Co., Ltd. | 01/15/25 | M | 1.00 | % | Morgan Stanley Capital Services LLC | 240,728 USD | 4,270 | |||||||||||||||
See Notes to Consolidated Financial Statements.
230
Table of Contents
Blackstone Alternative Multi-Strategy Fund and Subsidiaries
Consolidated Schedule of Investments ^ (Continued)
March 31, 2023
Reference Instrument | Termination Date | Payment Frequency | Financing Rate | Counterparty | Notional Amount | Unrealized Appreciation (Depreciation) | ||||||||||||||||
Tianjin Teda Co., Ltd. | 01/15/25 | M | 1.38 | % | Morgan Stanley Capital Services LLC | 18,986 USD | $ | 70 | ||||||||||||||
Tianjin Tianyao Pharmaceutical Co., Ltd. | 03/19/25 | M | 1.00 | % | JPMorgan Chase Bank, N.A. | 1,018 USD | 29 | |||||||||||||||
Tianjin Tianyao Pharmaceutical Co., Ltd. | 01/15/25 | M | 4.83 | % | Morgan Stanley Capital Services LLC | 192 USD | 4 | |||||||||||||||
Tianjin You Fa Steel Pipe Group Stock Co., Ltd. | 02/05/25 | M | 4.99 | % | JPMorgan Chase Bank, N.A. | 110,518 USD | (2,347 | ) | ||||||||||||||
Tianjin You Fa Steel Pipe Group Stock Co., Ltd. | 01/15/25 | M | 1.38 | % | Morgan Stanley Capital Services LLC | 17,777 USD | 116 | |||||||||||||||
Tianneng Battery Group Co., Ltd. | 01/15/25 | M | 3.48 | % | Morgan Stanley Capital Services LLC | 36,011 USD | 95 | |||||||||||||||
Tianrun Industry Technology Co., Ltd. | 03/11/25 | M | 1.00 | % | JPMorgan Chase Bank, N.A. | 196,597 USD | 11,265 | |||||||||||||||
Tianrun Industry Technology Co., Ltd. | 01/15/25 | M | 1.00 | % | Morgan Stanley Capital Services LLC | 169,535 USD | 9,343 | |||||||||||||||
Tibet Summit Resources Co., Ltd. | 01/15/25 | M | 1.00 | % | Morgan Stanley Capital Services LLC | 27,732 USD | (97 | ) | ||||||||||||||
Tibet Weixinkang Medicine Co., Ltd. | 01/22/25 | M | 4.97 | % | JPMorgan Chase Bank, N.A. | 15,507 USD | 584 | |||||||||||||||
Tibet Weixinkang Medicine Co., Ltd. | 03/17/25 | M | 4.97 | % | JPMorgan Chase Bank, N.A. | 6,351 USD | 128 | |||||||||||||||
Tibet Weixinkang Medicine Co., Ltd. | 01/15/25 | M | 1.00 | % | Morgan Stanley Capital Services LLC | 1,240 USD | 14 | |||||||||||||||
Time Publishing and Media Co., Ltd. | 03/26/25 | M | 5.22 | % | JPMorgan Chase Bank, N.A. | 95,939 USD | 611 | |||||||||||||||
Time Publishing and Media Co., Ltd. | 01/15/25 | M | 1.00 | % | Morgan Stanley Capital Services LLC | 3,541 USD | 16 | |||||||||||||||
Titan Wind Energy Suzhou Co., Ltd. | 04/02/25 | M | 1.00 | % | JPMorgan Chase Bank, N.A. | 13,075 USD | 27 | |||||||||||||||
Toly Bread Co., Ltd. | 01/15/25 | M | 1.00 | % | Morgan Stanley Capital Services LLC | 211 USD | (2 | ) | ||||||||||||||
Tongkun Group Co., Ltd. | 03/10/25 | M | 1.00 | % | JPMorgan Chase Bank, N.A. | 25,148 USD | 555 | |||||||||||||||
Tongling Jingda Special Magnet Wire Co., Ltd. | 01/15/25 | M | 1.00 | % | Morgan Stanley Capital Services LLC | 8,964 USD | (160 | ) | ||||||||||||||
Tongling Nonferrous Metals Group Co., Ltd. | 04/02/25 | M | 1.00 | % | JPMorgan Chase Bank, N.A. | 20,497 USD | 26 | |||||||||||||||
Tongling Nonferrous Metals Group Co., Ltd. | 01/15/25 | M | 1.38 | % | Morgan Stanley Capital Services LLC | 13,838 USD | 126 | |||||||||||||||
Top Score Fashion Co., Ltd. | 03/26/25 | M | 1.00 | % | JPMorgan Chase Bank, N.A. | 119,478 USD | (2,276 | ) | ||||||||||||||
Top Score Fashion Co., Ltd. | 01/15/25 | M | 1.00 | % | Morgan Stanley Capital Services LLC | 4,140 USD | (10 | ) | ||||||||||||||
Topsec Technologies Group, Inc. | 01/15/25 | M | 1.00 | % | Morgan Stanley Capital Services LLC | 16,349 USD | 51 | |||||||||||||||
Traffic Control Technology Co., Ltd. | 03/31/25 | M | 5.22 | % | JPMorgan Chase Bank, N.A. | 140,358 USD | (3,670 | ) | ||||||||||||||
Traffic Control Technology Co., Ltd. | 01/15/25 | M | 4.83 | % | Morgan Stanley Capital Services LLC | 68,569 USD | (1,579 | ) | ||||||||||||||
Transaction Media Networks, Inc. | 03/18/25 | M | 0.02 | % | Morgan Stanley Capital Services LLC | 17,831,820 JPY | — | |||||||||||||||
TravelCenters of America, Inc. | 02/20/25 | M | 5.07 | % | JPMorgan Chase Bank, N.A. | 3,664,679 USD | 98,763 | |||||||||||||||
See Notes to Consolidated Financial Statements.
231
Table of Contents
Blackstone Alternative Multi-Strategy Fund and Subsidiaries
Consolidated Schedule of Investments ^ (Continued)
March 31, 2023
Reference Instrument | Termination Date | Payment Frequency | Financing Rate | Counterparty | Notional Amount | Unrealized Appreciation (Depreciation) | ||||||||||||||||
Triductor Technology Suzhou Inc. | 01/15/25 | M | 1.00 | % | Morgan Stanley Capital Services LLC | 46,708 USD | $ | 549 | ||||||||||||||
Trina Solar Co., Ltd. | 01/15/25 | M | 1.00 | % | Morgan Stanley Capital Services LLC | 219 USD | (7 | ) | ||||||||||||||
Triumph New Energy Co., Ltd. | 03/19/25 | M | 1.00 | % | JPMorgan Chase Bank, N.A. | 173,672 USD | 3 | |||||||||||||||
Triumph New Energy Co., Ltd. | 01/15/25 | M | 1.00 | % | Morgan Stanley Capital Services LLC | 64,884 USD | (359 | ) | ||||||||||||||
Tsingtao Brewery Co., Ltd. | 01/15/25 | M | 3.48 | % | Morgan Stanley Capital Services LLC | 190,696 USD | 23,412 | |||||||||||||||
Tsingtao Brewery Co., Ltd. | 03/05/25 | M | 4.97 | % | JPMorgan Chase Bank, N.A. | 51,578 USD | 6,336 | |||||||||||||||
Tus-Pharmaceutical Group Co., Ltd. | 03/17/25 | M | 1.00 | % | JPMorgan Chase Bank, N.A. | 116,970 USD | (4,922 | ) | ||||||||||||||
Tus-Pharmaceutical Group Co., Ltd. | 01/15/25 | M | 4.83 | % | Morgan Stanley Capital Services LLC | 3,897 USD | (90 | ) | ||||||||||||||
U.S. Treasury Bonds | 06/09/23 | T | 3.63 | % | Morgan Stanley Capital Services LLC | 2,555,000 USD | 108,406 | |||||||||||||||
U.S. Treasury Notes | 06/09/23 | T | 3.50 | % | Morgan Stanley Capital Services LLC | 3,873,000 USD | 162,136 | |||||||||||||||
U.S. Treasury Notes | 06/09/23 | T | 3.88 | % | Morgan Stanley Capital Services LLC | 3,542,000 USD | 156,202 | |||||||||||||||
U.S. Treasury Notes | 06/09/23 | T | 4.00 | % | Morgan Stanley Capital Services LLC | 6,095,000 USD | 154,349 | |||||||||||||||
U.S. Treasury Notes | 06/09/23 | T | 4.00 | % | Morgan Stanley Capital Services LLC | 7,091,000 USD | 235,253 | |||||||||||||||
U.S. Treasury Notes | 06/09/23 | T | 4.00 | % | Morgan Stanley Capital Services LLC | 6,491,000 USD | 242,593 | |||||||||||||||
U.S. Treasury Notes | 06/09/23 | T | 4.63 | % | Morgan Stanley Capital Services LLC | 1,787,000 USD | 34,428 | |||||||||||||||
Uni-Select, Inc. | 03/03/25 | M | 5.48 | % | JPMorgan Chase Bank, N.A. | 112,721CAD | 486 | |||||||||||||||
Unisplendour Corp. Ltd. | 03/26/25 | M | 5.21 | % | JPMorgan Chase Bank, N.A. | 61,177 USD | (3,124 | ) | ||||||||||||||
Universal Scientific Industrial Shanghai Co., Ltd. | 01/15/25 | M | 1.00 | % | Morgan Stanley Capital Services LLC | 380,729 USD | (9,954 | ) | ||||||||||||||
Universal Scientific Industrial Shanghai Co., Ltd. | 03/19/25 | M | 5.21 | % | JPMorgan Chase Bank, N.A. | 697,723 USD | (16,314 | ) | ||||||||||||||
VanJee Technology Co., Ltd. | 03/26/25 | M | 5.22 | % | JPMorgan Chase Bank, N.A. | 402,438 USD | 5,561 | |||||||||||||||
VanJee Technology Co., Ltd. | 01/15/25 | M | 1.00 | % | Morgan Stanley Capital Services LLC | 215,658 USD | 2,838 | |||||||||||||||
Visionox Technology, Inc. | 04/02/25 | M | 1.00 | % | JPMorgan Chase Bank, N.A. | 3,693 USD | (7 | ) | ||||||||||||||
VMware, Inc. | 05/30/24 | M | 5.07 | % | JPMorgan Chase Bank, N.A. | 5,074,440 USD | 268,765 | |||||||||||||||
Vontron Technology Co., Ltd. | 03/26/25 | M | 5.22 | % | JPMorgan Chase Bank, N.A. | 121,382 USD | 566 | |||||||||||||||
Vontron Technology Co., Ltd. | 01/15/25 | M | 1.00 | % | Morgan Stanley Capital Services LLC | 73,768 USD | 291 | |||||||||||||||
Wanbangde Pharmaceutical Holding Group Co., Ltd. | 01/15/25 | M | 4.83 | % | Morgan Stanley Capital Services LLC | 137,346 USD | (2,159 | ) | ||||||||||||||
Wanbangde Pharmaceutical Holding Group Co., Ltd. | 03/17/25 | M | 5.08 | % | JPMorgan Chase Bank, N.A. | 10,336 USD | (154 | ) | ||||||||||||||
Wanbangde Pharmaceutical Holding Group Co., Ltd. | 01/15/25 | M | 1.00 | % | Morgan Stanley Capital Services LLC | 15,866 USD | (41 | ) | ||||||||||||||
See Notes to Consolidated Financial Statements.
232
Table of Contents
Blackstone Alternative Multi-Strategy Fund and Subsidiaries
Consolidated Schedule of Investments ^ (Continued)
March 31, 2023
Reference Instrument | Termination Date | Payment Frequency | Financing Rate | Counterparty | Notional Amount | Unrealized Appreciation (Depreciation) | ||||||||||||||||
Wanbangde Pharmaceutical Holding Group Co., Ltd. | 12/17/24 | M | 4.97 | % | JPMorgan Chase Bank, N.A. | 344,809 USD | $ | (5,369 | ) | |||||||||||||
Wanxiang Qianchao Co., Ltd. | 03/19/25 | M | 5.20 | % | JPMorgan Chase Bank, N.A. | 33,450 USD | 547 | |||||||||||||||
Wanxiang Qianchao Co., Ltd. | 01/15/25 | M | 1.00 | % | Morgan Stanley Capital Services LLC | 1,529 USD | (1 | ) | ||||||||||||||
Ways Electron Co., Ltd. | 01/15/25 | M | 1.00 | % | Morgan Stanley Capital Services LLC | 132,185 USD | (4,418 | ) | ||||||||||||||
Ways Electron Co., Ltd. | 03/12/25 | M | 5.09 | % | JPMorgan Chase Bank, N.A. | 330,110 USD | (12,920 | ) | ||||||||||||||
Weichai Power Co., Ltd. | 04/02/25 | M | 5.22 | % | JPMorgan Chase Bank, N.A. | 24,300 USD | 656 | |||||||||||||||
Weichai Power Co., Ltd. | 01/15/25 | M | 1.00 | % | Morgan Stanley Capital Services LLC | 90,272 USD | 2,580 | |||||||||||||||
Weihai Guangtai Airport Equipment Co., Ltd. | 04/02/25 | M | 5.22 | % | JPMorgan Chase Bank, N.A. | 238,579 USD | 3,892 | |||||||||||||||
Weihai Guangtai Airport Equipment Co., Ltd. | 01/15/25 | M | 1.00 | % | Morgan Stanley Capital Services LLC | 128,806 USD | 2,582 | |||||||||||||||
Wellhope Foods Co., Ltd. | 01/15/25 | M | 1.00 | % | Morgan Stanley Capital Services LLC | 157,246 USD | 2,993 | |||||||||||||||
Wellhope Foods Co., Ltd. | 10/23/24 | M | 1.00 | % | JPMorgan Chase Bank, N.A. | 520,017 USD | 11,220 | |||||||||||||||
Wenfeng Great World Chain Development Corp. | 01/15/25 | M | 1.00 | % | Morgan Stanley Capital Services LLC | 2,977 USD | 5 | |||||||||||||||
Wens Foodstuffs Group Co., Ltd. | 02/26/25 | M | 4.97 | % | JPMorgan Chase Bank, N.A. | 2,743 USD | 236 | |||||||||||||||
Wenzhou Hongfeng Electrical Alloy Co., Ltd. | 04/02/25 | M | 1.00 | % | JPMorgan Chase Bank, N.A. | 48,217 USD | 216 | |||||||||||||||
Wenzhou Hongfeng Electrical Alloy Co., Ltd. | 01/15/25 | M | 1.00 | % | Morgan Stanley Capital Services LLC | 1,562 USD | 6 | |||||||||||||||
Western Metal Materials Co., Ltd. | 03/19/25 | M | 5.03 | % | JPMorgan Chase Bank, N.A. | 38,680 USD | 3,076 | |||||||||||||||
Western Metal Materials Co., Ltd. | 01/15/25 | M | 3.41 | % | Morgan Stanley Capital Services LLC | 46,125 USD | 4,330 | |||||||||||||||
Western Region Gold Co., Ltd. | 01/15/25 | M | 1.00 | % | Morgan Stanley Capital Services LLC | 166 USD | (12 | ) | ||||||||||||||
Whirlpool China Co., Ltd. | 03/26/25 | M | 5.22 | % | JPMorgan Chase Bank, N.A. | 58,382 USD | (31 | ) | ||||||||||||||
Whirlpool China Co., Ltd. | 01/15/25 | M | 1.00 | % | Morgan Stanley Capital Services LLC | 2,001 USD | 15 | |||||||||||||||
Winner Medical Co., Ltd. | 01/21/25 | M | 4.97 | % | JPMorgan Chase Bank, N.A. | 50,884 USD | 174 | |||||||||||||||
Wolong Real Estate Group Co., Ltd. | 01/15/25 | M | 1.00 | % | Morgan Stanley Capital Services LLC | 233,334 USD | (4,223 | ) | ||||||||||||||
Wolong Real Estate Group Co., Ltd. | 11/04/24 | M | 5.08 | % | JPMorgan Chase Bank, N.A. | 559,853 USD | (12,228 | ) | ||||||||||||||
Wuhu Token Science Co., Ltd. | 01/15/25 | M | 1.38 | % | Morgan Stanley Capital Services LLC | 32,723 USD | 226 | |||||||||||||||
WUS Printed Circuit Kunshan Co., Ltd. | 01/15/25 | M | 4.83 | % | Morgan Stanley Capital Services LLC | 126 USD | 30 | |||||||||||||||
Wuxi Autowell Technology Co., Ltd. | 04/02/25 | M | 1.00 | % | JPMorgan Chase Bank, N.A. | 69,017 USD | 158 | |||||||||||||||
Wuxi Hongsheng Heat Exchanger Manufacturing Co., Ltd. | 03/25/25 | M | 5.10 | % | JPMorgan Chase Bank, N.A. | 271,451 USD | (20,412 | ) | ||||||||||||||
Wuxi Hongsheng Heat Exchanger Manufacturing Co., Ltd. | 01/15/25 | M | 4.78 | % | Morgan Stanley Capital Services LLC | 14,128 USD | (1,174 | ) | ||||||||||||||
See Notes to Consolidated Financial Statements.
233
Table of Contents
Blackstone Alternative Multi-Strategy Fund and Subsidiaries
Consolidated Schedule of Investments ^ (Continued)
March 31, 2023
Reference Instrument | Termination Date | Payment Frequency | Financing Rate | Counterparty | Notional Amount | Unrealized Appreciation (Depreciation) | ||||||||||||||||
Wuxi Lihu Corp., Ltd. | 04/02/25 | M | 1.00 | % | JPMorgan Chase Bank, N.A. | 8,680 USD | $ | 7 | ||||||||||||||
Wuxi Lihu Corp., Ltd. | 01/15/25 | M | 1.00 | % | Morgan Stanley Capital Services LLC | 3,410 USD | 3 | |||||||||||||||
Wuxi NCE Power Co., Ltd. | 01/15/25 | M | 1.00 | % | Morgan Stanley Capital Services LLC | 473 USD | 10 | |||||||||||||||
Wuxi New Hongtai Electrical Technology Co., Ltd. | 04/02/25 | M | 5.22 | % | JPMorgan Chase Bank, N.A. | 10,566 USD | 65 | |||||||||||||||
Wuxi Rural Commercial Bank Co., Ltd. | 03/24/25 | M | 5.08 | % | JPMorgan Chase Bank, N.A. | 2,059 USD | (23 | ) | ||||||||||||||
Wuxi Rural Commercial Bank Co., Ltd. | 01/15/25 | M | 2.82 | % | Morgan Stanley Capital Services LLC | 7,759 USD | (86 | ) | ||||||||||||||
Xi'an Bright Laser Technologies Co., Ltd. | 03/24/25 | M | 1.00 | % | JPMorgan Chase Bank, N.A. | 74,779 USD | 1,900 | |||||||||||||||
Xiamen Amoytop Biotech Co., Ltd. | 01/15/25 | M | 1.00 | % | Morgan Stanley Capital Services LLC | 2,616 USD | 11 | |||||||||||||||
Xiamen C & D, Inc. | 03/26/25 | M | 1.00 | % | JPMorgan Chase Bank, N.A. | 696,786 USD | 9,479 | |||||||||||||||
Xiamen C & D, Inc. | 01/15/25 | M | 1.00 | % | Morgan Stanley Capital Services LLC | 395,786 USD | 6,088 | |||||||||||||||
Xiamen Faratronic Co., Ltd. | 03/19/25 | M | 1.00 | % | JPMorgan Chase Bank, N.A. | 500,010 USD | (9,192 | ) | ||||||||||||||
Xiamen Faratronic Co., Ltd. | 01/15/25 | M | 1.00 | % | Morgan Stanley Capital Services LLC | 254,642 USD | (6,045 | ) | ||||||||||||||
Xiamen R&T Plumbing Technology Co., Ltd. | 04/02/25 | M | 1.00 | % | JPMorgan Chase Bank, N.A. | 137,149 USD | (400 | ) | ||||||||||||||
Xiamen R&T Plumbing Technology Co., Ltd. | 01/15/25 | M | 1.00 | % | Morgan Stanley Capital Services LLC | 27,699 USD | (63 | ) | ||||||||||||||
Xiamen XGMA Machinery Co., Ltd. | 04/02/25 | M | 5.22 | % | JPMorgan Chase Bank, N.A. | 6,314 USD | 19 | |||||||||||||||
Xiamen Yanjan New Material Co., Ltd. | 04/02/25 | M | 1.00 | % | JPMorgan Chase Bank, N.A. | 96,805 USD | 708 | |||||||||||||||
Xiamen Yanjan New Material Co., Ltd. | 01/15/25 | M | 1.00 | % | Morgan Stanley Capital Services LLC | 29,221 USD | 245 | |||||||||||||||
Xiandai Investment Co., Ltd. | 03/26/25 | M | 1.00 | % | JPMorgan Chase Bank, N.A. | 212,458 USD | (258 | ) | ||||||||||||||
Xiandai Investment Co., Ltd. | 01/15/25 | M | 1.00 | % | Morgan Stanley Capital Services LLC | 100,634 USD | (965 | ) | ||||||||||||||
Xiangtan Electric Manufacturing Co., Ltd. | 03/18/25 | M | 1.00 | % | JPMorgan Chase Bank, N.A. | 30,454 USD | (192 | ) | ||||||||||||||
Xianhe Co., Ltd. | 03/19/25 | M | 5.01 | % | JPMorgan Chase Bank, N.A. | 623,725 USD | (63,592 | ) | ||||||||||||||
Xianhe Co., Ltd. | 01/15/25 | M | 1.00 | % | Morgan Stanley Capital Services LLC | 255,144 USD | (24,675 | ) | ||||||||||||||
Xinfengming Group Co., Ltd. | 01/15/25 | M | 4.83 | % | Morgan Stanley Capital Services LLC | 81 USD | (2 | ) | ||||||||||||||
Xinjiang Hejin Holding Co., Ltd. | 04/02/25 | M | 1.00 | % | JPMorgan Chase Bank, N.A. | 285,163 USD | 5,704 | |||||||||||||||
Xinjiang Hejin Holding Co., Ltd. | 01/15/25 | M | 1.00 | % | Morgan Stanley Capital Services LLC | 201,615 USD | 4,924 | |||||||||||||||
Xinjiang Joinworld Co., Ltd. | 01/15/25 | M | 1.00 | % | Morgan Stanley Capital Services LLC | 21,063 USD | 259 | |||||||||||||||
Xinjiang Tianshan Cement Co., Ltd. | 01/15/25 | M | 4.83 | % | Morgan Stanley Capital Services LLC | 66 USD | (4 | ) | ||||||||||||||
Xinjiang Xuefeng Sci-Tech Group Co., Ltd. | 02/05/25 | M | 1.00 | % | JPMorgan Chase Bank, N.A. | 30,861 USD | (680 | ) | ||||||||||||||
See Notes to Consolidated Financial Statements.
234
Table of Contents
Blackstone Alternative Multi-Strategy Fund and Subsidiaries
Consolidated Schedule of Investments ^ (Continued)
March 31, 2023
Reference Instrument | Termination Date | Payment Frequency | Financing Rate | Counterparty | Notional Amount | Unrealized Appreciation (Depreciation) | ||||||||||||||||
Xinjiang Xuefeng Sci-Tech Group Co., Ltd. | 03/17/25 | M | 5.05 | % | JPMorgan Chase Bank, N.A. | 27,557 USD | $ | (620 | ) | |||||||||||||
Xinxiang Richful Lube Additive Co., Ltd. | 01/15/25 | M | 1.00 | % | Morgan Stanley Capital Services LLC | 340,306 USD | 13,633 | |||||||||||||||
Xinxiang Richful Lube Additive Co., Ltd. | 03/26/25 | M | 1.00 | % | JPMorgan Chase Bank, N.A. | 629,962 USD | 29,431 | |||||||||||||||
Xinxing Ductile Iron Pipes Co., Ltd. | 03/26/25 | M | 5.22 | % | JPMorgan Chase Bank, N.A. | 571,724 USD | 2,705 | |||||||||||||||
Xinxing Ductile Iron Pipes Co., Ltd. | 01/15/25 | M | 1.81 | % | Morgan Stanley Capital Services LLC | 349,304 USD | 1,804 | |||||||||||||||
Xizi Clean Energy Equipment Manufacturing Co., Ltd. | 02/19/25 | M | 1.00 | % | JPMorgan Chase Bank, N.A. | 583,910 USD | (16,539 | ) | ||||||||||||||
Xizi Clean Energy Equipment Manufacturing Co., Ltd. | 01/15/25 | M | 1.00 | % | Morgan Stanley Capital Services LLC | 295,606 USD | (8,999 | ) | ||||||||||||||
Xuji Electric Co., Ltd. | 03/26/25 | M | 5.22 | % | JPMorgan Chase Bank, N.A. | 603,263 USD | 2,181 | |||||||||||||||
Xuji Electric Co., Ltd. | 01/15/25 | M | 1.00 | % | Morgan Stanley Capital Services LLC | 405,928 USD | (2,412 | ) | ||||||||||||||
Yangling Metron New Material, Inc. | 01/08/25 | M | 4.97 | % | JPMorgan Chase Bank, N.A. | 125,862 USD | 299 | |||||||||||||||
Yangling Metron New Material, Inc. | 01/15/25 | M | 4.83 | % | Morgan Stanley Capital Services LLC | 514 USD | 9 | |||||||||||||||
Yangtze Optical Fibre & Cable Joint Stock Ltd., Co. | 03/19/25 | M | 4.97 | % | JPMorgan Chase Bank, N.A. | 60,343 USD | 1,107 | |||||||||||||||
Yangtze Optical Fibre & Cable Joint Stock Ltd., Co. | 01/15/25 | M | 2.97 | % | Morgan Stanley Capital Services LLC | 42,387 USD | 388 | |||||||||||||||
Yantai Changyu Pioneer Wine Co., Ltd. | 04/02/25 | M | 1.00 | % | JPMorgan Chase Bank, N.A. | 62,399 USD | 222 | |||||||||||||||
Yantai Changyu Pioneer Wine Co., Ltd. | 01/15/25 | M | 1.00 | % | Morgan Stanley Capital Services LLC | 47,049 USD | 391 | |||||||||||||||
Yantai Dongcheng Pharmaceutical Co., Ltd. | 04/02/25 | M | 5.22 | % | JPMorgan Chase Bank, N.A. | 57,295 USD | 1,767 | |||||||||||||||
YanTai Shuangta Food Co., Ltd. | 03/05/25 | M | 4.97 | % | JPMorgan Chase Bank, N.A. | 58,181 USD | 241 | |||||||||||||||
YanTai Shuangta Food Co., Ltd. | 01/15/25 | M | 1.00 | % | Morgan Stanley Capital Services LLC | 52,475 USD | 198 | |||||||||||||||
Yantai Zhenghai Bio-tech Co., Ltd. | 04/02/25 | M | 1.00 | % | JPMorgan Chase Bank, N.A. | 28,381 USD | (266 | ) | ||||||||||||||
Yantai Zhenghai Bio-tech Co., Ltd. | 01/15/25 | M | 1.38 | % | Morgan Stanley Capital Services LLC | 28,900 USD | (132 | ) | ||||||||||||||
Yapp Automotive Parts Co., Ltd. | 03/24/25 | M | 5.20 | % | JPMorgan Chase Bank, N.A. | 22,179 USD | 508 | |||||||||||||||
Yapp Automotive Parts Co., Ltd. | 01/15/25 | M | 4.83 | % | Morgan Stanley Capital Services LLC | 894 USD | 14 | |||||||||||||||
Yechiu Metal Recycling China Ltd. | 03/17/25 | M | 1.00 | % | JPMorgan Chase Bank, N.A. | 38,060 USD | (1,227 | ) | ||||||||||||||
Yechiu Metal Recycling China Ltd. | 03/12/25 | M | 1.00 | % | JPMorgan Chase Bank, N.A. | 21,682 USD | (744 | ) | ||||||||||||||
YGSOFT, Inc. | 03/26/25 | M | 5.22 | % | JPMorgan Chase Bank, N.A. | 29,264 USD | (964 | ) | ||||||||||||||
See Notes to Consolidated Financial Statements.
235
Table of Contents
Blackstone Alternative Multi-Strategy Fund and Subsidiaries
Consolidated Schedule of Investments ^ (Continued)
March 31, 2023
Reference Instrument | Termination Date | Payment Frequency | Financing Rate | Counterparty | Notional Amount | Unrealized Appreciation (Depreciation) | ||||||||||||||||
YGSOFT, Inc. | 01/15/25 | M | 3.09 | % | Morgan Stanley Capital Services LLC | 101,158 USD | $ | (1,560 | ) | |||||||||||||
Yifan Pharmaceutical Co., Ltd. | 01/15/25 | M | 1.00 | % | Morgan Stanley Capital Services LLC | 8,605 USD | (24 | ) | ||||||||||||||
Yongji Printing Co., Ltd. | 03/25/25 | M | 5.21 | % | JPMorgan Chase Bank, N.A. | 107,611 USD | 2,014 | |||||||||||||||
Yongji Printing Co., Ltd. | 01/15/25 | M | 4.83 | % | Morgan Stanley Capital Services LLC | 4,816 USD | 39 | |||||||||||||||
Yonyou Network Technology Co., Ltd. | 02/12/25 | M | 4.98 | % | JPMorgan Chase Bank, N.A. | 61,376 USD | 109 | |||||||||||||||
Yonyou Network Technology Co., Ltd. | 01/15/25 | M | 1.38 | % | Morgan Stanley Capital Services LLC | 62,955 USD | 3,654 | |||||||||||||||
Youyou Foods Co., Ltd. | 03/19/25 | M | 5.09 | % | JPMorgan Chase Bank, N.A. | 237,961 USD | 21,064 | |||||||||||||||
Youyou Foods Co., Ltd. | 01/15/25 | M | 4.72 | % | Morgan Stanley Capital Services LLC | 131,742 USD | 11,308 | |||||||||||||||
Yueyang Forest & Paper Co., Ltd. | 03/17/25 | M | 1.00 | % | JPMorgan Chase Bank, N.A. | 26,775 USD | 1,122 | |||||||||||||||
Yueyang Forest & Paper Co., Ltd. | 01/15/25 | M | 1.00 | % | Morgan Stanley Capital Services LLC | 74 USD | — | |||||||||||||||
Yueyang Xingchang Petrochemical | 03/31/25 | M | 1.00 | % | JPMorgan Chase Bank, N.A. | 233,774 USD | 137 | |||||||||||||||
Yueyang Xingchang Petrochemical | 01/15/25 | M | 2.82 | % | Morgan Stanley Capital Services LLC | 191,620 USD | (228 | ) | ||||||||||||||
Yunnan Luoping Zinc & Electricity Co., Ltd. | 03/26/25 | M | 5.22 | % | JPMorgan Chase Bank, N.A. | 8,677 USD | (179 | ) | ||||||||||||||
Yunnan Luoping Zinc & Electricity Co., Ltd. | 01/15/25 | M | 1.00 | % | Morgan Stanley Capital Services LLC | 198 USD | — | |||||||||||||||
Yunnan Shennong Agricultural Industry Group Co., Ltd. | 03/26/25 | M | 1.00 | % | JPMorgan Chase Bank, N.A. | 4,467 USD | 39 | |||||||||||||||
Yunnan Shennong Agricultural Industry Group Co., Ltd. | 01/15/25 | M | 1.00 | % | Morgan Stanley Capital Services LLC | 4,152 USD | (22 | ) | ||||||||||||||
Yunnan Shennong Agricultural Industry Group Co., Ltd. | 02/05/25 | M | 4.97 | % | JPMorgan Chase Bank, N.A. | 374,504 USD | 5,446 | |||||||||||||||
Yunnan Shennong Agricultural Industry Group Co., Ltd. | 01/15/25 | M | 4.72 | % | Morgan Stanley Capital Services LLC | 99,599 USD | 1,433 | |||||||||||||||
Yunnan Tin Co., Ltd. | 01/15/25 | M | 1.81 | % | Morgan Stanley Capital Services LLC | 138,404 USD | 857 | |||||||||||||||
Yunnan Tin Co., Ltd. | 04/02/25 | M | 5.22 | % | JPMorgan Chase Bank, N.A. | 15,204 USD | 149 | |||||||||||||||
Yunnan Yunwei Co., Ltd. | 03/26/25 | M | 1.00 | % | JPMorgan Chase Bank, N.A. | 26,580 USD | (168 | ) | ||||||||||||||
Yunnan Yunwei Co., Ltd. | 01/15/25 | M | 1.00 | % | Morgan Stanley Capital Services LLC | 872 USD | 1 | |||||||||||||||
Yutong Bus Co., Ltd. | 01/15/25 | M | 4.83 | % | Morgan Stanley Capital Services LLC | 102 USD | 22 | |||||||||||||||
Yutong Heavy Industries Co., Ltd. | 03/26/25 | M | 5.22 | % | JPMorgan Chase Bank, N.A. | 119,781 USD | 2,342 | |||||||||||||||
Yutong Heavy Industries Co., Ltd. | 01/15/25 | M | 2.97 | % | Morgan Stanley Capital Services LLC | 69,602 USD | 1,391 | |||||||||||||||
Zhangjiagang Freetrade Science & Technology Group Co., Ltd. | 01/15/25 | M | 1.00 | % | Morgan Stanley Capital Services LLC | 42,928 USD | (1,796 | ) | ||||||||||||||
See Notes to Consolidated Financial Statements.
236
Table of Contents
Blackstone Alternative Multi-Strategy Fund and Subsidiaries
Consolidated Schedule of Investments ^ (Continued)
March 31, 2023
Reference Instrument | Termination Date | Payment Frequency | Financing Rate | Counterparty | Notional Amount | Unrealized Appreciation (Depreciation) | ||||||||||||||||
Zhangjiagang Freetrade Science & Technology Group Co., Ltd. | 02/12/25 | M | 5.01 | % | JPMorgan Chase Bank, N.A. | 346,765 USD | $ | (15,721 | ) | |||||||||||||
Zhangjiagang Haiguo New Energy Equipment Manufacturing Co., Ltd. | 04/02/25 | M | 5.22 | % | JPMorgan Chase Bank, N.A. | 33,009 USD | 159 | |||||||||||||||
Zhangjiagang Haiguo New Energy Equipment Manufacturing Co., Ltd. | 01/15/25 | M | 4.83 | % | Morgan Stanley Capital Services LLC | 26,863 USD | 195 | |||||||||||||||
Zhe Jiang Kangsheng Co., Ltd. | 01/22/25 | M | 5.04 | % | JPMorgan Chase Bank, N.A. | 73,673 USD | (1,630 | ) | ||||||||||||||
Zhe Jiang Taihua New Material Co., Ltd. | 04/02/25 | M | 5.22 | % | JPMorgan Chase Bank, N.A. | 56,372 USD | 255 | |||||||||||||||
Zhe Jiang Taihua New Material Co., Ltd. | 01/15/25 | M | 1.00 | % | Morgan Stanley Capital Services LLC | 38,690 USD | 89 | |||||||||||||||
Zhejiang Asia-Pacific Mechanical & Electronic Co., Ltd. | 03/17/25 | M | 4.97 | % | JPMorgan Chase Bank, N.A. | 20,341 USD | 667 | |||||||||||||||
Zhejiang Bangjie Holding Group Co., Ltd. | 04/02/25 | M | 1.00 | % | JPMorgan Chase Bank, N.A. | 17,977 USD | 24 | |||||||||||||||
Zhejiang Bangjie Holding Group Co., Ltd. | 01/15/25 | M | 1.00 | % | Morgan Stanley Capital Services LLC | 7,923 USD | 7 | |||||||||||||||
Zhejiang Cfmoto Power Co., Ltd. | 03/31/25 | M | 5.22 | % | JPMorgan Chase Bank, N.A. | 319,020 USD | 2,033 | |||||||||||||||
Zhejiang Cfmoto Power Co., Ltd. | 01/15/25 | M | 1.00 | % | Morgan Stanley Capital Services LLC | 247,549 USD | 1,954 | |||||||||||||||
Zhejiang Chinastars New Materials Group Co., Ltd. | 04/02/25 | M | 1.00 | % | JPMorgan Chase Bank, N.A. | 38,017 USD | 178 | |||||||||||||||
Zhejiang Chinastars New Materials Group Co., Ltd. | 01/15/25 | M | 1.00 | % | Morgan Stanley Capital Services LLC | 7,238 USD | 121 | |||||||||||||||
Zhejiang Communications Technology Co., Ltd. | 03/11/25 | M | 5.15 | % | JPMorgan Chase Bank, N.A. | 7,649 USD | 60 | |||||||||||||||
Zhejiang Crystal-Optech Co., Ltd. | 01/15/25 | M | 1.00 | % | Morgan Stanley Capital Services LLC | 298,548 USD | 2,060 | |||||||||||||||
Zhejiang Crystal-Optech Co., Ltd. | 03/31/25 | M | 1.00 | % | JPMorgan Chase Bank, N.A. | 373,686 USD | 1,061 | |||||||||||||||
Zhejiang East-Asia Pharmaceutical Co., Ltd. | 04/02/25 | M | 5.22 | % | JPMorgan Chase Bank, N.A. | 41,085 USD | 171 | |||||||||||||||
Zhejiang East-Asia Pharmaceutical Co., Ltd. | 01/15/25 | M | 1.00 | % | Morgan Stanley Capital Services LLC | 6,000 USD | 47 | |||||||||||||||
Zhejiang Fulai New Material Co., Ltd. | 03/26/25 | M | 1.00 | % | JPMorgan Chase Bank, N.A. | 67,852 USD | (2,375 | ) | ||||||||||||||
Zhejiang Fulai New Material Co., Ltd. | 01/15/25 | M | 1.00 | % | Morgan Stanley Capital Services LLC | 2,211 USD | (8 | ) | ||||||||||||||
Zhejiang Golden Eagle Co., Ltd. | 03/26/25 | M | 5.22 | % | JPMorgan Chase Bank, N.A. | 146,462 USD | (1,401 | ) | ||||||||||||||
Zhejiang Golden Eagle Co., Ltd. | 01/15/25 | M | 1.00 | % | Morgan Stanley Capital Services LLC | 27,375 USD | 1 | |||||||||||||||
Zhejiang HangKe Technology, Inc., Co. | 01/15/25 | M | 4.83 | % | Morgan Stanley Capital Services LLC | 74 USD | (2 | ) | ||||||||||||||
Zhejiang Heda Technology Co., Ltd. | 04/02/25 | M | 1.00 | % | JPMorgan Chase Bank, N.A. | 8,598 USD | 238 | |||||||||||||||
See Notes to Consolidated Financial Statements.
237
Table of Contents
Blackstone Alternative Multi-Strategy Fund and Subsidiaries
Consolidated Schedule of Investments ^ (Continued)
March 31, 2023
Reference Instrument | Termination Date | Payment Frequency | Financing Rate | Counterparty | Notional Amount | Unrealized Appreciation (Depreciation) | ||||||||||||||||
Zhejiang Hisun Pharmaceutical Co., Ltd. | 03/19/25 | M | 4.97 | % | JPMorgan Chase Bank, N.A. | 56,329 USD | $ | (121 | ) | |||||||||||||
Zhejiang Hisun Pharmaceutical Co., Ltd. | 01/15/25 | M | 3.48 | % | Morgan Stanley Capital Services LLC | 107,674 USD | 84 | |||||||||||||||
Zhejiang Hongchang Electrical Technology Co., Ltd. | 03/26/25 | M | 5.22 | % | JPMorgan Chase Bank, N.A. | 10,993 USD | 289 | |||||||||||||||
Zhejiang Huada New Material Co., Ltd. | 02/12/25 | M | 1.00 | % | JPMorgan Chase Bank, N.A. | 354,209 USD | (7,589 | ) | ||||||||||||||
Zhejiang Huada New Material Co., Ltd. | 01/15/25 | M | 1.00 | % | Morgan Stanley Capital Services LLC | 12,330 USD | 9 | |||||||||||||||
Zhejiang Huahai Pharmaceutical Co., Ltd. | 01/15/25 | M | 1.00 | % | Morgan Stanley Capital Services LLC | 68,489 USD | 488 | |||||||||||||||
Zhejiang Huahai Pharmaceutical Co., Ltd. | 06/26/24 | M | 1.00 | % | JPMorgan Chase Bank, N.A. | 256,744 USD | 1,844 | |||||||||||||||
Zhejiang Huakang Pharmaceutical Co., Ltd. | 01/15/25 | M | 4.83 | % | Morgan Stanley Capital Services LLC | 116 USD | (8 | ) | ||||||||||||||
Zhejiang Huangma Technology Co., Ltd. | 01/15/25 | M | 1.00 | % | Morgan Stanley Capital Services LLC | 7,588 USD | (91 | ) | ||||||||||||||
Zhejiang Jinggong Science & Technology Co., Ltd. | 04/02/25 | M | 5.22 | % | JPMorgan Chase Bank, N.A. | 26,476 USD | (119 | ) | ||||||||||||||
Zhejiang Jingxin Pharmaceutical Co., Ltd. | 03/11/25 | M | 4.97 | % | JPMorgan Chase Bank, N.A. | 458,451 USD | 16,122 | |||||||||||||||
Zhejiang Jingxin Pharmaceutical Co., Ltd. | 01/15/25 | M | 3.48 | % | Morgan Stanley Capital Services LLC | 262,843 USD | 9,001 | |||||||||||||||
Zhejiang JIULI Hi-tech Metals Co., Ltd. | 01/22/25 | M | 5.21 | % | JPMorgan Chase Bank, N.A. | 127,354 USD | 443 | |||||||||||||||
Zhejiang Jiuzhou Pharmaceutical Co., Ltd. | 04/02/25 | M | 1.00 | % | JPMorgan Chase Bank, N.A. | 156,086 USD | (2,564 | ) | ||||||||||||||
Zhejiang Jiuzhou Pharmaceutical Co., Ltd. | 01/15/25 | M | 1.00 | % | Morgan Stanley Capital Services LLC | 68,465 USD | (1,148 | ) | ||||||||||||||
Zhejiang Jolly Pharmaceutical Co., Ltd. | 04/02/25 | M | 1.00 | % | JPMorgan Chase Bank, N.A. | 51,758 USD | 1,072 | |||||||||||||||
Zhejiang Juli Culture Development Co., Ltd. | 01/15/25 | M | 4.72 | % | Morgan Stanley Capital Services LLC | 160,086 USD | (5,505 | ) | ||||||||||||||
Zhejiang Juli Culture Development Co., Ltd. | 03/18/25 | M | 5.13 | % | JPMorgan Chase Bank, N.A. | 512,361 USD | (15,857 | ) | ||||||||||||||
Zhejiang KangLongDa Special Protection Technology Co., Ltd. | 04/02/25 | M | 1.00 | % | JPMorgan Chase Bank, N.A. | 77,772 USD | 347 | |||||||||||||||
Zhejiang KangLongDa Special Protection Technology Co., Ltd. | 01/15/25 | M | 1.00 | % | Morgan Stanley Capital Services LLC | 24,691 USD | 185 | |||||||||||||||
Zhejiang Orient Financial Holdings Group Co., Ltd. | 03/26/25 | M | 1.00 | % | JPMorgan Chase Bank, N.A. | 220,058 USD | (4,084 | ) | ||||||||||||||
Zhejiang Orient Financial Holdings Group Co., Ltd. | 01/15/25 | M | 1.00 | % | Morgan Stanley Capital Services LLC | 184,967 USD | (2,527 | ) | ||||||||||||||
Zhejiang Renzhi Co., Ltd. | 02/18/25 | M | 4.99 | % | JPMorgan Chase Bank, N.A. | 183,509 USD | (13,740 | ) | ||||||||||||||
Zhejiang Renzhi Co., Ltd. | 01/15/25 | M | 1.00 | % | Morgan Stanley Capital Services LLC | 15,917 USD | (1,224 | ) | ||||||||||||||
Zhejiang Sanhua Intelligent Controls Co., Ltd. | 12/11/24 | M | 5.19 | % | JPMorgan Chase Bank, N.A. | 55,920 USD | 663 | |||||||||||||||
See Notes to Consolidated Financial Statements.
238
Table of Contents
Blackstone Alternative Multi-Strategy Fund and Subsidiaries
Consolidated Schedule of Investments ^ (Continued)
March 31, 2023
Reference Instrument | Termination Date | Payment Frequency | Financing Rate | Counterparty | Notional Amount | Unrealized Appreciation (Depreciation) | ||||||||||||||||
Zhejiang Semir Garment Co., Ltd. | 03/26/25 | M | 5.21 | % | JPMorgan Chase Bank, N.A. | 202,262 USD | $ | 1,592 | ||||||||||||||
Zhejiang Semir Garment Co., Ltd. | 01/15/25 | M | 1.00 | % | Morgan Stanley Capital Services LLC | 103,344 USD | 467 | |||||||||||||||
Zhejiang Sunrise Garment Group Co., Ltd. | 03/26/25 | M | 5.22 | % | JPMorgan Chase Bank, N.A. | 19,437 USD | (160 | ) | ||||||||||||||
Zhejiang Sunrise Garment Group Co., Ltd. | 01/15/25 | M | 1.00 | % | Morgan Stanley Capital Services LLC | 578 USD | 2 | |||||||||||||||
Zhejiang Supor Co., Ltd. | 04/02/25 | M | 5.22 | % | JPMorgan Chase Bank, N.A. | 13,943 USD | (547 | ) | ||||||||||||||
Zhejiang Tailin Bioengineering Co., Ltd. | 01/15/25 | M | 1.00 | % | Morgan Stanley Capital Services LLC | 112,088 USD | 305 | |||||||||||||||
Zhejiang Tailin Bioengineering Co., Ltd. | 03/26/25 | M | 5.19 | % | JPMorgan Chase Bank, N.A. | 227,117 USD | 746 | |||||||||||||||
Zhejiang Vie Science & Technology Co., Ltd. | 04/02/25 | M | 5.22 | % | JPMorgan Chase Bank, N.A. | 216,029 USD | 1,612 | |||||||||||||||
Zhejiang Vie Science & Technology Co., Ltd. | 01/15/25 | M | 1.00 | % | Morgan Stanley Capital Services LLC | 131,771 USD | 1,201 | |||||||||||||||
Zhejiang Wanfeng Auto Wheel Co., Ltd. | 01/08/25 | M | 4.97 | % | JPMorgan Chase Bank, N.A. | 68,283 USD | 1,051 | |||||||||||||||
Zhejiang Wanfeng Auto Wheel Co., Ltd. | 01/15/25 | M | 3.48 | % | Morgan Stanley Capital Services LLC | 52,521 USD | 611 | |||||||||||||||
Zhejiang Wanliyang Co., Ltd. | 03/12/25 | M | 4.98 | % | JPMorgan Chase Bank, N.A. | 130,118 USD | (6,202 | ) | ||||||||||||||
Zhejiang Xinneng Solar Photovoltaic Technology Co., Ltd. | 01/15/25 | M | 4.83 | % | Morgan Stanley Capital Services LLC | 83 USD | (1 | ) | ||||||||||||||
Zhejiang Yasha Decoration Co., Ltd. | 03/19/25 | M | 5.15 | % | JPMorgan Chase Bank, N.A. | 109,606 USD | (2,009 | ) | ||||||||||||||
Zhejiang Yinlun Machinery Co., Ltd. | 04/02/25 | M | 5.22 | % | JPMorgan Chase Bank, N.A. | 309,452 USD | 1,621 | |||||||||||||||
Zhejiang Yinlun Machinery Co., Ltd. | 01/15/25 | M | 1.81 | % | Morgan Stanley Capital Services LLC | 210,539 USD | 1,018 | |||||||||||||||
Zhejiang Yonghe Refrigerant Co., Ltd. | 01/15/25 | M | 1.00 | % | Morgan Stanley Capital Services LLC | 230,537 USD | 12,612 | |||||||||||||||
Zhejiang Yonghe Refrigerant Co., Ltd. | 03/26/25 | M | 5.22 | % | JPMorgan Chase Bank, N.A. | 287,432USD | 16,847 | |||||||||||||||
Zhejiang Yongjin Metal Technology Co Ltd. | 04/02/25 | M | 5.22 | % | JPMorgan Chase Bank, N.A. | 361,032 USD | 6,779 | |||||||||||||||
Zhejiang Yongjin Metal Technology Co Ltd. | 01/15/25 | M | 1.00 | % | Morgan Stanley Capital Services LLC | 202,830 USD | 3,743 | |||||||||||||||
Zhengzhou Coal Mining Machinery Group Co., Ltd. | 02/10/25 | M | 1.00 | % | JPMorgan Chase Bank, N.A. | 122,274 USD | 3,761 | |||||||||||||||
Zhengzhou Jiean Hi-Tech Co., Ltd. | 03/19/25 | M | 5.01 | % | JPMorgan Chase Bank, N.A. | 412,464 USD | 27,455 | |||||||||||||||
Zhengzhou Jiean Hi-Tech Co., Ltd. | 01/15/25 | M | 4.72 | % | Morgan Stanley Capital Services LLC | 200,670 USD | 11,824 | |||||||||||||||
Zhengzhou Tiamaes Technology Co., Ltd. | 03/26/25 | M | 5.22 | % | JPMorgan Chase Bank, N.A. | 537,186 USD | (4,811 | ) | ||||||||||||||
Zhengzhou Tiamaes Technology Co., Ltd. | 01/15/25 | M | 1.00 | % | Morgan Stanley Capital Services LLC | 180,287 USD | (2,177 | ) | ||||||||||||||
Zheshang Securities Co., Ltd. | 01/15/25 | M | 1.38 | % | Morgan Stanley Capital Services LLC | 6,021 USD | (13 | ) | ||||||||||||||
See Notes to Consolidated Financial Statements.
239
Table of Contents
Blackstone Alternative Multi-Strategy Fund and Subsidiaries
Consolidated Schedule of Investments ^ (Continued)
March 31, 2023
Reference Instrument | Termination Date | Payment Frequency | Financing Rate | Counterparty | Notional Amount | Unrealized Appreciation (Depreciation) | ||||||||||||||||
Zhonghong Pulin Medical Products Co., Ltd. | 04/02/25 | M | 1.00 | % | JPMorgan Chase Bank, N.A. | 18,938 USD | $ | 620 | ||||||||||||||
Zhongjing Food Co., Ltd. | 03/26/25 | M | 5.22 | % | JPMorgan Chase Bank, N.A. | 191,798 USD | 12,690 | |||||||||||||||
Zhongjing Food Co., Ltd. | 01/15/25 | M | 1.00 | % | Morgan Stanley Capital Services LLC | 105,262 USD | 7,778 | |||||||||||||||
Zhongyin Babi Food Co., Ltd. | 04/02/25 | M | 5.22 | % | JPMorgan Chase Bank, N.A. | 50,866 USD | 48 | |||||||||||||||
Zhongyin Babi Food Co., Ltd. | 01/15/25 | M | 1.00 | % | Morgan Stanley Capital Services LLC | 30,161 USD | 112 | |||||||||||||||
Zhongyuan Environment-Protection Co., Ltd. | 03/25/25 | M | 5.18 | % | JPMorgan Chase Bank, N.A. | 165,803 USD | (9,145 | ) | ||||||||||||||
Zhongyuan Environment-Protection Co., Ltd. | 01/15/25 | M | 3.41 | % | Morgan Stanley Capital Services LLC | 16,598 USD | (932 | ) | ||||||||||||||
Zhuhai CosMX Battery Co., Ltd. | 01/15/25 | M | 3.27 | % | Morgan Stanley Capital Services LLC | 85,890 USD | (3,641 | ) | ||||||||||||||
Zhuhai Huafa Properties Co., Ltd. | 03/17/25 | M | 1.00 | % | JPMorgan Chase Bank, N.A. | 11,368 USD | 397 | |||||||||||||||
Zhuhai Winbase International Chemical Tank Terminal Co., Ltd. | 03/12/25 | M | 4.98 | % | JPMorgan Chase Bank, N.A. | 112,473 USD | (243 | ) | ||||||||||||||
Zhuhai Winbase International Chemical Tank Terminal Co., Ltd. | 01/15/25 | M | 1.00 | % | Morgan Stanley Capital Services LLC | 3,949 USD | 5 | |||||||||||||||
Zhuzhou CRRC Times Electric Co., Ltd. | 01/15/25 | M | 1.00 | % | Morgan Stanley Capital Services LLC | 307,273 USD | (20,750 | ) | ||||||||||||||
Zhuzhou CRRC Times Electric Co., Ltd. | 03/19/25 | M | 1.00 | % | JPMorgan Chase Bank, N.A. | 1,012 USD | (67 | ) | ||||||||||||||
Zhuzhou Hongda Electronics Corp. Ltd. | 03/19/25 | M | 5.00 | % | JPMorgan Chase Bank, N.A. | 508,542 USD | 5,730 | |||||||||||||||
Zhuzhou Hongda Electronics Corp. Ltd. | 01/15/25 | M | 3.40 | % | Morgan Stanley Capital Services LLC | 211,158 USD | 1,187 | |||||||||||||||
Zhuzhou Qianjin Pharmaceutical Co., Ltd. | 04/02/25 | M | 5.22 | % | JPMorgan Chase Bank, N.A. | 32,477 USD | 752 | |||||||||||||||
Zhuzhou Qianjin Pharmaceutical Co., Ltd. | 01/15/25 | M | 1.00 | % | Morgan Stanley Capital Services LLC | 31,879 USD | 672 | |||||||||||||||
Zhuzhou Tianqiao Crane Co., Ltd. | 04/02/25 | M | 1.00 | % | JPMorgan Chase Bank, N.A. | 35,015 USD | 193 | |||||||||||||||
Zhuzhou Tianqiao Crane Co., Ltd. | 01/15/25 | M | 1.00 | % | Morgan Stanley Capital Services LLC | 16,304 USD | 63 | |||||||||||||||
Zhuzhou Times New Material Technology Co., Ltd. | 03/17/25 | M | 1.00 | % | JPMorgan Chase Bank, N.A. | 598,729 USD | 10,000 | |||||||||||||||
Zhuzhou Times New Material Technology Co., Ltd. | 01/15/25 | M | 1.00 | % | Morgan Stanley Capital Services LLC | 335,924 USD | 5,607 | |||||||||||||||
Zoomlion Heavy Industry Science & Technology Co., Ltd. | 03/25/25 | M | 5.16 | % | JPMorgan Chase Bank, N.A. | 563,494 USD | (6,100 | ) | ||||||||||||||
Zoomlion Heavy Industry Science & Technology Co., Ltd. | 01/15/25 | M | 3.09 | % | Morgan Stanley Capital Services LLC | 250,790 USD | (1,914 | ) | ||||||||||||||
|
| |||||||||||||||||||||
Total Buys | $ | 12,985,744 | ||||||||||||||||||||
|
| |||||||||||||||||||||
See Notes to Consolidated Financial Statements.
240
Table of Contents
Blackstone Alternative Multi-Strategy Fund and Subsidiaries
Consolidated Schedule of Investments ^ (Continued)
March 31, 2023
Reference Instrument | Termination Date | Payment Frequency | Financing Rate | Counterparty | Notional Amount | Unrealized Appreciation (Depreciation) | ||||||||||||||||
Sells | ||||||||||||||||||||||
Broadcom, Inc. | 05/30/24 | M | 4.65 | % | JPMorgan Chase Bank, N.A. | 2,769,226 USD | $ | (20,832 | ) | |||||||||||||
Clearwater Analytics Holdings, Inc. | 11/30/23 | M | 4.83 | % | Morgan Stanley Capital Services LLC | 1,310,436 USD | (84,149 | ) | ||||||||||||||
CSI 1000 Net Total Return Index | 04/25/23 | M | 1.00 | % | Morgan Stanley Capital Services LLC | 49,275,056 USD | (642,466 | ) | ||||||||||||||
CSI 500 Index Futures | 08/29/23 | M | 1.00 | % | Morgan Stanley Capital Services LLC | 10,037,946 USD | (176,506 | ) | ||||||||||||||
CSOP CSI 500 ETF | 08/28/23 | M | 1.00 | % | JPMorgan Chase Bank, N.A. | 76,963,498 USD | (1,446,726 | ) | ||||||||||||||
Enfusion, Inc. | 11/30/23 | M | 4.83 | % | Morgan Stanley Capital Services LLC | 259,911 USD | (248 | ) | ||||||||||||||
EngageSmart, Inc. | 11/30/23 | M | 4.83 | % | Morgan Stanley Capital Services LLC | 379,296 USD | (5,396 | ) | ||||||||||||||
FactSet Research Systems, Inc. | 11/30/23 | M | 4.83 | % | Morgan Stanley Capital Services LLC | 575,562 USD | 5,643 | |||||||||||||||
Financial Select Sector SPDR Fund | 11/30/23 | M | 1.00 | % | Morgan Stanley Capital Services LLC | 1,112,943 USD | (6,616 | ) | ||||||||||||||
Frontline PLC | 07/15/24 | M | 2.88 | % | JPMorgan Chase Bank, N.A. | 299,817 USD | 15,780 | |||||||||||||||
Globus Medical, Inc. | 02/12/25 | M | 4.52 | % | JPMorgan Chase Bank, N.A. | 4,932,339 USD | (320,908 | ) | ||||||||||||||
GS Equity Index Swap —MS7GBSKT | 04/02/25 | M | 1.00 | % | Morgan Stanley Capital Services LLC | 5,788,932 USD | (73,050 | ) | ||||||||||||||
Hillman Solutions Corp. | 11/30/23 | M | 4.83 | % | Morgan Stanley Capital Services LLC | 437,251 USD | (25,268 | ) | ||||||||||||||
Industrial Select Sector SPDR Fund | 11/30/23 | M | 4.83 | % | Morgan Stanley Capital Services LLC | 1,144,392 USD | (28,993 | ) | ||||||||||||||
Intercontinental Exchange, Inc. | 05/13/24 | M | 4.52 | % | JPMorgan Chase Bank, N.A. | 186,676 USD | (8,555 | ) | ||||||||||||||
iShares Expanded Tech-Software Sector ETF | 11/30/23 | M | 4.83 | % | Morgan Stanley Capital Services LLC | 1,435,251 USD | (64,787 | ) | ||||||||||||||
iShares Iboxx High Yield | 05/31/23 | M | 1.00 | % | Barclays Bank PLC | 8,090,469 USD | (172,813 | ) | ||||||||||||||
iShares Iboxx Investment | 05/31/23 | M | 1.00 | % | Barclays Bank PLC | 20,285,625 USD | (266,250 | ) | ||||||||||||||
iShares Russell 2000 ETF | 11/30/23 | M | 4.83 | % | Morgan Stanley Capital Services LLC | 248,773 USD | 248,773 | |||||||||||||||
NEXTracker, Inc. | 11/30/23 | M | 1.00 | % | Morgan Stanley Capital Services LLC | 1,464,805 USD | (238,653 | ) | ||||||||||||||
Novozymes | 12/16/24 | M | 2.18 | % | JPMorgan Chase Bank, N.A. | 30,123,653 DKK | (129,961 | ) | ||||||||||||||
Pacific Biosciences of California, Inc. | 11/30/23 | M | 4.83 | % | Morgan Stanley Capital Services LLC | 361,027 USD | 361,027 | |||||||||||||||
Provident Financial Services, Inc. | 10/01/24 | M | 1.00 | % | JPMorgan Chase Bank, N.A. | 372,303 USD | 21,233 | |||||||||||||||
Shanghai Stock Exchange SSE 50 A Share Index | 07/24/23 | M | 1.00 | % | JPMorgan Chase Bank, N.A. | 32,335,455 USD | (375,388 | ) | ||||||||||||||
Skyward Specialty Insurance Group, Inc. | 11/30/23 | M | 4.83 | % | Morgan Stanley Capital Services LLC | 411,671 USD | (45,346 | ) | ||||||||||||||
SS&C Technologies Holdings, Inc. | 11/30/23 | M | 4.83 | % | Morgan Stanley Capital Services LLC | 538,455 USD | (7,836 | ) | ||||||||||||||
Xylem, Inc. | 01/27/25 | M | 4.52 | % | JPMorgan Chase Bank, N.A. | 5,728,150 USD | (359,318 | ) | ||||||||||||||
|
| |||||||||||||||||||||
Total Sells | $ | (3,847,609 | ) | |||||||||||||||||||
|
| |||||||||||||||||||||
Total OTC Total Return Swaps Outstanding |
| $ | 9,138,135 | |||||||||||||||||||
|
| |||||||||||||||||||||
See Notes to Consolidated Financial Statements.
��
241
Table of Contents
Blackstone Alternative Multi-Strategy Fund and Subsidiaries
Consolidated Schedule of Investments ^ (Continued)
March 31, 2023
Centrally Cleared Interest Rate Swaps Outstanding at March 31, 2023
The | Floating Rate Index | Fixed Rate | Pay/ | Maturity Date | Counterparty | Notional Amount | Market Value | Upfront Premium Paid (Received) | Unrealized Appreciation (Depreciation) | |||||||||||||||||||
Pays | 3-Month USD LIBOR | 0.98% | 3M/6M | 03/25/2030 | Morgan Stanley & Co. LLC | 3,000,000 USD | $ | (278,747 | ) | $ | — | $ | (278,747 | ) | ||||||||||||||
Pays | 3-Month CNY- CNREPOFIX | 2.56% | 3M/3M | 12/21/2027 | Merrill Lynch, Pierce, Fenner & Smith, Inc. | 30,000,000 CNY | (42,617 | ) | — | (42,617 | ) | |||||||||||||||||
Pays | 3-Month CNY- CNREPOFIX | 2.88% | 3M/3M | 03/15/2028 | Merrill Lynch, Pierce, Fenner & Smith, Inc. | 19,000,000 CNY | 10,065 | — | 10,065 | |||||||||||||||||||
Pays | 3-Month CNY- CNREPOFIX | 2.88% | 3M/3M | 03/15/2028 | Merrill Lynch, Pierce, Fenner & Smith, Inc. | 31,000,000 CNY | 16,944 | — | 16,944 | |||||||||||||||||||
Pays | 3-Month CNY- CNREPOFIX | 2.90% | 3M/3M | 03/13/2028 | Merrill Lynch, Pierce, Fenner & Smith, Inc. | 8,500,000 CNY | 3,693 | — | 3,693 | |||||||||||||||||||
Pays | 3-Month CNY- CNREPOFIX | 2.91% | 3M/3M | 03/15/2028 | Merrill Lynch, Pierce, Fenner & Smith, Inc. | 6,500,000 CNY | 4,756 | — | 4,756 | |||||||||||||||||||
Receives | 3-Month USD LIBOR | 0.66% | 6M/3M | 03/12/2035 | Morgan Stanley & Co. LLC | 1,500,000 USD | 416,154 | — | 416,154 | |||||||||||||||||||
Receives | 3-Month USD LIBOR | 0.71% | 6M/3M | 01/22/2026 | Morgan Stanley & Co. LLC | 20,000,000 USD | 1,775,257 | — | 1,775,257 | |||||||||||||||||||
Receives | 3-Month USD LIBOR | 0.80% | 6M/3M | 01/13/2026 | Morgan Stanley & Co. LLC | 80,000 USD | 6,883 | — | 6,883 | |||||||||||||||||||
Receives | 3-Month USD LIBOR | 0.95% | 6M/3M | 01/13/2027 | Morgan Stanley & Co. LLC | 940,000 USD | 95,162 | — | 95,162 | |||||||||||||||||||
Receives | 3-Month USD LIBOR | 1.24% | 6M/3M | 04/19/2028 | Morgan Stanley & Co. LLC | 700,000 USD | 77,454 | — | 77,454 | |||||||||||||||||||
Receives | 3-Month USD LIBOR | 1.32% | 6M/3M | 02/26/2027 | Morgan Stanley & Co. LLC | 5,000,000 USD | 449,862 | — | 449,862 | |||||||||||||||||||
Receives | 3-Month USD LIBOR | 1.46% | 6M/3M | 02/14/2024 | Morgan Stanley & Co. LLC | 10,000,000 USD | 306,179 | — | 306,179 | |||||||||||||||||||
Receives | 3-Month USD LIBOR | 1.56% | 6M/3M | 09/28/2026 | Morgan Stanley & Co. LLC | 1,800,000 USD | 136,855 | 6,115 | 130,740 | |||||||||||||||||||
Receives | 3-Month USD LIBOR | 1.58% | 6M/3M | 05/21/2025 | Morgan Stanley & Co. LLC | 10,000,000 USD | 556,414 | — | 556,414 | |||||||||||||||||||
Receives | 3-Month USD LIBOR | 1.61% | 6M/3M | 03/23/2027 | Morgan Stanley & Co. LLC | 7,000,000 USD | 560,719 | — | 560,719 | |||||||||||||||||||
Receives | 3-Month USD LIBOR | 1.62% | 6M/3M | 03/24/2027 | Morgan Stanley & Co. LLC | 7,000,000 USD | 560,351 | — | 560,351 | |||||||||||||||||||
Receives | 3-Month USD LIBOR | 1.62% | 6M/3M | 07/27/2026 | Morgan Stanley & Co. LLC | 1,900,000 USD | 136,114 | 4,658 | 131,456 | |||||||||||||||||||
Receives | 3-Month USD LIBOR | 1.66% | 6M/3M | 06/17/2025 | Morgan Stanley & Co. LLC | 10,000,000 USD | 549,798 | — | 549,798 | |||||||||||||||||||
Receives | 3-Month USD LIBOR | 1.81% | 6M/3M | 02/1/2024 | Morgan Stanley & Co. LLC | 2,500,000 USD | 67,070 | — | 67,070 | |||||||||||||||||||
Receives | 3-Month USD LIBOR | 1.86% | 6M/3M | 12/21/2023 | Morgan Stanley & Co. LLC | 8,000,000 USD | 184,866 | — | 184,866 | |||||||||||||||||||
Receives | 3-Month USD LIBOR | 1.88% | 6M/3M | 01/25/2027 | Morgan Stanley & Co. LLC | 1,500,000 USD | 103,390 | — | 103,390 | |||||||||||||||||||
See Notes to Consolidated Financial Statements.
242
Table of Contents
Blackstone Alternative Multi-Strategy Fund and Subsidiaries
Consolidated Schedule of Investments ^ (Continued)
March 31, 2023
The | Floating Rate Index | Fixed Rate | Pay/ | Maturity Date | Counterparty | Notional Amount | Market Value | Upfront Premium Paid (Received) | Unrealized Appreciation (Depreciation) | |||||||||||||||||||
Receives | 3-Month USD LIBOR | 1.90% | 6M/3M | 08/28/2029 | Morgan Stanley & Co. LLC | 1,650,000 USD | $ | 156,289 | $ | — | $ | 156,289 | ||||||||||||||||
Receives | 3-Month USD LIBOR | 2.05% | 6M/3M | 11/29/2024 | Morgan Stanley & Co. LLC | 5,000,000 USD | 201,312 | — | 201,312 | |||||||||||||||||||
Receives | 3-Month USD LIBOR | 2.22% | 6M/3M | 09/30/2024 | Morgan Stanley & Co. LLC | 2,000,000 USD | 71,404 | — | 71,404 | |||||||||||||||||||
Receives | 1-Year USD SOFR | 2.22% | 1Y/1Y | 03/25/2037 | Morgan Stanley & Co. LLC | 800,000 USD | 87,958 | — | 87,958 | |||||||||||||||||||
Receives | 3-Month USD LIBOR | 2.27% | 6M/3M | 01/26/2026 | Morgan Stanley & Co. LLC | 2,000,000 USD | 95,840 | — | 95,840 | |||||||||||||||||||
Receives | 3-Month USD LIBOR | 2.30% | 6M/3M | 01/27/2025 | Morgan Stanley & Co. LLC | 900,000 USD | 34,327 | 4,800 | 29,527 | |||||||||||||||||||
Receives | 3-Month USD LIBOR | 2.35% | 6M/3M | 11/8/2024 | Morgan Stanley & Co. LLC | 4,000,000 USD | 139,458 | — | 139,458 | |||||||||||||||||||
Receives | 3-Month USD LIBOR | 2.37% | 6M/3M | 11/1/2024 | Morgan Stanley & Co. LLC | 2,000,000 USD | 68,866 | — | 68,866 | |||||||||||||||||||
Receives | 3-Month USD LIBOR | 2.38% | 6M/3M | 10/5/2023 | Morgan Stanley & Co. LLC | 3,000,000 USD | 44,080 | — | 44,080 | |||||||||||||||||||
Receives | 3-Month USD LIBOR | 2.39% | 6M/3M | 11/16/2028 | Morgan Stanley & Co. LLC | 4,000,000 USD | 247,071 | — | 247,071 | |||||||||||||||||||
Receives | 3-Month USD LIBOR | 2.40% | 6M/3M | 01/25/2027 | Morgan Stanley & Co. LLC | 2,900,000 USD | 147,510 | 24,111 | 123,399 | |||||||||||||||||||
Receives | 3-Month USD LIBOR | 2.42% | 6M/3M | 09/23/2024 | Morgan Stanley & Co. LLC | 2,000,000 USD | 64,427 | — | 64,427 | |||||||||||||||||||
Receives | 3-Month USD LIBOR | 2.42% | 6M/3M | 10/24/2024 | Morgan Stanley & Co. LLC | 2,000,000 USD | 66,773 | — | 66,773 | |||||||||||||||||||
Receives | 3-Month USD LIBOR | 2.43% | 6M/3M | 10/13/2026 | Morgan Stanley & Co. LLC | 3,000,000 USD | 143,994 | — | 143,994 | |||||||||||||||||||
Receives | 3-Month USD LIBOR | 2.45% | 6M/3M | 10/18/2024 | Morgan Stanley & Co. LLC | 4,000,000 USD | 131,560 | — | 131,560 | |||||||||||||||||||
Receives | 3-Month USD LIBOR | 2.58% | 6M/3M | 08/5/2025 | Morgan Stanley & Co. LLC | 7,000,000 USD | 259,252 | — | 259,252 | |||||||||||||||||||
Receives | 3-Month USD LIBOR | 2.67% | 6M/3M | 09/13/2028 | Morgan Stanley & Co. LLC | 2,500,000 USD | 117,520 | — | 117,520 | |||||||||||||||||||
Receives | 3-Month USD LIBOR | 2.72% | 6M/3M | 09/8/2028 | Morgan Stanley & Co. LLC | 1,000,000 USD | 44,626 | — | 44,626 | |||||||||||||||||||
Receives | 3-Month USD LIBOR | 2.72% | 6M/3M | 08/8/2028 | Morgan Stanley & Co. LLC | 3,000,000 USD | 132,293 | — | 132,293 | |||||||||||||||||||
Receives | 1-Year USD LIBOR | 2.81% | 1Y/1Y | 05/11/2032 | Morgan Stanley & Co. LLC | 1,000,000 USD | 53,741 | (349 | ) | 54,090 | ||||||||||||||||||
Receives | 3-Month USD LIBOR | 2.83% | 6M/3M | 07/30/2029 | Morgan Stanley & Co. LLC | 3,000,000 USD | 123,974 | — | 123,974 | |||||||||||||||||||
Receives | 6-Month Check | 2.94% | 6M/6M | 02/14/2029 | Citi Bank N.A. | 1,000,000 EUR | (706 | ) | — | (706 | ) | |||||||||||||||||
Receives | 6-Month Check | 2.96% | 1Y/6M | 09/29/2028 | Morgan Stanley Capital Services LLC | 706,000 EUR | 1,881 | — | 1,881 | |||||||||||||||||||
Receives | 1-Year USD SOFR | 3.12% | 1Y/1Y | 06/16/2037 | Morgan Stanley & Co. LLC | 2,300,000 USD | 23,792 | (802 | ) | 24,594 | ||||||||||||||||||
Receives | 1-Year USD SOFR | 3.19% | 1Y/1Y | 12/1/2037 | Morgan Stanley & Co. LLC | 3,000,000 USD | 7,436 | (519 | ) | 7,955 | ||||||||||||||||||
See Notes to Consolidated Financial Statements.
243
Table of Contents
Blackstone Alternative Multi-Strategy Fund and Subsidiaries
Consolidated Schedule of Investments ^ (Continued)
March 31, 2023
The | Floating Rate Index | Fixed Rate | Pay/ | Maturity Date | Counterparty | Notional Amount | Market Value | Upfront Premium Paid (Received) | Unrealized Appreciation (Depreciation) | |||||||||||||||||||
Receives | 3-Month USD LIBOR | 3.21% | 6M/3M | 05/25/2033 | Morgan Stanley & Co. LLC | 2,000,000 USD | $ | 41,624 | $ | (1,053 | ) | $ | 42,677 | |||||||||||||||
Receives | 1-Year USD SOFR | 3.32% | 1Y/1Y | 09/22/2037 | Morgan Stanley & Co. LLC | 2,800,000 USD | (37,327 | ) | (1,522 | ) | (35,805 | ) | ||||||||||||||||
Receives | 1-Year USD SOFR | 3.34% | 1Y/1Y | 02/12/2035 | Merrill Lynch, Pierce, Fenner & Smith, Inc. | 800,000 USD | (10,289 | ) | — | (10,289 | ) | |||||||||||||||||
Receives | 1-Year Check | 3.46% | 1Y/1Y | 02/8/2030 | Citi Bank N.A. | 1,000,000 GBP | 9,549 | — | 9,549 | |||||||||||||||||||
Receives | 1-Year USD SOFR | 3.87% | 1Y/1Y | 02/23/2029 | Morgan Stanley & Co. LLC | 4,000,000 USD | (118,343 | ) | — | (118,343 | ) | |||||||||||||||||
Receives | �� | 1-Year USD LIBOR | 4.21% | 1Y/1Y | 04/20/2026 | Morgan Stanley & Co. LLC | 500,000 USD | (3,940 | ) | — | (3,940 | ) | ||||||||||||||||
Receives | 1-Year USD SOFR | 4.90% | 1Y/1Y | 03/3/2025 | Merrill Lynch, Pierce, Fenner & Smith, Inc. | 9,250,000 USD | (128,738 | ) | — | (128,738 | ) | |||||||||||||||||
|
|
|
|
|
| |||||||||||||||||||||||
Total Centrally Cleared Interest Rate Swaps Outstanding |
| $ | 7,913,836 | $ | 35,439 | $ | 7,878,397 | |||||||||||||||||||||
|
|
|
|
|
| |||||||||||||||||||||||
Abbreviation Legend: | ||||
| M | Monthly | |||
| 1Y | Yearly | |||
| 3M | Quarterly | |||
| 6M | Semi-Annually | |||
| ADR | American Depository Receipt | |||
| ASX | Australian Securities Exchange | |||
| CBOE | Chicago Board Options Exchange | |||
| CBOT | Chicago Board of Trade | |||
| CDE | Montreal Exchange | |||
| CFE | CBOE Futures Exchange | |||
| CME | Chicago Mercantile Exchange | |||
| CNY-CNREPOFIX | CFXS-Reuters to the floating-rate-index | |||
| COMEX | Commodities Exchange Center | |||
| Eurex | Eurex Exchange | |||
| EURIBOR | Euro Interbank Offered Rate | |||
| Euronext | Euronext Paris | |||
| HKFE | Hong Kong Futures Exchange Ltd. | |||
| ICE | Ice Futures Europe | |||
| IDEM | Italian Derivatives Exchange Market | |||
| LIBOR | London Interbank Offered Rate | |||
| LME | London Metal Exchange | |||
| MTN | Medium Term Note | |||
| Nasdaq-OMX | NASDAQ OMX Stockholm | |||
| NYMEX | New York Mercantile Exchange | |||
| OSE | Osaka Exchange | |||
| OTC | Over the Counter | |||
See Notes to Consolidated Financial Statements.
244
Table of Contents
Blackstone Alternative Multi-Strategy Fund and Subsidiaries
Consolidated Schedule of Investments ^ (Continued)
March 31, 2023
| PIK | Payment in Kind | |||
| REIT | Real Estate Investment Trust | |||
| S&P | Standard and Poor | |||
| SFE | ASX Trade24 | |||
| SGX | Singapore Exchange | |||
| SOFR | Secured Overnight Financing Rate | |||
| T | At Maturity | |||
| TSFR | Term Secured Financing Rate | |||
Currency Legend: | ||||
| AUD | Australian Dollar | |||
| BRL | Brazilian Real | |||
| CAD | Canadian Dollar | |||
| CHF | Swiss Franc | |||
| CLP | Chilean Peso | |||
| CNH | Chinese Renminbi | |||
| CNY | Chinese Yuan | |||
| COP | Colombian Peso | |||
| CZK | Czech Koruna | |||
| DKK | Danish Krone | |||
| EUR | Euro | |||
| GBP | British Pound | |||
| HKD | Hong Kong Dollar | |||
| HUF | Hungarian Forint | |||
| IDR | Indonesian Rupiah | |||
| ILS | Israeli Shekel | |||
| INR | Indian Rupee | |||
| JPY | Japanese Yen | |||
| KRW | South Korean Won | |||
| MXN | Mexican Peso | |||
| NOK | Norwegian Krone | |||
| PEN | Peruvian Nuevo Sol | |||
| PHP | Philippine Peso | |||
| PLN | Polish Zloty | |||
| SEK | Swedish Krona | |||
| SGD | Singapore Dollar | |||
| THB | Thai Baht | |||
| TRY | Turkish Lira | |||
| TWD | Taiwanese Dollar | |||
| USD | United States Dollar | |||
| ZAR | South African Rand | |||
See Notes to Consolidated Financial Statements.
245
Table of Contents
Blackstone Alternative Multi-Strategy Fund and Subsidiaries
Consolidated Statement of Assets and Liabilities
As of March 31, 2023
Assets: |
| |||
Investments in securities, at fair value (cost $4,948,877,615) | $ | 4,844,439,894 | ||
Cash | 1,216,386,090 | |||
Cash denominated in foreign currencies (cost of $23,975,752) | 23,963,340 | |||
Segregated cash balance with broker for securities sold short | 491,909,326 | |||
Segregated cash balance with custodian for derivative financial instruments | 342,241,522 | |||
Segregated cash balance with counterparties for futures contracts | 133,818,926 | |||
Segregated cash balance with counterparties for centrally cleared derivatives | 69,211,729 | |||
Segregated cash balance with counterparties for reverse repurchase agreements | 66,000 | |||
Segregated cash balance with broker for TBAs | 12,155,472 | |||
Unrealized appreciation on forward foreign currency exchange contracts | 4,618,527 | |||
Income receivable | 24,004,438 | |||
Receivable for investments sold | 1,717,166,194 | |||
Receivable for Fund shares sold | 5,686,100 | |||
Receivable for periodic payments from swap contracts | 26,082,106 | |||
Variation margin receivable on futures | 40,065,648 | |||
Variation margin receivable on centrally cleared swaps | 747,696 | |||
Swap contracts, at fair value (net premiums paid $2,252,030) | 24,972,140 | |||
Prepaid expenses and other assets | 146,350 | |||
|
| |||
Total assets | 8,977,681,498 | |||
|
| |||
Liabilities: |
| |||
Securities sold short, at fair value (proceeds of $1,220,537,343) | 1,207,819,941 | |||
Cash received as collateral from custodian for derivative financial instruments | 4,658,816 | |||
Cash received as collateral from counterparty for centrally cleared derivatives | 42,047,263 | |||
Cash received as collateral from counterparty for futures contracts | 3,743,614 | |||
Cash received as collateral for repurchase agreements | 1,216,000 | |||
Cash received as collateral from counterparty for OTC derivatives | 939,563 | |||
Options written, at fair value (premiums received $23,947,045) | 35,339,773 | |||
Unrealized depreciation on forward foreign currency exchange contracts | 3,226,782 | |||
Payable for reverse repurchase agreements | 59,801,623 | |||
Payable for investments purchased | 3,049,113,738 | |||
Payable for Fund shares redeemed | 7,610,079 | |||
Payable for periodic payments from swap contracts | 34,501,307 | |||
Variation margin payable on futures | 2,387,075 | |||
Variation margin payable on centrally cleared swaps | 40,275,621 | |||
Swap contracts, at fair value (net premiums received $4,045,067) | 19,419,672 | |||
Dividend and interest income payable on securities sold short | 3,300,074 | |||
Management fee payable | 21,210,084 | |||
Payable to Affiliate | 824,105 | |||
Accrued expenses and other liabilities | 10,099,310 | |||
|
| |||
Total liabilities | 4,547,534,440 | |||
|
| |||
Net assets | $ | 4,430,147,058 | ||
|
| |||
Net Assets Consist of: |
| |||
Paid-in capital | $ | 5,445,067,949 | ||
Total distributable earnings (loss) | (1,014,920,891 | ) | ||
|
| |||
Net assets | $ | 4,430,147,058 | ||
|
| |||
See Notes to Consolidated Financial Statements.
246
Table of Contents
Blackstone Alternative Multi-Strategy Fund and Subsidiaries
Consolidated Statement of Assets and Liabilities (Continued)
As of March 31, 2023
Net Asset Value: |
| ||||
Class I Shares |
| ||||
Net Assets | $ | 3,358,347,171 | |||
Class I Shares outstanding, no par value, unlimited shares authorized | 329,480,464 | ||||
|
| ||||
Net asset value per share | $ | 10.19 | |||
|
| ||||
Class D Shares |
| ||||
Net Assets | $ | 20,179,370 | |||
Class D Shares outstanding, no par value, unlimited shares authorized | 1,985,357 | ||||
|
| ||||
Net asset value per share | $ | 10.16 | |||
|
| ||||
Class Y Shares |
| ||||
Net Assets | $ | 1,051,620,517 | |||
Class Y Shares outstanding, no par value, unlimited shares authorized | 103,832,078 | ||||
|
| ||||
Net asset value per share | $ | 10.13 | |||
|
| ||||
See Notes to Consolidated Financial Statements.
247
Table of Contents
Blackstone Alternative Multi-Strategy Fund and Subsidiaries
Consolidated Statement of Operations
For the Year Ended March 31, 2023
Investment Income: | ||||
Interest (including net foreign taxes withheld of $169,877) | $ | 149,286,454 | ||
Dividends (including net foreign taxes withheld of $482,010) | 7,772,267 | |||
Other income | 11,414,157 | |||
|
| |||
Total income | 168,472,878 | |||
|
| |||
Expenses: | ||||
Management fees | $ | 89,397,492 | ||
Administration fees | 5,382,909 | |||
Custodian fees | 1,975,810 | |||
Trustees’ fees | 955,998 | |||
Distribution fees — Class D | 55,148 | |||
Shareholder service fees | 3,164,206 | |||
Registration fees | 229,803 | |||
Printing and postage fees | 540,673 | |||
Professional fees | 5,678,133 | |||
Dividends and interest on securities sold short | 49,126,484 | |||
Line of credit fee | 1,822,918 | |||
Interest fees | 1,456,156 | |||
Other | 1,199,309 | |||
|
| |||
Total expenses | 160,985,039 | |||
|
| |||
Net investment income | 7,487,839 | |||
|
| |||
Net Realized and Unrealized Gain (Loss): | ||||
Net realized gain (loss) on investments in securities | (152,886,106 | ) | ||
Net realized gain (loss) on securities sold short | 303,520,797 | |||
Net realized gain (loss) on forward foreign currency exchange contracts | 8,440,888 | |||
Net realized gain (loss) on foreign currency transactions | (1,922,721 | ) | ||
Net realized gain (loss) on futures contracts | (82,876,839 | ) | ||
Net realized gain (loss) on options written | (171,412,384 | ) | ||
Net realized gain (loss) on swap contracts | (130,287,203 | ) | ||
Net change in unrealized appreciation (depreciation) on investments in securities | (102,087,689 | ) | ||
Net change in unrealized appreciation (depreciation) on securities sold short | (24,569,462 | ) | ||
Net change in unrealized appreciation (depreciation) on forward foreign currency exchange contracts | 2,427,315 | |||
Net change in unrealized appreciation (depreciation) on foreign currency translations | 187,455 | |||
Net change in unrealized appreciation (depreciation) on futures contracts | 21,061,052 | |||
Net change in unrealized appreciation (depreciation) on options written | 152,737,757 | |||
Net change in unrealized appreciation (depreciation) on swap contracts | 17,597,093 | |||
Net change in unrealized appreciation (depreciation) on unfunded loan commitments | (159,842 | ) | ||
|
| |||
Net realized and unrealized loss | (160,229,889 | ) | ||
|
| |||
Net decrease in net assets resulting from operations | $ | (152,742,050 | ) | |
|
|
See Notes to Consolidated Financial Statements.
248
Table of Contents
Blackstone Alternative Multi-Strategy Fund and Subsidiaries
Consolidated Statement of Changes in Net Assets
| Year Ended 3/31/2023 | Year Ended 3/31/2022 | |||||||
Increase (Decrease) in Net Assets |
| |||||||
Operations: |
| |||||||
Net investment income (loss) | $ | 7,487,839 | $ | (41,852,146 | ) | |||
Net realized gain (loss) | (227,423,568 | ) | 339,985,420 | |||||
Net change in unrealized appreciation (depreciation) | 67,193,679 | (195,820,433 | ) | |||||
|
|
|
| |||||
Net increase (decrease) in net assets resulting from operations | (152,742,050 | ) | 102,312,841 | |||||
|
|
|
| |||||
Distributions: |
| |||||||
Distributions from earnings | ||||||||
Class I Shares | — | (66,621,442 | ) | |||||
Class D Shares | — | (429,054 | ) | |||||
Class Y Shares | — | (20,724,055 | ) | |||||
|
|
|
| |||||
Total distributions to shareholders | — | (87,774,551 | ) | |||||
|
|
|
| |||||
Capital Transactions: |
| |||||||
Shareholder subscriptions: | ||||||||
Proceeds from sale of Class I Shares | 961,246,522 | 1,216,510,073 | ||||||
Proceeds from sale of Class D Shares | 8,860,599 | 10,901,659 | ||||||
Proceeds from sale of Class Y Shares | 100,379,829 | 365,097,592 | ||||||
Shareholder reinvestments: | ||||||||
Net asset value of Class I Shares issued to shareholders in payment of distributions declared | — | 52,917,040 | ||||||
Net asset value of Class D Shares issued to shareholders in payment of distributions declared | — | 336,917 | ||||||
Net asset value of Class Y Shares issued to shareholders in payment of distributions declared | — | 20,681,257 | ||||||
Shareholder redemptions: | ||||||||
Cost of Class I Shares redeemed | (1,445,051,982 | ) | (953,055,040 | ) | ||||
Cost of Class D Shares redeemed | (13,507,148 | ) | (12,700,063 | ) | ||||
Cost of Class Y Shares redeemed | (260,497,584 | ) | (489,256,452 | ) | ||||
|
|
|
| |||||
Net increase (decrease) in net assets resulting from capital transactions | (648,569,764 | ) | 211,432,983 | |||||
|
|
|
| |||||
Net increase (decrease) in net assets | (801,311,814 | ) | 225,971,273 | |||||
|
|
|
| |||||
Net Assets: |
| |||||||
Beginning of period | 5,231,458,872 | 5,005,487,599 | ||||||
|
|
|
| |||||
End of period | $ | 4,430,147,058 | $ | 5,231,458,872 | ||||
|
|
|
| |||||
Share Transactions: |
| |||||||
Class I Shares |
| |||||||
Beginning of period | 377,678,111 | 348,316,502 | ||||||
Shares issued | 94,823,586 | 113,770,975 | ||||||
Reinvestment in Shares | — | 5,034,923 | ||||||
Shares redeemed | (143,021,233 | ) | (89,444,289 | ) | ||||
|
|
|
| |||||
Net change in shares resulting from share transactions | (48,197,647 | ) | 29,361,609 | |||||
|
|
|
| |||||
End of period | 329,480,464 | 377,678,111 | ||||||
|
|
|
| |||||
See Notes to Consolidated Financial Statements.
249
Table of Contents
Blackstone Alternative Multi-Strategy Fund and Subsidiaries
Consolidated Statement of Changes in Net Assets (Continued)
| Year Ended 3/31/2023 | Year Ended 3/31/2022 | |||||||
Class D Shares |
| |||||||
Beginning of period | 2,445,310 | 2,580,674 | ||||||
Shares issued | 879,179 | 1,017,155 | ||||||
Reinvestment in Shares | — | 32,026 | ||||||
Shares redeemed | (1,339,132 | ) | (1,184,545 | ) | ||||
|
|
|
| |||||
Net change in shares resulting from share transactions | (459,953 | ) | (135,364 | ) | ||||
|
|
|
| |||||
End of period | 1,985,357 | 2,445,310 | ||||||
|
|
|
| |||||
Class Y Shares |
| |||||||
Beginning of period | 119,885,251 | 129,503,907 | ||||||
Shares issued | 9,990,118 | 34,216,451 | ||||||
Reinvestment in Shares | — | 1,982,863 | ||||||
Shares redeemed | (26,043,291 | ) | (45,817,970 | ) | ||||
|
|
|
| |||||
Net change in shares resulting from share transactions | (16,053,173 | ) | (9,618,656 | ) | ||||
|
|
|
| |||||
End of period | 103,832,078 | 119,885,251 | ||||||
|
|
|
| |||||
See Notes to Consolidated Financial Statements.
250
Table of Contents
Blackstone Alternative Multi-Strategy Fund and Subsidiaries
Consolidated Statement of Cash Flows
For the Year Ended March 31, 2023
Cash Flows from Operating Activities: |
| |||
Net decrease in net assets resulting from operations | $ | (152,742,050 | ) | |
Adjustments to reconcile net increase (decrease) in net assets resulting from operations to net cash provided by operating activities: | ||||
Purchases of investments in securities | (18,379,127,463 | ) | ||
Proceeds from disposition of investments in securities | 19,239,629,233 | |||
Proceeds from securities sold short | 19,440,854,234 | |||
Payments to cover securities sold short | (19,254,043,550 | ) | ||
Short-term investments, net | 218,391,414 | |||
Premiums paid on closing options written | (360,817,525 | ) | ||
Proceeds from premiums received from options written | 139,702,471 | |||
Net realized loss on investments in securities | 152,886,106 | |||
Net realized gain on securities sold short | (303,520,797 | ) | ||
Net realized loss on options written | 171,412,384 | |||
Net change in accretion of bond discount and amortization of bond and swap premium | (9,352,007 | ) | ||
Net change in unrealized depreciation on investments in securities | 102,087,689 | |||
Net change in unrealized depreciation on securities sold short | 24,569,462 | |||
Net change in unrealized appreciation on options written | (152,737,757 | ) | ||
Net change in unrealized depreciation on repurchase agreements | 305,751 | |||
Changes in assets and liabilities: | ||||
(Increase) decrease in assets: | ||||
Unrealized appreciation on forward foreign currency exchange contracts | (3,608,394 | ) | ||
Income receivable | (5,288,692 | ) | ||
Receivable for periodic payments from swap contracts | 31,357,369 | |||
Variation margin receivable on futures | 1,030,156 | |||
Variation margin receivable on centrally cleared swaps | (223,183 | ) | ||
Change in unrealized on unfunded loan | 159,842 | |||
Swap contracts, at fair value | 9,366,753 | |||
Prepaid expenses and other assets | (81,939 | ) | ||
Increase (decrease) in liabilities: |
| |||
Cash received as collateral for repurchase agreements | (3,924,000 | ) | ||
Cash received as collateral from custodian for derivative financial instruments | (382,633 | ) | ||
Cash received as collateral from counterparty for OTC derivatives | 938,762 | |||
Cash received as collateral from counterparty for centrally cleared derivatives | 4,291,894 | |||
Cash received as collateral from counterparty for futures contracts | 3,550,072 | |||
Unrealized depreciation on forward foreign currency exchange contracts | 1,181,079 | |||
Swap contracts, at fair value | (35,071,828 | ) | ||
Variation margin payable on futures | (13,032,704 | ) | ||
Variation margin payable on centrally cleared swaps | 1,275,614 | |||
Payable for periodic payments from swap contracts | 6,419,666 | |||
Dividend and interest income payable on securities sold short | (2,887,752 | ) | ||
Interest payable on reverse repurchase agreements | 144,300 | |||
Management fee payable | (2,832,470 | ) | ||
Payable to Affiliates | (783,814 | ) | ||
Accrued expenses and other liabilities | 2,014,620 | |||
|
| |||
Net cash provided by operating activities | $ | 871,110,313 | ||
|
| |||
See Notes to Consolidated Financial Statements.
251
Table of Contents
Blackstone Alternative Multi-Strategy Fund and Subsidiaries
Consolidated Statement of Cash Flows (Continued)
For the Year Ended March 31, 2023
Cash Flows from Financing Activities |
| |||
Proceeds from shares sold | 1,072,100,175 | |||
Cost of shares repurchased | (1,715,348,974 | ) | ||
Proceeds from reverse repurchase agreements | 1,142,798,034 | |||
Repayment of reverse repurchase agreements | (1,269,056,782 | ) | ||
|
| |||
Net cash used in financing activities | (769,507,547 | ) | ||
|
| |||
Net increase (decrease) in unrestricted and restricted cash and foreign currency | 101,602,766 | |||
Unrestricted and restricted cash and foreign currency, beginning of period | 2,188,149,639 | |||
|
| |||
Unrestricted and restricted cash and foreign currency, end of period | $ | 2,289,752,405 | ||
|
| |||
Supplemental disclosure of cash flow information: |
| |||
Cash paid during the period for interest | $ | 1,311,856 | ||
|
| |||
| Reconciliation of unrestricted and restricted cash to the Consolidated Statements of Assets and Liabilities |
| Year Ended March 31, 2023 | Year Ended March 31, 2022 | |||||||
Cash | $ | 1,216,386,090 | $ | 1,042,164,458 | ||||
Foreign currency at value | 23,963,340 | 24,474,423 | ||||||
Cash Pledged | ||||||||
Securities sold short | 491,909,326 | 457,209,752 | ||||||
Derivative financial instruments | 342,241,522 | 487,161,960 | ||||||
Futures contracts | 133,818,926 | 96,549,761 | ||||||
Centrally cleared derivatives | 69,211,729 | 80,589,285 | ||||||
TBAs | 12,155,472 | — | ||||||
Reverse repurchase agreements | 66,000 | — | ||||||
|
|
|
| |||||
| $ | 2,289,752,405 | $ | 2,188,149,639 | |||||
|
|
|
| |||||
See Notes to Consolidated Financial Statements.
252
Table of Contents
Blackstone Alternative Multi-Strategy Fund and Subsidiaries
Consolidated Financial Highlights
(For Shares Outstanding Throughout the Period)
| Class I | ||||||||||||||||||||
Year | Year | Year | Year | Year | ||||||||||||||||
Net Asset Value, Beginning of Period | $ | 10.48 | $ | 10.44 | $ | 9.08 | $ | 10.76 | $ | 10.67 | ||||||||||
Income From Investment Operations: | ||||||||||||||||||||
Net investment income (loss)1 | 0.01 | (0.09 | ) | 0.08 | 0.15 | 0.10 | ||||||||||||||
Net realized and unrealized gain (loss) | (0.30 | ) | 0.31 | 1.60 | (1.44 | ) | 0.19 | |||||||||||||
|
|
|
|
|
|
|
|
|
| |||||||||||
Total From Investment Operations | (0.29 | ) | 0.22 | 1.68 | (1.29 | ) | 0.29 | |||||||||||||
|
|
|
|
|
|
|
|
|
| |||||||||||
Less Distributions to Shareholders: | ||||||||||||||||||||
From net investment income | — | — | (0.32 | ) | (0.21 | ) | (0.13 | ) | ||||||||||||
From net realized capital gains | — | (0.18 | ) | — | (0.18 | ) | (0.07 | ) | ||||||||||||
|
|
|
|
|
|
|
|
|
| |||||||||||
Total Distributions | — | (0.18 | ) | (0.32 | ) | (0.39 | ) | (0.20 | ) | |||||||||||
|
|
|
|
|
|
|
|
|
| |||||||||||
Net Asset Value, End of Period | $ | 10.19 | $ | 10.48 | $ | 10.44 | $ | 9.08 | $ | 10.76 | ||||||||||
|
|
|
|
|
|
|
|
|
| |||||||||||
Total Return | (2.77 | )% | 2.09 | % | 18.34 | % | (12.32 | )% | 2.76 | % | ||||||||||
|
|
|
|
|
|
|
|
|
| |||||||||||
Ratios to Average Net Assets:2 | ||||||||||||||||||||
Total expenses before recoupment (reimbursement) from Investment Adviser | 1.51 | % | 0.96 | % | 0.80 | % | 0.94 | % | 1.33 | % | ||||||||||
Management Fees | 1.88 | % | 1.87 | % | 1.87 | % | 1.85 | % | 1.86 | % | ||||||||||
|
|
|
|
|
|
|
|
|
| |||||||||||
Net expenses after recoupment (reimbursement) from Investment Adviser3 | 3.39 | % | 2.83 | % | 2.67 | % | 2.79 | % | 3.19 | % | ||||||||||
|
|
|
|
|
|
|
|
|
| |||||||||||
Net investment income | 0.13 | % | (0.83 | )% | 0.77 | % | 1.43 | % | 0.94 | % | ||||||||||
|
|
|
|
|
|
|
|
|
| |||||||||||
Supplemental Data: | ||||||||||||||||||||
Net assets, end of period (in thousands) | $ | 3,358,347 | $ | 3,958,328 | $ | 3,637,018 | $ | 4,734,372 | $ | 5,292,572 | ||||||||||
Portfolio turnover | 846 | %4 | 193 | % | 135 | % | 193 | % | 203 | % | ||||||||||
| 1 | Calculated using average shares outstanding during the period. |
| 2 | The ratios do not reflect the Fund’s share of the income and expenses of the underlying Investee Fund. |
| 3 | There have been no recoupments (reimbursements) from Investment Adviser in the years shown. See Note 7. |
| 4 | Including TBA roll transactions. Had TBA roll transactions been excluded, the portfolio turnover rate would have been 182%. |
See Notes to Consolidated Financial Statements.
253
Table of Contents
Blackstone Alternative Multi-Strategy Fund and Subsidiaries
Consolidated Financial Highlights (Continued)
(For Shares Outstanding Throughout the Period)
| Class D | ||||||||||||||||||||
Year | Year | Year | Year | Year | ||||||||||||||||
Net Asset Value, Beginning of Period | $ | 10.48 | $ | 10.47 | $ | 9.10 | $ | 10.73 | $ | 10.64 | ||||||||||
Income From Investment Operations: | ||||||||||||||||||||
Net investment income (loss)1 | (0.01 | ) | (0.12 | ) | 0.05 | 0.13 | 0.06 | |||||||||||||
Net realized and unrealized gain (loss) | (0.31 | ) | 0.31 | 1.60 | (1.46 | ) | 0.20 | |||||||||||||
|
|
|
|
|
|
|
|
|
| |||||||||||
Total From Investment Operations | (0.32 | ) | 0.19 | 1.65 | (1.33 | ) | 0.26 | |||||||||||||
|
|
|
|
|
|
|
|
|
| |||||||||||
Less Distributions to Shareholders: | ||||||||||||||||||||
From net investment income | — | — | (0.28 | ) | (0.12 | ) | (0.10 | ) | ||||||||||||
From net realized capital gains | — | (0.18 | ) | — | (0.18 | ) | (0.07 | ) | ||||||||||||
|
|
|
|
|
|
|
|
|
| |||||||||||
Total Distributions | — | (0.18 | ) | (0.28 | ) | (0.30 | ) | (0.17 | ) | |||||||||||
|
|
|
|
|
|
|
|
|
| |||||||||||
Net Asset Value, End of Period | $ | 10.16 | $ | 10.48 | $ | 10.47 | $ | 9.10 | $ | 10.73 | ||||||||||
|
|
|
|
|
|
|
|
|
| |||||||||||
Total Return | (3.05 | )% | 1.70 | % | 18.07 | % | (12.60 | )% | 2.50 | % | ||||||||||
|
|
|
|
|
|
|
|
|
| |||||||||||
Ratios to Average Net Assets:2 | ||||||||||||||||||||
Total expenses before recoupment (reimbursement) from Investment Adviser | 1.78 | % | 1.27 | % | 1.07 | % | 1.18 | % | 1.71 | % | ||||||||||
Management Fees | 1.88 | % | 1.87 | % | 1.87 | % | 1.85 | % | 1.86 | % | ||||||||||
|
|
|
|
|
|
|
|
|
| |||||||||||
Net expenses after recoupment (reimbursement) from Investment Adviser3 | 3.66 | % | 3.14 | % | 2.94 | % | 3.03 | % | 3.57 | % | ||||||||||
|
|
|
|
|
|
|
|
|
| |||||||||||
Net investment income | (0.14 | )% | (1.14 | )% | 0.51 | % | 1.19 | % | 0.57 | % | ||||||||||
|
|
|
|
|
|
|
|
|
| |||||||||||
Supplemental Data: | ||||||||||||||||||||
Net assets, end of period (in thousands) | $ | 20,179 | $ | 25,626 | $ | 27,031 | $ | 40,987 | $ | 297,086 | ||||||||||
Portfolio turnover | 846 | %4 | 193 | % | 135 | % | 193 | % | 203 | % | ||||||||||
| 1 | Calculated using average shares outstanding during the period. |
| 2 | The ratios do not reflect the Fund’s share of the income and expenses of the underlying Investee Fund. |
| 3 | There have been no recoupments (reimbursements) from Investment Adviser in the years shown. See Note 7. |
| 4 | Including TBA roll transactions. Had TBA roll transactions been excluded, the portfolio turnover rate would have been 182%. |
See Notes to Consolidated Financial Statements.
254
Table of Contents
Blackstone Alternative Multi-Strategy Fund and Subsidiaries
Consolidated Financial Highlights (Continued)
(For Shares Outstanding Throughout the Period)
| Class Y | ||||||||||||||||||||
Year | Year | Year | Year | Year | ||||||||||||||||
Net Asset Value, Beginning of Period | $ | 10.41 | $ | 10.36 | $ | 9.02 | $ | 10.68 | $ | 10.59 | ||||||||||
Income From Investment Operations: | ||||||||||||||||||||
Net investment income (loss)1 | 0.02 | (0.08 | ) | 0.08 | 0.16 | 0.09 | ||||||||||||||
Net realized and unrealized gain (loss) | (0.30 | ) | 0.31 | 1.59 | (1.42 | ) | 0.21 | |||||||||||||
|
|
|
|
|
|
|
|
|
| |||||||||||
Total From Investment Operations | (0.28 | ) | 0.23 | 1.67 | (1.26 | ) | 0.30 | |||||||||||||
|
|
|
|
|
|
|
|
|
| |||||||||||
Less Distributions to Shareholders: | ||||||||||||||||||||
From net investment income | — | — | (0.33 | ) | (0.22 | ) | (0.14 | ) | ||||||||||||
From net realized capital gains | — | (0.18 | ) | — | (0.18 | ) | (0.07 | ) | ||||||||||||
|
|
|
|
|
|
|
|
|
| |||||||||||
Total Distributions | — | (0.18 | ) | (0.33 | ) | (0.40 | ) | (0.21 | ) | |||||||||||
|
|
|
|
|
|
|
|
|
| |||||||||||
Net Asset Value, End of Period | $ | 10.13 | $ | 10.41 | $ | 10.36 | $ | 9.02 | $ | 10.68 | ||||||||||
|
|
|
|
|
|
|
|
|
| |||||||||||
Total Return | (2.69 | )% | 2.10 | % | 18.49 | % | (12.25 | )% | 2.85 | % | ||||||||||
|
|
|
|
|
|
|
|
|
| |||||||||||
Ratios to Average Net Assets:2 | ||||||||||||||||||||
Total expenses before recoupment (reimbursement) from Investment Adviser | 1.44 | % | 0.86 | % | 0.72 | % | 0.83 | % | 1.39 | % | ||||||||||
Management Fees | 1.88 | % | 1.87 | % | 1.87 | % | 1.85 | % | 1.86 | % | ||||||||||
|
|
|
|
|
|
|
|
|
| |||||||||||
Net expenses after recoupment (reimbursement) from Investment Adviser3 | 3.32 | % | 2.73 | % | 2.59 | % | 2.68 | % | 3.25 | % | ||||||||||
|
|
|
|
|
|
|
|
|
| |||||||||||
Net investment income (loss) | 0.22 | % | (0.72 | )% | 0.85 | % | 1.54 | % | 0.89 | % | ||||||||||
|
|
|
|
|
|
|
|
|
| |||||||||||
Supplemental Data: | ||||||||||||||||||||
Net assets, end of period (in thousands) | $ | 1,051,621 | $ | 1,247,505 | $ | 1,341,439 | $ | 1,752,913 | $ | 1,619,797 | ||||||||||
Portfolio turnover | 846 | %4 | 193 | % | 135 | % | 193 | % | 203 | % | ||||||||||
| 1 | Calculated using average shares outstanding during the period. |
| 2 | The ratios do not reflect the Fund’s share of the income and expenses of the underlying Investee Fund. |
| 3 | There have been no recoupments (reimbursements) from Investment Adviser in the years shown. See Note 7. |
| 4 | Including TBA roll transactions. Had TBA roll transactions been excluded, the portfolio turnover rate would have been 182%. |
See Notes to Consolidated Financial Statements.
255
Table of Contents
Blackstone Alternative Multi-Strategy Fund and Subsidiaries
Notes to Consolidated Financial Statements
For the Year Ended March 31, 2023
1. Organization
Blackstone Alternative Investment Funds (the “Trust”) is a Massachusetts business trust authorized to issue an unlimited number of shares of beneficial interest, which may be divided into different series and classes. The Trust is registered as an open-end management investment company under the Investment Company Act of 1940, as amended (the “1940 Act”). During the year ended March 31, 2023, the Trust consisted of a single series, Blackstone Alternative Multi-Strategy Fund (the “Fund”). The Fund commenced operations offering Class I Shares on June 16, 2014. The Fund also offers Class D Shares, Class Y Shares and Class R Shares. Class D Shares and Class Y Shares commenced operations on November 17, 2014 and January 28, 2015, respectively. As of March 31, 2023, the Fund had not issued any Class R Shares. The Fund operates as a diversified open-end investment company as defined in the 1940 Act.
The investment adviser of the Fund is Blackstone Alternative Investment Advisors LLC (“BAIA” or the “Investment Adviser”), a registered investment adviser under the Investment Advisers Act of 1940, as amended. The Board of Trustees (the “Board” and each member a “Trustee”) of the Trust supervises the conduct of the Fund’s affairs and has engaged BAIA to manage the Fund’s day-to-day investment activities pursuant to an investment management agreement. The Fund’s investment objective is to seek capital appreciation. In pursuing the Fund’s investment objective, the Investment Adviser seeks to maintain an investment portfolio with, on average, lower volatility relative to the broader equity markets. The Investment Adviser seeks to achieve the Fund’s objective by allocating the Fund’s assets among a variety of non-traditional, or “alternative,” investment strategies. The Investment Adviser determines the allocations of the Fund’s assets and allocates a majority of the Fund’s assets among the sub-advisers (the “Sub-Advisers”) with experience managing alternative investment strategies and among investment funds generally employing alternative investment strategies. The Investment Adviser also manages a portion of the Fund’s assets directly and, from time to time, may instruct Sub-Advisers with respect to particular investments. The Investment Adviser may allocate the Fund’s assets among discretionary and non-discretionary Sub-Advisers. Each discretionary Sub-Adviser is responsible for the day-to-day management of the portion of the Fund’s assets that the Investment Adviser allocates to it. Each non-discretionary Sub-Adviser implements its investment strategy in coordination with the Investment Adviser in the Investment Adviser’s discretion. The Investment Adviser has the responsibility to oversee each Sub-Adviser (subject to the ultimate oversight of the Board). The Investment Adviser also is responsible for recommending the hiring, termination, and replacement of Sub-Advisers.
The Fund’s assets may be invested in three wholly-owned and controlled subsidiaries of the Fund (collectively, the “Subsidiaries”), each of which has the same investment objective as the Fund. One of the Fund’s Subsidiaries, Blackstone Alternative Multi-Strategy Sub Fund II Ltd. (the “Cayman Subsidiary”), is a Cayman Islands exempted company. Both of the other Subsidiaries, Blackstone Alternative Multi-Strategy Sub Fund III L.L.C. (the “Domestic Subsidiary III”) and Blackstone Alternative Multi-Strategy Sub Fund IV L.L.C. (the “Domestic Subsidiary IV”), are Delaware limited liability companies. The Cayman Subsidiary invests, directly or indirectly through the use of derivatives, in securities and commodity interests. The Domestic Subsidiary III and the Domestic Subsidiary IV invest, directly or indirectly through the use of derivatives, almost entirely in securities (with only de minimis exposure to commodity interests). The Consolidated Financial Statements include the Financial Statements of the Fund and the three Subsidiaries. Except where context otherwise requires, the term “Fund” refers to the Fund together with the applicable Subsidiaries.
The Fund and the Cayman Subsidiary are each a commodity pool under the Commodity Exchange Act (“CEA”) and are subject to regulation by the Commodity Futures Trading Commission (“CFTC”). BAIA, the commodity pool operator of the Fund and the Cayman Subsidiary, is registered as such with the CFTC, but has claimed relief under Rules 4.12(c)(3) and 4.7 under the CEA, respectively, from certain disclosure,
256
Table of Contents
Blackstone Alternative Multi-Strategy Fund and Subsidiaries
Notes to Consolidated Financial Statements (Continued)
For the Year Ended March 31, 2023
reporting, and recordkeeping requirements otherwise applicable to commodity pools. Neither the Domestic Subsidiary III nor the Domestic Subsidiary IV intends to invest more than a de minimis level of its net assets in “commodity interests” (as defined under the CEA). Accordingly, BAIA is relying on CFTC No-Action Letter 12-38 with respect to the Domestic Subsidiary III and has claimed an exemption under Rule 4.13(a)(3) from registration as a commodity pool operator with respect to the Domestic Subsidiary IV.
Capitalized terms used, but not defined herein, shall have the meaning assigned to them in the Prospectus of the Fund.
2. Basis of Presentation
The Fund’s Consolidated Financial Statements are prepared in accordance with accounting principles generally accepted in the United States of America (“U.S. GAAP”) and are stated in U.S. dollars, except as otherwise noted. The preparation of Consolidated Financial Statements in accordance with U.S. GAAP requires management to make certain estimates and assumptions that affect the reported amount of assets and liabilities, the disclosure of contingent assets and liabilities, and the reported amounts of income and expenses during the period. Actual results could differ from these estimates and these differences could be material.
The Fund is an investment company in accordance with Accounting Standards Codification 946, Financial Services—Investment Companies (“ASC 946”), which defines investment companies and prescribes specialized accounting and reporting requirements for investment companies.
Consolidation
The Fund consolidates its investment in the Subsidiaries. Accordingly, the Consolidated Financial Statements include the assets and liabilities and the results of operations and cash flows of the Subsidiaries. All material intercompany balances and transactions have been eliminated.
3. Significant Accounting Policies
Valuation Policy
The net asset values (“NAV”) of the Fund’s shares are calculated as of the close of regular trading on the New York Stock Exchange (“NYSE”) (generally 4:00 pm Eastern Time) on each day that the NYSE is open for business (a “Business Day”).
For purposes of calculating the NAV for each class of shares, the Fund values its investments in securities, securities sold short, derivative financial instruments and other investments at market value if market quotations are readily available, and otherwise at fair value as determined in good faith by the Board of the Fund, or its designee. The Board has delegated to the Custodian and the Investment Adviser day-to-day responsibility for implementing the Valuation Procedures. Effective August 4, 2022, and in accordance with Rule 2a-5 under the 1940 Act, the Board also designated the Investment Adviser as the “valuation designee” of the Fund. Each of the Board and the Investment Adviser has established procedures for determining the value of securities, including securities sold short, derivative financial instruments and other investments (together, the “investments”) (together, the “Valuation Procedures”). Pursuant to the Valuation Procedures, if market quotations are not readily available (or are otherwise not reliable for a particular investment), the fair value will be determined by the Investment Adviser as the valuation designee, in good faith, and such determinations will be subject to oversight by the Board. Due to the inherent uncertainty, estimates of fair value may differ from the values that would have been used had a ready market for these investments existed and the differences could be material.
257
Table of Contents
Blackstone Alternative Multi-Strategy Fund and Subsidiaries
Notes to Consolidated Financial Statements (Continued)
For the Year Ended March 31, 2023
A market quotation is readily available only when that quotation is a quoted price (unadjusted) in active markets for identical investments that the Fund can access at the measurement date, provided that a quotation will not be readily available if it is not reliable. Accordingly, a security will not be considered to have readily available market quotations if its value is not determined solely by reference to Level 1 inputs in the fair value hierarchy outlined in U.S. GAAP, including where events occur after the close of the relevant market, but prior to the close of the NYSE, that materially affect the value of the Fund’s investments. In addition, market quotes are considered not readily available when, due to extraordinary circumstances, the exchanges or markets on which securities trade do not open for trading for the entire day and no other market prices are available. The Board has delegated to the Investment Adviser the responsibility for monitoring significant events that may materially affect the values of the Fund’s investments and for determining whether the value of the applicable investments should be re-evaluated in light of such significant events.
Fair Value Measurements
Fair value guidance defines fair value, establishes a framework for measuring fair value, and expands disclosures about fair value measurements. U.S. GAAP defines fair value as the price that the Fund would receive to sell an asset or pay to transfer a liability (i.e., the exit price) in an orderly transaction between market participants at the measurement date.
The availability of observable inputs can vary from security to security and is affected by a wide variety of factors, including, for example, the type of security, whether the security is new and not yet established in the marketplace, the liquidity of markets, and other characteristics particular to the security. To the extent that valuation is based on models or inputs that are less observable or unobservable in the market, the determination of fair value requires more judgment. Accordingly, the degree of judgment exercised in determining fair value is greatest for investments categorized in Level 3. The inputs or methodology used for valuing an investment are not necessarily an indication of the risk associated with investing in those securities.
Investments measured and reported at fair value are classified and disclosed in one of the following levels within the fair value hierarchy based on the lowest level of input that is significant to the fair value measurement:
Level 1 – quoted prices are available in active markets for identical investments as of the measurement date. The Fund does not adjust the quoted price for these investments.
The types of investments categorized within Level 1 generally include actively traded domestic and certain foreign equity securities, short-term investments and derivative financial instruments actively traded on recognized exchanges.
Level 2 – quoted prices are available in markets that are not active or model inputs are based on inputs that are either directly or indirectly observable as of the measurement date.
The types of investments categorized within Level 2 generally include certain foreign equities; fixed income securities including corporate and convertible bonds, loans, trade claims, sovereign debt obligations, U.S. Treasury obligations, and asset-backed and mortgage-backed securities; over-the-counter (“OTC”) derivative financial instruments such as total return swaps, interest rate swaps, credit default swaps, OTC options; and forward foreign currency exchange contracts (“Forwards”).
258
Table of Contents
Blackstone Alternative Multi-Strategy Fund and Subsidiaries
Notes to Consolidated Financial Statements (Continued)
For the Year Ended March 31, 2023
Level 3 – pricing inputs are unobservable and include instances where there is little, if any, market activity for the investment. Inputs reflect the best estimate of what market participants would use in determining fair value of investments as of the measurement date.
Changes in valuation techniques may result in transfers in or out of an investment’s assigned level within the fair value hierarchy.
Level 3 investments are valued by broker quotes, fair value models, or pricing services that may employ valuation techniques with unobservable inputs. At March 31, 2023, the total fair value of Level 3 investments was $71,029,360. The appropriateness of fair values for these securities are monitored on an ongoing basis, including through backtesting, pricing due diligence, unchanged price review, use of specialists, and consideration of macro security specific events.
The significant inputs and assumptions required to determine the change in fair value of the investments of the Fund are discussed in more detail below.
A description of the valuation techniques applied to the Fund’s major categories of investments measured at fair value on a recurring basis are as follows:
Exchange-Traded Securities
Equity securities, including common stock, listed preferred stock, exchange-traded funds, special purpose acquisition companies, and derivative financial instruments, such as futures contracts and option contracts, that are traded on a recognized securities exchange or on the NASDAQ Global Market System (“NASDAQ”) are valued at the last reported sales price (or the official closing price of certain foreign exchanges) or the NASDAQ official closing price, as applicable. For securities traded on more than one exchange, the last reported sales price on the exchange where the security is primarily traded is used. To the extent these securities and derivative financial instruments are actively traded and adjustments are not applied, they are categorized as Level 1 within the fair value hierarchy.
The Fund may use a third-party fair valuation service provider to value foreign equity securities that are primarily traded outside of North America and South America. The third-party fair valuation service provider calculates a factor (“Fair Value Factor”) that is applied to adjust the last price of each such security in the event that there is movement in excess of a specified trigger, as measured by the movement between the prior close and the current close of the U.S. market. Foreign equities for which the last price has been adjusted by such factor will generally be categorized as Level 2 within the fair value hierarchy. As of March 31, 2023, certain foreign equity securities were classified as Level 2 since a Fair Value Factor was applied to the prices of these securities.
Short-Term Investments
The Fund considers short-term, highly liquid investments with original maturities of 90 days or less when acquired to be short-term investments. At March 31, 2023, the Fund did not have any investment in short-term investments.
Derivative Financial Instruments
OTC derivative financial instruments, such as Forwards, OTC options contracts, or swap agreements, derive their value from underlying referenced instruments or obligations, indices, reference rates, and other inputs or a combination thereof. These contracts are normally valued by pricing service providers or based on broker-dealer quotations. Depending on the nature of the instruments and the terms of the transaction, the value of
259
Table of Contents
Blackstone Alternative Multi-Strategy Fund and Subsidiaries
Notes to Consolidated Financial Statements (Continued)
For the Year Ended March 31, 2023
OTC derivative financial instruments can be estimated by a pricing service provider using a series of techniques, including industry standard pricing models. The pricing models use inputs that are observed from actively quoted markets such as issuer details, indices, spreads, yield curves, dividends and exchange rates. Derivative financial instruments that use similar valuation techniques and inputs as described above are categorized as Level 2 within the fair value hierarchy.
Centrally cleared swaps listed or traded on a multilateral or trade facility platform, such as a registered exchange, are valued at the daily settlement price determined by the clearing exchange. For centrally cleared credit default swaps, the clearing facility requires its members to provide actionable levels across complete term structures. These levels along with external third-party prices are used to produce daily settlement prices. Centrally cleared interest rate swaps are valued using a pricing model that references the underlying rates to produce the daily settlement price. These securities are categorized as Level 2 within the fair value hierarchy.
Fixed Income Securities
Fixed income securities, including corporate and convertible bonds, U.S. government sponsored agency securities, municipal bonds, U.S. Treasury obligations, foreign debt obligations, and bank debt are normally valued by pricing service providers on the basis of last available bid price. In determining the value of a particular investment, pricing service providers may use broker-dealer quotations, reported trades, or valuation estimates from their internal pricing models to determine the reported price that consider observable inputs. The pricing service providers’ internal models use observable inputs such as issuer details, interest rates, yield curves, prepayment speeds, credit risks/spreads, default rates and quoted prices for similar assets. Securities that use similar valuation techniques and inputs as described above are categorized as Level 2 within the fair value hierarchy.
Mortgage-related securities (“MBS”) and asset-backed securities (“ABS”) are usually issued as separate tranches, or classes, of securities within each deal. These securities are also generally valued by pricing service providers that use broker-dealer quotations or valuation estimates from their internal pricing models. The pricing models for these securities usually consider tranche-level attributes, current market data, estimated cash flows and market-based yield spreads for each tranche, and in corporate deal collateral performance, as available. MBS and ABS that use similar valuation techniques and inputs as described above are categorized as Level 2 within the fair value hierarchy.
Investments in Investee Funds
The fair value of investments in unaffiliated investment funds (collectively, the “Investee Funds”) is generally determined using the reported NAV per share of the Investee Fund, or its equivalent, as a practical expedient for fair value, unless the investment in the Investee Fund is traded on a recognized securities exchange and a quoted price is available as of the measurement date. If the Investee Fund is not traded on an exchange, the Fund may, as a practical expedient, estimate the fair value of an Investee Fund based on the reported NAV per share or its equivalent if the reported NAV per share or its equivalent of the Investee Fund is calculated in a manner consistent with the measurement principles applied to investment companies, in accordance with ASC 946. If the Investee Fund does not provide a reported NAV per share or its equivalent on a Business Day, the Investment Adviser shall estimate fair value in good faith and in a manner consistent with the Valuation Procedures.
Securities and Other Investments
Bank Debt
The Fund may invest in bank debt including, for example, corporate loans, trade claims, loan participations, direct debt, revolvers, bank loans, and bridge loans. The Fund invests in loans through novations,
260
Table of Contents
Blackstone Alternative Multi-Strategy Fund and Subsidiaries
Notes to Consolidated Financial Statements (Continued)
For the Year Ended March 31, 2023
assignments, and participation interests. In a novation, the Fund typically assumes all of the rights of a lending institution, including the right to receive payments of principal and interest and other amounts directly from the borrower and to enforce its rights as a lender directly against the borrower. When the Fund takes an assignment of a loan, the Fund acquires some or all of the interest of another lender (or assignee) in the loan. In such cases, the Fund may be required generally to rely upon the assignor to demand payment and enforce rights under the loan. If the Fund acquires a participation in the loan, the Fund purchases an indirect interest in a loan held by a third-party and the Fund typically will have a contractual relationship only with the third-party loan investor, not with the borrower. As a result, the Fund may have the right to receive payments of principal, interest, and any fees to which it is entitled only from the loan investor selling the participation and only upon receipt by such loan investor of such payments from the borrower. In such cases, the Fund assumes the credit risk of both the borrower and the loan investor selling the participation, and the Fund may be unable to realize some or all of the value of its interest in the loan in the event of the insolvency of the third-party. Changes in the financial condition of the borrower or economic conditions or other circumstances may reduce the capacity of the borrower to make principal and interest payments on such instruments and may lead to defaults. Certain types of bank debt may have an associated partially funded or unfunded commitment. The unfunded commitments may or may not be funded by the Fund. At March 31, 2023, the Fund had an outstanding commitment of $1,840,232 related to held unfunded commitments.
Mortgage-Related and Other Asset-Backed Securities
The Fund may invest in MBS (residential and commercial) and other ABS. These securities include mortgage pass-through securities, collateralized mortgage obligations, commercial mortgage-backed securities, residential mortgage-backed securities, collateralized debt obligations, collateralized loan obligations, and other securities that directly or indirectly represent a participation in, or are secured by and payable from, mortgage loans on real property. MBS and other ABS represent interests in pools of mortgages, loans or other assets. MBS are created from pools of residential or commercial mortgage loans, including loans made by savings and loans institutions, mortgage bankers, commercial banks and others. These securities typically provide a monthly payment that consists of principal and/or interest payments. Interest payments may be determined by fixed or adjustable rates. MBS and ABS are subject to credit, interest rate, valuation liquidity, prepayment and extension risks.
Securities Sold Short
The Fund may sell securities short (a “Short Sale”). A Short Sale is a transaction whereby the Fund sells securities it does not own in anticipation of a decline in the market price of those securities, whereby the Fund’s broker will execute a borrow transaction to deliver the securities resulting from the Fund’s Short Sale. The Fund is obligated to repurchase the securities at the market price at the time of replacement. The Fund’s obligations to replace the securities in connection with a Short Sale are secured by collateral.
Upon entering into a Short Sale, the Fund establishes a liability which is recorded as securities sold short on the Consolidated Statement of Assets and Liabilities to represent securities due under the Short Sale agreement. The Fund is liable to pay any dividends declared and/or interest income earned during the period the Short Sale is open. These dividends and interest are recorded as dividend and interest expense on securities sold short in the Consolidated Statement of Operations.
Commodities
The Fund is permitted to invest in California Carbon Allowances (“CCAs”) or futures on CCAs, which are generally treated as commodity interests in this report. CCA and other allowances (collectively, “Allowances”) are valued according to their vintage based on market price or the number of Allowances delivered during the valuation month. ICE futures U.S., Inc. (“ICE”) will serve as the primary pricing source.
261
Table of Contents
Blackstone Alternative Multi-Strategy Fund and Subsidiaries
Notes to Consolidated Financial Statements (Continued)
For the Year Ended March 31, 2023
When early vintage Allowances no longer have readily observable market prices from ICE, they will be valued using prices for later vintage Allowances. ICE lists widely-traded futures contracts for the Allowance market. These contracts result in the delivery of an Allowance at expiry. The ICE CCA contracts permits delivery of Allowances issued by California or any linked program (at this time Quebec and Ontario). Trading in these futures contracts are subject to ICE’s market rules. ICE lists separate CCAs by vintage, (e.g. 2020 Vintage, 2022 Vintage and 2023 Vintage). The most traded ICE CCA contracts allow delivery of the indicated vintage or an earlier vintage; hence a 2022 Vintage Allowance can be delivered against the 2023 Vintage Contract. This flexibility means futures contracts on earlier vintages are usually more liquid than, and worth at least as much as, later vintages.
Repurchase Agreements
The Fund may invest in repurchase agreements, which are short term investments whereby the Fund acquires ownership of a debt security and the seller agrees to repurchase the security at a future date at a specified price. When entering into repurchase agreements, it is the Fund’s policy that the repurchase agreement be fully collateralized and that its custodian take possession of the underlying collateral securities. The repurchase counterparty has the ability to request additional collateral depending on the market value of the collateral security compared to the principal amount of the repurchase transaction in line with the agreement. To the extent that any repurchase transaction exceeds one Business Day, the value of the collateral is marked-to-market to ensure the adequacy of the collateral. If the seller defaults and the market value of the collateral declines or if bankruptcy proceedings are commenced with respect to the seller of the security, realization of the collateral by the Fund may be delayed or limited. The information required to be disclosed by FASB Accounting Standards Update No. 2011-11 for the Fund’s investments in repurchase agreements as of March 31, 2023, including the fair value of the repurchase agreement and the amount of collateral, can be found in the Fund’s Consolidated Schedule of Investments.
Reverse Repurchase Agreements
The Fund may enter into reverse repurchase agreements. In a reverse repurchase agreement, the Fund sells a security in exchange for cash to a financial institution, the counterparty, with a simultaneous agreement to repurchase the same or substantially the same security at an agreed upon price and date, under the terms of a Master Repurchase Agreement (“MRA”). The Fund is entitled to receive principal and interest payments, if any, made on the security delivered to the counterparty during the term of the agreement. Cash received in exchange for securities delivered plus accrued interest payments to be made by the Fund to counterparties is reflected as a liability. Reverse repurchase agreements involve the risk that the market value of the securities purchased with the proceeds from the sale of securities received by the Fund may decline below the price of the securities the Fund is obligated to repurchase. Reverse repurchase agreements also involve credit risk with the counterparty to the extent that the value of securities subject to repurchase exceeds the Fund’s liability under the reverse repurchase agreement. Securities subject to repurchase under reverse repurchase agreements, if any, are designated as such in the Consolidated Schedule of Investments. Due to the short term nature of the reverse repurchase agreements, face value approximates fair value. As of March 31, 2023, the face value of open reverse repurchase agreements for the Fund was $59,632,303. The weighted average daily balances of reverse repurchase agreements outstanding for the Fund during the year ended March 31, 2023 was approximately $32,454,351, at a weighted average weekly interest rate of 4.46%.
An MRA contains provisions for, among other things, initiation, income payments, events of default and maintenance of securities for repurchase agreements. An MRA also permits offsetting with collateral to create one single net payment in the event of default or similar events, including the bankruptcy or insolvency of a counterparty. The Fund may not use reverse repurchase agreements and related collateral governed by an MRA to offset derivatives contracts and related collateral governed by an ISDA (see Note 4)
262
Table of Contents
Blackstone Alternative Multi-Strategy Fund and Subsidiaries
Notes to Consolidated Financial Statements (Continued)
For the Year Ended March 31, 2023
or securities lending agreements (“SLA”) and related collateral governed by an SLA consistent with Rule 19b-1 under the 1940 Act. Dividends and capital gain distributions paid by the Fund will be reinvested in additional Shares (see Note 6) of the Fund or, if elected by the Shareholder, paid in cash. Segregation and Collateralization In cases in which the 1940 Act and the interpretive positions of the Securities and Exchange Commission (“SEC”) and its staff require that the Fund either delivers collateral or segregates assets in connection with certain investments.
The following tables present the reverse repurchase agreements, which are subject to enforceable MRAs, as well as the collateral delivered related to those reverse repurchase agreements by class of collateral and summarized by the remaining contractual maturity of the transactions.
Counterparty | Reverse Repurchase Agreements | Fair Value of Non-Cash Collateral(1),(2) | Cash Collateral Pledged(1) | Net Amount(3) | ||||||||||||||||
Barclays Capital | $ | (36,586,497 | ) | $ | 36,586,497 | $ | — | $ | — | |||||||||||
JPMorgan Chase Bank, N.A. | (23,215,126 | ) | 23,196,038 | 19,088 | — | |||||||||||||||
|
|
|
|
|
|
|
| |||||||||||||
Total | $ | (59,801,623 | ) | $ | 59,782,535 | $ | 19,088 | $ | — | |||||||||||
|
|
|
|
|
|
|
| |||||||||||||
| (1) | Additional required collateral pledged is not shown for financial reporting purposes. The total fair value of non-cash and cash collateral pledged at March 31, 2023 was $62,832,129 and $1,216,000, respectively. |
| (2) | The total fair value of non-cash collateral in the table above includes securities valued at $59,782,535 that have been pledged as collateral on a reverse repurchase agreement. |
| (3) | Net amount represents the net receivable (payable) that would be due from/to the counterparty in the event of default. |
| Remaining Contractual Maturity of the Agreements As of March 31, 2023 | ||||||||||||||||||||||||||
Overnight | <30 days | Between | >90 days | Total | ||||||||||||||||||||||
Reverse Repurchase Agreements |
| |||||||||||||||||||||||||
Corporate Bonds & Notes | $ | — | $ | — | $ | — | $ | 2,542,991 | $ | 2,542,991 | ||||||||||||||||
Sovereign Debt | — | — | — | 36,199,886 | 36,199,886 | |||||||||||||||||||||
U.S. Treasury Obligations | — | 21,039,658 | — | — | 21,039,658 | |||||||||||||||||||||
Collateral Cash | 19,088 | — | — | — | 19,088 | |||||||||||||||||||||
|
|
|
|
|
|
|
|
|
| |||||||||||||||||
Total | $ | 19,088 | $ | 21,039,658 | $ | — | $ | 38,742,877 | $ | 59,801,623 | ||||||||||||||||
|
|
|
|
|
|
|
|
|
| |||||||||||||||||
Gross amount of recognized liabilities for reverse repurchase agreements |
| $ | 59,801,623 | |||||||||||||||||||||||
|
| |||||||||||||||||||||||||
Investment Transactions and Related Investment Income
Investment transactions are recorded as of the trade date. Dividend income is recorded on the ex-dividend date or, for certain foreign securities, as of the date notified. Interest income, which includes amortization of premiums and accretion of discounts on non-defaulted fixed income securities, is recorded on an accrual basis and is accrued daily. Realized gains and losses on investments are determined on the identified cost basis, which is the same basis used for federal income tax purposes. Foreign income and foreign capital gains on some foreign securities may be subject to foreign taxes, which are accrued as applicable.
263
Table of Contents
Blackstone Alternative Multi-Strategy Fund and Subsidiaries
Notes to Consolidated Financial Statements (Continued)
For the Year Ended March 31, 2023
Allocation of Income and Expenses
The Fund uses the adjusted prior day net assets for each class of shares, adjusted for capital activity, to allocate Fund-level income and expenses and unrealized capital gains and losses pro-rata to each class of shares. Class-specific income and expenses are allocated directly to the applicable class.
Cash
At March 31, 2023, the Fund had $1,216,386,090 in domestic cash and $23,963,340 in foreign cash held at State Street Bank and Trust Company. These balances, at year end, exceeded insured limits.
Foreign Currency
The functional currency of the Fund is the U.S. dollar. Assets and liabilities denominated in foreign currencies are translated into U.S. dollars at the closing prices of such currencies on each Business Day. Purchases and sales of investments and income and expenses are translated on the respective dates of such transactions or when accrued. The Fund does not isolate the portion of realized or unrealized gains or losses resulting from changes in the foreign exchange rate on investments from fluctuations arising from changes in the fair value of the investments. Such gains and losses are included with net realized and unrealized gain or loss on investments. Net realized gains and losses on foreign currency transactions represent net realized exchange gains or losses on disposition of foreign currencies and currency gains and losses realized between trade and settlement dates on investment transactions. Net unrealized appreciation and depreciation of assets and liabilities, other than investments, attributable to foreign currency fluctuations are recorded as net unrealized appreciation or depreciation on foreign currency translations in the Consolidated Statement of Operations.
Contingencies
Under the Trust’s Amended and Restated Agreement and Declaration of Trust, the Fund’s officers and Trustees are indemnified against certain liabilities that may arise out of the performance of their duties to the Fund. Additionally, in the normal course of business, the Fund may enter into contracts that contain a variety of representations and indemnifications. To date, the Fund has not had claims or losses pursuant to these contracts, although there is no assurance that it will not incur losses in connection with these indemnifications in the future.
Income Taxes
The Fund’s policy is to comply with the provisions of the Internal Revenue Code of 1986, as amended (the “Code”), applicable to regulated investment companies and to distribute all of its investment company taxable income and net long-term capital gains to its shareholders. Therefore, no federal income tax provision is expected to be required. The Fund plans to file U.S. federal and various state and local tax returns.
For the current open tax years ending on October 31, 2020, October 31, 2021, and October 31, 2022, with respect to all major jurisdictions, management of the Fund has concluded that there are no significant uncertain tax positions that would require recognition in the Consolidated Financial Statements. As a result, no income tax liability or expense, including interest and penalties, has been recorded within these Consolidated Financial Statements.
Dividends and Distributions to Shareholders
Dividends from net investment income and distributions of net realized capital gains of the Fund, if any, are generally declared and paid in December; however, the Fund may make additional distributions at other times consistent with Rule 19b-1 under the 1940 Act. Dividends and capital gain distributions paid by the Fund will be reinvested in additional Shares (see Note 6) of the Fund or, if elected by the Shareholder, paid in cash.
264
Table of Contents
Blackstone Alternative Multi-Strategy Fund and Subsidiaries
Notes to Consolidated Financial Statements (Continued)
For the Year Ended March 31, 2023
Segregation and Collateralization
In cases in which the 1940 Act and the interpretive positions of the Securities and Exchange Commission (“SEC”) and its staff require that the Fund either delivers collateral or segregates assets in connection with certain investments (e.g., futures contracts, forwards, swaps and options written), or transactions considered to reflect borrowings (e.g., reverse repurchase agreements), the Fund will, consistent with SEC rules and/or other guidance issued by the SEC, segregate collateral or designate on its books and records cash or liquid securities having a market value at least equal to the amount that would otherwise be required to be physically segregated. Furthermore, based on requirements and agreements with certain exchanges and third party broker-dealers, the Fund engaging in such transactions may have requirements to deliver/deposit securities to/with an exchange or broker-dealer as collateral for certain investments to the extent consistent with the 1940 Act and interpretive positions of the SEC and its staff. The Fund may mitigate counterparty risk by procuring collateral and through netting provisions included within an International Swaps and Derivatives Association, Inc. Master Agreement (“ISDA Master Agreement”) entered into between the Fund and each of its respective counterparties. An ISDA Master Agreement may contain certain provisions regarding, among other things, the parties’ general obligations, representations, agreements, collateral requirements, events of default and early termination. Certain ISDA Master Agreements, or similar agreements, may allow the Fund to offset certain derivative financial instruments with collateral. At March 31, 2023, the Fund used the gross method of presentation in its Consolidated Financial Statements and did not elect to offset amounts eligible for offset under enforceable master netting arrangements or similar agreements (“MNA”). The segregated cash balance with counterparties for OTC derivatives disclosed on the Consolidated Statement of Assets and Liabilities includes amounts for various derivative types which are comingled per the Fund’s ISDA Master Agreements. These amounts are shown gross. The amount of collateral moved to/from applicable counterparties is generally based upon minimum transfer amounts of up to $250,000. Collateral pledged by the Fund is segregated by the Fund’s custodian and identified as such in the Fund’s portfolio. Collateral can be in the form of cash or securities as agreed to by the Fund and the applicable counterparty. Typically, the Fund and counterparties are not permitted to sell, repledge or use the collateral they receive unless explicitly permitted by each respective governing agreement.
The Fund manages counterparty risk by entering into agreements only with counterparties that the Investment Adviser believes to have the financial resources to honor its obligations and by monitoring the financial stability of those counterparties. The agreements entered into by the Fund may contain credit risk related contingent features that may be triggered in certain circumstances to protect either party from a deterioration in creditworthiness of the other. Such circumstances may include a decrease in credit rating or, in the case of the Fund, a decrease in NAV. If triggered, the Fund or counterparty may be entitled to additional cash margin and/or to terminate the contract. See Note 9 for a further discussion of the risks of the Fund, including credit and counterparty risk.
Securities Lending
The Fund may lend securities, through its agent, to certain qualified financial institutions. The loans are collateralized by cash in an amount at least equal to the market value of the securities loaned. The market value of securities loaned is determined daily and any additional required collateral is allocated to the Fund on the next Business Day. The initial collateral received by the Fund should have a value of at least 102% of the current value of loaned securities for U.S. securities and at least 105% for all other securities. The Fund will bear the risk of loss with respect to the investment of the cash collateral, as well as the possible loss of right to the collateral should the borrower fail financially. The advantage of such loans is that the Fund continues to receive income on loaned securities while earning returns on the cash amounts which may be reinvested for the purchase of investments in securities. As of March 31, 2023, there were no securities on loan.
The SLA entered into by the Fund provides the right, in the event of default, for the non-defaulting party to liquidate the collateral and calculate a net exposure to the defaulting party or request additional collateral. Under the agreement, the Fund can reinvest cash collateral.
265
Table of Contents
Blackstone Alternative Multi-Strategy Fund and Subsidiaries
Notes to Consolidated Financial Statements (Continued)
For the Year Ended March 31, 2023
When-Issued and Delayed-Delivery Transactions
The Fund may engage in when-issued or delayed-delivery transactions. The Fund records when-issued or delayed-delivery securities on the trade date and maintains security positions such that sufficient liquid assets will be available to make payment for the securities purchased. Securities purchased on a when-issued or delayed-delivery basis are marked-to-market daily and begin earning interest on the settlement date. Losses may occur on these transactions due to changes in market conditions or the failure of counterparties to perform under the contract.
The Fund may transact in To Be Announced Securities (“TBAs”). As with other delayed-delivery transactions, a seller agrees to issue TBAs at a future date. However, the seller does not specify the particular securities to be delivered. Instead, the Fund agrees to accept any security that meets specified terms such as issuer, interest rate and terms of underlying mortgages. The Fund records TBAs on the trade date utilizing information associated with the specified terms of the transaction as opposed to the specific mortgages. TBAs are marked-to-market daily and begin earning interest on the settlement date. Losses may occur due to the fact that the actual underlying mortgages received may be less favorable than those anticipated by the Fund.
Restricted Securities
The Fund may purchase securities which are considered restricted. Restricted securities are securities that cannot be offered for public sale without first being registered under the Securities Act of 1933, as amended, or are subject to contractual restrictions on public sales. Many such restricted securities may be resold in the secondary market in transactions exempt from registration. The Fund will not incur any registration costs upon such resales. The Fund cannot demand registration of restricted securities. The Fund’s restricted securities, like other securities, are priced in accordance with the Valuation Procedures. Restricted securities are identified in the Consolidated Schedule of Investments.
Interbank Offered Rates Transition
Certain jurisdictions are currently reforming or phasing out their benchmark interest rates, most notably the London Interbank Offered Rates (“LIBOR”) across multiple currencies. Many such reforms and phase outs became effective at the end of 2021 with select U.S. dollar LIBOR tenors persisting through June 2023 and others potentially persisting on a synthetic basis through September 2024. The Fund has taken steps to prepare for and mitigate the impact of changing base rates and continues to manage transition efforts and evaluate the impact of prospective changes on existing transactions and contractual arrangements.
4. Derivative Financial Instruments
In the normal course of business, the Fund enters into derivative financial instrument contracts for trading and/or economic hedging purposes to increase the returns of the Fund or to protect against exposure to certain risks such as credit risk, equity risk, interest rate risk, foreign currency exchange risk or other risk (e.g., inflation risk). These contracts may be transacted on a recognized exchange or OTC. The following disclosures contain information on how the Fund uses derivative financial instruments. The derivative financial instruments outstanding as of year end are disclosed in the Consolidated Schedule of Investments.
Forward Foreign Currency Exchange Contracts
The Fund may enter into Forwards to obtain investment exposure, seek to enhance return or hedge or protect its portfolio holdings against the risk of future movements in certain foreign currency exchange rates. Forwards are agreements between two parties to receive or deliver a fixed quantity of foreign currency for an agreed-upon price on an agreed upon future date. The market value of a Forward fluctuates with the changes
266
Table of Contents
Blackstone Alternative Multi-Strategy Fund and Subsidiaries
Notes to Consolidated Financial Statements (Continued)
For the Year Ended March 31, 2023
in foreign currency exchange rates. These contracts are valued daily and the change in market value is recorded as an unrealized gain or loss on Forwards. When a contract is closed, the Fund recognizes a realized gain or loss equal to the difference between the value of the contract at the time it was opened and the value at the time it was closed.
The use of Forwards does not eliminate fluctuations in the underlying prices of the securities of the Fund, but it does establish a rate of exchange that can be achieved in the future. Although Forwards may limit the risk of loss due to a decline in the value of the currency holdings, they also limit any potential gain that might result should the value of the currency increase. In addition, the Fund could be exposed to losses if the counterparties to the contracts are unable to meet the terms of the contracts. The Fund’s maximum potential loss from such contracts is the aggregate face value in U.S. dollars at the time the contract was opened. These contracts involve market and/ or credit risk in excess of the amount recognized in the Consolidated Statement of Assets and Liabilities.
Futures Contracts
The Fund may enter into futures contracts to maintain investment exposure to a target asset class or to seek to enhance return. The Fund may be subject to fluctuations in equity prices, interest rates, commodity prices and foreign currency exchange rates in the normal course of pursuing its investment objective. Futures contracts are standardized agreements to buy or sell a security or deliver a final cash settlement price in connection with an index, interest rate, currency, or other asset. The Fund must deposit an amount (“initial margin”) equal to a certain percentage of the face value of the futures contract. The initial margin may be in the form of cash or securities which is returned when the Fund’s obligations under the contract have been satisfied. If cash is deposited as the initial margin, it is shown as segregated cash balance with broker for futures contracts in the Consolidated Statement of Assets and Liabilities. Futures contracts are marked-to-market daily and subsequent payments (“variation margin”) are made or received by the Fund depending on whether unrealized gains or losses are incurred. When the contract is closed or expires, the Fund records a realized gain or loss equal to the difference between the value of the contract at the time it was opened and the value at the time it was closed. The potential risk to the Fund is that the change in value of futures contracts may not correspond to the change in the value of the hedge investments. In addition, losses may arise from changes in the value of the underlying instrument, if interest or exchange rates move unexpectedly or if the counterparty is unable to perform. With futures, there is minimal counterparty credit risk to the Fund since futures are exchange traded and the exchanges’ clearinghouse, as counterparty to all exchange traded futures, guarantees the futures against default.
Options Contracts
The Fund may purchase and write call and put options. An option contract purchased by the Fund gives the Fund the right, but not the obligation, to buy (call) or sell (put) an underlying instrument at a fixed exercise price during a specified period. Call options written by the Fund give the holder the right to buy the underlying instrument from the Fund at a fixed exercise price; put options written by the Fund give the holder the right to sell the underlying instrument to the Fund at a fixed exercise price. The Fund may use options to hedge against changes in values of securities or currencies it owns or expects to own, to gain or to maintain exposure to interest rates, currencies or broad equity markets, to generate additional income or to enhance returns.
Options trading involve certain additional risks. Specific market movements of the option and the instruments underlying the option cannot be predicted. No assurance can be given that a liquid secondary market will exist for any particular option or at any particular time. The Fund might not be able to enter into a closing transaction for the option as a result of an illiquid market for the option. To realize any profit in the case of an option, therefore, the option holder would need to exercise the option and comply with margin requirements
267
Table of Contents
Blackstone Alternative Multi-Strategy Fund and Subsidiaries
Notes to Consolidated Financial Statements (Continued)
For the Year Ended March 31, 2023
for the underlying instrument. A writer could not terminate the obligation until the option expired or the writer was assigned an exercise notice. The purchaser of an option is subject to the risk of losing the entire purchase price of the option. The writer of an option is subject to the risk of loss resulting from the difference between the premium received for the option and the price of the futures contract underlying the option that the writer must purchase or deliver upon exercise of the option. The writer of a naked option may have to purchase the underlying contract in the market for substantially more than the exercise price of the option in order to satisfy his delivery obligations. This could result in a large net loss.
Equity, foreign currency or index options that may be purchased or sold by the Fund may include options not traded on a securities exchange. The risk of nonperformance by the counterparty on such option may be greater and the ability of the Fund to enter into a closing transaction with respect to such option may be less than in the case of an exchange traded option.
The Fund may purchase or write interest rate swaption agreements, which are options to enter into a predefined swap agreement by some specific date in the future. The writer of the swaption becomes the counterparty to the swap if the buyer exercises. The interest rate swaption agreement will specify whether the buyer of the swaption will be a fixed-rate receiver or a fixed-rate payer upon exercise.
Purchases of put and call options are recorded as investments, the value of which are marked-to-market daily. When a purchased option expires without being exercised, the Fund will realize a loss equal to the premium paid. When the Fund enters into a closing sale transaction, the Fund will realize a gain or loss depending on whether the sales proceeds from the closing sale transaction are greater or less than the premium initially paid for the option. When the Fund exercises a put option, it will realize a gain or loss from the sale of the underlying instrument and the proceeds from such sale will be decreased by the premium originally paid for the put option. When the Fund exercises a call option, the cost of the security which the Fund purchases upon exercise will be increased by the premium originally paid for the call option. Realized gains and losses on purchased options are included in realized gains and losses on investments.
The premium received for a written option is recorded as an asset and an equivalent liability. The liability is marked-to-market daily in accordance with the option’s valuation policy. When a written option expires without being exercised or the Fund enters into a closing purchase transaction, the Fund realizes a gain (or loss if the cost of the closing purchase transaction exceeds the premium received when the option was sold) without regard to any unrealized gain or loss on the underlying instrument and the liability related to such option is eliminated. When a written call option is exercised, the Fund realizes a gain or loss, as adjusted for the premium received, from the sale of the underlying instrument. When a written put option is exercised, the premium received is offset against the amount paid for the purchase of the underlying instrument.
Swap Agreements
The Fund may enter into total return, interest rate, credit default, variance and volatility swap agreements (“Swaps”). Swaps are bilaterally negotiated agreements between the Fund and a counterparty in which the Fund and counterparty agree to make either periodic net payments on a specified notional amount or a net payment upon termination. Swaps are privately negotiated in the OTC market or may be executed in a multilateral or other trade facility platform, such as a registered exchange or swap execution facility (“centrally cleared swaps”). The Fund may enter into Swaps for the purposes of managing exposure to interest rate, credit or market risk, or for other purposes. In connection with these agreements, securities or cash (“segregated cash” or “collateral”) may be paid or received, as applicable, by the Fund as collateral or margin in accordance with the terms of the respective Swaps to provide assets of value and recourse in the event of default or bankruptcy/insolvency. Securities posted by the Fund as collateral for swaps are identified in the Consolidated Schedule of Investments and segregated cash, if any, is reflected in the Consolidated Statement of Assets and Liabilities.
268
Table of Contents
Blackstone Alternative Multi-Strategy Fund and Subsidiaries
Notes to Consolidated Financial Statements (Continued)
For the Year Ended March 31, 2023
Swap transactions involve, to varying degrees, elements of interest rate, credit and market risk in excess of the amounts recognized in the Consolidated Statement of Assets and Liabilities. Such risks involve the possibility that there will be no liquid market for these agreements, that the counterparty to the agreements may default on its obligation to perform, or that there may be unfavorable changes in market conditions or interest rates. In addition, entering into Swaps involves documentation risk resulting from the possibility that the parties to a Swap may disagree as to the meaning of contractual terms in the agreement. The Fund’s maximum risk of loss from counterparty credit risk is the discounted value of the net cash flows to be received from the counterparty over the contract’s remaining life, to the extent that amount is positive, or the fair value of the contract. The risk may be mitigated by having an MNA between the Fund and the counterparty and by the posting of collateral by the counterparty to cover the Fund’s exposure to the counterparty.
Interest Rate Swaps: The Fund may enter into OTC and/or centrally cleared interest rate swap contracts to hedge interest rate risk, to gain exposure on interest rates and to hedge prepayment risk. The Fund is subject to interest rate risk exposure in the normal course of pursuing their investment objectives. The Fund may hold fixed rate bonds, and the value of these bonds may decrease if interest rates rise. Interest rate swaps are agreements in which one party pays a stream of interest payments, either fixed or floating rate, for another party’s stream of interest payments, either fixed or floating, on the same notional amount for a specified period of time. The Fund’s maximum risk of loss from counterparty credit risk, as opposed to investment and other types of risk, in respect of interest rate swaps is typically the discounted net value of the cash flows to be received from the counterparty over the contracts remaining life, to the extent that amount is positive.
Interest rate swaps can be purchased or sold with an upfront premium. An upfront payment received by the Fund is recorded as a liability and an upfront payment made by the Fund is recorded as an asset in the Consolidated Statement of Assets and Liabilities. Interest rate swaps are marked-to-market daily and any change is recorded as an unrealized gain or loss on swaps. Daily fluctuations in the value of centrally cleared interest rate swaps are recorded as a receivable or payable for variation margin on the Fund’s Consolidated Statement of Assets and Liabilities. Payments, including upfront premiums, received or made are recorded as realized gains or losses at the closing of the contract.
Total Return Swaps: The Fund may enter into total return Swaps to obtain exposure to a security, index, market or other basket of securities without owning such security or investing directly in that security, index, market or other basket of securities or to transfer the risk/return of one market (e.g., fixed income) to another market (e.g., equity) (equity risk and/or interest rate risk). Total return swaps are agreements in which one party agrees to make periodic payments to another party based on the change in market value of the underlying instrument, which may include a specified security, index, basket of securities or securities indices during the specific period, in return for periodic payments based on a fixed or floating rate or the total return from other underlying assets. To the extent the total return of the instrument underlying the transaction exceeds or falls short of the offsetting interest rate obligation, the Fund will receive a payment from or make a payment to the counterparty. Total return swaps can also be structured without an interest payment, so that one party pays the other party if the value of the underlying instrument increases and receives payment from the other party if the value of the underlying asset decreases.
The Fund may utilize total return swaps on baskets of securities (“Basket Swaps”) to a significant extent in order to obtain synthetic exposure to investment strategies. For a Basket Swap, the Fund or a Subsidiary makes payments to a counterparty (at either a fixed or variable rate) in exchange for receiving from the counterparty payments that reflect the return of a “basket” of securities, derivatives, and/or commodity interests identified by the Sub-Adviser (or the Investment Adviser). The Fund may also utilize structured notes (“Basket Notes”) in which the Fund or a Subsidiary purchases a note from an issuer in exchange for receiving from the issuer payments that reflect the return of an account through which the Sub-Adviser (or
269
Table of Contents
Blackstone Alternative Multi-Strategy Fund and Subsidiaries
Notes to Consolidated Financial Statements (Continued)
For the Year Ended March 31, 2023
the Investment Adviser) manages a portfolio reflecting a basket of securities, derivatives, and/or commodity interests. The Sub-Adviser (or the Investment Adviser) will select and manage the securities, derivatives, and/or commodity interests underlying the Basket Swap or the Basket Note in a manner consistent with the Fund’s strategies. The Fund’s investment returns on Basket Swaps or Basket Notes generally will correspond to the Fund’s returns had the Sub-Adviser managed the notional equivalent of the Fund’s assets directly (although returns on Basket Swaps or Basket Notes will be reduced by financing charges and trading costs incurred by the Basket Swap counterparty or Basket Note issuer). The Fund may obtain a significant portion of its investment exposure through Basket Swaps and/or Basket Notes.
Credit Default Swaps: The Fund may enter into OTC and/or centrally cleared credit default swap contracts to hedge credit risk, to hedge market risk, or to gain exposure on single-name issuers and/or baskets of securities.
In a credit default swap contract, the protection buyer typically makes an upfront payment and a periodic stream of payments to a counterparty, the protection seller, in exchange for the right to receive a contingent payment upon the occurrence of a credit event on the reference obligation or all other equally ranked obligations of the reference entity. Credit events are contract specific but may include bankruptcy, failure to pay, restructurings and obligation acceleration. An upfront payment received by the Fund or made by the Fund is recorded as a liability or asset, respectively, in the Consolidated Statement of Assets and Liabilities. Periodic payments received or paid by the Fund are recorded as realized gains or losses. Credit default swap contracts are marked-to-market daily and the change is recorded as an unrealized gain or loss on swaps. Upon the occurrence of a credit event, the difference between the par value and the market value of the reference obligation, net of any proportional amount of upfront payment, is recorded as a realized gain or loss on swaps.
Variance Swaps: A variance swap is a negotiated contract used to hedge or speculate on the magnitude of a price movement of an underlying asset, which can include exchange rates, interest rates, commodity price or the price of an index, i.e. the variance is the difference between an expected result and the actual result.
Volatility Swaps: A volatility swap is a negotiated contract with a payoff based on the realized volatility of an underlying asset where the realized amount is the difference between the realized volatility and the volatility strike or predetermined fixed volatility level.
Interest rate swaps, total return swaps, credit default swaps, variance swaps, and volatility swaps outstanding at year end are listed at the end of the Fund’s Consolidated Schedule of Investments.
At March 31, 2023, the Fund had the following derivative financial instruments, presented on a gross basis and categorized by risk exposure:
Asset Derivatives | Liability Derivatives | |||||||||||
Consolidated Statement of Liabilities Location | Fair Value | Consolidated Statement of Assets & | Fair Value | |||||||||
Interest Rate | Centrally cleared swaps, at fair value (c) | $ | 8,534,543 | Centrally cleared swaps, at fair value (c) | $ | (620,707 | ) | |||||
| Swap contracts, at fair value (b) | 1,093,367 | Swap contracts, at fair value (b) | — | |||||||||
| Unrealized appreciation on futures contracts (c) | 3,851,687 | Unrealized depreciation on futures contracts (c) | (792,799 | ) | ||||||||
| Purchased options, at fair value (b) | 2,372,572 | Options written, at value | (2,034,362 | ) | ||||||||
270
Table of Contents
Blackstone Alternative Multi-Strategy Fund and Subsidiaries
Notes to Consolidated Financial Statements (Continued)
For the Year Ended March 31, 2023
Asset Derivatives | Liability Derivatives | |||||||||||
Consolidated Statement of Liabilities Location | Fair Value | Consolidated Statement of Assets & | Fair Value | |||||||||
Equity | Swap contracts, at fair value (b) | $ | 18,335,458 | Swap contracts, at fair value (b) | $ | (9,104,168 | ) | |||||
| Unrealized appreciation on futures contracts (c) | 1,619,210 | Unrealized depreciation on futures contracts (c) | (4,045,736 | ) | ||||||||
| Purchased options, at fair value (d) | 8,470,049 | Options written, at value | (3,993,967 | ) | ||||||||
Commodity | Swap contracts, at fair value (b) | — | Swap contracts, at fair value (b) | — | ||||||||
| Unrealized appreciation on futures contracts (c) | 92,650,848 | Unrealized depreciation on futures contracts (c) | (77,162,383 | ) | ||||||||
| Purchased options, at fair value (d) | 16,819,795 | Options written, at value | (28,669,600 | ) | ||||||||
Credit | Centrally cleared swaps, at fair value (c) | 19,856,609 | Centrally cleared swaps, at fair value (c) | (1,903,451 | ) | |||||||
| Swap contracts, at fair value (b) | 5,543,315 | Swap contracts, at fair value (b) | (10,315,504 | ) | ||||||||
Foreign Exchange | Unrealized appreciation on forward foreign currency exchange contracts | 4,618,527 | Unrealized depreciation on forward foreign currency exchange contracts | (3,226,782 | ) | |||||||
| Unrealized appreciation on futures contracts (c) | 656,556 | Unrealized depreciation on futures contracts (c) | (526,962 | ) | ||||||||
| Purchased options, at fair value (d) | 4,889,678 | Options written, at value | (641,844 | ) | ||||||||
|
|
|
| |||||||||
Total | $ | 189,312,214 | $ | (143,038,265 | ) | |||||||
|
|
|
| |||||||||
Amounts not subject to MNA(1) | 144,876,885 | (116,870,851 | ) | |||||||||
|
|
|
| |||||||||
Total Gross amounts subject to MNA | $ | 44,435,329 | $ | (26,167,414 | ) | |||||||
|
|
|
| |||||||||
| (1) | See below for disclosure of financial instruments assets and liabilities subject to offset under enforceable MNA. |
The following tables present information about the amount of net realized gain (loss) and net unrealized appreciation (depreciation) on derivative financial instruments for the year ended March 31, 2023:
Primary Underlying Risk | Average | Average Notional USD(a) | Net Realized Gain (Loss) | Net Change in Unrealized | ||||||||||||||||
Interest Rate | ||||||||||||||||||||
Swap contracts | — | $ | 95,910,493 | $ | 190,476 | $ | 3,512,923 | |||||||||||||
Future contracts | — | 2,367,168,240 | (110,095,624 | ) | 3,118,931 | |||||||||||||||
Purchased options(d) | 2,262,799,020 | (3,426,157 | ) | (6,488,020 | ) | (4,472,812 | ) | |||||||||||||
Options written | 1,990,334,429 | (469,645 | ) | (334,061 | ) | 292,651 | ||||||||||||||
271
Table of Contents
Blackstone Alternative Multi-Strategy Fund and Subsidiaries
Notes to Consolidated Financial Statements (Continued)
For the Year Ended March 31, 2023
Primary Underlying Risk | Average | Average | Net Realized Gain (Loss) | Net Change in Unrealized | ||||||||||||||||
Equity | ||||||||||||||||||||
Swap contracts | — | $ | 1,216,208,082 | $ | (139,626,267 | ) | $ | 14,146,309 | ||||||||||||
Future contracts | — | 174,873,886 | (10,854,250 | ) | (1,059,911 | ) | ||||||||||||||
Purchased options(d) | 39,444,213 | (1,783,031 | ) | (3,092,666 | ) | (9,106,092 | ) | |||||||||||||
Options written | 1,011,931 | (15,725 | ) | 1,930,653 | 3,167,116 | |||||||||||||||
Commodity | ||||||||||||||||||||
Swap contracts | — | — | — | 980,189 | ||||||||||||||||
Future contracts | — | 1,725,552,735 | 38,487,808 | 19,096,161 | ||||||||||||||||
Purchased options(d) | 27,867 | 88,198,632 | 178,215,236 | (189,878,777 | ) | |||||||||||||||
Options written | 17,194 | (83,717,174 | ) | (174,714,934 | ) | 148,939,680 | ||||||||||||||
Credit | ||||||||||||||||||||
Swap contracts | — | 80,915,997 | 9,148,588 | (1,042,328 | ) | |||||||||||||||
Foreign Exchange | ||||||||||||||||||||
Forward foreign currency exchange Contracts | — | 201,602,408 | 8,440,888 | 2,427,315 | ||||||||||||||||
Future contracts | — | 49,045,826 | (414,773 | ) | (94,129 | ) | ||||||||||||||
Purchased options(d) | 12,146,827 | 627,351 | 3,290,384 | (1,055,781 | ) | |||||||||||||||
Options written | 1,335,700 | 412,200 | 1,705,958 | 338,310 | ||||||||||||||||
|
|
|
| |||||||||||||||||
Total | $ | (204,210,604 | ) | $ | (10,690,245 | ) | ||||||||||||||
|
|
|
| |||||||||||||||||
| (a) | Averages are based on monthly activity levels during the year ended March 31, 2023. |
| (b) | Includes swap contract premiums paid/received and unrealized appreciation/depreciation on swap contracts. |
| (c) | Includes unrealized appreciation/depreciation of futures contracts and centrally cleared swaps as reported in the Notes to Consolidated Schedule of Investments. Only the current day’s variation margin is reported in the Consolidated Statement of Assets and Liabilities. |
| (d) | Includes purchased options that are part of investments in securities as shown in the Consolidated Statement of Assets and Liabilities and net realized gain on investments in securities and net unrealized appreciation on investments in securities as shown in the Consolidated Statement of Operations. |
Netting Arrangements
The Fund enters into ISDA Master Agreements that contain MNAs that provide for payment netting and, in the case of default or similar event with respect to the counterparty to the MNA, can provide for netting across transactions. Generally, upon counterparty default, the Fund can terminate all transactions under the MNA and set-off amounts it owes across all transactions under a particular MNA and against collateral under such MNA. The Fund may not use derivatives contracts and related collateral governed by an ISDA to offset reverse repurchase agreements and related collateral governed by an MRA or SLA and related collateral governed by an SLA (see Note 3).
The Fund has MNAs, which allows certain derivative financial instruments and collateral with the same counterparty to be offset to minimize counterparty credit exposure. The following table presents information related to derivative financial instruments and collateral related to securities loaned that are subject to an enforceable MNA and are not offset, as shown in the Consolidated Statement of Assets and Liabilities as of March 31, 2023.
272
Table of Contents
Blackstone Alternative Multi-Strategy Fund and Subsidiaries
Notes to Consolidated Financial Statements (Continued)
For the Year Ended March 31, 2023
The following table represents the Fund’s derivative financial instrument assets and liabilities by counterparty net of amounts available for offset under an MNA and net of related collateral received/pledged by the Fund as of March 31, 2023:
| Gross Amounts Not Offset in the Consolidated Statement of Assets and Liabilities | |||||||||||||||||||||||||
| Gross Amount of Assets Presented in Consolidated Statement of Assets and Liabilities | Derivative Financial Instruments Available to Offset | Cash Collateral Received(4) | Non-Cash Collateral | Net Amount(2) | |||||||||||||||||||||
By Counterparty(1) | |||||||||||||||||||||||||
Bank of America, N.A. | $ | 2,511,078 | $ | (138,546 | ) | $ | (1,620,000 | ) | $ | — | $ | 752,532 | |||||||||||||
Barclays Bank PLC | 2,372,572 | (446,935 | ) | — | — | 1,925,637 | |||||||||||||||||||
Citibank N.A. | 145,797 | — | — | — | 145,797 | ||||||||||||||||||||
Deutsche Bank AG | 1,472,244 | — | (1,472,244 | ) | — | — | |||||||||||||||||||
Goldman Sachs & Co. LLC | 554,073 | (173,388 | ) | — | — | 380,685 | |||||||||||||||||||
Goldman Sachs International | 4,956,408 | — | — | — | 4,956,408 | ||||||||||||||||||||
Morgan Stanley Capital Services LLC | 6,123,317 | (2,490,353 | ) | — | — | 3,632,964 | |||||||||||||||||||
Cayman Subsidiary | |||||||||||||||||||||||||
Citibank N.A. | 2,195,942 | (757,172 | ) | — | — | 1,438,770 | |||||||||||||||||||
Citigroup Global Markets, Inc. | 892,644 | (695,595 | ) | — | — | 197,049 | |||||||||||||||||||
Goldman Sachs & Co. LLC | 382,190 | — | — | — | 382,190 | ||||||||||||||||||||
Goldman Sachs International | 1,901,736 | (841,070 | ) | — | — | 1,060,666 | |||||||||||||||||||
JPMorgan Chase Bank, N.A. | 2,974,474 | (2,455,066 | ) | — | — | 519,408 | |||||||||||||||||||
Morgan Stanley Capital Services LLC | 33,233 | (33,233 | ) | — | — | — | |||||||||||||||||||
Morgan Stanley & Co. LLC | 2,437,676 | (532,820 | ) | — | — | 1,904,856 | |||||||||||||||||||
State Street Bank and Trust Company | 2,390,042 | (1,452,642 | ) | (937,400 | ) | — | — | ||||||||||||||||||
Domestic Subsidiary IV | |||||||||||||||||||||||||
Barclays Bank PLC | 41,042 | (41,042 | ) | — | — | — | |||||||||||||||||||
Goldman Sachs & Co. LLC | 39,255 | (39,255 | ) | — | — | — | |||||||||||||||||||
Goldman Sachs International | 43,697 | (43,697 | ) | — | — | — | |||||||||||||||||||
J.P. Morgan Securities LLC | 2,104,973 | (521,597 | ) | — | — | 1,583,376 | |||||||||||||||||||
JPMorgan Chase Bank, N.A. | 4,678,032 | (4,678,032 | ) | — | — | — | |||||||||||||||||||
Morgan Stanley Capital Services LLC | 5,594,148 | (1,526,328 | ) | — | — | 4,067,820 | |||||||||||||||||||
State Street Bank and Trust Company | 590,756 | (347,263 | ) | — | — | 243,493 | |||||||||||||||||||
|
|
|
|
|
|
|
|
|
| ||||||||||||||||
| $ | 44,435,329 | $ | (17,214,034 | ) | $ | (4,029,644 | ) | $ | — | $ | 23,191,651 | ||||||||||||||
|
|
|
|
|
|
|
|
|
| ||||||||||||||||
273
Table of Contents
Blackstone Alternative Multi-Strategy Fund and Subsidiaries
Notes to Consolidated Financial Statements (Continued)
For the Year Ended March 31, 2023
| Gross Amounts Not Offset in the Consolidated Statement of Assets and Liabilities | |||||||||||||||||||||||||
| Gross Amount of Liabilities Presented in Consolidated Statement of Assets and Liabilities | Derivative Financial Instruments Available to Offset | Cash Collateral Pledged(5) | Non-Cash Collateral | Net Amount(3) | |||||||||||||||||||||
By Counterparty(1) | |||||||||||||||||||||||||
Bank of America, N.A. | $ | (138,546 | ) | $ | 138,546 | $ | — | $ | — | $ | — | ||||||||||||||
Barclays Bank PLC | (446,935 | ) | 446,935 | — | — | — | |||||||||||||||||||
Goldman Sachs & Co. LLC | (173,388 | ) | 173,388 | — | — | — | |||||||||||||||||||
Morgan Stanley Capital Services LLC | (2,490,353 | ) | 2,490,353 | — | — | — | |||||||||||||||||||
Cayman Subsidiary | |||||||||||||||||||||||||
Citibank N.A. | (757,172 | ) | 757,172 | — | — | — | |||||||||||||||||||
Citigroup Global Markets, Inc. | (695,595 | ) | 695,595 | — | — | — | |||||||||||||||||||
Goldman Sachs International | (841,070 | ) | 841,070 | — | — | — | |||||||||||||||||||
J.P. Morgan Securities LLC | (2,605,055 | ) | — | 2,605,055 | — | — | |||||||||||||||||||
JPMorgan Chase Bank, N.A. | (2,455,066 | ) | 2,455,066 | — | — | — | |||||||||||||||||||
Morgan Stanley Capital Services LLC | (206,281 | ) | 33,233 | — | — | (173,048 | ) | ||||||||||||||||||
Morgan Stanley & Co. LLC | (532,820 | ) | 532,820 | — | — | — | |||||||||||||||||||
State Street Bank and Trust Company | (1,452,642 | ) | 1,452,642 | — | — | — | |||||||||||||||||||
Domestic Subsidiary IV | |||||||||||||||||||||||||
Barclays Bank PLC | (439,063 | ) | 41,042 | 398,021 | — | — | |||||||||||||||||||
Goldman Sachs & Co. LLC | (320,110 | ) | 39,255 | — | — | (280,855 | ) | ||||||||||||||||||
Goldman Sachs International | (5,204,157 | ) | 43,697 | 5,160,460 | — | — | |||||||||||||||||||
J.P. Morgan Securities LLC | (521,597 | ) | 521,597 | — | — | — | |||||||||||||||||||
JPMorgan Chase Bank, N.A. | (5,013,973 | ) | 4,678,032 | — | — | (335,941 | ) | ||||||||||||||||||
Morgan Stanley Capital Services LLC | (1,526,328 | ) | 1,526,328 | — | — | — | |||||||||||||||||||
State Street Bank and Trust Company | (347,263 | ) | 347,263 | — | — | — | |||||||||||||||||||
|
|
|
|
|
|
|
|
|
| ||||||||||||||||
| $ | (26,167,414 | ) | $ | 17,214,034 | $ | 8,163,536 | $ | — | $ | (789,844 | ) | ||||||||||||||
|
|
|
|
|
|
|
|
|
| ||||||||||||||||
| (1) | The Fund and each Subsidiary are subject to separate MNAs with each individual counterparty. |
| (2) | Net amount represents the net amount receivable from the counterparty in the event of default. |
| (3) | Net amount represents the net amount payable to the individual counterparty in the event of default. |
| (4) | Additional required collateral received from the individual counterparty is not shown for financial reporting purposes. |
| (5) | Additional required collateral pledged to the individual counterparty is not shown for financial reporting purposes. |
274
Table of Contents
Blackstone Alternative Multi-Strategy Fund and Subsidiaries
Notes to Consolidated Financial Statements (Continued)
For the Year Ended March 31, 2023
5. Fair Value Measurements
The following table presents information about the classification of the Fund’s investments measured at fair value within the fair value hierarchy as of March 31, 2023:
Assets: | Level 1 | Level 2 | Level 3 | Total | ||||||||||||||||
Investments in Securities: |
| |||||||||||||||||||
Common Stock | $ | 684,484,289 | $ | 5,740,591 | $ | 1,414,687 | $ | 691,639,567 | ||||||||||||
Preferred Stock | — | — | 9,088,567 | 9,088,567 | ||||||||||||||||
Asset-Backed Securities | — | 150,003,008 | — | 150,003,008 | ||||||||||||||||
Convertible Bonds | — | 3,067,581 | — | 3,067,581 | ||||||||||||||||
Bank Debt | — | 103,498,560 | 60,165,104 | 163,663,664 | ||||||||||||||||
Corporate Bonds & Notes | — | 451,304,294 | 125,350 | 451,429,644 | ||||||||||||||||
Sovereign Debt | — | 207,617,441 | — | 207,617,441 | ||||||||||||||||
Mortgage-Backed Securities | — | 2,245,196,802 | — | 2,245,196,802 | ||||||||||||||||
U.S. Government Sponsored Agency Securities | — | 10,730,831 | — | 10,730,831 | ||||||||||||||||
Municipals | — | 223,782 | — | 223,782 | ||||||||||||||||
U.S. Treasury Notes | — | 22,112,921 | — | 22,112,921 | ||||||||||||||||
Exchange-Traded Funds | 15,106,503 | — | — | 15,106,503 | ||||||||||||||||
Warrants | 865,168 | 27,797 | 246,796 | 1,139,761 | ||||||||||||||||
Rights | 262,484 | — | — | 262,484 | ||||||||||||||||
Commodities | — | 195,169,128 | — | 195,169,128 | ||||||||||||||||
Repurchase Agreements | — | 123,512,576 | — | 123,512,576 | ||||||||||||||||
Purchased Options | 17,707,432 | 14,844,662 | — | 32,552,094 | ||||||||||||||||
Subtotal | $ | 718,425,876 | $ | 3,533,049,974 | $ | 71,040,504 | $ | 4,322,516,354 | ||||||||||||
Investments Valued at NAV |
|
|
|
|
|
| 521,923,540 | |||||||||||||
Total Investments in Securities | $ | 718,425,876 | $ | 3,533,049,974 | $ | 71,040,504 | $ | 4,844,439,894 | ||||||||||||
Other Financial Instruments: |
| |||||||||||||||||||
Futures Contracts | 98,778,301 | — | — | 98,778,301 | ||||||||||||||||
Forward Foreign Currency Exchange Contracts | — | 4,618,527 | — | 4,618,527 | ||||||||||||||||
Centrally Cleared Credit Default Swaps | — | 19,856,609 | — | 19,856,609 | ||||||||||||||||
OTC Credit Default Swaps | — | 5,543,315 | — | 5,543,315 | ||||||||||||||||
OTC Total Return Swaps | — | 17,287,914 | — | 17,287,914 | ||||||||||||||||
Variance Swaps | — | 2,140,911 | — | 2,140,911 | ||||||||||||||||
Centrally Cleared Interest Rate Swaps | — | 8,534,543 | — | 8,534,543 | ||||||||||||||||
Total Investments in Securities and Other Financial Instruments | $ | 817,204,177 | $ | 3,591,031,793 | $ | 71,040,504 | $ | 5,001,200,014 | ||||||||||||
275
Table of Contents
Blackstone Alternative Multi-Strategy Fund and Subsidiaries
Notes to Consolidated Financial Statements (Continued)
For the Year Ended March 31, 2023
Liabilities: | Level 1 | Level 2 | Level 3 | Total | ||||||||||||||||
Securities Sold Short: |
| |||||||||||||||||||
Common Stock | $ | (500,019,546 | ) | $ | — | $ | (11,144 | ) | $ | (500,030,690 | ) | |||||||||
Corporate Bonds & Notes | — | (40,034,573 | ) | — | (40,034,573 | ) | ||||||||||||||
Exchange-Traded Funds | (2,530,298 | ) | — | — | (2,530,298 | ) | ||||||||||||||
Mortgage-Backed Securities | — | (586,590,064 | ) | — | (586,590,064 | ) | ||||||||||||||
Sovereign Debt | — | (70,840,676 | ) | — | (70,840,676 | ) | ||||||||||||||
U.S.Treasury Notes | — | (7,793,640 | ) | — | (7,793,640 | ) | ||||||||||||||
Warrants^ | — | — | 0 | 0 | ||||||||||||||||
Total Securities Sold Short | (502,549,844 | ) | (705,258,953 | ) | (11,144 | ) | (1,207,819,941 | ) | ||||||||||||
Other Financial Instruments: |
| |||||||||||||||||||
Options Written | (31,818,813 | ) | (3,520,960 | ) | — | (35,339,773 | ) | |||||||||||||
Reverse Repurchase Agreements | — | (59,801,623 | ) | — | (59,801,623 | ) | ||||||||||||||
Futures Contracts | (82,527,880 | ) | — | — | (82,527,880 | ) | ||||||||||||||
Forward Foreign Currency Exchange Contracts | — | (3,226,782 | ) | — | (3,226,782 | ) | ||||||||||||||
Centrally Cleared Credit Default Swaps | — | (1,903,451 | ) | — | (1,903,451 | ) | ||||||||||||||
OTC Credit Default Swaps | — | (10,315,504 | ) | — | (10,315,504 | ) | ||||||||||||||
OTC Total Return Swaps | — | (8,149,779 | ) | — | (8,149,779 | ) | ||||||||||||||
Variance Swaps | — | (954,389 | ) | — | (954,389 | ) | ||||||||||||||
Centrally Cleared Interest Rate Swaps | — | (620,707 | ) | — | (620,707 | ) | ||||||||||||||
Total Securities Sold Short and Other Financial Instruments | $ | (616,896,537 | ) | $ | (793,752,148 | ) | $ | (11,144 | ) | $ | (1,410,659,829 | ) | ||||||||
| ^ | A balance indicated with a “0”, reflects either a zero balance or an amount that rounds to less than 1. |
Investments in Investee Funds that are measured at fair value using NAV as a practical expedient have not been classified in the fair value hierarchy. The fair value amounts presented in this table are intended to permit reconciliation of the fair value hierarchy to the amounts presented in the Consolidated Financial Statements.
Investments in Investee Funds that are non-redeemable or subject to other restrictions such as a lockup at the measurement date or have the ability to limit the individual amount of investor redemptions shall be classified as having a redemption restriction.
276
Table of Contents
Blackstone Alternative Multi-Strategy Fund and Subsidiaries
Notes to Consolidated Financial Statements (Continued)
For the Year Ended March 31, 2023
The following table summarizes investments in Investee Funds, by investment strategy, the unfunded commitment of each strategy (if applicable), and the amount of the investment in Investee Fund that cannot be redeemed because of redemption restrictions put in place by the Investee Fund.
Investments in Investee Funds by Strategy | Unfunded Commitment $ | Non-Redeemable Investments (A) | Other Restricted Investments (B) | Investments Subject to No Restrictions | Total $ | |||||||||
Amount $ | Redemption Commencement | Amount $ | Redemption Restriction Term | Amount $ | ||||||||||
| Event-Driven(1) | 43,039,015 | 2,132,764 | N/A | 35,674,204 | Semi- Annual | — | 37,806,968 | |||||||
| Macro Strategies(2) | N/A | N/A | N/A | 99,219,825 | Monthly with 90 day’s notice | — | 99,219,825 | |||||||
| Macro Strategies(2) | N/A | N/A | N/A | 146,173,102 | Daily with 6 day’s notice | — | 146,173,102 | |||||||
| Macro Strategies(2) | N/A | N/A | N/A | 30,893,888 | Quarterly | — | 30,893,888 | |||||||
| Macro Strategies(2) | N/A | N/A | N/A | 43,688,270 | Monthly | — | 43,688,270 | |||||||
| Equity Hedge(3) | N/A | N/A | N/A | 27,526,527 | Monthly | — | 27,526,527 | |||||||
| (1) | The Event-Driven strategy generally includes Investee Funds that seek returns by investing in strategies including catalyst events, share class arbitrage, share buybacks, post re-organization equity, recapitalizations, spin-offs and stub trades. |
| (2) | The Macro Strategies strategy generally includes Investee Funds with a focus on opportunistic and strategic allocations across asset classes including but not limited to bonds, rates, currencies and commodities. |
| (3) | The Equity Hedge strategy generally includes equity-focused Investee Funds with a bottom-up analysis that do not actively trade exposures, with trading strategies focusing on shorter-term dynamics and appreciation for market technicals, top-down thematic/macro views, and technically driven statistical arbitrage with fundamental quantitative long/short strategies. |
(A) Investments in Investee Funds cannot currently be redeemed and the remaining redemption restriction period is not known. The date the redemption restriction commenced is disclosed when known.
(B) Investments subject to other restrictions include investments in Investee Funds that are subject to a lockup at the measurement date and/or have the ability to limit the individual amount of investor redemptions. The redemption restriction term is based on the restriction period (or range of restriction periods) for Investee Funds as defined in each respective Investee Fund’s governing legal agreement without consideration of the length of time elapsed from the date of investments in Investee Funds. The Fund’s
277
Table of Contents
Blackstone Alternative Multi-Strategy Fund and Subsidiaries
Notes to Consolidated Financial Statements (Continued)
For the Year Ended March 31, 2023
investment in a particular Investee Fund classified within the strategies above may be comprised of investments with differing liquidity terms or investments that were made at differing points in time.
The Fund recognizes transfers within the fair value hierarchy as of the beginning of the period. Transfers into and out of Level 3 were primarily related to the availability of broker quotations in accordance with valuation methodology.
The changes in investments measured at fair value for which the Fund used Level 3 inputs to determine fair value are as follows:
Assets: Investments | Common Stocks | Preferred Stocks | Bank Debt | Corporate Bonds & Notes | Warrants | Common Stocks Sold Short | Unfunded Loan Commitment(a) | Total | ||||||||||||||||||||||||||||||||
Balance as of March 31, 2022 | $ | 805,897 | $ | 9,655,872 | $ | 92,116,920 | $ | 126,440 | $ | 262,811 | $ | (11,144 | ) | $ | 71,259 | $ | 103,028,055 | |||||||||||||||||||||||
Transfers In | — | — | 13,840,984 | — | — | — | — | 13,840,984 | ||||||||||||||||||||||||||||||||
Transfers Out | — | — | (36,148,058 | ) | — | — | — | — | (36,148,058 | ) | ||||||||||||||||||||||||||||||
Purchases | — | — | 11,779,434 | — | — | 19,790 | — | 11,799,224 | ||||||||||||||||||||||||||||||||
Sales | (479 | ) | — | (15,460,021 | ) | — | — | (12,865 | ) | — | (15,473,365 | ) | ||||||||||||||||||||||||||||
Amortization | — | — | 413,878 | — | — | — | — | 413,878 | ||||||||||||||||||||||||||||||||
Net realized gain (loss) | 479 | — | (1,979,287 | ) | — | — | (1,480 | ) | — | (1,980,288 | ) | |||||||||||||||||||||||||||||
Net change in unrealized appreciation (depreciation) | 608,790 | (567,305 | ) | (4,398,746 | ) | (1,090 | ) | (16,015 | ) | (5,445 | ) | (71,259 | ) | (4,451,070 | ) | |||||||||||||||||||||||||
|
|
|
|
|
|
|
|
|
|
|
|
|
|
|
| |||||||||||||||||||||||||
Balance as of March 31, 2023 | $ | 1,414,687 | $ | 9,088,567 | $ | 60,165,104 | $ | 125,350 | $ | 246,796 | $ | (11,144 | ) | $ | — | $ | 71,029,360 | |||||||||||||||||||||||
|
|
|
|
|
|
|
|
|
|
|
|
|
|
|
| |||||||||||||||||||||||||
Net change in unrealized appreciation (depreciation) related to investments still held as of March 31, 2023 | $ | 608,790 | $ | (567,305 | ) | $ | (5,170,948 | ) | $ | (1,090 | ) | $ | (16,015 | ) | $ | (5,445 | ) | $ | — | $ | (5,152,013 | ) | ||||||||||||||||||
|
|
|
|
|
|
|
|
|
|
|
|
|
|
|
| |||||||||||||||||||||||||
| (a) | Represents unrealized appreciation (depreciation). |
The following table summarizes the quantitative inputs and assumptions used for investments classified within Level 3 of the fair value hierarchy as of March 31, 2023.
Assets | Valuation Technique | Unobservable Inputs | Fair Value at March 31, 2023 | Range of Inputs (Weighted Average) | ||||||||||||||||
Investments in Securities: | ||||||||||||||||||||
Bank Debt | | Broker-dealer Quotations | Indicative Bid | $ | 28,490,101 | N/A | ||||||||||||||
| Trade Price | Trade Price | 2,908,923 | ||||||||||||||||||
| | Comparable Company Multiples | EBITDA Multiples | 17,680,615 | 9.5x (a) | ||||||||||||||||
| 8,245,588 | 10.0x (a) | |||||||||||||||||||
| Distribution Analysis | | Expected Distribution Proceeds | 2,839,877 | N/A | ||||||||||||||||
278
Table of Contents
Blackstone Alternative Multi-Strategy Fund and Subsidiaries
Notes to Consolidated Financial Statements (Continued)
For the Year Ended March 31, 2023
Assets | Valuation Technique | Unobservable Inputs | Fair Value at March 31, 2023 | Range of Inputs (Weighted Average) | ||||||||||||||||
Common Stock | | Broker-dealer Quotations | Indicative Bid | $ | 1,414,687 | N/A | ||||||||||||||
Corporate Bonds & Notes | | Broker-dealer Quotations | Indicative Bid | 125,350 | N/A | |||||||||||||||
Preferred Stock | | Broker-dealer Quotations | Indicative Bid | 7,515,447 | N/A | |||||||||||||||
| | Comparable Company Multiples | EBITDA Multiples | 1,573,120 | 9.5x (a) | ||||||||||||||||
Warrants | Distribution Analysis | | Expected Distribution Proceeds | 246,796 | N/A | |||||||||||||||
| | Broker-dealer Quotations | Indicative Bid | 0 | ^ | N/A | |||||||||||||||
Common Stock Sold short | | Broker-dealer Quotations | Indicative Bid | (11,144 | ) | N/A | ||||||||||||||
|
| |||||||||||||||||||
Total Investments in Securities | $ | 71,029,360 | ||||||||||||||||||
|
| |||||||||||||||||||
| (a) | A significant change in unobservable input would have resulted in a correlated significant change to value. |
| ^ | A balance indicated with a “0”, reflects either a zero balance or an amount that rounds to less than 1. |
6. Purchase and Sale of Fund Shares
The Fund currently offers Class D Shares, Class I Shares, Class R Shares and Class Y Shares. During the year ended March 31, 2023, only Class D Shares, Class I Shares and Class Y Shares were outstanding.
The Fund’s Class D Shares are offered primarily through broker-dealers and other financial intermediaries with whom the Distributor has an agreement for the use of the Fund in investment products, programs, or accounts such as mutual fund supermarkets or other no transaction fee platforms. The Fund’s Class I Shares are offered to institutional investors and individual investors who are clients of financial intermediaries, broker-dealers, financial institutions or registered investment advisors that: have entered into an arrangement approved by the Distributor to provide certain administrative services to investors in the Fund’s Class I Shares. Shareholders of Class I Shares may be subject to additional advisory, administrative, servicing, account-level or other fees in addition to those described in the Fund’s Prospectus, which are paid to financial intermediaries to support the additional services they may provide. The Fund’s Class Y Shares are offered for institutional investors and individuals (including through individual retirement accounts) who purchase directly from the Fund. Class Y Shares may also be offered to employees, officers and directors/ trustees of the Investment Adviser, the Fund or their respective affiliates. In addition, Class Y Shares are offered for institutional investors and individuals who are clients of financial intermediaries, broker-dealers, financial institutions, or registered investment advisors that have entered into an arrangement approved by the Distributor and do not charge a fee to the Fund. The minimum investment in Class D Shares by an investor is $10,000, and the minimum subsequent investment in Class D Shares by an investor is $1,000. The minimum investment in Class I Shares by an investor is $100,000, and the minimum subsequent investment in Class I Shares by an investor is $10,000. Class Y Shares have no investment minimum requirements. The Fund’s Class R Shares have no minimum investment requirement and are generally available only to special benefit plans.
Shares of the Fund may be purchased or redeemed at NAV each Business Day.
279
Table of Contents
Blackstone Alternative Multi-Strategy Fund and Subsidiaries
Notes to Consolidated Financial Statements (Continued)
For the Year Ended March 31, 2023
7. Investment Adviser Fees and Other Transactions with Affiliates
Pursuant to the investment management agreement between the Investment Adviser and the Trust, on behalf of the Fund, the Fund pays the Investment Adviser a management fee (the “Fund Management Fee”) at an annual rate based on the Fund’s average daily net assets, excluding the net assets of the applicable Subsidiaries. The Fund Management Fee accrues daily in arrears and is paid quarterly. The Investment Adviser receives additional compensation at an annual rate based on each Subsidiary’s average daily net assets for providing management services to the Subsidiaries. For collective net assets of the Fund and the respective Subsidiaries up to $2.5 billion, the Fund Management Fee is calculated at a rate of 1.95% (annualized), and for collective net assets greater than or equal to $2.5 billion, the Fund Management Fee is calculated at a rate of 1.80% (annualized). During the year ended March 31, 2023, the Fund paid the Investment Adviser $89,397,492 in management fees. From this amount, the Investment Adviser paid $38,443,867 in sub-advisory fees to non-affiliated Sub-Advisers with respect to the Fund, which amounted to 0.81% of the Fund’s average daily net assets. The Investment Adviser paid $2,690,483 in sub-advisory fees with respect to the Fund to Blackstone Real Estate Special Situations Advisors L.L.C. and Blackstone Liquid Credit Strategies LLC, respectively, both indirect wholly-owned subsidiaries of Blackstone and affiliates of the Investment Adviser, which amounted to 0.06% of the Fund’s average daily net assets
Sub-Advisory Fees
Pursuant to the sub-advisory agreements between the Investment Adviser and the Sub-Advisers, the Sub-Advisers are compensated for the services they provide to the Fund by the Investment Adviser from the Fund Management Fee received by the Investment Adviser.
Distribution and Service Fees
Pursuant to the amended and restated Distribution and Service Plan, the Fund’s Class D Shares bear distribution and service fees at an annual rate of 0.25% of the average daily net assets of the Fund attributable to Class D Shares. Payments of the distribution and service fee may be made without regard to expenses actually incurred. The Distributor may pay all or a portion of the distribution and/or service fee to brokers, dealers, selling agents, other financial institutions, or other industry professionals (collectively, “intermediaries”) for distribution services, sales support services, personal services, and/or the maintenance of shareholder account services provided and related expenses incurred by such intermediaries. The Fund’s Class I Shares, Class Y Shares and Class R Shares are not subject to distribution and service fees.
Expense Limitation and Reimbursement
The Investment Adviser has entered into an Expense Limitation and Reimbursement Agreement with the Fund to limit the amount of Specified Expenses (as defined below) of the Fund to 2.40% per annum of the Fund’s net assets for Class D Shares, Class I Shares and Class Y Shares and 2.55% per annum of the Fund’s net assets for Class R Shares (collectively, the “Total Expense Cap”) (computed and applied on a monthly basis). Specified Expenses include all expenses incurred by the Fund with the exception of (i) distribution or servicing fees, (ii) acquired fund fees and expenses, (iii) brokerage and trading costs, (iv) interest payments (including any interest expenses, commitment fees, or other expenses related to any line of credit of the Fund), (v) taxes, (vi) dividends and interest on short positions, and (vii) extraordinary expenses (in each case as determined in the sole discretion of BAIA).
To the extent the estimated annualized Specified Expenses for any month exceed the Total Expense Cap, the Investment Adviser will waive its fees and/or reimburse the Fund for expenses to the extent necessary to eliminate such excess. The Investment Adviser may discontinue its obligations under the Expense Limitation
280
Table of Contents
Blackstone Alternative Multi-Strategy Fund and Subsidiaries
Notes to Consolidated Financial Statements (Continued)
For the Year Ended March 31, 2023
and Reimbursement Agreement at any time in its sole discretion after August 31, 2025 upon written notice to the Fund. This agreement cannot be terminated prior to August 31, 2025 without the Board’s consent. The Fund has agreed to repay the amounts borne by the Investment Adviser under the Expense Limitation and Reimbursement Agreement within the thirty-six month period after the Investment Adviser bears the expense, to the extent the estimated annualized Specified Expenses for a given month are less than the lower of the Total Expense Cap or any expense limitation agreement then in effect with respect to the Fund. The repayment may not raise the level of estimated annualized Specified Expenses in the month of repayment to exceed the Total Expense Cap or any other expense limitation agreement then in effect. During the three year period ended March 31, 2023, there were no repayments or potential repayments to the Investment Adviser.
Related Party Transactions
Blackstone Holdings Finance Co. L.L.C. (“FINCO”), an affiliate of the Fund, pays certain expenses on behalf of the Fund. The Fund reimburses FINCO for such expenses paid on behalf of the Fund. FINCO does not charge any fees for providing such administrative services. At year ended March 31, 2023, the Fund has an amount payable to FINCO of $549,237.
Blackstone Alternative Asset Management L.P. (“BAAM”), an affiliate of the Fund, pays certain expenses on behalf of the Fund. The Fund reimburses BAAM for such expenses paid on behalf of the Fund. BAAM does not charge any fees for providing such administrative services. At year ended March 31, 2023, the Fund has an amount payable to BAAM of $261,965.
Blackstone Administrative Services Partnership L.P. (“BASP”), an affiliate of the Fund, pays certain expenses on behalf of the Fund. The Fund reimburses BASP for such expenses paid on behalf of the Fund. BASP does not charge any fees for providing such administrative services. At year ended March 31, 2023, the Fund has an amount payable to BASP of $12,903.
The Investment Adviser utilizes technology offered by Arcesium LLC (“Arcesium”) to provide certain middle- and back-office services to the Fund, and the Fund bears the costs for such services. The parent company of a Sub-Adviser owns a controlling, majority interest in Arcesium and the Investment Adviser owns a non-controlling, minority interest in Arcesium. At year end March 31, 2023, the amounts related to Arcesium are included in the amount payable to FINCO and BAAM.
8. Other Agreements
State Street Bank and Trust Company serves as the administrator, custodian and transfer agent to the Fund. U.S. Bank National Association (“U.S. Bank”) serves as custodian for certain of the Fund’s securities, commodities, cash, and other property. Blackstone Securities Partners L.P., an affiliate of the Investment Adviser, serves as the Fund’s distributor.
9. Principal Investment Risks
The investment program of the Fund entails substantial risks and includes alternative investment and trading strategies not employed by traditional mutual funds. An investor may lose part or all of your investment and/ or your investment may not perform as well as other similar investments. An investment in the Fund should be viewed only as part of an overall investment program. No assurance can be given that the Fund’s investment program will be successful. The following is a summary description of some, but not all, of the principal risks of investing in the Fund, including the indirect risks associated with the Fund’s investments in the Subsidiaries and Investee Funds. Any decision to invest in the Fund should be made after a review of the
281
Table of Contents
Blackstone Alternative Multi-Strategy Fund and Subsidiaries
Notes to Consolidated Financial Statements (Continued)
For the Year Ended March 31, 2023
full set of principal risks in the Fund’s prospectus and should take into account that the Fund may make virtually any kind of investment, and be subject to related risks, which can be substantial. The relative significance of the principal risks identified below, at any given time, will vary depending on the specific composition of the Fund’s investment portfolio from time to time and the allocation of the Fund’s assets among the various investment strategies, which may change frequently and/or significantly over time. As applicable, references in these Risks to the “Fund” mean any one or more of the Fund, Subsidiaries, and Investments in Investee Funds, and references to a “Manager” mean any one or more of the Investment Adviser, Sub-Advisers, and advisers to the Investee Funds.
Market Risk and Selection Risk. The Fund is subject to market risk and selection risk. Market risk is the risk that one or more markets in which the Fund invests will decline in value, including the possibility that the markets will decline sharply and unpredictably. While a Manager may make efforts to control the risks associated with market changes, and may attempt to identify changes as they occur, market environment changes can be sudden and extreme. Significant shocks to or disruptions of the financial markets, including those caused by epidemics and pandemics, economic, natural, and man-made disasters, government action, war, or significant geopolitical events, could adversely affect the liquidity and volatility of securities held by the Fund. Market environment changes may adversely affect the performance of a model and amplify losses. Selection risk is the risk that the securities held by the Fund will underperform the markets, the relevant indices, or the securities selected by other funds with similar investment objectives and investment strategies.
Counterparty Credit Risk. The stability and liquidity of many derivative and securities lending transactions depend in large part on the creditworthiness of the parties to the transactions. If a counterparty to such a transaction defaults, exercising contractual rights may involve delays or costs for the Fund. Furthermore, there is a risk that a counterparty could become the subject of insolvency proceedings, and that the recovery of securities and other assets from such counterparty will be delayed or be of a value less than the value of the securities or assets originally entrusted to such counterparty. At times, including when the Fund has entered into a Basket Swap, the Fund will have significant exposure to a single counterparty.
Liquidity Risk. Some securities held by the Fund, including, but not limited to, restricted, distressed, non-exchange traded, and/or privately placed securities, may be difficult to sell, or illiquid, particularly during times of market turmoil. Investments in Investee Funds are sometimes illiquid and some Investee Funds may not permit withdrawals or may make in-kind distributions of illiquid securities when the Fund desires to divest. Illiquid securities may be difficult to value. If the Fund is forced to sell an illiquid asset to meet redemption requests or other cash needs, the Fund may be forced to sell at a loss.
Equity Securities Risk. Common and preferred stocks represent equity ownership in a company. Stock markets are volatile. The prices of equity securities will fluctuate and can decline and reduce the value of a portfolio investing in equities. The value of equity securities purchased by the Fund could decline if the financial condition of the companies the Fund invests in decline or if overall market and economic conditions deteriorate. They may also decline due to factors that affect a particular industry or industries, such as labor shortages or an increase in production costs and competitive conditions within an industry. In addition, they may decline due to general market conditions that are not specifically related to a company or industry, such as real or perceived adverse economic conditions, changes in the general outlook for corporate earnings, changes in interest or currency rates or generally adverse investor sentiment.
Derivatives Risk. The use of derivatives involves the risk that their value may not move as expected relative to the value of the relevant underlying assets, rates, or indices. The Fund invests in derivatives for hedging and non-hedging purposes. Derivatives can be volatile and illiquid, are subject to counterparty credit risk, and may create investment exposure greater than the initial investment.
282
Table of Contents
Blackstone Alternative Multi-Strategy Fund and Subsidiaries
Notes to Consolidated Financial Statements (Continued)
For the Year Ended March 31, 2023
Structured Products Risk. Holders of structured products bear risks of the underlying investments, index, or reference obligation and are subject to counterparty credit, valuation, and liquidity risks. The Fund may have the right to receive payments only from the structured product, and generally does not have direct rights against the issuer or the entity that sold the assets to be securitized. Certain structured products may be thinly traded or have a limited trading market. In addition to the general risks associated with debt securities discussed herein, structured products carry additional risks, including, but not limited to: the possibility that distributions from collateral securities will not be adequate to make interest or other payments; the quality of the reference securities may decline in value or default; the possibility that changes in the reference instrument will reduce the interest rate and principal amount payable on maturity; and the possibility that the position is subordinate to other classes. Structured notes are based upon the movement of one or more factors, including currency exchange rates, interest rates, referenced bonds and stock indices, and changes in interest rates and impact of these factors may cause significant price fluctuations. Additionally, changes in the reference instrument or security may cause the interest rate on the structured note to be reduced to zero. Structured products may be less liquid than other types of securities and more volatile than the reference instrument.
Inflation Risk. Inflation risk is the risk that the value of assets or income from investments will be less in the future as inflation decreases the value of money. As inflation increases, the present value of the Fund’s assets and distributions may decline. This risk is more prevalent with respect to debt securities held by the Fund. Inflation creates uncertainty over the future real value (after inflation) of an investment. Inflation rates may change frequently and drastically as a result of various factors, including unexpected shifts in the domestic or global economy (or expectations that such policies will change), and the Fund’s investments may not keep pace with inflation, which may result in losses to Fund investors or adversely affect the real value of shareholders’ investments in the Funds. For example, wages and prices of inputs increase during periods of inflation, which can negatively impact returns on investments. In an attempt to stabilize inflation, countries may impose wage and price controls or otherwise intervene in the economy. Governmental efforts to curb inflation often have negative effects on the level of economic activity. Investors’ expectation of future inflation can also impact the current value of portfolio investments, resulting in lower asset values and potential losses. This risk is elevated compared to historical market conditions because of recent monetary policy measures, the current interest rate environment, and the historically high prevailing inflation rates.
Risks Specific to Investments in Investee Funds. In addition to risks relating to their direct investments, Investee Funds often involve additional special risks not present in direct investments. Investors in the Fund bear two layers of fees and expenses at both the Fund level and the Investee Fund level. The Fund’s investments in Investee Funds are priced, in the absence of readily available market values, based on estimates of fair value, which may prove to be inaccurate; these valuations are used to calculate fees payable to the Investment Adviser and the net asset value of the Fund’s shares. The Investment Adviser is also dependent on information, including performance information, provided by the Investee Funds, which if inaccurate could adversely affect the Investment Adviser’s ability to accurately value the Fund’s shares. Some Investee Funds are not registered as investment companies under the 1940 Act, and therefore, the Fund is not able to avail itself of the protections of the 1940 Act with respect to such investments. Certain Investee Funds, including unaffiliated hedge funds and UCITS funds, are also subject to transfer or redemption restrictions that impair the liquidity of these investments, and some Investee Funds may suspend the withdrawal rights of their shareholders, including the Fund, from time to time. Incentive fees charged by advisors of Investee Funds also may create incentives for such advisors to make investments that are riskier or more speculative than in the absence of these fees. To the extent an Investee Fund invests in a special situation investment (an investment in securities or other instruments that an Investee Fund determines to be illiquid or lacking a readily ascertainable fair value and which the Investee Fund designates as a special situation investment), the Fund’s ownership interest with respect to such special situation investment generally may not be withdrawn until the special situation investment, or a portion thereof, is realized or
283
Table of Contents
Blackstone Alternative Multi-Strategy Fund and Subsidiaries
Notes to Consolidated Financial Statements (Continued)
For the Year Ended March 31, 2023
deemed realized. The Fund also may purchase non-voting securities of, or to contractually forego the right to vote in respect of, Investee Funds in order to prevent the Fund from becoming an “affiliated person” of the Investee Fund for purposes of the 1940 Act and becoming subject to the prohibitions on transactions with affiliated persons contained in the 1940 Act. Consequently, the Fund will not be able to vote to the full extent of its economic interest on matters that require approval of investors in each Investee Fund, including matters that could adversely affect the Fund’s investment.
10. Investment Transactions
The aggregate cost of purchases and proceeds of sales of investments in securities (excluding short-term debt securities with maturities at the time of acquisition of one year or less (if applicable)), for the year ended March 31, 2023 were as follows:
| Purchases | Sales | ||||||||||||||||||||||||
| Long-Term | U.S. Government | Long-Term | U.S. Government | ||||||||||||||||||||||
Including TBAs | $4,772,993,455 | $16,000,727,964 | $2,953,361,014 | $16,315,975,692 | |||||||||||||||||||||
Excluding TBAs | 3,283,050,728 | 850,627,065 | 2,953,361,014 | 1,563,686,805 | |||||||||||||||||||||
11. Income Tax Information
The Fund intends to qualify each tax year as a regulated investment company under Subchapter M of the Code. The Fund has adopted a tax year-end of October 31, therefore the Consolidated Financial Statements, unless otherwise indicated, reflect tax adjusted balances as of October 31, 2022. The Fund intends to distribute substantially all of its net investment income and all of its net realized short-term and long-term capital gain, if any, after giving effect to any available capital loss carryforwards for U.S. federal income tax purposes. Therefore, the Fund makes no provision for U.S. federal income or excise taxes.
The Fund’s policy is to declare and pay distributions from net investment income and from net realized short-term and long-term capital gain, if any, at least annually. All distributions are reinvested in additional shares of the Fund, at NAV, unless the shareholder elects to receive cash distributions. Distributions to shareholders are recorded by the Fund on the ex-dividend date.
The Fund is subject to authoritative guidance related to the accounting and disclosure of uncertain tax positions under U.S. GAAP. This guidance sets forth a minimum threshold for the financial statement recognition of tax positions taken based on the technical merits of such positions. United States and non-U.S. tax rules (including the interpretation and application of tax laws) are subject to change. The Fund files tax returns and/or adopts certain tax positions in various jurisdictions. Non-U.S. taxes are provided for based on the Fund’s understanding of the prevailing tax rules of the non-U.S. markets in which they invest. Recently enacted tax rules, including interpretations of tax laws (e.g., regulations pertaining to the U.S. Foreign Account Tax Compliance Act) and proposed legislation currently under consideration in various jurisdictions, including the U.S., might affect the way the Fund and its investors are taxed prospectively and/or retroactively. Prior to the expiration of the relevant statutes of limitations, if any, the Fund is subject to examination by U.S. federal, state, local and non-U.S. jurisdictions with respect to the tax returns they have filed and the tax positions they have adopted. The Fund’s U.S. federal income tax returns are generally subject to examination by the Internal Revenue Service for a period of three years after they were filed. State, local and/or non-U.S. tax returns and/or other filings may be subject to examination for different periods, depending upon the tax rules of each applicable jurisdiction.
284
Table of Contents
Blackstone Alternative Multi-Strategy Fund and Subsidiaries
Notes to Consolidated Financial Statements (Continued)
For the Year Ended March 31, 2023
The Fund made the following reclassification at March 31, 2023 due to permanent book and tax differences primarily attributable to gain or loss from passive foreign investment companies, certain derivative financial instrument transactions, and income from the wholly-owned Cayman Subsidiary from its tax year-ended October 31, 2022:
Paid-in Capital | Accumulated Investment Income/(Loss) | Accumulated Net Realized Gain/(Loss) | ||
| $182,967,507 | $9,371,372 | $(192,338,879) |
The tax basis components of distributable earnings of the Fund at their tax year-ended October 31, 2022 were:
Undistributed Ordinary Income | Undistributed Long-Term Capital Gains | Capital Loss Carryforward(1) | ||
| $— | $— | $(121,141,335) |
| (1) | Under the Regulated Investment Company Modernization Act of 2010, net capital losses recognized by the Cayman Subsidiary may get carried forward indefinitely, and retain their character as short-term and/or long-term losses. Any such losses, will be deemed to arise on the first day of the next taxable year. For the tax year ended October 31, 2022, short term and long term capital losses of $0 and $121,141,335 respectively, will be carried forward by the Fund. |
In addition, the tax character of distributions paid to shareholders for the tax year-ended October 31, 2021 by the Fund is as follows:
Ordinary Income | Long-Term Capital Gain | |
| $87,774,551 | $— |
In addition, the tax character of distributions paid to shareholders for the tax year-ended October 31, 2022 by the Fund is as follows:
Ordinary Income | Long-Term Capital Gain | |
| $— | $— |
As of March 31, 2023, the approximate cost for U.S. federal income tax purposes and gross and net unrealized appreciation (depreciation) in value of investments, securities sold short, and derivatives were as follows:
Aggregate Cost | Gross Unrealized Appreciation | Gross Unrealized (Depreciation) | Net Unrealized Appreciation (Depreciation) | |||
| $3,993,181,527 | $294,992,586 | $(647,754,319) | $(352,761,733) |
12. Borrowings Under Credit Facility
As of March 31, 2023, the Fund had a secured revolving borrowing facility (the “Facility”) with State Street Bank and Trust Company (the “Bank”) in an aggregate principal amount of up to $500,000,000, subject to a maximum loan value of not more than 25% of the Fund’s NAV (the “Aggregate Commitment Amount”). Upon renewal of the credit agreement on April 6, 2023, the aggregate principal amount was reduced to $400,000,000. Borrowings under the Facility are used primarily for bridge financing purposes and are secured by the assets of the Fund. Under the terms of the agreement, the Aggregate Commitment Amount
285
Table of Contents
Blackstone Alternative Multi-Strategy Fund and Subsidiaries
Notes to Consolidated Financial Statements (Continued)
For the Year Ended March 31, 2023
may be terminated or reduced from time to time upon written notice from the Fund to the Bank. Outstanding borrowings bear interest at a rate equal to 1.35% plus the Overnight Bank Funding Rate (4.82% at March 31, 2023). A commitment fee is charged in the amount of 0.25% per annum as well as an upfront underwriting fee equal to 0.10% of the Commitment Amount per annum. Commitment fees accrued through the end of each calendar quarter are due no later than the 15th day of the immediately succeeding calendar month during the term of the Facility. Accrued interest is due no later than April 4, 2024, the termination date of the Facility at which time the Fund and the Bank can agree to extend the existing agreement. As of March 31, 2023 the Fund had no borrowings under the Facility.
13. Subsequent Events
The Investment Adviser has evaluated the impact of subsequent events through the date of financial statement issuance and determined there were no subsequent events outside the normal course of business requiring adjustment to or disclosure in the Consolidated Financial Statements.
286
Table of Contents
REPORT OF INDEPENDENT REGISTERED PUBLIC ACCOUNTING FIRM
To the Board of Trustees of Blackstone Alternative Investment Funds and the shareholders of Blackstone Alternative Multi-Strategy Fund and Subsidiaries
Opinion on the Financial Statements and Financial Highlights
We have audited the accompanying consolidated statement of assets and liabilities, including the consolidated schedule of investments, of Blackstone Alternative Multi-Strategy Fund and Subsidiaries, one of the portfolios constituting the Blackstone Alternative Investment Funds (the “Fund”), as of March 31, 2023, the related consolidated statements of operations and cash flows for the year then ended, the consolidated statements of changes in net assets for each of the two years in the period then ended, the consolidated financial highlights for each of the five years in the period then ended, and the related notes. In our opinion, the consolidated financial statements and consolidated financial highlights present fairly, in all material respects, the financial position of the Fund as of March 31, 2023, and the consolidated results of its operations and its cash flows for the year then ended, the consolidated changes in its net assets for each of the two years in the period then ended, and the consolidated financial highlights for each of the five years in the period then ended, in conformity with accounting principles generally accepted in the United States of America.
Basis for Opinion
These financial statements and financial highlights are the responsibility of the Fund’s management. Our responsibility is to express an opinion on the Fund’s financial statements and financial highlights based on our audits. We are a public accounting firm registered with the Public Company Accounting Oversight Board (United States) (PCAOB) and are required to be independent with respect to the Fund in accordance with the U.S. federal securities laws and the applicable rules and regulations of the Securities and Exchange Commission and the PCAOB.
We conducted our audits in accordance with the standards of the PCAOB. Those standards require that we plan and perform the audit to obtain reasonable assurance about whether the financial statements and financial highlights are free of material misstatement, whether due to error or fraud. The Fund is not required to have, nor were we engaged to perform, an audit of its internal control over financial reporting. As part of our audits, we are required to obtain an understanding of internal control over financial reporting but not for the purpose of expressing an opinion on the effectiveness of the Fund’s internal control over financial reporting. Accordingly, we express no such opinion.
Our audits included performing procedures to assess the risks of material misstatement of the financial statements and financial highlights, whether due to error or fraud, and performing procedures that respond to those risks. Such procedures included examining, on a test basis, evidence regarding the amounts and disclosures in the financial statements and financial highlights. Our audits also included evaluating the accounting principles used and significant estimates made by management, as well as evaluating the overall presentation of the financial statements and financial highlights. Our procedures included confirmation of securities owned as of March 31, 2023, by correspondence with the custodian, brokers and agent banks; when replies were not received from brokers and agent banks, we performed other auditing procedures. We believe that our audits provide a reasonable basis for our opinion.
Deloitte & Touche LLP
New York, New York
May 26, 2023
We have served as the auditor of one or more Blackstone investment companies since 2010.
287
Table of Contents
Blackstone Alternative Multi-Strategy Fund and Subsidiaries
Shareholder Fee Example (Unaudited)
As a shareholder of the Fund, you incur ongoing costs, including management fees and to the extent applicable, distribution (12b-1) fees and/or shareholder services fees and other Fund expenses. This Example is intended to help you to understand your ongoing costs (in dollars) of investing in the Fund and to compare these costs with the ongoing costs of investing in other mutual funds.
Actual Expenses
The actual expense example is based on an investment of $1,000 invested at the beginning of a six month period and held through the six months-ended March 31, 2023. The first line in the table below provides information about actual account values and actual expenses. You may use the information in this line, together with the amount you invested, to estimate the expenses that you paid over the period. Simply divide your account value by $1,000 (for example, an $8,600 account value divided by $1,000 = 8.6), then multiply the result by the number in the first line under the heading “Expenses Paid During Period” to estimate the expenses you paid on your account during this period.
Hypothetical Example for Comparison Purposes
The hypothetical expense example is based on an investment of $1,000 invested at the beginning of a six month period. The second line of the table below provides information about hypothetical account values and hypothetical expenses based on the Fund’s actual expense ratio and an assumed rate of return of 5% per year before expenses, which is not the actual return of the Fund. The hypothetical amount account values and expenses may not be used to estimate the actual ending account balance or expenses you paid for the period. You may use this information to compare the ongoing costs of investing in the Fund and other funds. To do so, compare this 5% hypothetical example with the 5% hypothetical examples that appear in the shareholder reports of the other funds. Please note that the expenses shown in the table are meant to highlight your ongoing costs only and do not reflect any transactional costs, such as sales charges (loads) or redemption/exchange fees. Therefore, the second line of the table is useful in comparing ongoing costs only, and will not help you determine the relative total costs of owning different funds. In addition, if these transactional costs were included, your costs would have been higher.
| Beginning Account Value 10/1/2022 | Ending Account Value 3/31/2023 | Expenses Paid During Period1 | Annualized Expense Ratio | |||||||||||||||||
Class I |
| |||||||||||||||||||
Actual | $1,000.00 | $1,030.30 | $16.86 | 3.33% | ||||||||||||||||
Hypothetical (assuming a 5% return before expenses) | $1,000.00 | $1,008.33 | $16.67 | 3.33% | ||||||||||||||||
Class D |
| |||||||||||||||||||
Actual | $1,000.00 | $1,028.30 | $20.58 | 4.07% | ||||||||||||||||
Hypothetical (assuming a 5% return before expenses) | $1,000.00 | $1,004.64 | $20.34 | 4.07% | ||||||||||||||||
Class Y |
| |||||||||||||||||||
Actual | $1,000.00 | $1,029.50 | $16.34 | 3.23% | ||||||||||||||||
Hypothetical (assuming a 5% return before expenses) | $1,000.00 | $1,008.83 | $16.18 | 3.23% | ||||||||||||||||
| 1 | Expenses are calculated using the annualized expense ratio, multiplied by the average account value over the period, multiplied by 182/365 (to reflect the one-half-year period). |
288
Table of Contents
Blackstone Alternative Investment Funds and Subsidiaries
March 31, 2023
Management of the Fund
The Fund’s operations are managed by the Investment Adviser and the Sub-Advisers (defined below), under the direction and oversight of the Board. A majority of the Trustees are not “interested persons” (as defined in the 1940 Act) of the Fund or the Investment Adviser (the “Independent Trustees”). The Trustees and the Fund’s officers (“Officers”) are subject to removal or replacement in accordance with Massachusetts law and the Trust’s Amended and Restated Declaration of Trust. All Trustees were elected by the initial shareholder of the Trust, except for Mr. Gilbert who was appointed to serve as Trustee by the Board.
Sub-Advisers
During the period covered by this report, the Investment Adviser engaged the following entities as sub-advisers (each, a “Sub-Adviser”, and together, the “Sub-Advisers”) to provide investment management services to the Fund and/or to one or more Subsidiaries.
Discretionary Sub-Advisers:
| • | Aperture Investors, LLC |
| • | Bayforest Capital Limited |
| • | Bayview Asset Management, LLC |
| • | Blackstone Liquid Credit Strategies LLC |
| • | Blackstone Real Estate Special Situations Advisors L.L.C. |
| • | Caspian Capital LP |
| • | Clear Sky Advisers, LLC |
| • | D.E. Shaw Investment Management, L.L.C. |
| • | Emso Asset Management Limited |
| • | Endeavour Capital Advisors Inc. |
| • | Fir Tree Capital Management LP (effective October 21, 2022) |
| • | Fort Baker Capital Management LP (effective March 15, 2023) |
| • | HealthCor Management, L.P. (until February 10, 2023) |
| • | Jasper Capital Hong Kong Limited |
| • | Magnetar Asset Management LLC1 (effective October 24, 2022) |
| • | Mariner Investment Group, LLC |
| • | Melqart Asset Management (UK) Limited (effective December 1, 2022) |
| • | Merritt Point Partners LLC (effective March 28, 2023) |
| • | Mesarete Capital LLP |
| • | Nephila Capital, Ltd. |
| • | North Reef Capital Management LP (effective November 16, 2022) |
| • | Sage Rock Capital Management LP |
| • | Seiga Asset Management Limited |
| • | Seven Grand Managers, LLC (effective November 16, 2022) |
| • | TrailStone Commodity Trading US, LLC |
| • | Two Sigma Advisers, LP |
| • | Waterfall Asset Management, LLC |
| 1 | Magnetar Asset Management LLC (“Magnetar”) was initially approved by the Board as a sub-adviser to the Fund in 2017 and was formally hired as a sub-adviser to the Fund on June 15, 2017. At a meeting on August 4, 2022, the Board re-approved Magnetar as a sub-adviser to the Fund and replaced the prior investment sub-advisory agreement with Magnetar with a new sub-advisory agreement. The new sub-advisory agreement with Magnetar became effective as of October 24, 2022. |
289
Table of Contents
Blackstone Alternative Investment Funds and Subsidiaries
Supplemental Information (Continued)
March 31, 2023
Trustees and Officers
The following tables set forth information concerning the Trustees and Officers of the Fund. Unless otherwise noted, the business address of each Trustee and Officer is c/o Blackstone Alternative Investment Advisors LLC, 345 Park Avenue, 28th Floor, New York, NY 10154.
Independent Trustees:
| Name and Year of Birth of Independent Trustees | Position(s) Held with Fund | Term of Office1 and Length of Time Served | Principal Occupation(s) During Past 5 Years | Number of Portfolios in Fund Complex2 Overseen by Trustee | Other Trusteeships Held by Trustee During Past 5 Years | |||||
Frank J. Coates (1964) | Trustee | March 2013 – Present | Chief Technology Officer, Dynasty Financial Partners (July 2021 – Present);
Executive Managing Director,3 Envestnet, Inc. (Wealth Management Solutions) (2016 – 2020) | 1 | None | |||||
Peter M. Gilbert (1947) | Trustee | February 2016 – Present | Retired (2015 – Present) | 1 | None | |||||
Paul J. Lawler (1948) | Trustee | March 2013 – Present | Retired (2011 – Present) | 1 | Trustee, First Eagle Funds (11 portfolios) | |||||
Kristen M. Leopold (1967) | Trustee | March 2013 – Present | CFO, BK Realty Services LLC (April 2021 – Present)
CFO, WFL Real Estate Services (2006 – April 2021) | 1 | Trustee, Central Park Group Funds (9 portfolios)
Trustee , Constitution Capital Access Fund, LLC | |||||
290
Table of Contents
Blackstone Alternative Investment Funds and Subsidiaries
Supplemental Information (Continued)
March 31, 2023
Interested Trustees:
| Name and Year of Birth of Independent Trustees | Position(s) Held with Fund | Term of Office1 and Length of Time Served | Principal Occupation(s) During Past 5 Years | Number of Portfolios in Fund Complex2 Overseen by Trustee | Other Trusteeships Held by Trustee During Past 5 Years | |||||
John M. Brown4 (1959) | Trustee | March 2013 – Present | Retired (2004 – Present) | 1 | None | |||||
Peter Koffler5 (1956) | Trustee | August 2012 – Present | Senior Managing Director,3 Blackstone Inc. (“Blackstone”) (2012 – Present);
General Counsel, BAIA (2012 – December 2021); BAAM (2010 – December 2021)
Chief Compliance Officer, BAIA (2018 – December 2020; July 2021 – December 2022); BAAM (2008 – 2012, 2018) | 1 | None |
| 1 | Term of office of each Trustee is indefinite until his or her resignation, removal, or death. Any Trustee of the Fund may be removed from office in accordance with the provisions of the Trust’s Declaration of Trust and Bylaws. |
| 2 | As of March 31, 2023, the “Fund Complex” consists of BAMSF, the Blackstone Credit Closed-End Funds (Blackstone Senior Floating Rate Term Fund, Blackstone Long-Short Credit Income Fund, Blackstone Strategic Credit Fund, and Blackstone Floating Rate Enhanced Income Fund), Blackstone Private Credit Fund, and Blackstone Secured Lending Fund. |
| 3 | Executive title, not a board directorship. |
| 4 | Mr. Brown is treated as “interested person” of the Fund, as defined in the 1940 Act, due to a family member’s relationship with a Sub-Adviser to the Fund. |
| 5 | Mr. Koffler is an “interested person” of the Fund, as defined in the 1940 Act, due to his positions with the Adviser and its affiliates. |
291
Table of Contents
Blackstone Alternative Investment Funds and Subsidiaries
Supplemental Information (Continued)
March 31, 2023
Officers:
| Name and Year of Birth of Officer | Position(s) Held with the Fund | Term of Office1 and Length of Time Served | Principal Occupation(s) During Past 5 Years | |||
| Brian F. Gavin (1969) | President (Principal Executive Officer) | August 2012 to Present | Chief Operating Officer & Senior Managing Director,2 Blackstone (2007 – Present) | |||
| Sarah Kassman (1991) | Secretary | February 2022 – Present | Associate, Blackstone (2022 – Present);
Analyst, Blackstone (2018 – 2021) | |||
| Kevin Michel (1986) | Chief Legal Officer | July 2021 – Present | Managing Director, Blackstone (2022 – Present);
Senior Vice President, Blackstone (2021 – 2022);
Vice President, Blackstone (2018 – 2020);
Associate, Blackstone | |||
| Thomas Procida (1980) | Treasurer and Principal Financial and Accounting Officer | Treasurer (August 2021 – Present); Principal Financial and Accounting Officer (February 2022 – Present) | Managing Director,2 Blackstone (2019 – Present);
Senior Vice President, Blackstone (2015 – 2019) | |||
| William Renahan (1969) | Chief Compliance Officer | August 2022 - Present | Managing Director,2 Blackstone (May 2022 – Present);
Senior Managing Director, Duff & Phelps Investment Management (2017 – May 2022) | |||
| Sherilene Sibadan (1976) | Anti-Money Laundering Officer | July 2019 – Present | Managing Director, 2 Blackstone (2022 – Present);
Senior Vice President, Blackstone (2016 – 2021) |
| 1 | Term of office of each officer is indefinite until his or her death, resignation, removal, or disqualification. |
| 2 | Executive title, not a board directorship. |
Compensation for Trustees
Each of the Independent Trustees is paid by the Fund Complex (as defined below) at a rate of $150,000 per fiscal year in the aggregate for the services to the Fund Complex (including the Subsidiaries). Mr. Brown was treated as an Independent Trustee until July 20, 2022, after which he was treated as an “interested person” (as
292
Table of Contents
Blackstone Alternative Investment Funds and Subsidiaries
Supplemental Information (Continued)
March 31, 2023
defined in the 1940 Act) of the Fund (an “Interested Trustee”) due to a family member’s relationship with a Sub-Adviser. For his service to the Fund as an Interested Trustee, Mr. Brown is paid by the Fund Complex at a rate of $129,000 per fiscal year in the aggregate for his services to the Fund Complex (excluding the Subsidiaries). The Chairpersons of the Board of Trustees and the Audit Committee is paid by the Fund Complex an additional $35,000 and $15,000, respectively, per fiscal year. These payments are allocated to the Fund and any other funds in the Fund Complex on the basis of assets under management. The Fund Complex pays for the Trustees’ travel expenses related to Board of Trustees meetings. The Trustees do not receive any pension or retirement benefits from the Fund Complex. As of November 10, 2020, the Trust adopted a deferred compensation plan (the “Deferred Compensation Plan”) to allow each Independent Trustee to align his or her interest with the Fund and the Fund’s shareholders without purchasing shares of the Fund. Certain of the Independent Trustees currently participate in the Deferred Compensation Plan. Under the Deferred Compensation Plan, each participating Independent Trustee defers payment of all or part of the compensation payable for such Trustee’s services and thereby shares in the experience alongside the Fund’s shareholders as the compensation deferred increases or decreases depending on the investment performance of the Fund. Deferred amounts remain in the Fund until distributed in accordance with the provisions of the Trust’s Deferred Compensation Plan. Pursuant to the Deferred Compensation Plan, payments due under the Deferred Compensation Plan are unsecured obligations of the Trust.
The following tables set forth information covering the total compensation payable by the Fund during its fiscal year ended March 31, 2023, to the persons who served as Trustees and Officers of the Fund during such period.
Independent Trustees:
| Name of Independent Trustee | Aggregate Compensation From the Fund | Total Compensation From the Fund Complex1 | ||||||||
Frank J. Coates2 | $ | 153,226 | $ | 153,226 | ||||||
Peter M. Gilbert | $ | 150,000 | $ | 150,000 | ||||||
Paul J. Lawler | $ | 150,000 | $ | 150,000 | ||||||
Kristen M. Leopold | $ | 165,000 | $ | 165,000 | ||||||
Interested Trustees:
| Name of Interested Trustee | Aggregate Compensation From the Fund | Total Compensation From Fund Complex1 | ||||||||
John M. Brown (treated as Independent Trustee until July 20, 2022) | $ | 166,699 | $ | 166,699 | ||||||
Peter Koffler | None | None | ||||||||
| 1 | These amounts represent aggregate compensation for the services of each Trustee to each fund in the Fund Complex, for which each Trustee serves as trustee. For the purpose of this table, the “Fund Complex” consists of the Fund and its Subsidiaries. Certain of the Independent Trustees have elected to defer all or part of their total compensation for the year ended March 31, 2023, under the Trust’s Deferred Compensation Plan. Amounts deferred for the fiscal year ended March 31, 2023 by Messrs. Gilbert and Lawler and by Ms. Leopold were $131,250, $150,000, and $49,495, respectively. |
| 2 | Mr. Coates served as Chair of the Board starting February 21, 2023. |
| 3 | Mr. Brown was treated as an Independent Trustee from his appointment as Trustee in March 2013 through July 20, 2022. Mr. Brown served as Chair of the Board until February 20, 2023. |
293
Table of Contents
Blackstone Alternative Investment Funds and Subsidiaries
Supplemental Information (Continued)
March 31, 2023
The Fund Complex also pays for a portion of the compensation for the Fund’s Chief Compliance Officer. The following table sets forth information covering the total compensation payable by the Fund, during its fiscal year ended March 31, 2023, to the Fund’s former Chief Compliance Officer, Kevin Michel (Mr. Michel resigned as Chief Compliance Officer effective August 5, 2022), and the Fund’s current Chief Compliance Officer, William Renahan, during the period. No other Officer received any compensation from the Fund during the period.
| Compensated Officer | Aggregate Compensation From the Fund | Total Compensation From the Fund Complex1 | ||||||||
Chief Compliance Officer | $ | 148,541 | $ | 148,541 | ||||||
| 1 | For the purpose of this table, the “Fund Complex” consists of the Fund and its Subsidiaries. |
Form N-PORT Filings
The Fund files its complete schedule of portfolio holdings with the SEC for the first and third quarters of each fiscal year as an exhibit to its reports on Form N-PORT. The Fund’s Form N-PORT reports are available on the SEC’s website at http://www.sec.gov. Holdings and allocations shown on any Form N-PORT are as of the date indicated in the filing and may not be representative of future investments. Holdings and allocations should not be considered research or investment advice and should not be relied upon in making investment decisions.
Proxy Voting Policies
A description of the policies and procedures used to vote proxies related to the Fund’s portfolio securities and information regarding how the Fund voted proxies relating to its portfolio securities during the most recent 12-month period ended June 30 is available (1) without charge, upon request, by calling toll free, 1-855-890-7725 and (2) on the SEC’s website at http://www.sec.gov.
Board Approval of the Sub-Advisory Agreements
At meetings of the Board held virtually on October 12, 2022 and in-person on November 15-16, 2022 and February 21-22, 2023, the Board, including a majority of the Independent Trustees, considered and approved for the Fund (i) the continuation of certain investment sub-advisory agreements ( “Continued Sub-Advisory Agreements”); (ii) certain amended and restated investment sub-advisory agreements (“Amended and Restated Sub-Advisory Agreements”); and (iii) certain new investment sub-advisory agreements (“New Sub-Advisory Agreements” and together with the Amended and Restated Sub-Advisory Agreements and Continued Sub-Advisory Agreements, the “Sub-Advisory Agreements”) between BAIA and each of the following sub-advisers (the “Sub-Advisers”):
New Sub-Advisory Agreements (approved at October meeting)
| • | Fir Tree Capital Management LP (“Fir Tree”) |
Amended and Restated Sub-Advisory Agreements (approved at October meeting)
| • | Jasper Capital Hong Kong Limited (“Jasper”) |
Continued Sub-Advisory Agreements (approved at November meeting)
| • | Blackstone Real Estate Special Situations Advisors L.L.C. (“BRESSA”) |
294
Table of Contents
Blackstone Alternative Investment Funds and Subsidiaries
Supplemental Information (Continued)
March 31, 2023
| • | Endeavour Capital Advisors Inc. (“Endeavour”) |
| • | Jasper |
| • | Seiga Asset Management Limited (“Seiga”) |
| • | Waterfall Asset Management, LLC (“Waterfall”) |
New Sub-Advisory Agreements (approved at November meeting)
| • | North Reef Capital Management LP (“North Reef”) |
| • | Seven Grand Managers LLC (“Seven Grand”) |
| • | Melqart Asset Management (UK) Limited (“Melqart”) |
Continued Sub-Advisory Agreements (approved at February meeting)
| • | Blackstone Liquid Credit Strategies LLC (“BX LCS”) |
| • | Sage Rock Capital Partners LP (“Sage Rock”) |
New Sub-Advisory Agreement (approved at February meeting)
| • | Fort Baker Capital Management (“Fort Baker”) |
| • | Harvest Fund Advisors LLC (“Harvest,”)1 |
| • | Merritt Point Partners LLC (“Merritt Point”) |
The Board held its October 2022 meeting virtually by video conference due to the ongoing COVID-19 pandemic and in reliance on the exemptive order from the SEC issued on March 13, 2020 (subsequently modified and extended on March 25, 2020 and June 19, 2020) providing temporary relief from the in person voting requirements of Section 15(c) of the 1940 Act and in compliance with the conditions therein. The Board noted that BAIA and the Fund relied on an exemptive order from the SEC that permits the Fund to hire, and make material amendments to sub-advisory agreements with, discretionary or non-discretionary sub-advisers without a shareholder vote, provided that the Board, including a majority of Independent Trustees, approve the new sub-advisers and material amendments, and certain other conditions are met. The Independent Trustees were assisted in their review of the applicable sub-advisory arrangements by their independent legal counsel, and before the meetings, the Board received materials prepared by the Independent Trustees’ independent legal counsel regarding the relevant factors to consider in connection with the approval of the Sub-Advisory Agreements between BAIA and each of the Sub-Advisers. The Board requested and evaluated all the information it deemed reasonably necessary under the circumstances in connection with the approval of the Sub-Advisory Agreements. Prior to the meetings, the Board had requested and received materials prepared by BAIA relating to each Sub-Adviser.
The information the Board received in connection with the consideration of the Continued Sub-Advisory Agreements generally included, among other things:
| (1) | a Manager Investment Review, which covered, among other things, summary information regarding each Sub-Adviser’s investment thesis, strategy, investment process, and portfolio construction; a risk evaluation; an assessment of business infrastructure, valuation, liquidity, trade execution and allocation, and compliance; and a summary of the key terms of the applicable Sub-Advisory Agreement; |
| (2) | a sub-adviser “tear sheet,” which covered in greater detail the performance, returns, and investment exposure of each Sub-Adviser that had, presently or in the past, been allocated Fund assets; and |
| (3) | a completed sub-adviser 15(c) questionnaire, which provided each Sub-Adviser’s responses to the Independent Trustees’ request for information. |
| 1 | The sub-advisory agreement with Harvest is not in effect as of the date of this Report. |
295
Table of Contents
Blackstone Alternative Investment Funds and Subsidiaries
Supplemental Information (Continued)
March 31, 2023
The information the Board received in connection with the consideration of the New Sub-Advisory Agreements generally included:
| (1) | a Manager Investment Review, which covered, among other things, summary information regarding each sub-adviser’s investment thesis, strategy, investment process, and portfolio construction; a risk evaluation; an assessment of business infrastructure, valuation, liquidity monitoring, and compliance; and a summary of the key terms of the Sub-Advisory Agreements; |
| (2) | a sub-adviser 15(c) questionnaire, which provided the sub-adviser’s responses to the Independent Trustees’ request for information; and |
| (3) | information regarding the sub-adviser’s affiliates. |
Additionally, for each newly proposed Sub-Adviser, the Board received a copy of the Sub-Adviser’s compliance program under Rule 38a-1 under the 1940 Act and code of ethics.
With respect to the Amended Sub-Advisory Agreement approved in October 2022 for Jasper, the Board reviewed the proposed amendments to the Sub-Advisory Agreement and considered the amendment in light of the information provided in connection with the Board’s approval of the initial Sub-Advisory Agreement with Jasper at its August 2020 meeting, its approval of a new revised Sub-Advisory Agreement with Jasper at its November 2020 meeting (prior to the execution of the initial Sub-Advisory Agreement), and its approval of a first amended and restated Sub-Advisory Agreement with Jasper at its August 2021 meeting.
At the meetings, the Board and BAIA discussed the materials that had been provided to the Board, the terms of the Sub-Advisory Agreements, and other relevant considerations. Additionally, the Board (and separately, the Independent Trustees) conferred with the Independent Trustees’ independent legal counsel to consider the information provided. In evaluating each Sub-Advisory Agreement, the Board took into account the fact that the compensation paid to the Sub-Advisers would be paid by BAIA from the investment management fee it receives from the Fund and would not increase the fees or expenses otherwise incurred by the Fund or its shareholders.
Following this discussion, the Board, including a majority of the Independent Trustees, determined to approve each Continued Sub-Advisory Agreement, each New Sub-Advisory Agreement, and each Amended and Restated Sub-Advisory Agreement on the basis of the following factors, among others, for each Sub-Adviser:
Nature, Extent, and Quality of the Services
The Board discussed and considered with respect to each Sub-Adviser:
| (1) | the Sub-Adviser’s personnel, operations, and, where available, financial condition; |
| (2) | the Sub-Adviser’s investment expertise and strengths; |
| (3) | the percentage of Fund assets that are, previously were, and/or potentially would be allocated to the Sub-Adviser; |
| (4) | where applicable, the investment return on other assets that are, or were previously, managed by the Sub-Adviser and related investment risks; |
| (5) | the Sub-Adviser’s experience and performance investing in particular instruments or strategies or managing hedge funds or other products and, where applicable, the extent to which the Sub-Adviser’s strategy for the Fund would overlap with its strategy for hedge funds or other products; |
| (6) | where applicable, the Sub-Adviser’s experience and performance as a Sub-Adviser to the Fund since its inception or otherwise; |
| (7) | the experience and depth of the Sub-Adviser’s portfolio management team in managing hedge funds or other products, as applicable, and its ability to manage risk; and |
296
Table of Contents
Blackstone Alternative Investment Funds and Subsidiaries
Supplemental Information (Continued)
March 31, 2023
| (8) | any other factors deemed relevant to the determination of whether to approve or continue the Sub-Advisory Agreements. |
The Board concluded that the nature, extent, and quality of the sub-advisory services to be provided by each Sub-Adviser were appropriate and thus supported a decision to approve or continue the Sub-Advisory Agreements.
Investment Performance of the Sub-Advisers
The Board considered the investment performance of the existing Sub-Advisers. With respect to each Sub-Adviser that previously has been allocated a portion of the Fund’s assets, the Board considered information about the performance record of the Fund’s assets managed by the Sub-Adviser (net of trading expenses and sub-advisory fees but gross of investment management fees and Fund operating expenses over various periods, including in many cases the year-to-date period, recent calendar month and year periods, and the inception-to-date period), all as compared to the investment returns of (i) a custom index defined by BAIA and (ii) in the case of certain Sub-Advisers, the Sub-Adviser’s hedge fund strategy. In addition, the Board considered information about performance risk measurements of the assets that are managed by the Sub-Adviser, the custom index, and, if applicable, the Sub-Adviser’s hedge fund strategy, such as annualized return, standard deviation (which is a common measure of volatility), Sharpe ratio, and alpha and beta statistics (where available). On the basis of the Board’s assessment, while recognizing that there can be no assurance of any particular investment outcome, the Board concluded that the investment performance generated by the applicable Sub-Advisers was generally satisfactory and that the Sub-Advisers were capable of providing reasonable investment performance to the Fund. The Board noted that, because Fir Tree, North Reef, Seven Grand, Melqart, Fort Baker, Harvest, and Merritt Point had not yet managed assets of the Fund, there was no prior performance with respect to Fund assets to consider.
Costs of Services and Profitability
In analyzing the cost of services and profitability of each Sub-Adviser, the Board considered (i) each Sub-Adviser’s sub-advisory fee or proposed sub-advisory fee for managing the allocated Fund assets, including any fee breakpoints or fulcrum fee arrangements; (ii) each Sub-Adviser’s resources devoted or expected to be devoted to the Fund; and (iii) any information provided in response to inquiries regarding the profitability to each Sub-Adviser from providing sub-advisory services to the Fund. The Board considered the specific resources that each Sub-Adviser devoted or expected to devote to the Fund for investment analysis, risk management, compliance, and order execution, and the extent to which each Sub-Adviser’s investment process is or would be scalable. The Board also took into account the entrepreneurial, business, and other risks each Sub-Adviser has undertaken, or would undertake, in serving as a sub-adviser.
The Board noted that the compensation paid to each Sub-Adviser was paid by BAIA, not the Fund, and, accordingly, that the retention of each Sub-Adviser did not increase the fees or expenses otherwise incurred by shareholders of the Fund. It also noted that the terms of each Sub-Adviser’s Sub-Advisory Agreement were the result of separate arm’s-length negotiations between BAIA and the Sub-Adviser. The Board considered information comparing the sub-advisory fees to the fees that each Sub-Adviser charges for providing investment advisory services to certain other clients. The Board also considered information regarding the impact that retaining the Sub-Advisers as sub-advisers to the Fund has or would have on BAIA’s profitability, as well as information about the blended average of all sub-advisory fee rates that BAIA pays the Sub-Advisers based on allocations of Fund assets among all the Sub-Advisers.
297
Table of Contents
Blackstone Alternative Investment Funds and Subsidiaries
Supplemental Information (Continued)
March 31, 2023
The Board concluded that the level of investment sub-advisory fees was appropriate in light of the services to be provided.
Economies of Scale
The Board considered various financial and economic considerations relating to the arrangement with each Sub-Adviser, including economies of scale and the current and proposed breakpoints in the sub-advisory fees for certain Sub-Advisers. The Board noted challenges in identifying and measuring economies of scale, both generally and given the Fund’s multi-manager structure and the different sub-adviser fee levels and fee structures. The Board noted that it would have the opportunity to periodically re-examine whether the Fund had achieved economies of scale, as well as the appropriateness of sub-advisory fees payable to each Sub-Adviser, with respect to different asset sizes of the portfolio, in the future. The Board also noted that although not directly related to the sub-advisory fees payable to the Sub-Advisers, certain Fund expenses were subject to an expense cap, an undertaking by BAIA intended to limit the Fund’s overall expenses at smaller asset levels, although the Fund’s expenses were sufficiently limited at the time of the meetings such that the expense cap did not currently result in BAIA bearing any of the Fund’s expenses.
Other Benefits
The Board considered other potential benefits that each Sub-Adviser may receive from serving as a sub-adviser to the Fund, including soft dollar arrangements, receipt of brokerage and research services, and the opportunity to offer additional products and services to the Fund’s shareholders or BAIA. The Board noted that each Sub-Adviser benefited from its relationship with BAIA. The Board concluded that other ancillary or “fall out” benefits derived by each Sub-Adviser from its relationship with BAIA or the Fund, to the extent such benefits were identifiable or determinable, were reasonable and fair, resulted from the provision of appropriate services to the Fund and its shareholders, and were consistent with industry practice and the best interests of the Fund and its shareholders.
Other Considerations
The Board reviewed and considered certain terms and conditions of each Sub-Adviser’s Sub-Advisory Agreement. After discussion, the Board concluded that the terms of each Sub-Adviser’s Sub-Advisory Agreement were reasonable and fair. It was noted that the Board would have the opportunity to periodically re-examine the terms of each Sub-Adviser’s Sub-Advisory Agreement in the future.
Conclusion
The Board, including all of the Independent Trustees, concluded that the fees payable under each of the Sub-Advisory Agreements were fair and reasonable with respect to the services that each Sub-Adviser provides or were proposed to provide to the Fund and in light of the other factors described above that the Board deemed relevant. The Board noted that both BAIA and the Board had previously determined, or determined at the meetings, that each Sub-Adviser’s compliance program was reasonably designed to prevent the violation of federal securities laws within the meaning of Rule 38a-1 under the 1940 Act and that each Sub-Adviser’s code of ethics was reasonably designed to prevent “access persons” (as defined in Rule 17j-1 under the 1940 Act) from engaging in any act, practice, or course of business prohibited by Rule 17j-1(b) under the 1940 Act. The Board based its approval or continuation of each Sub-Adviser’s Sub-Advisory Agreement on a comprehensive consideration of all relevant information presented to the Board at its meetings throughout the year, as applicable, and not as a result of any single controlling factor. The Board also gave due consideration to the recommendations of BAIA, which in each case recommended continuation or approval (as applicable) of the proposed sub-advisory arrangements as in the best interests of the Fund and
298
Table of Contents
Blackstone Alternative Investment Funds and Subsidiaries
Supplemental Information (Continued)
March 31, 2023
its shareholders, and BAIA’s belief that the arrangements do not present any conflict of interest from which BAIA or any sub-adviser derives an inappropriate advantage. The Board was assisted by the advice of independent legal counsel in approving each Sub-Adviser’s Sub-Advisory Agreement.
Board Approval of the Investment Management Agreement for Blackstone Multi-Strategy Fund, and each of its Wholly Owned Subsidiaries
At a meeting of the Board held in-person on February 21-23, 2023, the Board, including all of the Independent Trustees, considered and approved (a) the investment management agreement by and between BAIA and the Trust, on behalf of the Blackstone Alternative Multi-Strategy Fund (the “BAMSF Investment Management Agreement”); and (b) the investment management agreements between BAIA and each of Blackstone Alternative Multi-Strategy Sub Fund II Ltd., Blackstone Alternative Multi-Strategy Sub Fund III L.L.C., and Blackstone Alternative Multi-Strategy Sub Fund IV L.L.C. (the “Sub Funds”) (collectively, the “Sub Fund Agreements” and together with the BAMSF Investment Management Agreement, the “BAIA Investment Management Agreements”). Because the Sub Funds are wholly owned subsidiaries of the Fund, and because BAIA provides investment management services to the Fund and its Sub Funds on a collective basis, the Trustees evaluated the arrangements between BAIA and the Fund collectively with BAIA’s arrangements with the Sub Funds.
The Independent Trustees were assisted in their review of the BAIA Investment Management Agreements by their independent legal counsel. The Board requested and evaluated all the information it deemed reasonably necessary under the circumstances in connection with the approval of the BAIA Investment Management Agreements. Before the meeting, the Board received, among other things, (1) materials prepared by the Independent Trustees’ independent legal counsel regarding the relevant factors to consider in connection with the approval of the continuation of the BAIA Investment Management Agreements; (2) a presentation by BAIA relating to, among other things, BAIA’s experience and qualifications to serve as adviser to the Fund and the Sub Funds; (3) analysis of the fees and expenses of the Fund (on a combined basis with the fees and expenses of the Sub Funds) as compared with a peer group of funds; (4) analysis of BAIA’s profitability for providing services to the Fund (on a combined basis with the Sub Funds); (5) information regarding BAIA’s Code of Ethics and compliance program; and (6) materials prepared by an outside firm, unaffiliated with the Fund or BAIA, that is in the business of regularly preparing reports for use by fund boards in considering investment advisory agreement approvals (the “Service Provider”) comparing the management fee rate and total operating expenses of the Fund (on a combined basis with the fees and expenses of the Sub Funds) to those of a peer group of funds determined by the Service Provider.
Prior to the meeting, the Board received BAIA’s responses to an information request under Section 15(c) of the 1940 Act that addressed, among other things: (i) general financial information; (ii) any material business dealings with the Fund’s service providers; (iii) BAIA’s business plan for the Fund for the coming year; (iv) costs, fees, other benefits, and profitability; and (v) risk management and regulatory compliance matters.
At the meeting, there was a discussion regarding the materials that had been provided to the Board, the terms of the BAIA Investment Management Agreements, the services being provided by BAIA, and other relevant considerations. Following this discussion, the Board, including all of the Independent Trustees, determined to renew the BAIA Investment Management Agreements for an additional period of no more than twelve months ending March 31, 2024 on the basis of the following factors, among others:
Nature, Extent, and Quality of the Services
The Board discussed BAIA’s personnel, operations, and financial condition and considered:
| (1) | the background and experience of key investment personnel and BAIA’s ability to attract and retain talent; |
299
Table of Contents
Blackstone Alternative Investment Funds and Subsidiaries
Supplemental Information (Continued)
March 31, 2023
| (2) | BAIA’s focus on analysis of complex asset categories, including alternative investments; |
| (3) | BAIA’s disciplined investment approach and commitment to investment principles; |
| (4) | BAIA’s manager selection and due diligence process; |
| (5) | BAIA’s direct investing capabilities |
| (6) | BAIA’s significant risk management, compliance, portfolio allocation, and operational efforts; |
| (7) | BAIA’s and Blackstone Securities Partners L.P.’s strategic planning for the Fund in the marketplace; and |
| (8) | BAIA’s oversight of and interaction with sub-advisers and other service providers. |
The Board concluded that the nature, extent, and quality of the management services provided were appropriate and thus supported a decision to renew the BAIA Investment Management Agreements. The Board also concluded that BAIA likely would be able to provide during the coming year the same quality of investment management and related services as provided in the past and that these services are appropriate in scope and extent in light of the Fund’s and the Sub Funds’ operations, the competitive landscape, and shareholders’ expectations.
Investment Performance of the Investment Adviser
The Board, including the Independent Trustees, received and considered information about (i) the one year, five year, inception-to-date, and quarter-to-date performance information of the Fund (net of fees and expenses) as of December 31, 2022, each as compared to the MSCI World Total Return Index, Barclay’s Global Aggregate Bond Index, Barclay’s US Aggregate Bond Index, the S&P 500, and HFRX Global Hedge Fund Index (the “Comparative Indices”); (ii) the historical monthly performance of the Fund since inception (net of fees and expenses); (iii) the inception-to-date standard deviation (a measurement of volatility) and Sharpe ratio (a measurement of risk-adjusted return) of the Fund as compared to the Comparative Indices; (iv) information about inception-to-date, trailing three-month, one-year, three-year, and five-year performance and risk measurements of the Fund as compared to a peer group selected by BAIA’s Mandate Oversight Committee (the “Committee”) (which included four funds in the Service Provider-prepared peer group) such as (a) annualized return, (b) standard deviation, (c) Sharpe ratio, (d) beta and alpha against the S&P 500, (e) alpha against a custom benchmark index, and (f) one-year, two-year, three-year, four-year, and five-year performance of the Fund as compared to the Committee-prepared peer group. The Board further considered information about the Fund’s inception-to-date, one-year, and three-year performance, volatility, Sharpe ratio, and beta ratio versus that of several indices.
The Board noted that, as of December 31, 2022 (i) the inception-to-date performance return was less than the corresponding returns of the MSCI World Total Return Index and the S&P 500 but greater than the corresponding returns of the HFRX Global Hedge Fund Index, Barclay’s US Aggregate Bond Index, and the Barclays Global Aggregate Bond Index; (ii) the one-year performance return was less than the corresponding return of the BAIF Comparative Indices; and (iii) the inception-to-date performance return was less than the average return of the other funds in the Committee-prepared peer group for which this information was shown; and (iv) the one-year performance return was greater than all but two of the other funds in the Committee-prepared peer group.
Taking into account such factors, the Board concluded that the investment performance generated by BAIA was generally satisfactory and that BAIA was capable of generating a level of long term investment performance that is appropriate in light of the Fund’s and the Sub Funds’ investment objectives, policies, and strategies, although recognizing that there can be no assurance of any particular investment outcome. The Board also considered BAIA’s strategies to improve performance.
300
Table of Contents
Blackstone Alternative Investment Funds and Subsidiaries
Supplemental Information (Continued)
March 31, 2023
Fees and Expenses
The Board, including the Independent Trustees, compared the fee and expense ratio of the Fund’s Class I, Class Y, Class D, and Class R shares (before and after any fee waivers and expense reimbursements) for the calendar year ended December 31, 2022 against the fee and expense ratios of the Service Provider-prepared peer group. The Board also considered BAIA’s views as to the appropriateness of the Service Provider peer group. Specifically, the Board considered data based on information provided by the Service Provider indicating that, for the Fund’s Class I shares: (i) the contractual (before waivers) management (including both investment management and administration fees) fee rate was higher than all thirteen other funds in the Service Provider peer group; (ii) total net expenses (management fee and expenses after waiver) were higher than all thirteen other funds in the Service Provider peer group; and (iii) total fees were higher than all thirteen other funds in the Service Provider peer group. It was noted that the contractual management fee for the Fund was similar to the fee charged by the peer fund with the next-highest contractual management fee.
The Board also took into consideration the peer group analysis prepared by BAIA, under the guidance of the Committee, which showed fees and expenses of the Fund’s Class I, Class Y, Class D, and Class R shares and a group of six competitor funds selected by BAIA (including four funds from the Service Provider-prepared peer group). The Board noted that: (i) the contractual (before waivers) management fee rate for the Fund’s Class I, Class Y, Class D, and Class R shares was higher than the fee rate of five of the six other funds in the broader Committee-prepared peer group; and (ii) total net expenses (management fee and expenses after waiver) and total fees for the Fund’s Class I, Class Y, and Class D shares were higher than all of the six funds in the broader Committee-prepared peer group.
The Board noted that certain expense information was not available for Class R, as no Class R shares were outstanding as of December 31, 2022. The Board considered the Fund’s fees and expenses in light of the scope, quality, and complexity of services provided by BAIA and determined that, given the scope, quality, and complexity of services provided by BAIA, the fees, while generally higher than those charged by peers, were appropriate. On the basis of the factors considered and information presented, the Board determined that the Fund’s fee rates were reasonable.
Costs of Services and Profitability
In analyzing the cost of services and profitability of BAIA, the Board considered BAIA’s resources devoted to the Fund as well as the revenues earned and expenses incurred by BAIA. The Board also considered profitability data provided by BAIA showing fees, revenues, and overhead expenses of the Fund. The Board took into account the significant investment by, and cost to, BAIA regarding service infrastructure to support the Fund and its investors. The Board also took into account the entrepreneurial, business, and other risks BAIA has undertaken as investment adviser of the Funds for which it is entitled to reasonable compensation. On the basis of the Board’s review of the fees to be charged by BAIA for investment advisory and related services, the relatively unique, and highly specialized, nature of the Fund’s investment program, BAIA’s financial information, BAIA’s entrepreneurial, business, and other risks, and the estimated overhead costs associated with managing the Fund, the Board concluded that the level of investment management fees is appropriate in light of the services provided, the management fees and overall expense ratios of comparable investment companies, and the cap on expenses established by the expense limitation agreement.
Economies of Scale
The Board discussed various financial and economic considerations relating to the arrangement with BAIA, including economies of scale. The Board considered the management fee breakpoint for the Fund, noting that, for collective net assets of the Fund and its Sub Funds up to $2.5 billion, the management fee is
301
Table of Contents
Blackstone Alternative Investment Funds and Subsidiaries
Supplemental Information (Continued)
March 31, 2023
calculated at a rate of 1.95%, and for collective net assets greater than or equal to $2.5 billion, the management fee is calculated at a rate of 1.80%. The Board concluded that the management fees, with the current breakpoint in place, reflected the complexity of the Fund’s and the Sub Funds’ operations and were reasonable in light of the Fund’s and Sub Funds’ current and anticipated size. The Board noted that it will have the opportunity to periodically re-examine whether the Fund and the Sub Funds had achieved economies of scale, as well as the appropriateness of management fees payable to BAIA, in the future. The Board further noted that certain Fund expenses were subject to an expense cap, an undertaking by BAIA intended to limit the Fund’s overall expenses at smaller asset levels.
Other Benefits
The Board discussed other potential benefits that BAIA may receive from the Fund. The Board noted that BAIA indicated that it does not expect to receive significant ancillary, soft dollar, or other “fall out” benefits as a result of its relationship with the Fund. The Board concluded that other benefits derived by BAIA from its relationship with the Fund, to the extent such benefits are identifiable or determinable, are reasonable and fair, result from the provision of appropriate services to the Fund and its shareholders, and are consistent with industry practice and the best interests of the Fund and its shareholders.
Conclusion
The Board, including all of the Independent Trustees, concluded that the fees payable under the BAIA Investment Management Agreements were fair and reasonable with respect to the services that BAIA provides to the Fund it manages and in light of the other factors described above that the Board deemed relevant. The Board, including all of the Independent Trustees, determined to approve the continuation of the BAIA Investment Management Agreements based on a comprehensive consideration of all information presented to the Board at its meetings throughout the year and not as a result of any single controlling factor. The Board was assisted by the advice of the Independent Trustees’ independent legal counsel in this determination.
Liquidity Risk Management Program Discussion
Pursuant to Rule 22e-4 under the 1940 Act, the Fund has adopted a liquidity risk management program (“Program”). The Program’s principal objectives include assessing, managing, and periodically reviewing the Fund’s liquidity risk. Liquidity risk is defined as the risk that the Fund could not meet redemption requests without significant dilution of remaining investors’ interests in the Fund.
The Board has appointed BAIA as the program administrator for the Fund’s Program. BAIA expects to carry out its responsibilities as Program Administrator through its Liquidity Risk Committee (the “Committee”). BAIA uses a third-party service provider to provide preliminary liquidity classifications for the Fund’s investments. At the February 21-22, 2023 meeting, the Committee provided the Board with a report addressing the operation of the program and assessing its adequacy and effectiveness of implementation for the period January 1, 2022 through December 31, 2022. The Committee reported as to the following, among other things:
| • | the Program was adequately designed and adequately and effectively implemented; and |
| • | the Program was effective in assessing, monitoring, and managing the liquidity risk of the Fund’s portfolio during the period. |
There can be no assurance that the Program will achieve its objectives in the future. Please refer to the Fund’s prospectus for more information regarding the Fund’s exposure to liquidity risk and other principal risks to which an investment in the Fund may be subject.
302
Table of Contents
Blackstone Alternative Investment Funds and Subsidiaries
Supplemental Information (Continued)
March 31, 2023
Additional Information
The Fund’s Statement of Additional Information includes additional information about the Trustees. The Statement of Additional Information is available upon request, without charge, by calling toll free 1-855-890-7725.
Copies of this annual shareholder report are available upon request to prior shareholders of the Fund, without charge, by calling toll free 1-855-890-7725.
303
Table of Contents
Blackstone
|
Rev November 2022
FACTS | WHAT DO BLACKSTONE REGISTERED FUNDS DO WITH YOUR PERSONAL INFORMATION? | |
Why? | Financial companies choose how they share your personal information. Federal law gives consumers the right to limit some but not all sharing. Federal law also requires us to tell you how we collect, share, and protect your personal information. Please read this notice carefully to understand what we do. |
What? | The types of personal information we collect and share depend on the product or service you have with us. This information can include:
∎ Social Security number and income
∎ Assets and investment experience
∎ Risk tolerance and transaction history |
How? | All financial companies need to share customers’ personal information to run their everyday business. In the section below, we list the reasons financial companies can share their customers’ personal information; the reasons Blackstone Registered Funds (as defined below) choose to share; and whether you can limit this sharing. |
| Reasons we can share your personal information | Do Blackstone Registered Funds share? | Can you limit this sharing? | ||
For our everyday business purposes— such as to process your transactions, maintain your account(s), respond to court orders and legal investigations, or report to credit bureaus | Yes | No | ||
For our marketing purposes— to offer our products and services to you | Yes | No | ||
| For joint marketing with other financial companies | No | We don’t share | ||
For our affiliates’ everyday business purposes— information about your transactions and experiences | No | We don’t share | ||
For our affiliates’ everyday business purposes— information about your creditworthiness | No | We don’t share | ||
| For our affiliates to market to you | No | We don’t share | ||
| For nonaffiliates to market to you | No | We don’t share | ||
| Questions? | Email us at GLB.privacy@blackstone.com | |
304
Table of Contents
| Who We Are | ||
| Who is providing this notice? | Blackstone Registered Funds include Blackstone Alternative Investment Funds, on behalf of its series Blackstone Alternative Multi-Strategy Fund, Blackstone Diversified Multi-Strategy Fund, a sub-fund of Blackstone Alternative Investment Funds plc, Blackstone Floating Rate Enhanced Income Fund, Blackstone Long-Short Credit Income Fund, Blackstone Private Credit Fund, Blackstone Secured Lending Fund, Blackstone Senior Floating Rate Term Fund, Blackstone Strategic Credit Fund, and SPDR Blackstone High Income ETF, SPDR Blackstone Senior Loan ETF. | |
| What We Do | ||
| How do Blackstone Registered Funds protect my personal information? | To protect your personal information from unauthorized access and use, we use security measures that comply with federal law. These measures include computer safeguards and secured files and buildings. | |
| How do Blackstone Registered Funds collect my personal information? | We collect your personal information, for example, when you:
∎ open an account or give us your income information
∎ provide employment information or give us your contact information
∎ tell us about your investment or retirement portfolio
We also collect your personal information from others, such as credit bureaus, affiliates, or other companies. | |
| Why can’t I limit all sharing? | Federal law gives you the right to limit only:
∎ sharing for affiliates’ everyday business purposes—information about your creditworthiness
∎ affiliates from using your information to market to you sharing for nonaffiliates to market to you
State laws and individual companies may give you additional rights to limit sharing. See below for more on your rights under state law. | |
| What happens when I limit sharing for an account I hold jointly with someone else? | Your choices will apply to everyone on your account—unless you tell us otherwise. | |
| Definitions | ||
| Affiliates | Companies related by common ownership or control. They can be financial and nonfinancial companies.
∎ Our affiliates include companies with a Blackstone name and financial companies such as Blackstone Credit and Strategic Partners Fund Solutions. | |
| Nonaffiliates | Companies not related by common ownership or control. They can be financial and nonfinancial companies.
∎ Blackstone Registered Funds do not share with nonaffiliates so they can market to you. | |
| Joint marketing | A formal agreement between nonaffiliated financial companies that together market financial products or services to you.
∎ Our joint marketing partners include financial services companies. | |
305
Table of Contents
| Other Important Information | ||
California Residents—In accordance with California law, we will not share information we collect about California residents with nonaffiliates except as permitted by law, such as with the consent of the customer or to service the customer’s accounts. We will also limit the sharing of information about you with our affiliates to the extent required by applicable California law. Vermont Residents—In accordance with Vermont law, we will not share information we collect about Vermont residents with nonaffiliates except as permitted by law, such as with the consent of the customer or to service the customer’s accounts. We will not share creditworthiness information about Vermont residents among Blackstone Registered Funds’ affiliates except with the authorization or consent of the Vermont resident. | ||
| Contact Us | ||
If you have any questions or comments about this Privacy Notice, or if you would like us to update information we have about you or your preferences, please email us at PrivacyQueries@Blackstone.com or access our web form www.blackstone.com/privacy.
You also may write to:
Blackstone Inc. Attn: Legal & Compliance 345 Park Avenue New York, NY 10154 | ||
306
Table of Contents
Blackstone
|
Last Updated: July 23, 2021
Investor Data Privacy Notice
Why are you seeing this notice?
| • | You may need to provide Personal Data to us as part of your investment into a fund or other investment vehicle (as applicable, the Fund) managed or advised by investment advisers or management companies that are subsidiaries of The Blackstone Group Inc. or its affiliates (and, where applicable, the general partner of the relevant Fund) (collectively, Blackstone). |
| • | We want you to understand how and why we use, store and otherwise process your Personal Data when you deal with us or our relevant affiliates (including under applicable data protection laws). If this notice (the Data Privacy Notice) has been made available to you, you may have certain rights with respect to your Personal Data under applicable data protection laws (including as described in this Data Privacy Notice). |
| • | “Personal Data” has the meaning given to it under data protection laws that apply to our processing of your personal information, and includes any information that relates to, describes, identifies or can be used, directly or indirectly, to identify an individual (such as name, address, date of birth, personal identification numbers, sensitive personal information, and economic information). |
| • | We ask that investors promptly provide the information contained in this Data Privacy Notice to any individuals whose Personal Data they provide to the Fund or its affiliates in connection with ‘know your client’/anti-money laundering requests or otherwise. |
Please read the information below carefully. It explains how and why Personal Data is processed by us.
Who is providing this notice?
Blackstone is committed to protecting and respecting your privacy. Blackstone is a global financial services firm with offices, branches, operations and entities globally, including as described at this link: https://www.blackstone.com/privacy#appendixA
| • | For transparency, the Blackstone entities on whose behalf this privacy statement is made are: (i) the Fund; and (ii) where applicable, the Blackstone general partner, manager and/or investment adviser of the relevant Fund, in each case, with which you contract, transact or otherwise share Personal Data (together, the Fund Parties). |
| • | Where we use the terms “we”, “us” and “our” in this Data Privacy Notice, we are referring to the Fund and the Fund Parties. |
| • | Please consult your subscription documents, private placement memorandum or other offering documentation provided to you by or on behalf of the Fund Parties which will further specify the entities and contact details of the Fund Parties relevant to our relationship with you. |
| • | We welcome investors and their representatives to contact us if they have any queries with respect to the Fund Parties (in particular, which Fund Parties are relevant to their relationship with Blackstone). If you have any queries, please see the ‘Contact Us’ section. |
When you provide us with your Personal Data, each Fund Party that decides how and why Personal Data is processed acts as a “data controller”. In simple terms, this means that the Fund Party makes certain decisions on how to use and protect your Personal Data – but only to the extent that we have informed you about the use or are otherwise permitted by law.
Where your Personal Data is processed by an entity controlled by, or under common control with, the Blackstone entity/ies managing a Fund for its own purposes, this entity will also be a data controller.
307
Table of Contents
What Personal Data do we collect about you?
The types of Personal Data that we collect and share depends on the product or service you have with us and the nature of your investment.
The Personal Data collected about you will help us to provide you with a better service and facilitate our business relationship.
We may combine Personal Data that you provide to us with Personal Data that we collect from you, or about you from other sources, in some circumstances. This will include Personal Data collected in an online or offline context.
As a result of our relationship with you as an investor, in the past 12 months we may have collected Personal Data concerning you in the following categories:
| • | Identifiers (e.g., real name, alias, postal address, email address, social security or driver’s licence number, government ID, signature, telephone number, education, employment, employment history, financial information, including tax-related information/codes and bank account details, information used for monitoring and background checks to comply with laws and regulations, including ‘know your client’, anti-money laundering, and sanctions checks, online registration details, and other contact information); |
| • | Sensitive/protected characteristic information (e.g., age/date of birth, nationality, citizenship, country of residence, gender, and other information used to comply with laws and regulations); |
| • | Commercial information (e.g., assets, income, transaction and investment history, accounts at other institutions, financial positions/returns, information concerning source of funds and any applicable restrictions on your investment such as political exposure or sanctions); |
| • | Internet or other network activity (e.g., browsing or search history, information regarding interaction with an internet website, application, or advertisement, online identifiers such as cookies); |
| • | Sensory and surveillance data (e.g., recordings of telephone calls where permitted or required by law, video (surveillance) recordings, closed-circuit television (CCTV) images and recordings, and other records of your interactions with us or our service providers, including electronic communications); |
| • | Professional or employment-related information (e.g., current or past job history); and |
| • | Inferences drawn from other personal information (e.g., profiles reflecting preferences and trends, based on information such as assets, investment experience, risk tolerance, investment activity, and transaction history). |
Where do we obtain your Personal Data?
We collect, and have collected, Personal Data about you from a number of sources, including from you directly:
| What | How | |
| Personal Data that you give us | • From the forms and any associated documentation that you complete when subscribing for an investment, shares, interests, and/or opening an account with us. This can include information about your name, address, date of birth, passport details or other national identifier, driving license, your national insurance or social security number and income, employment information and details about your investment or retirement portfolio(s), and financial-related data (such as returns and financial positions) • When you provide it to us in correspondence and conversations, including electronic communications such as email and telephone calls • When you make transactions with respect to the Fund • When you interact with our online platforms and websites (such as bxaccess.com) • When you purchase securities from us and/or tell us where to send money • From cookies, web beacons, and similar interactions when you or your devices access our sites • When we need to identify you and/or complete necessary security checks, where you visit one of our buildings or attend meetings. This can include form of ID, and your image for CCTV purposes. |
308
Table of Contents
| What | How | |
| Personal Data that we obtain from others | We obtain Personal Data from: • Publicly available and accessible directories and sources • Bankruptcy registers • Tax authorities, including those that are based outside the territory in which you are located or domiciled, including the Cayman Islands, the United Kingdom (UK) and the European Economic Area (EEA), if you are subject to tax in another jurisdiction • Governmental and competent regulatory authorities to whom we have regulatory obligations • Credit agencies • Fraud prevention and detection agencies / organizations • Transaction counterparties |
Why do we process your Personal Data?
We may process or disclose your Personal Data for the following reasons:
| Why | How | |
| Contract | It is necessary to perform our contract with you to: • Administer, manage and set up your investor account(s) to allow you to purchase your holding (of shares or interests) in our Funds • Meet the resulting contractual obligations we have to you • Facilitate the continuation or termination of the contractual relationship between you and the Fund • Facilitate the transfer of funds, and administering and facilitating any other transaction, between you and the Fund | |
| Compliance with law | It is necessary for compliance with an applicable legal or regulatory obligation to which we are subject, in order to: • Undertake our client and investor due diligence, and on-boarding checks • Carry out verification, ‘know your client’, terrorist financing, sanctions, and anti-money laundering checks • Verify the identity and addresses of our investors (and, if applicable, their beneficial owners) • Comply with requests from regulatory, governmental, tax and law enforcement authorities • Carry out surveillance and investigations • Carry out audit checks • Maintain statutory registers • Prevent and detect fraud • Comply with sanctions requirements | |
| Legitimate Interests | For our legitimate interests or those of a third party (such as a transaction counterparty or lender) to: • Manage and administer your holding in any Funds in which you are invested, and any related accounts on an ongoing basis • Assess and process any applications or requests made by you • Open, maintain or close accounts in connection with your investment in, or withdrawal from, the Fund scheme • Send updates, information and notices or otherwise correspond with you in connection with your investment in the Fund scheme • Address or investigate any complaints, claims, proceedings or disputes • Provide you with, and inform you about, our investment products and services • Monitor and improve our relationships with investors • Comply with applicable prudential and regulatory obligations, including anti-money laundering, sanctions and ‘know your client’ checks |
309
Table of Contents
| Why | How | |
• Assist our transaction counterparties to comply with their regulatory and legal obligations (including anti-money laundering, ‘know your client’, terrorist financing, and sanctions checks) • Manage our risk and operations • Comply with our accounting and tax-reporting requirements • Comply with our audit requirements • Assist with internal compliance with our policies and processes • Ensure appropriate group management and governance • Keep our internal records • Prepare reports on incidents/accidents • Protect our business against fraud, breach of confidence, theft of proprietary materials, and other financial or business crimes (to the extent that this is not required of us by law) • Analyze and manage commercial risks • Seek professional advice, including legal advice • Enable any actual or proposed assignee or transferee, participant or sub-participant of the partnership’s or Fund vehicles’ rights or obligations to evaluate proposed transactions • Facilitate business asset transactions involving the Fund partnership or Fund-related vehicles • Monitor communications to/from us using our systems • Protect the security and integrity of our information technology systems • Protect the security and safety of our buildings and locations where we operate • Operate, run and schedule online meetings, webinars and conferences (for example, using Zoom and other online meeting platforms) • Manage our financing arrangements with our financiers and financing transaction counterparties, including payment providers, intermediaries, and correspondent/agent banks • Monitor the operation of Fund distribution platforms, where these are operated by third parties or service providers We only rely on these interests where we have considered that, on balance, the legitimate interests are not overridden by your interests, fundamental rights or freedoms. |
Monitoring as described in ‘Legitimate Interests’ above
We monitor communications where the law requires us to do so. We will also monitor where we are required to do so to comply with regulatory rules and practices and, where we are permitted to do so, to protect our business and the security of our systems.
310
Table of Contents
Who we share your Personal Data With
Your Personal Data will be shared with:
| Who | Why | |
| Fund Associates | We share your Personal Data with our associates, related parties and members of our group. This is: • To manage our relationship with you • For the legitimate interests of a third party in carrying out anti-money laundering, ‘know your client’, and other compliance checks required of them under applicable laws and regulations • For the purposes set out in this Data Privacy Notice | |
| Fund Managers, Depositories, Administrators, Custodians, Distributors, Investment Advisers | • Delivering the services you require • Managing your investment • Supporting and administering investment-related activities • Complying with applicable investment, anti-money laundering and other laws and regulations | |
| Tax Authorities | • To comply with applicable laws and regulations • Where required or requested by tax authorities in the territory in which you are located or domiciled (in particular, Cayman Island or UK/EEA tax authorities) who, in turn, may share your Personal Data with foreign tax authorities • Where required or requested by foreign tax authorities, including outside of the territory in which you are located or domiciled (including outside the Cayman Islands or UK/EEA) | |
| Service Providers | • Delivering and facilitating the services needed to support our business relationship with you (including cloud services) • Supporting and administering investment-related activities • Where disclosure to the service provider is considered necessary to support Blackstone with the purposes described in section 5 of this Data Privacy Notice | |
| Financing Counterparties, Lenders, Correspondent and Agent Banks | • Assisting these transaction counterparties with regulatory checks, such as ‘know your client’, and anti-money laundering procedures • Sourcing credit for Fund-related entities in the course of our transactions and fund life cycles | |
| Our Lawyers, Auditors and other Professional Advisers | • Providing you with investment-related services • To comply with applicable legal and regulatory requirements • Supporting Blackstone with the purposes described in section 5 of this Data Privacy Notice |
In exceptional circumstances, we will share your Personal Data with:
| • | Competent regulatory, prosecuting and other governmental agencies or litigation counterparties, in any country or territory; and |
| • | Other organizations and agencies – where we are required to do so by law. |
For California residents, in the preceding 12 months, we may have disclosed Personal Data listed in any of the categories in “What Personal Data do we collect about you?” above for a business purpose (in particular, as described in this section).
We have not sold Personal Data in the 12 months preceding the date of this Data Privacy Notice.
311
Table of Contents
Do you have to provide us with this Personal Data?
Where we collect Personal Data from you, we will indicate if:
| • | Provision of the Personal Data is necessary for our compliance with a legal obligation; or |
| • | It is purely voluntary and there are no implications for you if you do not wish to provide us with it. |
Unless otherwise indicated, you should assume that we require the Personal Data for business and/or compliance purposes.
Some of the Personal Data that we request is necessary for us to perform our contract with you and if you do not wish to provide us with this Personal Data, it will affect our ability to provide our services to you and manage your investment.
Sending your Personal Data Internationally
We may transfer your Personal Data between different countries to recipients in countries other than the country in which the information was originally collected (including to our affiliates and group members, members of the Fund’s partnership, transaction counterparties, and third-party service providers). Where you are based in the UK, the EU, or another country which imposes data transfer restrictions outside of its territory, this includes transfers outside of the UK and the European Economic Area (“EEA”) or that geographical area, to those countries in which our affiliates, group members, service providers and business partners operate. Those countries may not have the same data protection laws as the country in which you initially provided the information.
Where we transfer Personal Data outside of the UK, the EEA, or other territories subject to data transfer restrictions to other members of our group, our service providers or another third party recipient, we will ensure that our arrangements with them are governed by data transfer agreements or appropriate safeguards, designed to ensure that your Personal Data is protected as required under applicable data protection law (including, where appropriate, under an agreement on terms approved for this purpose by the European Commission or by obtaining your consent).
Please contact us if you would like to know more about these agreements or receive a copy of them. Please see the ‘Contact Us’ section for details.
Consent – and Your Right to Withdraw It
Except as may otherwise be required by local law, we do not generally rely on obtaining your consent to process your Personal Data. In particular, we do not generally rely on obtaining your consent where our processing of your Personal Data is subject only to the data protection laws of the UK/EEA (in these circumstances we will usually rely on another legal basis more appropriate in the circumstances, including those set out in “Why do we process your Personal Data?” above). If we do rely on consent for processing of your Personal Data, you have the right to withdraw this consent at any time. Please contact us or send us an email at PrivacyQueries@Blackstone.com at any time if you wish to do so.
Where required by applicable law, we will obtain your consent for the processing of your Personal Data for direct marketing purposes. If you do receive direct marketing communications from us (for example, by post, email, fax or telephone), you may opt-out by clicking the link in the relevant communication, completing the forms provided to you (where relevant), or by contacting us (see the ‘Contact Us’ section for details).
Retention and Deletion of your Personal Data
We keep your Personal Data for as long as it is required by us for our legitimate business purposes, to perform our contractual obligations or, where longer, such longer period as is required or permitted by law or regulatory obligations which apply to us. We will generally:
| • | Retain Personal Data about you throughout the life cycle of any investment you are involved in; and |
| • | Retain some Personal Data after your relationship with us ends. |
As a general principle, we do not retain your Personal Data for longer than we need it.
We will usually delete your Personal Data (at the latest) after you cease to be an investor in any fund and there is no longer any legal / regulatory requirement, or business purpose, for retaining your Personal Data.
312
Table of Contents
Your Rights
You may, subject to certain limitations, have data protection rights depending on the data protection laws that apply to our processing of your Personal Data, including the right to:
| • | Access your Personal Data, and some related information, including the purpose for processing the Personal Data, the categories of recipients of that Personal Data to the extent that it has been transferred internationally, and, where the Personal Data has not been collected directly from you, the source (the category information) |
| • | Restrict the use of your Personal Data in certain circumstances |
| • | Have incomplete or inaccurate Personal Data corrected |
| • | Ask us to stop processing your Personal Data |
| • | Require us to delete your Personal Data in some limited circumstances |
You also have the right in some circumstances to request us to “port” your Personal Data in a portable, re-usable format to other organizations (where this is possible).
California residents may also request certain information about our disclosure of Personal Data during the prior year, including category information (as defined above).
We review and verify requests to protect your Personal Data, and will action data protection requests fairly and in accordance with applicable data protection laws and principles. If you wish to exercise any of these rights, please see the ‘Contact Us’ section for details.
Concerns or Queries
We take your concerns very seriously. We encourage you to bring to our attention any concerns you have about our processing of your Personal Data. This Data Privacy Notice was drafted with simplicity and clarity in mind. We are, of course, happy to provide any further information or explanation needed. Please see the ‘Contact Us’ section for details.
Please also contact us via any of the contact methods listed below if you have a disability and require an alternative format of this Data Privacy Notice.
If you want to make a complaint, you can also contact the body regulating data protection in your country, where you live or work, or the location where the data protection issue arose. In particular:
| Country | Supervisory Authority | |
| Cayman Islands | Cayman Islands Ombudsman (available at: https://ombudsman.ky) | |
| European Union | A list of the EU data protection authorities and contact details is available by clicking this link: http://ec.europa.eu/newsroom/article29/item-detail.cfm?item_id=612080 | |
| United Kingdom | Information Commissioner’s Office (available at: https://ico.org.uk/global/contact-us/) |
Contact Us
Please contact us if you have any questions about this Data Privacy Notice or the Personal Data we hold about you.
Contact us by email or access our web form by emailing PrivacyQueries@Blackstone.com.
Contact us in writing using this address:
| Address | For EU/UK related queries: 40 Berkeley Square, London, W1J 5AL, United Kingdom
All other queries: 345 Park Avenue, New York, NY 10154 |
313
Table of Contents
A list of country-specific addresses and contacts for locations where we operate is available at https://www.blackstone.com/privacy#appendixA.
Changes to this Data Privacy Notice
We keep this Data Privacy Notice under regular review. Please check regularly for any updates at our investor portal (www.bxaccess.com).
314
Table of Contents
Blackstone Alternative Multi-Strategy Fund
a series of Blackstone Alternative Investment Funds
Trustees
John M. Brown
Frank J. Coates, Chair
Paul J. Lawler
Kristen M. Leopold
Peter Koffler
Peter M. Gilbert
Investment Adviser
Blackstone Alternative Investment Advisors LLC
345 Park Avenue
New York, New York 10154
Administrator
State Street Bank and Trust Company
One Congress Street, Suite 1
Boston, MA 02114
Custodians
State Street Bank and Trust Company
One Congress Street, Suite 1
Boston, MA 02114
U.S. Bank N.A.
U.S. Bank Tower
425 Walnut Street
Cincinnati, OH 45202
Transfer Agent
State Street Bank and Trust Company
One Congress Street, Suite 1
Boston, MA 02114
Officers
Brian F. Gavin, President and Principal Executive Officer
Sarah Kassman, Secretary
Kevin Michel, Chief Legal Officer
Thomas Procida, Treasurer and Principal Financial and Accounting Officer
William Renahan, Chief Compliance Officer
Sherilene Sibadan, Anti-Money Laundering Officer
Independent Registered Public Accounting Firm
Deloitte & Touche LLP
30 Rockefeller Plaza
New York, New York 10112
Legal Counsel
Ropes & Gray LLP
Prudential Tower
800 Boylston Street
Boston, Massachusetts 02199-3600
This report, including the financial information herein, is transmitted to the shareholders of Blackstone Alternative Multi-Strategy Fund for their information. It is not a prospectus or representation intended for use in the purchase of shares of the Fund or any securities mentioned in this report.
You can find the Fund’s prospectus and other information about the Fund, including the Fund’s statement of additional information, on the Fund’s website at www.bxmix.com. You can also get this information at no cost by calling the Fund at 1-855-890-7725.
Table of Contents
Item 2. Code of Ethics.
| (a) | The Registrant, as of the end of the period covered by the report, has adopted a code of ethics that applies to the Registrant’s principal executive officer, principal financial officer, principal accounting officer or controller, or persons performing similar functions. |
| (b) | No disclosures are required by this Item 2(b). |
| (c) | The Registrant has not made any amendments to its code of ethics during the reporting period for this Form N-CSR. |
| (d) | There have been no waivers granted by the Registrant to individuals covered by the Registrant’s code of ethics during the reporting period for this Form N-CSR. |
| (e) | Not applicable. |
| (f) | A copy of the Registrant’s code of ethics is attached as Exhibit 13(a)(1) to this Form N-CSR. |
Item 3. Audit Committee Financial Expert.
| (a) (1) | The Registrant’s Board of Trustees has determined that the Registrant has at least one audit committee financial expert serving on its Audit Committee (the “Committee”). |
| (2) | The audit committee financial expert is Kristen M. Leopold, who is “independent” for purposes of this Item 3 of Form N-CSR. |
| (3) | Not applicable. |
Item 4. Principal Accountant Fees and Services.
| Current Fiscal Year(1) | Previous Fiscal Year | |||||||
(a) Audit Fees | $ | 265,000 | $ | 250,000 | ||||
(b) Audit-Related Fees | $ | 0 | $ | 0 | ||||
(c) Tax Fees(2) | $ | 41,340 | $ | 39,000 | ||||
(d) All Other Fees | $ | 0 | $ | 0 | ||||
| (1) | No fees were required to be approved pursuant to paragraph (c)(7)(ii) of Rule 2-01 of Regulation S-X during the current fiscal year. |
| (2) | The nature of the services includes tax compliance, tax advice and tax planning. |
| (e) (1) | Disclose the Committee’s pre-approval policies and procedures described in paragraph (c)(7) of Rule 2-01 of Regulation S-X. |
The charter for the Committee requires that the Committee pre-approve (i) all audit and non-audit services that the Registrant’s independent auditors provide to the Registrant, and (ii) all non-audit services that the Registrant’s independent auditors provide to Blackstone Alternative Investment Advisors LLC (“BAIA”), the investment adviser of the Registrant, and any entity controlling, controlled by, or under common control with BAIA that provides ongoing services to the Registrant, if the engagement relates directly to the operations and financial reporting of the Registrant; provided that the Committee may implement policies and procedures by which such services are approved other than by the full Committee prior to their ratification by the Committee.
Table of Contents
| (2) | Disclose the percentage of services described in each of paragraphs (b) through (d) of this item that were approved by the Committee pursuant to paragraph (c)(7)(i)(C) of Rule 2-01 of Regulation S-X. |
| Current Fiscal Year | Previous Fiscal Year | |||||||
(b) | 0 | % | 0 | % | ||||
(c) | 0 | % | 0 | % | ||||
(d) | 0 | % | 0 | % | ||||
| (f) | Not applicable. |
| (g) | Disclose the aggregate non-audit fees billed by the Registrant’s accountant for services rendered to the Registrant, and rendered to the Registrant’s investment adviser, and any entity controlling, controlled by, or under common control with the adviser that provides ongoing services to the Registrant for each of the last two fiscal years of the Registrant. |
Current Fiscal Year | Previous Fiscal Year | |||
| $0 | $ | 0 | ||
| (h) | Not applicable. |
| (i) | Not applicable. |
| (j) | Not applicable. |
Item 5. Audit Committee of Listed Registrants.
Not applicable.
Item 6. Investments.
| (a) | The Registrant’s Consolidated Schedule of Investments as of the close of the reporting period is included in the Report to Shareholders filed under Item 1 of this form. |
| (b) | Not applicable. |
Item 7. Disclosure of Proxy Voting Policies and Procedures for Closed-End Management Investment Companies.
Not applicable.
Item 8. Portfolio Managers of Closed-End Management Investment Companies.
Not applicable.
Item 9. Purchases of Equity Securities by Closed-End Management Investment Company and Affiliated Purchasers.
Not applicable.
Item 10. Submission of Matters to a Vote of Security Holders.
There have been no material changes to the procedures by which the shareholders may recommend nominees to the Registrant’s Board of Trustees.
Item 11. Controls and Procedures.
| (a) | The Registrant’s principal executive officer and principal financial officers, or persons performing similar functions, have concluded that the Registrant’s disclosure controls and procedures (as defined in Rule 30a-3(c) under the 1940 Act) are effective as of a date within 90 days of the filing date of this report based on the evaluation of these controls and procedures required by Rule 30a-3(b) under the 1940 Act and Rules 13a-15(b) or 15d-15(b) under the Securities Exchange Act of 1934, as amended. |
Table of Contents
| (b) | There were no changes in the Registrant’s internal control over financial reporting (as defined in Rule 30a-3(d) under the 1940 Act) that occurred during the period covered by this report that have materially affected, or are reasonably likely to materially affect, the Registrant’s internal control over financial reporting. |
Item 12. Disclosure of Securities Lending Activities for Closed-End Management Investment Companies.
| (a) | Not applicable. |
| (b) | Not applicable. |
Item 13. Exhibits.
Table of Contents
SIGNATURES
Pursuant to the requirements of the Securities Exchange Act of 1934 and the Investment Company Act of 1940, the Registrant has duly caused this report to be signed on its behalf by the undersigned, thereunto duly authorized.
| (Registrant) | Blackstone Alternative Investment Funds |
| By (Signature and Title) | /s/ Brian F. Gavin | |
| Brian F. Gavin, President (Principal Executive Officer) | ||
| Date May 30, 2023 |
Pursuant to the requirements of the Securities Exchange Act of 1934 and the Investment Company Act of 1940, this report has been signed below by the following persons on behalf of the Registrant and in the capacities and on the dates indicated.
| By (Signature and Title) | /s/ Brian F. Gavin | |
| Brian F. Gavin, President (Principal Executive Officer) | ||
| Date May 30, 2023 |
| By (Signature and Title) | /s/ Thomas Procida | |
| Thomas Procida, Treasurer (Principal Financial and Accounting Officer) | ||
| Date May 30, 2023 |