UNITED STATES
SECURITIES AND EXCHANGE COMMISSION
Washington, D.C. 20549
FORM N-CSR
CERTIFIED SHAREHOLDER REPORT OF REGISTERED
MANAGEMENT INVESTMENT COMPANIES
Investment Company Act file number: 811-22747
ALPS SERIES TRUST
(Exact name of Registrant as specified in charter)
1290 Broadway, Suite 1100, Denver, Colorado 80203
(Address of principal executive offices) (Zip code)
303.623.5277
(Registrant’s telephone number, including area code)
JoEllen L. Legg, Esq., Secretary
ALPS Series Trust
1290 Broadway, Suite 1100
Denver, CO 80203
(Name and address of agent for service)
Copy to:
Alisha Hunt, Esq.
Dechert LLP
One Maritime Plaza, Suite 2300
San Francisco, CA 94111-3513
Date of fiscal year end: September 30
Date of reporting period: October 1, 2012 – September 30, 2013
| Item 1. | Reports to Stockholders. |
The following are copies of the reports transmitted to shareholders of the Cognios Market Neutral Large Cap Fund and the GKE Asian Opportunities Fund.
| Table of Contents |
| 1 | ||||
| 4 | ||||
| 7 | ||||
| 8 | ||||
| 14 | ||||
| 15 | ||||
| 16 | ||||
| 17 | ||||
| 18 | ||||
| 20 | ||||
| 29 | ||||
| 30 | ||||
| 31 | ||||
1-855-254-6467 | | www.cogniosfunds.com |
| Cognios Market Neutral Large Cap Fund | ||
| September 30, 2013 (Unaudited) |
Dear Shareholder,
This is the first annual shareholder letter for the Cognios Market Neutral Large Cap Fund (the “Fund”) representing the Fund’s first nine months of operation. Thank you for investing in the Fund. We value this opportunity to offer insight into the Fund’s investment adviser Cognios Capital, LLC.
At Cognios, we believe that all investors should have access to the investment strategies necessary to diversify their portfolios. However, market neutral equity investment strategies have historically been more common in the hedge fund industry. Launching the Cognios Market Neutral Large Cap Fund allowed us to offer our hedged strategy as an alternative investment to investors that either (a) traditionally have not been able to invest in hedge funds or (b) were hedge fund investors in the past, but who now prefer the daily liquidity1, enhanced transparency2, and lack of incentive fees provided in a mutual fund format.
Consistent with our core values, Cognios’ goal is to make sure that every shareholder has a thorough understanding of our investment strategies. Information is power, and we believe educated investors are better clients. Below we describe in general terms the investment strategy of the Fund.
The Fund employs a Beta-adjusted long/short market neutral equity investment strategy. With this type of strategy, the investment adviser buys (takes long positions in) stocks of companies that it believes are likely to outperform securities that the adviser “sells short”. In a short sale, the adviser borrows shares of a stock and then sells them with the obligation to repurchase them at some future date. The long positions generally make money for the fund when those stocks go up in price (and pay dividends) and the short positions generally make money for the fund when their prices go down (as long as they go down more than the dividends paid by those stocks that were sold short.) A fund is “Beta market neutral” when there is as much stock sold short as there are long positions after adjusting for each of the positions’ sensitivities to moves in the broad stock market, so the overall profits for the fund are “neutralized” to the overall movement of the stock market. Beta is a measure of the sensitivity of a stock’s price changes to broad stock market movements over time.
By attempting to hedge out all of the market Beta, the Fund’s returns over time should be essentially “pure Alpha” (i.e., Alpha is the excess return of a portfolio after considering its Beta exposure.)
When these long and short portfolios are combined to hedge out the market Beta, the market neutral pure Alpha portfolio can make or lose money whether the entire stock market is up or down. In general, as the broad stock market increases, the Fund is likely to make money on its long positions but lose money on its short positions. Conversely, in general, as the broad stock market declines, the Fund is likely to lose money on its long positions but make money on its short positions. So while the general direction of the stock market shouldn’t make much of a difference to the Fund’s returns, what does matter is how the long positions perform relative to the short positions. The Fund generally makes money when the long positions outperform the short positions, even if all of the long and short positions are up or even if all of the long and short positions are down.
| Annual Report | September 30, 2013 | 1 |
Cognios Market Neutral Large Cap Fund | ||
Shareholder Letter | September 30, 2013 (Unaudited) |
By hedging out the general market movements in this Beta-adjusted market neutral fashion, we believe that the total returns of the Fund will be independent of those broad “systemic” risk factors and macro events that move the entire stock market either positively or negatively over time. Some of those systemic risks that effect the overall stock market but should not affect the returns of the Fund include: the level of interest rates, the economic cycle, natural disasters, acts of terrorism, monetary and fiscal policy, political elections, technical “flash crashes”, etc.
Because these risk factors are not likely to impact the Fund but are likely to impact many of the investments in the rest of an investor’s public equity portfolio (i.e., the Fund’s returns are likely to be uncorrelated with the overall stock market over time), the Fund potentially can serve to diversify an investment portfolio.
One potential risk in particular is worth highlighting in this market environment. Many investors are concerned that rising interest rates might lead to low or even negative returns in the future for their fixed income allocation. Rising interest rates could have negative potential implications for the stock market as well. When interest rates rise, market participants increase their required hurdle rate of return, resulting in a decline in the intrinsic values of stocks. Since we do not expect the Fund’s returns to be dependent upon general movements in interest rates over time, certain investors may want to consider a market neutral equity investment strategy, like the one employed by this Fund, to replace at least a portion of their longer term fixed income or equity investment allocations. Of course, each individual investor’s circumstances vary, but investors might want to discuss these possibilities with their qualified investment adviser.
Cognios selects stocks for the long and short portfolios using our firm’s proprietary investment process called ROTA/ROME®. The ROTA/ROME® investment process is a fundamental quantitative stock selection approach that focuses on a company’s Return on Tangible Assets (“ROTA”) and Return on Market value of Equity (“ROME,” which is essentially a company’s profit yield on its stock price). More information about the potential benefits of taking both long and short positions is available on the FAQ page of the Fund’s website, www.cogniosfunds.com.
Regarding performance of the Fund, NAV per share declined by 0.50% for the Institutional Class Shares (COGIX) and declined by 0.70% for the Investor Class Shares (COGMX) during the first calendar year of the Fund, which represents nine months of operations (the Fund was launched on December 31, 2012.) The Fund held fifty-five separate long positions and one hundred forty-one separate short positions at different times throughout the period. Thirty-five of the fifty-five long positions were profitable and twenty-five of the one hundred forty-one short positions were profitable for the period. The long positions generated 19.0% gains on average equity capital while the short positions generated losses of 17.8% on average equity capital. This resulted in a net investment return of 1.2% on average equity capital for the period, but the Fund’s NAV declined during the year because fund operating expenses exceeded those investment gains.
We at Cognios look forward to future opportunities to connect with our shareholders. We strive to continuously add value to your investment experience by providing access to fund information, portfolio updates and straightforward commentary.
If you have any questions regarding the Cognios Market Neutral Large Cap Fund, please contact your account manager or financial adviser, or call one of our shareholder associates at
| 2 | www.cogniosfunds.com |
Cognios Market Neutral Large Cap Fund | ||
Shareholder Letter | September 30, 2013 (Unaudited) |
855-254-6467. We also invite you to visit Cognios’ website at www.cognios.com to learn more about our firm, our team and our values.
We thank you for investing with Cognios and for the trust you have placed in us.
Sincerely,
|
| |||||
Jonathan Angrist | Brian Machtley | |||||
Portfolio Managers | ||||||
Cognios Capital, LLC | ||||||


| 1 | Purchases and redemptions may be made on any day the New York Stock Exchange is open for trading. You may purchase and sell shares directly with the Fund through the Fund’s website at www.cogniosfunds.com. |
| 2 | The Fund’s holdings will be updated quarterly at www.cogniosfunds.com. |
The Fund’s investment objectives, risks, charges and expenses must be considered before investing.
| Annual Report | September 30, 2013 | 3 |
Cognios Market Neutral Large Cap Fund | ||
| September 30, 2013 (Unaudited) |
Performance (for the period ended September 30, 2013)
| Three Month | Six Month | Since Inception* | ||||||||||
Cognios Market Neutral Large Cap Fund – Investor | -1.88 | % | 1.85 | % | -0.70 | % | ||||||
Cognios Market Neutral Large Cap fund – Institutional | -1.87 | % | 1.95 | % | -0.50 | % | ||||||
HFRI Equity Hedge Market Neutral(a) | 0.88 | % | 1.67 | % | 3.69 | % | ||||||
S&P 500® Total Return Index(b) | 5.25 | % | 8.31 | % | 19.79 | % | ||||||
| * | Fund’s inception date is December 31, 2012. |
Indexes are not actively managed and do not reflect deduction for fees, expenses or taxes. An investor cannot invest directly into an index.
The returns shown above do not reflect the deduction of taxes a shareholder would pay on Fund distributions or redemption of Fund shares.
The Fund is new and has a limited operating history.
The performance data quoted above represents past performance. Past performance is not a guarantee of future results. Investment return and value of the Fund shares will fluctuate so that an investor’s shares, when sold or redeemed, may be worth more or less than their original cost. Performance may be lower or higher than performance data quoted. Fund performance current to the most recent month-end is available by calling 855.254.6467 or by visiting www.cogniosfunds.com.
| (a) | The HFRI Equity Hedge Market Neutral Index is a common benchmark for long/short market neutral hedge funds (funds traditionally only available to high net-worth accredited and institutional investors that are also “qualified clients” as defined by the SEC). More information about this index may be found at www.hedgefundresearch.com. |
| (b) | The S&P 500® Total Return Index is an unmanaged index of 500 common stocks chosen for the market size, liquidity and industry group representation. It is a market-value weighted index. |
| 4 | www.cogniosfunds.com |
Cognios Market Neutral Large Cap Fund | ||
Portfolio Update | September 30, 2013 (Unaudited) |
Performance of $10,000 Initial Investment (for the period ended September 30, 2013)
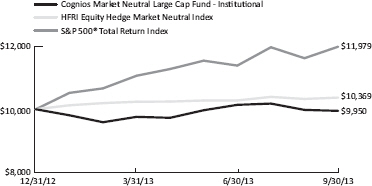
The graph shown above represents historical performance of a hypothetical investment of $10,000 in the Fund since inception. Past performance does not guarantee future results. All returns reflect reinvested dividends, but do not reflect the deduction of taxes that a shareholder would pay on Fund distributions or the redemption of Fund shares.
Sector Allocation (as a % of Net Assets)*
Technology - Long | 44.54 | % | ||
Technology (Short) | -10.92 | % | ||
Communications - Long | 28.95 | % | ||
Communications (Short) | -6.38 | % | ||
Utilities - Long | 2.50 | % | ||
Consumer Non-cyclical - Long | 11.29 | % | ||
Consumer Non-cyclical (Short) | -10.51 | % | ||
Money Market Fund - Long | 0.26 | % | ||
Diversified (Short) | -0.10 | % | ||
Industrials - Long | 12.35 | % | ||
Industrials (Short) | -12.95 | % | ||
Basic Materials - Long | 6.67 | % | ||
Basic Materials (Short) | -8.85 | % | ||
Energy - Long | 10.46 | % | ||
Energy (Short) | -16.10 | % | ||
Consumer Cyclical - Long | 2.48 | % | ||
Consumer Cyclical (Short) | -15.70 | % | ||
Financials (Short) | -14.88 | % | ||
Cash, Cash Equivalents, & Other Net Assets | 76.89 | % | ||
TOTALS | 100.00 | % |
| * | Holdings are subject to change. Table presents indicative values only. |
| Annual Report | September 30, 2013 | 5 |
Cognios Market Neutral Large Cap Fund | ||
Portfolio Update | September 30, 2013 (Unaudited) |
Top 10 Long Positions (as a % of Net Assets)*
| Security | Ticker | Weight^ | ||||
Seagate Technology PLC | STX | 6.87% | ||||
CF Industries Holdings, Inc. | CF | 6.67% | ||||
Expedia, Inc. | EXPE | 6.66% | ||||
L-3 Communications Holdings, Inc. | LLL | 6.29% | ||||
Western Digital Corp. | WDC | 6.15% | ||||
Gannett Co., Inc. | GCI | 5.35% | ||||
Western Union Co. | WU | 5.12% | ||||
Harris Corp. | HRS | 5.04% | ||||
Intel Corp. | INTC | 5.02% | ||||
Broadcom Corp. - Class A | BRCM | 4.96% | ||||
| * | Holdings are subject to change. Table presents indicative values only. |
| ^ | Position rank based on percentage of net assets. |
| 6 | www.cogniosfunds.com |
Cognios Market Neutral Large Cap Fund | ||
| September 30, 2013 (Unaudited) |
As a shareholder of the Cognios Market Neutral Large Cap Fund (the “Fund”), you will incur two types of costs: (1) transaction costs, (2) ongoing costs, including management fees, distribution and service (12b-1) fees and other Fund expenses. The following examples are intended to help you understand your ongoing costs (in dollars) of investing in the Fund and to compare these costs with the ongoing costs of investing in other mutual funds. The examples are based on an investment of $1,000 invested on April 1, 2013 and held until September 30, 2013.
Actual Expenses. The first line of each table below provides information about actual account values and actual expenses. You may use the information in this line, together with the amount you invested, to estimate the expenses that you paid over the period. Simply divide your account value by $1,000 (for example, an $8,600 account value divided by $1,000 = 8.6), then multiply the result by the number in the first line under the heading “Expenses Paid During Period” to estimate the expenses you paid on your account during this period.
Hypothetical Example for Comparison Purposes. The second line of the table below provides information about hypothetical account values and hypothetical expenses based on the Fund’s actual expense ratio and an assumed rate of return of 5% per year before expenses, which is not the Fund’s actual return. The hypothetical account values and expenses may not be used to estimate the actual ending account balance or expenses you paid for the period. You may use this information to compare the ongoing costs of investing in the Fund and other mutual funds. To do so, compare this 5% hypothetical example with the 5% hypothetical examples that appear in the shareholder reports of the other funds. The expenses shown in the table are meant to highlight ongoing Fund costs only and do not reflect transaction fees, such as redemption fees or exchange fees. Therefore, the second line of each table below is useful in comparing ongoing costs only, and may not help you determine the relative total costs of owning different funds. In addition, if these transactional costs were included, your costs would have been higher.
| Beginning Account Value April 1, 2013 | Ending Account Value September 30, 2013 | Expense Ratio(a) | Expenses Paid During Period April 1, 2013 - September 30, 2013(b) | |||||||||||||
Investor Class | ||||||||||||||||
Actual | $ | 1,000.00 | $ | 1,018.50 | 3.91 | % | $ | 19.78 | ||||||||
Hypothetical (5% return before expenses) | $ | 1,000.00 | $ | 1,005.46 | 3.91 | % | $ | 19.66 | ||||||||
| ||||||||||||||||
Institutional Class | ||||||||||||||||
Actual | $ | 1,000.00 | $ | 1,019.50 | 3.67 | % | $ | 18.58 | ||||||||
Hypothetical (5% return before expenses) | $ | 1,000.00 | $ | 1,006.67 | 3.67 | % | $ | 18.46 | ||||||||
| (a) | Annualized, based on the Fund’s most recent fiscal half year expenses. Expense ratio excluding interest expense and dividends paid on borrowed securities is 2.25% and 2.00% for Investor Class and Institutional Class, respectively. |
| (b) | Expenses are equal to the Fund’s annualized expense ratio, multiplied by the average account value over the period, multiplied by the number of days in the most recent fiscal half year (183), divided by 365. |
| Annual Report | September 30, 2013 | 7 |
Cognios Market Neutral Large Cap Fund | ||
| September 30, 2013 |
| Shares | Value | |||||||
COMMON STOCKS (119.24%) | ||||||||
Basic Materials (6.67%) | ||||||||
CF Industries Holdings, Inc.(a) | 3,540 | $ | 746,338 | |||||
|
| |||||||
Total Basic Materials | 746,338 | |||||||
|
| |||||||
Communications (28.95%) | ||||||||
AT&T, Inc.(a) | 3,958 | 133,860 | ||||||
Cablevision Systems Corp. - Class A(a) | 30,391 | 511,784 | ||||||
DIRECTV(a)(b) | 9,261 | 553,345 | ||||||
Expedia, Inc.(a) | 14,404 | 745,983 | ||||||
Gannett Co., Inc.(a) | 22,368 | 599,239 | ||||||
Harris Corp.(a) | 9,515 | 564,240 | ||||||
Verizon Communications, Inc.(a) | 2,843 | 132,654 | ||||||
|
| |||||||
Total Communications | 3,241,105 | |||||||
|
| |||||||
Consumer Cyclical (2.48%) | ||||||||
Abercrombie & Fitch Co. - Class A(a) | 3,814 | 134,901 | ||||||
PulteGroup, Inc.(a) | 8,686 | 143,319 | ||||||
|
| |||||||
Total Consumer Cyclical | 278,220 | |||||||
| �� |
|
| ||||||
Consumer Non-cyclical (11.29%) | ||||||||
ADT Corp.(a) | 13,529 | 550,089 | ||||||
Archer-Daniels-Midland Co.(a) | 3,826 | 140,950 | ||||||
Western Union Co.(a) | 30,738 | 573,571 | ||||||
|
| |||||||
Total Consumer Non-cyclical | 1,264,610 | |||||||
|
| |||||||
Energy (10.46%) | ||||||||
Denbury Resources, Inc.(a)(b) | 7,757 | 142,806 | ||||||
Diamond Offshore Drilling, Inc.(a) | 8,415 | 524,423 | ||||||
Marathon Petroleum Corp.(a) | 1,850 | 118,992 | ||||||
Murphy Oil Corp.(a) | 1,998 | 120,519 | ||||||
Phillips 66(a) | 2,342 | 135,415 | ||||||
Valero Energy Corp.(a) | 3,775 | 128,916 | ||||||
|
| |||||||
Total Energy | 1,171,071 | |||||||
|
| |||||||
Industrials (12.35%) | ||||||||
Jabil Circuit, Inc.(a) | 5,879 | 127,457 | ||||||
L-3 Communications Holdings, Inc.(a) | 7,457 | 704,686 | ||||||
Raytheon Co.(a) | 7,137 | 550,049 | ||||||
|
| |||||||
Total Industrials | 1,382,192 | |||||||
|
| |||||||
Technology (44.54%) | ||||||||
Apple, Inc. | 1,109 | 528,716 | ||||||
Broadcom Corp. - Class A(a) | 21,331 | 554,819 | ||||||
Dell, Inc.(a) | 9,783 | 134,712 | ||||||
| 8 | www.cogniosfunds.com |
Cognios Market Neutral Large Cap Fund | ||
Portfolio of Investments | September 30, 2013 |
| Shares | Value | |||||||||||
Technology (continued) | ||||||||||||
EMC Corp.(a) | 20,900 | $ | 534,204 | |||||||||
Hewlett-Packard Co.(a) | 5,965 | 125,146 | ||||||||||
Intel Corp.(a) | 24,515 | 561,884 | ||||||||||
Microsoft Corp. | 16,116 | 536,824 | ||||||||||
NetApp, Inc.(a) | 12,972 | 552,867 | ||||||||||
Seagate Technology PLC | 17,576 | 768,774 | ||||||||||
Western Digital Corp.(a) | 10,864 | 688,777 | ||||||||||
|
| |||||||||||
Total Technology | 4,986,723 | |||||||||||
|
| |||||||||||
Utilities (2.50%) | ||||||||||||
AES Corp.(a) | 10,417 | 138,442 | ||||||||||
AGL Resources, Inc.(a) | 3,065 | 141,082 | ||||||||||
|
| |||||||||||
Total Utilities | 279,524 | |||||||||||
|
| |||||||||||
TOTAL COMMON STOCKS (Cost $12,740,909) | 13,349,783 | |||||||||||
| ||||||||||||
| 7-Day Yield | Shares | Value | ||||||||||
| ||||||||||||
SHORT TERM INVESTMENTS (0.26%) | ||||||||||||
Money Market Fund (0.26%) | ||||||||||||
Daily Income Fund - U.S. Treasury Portfolio - Fiduciary Class | 0.00000% | 29,154 | 29,154 | |||||||||
|
| |||||||||||
TOTAL SHORT TERM INVESTMENTS (Cost $29,154) | 29,154 | |||||||||||
| ||||||||||||
TOTAL INVESTMENTS (119.50%) (Cost $12,770,063) | 13,378,937 | |||||||||||
| ||||||||||||
SECURITIES SOLD SHORT (-96.39%) (Proceeds $9,947,317) | (10,791,227) | |||||||||||
| ||||||||||||
Other Assets In Excess Of Liabilities (76.89%) | 8,607,743 | (c) | ||||||||||
| ||||||||||||
NET ASSETS (100.00%) | $ | 11,195,453 | ||||||||||
| ||||||||||||
SCHEDULE OF SECURITIES SOLD SHORT | Shares | Value | ||||||
| ||||||||
COMMON STOCKS (-96.39%) | ||||||||
Basic Materials (-8.85%) | ||||||||
Air Products & Chemicals, Inc. | (2,121) | $ | (226,035) | |||||
Alcoa, Inc. | (19,981) | (162,246) | ||||||
EI du Pont de Nemours & Co. | (4,240) | (248,294) | ||||||
FMC Corp. | (1,380) | (98,974) | ||||||
MeadWestvaco Corp. | (3,455) | (132,603) | ||||||
| Annual Report | September 30, 2013 | 9 |
Cognios Market Neutral Large Cap Fund | ||
Portfolio of Investments | September 30, 2013 |
| SCHEDULE OF SECURITIES SOLD SHORT | Shares | Value | ||||||
| ||||||||
Basic Materials (-8.85%) (continued) | ||||||||
United States Steel Corp. | (6,004) | $(123,622) | ||||||
|
| |||||||
Total Basic Materials | (991,774) | |||||||
|
| |||||||
Communications (-6.38%) | ||||||||
Interpublic Group of Cos., Inc. | (8,055) | (138,385) | ||||||
JDS Uniphase Corp. | (8,377) | (123,226) | ||||||
Motorola Solutions, Inc. | (2,277) | (135,208) | ||||||
News Corp. - Class A | (3,788) | (60,835) | ||||||
Twenty-First Century Fox, Inc. - Class A | (7,663) | (256,710) | ||||||
|
| |||||||
Total Communications | (714,364) | |||||||
|
| |||||||
Consumer Cyclical (-15.70%) | ||||||||
CarMax, Inc. | (4,177) | (202,459) | ||||||
DR Horton, Inc. | (6,599) | (128,219) | ||||||
Ford Motor Co. | (18,366) | (309,834) | ||||||
Goodyear Tire & Rubber Co. | (2,867) | (64,364) | ||||||
Harman International Industries, Inc. | (1,679) | (111,200) | ||||||
JC Penney Co., Inc. | (8,612) | (75,958) | ||||||
Johnson Controls, Inc. | (5,859) | (243,149) | ||||||
Lennar Corp. - Class A | (3,505) | (124,077) | ||||||
PVH Corp. | (820) | (97,326) | ||||||
Tiffany & Co. | (2,391) | (183,198) | ||||||
Whirlpool Corp. | (1,481) | (216,878) | ||||||
|
| |||||||
Total Consumer Cyclical | (1,756,662) | |||||||
|
| |||||||
Consumer Non-cyclical (-10.51%) | ||||||||
Aetna, Inc. | (6,951) | (445,003) | ||||||
Beam, Inc. | (1,638) | (105,897) | ||||||
Cigna Corp. | (5,284) | (406,128) | ||||||
Estee Lauder Cos., Inc. - Class A | (2,413) | (168,669) | ||||||
Tenet Healthcare Corp. | (1,230) | (50,664) | ||||||
|
| |||||||
Total Consumer Non-cyclical | (1,176,361) | |||||||
|
| |||||||
Diversified (-0.10%) | ||||||||
Leucadia National Corp. | (420) | (11,441) | ||||||
|
| |||||||
Total Diversified | (11,441) | |||||||
|
| |||||||
Energy (-16.10%) | ||||||||
Baker Hughes, Inc. | (3,794) | (186,285) | ||||||
Cabot Oil & Gas Corp. | (4,265) | (159,170) | ||||||
Cameron International Corp. | (4,598) | (268,385) | ||||||
Chesapeake Energy Corp. | (5,699) | (147,490) | ||||||
| 10 | www.cogniosfunds.com |
Cognios Market Neutral Large Cap Fund | ||
Portfolio of Investments | September 30, 2013 |
| SCHEDULE OF SECURITIES SOLD SHORT | Shares | Value | ||||||
| ||||||||
Energy (-16.10%) (continued) | ||||||||
CONSOL Energy, Inc. | (4,276 | ) | $ | (143,887 | ) | |||
FMC Technologies, Inc. | (4,426 | ) | (245,289 | ) | ||||
Nabors Industries, Ltd. | (3,862 | ) | (62,024 | ) | ||||
National Oilwell Varco, Inc. | (3,661 | ) | (285,961 | ) | ||||
Noble Corp. | (2,170 | ) | (81,961 | ) | ||||
QEP Resources, Inc. | (1,814 | ) | (50,230 | ) | ||||
Rowan Cos. PLC - Class A | (1,679 | ) | (61,653 | ) | ||||
WPX Energy, Inc. | (5,760 | ) | (110,938 | ) | ||||
|
| |||||||
Total Energy | (1,803,273 | ) | ||||||
|
| |||||||
Financials (-14.88%) | ||||||||
Allstate Corp. | (534 | ) | (26,994 | ) | ||||
American International Group, Inc. | (1,700 | ) | (82,671 | ) | ||||
Ameriprise Financial, Inc. | (228 | ) | (20,766 | ) | ||||
Assurant, Inc. | (67 | ) | (3,625 | ) | ||||
AvalonBay Communities, Inc. - REIT | (149 | ) | (18,936 | ) | ||||
Bank of America Corp. | (12,370 | ) | (170,706 | ) | ||||
BlackRock, Inc. | (193 | ) | (52,230 | ) | ||||
Capital One Financial Corp. | (674 | ) | (46,331 | ) | ||||
Charles Schwab Corp. | (1,480 | ) | (31,287 | ) | ||||
Citigroup, Inc. | (3,502 | ) | (169,882 | ) | ||||
Comerica, Inc. | (213 | ) | (8,373 | ) | ||||
E*Trade Financial Corp. | (251 | ) | (4,141 | ) | ||||
Equity Residential | (415 | ) | (22,232 | ) | ||||
Fifth Third Bancorp | (980 | ) | (17,679 | ) | ||||
Genworth Financial, Inc. - Class A | (431 | ) | (5,512 | ) | ||||
Goldman Sachs Group, Inc. | (517 | ) | (81,795 | ) | ||||
Hartford Financial Services Group, Inc. | (524 | ) | (16,307 | ) | ||||
Host Hotels & Resorts, Inc. - REIT | (864 | ) | (15,267 | ) | ||||
Huntington Bancshares, Inc. | (733 | ) | (6,055 | ) | ||||
JPMorgan Chase & Co. | (4,334 | ) | (224,024 | ) | ||||
Lincoln National Corp. | (305 | ) | (12,807 | ) | ||||
Loews Corp. | (446 | ) | (20,846 | ) | ||||
Macerich Co. - REIT | (162 | ) | (9,143 | ) | ||||
Morgan Stanley | (2,255 | ) | (60,772 | ) | ||||
PNC Financial Services Group, Inc. | (612 | ) | (44,339 | ) | ||||
Principal Financial Group, Inc. | (339 | ) | (14,516 | ) | ||||
Prologis, Inc. - REIT | (574 | ) | (21,594 | ) | ||||
Prudential Financial, Inc. | (533 | ) | (41,563 | ) | ||||
Regions Financial Corp. | (1,607 | ) | (14,881 | ) | ||||
SLM Corp. | (502 | ) | (12,500 | ) | ||||
State Street Corp. | (514 | ) | (33,796 | ) | ||||
| Annual Report | September 30, 2013 | 11 |
Cognios Market Neutral Large Cap Fund | ||
Portfolio of Investments | September 30, 2013 |
| SCHEDULE OF SECURITIES SOLD SHORT | Shares | Value | ||||||
| ||||||||
Financials (-14.88%) (continued) | ||||||||
SunTrust Banks, Inc. | (619) | $ | (20,068) | |||||
Unum Group | (304) | (9,254) | ||||||
Ventas, Inc. - REIT | (338) | (20,787) | ||||||
Vornado Realty Trust - REIT | (215) | (18,073) | ||||||
Wells Fargo & Co. | (6,114) | (252,630) | ||||||
Weyerhaeuser Co. - REIT | (670) | (19,182) | ||||||
XL Group PLC | (330) | (10,171) | ||||||
Zions Bancorporation | (161) | (4,415) | ||||||
|
| |||||||
Total Financials | (1,666,150) | |||||||
|
| |||||||
Industrials (-12.95%) | ||||||||
Deere & Co. | (3,278) | (266,796) | ||||||
Fluor Corp. | (1,396) | (99,060) | ||||||
General Electric Co. | (12,850) | (306,987) | ||||||
Masco Corp. | (3,612) | (76,863) | ||||||
Molex, Inc. | (1,655) | (63,751) | ||||||
Owens-Illinois, Inc. | (2,095) | (62,892) | ||||||
Pall Corp. | (1,129) | (86,978) | ||||||
Ryder System, Inc. | (1,069) | (63,819) | ||||||
Stanley Black & Decker, Inc. | (1,620) | (146,723) | ||||||
Textron, Inc. | (5,240) | (144,676) | ||||||
Vulcan Materials Co. | (2,559) | (132,582) | ||||||
|
| |||||||
Total Industrials | (1,451,127) | |||||||
|
| |||||||
Technology (-10.92%) | ||||||||
Advanced Micro Devices, Inc. | (32,869) | (124,902) | ||||||
Applied Materials, Inc. | (12,171) | (213,479) | ||||||
Computer Sciences Corp. | (2,759) | (142,751) | ||||||
Electronic Arts, Inc. | (5,729) | (146,376) | ||||||
Micron Technology, Inc. | (19,401) | (338,935) | ||||||
Salesforce.com, Inc. | (4,886) | (253,632) | ||||||
|
| |||||||
Total Technology | (1,220,075) | |||||||
|
| |||||||
TOTAL COMMON STOCKS (Proceeds $9,947,317) | (10,791,227) | |||||||
| ||||||||
TOTAL SECURITIES SOLD SHORT (-96.39%) (Proceeds $9,947,317) | $ | (10,791,227) | ||||||
| ||||||||
| 12 | www.cogniosfunds.com |
Cognios Market Neutral Large Cap Fund | ||
Portfolio of Investments | September 30, 2013 |
| (a) | Security, or a portion of security, is being held as collateral for short sales. As of September 30, 2013, the aggregate market value of those securities was $7,556,624, which represents approximately 67.50% of net assets. |
| (b) | Non-income producing security. |
| (c) | Includes segregated cash that is being held as collateral for securities sold short. |
Common Abbreviations:
PLC - Public Limited Company.
REIT - Real Estate Investment Trust.
For Fund compliance purposes, the Fund’s industry classifications refer to any one of the industry sub-classifications used by one or more widely recognized market indexes, and/or as defined by the Fund’s management. This definition may not apply for purposes of this report, which may combine industry sub-classifications for reporting ease. Industries are shown as a percent of net assets.
See Notes to Financial Statements.
| Annual Report | September 30, 2013 | 13 |
Cognios Market Neutral Large Cap Fund | ||
| September 30, 2013 |
ASSETS: | ||||
Investments, at value (cost $12,770,063) | $ | 13,378,937 | ||
Segregated cash with brokers | 9,615 | |||
Deposit with broker for securities sold short (Note 2) | 8,626,054 | |||
Receivable due from adviser | 8,157 | |||
Dividends receivable | 15,242 | |||
Prepaid assets | 6,471 | |||
|
| |||
Total Assets | 22,044,476 | |||
|
| |||
LIABILITIES: | ||||
Securities sold short (proceeds $9,947,317) | 10,791,227 | |||
Payable for dividends on short sales | 11,514 | |||
Payable for distribution and service fees | 1,035 | |||
Payable to trustees | 806 | |||
Payable to chief compliance officer | 1,667 | |||
Payable to principal financial officer | 833 | |||
Accrued expenses and other liabilities | 41,941 | |||
|
| |||
Total Liabilities | 10,849,023 | |||
|
| |||
NET ASSETS | $ | 11,195,453 | ||
|
| |||
NET ASSETS CONSIST OF: | ||||
Paid-in capital (Note 5) | $ | 11,270,902 | ||
Accumulated net investment loss | (144) | |||
Accumulated net realized gain on investments and securities sold short | 159,731 | |||
Net unrealized depreciation on investments and securities sold short | (235,036) | |||
|
| |||
NET ASSETS | $ | 11,195,453 | ||
|
| |||
PRICING OF SHARES | ||||
Investor Class: | ||||
Net Asset Value, offering and redemption price per share | $ | 9.93 | ||
Net Assets | $ | 5,067,266 | ||
Shares of beneficial interest outstanding | 510,275 | |||
Institutional Class: | ||||
Net Asset Value, offering and redemption price per share | $ | 9.95 | ||
Net Assets | $ | 6,128,187 | ||
Shares of beneficial interest outstanding | 615,958 | |||
See Notes to Financial Statements. | ||||
See Notes to Financial Statements.
| 14 | www.cogniosfunds.com |
Cognios Market Neutral Large Cap Fund | ||
| For the Period Ended September 30, 2013(a) |
INVESTMENT INCOME: | ||||
Dividends | $ | 193,773 | ||
|
| |||
Total Investment Income | 193,773 | |||
|
| |||
EXPENSES: | ||||
Investment advisory fee (Note 6) | 118,413 | |||
Dividend expense on securities sold short | 102,645 | |||
Interest expense | 46,074 | |||
Administration fee | 42,940 | |||
Distribution and service fees | ||||
Investor Class | 9,320 | |||
Custodian fee | 7,944 | |||
Legal fees | 24,682 | |||
Audit fees | 18,000 | |||
Transfer agent fee | 30,161 | |||
Trustees fees and expenses | 29,417 | |||
Chief compliance officer fee | 15,000 | |||
Principal financial officer fee | 7,500 | |||
Insurance expense | 14,460 | |||
Other expenses | 17,772 | |||
|
| |||
Total expenses | 484,328 | |||
|
| |||
Less fees waived/reimbursed by investment adviser | ||||
Investor Class | (79,516) | |||
Institutional Class | (88,889) | |||
|
| |||
Net Expenses | 315,923 | |||
|
| |||
NET INVESTMENT LOSS | (122,150) | |||
|
| |||
Net realized gain on investments | 1,210,621 | |||
Net realized loss on securities sold short | (933,904) | |||
Net change in unrealized appreciation on investments | 608,874 | |||
Net change in unrealized depreciation on securities sold short | (843,910) | |||
|
| |||
NET REALIZED AND UNREALIZED GAIN ON INVESTMENTS AND SECURITIES SOLD SHORT | 41,681 | |||
NET DECREASE IN NET ASSETS RESULTING FROM OPERATIONS | $ | (80,469) | ||
|
| |||
| (a) | Commenced operations on January 2, 2013. |
See Notes to Financial Statements.
| Annual Report | September 30, 2013 | 15 |
Cognios Market Neutral Large Cap Fund | ||
|
| For the Period Ended September 30, 2013(a) | ||||
OPERATIONS: | ||||
Net investment loss | $ | (122,150) | ||
Net realized gain on investments and securities sold short | 276,717 | |||
Net change in unrealized depreciation on investments and securities sold short | (235,036) | |||
|
| |||
Net decrease in net assets resulting from operations | (80,469) | |||
|
| |||
BENEFICIAL SHARE TRANSACTIONS: | ||||
Investor Class | ||||
Shares sold | 5,053,401 | |||
Shares redeemed | (41) | |||
|
| |||
Net increase from beneficial share transactions | 5,053,360 | |||
|
| |||
Institutional Class | ||||
Shares sold | 6,138,562 | |||
Shares redeemed | (16,000) | |||
|
| |||
Net increase from beneficial share transactions | 6,122,562 | |||
|
| |||
Net increase in net assets | 11,095,453 | |||
|
| |||
NET ASSETS: | ||||
Beginning of period | 100,000 | |||
|
| |||
End of period (including accumulated net investment loss of $(144)) | $ | 11,195,453 | ||
|
| |||
(a) Commenced operations on January 2, 2013. | ||
See Notes to Financial Statements. | ||
| 16 | www.cogniosfunds.com |
Cognios Market Neutral Large Cap Fund | ||
| For the Period Ended September 30, 2013(a) |
CASH FLOWS FROM OPERATING ACTIVITIES: | ||||
Net decrease in net assets from operations | $ | (80,469) | ||
Adjustments to reconcile net decrease in net assets from operations to net cash used in operating activities: | ||||
Purchases of investment securities | (30,096,661) | |||
Proceeds from disposition of investment securities | 18,566,373 | |||
Proceeds from securities sold short transactions | 22,198,844 | |||
Purchases to cover securities sold short transactions | (13,185,431) | |||
Net purchases from short-term investment securities | (29,154) | |||
Net realized gain on investments and securities sold short | (276,717) | |||
Net change in unrealized depreciation on investments and securities sold short | 235,036 | |||
Changes in assets and liabilities: | ||||
Increase in segregated cash with brokers | (9,615) | |||
Increase in deposit with broker for securities sold short | (8,626,054) | |||
Increase in receivable due from adviser | (8,157) | |||
Increase in dividends receivable | (15,242) | |||
Increase in prepaid assets | (6,471) | |||
Increase in payable for dividends on short sales | 11,514 | |||
Increase in payable for distribution and service fees | 1,035 | |||
Increase in payable to trustees | 806 | |||
Increase in payable to chief compliance officer | 1,667 | |||
Increase in payable to principal financial officer | 833 | |||
Increase in other accrued expenses and other liabilities | 41,941 | |||
| ||||
Net cash used in operating activities | (11,275,922) | |||
| ||||
CASH FLOWS USED IN FINANCING ACTIVITIES: | ||||
Proceeds from sale of shares | 11,191,963 | |||
Cost of shares redeemed | (16,041) | |||
| ||||
Net cash provided by financing activities | 11,175,922 | |||
| ||||
NET DECREASE IN CASH FOR THE PERIOD | (100,000) | |||
| ||||
CASH, BEGINNING OF PERIOD | $ | 100,000 | ||
CASH, END OF PERIOD | $ | 0 | ||
SUPPLEMENTAL DISCLOSURE OF CASH FLOW INFORMATION: | ||||
Cash paid during the period for interest expense | $ | 46,074 | ||
(a) Commenced operations on January 2, 2013. | ||
See Notes to Financial Statements. | ||
| Annual Report | September 30, 2013 | 17. |
Cognios Market Neutral Large Cap Fund | Investor Class | |
|
For the Period Ended | ||||
For a share outstanding throughout the period presented. | ||||
| ||||
NET ASSET VALUE, BEGINNING OF PERIOD | $ | 10.00 | ||
INCOME/(LOSS) FROM OPERATIONS: | ||||
Net investment loss(b) | (0.12) | |||
Net realized and unrealized gain on investments | 0.05 | |||
|
| |||
Total from Investment Operations | (0.07) | |||
|
| |||
NET DECREASE IN NET ASSET VALUE | (0.07) | |||
|
| |||
NET ASSET VALUE, END OF PERIOD | $ | 9.93 | ||
|
| |||
TOTAL RETURN(c) | (0.70) | % | ||
RATIOS/SUPPLEMENTAL DATA: | ||||
Net assets, End of Period (in 000s) | $ | 5,067 | ||
RATIOS TO AVERAGE NET ASSETS (excluding interest expense and dividend expense on securities sold short) | ||||
Operating expenses excluding reimbursement/waiver | 4.38% | (d) | ||
Operating expenses including reimbursement/waiver | 2.25% | (d) | ||
Net investment loss including reimbursement/waiver | 0.19% | (d) | ||
RATIOS TO AVERAGE NET ASSETS (including interest expense and dividend expense on securities sold short) | ||||
Operating expenses excluding reimbursement/waiver | 6.27% | (d) | ||
Operating expenses including reimbursement/waiver | 4.13% | (d) | ||
Net investment loss including reimbursement/waiver | (1.69)% | (d) | ||
PORTFOLIO TURNOVER RATE | 155% | (e) | ||
| (a) | Commenced operations on January 2, 2013. |
| (b) | Per share amounts are based upon average shares outstanding. |
| (c) | Total return is for the period indicated and has not been annualized. The total return would have been lower had certain expenses not been reimbursed / waived during the period. The return shown does not reflect the deduction of taxes that a shareholder would pay on fund distributions or the redemption of fund shares. |
| (d) | Annualized. |
| (e) | Not annualized. |
See Notes to Financial Statements.
| 18 | www.cogniosfunds.com |
Cognios Market Neutral Large Cap Fund | Institutional Class | |
Financial Highlights |
For the Period Ended | ||||
For a share outstanding throughout the period presented. | ||||
| ||||
NET ASSET VALUE, BEGINNING OF PERIOD | $ | 10.00 | ||
INCOME/(LOSS) FROM OPERATIONS: | ||||
Net investment loss(b) | (0.10) | |||
Net realized and unrealized gain on investments | 0.05 | |||
|
| |||
Total from Investment Operations | (0.05) | |||
|
| |||
NET DECREASE IN NET ASSET VALUE | (0.05) | |||
|
| |||
NET ASSET VALUE, END OF PERIOD | $ | 9.95 | ||
|
| |||
TOTAL RETURN(c) | (0.50) | % | ||
RATIOS/SUPPLEMENTAL DATA: | ||||
Net assets, End of Period (in 000s) | $ | 6,128 | ||
RATIOS TO AVERAGE NET ASSETS (excluding interest expense and dividend expense on securities sold short) | ||||
Operating expenses excluding reimbursement/waiver | 4.13% | (d) | ||
Operating expenses including reimbursement/waiver | 2.00% | (d) | ||
Net investment loss including reimbursement/waiver | 0.46% | (d) | ||
RATIOS TO AVERAGE NET ASSETS (including interest expense and dividend expense on securities sold short) | ||||
Operating expenses excluding reimbursement/waiver | 6.02% | (d) | ||
Operating expenses including reimbursement/waiver | 3.88% | (d) | ||
Net investment loss including reimbursement/waiver | (1.42)% | (d) | ||
PORTFOLIO TURNOVER RATE | 155% | (e) | ||
| (a) | Commenced operations on January 2, 2013. |
| (b) | Per share amounts are based upon average shares outstanding. |
| (c) | Total return is for the period indicated and has not been annualized. The total return would have been lower had certain expenses not been reimbursed / waived during the period. The return shown does not reflect the deduction of taxes that a shareholder would pay on fund distributions or the redemption of fund shares. |
| (d) | Annualized. |
| (e) | Not annualized. |
See Notes to Financial Statements.
| Annual Report | September 30, 2013 | 19 |
Cognios Market Neutral Large Cap Fund | ||
| September 30, 2013 |
1. ORGANIZATION
ALPS Series Trust (the “Trust”), a Delaware statutory trust, is an open-end management investment company registered under the Investment Company Act of 1940, as amended (the “1940 Act”). As of September 30, 2013, the Trust had two registered funds. This annual report describes the Cognios Market Neutral Large Cap Fund (the “Fund”). The Fund seeks long-term growth of capital independent of stock market direction. The Fund currently offers Investor Class shares and Institutional Class shares. Each share class of the Fund represents an investment in the same portfolio of securities, but each share class has its own expense structure. Institutional Class shares are offered directly, via the Fund’s transfer agent, and through financial intermediaries (including, but not limited to, broker-dealers, retirement plans, bank trust departments and financial advisors). The Board of Trustees (the “Board”) may establish additional funds and classes of shares at any time in the future without shareholder approval.
As a newly organized entity, the Fund has little operating history. The Fund did not have any operations before January 2, 2013, other than those relating to the sale and issuance of 10,000 common shares, in the amount of 5,000 and 5,000 shares for Investor Class and Institutional Class shares in the Fund, respectively, to ALPS Fund Services, Inc. (“ALPS” and the “Administrator”) the Fund’s administrator and transfer agent. ALPS Distributors, Inc. (“ADI” or the “Distributor”) is an affiliate of ALPS Fund Services, Inc.
Cognios Capital, LLC (“Cognios Capital” or the “Adviser”) the Fund’s investment adviser, has assumed all organization and offering costs on behalf of the Fund.
2. SIGNIFICANT ACCOUNTING POLICIES
The accompanying financial statements were prepared in accordance with accounting principles generally accepted in the United States of America (“U.S. GAAP”). The preparation of financial statements in conformity with U.S. GAAP requires management to make certain estimates and assumptions that affect the reported amounts of assets and liabilities and disclosures of contingent assets and liabilities at the date of the financial statements and the reported amounts of revenue and expenses during the period. Actual results could differ from those estimates. The following is a summary of significant accounting policies consistently followed by the Fund in preparation of the financial statements.
Investment Valuation: The Fund generally values its securities based on market prices determined at the close of regular trading on the New York Stock Exchange (“NYSE”), normally 4:00 p.m. Eastern Time, on each day the NYSE is open for trading.
For equity securities and mutual funds that are traded on an exchange, the market price is usually the closing sale or official closing price on that exchange. In the case of equity securities not traded on an exchange, or if such closing prices are not otherwise available, the securities are valued at the mean of the most recent bid and ask prices on such day.
Redeemable securities issued by open-end registered investment companies are valued at the investment company’s applicable net asset value, with the exception of exchange-traded open-end investment companies, which are priced as equity securities.
| 20 | www.cogniosfunds.com |
Cognios Market Neutral Large Cap Fund | ||
Notes to Financial Statements | September 30, 2013 |
When such prices or quotations are not available, or when the Fair Value Committee appointed by the Board believes that they are unreliable, securities may be priced using fair value procedures approved by the Board.
Short Sales: The Fund may sell securities short. To do this, the Adviser will borrow and then sell (take short positions in) equity securities of U.S. companies that the Adviser believes are likely to underperform the long positions over time. To complete such a transaction, the Fund must borrow the security to deliver to the buyer. The Fund then is obligated to replace the security borrowed by purchasing it in the open market at some later date. The Fund bears the risk of a loss if the market price of the security increases between the date of the short sale and the date on which the Fund replaces the borrowed security. The Fund will realize a gain if the security declines in value between those dates. There can be no assurance that securities necessary to cover a short position will be available for purchase. To mitigate leverage risk, the Fund will segregate liquid assets (which may include its long positions) at least equal to its short position exposure, marked-to-market daily. The Fund maintains collateral consisting of cash, U.S. Government securities or other liquid assets in an amount at least equal to the market value of their respective short positions. The Fund is liable for any dividends or interest payable on securities while those securities are in a short position. The Fund typically intends to hold securities sold short for the short term, therefore, they are excluded from the purchase and sales of investments in Note 4 and the Fund’s Portfolio Turnover Calculation in the Financial Highlights. As of September 30, 2013, the Fund held securities sold short with a market value of $10,791,227.
Fair Value Measurements: The Fund discloses the classification of their fair value measurements following a three-tier hierarchy based on the inputs used to measure fair value. Inputs refer broadly to the assumptions that market participants would use in pricing the asset or liability, including assumptions about risk. Inputs may be observable or unobservable. Observable inputs reflect the assumptions market participants would use in pricing the asset or liability that are developed based on market data obtained from sources independent of the reporting entity. Unobservable inputs reflect the reporting entity’s own assumptions about the assumptions market participants would use in pricing the asset or liability that are developed based on the best information available.
Various inputs are used in determining the value of the Fund’s investments as of the end of the reporting period. When inputs used fall into different levels of the fair value hierarchy, the level in the hierarchy within which the fair value measurement falls is determined based on the lowest level input that is significant to the fair value measurement in its entirety. The designated input levels are not necessarily an indication of the risk or liquidity associated with these investments. These inputs are categorized in the following hierarchy under applicable financial accounting standards:
Level 1 – Unadjusted quoted prices in active markets for identical investments, unrestricted assets or liabilities that the Fund has the ability to access at the measurement date;
Level 2 – Quoted prices which are not active, quoted prices for similar assets or liabilities in active markets or inputs other than quoted prices that are observable (either directly or indirectly) for substantially the full term of the asset or liability; and
| Annual Report | September 30, 2013 | 21 |
Cognios Market Neutral Large Cap Fund | ||
Notes to Financial Statements | September 30, 2013 |
Level 3 – Significant unobservable prices or inputs (including the Fund’s own assumptions in determining the fair value of investments) where there is little or no market activity for the asset or liability at the measurement date.
The following is a summary of the inputs used to value the Fund’s investments as of September 30, 2013:
| Investments in Securities at Value | Level 1 - Quoted Prices | Level 2 - Other Significant Observable Inputs | Level 3 - Significant Unobservable Inputs | Total | ||||||||||||
| ||||||||||||||||
Common Stocks(a) | $ | 13,349,783 | $ | – | $ | – | $ | 13,349,783 | ||||||||
Short Term Investments | 29,154 | – | – | 29,154 | ||||||||||||
| ||||||||||||||||
Total | $ | 13,378,937 | $ | – | $ | – | $ | 13,378,937 | ||||||||
| ||||||||||||||||
| ||||||||||||||||
| ||||||||||||||||
| ||||||||||||||||
Other Financial Instruments | ||||||||||||||||
| ||||||||||||||||
Liabilities | ||||||||||||||||
Securities Sold Short(a) | $ | (10,791,227) | $ | – | $ | – | $ | (10,791,227) | ||||||||
| ||||||||||||||||
Total | $ | (10,791,227) | $ | – | $ | – | $ | (10,791,227) | ||||||||
| ||||||||||||||||
| ||||||||||||||||
| (a) | For detailed descriptions of sectors, see the accompanying Portfolio of Investments. |
The Fund recognizes transfers between levels as of the end of the fiscal year. For the period ended September 30, 2013, the Fund did not have any transfers between Level 1 and Level 2 securities. There were no Level 3 securities held during the period.
Trust Expenses: Some expenses of the Trust can be directly attributed to the Fund. Expenses that cannot be directly attributed to the Fund are apportioned among all funds in the Trust based on average net assets of each fund.
Class Expenses: Expenses that are specific to a class of shares are charged directly to that share class. Fees provided under the distribution (Rule 12b-1) and/or shareholder service plans for a particular class of the Fund are charged to the operations of such class.
Federal Income Taxes: The Fund complies with the requirements under Subchapter M of the Internal Revenue Code of 1986, as amended, applicable to regulated investment companies and intends to distribute substantially all of its net taxable income and net capital gains, if any, each year so that it will not be subject to excise tax on undistributed income and gains. The Fund is not subject to income taxes to the extent such distributions are made.
As of and during the period ended September 30, 2013, the Fund did not have a liability for any unrecognized tax benefits in the accompanying financial statements. The Fund files U.S federal, state and local income tax returns as required. The Fund’s tax returns are subject to examination by the relevant tax authorities until expiration of the applicable statute of limitations, which is
| 22 | www.cogniosfunds.com |
Cognios Market Neutral Large Cap Fund | ||
Notes to Financial Statements | September 30, 2013 |
generally three years after the filing of the tax return for federal purposes and four years for most state returns. Tax returns for open years have incorporated no uncertain tax positions that require a provision for income taxes.
Investment Transactions and Investment Income: Investment transactions are accounted for on the date the investments are purchased or sold (trade date basis). Net realized gains and losses from investment transactions are reported on an identified cost basis. Interest income, which includes accretion of discounts and amortization of premiums, is accrued and recorded as earned. Dividend income is recognized on the ex-dividend date. All of the realized and unrealized gains and losses and net investment income, are allocated daily to each class in proportion to its average daily net assets.
Principal Investment Strategies and Risk: The Fund seeks to achieve its investment objective by balancing “long” and “short” positions. To do this, the Fund will buy (take long positions in) equity securities of U.S. companies that the Adviser believes are undervalued and more likely to appreciate and, at the same time, borrow and then sell (take short positions in) equity securities of U.S. companies that the Adviser believes are likely to underperform the long positions over time. The Fund generally seeks to purchase and sell short large capitalization U.S. equity common stocks of companies that are constituents of the S&P 500® Total Return Index. The Fund may invest across different industries and sectors. Utilization of short selling involves certain risks to the Fund’s shareholders, including potential for higher volatility of the net asset value (“NAV”) of the Fund’s shares and the relatively greater effect of portfolio holdings on the NAV of the shares. The Fund may not always be able to close out a short position on favorable terms. Short sales involve the risk that the Fund will incur a loss by subsequently buying a security at a higher price than the price at which it sold the security short.
Distributions to Shareholders: The Fund normally pays dividends and distributes capital gains, if any, on an annual basis. Income dividend distributions are derived from interest and other income the Fund receives from its investments, including short term capital gains. Long term capital gain distributions are derived from gains realized when the Fund sells a security it has owned for more than a year. The Fund may make additional distributions and dividends at other times if its portfolio manager or managers believe doing so may be necessary for the Fund to avoid or reduce taxes. Net investment income/(loss) and net realized gain/(loss) may differ for financial statement and tax purposes.
3. TAX BASIS INFORMATION
Reclassifications: As of September 30, 2013, permanent differences in book and tax accounting were reclassified. The following reclassifications have been made on the Statement of Assets and Liabilities and have no impact on the net asset value of the Fund:
| Paid-in Capital | Accumulated Net Investment Loss | Accumulated Investments | ||||||||||
| ||||||||||||
| $ | (5,020) | $ | 122,006 | $ | (116,986) | |||||||
These differences are primarily attributed to the different tax treatment of stock issuance costs.
| Annual Report | September 30, 2013 | 23 |
Cognios Market Neutral Large Cap Fund | ||
Notes to Financial Statements | September 30, 2013 |
Tax Basis of Investments: As of September 30, 2013, the aggregate cost of investments, gross unrealized appreciation/(depreciation) and net unrealized appreciation for Federal tax purposes was as follows:
Gross unrealized appreciation (excess of value over tax cost) | $ | 996,041 | ||
Gross unrealized depreciation (excess of tax cost over value) | (490,837) | |||
| ||||
Net unrealized appreciation/(depreciation) | $ | 505,204 | ||
| ||||
| ||||
Cost of investments for income tax purposes | $ | 12,873,733 | ||
| ||||
| ||||
The difference between book and tax basis unrealized appreciation (depreciation) for the Fund is attributable primarily to the tax deferral of losses on wash sales.
Components of Distributable Earnings: As of September 30, 2013, the components of distributable earnings on a tax basis were as follows:
Undistributed ordinary income | $ | 263,401 | ||
Net unrealized depreciation on investments and securities sold short | (338,706) | |||
Other cumulative effect of timing differences | (144) | |||
| ||||
Total | $ | (75,449) | ||
| ||||
| ||||
Capital Losses: As of September 30, 2013, the Fund had no accumulated capital loss carryforwards.
Tax Basis of Distributions to Shareholders: The character of distributions made during the period from net investment income or net realized gains may differ from its ultimate characterization for federal income tax purposes. Also, due to the timing of dividend distributions, the fiscal year in which amounts are distributed may differ from the fiscal year in which the income or realized gain were recorded by the Fund. There were no distributions paid by the Fund for the period ended September 30, 2013.
4. SECURITIES TRANSACTIONS
Purchases and sales of securities, excluding short-term securities and securities sold short, during the period ended September 30, 2013, were as follows:
| Purchases of Securities | Proceeds From Sales of Securities | |||||||
| ||||||||
| $ | 30,096,661 | $ | 18,566,373 | |||||
| ||||||||
5. BENEFICIAL SHARE TRANSACTIONS
The capitalization of the Trust consists of an unlimited number of shares of beneficial interest with no par value per share. Holders of the shares of the Fund of the Trust have one vote for each share held and a proportionate fraction of a vote for each fractional share. All shares issued and outstanding are fully paid and are non-assessable, transferable and redeemable at the option of the shareholder. Shares have no pre-emptive rights.
| 24 | www.cogniosfunds.com |
Cognios Market Neutral Large Cap Fund | ||
Notes to Financial Statements | September 30, 2013 |
Transactions in common shares were as follows:
| For the Period Ended September 30, 2013 (a) | ||||
Investor Class | ||||
Beginning of period | 5,000 | |||
Shares sold | 505,279 | |||
Shares redeemed | (4) | |||
|
| |||
Shares outstanding, end of period | 510,275 | |||
|
| |||
Institutional Class | ||||
Beginning of period | 5,000 | |||
Shares sold | 612,556 | |||
Shares redeemed | (1,598) | |||
|
| |||
Shares outstanding, end of period | 615,958 | |||
|
| |||
| (a) | Commenced operations on January 2, 2013. |
The beneficial ownership, either directly or indirectly, of more than 25% of the voting securities of any class of the Fund creates a presumption of control of the Fund under Section 2(a)(9) of the 1940 Act. As of September 30, 2013, the following entities owned beneficially 25% or greater of the Fund’s outstanding shares. The shares are held under omnibus accounts, whereby the transactions of two or more shareholders are combined and carried in the name of the originating broker rather than designated separately.
| Class | Percentage | |||
| ||||
Investor | A Joseph Brandmeyer Trust Agreement | 97.99% | ||
| ||||
Institutional | A Joseph Brandmeyer Trust Agreement | 81.17% | ||
| ||||
6. MANAGEMENT AND RELATED PARTY TRANSACTIONS
Investment Advisory: Cognios Capital, subject to the authority of the Board, is responsible for the overall management and administration of the Fund’s business affairs. The Adviser manages the investments of the Fund in accordance with the Fund’s investment objective, policies and limitations and investment guidelines established by the Adviser and the Board. Pursuant to the Investment Advisory Agreement (the “Advisory Agreement”), the Fund pays the Adviser an annual management fee of 1.50% based on the Fund’s average daily net assets, computed daily and payable monthly.
The Adviser has agreed contractually to waive and/or reimburse fees or expenses in order to limit total annual Fund operating expenses (exclusive of brokerage costs, interest, taxes, dividends, litigation expenses, indemnification amounts, borrowing costs, brokerage expenses and dividend expenses on securities sold short, distribution/12b-1 fees and extraordinary expenses) to 2.00% of the Fund’s average daily net assets for the Investor and Institutional share classes, respectively. This agreement is in effect through January 31, 2015 and may not be terminated or modified prior
| Annual Report | September 30, 2013 | 25 |
Cognios Market Neutral Large Cap Fund | ||
Notes to Financial Statements | September 30, 2013 |
to this date except with the approval of the Board. The Adviser will be permitted to recover expenses it has borne through the agreement described above to the extent that the Fund’s expenses in later periods fall below the annual rates set forth in the relevant agreement. The Fund will not be obligated to pay any such deferred fees and expenses more than three years after the end of the fiscal year(s) in which the fees and expenses were deferred.
For the period ended September 30, 2013, the fee waivers and/or reimbursements were as follows:
| Fees Wavied/Reimbursed by Adviser | ||||
| ||||
Investor Class | $ | (79,516) | ||
Institutional Class | (88,889) | |||
| ||||
TOTAL | $ | (168,405) | ||
| ||||
| ||||
As of September 30, 2013, the balances of recoupable expenses for each class were as follows:
| Expires 2016 | Total | |||||||
| ||||||||
Investor Class | $ | (79,516) | $ | (79,516) | ||||
| ||||||||
Institutional Class | (88,889) | (88,889) | ||||||
| ||||||||
Administrator: ALPS serves as administrator to the Fund. The Fund has agreed to pay expenses incurred in connection with its administrative activities. Pursuant to the Administration, Bookkeeping and Pricing Services Agreement (the “Agreement”), ALPS will provide operational services to the Fund including, but not limited to fund accounting and fund administration and generally assist in the Fund’s operations.
The Fund’s administration fee is accrued on a daily basis, and paid on a monthly basis following the end of the month, based on the greater of (a) an annual total fee of $52,500; or (b) the following basis point fee schedule:
| Average Total Net Assets | Contractual Fee | |
| ||
Between $0-$250M | 0.10% | |
| ||
$250M-$500M | 0.07% | |
| ||
Above $500M | 0.03% | |
Annually thereafter, the parties agree to reevaluate the compensation paid under this Agreement by the Trust on behalf of the Fund to ALPS for the services it performs for the Fund.
The Administrator is reimbursed by the Fund for certain out-of-pocket expenses.
Transfer Agent: ALPS serves as transfer, dividend paying and shareholder servicing agent for the Fund under a Transfer Agency and Services Agreement with the Trust. Under this Agreement, ALPS is paid an annual base fee of $25,000 for the Fund plus fees for open accounts and is reimbursed for certain out-of-pocket expenses.
| 26 | www.cogniosfunds.com |
Cognios Market Neutral Large Cap Fund | ||
Notes to Financial Statements | September 30, 2013 |
Compliance Services: ALPS provides services as the Fund’s Chief Compliance Officer to monitor and test the policies and procedures of the Fund in conjunction with requirements under Rule 38a-1 under the 1940 Act under the Chief Compliance Officer Services Agreement. Under this Agreement, ALPS is paid an annual base fee of $20,000 for services performed on behalf of the Fund and is reimbursed for certain out-of-pocket expenses.
Principal Financial Officer: ALPS receives an annual base fee of $10,000 for providing Principal Financial Officer (“PFO”) services to the Fund and is reimbursed for certain out-of-pocket expenses.
Distributor: ADI acts as the distributor of the Fund’s shares pursuant to a Distribution Agreement with the Trust. Shares are sold on a continuous basis by ADI as agent for the Fund, and ADI has agreed to use its best efforts to solicit orders for the sale of the Fund’s shares, although it is not obliged to sell any particular amount of shares. ADI is not entitled to any compensation for its services as the Distributor. ADI is registered as a broker-dealer with the Securities and Exchange Commission.
The Fund has adopted a Distribution and Services Plan (the “Plan”) pursuant to Rule 12b-1 of the 1940 Act for its Investor Class shares. The Plan allows the Fund to use Investor Class assets to pay fees in connection with the distribution and marketing of Investor Class shares and/or the provision of shareholder services to Investor Class shareholders. The Plan permits payment for services in connection with the administration of plans or programs that use Investor Class shares of the Fund, if any, as their funding medium and for related expenses. The Plan permits the Fund to make total payments at an annual rate of up to 0.25% of the Fund’s average daily net assets attributable to its Investor Class shares. Plan fees are shown as distribution and service fees on the Statement of Operations.
7. TRUSTEES
As of September 30, 2013, there were four Trustees, three of whom are not “interested persons” (within the meaning of the 1940 Act) of the Trust (the “Independent Trustees”). The Independent Trustees of the Trust receive a quarterly retainer of $2,000, plus $1,000 for each regular Board or Committee meeting attended, $1,000 for each special telephonic Board or Committee meeting attended and $1,000 for each special in-person Board meeting attended. The Independent Trustees are also reimbursed for all reasonable out-of-pocket expenses relating to attendance at meetings and for meeting-related expenses. Officers of the Trust and Trustees who are interested persons of the Trust receive no salary or fees from the Trust.
8. INDEMNIFICATIONS
Under the Trust’s organizational documents, its officers and Trustees are indemnified against certain liability arising out of the performance of their duties to the Trust. Additionally, in the normal course of business, the Trust enters into contracts with service providers that may contain general indemnification clauses which may permit indemnification to the extent permissible under applicable law. The Trust’s maximum exposure under these arrangements is unknown, as this would involve future claims that may be made against the Trust that have not yet occurred.
| Annual Report | September 30, 2013 | 27 |
Cognios Market Neutral Large Cap Fund | ||
Notes to Financial Statements | September 30, 2013 |
9. NEW ACCOUNTING PRONOUNCEMENTS
In June 2013, the Financial Accounting Standards Board (the “FASB”) issued Accounting Standards Update (“ASU”) No. 2013-08, Financial Services-Investment Companies (Topic 946): Amendments to the Scope, Measurement, and Disclosure Requirements. The FASB standard identifies characteristics a company must assess to determine whether it is considered an investment company for financial reporting purposes. This ASU is effective for fiscal years beginning after December 15, 2013. The Fund believes the adoption of this ASU will not have a material impact on its financial statements.
| 28 | www.cogniosfunds.com |
Cognios Market Neutral Large Cap Fund | ||
Report of Independent Registered Public Accounting Firm |
To the Board of Trustees and Shareholders of
Cognios Market Neutral Large Cap Fund
We have audited the accompanying statement of assets and liabilities, of Cognios Market Neutral Large Cap Fund (the “Fund”), a series of ALPS Series Trust (the “Trust”), as of September 30, 2013, including the portfolio of investments and the related statements of operations, changes in net assets, cash flows, and financial highlights for the period January 2, 2013 (Commencement of Operations) through September 30, 2013. These financial statements and financial highlights are the responsibility of the Fund’s management. Our responsibility is to express an opinion on these financial statements and financial highlights based on our audit.
We conducted our audit in accordance with the standards of the Public Company Accounting Oversight Board (United States). Those standards require that we plan and perform the audit to obtain reasonable assurance about whether the financial statements and financial highlights are free of material misstatement. An audit includes examining, on a test basis, evidence supporting the amounts and disclosures in the financial statements. Our procedures included confirmation of securities owned as of September 30, 2013 by correspondence with the custodian and brokers. An audit also includes assessing the accounting principles used and significant estimates made by management, as well as evaluating the overall financial statement presentation. We believe that our audit provides a reasonable basis for our opinion.
In our opinion, the financial statements and financial highlights referred to above present fairly, in all material respects, the financial position of Cognios Market Neutral Large Cap Fund as of September 30, 2013, and the results of its operations, the changes in its net assets, its cash flows and the financial highlights for the period January 2, 2013 (Commencement of Operations) through September 30, 2013, in conformity with accounting principles generally accepted in the United States of America.
Rothstein Kass
Walnut Creek, California
November 22, 2013
| Annual Report | September 30, 2013 | 29 |
Cognios Market Neutral Large Cap Fund | ||
| September 30, 2013 (Unaudited) |
1. PROXY VOTING POLICIES AND VOTING RECORD
A description of the policies and procedures that the Fund uses to determine how to vote proxies relating to portfolio securities is available without charge, upon request, (1) by calling the Fund (toll-free) at 1-855-254-6467 or (2) on the Securities and Exchange Commission’s the (“SEC”) website at http://www.sec.gov. Information regarding how the Fund voted proxies relating to portfolio securities during the most recent 12-month period ended June 30, 2013 is available (i) without charge, upon request, by calling the Fund (toll-free) at 1-855-254-6467 or (2) on the SEC’s website at http://www.sec.gov.
2. PORTFOLIO HOLDINGS
The Fund files its complete schedule of portfolio holdings with the SEC for the first and third quarters of each fiscal year on Form N-Q. The Fund’s Form N-Q is available on the SEC website at http://www.sec.gov. The Fund’s Form N-Q may be reviewed and copied at the SEC’s Public Reference Room in Washington, D.C., and information on the operation of the Public Reference Room may be obtained by calling 1-800-SEC-0330.
| 30 | www.cogniosfunds.com |
Cognios Market Neutral Large Cap Fund | ||
| September 30, 2013 (Unaudited) |
INDEPENDENT TRUSTEES
Name, Birth Year & Address* | Position(s) Held with Fund | Term of Office and Length of Time Served | Principal Occupation(s) During Past 5 Years** | Number of Funds in Fund Complex Overseen by | Other Directorships Held by Trustee During Past 5 Years** | |||||
| ||||||||||
Cheryl Burgermeister Birth year: 1951 | Trustee | Ms. Burgermeister was elected to the Board by the sole shareholder of the Trust on October 30, 2012. | Ms. Burgermeister is Trustee and Audit Committee Chair of The Select Sector SPDR Trust (October 1998 to present), Trustee of Russell Investment Funds (September 2012 to present) and Trustee, Treasurer and Finance Committee Chair of the Portland Community College Foundation (January 2001 to present). She also served as Trustee and Audit Committee Chair of E*Trade Funds (March 2004 to March 2010), Trustee of Zero Gravity Internet Fund (May 2000 to December 2001), Director and Treasurer of Crabbe Huson Family of Funds (1998 to 1999) and Director, Chief Financial Officer and Treasurer of The Crabbe Huson Group, Inc. (July 1987 to October 1999). From 1982 to 1986, Ms. Burgermeister was Supervising Senior Accountant at KPMG Peat Marwick. Ms. Burgermeister a licensed Certified Public Accountant and a member of the Oregon Society of Certified Public Accountants. | 2 | Ms. Burgermeister is a Trustee and Audit Committee Chair of The Select Sector SPDR Trust (9 ETFs) and Trustee of Russell Investment Funds (42 funds). | |||||
| ||||||||||
| Annual Report | September 30, 2013 | 31 |
Cognios Market Neutral Large Cap Fund | ||
Trustees and Officers | September 30, 2013 (Unaudited) |
Name, Birth Year & Address* | Position(s) Held with Fund | Term of Office and Length of Time Served | Principal Occupation(s) During Past 5 Years** | Number of Funds in Fund Complex Overseen by | Other Directorships Held by Trustee During Past 5 Years** | |||||
| ||||||||||
J. Wayne Hutchens Birth year: 1944 | Trustee | Mr. Hutchens was elected to the Board by the sole shareholder of the Trust on October 30, 2012. | Mr. Hutchens is currently retired. From April 2006 to December 2012, he served as President and CEO of the University of Colorado (CU) Foundation and from April 2009 to December 2012, he was Executive Director of the CU Real Estate Foundation. Mr. Hutchens is also Trustee of the Denver Museum of Nature and Science (2000 to present), Director of AMG National Trust Bank (June 2012 to present) and Trustee of Children’s Hospital Colorado (May 2012 to present). Prior to these positions, Mr. Hutchens spent 29 years in the banking industry, retiring as Chairman of Chase Bank Colorado. | 2 | None. | |||||
| ||||||||||
| 32 | www.cogniosfunds.com |
Cognios Market Neutral Large Cap Fund | ||
Trustees and Officers | September 30, 2013 (Unaudited) |
Name, Birth Year & Address* | Position(s) Held with Fund | Term of Office and Length of Time Served | Principal Occupation(s) During Past 5 Years** | Number of Funds in Fund Complex Overseen by | Other Directorships Held by Trustee During Past 5 Years** | |||||
| ||||||||||
Patrick Seese Birth year: 1971 | Trustee | Mr. Seese was elected to the Board by the sole shareholder of the Trust on October 30, 2012. | Mr. Seese is an owner and a Managing Director of Integris Partners, a middle-market investment banking firm serving closely-held companies, financial sponsors and public companies (February 2008 to present). Prior to this, Mr. Seese was a Managing Director of Headwaters MB, a middle-market investing banking firm (December 2003 to February 2008). Prior to that, Mr. Sesse worked in Credit Suisse First Boston’s Mergers and Acquisitions Group and served as Head of Corporation Development, Katy Industries, a publicly traded industrial and consumer products company and at Deloitte & Touche LLP, where he began his career in 1994. | 2 | None. | |||||
| ||||||||||
| Annual Report | September 30, 2013 | 33 |
Cognios Market Neutral Large Cap Fund | ||
Trustees and Officers | September 30, 2013 (Unaudited) |
INTERESTED TRUSTEE AND OFFICERS
Name, Birth Year & Address* | Position(s) Held with Fund | Term of Office and Length of Time Served | Principal Occupation(s) During Past 5 Years** | Number of Funds in Fund Complex Overseen by | Other Directorships Held by Trustee During Past 5 Years** | |||||
| ||||||||||
Jeremy O. May Birth year: 1970 | Trustee, Chairman and President | Mr. May was elected Trustee, Chairman and President at the October 30, 2012 meeting of the Board of Trustees. | Mr. May joined ALPS in 1995 and is currently President of ALPS Fund Services, Inc. and Executive Vice President and Director of ALPS Holdings, Inc., ALPS Advisors, Inc. and ALPS Distributors, Inc. Because of his positions with these entities, Mr. May is deemed an affiliate of the Trust as defined under the 1940 Act. Mr. May currently serves as Treasurer of Clough Global Allocation Fund, Clough Global Equity Fund, Clough Global Opportunities Fund, Mr. May is also Chairman and Trustee of the Reaves Utility Income Fund. Mr. May is currently Vice Chair of the Board of Directors of the University of Colorado Foundation. | 2 | Mr. May is Chairman and Trustee of the Reaves Utility Income Fund (1 fund). | |||||
| ||||||||||
| 34 | www.cogniosfunds.com |
Cognios Market Neutral Large Cap Fund | ||
Trustees and Officers | September 30, 2013 (Unaudited) |
OFFICERS
Name, Birth Year & Address* | Position(s) Held with Fund | Term of Office and Length of Time Served | Principal Occupation(s) During Past 5 Years** | |||
| ||||||
Kimberly R. Storms Birth year: 1972 | Treasurer | Ms. Storms was elected Treasurer of the Trust at the October 30, 2012 meeting of the Board of Trustees. | Ms. Storms is Senior Vice President -Director of Fund Administration of ALPS. Ms. Storms joined ALPS in 1998 as Assistant Controller. Because of her position with ALPS, Ms. Storms is deemed an affiliate of the Trust as defined under the 1940 Act. Ms. Storms is also Treasurer of Financial Investors Trust, BPV Family of Funds, Liberty All-Star Equity Fund and Liberty All-Star Growth Fund, Inc.; She serves as Chief Financial Officer of Arbitrage Funds. | |||
| ||||||
JoEllen L. Legg Birth year: 1961 | Secretary | Ms. Legg was elected Secretary of the Trust at the October 30, 2012 meeting of the Board of Trustees. | Ms. Legg joined ALPS in October 2007 and is Vice President, Assistant General Counsel of ALPS, ALPS Advisors, Inc., ALPS Distributors, Inc. and ALPS Portfolio Solutions Distributor, Inc. Prior to joining ALPS, Ms. Legg served as Senior Counsel - Law (Corporate & Securities) for Adelphia Communications Corporation (February 2005 –March 200 7). Prior to this, Ms. Legg held associate positions at Fried Frank Harris Shriver & Jacobson LLP (1998 - 2004) and at Patton Boggs LLP (2004 -2005). Because of her position with ALPS, Ms. Legg is deemed an affiliate of the Trust as defined under the 1940 Act. Ms. Legg is also the Assistant Secretary of the Stone Harbor Investment Funds, Stone Harbor Emerging Markets Income Fund, Stone Harbor Emerging Markets Total Income Fund, James Advantage Funds and WesMark Funds. | |||
| ||||||
Jill Kerschen Birth year: 1975 | Assistant Treasurer | Ms. Kerchen was elected Assistant Treasurer of the Trust at the November 22, 2013 meeting of the Board of Trustees. | Ms. Kerschen joined ALPS in July 2013 and is Fund Controller of ALPS. Prior to joining ALPS, Ms. Kerschen worked for Great-West Financial (2001-2013) and OppenheimerFunds (1998-2000). Because of her position with ALPS, Ms. Kerschen is deemed an affiliate of the Trust as defined under the 1940 Act. Ms. Kerschen is also the Assistant Treasurer of Clough Global Allocation Fund, Clough Global Equity Fund, Clough Global Opportunities Fund and Westcore Funds. | |||
| ||||||
| Annual Report | September 30, 2013 | 35 |
Cognios Market Neutral Large Cap Fund | ||
Trustees and Officers | September 30, 2013 (Unaudited) |
Name, Birth Year & Address* | Position(s) Held with Fund | Term of Office and Length of Time Served | Principal Occupation(s) During Past 5 Years** | |||
| ||||||
Lucas Foss Birth year: 1977 | Chief Compliance Officer (“CCO”) | Mr. Foss was elected CCO of the Trust at the October 30, 2012 meeting of the Board of Trustees. | Mr. Foss joined ALPS in November 2004 and is Deputy Chief Compliance Officer of ALPS. Prior to his current role, Mr. Foss served as a Compliance Manager at ALPS (January 2010 - August 2012), and a Senior Compliance Analyst at ALPS (November 2004 – May 2006). Before joining ALPS, Mr. Foss held positions at Bisys Hedge Fund Services and Deutsche Asset Management. Because of his position with ALPS, Mr. Foss is deemed an affiliate of the Trust as defined under the 1940 Act. Mr. Foss is also CCO of Caldwell & Orkin Funds, Whitebox Mutual Funds, Boulder Growth & Income Fund, Boulder Total Return Fund, the Denali Fund, Wakefield Alternative Series Trust and The Principal Real Estate Income Fund. | |||
| ||||||
| * | All communications to Trustees and Officers may be directed to ALPS Series Trust c/o 1290 Broadway, Suite 1100, Denver, CO 80203. |
| ** | Except as otherwise indicated, each individual has held the office shown or other offices in the same company for the last five years. |
| *** | The Fund Complex currently consists of two series of the Trust and any other investment companies for which Cognios Capital, LLC provides investment advisory services, currently none. |
Additional information about members of the Board of Trustees and officers of the Trust is available in the Statement of Additional Information and is available, without charge, upon request, by calling the Fund (toll-free) at 1-855-254-6467.
| 36 | www.cogniosfunds.com |

| 1 | ||||
| 3 | ||||
| 5 | ||||
| 6 | ||||
| 12 | ||||
| 13 | ||||
| 14 | ||||
| 15 | ||||
| 16 | ||||
| 28 | ||||
| 29 | ||||
| 33 | ||||
GKE Asian Opportunities Fund | Shareholder Letter | |
September 30, 2013 (Unaudited) |
Dear Shareholder,
Since the Fund’s inception on August 5, 2013, which also constitutes year to date performance, the GKE Asian Opportunities Fund’s Institutional Shares have delivered a net return of 3.80%. Despite a selloff in the fixed income book, security selection in equities produced outperformance for the period relative to the Fund’s benchmark.
The Fund’s current investment themes for Asia are three-fold, outlined here.
First, the portfolio team believes current interest rate policies will remain in place for longer than people expect; and the big question is whether this is inflationary, or deflationary, for the global economy. At first glance, most investors would probably assume that too low a cost of capital leads to high money supply growth and, from there, to inflation. But what if, simultaneously, too low a cost of capital encourages zombie companies to stay alive, hereby lowering the returns on capital for everyone? Or what if no-cost capital encourages companies to replace ever more workers with robots and machinery, hereby triggering long-term unemployment amongst the unskilled and semi-skilled workforce? Or, worse yet, what if the zero cost of money encourages companies to leverage up in order to buy out their competitors and/or their own shares, creating an economy with more leverage, and more concentration of asset ownership, thereby leaving it prone to trip at the slightest outside shock? For all these reasons, it seems that zero-interest rate policies could actually end up being more deflationary, and thus self-sustaining, than most expect.
Second, the rapid internationalization of the renminbi, is increasingly allowing Chinese exports to move up the value chain. Combine this with China’s growing ability to finance its emerging market customers’ purchase of machine tools, excavators, roads, oil-rigs, ships etc… and we believe China is increasingly allowing the rest of the emerging world to industrialize ‘on the cheap’. If nothing else, this means that capitalism’s deflationary ability to produce more goods at cheaper costs is alive and well.
Lastly, commodity prices are falling. The Commodity Research Bureau (CRB) Index is flirting with a three year low while oil price stands at a four month low. This is terrific news for a number of economies whose large current account deficits, themselves typically the direct result of high commodity prices, have, in recent months, worried investors (whether India, Indonesia etc…). At the same time, we believe it is bad news for a lot of emerging market indices where commodity-related equities are simply too large a component in the index. As more commodity output continues to come on stream, commodity prices will likely continue to drag most countries’ inflation data lower, and will also rebalance trade data that currently seems unbalanced.
Putting it all together, it seems unlikely to us that the current global deflationary trends will reverse in the coming quarters. Instead, investors will likely return to chasing steady yield wherever that may be found; in fact, we may soon be back to investors dreaming of portfolios that deliver equity-like returns with bond-like volatility. Today, this is what we aim to achieve in the GKE Asian Opportunities Fund. In our opinion, the opportunities in yield delivering investment vehicles are still there.

Louis-Vincent Gave
CEO and Portfolio Manager, GaveKal Capital Limited
Annual Report | September 30, 2013 |
1 |
GKE Asian Opportunities Fund | Shareholder Letter | |
September 30, 2013 (Unaudited) |
The views and information discussed in this commentary are as of the date of publication, are subject to change, and may not reflect the writer’s current views. The views expressed represent an assessment of market conditions at a specific point in time, are opinions only and should not be relied upon as investment advice regarding a particular investment or markets in general. Such information does not constitute a recommendation to buy or sell specific securities or investment vehicles. It should not be assumed that any investment will be profitable or will equal the performance of the fund(s) or any securities or any sectors mentioned herein. The subject matter contained herein has been derived from several sources believed to be reliable and accurate at the time of compilation. GaveKal does not accept any liability for losses either direct or consequential caused by the use of this information
Thomson Reuters/Jefferies CRB Total Return Index – is comprised of a basket of 19 commodities, with 39% allocated to energy contracts; 41% to agriculture; 7% to precious metals and 13% to industrial metals. The index acts as a representative indicator or today’s global commodity markets. The index is not actively managed and does not reflect any deductions for fees, expenses or taxes. An investor may not invest directly in an index.
Emerging markets are often less stable politically and economically than developed markets such as the United States and investing in emerging markets involves different and greater risks. There may be less publicly available information about companies in emerging markets. The stock exchanges and brokerage industries of emerging markets do not have the level of government oversight as do those in the United States. Securities markets of such countries are substantially smaller, less liquid and more volatile than securities markets in the United States. Emerging markets may be especially prone to currency-related risks.
Past performance does not guarantee future results.
2 |
www.gkefund.com |
GKE Asian Opportunities Fund | Portfolio Update | |
September 30, 2013 (Unaudited) |
Performance (for the period ended September 30, 2013)
| One Month | Since Inception* | |||||||
GKE Asian Opportunities Fund - NAV | 3.39% | 3.80% | ||||||
MSCI AC Asia Pacific TR USD(a) | 6.94% | 3.21% |
| * | Fund’s inception date is August 5, 2013. |
| (a) | The MSCI Asia Pacific Index is designed to measure the equity market performance of the developed and emerging markets in the Pacific region. The Index consists of the following 12 developed and emerging market countries: Australia, China, Hong Kong, Indonesia, Japan, Korea, Malaysia, New Zealand, Philippines, Singapore, Taiwan, and Thailand. |
Indexes are not actively managed and do not reflect deduction for fees, expenses or taxes. An investor cannot invest directly into an index.
The returns shown above do not reflect the deduction of taxes a shareholder would pay on Fund distributions or redemption of Fund shares.
The Fund is new and has a limited operating history.
The performance data quoted above represents past performance. Past performance is not a guarantee of future results. Investment return and value of the Fund shares will fluctuate so that an investor’s shares, when sold or redeemed, may be worth more or less than their original cost. Performance may be lower or higher than performance data quoted. Fund performance current to the most recent month-end is available by calling 1-855-331-6240 or by visiting www.gkefund.com.
Performance of $10,000 Initial Investment (for the period ended September 30, 2013)
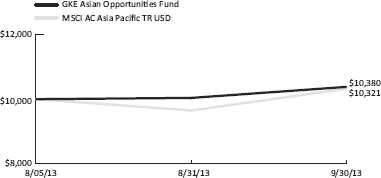
The graph shown above represents historical performance of a hypothetical investment of $10,000 in the Fund since inception. Past performance does not guarantee future results. All returns reflect reinvested dividends, but do not reflect the deduction of taxes that a shareholder would pay on Fund distributions or the redemption of Fund shares.
Annual Report | September 30, 2013 |
3 |
GKE Asian Opportunities Fund | Portfolio Update | |
September 30, 2013 (Unaudited) |
Sector Allocation (as a % of Net Assets)*
Financials | 22.93% | |||||
Government | 16.72% | |||||
Consumer, Cyclical | 8.18% | |||||
Utilities | 8.12% | |||||
Industrial | 6.35% | |||||
Communications | 3.77% | |||||
Technology | 1.94% | |||||
Diversified | 1.93% | |||||
Basic Materials | 1.01% | |||||
Software | 0.88% | |||||
Computers | 0.81% | |||||
Consumer, Non-cyclical | 0.59% | |||||
Cash, Cash Equivalents, & Other Net Assets | 26.77% | |||||
| ||||||
TOTALS | 100.00% | |||||
| ||||||
Top 10 Long Positions (as a % of Net Assets)* | ||||||
Singapore Government Bond | 16.72% | |||||
Agricultural Development Bank of China | 6.57% | |||||
Cheung Kong Infrastructure Holdings Ltd. | 2.79% | |||||
Guangdong Investment Ltd. | 2.42% | |||||
Metro Pacific Investments Corp. | 2.36% | |||||
Techtronic Industries Co. | 2.25% | |||||
ENN Energy Holdings Ltd. | 2.24% | |||||
Panasonic Corp. | 2.17% | |||||
Megaworld Corp. | 2.15% | |||||
Agricultural Bank of China Ltd. | 1.95% | |||||
| * | Holdings are subject to change. Tables present indicative values only. |
4 |
www.gkefund.com |
GKE Asian Opportunities Fund | Disclosure of Fund Expenses | |
September 30, 2013 (Unaudited) |
As a shareholder of the GKE Asian Opportunity Fund (the “Fund”), you incur two types of costs: (1) transaction costs, including applicable redemption fees; and (2) ongoing costs, including management fees and other Fund expenses. The following example is intended to help you understand your ongoing costs (in dollars) of investing in the Fund and to compare these costs with the ongoing costs of investing in other mutual funds. The example is based on an investment of $1,000 invested on 4/1/2013 and held through 9/30/2013.
Actual Expenses. The first line of the table below provides information about actual account values and actual expenses. You may use the information in this line, together with the amount you invested, to estimate the expenses that you paid over the period. Simply divide your account value by $1,000 (for example, an $8,600 account value divided by $1,000 = 8.6), then multiply the result by the number in the first line under the heading “Expenses Paid During Period (4/1/2013 – 9/30/2013)” to estimate the expenses you paid on your account during this period.
Hypothetical Example for Comparison Purposes. The second line of the table below provides information about hypothetical account values and hypothetical expenses based on the Fund’s actual expense ratio and an assumed rate of return of 5% per year before expenses, which is not the Fund’s actual return. The hypothetical account values and expenses may not be used to estimate the actual ending account balance or expenses you paid for the period. You may use this information to compare the ongoing costs of investing in the Fund and other mutual funds. To do so, compare this 5% hypothetical example with the 5% hypothetical examples that appear in the shareholder reports of the other mutual funds. Please note that the expenses shown in the table are meant to highlight your ongoing Fund costs only and do not reflect any transactional costs, such as redemption fees. Therefore, the second line of the table below is useful in comparing ongoing costs only and may not help you determine the relative total costs of owning different funds. In addition, if these transactional costs were included, your costs would have been higher.
Beginning Account 4/1/2013 | Ending Account 9/30/2013 | Expense Ratio(a) | Expenses Paid During period 4/1/2013 - 9/30/2013(b) | |||||||||||
Actual(c) | $ 1,000.00 | $ 1,038.00 | 1.81% | $ 2.83 | ||||||||||
Hypothetical | $ 1,000.00 | $ 1,015.99 | 1.81% | $ 9.15 | ||||||||||
| (a) | The Fund’s expense ratios have been annualized based on the Fund’s most recent fiscal half-year expenses. |
| (b) | Expenses are equal to the Fund’s annualized expense ratio, multiplied by the average account value over the period, multiplied by the number of days in the most recent fiscal half-year 183/365. |
| (c) | The actual expenses paid during the period is based on the commencement of operations on August 5, 2013. |
Annual Report | September 30, 2013 |
5 |
GKE Asian Opportunities Fund | Portfolio of Investments | |
September 30, 2013 |
| Shares | Value (Note 2) | |||||||
| ||||||||
COMMON STOCKS (48.25%) | ||||||||
BASIC MATERIALS (1.01%) | ||||||||
Iron & Steel (1.01%) | ||||||||
Fortescue Metals Group Ltd. | 5,674 | $ | 25,143 | |||||
|
| |||||||
TOTAL BASIC MATERIALS | 25,143 | |||||||
|
| |||||||
COMMUNICATIONS (3.77%) | ||||||||
Internet (1.48%) | ||||||||
Tencent Holdings Ltd. | 700 | 36,715 | ||||||
|
| |||||||
Telecommunications (2.29%) | ||||||||
KDDI Corp. | 300 | 15,382 | ||||||
Softbank Corp. | 600 | 41,447 | ||||||
|
| |||||||
| 56,829 | ||||||||
|
| |||||||
TOTAL COMMUNICATIONS | 93,544 | |||||||
|
| |||||||
CONSUMER, CYCLICAL (8.18%) | ||||||||
Auto Manufacturers (3.04%) | ||||||||
Honda Motor Co. Ltd. | 700 | 26,599 | ||||||
Mazda Motor Corp.(a) | 1,000 | 4,446 | ||||||
Toyota Motor Corp. | 700 | 44,651 | ||||||
|
| |||||||
| 75,696 | ||||||||
|
| |||||||
Entertainment (0.60%) | ||||||||
Genting Singapore PLC | 13,000 | 14,870 | ||||||
|
| |||||||
Home Furnishings (2.17%) | ||||||||
Panasonic Corp. | 5,600 | 54,009 | ||||||
|
| |||||||
Retail (2.37%) | ||||||||
GOME Electrical Appliances Holding Ltd. | 141,000 | 17,998 | ||||||
Puregold Price Club, Inc. | 42,900 | 41,087 | ||||||
|
| |||||||
| 59,085 | ||||||||
|
| |||||||
TOTAL CONSUMER, CYCLICAL | 203,660 | |||||||
|
| |||||||
See Notes to Financial Statements. | ||
6 |
www.gkefund.com |
GKE Asian Opportunities Fund | Portfolio of Investments | |
September 30, 2013 |
| Shares | Value (Note 2) | |||||||
| ||||||||
CONSUMER, NON-CYCLICAL (0.59%) | ||||||||
Food (0.59%) | ||||||||
Seven & I Holdings Co. Ltd. | 400 | $ | 14,568 | |||||
|
| |||||||
TOTAL CONSUMER, NON-CYCLICAL | 14,568 | |||||||
|
| |||||||
DIVERSIFIED (1.93%) | ||||||||
Holding Companies-Divers (1.93%) | ||||||||
Hutchison Whampoa Ltd. | 4,000 | 47,912 | ||||||
|
| |||||||
TOTAL DIVERSIFIED | 47,912 | |||||||
|
| |||||||
FINANCIAL (16.36%) | ||||||||
Banks (12.76%) | ||||||||
Agricultural Bank of China Ltd. | 105,000 | 48,331 | ||||||
BDO Unibank, Inc. | 21,770 | 37,500 | ||||||
China Construction Bank Corp. | 61,000 | 46,954 | ||||||
Industrial & Commercial Bank of China Ltd. | 69,000 | 48,130 | ||||||
Metropolitan Bank & Trust | 14,100 | 26,879 | ||||||
Mitsubishi UFJ Financial Group, Inc. | 4,900 | 31,256 | ||||||
Mizuho Financial Group, Inc. | 6,700 | 14,519 | ||||||
Sumitomo Mitsui Financial Group, Inc. | 700 | 33,790 | ||||||
Sumitomo Mitsui Trust Holdings, Inc. | 6,000 | 29,605 | ||||||
|
| |||||||
| 316,964 | ||||||||
|
| |||||||
Diversified Financial Services (0.28%) | ||||||||
Nomura Holdings, Inc. | 900 | 7,004 | ||||||
|
| |||||||
Real Estate (3.32%) | ||||||||
Country Garden Holdings Co. Ltd. | 39,000 | 24,941 | ||||||
Megaworld Corp. | 712,000 | 53,310 | ||||||
Poly Property Group Co. Ltd. | 7,000 | 4,206 | ||||||
|
| |||||||
| 82,457 | ||||||||
|
| |||||||
TOTAL FINANCIAL | 406,425 | |||||||
|
| |||||||
INDUSTRIAL (6.35%) | ||||||||
Engineering & Construction (2.79%) | ||||||||
Cheung Kong Infrastructure Holdings Ltd. | 10,000 | 69,303 | ||||||
|
| |||||||
See Notes to Financial Statements. | ||
Annual Report | September 30, 2013 |
7 |
GKE Asian Opportunities Fund | Portfolio of Investments | |
September 30, 2013 |
| Shares | Value (Note 2) | |||||||
| ||||||||
INDUSTRIAL (continued) | ||||||||
Hand & Machine Tools (2.25%) | ||||||||
Techtronic Industries Co. | 21,500 | $ | 55,996 | |||||
|
| |||||||
Machinery-Diversified (0.58%) | ||||||||
Kubota Corp. | 1,000 | 14,416 | ||||||
|
| |||||||
Shipbuilding (0.73%) | ||||||||
SembCorp Marine Ltd. | 5,000 | 18,054 | ||||||
|
| |||||||
TOTAL INDUSTRIAL | 157,769 | |||||||
|
| |||||||
TECHNOLOGY (1.94%) | ||||||||
Computers (1.94%) | ||||||||
Lenovo Group Ltd. | 46,000 | 48,100 | ||||||
|
| |||||||
TOTAL TECHNOLOGY | 48,100 | |||||||
|
| |||||||
UTILITIES (8.12%) | ||||||||
Electric (1.09%) | ||||||||
Manila Electric Co. | 4,140 | 27,194 | ||||||
|
| |||||||
Gas (2.24%) | ||||||||
ENN Energy Holdings Ltd. | 10,000 | 55,571 | ||||||
|
| |||||||
Water (4.79%) | ||||||||
Guangdong Investment Ltd. | 70,000 | 60,109 | ||||||
Metro Pacific Investments Corp. | 566,000 | 58,498 | ||||||
|
| |||||||
| 118,607 | ||||||||
|
| |||||||
TOTAL UTILITIES | 201,372 | |||||||
|
| |||||||
TOTAL COMMON STOCKS (Cost $1,152,619) | 1,198,493 | |||||||
|
| |||||||
See Notes to Financial Statements. | ||
8 |
www.gkefund.com |
GKE Asian Opportunities Fund | Portfolio of Investments | |
September 30, 2013 |
| Shares | Value (Note 2) | |||||||||||
| ||||||||||||
PARTICIPATION NOTES (1.69%) | ||||||||||||
COMPUTERS (0.81%) | ||||||||||||
Computer Services (0.81%) | ||||||||||||
Tata Consultancy Services, (Loan Participation Notes issued by Citigroup Global Markets Holdings Inc.),(a) |
| 656 | $ | 20,200 | ||||||||
|
| |||||||||||
TOTAL COMPUTERS | 20,200 | |||||||||||
|
| |||||||||||
SOFTWARE (0.88%) | ||||||||||||
Application Software (0.88%) | ||||||||||||
HCL Technologies Ltd, (Loan Participation Notes issued by Citigroup Global Markets Holdings Inc.), |
| 1,250 | 21,708 | |||||||||
|
| |||||||||||
TOTAL SOFTWARE | 21,708 | |||||||||||
|
| |||||||||||
TOTAL PARTICIPATION NOTES (Cost $37,563) | 41,908 | |||||||||||
|
| |||||||||||
| Currency | Principal Amount | Value (Note 2) | ||||||||||
| ||||||||||||
CORPORATE BONDS (6.57%) | ||||||||||||
Agricultural Development Bank of China | HKD | 1,000,000 | 163,302 | |||||||||
|
| |||||||||||
TOTAL CORPORATE BONDS (Cost $163,070) | 163,302 | |||||||||||
|
| |||||||||||
GOVERNMENT BONDS (16.72%) | ||||||||||||
Singapore Government Bond | SGD | 500,000 | 415,388 | |||||||||
|
| |||||||||||
TOTAL GOVERNMENT BONDS (Cost $396,472) | 415,388 | |||||||||||
|
| |||||||||||
See Notes to Financial Statements. | ||
Annual Report | September 30, 2013 |
9 |
GKE Asian Opportunities Fund | Portfolio of Investments | |
September 30, 2013 |
| 7-Day Yield | Shares | Value (Note 2) | ||||||||
| ||||||||||
SHORT TERM INVESTMENTS (13.76%) | ||||||||||
Blackrock Liquidity Temporary Fund, Investor Class | 0.035608 | % | 341,729 | $ | 341,729 | |||||
|
| |||||||||
TOTAL SHORT TERM INVESTMENTS (Cost $341,729) | 341,729 | |||||||||
|
| |||||||||
TOTAL INVESTMENTS (86.99%) (Cost $2,091,453) | $ | 2,160,820 | ||||||||
Other Assets In Excess Of Liabilities (13.01%) | 323,077 (b) | |||||||||
|
| |||||||||
NET ASSETS (100.00%) | $ | 2,483,897 | ||||||||
|
| |||||||||
| (a) | Non-Income Producing Security. |
| (b) | Includes cash which is being held as collateral for futures contracts. |
Common Abbreviations:
Ltd. - Limited.
PLC - Public Limited Company.
Currency Abbreviations:
HKD - Hong Kong Dollar
JPY - Japanese Yen
SGD - Singapore Dollar
For Fund compliance purposes, the Fund’s industry classifications refer to any one or more of the industry sub-classifications used by one or more widely recognized market indexes or ratings group indexes, and/or as defined by Fund management. This definition may not apply for purposes of this report, which may combine industry sub-classifications for reporting ease. Industries are shown as a percent of net assets.
See Notes to Financial Statements. | ||
10 |
www.gkefund.com |
GKE Asian Opportunities Fund | Portfolio of Investments | |
September 30, 2013 |
OUTSTANDING FORWARD FOREIGN CURRENCY CONTRACTS
Foreign Currency | Contracted Amount* | Purchase/Sale Contract | Settlement Date | Current Value | Unrealized Appreciation/ (Depreciation) | |||||||||
| ||||||||||||||
JPY | 36,296,630 | Sale | 10/03/2013 | $ | 369,268 | $ | 732 | |||||||
JPY | 28,500,000 | Sale | 11/05/2013 | 290,003 | 1,170 | |||||||||
|
| |||||||||||||
| $ | 1,902 | |||||||||||||
|
| |||||||||||||
JPY | 2,800,000 | Purchase | 10/07/2013 | $ | 28,487 | $ | (295) | |||||||
JPY | 2,000,000 | Purchase | 10/15/2013 | 20,349 | (350) | |||||||||
|
| |||||||||||||
| $ | (645) | |||||||||||||
|
| |||||||||||||
* The contracted amount is stated in the currency in which the security is denominated.
FUTURES CONTRACTS
| Description | Position | Contracts | Expiration Date | Underlying Face Amount at Value (Note 2) | Unrealized Appreciation | |||||||||
| ||||||||||||||
Hang Seng China Futures | Long | 5 | 10/31/13 | $ | 333,134 | $ | (8,179) | |||||||
Nikkei 225 | Long | 3 | 12/13/13 | 221,654 | 1,513 | |||||||||
|
| |||||||||||||
| $ | 554,788 | $ | (6,666) | |||||||||||
|
| |||||||||||||
See Notes to Financial Statements. | ||
Annual Report | September 30, 2013 |
11 |
GKE Asian Opportunities Fund | Statement of Assets and Liabilities | |
September 30, 2013 |
| ||||
ASSETS | ||||
Investments, at value (Cost $2,091,453) | $ | 2,160,820 | ||
Foreign currency, at value (Cost $124,754) | 125,084 | |||
Receivable for investments sold | 57,701 | |||
Deposit with broker for futures contracts (Note 3) | 146,678 | |||
Unrealized gain on forward foreign currency contracts | 1,902 | |||
Dividends and interest receivable | 7,131 | |||
Receivable from variation margin | 1,513 | |||
Receivable due from advisor | 50,012 | |||
Other assets | 14,949 | |||
| ||||
Total assets | 2,565,790 | |||
| ||||
LIABILITIES | ||||
Payable for investments purchased | 37,815 | |||
Unrealized loss on forward foreign currency contracts | 645 | |||
Payable for variation margin | 8,179 | |||
Payable for administration fees | 6,010 | |||
Payable for transfer agency fees | 3,935 | |||
Payable to Chief Compliance Officer | 3,118 | |||
Legal fees payable | 439 | |||
Audit and tax fees payable | 18,000 | |||
Accrued expenses and other liabilities | 3,752 | |||
| ||||
Total liabilities | 81,893 | |||
| ||||
NET ASSETS | $ | 2,483,897 | ||
| ||||
NET ASSETS CONSIST OF | ||||
Paid-in capital (Note 6) | $ | 2,388,994 | ||
Accumulated net investment income | 2,122 | |||
Accumulated net realized gain on investments, futures contracts and foreign currency transactions | 29,843 | |||
Net unrealized appreciation on investments, futures contracts and translation of assets and liabilities denominated in foreign currencies | 62,938 | |||
| ||||
NET ASSETS | $ | 2,483,897 | ||
| ||||
PRICING OF SHARES | ||||
Net Asset Value, offering and redemption price per share | $ | 10.38 | ||
Shares of beneficial interest outstanding | 239,213 | |||
See Notes to Financial Statements. | ||
12 |
www.gkefund.com |
GKE Asian Opportunities Fund | Statement of Operations | |
| For the Period August 5, 2013 (Commencement of Operations) to September 30, 2013 | ||||
| ||||
INVESTMENT INCOME | ||||
Dividends | $ | 3,612 | ||
Foreign taxes withheld | (199) | |||
Interest | 1,219 | |||
| ||||
Total investment income | 4,632 | |||
| ||||
EXPENSES | ||||
Investment advisory fees (Note 7) | 3,634 | |||
Administrative fees | 10,712 | |||
Transfer agency fees | 5,948 | |||
Legal and audit fees | 18,439 | |||
Offering cost and registration fees | 13,081 | |||
Custodian fees | 1,918 | |||
Compliance fees | 3,118 | |||
Other | 1,182 | |||
| ||||
Total expenses | 58,032 | |||
Less fees waived/reimbursed by investment adviser (Note 7) | (53,646) | |||
| ||||
Net expenses | 4,386 | |||
| ||||
NET INVESTMENT INCOME | 246 | |||
| ||||
REALIZED AND UNREALIZED GAIN ON INVESTMENTS | ||||
Net realized gain on investments | 14,821 | |||
Net realized gain on futures contracts | 17,099 | |||
Net realized loss on foreign currency transactions | (1,207) | |||
Net change in unrealized appreciation on investments | 69,367 | |||
Net change in unrealized depreciation on futures contracts | (6,666) | |||
Net change in unrealized appreciation on translation of assets and liabilities denominated in foreign currencies | 237 | |||
| ||||
NET REALIZED AND UNREALIZED GAIN ON INVESTMENTS | 93,651 | |||
| ||||
NET INCREASE IN NET ASSETS RESULTING FROM OPERATIONS | $ | 93,897 | ||
| ||||
See Notes to Financial Statements. | ||
Annual Report | September 30, 2013 |
13 |
GKE Asian Opportunities Fund | Statement of Changes in Net Assets | |
| For the Period August 5, 2013 (Commencement of Operations) to September 30, 2013 | ||||
| ||||
OPERATIONS | ||||
Net investment income | $ | 246 | ||
Net realized gain on investments, futures contracts and foreign currency transactions | 30,713 | |||
Net change in unrealized appreciation on investments, futures contracts and translation of assets and liabilities denominated in foreign currencies | 62,938 | |||
| ||||
Net increase in net assets resulting from operations | 93,897 | |||
| ||||
BENEFICIAL SHARE TRANSACTIONS (Note 6) | ||||
Proceeds from sales of shares | 2,390,000 | |||
| ||||
Net increase from capital share transactions | 2,390,000 | |||
| ||||
Net increase in net assets | 2,483,897 | |||
| ||||
NET ASSETS | ||||
Beginning of period | – | |||
| ||||
End of period* | $ | 2,483,897 | ||
| ||||
*Including accumulated net investment income of: | $ | 2,122 | ||
OTHER INFORMATION | ||||
Share Transactions | ||||
Issued | 239,213 | |||
| ||||
Net increase in share transactions | 239,213 | |||
| ||||
See Notes to Financial Statements. | ||
14 |
www.gkefund.com |
GKE Asian Opportunities Fund | Financial Highlights | |
For a share outstanding through the period presented. |
For the Period of Operations) to | ||||
| ||||
NET ASSET VALUE, BEGINNING OF PERIOD | $ 10.00 | |||
INCOME FROM OPERATIONS | ||||
Net investment income(a) | 0.00 (b) | |||
Net realized and unrealized gain on investments | 0.38 | |||
| ||||
Total from investment operations | 0.38 | |||
| ||||
INCREASE IN NET ASSET VALUE | 0.38 | |||
| ||||
NET ASSET VALUE, END OF PERIOD | $ 10.38 | |||
| ||||
TOTAL RETURN(c) | 3.80% | |||
RATIOS AND SUPPLEMENTAL DATA | ||||
Net assets, end of period (000’s) | $ 2,484 | |||
Ratio of expenses to average net assets excluding fee waivers and reimbursements | 23.95% (d) | |||
Ratio of expenses to average net assets including fee waivers and reimbursements | 1.81% (d) | |||
Ratio of net investment income to average net assets | 0.10% (d) | |||
PORTFOLIO TURNOVER RATE(e) | 22% | |||
| (a) | Calculated using the average shares method. |
| (b) | Less than $0.01 per share. |
| (c) | Total returns are for the period indicated and have not been annualized. Total returns would have been lower had certain expenses not been waived during the period. Returns shown do not reflect the deduction of taxes that a shareholder would pay on Fund distributions or the redemption of Fund shares. |
| (d) | Annualized. |
| (e) | Portfolio turnover rate for periods less than one full year have not been annualized. |
See Notes to Financial Statements. | ||
Annual Report | September 30, 2013 |
15 |
GKE Asian Opportunities Fund | Notes to Financial Statements | |
September 30, 2013 |
1. ORGANIZATION
ALPS Series Trust (the “Trust”), a Delaware statutory trust, is an open-end management investment company registered under the Investment Company Act of 1940, as amended (the “1940 Act”). As of September 30, 2013, the Trust had two registered funds. This annual report describes the GKE Asian Opportunities Fund (the “Fund”). The Fund commenced operations on August 5, 2013. The Fund seeks to achieve capital appreciation through asset allocation among equities, currencies and bonds of the Asia-Pacific region. The Fund currently offers Institutional Class shares. Institutional Class shares are offered directly, via the Fund’s transfer agent, and through financial intermediaries (including, but not limited to, broker-dealers, retirement plans, bank trust departments and financial advisors). The Board of Trustees (the “Board”) may establish additional funds and classes of shares at any time in the future without shareholder approval.
2. SIGNIFICANT ACCOUNTING POLICIES
The accompanying financial statements were prepared in accordance with accounting principles generally accepted in the United States of America (“U.S. GAAP”). The preparation of financial statements in conformity with U.S. GAAP requires management to make certain estimates and assumptions that affect the reported amounts of assets and liabilities and disclosures of contingent assets and liabilities at the date of the financial statements and the reported amounts of revenue and expenses during the period. Actual results could differ from those estimates. The following is a summary of significant accounting policies consistently followed by the Fund in preparation of the financial statements.
Investment Valuation: The Fund generally values its securities based on market prices determined at the close of regular trading on the New York Stock Exchange (“NYSE”), normally 4:00 p.m. Eastern Time, on each day the NYSE is open for trading.
For equity securities and mutual funds that are traded on an exchange, the market price is usually the closing sale or official closing price on that exchange. In the case of equity securities not traded on an exchange, or if such closing prices are not otherwise available, the securities are valued at the mean of the most recent bid and ask prices on such day.
Equity securities that are primarily traded on foreign securities exchanges are valued at the closing values of such securities on their respective foreign exchanges, except when an event occurs subsequent to the close of the foreign exchange and the close of the NYSE that was likely to have changed such value. In such an event, the fair values of those securities are determined in good faith through consideration of other factors in accordance with procedures established by and under the general supervision of the Board. The Fund will use a fair valuation model provided by an independent pricing service, which is intended to reflect fair value when a security’s value or a meaningful portion of the Fund’s portfolio is believed to have been materially affected by a valuation event that has occurred between the close of the exchange or market on which the security is traded and the close of the regular trading day on the NYSE.
The market price for debt obligations is generally the price supplied by an independent third-party pricing service approved by the Board, which may use a matrix, formula or other objective method that takes into consideration quotations from dealers, market transactions in comparable investments, market indices and yield curves. If vendors are unable to supply a price, or if the
16 |
www.gkefund.com |
GKE Asian Opportunities Fund | Notes to Financial Statements | |
September 30, 2013 |
price supplied is deemed to be unreliable, the market price may be determined using quotations received from one or more broker dealers that make a market in the security. Short term debt obligations that will mature in 60 days or less are valued at amortized cost; unless it is determined that using this method would not reflect an investment’s fair value. Investments in non-exchange traded funds are fair valued at their respective net asset values.
Redeemable securities issued by open-end registered investment companies are valued at the investment company’s applicable net asset value, with the exception of exchange-traded open-end investment companies, which are priced as equity securities.
Futures contracts that are listed or traded on a national securities exchange, commodities exchange, contract market or comparable over the counter market, and that are freely transferable, are valued at their closing settlement price on the exchange on which they are primarily traded or based upon the current settlement price for a like instrument acquired on the day on which the instrument is being valued. A settlement price may not be used if the market makes a limit move with respect to a particular commodity.
Forward foreign currency contracts have a market value determined by the prevailing foreign currency exchange daily rates and current foreign currency exchange forward rates. The foreign currency exchange forward rates are calculated using an automated system that estimates rates on the basis of the current day foreign currency exchange rates and forward foreign currency exchange rates supplied by a pricing service. Foreign exchange rates and forward foreign currency exchange rates may generally be obtained at the close of the NYSE, normally 4:00 p.m. Eastern Time.
When such prices or quotations are not available, or when the fair value committee appointed by the Board believes that they are unreliable, securities may be priced using fair value procedures approved by the Board.
Fair Value Measurements: The Fund discloses the classification of their fair value measurements following a three-tier hierarchy based on the inputs used to measure fair value. Inputs refer broadly to the assumptions that market participants would use in pricing the asset or liability, including assumptions about risk. Inputs may be observable or unobservable. Observable inputs reflect the assumptions market participants would use in pricing the asset or liability that are developed based on market data obtained from sources independent of the reporting entity. Unobservable inputs reflect the reporting entity’s own assumptions about the assumptions market participants would use in pricing the asset or liability that are developed based on the best information available.
Various inputs are used in determining the value of the Fund’s investments as of the end of the reporting period. When inputs used fall into different levels of the fair value hierarchy, the level in the hierarchy within which the fair value measurement falls is determined based on the lowest level input that is significant to the fair value measurement in its entirety. The designated input levels are not necessarily an indication of the risk or liquidity associated with these investments. These inputs are categorized in the following hierarchy under applicable financial accounting standards:
Level 1 – | Unadjusted quoted prices in active markets for identical investments, unrestricted assets or liabilities that the Fund has the ability to access at the measurement date; |
Annual Report | September 30, 2013 |
17 |
GKE Asian Opportunities Fund | Notes to Financial Statements | |
September 30, 2013 |
Level 2 – | Quoted prices which are not active, quoted prices for similar assets or liabilities in active markets or inputs other than quoted prices that are observable (either directly or indirectly) for substantially the full term of the asset or liability; and | |
Level 3 – | Significant unobservable prices or inputs (including the Fund’s own assumptions in determining the fair value of investments) where there is little or no market activity for the asset or liability at the measurement date. | |
The following is a summary of the inputs used to value the Fund’s investments as of September 30, 2013:
| Investments in Securities at Value* | Level 1 - Unadjusted Quoted Prices | Level 2 - Other Significant Observable Inputs | Level 3 - Significant Unobservable Inputs | Total | ||||||||||||
| ||||||||||||||||
Common Stocks | $ | 1,198,493 | $ | – | $ | – | $ | 1,198,493 | ||||||||
Participation Notes | – | 41,908 | – | 41,908 | ||||||||||||
Corporate Bonds | – | 163,302 | – | 163,302 | ||||||||||||
Government Bonds | – | 415,388 | – | 415,388 | ||||||||||||
Short Term Investments | 341,729 | – | – | 341,729 | ||||||||||||
| ||||||||||||||||
TOTAL | $ | 1,540,222 | $ | 620,598 | $ | – | $ | 2,160,820 | ||||||||
| ||||||||||||||||
Valuation Inputs | ||||||||||||||||
|
| |||||||||||||||
| Other Financial Instruments | Level 1 | Level 2 | Level 3 | Total | ||||||||||||
| ||||||||||||||||
Forward Foreign Currency Contracts | $ | – | $ | 1,257 | $ | – | $ | 1,257 | ||||||||
Futures Contracts | (6,666) | – | – | (6,666) | ||||||||||||
| ||||||||||||||||
TOTAL | $ | (6,666) | $ | 1,257 | $ | – | $ | (5,409) | ||||||||
| ||||||||||||||||
| * | For detailed descriptions of the underlying industries, see the accompanying Portfolio of Investments. |
The Fund recognizes transfers between levels as of the end of the fiscal year. For the period ended September 30, 2013, the Fund did not have any transfers between Level 1 and Level 2 securities. There were no Level 3 securities held during the period.
Trust Expenses: Some expenses of the Trust can be directly attributed to the Fund. Expenses which cannot be directly attributed to the Fund are apportioned among all funds in the Trust based on average net assets of each fund.
Federal Income Taxes: The Fund complies with the requirements under Subchapter M of the Internal Revenue Code of 1986, as amended, applicable to regulated investment companies and intends to distribute substantially all of its net taxable income and net capital gains, if any, each year so that it will not be subject to excise tax on undistributed income and gains. The Fund is not subject to income taxes to the extent such distributions are made.
As of and during the period ended September 30, 2013, the Fund did not have a liability for any unrecognized tax benefits in the accompanying financial statements. The Fund files U.S federal, state and local income tax returns as required. The Fund’s tax returns are subject to examination
18 |
www.gkefund.com |
GKE Asian Opportunities Fund | Notes to Financial Statements | |
September 30, 2013 |
by the relevant tax authorities until expiration of the applicable statute of limitations, which is generally three years after the filing of the tax return for federal purposes and four years for most state returns. Tax returns for open years have incorporated no uncertain tax positions that require a provision for income taxes.
Investment Transactions and Investment Income: Investment transactions are accounted for on the date the investments are purchased or sold (trade date basis). Net realized gains and losses from investment transactions are reported on an identified cost basis. Interest income, which includes accretion of discounts and amortization of premiums, is accrued and recorded as earned. Dividend income is recognized on the ex-dividend date, or for certain foreign securities, as soon as information is available to the Fund.
Foreign Securities: The Fund may directly purchase securities of foreign issuers. Investing in securities of foreign issuers involves special risks not typically associated with investing in securities of U.S. issuers. The risks include possible reevaluation of currencies, the inability to repatriate foreign currency, less complete financial information about companies and possible future adverse political and economic developments. Moreover, securities of many foreign issuers and their markets may be less liquid and their prices more volatile than those of securities of comparable U.S. issuers.
Foreign Currency Translation: The books and records of the Funds are maintained in U.S. dollars. Investment valuations and other assets and liabilities initially expressed in foreign currencies are converted each business day into U.S. dollars based upon current exchange rates. The portion of realized and unrealized gains or losses on investments due to fluctuations in foreign currency exchange rates is not separately disclosed and is included in realized and unrealized gains or losses on investments, when applicable.
Foreign Exchange Transactions: The Funds may enter into foreign currency spot contracts to facilitate transactions in foreign securities or to convert foreign currency receipts into U.S. dollars. A foreign currency spot contract is an agreement between two parties to buy and sell currencies at the current market rate, for settlement generally within two business days. The U.S. dollar value of the contracts is determined using current currency exchange rates supplied by a pricing service. The contract is marked-to-market daily for settlements beyond one day and any change in market value is recorded as an unrealized gain or loss. When the contract is closed, the Fund records a realized gain or loss equal to the difference between the value on the open and close date. Losses may arise from changes in the value of the foreign currency, or if the counterparties do not perform under the contract’s terms. The maximum potential loss from such contracts is the aggregate face value in U.S. dollars at the time the contract was opened.
Principal Investment Strategies and Risk: The Fund seeks to achieve its investment objective by investing at least 80% of its total assets in securities of companies located in developed or emerging markets in the Asia-Pacific region, where “total assets” means net assets, plus the amount of any borrowings for investment purposes. Developed and emerging market countries in the Asia-Pacific region are those currently included in the Morgan Stanley Capital International (MSCI) AC (All Country) Pacific Index. The Fund’s investments may also include securities of issuers in Asia-Pacific Countries that are traded elsewhere, such as depositary receipts and global depositary receipts listed in New York, London and Frankfurt. Investing in emerging markets involves certain risks to the Fund’s shareholders, including potential for higher volatility of the net
Annual Report | September 30, 2013 |
19 |
GKE Asian Opportunities Fund | Notes to Financial Statements | |
September 30, 2013 |
asset value (“NAV”) of the Fund’s shares and the relatively greater effect of portfolio holdings on the NAV of the shares. Emerging markets are often less stable politically and economically than developed markets resulting in less transparency, little government oversight and ultimately currency-related risks.
Distributions to Shareholders: The Fund normally pays dividends and distributes capital gains, if any, on an annual basis. Income dividend distributions are derived from interest and other income the Fund receives from its investments, including distributions of short term capital gains. Long term capital gain distributions are derived from gains realized when the Fund sells a security it has owned for more than a year. The Fund may make additional distributions and dividends at other times if its portfolio manager or managers believe doing so may be necessary for the Fund to avoid or reduce taxes. Net investment income/(loss) and net realized gain/(loss) may differ for financial statement and tax purposes.
3. DERIVATIVE INSTRUMENTS
The Fund’s investment objective permits the Fund to enter into various types of derivatives contracts, including, but not limited to, futures contracts, forward foreign currency contracts, currency swaps and purchased and written options. In doing so, the Fund will employ strategies in differing combinations to permit it to increase, decrease, or change the level or types of exposure to market factors. Central to those strategies are features inherent in derivatives that make them more attractive for this purpose than equity or debt securities; they require little or no initial cash investment, they can focus exposure on only certain selected risk factors, and they may not require the ultimate receipt or delivery of the underlying security (or securities) to the contract. This may allow the Fund to pursue its objectives more quickly and efficiently than if it were to make direct purchases or sales of securities capable of affecting a similar response to market factors.
Risk of Investing in Derivatives: The Fund’s use of derivatives can result in losses due to unanticipated changes in the market risk factors and the overall market. In instances where the Fund is using derivatives to decrease, or hedge, exposures to market risk factors for securities held by the Fund, there are also risks that those derivatives may not perform as expected resulting in losses for the combined or hedged positions.
Derivatives may have little or no initial cash investment relative to their market value exposure and therefore can produce significant gains or losses in excess of their cost. This use of embedded leverage allows the Fund to increase its market value exposure relative to its net assets and can substantially increase the volatility of the Fund’s performance.
Additional associated risks from investing in derivatives also exist and potentially could have significant effects on the valuation of the derivative and the Fund. Typically, the associated risks are not the risks that the Fund is attempting to increase or decrease exposure to, per its investment objective, but are the additional risks from investing in derivatives.
Examples of these associated risks are liquidity risk, which is the risk that the Fund will not be able to sell or close out the derivative in a timely manner, and counterparty credit risk, which is the risk that the counterparty will not fulfill its obligation to the Fund. In addition, use of derivatives may increase or decrease exposure to the following risk factors:
Equity Risk: Equity risk relates to the change in value of equity securities as they relate to increases or decreases in the general market. Associated risks can be different for each type of derivative and are discussed by each derivative type in the notes that follow.
20 |
www.gkefund.com |
GKE Asian Opportunities Fund | Notes to Financial Statements | |
September 30, 2013 |
Foreign Currency Risk: Currency trading involves significant risks, including market risk, interest rate risk, country risk, counterparty credit risk and short sale risk. Market risk results from the price movement of foreign currency values in response to shifting market supply and demand.
Forward Foreign Currency Contracts: The Fund invests in foreign currency exchange contracts to reduce the risks of fluctuating exchange rates and to generate returns uncorrelated to the other strategies employed. A forward foreign currency exchange contract involves an obligation to purchase or sell a specific currency at a future date, which may be a fixed number of days from the date of the contract agreed upon by the parties, at a price set at the time of the contract. By entering into a forward foreign currency exchange contract, the Fund “locks in” the exchange rate between the currency it will deliver and the currency it will receive for the duration of the contract. As a result, the Fund reduces its exposure to changes in the value of the currency it will deliver and increases its exposure to changes in the value of the currency it will exchange into. The Fund may enter into these contracts for the purpose of hedging against foreign exchange risk arising from the Fund’s investment or anticipated investment in securities denominated in foreign currencies. The Fund also may enter into these contracts for purposes of increasing exposure to a foreign currency or to shift exposure to foreign currency fluctuations from one country to another. The Fund may use one currency (or a basket of currencies) to hedge against adverse changes in the value of another currency (or a basket of currencies) when exchange rates between the two currencies are positively correlated. The unrealized appreciation/(depreciation) is reported in the Statement of Assets and Liabilities as receivable or payable and in the Statement of Operations within the change in unrealized appreciation/(depreciation). At contract close, the difference between the original cost of the contract and the value at the close date is recorded as a realized gain/(loss) in the Statement of Operations. As of September 30, 2013, the Fund held forward foreign currency contracts with net unrealized appreciation of $1,257.
Futures: The Fund may invest in futures contracts in accordance with its investment objectives. The Fund does so for a variety of reasons including for cash management, hedging or non-hedging purposes in an attempt to achieve investment returns consistent with the Fund’s investment objective. A futures contract provides for the future sale by one party and purchase by another party of a specified quantity of the security or other financial instrument at a specified price and time. A futures contract on an index is an agreement pursuant to which two parties agree to take or make delivery of an amount of cash equal to the difference between the value of the index at the close of the last trading day of the contract and the price at which the index contract was originally written. Futures transactions may result in losses in excess of the amount invested in the futures contract. There can be no guarantee that there will be a correlation between price movements in the hedging vehicle and in the portfolio securities being hedged. An incorrect correlation could result in a loss on both the hedged securities in a Fund and the hedging vehicle so that the portfolio return might have been greater had hedging not been attempted. There can be no assurance that a liquid market will exist at a time when a Fund seeks to close out a futures contract or a futures option position. Lack of a liquid market for any reason may prevent a Fund from liquidating an unfavorable position, and the Fund would remain obligated to meet margin requirements until the position is closed. In addition, a Fund could be exposed to risk if the
Annual Report | September 30, 2013 |
21 |
GKE Asian Opportunities Fund | Notes to Financial Statements | |
September 30, 2013 |
counterparties to the contracts are unable to meet the terms of their contracts. With exchange traded futures, there is minimal counterparty credit risk to the Fund since futures are exchange traded and the exchange’s clearinghouse, as counterparty to all exchange traded futures, guarantees the futures against default. When a purchase or sale of a futures contract is made by a Fund, the Fund is required to deposit with its custodian (or broker, if legally permitted) a specified amount of liquid assets (“initial margin”). The margin required for a futures contract is set by the exchange on which the contract is traded and may be modified during the term of the contract. The initial margin is in the nature of a performance bond or good faith deposit on the futures contract that is returned to a Fund upon termination of the contract, assuming all contractual obligations have been satisfied. Each day a Fund may pay or receive cash, called “variation margin,” equal to the daily change in value of the futures contract. Such payments or receipts are recorded for financial statement purposes as unrealized gains or losses by a Fund. Variation margin does not represent a borrowing or loan by a Fund but is instead a settlement between a Fund and the broker of the amount one would owe the other if the futures contract expired. When the contract is closed, a Fund records a realized gain or loss equal to the difference between the value of the contract at the time it was opened and the value at the time it was closed. As of September 30, 2013, the Fund had futures contracts outstanding with net unrealized depreciation of $6,666. The number of futures contracts held at September 30, 2013, as disclosed in the Portfolio of Investments, is representative of futures contracts activity during the period ended September 30, 2013.
Derivatives Instruments: The following tables disclose the amounts related to the Fund’s use of derivative instruments.
The effect of derivatives instruments on the Statement of Assets and Liabilities as of September 30, 2013:
Derivatives Not Accounted for As Hedging Instruments | Asset Derivatives Statement of Assets and Liabilities Location | Fair Value | Liability Derivatives Statement of Assets and Liabilities Location | Fair Value | ||||||||
| ||||||||||||
Foreign Exchange Contracts (Forward foreign currency contracts) | Unrealized gain on forward foreign currency contracts | $ | 1,902 | Unrealized loss on forward foreign currency contracts | $ | 645 | ||||||
| ||||||||||||
Equity Contracts (Futures contracts) | Payable for variation margin | (6,666) | ||||||||||
| ||||||||||||
| $ | 1,902 | $ | (6,021) | |||||||||
| ||||||||||||
22 |
www.gkefund.com |
GKE Asian Opportunities Fund | Notes to Financial Statements | |
September 30, 2013 |
The effect of derivatives instruments on the Statement of Operations for the period ended September 30, 2013:
Derivatives Not Accounted for As Hedging Instruments | Location of Gains/(Losses) On Derivatives Recognized in Income | Realized Gain/(Loss) On Derivatives Recognized in Income | Change in Unrealized Gain/(Loss) On Derivatives Recognized in Income | |||||||
| ||||||||||
Foreign Exchange Contracts (Forward foreign currency contracts) | Net realized loss on foreign currency transactions /Net change in unrealized appreciation on translation of assets and liabilities denominated in foreign currencies | $ | 0 | $ | 1,257 | |||||
| ||||||||||
Equity Contracts (Futures contracts) | Net realized gain on futures contracts / Net change in unrealized depreciation on futures contracts | 17,099 | (6,666) | |||||||
| ||||||||||
| $ | 17,099 | $ | (5,409) | |||||||
| ||||||||||
4. TAX BASIS INFORMATION
Reclassifications: As of September 30, 2013, permanent differences in book and tax accounting were reclassified. The following reclassifications, which had no impact on results of operations or net assets, were recorded to reflect tax character:
| Paid-in Capital | Accumulated Net Investment Income | Accumulated Net Realized Gain on Investments | ||||||||||
| $ | (1,006) | $ | 1,876 | $ | (870) | |||||||
These differences are primarily attributed to the different tax treatment of foreign currency and organizational costs.
Tax Basis of Investments: As of September 30, 2013, the aggregate cost of investments, gross unrealized appreciation/(depreciation) and net unrealized appreciation for Federal tax purposes was as follows:
Gross appreciation | $ | 78,683 | ||||
Gross depreciation | (9,316) | |||||
| ||||||
Net unrealized appreciation | $ | 69,367 | ||||
| ||||||
Cost of investments for income tax purposes | $ | 2,091,453 | ||||
| ||||||
Annual Report | September 30, 2013 |
23 |
GKE Asian Opportunities Fund | Notes to Financial Statements | |
September 30, 2013 |
Components of Distributable Earnings: At September 30, 2013, components of distributable earnings were as follows:
Undistributed ordinary income | $ | 31,988 | ||
Net unrealized appreciation on investments, futures contracts, forward foreign currency contracts and foreign currency | 62,938 | |||
Other cumulative effect of timing differences | (23) | |||
| ||||
Total | $ | 94,903 | ||
| ||||
Capital Losses: As of September 30, 2013, the Fund had no accumulated capital loss carryforwards.
Tax Basis of Distributions to Shareholders: The character of distributions made during the period from net investment income or net realized gains may differ from its ultimate characterization for federal income tax purposes. Also, due to the timing of dividend distributions, the fiscal year in which amounts are distributed may differ from the fiscal year in which the income or realized gain were recorded by the Fund. There were no distributions paid by the Fund for the period ended September 30, 2013.
5. SECURITIES TRANSACTIONS
Purchases and sales of securities, excluding short-term securities, during the period ended September 30, 2013 were as follows:
Purchases of Securities | $ | 2,100,035 | ||
Proceeds From Sales of Securities | 363,028 |
6. BENEFICIAL SHARE TRANSACTIONS
The capitalization of the Trust consists of an unlimited number of shares of beneficial interest with no par value per share. Holders of the shares of the Fund have one vote for each share held and a proportionate fraction of a vote for each fractional share. All shares issued and outstanding are fully paid and are non-assessable, transferable and redeemable at the option of the shareholder. Shares have no pre-emptive rights.
The beneficial ownership, either directly or indirectly, of more than 25% of the voting securities of any class of the Fund creates a presumption of control of the Fund under Section 2(a)(9) of the 1940 Act. As of September 30, 2013, the following entities owned beneficially 25% or greater of the Fund’s outstanding shares. The shares are held under omnibus accounts, whereby the transactions of two or more shareholders are combined and carried in the name of the originating broker rather than designated separately.
| Class | Percentage | |||
| ||||
Institutional | Ralph & Cheryl Broetje | 53.35% | ||
| ||||
Institutional | Jeremy & Karen Butler | 35.57% | ||
| ||||
24 |
www.gkefund.com |
GKE Asian Opportunities Fund | Notes to Financial Statements | |
September 30, 2013 |
7. MANAGEMENT AND RELATED PARTY TRANSACTIONS
Investment Advisory: Evergreen Capital Management, LLC (“Evergreen Capital” or the “Adviser”), subject to the authority of the Board, is responsible for the overall management and administration of the Fund’s business affairs. The Adviser has delegated daily management of the Fund to GaveKal Capital Limited (the “Sub-Adviser”). The Sub-Adviser manages the investments of the Fund in accordance with the Fund’s investment objective, policies and limitations and investment guidelines established by the Adviser and the Board.
Pursuant to the Investment Advisory Agreement with the Adviser (the “Advisory Agreement”), the Fund pays the Adviser an annual management fee of 1.50% based on the Fund’s average daily net assets, computed daily and payable monthly. Pursuant to an Investment Sub-Advisory Agreement with the Sub-Adviser, the Adviser pays the Sub-Adviser an annual sub-advisory management fee of 0.825% based on the Fund’s average daily net assets, computed daily and payable monthly. The Adviser is required to pay all fees due to the Sub-Adviser out of the management fee the Adviser receives from the Fund.
The Adviser has agreed contractually to waive and/or reimburse fees or expenses in order to limit total annual Fund operating expenses (exclusive of brokerage expenses, interest expenses, taxes and extraordinary expenses) to 1.81% of the Fund’s average daily net assets. This agreement is in effect through January 31, 2016 and may not be terminated or modified prior to this date except with the approval of the Fund’s Board. The Adviser will be permitted to recover expenses it has borne through the agreement described above to the extent that the Fund’s expenses in later periods fall below the annual rates set forth in the relevant agreement. The Fund will not be obligated to pay any such deferred fees and expenses more than three years after the end of the fiscal year(s) in which the fees and expenses were deferred.
For the period ended September 30, 2013, the fee waivers and/or reimbursements were $53,646.
As of September 30, 2013, the balance of recoupable expenses was $53,646 and expires in 2016.
Administrator: ALPS Fund Services, Inc. (“ALPS” and the “Administrator”) (an affiliate of ALPS Distributors, Inc.) serves as administrator to the Fund. The Fund has agreed to pay expenses incurred in connection with its administrative activities. Pursuant to the Administration, Bookkeeping and Pricing Services Agreement (the “Agreement”), ALPS will provide operational services to the Fund including, but not limited to fund accounting and fund administration and generally assist in the Fund’s operations.
The Fund’s administration fee is accrued on a daily basis, and paid on a monthly basis following the end of the month, based on the greater of (a) an annual total fee of $66,000 in year 1 of operations and $125,000 in year 2; or (b) the following basis point fee schedule:
| Average Total Net Assets | Contractual Fee | |
| ||
Between $0-$250M | 0.10% | |
| ||
$250M-$500M | 0.07% | |
| ||
Above $500M | 0.03% | |
| ||
Annual Report | September 30, 2013 |
25 |
GKE Asian Opportunities Fund | Notes to Financial Statements | |
September 30, 2013 |
The Administrator is reimbursed by the Fund for certain out-of-pocket expenses.
Transfer Agent: ALPS serves as transfer, dividend paying and shareholder servicing agent for the Fund under a Transfer Agency and Services Agreement with the Trust. Under this Agreement, ALPS is paid an annual base fee of $20,000 for the Fund plus fees for open accounts and is reimbursed for certain out-of-pocket expenses.
Compliance Services: ALPS provides services as the Fund’s Chief Compliance Officer to monitor and test the policies and procedures of the Fund in conjunction with requirements under Rule 38a-1 under the 1940 Act under the Chief Compliance Officer Services Agreement. Under this Agreement, ALPS is paid an annual base fee of $20,000 for services performed on behalf of the Fund and is reimbursed for certain out-of-pocket expenses.
Principal Financial Officer: ALPS provides Principal Financial Officer (“PFO”) services to the Fund at no annual fee and is reimbursed for certain out-of-pocket expenses.
Distributor: ALPS Distributors, Inc. (“ADI” or the “Distributor”) (an affiliate of ALPS Fund Services, Inc.) acts as the distributor of the Fund’s shares pursuant to a Distribution Agreement with the Trust. Shares are sold on a continuous basis by ADI as agent for the Fund, and ADI has agreed to use its best efforts to solicit orders for the sale of the Fund’s shares, although it is not obliged to sell any particular amount of shares. ADI is not entitled to any compensation for its services as Distributor. ADI is registered as a broker-dealer with the Securities and Exchange Commission.
8. TRUSTEES
As of September 30, 2013, there were four Trustees, three of whom are not “interested persons” (within the meaning of the 1940 Act) of the Trust (the “Independent Trustees”). The Independent Trustees of the Trust receive a quarterly retainer of $2,000, plus $1,000 for each regular Board or Committee meeting attended, $1,000 for each special telephonic Board or Committee meeting attended and $1,000 for each special in-person Board meeting attended. The Independent Trustees are also reimbursed for all reasonable out-of-pocket expenses relating to attendance at meetings and for meeting-related expenses. Officers of the Trust and Trustees who are interested persons of the Trust receive no salary or fees from the Trust.
9. INDEMNIFICATIONS
Under the Trust’s organizational documents, its officers and Trustees are indemnified against certain liability arising out of the performance of their duties to the Trust. Additionally, in the normal course of business, the Trust enters into contracts with service providers that may contain general indemnification clauses which may permit indemnification to the extent permissible under applicable law. The Trust’s maximum exposure under these arrangements is unknown, as this would involve future claims that may be made against the Trust that have not yet occurred.
26 |
www.gkefund.com |
GKE Asian Opportunities Fund | Notes to Financial Statements | |
September 30, 2013 |
10. NEW ACCOUNTING PRONOUCEMENTS
In June 2013, the Financial Accounting Standards Board (the “FASB”) issued Accounting Standards Update (“ASU”) No. 2013-08, Financial Services-Investment Companies (Topic 946): Amendments to the Scope, Measurement, and Disclosure Requirements. The FASB standard identifies characteristics a company must assess to determine whether it is considered an investment company for financial reporting purposes. This ASU is effective for fiscal years beginning after December 15, 2013. The Fund believes the adoption of this ASU will not have a material impact on its financial statements.
Annual Report | September 30, 2013 |
27 |
GKE Asian Opportunities Fund | Report of Independent Registered Public Accounting Firm | |
To the Board of Trustees and Shareholders of
GKE Asian Opportunities Fund
We have audited the accompanying statement of assets and liabilities, of GKE Asian Opportunities Fund (the “Fund”), a series of ALPS Series Trust (the “Trust”), as of September 30, 2013, including the portfolio of investments and the related statements of operations, changes in net assets and financial highlights for the period August 5, 2013 (Commencement of Operations) to September 30, 2013. These financial statements and financial highlights are the responsibility of the Fund’s management. Our responsibility is to express an opinion on these financial statements and financial highlights based on our audit.
We conducted our audit in accordance with the standards of the Public Company Accounting Oversight Board (United States). Those standards require that we plan and perform the audit to obtain reasonable assurance about whether the financial statements and financial highlights are free of material misstatement. An audit includes examining, on a test basis, evidence supporting the amounts and disclosures in the financial statements. Our procedures included confirmation of securities owned as of September 30, 2013 by correspondence with the custodian and brokers. An audit also includes assessing the accounting principles used and significant estimates made by management, as well as evaluating the overall financial statement presentation. We believe that our audit provides a reasonable basis for our opinion.
In our opinion, the financial statements and financial highlights referred to above present fairly, in all material respects, the financial position of GKE Asian Opportunities Fund as of September 30, 2013, and the results of its operations, the changes in its net assets, and the financial highlights for the period August 5, 2013 (Commencement of Operations) to September 30, 2013, in conformity with accounting principles generally accepted in the United States of America.
Rothstein Kass
Walnut Creek, California
November 22, 2013
28 |
www.gkefund.com |
GKE Asian Opportunities Fund | Additional Information | |
September 30, 2013 (Unaudited) |
1. PROXY VOTING POLICIES AND VOTING RECORD
A description of the policies and procedures that the Fund uses to determine how to vote proxies relating to portfolio securities is available without charge, upon request, (1) by calling the Fund (toll-free) at 1-855-331-6240 or (2) on the Securities and Exchange Commission’s the (“SEC”) website at http://www.sec.gov. Information regarding how the Fund voted proxies relating to portfolio securities during the most recent 12-month period ended June 30, 2013 is available (i) without charge, upon request, by calling the Fund (toll-free) at 1-855-331-6240 or (2) on the SEC’s website at http://www.sec.gov.
2. PORTFOLIO HOLDINGS
The Fund files its complete schedule of portfolio holdings with the SEC for the first and third quarters of each fiscal year on Form N-Q. The Fund’s Form N-Q is available on the SEC website at http://www.sec.gov. The Fund’s Form N-Q may be reviewed and copied at the SEC’s Public Reference Room in Washington, D.C., and information on the operation of the Public Reference Room may be obtained by calling 1-800-SEC-0330.
3. DISCLOSURE REGARDING APPROVAL OF FUND ADVISORY AND SUB-ADVISORY AGREEMENTS
GKE Asian Opportunities Fund
On May 16, 2013, the Trustees met in person to discuss, among other things, the approval of the Investment Advisory Agreement between the Trust and Evergreen Capital Management, LLC (the “Adviser” or “Evergreen Capital”) (the “Advisory Agreement”) and the Investment Sub-Advisory Agreement among the Trust, the Adviser and GaveKal Capital Limited (the “Sub-Adviser” or “GaveKal Capital”) (the “Sub-Advisory Agreement”) in accordance with Section 15(c) of the Investment Company Act of 1940, as amended (the “1940 Act”). The Independent Trustees met with independent legal counsel during executive session and discussed the Advisory Agreement, the Sub-Advisory Agreement and related matters.
In approving the Advisory and Sub-Advisory Agreements, the Trustees, including the Independent Trustees, considered the following factors with respect to the Fund:
Investment Advisory Fee Rate: The Trustees reviewed and considered the contractual annual advisory fee to be paid (i) by the Trust, on behalf of the Fund, to Evergreen Capital of 1.50% of the Fund’s daily average net assets, and (ii) the contractual annual sub-advisory fee to be paid by Evergreen Capital to GaveKal Capital of 0.825% of the Fund’s daily average net assets, in light of the extent and quality of the advisory services to be provided by each Evergreen Capital and GaveKal Capital to the Fund.
The Trustees considered the information they received comparing the Fund’s contractual annual advisory fee and overall expenses with those of funds in the expense group and universe of funds provided by an independent provider of investment company data. The Trustees also considered the information they received from Evergreen Capital comparing the Fund’s contractual annual advisory fee and overall expenses with those of funds in the universe of Asia Pacific funds offered in the U.S. sourced by Bloomberg provided to the Trustees by Evergreen Capital. The Trustees
Annual Report | September 30, 2013 |
29 |
GKE Asian Opportunities Fund | Additional Information | |
September 30, 2013 (Unaudited) |
noted that the Fund’s total expense ratio of 1.81% was the highest in the peer group analyses provided to them. The Trustees then considered the relative position of the Fund’s total expense ratio in light of various factors including, but not limited to, the costs anticipated to be incurred by the advisers in providing services to the Fund, noting that certain of these costs were either anticipated to be distinguishing characteristics of the Fund and its investment process relative to some of the other funds within the peer group (or were not likely to be relevant to some of the other funds within the peer group). The Trustees also noted Evergreen Capital’s and GaveKal Capital’s views regarding the compatibility of the peer group given certain characteristics believed to be particular to the Fund. The Trustees acknowledged that comparing the fee paid by the Fund to Evergreen Capital against fees paid by the funds in their peer groups is one important measure in considering the fairness of the advisory fee, but it is not the only measure. The Trustees further noted particular services that would be provided to the Fund, including, for example, maintaining an investment team to select income-generating securities, maintaining a team across the Asia Pacific to perform due diligence on companies in Asia Pacific countries, and employing a dedicated risk analyst responsible for identifying any drags and sensitivity issues to the Fund’s performance, among others. Based on the information above, the Trustees determined that the contractual annual advisory fee of 1.50% and the total expense ratio of 1.81% for the Fund, taking into account the contractual fee waiver in place, although higher than the advisory fees charged by the funds in the peer group analyses provided to the Trustees, is fair to the Fund’s shareholders when considered in the context of the varied and particular services expected to be provided to the Fund in executing this investment strategy relative to certain of the funds in such peer group analyses.
Nature, Extent and Quality of the Services under the Advisory Agreement and the Sub-Advisory Agreement: The Trustees received and considered information regarding the nature, extent and quality of services to be provided to the Fund under the Advisory Agreement and the Sub-Advisory Agreement. The Trustees reviewed certain background materials supplied by Evergreen Capital in its presentation, including its Form ADV, and by GaveKal Capital in its presentation.
The Trustees reviewed and considered Evergreen Capital’s and GaveKal Capital’s investment advisory personnel, their history as asset managers and their performance and the amount of assets currently under management by each. The Trustees also reviewed the research and decision-making processes utilized by Evergreen Capital and GaveKal Capital, including the methods adopted to seek to achieve compliance with the investment objectives, policies and restrictions of the Fund.
The Trustees considered the background and experience of Evergreen Capital’s and GaveKal Capital’s management in connection with the Fund, including reviewing the qualifications, backgrounds and responsibilities of the management team primarily responsible for the day-to-day portfolio management of the Fund and the extent of the resources devoted to research and analysis of actual and potential investments.
The Trustees also reviewed, among other things, Evergreen Capital’s and GaveKal Capital’s Code of Ethics.
Performance: The Trustees noted that since the Fund had not yet begun operations, there was no fund performance to be reviewed or analyzed at that time. The Trustees also noted that the Fund would be managed in a substantially similar manner to the GaveKal UCITS Fund and considered
30 |
www.gkefund.com |
GKE Asian Opportunities Fund | Additional Information | |
September 30, 2013 (Unaudited) |
the comparability of the prior performance of the GaveKal UCITS Fund. The Trustees further considered Evergreen Capital’s and GaveKal Capital’s reputation generally and their investment techniques, risk management controls and decision-making processes.
The Adviser’s and the Sub-Adviser’s Profitability: The Trustees received and considered a projected profitability analysis prepared by each of Evergreen Capital and GaveKal Capital based on the fees payable under the Advisory Agreement and the Sub-Advisory Agreement, respectively. The Trustees considered the profits, if any, anticipated to be realized by Evergreen Capital and GaveKal Capital in connection with the operation of the Fund. The Board then reviewed and discussed Evergreen Capital’s and GaveKal Capital’s financial statements in order to analyze the financial condition and stability and profitability of each adviser.
Economies of Scale: The Trustees considered whether economies of scale in the provision of services to the Fund will be passed along to the shareholders under the proposed advisory agreements.
Other Benefits to the Adviser and the Sub-Adviser: The Trustees reviewed and considered any other incidental benefits derived or to be derived by Evergreen Capital and GaveKal Capital from their relationship with the Fund, including soft dollar arrangements.
In selecting Evergreen Capital and GaveKal Capital and the fees charged under the Advisory Agreement and Sub-Advisory Agreement, the Trustees concluded that no single factor reviewed by the Trustees was identified by the Trustees to be determinative as the principal factor in whether to approve the Advisory Agreement or the Sub-Advisory Agreement. Further, the Independent Trustees were advised by separate independent legal counsel throughout the process. The Trustees, including all of the Independent Trustees, concluded that:
| — | the contractual annual advisory fee of 1.50% and the total expense ratio of 1.81% for the Fund, taking into account the contractual fee waiver in place, although higher than the advisory fees charged by the funds in the peer group analyses provided to the Trustees, was fair to the Fund’s shareholders when considered in the context of the varied and particular services expected to be provided to the Fund in executing this investment strategy relative to certain of the funds in such peer group analyses; |
| — | the nature, extent and quality of services to be rendered by Evergreen Capital under the Advisory Agreement and by GaveKal Capital under the Sub-Advisory Agreement were adequate; |
| — | although there was no performance history for the Fund for the Board to consider, because the Fund will be managed in a substantially similar manner to the GaveKal UCITS Fund and that the U.S. Dollar and Euro institutional classes of the GaveKal UCITS Fund had outperformed its primary benchmark since commencement of trading in March 2010 and in January 2006, respectively, is a positive factor in the approval process; |
| — | the terms of the proposed fee waiver and expense limitation agreement between the Trust, on behalf of the Fund, and Evergreen Capital, were not unreasonable; |
Annual Report | September 30, 2013 |
31 |
GKE Asian Opportunities Fund | Additional Information | |
September 30, 2013 (Unaudited) |
| — | the profit, if any, anticipated to be realized by Evergreen Capital or GaveKal Capital in connection with the operation of the Fund was not unreasonable to the Fund; and |
| — | there were no material economies of scale or other incidental benefits accruing to Evergreen Capital or GaveKal Capital in connection with their relationship with the Fund. |
Based on the Trustees’ deliberations and their evaluation of the information described above, the Trustees, including all of the Independent Trustees, concluded that Evergreen Capital’s and GaveKal Capital’s compensation for investment advisory services is consistent with the best interests of the Fund and its shareholders.
32 |
www.gkefund.com |
GKE Asian Opportunities Fund | Trustees & Officers | |
September 30, 2013 (Unaudited) |
INDEPENDENT TRUSTEES
Name, Birth Year & Address* | Position(s) Held with Fund | Term of Office and Length of Time Served | Principal Occupation(s) During Past 5 Years** | Number of Funds in Fund Complex Overseen by Trustee*** | Other Directorships Held by Trustee During Past 5 Years** | |||||
| ||||||||||
Cheryl Burgermeister Birth year: 1951 | Trustee | Ms. Burgermeister was elected to the Board by the sole shareholder of the Trust on October 30, 2012. | Ms. Burgermeister is Trustee and Audit Committee Chair of The Select Sector SPDR Trust (October 1998 to present), Trustee of Russell Investment Funds (September 2012 to present) and Trustee, Treasurer and Finance Committee Chair of the Portland Community College Foundation (January 2001 to present). She also served as Trustee and Audit Committee Chair of E*Trade Funds (March 2004 to March 2010), Trustee of Zero Gravity Internet Fund (May 2000 to December 2001), Director and Treasurer of Crabbe Huson Family of Funds (1998 to 1999) and Director, Chief Financial Officer and Treasurer of The Crabbe Huson Group, Inc. (July 1987 to October 1999). From 1982 to 1986, Ms. Burgermeister was Supervising Senior Accountant at KPMG Peat Marwick. Ms. Burgermeister a licensed Certified Public Accountant and a member of the Oregon Society of Certified Public Accountants. | 2 | Ms. Burgermeister is a Trustee and Audit Committee Chair of The Select Sector SPDR Trust (9 ETFs) and Trustee of Russell Investment Funds (42 funds). | |||||
| ||||||||||
| * | All communications to Trustees and Officers may be directed to ALPS Series Trust c/o 1290 Broadway, Suite 1100, Denver, CO 80203. |
| ** | Except as otherwise indicated, each individual has held the office shown or other offices in the same company for the last five years. |
| *** | The Fund Complex currently consists of two series of the Trust and any other investment companies for which Evergreen Capital Management, LLC and GaveKal Capital Limited provide investment advisory services, currently none. |
Annual Report | September 30, 2013 |
33 |
GKE Asian Opportunities Fund | Trustees & Officers | |
September 30, 2013 (Unaudited) |
INDEPENDENT TRUSTEES (continued)
Name, Birth Year & Address* | Position(s) Held with Fund | Term of Office and Length of Time Served | Principal Occupation(s) During Past 5 Years** | Number of Trustee*** | Other Directorships Held by Trustee During Past 5 Years** | |||||
| ||||||||||
| J. Wayne Hutchens Birth year: 1944 | Trustee | Mr. Hutchens was elected to the Board by the sole shareholder of the Trust on October 30, 2012. | Mr. Hutchens is currently retired. From April 2006 to December 2012, he served as President and CEO of the University of Colorado (CU) Foundation and from April 2009 to December 2012, he was Executive Director of the CU Real Estate Foundation. Mr. Hutchens is also Trustee of the Denver Museum of Nature and Science (2000 to present), Director of AMG National Trust Bank (June 2012 to present) and Trustee of Children’s Hospital Colorado (May 2012 to present). Prior to these positions, Mr. Hutchens spent 29 years in the banking industry, retiring as Chairman of Chase Bank Colorado. | 2 | None. | |||||
| ||||||||||
| * | All communications to Trustees and Officers may be directed to ALPS Series Trust c/o 1290 Broadway, Suite 1100, Denver, CO 80203. |
| ** | Except as otherwise indicated, each individual has held the office shown or other offices in the same company for the last five years. |
| *** | The Fund Complex currently consists of two series of the Trust and any other investment companies for which Evergreen Capital Management, LLC and GaveKal Capital Limited provide investment advisory services, currently none. |
34 |
www.gkefund.com |
GKE Asian Opportunities Fund | Trustees & Officers | |
September 30, 2013 (Unaudited) |
INDEPENDENT TRUSTEES (continued)
Name, Birth Year & Address* | Position(s) Held with Fund | Term of Office and Length of Time Served | Principal Occupation(s) During Past 5 Years** | Number of Trustee*** | Other Directorships Held by Trustee During Past 5 Years** | |||||
| ||||||||||
Patrick Seese Birth year: 1971 | Trustee | Mr. Seese was elected to the Board by the sole shareholder of the Trust on October 30, 2012. | Mr. Seese is an owner and a Managing Director of Integris Partners, a middle-market investment banking firm serving closely-held companies, financial sponsors and public companies (February 2008 to present). Prior to this, Mr. Seese was a Managing Director of Headwaters MB, a middle-market investing banking firm (December 2003 to February 2008). Prior to that, Mr. Seese worked in Credit Suisse First Boston’s Mergers and Acquisitions Group and served as Head of Corporation Development, Katy Industries, a publicly traded industrial and consumer products company and at Deloitte & Touche LLP, where he began his career in 1994. | 2 | None. | |||||
| ||||||||||
| * | All communications to Trustees and Officers may be directed to ALPS Series Trust c/o 1290 Broadway, Suite 1100, Denver, CO 80203. |
| ** | Except as otherwise indicated, each individual has held the office shown or other offices in the same company for the last five years. |
| *** | The Fund Complex currently consists of two series of the Trust and any other investment companies for which Evergreen Capital Management, LLC and GaveKal Capital Limited provide investment advisory services, currently none. |
Annual Report | September 30, 2013 |
35 |
GKE Asian Opportunities Fund | Trustees & Officers | |
September 30, 2013 (Unaudited) |
INTERESTED TRUSTEE AND OFFICERS
Name, Birth Year & Address* | Position(s) Held with Fund | Term of Office and Length of Time Served | Principal Occupation(s) During Past 5 Years** | Number of Trustee*** | Other Directorships Held by Trustee During Past 5 Years** | |||||
| ||||||||||
Jeremy O. May Birth year: 1970 | Trustee, Chairman and President | Mr. May was elected Trustee, Chairman and President at the October 30, 2012 meeting of the Board of Trustees. | Mr. May joined ALPS in 1995 and is currently President of ALPS Fund Services, Inc. and Executive Vice President and Director of ALPS Holdings, Inc., ALPS Advisors, Inc. and ALPS Distributors, Inc. Because of his positions with these entities, Mr. May is deemed an affiliate of the Trust as defined under the 1940 Act. Mr. May currently serves as Treasurer of Clough Global Allocation Fund, Clough Global Equity Fund, Clough Global Opportunities Fund, Mr. May is also Chairman and Trustee of the Reaves Utility Income Fund. Mr. May is currently Vice Chair of the Board of Directors of the University of Colorado Foundation. | 2 | Mr. May is Chairman and Trustee of the Reaves Utility Income Fund (1 fund). | |||||
| ||||||||||
| * | All communications to Trustees and Officers may be directed to ALPS Series Trust c/o 1290 Broadway, Suite 1100, Denver, CO 80203. |
| ** | Except as otherwise indicated, each individual has held the office shown or other offices in the same company for the last five years. |
| *** | The Fund Complex currently consists of two series of the Trust and any other investment companies for which Evergreen Capital Management, LLC and GaveKal Capital Limited provide investment advisory services, currently none. |
36 |
www.gkefund.com |
GKE Asian Opportunities Fund | Trustees & Officers | |
September 30, 2013 (Unaudited) |
INTERESTED TRUSTEE AND OFFICERS (continued)
Name, Birth Year & Address* | Position(s) Held with Fund | Term of Office and Length of Time Served | Principal Occupation(s) During Past 5 Years** | |||
| ||||||
Kimberly R. Storms Birth year: 1972 | Treasurer | Ms. Storms was elected Treasurer of the Trust at the October 30, 2012 meeting of the Board of Trustees. | Ms. Storms is Senior Vice President - Director of Fund Administration of ALPS. Ms. Storms joined ALPS in 1998 as Assistant Controller. Because of her position with ALPS, Ms. Storms is deemed an affiliate of the Trust as defined under the 1940 Act. Ms. Storms is also Treasurer of Financial Investors Trust, BPV Family of Funds, Liberty All-Star Equity Fund and Liberty All-Star Growth Fund, Inc.; She serves as Chief Financial Officer of Arbitrage Funds. | |||
JoEllen L. Legg Birth year: 1961 | Secretary | Ms. Legg was elected Secretary of the Trust at the October 30, 2012 meeting of the Board of Trustees. | Ms. Legg joined ALPS in October 2007 and is Vice President, Assistant General Counsel of ALPS, ALPS Advisors, Inc., ALPS Distributors, Inc. and ALPS Portfolio Solutions Distributor, Inc. Prior to joining ALPS, Ms. Legg served as Senior Counsel - Law (Corporate & Securities) for Adelphia Communications Corporation (February 2005 - March 2007). Prior to this, Ms. Legg held associate positions at Fried Frank Harris Shriver & Jacobson LLP (1998 - 2004) and at Patton Boggs LLP (2004 - 2005). Because of her position with ALPS, Ms. Legg is deemed an affiliate of the Trust as defined under the 1940 Act. Ms. Legg is also the Assistant Secretary of the Stone Harbor Investment Funds, Stone Harbor Emerging Markets Income Fund, Stone Harbor Emerging Markets Total Income Fund, James Advantage Funds and WesMark Funds.
| |||
| ||||||
Jill Kerschen Birth year: 1975 |
Assistant Treasurer |
Ms. Kerschen was elected Assistant Treasurer of the Trust at the November 22, 2013 meeting of the Board of Trustees. |
Ms. Kerschen joined ALPS in July 2013 and is Fund Controller of ALPS. Prior to joining ALPS, Ms. Kerschen worked for Great-West Financial (2001-2013) and OppenheimerFunds (1998-2000). Because of her position with ALPS, Ms. Kerschen is deemed an affiliate of the Trust as defined under the 1940 Act. Ms. Kerschen is also the Assistant Treasurer of Clough Global Allocation Fund, Clough Global Equity Fund, Clough Global Opportunities Fund and Westcore Funds. | |||
| ||||||
| * | All communications to Trustees and Officers may be directed to ALPS Series Trust c/o 1290 Broadway, Suite 1100, Denver, CO 80203. |
| ** | Except as otherwise indicated, each individual has held the office shown or other offices in the same company for the last five years. |
Annual Report | September 30, 2013 |
37 |
GKE Asian Opportunities Fund | Trustees & Officers | |
September 30, 2013 (Unaudited) |
INTERESTED TRUSTEE AND OFFICERS (continued)
Name, Birth Year & Address* | Position(s) Held with Fund | Term of Office and Length of Time Served | Principal Occupation(s) During Past 5 Years** | |||
| ||||||
Lucas Foss Birth year: 1977 | Chief Compliance Officer (“CCO”) | Mr. Foss was elected CCO of the Trust at the October 30, 2012 meeting of the Board of Trustees. | Mr. Foss joined ALPS in November 2004 and is Deputy Chief Compliance Officer of ALPS. Prior to his current role, Mr. Foss served as a Compliance Manager at ALPS (January 2010 - August 2012), and a Senior Compliance Analyst at ALPS (November 2004 – May 2006). Before joining ALPS, Mr. Foss held positions at Bisys Hedge Fund Services and Deutsche Asset Management. Because of his position with ALPS, Mr. Foss is deemed an affiliate of the Trust as defined under the 1940 Act. Mr. Foss is also CCO of Caldwell & Orkin Funds, Whitebox Mutual Funds, Boulder Growth & Income Fund, Boulder Total Return Fund, the Denali Fund, Wakefield Alternative Series Trust and The Principal Real Estate Income Fund. | |||
| ||||||
| * | All communications to Trustees and Officers may be directed to ALPS Series Trust c/o 1290 Broadway, Suite 1100, Denver, CO 80203. |
| ** | Except as otherwise indicated, each individual has held the office shown or other offices in the same company for the last five years. |
Additional information about members of the Board of Trustees and officers of the Trust is available in the Statement of Additional Information and is available, without charge, upon request, by calling the Fund (toll-free) at 1-855-331-6240.
38 |
www.gkefund.com |
Page Intentionally Left Blank.
Page Intentionally Left Blank.

Item 2. Code of Ethics. | ||||
(a) | The Registrant, as of the end of the period covered by this report, has adopted a code of ethics that applies to the Registrant’s principal executive officer, principal financial officer, principal accounting officer or controller or any persons performing similar functions on behalf of the Registrant. | |||
(b) | Not applicable. | |||
(c) | During the period covered by this report, no amendments to the provisions of the code of ethics adopted in Item 2(a) above were made. | |||
(d) | During the period covered by this report, no implicit or explicit waivers to the provisions of the code of ethics adopted in Item 2(a) above were granted. | |||
(e) | Not applicable. | |||
(f) | The Registrant’s Code of Ethics is attached as an Exhibit to this report. | |||
Item 3. Audit Committee Financial Expert. | ||||
The Board of Trustees of the Registrant has determined that the Registrant has at least one Audit Committee Financial Expert serving on its audit committee. The Board of Trustees of the Registrant has designated Cheryl Burgermeister, J. Wayne Hutchens and Patrick Seese, as the Registrant’s “Audit Committee Financial Experts.” Ms. Burgermeister, Mr. Hutchens and Mr. Seese are “independent” as defined in paragraph (a)(2) of Item 3 to Form N-CSR. | ||||
Item 4. Principal Accountant Fees and Services. | ||||
(a) | Audit Fees: For the Registrant’s initial fiscal year ended September 30, 2013 the aggregate fees billed for professional services rendered by the principal accountant for the audit of the Registrant’s annual financial statements was $27,500 | |||
(b) | Audit-Related Fees: For the Registrant’s initial fiscal year ended September 30, 2013, the aggregate fees billed for professional services rendered by the principal accountant for assurance and related services by the principal accountant that are reasonably related to the performance of the audit of the Registrant’s annual financial statements and are not reported under paragraph (a) of this Item was $0. | |||
(c) | Tax Fees: For the Registrant’s initial fiscal year ended September 30, 2013, the aggregate fees billed for professional services rendered by the | |||
principal accountant for tax compliance, tax advice and tax planning was $6,000. The fiscal year 2013 tax fees were for services for dividend calculation, excise tax preparation and tax return preparation. | ||||
(d) | All Other Fees: For the Registrant’s initial fiscal year ended September 30, 2013, no fees were billed to Registrant by the principal accountant for services other than the services reported in paragraphs (a) through (c) of this Item. | |||
(e)(1) | Audit Committee Pre-Approval Policies and Procedures: All services to be performed by the Registrant’s principal accountant must be pre-approved by the Registrant’s audit committee. | |||
(e)(2) | No services described in paragraphs (b) through (d) of this Item were approved by the Registrant’s audit committee pursuant to paragraph (c)(7)(i)(C) of Rule 2-01 of Regulation S-X. | |||
(f) | Not applicable. | |||
(g) | The aggregate non-audit fees billed by the registrant’s accountant consisted of $6,000 in 2013 as described in response to paragraph (c) above. | |||
(h) | Not applicable. | |||
Item 5. Audit Committee of Listed Registrants. | ||||
Not applicable to the Registrant. | ||||
Item 6. Investments. | ||||
(a) | Schedule of Investments is included as part of the Reports to Stockholders filed under Item 1 of this Form N-CSR. | |||
(b) | Not applicable. | |||
Item 7. Disclosure of Proxy Voting Policies and Procedures for Closed-End Management Investment Companies. | ||||
Not applicable to the Registrant. | ||||
Item 8. Portfolio Managers of Closed-End Management Investment Companies. | ||||
Not applicable to the Registrant. | ||||
Item 9. Purchases of Equity Securities by Closed-End Management Investment Company and Affiliated Purchasers. | ||||
Not applicable to the Registrant. | ||
Item 10. Submission of Matters to a Vote of Security Holders. | ||
There have been no material changes to the procedures by which shareholders may recommend nominees to the Registrant’s Board of Trustees. | ||
Item 11. Controls and Procedures. | ||
| (a) | The Registrant’s principal executive officer and principal financial officer, or persons performing similar functions, have concluded that the Registrant’s disclosure controls and procedures (as defined in Rule 30a-3(c) under the Investment Company Act of 1940, as amended (the “1940 Act”) (17 CFR 270.30a-3(c))) are effective, as of a date within 90 days of the filing of this report that includes the disclosure required by this paragraph, based on their evaluation of these controls and procedures required by Rule 30a-3(b) under the 1940 Act (17 CFR 370.30a-3(b)) and Rules 13a-15(b) or 15d-15(b) under the Securities Exchange Act of 1934, as amended (17 CRF 240.13a-15(b) or 240.15d-15(b)). | |
| (b) | No changes in the Registrant’s internal control over financial reporting (as defined in Rule 30a-3(d) under the 1940 Act (17 CFR 270.30a-3(d)) occurred during the Registrant’s second fiscal quarter of the period covered by this report that has materially affected, or is reasonably likely to materially affect, the Registrant’s internal control over financial reporting. | |
Item 12. Exhibits. | ||
(a)(1) | The Registrant’s Code of Ethics for Principal Executive Officer and Senior Financial Officers, which is the subject of the disclosure required by Item 2 of Form N-CSR, is filed herewith. | |
(a)(2) | The certifications required by Rule 30a-2(a) of the 1940 Act and Section 302 of the Sarbanes-Oxley Act of 2002 are attached hereto as Ex99.Cert. | |
(a)(3) | None. | |
(b) | The certifications by the Registrant’s principal executive officer and principal financial officer, as required by Rule 30a-2(b) of the 1940 Act and Section 906 of the Sarbanes-Oxley Act of 2002 are attached hereto as Ex99.906Cert. | |
SIGNATURES
Pursuant to the requirements of the Securities Exchange Act of 1934 and the Investment Company Act of 1940, the Registrant has duly caused this report to be signed on its behalf by the undersigned, thereunto duly authorized.
ALPS SERIES TRUST
By: | /s/ Jeremy O. May | |
Jeremy O. May | ||
| President (Principal Executive Officer) | ||
Date: | December 6, 2013 | |
Pursuant to the requirements of the Securities Exchange Act of 1934 and the Investment Company Act of 1940, this report has been signed below by the following persons on behalf of the Registrant and in the capacities and on the dates indicated.
By: | /s/ Jeremy O. May | |
Jeremy O. May | ||
| President (Principal Executive Officer) | ||
Date: | December 6, 2013 | |
By: | /s/ Kimberly Storms | |
Kimberly Storms | ||
| Treasurer (Principal Financial Officer) | ||
Date: | December 6, 2013 | |