Table of Contents
UNITED STATES
SECURITIES AND EXCHANGE COMMISSION
Washington, D.C. 20549
FORM N-CSR
CERTIFIED SHAREHOLDER REPORT OF REGISTERED
MANAGEMENT INVESTMENT COMPANIES
Investment Company Act file number: 811-22747
ALPS SERIES TRUST
(Exact name of registrant as specified in charter)
1290 Broadway, Suite 1100, Denver, Colorado 80203
(Address of principal executive offices) (Zip code)
303.623.5277
(Registrant’s telephone number, including area code)
JoEllen L. Legg, Esq., Secretary
ALPS Series Trust
1290 Broadway, Suite 1100
Denver, CO 80203
(Name and address of agent for service)
Copy to:
Robert Robertson, Esq.
Dechert LLP
One Bush Street, Suite 1600
San Francisco, CA 94104-4446
Date of fiscal year end: September 30
Date of reporting period: October 1, 2013 – September 30, 2014
Table of Contents
Item 1. Reports to Stockholders.
Table of Contents
Table of Contents
|
| 1 | ||||
| 5 | ||||
| 8 | ||||
| 9 | ||||
| 15 | ||||
| 16 | ||||
| 17 | ||||
| 18 | ||||
| 19 | ||||
| 21 | ||||
| 31 | ||||
| 32 | ||||
| 33 | ||||
| 1-855-254-6467 | www.cogniosfunds.com |
Table of Contents
| Cognios Market Neutral Large Cap Fund | ||
|
September 30, 2014 (Unaudited) |
Dear Shareholder,
Thank you for investing in the Cognios Market Neutral Large Cap Fund (the “Fund”). We value this opportunity to offer insight into the Fund’s investment adviser, Cognios Capital, LLC.
At Cognios, we believe that all investors should have access to the investment strategies necessary to diversify their portfolios. However, market neutral equity investment strategies have historically been more common in the hedge fund industry. Launching the Cognios Market Neutral Large Cap Fund allowed us to offer our hedged strategy as an alternative investment to investors that either (a) traditionally have not been able to invest in hedge funds or (b) were hedge fund investors in the past, but who now prefer the daily liquidity1, enhanced transparency2, and absence of incentive fees provided in a mutual fund format.
Consistent with our core values, Cognios’ goal is to make sure that every shareholder has a thorough understanding of our investment strategies. Information is power, and we believe educated investors are better clients. Below we describe in general terms the investment strategy of the Fund. A more complete description is provided in the Fund’s Prospectus.
The Fund employs a Beta-adjusted long/short market neutral equity investment strategy. With this type of strategy, the investment adviser buys (takes long positions in) stocks of companies that it believes are likely to outperform securities that the adviser “sells short”. In a short sale, the adviser borrows shares of a stock and then sells those shares with the obligation to repurchase them at some future date. The long positions generally make money for a fund when those stocks go up in price (and pay dividends) and the short positions generally make money for a fund when their prices go down (as long as they go down more than the dividends paid by those stocks that were sold short). A fund is “Beta market neutral” when there is as much stock sold short as there are positions bought long after adjusting for each of the positions’ sensitivities to moves in the broad stock market, so the overall profits for the fund are “neutralized” to the overall movement of the stock market. Beta is a measure of the sensitivity of a stock’s price changes to broad stock market movements over time.
By attempting to hedge out all of the market Beta, the Fund’s returns over time should be essentially “pure Alpha” (i.e., Alpha is the excess return of a portfolio after considering its Beta exposure.)
When these long and short portfolios are combined to hedge out the market Beta, the market neutral pure Alpha portfolio can make or lose money whether the entire stock market is up or down. In general, as the broad stock market increases, the Fund is likely to make money on its long positions but lose money on its short positions. Conversely, in general, as the broad stock market declines, the Fund is likely to lose money on its long positions but make money on its short positions. So while the general direction of the stock market shouldn’t make much of a difference to the Fund’s returns, what does matter is how the long positions perform relative to the short positions. The Fund generally makes money when the long positions outperform the short positions, even if all of the long and short positions are up or even if all of the long and short positions are down.
Annual Report | September 30, 2014 | 1 |
Table of Contents
| Cognios Market Neutral Large Cap Fund | ||
Shareholder Letter |
September 30, 2014 (Unaudited) |
Because these risk factors are not likely to impact the Fund but are likely to impact many of the investments in the rest of an investor’s public equity portfolio (i.e., the Fund’s returns are likely to be uncorrelated with the overall stock market over time), the Fund potentially can serve to diversify an investment portfolio.
One potential risk in particular is worth highlighting in this market environment. Many investors are concerned that rising interest rates might lead to low or even negative returns in the future for their fixed income allocation. Rising interest rates could have negative potential implications for the stock market as well. When interest rates rise, market participants increase their required hurdle rate of return, resulting in a decline in the intrinsic values of stocks. Since we do not expect the Fund’s returns to be dependent upon general movements in interest rates over time, certain investors may want to consider a market neutral equity investment strategy, like the one employed by this Fund, to replace at least a portion of their longer term fixed income or equity investment allocations. Of course, each individual investor’s circumstances vary, but investors might want to discuss these possibilities with their qualified investment adviser.
Cognios selects stocks for the long and short portfolios using our firm’s proprietary investment process called ROTA/ROME® . The ROTA/ROME® investment process is a fundamental quantitative stock selection approach that focuses on a company’s Return on Tangible Assets (“ROTA”) and Return on Market value of Equity (“ROME,” which is essentially a company’s profit yield on its stock price). We believe that our ROTA/ROME process differentiates the Fund from other market neutral funds in that the Fund will exhibit more volatility when compared to other comparable funds; however, we believe that this also will lead to superior returns, resulting in superior risk-adjusted measures such as Sharpe Ratio3 and Sortino Ratio4. Additional details about the ROTA/ROME® investment process are outlined in the Fund’s prospectus. More information about the potential benefits of taking both long and short positions is available on the FAQ page of the Fund’s website, www.cogniosfunds.com.
Regarding performance of the Fund, NAV per share gained 12.41% including distributions for the Institutional Class Shares (COGIX) and gained 12.12% including distributions for the Investor Class Shares (COGMX) during the twelve months ended September 30, 2014. For the six months ended September 30, 2014, COGIX shares gained 6.60%, while the COGMX shares gained 6.42%.
The Fund held sixty-eight separate long positions and one hundred thirty-six separate short positions over the course of the last six months. Forty-seven of the sixty-eight long positions were profitable and thirty-six of the one hundred thirty-six short positions were profitable for the period. The long positions generated 17.6% gains on average equity capital while the short positions generated losses of 8.4% on average equity capital.
The performance data is obviously important; but since the portfolio is hedged, the independence of the performance versus the S&P 500 is also very important. Beta, Alpha, Correlation (a statistical measure of how two securities move in relation to each other) and R Squared are statistics that are commonly used to measure this independence. We track these measures on monthly basis (21 data points) and the data is presented in the tables below:
2 | www.cogniosfunds.com |
Table of Contents
| Cognios Market Neutral Large Cap Fund | ||
Shareholder Letter |
September 30, 2014 (Unaudited) |
| Beta to the S&P 500 | Annualized Alpha to the S&P 500 | |||
COGIX | 0.21 | 2.20% | ||
COGMX | 0.21 | 1.81% | ||
| Correlation of Returns to the S&P 500 | R Squared of Returns to the S&P 5005 | |||
COGIX | 27.1% | 7.3% | ||
COGMX | 27.8% | 7.7% | ||
As the tables above indicate, Beta, Correlation and R Squared are all low, meaning that the performance of the Fund is statistically independent of the performance of the S&P 500. Meanwhile, the Alpha of the Fund is positive, which is good, but we hope this statistic moves higher in the future with improved performance.
We at Cognios look forward to future opportunities to connect with our shareholders. We strive to continuously add value to your investment experience by providing access to fund information, portfolio updates and straightforward commentary.
If you have any questions regarding the Cognios Market Neutral Large Cap Fund, please contact your account manager or financial adviser, or call one of our shareholder associates at 855-254-6467. We also invite you to visit Cognios’ website at www.cognios.com to learn more about our firm, our team and our values.
We thank you for investing with Cognios and for the trust you have placed in us.
Sincerely,
|
| |||
Jonathan Angrist
| Brian Machtley | |||
Portfolio Managers | ||||
Cognios Capital, LLC | ||||


| 1 | Purchases and redemptions may be made on any day the New York Stock Exchange is open for trading. You may purchase and sell shares directly with the Fund through the Fund’s website at www.cogniosfunds.com. |
| 2 | The Fund’s holdings will be updated quarterly at www.cogniosfunds.com. |
| 3 | The Sharpe Ratio is a ratio to measure risk-adjusted performance. The Sharpe ratio is calculated by subtracting the risk-free rate - such as that of the 10-year U.S. Treasury bond - from the rate of return for a portfolio and dividing the result by the standard deviation of the portfolio returns. |
Annual Report | September 30, 2014 | 3 |
Table of Contents
| Cognios Market Neutral Large Cap Fund | ||
Shareholder Letter |
September 30, 2014 (Unaudited) |
| 4 | The Sortino Ratio is a modification of the Sharpe ratio that differentiates harmful volatility from general volatility by taking into account the standard deviation of negative asset returns, called downside deviation. |
| 5 | R Squared is the coefficient of determination and indicates how well data points fit in a model. In the example in the above table, 7.3% of the monthly movement in share price of COGIX can be explained by the movement of the S&P 500. |
4 | www.cogniosfunds.com |
Table of Contents
| Cognios Market Neutral Large Cap Fund | ||
|
September 30, 2014 (Unaudited) |
Performance (as of September 30, 2014)
Six Month | 1 Year | Since Inception* | ||||
Cognios Market Neutral Large Cap Fund - Investor | 6.42% | 12.12% | 6.34% | |||
Cognios Market Neutral Large Cap Fund - Institutional | 6.60% | 12.41% | 6.62% | |||
S&P 500® Total Return Index(a) | 6.42% | 19.73% | 22.92% | |||
HFRX Equity Hedge Market Neutral Index(b) | 0.54% | 4.90% | 2.50% | |||
HFRI Equity Hedge Market Neutral(c) | 0.91% | 4.74% | 4.91% |
The performance data quoted above represents past performance. Past performance is not a guarantee of future results. Investment return and value of the Fund shares will fluctuate so that an investor’s shares, when sold or redeemed, may be worth more or less than their original cost. Performance may be lower or higher than performance data quoted. Fund performance current to the most recent month-end is available by calling 855.254.6467 or by visiting www. cogniosfunds.com.
| * | Fund’s inception date is December 31, 2012. |
| (a) | The S&P 500® Total Return Index is an unmanaged index of 500 common stocks chosen for the market size, liquidity and industry group representation. It is a market-value weighted index. |
| (b) | The HFRX Equity Hedge Market Neutral Index – As of September 30, 2014, the secondary benchmark for the Fund was changed from the HFRI Equity Hedge Market Neutral Index to the HFRX Equity Market Neutral Index. The methodology used to construct the HFRX Equity Market Neutral Index requires that funds have a performance record of at least 12 months and assets greater than $50 million to be included as a constituent of the Index. The HFRX Equity Market Neutral Index also required funds to trade on a transparent basis and be open to new investors. As such, the Adviser believes that the methodology used and components of the HFRX Equity Hedge Market Neutral Index represent a more mature and accessible peer group for performance comparison and help to minimize selection, survivorship and reporting bias for the index. Both index returns and index methodology are provided by Hedge Fund Research Inc. |
| (c) | The HFRI Equity Hedge Market Neutral Index is a common benchmark for long/short market neutral hedge funds (funds traditionally only available to high net-worth accredited and institutional investors that are also “qualified clients” as defined by the SEC). More information about this index may be found at www.hedgefundresearch.com. |
Returns of less than one year are cumulative.
Indices are not actively managed and do not reflect deduction for fees, expenses or taxes. An investor cannot invest directly into an index.
The returns shown above do not reflect the deduction of taxes a shareholder would pay on Fund distributions or redemption of Fund shares.
The total annual operating expenses and total annual operating expenses after fee waivers and/or reimbursement you may pay as an investor in the Fund’s Investor Class and Institutional Class shares (as reported in the January 28, 2014 Prospectus) are 7.44% and 4.13%; and 7.19% and 3.88%, respectively.
Annual Report | September 30, 2014 | 5 |
Table of Contents
| Cognios Market Neutral Large Cap Fund | ||
Portfolio Update |
September 30, 2014 (Unaudited) |
Performance of $10,000 Initial Investment (as of September 30, 2014)
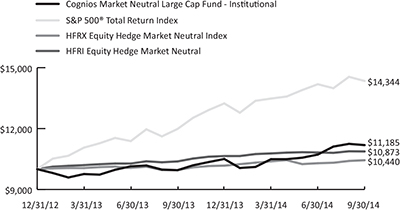
The graph shown above represents historical performance of a hypothetical investment of $10,000 in the Fund since inception. Past performance does not guarantee future results. All returns reflect reinvested dividends, but do not reflect the deduction of taxes that a shareholder would pay on Fund distributions or the redemption of Fund shares.
Sector Allocation (as a % of Net Assets)*
Basic Materials - Long | 4.32% | |||
Basic Materials (Short) | -17.80% | |||
Communications - Long | 17.53% | |||
Communications (Short) | -15.99% | |||
Consumer Cyclical - Long | 12.18% | |||
Consumer Cyclical (Short) | -13.91% | |||
Consumer Non-cyclical - Long | 24.06% | |||
Consumer Non-cyclical (Short) | -3.76% | |||
Diversified (Short) | -0.07% | |||
Energy - Long | 17.40% | |||
Energy (Short) | -12.99% | |||
Financials - Long | 3.75% | |||
Financials (Short) | -15.21% | |||
Industrials - Long | 10.60% | |||
Industrials (Short) | -9.66% | |||
Technology - Long | 21.61% | |||
Technology (Short) | -2.72% | |||
Utilities - Long | 6.32% | |||
Cash, Cash Equivalents, & Other Net Assets | 74.34% | |||
| ||||
TOTAL | 100.00% | |||
| ||||
| * | Holdings are subject to change. Table presents indicative values only. |
6 | www.cogniosfunds.com |
Table of Contents
| Cognios Market Neutral Large Cap Fund | ||
Portfolio Update |
September 30, 2014 (Unaudited) |
Top 10 Long Positions (as a % of Net Assets)*
| Security | Ticker | Weight | ||
Edwards Lifesciences Corp. | EW | 6.32% | ||
ADT Corp. | ADT | 5.93% | ||
L-3 Communications Holdings, Inc. | LLL | 4.34% | ||
CF Industries Holdings, Inc. | CF | 4.32% | ||
Raytheon Co. | RTN | 4.23% | ||
Bed Bath & Beyond, Inc. | BBBY | 4.10% | ||
NetApp, Inc. | NTAP | 4.08% | ||
Expedia, Inc. | EXPE | 4.03% | ||
EMC Corp. | EMC | 4.00% | ||
DIRECTV | DTV | 3.99% |
| * | Holdings are subject to change. Table presents indicative values only. |
Annual Report | September 30, 2014 | 7 |
Table of Contents
| Cognios Market Neutral Large Cap Fund | ||
|
September 30, 2014 (Unaudited) |
Examples. As a shareholder of the Cognios Market Neutral Large Cap Fund (the “Fund”), you will incur two types of costs: (1) transaction costs, (2) ongoing costs, including management fees, distribution and service (12b-1) fees and other Fund expenses. The following examples are intended to help you understand your ongoing costs (in dollars) of investing in the Fund and to compare these costs with the ongoing costs of investing in other mutual funds. The examples are based on an investment of $1,000 invested on April 1, 2014 and held until September 30, 2014.
Actual Expenses. The first line under each class in the table below provides information about actual account values and actual expenses. You may use the information in this line, together with the amount you invested, to estimate the expenses that you paid over the period. Simply divide your account value by $1,000 (for example, an $8,600 account value divided by $1,000 = 8.6), then multiply the result by the number in the first line under the heading “Expenses Paid During Period April 1, 2014 - September 30, 2014” to estimate the expenses you paid on your account during this period.
Hypothetical Example for Comparison Purposes. The second line under each class in the table below provides information about hypothetical account values and hypothetical expenses based on the Fund’s actual expense ratio and an assumed rate of return of 5% per year before expenses, which is not the Fund’s actual return. The hypothetical account values and expenses may not be used to estimate the actual ending account balance or expenses you paid for the period. You may use this information to compare the ongoing costs of investing in the Fund and other mutual funds. To do so, compare this 5% hypothetical example with the 5% hypothetical examples that appear in the shareholder reports of the other funds.
Please note that the expenses shown in the table are meant to highlight your ongoing costs only and do not reflect any transactional costs, such as redemption fees. Therefore, the second line under each class in the table below is useful in comparing ongoing costs only and will not help you determine the relative total costs of owning different funds. In addition, if these transactional costs were included, your costs would have been higher.
| Beginning Account Value April 1, 2014 | Ending Account Value September 30, 2014 | Expense Ratio(a) | Expenses Paid During Period April 1, 2014 - September 30, 2014(b) | |||||||
Investor Class | ||||||||||
Actual | $ 1,000.00 | $ 1,064.20 | 4.23% | $ 21.89 | ||||||
Hypothetical (5% return before expenses) | $ 1,000.00 | $ 1,003.86 | 4.23% | $ 21.25 | ||||||
Institutional Class | ||||||||||
Actual | $ 1,000.00 | $ 1,066.00 | 4.00% | $ 20.72 | ||||||
Hypothetical (5% return before expenses) | $ 1,000.00 | $ 1,005.01 | 4.00% | $ 20.11 | ||||||
| (a) | Annualized, based on the Fund’s most recent fiscal half-year expenses. Expense ratio excluding interest expense and dividends paid on borrowed securities is 2.25% and 2.00% for Investor Class and Institutional Class, respectively. |
| (b) | Expenses are equal to the Fund’s annualized expense ratio, multiplied by the average account value over the period, multiplied by the number of days in the most recent fiscal half year (183), divided by 365. |
8 | www.cogniosfunds.com |
Table of Contents
| Cognios Market Neutral Large Cap Fund | ||
| September 30, 2014
|
| Shares | Value (Note 2) | |||||||
| ||||||||
COMMON STOCKS (117.77%) |
| |||||||
Basic Materials (4.32%) |
| |||||||
CF Industries Holdings, Inc.(a) | 2,261 | $ | 631,316 | |||||
|
| |||||||
Total Basic Materials | 631,316 | |||||||
|
| |||||||
Communications (17.53%) | ||||||||
Cablevision Systems Corp. - Class A | 31,434 | 550,409 | ||||||
Corning, Inc. | 15,069 | 291,435 | ||||||
DIRECTV(b) | 6,744 | 583,491 | ||||||
Expedia, Inc.(a) | 6,713 | 588,193 | ||||||
Harris Corp. | 8,238 | 547,003 | ||||||
|
| |||||||
Total Communications | 2,560,531 | |||||||
|
| |||||||
Consumer Cyclical (12.18%) | ||||||||
Bed Bath & Beyond, Inc.(a)(b) | 9,093 | 598,592 | ||||||
Delta Air Lines, Inc.(a) | 7,905 | 285,766 | ||||||
GameStop Corp. - Class A | 13,678 | 563,534 | ||||||
Southwest Airlines Co.(a) | 9,795 | 330,777 | ||||||
|
| |||||||
Total Consumer Cyclical | 1,778,669 | |||||||
|
| |||||||
Consumer Non-cyclical (24.06%) | ||||||||
ADT Corp.(a) | 24,410 | 865,579 | ||||||
Aetna, Inc.(a) | 3,825 | 309,825 | ||||||
CR Bard, Inc.(a) | 3,891 | 555,285 | ||||||
Edwards Lifesciences Corp.(b) | 9,036 | 923,027 | ||||||
WellPoint, Inc. | 2,727 | 326,204 | ||||||
Western Union Co. | 33,339 | 534,757 | ||||||
|
| |||||||
Total Consumer Non-cyclical | 3,514,677 | |||||||
|
| |||||||
Energy (17.40%) | ||||||||
Chesapeake Energy Corp.(a) | 5,688 | 130,767 | ||||||
Denbury Resources, Inc. | 18,486 | 277,845 | ||||||
Devon Energy Corp. | 4,184 | 285,265 | ||||||
Ensco PLC - Class A(a) | 6,244 | 257,940 | ||||||
Murphy Oil Corp.(a) | 5,073 | 288,704 | ||||||
Newfield Exploration Co.(a)(b) | 7,073 | 262,196 | ||||||
Noble Corp. PLC | 11,113 | 246,931 | ||||||
Southwestern Energy Co.(b) | 14,218 | 496,919 | ||||||
Tesoro Corp.(a) | 4,836 | 294,899 | ||||||
|
| |||||||
Total Energy | 2,541,466 | |||||||
|
| |||||||
Financials (3.75%) | ||||||||
Affiliated Managers Group, Inc.(a)(b) | 2,737 | 548,385 | ||||||
|
| |||||||
Total Financials | 548,385 | |||||||
|
| |||||||
| See Notes to Financial Statements. | ||
Annual Report | September 30, 2014 | 9 | |
Table of Contents
| Cognios Market Neutral Large Cap Fund | ||
Portfolio of Investments
|
September 30, 2014 |
| Shares | Value (Note 2) | |||||||||||
| ||||||||||||
Industrials (10.60%) |
| |||||||||||
L-3 Communications Holdings, Inc.(a) |
| 5,325 | $ | 633,249 | ||||||||
Raytheon Co. |
| 6,073 | 617,138 | |||||||||
Textron, Inc.(a) |
| 8,264 | 297,422 | |||||||||
|
| |||||||||||
Total Industrials |
| 1,547,809 | ||||||||||
|
| |||||||||||
Technology (21.61%) | ||||||||||||
Apple, Inc. |
| 5,681 | 572,361 | |||||||||
CA, Inc. |
| 20,696 | 578,246 | |||||||||
EMC Corp. |
| 19,975 | 584,469 | |||||||||
Hewlett-Packard Co. |
| 8,335 | 295,642 | |||||||||
NetApp, Inc.(a) |
| 13,855 | 595,211 | |||||||||
Seagate Technology PLC |
| 9,260 | 530,320 | |||||||||
|
| |||||||||||
Total Technology |
| 3,156,249 | ||||||||||
|
| |||||||||||
Utilities (6.32%) | ||||||||||||
Consolidated Edison, Inc.(a) |
| 5,424 | 307,324 | |||||||||
Entergy Corp.(a) |
| 4,062 | 314,114 | |||||||||
Pinnacle West Capital Corp.(a) |
| 5,514 | 301,285 | |||||||||
|
| |||||||||||
Total Utilities |
| 922,723 | ||||||||||
|
| |||||||||||
TOTAL COMMON STOCKS (Cost $16,907,824) |
| 17,201,825 | ||||||||||
| ||||||||||||
| 7-Day Yield | Shares | Value (Note 2) | ||||||||||
| ||||||||||||
SHORT TERM INVESTMENTS (0.32%) | ||||||||||||
Money Market Fund (0.32%) | ||||||||||||
Daily Income Fund - U.S. Treasury | 0.01000% | 46,378 | 46,378 | |||||||||
|
| |||||||||||
TOTAL SHORT TERM INVESTMENTS (Cost $46,378) | 46,378 | |||||||||||
| ||||||||||||
TOTAL INVESTMENTS (118.09%) (Cost $16,954,202) | $ | 17,248,203 | ||||||||||
| ||||||||||||
SECURITIES SOLD SHORT (-92.11%) (Proceeds $13,529,415) | (13,453,215) | |||||||||||
| ||||||||||||
Other Assets In Excess Of Liabilities (74.02%) | 10,811,307 (c) | |||||||||||
| ||||||||||||
NET ASSETS (100.00%) | $ | 14,606,295 | ||||||||||
| ||||||||||||
| See Notes to Financial Statements. | ||
10 | www.cogniosfunds.com |
Table of Contents
| Cognios Market Neutral Large Cap Fund | ||
Portfolio of Investments
|
September 30, 2014 |
| Shares | Value (Note 2) | |||||||
| ||||||||
SCHEDULE OF SECURITIES SOLD SHORT | ||||||||
COMMON STOCKS (-92.11%) | ||||||||
Basic Materials (-17.80%) |
| |||||||
Alcoa, Inc. | (19,424) | $ | (312,532) | |||||
Allegheny Technologies, Inc. | (3,553) | (131,816) | ||||||
EI du Pont de Nemours & Co. | (11,272) | (808,879) | ||||||
FMC Corp. | (2,258) | (129,135) | ||||||
Freeport-McMoRan, Inc. | (9,474) | (309,326) | ||||||
MeadWestvaco Corp. | (3,481) | (142,512) | ||||||
Monsanto Co. | (3,048) | (342,931) | ||||||
The Mosaic Co. | (3,076) | (136,605) | ||||||
Nucor Corp. | (5,273) | (286,218) | ||||||
|
| |||||||
Total Basic Materials | (2,599,954) | |||||||
|
| |||||||
Communications (-15.99%) | ||||||||
CBS Corp. - Class B | (3,658) | (195,703) | ||||||
Discovery Communications, Inc. - Class A | (1,599) | (60,442) | ||||||
Facebook, Inc. | (4,698) | (371,330) | ||||||
Graham Holdings Co. - Class B | (208) | (145,515) | ||||||
Interpublic Group of Cos., Inc. | (4,023) | (73,701) | ||||||
News Corp. - Class A | (4,431) | (72,447) | ||||||
The Priceline Group, Inc. | (282) | (326,719) | ||||||
TripAdvisor, Inc. | (978) | (89,409) | ||||||
Twenty-First Century Fox, Inc. - Class A | (9,822) | (336,796) | ||||||
Yahoo! Inc | (16,273) | (663,125) | ||||||
|
| |||||||
Total Communications | (2,335,187) | |||||||
|
| |||||||
Consumer Cyclical (-13.91%) | ||||||||
BorgWarner, Inc. | (1,690) | (88,911) | ||||||
CarMax, Inc. | (3,601) | (167,266) | ||||||
Carnival Corp. | (5,344) | (214,668) | ||||||
DR Horton, Inc. | (6,922) | (142,039) | ||||||
Ford Motor Co. | (22,478) | (332,450) | ||||||
Goodyear Tire & Rubber Co. | (5,781) | (130,564) | ||||||
Harman International Industries, Inc. | (690) | (67,648) | ||||||
Lennar Corp. - Class A | (3,813) | (148,059) | ||||||
Michael Kors Holdings, Ltd. | (1,522) | (108,656) | ||||||
Mohawk Industries, Inc. | (1,203) | (162,188) | ||||||
PVH Corp. | (1,352) | (163,795) | ||||||
Tiffany & Co. | (2,113) | (203,503) | ||||||
Whirlpool Corp. | (701) | (102,101) | ||||||
|
| |||||||
Total Consumer Cyclical | (2,031,848) | |||||||
|
| |||||||
| See Notes to Financial Statements. | ||
Annual Report | September 30, 2014 | 11 | |
Table of Contents
| Cognios Market Neutral Large Cap Fund | ||
Portfolio of Investments
|
September 30, 2014 |
| Shares | Value (Note 2) | |||||||
| ||||||||
Consumer Non-cyclical (-3.76%) | ||||||||
Avery Dennison Corp. | (1,426) | $ | (63,671) | |||||
Biogen Idec, Inc. | (1,022) | (338,088) | ||||||
Tenet Healthcare Corp. | (2,474) | (146,931) | ||||||
|
| |||||||
Total Consumer Non-cyclical | (548,690) | |||||||
|
| |||||||
Diversified (-0.07%) | ||||||||
Leucadia National Corp. | (410) | (9,774) | ||||||
|
| |||||||
Total Diversified | (9,774) | |||||||
|
| |||||||
Energy (-12.99%) | ||||||||
Apache Corp. | (3,482) | (326,855) | ||||||
Baker Hughes, Inc. | (7,214) | (469,343) | ||||||
Cameron International Corp. | (3,335) | (221,377) | ||||||
CONSOL Energy, Inc. | (3,819) | (144,587) | ||||||
Nabors Industries, Ltd. | (2,922) | (66,505) | ||||||
Peabody Energy Corp. | (9,596) | (118,798) | ||||||
QEP Resources, Inc. | (2,220) | (68,332) | ||||||
Rowan Cos. PLC - Class A | (2,563) | (64,870) | ||||||
Transocean, Ltd. | (3,274) | (104,670) | ||||||
The Williams Cos, Inc. | (5,644) | (312,395) | ||||||
|
| |||||||
Total Energy | (1,897,732) | |||||||
|
| |||||||
Financials (-15.21%) | ||||||||
American Express Co. | (1,301) | (113,890) | ||||||
American International Group, Inc. | (1,785) | (96,426) | ||||||
Ameriprise Financial, Inc. | (233) | (28,748) | ||||||
Bank of America Corp. | (13,078) | (222,980) | ||||||
Bank of New York Mellon Corp. | (1,406) | (54,454) | ||||||
BB&T Corp. | (892) | (33,191) | ||||||
BlackRock, Inc. | (207) | (67,962) | ||||||
Capital One Financial Corp. | (702) | (57,297) | ||||||
Charles Schwab Corp. | (1,619) | (47,582) | ||||||
Citigroup, Inc. | (3,782) | (195,983) | ||||||
Comerica, Inc. | (205) | (10,221) | ||||||
Discover Financial Services | (572) | (36,831) | ||||||
E*Trade Financial Corp. | (327) | (7,387) | ||||||
Fifth Third Bancorp | (1,040) | (20,821) | ||||||
General Growth Properties, Inc. - REIT | (1,110) | (26,140) | ||||||
Genworth Financial, Inc. - Class A | (553) | (7,244) | ||||||
Goldman Sachs Group, Inc. | (551) | (101,147) | ||||||
The Hartford Financial Services Group, Inc. | (558) | (20,786) | ||||||
Host Hotels & Resorts, Inc. - REIT | (945) | (20,157) | ||||||
| See Notes to Financial Statements. | ||
12 | www.cogniosfunds.com |
Table of Contents
| Cognios Market Neutral Large Cap Fund | ||
Portfolio of Investments
|
September 30, 2014 |
| Shares | Value (Note 2) | |||||||
| ||||||||
Financials (continued) | ||||||||
Huntington Bancshares, Inc. | (890) | $ | (8,660) | |||||
JPMorgan Chase & Co. | (4,689) | (282,465) | ||||||
KeyCorp | (989) | (13,183) | ||||||
Kimco Realty Corp. - REIT | (454) | (9,947) | ||||||
Lincoln National Corp. | (324) | (17,360) | ||||||
Macerich Co. - REIT | (155) | (9,894) | ||||||
Morgan Stanley | (2,442) | (84,420) | ||||||
Navient Corp. | (457) | (8,093) | ||||||
PNC Financial Services Group, Inc. | (675) | (57,767) | ||||||
Principal Financial Group, Inc. | (368) | (19,309) | ||||||
Prologis, Inc. - REIT | (625) | (23,563) | ||||||
Prudential Financial, Inc. | (570) | (50,126) | ||||||
Regions Financial Corp. | (1,718) | (17,249) | ||||||
State Street Corp. | (526) | (38,719) | ||||||
SunTrust Banks, Inc. | (660) | (25,100) | ||||||
Unum Group | (287) | (9,867) | ||||||
Vornado Realty Trust - REIT | (235) | (23,491) | ||||||
Wells Fargo & Co. | (6,502) | (337,259) | ||||||
XL Group PLC | (301) | (9,984) | ||||||
Zions Bancorporation | (208) | (6,044) | ||||||
|
| |||||||
Total Financials | (2,221,747) | |||||||
|
| |||||||
Industrials (-9.66%) | ||||||||
Agilent Technologies, Inc. | (2,496) | (142,222) | ||||||
Deere & Co. | (3,226) | (264,500) | ||||||
General Electric Co. | (15,212) | (389,731) | ||||||
Ingersoll-Rand PLC | (2,018) | (113,734) | ||||||
Martin Marietta Materials, Inc. | (540) | (69,628) | ||||||
Ryder System, Inc. | (867) | (78,004) | ||||||
Sealed Air Corp. | (4,116) | (143,566) | ||||||
Vulcan Materials Co. | (2,352) | (141,661) | ||||||
Xylem, Inc. | (1,908) | (67,715) | ||||||
|
| |||||||
Total Industrials | (1,410,761) | |||||||
|
| |||||||
Technology (-2.72%) | ||||||||
Adobe Systems, Inc. | (3,708) | (256,557) | ||||||
| See Notes to Financial Statements. | ||
Annual Report | September 30, 2014 | 13 | |
Table of Contents
| Cognios Market Neutral Large Cap Fund | ||
Portfolio of Investments
|
September 30, 2014 |
| Shares | Value (Note 2) | |||||||
| ||||||||
Technology (continued) | ||||||||
First Solar, Inc. | (2,142) | $ | (140,965) | |||||
|
| |||||||
Total Technology | (397,522) | |||||||
|
| |||||||
TOTAL COMMON STOCKS (Proceeds $13,529,415) | (13,453,215) | |||||||
| ||||||||
TOTAL SECURITIES SOLD SHORT (-92.11%) (Proceeds $13,529,415) | $ | (13,453,215) | ||||||
| ||||||||
| (a) | Security, or a portion of security, is being held as collateral for short sales. As of September 30, 2014, the aggregate market value of those securities was $8,031,363, which represents approximately 54.99% of net assets. |
| (b) | Non-income producing security. |
| (c) | Includes segregated cash that is being held as collateral for securities sold short. |
Common Abbreviations:
Ltd - Limited
PLC - Public Limited Company.
REIT - Real Estate Investment Trust.
For Fund compliance purposes, the Fund’s industry classifications refer to any one of the industry sub-classifications used by one or more widely recognized market indexes and/or as defined by the Fund’s management. This definition may not apply for purposes of this report, which may combine industry sub-classifications for reporting ease. Industries are shown as a percent of the Fund’s net assets. (unaudited)
| See Notes to Financial Statements. | ||
14 | www.cogniosfunds.com |
Table of Contents
| Cognios Market Neutral Large Cap Fund | ||
Statement of Assets and Liabilities
|
September 30, 2014 |
ASSETS: | ||||
Investments, at value (cost $16,954,202) | $ | 17,248,203 | ||
Segregated cash with brokers | 19,554 | |||
Deposit with broker for securities sold short (Note 2) | 10,804,078 | |||
Receivable for shares sold | 40,000 | |||
Due from advisor | 3,783 | |||
Dividends receivable | 7,293 | |||
Prepaid assets | 9,359 | |||
|
| |||
Total Assets | 28,132,270 | |||
|
| |||
LIABILITIES: | ||||
Securities sold short (proceeds $13,529,415) | 13,453,215 | |||
Payable for dividends on short sales | 11,000 | |||
Payable for distribution and service fees | 1,163 | |||
Payable to trustees | 144 | |||
Payable to chief compliance officer | 1,667 | |||
Payable to principal financial officer | 833 | |||
Accrued expenses and other liabilities | 57,953 | |||
|
| |||
Total Liabilities | 13,525,975 | |||
|
| |||
NET ASSETS | $ | 14,606,295 | ||
|
| |||
NET ASSETS CONSIST OF: | ||||
Paid-in capital (Note 5) | $ | 12,930,894 | ||
Accumulated net investment loss | (45) | |||
Accumulated net realized gain on investments and securities sold short | 1,305,245 | |||
Net unrealized appreciation on investments and securities sold short | 370,201 | |||
|
| |||
NET ASSETS | $ | 14,606,295 | ||
|
| |||
PRICING OF SHARES | ||||
Investor Class: | ||||
Net Asset Value, offering and redemption price per share | $ | 10.77 | ||
Net Assets | $ | 5,699,437 | ||
Shares of beneficial interest outstanding | 528,991 | |||
Institutional Class: | ||||
Net Asset Value, offering and redemption price per share | $ | 10.82 | ||
Net Assets | $ | 8,906,858 | ||
Shares of beneficial interest outstanding | 823,373 | |||
| See Notes to Financial Statements. | ||
Annual Report | September 30, 2014 | 15 | |
Table of Contents
| Cognios Market Neutral Large Cap Fund | ||
|
For the Year Ended September 30, 2014 |
INVESTMENT INCOME: | ||||
Dividends | 398,403 | |||
|
| |||
Total Investment Income | 398,403 | |||
|
| |||
EXPENSES: | ||||
Investment advisory fee (Note 6) | 228,509 | |||
Dividend expense on securities sold short | 196,940 | |||
Interest expense | 110,311 | |||
Administration fee | 120,465 | |||
Distribution and service fees | 13,273 | |||
Custodian fee | 10,012 | |||
Legal fees | 30,140 | |||
Audit fees | 15,850 | |||
Transfer agent fee | 39,641 | |||
Trustees fees and expenses | 17,436 | |||
Registration and filing fees | 27,556 | |||
Printing fees | 7,997 | |||
Chief compliance officer fee | 20,000 | |||
Principal financial officer fee | 10,000 | |||
Insurance expense | 11,828 | |||
Other expenses | 8,233 | |||
|
| |||
Total Expenses | 868,191 | |||
|
| |||
Less fees waived/reimbursed by investment adviser | ||||
Investor Class | (92,011) | |||
Institutional Class | (125,422) | |||
|
| |||
Total fees waived/reimbursed by investment adviser (Note 6) | (217,433) | |||
|
| |||
Less fess waived by Administrator (Note 6) | (25,556) | |||
|
| |||
Net Expenses | 625,202 | |||
|
| |||
NET INVESTMENT LOSS | (226,799) | |||
|
| |||
REALIZED AND UNREALIZED GAIN/(LOSS) ON INVESTMENTS: | ||||
Net realized gain/(loss) on: | ||||
Investments | 5,376,751 | |||
Securities sold short | (3,617,570) | |||
|
| |||
Net realized gain | 1,759,181 | |||
|
| |||
Change in appreciation/(depreciation) on | (314,873) | |||
Securities sold short | 920,110 | |||
|
| |||
Net change | 605,237 | |||
|
| |||
NET REALIZED AND UNREALIZED GAIN ON INVESTMENTS AND SECURITIES SOLD SHORT | 2,364,418 | |||
|
| |||
NET INCREASE IN NET ASSETS RESULTING FROM OPERATIONS | $ | 2,137,619 | ||
|
| |||
| See Notes to Financial Statements. | ||
16 | www.cogniosfunds.com |
Table of Contents
| Cognios Market Neutral Large Cap Fund | ||
Statements of Changes in Net Assets
|
For the Year Ended September 30, 2014 | For the Period Ended September 30, 2013(a) | |||||||
| ||||||||
OPERATIONS: | ||||||||
Net investment loss | $ | (226,799) | $ | (122,150) | ||||
Net realized gain on investments and securities sold short | 1,759,181 | 276,717 | ||||||
Net change in unrealized appreciation/(depreciation) on investments and securities sold short | 605,237 | (235,036) | ||||||
|
|
|
| |||||
Net increase/(decrease) in net assets resulting from operations | 2,137,619 | (80,469) | ||||||
|
|
|
| |||||
DISTRIBUTIONS TO SHAREHOLDERS: | ||||||||
From net realized gains on investments: | ||||||||
Investor Class | (170,799) | – | ||||||
Institutional Class | (215,970) | – | ||||||
|
|
|
| |||||
Total distributions | (386,769) | – | ||||||
|
|
|
| |||||
BENEFICIAL SHARE TRANSACTIONS (Note 5): | ||||||||
Investor Class: | ||||||||
Shares sold | 125,097 | 5,053,401 | ||||||
Dividends reinvested | 170,799 | – | ||||||
Shares redeemed | (105,773) | (41) | ||||||
|
|
|
| |||||
Net increase from beneficial share transactions | 190,123 | 5,053,360 | ||||||
|
|
|
| |||||
Institutional Class: | ||||||||
Shares sold | 35,902,787 | 6,138,562 | ||||||
Dividends reinvested | 215,970 | – | ||||||
Shares redeemed | (34,648,888) | (16,000) | ||||||
|
|
|
| |||||
Net increase from beneficial share transactions | 1,469,869 | 6,122,562 | ||||||
|
|
|
| |||||
Net increase in net assets | 3,410,842 | 11,095,453 | ||||||
|
|
|
| |||||
NET ASSETS: | ||||||||
Beginning of period | 11,195,453 | 100,000 | ||||||
|
|
|
| |||||
End of period (including accumulated net investment loss of $(45) and $(144)) | $ | 14,606,295 | $ | 11,195,453 | ||||
|
|
|
| |||||
| (a) | Commenced operations on January 2, 2013. |
| See Notes to Financial Statements. | ||
Annual Report | September 30, 2014 | 17 | |
Table of Contents
| Cognios Market Neutral Large Cap Fund | ||
|
For the Year Ended September 30, 2014 |
CASH FLOWS FROM OPERATING ACTIVITIES: | ||||
Net increase in net assets from operations | $ | 2,137,619 | ||
Adjustments to reconcile net increase in net assets from operations to net cash used in operating activities: | ||||
Purchases of investment securities | (83,091,031) | |||
Proceeds from disposition of investment securities | 84,300,876 | |||
Proceeds from securities sold short transactions | 54,285,333 | |||
Purchases to cover securities sold short transactions | (54,320,801) | |||
Net purchases from short-term investment securities | (17,237) | |||
Net realized gain on investments and securities sold short | (1,759,181) | |||
Net change in unrealized appreciation on investments and securities sold short | (605,237) | |||
Changes in assets and liabilities: | ||||
Increase in segregated cash with brokers | (9,939) | |||
Increase in deposit with broker for securities sold short | (2,178,024) | |||
Decrease in receivable due from adviser | 4,374 | |||
Decrease in dividends receivable | 7,949 | |||
Increase in prepaid assets | (2,888) | |||
Decrease in payable for dividends on short sales | (514) | |||
Increase in payable for distribution and service fees | 128 | |||
Decrease in payable to trustees | (662) | |||
Increase in other accrued expenses and other liabilities | 16,012 | |||
| ||||
Net cash used in operating activities | (1,233,223) | |||
| ||||
CASH FLOWS PROVIDED BY FINANCING ACTIVITIES: | ||||
Proceeds from sale of shares | 35,987,884 | |||
Cost of shares redeemed | (34,754,661) | |||
| ||||
Net cash provided by financing activities | 1,233,223 | |||
| ||||
NET INCREASE IN CASH FOR THE PERIOD | – | |||
| ||||
CASH, BEGINNING OF PERIOD | $ | – | ||
CASH, END OF PERIOD | $ | – | ||
SUPPLEMENTAL DISCLOSURE OF CASH FLOW INFORMATION: | ||||
Non-cash financing activities not included herein consist of reinvestment of distributions of: | $ | 386,769 | ||
| See Notes to Financial Statements. | ||
18 | www.cogniosfunds.com |
Table of Contents
| Cognios Market Neutral Large Cap Fund - Investor Class | Financial Highlights | |
For a share outstanding throughout the periods presented. |
For the Year Ended September 30, 2014 | For the Period Ended September 30, 2013(a) | |||||||
| ||||||||
NET ASSET VALUE, BEGINNING OF PERIOD | $ | 9.93 | $ | 10.00 | ||||
INCOME/(LOSS) FROM OPERATIONS: | ||||||||
Net investment loss(b) | (0.17) | (0.12) | ||||||
Net realized and unrealized gain on investments | 1.35 | 0.05 | ||||||
|
| |||||||
Total from Investment Operations | 1.18 | (0.07) | ||||||
|
| |||||||
LESS DISTRIBUTIONS: | ||||||||
From net realized gains on investments | (0.34) | – | ||||||
|
| |||||||
Total Distributions | (0.34) | – | ||||||
|
| |||||||
NET INCREASE/(DECREASE) IN NET ASSET VALUE | 0.84 | (0.07) | ||||||
|
| |||||||
NET ASSET VALUE, END OF PERIOD | $ | 10.77 | $ | 9.93 | ||||
|
| |||||||
TOTAL RETURN(c) | 12.12 | % | (0.70)%(d) | |||||
SUPPLEMENTAL DATA: | ||||||||
Net assets, End of Period (in 000s) | $ | 5,699 | $ | 5,067 | ||||
RATIOS TO AVERAGE NET ASSETS (excluding interest expense and dividend expense on securities sold short) | ||||||||
Operating expenses excluding reimbursement/waiver | 4.15 | % | 4.38%(e) | |||||
Operating expenses including reimbursement/waiver | 2.25 | % | 2.25%(e) | |||||
Net investment income including reimbursement/waiver | 0.30 | % | 0.19%(e) | |||||
RATIOS TO AVERAGE NET ASSETS (including interest expense and dividend expense on securities sold short) | ||||||||
Operating expenses excluding reimbursement/waiver | 6.16 | % | 6.27%(e) | |||||
Operating expenses including reimbursement/waiver | 4.26 | % | 4.13%(e) | |||||
Net investment loss including reimbursement/waiver | (1.71) | % | (1.69)%(e) | |||||
PORTFOLIO TURNOVER RATE | 461 | % | 155%(d) | |||||
| (a) | Commenced operations on January 2, 2013. |
| (b) | Per share amounts are based upon average shares outstanding. |
| (c) | The total return would have been lower had certain expenses not been reimbursed / waived during the period. The return shown does not reflect the deduction of taxes that a shareholder would pay on fund distributions or the redemption of fund shares. |
| (d) | Not annualized. |
| (e) | Annualized. |
| See Notes to Financial Statements. | ||
Annual Report | September 30, 2014 | 19 | |
Table of Contents
| Cognios Market Neutral Large Cap Fund - Institutional Class | Financial Highlights | |
For a share outstanding throughout the periods presented. |
For the Year Ended September 30, 2014 | For the Period Ended September 30, 2013(a) | |||||||
| ||||||||
NET ASSET VALUE, BEGINNING OF PERIOD | $ | 9.95 | $ | 10.00 | ||||
INCOME/(LOSS) FROM OPERATIONS: | ||||||||
Net investment loss(b) | (0.14) | (0.10) | ||||||
Net realized and unrealized gain on investments | 1.35 | 0.05 | ||||||
|
| |||||||
Total from Investment Operations | 1.21 | (0.05) | ||||||
|
| |||||||
LESS DISTRIBUTIONS: | ||||||||
From net realized gains on investments | (0.34) | – | ||||||
|
| |||||||
Total Distributions | (0.34) | – | ||||||
|
| |||||||
NET INCREASE/(DECREASE) IN NET ASSET VALUE | 0.87 | (0.05) | ||||||
|
| |||||||
NET ASSET VALUE, END OF PERIOD | $ | 10.82 | $ | 9.95 | ||||
|
| |||||||
TOTAL RETURN(c) | 12.41 | % | (0.50)%(d) | |||||
SUPPLEMENTAL DATA: | ||||||||
Net assets, End of Period (in 000s) | $ | 8,907 | $ | 6,128 | ||||
RATIOS TO AVERAGE NET ASSETS (excluding interest expense and dividend expense on securities sold short) | ||||||||
Operating expenses excluding reimbursement/waiver | 3.43 | % | 4.13%(e) | |||||
Operating expenses including reimbursement/waiver | 2.00 | % | 2.00%(e) | |||||
Net investment income including reimbursement/waiver | 0.65 | % | 0.46%(e) | |||||
RATIOS TO AVERAGE NET ASSETS (including interest expense and dividend expense on securities sold short) | ||||||||
Operating expenses excluding reimbursement/waiver | 5.45 | % | 6.02%(e) | |||||
Operating expenses including reimbursement/waiver | 4.01 | % | 3.88%(e) | |||||
Net investment loss including reimbursement/waiver | (1.37) | % | (1.42)%(e) | |||||
PORTFOLIO TURNOVER RATE | 461 | % | 155%(d) | |||||
| (a) | Commenced operations on January 2, 2013. |
| (b) | Per share amounts are based upon average shares outstanding. |
| (c) | The total return would have been lower had certain expenses not been reimbursed / waived during the period. The return shown does not reflect the deduction of taxes that a shareholder would pay on fund distributions or the redemption of fund shares. |
| (d) | Not annualized. |
| (e) | Annualized. |
See Notes to Financial Statements.
| ||
20 | www.cogniosfunds.com | |
Table of Contents
| Cognios Market Neutral Large Cap Fund | ||
|
September 30, 2014 |
1. ORGANIZATION
ALPS Series Trust (the “Trust”), a Delaware statutory trust, is an open-end management investment company registered under the Investment Company Act of 1940 (the “1940 Act”). As of September 30, 2014, the Trust had nine registered funds. This annual report describes the Cognios Market Neutral Large Cap Fund (the “Fund”). The Fund seeks long-term growth of capital independent of stock market direction. The Fund currently offers Investor Class shares and Institutional Class shares. Each share class of the Fund represents an investment in the same portfolio of securities, but each share class has its own expense structure. The Board of Trustees (the “Board”) may establish additional funds and classes of shares at any time in the future without shareholder approval.
2. SIGNIFICANT ACCOUNTING POLICIES
The accompanying financial statements were prepared in accordance with accounting principles generally accepted in the United States of America for investment companies “U.S. GAAP”. The Fund is considered an investment company for financial reporting purposes. The preparation of financial statements in conformity with U.S. GAAP requires management to make certain estimates and assumptions that affect the reported amounts of assets and liabilities and disclosures of contingent assets and liabilities at the date of the financial statements and the reported amounts of revenue and expenses during the period. Actual results could differ from those estimates. The following is a summary of significant accounting policies consistently followed by the Fund in preparation of the financial statements.
Investment Valuation: The Fund generally values its securities based on market prices determined at the close of regular trading on the New York Stock Exchange (“NYSE”), normally 4:00 p.m. Eastern Time, on each day the NYSE is open for trading.
For equity securities and mutual funds that are traded on an exchange, the market price is usually the closing sale or official closing price on that exchange. In the case of equity securities not traded on an exchange, or if such closing prices are not otherwise available, the securities are valued at the mean of the most recent bid and ask prices on such day.
Redeemable securities issued by open-end registered investment companies are valued at the investment company’s applicable net asset value, with the exception of exchange-traded open-end investment companies, which are priced as equity securities.
When such prices or quotations are not available, or when the Fair Value Committee appointed by the Board believes that they are unreliable, securities may be priced using fair value procedures approved by the Board.
Short Sales: The Fund may sell securities short. To do this, the Adviser will borrow and then sell (take short positions in) equity securities of U.S. companies that the Adviser believes are likely to underperform the long positions over time. To complete such a transaction, the Fund must borrow the security to deliver to the buyer. The Fund then is obligated to replace the security borrowed by purchasing it in the open market at some later date. The Fund bears the risk of a loss if the market
Annual Report | September 30, 2014 | 21 |
Table of Contents
| Cognios Market Neutral Large Cap Fund | ||
Notes to Financial Statements |
September 30, 2014 |
price of the security increases between the date of the short sale and the date on which the Fund replaces the borrowed security. The Fund will realize a gain if the security declines in value between those dates. There can be no assurance that securities necessary to cover a short position will be available for purchase. To mitigate leverage risk, the Fund will segregate liquid assets (which may include its long positions) at least equal to its short position exposure, marked-to-market daily. The Fund maintains collateral consisting of cash, U.S. Government securities or other liquid assets in an amount at least equal to the market value of their respective short positions. The Fund is liable for any dividends or interest payable on securities while those securities are in a short position. The Fund typically intends to hold securities sold short for the short term, therefore, they are excluded from the purchase and sales of investments in Note 4 and the Fund’s Portfolio Turnover Calculation in the Financial Highlights. As of September 30, 2014, the Fund held securities sold short with a market value of $13,453,215.
Fair Value Measurements: The Fund discloses the classification of its fair value measurements following a three-tier hierarchy based on the inputs used to measure fair value. Inputs refer broadly to the assumptions that market participants would use in pricing the asset or liability, including assumptions about risk. Inputs may be observable or unobservable. Observable inputs reflect the assumptions market participants would use in pricing the asset or liability that are developed based on market data obtained from sources independent of the reporting entity. Unobservable inputs reflect the reporting entity’s own assumptions about the assumptions market participants would use in pricing the asset or liability that are developed based on the best information available.
Various inputs are used in determining the value of the Fund’s investments as of the end of the reporting period. When inputs used fall into different levels of the fair value hierarchy, the level in the hierarchy within which the fair value measurement falls is determined based on the lowest level input that is significant to the fair value measurement in its entirety. The designated input levels are not necessarily an indication of the risk or liquidity associated with these investments. These inputs are categorized in the following hierarchy under applicable financial accounting standards:
Level 1 – | Unadjusted quoted prices in active markets for identical investments, unrestricted assets or liabilities that the Fund has the ability to access at the measurement date; | |
Level 2 – | Quoted prices which are not active, quoted prices for similar assets or liabilities in active markets or inputs other than quoted prices that are observable (either directly or indirectly) for substantially the full term of the asset or liability; and | |
Level 3 – | Significant unobservable prices or inputs (including the Fund’s own assumptions in determining the fair value of investments) where there is little or no market activity for the asset or liability at the measurement date. | |
22 | www.cogniosfunds.com |
Table of Contents
| Cognios Market Neutral Large Cap Fund | ||
Notes to Financial Statements |
September 30, 2014 |
The following is a summary of the inputs used to value the Fund’s investments as of September 30, 2014:
| Investments in Securities at Value | Level 1 - Quoted Prices | Level 2 - Other Significant Observable Inputs | Level 3 - Significant Unobservable Inputs | Total | ||||||||||||
| ||||||||||||||||
Common Stocks | ||||||||||||||||
Basic Materials | $ | 631,316 | $ | – | $ | – | $ | 631,316 | ||||||||
Communications | 2,560,531 | – | – | 2,560,531 | ||||||||||||
Consumer Cyclical | 1,778,669 | – | – | 1,778,669 | ||||||||||||
Consumer Non-cyclical | 3,514,677 | – | – | 3,514,677 | ||||||||||||
Energy | 2,541,466 | – | – | 2,541,466 | ||||||||||||
Financials | 548,385 | – | – | 548,385 | ||||||||||||
Industrials | 1,547,809 | – | – | 1,547,809 | ||||||||||||
Technology | 3,156,249 | – | – | 3,156,249 | ||||||||||||
Utilities | 922,723 | – | – | 922,723 | ||||||||||||
Short Term Investments | 46,378 | – | – | 46,378 | ||||||||||||
| ||||||||||||||||
Total | $ | 17,248,203 | $ | – | $ | – | $ | 17,248,203 | ||||||||
| ||||||||||||||||
| ||||||||||||||||
Other Financial Instruments | ||||||||||||||||
| ||||||||||||||||
Liabilities | ||||||||||||||||
Securities Sold Short | ||||||||||||||||
Basic Materials | $ | (2,599,954) | $ | – | $ | – | $ | (2,599,954) | ||||||||
Communications | (2,335,187) | – | – | (2,335,187) | ||||||||||||
Consumer Cyclical | (2,031,848) | – | – | (2,031,848) | ||||||||||||
Consumer Non-cyclical | (548,690) | – | – | (548,690) | ||||||||||||
Diversified | (9,774) | – | – | (9,774) | ||||||||||||
Energy | (1,897,732) | – | – | (1,897,732) | ||||||||||||
Financials | (2,221,747) | – | – | (2,221,747) | ||||||||||||
Industrials | (1,410,761) | – | – | (1,410,761) | ||||||||||||
Technology | (397,522) | – | – | (397,522) | ||||||||||||
| ||||||||||||||||
Total | $ | (13,453,215) | $ | – | $ | – | $ | (13,453,215) | ||||||||
| ||||||||||||||||
The Fund recognizes transfers between levels as of the end of the fiscal year. For the fiscal year ended September 30, 2014, the Fund did not have any transfers between Level 1 and Level 2 securities. There were no Level 3 securities held during the period.
Offering Costs: The Fund incurred offering costs during the fiscal year ended September 30, 2014. These offering costs, including fees for printing initial prospectuses, legal and registration fees, are being amortized over the first twelve months from the inception date of the Fund. Amounts amortized through September 30, 2014 are shown on the Fund’s Statement of Operations within other expenses.
Fund Expenses: Some expenses can be directly attributed to the Fund and are apportioned among the classes based on average net assets of each class.
Annual Report | September 30, 2014 | 23 |
Table of Contents
| Cognios Market Neutral Large Cap Fund | ||
Notes to Financial Statements |
September 30, 2014 |
Trust Expenses: Some expenses of the Trust can be directly attributed to the Fund. Expenses that cannot be directly attributed to the Fund are apportioned among all funds in the Trust based on average net assets of each fund.
Class Expenses: Expenses that are specific to a class of shares are charged directly to that share class. Fees provided under the distribution (Rule 12b-1) and/or shareholder service plans for a particular class of the Fund are charged to the operations of such class.
Federal Income Taxes: The Fund complies with the requirements under Subchapter M of the Internal Revenue Code of 1986 applicable to regulated investment companies and intends to distribute substantially all of its net taxable income and net capital gains, if any, each year so that it will not be subject to excise tax on undistributed income and gains. The Fund is not subject to income taxes to the extent such distributions are made.
As of and during the fiscal year ended September 30, 2014, the Fund did not have a liability for any unrecognized tax benefits in the accompanying financial statements. The Fund files U.S. federal, state and local income tax returns as required. The Fund’s tax returns are subject to examination by the relevant tax authorities until expiration of the applicable statute of limitations, which is generally three years after the filing of the tax return for federal purposes and four years for most state returns. The Fund’s Administrator has analyzed the Fund’s tax positions taken on federal and state income tax returns for all open tax years and has concluded that as of September 30, 2014, no provision for income tax is required in the Fund’s financial statements related to these tax positions.
Investment Transactions and Investment Income: Investment transactions are accounted for on the date the investments are purchased or sold (trade date basis). Net realized gains and losses from investment transactions are reported on an identified cost basis. Interest income, which includes accretion of discounts and amortization of premiums, is accrued and recorded as earned. Dividend income is recognized on the ex-dividend date. All of the realized and unrealized gains and losses and net investment income, are allocated daily to each class in proportion to its average daily net assets.
Distributions to Shareholders: The Fund normally pays dividends and distributes capital gains, if any, on an annual basis. Income dividend distributions are derived from interest and other income the Fund receives from its investments, including short term capital gains. Long term capital gain distributions are derived from gains realized when the Fund sells a security it has owned for more than one year. The Fund may make additional distributions and dividends at other times if its portfolio manager or managers believe doing so may be necessary for the Fund to avoid or reduce taxes. Net investment income/(loss) and net realized gain/(loss) may differ for financial statement and tax purposes.
24 | www.cogniosfunds.com |
Table of Contents
| Cognios Market Neutral Large Cap Fund | ||
Notes to Financial Statements |
September 30, 2014 |
3. TAX BASIS INFORMATION
Reclassifications: As of September 30, 2014, permanent differences in book and tax accounting were reclassified. The following reclassifications have been made on the Statement of Assets and Liabilities and have no impact on the net asset value of the Fund:
| Paid-in Capital | Accumulated Net Investment Income | Accumulated Net Realized Loss on Investments | ||||||||||
| ||||||||||||
| $ | 0 | $ | 226,898 | $ | (226,898) | |||||||
Tax Basis of Distributions to Shareholders: The character of distributions made during the period from net investment income or net realized gains may differ from its ultimate characterization for federal income tax purposes. Also, due to the timing of dividend distributions, the fiscal year in which amounts are distributed may differ from the fiscal year in which the income or realized gain were recorded by the Fund. The amounts and characteristics of tax basis distributions and composition of distributable earnings/(accumulated losses) are finalized at fiscal year-end.
The tax character of distributions paid by the Fund for the fiscal year ended September 30, 2014 were as follows:
| Distributions Paid From: | 2014 | |||
| ||||
Ordinary Income | $ | 386,769 | ||
| ||||
Total | $ | 386,769 | ||
| ||||
Components of Distributable Earnings on a Tax Basis: As of September 30, 2014, the components of distributable earnings on a tax basis were as follows:
Undistributed ordinary income | $ | 1,351,210 | ||
Accumulated Capital Gains | 504,148 | |||
Net unrealized depreciation on investments and securities sold short | (179,912) | |||
Other cumulative effect of timing differences | (45) | |||
| ||||
Total | $ | 1,675,401 | ||
| ||||
Unrealized Appreciation and Depreciation on Investments: As of September 30, 2014, the aggregate cost of investments, gross unrealized appreciation/(depreciation) and net unrealized appreciation for Federal tax purposes were as follows:
Gross unrealized appreciation (excess of value over tax cost) | $ | 358,830 | ||
Gross unrealized depreciation (excess of tax cost over value) | (614,942) | |||
Net appreciation on short sales | 76,200 | |||
| ||||
Net unrealized depreciation | $ | (179,912) | ||
| ||||
Cost of investments for income tax purposes | $ | 17,504,315 | ||
| ||||
Annual Report | September 30, 2014 | 25 |
Table of Contents
| Cognios Market Neutral Large Cap Fund | ||
Notes to Financial Statements |
September 30, 2014 |
Capital Losses: As of September 30, 2014, the Fund had no accumulated capital loss carryforwards.
4. SECURITIES TRANSACTIONS
Purchases and sales of securities, excluding short-term securities and securities sold short, during the fiscal year ended September 30, 2014, were as follows:
| Purchases of Securities | Proceeds from Sales of Securities | |||
| ||||
| $ 83,091,031 | $ 84,300,876 | |||
5. BENEFICIAL SHARE TRANSACTIONS
The capitalization of the Trust consists of an unlimited number of shares of beneficial interest with no par value per share. Holders of the shares of the Fund of the Trust have one vote for each share held and a proportionate fraction of a vote for each fractional share. All shares issued and outstanding are fully paid and are non-assessable, transferable and redeemable at the option of the shareholder. Shares have no pre-emptive rights.
Transactions in common shares were as follows:
| For the Year Ended September 30, 2014 | For the Period Ended September 30, 2013 (a) | |||||||
Investor Class | ||||||||
Shares sold | 12,035 | 505,279 | ||||||
Shares issued in reinvestment of distributions to shareholders | 17,200 | – | ||||||
Shares redeemed | (10,519) | (4) | ||||||
|
|
|
| |||||
Net increase in shares outstanding | 18,716 | 505,275 | ||||||
|
|
|
| |||||
Institutional Class | ||||||||
Shares sold | 3,511,372 | 612,556 | ||||||
Shares issued in reinvestment of distributions to shareholders | 21,706 | – | ||||||
Shares redeemed | (3,325,663) | (1,598) | ||||||
|
|
|
| |||||
Net increase in shares outstanding | 207,415 | 610,958 | ||||||
|
|
|
| |||||
| (a) | Commenced operations on January 2, 2013. |
Control is defined by the 1940 Act as the beneficial ownership, either directly or through one or more controlled companies, of more than 25% of the voting securities of a company. The Fund has one affiliated shareholder representing approximately 77% of total Fund shares. Investment activities of these shareholders could have a material impact on the Fund.
26 | www.cogniosfunds.com |
Table of Contents
| Cognios Market Neutral Large Cap Fund | ||
Notes to Financial Statements |
September 30, 2014 |
6. MANAGEMENT AND RELATED PARTY TRANSACTIONS
Investment Advisory: Cognios Capital, LLC (“Cognios Capital” or the “Adviser”), subject to the authority of the Board, is responsible for the overall management and administration of the Fund’s business affairs. The Adviser manages the investments of the Fund in accordance with the Fund’s investment objective, policies and limitations and investment guidelines established by the Adviser and the Board.
Pursuant to the Investment Advisory Agreement (the “Advisory Agreement”), the Fund pays the Adviser an annual management fee of 1.50% based on the Fund’s average daily net assets. The management fees are paid on a monthly basis. The initial term of the Advisory Agreement is two years. The Board may extend the Advisory Agreement for additional one-year terms. The Board, shareholders of the Fund or Adviser may terminate the Advisory Agreement upon 60 days’ notice.
Pursuant to a fee waiver letter agreement (the “Fee Waiver Agreement”), the Adviser has agreed contractually to reduce the fees payable to it under the Advisory Agreement (but not below zero) and/or reimburse other expenses of the Fund attributable to services provided by the Fund’s administrator and its affiliates (including, but not limited to, organizational expenses and offering costs), to the extent necessary to limit the Total Annual Fund Operating Expenses of each of the Investor Class and Institutional Class shares of the Fund (exclusive of brokerage costs, interest, taxes, dividends, litigation expenses, indemnification amounts, borrowing costs, brokerage expenses and dividend expenses on securities sold short, distribution/12b-1 fees and extraordinary expenses) to 2.00% of the Fund’s average annual net assets. The Fee Waiver Agreement is in effect through January 31, 2015, and may not be terminated or modified prior to this date except with the approval of the Fund’s Board of Trustees. The Adviser will be permitted to recover expenses on a class-by-class basis expenses it has borne through the Fee Waiver Agreement to the extent that the Fund’s expenses in later periods fall below the annual rates set forth in the Fee Waiver Agreement. The Fund will not be obligated to pay any such deferred fees and expenses more than three years after the end of the fiscal year in which the fees and expenses were deferred.
For the fiscal year ended September 30, 2014, the fee waivers and/or reimbursements were as follows:
Fees Waived/Reimbursed by Adviser | ||||
| ||||
Investor Class | $ | (92,011) | ||
Institutional Class | (125,422) | |||
| ||||
TOTAL | $ | (217,433) | ||
| ||||
As of September 30, 2014, the balances of recoupable expenses for each class were as follows:
| Expiring in 2016 | Expiring in 2017 | |||||||
| ||||||||
Investor Class | $ | (79,516) | $ | (92,011) | ||||
Institutional Class | (88,889) | (125,422) | ||||||
Annual Report | September 30, 2014 | 27 |
Table of Contents
| Cognios Market Neutral Large Cap Fund | ||
Notes to Financial Statements |
September 30, 2014 |
Administrator: ALPS Fund Services, Inc. (“ALPS”) serves as administrator to the Fund. The Fund has agreed to pay expenses incurred in connection with its administrative activities. Pursuant to the Administration, Bookkeeping and Pricing Services Agreement, ALPS will provide operational services to the Fund including, but not limited to, fund accounting and fund administration and generally assist in the Fund’s operations.
The Fund’s administration fee is accrued on a daily basis and paid on a monthly basis following the end of the month, based on the greater of (a) an annual total fee of $135,000; or (b) the following basis point fee schedule:
| Average Total Net Assets | Contractual Fee | |
Between $0-$250M | 0.10% | |
$250M-$500M | 0.07% | |
Above $500M | 0.03% |
Annually thereafter, the parties agree to reevaluate the compensation paid under the agreement by the Trust on behalf of the Fund to ALPS for the services it performs for the Fund.
ALPS is reimbursed by the Fund for certain out-of-pocket expenses. ALPS has agreed to reimburse the Fund for expenses relating to insurance and certain routine legal services for the fiscal period ended September 30, 2014.
Transfer Agent: ALPS serves as transfer agent for the Fund under a Transfer Agency and Services Agreement with the Trust. Under this agreement, ALPS is paid an annual base fee of $25,000 for services performed on behalf of the Fund plus fees for open accounts and is reimbursed for certain out-of-pocket expenses.
Compliance Services: ALPS provides services as the Fund’s Chief Compliance Officer to monitor and test the policies and procedures of the Fund in conjunction with requirements under Rule 38a-1 of the 1940 Act under a Chief Compliance Officer Services Agreement. Under this agreement, ALPS is paid an annual base fee of $20,000 for services performed on behalf of the Fund and is reimbursed for certain out-of-pocket expenses.
Principal Financial Officer: ALPS receives an annual base fee of $10,000 for providing Principal Financial Officer services to the Fund and is reimbursed for certain out-of-pocket expenses.
Distribution: ALPS Distributors, Inc. (the “Distributor”) (as affiliate of ALPS Fund Services, Inc.) acts as the principal underwriter of the Fund’s shares pursuant to a Distribution Agreement with the Trust. Shares of the Fund are offered on a continuous basis through the Distributor, as agent of the Fund. The Distributor is not obligated to sell any particular amount of shares and is not entitled to any compensation for its services as the Fund’s principal underwriter.
The Fund has adopted a Distribution and Services Plan (the “Plan”) pursuant to Rule 12b-1 of the 1940 Act for its Investor Class shares. The Plan allows the Fund to use Investor Class assets to pay fees in connection with the distribution and marketing of Investor Class shares and/or the provision of shareholder services to Investor Class shareholders. The Plan permits payment for services in connection with the administration of plans or programs that use Investor Class shares
28 | www.cogniosfunds.com |
Table of Contents
| Cognios Market Neutral Large Cap Fund | ||
Notes to Financial Statements |
September 30, 2014 |
of the Fund, if any, as their funding medium and for related expenses. The Plan permits the Fund to make total payments at an annual rate of up to 0.25% of the Fund’s average daily net assets attributable to its Investor Class shares. Plan fees are shown as distribution and service fees on the Statement of Operations.
7. TRUSTEES
As of September 30, 2014, there were four Trustees, three of whom are not “interested persons” (as defined in the 1940 Act) of the Trust (the “Independent Trustees”). Prior to October 1, 2014, the Independent Trustees received a quarterly retainer of $2,000, plus $1,000 for each regular Board or Committee meeting attended, $1,000 for each special telephonic Board or Committee meeting attended and $1,000 for each special in-person Board meeting attended. Effective October 1, 2014, the Independent Trustees receive a quarterly retainer of $4,000, plus $2,000 for each regular Board or Committee meeting attended, $2,000 for each special telephonic Board or Committee meeting attended and $2,000 for each special in-person Board meeting attended. The Independent Trustees are also reimbursed for all reasonable out-of-pocket expenses relating to attendance at meetings and for meeting-related expenses. Officers of the Trust and Trustees who are interested persons of the Trust receive no salary or fees from the Trust.
8. INDEMNIFICATIONS
Under the Trust’s organizational documents, its officers and Trustees are indemnified against certain liabilities arising out of the performance of their duties to the Trust. Additionally, in the normal course of business, the Trust enters into contracts with service providers that may contain general indemnification clauses which may permit indemnification to the extent permissible under applicable law. The Trust’s maximum exposure under these arrangements is unknown, as this would involve future claims that may be made against the Trust that have not yet occurred.
9. CHANGES IN ACCOUNTANTS
On June 30, 2014, KPMG LLP acquired certain assets of ROTHSTEIN-KASS, P.A. (d/b/a Rothstein Kass & Company, P.C.) and certain of its affiliates (“Rothstein Kass”), the independent public accounting firm for the Fund. As a result of this transaction, on June 30, 2014, Rothstein Kass resigned as the independent registered public accounting firm for the Fund.
The Fund commenced operations on January 2, 2013 and the Fund’s fiscal year end is September 30th. The report of Rothstein Kass on the Fund’s financial statements for the fiscal year ended September 30, 2013 contained no adverse opinion or disclaimer of opinion and were not qualified or modified as to uncertainty, audit scope or accounting principles.
During the fiscal year ended September 30, 2013 and through June 30, 2014, there were no disagreements with Rothstein Kass on any matter of accounting principles or practices, financial statement disclosure or auditing scope or procedure, which disagreements, if not resolved to the satisfaction of Rothstein Kass, would have caused Rothstein Kass to make reference thereto in its reports on the financial statements for such year.
Annual Report | September 30, 2014 | 29 |
Table of Contents
| Cognios Market Neutral Large Cap Fund | ||
Notes to Financial Statements |
September 30, 2014 |
During the fiscal year ended September 30, 2013 and through June 30, 2014, there were no reportable events (as defined in Item 304(a)(1)(v)) of Regulation S-K).
The Board of Trustees of the Trust approved the selection of KPMG LLP to serve as the Fund’s independent registered public accounting firm for the Fund’s fiscal year ending September 30, 2014 at an in-person meeting held on August 22, 2014. During the fiscal year ended September 30, 2013 and through June 30, 2014, the Trust on behalf of the Fund had not consulted with Rothstein Kass regarding either (i) the application of accounting principles to a specified transaction, either completed or proposed; or the type of audit opinion that might be rendered on the Fund’s financial statements, and neither a written report was provided to the Trust on behalf of the Fund or oral advice was provided that Rothstein Kass concluded was an important factor considered by the Trust on behalf of the Fund in reaching a decision as to the accounting, auditing or financial reporting issue; or (ii) any matter that was either the subject of a disagreement, as that term is defined in Item 304(a)(1)(iv) of Regulation S-K and the related instructions to Item 304 of Regulation S-K, or a reportable event, as that term is defined in Item 304(a)(1)(v) of Regulation S-K.
30 | www.cogniosfunds.com |
Table of Contents
| Cognios Market Neutral Large Cap Fund |
Report of Independent Registered
Public Accounting Firm
The Board of Trustees and Shareholders
ALPS Series Trust:
We have audited the accompanying statement of assets and liabilities of Cognios Market Neutral Large Cap Fund, including the portfolio of investments, as of September 30, 2014, and the related statement of operations, statement of changes in net assets, and the financial highlights for the year then ended. These financial statements and financial highlights are the responsibility of the Fund’s management. Our responsibility is to express an opinion on these financial statements and financial highlights based on our audit. The accompanying statement of changes in net assets and financial highlights of Cognios Market Neutral Large Cap Fund for the period from January 2, 2013 to September 30, 2013, were audited by other auditors whose report thereon dated November 22, 2013, expressed an unqualified opinion on those statements.
We conducted our audit in accordance with the standards of the Public Company Accounting Oversight Board (United States). Those standards require that we plan and perform the audit to obtain reasonable assurance about whether the financial statements and financial highlights are free of material misstatement. An audit includes examining, on a test basis, evidence supporting the amounts and disclosures in the financial statements. Our procedures included confirmation of securities owned as of September 30, 2014, by correspondence with custodians and brokers, or by other appropriate auditing procedures where replies from brokers were not received. An audit also includes assessing the accounting principles used and significant estimates made by management, as well as evaluating the overall financial statement presentation. We believe that our audit provides a reasonable basis for our opinion.
In our opinion, the financial statements and financial highlights referred to above present fairly, in all material respects, the financial position of Cognios Market Neutral Large Cap Fund, as of September 30, 2014, the results of its operations, the changes in its net assets and the financial highlights for the year then ended, in conformity with U.S. generally accepted accounting principles.
KPMG LLP
Denver, Colorado
November 24, 2014
Annual Report | September 30, 2014 | 31 |
Table of Contents
| Cognios Market Neutral Large Cap Fund | ||
|
September 30, 2014 (Unaudited) |
1. PROXY VOTING POLICIES AND VOTING RECORD
A description of the policies and procedures that the Fund uses to determine how to vote proxies relating to portfolio securities is available without charge, upon request, (i) by calling the Fund (toll-free) at 1-855-254-6467, or (ii) on the Securities and Exchange Commission’s website at http://www.sec.gov.
Information regarding how the Fund voted proxies relating to portfolio securities during the most recent 12-month period ended June 30, 2014 is available (i) without charge, upon request, by calling the Fund (toll-free) at 1-855-254-6467 or (ii) on the SEC’s website at http://www.sec.gov.
2. PORTFOLIO HOLDINGS
The Fund files its complete schedule of portfolio holdings with the SEC for the first and third quarters of each fiscal year on Form N-Q. The Fund’s Form N-Q is available on the SEC website at http://www.sec.gov. The Fund’s Form N-Q may be reviewed and copied at the SEC’s Public Reference Room in Washington, D.C., and information on the operation of the Public Reference Room may be obtained by calling 1-800-SEC-0330.
3. TAX DESIGNATIONS
The Fund designates the following for federal income tax purposes for the calendar year ended December 31, 2013:
Qualified Dividend Income 61.33%
Corporate Dividends Received Deduction 59.26%
In early 2014, if applicable, shareholders of record should have received this information for the distributions paid to them by the Fund during the calendar year 2013 via Form 1099. The Fund will notify shareholders in early 2015 of amounts paid to them by the Fund, if any, during the calendar year 2014.
32 | www.cogniosfunds.com |
Table of Contents
| Cognios Market Neutral Large Cap Fund | ||
|
September 30, 2014 (Unaudited) |
INDEPENDENT TRUSTEES
| Number of | ||||||||||
| Funds in | ||||||||||
| Fund | Other | |||||||||
| Term of | Complex | Directorships | ||||||||
| Name, | Position(s) | Office and | Overseen | Held by Trustee | ||||||
| Birth Year & | Held with | Length of Time | Principal Occupation(s) During | by | During Past | |||||
| Address* | Fund | Served | Past 5 Years** | Trustee*** | 5 Years** | |||||
| Cheryl Burgermeister Birth year: 1951 | Trustee | Ms. Burgermeister was elected to the Board on October 30, 2012; indefinite term. | Ms. Burgermeister is Trustee and Audit Committee Chair of The Select Sector SPDR Trust (October 1998 to present), Trustee of Russell Investment Funds (September 2012 to present) and Trustee, Treasurer and Finance Committee Chair of the Portland Community College Foundation (January 2001 to present). She also served as Trustee and Audit Committee Chair of E*Trade Funds (March 2004 to March 2010), Trustee of Zero Gravity Internet Fund (May 2000 to December 2001), Director and Treasurer of Crabbe Huson Family of Funds (1998 to 1999) and Director, Chief Financial Officer and Treasurer of The Crabbe Huson Group, Inc. (July 1987 to October 1999). From 1982 to 1986, Ms. Burgermeister was Supervising Senior Accountant at KPMG Peat Marwick. Ms. Burgermeister a licensed Certified Public Accountant and a member of the Oregon Society of Certified Public Accountants. | 9 | Ms. Burgermeister is a Trustee and Audit Committee Chair of The Select Sector SPDR Trust (9 ETFs) and Trustee of Russell Investment Funds (42 funds). | |||||
| ||||||||||
| * | All communications to Trustees and Officers may be directed to ALPS Series Trust c/o 1290 Broadway, Suite 1100, Denver, CO 80203. |
| ** | Except as otherwise indicated, each individual has held the office shown or other offices in the same company for the last five years. |
| *** | The Fund Complex currently consists of nine series of the Trust and any other investment companies for which Cognios Capital, LLC provides investment advisory services, currently none. |
Additional information about members of the Board of Trustees and officers of the Trust is available in the Statement of Additional Information and is available, without charge, upon request, by calling the Fund (toll-free) at 1-855-254-6467.
Annual Report | September 30, 2014 | 33 |
Table of Contents
| Cognios Market Neutral Large Cap Fund | ||
Trustees and Officers |
September 30, 2014 (Unaudited) |
| Number of | Other | |||||||||
| Term of | Funds in | Directorships | ||||||||
| Name, | Office and | Fund | Held by | |||||||
| Birth Year | Position(s) | Length of | Complex | Trustee During | ||||||
| & | Held with | Time | Principal Occupation(s) During Past 5 | Overseen by | Past | |||||
| Address* | Fund | Served | Years** | Trustee*** | 5 Years** | |||||
| J. Wayne Hutchens Birth year: 1944 | Trustee | Mr. Hutchens was elected to the Board on October 30, 2012; indefinite term. | Mr. Hutchens is currently retired. From April 2006 to December 2012, he served as President and CEO of the University of Colorado (CU) Foundation and from April 2009 to December 2012, he was Executive Director of the CU Real Estate Foundation. Mr. Hutchens is also Trustee of the Denver Museum of Nature and Science (2000 to present), Director of AMG National Trust Bank (June 2012 to present) and Trustee of Children’s Hospital Colorado (May 2012 to present). Prior to these positions, Mr. Hutchens spent 29 years in the banking industry, retiring as Chairman of Chase Bank Colorado. | 9 | None. | |||||
| ||||||||||
| * | All communications to Trustees and Officers may be directed to ALPS Series Trust c/o 1290 Broadway, Suite 1100, Denver, CO 80203. |
| ** | Except as otherwise indicated, each individual has held the office shown or other offices in the same company for the last five years. |
| *** | The Fund Complex currently consists of nine series of the Trust and any other investment companies for which Cognios Capital, LLC provides investment advisory services, currently none. |
Additional information about members of the Board of Trustees and officers of the Trust is available in the Statement of Additional Information and is available, without charge, upon request, by calling the Fund (toll-free) at 1-855-254-6467.
34 | www.cogniosfunds.com |
Table of Contents
| Cognios Market Neutral Large Cap Fund | ||
Trustees and Officers |
September 30, 2014 (Unaudited) |
| Number of | ||||||||||
| Term of | Funds in | Other | ||||||||
| Name, | Office and | Fund | Directorships | |||||||
| Birth | Position(s) | Length of | Complex | Held by Trustee | ||||||
| Year & | Held with | Time | Principal Occupation(s) During Past 5 | Overseen by | During Past 5 | |||||
| Address* | Fund | Served | Years** | Trustee*** | Years** | |||||
| Patrick Seese Birth year: 1971 | Trustee | Mr. Seese was elected to the Board on October 30, 2012; indefinite term. | Mr. Seese is an owner and a Managing Director of Integris Partners, a middle-market investment banking firm serving closely-held companies, financial sponsors and public companies (February 2008 to present). Prior to this, Mr. Seese was a Managing Director of Headwaters MB, a middle-market investing banking firm (December 2003 to February 2008). Prior to that, Mr. Seese worked in Credit Suisse First Boston’s Mergers and Acquisitions Group and served as Head of Corporation Development, Katy Industries, a publicly traded industrial and consumer products company and at Deloitte & Touche LLP, where he began his career in 1994. | 9 | None. | |||||
| ||||||||||
| * | All communications to Trustees and Officers may be directed to ALPS Series Trust c/o 1290 Broadway, Suite 1100, Denver, CO 80203. |
| ** | Except as otherwise indicated, each individual has held the office shown or other offices in the same company for the last five years. |
| *** | The Fund Complex currently consists of nine series of the Trust and any other investment companies for which Cognios Capital, LLC provides investment advisory services, currently none. |
Additional information about members of the Board of Trustees and officers of the Trust is available in the Statement of Additional Information and is available, without charge, upon request, by calling the Fund (toll-free) at 1-855-254-6467.
Annual Report | September 30, 2014 | 35 |
Table of Contents
| Cognios Market Neutral Large Cap Fund | ||
Trustees and Officers |
September 30, 2014 (Unaudited) |
INTERESTED TRUSTEE AND OFFICERS
Name, Birth Year & Address* | Position(s) Held with Fund | Term of Office and Length of Time Served | Principal Occupation(s) During Past 5 Years** | Number of Funds in Fund Complex Overseen by Trustee*** | Other Directorships Held by Trustee During Past 5 Years** | |||||
| Jeremy O. May Birth year: 1970 | Trustee, Chairman and President | Mr. May was elected President on | Mr. May joined ALPS in 1995 and is currently President of ALPS Fund Services, Inc. and ALPS Distributors, Inc. and Executive Vice President and Director of ALPS Holdings, Inc. and ALPS Advisors, Inc. Because of his positions with these entities, Mr. May is deemed an affiliate of the Trust as defined under the 1940 Act. Mr. May currently serves as Treasurer of Clough Global Allocation Fund, Clough Global Equity Fund, Clough Global Opportunities Fund, Mr. May is also Chairman and Trustee of the Reaves Utility Income Fund. Mr. May is currently Vice Chair of the Board of Directors of the University of Colorado Foundation. | 9 | Mr. May is Chairman and Trustee of the Reaves Utility Income Fund (1 fund). | |||||
| ||||||||||
| * | All communications to Trustees and Officers may be directed to ALPS Series Trust c/o 1290 Broadway, Suite 1100, Denver, CO 80203. |
| ** | Except as otherwise indicated, each individual has held the office shown or other offices in the same company for the last five years. |
| *** | The Fund Complex currently consists of nine series of the Trust and any other investment companies for which Cognios Capital, LLC provides investment advisory services, currently none. |
Additional information about members of the Board of Trustees and officers of the Trust is available in the Statement of Additional Information and is available, without charge, upon request, by calling the Fund (toll-free) at 1-855-254-6467.
36 | www.cogniosfunds.com |
Table of Contents
| Cognios Market Neutral Large Cap Fund | ||
Trustees and Officers |
September 30, 2014 (Unaudited) |
OFFICERS
Name, Birth Year & | Position(s) Held with Fund | Term of Office and | Principal Occupation(s) During Past 5 Years** | |||
| ||||||
Kimberly R. Storms Birth year: 1972 | Treasurer | Ms. Storms was elected Treasurer of the Trust on October 30, 2012; indefinite term. | Ms. Storms is Senior Vice President - Director of Fund Administration of ALPS. Ms. Storms joined ALPS in 1998 as Assistant Controller. Because of her position with ALPS, Ms. Storms is deemed an affiliate of the Trust as defined under the 1940 Act. Ms. Storms is also Treasurer of Financial Investors Trust, Liberty All-Star Equity Fund and Liberty All-Star Growth Fund, Inc. She serves as Chief Financial Officer of Arbitrage Funds. | |||
| ||||||
JoEllen L. Legg Birth year: 1961 | Secretary | Ms. Legg was elected Secretary of the Trust on October 30, 2012; indefinite term. | Ms. Legg joined ALPS in October 2007 and is Vice President, Senior Counsel of ALPS. Prior to joining ALPS, Ms. Legg served as Senior Counsel - Law (Corporate & Securities) for Adelphia Communications Corporation (February 2005 – March 2007). Prior to this, Ms. Legg held associate positions at Fried Frank Harris Shriver & Jacobson LLP (1998 - 2004) and at Patton Boggs LLP (2004 - 2005). Because of her position with ALPS, Ms. Legg is deemed an affiliate of the Trust as defined under the 1940 Act. Ms. Legg is also the Assistant Secretary of the Stone Harbor Investment Funds, Stone Harbor Emerging Markets Income Fund, Stone Harbor Emerging Markets Total Income Fund, James Advantage Funds, WesMark Funds and Griffin International Access Real Estate Fund. | |||
| ||||||
Nate Mandeville Birth year: 1977 | Assistant Treasurer | Mr. Mandeville was elected Assistant Treasurer of the Trust on August 22, 2014; indefinite term. | Mr. Mandeville joined ALPS in December 2013 and is Fund Controller of ALPS. Prior to joining ALPS, Mr. Mandeville worked for Great-West Financial (2011-2013), Virtuoso Sourcing Group (2008-2011) and Janus Capital Group (2000-2008). Because of his position with ALPS, Mr. Mandeville is deemed an affiliate of the Trust as defined under the 1940 Act. | |||
| * | All communications to Trustees and Officers may be directed to ALPS Series Trust c/o 1290 Broadway, Suite 1100, Denver, CO 80203. |
| ** | Except as otherwise indicated, each individual has held the office shown or other offices in the same company for the last five years. |
| *** | The Fund Complex currently consists of nine series of the Trust and any other investment companies for which Cognios Capital, LLC provides investment advisory services, currently none. |
Additional information about members of the Board of Trustees and officers of the Trust is available in the Statement of Additional Information and is available, without charge, upon request, by calling the Fund (toll-free) at 1-855-254-6467.
Annual Report | September 30, 2014 | 37 |
Table of Contents
| Cognios Market Neutral Large Cap Fund | ||
Trustees and Officers |
September 30, 2014 (Unaudited) |
Name, Birth Year & | Position(s) Held with Fund | Term of Office and | Principal Occupation(s) During Past 5 Years** | |||
Lucas Foss Birth year: 1977 | Chief Compliance Officer (“CCO”) | Mr. Foss was elected CCO of the Trust on October 30, 2012; indefinite term. | Mr. Foss joined ALPS in November 2004 and is Deputy Chief Compliance Officer of ALPS. Prior to his current role, Mr. Foss served as a Compliance Manager at ALPS (January 2010 - August 2012), and a Senior Compliance Analyst at ALPS (November 2004 – May 2006). Before joining ALPS, Mr. Foss held positions at Bisys Hedge Fund Services and Deutsche Asset Management. Because of his position with ALPS, Mr. Foss is deemed an affiliate of the Trust as defined under the 1940 Act. Mr. Foss is also CCO of Caldwell & Orkin Funds, Whitebox Mutual Funds, Boulder Growth & Income Fund, Boulder Total Return Fund, the Denali Fund, Wakefield Alternative Series Trust and The Principal Real Estate Income Fund. | |||
| ||||||
| * | All communications to Trustees and Officers may be directed to ALPS Series Trust c/o 1290 Broadway, Suite 1100, Denver, CO 80203. |
| ** | Except as otherwise indicated, each individual has held the office shown or other offices in the same company for the last five years. |
| *** | The Fund Complex currently consists of nine series of the Trust and any other investment companies for which Cognios Capital, LLC provides investment advisory services, currently none. |
Additional information about members of the Board of Trustees and officers of the Trust is available in the Statement of Additional Information and is available, without charge, upon request, by calling the Fund (toll-free) at 1-855-254-6467.
38 | www.cogniosfunds.com |
Table of Contents
Page Intentionally Left Blank
Table of Contents
Table of Contents
Table of Contents

| 1 | ||||
| 3 | ||||
| 12 | ||||
| 15 | ||||
| 24 | ||||
| 26 | ||||
| 28 | ||||
| 31 | ||||
| 40 | ||||
| 54 | ||||
| 55 | ||||
| 56 | ||||
Table of Contents
Crystal Strategy Family of Funds | Shareholder Letter | |
September 30, 2014 (Unaudited)
|
Dear Investors,
September 30th marks the end of our first fiscal year managing the Crystal Strategy Family of Funds. When we launched the funds nearly nine months ago, our goal was simple: bring our widely successful absolute return strategies (managed via separate accounts) to a vehicle capable of reaching a larger breadth of financial advisors and clients. While we’ve learned a lot during the past year, our process and approach has remained consistent since launching the Crystal brand nearly six years ago. Namely, our goal has been to deliver steady long-term capital appreciation in the context of prudent risk management and downside protection. For the better part of 2014, we have placed a greater emphasis on the downside protection component of our mandate. Time will ultimately tell whether we are simply too early in our beliefs or incorrectly overcautious, but with valuations towards the high end of historical levels, we view the longer term risks as overwhelming any potential near-term opportunity.
Headed into this year, our expectation was that upside would be limited and that volatility would trend higher. In addition to elevated valuations off of the strong 2013 performance, high levels of investor optimism, weak growth in international economies and expectations of tighter monetary conditions were all issues we expected the market to come to grips with in 2014. Through the end of September, only part of that thesis has played out. Although returns have been much more subdued compared to that of last year, volatility has remained low and there has yet to be any meaningful downside to the domestic equity market. The lack of downside volatility and our contrarian approach has been the single biggest detractor to performance this year.
As we look forward to the last quarter of 2014 and 2015, we are optimistic in two ways. First, we are optimistic that our conservative positioning and expectation of higher volatility will be back in vogue. A meaningful market correction would go a long way in restoring the long-term health of the market as well as providing the Crystal portfolios an opportunity to profit. As of this writing, markets have been treading water for the better part of three months, volatility has increased, and divergences are beginning to exhibit themselves. To that, we are optimistic that we are positioned favorably as we head into a period of heightened risk. Secondly, we are optimistic that any correction of meaningful size will be a buyable event which creates opportunities for investors patient enough to wait for them. Steady job growth, improving consumer balance sheets, and a favorable outlook for higher corporate capital expenditure spending argue that our economic recovery has further upside. To the extent that market valuations can realign themselves with the trajectory of long-term global growth will create a more sustainable environment for investors.
However, we also have to consider the “what-ifs”. In an environment of easy monetary policy from central banks around the world, investors are left with few alternatives to the low returns available in other asset classes. The “There is no alternative” mentality is why we also have to think about a return to a 1990’s bubble-like environment. It’s a low probability scenario in our opinion, but one that must be considered. There’s also a second scenario where the Federal Reserve has indeed created a perfect landing and a return to normalized growth and inflation returns. It’s for these reasons that we express our concerns not through an outright bearish positioning in the portfolio, but one that is conservative and focused on “relative value”. Through our long/short approach, we are currently emphasizing our short exposures through higher risk and higher valuation asset classes such as European and U.S. small cap equities. Paired with these short exposures, our long investments are concentrated in large cap U.S. equities, hedged Japanese equities, select emerging market exposures such as Mexico, India, and China, as well as
Annual Report | September 30, 2014 |
1 |
Table of Contents
| Crystal Strategy Family of Funds | Shareholder Letter | |
September 30, 2014 (Unaudited)
|
select individual stocks which we believe will outperform for various reasons. Our current approach (1) maintains our conservative position, (2) gives us the potential to generate positive returns, and (3) reduces the risk of a meaningful drawdown in the event that we are wrong about markets.
Sincerely,
The Crystal Strategy Funds Portfolio Management Team
The Crystal Strategy Funds are subject to investment risks, including possible loss of the principal amount invested and therefore are not suitable for all investors. The Funds may not achieve their objectives. Diversification does not ensure a profit or guarantee against loss.
Not FDIC Insured – No Bank Guarantee – May Lose Value
2 |
www.crystalstrategyfunds.com |
Table of Contents
| Crystal Strategy Absolute Income Fund | Portfolio Update | |
September 30, 2014 (Unaudited)
|
Performance (as of September 30, 2014)
| Three Months | Since Inception* | |||
Crystal Strategy Absolute Income Fund - A NAV | -1.50% | 1.83% | ||
Crystal Strategy Absolute Income Fund - A MOP | -6.93% | -3.76% | ||
Crystal Strategy Absolute Income Fund - I | -1.54% | 1.87% | ||
Crystal Strategy Absolute Income Fund - R | -1.66% | 1.55% | ||
HFRX Global Hedge Fund Index(a) | -0.57% | 1.35% | ||
US CPI Urban Consumers NSA(b) | -0.13% | 2.14% |
The performance data quoted above represents past performance. Past performance is not a guarantee of future results. Investment return and value of the Fund shares will fluctuate so that an investor’s shares, when sold or redeemed, may be worth more or less than their original cost. Performance may be lower or higher than performance data quoted. Fund performance current to the most recent month-end is available by calling (855) 572-1722 or by visiting www.crystalstrategyfunds.com.
| * | Fund’s inception date is December 30, 2013. |
| (a) | HFRX Global Hedge Fund Index (USD): the Fund’s investment adviser uses the HFRX Global Hedge Fund Index as a performance reference point because it is designed to be representative of the overall composition of the hedge fund universe. Such index will have a different level of volatility than the actual investment portfolio. |
| (b) | US CPI (Consumer Price Index) Urban Consumers NSA: Published by the Bureau of Labor Statistics in the Department of Labor, the CPI is a widely used cost-of-living benchmark that measures the price of a fixed basket of goods purchased by a typical consumer. |
Returns of less than 1 year are cumulative.
Indices are not actively managed and do not reflect deduction for fees, expenses or taxes. An investor cannot invest directly in an index.
The returns shown above do not reflect the deduction of taxes a shareholder would pay on Fund distributions or redemption of Fund shares.
Maximum Offering Price (MOP) for Class A shares includes the Fund’s maximum sales charge of 5.50%. Performance shown at NAV does not include these sales charges and would have been lower had it been taken into account. If you invest $1 million or more, either as a lump sum or through the Fund’s accumulation or letter of intent programs, you can purchase Class A shares without an initial sales charge (load); however, a Contingent Deferred Sales Charge (“CDSC”) of 1.00% may apply to Class A shares redeemed within the first 12 months after a purchase in excess of $1 million. The total annual operating expenses and total annual operating expenses after fee waivers and/or reimbursement you may pay as an investor in the Fund’s Class A, Class I and Class R shares (as reported in the December 16, 2013 Prospectus) are 5.00% and 2.90%; 4.75% and 2.65%; and 5.25% and 3.15%, respectively.
The Fund is new and has a limited operating history.
Annual Report | September 30, 2014 |
3 |
Table of Contents
| Crystal Strategy Absolute Income Fund | Portfolio Update | |
September 30, 2014 (Unaudited)
|
Performance of $10,000 Initial Investment (as of September 30, 2014)
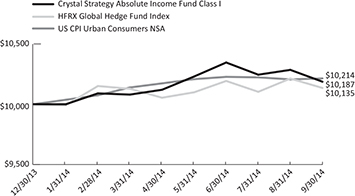
The graph shown above represents historical performance of a hypothetical investment of $10,000 in the Fund since inception. Past performance does not guarantee future results. All returns reflect reinvested dividends, but do not reflect the deduction of taxes that a shareholder would pay on Fund distributions or the redemption of Fund shares.
Top Ten Holdings (as a % of Net Assets)*
DoubleLine Total Return Bond Fund - Institutional Class | 11.20% | |||
ProShares® Short Russell2000® | 7.52% | |||
ProShares® Short MSCI EAFE | 6.94% | |||
ProShares® Short MSCI Emerging Markets | 5.95% | |||
DoubleLine Income Solutions Fund | 5.49% | |||
ProShares® Short Real Estate | 4.94% | |||
ProShares® Short S&P 500® | 4.59% | |||
Forward Select Income Fund - Institutional Class | 4.55% | |||
ProShares® Short 7-10 Year Treasury | 3.74% | |||
Starwood Property Trust, Inc. - REIT | 3.70% | |||
| ||||
Top Ten Holdings | 58.62% | |||
| ||||
| * | Holdings are subject to change, excludes cash and cash equivalents. |
4 |
www.crystalstrategyfunds.com |
Table of Contents
| Crystal Strategy Absolute Income Fund | Portfolio Update | |
September 30, 2014 (Unaudited)
|
Sector Allocation (as a % of Net Assets)*
Exchange-Traded Funds | 39.69% | |||
Open-End Mutual Funds | 20.24% | |||
Financials | 14.71% | |||
Closed-End Mutual Funds | 7.74% | |||
Master Limited Partnerships | 3.99% | |||
Energy | 1.89% | |||
Communications | 1.68% | |||
Exchange-Traded Notes | 1.35% | |||
Cash, Cash Equivalents, & Other Net Assets | 8.71% | |||
|
| |||
| 100.00% | ||||
|
|
| * | Holdings are subject to change. |
Annual Report | September 30, 2014 |
5 |
Table of Contents
| Crystal Strategy Absolute Return Fund | Portfolio Update | |
September 30, 2014 (Unaudited)
|
Performance (as of September 30, 2014)
| Three Months | Since Inception* | |||
Crystal Strategy Absolute Return Fund - A NAV | -0.93% | -4.00% | ||
Crystal Strategy Absolute Return Fund - A MOP | -6.34% | -9.26% | ||
Crystal Strategy Absolute Return Fund - I | -0.72% | -3.70% | ||
Crystal Strategy Absolute Return Fund - R | -1.03% | -4.20% | ||
HFRX Global Hedge Fund Index(a) | -0.57% | 1.35% | ||
US CPI Urban Consumers NSA(b) | -0.13% | 2.14% |
The performance data quoted above represents past performance. Past performance is not a guarantee of future results. Investment return and value of the Fund shares will fluctuate so that an investor’s shares, when sold or redeemed, may be worth more or less than their original cost. Performance may be lower or higher than performance data quoted. Fund performance current to the most recent month-end is available by calling (855) 572-1722 or by visiting www.crystalstrategyfunds.com.
| * | Fund’s inception date is December 30, 2013. |
| (a) | HFRX Global Hedge Fund Index (USD): the Fund’s investment adviser uses the HFRX Global Hedge Fund Index as a performance reference point because it is designed to be representative of the overall composition of the hedge fund universe. Such index will have a different level of volatility than the actual investment portfolio. |
| (b) | US CPI (Consumer Price Index) Urban Consumers NSA: Published by the Bureau of Labor Statistics in the Department of Labor, the CPI is a widely used cost-of-living benchmark that measures the price of a fixed basket of goods purchased by a typical consumer. |
Returns of less than 1 year are cumulative.
Indices are not actively managed and do not reflect deduction for fees, expenses or taxes. An investor cannot invest directly in an index.
The returns shown above do not reflect the deduction of taxes a shareholder would pay on Fund distributions or redemption of Fund shares.
Maximum Offering Price (MOP) for Class A shares includes the Fund’s maximum sales charge of 5.50%. Performance shown at NAV does not include these sales charges and would have been lower had it been taken into account. If you invest $1 million or more, either as a lump sum or through the Fund’s accumulation or letter of intent programs, you can purchase Class A shares without an initial sales charge (load); however, a Contingent Deferred Sales Charge (“CDSC”) of 1.00% may apply to Class A shares redeemed within the first 12 months after a purchase in excess of $1 million. The total annual operating expenses and total annual operating expenses after fee waivers and/or reimbursement you may pay as an investor in the Fund’s Class A, Class I and Class R shares (as reported in the December 16, 2013 Prospectus) are 5.10% and 3.00%; 4.85% and 2.75%; and 5.35% and 3.25%, respectively.
The Fund is new and has a limited operating history.
6 |
www.crystalstrategyfunds.com |
Table of Contents
| Crystal Strategy Absolute Return Fund | Portfolio Update | |
September 30, 2014 (Unaudited)
|
Performance of $10,000 Initial Investment (as of September 30, 2014)
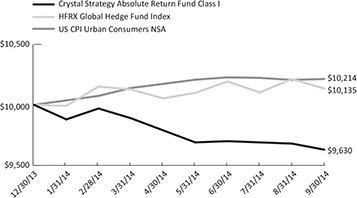
The graph shown above represents historical performance of a hypothetical investment of $10,000 in the Fund since inception. Past performance does not guarantee future results. All returns reflect reinvested dividends, but do not reflect the deduction of taxes that a shareholder would pay on Fund distributions or the redemption of Fund shares.
Top Ten Holdings (as a % of Net Assets)*
ProShares® Short Russell2000® | 16.74% | |||
ProShares® Short MSCI EAFE | 12.12% | |||
WisdomTree® Japan Hedged Equity Fund | 3.14% | |||
ProShares® Short MSCI Emerging Markets | 2.91% | |||
ProShares® Short QQQ | 2.90% | |||
Cemex SAB de CV - Sponsored ADR | 2.88% | |||
Microsoft Corp. | 2.31% | |||
DoubleLine Income Solutions Fund | 2.22% | |||
Morgan Stanley China - Class A | 2.21% | |||
Huntington Bancshares, Inc. | 2.16% | |||
| ||||
Top Ten Holdings | 49.59% | |||
| ||||
| * | Holdings are subject to change, excludes cash and cash equivalents. |
Annual Report | September 30, 2014 |
7 |
Table of Contents
| Crystal Strategy Absolute Return Fund | Portfolio Update | |
September 30, 2014 (Unaudited)
|
Sector Allocation (as a % of Net Assets)*
Exchange-Traded Funds | 49.78% | |||
Open-End Mutual Funds | 10.98% | |||
Financials | 6.70% | |||
Closed-End Mutual Funds | 5.78% | |||
Master Limited Partnerships | 3.93% | |||
Industrials | 2.88% | |||
Technology | 2.31% | |||
Consumer Non-cyclical | 1.22% | |||
Communications | 0.97% | |||
Energy | 0.81% | |||
Cash, Cash Equivalents, & Other Net Assets | 14.64% | |||
|
| |||
| 100.00% | ||||
|
|
| * | Holdings are subject to change. |
8 |
www.crystalstrategyfunds.com |
Table of Contents
| Crystal Strategy Leveraged Alternative Fund | Portfolio Update | |
September 30, 2014 (Unaudited)
|
Performance (as of September 30, 2014)
| Three Months | Since Inception* | |||
Crystal Strategy Leveraged Alternative Fund - A NAV | -1.14% | -4.80% | ||
Crystal Strategy Leveraged Alternative Fund - A MOP | -6.58% | -10.02% | ||
Crystal Strategy Leveraged Alternative Fund - I | -1.04% | -4.60% | ||
Crystal Strategy Leveraged Alternative Fund - R | -1.14% | -4.90% | ||
HFRX Global Hedge Fund Index(a) | -0.57% | 1.35% | ||
US CPI Urban Consumers NSA(b) | -0.13% | 2.14% |
The performance data quoted above represents past performance. Past performance is not a guarantee of future results. Investment return and value of the Fund shares will fluctuate so that an investor’s shares, when sold or redeemed, may be worth more or less than their original cost. Performance may be lower or higher than performance data quoted. Fund performance current to the most recent month-end is available by calling (855) 572-1722 or by visiting www.crystalstrategyfunds.com.
| * | Fund’s inception date is December 30, 2013. |
| (a) | HFRX Global Hedge Fund Index (USD): the Fund’s investment adviser uses the HFRX Global Hedge Fund Index as a performance reference point because it is designed to be representative of the overall composition of the hedge fund universe. Such index will have a different level of volatility than the actual investment portfolio. |
| (b) | US CPI (Consumer Price Index) Urban Consumers NSA: Published by the Bureau of Labor Statistics in the Department of Labor, the CPI is a widely used cost-of-living benchmark that measures the price of a fixed basket of goods purchased by a typical consumer. |
Returns of less than 1 year are cumulative.
Indices are not actively managed and do not reflect deduction for fees, expenses or taxes. An investor cannot invest directly in an index.
The returns shown above do not reflect the deduction of taxes a shareholder would pay on Fund distributions or redemption of Fund shares.
Maximum Offering Price (MOP) for Class A shares includes the Fund’s maximum sales charge of 5.50%. Performance shown at NAV does not include these sales charges and would have been lower had it been taken into account. If you invest $1 million or more, either as a lump sum or through the Fund’s accumulation or letter of intent programs, you can purchase Class A shares without an initial sales charge (load); however, a Contingent Deferred Sales Charge (“CDSC”) of 1.00% may apply to Class A shares redeemed within the first 12 months after a purchase in excess of $1 million. The total annual operating expenses and total annual operating expenses after fee waivers and/or reimbursement you may pay as an investor in the Fund’s Class A, Class I and Class R shares (as reported in the December 16, 2013 Prospectus) are 5.40% and 3.30%; 5.15% and 3.05%; and 5.65% and 3.55%, respectively.
The Fund is new and has a limited operating history.
Annual Report | September 30, 2014 |
9 |
Table of Contents
| Crystal Strategy Leveraged Alternative Fund | Portfolio Update | |
September 30, 2014 (Unaudited)
|
Performance of $10,000 Initial Investment (as of September 30, 2014)
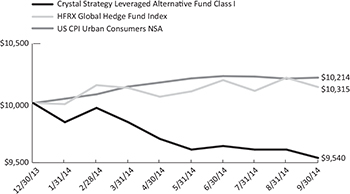
The graph shown above represents historical performance of a hypothetical investment of $10,000 in the Fund since inception. Past performance does not guarantee future results. All returns reflect reinvested dividends, but do not reflect the deduction of taxes that a shareholder would pay on Fund distributions or the redemption of Fund shares.
Top Ten Holdings (as a % of Net Assets)*
ProShares® Short Russell2000® | 17.43% | |||
ProShares® Short MSCI EAFE | 11.22% | |||
ProShares® Short MSCI Emerging Markets | 4.66% | |||
WisdomTree® Japan Hedged Equity Fund | 4.03% | |||
DoubleLine Total Return Bond Fund - Institutional Class | 3.10% | |||
ProShares® Short QQQ | 3.03% | |||
Cemex SAB de CV - Sponsored ADR | 2.98% | |||
Morgan Stanley China - Class A | 2.76% | |||
Microsoft Corp. | 2.50% | |||
DoubleLine Income Solutions Fund | 2.47% | |||
| ||||
Top Ten Holdings | 54.18% | |||
| ||||
| * | Holdings are subject to change, excludes cash and cash equivalents. |
10 |
www.crystalstrategyfunds.com |
Table of Contents
| Crystal Strategy Leveraged Alternative Fund | Portfolio Update | |
September 30, 2014 (Unaudited)
|
Sector Allocation (as a % of Net Assets)*
Exchange-Traded Funds | 53.46% | |||
Open-End Mutual Funds | 13.07% | |||
Closed-End Mutual Funds | 6.68% | |||
Financials | 6.66% | |||
Master Limited Partnerships | 5.15% | |||
Industrials | 2.98% | |||
Technology | 2.50% | |||
Consumer Non-cyclical | 1.38% | |||
Communications | 1.01% | |||
Energy | 0.87% | |||
Cash, Cash Equivalents, & Other Net Assets | 6.24% | |||
|
| |||
| 100.00% | ||||
|
|
| * | Holdings are subject to change. |
Annual Report | September 30, 2014 |
11 |
Table of Contents
| Crystal Strategy Family of Funds | Disclosure of Fund Expenses | |
September 30, 2014 (Unaudited)
|
Examples. As a shareholder of the Crystal Strategy Absolute Income Fund, the Crystal Strategy Absolute Return Fund or the Crystal Strategy Leveraged Alternative Fund (the “Funds”), you will incur two types of costs: (1) transaction costs, including sales charges on purchase payments and applicable redemption fees; and (2) ongoing costs, including management fees, distribution and service (12b-1) fees and other Fund expenses. The following examples are intended to help you understand your ongoing costs (in dollars) of investing in a Fund and to compare these costs with the ongoing costs of investing in other mutual funds. The examples are based on an investment of $1,000 invested on April 1, 2014 and held until September 30, 2014.
Actual Expenses. The first line under each class in the table below provides information about actual account values and actual expenses. You may use the information in this line, together with the amount you invested, to estimate the expenses that you paid over the period. Simply divide your account value by $1,000 (for example, an $8,600 account value divided by $1,000 = 8.6), then multiply the result by the number in the first line under each class in the table under the heading “Expenses Paid During Period April 1, 2014 – September 30, 2014” to estimate the expenses you paid on your account during this period.
Hypothetical Example for Comparison Purposes. The second line under each class in the table below provides information about hypothetical account values and hypothetical expenses based on a Fund’s actual expense ratio and an assumed rate of return of 5% per year before expenses, which is not the Fund’s actual return. The hypothetical account values and expenses may not be used to estimate the actual ending account balance or expenses you paid for the period. You may use this information to compare the ongoing costs of investing in a Fund and other mutual funds. To do so, compare this 5% hypothetical example with the 5% hypothetical examples that appear in the shareholder reports of the other funds.
Please note that the expenses shown in the table are meant to highlight your ongoing costs only and do not reflect any transactional costs, such as sales charges (loads) or redemption fees. Therefore, the second line under each class in the tables below is useful in comparing ongoing costs only, and will not help you determine the relative total costs of owning different funds. In addition, if these transactional costs were included, your costs would have been higher.
12 |
www.crystalstrategyfunds.com |
Table of Contents
| Crystal Strategy Family of Funds | Disclosure of Fund Expenses | |
September 30, 2014 (Unaudited)
|
Beginning Account Value April 1, 2014 | Ending Account Value September 30, 2014 | Expense Ratio(a) | Expenses Paid During Period April 1, 2014 - September 30, 2014(b) | |||||
Crystal Strategy Absolute Income Fund | ||||||||
Class A | ||||||||
Actual | $ 1,000.00 | $ 1,011.20 | 1.35% | $ 6.81 | ||||
Hypothetical (5% return before expenses) | $ 1,000.00 | $ 1,018.30 | 1.35% | $ 6.83 | ||||
Class I | ||||||||
Actual | $ 1,000.00 | $ 1,010.60 | 1.10% | $ 5.54 | ||||
Hypothetical (5% return before expenses) | $ 1,000.00 | $ 1,019.55 | 1.10% | $ 5.57 | ||||
Class R | ||||||||
Actual | $ 1,000.00 | $ 1,008.40 | 1.61% | $ 8.11 | ||||
Hypothetical (5% return before expenses) | $ 1,000.00 | $ 1,017.00 | 1.61% | $ 8.14 | ||||
Beginning Account Value April 1, 2014 | Ending Account Value September 30, 2014 | Expense Ratio(a) | Expenses Paid During Period April 1, 2014 - September 30, | |||||
Crystal Strategy Absolute Return Fund | ||||||||
Class A | ||||||||
Actual | $ 1,000.00 | $ 971.70 | 1.40% | $ 6.92 | ||||
Hypothetical (5% return before expenses) | $ 1,000.00 | $ 1,018.05 | 1.40% | $ 7.08 | ||||
Class I | ||||||||
Actual | $ 1,000.00 | $ 973.70 | 1.15% | $ 5.69 | ||||
Hypothetical (5% return before expenses) | $ 1,000.00 | $ 1,019.30 | 1.15% | $ 5.82 | ||||
Class R | ||||||||
Actual | $ 1,000.00 | $ 969.60 | 1.66% | $ 8.20 | ||||
Hypothetical (5% return before expenses) | $ 1,000.00 | $ 1,016.75 | 1.66% | $ 8.39 | ||||
Annual Report | September 30, 2014 |
13 |
Table of Contents
| Crystal Strategy Family of Funds | Disclosure of Fund Expenses | |
September 30, 2014 (Unaudited)
|
Beginning Account Value April 1, 2014 | Ending Account Value September 30, 2014 | Expense Ratio(a) | Expenses Paid During Period April 1, 2014 - September 30, 2014(b) | |||||
Crystal Strategy Leveraged Alternative Fund | ||||||||
Class A | ||||||||
Actual | $ 1,000.00 | $ 967.50 | 1.50% | $ 7.40 | ||||
Hypothetical (5% return before expenses) | $ 1,000.00 | $ 1,017.55 | 1.50% | $ 7.59 | ||||
Class I | ||||||||
Actual | $ 1,000.00 | $ 969.50 | 1.25% | $ 6.17 | ||||
Hypothetical (5% return before expenses) | $ 1,000.00 | $ 1,018.80 | 1.25% | $ 6.33 | ||||
Class R | ||||||||
Actual | $ 1,000.00 | $ 966.50 | 1.75% | $ 8.63 | ||||
Hypothetical (5% return before expenses) | $ 1,000.00 | $ 1,016.29 | 1.75% | $ 8.85 |
| (a) | The Fund’s expense ratios have been annualized based on the Fund’s most recent fiscal half-year expenses. |
| (b) | Expenses are equal to the Fund’s annualized expense ratio, multiplied by the average account value over the period, multiplied by the number of days in the most recent fiscal half year (183), divided by 365. |
14 |
www.crystalstrategyfunds.com |
Table of Contents
| Crystal Strategy Absolute Income Fund | Portfolio of Investments | |
September 30, 2014
|
| Shares | Value (Note 2) | |||||||
CLOSED-END MUTUAL FUNDS (7.74%) | ||||||||
DoubleLine Income Solutions Fund | 11,425 | $ | 247,351 | |||||
Morgan Stanley China Fund, Inc. - Class A | 1,845 | 44,834 | ||||||
Neuberger Berman MLP Income Fund, Inc. | 2,600 | 56,342 | ||||||
|
| |||||||
TOTAL CLOSED-END MUTUAL FUNDS (Cost $346,579) | 348,527 | |||||||
|
| |||||||
COMMON STOCKS (18.28%) | ||||||||
Communications (1.68%) | ||||||||
CBS Outdoor Americas, Inc.- REIT | 2,535 | 75,898 | ||||||
|
| |||||||
Energy (1.89%) | ||||||||
ConocoPhillips | 570 | 43,616 | ||||||
Occidental Petroleum Corp. | 215 | 20,672 | ||||||
Royal Dutch Shell PLC - ADR | 275 | 20,936 | ||||||
|
| |||||||
Total Energy | 85,224 | |||||||
|
| |||||||
Financials (14.71%) | ||||||||
Colony Financial, Inc. - REIT | 5,935 | 132,825 | ||||||
Fifth Street Finance Corp. | 8,775 | 80,555 | ||||||
ICICI Bank, Ltd. - Sponsored ADR | 915 | 44,927 | ||||||
NorthStar Realty Finance Corp. - REIT | 8,910 | 157,440 | ||||||
Starwood Property Trust, Inc. - REIT | 7,590 | 166,676 | ||||||
Zurich Insurance Group AG - ADR | 2,690 | 80,186 | ||||||
|
| |||||||
Total Financials | 662,609 | |||||||
|
| |||||||
TOTAL COMMON STOCKS (Cost $855,972) | 823,731 | |||||||
|
| |||||||
EXCHANGE-TRADED FUNDS (39.69%) | ||||||||
iShares® JP Morgan USD Emerging Markets Bond ETF | 530 | 59,811 | ||||||
PowerShares® Global Listed Private Equity Portfolio | 3,420 | 37,928 | ||||||
ProShares® Short 7-10 Year Treasury(a) | 5,340 | 168,476 | ||||||
ProShares® Short MSCI EAFE(a) | 9,375 | 312,562 | ||||||
ProShares® Short MSCI Emerging Markets(a) | 10,520 | 268,155 | ||||||
ProShares® Short Real Estate(a) | 9,645 | 222,607 | ||||||
ProShares® Short Russell2000®(a) | 19,715 | 338,704 | ||||||
ProShares® Short S&P500®(a) | 8,995 | 206,975 | ||||||
SPDR® S&P® International Dividend ETF | 1,815 | 83,998 | ||||||
| See Notes to Financial Statements. | ||
Annual Report | September 30, 2014 |
15 |
Table of Contents
| Crystal Strategy Absolute Income Fund | Portfolio of Investments | |
September 30, 2014
|
| Shares | Value (Note 2) | |||||||
EXCHANGE-TRADED FUNDS (39.69%) (continued) | ||||||||
WisdomTree® Japan Hedged Real Estate Fund(a) | 3,300 | $ | 88,938 | |||||
|
| |||||||
TOTAL EXCHANGE-TRADED FUNDS (Cost $1,780,796) | 1,788,154 | |||||||
|
| |||||||
EXCHANGE-TRADED NOTES (1.35%) | ||||||||
JPMorgan Alerian MLP Index ETN | 1,145 | 60,776 | ||||||
|
| |||||||
TOTAL EXCHANGE-TRADED NOTES (Cost $60,233) | 60,776 | |||||||
|
| |||||||
MASTER LIMITED PARTNERSHIPS (3.99%) | ||||||||
Apollo Global Management LLC - Class A | 540 | 12,874 | ||||||
Blackstone Group LP | 1,115 | 35,100 | ||||||
Carlyle Group LP | 365 | 11,118 | ||||||
KKR & Co. LP | 855 | 19,066 | ||||||
Lazard, Ltd. - Class A | 1,605 | 81,374 | ||||||
Oaktree Capital Group LLC | 400 | 20,440 | ||||||
|
| |||||||
TOTAL MASTER LIMITED PARTNERSHIPS (Cost $187,622) | 179,972 | |||||||
|
| |||||||
OPEN-END MUTUAL FUNDS (20.24%) | ||||||||
DoubleLine Total Return Bond Fund - Institutional Class | 46,121 | 504,564 | ||||||
Driehaus Active Income Fund - Retail Class | 3,428 | 36,126 | ||||||
Forward Select Income Fund - Institutional Class | 8,125 | 205,067 | ||||||
Goldman Sachs Strategic Income Fund - Institutional Class | 5,819 | 61,623 | ||||||
RiverPark Strategic Income Fund - Institutional Class | 10,179 | 104,440 | ||||||
|
| |||||||
TOTAL OPEN-END MUTUAL FUNDS (Cost $916,731) | 911,820 | |||||||
|
| |||||||
| See Notes to Financial Statements. | ||
16 |
www.crystalstrategyfunds.com |
Table of Contents
| Crystal Strategy Absolute Income Fund | Portfolio of Investments | |
September 30, 2014
|
7-Day Yield | Shares | Value (Note 2) | ||||||||
SHORT TERM INVESTMENTS (9.84%) | ||||||||||
Fidelity Institutional Money Market Portfolio | 0.05075% | 443,183 | $ | 443,183 | ||||||
|
| |||||||||
TOTAL SHORT TERM INVESTMENTS (Cost $443,183) | 443,183 | |||||||||
|
| |||||||||
TOTAL INVESTMENTS (101.13%) (Cost $4,591,116) | $ | 4,556,163 | ||||||||
Liabilities In Excess Of Other Assets (-1.13%) | (51,041) | |||||||||
|
| |||||||||
NET ASSETS (100.00%) | $ | 4,505,122 | ||||||||
|
| |||||||||
| (a) | Non-Income Producing Security. |
Common Abbreviations:
ADR - American Depositary Receipt.
AG - Aktiengesellschaft is a German term that refers to a corporation that is limited by shares, i.e., owned by shareholders.
EAFE - Europe, Australasia, Far East.
ETF - Exchange-Traded Fund.
ETN - Exchange-Traded Note.
LLC - Limited Liability Company.
LP - Limited Partnership.
MLP - Master Limited Partnership.
MSCI - Morgan Stanley Capital International.
REIT - Real Estate Investment Trust.
PLC - Public Limited Company.
S&P - Standard & Poor’s.
SPDR - Standard & Poor’s Depository Receipts.
For Fund compliance purposes, the Fund’s industry classifications refer to any one or more of the industry sub-classifications used by one or more widely recognized market indexes or ratings group indexes, and/or as defined by Fund’s management. This definition may not apply for purposes of this report, which may combine industry sub-classifications for reporting ease. Industries are shown as a percentage of net assets. (Unaudited)
| See Notes to Financial Statements. | ||
Annual Report | September 30, 2014 |
17 |
Table of Contents
| Crystal Strategy Absolute Return Fund | Portfolio of Investments | |
September 30, 2014
|
| Shares | Value (Note 2) | |||||||
CLOSED-END MUTUAL FUNDS (5.78%) | ||||||||
DoubleLine Income Solutions Fund | 5,050 | $ | 109,333 | |||||
Morgan Stanley China Fund, Inc. - Class A | 4,480 | 108,864 | ||||||
Neuberger Berman MLP Income Fund, Inc. | 3,045 | 65,985 | ||||||
|
| |||||||
TOTAL CLOSED-END MUTUAL FUNDS (Cost $284,500) | 284,182 | |||||||
|
| |||||||
COMMON STOCKS (14.89%) | ||||||||
Communications (0.97%) | ||||||||
CBS Outdoor Americas, Inc.- REIT | 1,585 | �� | 47,455 | |||||
|
| |||||||
Consumer Non-cyclical (1.22%) | ||||||||
Odyssey Marine Exploration, Inc.(a) | 66,030 | 60,087 | ||||||
|
| |||||||
Energy (0.81%) | ||||||||
ConocoPhillips | 520 | 39,790 | ||||||
|
| |||||||
Financials (6.70%) | ||||||||
Huntington Bancshares, Inc. | 10,915 | 106,203 | ||||||
ICICI Bank, Ltd. - Sponsored ADR | 1,675 | 82,242 | ||||||
NorthStar Realty Finance Corp. - REIT | 3,150 | 55,661 | ||||||
Starwood Property Trust, Inc. - REIT | 3,895 | 85,534 | ||||||
|
| |||||||
Total Financials | 329,640 | |||||||
|
| |||||||
Industrials (2.88%) | ||||||||
Cemex SAB de CV - Sponsored ADR(a) | 10,870 | 141,747 | ||||||
|
| |||||||
Technology (2.31%) | ||||||||
Microsoft Corp. | 2,455 | 113,814 | ||||||
|
| |||||||
TOTAL COMMON STOCKS (Cost $790,845) | 732,533 | |||||||
|
| |||||||
EXCHANGE-TRADED FUNDS (49.78%) | ||||||||
First Trust NASDAQ Technology Dividend Index Fund | 3,140 | 85,000 | ||||||
Global X Guru Index ETF | 1,565 | 41,181 | ||||||
Guggenheim Insider Sentiment ETF | 860 | 40,205 | ||||||
Guggenheim Spin-Off ETF | 920 | 41,510 | ||||||
iShares® MSCI Frontier 100 ETF | 2,145 | 81,167 | ||||||
iShares® MSCI Japan ETF | 7,245 | 85,274 | ||||||
Market Vectors® Semiconductor ETF | 1,324 | 67,643 | ||||||
| See Notes to Financial Statements. | ||
18 |
www.crystalstrategyfunds.com |
Table of Contents
| Crystal Strategy Absolute Return Fund | Portfolio of Investments | |
September 30, 2014
|
| Shares | Value (Note 2) | |||||||
EXCHANGE-TRADED FUNDS (49.78%) (continued) | ||||||||
PowerShares® Global Listed Private Equity Portfolio | 4,390 | $ | 48,685 | |||||
ProShares® Short 20+ Year Treasury(a) | 1,055 | 29,266 | ||||||
ProShares® Short MSCI EAFE(a) | 17,890 | 596,453 | ||||||
ProShares® Short MSCI Emerging Markets(a) | 5,615 | 143,126 | ||||||
ProShares® Short QQQ(a) | 9,060 | 142,695 | ||||||
ProShares® Short Russell2000®(a) | 47,950 | 823,781 | ||||||
WisdomTree® Japan Hedged Equity Fund | 2,955 | 154,606 | ||||||
WisdomTree® Japan Hedged Real Estate Fund(a) | 2,540 | 68,455 | ||||||
|
| |||||||
TOTAL EXCHANGE-TRADED FUNDS (Cost $2,422,290) | 2,449,047 | |||||||
|
| |||||||
MASTER LIMITED PARTNERSHIPS (3.93%) | ||||||||
Apollo Global Management LLC - Class A | 685 | 16,330 | ||||||
Blackstone Group LP | 1,550 | 48,794 | ||||||
Carlyle Group LP | 245 | 7,463 | ||||||
KKR & Co. LP | 875 | 19,513 | ||||||
Lazard, Ltd. - Class A | 1,700 | 86,190 | ||||||
Oaktree Capital Group LLC | 300 | 15,330 | ||||||
|
| |||||||
TOTAL MASTER LIMITED PARTNERSHIPS (Cost $204,732) | 193,620 | |||||||
|
| |||||||
OPEN-END MUTUAL FUNDS (10.98%) | ||||||||
Absolute Opportunities Fund - Institutional Class(a) | 2,846 | 32,843 | ||||||
ASG Global Alternatives Fund - Institutional Class | 3,811 | 42,685 | ||||||
ASG Managed Futures Strategy Fund - Institutional Class | 3,915 | 44,553 | ||||||
Aston/River Road Long-Short Fund - Institutional Class | 3,601 | 42,312 | ||||||
Bogle Investment Management Small Cap Growth Fund - Institutional Class | 1,155 | 41,328 | ||||||
DoubleLine Total Return Bond Fund - Institutional Class | 9,293 | 101,661 | ||||||
Goldman Sachs Strategic Income Fund - Institutional Class | 4,108 | 43,501 | ||||||
MainStay Marketfield Fund - Institutional Class | 3,685 | 62,096 | ||||||
Whitebox Tactical Opportunities Fund - Institutional Class | 6,807 | 85,227 | ||||||
| See Notes to Financial Statements. | ||
Annual Report | September 30, 2014 |
19 |
Table of Contents
| Crystal Strategy Absolute Return Fund | Portfolio of Investments | |
September 30, 2014
|
| Value | ||||||||||||
| Shares | (Note 2) | |||||||||||
OPEN-END MUTUAL FUNDS (10.98%) (continued) | ||||||||||||
William Blair Macro Allocation Fund - Institutional Class | 3,356 | $ | 44,170 | |||||||||
|
| |||||||||||
TOTAL OPEN-END MUTUAL FUNDS (Cost $540,982) | 540,376 | |||||||||||
|
| |||||||||||
| 7-Day | Value | |||||||||||
| Yield | Shares | (Note 2) | ||||||||||
SHORT TERM INVESTMENTS (12.35%) | ||||||||||||
Fidelity Institutional Money Market Portfolio | 0.05075% | 607,550 | 607,550 | |||||||||
|
| |||||||||||
TOTAL SHORT TERM INVESTMENTS (Cost $607,550) | 607,550 | |||||||||||
|
| |||||||||||
TOTAL INVESTMENTS (97.71%) (Cost $4,850,899) | $ | 4,807,308 | ||||||||||
Other Assets In Excess Of Liabilities (2.29%) | 112,674 | |||||||||||
|
| |||||||||||
NET ASSETS (100.00%) | $ | 4,919,982 | ||||||||||
|
| |||||||||||
| (a) | Non-Income Producing Security. |
Common Abbreviations:
ADR - American Depositary Receipt.
EAFE - Europe, Australasia, Far East.
ETF - Exchange-Traded Fund.
LLC - Limited Liability Company.
LP - Limited Partnership.
MLP - Master Limited Partnership.
MSCI - Morgan Stanley Capital International.
REIT - Real Estate Investment Trust.
SAB de CV - A variable capital company.
For Fund compliance purposes, the Fund’s industry classifications refer to any one or more of the industry sub-classifications used by one or more widely recognized market indexes or ratings group indexes, and/or as defined by Fund’s management. This definition may not apply for purposes of this report, which may combine industry sub-classifications for reporting ease. Industries are shown as a percentage of net assets. (Unaudited)
| See Notes to Financial Statements. | ||
20 |
www.crystalstrategyfunds.com |
Table of Contents
| Crystal Strategy Leveraged Alternative Fund | Portfolio of Investments | |
September 30, 2014
|
| Value | ||||||||
| Shares | (Note 2) | |||||||
CLOSED-END MUTUAL FUNDS (6.68%) | ||||||||
DoubleLine Income Solutions Fund | 5,850 | $ | 126,653 | |||||
Morgan Stanley China Fund, Inc. - Class A | 5,825 | 141,547 | ||||||
Neuberger Berman MLP Income Fund, Inc. | 3,420 | 74,111 | ||||||
|
| |||||||
TOTAL CLOSED-END MUTUAL FUNDS (Cost $344,017) | 342,311 | |||||||
|
| |||||||
COMMON STOCKS (15.40%) | ||||||||
Communications (1.01%) | ||||||||
CBS Outdoor Americas, Inc. - REIT | 1,720 | 51,497 | ||||||
|
| |||||||
Consumer Non-cyclical (1.38%) | ||||||||
Odyssey Marine Exploration, Inc.(a) | 77,410 | 70,443 | ||||||
|
| |||||||
Energy (0.87%) | ||||||||
ConocoPhillips | 580 | 44,382 | ||||||
|
| |||||||
Financials (6.66%) | ||||||||
Huntington Bancshares, Inc. | 12,875 | 125,274 | ||||||
ICICI Bank, Ltd. - Sponsored ADR | 1,930 | 94,763 | ||||||
NorthStar Realty Finance Corp. - REIT | 2,990 | 52,833 | ||||||
Starwood Property Trust, Inc. - REIT | 3,130 | 68,735 | ||||||
|
| |||||||
Total Financials | 341,605 | |||||||
|
| |||||||
Industrials (2.98%) | ||||||||
Cemex SAB de CV - Sponsored ADR(a) | 11,720 | 152,829 | ||||||
|
| |||||||
Technology (2.50%) | ||||||||
Microsoft Corp. | 2,765 | 128,185 | ||||||
|
| |||||||
TOTAL COMMON STOCKS (Cost $871,365) | 788,941 | |||||||
|
| |||||||
EXCHANGE-TRADED FUNDS (53.46%) | ||||||||
First Trust NASDAQ Technology Dividend Index Fund | 4,010 | 108,551 | ||||||
Global X Guru Index ETF | 1,893 | 49,812 | ||||||
Guggenheim Insider Sentiment ETF | 1,035 | 48,386 | ||||||
Guggenheim Spin-Off ETF | 1,110 | 50,083 | ||||||
iShares® MSCI Frontier 100 ETF | 2,590 | 98,006 | ||||||
iShares® MSCI Japan ETF | 10,365 | 121,996 | ||||||
Market Vectors® Semiconductor ETF | 1,445 | 73,825 | ||||||
| See Notes to Financial Statements. | ||
Annual Report | September 30, 2014 |
21 |
Table of Contents
| Crystal Strategy Leveraged Alternative Fund | Portfolio of Investments | |
September 30, 2014
|
| Value | ||||||||
| Shares | (Note 2) | |||||||
EXCHANGE-TRADED FUNDS (53.46%) (continued) | ||||||||
PowerShares® Global Listed Private Equity Portfolio | 4,100 | $ | 45,469 | |||||
ProShares® Short MSCI EAFE(a) | 17,250 | 575,115 | ||||||
ProShares® Short MSCI Emerging Markets(a) | 9,375 | 238,969 | ||||||
ProShares® Short QQQ(a) | 9,850 | 155,138 | ||||||
ProShares® Short Russell2000®(a) | 51,985 | 893,102 | ||||||
WisdomTree® Japan Hedged Equity Fund | 3,950 | 206,664 | ||||||
WisdomTree® Japan Hedged Real Estate Fund(a) | 2,770 | 74,654 | ||||||
|
| |||||||
TOTAL EXCHANGE-TRADED FUNDS (Cost $2,745,024) | 2,739,770 | |||||||
|
| |||||||
MASTER LIMITED PARTNERSHIPS (5.15%) | ||||||||
Apollo Global Management LLC - Class A | 750 | 17,880 | ||||||
Blackstone Group LP | 2,090 | 65,793 | ||||||
Carlyle Group LP | 774 | 23,576 | ||||||
KKR & Co. LP | 1,395 | 31,108 | ||||||
Lazard, Ltd. - Class A | 1,965 | 99,626 | ||||||
Oaktree Capital Group LLC | 509 | 26,010 | ||||||
|
| |||||||
TOTAL MASTER LIMITED PARTNERSHIPS (Cost $285,322) | 263,993 | |||||||
|
| |||||||
OPEN-END MUTUAL FUNDS (13.07%) | ||||||||
Absolute Opportunities Fund - Institutional Class(a) | 7,155 | 82,572 | ||||||
ASG Global Alternatives Fund - Institutional Class | 3,585 | 40,149 | ||||||
Aston/River Road Long-Short Fund - Institutional Class | 6,853 | 80,524 | ||||||
DoubleLine Total Return Bond Fund - Institutional Class | 14,508 | 158,713 | ||||||
Goldman Sachs Strategic Income Fund - Institutional Class | 5,642 | 59,751 | ||||||
MainStay Marketfield Fund - Institutional Class | 4,870 | 82,053 | ||||||
Whitebox Tactical Opportunities Fund - Institutional Class | 8,123 | 101,704 | ||||||
William Blair Macro Allocation Fund - Institutional Class | 4,883 | 64,262 | ||||||
|
| |||||||
TOTAL OPEN-END MUTUAL FUNDS (Cost $676,119) | 669,728 | |||||||
|
| |||||||
| See Notes to Financial Statements. | ||
22 |
www.crystalstrategyfunds.com |
Table of Contents
| Crystal Strategy Leveraged Alternative Fund | Portfolio of Investments | |
September 30, 2014
|
| 7-Day Yield | Shares | Value (Note 2) | ||||||||
SHORT TERM INVESTMENTS (6.51%) | ||||||||||
Fidelity Institutional Money Market Portfolio | 0.05075% | 333,670 | $ | 333,670 | ||||||
|
| |||||||||
TOTAL SHORT TERM INVESTMENTS (Cost $333,670) | 333,670 | |||||||||
|
| |||||||||
TOTAL INVESTMENTS (100.27%) (Cost $5,255,517) | $ | 5,138,413 | ||||||||
Liabilities In Excess Of Other Assets (-0.27%) | (13,698) | |||||||||
|
| |||||||||
NET ASSETS (100.00%) | $ | 5,124,715 | ||||||||
|
| |||||||||
| (a) | Non-Income Producing Security. |
Common Abbreviations:
ADR - American Depositary Receipt.
EAFE - Europe, Australasia, Far East.
ETF - Exchange-Traded Fund.
LLC - Limited Liability Company.
LP - Limited Partnership.
MLP - Master Limited Partnership.
MSCI - Morgan Stanley Capital International.
REIT - Real Estate Investment Trust.
SAB de CV - A variable capital company.
For Fund compliance purposes, the Fund’s industry classifications refer to any one or more of the industry sub-classifications used by one or more widely recognized market indexes or ratings group indexes, and/or as defined by Fund’s management. This definition may not apply for purposes of this report, which may combine industry sub-classifications for reporting ease. Industries are shown as a percentage of net assets. (Unaudited)
| See Notes to Financial Statements. | ||
Annual Report | September 30, 2014 |
23 |
Table of Contents
| Crystal Strategy Family of Funds | Statements of Assets and Liabilities | |
September 30, 2014
|
Crystal Strategy Absolute Income Fund | Crystal Strategy Absolute Return Fund | Crystal Strategy Leveraged Alternative Fund | ||||||||||
ASSETS: | ||||||||||||
Investments, at value | $ | 4,556,163 | $ | 4,807,308 | $ | 5,138,413 | ||||||
Receivable for investments sold | 404,814 | 958,528 | 3,506,694 | |||||||||
Receivable for shares sold | 41,665 | 120,608 | 0 | |||||||||
Receivable due from adviser | 22,717 | 26,190 | 22,224 | |||||||||
Dividends receivable | 10,629 | 6,317 | 7,418 | |||||||||
Prepaid assets | 7,365 | 7,309 | 7,864 | |||||||||
|
|
|
|
|
| |||||||
Total Assets | 5,043,353 | 5,926,260 | 8,682,613 | |||||||||
|
|
|
|
|
| |||||||
LIABILITIES: | ||||||||||||
Payable for investments purchased | 497,302 | 959,633 | 3,510,258 | |||||||||
Payable for distribution and service fees | 210 | 402 | 56 | |||||||||
Payable to trustees | 34 | 43 | 55 | |||||||||
Payable to chief compliance officer | 289 | 627 | 1,584 | |||||||||
Accrued expenses and other liabilities | 40,396 | 45,573 | 45,945 | |||||||||
|
|
|
|
|
| |||||||
Total Liabilities | 538,231 | 1,006,278 | 3,557,898 | |||||||||
|
|
|
|
|
| |||||||
NET ASSETS | $ | 4,505,122 | $ | 4,919,982 | $ | 5,124,715 | ||||||
|
|
|
|
|
| |||||||
NET ASSETS CONSIST OF: | ||||||||||||
Paid-in capital (Note 6) | $ | 4,538,589 | $ | 4,987,930 | $ | 5,295,965 | ||||||
Accumulated net investment income | 6,787 | 8,280 | 11,325 | |||||||||
Accumulated net realized loss on investments | (5,301) | (32,637) | (65,471) | |||||||||
Net unrealized depreciation on investments | (34,953) | (43,591) | (117,104) | |||||||||
|
|
|
|
|
| |||||||
NET ASSETS | $ | 4,505,122 | $ | 4,919,982 | $ | 5,124,715 | ||||||
|
|
|
|
|
| |||||||
INVESTMENTS, AT COST | $ | 4,591,116 | $ | 4,850,899 | $ | 5,255,517 | ||||||
| See Notes to Financial Statements. | ||
24 |
www.crystalstrategyfunds.com |
Table of Contents
| Crystal Strategy Family of Funds | Statements of Assets and Liabilities | |
September 30, 2014
|
Crystal Strategy Absolute Income Fund | Crystal Strategy Absolute Return Fund | Crystal Strategy Leveraged Alternative Fund | ||||||||||
| ||||||||||||
PRICING OF SHARES | ||||||||||||
Class A: | ||||||||||||
Net Asset Value, offering and redemption price per share(a) | $ | 10.09 | $ | 9.60 | $ | 9.52 | ||||||
Net Assets | $ | 1,124,005 | $ | 1,982,281 | $ | 263,888 | ||||||
Shares of beneficial interest outstanding | 111,417 | 206,588 | 27,714 | |||||||||
Maximum offering price per share (NAV/0.945, based on maximum sales charge of 5.50% of the offering price) | $ | 10.68 | $ | 10.16 | $ | 10.07 | ||||||
Class I: | ||||||||||||
Net Asset Value, offering and redemption price per share | $ | 10.07 | $ | 9.63 | $ | 9.54 | ||||||
Net Assets | $ | 3,376,037 | $ | 2,932,910 | $ | 4,856,072 | ||||||
Shares of beneficial interest outstanding | 335,096 | 304,663 | 508,967 | |||||||||
Class R: | ||||||||||||
Net Asset Value, offering and redemption price per share | $ | 10.01 | (b) | $ | 9.58 | $ | 9.51 | |||||
Net Assets | $ | 5,080 | $ | 4,791 | $ | 4,755 | ||||||
Shares of beneficial interest outstanding | 507 | 500 | 500 | |||||||||
| (a) | Redemption price per share may be reduced for any applicable contingent deferred sales charge. For a description of a possible sales charge, please see the Fund’s Prospectus. |
| (b) | Net asset value per share does not recalculate due to fractional shares not presented and rounding. |
| See Notes to Financial Statements. | ||
Annual Report | September 30, 2014 |
25 |
Table of Contents
| Crystal Strategy Family of Funds | Statements of Operations | |
For the Period Ended September 30, 2014(a)
|
Crystal Strategy Absolute Income Fund | Crystal Strategy Absolute Return Fund | Crystal Strategy Leveraged Alternative Fund | ||||||||||
| ||||||||||||
INVESTMENT INCOME: | ||||||||||||
Dividends | $ | 44,943 | $ | 24,691 | $ | 53,084 | ||||||
Foreign taxes withheld | (211) | (85) | (297) | |||||||||
|
|
|
|
|
| |||||||
Total Investment Income | 44,732 | 24,606 | 52,787 | |||||||||
|
|
|
|
|
| |||||||
EXPENSES: | ||||||||||||
Investment advisory fee (Note 7) | 8,576 | 12,917 | 29,710 | |||||||||
Administration fee | 28,386 | 44,952 | 107,519 | |||||||||
Distribution and service fees | ||||||||||||
Class A | 420 | 1,535 | 203 | |||||||||
Class R | 19 | 19 | 19 | |||||||||
Custodian fee | 3,763 | 3,763 | 3,800 | |||||||||
Legal fees | 9,333 | 11,044 | 14,691 | |||||||||
Audit fees | 18,350 | 18,350 | 18,350 | |||||||||
Transfer agent fee | 20,353 | 30,814 | 20,604 | |||||||||
Trustees fees and expenses | 1,128 | 724 | 1,503 | |||||||||
Registration and filing fees | 3,058 | 2,995 | 2,995 | |||||||||
Printing fees | 1,962 | 2,694 | 4,040 | |||||||||
Chief compliance officer fee | 2,958 | 5,115 | 14,508 | |||||||||
Insurance expense | 243 | 336 | 2,353 | |||||||||
Offering cost expense | 58,281 | 58,281 | 58,282 | |||||||||
Other expenses | 5,154 | 6,465 | 10,393 | |||||||||
|
|
|
|
|
| |||||||
Total Expenses | 161,984 | 200,004 | 288,970 | |||||||||
|
|
|
|
|
| |||||||
Less fees waived/reimbursed by investment adviser | ||||||||||||
Class A | (20,113) | (58,887) | (6,120) | |||||||||
Class I | (122,906) | (116,207) | (236,372) | |||||||||
Class R | (1,804) | (822) | (479) | |||||||||
Total fees waived/reimbursed by investment adviser (Note 7) | (144,823) | (175,916) | (242,971) | |||||||||
|
|
|
|
|
| |||||||
Less fess waived by Administrator (Note 7) | (4,930) | (5,064) | (6,690) | |||||||||
|
|
|
|
|
| |||||||
Net Expenses | 12,231 | 19,024 | 39,309 | |||||||||
|
|
|
|
|
| |||||||
NET INVESTMENT INCOME | 32,501 | 5,582 | 13,478 | |||||||||
|
|
|
|
|
| |||||||
REALIZED AND UNREALIZED GAIN/(LOSS) ON INVESTMENTS: | ||||||||||||
Net realized loss on: | ||||||||||||
Investments | (7,494) | (36,210) | (76,882) | |||||||||
| See Notes to Financial Statements. | ||
26 |
www.crystalstrategyfunds.com |
Table of Contents
| Crystal Strategy Family of Funds | Statements of Operations | |
For the Period Ended September 30, 2014(a)
|
| Crystal Strategy Absolute Income Fund | Crystal Strategy Absolute Return Fund | Crystal Strategy Leveraged Alternative Fund | ||||||||||
| ||||||||||||
Long-term capital gains from other investment companies | – | 150 | – | |||||||||
|
|
|
|
|
| |||||||
Net realized loss | (7,494) | (36,060) | (76,882) | |||||||||
|
|
|
|
|
| |||||||
Net change in unrealized depreciation on: | ||||||||||||
Investments | (34,953) | (43,591) | (117,104) | |||||||||
|
|
|
|
|
| |||||||
Net change in unrealized depreciation | (34,953) | (43,591) | (117,104) | |||||||||
|
|
|
|
|
| |||||||
NET REALIZED AND UNREALIZED LOSS ON | (42,447) | (79,651) | (193,986) | |||||||||
|
|
|
|
|
| |||||||
NET DECREASE IN NET ASSETS RESULTING FROM | $ | (9,946) | $ | (74,069) | $ | (180,508) | ||||||
|
|
|
|
|
| |||||||
| (a) | Commenced operations on December 31, 2013. |
| See Notes to Financial Statements. | ||
Annual Report | September 30, 2014 |
27 |
Table of Contents
| Crystal Strategy Absolute Income Fund | Changes in Net Assets | |
| For the Period Ended September 30, 2014(a) | ||||
OPERATIONS: | ||||
Net investment income | $ | 32,501 | ||
Net realized loss on investments | (7,494) | |||
Net change in unrealized depreciation on investments | (34,953) | |||
|
| |||
Net decrease in net assets resulting from operations | (9,946) | |||
|
| |||
DISTRIBUTIONS TO SHAREHOLDERS: | ||||
From net investment income | ||||
Class A | (4,452) | |||
Class I | (23,816) | |||
Class R | (73) | |||
|
| |||
Total distributions | (28,341) | |||
|
| |||
BENEFICIAL SHARE TRANSACTIONS: | ||||
Class A | ||||
Shares sold | 1,129,757 | |||
Dividends reinvested | 3,512 | |||
Shares redeemed | (300) | |||
Redemption fees (Note 6) | 2 | |||
|
| |||
Net increase from beneficial share transactions | 1,132,971 | |||
|
| |||
Class I | ||||
Shares sold | 3,411,813 | |||
Dividends reinvested | 23,742 | |||
Shares redeemed | (30,193) | |||
|
| |||
Net increase from beneficial share transactions | 3,405,362 | |||
|
| |||
Class R | ||||
Shares sold | 5,203 | |||
Dividends reinvested | 73 | |||
Shares redeemed | (200) | |||
|
| |||
Net increase from beneficial share transactions | 5,076 | |||
|
| |||
Net increase in net assets | 4,505,122 | |||
|
| |||
NET ASSETS: | ||||
Beginning of period | 0 | |||
|
| |||
End of period (including accumulated net investment income of $6,787) | $ | 4,505,122 | ||
|
| |||
| (a) | Commenced operations on December 31, 2013. |
| See Notes to Financial Statements. | ||
28 |
www.crystalstrategyfunds.com |
Table of Contents
| Crystal Strategy Absolute Return Fund | Statement of Changes in Net Assets | |
| For the Period Ended September 30, 2014(a) | ||||
OPERATIONS: | ||||
Net investment income | $ | 5,582 | ||
Net realized loss on investments | (36,210) | |||
Long-term capital gain distributions from other investment companies | 150 | |||
Net change in unrealized depreciation on investments | (43,591) | |||
|
| |||
Net decrease in net assets resulting from operations | (74,069) | |||
|
| |||
BENEFICIAL SHARE TRANSACTIONS: | ||||
Class A | ||||
Shares sold | 2,051,212 | |||
Shares redeemed | (34,508) | |||
Redemption fees (Note 6) | 210 | |||
|
| |||
Net increase from beneficial share transactions | 2,016,914 | |||
|
| |||
Class I | ||||
Shares sold | 3,171,305 | |||
Shares redeemed | (199,919) | |||
Redemption fees (Note 6) | 748 | |||
|
| |||
Net increase from beneficial share transactions | 2,972,134 | |||
|
| |||
Class R | ||||
Shares sold | 5,203 | |||
Shares redeemed | (200) | |||
|
| |||
Net increase from beneficial share transactions | 5,003 | |||
|
| |||
Net increase in net assets | 4,919,982 | |||
|
| |||
NET ASSETS: | ||||
Beginning of period | 0 | |||
|
| |||
End of period (including accumulated net investment income of $8,280) | $ | 4,919,982 | ||
|
| |||
| (a) | Commenced operations on December 31, 2013. |
| See Notes to Financial Statements. | ||
Annual Report | September 30, 2014 |
29 |
Table of Contents
| Crystal Strategy Leveraged Alternative Fund | Statement of Changes in Net Assets | |
| For the Period Ended September 30, 2014(a) | ||||
OPERATIONS: | ||||
Net investment income | $ | 13,478 | ||
Net realized loss on investments | (76,882) | |||
Net change in unrealized depreciation on investments | (117,104) | |||
|
| |||
Net decrease in net assets resulting from operations | (180,508) | |||
|
| |||
BENEFICIAL SHARE TRANSACTIONS: | ||||
Class A | ||||
Shares sold | 267,943 | |||
Shares redeemed | (240) | |||
|
| |||
Net increase from beneficial share transactions | 267,703 | |||
|
| |||
Class I | ||||
Shares sold | 5,115,539 | |||
Shares redeemed | (83,022) | |||
|
| |||
Net increase from beneficial share transactions | 5,032,517 | |||
|
| |||
Class R | ||||
Shares sold | 5,203 | |||
Shares redeemed | (200) | |||
|
| |||
Net increase from beneficial share transactions | 5,003 | |||
|
| |||
Net increase in net assets | 5,124,715 | |||
|
| |||
NET ASSETS: | ||||
Beginning of period | 0 | |||
|
| |||
End of period (including accumulated net investment income of $11,325) | $ | 5,124,715 | ||
|
| |||
| (a) | Commenced operations on December 31, 2013. |
| See Notes to Financial Statements. | ||
30 |
www.crystalstrategyfunds.com |
Table of Contents
| Crystal Strategy Absolute Income Fund – Class A | Financial Highlights | |
For a share outstanding throughout the period presented
|
| For the Period | ||||
| Ended | ||||
| September 30, 2014(a) | ||||
| ||||
NET ASSET VALUE, BEGINNING OF PERIOD | $ | 10.00 | ||
INCOME/(LOSS) FROM OPERATIONS: | ||||
Net investment income(b) | 0.28 | |||
Net realized and unrealized loss on investments | (0.10) | |||
|
| |||
Total from Investment Operations | 0.18 | |||
|
| |||
LESS DISTRIBUTIONS: | ||||
From investment income | (0.09) | |||
|
| |||
Total Distributions | (0.09) | |||
|
| |||
REDEMPTION FEES ADDED TO PAID IN CAPITAL | 0.00(c) | |||
|
| |||
NET INCREASE IN NET ASSET VALUE | 0.09 | |||
|
| |||
NET ASSET VALUE, END OF PERIOD | $ | 10.09 | ||
|
| |||
TOTAL RETURN(d) | 1.83% | |||
SUPPLEMENTAL DATA: | ||||
Net assets, End of Period (in 000s) | $ | 1,124 | ||
RATIOS TO AVERAGE NET ASSETS: | ||||
Operating expenses excluding fee waivers/reimbursements(e) | 13.76%(f) | |||
Operating expenses including fee waivers/reimbursements(e) | 1.35%(f) | |||
Net investment income including fee waivers/reimbursements(e) | 2.92%(f) | |||
PORTFOLIO TURNOVER RATE | 81%(g) | |||
| (a) | Commenced operations on December 31, 2013. |
| (b) | Per share amounts are based upon average shares outstanding. |
| (c) | Less than $0.005 per share. |
| (d) | Total return is for the period indicated and has not been annualized. The total return would have been lower had certain expenses not been waived / reimbursed during the period. The return shown does not reflect the deduction of taxes that a shareholder would pay on Fund distributions or the redemption of Fund shares. |
| (e) | The ratios exclude the impact of expenses of the underlying funds in which the Fund invests as represented in the Portfolio of Investments. |
| (f) | Annualized. |
| (g) | Portfolio turnover rate for periods less than one full year have not been annualized. |
| See Notes to Financial Statements. | ||
Annual Report | September 30, 2014 |
31 |
Table of Contents
| Crystal Strategy Absolute Income Fund – Class I | Financial Highlights | |
For a share outstanding throughout the period presented
|
| For the Period | ||||
| Ended | ||||
| September 30, 2014(a) | ||||
| ||||
NET ASSET VALUE, BEGINNING OF PERIOD | $ | 10.00 | ||
INCOME/(LOSS) FROM OPERATIONS: | ||||
Net investment income(b) | 0.31 | |||
Net realized and unrealized loss on investments | (0.12) | |||
|
| |||
Total from Investment Operations | 0.19 | |||
|
| |||
LESS DISTRIBUTIONS: | ||||
From investment income | (0.12) | |||
|
| |||
Total Distributions | (0.12) | |||
|
| |||
REDEMPTION FEES ADDED TO PAID IN CAPITAL | 0.00(c) | |||
|
| |||
NET INCREASE IN NET ASSET VALUE | 0.07 | |||
|
| |||
NET ASSET VALUE, END OF PERIOD | $ | 10.07 | ||
|
| |||
TOTAL RETURN(d) | 1.87% | |||
SUPPLEMENTAL DATA: | ||||
Net assets, End of Period (in 000s) | $ | 3,376 | ||
RATIOS TO AVERAGE NET ASSETS: | ||||
Operating expenses excluding fee waivers/reimbursements(e) | 15.22%(f) | |||
Operating expenses including fee waivers/reimbursements(e) | 1.10%(f) | |||
Net investment income including fee waivers/reimbursements(e) | 3.06%(f) | |||
PORTFOLIO TURNOVER RATE | 81%(g) | |||
| (a) | Commenced operations on December 31, 2013. |
| (b) | Per share amounts are based upon average shares outstanding. |
| (c) | Less than $0.005 per share. |
| (d) | Total return is for the period indicated and has not been annualized. The total return would have been lower had certain expenses not been waived / reimbursed during the period. The return shown does not reflect the deduction of taxes that a shareholder would pay on Fund distributions or the redemption of Fund shares. |
| (e) | The ratios exclude the impact of expenses of the underlying funds in which the Fund invests as represented in the Portfolio of Investments. |
| (f) | Annualized. |
| (g) | Portfolio turnover rate for periods less than one full year have not been annualized. |
| See Notes to Financial Statements. | ||
32 |
www.crystalstrategyfunds.com |
Table of Contents
| Crystal Strategy Absolute Income Fund – Class R | Financial Highlights | |
For a share outstanding throughout the period presented
|
| For the Period | ||||
| Ended | ||||
| September 30, 2014(a) | ||||
| ||||
NET ASSET VALUE, BEGINNING OF PERIOD | $ | 10.00 | ||
INCOME/(LOSS) FROM OPERATIONS: | ||||
Net investment income(b) | 0.17 | |||
Net realized and unrealized loss on investments | (0.01) | |||
|
| |||
Total from Investment Operations | 0.16 | |||
|
| |||
LESS DISTRIBUTIONS: | ||||
From investment income | (0.15) | |||
|
| |||
Total Distributions | (0.15) | |||
|
| |||
NET INCREASE IN NET ASSET VALUE | 0.01 | |||
|
| |||
NET ASSET VALUE, END OF PERIOD | $ | 10.01 | ||
|
| |||
TOTAL RETURN(c) | 1.55% | |||
SUPPLEMENTAL DATA: | ||||
Net assets, End of Period (in 000s) | $ | 5 | ||
RATIOS TO AVERAGE NET ASSETS: | ||||
Operating expenses excluding fee waivers/reimbursements(d) | 49.42%(e) | |||
Operating expenses including fee waivers/reimbursements(d) | 1.60%(e) | |||
Net investment income including fee waivers/reimbursements(d) | 2.18%(e) | |||
PORTFOLIO TURNOVER RATE | 81%(f) | |||
| (a) | Commenced operations on December 31, 2013. |
| (b) | Per share amounts are based upon average shares outstanding. |
| (c) | Total return is for the period indicated and has not been annualized. The total return would have been lower had certain expenses not been waived / reimbursed during the period. The return shown does not reflect the deduction of taxes that a shareholder would pay on Fund distributions or the redemption of Fund shares. |
| (d) | The ratios exclude the impact of expenses of the underlying funds in which the Fund invests as represented in the Portfolio of Investments. |
| (e) | Annualized. |
| (f) | Portfolio turnover rate for periods less than one full year have not been annualized. |
| See Notes to Financial Statements. | ||
Annual Report | September 30, 2014 |
33 |
Table of Contents
| Crystal Strategy Absolute Return Fund – Class A | Financial Highlights | |
For a share outstanding throughout the period presented
|
| For the Period | ||||
| Ended | ||||
| September 30, 2014(a) | ||||
| ||||
NET ASSET VALUE, BEGINNING OF PERIOD | $ | 10.00 | ||
INCOME/(LOSS) FROM OPERATIONS: | ||||
Net investment income(b) | 0.02 | |||
Net realized and unrealized loss on investments | (0.42) | |||
|
| |||
Total from Investment Operations | (0.40) | |||
|
| |||
REDEMPTION FEES ADDED TO PAID IN CAPITAL | 0.00(c) | |||
|
| |||
NET DECREASE IN NET ASSET VALUE | (0.40) | |||
|
| |||
NET ASSET VALUE, END OF PERIOD | $ | 9.60 | ||
|
| |||
TOTAL RETURN(d) | (4.00)% | |||
SUPPLEMENTAL DATA: | ||||
Net assets, End of Period (in 000s) | $ | 1,982 | ||
RATIOS TO AVERAGE NET ASSETS: | ||||
Operating expenses excluding fee waivers/reimbursements(e) | 11.32%(f) | |||
Operating expenses including fee waivers/reimbursements(e) | 1.40%(f) | |||
Net investment income including fee waivers/reimbursements(e) | 0.26%(f) | |||
PORTFOLIO TURNOVER RATE | 159%(g) | |||
| (a) | Commenced operations on December 31, 2013. |
| (b) | Per share amounts are based upon average shares outstanding. |
| (c) | Less than $0.005 per share. |
| (d) | Total return is for the period indicated and has not been annualized. The total return would have been lower had certain expenses not been waived / reimbursed during the period. The return shown does not reflect the deduction of taxes that a shareholder would pay on Fund distributions or the redemption of Fund shares. |
| (e) | The ratios exclude the impact of expenses of the underlying funds in which the Fund invests as represented in the Portfolio of Investments. |
| (f) | Annualized. |
| (g) | Portfolio turnover rate for periods less than one full year have not been annualized. |
| See Notes to Financial Statements. | ||
34 |
www.crystalstrategyfunds.com |
Table of Contents
| Crystal Strategy Absolute Return Fund – Class I | Financial Highlights | |
For a share outstanding throughout the period presented
|
| For the Period | ||||
| Ended | ||||
| September 30, 2014(a) | ||||
| ||||
NET ASSET VALUE, BEGINNING OF PERIOD | $ | 10.00 | ||
INCOME/(LOSS) FROM OPERATIONS: | ||||
Net investment income(b) | 0.04 | |||
Net realized and unrealized loss on investments | (0.42) | |||
|
| |||
Total from Investment Operations | (0.38) | |||
|
| |||
REDEMPTION FEES ADDED TO PAID IN CAPITAL | 0.01 | |||
|
| |||
NET DECREASE IN NET ASSET VALUE | (0.37) | |||
|
| |||
NET ASSET VALUE, END OF PERIOD | $ | 9.63 | ||
|
| |||
TOTAL RETURN(c) | (3.70)% | |||
SUPPLEMENTAL DATA: | ||||
Net assets, End of Period (in 000s) | $ | 2,933 | ||
RATIOS TO AVERAGE NET ASSETS: | ||||
Operating expenses excluding fee waivers/reimbursements(d) | 14.36%(e) | |||
Operating expenses including fee waivers/reimbursements(d) | 1.15%(e) | |||
Net investment income including fee waivers/reimbursements(d) | 0.45%(e) | |||
PORTFOLIO TURNOVER RATE | 159%(f) | |||
| (a) | Commenced operations on December 31, 2013. |
| (b) | Per share amounts are based upon average shares outstanding. |
| (c) | Total return is for the period indicated and has not been annualized. The total return would have been lower had certain expenses not been waived / reimbursed during the period. The return shown does not reflect the deduction of taxes that a shareholder would pay on Fund distributions or the redemption of Fund shares. |
| (d) | The ratios exclude the impact of expenses of the underlying funds in which the Fund invests as represented in the Portfolio of Investments. |
| (e) | Annualized. |
| (f) | Portfolio turnover rate for periods less than one full year have not been annualized. |
| See Notes to Financial Statements. | ||
Annual Report | September 30, 2014 |
35 |
Table of Contents
| Crystal Strategy Absolute Return Fund – Class R | Financial Highlights | |
For a share outstanding throughout the period presented
|
| For the Period | ||||
| Ended | ||||
| September 30, 2014(a) | ||||
| ||||
NET ASSET VALUE, BEGINNING OF PERIOD | $ | 10.00 | ||
INCOME/(LOSS) FROM OPERATIONS: | ||||
Net investment loss(b) | (0.02) | |||
Net realized and unrealized loss on investments | (0.40) | |||
|
| |||
Total from Investment Operations | (0.42) | |||
|
| |||
NET DECREASE IN NET ASSET VALUE | (0.42) | |||
|
| |||
NET ASSET VALUE, END OF PERIOD | $ | 9.58 | ||
|
| |||
TOTAL RETURN(c) | (4.20)% | |||
SUPPLEMENTAL DATA: | ||||
Net assets, End of Period (in 000s) | $ | 5 | ||
RATIOS TO AVERAGE NET ASSETS: | ||||
Operating expenses excluding fee waivers/reimbursements(d) | 24.38%(e) | |||
Operating expenses including fee waivers/reimbursements(d) | 1.65%(e) | |||
Net investment loss including fee waivers/reimbursements(d) | (0.33)%(e) | |||
PORTFOLIO TURNOVER RATE | 159%(f) | |||
| (a) | Commenced operations on December 31, 2013. |
| (b) | Per share amounts are based upon average shares outstanding. |
| (c) | Total return is for the period indicated and has not been annualized. The total return would have been lower had certain expenses not been waived / reimbursed during the period. The return shown does not reflect the deduction of taxes that a shareholder would pay on Fund distributions or the redemption of Fund shares. |
| (d) | The ratios exclude the impact of expenses of the underlying funds in which the Fund invests as represented in the Portfolio of Investments. |
| (e) | Annualized. |
| (f) | Portfolio turnover rate for periods less than one full year have not been annualized. |
| See Notes to Financial Statements. | ||
36 |
www.crystalstrategyfunds.com |
Table of Contents
| Crystal Strategy Leveraged Alternative Fund – Class A | Financial Highlights | |
For a share outstanding throughout the period presented
|
| For the Period | ||||
| Ended | ||||
| September 30, 2014(a) | ||||
| ||||
NET ASSET VALUE, BEGINNING OF PERIOD | $ | 10.00 | ||
INCOME/(LOSS) FROM OPERATIONS: | ||||
Net investment income(b) | 0.03 | |||
Net realized and unrealized loss on investments | (0.51) | |||
|
| |||
Total from Investment Operations | (0.48) | |||
|
| |||
NET DECREASE IN NET ASSET VALUE | (0.48) | |||
|
| |||
NET ASSET VALUE, END OF PERIOD | $ | 9.52 | ||
|
| |||
TOTAL RETURN(c) | (4.80)% | |||
SUPPLEMENTAL DATA: | ||||
Net assets, End of Period (in 000s) | $ | 264 | ||
RATIOS TO AVERAGE NET ASSETS: | ||||
Operating expenses excluding fee waivers/reimbursements(d) | 9.24%(e) | |||
Operating expenses including fee waivers/reimbursements(d) | 1.50%(e) | |||
Net investment income including fee waivers/reimbursements(d) | 0.33%(e) | |||
PORTFOLIO TURNOVER RATE | 270%(f) | |||
| (a) | Commenced operations on December 31, 2013. |
| (b) | Per share amounts are based upon average shares outstanding. |
| (c) | Total return is for the period indicated and has not been annualized. The total return would have been lower had certain expenses not been waived / reimbursed during the period. The return shown does not reflect the deduction of taxes that a shareholder would pay on Fund distributions or the redemption of Fund shares. |
| (d) | The ratios exclude the impact of expenses of the underlying funds in which the Fund invests as represented in the Portfolio of Investments. |
| (e) | Annualized. |
| (f) | Portfolio turnover rate for periods less than one full year have not been annualized. |
| See Notes to Financial Statements. | ||
Annual Report | September 30, 2014 |
37 |
Table of Contents
| Crystal Strategy Leveraged Alternative Fund – Class I | Financial Highlights | |
For a share outstanding throughout the period presented
|
| For the Period | ||||
| Ended | ||||
| September 30, 2014(a) | ||||
| ||||
NET ASSET VALUE, BEGINNING OF PERIOD | $ | 10.00 | ||
INCOME/(LOSS) FROM OPERATIONS: | ||||
Net investment income(b) | 0.04 | |||
Net realized and unrealized loss on investments | (0.50) | |||
|
| |||
Total from Investment Operations | (0.46) | |||
|
| |||
NET DECREASE IN NET ASSET VALUE | (0.46) | |||
|
| |||
NET ASSET VALUE, END OF PERIOD | $ | 9.54 | ||
|
| |||
TOTAL RETURN(c) | (4.60)% | |||
SUPPLEMENTAL DATA: | ||||
Net assets, End of Period (in 000s) | $ | 4,856 | ||
RATIOS TO AVERAGE NET ASSETS: | ||||
Operating expenses excluding fee waivers/reimbursements(d) | 9.23%(e) | |||
Operating expenses including fee waivers/reimbursements(d) | 1.25%(e) | |||
Net investment income including fee waivers/reimbursements(d) | 0.43%(e) | |||
PORTFOLIO TURNOVER RATE | 270%(f) | |||
| (a) | Commenced operations on December 31, 2013. |
| (b) | Per share amounts are based upon average shares outstanding. |
| (c) | Total return is for the period indicated and has not been annualized. The total return would have been lower had certain expenses not been waived / reimbursed during the period. The return shown does not reflect the deduction of taxes that a shareholder would pay on Fund distributions or the redemption of Fund shares. |
| (d) | The ratios exclude the impact of expenses of the underlying funds in which the Fund invests as represented in the Portfolio of Investments. |
| (e) | Annualized. |
| (f) | Portfolio turnover rate for periods less than one full year have not been annualized. |
| See Notes to Financial Statements. | ||
38 |
www.crystalstrategyfunds.com |
Table of Contents
| Crystal Strategy Leveraged Alternative Fund – Class R | Financial Highlights | |
For a share outstanding throughout the period presented
|
| For the Period | ||||
| Ended | ||||
| September 30, 2014(a) | ||||
| ||||
NET ASSET VALUE, BEGINNING OF PERIOD | $ | 10.00 | ||
INCOME/(LOSS) FROM OPERATIONS: | ||||
Net investment loss(b) | (0.02) | |||
Net realized and unrealized loss on investments | (0.47) | |||
|
| |||
Total from Investment Operations | (0.49) | |||
|
| |||
NET DECREASE IN NET ASSET VALUE | (0.49) | |||
|
| |||
NET ASSET VALUE, END OF PERIOD | $ | 9.51 | ||
|
| |||
TOTAL RETURN(c) | (4.90)% | |||
SUPPLEMENTAL DATA: | ||||
Net assets, End of Period (in 000s) | $ | 5 | ||
RATIOS TO AVERAGE NET ASSETS: | ||||
Operating expenses excluding fee waivers/reimbursements(d) | 15.08%(e) | |||
Operating expenses including fee waivers/reimbursements(d) | 1.75%(e) | |||
Net investment loss including fee waivers/reimbursements(d) | (0.22)%(e) | |||
PORTFOLIO TURNOVER RATE | 270%(f) | |||
| (a) | Commenced operations on December 31, 2013. |
| (b) | Per share amounts are based upon average shares outstanding. |
| (c) | Total return is for the period indicated and has not been annualized. The total return would have been lower had certain expenses not been waived / reimbursed during the period. The return shown does not reflect the deduction of taxes that a shareholder would pay on Fund distributions or the redemption of Fund shares. |
| (d) | The ratios exclude the impact of expenses of the underlying funds in which the Fund invests as represented in the Portfolio of Investments. |
| (e) | Annualized. |
| (f) | Portfolio turnover rate for periods less than one full year have not been annualized. |
| See Notes to Financial Statements. | ||
Annual Report | September 30, 2014 |
39 |
Table of Contents
| Crystal Strategy Family of Funds | Notes to Financial Statements | |
September 30, 2014
|
1. ORGANIZATION
ALPS Series Trust (the “Trust”), a Delaware statutory trust, is an open-end management investment company registered under the Investment Company Act of 1940 (the “1940 Act”). As of September 30, 2014, the Trust had nine registered funds. This annual report describes the Crystal Strategy Absolute Income Fund, the Crystal Strategy Absolute Return Fund and the Crystal Strategy Leveraged Alternative Fund (individually a “Fund” and collectively, the “Funds”). The Crystal Strategy Absolute Income Fund seeks to provide current income and downside protection to conventional equity markets, with absolute (positive) returns over full market cycles as a secondary objective. The Crystal Strategy Absolute Return Fund seeks to provide absolute (positive) returns over full market cycles. The Crystal Strategy Leveraged Alternative Fund seeks to provide long-term absolute (positive) returns with reduced correlation to conventional equity markets as a secondary objective. The Funds currently offer Class A shares, Class I shares and Class R shares. All classes of shares have identical rights to earnings, assets and voting privileges, except for class specific expenses and exclusive rights to vote on matters affecting only individual classes. The Trust has an unlimited number of shares with no par value per share. The Board of Trustees (the “Board”) may establish additional funds and classes of shares at any time in the future without shareholder approval.
2. SIGNIFICANT ACCOUNTING POLICIES
The accompanying financial statements were prepared in accordance with accounting principles generally accepted in the United States of America for investment companies (“U.S. GAAP”). Each Fund is considered an investment company for financial reporting purposes. The preparation of financial statements in conformity with U.S. GAAP requires management to make certain estimates and assumptions that affect the reported amounts of assets and liabilities and disclosures of contingent assets and liabilities at the date of the financial statements and the reported amounts of revenue and expenses during the period. Actual results could differ from those estimates. The following is a summary of significant accounting policies consistently followed by the Funds in preparation of their financial statements.
Investment Valuation: The Funds generally value their securities based on market prices determined at the close of regular trading on the New York Stock Exchange (“NYSE”), normally 4:00 p.m. Eastern Time, on each day the NYSE is open for trading.
For equity securities and mutual funds that are traded on an exchange, the market price is usually the closing sale or official closing price on that exchange. In the case of equity securities not traded on an exchange, or if such closing prices are not otherwise available, the securities are valued at the mean of the most recent bid and ask prices on such day.
Redeemable securities issued by open-end registered investment companies are valued at the investment company’s applicable net asset value, with the exception of exchange-traded open-end investment companies, which are priced as equity securities.
The market price for debt obligations is generally the price supplied by an independent third-party pricing service approved by the Board, which may use a matrix, formula or other objective method that takes into consideration quotations from dealers, market transactions in comparable investments, market indices and yield curves. If vendors are unable to supply a price, or if the
40 |
www.crystalstrategyfunds.com |
Table of Contents
| Crystal Strategy Family of Funds | Notes to Financial Statements | |
September 30, 2014
|
price supplied is deemed to be unreliable, the market price may be determined using quotations received from one or more broker dealers that make a market in the security. Short term debt obligations that will mature in 60 days or less are valued at amortized cost, unless it is determined that using this method would not reflect an investment’s fair value. Investments in non-exchange traded funds are fair valued at their respective net asset values.
When such prices or quotations are not available, or when the fair value committee appointed by the Board believes that they are unreliable, securities may be priced using fair value procedures approved by the Board.
Fair Value Measurements: The Funds disclose the classification of their fair value measurements following a three-tier hierarchy based on the inputs used to measure fair value. Inputs refer broadly to the assumptions that market participants would use in pricing the asset or liability, including assumptions about risk. Inputs may be observable or unobservable. Observable inputs reflect the assumptions market participants would use in pricing the asset or liability that are developed based on market data obtained from sources independent of the reporting entity. Unobservable inputs reflect the reporting entity’s own assumptions about the assumptions market participants would use in pricing the asset or liability that are developed based on the best information available.
Various inputs are used in determining the value of the Funds’ investments as of the end of the reporting period. When inputs used fall into different levels of the fair value hierarchy, the level in the hierarchy within which the fair value measurement falls is determined based on the lowest level input that is significant to the fair value measurement in its entirety. The designated input levels are not necessarily an indication of the risk or liquidity associated with these investments. These inputs are categorized in the following hierarchy under applicable financial accounting standards:
Level 1 – | Unadjusted quoted prices in active markets for identical investments, unrestricted assets or liabilities that the Funds have the ability to access at the measurement date; | |
Level 2 – | Quoted prices which are not active, quoted prices for similar assets or liabilities in active markets or inputs other than quoted prices that are observable (either directly or indirectly) for substantially the full term of the asset or liability; and | |
Level 3 – | Significant unobservable prices or inputs (including the Funds’ own assumptions in determining the fair value of investments) where there is little or no market activity for the asset or liability at the measurement date. | |
Annual Report | September 30, 2014 |
41 |
Table of Contents
| Crystal Strategy Family of Funds | Notes to Financial Statements | |
September 30, 2014
|
The following is a summary of the inputs used to value the Funds’ investments as of September 30, 2014:
Crystal Strategy Absolute Income Fund
| Level 2 - Other | Level 3 - | |||||||||||||||
| Level 1 - | Significant | Significant | ||||||||||||||
| Unadjusted | Observable | Unobservable | ||||||||||||||
| Investments in Securities at Value | Quoted Prices | Inputs | Inputs | Total | ||||||||||||
| ||||||||||||||||
Closed-End Mutual Funds | $ | 348,527 | $ | – | $ | – | $ | 348,527 | ||||||||
Common Stocks | ||||||||||||||||
Communications | 75,898 | – | – | 75,898 | ||||||||||||
Energy | 85,224 | – | – | 85,224 | ||||||||||||
Financials | 662,609 | – | – | 662,609 | ||||||||||||
Exchange-Traded Funds | 1,788,154 | – | – | 1,788,154 | ||||||||||||
Exchange-Traded Notes | 60,776 | – | – | 60,776 | ||||||||||||
Master Limited Partnerships | 179,972 | – | – | 179,972 | ||||||||||||
Open-End Mutual Funds | 911,820 | – | – | 911,820 | ||||||||||||
Short Term Investments | 443,183 | – | – | 443,183 | ||||||||||||
| ||||||||||||||||
TOTAL | $ | 4,556,163 | $ | – | $ | – | $ | 4,556,163 | ||||||||
| ||||||||||||||||
Crystal Strategy Absolute Return Fund
| Level 2 - Other | Level 3 - | |||||||||||||||
| Level 1 - | Significant | Significant | ||||||||||||||
| Unadjusted | Observable | Unobservable | ||||||||||||||
| Investments in Securities at Value | Quoted Prices | Inputs | Inputs | Total | ||||||||||||
| ||||||||||||||||
Closed-End Mutual Funds | $ | 284,182 | $ | – | $ | – | $ | 284,182 | ||||||||
Common Stocks | ||||||||||||||||
Communications | 47,455 | – | – | 47,455 | ||||||||||||
Consumer Non-cyclical | 60,087 | – | – | 60,087 | ||||||||||||
Energy | 39,790 | – | – | 39,790 | ||||||||||||
Financials | 329,640 | – | – | 329,640 | ||||||||||||
Industrials | 141,747 | – | – | 141,747 | ||||||||||||
Technology | 113,814 | – | – | 113,814 | ||||||||||||
Exchange-Traded Funds | 2,449,047 | – | – | 2,449,047 | ||||||||||||
Master Limited Partnerships | 193,620 | – | – | 193,620 | ||||||||||||
Open-End Mutual Funds | 540,376 | – | – | 540,376 | ||||||||||||
Short Term Investments | 607,550 | – | – | 607,550 | ||||||||||||
| ||||||||||||||||
TOTAL | $ | 4,807,308 | $ | – | $ | – | $ | 4,807,308 | ||||||||
| ||||||||||||||||
42 |
www.crystalstrategyfunds.com |
Table of Contents
| Crystal Strategy Family of Funds | Notes to Financial Statements | |
September 30, 2014
|
Crystal Strategy Leveraged Alternative Fund
| Level 2 - Other | Level 3 - | |||||||||||||||
| Level 1 - | Significant | Significant | ||||||||||||||
| Unadjusted | Observable | Unobservable | ||||||||||||||
| Investments in Securities at Value | Quoted Prices | Inputs | Inputs | Total | ||||||||||||
| ||||||||||||||||
Closed-End Mutual Funds | $ | 342,311 | $ | – | $ | – | $ | 342,311 | ||||||||
Common Stocks | ||||||||||||||||
Communications | 51,497 | – | – | 51,497 | ||||||||||||
Consumer Non-cyclical | 70,443 | – | – | 70,443 | ||||||||||||
Energy | 44,382 | – | – | 44,382 | ||||||||||||
Financials | 341,605 | – | – | 341,605 | ||||||||||||
Industrials | 152,829 | – | – | 152,829 | ||||||||||||
Technology | 128,185 | – | – | 128,185 | ||||||||||||
Exchange-Traded Funds | 2,739,770 | – | – | 2,739,770 | ||||||||||||
Master Limited Partnerships | 263,993 | – | – | 263,993 | ||||||||||||
Open-End Mutual Funds | 669,728 | – | – | 669,728 | ||||||||||||
Short Term Investments | 333,670 | – | – | 333,670 | ||||||||||||
| ||||||||||||||||
TOTAL | $ | 5,138,413 | $ | – | $ | – | $ | 5,138,413 | ||||||||
| ||||||||||||||||
The Funds recognize transfers between levels as of the end of the fiscal year. For the period ended September 30, 2014, the Funds did not have any transfers between Level 1 and Level 2 securities. There were no Level 3 securities held during the period.
Offering Costs: The Funds incurred offering costs during the period ended September 30, 2014. These offering costs, including fees for printing initial prospectuses, legal and registration fees, are being amortized over the first twelve months from the inception date of the Funds. Amounts amortized through September 30, 2014 are shown on each Fund’s Statement of Operations and amounts that remain to be amortized are shown on each Fund’s Statement of Assets and Liabilities.
Trust Expenses: Some expenses of the Trust can be directly attributed to the Funds. Expenses which cannot be directly attributed to the Funds are apportioned among all funds in the Trust based on average net assets of each fund.
Fund Expenses: Some expenses can be directly attributed to each Fund and are apportioned among the classes based on average net assets of each class. Additionally, some expenses are attributed to the fund family and are apportioned among the Funds based on average net assets of each Fund.
Class Expenses: Expenses that are specific to a class of shares are charged directly to that share class. Fees provided under the distribution (Rule 12b-1) and/or shareholder service plans for a particular class of the Funds are charged to the operations of such class.
Federal Income Taxes: The Funds comply with the requirements under Subchapter M of the Internal Revenue Code of 1986 applicable to regulated investment companies and intend to distribute substantially all net taxable income and net capital gains, if any, each year so that they
Annual Report | September 30, 2014 |
43 |
Table of Contents
| Crystal Strategy Family of Funds | Notes to Financial Statements | |
September 30, 2014
|
will not be subject to excise tax on undistributed income and gains. The Funds are not subject to income taxes to the extent such distributions are made.
As of and during the period ended September 30, 2014, the Funds did not have a liability for any unrecognized tax benefits in the accompanying financial statements. The Funds file U.S. federal, state and local income tax returns as required. The Funds’ tax returns are subject to examination by the relevant tax authorities until expiration of the applicable statute of limitations, which is generally three years after the filing of the tax return for federal purposes and four years for most state returns. The Funds’ Administrator has analyzed the Funds’ tax positions taken on federal and state income tax returns for all open tax years and has concluded that as of September 30, 2014, no provision for income tax is required in the Funds’ financial statements related to these tax positions.
Investment Transactions and Investment Income: Investment transactions are accounted for on the date the investments are purchased or sold (trade date basis). Realized gains and losses from investment transactions are reported on an identified cost basis. Interest income, which includes accretion of discounts and amortization of premiums, is accrued and recorded as earned. Dividend income is recognized on the ex-dividend date, or for certain foreign securities, as soon as information is available to the Funds. All of the realized and unrealized gains and losses and net investment income are allocated daily to each class in proportion to its average daily net assets.
Foreign Securities: The Funds may directly purchase securities of foreign issuers. Investing in securities of foreign issuers involves special risks not typically associated with investing in securities of U.S. issuers. The risks include possible reevaluation of currencies, the inability to repatriate foreign currency, less complete financial information about companies and possible future adverse political and economic developments. Moreover, securities of many foreign issuers and their markets may be less liquid and their prices more volatile than those of securities of comparable U.S. issuers.
Foreign Currency Translation: The books and records of the Funds are maintained in U.S. dollars. Investment valuations and other assets and liabilities initially expressed in foreign currencies are converted each business day into U.S. dollars based upon current exchange rates. The portion of realized and unrealized gains or losses on investments due to fluctuations in foreign currency exchange rates is not separately disclosed and is included in realized and unrealized gains or losses on investments, when applicable.
Foreign Exchange Transactions: The Funds may enter into foreign currency spot contracts to facilitate transactions in foreign securities or to convert foreign currency receipts into U.S. dollars. A foreign currency spot contract is an agreement between two parties to buy and sell currencies at the current market rate, for settlement generally within two business days. The U.S. dollar value of the contracts is determined using current currency exchange rates supplied by a pricing service. The contract is marked-to-market daily for settlements beyond one day and any change in market value is recorded as an unrealized gain or loss. When the contract is closed, the Fund records a realized gain or loss equal to the difference between the value on the open and close date. Losses may arise from changes in the value of the foreign currency, or if the counterparties do not perform under the contract’s terms. The maximum potential loss from such contracts is the aggregate face value in U.S. dollars at the time the contract was opened.
44 |
www.crystalstrategyfunds.com |
Table of Contents
| Crystal Strategy Family of Funds | Notes to Financial Statements | |
September 30, 2014
|
Distributions to Shareholders: The Crystal Strategy Absolute Income Fund pays dividends on a quarterly basis, and the Crystal Strategy Absolute Return Fund and the Crystal Strategy Leveraged Fund pays dividends on an annual basis. All Funds distribute capital gains, if any, on an annual basis.
Income dividend distributions are derived from interest and other income a Fund receives from its investments and include distributions of short-term capital gains. Capital gain distributions are derived from gains realized when the Fund sells a security it has owned for more than one year.
The Funds may make additional distributions and dividends at other times if its portfolio manager or managers believe doing so may be necessary for the Funds to avoid or reduce taxes. Net investment income/(loss) and net realized gain/(loss) may differ for financial statement and tax purposes.
3. DERIVATIVE INSTRUMENTS
The Funds’ investment objectives permit the Funds to enter into various types of derivatives contracts, including, but not limited to, futures contracts, forward foreign currency contracts, currency swaps and purchased and written options. In doing so, the Funds may employ strategies in differing combinations to permit them to increase, decrease, or change the level or types of exposure to market factors. Central to those strategies are features inherent in derivatives that make them more attractive for this purpose than equity or debt securities; they require little or no initial cash investment, they can focus exposure on only certain selected risk factors, and they may not require the ultimate receipt or delivery of the underlying security (or securities) to the contract. This may allow the Funds to pursue their objectives more quickly and efficiently than if they were to make direct purchases or sales of securities capable of affecting a similar response to market factors. The Funds did not invest in any derivative instruments during the fiscal period ended September 30, 2014.
Risk of Investing in Derivatives: The Funds’ use of derivatives can result in losses due to unanticipated changes in the market risk factors and the overall market. In instances where the Funds are using derivatives to decrease, or hedge, exposures to market risk factors for securities held by the Funds, there are also risks that those derivatives may not perform as expected resulting in losses for the combined or hedged positions.
Derivatives may have little or no initial cash investment relative to their market value exposure and therefore can produce significant gains or losses in excess of their cost. This use of embedded leverage allows the Funds to increase their market value exposure relative to their net assets and can substantially increase the volatility of the Funds’ performance.
Additional associated risks from investing in derivatives also exist and potentially could have significant effects on the valuation of the derivative and the Funds. Typically, the associated risks are not the risks that the Funds are attempting to increase or decrease exposure to, per their investment objectives, but are the additional risks from investing in derivatives.
Examples of these associated risks are liquidity risk, which is the risk that the Funds will not be able to sell or close out the derivative in a timely manner, and counterparty credit risk, which is the risk
Annual Report | September 30, 2014 |
45 |
Table of Contents
| Crystal Strategy Family of Funds | Notes to Financial Statements | |
September 30, 2014
|
that the counterparty will not fulfill its obligation to the Funds. In addition, use of derivatives may increase or decrease exposure to the following risk factors:
Equity Risk: Equity risk relates to the change in value of equity securities as they relate to increases or decreases in the general market. Associated risks can be different for each type of derivative.
Commodity Risk: Exposure to the commodities markets may subject the Funds to greater volatility than investments in traditional securities. Prices of various commodities may also be affected by factors, such as drought, floods, weather, livestock disease, embargoes, tariffs and other regulatory developments, which are unpredictable. The prices of commodities can also fluctuate widely due to supply and demand disruptions in major producing or consuming regions.
Foreign Currency Risk: Currency trading involves significant risks, including market risk, interest rate risk, country risk, counterparty credit risk and short sale risk. Market risk results from the price movement of foreign currency values in response to shifting market supply and demand.
Interest Rate Risk: Interest rate risk is the risk that fixed income securities will decline in value because of changes in interest rates. As nominal interest rates rise, the value of fixed income securities held by the Funds are likely to decrease. Securities with longer durations tend to be more sensitive to changes in interest rates, and are usually more volatile than equity securities.
4. TAX BASIS INFORMATION
Tax Basis of Distributions to Shareholders: The character of distributions made during the period from net investment income or net realized gains may differ from its ultimate characterization for federal income tax purposes. Also, due to the timing of dividend distributions, the fiscal year in which amounts are distributed may differ from the fiscal year in which the income or realized gain were recorded by the Funds.
The tax character of distributions paid by the Funds for the fiscal period ended September 30, 2014 were as follows:
| Distributions Paid From: | Crystal Strategy 2014 | Crystal Strategy 2014 | Crystal Strategy Leveraged Alternative Fund 2014 | |||||||||
Ordinary Income | $ 28,341 | $ – | $ – | |||||||||
46 |
www.crystalstrategyfunds.com |
Table of Contents
| Crystal Strategy Family of Funds | Notes to Financial Statements | |
September 30, 2014
|
Reclassifications: As of September 30, 2014, permanent differences in book and tax accounting were reclassified. The following reclassifications, which had no impact on results of operations or net assets, were recorded to reflect tax character:
| Paid-in Capital | Accumulated Net Investment Income/(Loss) | Accumulated Net Realized Gain on Investments | ||||||||||
Crystal Strategy Absolute Income Fund | $ | (4,820) | $ | 2,627 | $ | 2,193 | ||||||
Crystal Strategy Absolute Return Fund | (6,121) | 2,698 | 3,423 | |||||||||
Crystal Strategy Leveraged Alternative Fund | (9,258) | (2,153) | 11,411 | |||||||||
These differences are primarily attibuted to the different tax treatment of partnership income and organizational costs.
Unrealized Appreciation and Depreciation on Investments: As of September 30, 2014, the aggregate cost of investments, gross unrealized appreciation/(depreciation) and net unrealized appreciation/(depreciation) for Federal tax purposes were as follows:
| Crystal Strategy Absolute Income Fund | Crystal Strategy Absolute Return Fund | Crystal Strategy Leveraged Alternative Fund | ||||||||||
| ||||||||||||
Gross unrealized appreciation (excess of value over tax cost) | $ | 38,371 | $ | 56,650 | $ | 15,065 | ||||||
Gross unrealized depreciation (excess of tax cost over value) | (74,043) | (101,499) | (144,248) | |||||||||
| ||||||||||||
Net unrealized depreciation | $ | (35,672) | $ | (44,849) | $ | (129,183) | ||||||
| ||||||||||||
Cost of investments for income tax purposes | $ | 4,591,835 | $ | 4,852,157 | $ | 5,267,596 | ||||||
| ||||||||||||
Components of Distributable Earnings on a Tax Basis: As of September 30, 2014, the components of distributable earnings on a tax basis were as follows:
| Crystal Strategy Absolute Income Fund | Crystal Strategy Absolute Return Fund | Crystal Strategy Leveraged Alternative Fund | ||||||||||||||||
Undistributed ordinary income | $ | 6,787 | $ | 8,280 | $ | 11,325 | ||||||||||||
Accumulated capital losses | (4,582) | (31,379) | (53,392) | |||||||||||||||
Net unrealized depreciation on investments and securities sold short | (35,672) | (44,849) | (129,183) | |||||||||||||||
| ||||||||||||||||||
Total | $ | (33,467) | $ | (67,948) | $ | (171,250) | ||||||||||||
| ||||||||||||||||||
Annual Report | September 30, 2014 |
47 |
Table of Contents
| Crystal Strategy Family of Funds | Notes to Financial Statements | |
September 30, 2014
|
The funds elect to defer to the period ending September 30, 2015, capital losses recognized during the period November 1, 2013 to September 30, 2014 in the amount of:
| Amount | ||||
Crystal Strategy Absolute Income Fund | $ | (4,582) | ||
Crystal Strategy Absolute Return Fund | (31,379) | |||
Crystal Strategy Leveraged Alternative Fund | (53,392) | |||
Capital Losses: As of September 30, 2014, the Funds had no accumulated capital loss carryforwards.
5. SECURITIES TRANSACTIONS
Purchases and sales of securities, excluding short-term securities, during the fiscal period ended September 30, 2014 were as follows:
| Purchases of Securities | Proceeds from Sales of Securities | |||||||
Crystal Strategy Absolute Income Fund | $ | 5,268,923 | $ | 1,110,609 | ||||
Crystal Strategy Absolute Return Fund | 7,151,408 | 2,870,321 | ||||||
Crystal Strategy Leveraged Alternative Fund | 15,648,272 | 10,646,219 | ||||||
6. BENEFICIAL SHARE TRANSACTIONS
The capitalization of the Trust consists of an unlimited number of shares of beneficial interest with no par value per share. Holders of the shares of the Funds have one vote for each share held and a proportionate fraction of a vote for each fractional share. All shares issued and outstanding are fully paid and are non-assessable, transferable and redeemable at the option of the shareholder. Shares have no pre-emptive rights.
Shares redeemed within 60 days of purchase may incur a 1.50% short-term redemption fee deducted from the redemption amount. For the period ended September 30, 2014, the redemption fees charged by the Funds are presented in the Statements of Changes in Net Assets.
48 |
www.crystalstrategyfunds.com |
Table of Contents
| Crystal Strategy Family of Funds | Notes to Financial Statements | |
September 30, 2014
|
| Transactions in common shares were as follows: | For the Period Ended | |||
| September 30, 2014(a) | ||||
| ||||
Crystal Strategy Absolute Income Fund: | ||||
Class A | ||||
| ||||
Shares sold | 111,098 | |||
Shares issued in reinvestment of distributions to shareholders | 349 | |||
Shares redeemed | (30) | |||
| ||||
Net increase from share transactions | 111,417 | |||
| ||||
| Class I | ||||
| ||||
Shares sold | 335,697 | |||
Shares issued in reinvestment of distributions to shareholders | 2,348 | |||
Shares redeemed | (2,949) | |||
| ||||
Net increase from share transactions | 335,096 | |||
| ||||
| Class R | ||||
| ||||
Shares sold | 520 | |||
Shares issued in reinvestment of distributions to shareholders | 7 | |||
Shares redeemed | (20) | |||
| ||||
Net increase from share transactions | 507 | |||
| ||||
Crystal Strategy Absolute Return Fund: | ||||
Class A | ||||
| ||||
Shares sold | 210,152 | |||
Shares redeemed | (3,564) | |||
| ||||
Net increase from share transactions | 206,588 | |||
| ||||
Class I | ||||
| ||||
Shares sold | 325,351 | |||
Shares redeemed | (20,688) | |||
| ||||
Net increase from share transactions | 304,663 | |||
| ||||
Class R | ||||
| ||||
Shares sold | 520 | |||
Shares redeemed | (20) | |||
| ||||
Net increase from share transactions | 500 | |||
| ||||
Annual Report | September 30, 2014 |
49 |
Table of Contents
| Crystal Strategy Family of Funds | Notes to Financial Statements | |
September 30, 2014
|
| Transactions in common shares were as follows: | For the Period Ended | |||
| September 30, 2014(a) | ||||
| ||||
Crystal Strategy Leveraged Alternative Fund: | ||||
Class A | ||||
| ||||
Shares sold | 27,738 | |||
Shares redeemed | (24) | |||
| ||||
Net increase from share transactions | 27,714 | |||
| ||||
Class I | ||||
| ||||
Shares sold | 517,564 | |||
Shares redeemed | (8,597) | |||
| ||||
Net increase from share transactions | 508,967 | |||
| ||||
Class R | ||||
| ||||
Shares sold | 520 | |||
Shares redeemed | (20) | |||
| ||||
Net increase from share transactions | 500 | |||
| ||||
| (a) | Commenced operations on December 31, 2013. |
Control is defined by the 1940 Act as the beneficial ownership, either directly or through one or more controlled companies, of more than 25% of the voting securities of a company. Approximately 52%, 34%, and 86% of the shares outstanding of the Crystal Strategy Absolute Income Fund, the Crystal Strategy Absolute Return Fund and the Crystal Strategy Leveraged Alternative Fund, respectively, are held within one omnibus account. Investment activities of these shareholders could have a material impact on the Funds.
7. MANAGEMENT AND RELATED PARTY TRANSACTIONS
Investment Advisory: Brinker Capital, Inc. (“Brinker Capital” or the “Adviser”), subject to the authority of the Board, is responsible for the overall management and administration of the Funds’ business affairs. The Adviser manages the investments of the Funds in accordance with the Funds’ investment objectives, policies and limitations and investment guidelines established jointly by the Adviser and the Board.
Pursuant to the Investment Advisory Agreement (the “Advisory Agreement”) with the Adviser, the Funds pay the Adviser an annual management fee of 0.80%, 0.85% and 0.95% based on the average daily net assets of the Crystal Strategy Absolute Income Fund, the Crystal Strategy Absolute Return Fund and the Crystal Strategy Leverage Alternative Fund, respectively. The management fees are paid on a monthly basis. The initial term of the Advisory Agreement is two years. The Board may extend the Advisory Agreement for additional one-year terms. The Board, shareholders of the Funds or the Adviser may terminate the Advisory Agreement upon 60 days’ notice.
Pursuant to a fee waiver letter agreement (the “Fee Waiver Agreement”), the Adviser has contractually agreed to limit the amount of each Fund’s Total Annual Fund Operating Expenses, exclusive of Distribution and Service (12b-1) fees, Acquired Fund Fees and Expenses, brokerage
50 |
www.crystalstrategyfunds.com |
Table of Contents
| Crystal Strategy Family of Funds | Notes to Financial Statements | |
September 30, 2014
|
expenses, interest expenses, taxes and extraordinary expenses, to 1.10%, 1.15% and 1.25% of the average daily net assets of the Crystal Strategy Absolute Income Fund, the Crystal Strategy Absolute Return Fund and the Crystal Strategy Leveraged Alternative Fund, respectively. The Fee Waiver Agreement is in effect through January 31, 2015. The Adviser will be permitted to recover, on a class-by-class basis, expenses it has borne through the Fee Waiver Agreement to the extent that a Fund’s expenses in later periods fall below the annual rates set forth in the Fee Waiver Agreement. The Funds will not be obligated to pay any such deferred fees and expenses more than three years after the end of the fiscal year in which the fees and expenses were deferred. The Adviser may not discontinue the Fee Waiver Agreement without the approval by the Trust’s Board.
For the fiscal period ended September 30, 2014, the fee waivers and/or reimbursements were as follows:
Fees Waived/Reimbursed by Adviser | ||||
| ||||
Crystal Strategy Absolute Income Fund | ||||
Class A | $ | (20,113) | ||
Class I | (122,906) | |||
Class R | (1,804) | |||
| ||||
TOTAL | $ | (144,823) | ||
| ||||
Crystal Strategy Absolute Return Fund | ||||
Class A | $ | (58,887) | ||
Class I | (116,207) | |||
Class R | (822) | |||
| ||||
TOTAL | $ | (175,916) | ||
| ||||
Crystal Strategy Leveraged Alternative Fund | ||||
Class A | $ | (6,120) | ||
Class I | (236,372) | |||
Class R | (479) | |||
| ||||
TOTAL | $ | (242,971) | ||
| ||||
As of September 30, 2014, the balances of recoupable expenses were as follows: | ||||
| Crystal Strategy Absolute Income Fund | Expires 2017 | |||
| ||||
Class A | $ | (20,113) | ||
Class I | (122,906) | |||
Class R | (1,804) | |||
| Crystal Strategy Absolute Return Fund | Expires 2017 | |||
| ||||
Class A | $ | (58,887) | ||
Class I | (116,207) | |||
Class R | (822) | |||
Annual Report | September 30, 2014 |
51 |
Table of Contents
| Crystal Strategy Family of Funds | Notes to Financial Statements | |
September 30, 2014
|
| Crystal Strategy Leveraged Alternative Fund | Expires 2017 | |||
Class A | $ | (6,120) | ||
Class I | (236,372) | |||
Class R | (479) | |||
Administrator: ALPS Fund Services, Inc. (“ALPS”) serves as administrator to the Funds. The Funds have agreed to pay expenses incurred in connection with their administrative activities. Pursuant to the Administration, Bookkeeping and Pricing Services Agreement with the Trust, ALPS will provide operational services to the Funds including, but not limited to, fund accounting and fund administration and generally assist in the Funds’ operations.
The administration fees for the Fund Family are accrued on a daily basis and paid on a monthly basis following the end of the month, based on the greater of (a) an annual total fee of $235,000 in year 1 of operations and $260,000 in year 2; or (b) the following basis point fee schedule:
| Average Total Net Assets | Contractual Fee | |
Between $0-$500M | 0.055% | |
| ||
$500M-$1B | 0.03% | |
| ||
Above $1B | 0.02% | |
Annually thereafter, the parties agree to reevaluate the compensation paid under the agreement by the Trust on behalf of the Funds to ALPS for the services it performs for the Funds. ALPS is reimbursed by the Funds for certain out-of-pocket expenses. ALPS has agreed to reimburse the Fund for expenses relating to insurance and certain routine legal services for the fiscal period ended September 30, 2014.
Transfer Agent: ALPS serves as transfer agent for the Funds under a Transfer Agency and Services Agreement with the Trust. Under this agreement, ALPS is paid an annual base fee of $25,000 for Services performed on behalf of the funds plus fees for open accounts and is reimbursed for certain out-of-pocket expenses.
Compliance Services: ALPS provides services as the Funds’ Chief Compliance Officer to monitor and test the policies and procedures of the Funds in conjunction with the requirements under Rule 38a-1 of the 1940 Act pursuant to a Chief Compliance Officer Services Agreement with the Trust. Under this agreement, ALPS is paid an annual base fee of $30,000 for services performed on behalf of the Funds and is reimbursed for certain out-of-pockets expenses.
Distributor: ALPS Distributors, Inc. ( the “Distributor”) acts as the principal underwriter of the Funds’ shares pursuant to a Distribution Agreement with the Trust. Shares of the Funds are offered on a continuous basis through the Distributor, as agent of the Funds. The Distributor is not obligated to sell any particular amount of shares and is not entitled to any compensation for its services as the Funds’ principal underwriter.
Each Fund has adopted a Distribution and Services Plan (the “Plans”) pursuant to Rule 12b-1 of the 1940 Act for its Class A shares and Class R shares. The Plans allow the Funds to use Class A and Class R assets to pay fees in connection with the distribution and marketing of Class A shares and Class R shares and/or the provision of shareholder services to Class A and Class R shareholders. The Plans
52 |
www.crystalstrategyfunds.com |
Table of Contents
| Crystal Strategy Family of Funds | Notes to Financial Statements | |
September 30, 2014
|
permit payment for services in connection with the administration of plans or programs that use Class A and Class R shares of a Funds, if any, as their funding medium and for related expenses. The Plans permit the Funds to make total payments at an annual rate of up to 0.25% of the Funds’ average daily net assets attributable to its Class A shares and 0.50% of the Funds’ average daily net assets attributable to its Class R shares. Because these fees are paid out of a Funds’ Class A and Class R assets, if any, on an ongoing basis, over time they will increase the cost of an investment in Class A and Class R shares, if any, and Plan fees may cost an investor more than other types of sales charges. Plan fees are shown as distribution and service fees on the Statement of Operations.
8. TRUSTEES
As of September 30, 2014, there were four Trustees, three of whom are not “interested persons” (as defined in the 1940 Act) of the Trust (the “Independent Trustees”). Prior to October 1, 2014, the Independent Trustees received a quarterly retainer of $2,000, plus $1,000 for each regular Board or Committee meeting attended, $1,000 for each special telephonic Board or Committee meeting attended and $1,000 for each special in-person Board meeting attended. Effective October 1, 2014, the Independent Trustees receive a quarterly retainer of $4,000, plus $2,000 for each regular Board or Committee meeting attended, $2,000 for each special telephonic Board or Commission meeting attended and $2,000 for each special in-person Board meeting attended. The Independent Trustees are also reimbursed for all reasonable out-of-pocket expenses relating to attendance at meetings and for meeting-related expenses. Officers of the Trust and Trustees who are interested persons of the Trust receive no salary or fees from the Trust.
9. INDEMNIFICATIONS
Under the Trust’s organizational documents, its officers and Trustees are indemnified against certain liabilities arising out of the performance of their duties to the Trust. Additionally, in the normal course of business, the Trust enters into contracts with service providers that may contain general indemnification clauses which may permit indemnification to the extent permissible under applicable law. The Trust’s maximum exposure under these arrangements is unknown, as this would involve future claims that may be made against the Trust that have not yet occurred.
10. CHANGES IN ACCOUNTANTS
On June 30, 2014, KPMG LLP acquired certain assets of ROTHSTEIN-KASS, P.A. (d/b/a Rothstein Kass & Company, P.C.) and certain of its affiliates (“Rothstein Kass”), the independent public accounting firm for the Funds. As a result of this transaction, on June 30, 2014, Rothstein Kass resigned as the independent registered public accounting firm for the Funds. As the Funds commenced operations on December 31, 2013 and the Funds’ fiscal year end is September 30th, there are no financial statements for the Funds for the fiscal year ended September 30, 2013.
The Board of Trustees of the Trust approved the selection of KPMG LLP to serve as the Funds’ independent registered public accounting firm for the Funds’ fiscal year ending September 30, 2014 at an in-person meeting held on August 22, 2014.
Annual Report | September 30, 2014 |
53 |
Table of Contents
| Crystal Strategy Family of Funds | Report of Independent Registered Public Accounting Firm | |
The Board of Trustees and Shareholders
ALPS Series Trust:
We have audited the accompanying statements of assets and liabilities of Crystal Strategy Absolute Income Fund, Crystal Strategy Absolute Return Fund and Crystal Strategy Leveraged Alternative Fund, including the portfolios of investments, as of September 30, 2014, and the related statements of operations, the statements of changes in net assets, and the financial highlights for the period from December 31, 2013 (commencement of operations) to September 30, 2014. These financial statements and financial highlights are the responsibility of the Funds’ management. Our responsibility is to express an opinion on these financial statements and financial highlights based on our audits.
We conducted our audits in accordance with the standards of the Public Company Accounting Oversight Board (United States). Those standards require that we plan and perform the audits to obtain reasonable assurance about whether the financial statements and financial highlights are free of material misstatement. An audit includes examining, on a test basis, evidence supporting the amounts and disclosures in the financial statements. Our procedures included confirmation of securities owned as of September 30, 2014, by correspondence with custodians and brokers, or by other appropriate auditing procedures where replies from brokers were not received. An audit also includes assessing the accounting principles used and significant estimates made by management, as well as evaluating the overall financial statement presentation. We believe that our audits provide a reasonable basis for our opinion.
In our opinion, the financial statements and financial highlights referred to above present fairly, in all material respects, the financial position of Crystal Strategy Absolute Income Fund, Crystal Strategy Absolute Return Fund and Crystal Strategy Leveraged Alternative Fund, as of September 30, 2014, the results of their operations, the changes in their net assets, and the financial highlights for the period from December 31, 2013 (commencement of operations) to September 30, 2014, in conformity with U.S. generally accepted accounting principles.
KPMG LLP
Denver, Colorado
November 24, 2014
54 |
www.crystalstrategyfunds.com |
Table of Contents
| Crystal Strategy Family of Funds | Additional Information | |
September 30, 2014 (Unaudited)
|
1. PROXY VOTING POLICIES AND VOTING RECORD
A description of the policies and procedures that the Funds use to determine how to vote proxies relating to portfolio securities is available without charge, upon request, (i) by calling the Funds (toll-free) at 1-855-572-1722 or (ii) on the Securities and Exchange Commission’s website at http://www.sec.gov.
Information regarding how the Funds voted proxies relating to portfolio securities during the most recent 12-month period ended June 30 is available (i) without charge, upon request, by calling the Funds (toll-free) at 1-855-572-1722 or (ii) on the SEC’s website at http://www.sec.gov.
2. PORTFOLIO HOLDINGS
The Funds file their complete schedule of portfolio holdings with the SEC for the first and third quarters of each fiscal year on Form N-Q. The Funds’ Forms N-Q are available on the SEC website at http://www.sec.gov. The Funds’ Forms N-Q may be reviewed and copied at the SEC’s Public Reference Room in Washington, D.C., and information on the operation of the Public Reference Room may be obtained by calling 1-800-SEC-0330.
Annual Report | September 30, 2014 |
55 |
Table of Contents
| Crystal Strategy Family of Funds | Trustees and Officers | |
September 30, 2014 (Unaudited)
|
INDEPENDENT TRUSTEES
| Number of | ||||||||||
| Funds in | ||||||||||
| Fund | Other | |||||||||
| Term of | Complex | Directorships | ||||||||
| Name, | Position(s) | Office and | Overseen | Held by Trustee | ||||||
| Birth Year & | Held with | Length of Time | Principal Occupation(s) During | by | During Past | |||||
| Address* | Fund | Served | Past 5 Years** | Trustee*** | 5 Years** | |||||
| Cheryl Burgermeister Birth year: 1951 | Trustee | Ms. Burgermeister was elected to the Board on October 30, 2012; indefinite term. | Ms. Burgermeister is Trustee and Audit Committee Chair of The Select Sector SPDR Trust (October 1998 to present), Trustee of Russell Investment Funds (September 2012 to present) and Trustee, Treasurer and Finance Committee Chair of the Portland Community College Foundation (January 2001 to present). She also served as Trustee and Audit Committee Chair of E*Trade Funds (March 2004 to March 2010), Trustee of Zero Gravity Internet Fund (May 2000 to December 2001), Director and Treasurer of Crabbe Huson Family of Funds (1998 to 1999) and Director, Chief Financial Officer and Treasurer of The Crabbe Huson Group, Inc. (July 1987 to October 1999). From 1982 to 1986, Ms. Burgermeister was Supervising Senior Accountant at KPMG Peat Marwick. Ms. Burgermeister a licensed Certified Public Accountant and a member of the Oregon Society of Certified Public Accountants. | 9 | Ms. Burgermeister is a Trustee and Audit Committee Chair of The Select Sector SPDR Trust (9 ETFs) and Trustee of Russell Investment Funds (42 funds). |
| * | All communications to Trustees and Officers may be directed to ALPS Series Trust c/o 1290 Broadway, Suite 1100, Denver, CO 80203. |
| ** | Except as otherwise indicated, each individual has held the office shown or other offices in the same company for the last five years. |
| *** | The Fund Complex currently consists of nine series of the Trust and any other investment companies for which Brinker Capital, Inc. provides investment advisory services, currently none. |
Additional information about members of the Board of Trustees and officers of the Trust is available in the Statement of Additional Information and is available, without charge, upon request, by calling the Funds (toll-free) at 1-855-254-6467.
56 |
www.crystalstrategyfunds.com |
Table of Contents
| Crystal Strategy Family of Funds | Trustees and Officers | |
September 30, 2014 (Unaudited)
|
| Name, Birth Year & Address* | Position(s) Held with Fund | Term of Time | Principal Occupation(s) During Past 5 Years** | Number of Funds in Fund Complex Overseen by Trustee*** | Other Trustee During Past 5 Years** | |||||
| J. Wayne Hutchens Birth year: 1944 | Trustee | Mr. Hutchens was elected to the Board on October 30, 2012; indefinite term. | Mr. Hutchens is currently retired. From April 2006 to December 2012, he served as President and CEO of the University of Colorado (CU) Foundation and from April 2009 to December 2012, he was Executive Director of the CU Real Estate Foundation. Mr. Hutchens is also Trustee of the Denver Museum of Nature and Science (2000 to present), Director of AMG National Trust Bank (June 2012 to present) and Trustee of Children’s Hospital Colorado (May 2012 to present). Prior to these positions, Mr. Hutchens spent 29 years in the banking industry, retiring as Chairman of Chase Bank Colorado. | 9 | None. |
| * | All communications to Trustees and Officers may be directed to ALPS Series Trust c/o 1290 Broadway, Suite 1100, Denver, CO 80203. |
| ** | Except as otherwise indicated, each individual has held the office shown or other offices in the same company for the last five years. |
| *** | The Fund Complex currently consists of nine series of the Trust and any other investment companies for which Brinker Capital, Inc. provides investment advisory services, currently none. |
Additional information about members of the Board of Trustees and officers of the Trust is available in the Statement of Additional Information and is available, without charge, upon request, by calling the Funds (toll-free) at 1-855-254-6467.
Annual Report | September 30, 2014 |
57 |
Table of Contents
| Crystal Strategy Family of Funds | Trustees and Officers | |
September 30, 2014 (Unaudited)
|
| Number of | ||||||||||
| Term of | Funds in | Other | ||||||||
| Name, | Office and | Fund | Directorships | |||||||
| Birth | Position(s) | Length of | Complex | Held by Trustee | ||||||
| Year & | Held with | Time | Principal Occupation(s) During Past 5 | Overseen by | During Past | |||||
| Address* | Fund | Served | Years** | Trustee*** | 5 Years** | |||||
| Patrick Seese Birth year: 1971 | Trustee | Mr. Seese was elected to the Board on October 30, 2012; indefinite term. | Mr. Seese is an owner and a Managing Director of Integris Partners, a middle-market investment banking firm serving closely-held companies, financial sponsors and public companies (February 2008 to present). Prior to this, Mr. Seese was a Managing Director of Headwaters MB, a middle-market investing banking firm (December 2003 to February 2008). Prior to that, Mr. Seese worked in Credit Suisse First Boston’s Mergers and Acquisitions Group and served as Head of Corporation Development, Katy Industries, a publicly traded industrial and consumer products company and at Deloitte & Touche LLP, where he began his career in 1994. | 9 | None. |
| * | All communications to Trustees and Officers may be directed to ALPS Series Trust c/o 1290 Broadway, Suite 1100, Denver, CO 80203. |
| ** | Except as otherwise indicated, each individual has held the office shown or other offices in the same company for the last five years. |
| *** | The Fund Complex currently consists of nine series of the Trust and any other investment companies for which Brinker Capital, Inc. provides investment advisory services, currently none. |
Additional information about members of the Board of Trustees and officers of the Trust is available in the Statement of Additional Information and is available, without charge, upon request, by calling the Funds (toll-free) at 1-855-254-6467.
58 |
www.crystalstrategyfunds.com |
Table of Contents
| Crystal Strategy Family of Funds | Trustees and Officers | |
September 30, 2014 (Unaudited)
|
INTERESTED TRUSTEE AND OFFICERS
Name, Year & | Position(s) Held with Fund | Term of Time | Principal Occupation(s) During Past 5 Years** | Number of Funds in Fund Complex Overseen by Trustee*** | Other Directorships Held by Trustee During Past 5 Years** | |||||
| Jeremy O. May Birth year: 1970 | Trustee, Chairman and President | Mr. May was elected Trustee, Chairman and President on October 30, 2012; indefinite term. | Mr. May joined ALPS in 1995 and is currently President of ALPS Fund Services, Inc. and ALPS Distributors, Inc. and Executive Vice President and Director of ALPS Holdings, Inc. and ALPS Advisors, Inc. Because of his positions with these entities, Mr. May is deemed an affiliate of the Trust as defined under the 1940 Act. Mr. May currently serves as Treasurer of Clough Global Allocation Fund, Clough Global Equity Fund, Clough Global Opportunities Fund, Mr. May is also Chairman and Trustee of the Reaves Utility Income Fund. Mr. May is currently Vice Chair of the Board of Directors of the University of Colorado Foundation. | 9 | Mr. May is Chairman and Trustee of the Reaves Utility Income Fund (1 fund). |
| * | All communications to Trustees and Officers may be directed to ALPS Series Trust c/o 1290 Broadway, Suite 1100, Denver, CO 80203. |
| ** | Except as otherwise indicated, each individual has held the office shown or other offices in the same company for the last five years. |
| *** | The Fund Complex currently consists of nine series of the Trust and any other investment companies for which Brinker Capital, Inc. provides investment advisory services, currently none. |
Additional information about members of the Board of Trustees and officers of the Trust is available in the Statement of Additional Information and is available, without charge, upon request, by calling the Funds (toll-free) at 1-855-254-6467.
Annual Report | September 30, 2014 |
59 |
Table of Contents
| Crystal Strategy Family of Funds | Trustees and Officers | |
September 30, 2014 (Unaudited)
|
OFFICERS
| Term of | ||||||
| Name, | Position(s) | Office and | ||||
| Birth Year & | Held with | Length of Time | ||||
| Address* | Fund | Served | Principal Occupation(s) During Past 5 Years** | |||
Kimberly R. Storms Birth year: 1972 | Treasurer | Ms. Storms was elected Treasurer of the Trust on October 30, 2012; indefinite term. | Ms. Storms is Senior Vice President - Director of Fund Administration of ALPS. Ms. Storms joined ALPS in 1998 as Assistant Controller. Because of her position with ALPS, Ms. Storms is deemed an affiliate of the Trust as defined under the 1940 Act. Ms. Storms is also Treasurer of Financial Investors Trust, Liberty All-Star Equity Fund and Liberty All-Star Growth Fund, Inc. She serves as Chief Financial Officer of Arbitrage Funds.
| |||
JoEllen L. Legg Birth year: 1961 | Secretary | Ms. Legg was elected Secretary of the Trust on October 30, 2012; indefinite term. | Ms. Legg joined ALPS in October 2007 and is Vice President, Senior Counsel of ALPS. Prior to joining ALPS, Ms. Legg served as Senior Counsel - Law (Corporate & Securities) for Adelphia Communications Corporation (February 2005 – March 2007). Prior to this, Ms. Legg held associate positions at Fried Frank Harris Shriver & Jacobson LLP (1998 - 2004) and at Patton Boggs LLP (2004 - 2005). Because of her position with ALPS, Ms. Legg is deemed an affiliate of the Trust as defined under the 1940 Act. Ms. Legg is also the Assistant Secretary of the Stone Harbor Investment Funds, Stone Harbor Emerging Markets Income Fund, Stone Harbor Emerging Markets Total Income Fund, James Advantage Funds, WesMark Funds and Griffin Institutional Access Real Estate Fund. | |||
| Nate Mandeville Birth year: 1977 | Assistant Treasurer | Mr. Mandeville was elected Assistant Treasurer of the Trust on August 22, 2014; indefinite term. | Mr. Mandeville joined ALPS in December 2013 and is Fund Controller of ALPS. Prior to joining ALPS, Mr. Mandeville worked for Great-West Financial (2011-2013), Virtuoso Sourcing Group (2008-2011) and Janus Capital Group (2000-2008). Because of his position with ALPS, Mr. Mandeville is deemed an affiliate of the Trust as defined under the 1940 Act. |
| * | All communications to Trustees and Officers may be directed to ALPS Series Trust c/o 1290 Broadway, Suite 1100, Denver, CO 80203. |
| ** | Except as otherwise indicated, each individual has held the office shown or other offices in the same company for the last five years. |
| *** | The Fund Complex currently consists of nine series of the Trust and any other investment companies for which Brinker Capital, Inc. provides investment advisory services, currently none. |
Additional information about members of the Board of Trustees and officers of the Trust is available in the Statement of Additional Information and is available, without charge, upon request, by calling the Funds (toll-free) at 1-855-254-6467.
60 |
www.crystalstrategyfunds.com |
Table of Contents
| Crystal Strategy Family of Funds | Trustees and Officers | |
September 30, 2014 (Unaudited)
|
| Term of | ||||||
| Name, | Position(s) | Office and | ||||
| Birth Year & | Held with | Length of Time | ||||
| Address* | Fund | Served | Principal Occupation(s) During Past 5 Years** | |||
| Lucas Foss Birth year: 1977 | Chief Compliance Officer (“CCO”) | Mr. Foss was elected CCO of the Trust on October 30, 2012; indefinite term. | Mr. Foss joined ALPS in November 2004 and is Deputy Chief Compliance Officer of ALPS. Prior to his current role, Mr. Foss served as a Compliance Manager at ALPS (January 2010 - August 2012), and a Senior Compliance Analyst at ALPS (November 2004 – May 2006). Before joining ALPS, Mr. Foss held positions at Bisys Hedge Fund Services and Deutsche Asset Management. Because of his position with ALPS, Mr. Foss is deemed an affiliate of the Trust as defined under the 1940 Act. Mr. Foss is also CCO of Caldwell & Orkin Funds, Whitebox Mutual Funds, Boulder Growth & Income Fund, Boulder Total Return Fund, the Denali Fund, Wakefield Alternative Series Trust and The Principal Real Estate Income Fund. |
| * | All communications to Trustees and Officers may be directed to ALPS Series Trust c/o 1290 Broadway, Suite 1100, Denver, CO 80203. |
| ** | Except as otherwise indicated, each individual has held the office shown or other offices in the same company for the last five years. |
| *** | The Fund Complex currently consists of nine series of the Trust and any other investment companies for which Brinker Capital, Inc. provides investment advisory services, currently none. |
Additional information about members of the Board of Trustees and officers of the Trust is available in the Statement of Additional Information and is available, without charge, upon request, by calling the Funds (toll-free) at 1-855-254-6467.
Annual Report | September 30, 2014 |
61 |
Table of Contents
Table of Contents

Table of Contents
|
| 1
|
| ||
|
| 2
|
| ||
|
| 4
|
| ||
|
| 5
|
| ||
|
| 7
|
| ||
|
| 8
|
| ||
|
| 9
|
| ||
|
| 10
|
| ||
|
| 11
|
| ||
|
| 16
|
| ||
|
| 17
|
| ||
|
| 19
|
| ||
Table of Contents
| Cupps All Cap Growth Fund | Shareholder Letter | |
September 30, 2014 (Unaudited) |
Investment Environment
The investment environment in 2014 can truly be described as “A Tale of Two Markets” with dramatic divergence between the performance of higher growth, smaller stocks and the larger stocks that dominate the major indices. By the end of the third quarter, the Russell 1000® Growth, representing larger stocks, was up almost 8% for the year while the Russell 2000® Growth, representing smaller companies, was down over 4%. The divergence began in mid-March with a sharp decline in high growth, smaller cap stocks and persisted through the summer as smaller growth stocks moved sideways or lower while many larger stocks in the major indexes made clear advances into positive territory for the year.
Performance
The Cupps All Cap Growth Fund launched June 30, 2014. The bias against smaller and younger growth companies that began earlier in early March, continued into the third quarter and presented a slight headwind to the Fund. For the quarter, the Fund declined -1.70% while the benchmark Russell 3000® Growth index gained 0.88%.
Stock selections in the Technology Services sector, which includes many of the leading Internet companies and innovative rapidly growing software companies, accounted for the majority of the Fund’s underperformance. Despite the negative short term performance of these stocks, our view toward this segment of the economy is very constructive. We believe many of these companies will change the way consumers communicate with one another and digest news and entertainment. Likewise, other companies in the sector are redefining industry after industry by providing new information, altering the supply chain or creating unprecedented customization in the manufacturing process.
Exposure to leading biotechnology companies in the healthcare sector and semiconductors, specializing in wireless technology, in the technology hardware sector made the biggest contribution to performance.
Outlook
The likelihood of a dramatic acceleration in the U.S. economy appears low, partially as a function of the weak global economy. Despite continued muddle-along growth, the U.S. is nevertheless continuing to progress toward interest rate normalization. The Federal Reserve has all but concluded its Quantitative Easing activity and has articulated a desire to execute at least a nominal interest rate increase in 2015. From our perspective, these are constructive signposts on the road to a “more normal” economic environment. We believe this upcoming “more normal” economic environment will be one in which bottom up, company specific growth profiles will be a larger determinant in the performance of stocks, and the macro dynamics of the government involvement in the economy determining groups of winners and losers will have a smaller role.
We are quite optimistic about the opportunity created by the “valuation compression” that has occurred throughout 2014, especially in small and midsize companies. These companies are growing revenues rapidly and also driving rising operating margins. There are three examples of this valuation compression. The first example is price compression that has occurred as a function of simple price declines in many of the small and mid-size growth companies. Second, valuations of high growth stocks have compressed as a function of time. For example, a company with annual growth of 30% is roughly 15-20% larger today than early in the year. Lastly, a relative valuation compression has occurred as larger and slower growth stocks have moved higher, extending their valuations on a relative basis versus small and mid-size growth stocks that have not appreciated this year. These elements of compression in our portfolio, combined with continued remarkable growth prospects, make us believe the opportunities ahead are quite constructive.
RISKS: Investment in mutual funds involves risk, including possible loss of principal invested. You could lose money on your investment in the Fund or the Fund could underperform because of the following risks: common stocks are susceptible to general stock market fluctuations and to volatile increases and decreases in value as market confidence in and perceptions of their issues change. Individual investments of the Fund may not perform as expected and the fund’s portfolio management practices may not achieve the desired result. Funds focusing on small/mid-cap companies generally experience greater price volatility. Because the Fund focuses on growth-style stocks, its performance may at times be better or worse than the performance of funds that focus on other types of stocks or that have a broader investment style. From time to time, the trading market for a particular security or type of security in which the Fund invests may become less liquid or even illiquid. Reduced liquidity will have an adverse impact on the Fund’s ability to sell such securities when necessary to meet the Fund’s liquidity needs or in response to a specific economic event. There is no guarantee that the objective will be met and diversification does not eliminate risk.
Bottom up: an investment approach that de-emphasizes the significance of economic and market cycles and focuses on the analysis of individual stocks.
Quantitative Easing: An unconventional monetary policy in which a central bank purchases government securities or other securities from the market in order to lower interest rates and increase the money supply.
Russell 1000® Growth Index: measures the performance of the large-cap growth segment of the U.S. equity universe.
Russell 2000® Growth Index: measures the performance of the small-cap growth segment of the U.S. equity universe.
The Russell 3000® Index is a widely recognized, unmanaged index that measures the performance of the broad growth segment of the U.S. equity universe. It includes those Russell 3000 companies with higher price-to-book ratios and higher forecasted growth values. As of June 1, 2014, the Russell 3000® Growth Index included securities issued by companies that ranged in size between $24 million and $545 billion. One cannot invest directly in an index.
Not FDIC Insured – No Bank Guarantee – May Lose Value
Annual Report | September 30, 2014 | 1 |
Table of Contents
| Cupps All Cap Growth Fund | Portfolio Update | |
September 30, 2014 (Unaudited) |
Performance (as of September 30, 2014)
| Since Inception* | ||
| ||
Cupps All Cap Growth Fund | -1.70% | |
| ||
Russell 3000® Growth Index | 0.88% | |
| ||
The performance data quoted above represents past performance. Past performance is not a guarantee of future results. Investment return and value of the Fund shares will fluctuate so that an investor’s shares, when sold or redeemed, may be worth more or less than their original cost. Performance may be lower or higher than performance data quoted. Fund performance current to the most recent month-end is available by calling (844) 751-5731 or by visiting www.cuppsfunds.com.
| * | Fund’s inception date is June 30, 2014. |
Returns of less than 1 year are cumulative.
Indices are not actively managed and do not reflect deduction for fees, expenses, or taxes. An investor cannot invest directly in an index.
The returns shown above do not reflect the deduction of taxes a shareholder would pay on Fund distributions or redemption of Fund shares.
The total annual operating expenses and total annual operating expenses after fee waivers and/or reimbursement you may pay as an investor in the Fund (as reported in the June 30, 2014 Prospectus) are 3.29% and 1.05%, respectively.
The Fund is new and has a limited operating history.
Performance of $10,000 Initial Investment (as of September 30, 2014)
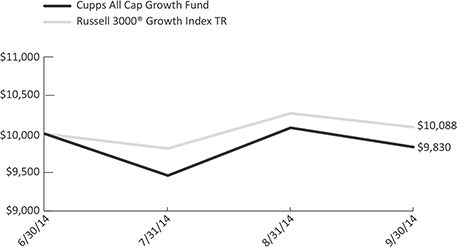
The graph shown above represents historical performance of a hypothetical investment of $10,000 in the Fund since inception. Past performance does not guarantee future results. All returns reflect reinvested dividends, but do not reflect the deduction of taxes that a shareholder would pay on Fund distributions or the redemption of Fund shares.
2 |
www.cuppsfunds.com |
Table of Contents
| Cupps All Cap Growth Fund | Portfolio Update | |
September 30, 2014 (Unaudited) |
Sector Allocation (as a % of Net Assets)*
Technology | 32.16 | % | ||||||||
Communications | 24.24 | % | ||||||||
Consumer, Non-cyclical | 17.73 | % | ||||||||
Consumer, Cyclical | 12.47 | % | ||||||||
Energy | 4.90 | % | ||||||||
Financial | 3.50 | % | ||||||||
Basic Materials | 2.52 | % | ||||||||
Industrial | 1.79 | % | ||||||||
Cash, Cash Equivalents, & Other Net Assets | 0.69 | % | ||||||||
| ||||||||||
Totals | 100.00 | % | ||||||||
| ||||||||||
Top 10 Long Holdings (as a % of Net Assets)* | ||||||||||
Facebook, Inc. - Class A | 4.30 | % | ||||||||
Apple, Inc. | 4.05 | % | ||||||||
Tesla Motors, Inc. | 3.12 | % | ||||||||
salesforce.com, Inc. | 2.70 | % | ||||||||
Gilead Sciences, Inc. | 2.46 | % | ||||||||
Stratasys Ltd. | 2.44 | % | ||||||||
Palo Alto Networks, Inc. | 2.41 | % | ||||||||
athenahealth, Inc. | 2.35 | % | ||||||||
Google, Inc. - Class A | 2.32 | % | ||||||||
Keurig Green Mountain, Inc. | 2.27 | % | ||||||||
| ||||||||||
Top Ten Holdings | 28.42 | % | ||||||||
| ||||||||||
| * | Holdings are subject to change. Tables present indicative values only. |
Annual Report | September 30, 2014 | 3 |
Table of Contents
| Cupps All Cap Growth Fund | Disclosure of Fund Expenses | |
September 30, 2014 (Unaudited) |
Examples. As a shareholder of the Cupps All Cap Growth Fund (the “Fund”), you will incur two types of costs: (1) transaction costs, including applicable redemption fees; and (2) ongoing costs, including management fees and other Fund expenses. The following example is intended to help you understand your ongoing costs (in dollars) of investing in the Fund and to compare these costs with the ongoing costs of investing in other mutual funds. The examples are based on an investment of $1,000 invested on April 1, 2014 and held through September 30, 2014.
Actual Expenses. The first line of the table below provides information about actual account values and actual expenses. You may use the information in this line, together with the amount you invested, to estimate the expenses that you paid over the period. Simply divide your account value by $1,000 (for example, an $8,600 account value divided by $1,000 = 8.6), then multiply the result by the number in the first line under the heading “Expenses Paid During Period April 1, 2014 – September 30, 2014” to estimate the expenses you paid on your account during this period.
Hypothetical Example for Comparison Purposes. The second line of the table below provides information about hypothetical account values and hypothetical expenses based on the Fund’s actual expense ratio and an assumed rate of return of 5% per year before expenses, which is not the Fund’s actual return. The hypothetical account values and expenses may not be used to estimate the actual ending account balance or expenses you paid for the period. You may use this information to compare the ongoing costs of investing in the Fund and other mutual funds. To do so, compare this 5% hypothetical example with the 5% hypothetical examples that appear in the shareholder reports of the other mutual funds.
Please note that the expenses shown in the table are meant to highlight your ongoing costs only and do not reflect any transactional costs, such as redemption fees. Therefore, the second line of the table below is useful in comparing ongoing costs only and may not help you determine the relative total costs of owning different funds. In addition, if these transactional costs were included, your costs would have been higher.
| Beginning Account Value April 1, 2014 | Ending Account Value September 30, 2014 | Expense Ratio(a) | Expense Paid During Period September 30, 2014(b) | |||||||||||
| ||||||||||||||
Cupps All Cap Growth Fund | ||||||||||||||
Actual(c) | $ | 1,000.00 | $ | 983.00 | 1.05% | $ | 2.62 | |||||||
Hypothetical (5% return before expenses) | $ | 1,000.00 | $ | 1,019.80 | 1.05% | $ | 5.32 | |||||||
| (a) | The Fund’s expenses have been annualized based on the Fund’s most recent fiscal half-year expenses. |
| (b) | Expenses are equal to the Fund’s annualized expense ratio, multiplied by the average account value over the period, multiplied by the number of days in the most recent fiscal half year (183), divided by 365. |
| (c) | The actual expenses paid during the period is based on the commencement of operations on July 1, 2014. |
4 |
www.cuppsfunds.com |
Table of Contents
| Cupps All Cap Growth Fund | Portfolio of Investments | |
September 30, 2014 |
| Shares | Value (Note 2) | |||||||
| ||||||||
COMMON STOCKS (98.10%) |
| |||||||
BASIC MATERIALS (2.52%) |
| |||||||
Methanex Corp. | 90 | $ | 6,012 | |||||
Rockwood Holdings, Inc. | 61 | 4,664 | ||||||
US Silica Holdings, Inc. | 136 | 8,501 | ||||||
|
| |||||||
TOTAL BASIC MATERIALS |
| 19,177 | ||||||
|
| |||||||
COMMUNICATIONS (24.24%) |
| |||||||
Alibaba Group Holding Ltd.(a) | 88 | 7,819 | ||||||
Amazon.com, Inc.(a) | 47 | 15,155 | ||||||
Baidu, Inc.- Sponsored | 43 | 9,384 | ||||||
Facebook, Inc.- Class A(a) | 414 | 32,722 | ||||||
FireEye, Inc.(a) | 388 | 11,857 | ||||||
Google, Inc.- Class A(a) | 30 | 17,652 | ||||||
Groupon, Inc.(a) | 220 | 1,469 | ||||||
Netflix, Inc.(a) | 18 | 8,121 | ||||||
Palo Alto Networks, Inc.(a) | 187 | 18,345 | ||||||
Splunk, Inc.(a) | 102 | 5,647 | ||||||
TripAdvisor, Inc.(a) | 42 | 3,840 | ||||||
Vipshop Holdings Ltd.- | 66 | 12,475 | ||||||
Yelp, Inc.(a) | 231 | 15,766 | ||||||
Zillow, Inc.- Class A(a) | 87 | 10,091 | ||||||
zulily, Inc.- Class A(a) | 377 | 14,284 | ||||||
|
| |||||||
TOTAL COMMUNICATIONS |
| 184,627 | ||||||
|
| |||||||
CONSUMER, CYCLICAL (12.47%) |
| |||||||
Chipotle Mexican Grill, Inc.(a) | 24 | 15,998 | ||||||
Deckers Outdoor Corp.(a) | 147 | 14,285 | ||||||
Delta Air Lines, Inc. | 215 | 7,772 | ||||||
Polaris Industries, Inc. | 62 | 9,287 | ||||||
Restoration Hardware Holdings, Inc.(a) | 174 | 13,842 | ||||||
Tesla Motors, Inc.(a) | 98 | 23,783 | ||||||
Under Armour, Inc.- Class A(a) | 145 | 10,020 | ||||||
|
| |||||||
TOTAL CONSUMER, CYCLICAL |
| 94,987 | ||||||
|
| |||||||
CONSUMER, NON-CYCLICAL (17.73%) |
| |||||||
Alkermes PLC(a) | 171 | 7,331 | ||||||
Alnylam Pharmaceuticals, | 156 | 12,184 | ||||||
Brookdale Senior Living, | 219 | 7,056 | ||||||
Cepheid(a) | 125 | 5,504 | ||||||
CoStar Group, Inc.(a) | 24 | 3,733 | ||||||
DexCom, Inc.(a) | 191 | 7,638 | ||||||
Gilead Sciences, Inc.(a) | 176 | 18,735 | ||||||
Illumina, Inc.(a) | 100 | 16,392 | ||||||
Keurig Green Mountain, Inc. | 133 | 17,307 | ||||||
Pharmacyclics, Inc.(a) | 39 | 4,580 | ||||||
Salix Pharmaceuticals Ltd.(a) | 78 | 12,187 | ||||||
United Rentals, Inc.(a) | 93 | 10,332 | ||||||
Vertex Pharmaceuticals, | 107 | 12,017 | ||||||
|
| |||||||
TOTAL CONSUMER, NON-CYCLICAL |
| 134,996 | ||||||
|
| |||||||
| Shares | Value (Note 2) | |||||||
| ||||||||
ENERGY (4.90%) | ||||||||
Pioneer Natural Resources Co. | 48 | $ | 9,454 | |||||
Precision Drilling Corp. | 366 | 3,949 | ||||||
SolarCity Corp.(a) | 275 | 16,390 | ||||||
Weatherford International PLC(a) | 362 | 7,530 | ||||||
|
| |||||||
TOTAL ENERGY | 37,323 | |||||||
|
| |||||||
FINANCIAL (2.29%) | ||||||||
American Tower Corp.- REIT | 83 | 7,771 | ||||||
Morgan Stanley | 280 | 9,680 | ||||||
|
| |||||||
TOTAL FINANCIAL | 17,451 | |||||||
|
| |||||||
INDUSTRIAL (1.79%) | ||||||||
Mobileye NV(a) | 254 | 13,612 | ||||||
|
| |||||||
TOTAL INDUSTRIAL | 13,612 | |||||||
|
| |||||||
TECHNOLOGY (32.16%) | ||||||||
Apple, Inc. | 306 | 30,829 | ||||||
Applied Materials, Inc. | 603 | 13,031 | ||||||
athenahealth, Inc.(a) | 136 | 17,910 | ||||||
Avago Technologies Ltd. | 132 | 11,484 | ||||||
Cavium, Inc.(a) | 284 | 14,123 | ||||||
Electronic Arts, Inc.(a) | 275 | 9,793 | ||||||
Freescale Semiconductor Ltd.(a) | 277 | 5,410 | ||||||
NetSuite, Inc.(a) | 178 | 15,938 | ||||||
NXP Semiconductor NV(a) | 135 | 9,238 | ||||||
salesforce.com, Inc.(a) | 357 | 20,538 | ||||||
SanDisk Corp. | 93 | 9,109 | ||||||
ServiceNow, Inc.(a) | 190 | 11,168 | ||||||
Skyworks Solutions, Inc. | 284 | 16,486 | ||||||
Stratasys Ltd.(a) | 154 | 18,600 | ||||||
Tableau Software, Inc.- Class A(a) | 230 | 16,710 | ||||||
Ultimate Software Group, Inc.(a) | 84 | 11,887 | ||||||
Workday, Inc.- Class A(a) | 153 | 12,623 | ||||||
|
| |||||||
TOTAL TECHNOLOGY | 244,877 | |||||||
|
| |||||||
TOTAL COMMON STOCKS (Cost $751,202) |
| 747,050 | ||||||
|
| |||||||
MASTER LIMITED PARTNERSHIP (1.21%) |
| |||||||
FINANCIAL (1.21%) | ||||||||
Lazard Ltd.- Class A | 181 | 9,177 | ||||||
|
| |||||||
TOTAL FINANCIAL | 9,177 | |||||||
|
| |||||||
TOTAL MASTER LIMITED PARTNERSHIP (Cost $9,363) |
| 9,177 | ||||||
|
| |||||||
See Notes to Financial Statements. | ||
Annual Report | September 30, 2014 | 5 |
Table of Contents
| Cupps All Cap Growth Fund | Portfolio of Investments | |
September 30, 2014 |
7-Day Yield | Shares | Value (Note 2) | ||||||||||
| ||||||||||||
SHORT-TERM INVESTMENTS (24.99%) |
| |||||||||||
MONEY MARKET FUND (24.99%) |
| |||||||||||
Fidelity Institutional Money Market- Money Market Portfolio- Class I | 0.05075 | % | 190,316 | $ | 190,316 | |||||||
|
| |||||||||||
TOTAL SHORT-TERM INVESTMENTS (Cost $190,316) |
| 190,316 | ||||||||||
|
| |||||||||||
TOTAL INVESTMENTS (124.30%) (Cost $950,881) |
| $ | 946,543 | |||||||||
Liabilities In Excess Of Other Assets (-24.30%) |
| (185,046) | ||||||||||
|
| |||||||||||
NET ASSETS (100.00%) |
| $ | 761,497 | |||||||||
|
| |||||||||||
| (a) | Non-Income Producing Security. |
Common Abbreviations:
ADR - American Depositary Receipt.
Ltd. - Limited.
NV - Naamloze Vennootschap is the Dutch term used for a public limited liability company.
PLC - Public Limited Company.
REIT - Real Estate Investment Trust.
For Fund compliance purposes, the Fund’s industry classifications refer to any one or more of the industry sub-classifications used by one or more widely recognized market indexes or ratings group indexes, and/or as defined by Fund management. This definition may not apply for purposes of this report, which may combine industry sub-classifications for reporting ease. Industries are shown as a percentage of net assets. (unaudited)
See Notes to Financial Statements. | ||
6 |
www.cuppsfunds.com |
Table of Contents
| Cupps All Cap Growth Fund | Statement of Assets and Liabilities | |
September 30, 2014 |
ASSETS |
| |||
Investments, at value (Cost $950,881) | $ | 946,543 | ||
Cash | 21 | |||
Receivable for investments sold | 7,774 | |||
Dividend and interest receivable | 25 | |||
Receivable due from advisor | 22,943 | |||
Prepaid offering costs | 12,853 | |||
Prepaid expenses and other assets | 14 | |||
|
| |||
Total Assets | 990,173 | |||
|
| |||
LIABILITIES | ||||
Payable for investments purchased | 180,157 | |||
Payable due to Chief Compliance Officer | 1,667 | |||
Administration and transfer agency fees payable | 25,104 | |||
Trustees’ fees and expenses payable | 3 | |||
Legal fees payable | 1,539 | |||
Audit and tax fees payable | 16,600 | |||
Accrued expenses and other liabilities | 3,606 | |||
|
| |||
Total Liabilities | 228,676 | |||
|
| |||
NET ASSETS | $ | 761,497 | ||
|
| |||
NET ASSETS CONSIST OF | ||||
Paid-in capital | $ | 773,341 | ||
Accumulated net investment loss | (403) | |||
Accumulated net realized loss on investments | (7,103) | |||
Net unrealized depreciation on investments | (4,338) | |||
|
| |||
NET ASSETS | $ | 761,497 | ||
|
| |||
PRICING OF SHARES | ||||
Net Asset Value, offering and redemption price per share | $ | 9.83 | ||
Net Assets | $ | 761,497 | ||
Shares of beneficial interest outstanding (unlimited number of shares, no par value common stock authorized) | 77,491 | |||
See Notes to Financial Statements. | ||
Annual Report | September 30, 2014 | 7 |
Table of Contents
| Cupps All Cap Growth Fund | Statement of Operations | |
For the Period Ended September 30, 2014(a) |
INVESTMENT INCOME | ||||
Dividends | $ | 325 | ||
Foreign taxes withheld on dividends | (3) | |||
|
| |||
Total Investment Income | 322 | |||
|
| |||
EXPENSES | ||||
Investment advisory fees | 713 | |||
Administrative and transfer agency fees | 36,119 | |||
Legal fees | 1,539 | |||
Audit and tax fees | 16,600 | |||
Reports to shareholders and printing fees | 1,015 | |||
Custody fees | 1,250 | |||
Chief Compliance Officer Fees | 5,000 | |||
Trustees’ fees and expenses | 42 | |||
Offering costs | 15,968 | |||
Miscellaneous expenses | 1,349 | |||
|
| |||
Total Expenses | 79,595 | |||
Less fees waived/reimbursed by investment advisor (Note 7) | (78,806) | |||
|
| |||
Net Expenses | 789 | |||
|
| |||
Net Investment Loss | (467) | |||
|
| |||
Net realized loss on investments | (7,208) | |||
Net change in unrealized depreciation on investments | (4,338) | |||
|
| |||
NET REALIZED AND UNREALIZED LOSS ON INVESTMENTS | (11,546) | |||
|
| |||
NET DECREASE IN NET ASSETS RESULTING FROM OPERATIONS | $ | (12,013) | ||
|
| |||
| (a) | Commenced operations on July 1, 2014. |
See Notes to Financial Statements. | ||
8 |
www.cuppsfunds.com |
Table of Contents
| Cupps All Cap Growth Fund | Statement of Changes in Net Assets | |
| For the Period Ended September 30, 2014(a) | ||||
OPERATIONS | ||||
Net investment loss | $ | (467) | ||
Net realized loss on investments | (7,208) | |||
Net change in unrealized depreciation on investments | (4,338) | |||
|
| |||
Net decrease in net assets resulting from operations | (12,013) | |||
|
| |||
BENEFICIAL SHARE TRANSACTIONS | ||||
Shares sold | 773,510 | |||
|
| |||
Net increase in net assets derived from beneficial share transactions | 773,510 | |||
|
| |||
Net increase in net assets | 761,497 | |||
NET ASSETS | ||||
Beginning of period | – | |||
|
| |||
End of period (Including accumulated net investment loss of $(403)) | $ | 761,497 | ||
|
| |||
| (a) | Commenced operations on July 1, 2014. |
See Notes to Financial Statements. | ||
Annual Report | September 30, 2014 | 9 |
Table of Contents
| Cupps All Cap Growth Fund | Financial Highlights | |
For a Share Outstanding Throughout the Period Presented |
| For the Period Ended September 30, 2014(a) | ||||
Net asset value, beginning of period | $10.00 | |||
INCOME FROM INVESTMENT OPERATIONS: | ||||
Net investment loss(b) | (0.01) | |||
Net realized and unrealized loss | (0.16) | |||
|
| |||
Total from investment operations | (0.17) | |||
|
| |||
Net (decrease) in net asset value | (0.17) | |||
|
| |||
Net asset value, end of year | $9.83 | |||
|
| |||
TOTAL RETURN(c) | (1.70)% | |||
RATIOS/SUPPLEMENTAL DATA: | ||||
Net assets, end of year (000s) | $761 | |||
Ratio of expenses to average net assets excluding fee waivers and reimbursements | 106.03%(d) | |||
Ratio of expenses to average net assets including fee waivers and reimbursements | 1.05%(d) | |||
Ratio of net investment loss to average net assets | (0.62)%(d) | |||
Portfolio turnover rate(e) | 25% | |||
| (a) | Commenced operations on July 1, 2014. |
| (b) | Calculated using the average shares method. |
| (c) | The total return is for the period indicated and have not been annualized. The total return would have been lower had certain expenses not been reimbursed/waived during the period. The return shown does not reflect the deduction of taxes that a shareholder would pay on Fund distributions or the redemption of Fund shares. |
| (d) | Annualized. |
| (e) | Portfolio turnover rate for periods less than one full year have not been annualized. |
See Notes to Financial Statements. | ||
10 |
www.cuppsfunds.com |
Table of Contents
| Cupps All Cap Growth Fund | Notes to Financial Statements | |
September 30, 2014 |
1. ORGANIZATION
The ALPS Series Trust (the “Trust”), a Delaware statutory trust, is an open-end management investment company registered under the Investment Company Act of 1940 (the “1940 Act”). As of September 30, 2014, the Trust had nine registered funds. This annual report describes the Cupps All Cap Growth Fund (the “Fund”). The Fund’s primary investment objective is to achieve growth of capital over the long term. The Fund currently offers an Institutional Class. The Trust has an unlimited number of shares with no par value per share. The Board of Trustees (the “Board”) may establish additional funds and classes of shares at any time in the future without shareholder approval.
As a newly organized entity, the Fund has little operating history. The Fund does not have any operations before June 30, 2014 other than those relating to the sale and issuance of the Fund’s Institutional share class to ALPS Fund Services, Inc., the Fund’s Administrator and Transfer Agent. ALPS Fund Services is an affiliate of ALPS Distributors, Inc., the Fund’s principal underwriter.
2. SIGNIFICANT ACCOUNTING POLICIES
The accompanying financial statements were prepared in accordance with accounting principles generally accepted in the United States of America for investment companies (“U.S. GAAP”). The Fund is considered an investment company for financial reporting purposes. The preparation of financial statements in conformity with U.S. GAAP requires management to make certain estimates and assumptions that affect the reported amounts of assets and liabilities and disclosures of contingent assets and liabilities at the date of the financial statements and the reported amounts of revenue and expenses during the period. Actual results could differ from those estimates. The following is a summary of significant accounting policies consistently followed by the Fund in preparation of its financial statements.
Investment Valuation: The Fund generally values its securities based on market prices determined at the close of regular trading on the New York Stock Exchange (“NYSE”), normally 4:00 p.m. Eastern Time, on each day the NYSE is open for trading.
For equity securities and mutual funds that are traded on an exchange, the market price is usually the closing sale or official closing price on that exchange. In the case of equity securities not traded on an exchange, or if such closing prices are not otherwise available, the securities are valued at the mean of the most recent bid and ask prices on such day.
Redeemable securities issued by open-end registered investment companies are valued at the investment company’s applicable net asset value, with the exception of exchange-traded open-end investment companies, which are priced as equity securities.
When such prices or quotations are not available, or when the Fair Value Committee appointed by the Board believes that they are unreliable, securities may be priced using fair value procedures approved by the Board.
Fair Value Measurements: The Fund discloses the classification of its fair value measurements following a three-tier hierarchy based on the inputs used to measure fair value. Inputs refer broadly to the assumptions that market participants would use in pricing the asset or liability, including assumptions about risk. Inputs may be observable or unobservable. Observable inputs reflect the assumptions market participants would use in pricing the asset or liability that are developed based on market data obtained from sources independent of the reporting entity. Unobservable inputs reflect the reporting entity’s own assumptions about the assumptions market participants would use in pricing the asset or liability that are developed based on the best information available.
Various inputs are used in determining the value of the Fund’s investments as of the end of the reporting period. When inputs used fall into different levels of the fair value hierarchy, the level in the hierarchy within which the fair value measurement falls is determined based on the lowest level input that is significant to the fair value measurement in its entirety. The designated input levels are not necessarily an indication of the risk or liquidity associated with these investments. These inputs are categorized in the following hierarchy under applicable financial accounting standards:
Level 1 – | Unadjusted quoted prices in active markets for identical investments, unrestricted assets or liabilities that the Fund has the ability to access at the measurement date; | |||
Level 2 – | Quoted prices which are not active, quoted prices for similar assets or liabilities in active markets or inputs other than quoted prices that are observable (either directly or indirectly) for substantially the full term of the asset or liability; and | |||
Level 3 – | Significant unobservable prices or inputs (including the Fund’s own assumptions in determining the fair value of investments) where there is little or no market activity for the asset or liability at the measurement date. | |||
Annual Report | September 30, 2014 | 11 |
Table of Contents
| Cupps All Cap Growth Fund | Notes to Financial Statements | |
September 30, 2014 |
The following is a summary of the inputs used to value the Fund’s investments as of September 30, 2014:
| Investments in Securities at Value | Level 1 - Unadjusted Quoted Prices | Level 2 - Other Significant Observable Inputs | Level 3 - Significant Unobservable Inputs | Total | ||||||||||||
| ||||||||||||||||
Common Stocks Basic Materials | $ | 19,177 | $ | – | $ | – | $ | 19,177 | ||||||||
Communications | 184,627 | – | – | 184,627 | ||||||||||||
Consumer, Cyclical | 94,987 | – | – | 94,987 | ||||||||||||
Consumer, Non-cyclical | 134,996 | – | – | 134,996 | ||||||||||||
Energy | 37,323 | – | – | 37,323 | ||||||||||||
Financial | 17,451 | – | – | 17,451 | ||||||||||||
Industrial | 13,612 | – | – | 13,612 | ||||||||||||
Technology | 244,877 | – | – | 244,877 | ||||||||||||
Master Limited Partnership | 9,177 | – | – | 9,177 | ||||||||||||
Short-Term Investments | 190,316 | – | – | 190,316 | ||||||||||||
| ||||||||||||||||
TOTAL | $ | 946,543 | $ | – | $ | – | $ | 946,543 | ||||||||
| ||||||||||||||||
The Fund recognizes transfers between levels as of the end of the fiscal year. For the period ended September 30, 2014, the Fund did not have any transfers between Level 1 and Level 2 securities. There were no Level 3 securities held during the period.
Offering Costs: The Fund incurred offering costs during the period ended September 30, 2014. These offering costs, including fees for printing initial prospectuses, legal and registration fees, are being amortized over the first twelve months from the inception date of the Fund. Amounts amortized through September 30, 2014 are shown on the Fund’s Statement of Operations and amounts that remain to be amortized are shown on the Fund’s Statement of Assets and Liabilities.
Trust Expenses: Some expenses of the Trust can be directly attributed to the Fund. Expenses which cannot be directly attributed to the Fund are apportioned among all funds in the Trust based on average net assets of each fund.
Federal Income Taxes: The Fund complies with the requirements under Subchapter M of the Internal Revenue Code of 1986 applicable to regulated investment companies and intends to distribute substantially all of its net taxable income and net capital gains, if any, each year so that it will not be subject to excise tax on undistributed income and gains. The Fund is not subject to income taxes to the extent such distributions are made.
As of and during the period ended September 30, 2014, the Fund did not have a liability for any unrecognized tax benefits in the accompanying financial statements. The Fund files U.S. federal, state and local income tax returns as required. The Fund’s tax returns are subject to examination by the relevant tax authorities until expiration of the applicable statute of limitations, which is generally three years after the filing of the tax return for federal purposes and four years for most state returns. If applicable, the Fund’s Administrator has analyzed the Fund’s tax positions taken on federal and state income tax returns for all open tax years and has concluded that as of September 30, 2014, no provision for income tax is required in the Fund’s financial statements related to these tax positions.
Investment Transactions and Investment Income: Investment transactions are accounted for on the date the investments are purchased or sold (trade date basis). Realized gains and losses from investment transactions are reported on an identified cost basis. Interest income, which includes accretion of discounts and amortization of premiums, is accrued and recorded as earned. Dividend income is recognized on the ex-dividend date, or for certain foreign securities, as soon as information is available to the Fund.
Distributions to Shareholders: The Fund normally pays dividends, if any, and distributes capital gains, if any, on an annual basis. Income dividend distributions are derived from interest and other income the Fund receives from its investments, including short term capital gains. Long term capital gain distributions are derived from gains realized when the Fund sells a security it has owned for more than one year. The Fund may make additional distributions and dividends at other times if its portfolio manager believes doing so may be necessary for the Fund to avoid or reduce taxes. Net investment income/(loss) and net realized gain/(loss) may differ for financial statement and tax purposes.
12 |
www.cuppsfunds.com |
Table of Contents
| Cupps All Cap Growth Fund | Notes to Financial Statements | |
September 30, 2014 |
3. TAX BASIS INFORMATION
Tax Basis of Distributions to Shareholders: The character of distributions made during the period from net investment income or net realized gains may differ from its ultimate characterization for federal income tax purposes. Also, due to the timing of dividend distributions, the fiscal year in which amounts are distributed may differ from the fiscal year in which the income or realized gain were recorded by the Fund. The amounts and characteristics of tax basis distributions and composition of distributable earnings/(accumulated losses) are finalized at fiscal year end. There were no distributions paid by the Fund for the period ended September 30, 2014.
Reclassifications: As of September 30, 2014, permanent differences in book and tax accounting were reclassified. The following reclassifications, which had no impact on results of operations or net assets, were recorded to reflect tax character:
| Paid-in Capital | Accumulated Net Investment Income | Accumulated Net Realized Gain on Investments | ||||||||
| ||||||||||
| $ (169) | $ 64 | $ 105 | ||||||||
These differences are primarily attributed to the wash sales, partnerships and organizational costs.
Unrealized Appreciation and Depreciation on Investments: As of September 30, 2014, the aggregate costs of investments, gross unrealized appreciation/(depreciation) and net unrealized appreciation for Federal tax purposes were as follows:
Gross unrealized appreciation (excess of value over tax cost) | $ | 13,970 | ||
Gross unrealized depreciation (excess of tax cost over value) | (21,929) | |||
| ||||
Net unrealized depreciation | $ | (7,959) | ||
| ||||
Cost of investments for income tax purposes | $ | 954,502 | ||
| ||||
Components of Distributable Earnings: At September 30, 2014, components of distributable earnings were as follows:
Accumulated Capital Losses | (3,482) | |||
Net unrealized depreciation on investments | (7,959) | |||
Other cumulative effect of timing differences | (403) | |||
| ||||
Total | $ | (11,844) | ||
| ||||
Capital Losses: As of September 30, 2014, the Fund had no accumulated capital loss carryforwards.
The Fund elects to defer to the period ending September 30th, 2015, capital losses recognized in the period ending September 30th, 2014 in the amount of $3,482.
The Fund elects to defer to the period ending September 30th, 2015, late year ordinary losses in the amount of $403.
4. SECURITIES TRANSACTIONS
Purchases and sales of securities, excluding short-term securities, during the fiscal year ended September 30, 2014 were as follows:
| Purchases of Securities | Proceeds from Sales of Securities | |||||||
| ||||||||
| $ | 874,901 | $ 107,126 | ||||||
5. BENEFICIAL SHARE TRANSACTIONS
The capitalization of the Trust consists of an unlimited number of shares of beneficial interest with no par value per share. Holders of the shares of the Fund have one vote for each share held and a proportionate fraction of a vote for each fractional share. All shares issued and outstanding are fully paid and are non-assessable, transferable and redeemable at the option of the shareholder. Shares have no pre-emptive rights.
Annual Report | September 30, 2014 | 13 |
Table of Contents
| Cupps All Cap Growth Fund | Notes to Financial Statements | |
September 30, 2014 |
Transactions in common shares were as follows:
| For the Period Ended September 30, 2014(a) | ||||
| ||||
Shares sold | 77,491 | |||
Dividends reinvested | – | |||
Shares redeemed | – | |||
|
| |||
Net increase in shares outstanding | 77,491 | |||
|
| |||
| (a) | Commenced operations on July 1, 2014. |
Control is defined by the 1940 Act as the beneficial ownership, either directly or through one or more controlled companies, of more than 25% of the voting securities of a company. The Fund has one affiliated shareholder representing approximately 32% of total Fund shares. Approximately 64% of the shares outstanding are held within one omnibus account. Investment activities of these shareholders could have a material impact on the Fund.
6. MANAGEMENT AND RELATED PARTY TRANSACTIONS
Investment Advisory: Cupps Capital Management, LLC (“Cupps” or the “Adviser”), subject to the authority of the Board, is responsible for the overall management and administration of the Fund’s business affairs. The Adviser manages the investments of the Fund in accordance with the Fund’s investment objective, policies and limitations and investment guidelines established jointly by the Adviser and the Board.
Pursuant to the Investment Advisory Agreement (the “Advisory Agreement”) with the Adviser, the Fund pays the Adviser an annual management fee of 0.95% based on the Fund’s average daily net assets. The management fee is paid on a monthly basis. The initial term of the Advisory Agreement is two years. The Board may extend the Advisory Agreement for additional one-year terms. The Board, shareholders of the Fund or the Adviser may terminate the Advisory Agreement upon 60 days’ notice.
Pursuant to a fee waiver letter agreement (the “Fee Waiver Agreement”), the Adviser has contractually agreed to limit the amount of the Fund’s Total Annual Fund Operating Expenses, exclusive of Distribution and Service (12b-1) Fees, Acquired Fund Fees and Expenses, brokerage expenses, interest expenses, taxes and extraordinary expenses, Fund liquidation expenses and Fund reorganization expenses to 1.05% of the Fund’s average daily net assets. The Fee Waiver Agreement is in effect through January 31, 2016. The Adviser will be permitted to recover, on a class-by-class basis, expenses it has borne through the Fee Waiver Agreement to the extent that the Fund’s expenses in later periods fall below the annual rates set forth in the Fee Waiver Agreement. The Fund will not be obligated to pay any such deferred fees and expenses more than three years after the end of the fiscal year in which the fees and expense were deferred. The Adviser may not discontinue this waiver without the approval by the Trust’s Board.
For the fiscal year ended September 30, 2014, the fee waivers and/or reimbursements were $78,806.
As of September 30, 2014, the balance of recoupable expenses was $78,806, and will expire in 2017.
Administrator: ALPS Fund Services, Inc. (“ALPS”) serves as administrator to the Fund. The Fund has agreed to pay expenses incurred in connection with its administrative activities. Pursuant to the Administration, Bookkeeping and Pricing Services Agreement with the Trust, ALPS will provide operational services to the Fund including, but not limited to, fund accounting and fund administration and generally assist in the Fund’s operations.
The Fund’s administration fee is accrued on a daily basis and paid on a monthly basis following the end of the month, based on the greater of (a) an annual total fee of $105,000 in year 1 of operations and $125,000 in year 2; or (b) the following basis point fee schedule:
| Average Total Net Assets | Contractual Fee | |
Between $0-$500M | 0.08% | |
$500M-$1B | 0.06% | |
Above $1B | 0.02% |
Annually thereafter, the parties agree to reevaluate the compensation paid under the agreement by the Trust on behalf of the fund to ALPS for the services it performs for the Fund.
ALPS is reimbursed by the Fund for certain out-of-pocket expenses.
14 |
www.cuppsfunds.com |
Table of Contents
| Cupps All Cap Growth Fund | Notes to Financial Statements | |
September 30, 2014 |
Transfer Agent: ALPS serves as transfer agent for the Fund under a Transfer Agency and Services Agreement with the Trust. Under this agreement, ALPS is paid an annual base fee of $25,000 for services performed on behalf of the Fund plus fees for open accounts and is reimbursed for certain out-of-pocket expenses.
Compliance Services: ALPS provides services as the Fund’s Chief Compliance Officer to monitor and test the policies and procedures of the Fund in conjunction with requirements under Rule 38a-1 of the 1940 Act pursuant to a Chief Compliance Officer Services Agreement with the Trust. Under this agreement, ALPS is paid an annual base fee of $20,000 for services performed on behalf of the Fund and is reimbursed for certain out-of-pocket expenses.
Distributor: ALPS Distributors, Inc. (the “Distributor”) acts as the principal underwriter of the Fund’s shares pursuant to a Distribution Agreement with the Trust. Shares of the Fund are offered on a continuous basis through the Distributor, as agent of the Fund. The Distributor is not obligated to sell any particular amount of shares and is not entitled to any compensation for its services as the Fund’s principal underwriter.
7. TRUSTEES
As of September 30, 2014, there were four Trustees, three of whom are not “interested persons” (as defined in the 1940 Act) of the Trust (the “Independent Trustees”). Prior to October 1, 2014, the Independent Trustees received a quarterly retainer of $2,000, plus $1,000 for each regular Board or Committee meeting attended, $1,000 for each special telephonic Board or Committee meeting attended and $1,000 for each special in-person Board meeting attended. Effective October 1, 2014, the Independent Trustees receive a quarterly retainer of $4,000, plus $2,000 for each regular Board or Committee meeting attended, $2,000 for each special telephonic Board or Committee meeting attended and $2,000 for each special in-person Board meeting attended. The Independent Trustees are also reimbursed for all reasonable out-of-pocket expenses relating to attendance at meetings and for meeting-related expenses. Officers of the Trust and Trustees who are interested persons of the Trust receive no salary or fees from the Trust.
8. INDEMNIFICATIONS
Under the Trust’s organizational documents, its officers and Trustees are indemnified against certain liabilities arising out of the performance of their duties to the Trust. Additionally, in the normal course of business, the Trust enters into contracts with service providers that may contain general indemnification clauses which may permit indemnification to the extent permissible under applicable law. The Trust’s maximum exposure under these arrangements is unknown, as this would involve future claims that may be made against the Trust that have not yet occurred.
9. CHANGES IN ACCOUNTANTS
On June 30, 2014, KPMG LLP acquired certain assets of ROTHSTEIN-KASS, P.A. (d/b/a Rothstein Kass & Company, P.C.) and certain of its affiliates (“Rothstein Kass”), the independent public accounting firm for the Fund. As a result of this transaction, on June 30, 2014, Rothstein Kass resigned as the independent registered public accounting firm for the Funds. As the Fund commenced operations on July 1, 2014 and the Fund’s fiscal year end is September 30th, there are no financial statements for the Fund for the fiscal year ended September 30, 2013.
The Board of Trustees of the Trust approved the selection of KPMG LLP to serve as the Fund’s independent registered public accounting firm for the Funds’ fiscal year ending September 30, 2014 at an in-person meeting held on August 22, 2014.
Annual Report | September 30, 2014 | 15 |
Table of Contents
| Cupps All Cap Growth Fund | Report of Independent Registered Public Accounting Firm |
The Board of Trustees and Shareholders
ALPS Series Trust:
We have audited the accompanying statement of assets and liabilities of Cupps All Cap Growth Fund, including the portfolio of investments, as of September 30, 2014, and the related statement of operations, the statement of changes in net assets, and the financial highlights for the period from July 1, 2014 (commencement of operations) to September 30, 2014. These financial statements and financial highlights are the responsibility of the Fund’s management. Our responsibility is to express an opinion on these financial statements and financial highlights based on our audit.
We conducted our audit in accordance with the standards of the Public Company Accounting Oversight Board (United States). Those standards require that we plan and perform the audit to obtain reasonable assurance about whether the financial statements and financial highlights are free of material misstatement. An audit includes examining, on a test basis, evidence supporting the amounts and disclosures in the financial statements. Our procedures included confirmation of securities owned as of September 30, 2014, by correspondence with custodians and brokers, or by other appropriate auditing procedures where replies from brokers were not received. An audit also includes assessing the accounting principles used and significant estimates made by management, as well as evaluating the overall financial statement presentation. We believe that our audit provides a reasonable basis for our opinion.
In our opinion, the financial statements and financial highlights referred to above present fairly, in all material respects, the financial position of Cupps All Cap Growth Fund as of September 30, 2014, the results of its operations, the changes in its net assets, and the financial highlights for the period from July 1, 2014 (commencement of operations) to September 30, 2014, in conformity with U.S. generally accepted accounting principles.
KPMG LLP
Denver, Colorado
November 24, 2014
| 16 |
www.cuppsfunds.com |
Table of Contents
| Cupps All Cap Growth Fund | Additional Information | |
September 30, 2014 (Unaudited) |
1. PROXY VOTING POLICIES AND VOTING RECORD
A description of the policies and procedures that the Fund uses to determine how to vote proxies relating to portfolio securities is available without charge, upon request, (i) by calling the Fund (toll-free) at 1-855-674-4642 or (ii) on the Securities and Exchange Commission’s the (“SEC”) website at http://www.sec.gov.
Information regarding how the Fund voted proxies relating to portfolio securities during the most recent 12-month period ended June 30 is available (i) without charge, upon request, by calling the Fund (toll-free) at 1-855-674-4642 or (ii) on the SEC’s website at http://www.sec.gov.
2. PORTFOLIO HOLDINGS
The Fund files its complete schedule of portfolio holdings with the SEC for the first and third quarters of each fiscal year on Form N-Q. The Fund’s Forms N-Q are available on the SEC website at http://www.sec.gov. The Fund’s Forms N-Q may be reviewed and copied at the SEC’s Public Reference Room in Washington, D.C., and information on the operation of the Public Reference Room may be obtained by calling 1-800-SEC-0330.
3. DISCLOSURE REGARDING APPROVAL OF FUND ADVISORY AGREEMENT
On May 14, 2014, the Trustees met in person to discuss, among other things, the approval of the Investment Advisory Agreement (the “Advisory Agreement”) between the Trust and Cupps Capital Management, LLC (the “Adviser”), on behalf of the Cupps All Cap Growth Fund (the “Fund”) with in accordance with Section 15(c) of the 1940 Act. The Independent Trustees met with independent legal counsel during executive session and discussed the Advisory Agreement and related matters.
In approving the Advisory Agreement, the Trustees, including the Independent Trustees, considered the following factors with respect to the Fund:
Investment Advisory Fee Rate: The Trustees reviewed and considered the contractual annual advisory fee to be paid by the Trust, on behalf of the Fund, to the Adviser of 0.95% of the Fund’s daily average net assets, in light of the nature, extent and quality of the advisory services to be provided by Cupps Capital to the Fund.
The Trustees considered the information they received comparing the Fund’s contractual annual advisory fee and overall expenses with those of funds in the expense group and universe of funds provided by an independent provider of investment company data (the “Independent Provider”). The Trustees noted that the Fund’s contractual advisory fee of 0.95% is within the range of its Independent Provider peer group of 0.55% to 1.10%. The Trustees also noted the Fund’s Institutional Class total net expense of 1.05% is within the range of its Independent Provider peer group of 0.50% to 1.25%. After consideration, the Trustees determined that the contractual annual advisory fees and total net expenses set forth above for the Fund, taking into account the contractual fee waiver in place, is fair to the Fund’s shareholders.
Nature, Extent and Quality of the Services under the Advisory Agreement: The Trustees received and considered information regarding the nature, extent and quality of services to be provided to the Fund under the Advisory Agreement. The Trustees reviewed certain background materials supplied by the Adviser in its presentation, including its Form ADV.
The Trustees reviewed and considered the Adviser’s investment advisory personnel, its history as an asset manager and its performance and the amount of assets currently under management by the Adviser. The Trustees also reviewed the research and decision-making processes utilized by the Adviser, including the methods adopted to seek to achieve compliance with the investment objectives, policies and restrictions of the Fund.
The Trustees considered the background and experience of the Adviser’s management in connection with the Fund, including reviewing the qualifications, backgrounds and responsibilities of the management team primarily responsible for the day-to-day portfolio management of the Fund and the extent of the resources devoted to research and analysis of actual and potential investments. The Trustees noted that the Adviser currently manages all cap growth strategies in the form of separate accounts and commingled private partnership funds and considered the fees the Adviser charges to manage these accounts and funds.
The Trustees also reviewed, among other things, Cupps Capital’s Code of Ethics.
Performance: The Trustees noted that since the Fund has not yet begun operations, there is no performance of the Fund to be reviewed or analyzed at this time. The Trustees considered the Adviser’s reputation generally and its investment techniques, risk management controls and decision-making processes.
Annual Report | September 30, 2014 | 17 |
Table of Contents
| Cupps All Cap Growth Fund | Additional Information | |
September 30, 2014 (Unaudited) |
The Adviser’s Profitability: The Trustees received and considered a projected profitability analysis prepared by the Adviser based on the fees payable under the Advisory Agreement. The Trustees considered the profits, if any, anticipated to be realized by the Adviser in connection with the operation of the Fund.
Economies of Scale: The Trustees considered whether economies of scale in the provision of services to the Fund would be passed along to the shareholders under the proposed Advisory Agreement.
Other Benefits to the Adviser: The Trustees reviewed and considered any other incidental benefits derived or to be derived by the Adviser from its relationship with the Fund, noting that the Adviser does engage in soft dollar arrangements pursuant to its soft dollar policy.
In selecting the Adviser and the fees charged under the Advisory Agreement, the Trustees concluded that no single factor reviewed by the Trustees was identified by the Trustees to be determinative as the principal factor in whether to approve the Advisory Agreement. Further, the Independent Trustees were advised by independent legal counsel throughout the process. The Trustees, including all of the Independent Trustees, concluded that:
| • | the contractual annual advisory fees of 0.95% of the Fund’s daily average net assets to be paid to the Adviser under the Advisory Agreement and the total net expenses of 1.05% for the Fund’s Institutional Class shares, taking into account the contractual fee waiver in place, were fair to the Fund’s shareholders; |
| • | the nature, extent and quality of services to be rendered by the Adviser under the Advisory Agreement were adequate; |
| • | bearing in mind the limitations of comparing different types of managed accounts and the different levels of service typically associated with such accounts, the fee structures applicable to the Adviser’s private fund and institutional separate account clients employing a comparable all cap growth strategy were not indicative of any unreasonableness with respect to the advisory fees proposed to be payable by the Fund; |
| • | there was no performance history for the Fund for the Board to consider; |
| • | the terms of the proposed fee waiver/expense reimbursement letter agreement between the Trust, on behalf of the Fund, and the Adviser were not unreasonable; |
| • | the profit, if any, anticipated to be realized by the Adviser in connection with the operation of the Fund was not unreasonable; and |
| • | there were no material economies of scale or other incidental benefits accruing to the Adviser in connection with its relationship with the Fund. |
Based on the Trustees’ deliberations and their evaluation of the information described above, the Trustees, including all of the Independent Trustees, concluded that the Adviser’s compensation for investment advisory services is consistent with the best interests of the Fund and its shareholders.
18 |
www.cuppsfunds.com |
Table of Contents
| Cupps All Cap Growth Fund | Trustees and Officers | |
September 30, 2014 (Unaudited) |
INDEPENDENT TRUSTEES
| Name, Birth Year & Address* | Position(s) Held with Fund | Term of Office and Length of Time Served | Principal Occupation(s) During Past 5 Years** | Number of Funds in Fund Complex Overseen by Trustee*** | Other Directorships Held by Trustee During Past 5 Years** | |||||
| ||||||||||
Cheryl Burgermeister Birth year: 1951 | Trustee | Ms. Burgermeister was elected to the Board on October 30, 2012; indefinite term. | Ms. Burgermeister is Trustee and Audit Committee Chair of The Select Sector SPDR Trust (October 1998 to present), Trustee of Russell Investment Funds (September 2012 to present) and Trustee, Treasurer and Finance Committee Chair of the Portland Community College Foundation (January 2001 to present). She also served as Trustee and Audit Committee Chair of E*Trade Funds (March 2004 to March 2010), Trustee of Zero Gravity Internet Fund (May 2000 to December 2001), Director and Treasurer of Crabbe Huson Family of Funds (1998 to 1999) and Director, Chief Financial Officer and Treasurer of The Crabbe Huson Group, Inc. (July 1987 to October 1999). From 1982 to 1986, Ms. Burgermeister was Supervising Senior Accountant at KPMG Peat Marwick. Ms. Burgermeister a licensed Certified Public Accountant and a member of the Oregon Society of Certified Public Accountants. | 9 | Ms. Burgermeister is a Trustee and Audit Committee Chair of The Select Sector SPDR Trust (9 ETFs) and Trustee of Russell Investment Funds (42 funds). | |||||
| ||||||||||
J. Wayne Hutchens Birth year: 1944 | Trustee | Mr. Hutchens was elected to the Board on October 30, 2012; indefinite term. | Mr. Hutchens is currently retired. From April 2006 to December 2012, he served as President and CEO of the University of Colorado (CU) Foundation and from April 2009 to December 2012, he was Executive Director of the CU Real Estate Foundation. Mr. Hutchens is also Trustee of the Denver Museum of Nature and Science (2000 to present), Director of AMG National Trust Bank (June 2012 to present) and Trustee of Children’s Hospital Colorado (May 2012 to present). Prior to these positions, Mr. Hutchens spent 29 years in the banking industry, retiring as Chairman of Chase Bank Colorado. | 9 | None. | |||||
| ||||||||||
| * | All communications to Trustees and Officers may be directed to ALPS Series Trust c/o 1290 Broadway, Suite 1100, Denver, CO 80203. |
| ** | Except as otherwise indicated, each individual has held the office shown or other offices in the same company for the last five years. |
| *** | The Fund Complex currently consists of nine series of the Trust and any other investment companies for which Cupps Capital Management, LLC provide investment advisory services, currently none. |
Annual Report | September 30, 2014 | 19 |
Table of Contents
| Cupps All Cap Growth Fund | Trustees and Officers | |
September 30, 2014 (Unaudited) |
INDEPENDENT TRUSTEES (continued)
Name, Birth Year & Address* | Position(s) Held with Fund | Term of Office and Length of Time Served | Principal Occupation(s) During Past 5 Years** | Number of Funds in Fund Complex Overseen by Trustee*** | Other Directorships Held by Trustee During Past 5 Years** | |||||
| ||||||||||
Patrick Seese Birth year: 1971 | Trustee | Mr. Seese was elected to the Board on October 30, 2012; indefinite term. | Mr. Seese is an owner and a Managing Director of Integris Partners, a middle-market investment banking firm serving closely-held companies, financial sponsors and public companies (February 2008 to present). Prior to this, Mr. Seese was a Managing Director of Headwaters MB, a middle-market investing banking firm (December 2003 to February 2008). Prior to that, Mr. Seese worked in Credit Suisse First Boston’s Mergers and Acquisitions Group and served as Head of Corporation Development, Katy Industries, a publicly traded industrial and consumer products company and at Deloitte & Touche LLP, where he began his career in 1994. | 9 | None. | |||||
| ||||||||||
INTERESTED TRUSTEE
| ||||||||||
| ||||||||||
Jeremy O. May Birth year: 1970 | Trustee, Chairman and President | Mr. May was elected Trustee, Chairman and President on October 30, 2012; indefinite term. | Mr. May joined ALPS in 1995 and is currently President of ALPS Fund Services, Inc. and ALPS Distributors, Inc. Executive Vice President of ALPS Holdings, Inc. and ALPS Advisors, Inc. Because of his positions with these entities, Mr. May is deemed an affiliate of the Trust as defined under the 1940 Act. Mr. May currently serves as Treasurer of Clough Global Allocation Fund, Clough Global Equity Fund, Clough Global Opportunities Fund, Mr. May is also Chairman and Trustee of the Reaves Utility Income Fund. Mr. May is currently Vice Chair of the Board of Directors of the University of Colorado Foundation. | 9 | Mr. May is Chairman and Trustee of the Reaves Utility Income Fund (1 fund). | |||||
| ||||||||||
| * | All communications to Trustees and Officers may be directed to ALPS Series Trust c/o 1290 Broadway, Suite 1100, Denver, CO 80203. |
| ** | Except as otherwise indicated, each individual has held the office shown or other offices in the same company for the last five years. |
| *** | The Fund Complex currently consists of nine series of the Trust and any other investment companies for which Cupps Capital Management, LLC provide investment advisory services, currently none. |
20 |
www.cuppsfunds.com |
Table of Contents
| Cupps All Cap Growth Fund | Trustees and Officers | |
September 30, 2014 (Unaudited) |
OFFICERS
| Name, Birth Year & Address* | Position(s) Held with Fund | Term of Office and Length of Time Served | Principal Occupation(s) During Past 5 Years** | |||
| ||||||
Kimberly R. Storms Birth year: 1972 | Treasurer | Ms. Storms was elected Treasurer of the Trust on October 30, 2012; indefinite term. | Ms. Storms is Senior Vice President - Director of Fund Administration of ALPS. Ms. Storms joined ALPS in 1998 as Assistant Controller. Because of her position with ALPS, Ms. Storms is deemed an affiliate of the Trust as defined under the 1940 Act. Ms. Storms is also Treasurer of Financial Investors Trust, Liberty All-Star Equity Fund and Liberty All-Star Growth Fund, Inc. She serves as Chief Financial Officer of Arbitrage Funds. | |||
| ||||||
JoEllen L. Legg Birth year: 1961 | Secretary | Ms. Legg was elected Secretary of the Trust on October 30, 2012; indefinite term. | Ms. Legg joined ALPS in October 2007 and is Vice President, Senior Counsel of ALPS. Prior to joining ALPS, Ms. Legg served as Senior Counsel - Law (Corporate & Securities) for Adelphia Communications Corporation (February 2005 - March 2007). Prior to this, Ms. Legg held associate positions at Fried Frank Harris Shriver & Jacobson LLP (1998 - 2004) and at Patton Boggs LLP (2004 - 2005). Because of her position with ALPS, Ms. Legg is deemed an affiliate of the Trust as defined under the 1940 Act. Ms. Legg is also the Assistant Secretary of the Stone Harbor Investment Funds, Stone Harbor Emerging Markets Income Fund, Stone Harbor Emerging Markets Total Income Fund, James Advantage Funds, WesMark Funds, and Griffin Institutional Access Real Estate Fund. | |||
| ||||||
Nate Mandeville Birth year: 1977 | Assistant Treasurer | Mr. Mandeville was elected Assistant Treasurer of the Trust on August 22, 2014; indefinite term. | Mr. Mandeville joined ALPS in December 2013 and is Fund Controller of ALPS. Prior to joining ALPS, Mr. Mandeville worked for Great-West Financial (2011-2013), Virtuoso Sourcing Group (2008-2011) and Janus Capital Group (2000-2008). Because of his position with ALPS, Mr. Mandeville is deemed an affiliate of the Trust as defined under the 1940 Act. | |||
| ||||||
Lucas Foss Birth year: 1977 | Chief Compliance Officer (“CCO”) | Mr. Foss was elected CCO of the Trust on October 30, 2012; indefinite term. | Mr. Foss joined ALPS in November 2004 and is Deputy Chief Compliance Officer of ALPS. Prior to his current role, Mr. Foss served as a Compliance Manager at ALPS (January 2010 - August 2012), and a Senior Compliance Analyst at ALPS (November 2004 – May 2006). Before joining ALPS, Mr. Foss held positions at Bisys Hedge Fund Services and Deutsche Asset Management. Because of his position with ALPS, Mr. Foss is deemed an affiliate of the Trust as defined under the 1940 Act. Mr. Foss is also CCO of Caldwell & Orkin Funds, Whitebox Mutual Funds, Boulder Growth & Income Fund, Boulder Total Return Fund, the Denali Fund, Wakefield Alternative Series Trust and The Principal Real Estate Income Fund. | |||
| ||||||
| * | All communications to Trustees and Officers may be directed to ALPS Series Trust c/o 1290 Broadway, Suite 1100, Denver, CO 80203. |
| ** | Except as otherwise indicated, each individual has held the office shown or other offices in the same company for the last five years. |
Additional information about members of the Board of Trustees and officers of the Trust is available in the Statement of Additional Information and is available, without charge, upon request, by calling the Fund (toll-free) at 1-855-331-6240.
Annual Report | September 30, 2014 | 21 |
Table of Contents
Table of Contents
Table of Contents
| TABLE OF CONTENTS |
| 1 | |||
| 4 | |||
| 6 | |||
| 7 | |||
Statement of Assets and Liabilities
| 16 | |||
| 17 | |||
Statements of Changes in Net Assets
| 18 | |||
| 19 | |||
| 20 | |||
Report of Independent Registered Public Accounting Firm
| 33 | |||
| 34 | |||
| 35 | |||
Table of Contents
| GKE Asian Opportunities Fund | Shareholder Letter | |
September 30, 2014 (Unaudited) |
Dear Shareholder,
Despite difficult times for Emerging Markets in the 3rd quarter of 2014 Asian markets fared slightly better and the GKE Asian Opportunities Fund did even better than that. In the 3rd Quarter the GKE Asian Opportunities Fund rose +0.38% in U.S. Dollar (USD) terms. Though the returns may be optically rather paltry, it represents very strong outperformance against the index which fell -2.78% over the same period. This brings total fiscal year performance to +3.37% against the benchmarks +4.03% returns. The fund has now clawed back some of the underperformance experienced during the first part of the year and if the prevailing trends continue we anticipate the fund may continue to outperform.
The fund had a number of things go right for it this quarter: stock selection in China and India provided alpha(1) while the Fund’s decision to be overweight the Philippines and underweight Australia further boosted returns. Further, the Fund’s overweight position in Japanese exporters saw strong performance during September as the Japanese Yen (JPY) continued its depreciation. Finally, the allocation to fixed income securities added stability and positive performance during the volatile months of August and September, as intended.
Looking back on the quarter, there were several important events which we would like to highlight in order to provide insight into the markets today. First was the sharp rise in the value of the U.S. dollar. As measured by the DXY Index(2), the U.S. dollar appreciated +7.7% over the 3rd quarter. The impetus was seemingly the increasing consensus among investors that the Federal Reserve would begin raising interest rates sooner and more quickly than previously expected. This bullish dollar news was further helped by dovishness from both Europe and Japan. We are now into year 3 of a rising U.S. dollar, while U.S. dollar cycles tend to last between five to ten years. If the dollar has indeed turned for the stronger we should expect at least a few more years of strength.
The next important event we want to highlight was the continuing slowdown in the Chinese economy. Beginning with June trade figures, investors again began worrying about China’s economy. The true scare came in mid-August though when it was announced that China’s monthly new Yuan loans were only half of the expectation. This figure brought new concern that the Chinese government was not doing enough to support a stagnating economy. With a housing market clearly turning downward weak lending data only served to further scare investors.
The culmination of these two important events was a collapse in commodity prices across the board. Everything from wheat to copper to oil accelerated its downward movement during the fall months. It is important to note though that this was hardly a change in direction; most commodity markets have been in a bear market for the past two to three years. As commodity cycles tend to go, under supply leads to more production and boom goes to bust. So while we are several years into a commodity bear market we do not believe the resulting shift in terms of trade have been fully appreciated by the markets.
There are several ramifications for the global economy which should be noted. First and foremost will be the likely continued downward pressure on inflation. With inputs to all manufactured goods falling and still very little wage pressure globally it is hard to see why inflation would accelerate, anywhere. Next, the stronger U.S. dollar is having the secondary effect of weakening growth in some Emerging Markets (through commodities) and slowing growth in the U.S. (weaker exports). Finally, in a circuitous game of cause and effect, a stronger USD will most likely have the ironic effect of delaying the Federal Reserve’s plans to increase interest rates.
Annual Report | September 30, 2014 | 1 |
Table of Contents
| GKE Asian Opportunities Fund | Shareholder Letter | |
September 30, 2014 (Unaudited) |
With respect to Asia, our first reaction is that the stronger U.S. dollar and falling commodities is a big boon for Asian economies. As the chart below shows, Asian economies are in general short of commodities and spend a lot of money importing them. Korea, China, Japan, India, Thailand and the Philippines all have primary goods deficits at -5% of Gross Domestic Product (GDP) or greater. Further, India’s primary goods deficit is almost certainly under-reported due to gold smuggling. The exceptions to the Asian commodity import structure are Australia and Indonesia. Broadly speaking a drop in commodity prices represents a positive shift in the terms of trade for Asia.
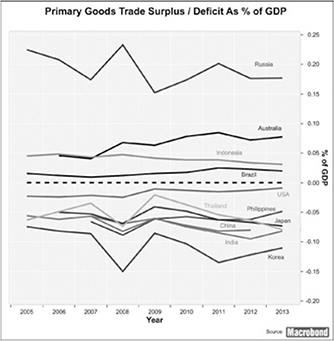
Chart data as of 12/31/2013.
The second reason why Asia is a net benefactor or today’s trends is that a stronger U.S. dollar should help expand exports; a stronger dollar makes goods manufactured in Asia cheaper. Stronger exports and cheaper imports will almost certainly result in higher liquidity and cheaper financing costs for the region. Finally, many investors are concerned about Asia because of its historical dependence on external dollar financing. However, as we have stressed before, U.S. dollar dependence has greatly diminished in the past decade. Asian central banks have built much larger foreign reserves and the expansion of local liquidity pools is allowing companies to finance themselves locally at affordable rates.
2 |
www.gkefund.com |
Table of Contents
| GKE Asian Opportunities Fund | Shareholder Letter | |
September 30, 2014 (Unaudited) |
Over the past several months investors have started to show some degree of discrimination between those countries benefitting from weaker commodities (India +1.3% in Q3 in USD terms) and those hurt (Australia-9.1% in Q3 in USD terms). However, when markets began to sell off in earnest during September and early October we noticed there was very little differentiation; correlations went to +1 as investors went “risk-off”(3). This resulted in most of Asia falling in line with the rest of the world.
Today the Fund is largely positioned to potentially benefit from falling commodities and the resulting better terms of trade in Asia. The Fund is underweight commodities, underweight Australia, and its investments in Indonesia are all skewed toward domestic staples. Meanwhile the Fund is overweight China, India, and the Philippines. When markets recover from their current blind “risk-off” phase we believe that investors will again focus on those places which are benefitting from lower commodities and a higher U.S. dollar.

Louis-Vincent Gave
CEO and Portfolio Manager, GaveKal Capital Limited
The views and information discussed in this commentary are as of the date of publication, are subject to change, and may not reflect the writer’s current views. The views expressed represent an assessment of market conditions at a specific point in time, are opinions only and should not be relied upon as investment advice regarding a particular investment or markets in general. Such information does not constitute a recommendation to buy or sell specific securities or investment vehicles. It should not be assumed that any investment will be profitable or will equal the performance of the fund(s) or any securities or any sectors mentioned herein. The subject matter contained herein has been derived from several sources believed to be reliable and accurate at the time of compilation. GaveKal does not accept any liability for losses either direct or consequential caused by the use of this information
Emerging markets are often less stable politically and economically than developed markets such as the United States and investing in emerging markets involves different and greater risks. There may be less publicly available information about companies in emerging markets. The stock exchanges and brokerage industries of emerging markets do not have the level of government oversight as do those in the United States. Securities markets of such countries are substantially smaller, less liquid and more volatile than securities markets in the United States. Emerging markets may be especially prone to currency-related risks.
Past performance does not guarantee future results.
| (1) | Alpha - A measure of performance on a risk-adjusted basis. Alpha takes the volatility (price risk) of a mutual fund and compares its risk-adjusted performance to a benchmark index. The excess return of the fund relative to the return of the benchmark index is a fund’s alpha. |
| (2) | DXY Index - A measure of the value of the United States dollar relative to a basket of foreign currencies. |
| (3) | Correlation is a statistical measure of how two securities move in relation to each other. A correlation of +1 implies that such securities will move in lockstep, in the same direction. |
Annual Report | September 30, 2014 | 3 |
Table of Contents
| GKE Asian Opportunities Fund | Portfolio Update | |
September 30, 2014 (Unaudited) |
Performance (as of September 30, 2014)
| 3 Month | 1 Year | Since Inception* | ||||
| ||||||
GKE Asian Opportunities Fund - NAV | 0.38% | 3.37% | 6.30% | |||
MSCI AC Asia Pacific TR USD(a) | -2.78% | 4.03% | 6.37% | |||
| ||||||
The performance data quoted above represents past performance. Past performance is not a guarantee of future results. Investment return and value of the Fund shares will fluctuate so that an investor’s shares, when sold or redeemed, may be worth more or less than their original cost. Performance may be lower or higher than performance data quoted. Fund performance current to the most recent month-end is available by calling 1-855-331-6240 or by visiting www.gkefund.com.
| * | Fund’s inception date is August 5, 2013. |
| (a) | The MSCI AC Asia Pacific TR USD Index is designed to measure the equity market performance of the developed and emerging markets in the Pacific region. The Index consists of the following 12 developed and emerging market countries: Australia, China, Hong Kong, Indonesia, Japan, Korea, Malaysia, New Zealand, Philippines, Singapore, Taiwan, and Thailand. |
Returns of less than 1 year are cumulative.
Indexes are not actively managed and do not reflect deduction for fees, expenses or taxes. An investor cannot invest directly into an index.
The returns shown above do not reflect the deduction of taxes a shareholder would pay on Fund distributions or redemption of Fund shares.
The total annual operating expenses and total annual operating expenses after fee waivers and/or reimbursement you may pay as an investor in the Fund (as reported in the January 28, 2014 Prospectus) are 2.14% and 1.81%, respectively.
Performance of $10,000 Initial Investment (as of September 30, 2014)
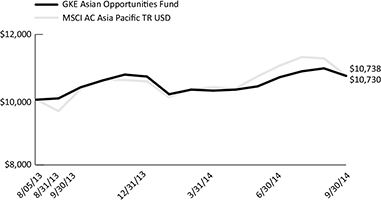
The graph shown above represents historical performance of a hypothetical investment of $10,000 in the Fund since inception. Past performance does not guarantee future results. All returns reflect reinvested dividends, but do not reflect the deduction of taxes that a shareholder would pay on Fund distributions or the redemption of Fund shares.
4 |
www.gkefund.com |
Table of Contents
| GKE Asian Opportunities Fund | Portfolio Update | |
September 30, 2014 (Unaudited) |
Sector Allocation (as a % of Net Assets)*
Financials | 24.01% | |||
Government | 13.05% | |||
Industrial | 11.94% | |||
Communications | 9.42% | |||
Utilities | 8.28% | |||
Consumer, Cyclical | 7.69% | |||
Technology | 6.47% | |||
Consumer, Non-cyclical | 3.91% | |||
Energy | 1.28% | |||
Basic Materials | 1.10% | |||
Cash, Cash Equivalents, & Other Net Assets | 12.85% | |||
| ||||
TOTALS | 100.00% | |||
| ||||
Top 10 Long Positions (as a % of Net Assets)*
Indonesia Government International Bond | 10.03% | |||
Optus Finance Pty Ltd., Sr. Unsec. Notes | 6.41% | |||
New Zealand Government Bond, Sr. Unsec. Notes | 3.02% | |||
Far East Horizon Ltd., Sr. Unsec. Notes | 2.89% | |||
Megaworld Corp. | 2.89% | |||
Guangdong Investment Ltd. | 2.78% | |||
Huadian Fuxin Energy Corp. Ltd. | 2.72% | |||
AIA Group Ltd. | 2.45% | |||
Panasonic Corp. | 2.34% | |||
Cheung Kong Holdings Ltd. | 2.18% |
| * | Holdings are subject to change. Tables present indicative values only. |
Annual Report | September 30, 2014 | 5 |
Table of Contents
| GKE Asian Opportunities Fund | Disclosure of Fund Expenses | |
September 30, 2014 (Unaudited) |
Examples. As a shareholder of the GKE Asian Opportunities Fund (the “Fund”), you will incur two types of costs: (1) transaction costs, including redemption fees; and (2) ongoing costs, including management fees and other Fund expenses. The following examples are intended to help you understand your ongoing costs (in dollars) of investing in the Fund and to compare these costs with the ongoing costs of investing in other mutual funds. The examples are based on an investment of $1,000 invested on April 1, 2014 and held until September 30, 2014.
Actual Expenses. The first line of each table below provides information about actual account values and actual expenses. You may use the information in this line, together with the amount you invested, to estimate the expenses that you paid over the period. Simply divide your account value by $1,000 (for example, an $8,600 account value divided by $1,000 = 8.6), then multiply the result by the number in the first line under the heading “Expenses Paid During Period April 1, 2014 – September 30, 2014” to estimate the expenses you paid on your account during this period.
Hypothetical Example for Comparison Purposes. The second line of the table below provides information about hypothetical account values and hypothetical expenses based on the Fund’s actual expense ratio and an assumed rate of return of 5% per year before expenses, which is not the Fund’s actual return. The hypothetical account values and expenses may not be used to estimate the actual ending account balance or expenses you paid for the period. You may use this information to compare the ongoing costs of investing in the Fund and other mutual funds. To do so, compare this 5% hypothetical example with the 5% hypothetical examples that appear in the shareholder reports of the other mutual funds.
Please note that the expenses shown in the table are meant to highlight your ongoing costs only and do not reflect any transactional costs, such as redemption fees. Therefore, the second line of the table below is useful in comparing ongoing costs only and may not help you determine the relative total costs of owning different funds. In addition, if these transactional costs were included, your costs would have been higher.
Beginning Account Value April 1, 2014 | Ending Account Value September 30, 2014 | Expense Ratio(a) | Expenses Paid During period April 1, 2014 - September 30, 2014(b) | |||||
| ||||||||
Actual | $ 1,000.00 | $ 1,043.90 | 1.81% | $ 9.27 | ||||
Hypothetical | ||||||||
(5% return before expenses) | $ 1,000.00 | $ 1,015.99 | 1.81% | $ 9.15 | ||||
| (a) | The Fund’s expense ratios have been annualized based on the Fund’s most recent fiscal half-year expenses. |
| (b) | Expenses are equal to the Fund’s annualized expense ratio, multiplied by the average account value over the period, multiplied by the number of days in the most recent fiscal half year (183), divided by 365. |
6 |
www.gkefund.com |
Table of Contents
| GKE Asian Opportunities Fund | Portfolio of Investments | |
September 30, 2014 |
| Value | ||||||||
| Shares | (Note 2) | |||||||
| ||||||||
COMMON STOCKS (52.65%) | ||||||||
BASIC MATERIALS (1.10%) | ||||||||
Iron & Steel (0.84%) | ||||||||
Angang Steel Co. Ltd. | 152,000 | $ | 95,919 | |||||
|
| |||||||
Mining (0.26%) | ||||||||
PT Aneka Tambang Persero Tbk | 104,400 | 9,510 | ||||||
PT Vale Indonesia Tbk | 64,300 | 19,789 | ||||||
|
| |||||||
| 29,299 | ||||||||
|
| |||||||
TOTAL BASIC MATERIALS | 125,218 | |||||||
|
| |||||||
COMMUNICATIONS (3.01%) | ||||||||
Internet (2.85%) | ||||||||
Kakaku.com, Inc. | 1,600�� | 22,729 | ||||||
Tencent Holdings Ltd. | 12,000 | 178,497 | ||||||
Trend Micro, Inc. | 3,600 | 121,778 | ||||||
|
| |||||||
| 323,004 | ||||||||
|
| |||||||
Telecommunications (0.16%) | ||||||||
PT Telekomunikasi Indonesia Persero Tbk | 76,100 | 18,205 | ||||||
|
| |||||||
TOTAL COMMUNICATIONS | 341,209 | |||||||
|
| |||||||
CONSUMER, CYCLICAL (7.69%) | ||||||||
Auto Manufacturers (3.62%) | ||||||||
Great Wall Motor Co. Ltd. | 36,500 | 141,725 | ||||||
Mazda Motor Corp. | 4,200 | 105,273 | ||||||
Suzuki Motor Corp. | 3,000 | 99,444 | ||||||
Toyota Motor Corp. | 1,100 | 64,822 | ||||||
|
| |||||||
| 411,264 | ||||||||
|
| |||||||
Home Furnishings (2.78%) | ||||||||
Haier Electronics Group Co. Ltd. | 19,000 | 49,795 | ||||||
Panasonic Corp. | 22,300 | 265,241 | ||||||
|
| |||||||
| 315,036 | ||||||||
|
| |||||||
| See Notes to Financial Statements. | ||
Annual Report | September 30, 2014 | 7 |
Table of Contents
| GKE Asian Opportunities Fund | Portfolio of Investments | |
September 30, 2014 |
| Value | ||||||||
| Shares | (Note 2) | |||||||
| ||||||||
CONSUMER, CYCLICAL (continued) | ||||||||
Retail (1.29%) | ||||||||
ANTA Sports Products Ltd. | 35,000 | $ | 71,309 | |||||
Puregold Price Club, Inc. | 97,100 | 75,079 | ||||||
|
| |||||||
| 146,388 | ||||||||
|
| |||||||
TOTAL CONSUMER, CYCLICAL | 872,688 | |||||||
|
| |||||||
CONSUMER, NON-CYCLICAL (3.55%) | ||||||||
Commercial Services (0.43%) | ||||||||
WuXi PharmaTech Cayman, Inc.(a) | 1,400 | 49,028 | ||||||
|
| |||||||
Cosmetics/Personal Care (0.19%) | ||||||||
Shiseido Co. Ltd. | 1,300 | 21,449 | ||||||
|
| |||||||
Food (0.82%) | ||||||||
China Modern Dairy Holdings Ltd.(a) | 201,000 | 93,189 | ||||||
|
| |||||||
Household Products/Wares (1.00%) | ||||||||
Samsonite International SA | 35,100 | 113,009 | ||||||
|
| |||||||
Pharmaceuticals (1.11%) | ||||||||
China Traditional Chinese Medicine Co. Ltd.(a) | 34,000 | 17,077 | ||||||
CSPC Pharmaceutical Group Ltd. | 132,000 | 109,308 | ||||||
|
| |||||||
| 126,385 | ||||||||
|
| |||||||
TOTAL CONSUMER, NON-CYCLICAL | 403,060 | |||||||
|
| |||||||
ENERGY (1.28%) | ||||||||
Energy Alternate Sources (1.28%) | ||||||||
China Longyuan Power Group Corp. | 148,000 | 144,667 | ||||||
|
| |||||||
TOTAL ENERGY | 144,667 | |||||||
|
| |||||||
See Notes to Financial Statements. | ||
| 8 |
www.gkefund.com |
Table of Contents
| GKE Asian Opportunities Fund | Portfolio of Investments | |
September 30, 2014 |
| Value | ||||||||
| Shares | (Note 2) | |||||||
| ||||||||
FINANCIAL (18.78%) | ||||||||
Banks (6.96%) | ||||||||
BDO Unibank, Inc. | 92,930 | $ | 203,037 | |||||
Metropolitan Bank & Trust | 103,110 | 199,431 | ||||||
Resona Holdings, Inc. | 41,900 | 236,252 | ||||||
Shinsei Bank Ltd. | 15,000 | 32,140 | ||||||
Sumitomo Mitsui Financial Group, Inc. | 2,900 | 118,221 | ||||||
|
| |||||||
| 789,081 | ||||||||
|
| |||||||
Diversified Financial Services (2.44%) | ||||||||
China Galaxy Securities Co. Ltd. | 81,500 | 56,784 | ||||||
CITIC Securities Co. Ltd. | 24,500 | 56,479 | ||||||
Daiwa Securities Group, Inc. | 16,000 | 126,760 | ||||||
ORIX Corp. | 2,700 | 37,247 | ||||||
|
| |||||||
| 277,270 | ||||||||
|
| |||||||
Insurance (2.88%) | ||||||||
AIA Group Ltd. | 53,800 | 278,186 | ||||||
Ping An Insurance Group Co. of China Ltd. | 6,500 | 48,803 | ||||||
|
| |||||||
| 326,989 | ||||||||
|
| |||||||
Real Estate (6.50%) | ||||||||
Cheung Kong Holdings Ltd. | 15,000 | 247,075 | ||||||
Megaworld Corp. | 2,923,000 | 327,618 | ||||||
Mitsui Fudosan Co. Ltd. | 1,000 | 30,632 | ||||||
Shimao Property Holdings Ltd. | 65,500 | 132,605 | ||||||
|
| |||||||
| 737,930 | ||||||||
|
| |||||||
TOTAL FINANCIAL | 2,131,270 | |||||||
|
| |||||||
INDUSTRIAL (8.93%) | ||||||||
Building Materials (1.63%) | ||||||||
Anhui Conch Cement Co. Ltd. | 27,000 | 86,235 | ||||||
China Resources Cement Holdings Ltd. | 144,000 | 98,660 | ||||||
|
| |||||||
| 184,895 | ||||||||
|
| |||||||
Electrical Components & Equipment (1.05%) | ||||||||
Hitachi Ltd. | 12,000 | 91,634 | ||||||
Nidec Corp. | 400 | 27,062 | ||||||
|
| |||||||
| 118,696 | ||||||||
|
| |||||||
| See Notes to Financial Statements. | ||
Annual Report | September 30, 2014 | 9 |
Table of Contents
| GKE Asian Opportunities Fund | Portfolio of Investments | |
September 30, 2014 |
| Value | ||||||||
| Shares | (Note 2) | |||||||
| ||||||||
INDUSTRIAL (continued) | ||||||||
Electronics (1.43%) | ||||||||
LG Display Co. Ltd.(a) | 2,061 | $ | 66,405 | |||||
Murata Manufacturing Co. Ltd. | 400 | 45,480 | ||||||
Omron Corp. | 1,100 | 49,948 | ||||||
|
| |||||||
| 161,833 | ||||||||
|
| |||||||
Engineering & Construction (1.48%) | ||||||||
Cheung Kong Infrastructure Holdings Ltd. | 24,000 | 168,451 | ||||||
|
| |||||||
Hand & Machine Tools (0.35%) | ||||||||
THK Co. Ltd. | 1,600 | 39,827 | ||||||
|
| |||||||
Machinery - Construction & Mining (1.88%) | ||||||||
Mitsubishi Electric Corp. | 16,000 | 213,066 | ||||||
|
| |||||||
Machinery-Diversified (1.11%) | ||||||||
FANUC Corp. | 700 | 126,437 | ||||||
|
| |||||||
TOTAL INDUSTRIAL | 1,013,205 | |||||||
|
| |||||||
TECHNOLOGY (0.03%) | ||||||||
Semiconductors (0.03%) | ||||||||
Samsung Electronics Co. Ltd. | 3 | 3,366 | ||||||
|
| |||||||
TOTAL TECHNOLOGY | 3,366 | |||||||
|
| |||||||
UTILITIES (8.28%) | ||||||||
Electric (5.50%) | ||||||||
China Resources Power Holdings Co. Ltd. | 24,000 | 64,753 | ||||||
Huadian Fuxin Energy Corp. Ltd. | 526,000 | 308,222 | ||||||
Huaneng Power International, Inc. | 144,000 | 157,263 | ||||||
Huaneng Renewables Corp. Ltd. | 284,000 | 93,266 | ||||||
|
| |||||||
| 623,504 | ||||||||
|
| |||||||
See Notes to Financial Statements. | ||
10 |
www.gkefund.com |
Table of Contents
| GKE Asian Opportunities Fund | Portfolio of Investments | |
September 30, 2014 |
| Value | ||||||||
| Shares | (Note 2) | |||||||
| ||||||||
UTILITIES (continued) | ||||||||
Water (2.78%) | ||||||||
Guangdong Investment Ltd. | 270,000 | $ | 315,383 | |||||
|
| |||||||
TOTAL UTILITIES | 938,887 | |||||||
|
| |||||||
TOTAL COMMON STOCKS (Cost $5,790,836) | 5,973,570 | |||||||
|
| |||||||
PARTICIPATION NOTES (12.15%) | ||||||||
CONSUMER, NON-CYCLICAL (0.36%) | ||||||||
Agriculture (0.36%) | ||||||||
ITC Limited, (Loan Participation Notes issued by Citigroup Global Markets Holdings Inc.),(a) expiring 02/27/2015 | 6,755 | 40,490 | ||||||
|
| |||||||
TOTAL CONSUMER, NON-CYCLICAL | 40,490 | |||||||
|
| |||||||
FINANCIAL (2.34%) | ||||||||
Banks (2.34%) | ||||||||
Axis Bank Ltd., (Loan Participation Notes issued by Citigroup Global Markets Holdings Inc.), expiring 02/27/2015 | 3,691 | 22,573 | ||||||
Yes Bank Ltd, (Loan Participation Notes issued by Citigroup Global Markets Holdings Inc.), expiring 02/27/2015 | 26,885 | 243,275 | ||||||
|
| |||||||
| 265,848 | ||||||||
|
| |||||||
TOTAL FINANCIAL | 265,848 | |||||||
|
| |||||||
INDUSTRIAL (3.01%) | ||||||||
Electrical Components & Equipment (0.22%) | ||||||||
Delta Electronics, (Loan Participation Notes issued by Citigroup Global Markets Holdings | 4,000 | 25,247 | ||||||
|
| |||||||
Electronics (2.06%) | ||||||||
Hon Hai Precision Co, (Loan Participation Notes issued by Citigroup Global Markets Holdings Inc.), expiring 01/17/2017 | 73,920 | 233,282 | ||||||
|
| |||||||
| See Notes to Financial Statements. | ||
Annual Report | September 30, 2014 | 11 |
Table of Contents
| GKE Asian Opportunities Fund | Portfolio of Investments | |
September 30, 2014 |
| Value | ||||||||
| Shares | (Note 2) | |||||||
| ||||||||
INDUSTRIAL (continued) | ||||||||
Metal Fabrication & Hardware (0.73%) | ||||||||
Catcher Technology, (Loan Participation Notes issued by Citigroup Global Markets Holdings Inc.),(a) expiring 01/20/2015 | 9,000 | $ | 83,433 | |||||
|
| |||||||
TOTAL INDUSTRIAL | 341,962 | |||||||
|
| |||||||
TECHNOLOGY (6.44%) | ||||||||
Computers (2.25%) | ||||||||
Compal Electronics, (Loan Participation Notes issued by Citigroup Global Markets Holdings Inc.), expiring 01/17/2017 | 144,000 | 107,694 | ||||||
Tata Consultancy Services, (Loan Participation Notes issued by Citigroup Global Markets Holdings Inc.), expiring 02/27/2015 | 3,319 | 147,066 | ||||||
|
| |||||||
| 254,760 | ||||||||
|
| |||||||
Semiconductors (4.19%) | ||||||||
CHIPBOND Technology, (Loan Participation Notes issued by Merrill Lynch Intl & Co.), expiring 01/17/2019 | 13,000 | 23,804 | ||||||
Epistar Corp, (Loan Participation Notes issued by Citigroup Global Markets Holdings Inc.), expiring 01/17/2017 | 14,000 | 26,187 | ||||||
MediaTek Inc., (Loan Participation Notes issued by Citigroup Global Markets Holdings Inc.), expiring 01/20/2015 | 13,000 | 192,525 | ||||||
Taiwan Semiconductor, (Loan Participation Notes issued by Citigroup Global Markets Holdings Inc.), expiring 01/17/2017 | 59,000 | 232,745 | ||||||
|
| |||||||
| 475,261 | ||||||||
|
| |||||||
TOTAL TECHNOLOGY | 730,021 | |||||||
|
| |||||||
TOTAL PARTICIPATION NOTES (Cost $1,324,914) | 1,378,321 | |||||||
|
| |||||||
See Notes to Financial Statements. | ||
12 |
www.gkefund.com |
Table of Contents
| GKE Asian Opportunities Fund | Portfolio of Investments | |
September 30, 2014 |
| Currency | Principal Amount | Value (Note 2) | ||||||||||
| ||||||||||||
CORPORATE BONDS (9.30%) | ||||||||||||
COMMUNICATIONS (6.41%) | ||||||||||||
Telecommunications (6.41%) | ||||||||||||
Optus Finance Proprietary Ltd., Sr. Unsec. | AUD | $ | 800,000 | $ | 727,615 | |||||||
|
| |||||||||||
TOTAL COMMUNICATIONS | 727,615 | |||||||||||
|
| |||||||||||
FINANCIAL (2.89%) | ||||||||||||
Diversified Financial Services (2.89%) | ||||||||||||
Far East Horizon Ltd., Sr. Unsec. Notes | CNH | 2,000,000 | 327,794 | |||||||||
|
| |||||||||||
TOTAL FINANCIAL | 327,794 | |||||||||||
|
| |||||||||||
TOTAL CORPORATE BONDS (Cost $1,046,913) | 1,055,409 | |||||||||||
|
| |||||||||||
GOVERNMENT BONDS (13.05%) | ||||||||||||
Indonesia Government International Bond, | USD | 1,000,000 | 1,137,500 | |||||||||
New Zealand Government Bond, Sr. Unsec. | NZD | 400,000 | 342,664 | |||||||||
|
| |||||||||||
| 1,480,164 | ||||||||||||
|
| |||||||||||
TOTAL GOVERNMENT BONDS (Cost $1,484,012) | 1,480,164 | |||||||||||
|
| |||||||||||
7-Day Yield | Shares | Value (Note 2) | ||||||||||
| ||||||||||||
SHORT-TERM INVESTMENTS (4.81%) | ||||||||||||
MONEY MARKET FUND (4.81%) | ||||||||||||
Blackrock Liquidity Temporary Fund, Investor Class | 0.030% | 546,369 | 546,369 | |||||||||
| See Notes to Financial Statements. | ||
Annual Report | September 30, 2014 | 13 |
Table of Contents
| GKE Asian Opportunities Fund | Portfolio of Investments | |
September 30, 2014 |
7-Day Yield | Shares | Value (Note 2) | ||||||
| ||||||||
TOTAL SHORT-TERM INVESTMENTS | ||||||||
(Cost $546,369) | $ | 546,369 | ||||||
|
| |||||||
TOTAL INVESTMENTS (91.96%) (Cost $10,193,044) | 10,433,833 | |||||||
Other Assets In Excess Of Liabilities (8.04%) | 912,357(b) | |||||||
|
| |||||||
NET ASSETS (100.00%) | $ | 11,346,190 | ||||||
|
| |||||||
| (a) | Non-Income Producing Security. |
| (b) | Includes cash which is being held as collateral for futures contracts. |
Common Abbreviations:
Ltd. - Limited.
PT - Perseroan Terbatas, meaning “private limited”, which is the equivalent of an incorporated entity in the U.S.
SA - Societe Anonyme
Sr. - Senior.
Tbk - Terbuka is appended after the corporation name if the shares become publicly listed for trading.
Unsec. -Unsecured.
Currency Abbreviations:
AUD - Australian Dollar
CNH - People’s Republic of China Renminbi
JPY - Japanese Yen
NZD - New Zealand Dollar
For Fund compliance purposes, the Fund’s industry classifications refer to any one or more of the industry sub-classifications used by one or more widely recognized market indexes or ratings group indexes, and/or as defined by Fund management. This definition may not apply for purposes of this report, which may combine industry sub-classifications for reporting ease. Industries are shown as a percent of net assets. (unaudited)
See Notes to Financial Statements. | ||
14 |
www.gkefund.com |
Table of Contents
| GKE Asian Opportunities Fund | Portfolio of Investments | |
September 30, 2014 |
OUTSTANDING FORWARD FOREIGN CURRENCY CONTRACTS
Foreign Currency | Contracted Amount* | Purchase/Sale Contract | Settlement Date | Current Value | Unrealized Appreciation | |||||||||
| ||||||||||||||
AUD | 850,000 | Sale | 10/31/2014 | $ | 742,554 | $ | 1,536 | |||||||
JPY | 8,000,000 | Sale | 10/08/2014 | 72,947 | 3,287 | |||||||||
JPY | 55,000,000 | Sale | 10/20/2014 | 501,556 | 12,223 | |||||||||
JPY | 150,000,000 | Sale | 10/31/2014 | 1,367,969 | 8,430 | |||||||||
NZD | 450,000 | Sale | 10/15/2014 | 350,736 | 17,162 | |||||||||
|
| |||||||||||||
| $ | 42,638 | |||||||||||||
|
| |||||||||||||
| * | The contracted amount is stated in the currency in which the security is denominated. |
FUTURES CONTRACTS
| Description | Position | Contracts | Expiration Date | Underlying Face Amount at Value | Unrealized Appreciation/(Depreciation) | |||||||||||
| ||||||||||||||||
Hang Seng China Futures | Long | 3 | 10/31/14 | $ | 199,495 | $ | (6,428) | |||||||||
Nikkei 225 | Long | 13 | 12/12/14 | 955,368 | 12,534 | |||||||||||
|
| |||||||||||||||
| $ | 1,154,863 | $ | 6,106 | |||||||||||||
|
| |||||||||||||||
| See Notes to Financial Statements. | ||
Annual Report | September 30, 2014 | 15 |
Table of Contents
| GKE Asian Opportunities Fund | Statement of Assets and Liabilities | |
September 30, 2014 |
ASSETS: | ||||
Investments, at value (Cost $10,193,044) | $ | 10,433,833 | ||
Foreign currency, at value (Cost $718,067) | 716,133 | |||
Receivable for investments sold | 153,311 | |||
Deposit with broker for futures contracts (Note 3) | 100,000 | |||
Unrealized gain on forward foreign currency contracts | 42,638 | |||
Dividends and interest receivable | 51,344 | |||
Receivable from variation margin | 12,534 | |||
Receivable due from advisor | 3,943 | |||
Other assets | 14,823 | |||
|
| |||
Total assets | 11,528,559 | |||
|
| |||
LIABILITIES: | ||||
Payable for investments purchased | 101,269 | |||
Payable for variation margin (Note 3) | 6,428 | |||
Payable for administration fees | 26,286 | |||
Payable for transfer agency fees | 4,460 | |||
Payable to trustees | 129 | |||
Payable to Chief Compliance Officer | 1,666 | |||
Due to broker | 7,131 | |||
Legal fees payable | 8,691 | |||
Audit and tax fees payable | 18,100 | |||
Accrued expenses and other liabilities | 8,209 | |||
|
| |||
Total liabilities | 182,369 | |||
|
| |||
NET ASSETS | $ | 11,346,190 | ||
|
| |||
NET ASSETS CONSIST OF: | ||||
Paid-in capital (Note 6) | $ | 11,007,122 | ||
Accumulated net investment income | 190,724 | |||
Accumulated net realized loss on investments, futures contracts and foreign currency transactions | (138,318) | |||
Net unrealized appreciation on investments, futures contracts and translation of assets and liabilities denominated in foreign currencies | 286,662 | |||
|
| |||
NET ASSETS | $ | 11,346,190 | ||
|
| |||
PRICING OF SHARES: | ||||
Net Asset Value, offering and redemption price per share | $ | 10.69 | ||
Shares of beneficial interest outstanding | 1,060,963 | |||
See Notes to Financial Statements. | ||
16 |
www.gkefund.com |
Table of Contents
| GKE Asian Opportunities Fund | Statement of Operations | |
For the Year Ended September 30, 2014 |
INVESTMENT INCOME: | ||||
Dividends | $ | 178,766 | ||
Foreign taxes withheld | (12,181) | |||
Interest | 75,611 | |||
|
| |||
Total investment income | 242,196 | |||
|
| |||
EXPENSES: | ||||
Investment advisory fees (Note 7) | 156,659 | |||
Administrative fees | 96,779 | |||
Transfer agency fees | 33,886 | |||
Legal and audit fees | 37,067 | |||
Offering costs | 76,650 | |||
Registration fees | 11,416 | |||
Custodian fees | 47,516 | |||
Compliance fees | 19,973 | |||
Trustees’ fees and expenses | 11,995 | |||
Other expenses | 22,451 | |||
|
| |||
Total Expenses | 514,392 | |||
Less fees waived/reimbursed by investment adviser (Note 7) | (306,479) | |||
Less fees waived by Administrator (Note 7) | (18,877) | |||
|
| |||
Net Expenses | 189,036 | |||
|
| |||
NET INVESTMENT INCOME | 53,160 | |||
|
| |||
REALIZED AND UNREALIZED GAIN/(LOSS) ON INVESTMENTS: | ||||
Net realized gain/(loss) on: | ||||
Investments | (193,414) | |||
Futures contracts | 81,669 | |||
Foreign currency transactions | 80,854 | |||
|
| |||
Net realized loss | (30,891) | |||
|
| |||
Net Change in appreciation/(depreciation) on: | ||||
Investments | 171,422 | |||
Futures contracts | 12,772 | |||
Translation of assets and liabilities denominated in foreign currencies | 39,530 | |||
|
| |||
Net Change | 223,724 | |||
|
| |||
NET REALIZED AND UNREALIZED GAIN ON INVESTMENTS | 192,833 | |||
|
| |||
NET INCREASE IN NET ASSETS RESULTING FROM OPERATIONS | $ | 245,993 | ||
|
| |||
| See Notes to Financial Statements. | ||
Annual Report | September 30, 2014 | 17 |
Table of Contents
| GKE Asian Opportunities Fund | Statements of Changes in Net Assets | |
For the Year Ended | For the Period Ended September 30, 2013(a) | |||||||
| ||||||||
OPERATIONS: | ||||||||
Net investment income | $ | 53,160 | $ | 246 | ||||
Net realized gain/(loss) on investments, futures contracts and foreign currency transactions | (30,891) | 30,713 | ||||||
Net change in unrealized appreciation on investments, futures contracts and translation of assets and liabilities denominated in foreign currencies | 223,724 | 62,938 | ||||||
|
|
|
| |||||
Net increase in net assets resulting from operations | 245,993 | 93,897 | ||||||
|
|
|
| |||||
DISTRIBUTIONS: | ||||||||
From net investment income | (2,146) | – | ||||||
From net realized gains on investments | (40,567) | – | ||||||
|
|
|
| |||||
Net decrease in net assets from distributions | (42,713) | – | ||||||
|
|
|
| |||||
BENEFICIAL SHARE TRANSACTIONS (Note 6): | ||||||||
Shares sold | 9,797,904 | 2,390,000 | ||||||
Dividends reinvested | 29,943 | – | ||||||
Shares redeemed | (1,169,307) | – | ||||||
Redemption fees | 473 | – | ||||||
|
|
|
| |||||
Net increase from capital share transactions | 8,659,013 | 2,390,000 | ||||||
|
|
|
| |||||
Net increase in net assets | 8,862,293 | 2,483,897 | ||||||
|
|
|
| |||||
NET ASSETS: | ||||||||
Beginning of period | 2,483,897 | – | ||||||
|
|
|
| |||||
End of period (Including accumulated net investment income of $190,724 and $2,122) | $ | 11,346,190 | $ | 2,483,897 | ||||
|
|
|
| |||||
| (a) | Commenced operations on August 5, 2013. |
See Notes to Financial Statements. | ||
18 |
www.gkefund.com |
Table of Contents
| GKE Asian Opportunities Fund | Financial Highlights | |
For a share outstanding through the periods presented. |
| For the Year Ended September 30, 2014 | For the Period Ended | |||||||
| ||||||||
NET ASSET VALUE, BEGINNING OF PERIOD | $ | 10.38 | $ | 10.00 | ||||
INCOME/(LOSS) FROM OPERATIONS: | ||||||||
Net investment income(b) | 0.05 | 0.00(c) | ||||||
Net realized and unrealized gain on investments | 0.30 | 0.38 | ||||||
|
| |||||||
Total from investment operations | 0.35 | 0.38 | ||||||
|
| |||||||
LESS DISTRIBUTIONS: | ||||||||
From net investment income | (0.00)(c) | – | ||||||
From net realized gain on investments | (0.04) | – | ||||||
|
| |||||||
Total distributions | (0.04) | – | ||||||
|
| |||||||
REDEMPTION FEES (Note 6) | 0.00(c) | – | ||||||
|
| |||||||
NET INCREASE IN NET ASSET VALUE | 0.31 | 0.38 | ||||||
|
| |||||||
NET ASSET VALUE, END OF PERIOD | $ | 10.69 | $ | 10.38 | ||||
|
| |||||||
TOTAL RETURN(d) | 3.37% | 3.80% | ||||||
SUPPLEMENTAL DATA: | ||||||||
Net assets, end of period (000’s) | $ | 11,346 | $ | 2,484 | ||||
RATIOS TO AVERAGE NET ASSETS | ||||||||
Operating expenses excluding reimbursement/waiver | 4.93% | 23.95%(e) | ||||||
Operating expenses including reimbursement/waiver | 1.81% | 1.81%(e) | ||||||
Net investment income including reimbursement/waiver | 0.51% | 0.10%(e) | ||||||
PORTFOLIO TURNOVER RATE | 219% | 22%(f) | ||||||
| (a) | Commenced operations on August 5, 2013. |
| (b) | Per share amounts are based upon average shares outstanding. |
| (c) | Less than $0.005 per share. |
| (d) | Total returns are for the period indicated and have not been annualized. Total returns would have been lower had certain expenses not been reimbursed/waived during the period. Returns shown do not reflect the deduction of taxes that a shareholder would pay on Fund distributions or the redemption of Fund shares. |
| (e) | Annualized. |
| (f) | Not annualized. |
| See Notes to Financial Statements. | ||
Annual Report | September 30, 2014 | 19 |
Table of Contents
| GKE Asian Opportunities Fund | Notes to Financial Statements | |
September 30, 2014 |
1. ORGANIZATION
ALPS Series Trust (the “Trust”), a Delaware statutory trust, is an open-end management investment company registered under the Investment Company Act of 1940 (the “1940 Act”). As of September 30, 2014, the Trust had nine registered funds. This annual report describes the GKE Asian Opportunities Fund (the “Fund”). The Fund’s primary investment objective is to achieve capital appreciation through asset allocation among equities, currencies and bonds of the Asia-Pacific region. The Fund currently offers Institutional Class shares. The Board of Trustees (the “Board”) may establish additional funds and classes of shares at any time in the future without shareholder approval.
2. SIGNIFICANT ACCOUNTING POLICIES
The accompanying financial statements were prepared in accordance with accounting principles generally accepted in the United States of America for investment companies (“U.S. GAAP”). The fund is considered an investment company for financial reporting purposes. The preparation of financial statements in conformity with U.S. GAAP requires management to make certain estimates and assumptions that affect the reported amounts of assets and liabilities and disclosures of contingent assets and liabilities at the date of the financial statements and the reported amounts of revenue and expenses during the period. Actual results could differ from those estimates. The following is a summary of significant accounting policies consistently followed by the Fund in preparation of the financial statements.
Investment Valuation: The Fund generally values its securities based on market prices determined at the close of regular trading on the New York Stock Exchange (“NYSE”), normally 4:00 p.m. Eastern Time, on each day the NYSE is open for trading.
For equity securities and mutual funds that are traded on an exchange, the market price is usually the closing sale or official closing price on that exchange. In the case of equity securities not traded on an exchange, or if such closing prices are not otherwise available, the securities are valued at the mean of the most recent bid and ask prices on such day.
Equity securities that are primarily traded on foreign securities exchanges are valued at the closing values of such securities on their respective foreign exchanges, except when an event occurs subsequent to the close of the foreign exchange and the close of the NYSE that was likely to have changed such value. In such an event, the fair values of those securities are determined in good faith through consideration of other factors in accordance with procedures established by and under the general supervision of the Board. The Fund will use a fair valuation model provided by an independent pricing service, which is intended to reflect fair value when a security’s value or a meaningful portion of the Fund’s portfolio is believed to have been materially affected by a valuation event that has occurred between the close of the exchange or market on which the security is traded and the close of the regular trading day on the NYSE.
The market price for debt obligations is generally the price supplied by an independent third-party pricing service approved by the Board, which may use a matrix, formula or other objective method that takes into consideration quotations from dealers, market transactions in comparable
20 |
www.gkefund.com |
Table of Contents
| GKE Asian Opportunities Fund | Notes to Financial Statements | |
September 30, 2014 |
investments, market indices and yield curves. If vendors are unable to supply a price, or if the price supplied is deemed to be unreliable, the market price may be determined using quotations received from one or more broker dealers that make a market in the security. Short term debt obligations that will mature in 60 days or less are valued at amortized cost; unless it is determined that using this method would not reflect an investment’s fair value. Investments in non-exchange traded funds are fair valued at their respective net asset values.
Redeemable securities issued by open-end registered investment companies are valued at the investment company’s applicable net asset value, with the exception of exchange-traded open-end investment companies, which are priced as equity securities.
Futures contracts that are listed or traded on a national securities exchange, commodities exchange, contract market or comparable over the counter market, and that are freely transferable, are valued at their closing settlement price on the exchange on which they are primarily traded or based upon the current settlement price for a like instrument acquired on the day on which the instrument is being valued. A settlement price may not be used if the market makes a limit move with respect to a particular commodity.
Forward foreign currency contracts have a market value determined by the prevailing foreign currency exchange daily rates and current foreign currency exchange forward rates. The foreign currency exchange forward rates are calculated using an automated system that estimates rates on the basis of the current day foreign currency exchange rates and forward foreign currency exchange rates supplied by a pricing service. Foreign exchange rates and forward foreign currency exchange rates may generally be obtained at the close of the NYSE, normally 4:00 p.m. Eastern Time.
When such prices or quotations are not available, or when the fair value committee appointed by the Board believes that they are unreliable, securities may be priced using fair value procedures approved by the Board.
Fair Value Measurements: The Fund discloses the classification of its fair value measurements following a three-tier hierarchy based on the inputs used to measure fair value. Inputs refer broadly to the assumptions that market participants would use in pricing the asset or liability, including assumptions about risk. Inputs may be observable or unobservable. Observable inputs reflect the assumptions market participants would use in pricing the asset or liability that are developed based on market data obtained from sources independent of the reporting entity. Unobservable inputs reflect the reporting entity’s own assumptions about the assumptions market participants would use in pricing the asset or liability that are developed based on the best information available.
Various inputs are used in determining the value of the Fund’s investments as of the end of the reporting period. When inputs used fall into different levels of the fair value hierarchy, the level in the hierarchy within which the fair value measurement falls is determined based on the lowest level input that is significant to the fair value measurement in its entirety. The designated input levels are not necessarily an indication of the risk or liquidity associated with these investments. These inputs are categorized in the following hierarchy under applicable financial accounting standards:
Annual Report | September 30, 2014 | 21 |
Table of Contents
| GKE Asian Opportunities Fund | Notes to Financial Statements | |
September 30, 2014 |
Level 1 | – | Unadjusted quoted prices in active markets for identical investments, unrestricted assets or liabilities that the Fund has the ability to access at the measurement date; | ||||
Level 2 | – | Quoted prices which are not active, quoted prices for similar assets or liabilities in active markets or inputs other than quoted prices that are observable (either directly or indirectly) for substantially the full term of the asset or liability; and | ||||
Level 3 | – | Significant unobservable prices or inputs (including the Fund’s own assumptions in determining the fair value of investments) where there is little or no market activity for the asset or liability at the measurement date. |
The following is a summary of the inputs used to value the Fund’s investments as of September 30, 2014:
| Investments in Securities at Value | Level 1 - Unadjusted Quoted Prices | Level 2 - Other Observable Inputs | Level 3 - Unobservable | Total | ||||||||||||
| ||||||||||||||||
Common Stocks | ||||||||||||||||
Basic Materials | $ | 125,218 | $ | – | $ | – | $ | 125,218 | ||||||||
Communications | 341,209 | – | – | 341,209 | ||||||||||||
Consumer, Cyclical | 872,688 | – | – | 872,688 | ||||||||||||
Consumer, Non-cyclical | 403,060 | – | – | 403,060 | ||||||||||||
Energy | 144,667 | – | – | 144,667 | ||||||||||||
Financial | 2,131,270 | – | – | 2,131,270 | ||||||||||||
Industrial | 1,013,205 | – | – | 1,013,205 | ||||||||||||
Technology | 3,366 | – | – | 3,366 | ||||||||||||
Utilities | 938,887 | – | – | 938,887 | ||||||||||||
Participation Notes | ||||||||||||||||
Consumer, Non-cyclical | – | 40,490 | – | 40,490 | ||||||||||||
Financial | – | 265,848 | – | 265,848 | ||||||||||||
Industrial | – | 341,962 | – | 341,962 | ||||||||||||
Technology | – | 730,021 | – | 730,021 | ||||||||||||
Corporate Bonds | ||||||||||||||||
Communications | – | 727,615 | – | 727,615 | ||||||||||||
Financial | – | 327,794 | – | 327,794 | ||||||||||||
Government Bonds | – | 1,480,164 | – | 1,480,164 | ||||||||||||
Short-term Investments | 546,369 | – | – | 546,369 | ||||||||||||
| ||||||||||||||||
TOTAL | $ | 6,519,939 | $ | 3,913,894 | $ | – | $ | 10,433,833 | ||||||||
| ||||||||||||||||
| Valuation Inputs | ||||||||||||||||
| Other Financial Instruments | Level 1 | Level 2 | Level 3 | Total | ||||||||||||
| ||||||||||||||||
Assets | ||||||||||||||||
Forward Foreign Currency | ||||||||||||||||
Contracts | $ | – | $ | 42,638 | $ | – | $ | 42,638 | ||||||||
Futures Contracts | 12,534 | – | – | 12,534 | ||||||||||||
Liabilities | ||||||||||||||||
Futures Contracts | $ | (6,428) | $ | – | $ | – | $ | (6,428) | ||||||||
| ||||||||||||||||
TOTAL | $ | 6,106 | $ | 42,638 | $ | – | $ | 48,744 | ||||||||
| ||||||||||||||||
22 |
www.gkefund.com |
Table of Contents
| GKE Asian Opportunities Fund | Notes to Financial Statements | |
September 30, 2014 |
The Fund recognizes transfers between levels as of the end of the fiscal year. For the fiscal year ended September 30, 2014, the Fund did not have any transfers between Level 1 and Level 2 securities. There were no Level 3 securities held during the period.
Offering Costs: The Fund incurred offering costs during the fiscal year ended September 30, 2014. These offering costs, including fees for printing initial prospectuses, legal and registration fees, are being amortized over the first twelve months from the inception date of the Fund. Amounts amortized through September 30, 2014 are shown on the Fund’s Statement of Operations and amounts that remain to be amortized are shown on the Fund’s Statement of Assets and Liabilities.
Trust Expenses: Some expenses of the Trust can be directly attributed to the Fund. Expenses which cannot be directly attributed to the Fund are apportioned among all funds in the Trust based on average net assets of each fund.
Federal Income Taxes: The Fund complies with the requirements under Subchapter M of the Internal Revenue Code of 1986 applicable to regulated investment companies and intends to distribute substantially all of its net taxable income and net capital gains, if any, each year so that it will not be subject to excise tax on undistributed income and gains. The Fund is not subject to income taxes to the extent such distributions are made.
As of and during the fiscal year ended September 30, 2014, the Fund did not have a liability for any unrecognized tax benefits in the accompanying financial statements. The Fund files U.S. federal, state and local income tax returns as required. The Fund’s tax returns are subject to examination by the relevant tax authorities until expiration of the applicable statute of limitations, which is generally three years after the filing of the tax return for federal purposes and four years for most state returns. The Fund’s Administrator has analyzed the Fund’s tax positions taken on federal and state income tax returns for all open tax years and has concluded that as of September 30, 2014, no provision for income tax is required in the Fund’s financial statements related to these tax positions.
Investment Transactions and Investment Income: Investment transactions are accounted for on the date the investments are purchased or sold (trade date basis). Realized gains and losses from investment transactions are reported on an identified cost basis. Interest income, which includes accretion of discounts and amortization of premiums, is accrued and recorded as earned. Dividend income is recognized on the ex-dividend date, or for certain foreign securities, as soon as information is available to the Fund.
Foreign Securities: The Fund may directly purchase securities of foreign issuers. Investing in securities of foreign issuers involves special risks not typically associated with investing in securities of U.S. issuers. The risks include possible reevaluation of currencies, the inability to repatriate foreign currency, less complete financial information about companies and possible future adverse political and economic developments. Moreover, securities of many foreign issuers and their markets may be less liquid and their prices more volatile than those of securities of comparable U.S. issuers.
Annual Report | September 30, 2014 | 23 |
Table of Contents
| GKE Asian Opportunities Fund | Notes to Financial Statements | |
September 30, 2014 |
Foreign Currency Translation: The books and records of the Fund are maintained in U.S. dollars. Investment valuations and other assets and liabilities initially expressed in foreign currencies are converted each business day into U.S. dollars based upon current exchange rates. The portion of realized and unrealized gains or losses on investments due to fluctuations in foreign currency exchange rates is not separately disclosed and is included in realized and unrealized gains or losses on investments, when applicable.
Foreign Exchange Transactions: The Fund may enter into foreign currency spot contracts to facilitate transactions in foreign securities or to convert foreign currency receipts into U.S. dollars. A foreign currency spot contract is an agreement between two parties to buy and sell currencies at the current market rate, for settlement generally within two business days. The U.S. dollar value of the contracts is determined using current currency exchange rates supplied by a pricing service. The contract is marked-to-market daily for settlements beyond one day and any change in market value is recorded as an unrealized gain or loss. When the contract is closed, the Fund records a realized gain or loss equal to the difference between the value on the open and close date. Losses may arise from changes in the value of the foreign currency, or if the counterparties do not perform under the contract’s terms. The maximum potential loss from such contracts is the aggregate face value in U.S. dollars at the time the contract was opened.
Distributions to Shareholders: The Fund normally pays dividends and distributes capital gains, if any, on an annual basis. Income dividend distributions are derived from interest and other income the Fund receives from its investments, including distributions of short term capital gains. Long term capital gain distributions are derived from gains realized when the Fund sells a security it has owned for more than one year. The Fund may make additional distributions and dividends at other times if its portfolio manager or managers believe doing so may be necessary for the Fund to avoid or reduce taxes. Net investment income/(loss) and net realized gain/(loss) may differ for financial statement and tax purposes.
3. DERIVATIVE INSTRUMENTS
The Fund’s investment objective permits the Fund to enter into various types of derivatives contracts, including, but not limited to, futures contracts, forward foreign currency contracts, currency swaps and purchased and written options. In doing so, the Fund will employ strategies in differing combinations to permit it to increase, decrease, or change the level or types of exposure to market factors. Central to those strategies are features inherent in derivatives that make them more attractive for this purpose than equity or debt securities; they require little or no initial cash investment, they can focus exposure on only certain selected risk factors, and they may not require the ultimate receipt or delivery of the underlying security (or securities) to the contract. This may allow the Fund to pursue its objectives more quickly and efficiently than if it were to make direct purchases or sales of securities capable of affecting a similar response to market factors.
Risk of Investing in Derivatives: The Fund’s use of derivatives can result in losses due to unanticipated changes in the market risk factors and the overall market. In instances where the Fund is using derivatives to decrease, or hedge, exposures to market risk factors for securities held by the Fund, there are also risks that those derivatives may not perform as expected resulting in losses for the combined or hedged positions.
24 |
www.gkefund.com |
Table of Contents
| GKE Asian Opportunities Fund | Notes to Financial Statements | |
September 30, 2014 |
Derivatives may have little or no initial cash investment relative to their market value exposure and therefore can produce significant gains or losses in excess of their cost. This use of embedded leverage allows the Fund to increase its market value exposure relative to its net assets and can substantially increase the volatility of the Fund’s performance.
Additional associated risks from investing in derivatives also exist and potentially could have significant effects on the valuation of the derivative and the Fund. Typically, the associated risks are not the risks that the Fund is attempting to increase or decrease exposure to, per its investment objective, but are the additional risks from investing in derivatives.
Examples of these associated risks are liquidity risk, which is the risk that the Fund will not be able to sell or close out the derivative in a timely manner, and counterparty credit risk, which is the risk that the counterparty will not fulfill its obligation to the Fund. In addition, use of derivatives may increase or decrease exposure to the following risk factors:
Equity Risk: Equity risk relates to the change in value of equity securities as they relate to increases or decreases in the general market. Associated risks can be different for each type of derivative and are discussed by each derivative type in the notes that follow.
Foreign Currency Risk: Currency trading involves significant risks, including market risk, interest rate risk, country risk, counterparty credit risk and short sale risk. Market risk results from the price movement of foreign currency values in response to shifting market supply and demand.
Forward Foreign Currency Contracts: The Fund invests in foreign currency exchange contracts to reduce the risks of fluctuating exchange rates and to generate returns uncorrelated to the other strategies employed. A forward foreign currency exchange contract involves an obligation to purchase or sell a specific currency at a future date, which may be a fixed number of days from the date of the contract agreed upon by the parties, at a price set at the time of the contract. By entering into a forward foreign currency exchange contract, the Fund “locks in” the exchange rate between the currency it will deliver and the currency it will receive for the duration of the contract. As a result, the Fund reduces its exposure to changes in the value of the currency it will deliver and increases its exposure to changes in the value of the currency it will exchange into. The Fund may enter into these contracts for the purpose of hedging against foreign exchange risk arising from the Fund’s investment or anticipated investment in securities denominated in foreign currencies. The Fund also may enter into these contracts for purposes of increasing exposure to a foreign currency or to shift exposure to foreign currency fluctuations from one country to another. The Fund may use one currency (or a basket of currencies) to hedge against adverse changes in the value of another currency (or a basket of currencies) when exchange rates between the two currencies are positively correlated. The unrealized appreciation/(depreciation) is reported in the Statement of Assets and Liabilities as receivable or payable and in the Statement of Operations within the change in unrealized appreciation/(depreciation). At contract close, the difference between the original cost of the contract and the value at the close date is recorded as a realized gain/(loss) in the Statement of Operations. As of September 30, 2014, the Fund held forward foreign currency contracts with net unrealized appreciation of $42,638.
Annual Report | September 30, 2014 | 25 |
Table of Contents
| GKE Asian Opportunities Fund | Notes to Financial Statements | |
September 30, 2014 |
Futures: The Fund may invest in futures contracts in accordance with its investment objectives. The Fund does so for a variety of reasons including for cash management, hedging or non-hedging purposes in an attempt to achieve investment returns consistent with the Fund’s investment objective. A futures contract provides for the future sale by one party and purchase by another party of a specified quantity of the security or other financial instrument at a specified price and time. A futures contract on an index is an agreement pursuant to which two parties agree to take or make delivery of an amount of cash equal to the difference between the value of the index at the close of the last trading day of the contract and the price at which the index contract was originally written. Futures transactions may result in losses in excess of the amount invested in the futures contract. There can be no guarantee that there will be a correlation between price movements in the hedging vehicle and in the portfolio securities being hedged. An incorrect correlation could result in a loss on both the hedged securities in a Fund and the hedging vehicle so that the portfolio return might have been greater had hedging not been attempted. There can be no assurance that a liquid market will exist at a time when a Fund seeks to close out a futures contract or a futures option position. Lack of a liquid market for any reason may prevent a Fund from liquidating an unfavorable position, and the Fund would remain obligated to meet margin requirements until the position is closed. In addition, a Fund could be exposed to risk if the counterparties to the contracts are unable to meet the terms of their contracts. With exchange traded futures, there is minimal counterparty credit risk to the Fund since futures are exchange traded and the exchange’s clearinghouse, as counterparty to all exchange traded futures, guarantees the futures against default. When a purchase or sale of a futures contract is made by a Fund, the Fund is required to deposit with its custodian (or broker, if legally permitted) a specified amount of liquid assets (“initial margin”). The margin required for a futures contract is set by the exchange on which the contract is traded and may be modified during the term of the contract. The initial margin is in the nature of a performance bond or good faith deposit on the futures contract that is returned to a Fund upon termination of the contract, assuming all contractual obligations have been satisfied. Each day a Fund may pay or receive cash, called “variation margin,” equal to the daily change in value of the futures contract. Such payments or receipts are recorded for financial statement purposes as unrealized gains or losses by a Fund. Variation margin does not represent a borrowing or loan by a Fund but is instead a settlement between a Fund and the broker of the amount one would owe the other if the futures contract expired. When the contract is closed, a Fund records a realized gain or loss equal to the difference between the value of the contract at the time it was opened and the value at the time it was closed. As of September 30, 2014, the Fund had futures contracts outstanding with net unrealized appreciation of $6,106. The number of futures contracts held at September 30, 2014, as disclosed in the Portfolio of Investments, is representative of futures contracts activity during the fiscal year ended September 30, 2014.
Derivative Instruments: The following tables disclose the amounts related to the Fund’s use of derivative instruments.
26 |
www.gkefund.com |
Table of Contents
| GKE Asian Opportunities Fund | Notes to Financial Statements | |
September 30, 2014 |
The effect of derivative instruments on the Statement of Assets and Liabilities as of September 30, 2014:
Derivatives Not Accounted for As Hedging Instruments | Asset Derivatives and Liabilities Location | Fair Value | Liability Derivatives Assets and Liabilities Location | Fair Value | ||||||
| ||||||||||
Foreign Exchange Contracts (Forward foreign currency contracts) | Unrealized gain on forward foreign currency contracts | $ 42,638 | Unrealized loss on forward foreign currency contracts | $ | – | |||||
Equity Contracts (Futures contracts) | Receivable from variation margin | 12,534 | Payable for variation margin | 6,428 | ||||||
| ||||||||||
Total | $ 55,172 | $ | 6,428 | |||||||
| ||||||||||
The effect of derivative instruments on the Statement of Operations for the fiscal year ended September 30, 2014:
Derivatives Not Accounted for As Hedging Instruments | Location of Gains/(Losses) On Derivatives Recognized in Income | Realized Gain/(Loss) On Derivatives Recognized | Change in Unrealized Gain/(Loss) on Derivatives Recognized | |||||||
| ||||||||||
Foreign Exchange Contracts (Forward foreign currency contracts) | Net realized gain/(loss) on: Foreign currency transactions /Net Change in appreciation/(depreciation) on: Translation of assets and liabilities denominated in foreign currencies | $ | 27,683 | $ | 41,381 | |||||
Equity Contracts (Futures contracts) | Net realized gain/(loss) on: Futures contracts / Net Change in appreciation/(depreciation) on: Futures contracts | 81,669 | 12,772 | |||||||
| ||||||||||
Total | $ | 109,352 | $ | 54,153 | ||||||
| ||||||||||
4. TAX BASIS INFORMATION
Tax Basis of Distributions to Shareholders: The character of distributions made during the period from net investment income or net realized gains may differ from its ultimate characterization for federal income tax purposes. Also, due to the timing of dividend distributions, the fiscal year in which amounts are distributed may differ from the fiscal year in which the income or realized gain were recorded by the Fund.
Annual Report | September 30, 2014 | 27 |
Table of Contents
| GKE Asian Opportunities Fund | Notes to Financial Statements | |
September 30, 2014 |
| Long-Term Capital | ||||||||||||
| Ordinary Income | Gain | |||||||||||
| ||||||||||||
| $ | 42,713 | $ | – | |||||||||
Reclassifications: As of September 30, 2014, permanent differences in book and tax accounting were reclassified. The following reclassifications, which had no impact on results of operations or net assets, were recorded to reflect tax character:
| Accumulated Net | ||||||||||||||||||
| Accumulated Net | Realized Loss on | |||||||||||||||||
| Paid-in Capital | Investment Income | Investments | ||||||||||||||||
| ||||||||||||||||||
| $ | (40,885) | $ | 137,588 | $ | (96,703) | |||||||||||||
These differences are primarily attributed to the different tax treatment of foreign currency and organizational costs.
Unrealized Appreciation and Depreciation on Investments: As of September 30, 2014, the aggregate cost of investments, gross unrealized appreciation/(depreciation) and net unrealized appreciation for Federal tax purposes were as follows:
Gross unrealized appreciation (excess of value over tax cost) | $ | 483,071 | ||
Gross unrealized depreciation (excess of tax cost over value) | (269,372) | |||
Net appreciation of foreign currency and derivatives | 45,873 | |||
| ||||
Net unrealized appreciation | $ | 259,572 | ||
| ||||
Cost of investments for income tax purposes | $ | 10,220,134 | ||
| ||||
Components of Distributable Earnings: At September 30, 2014, components of distributable earnings were as follows:
Undistributed ordinary income | $ | 233,361 | ||
Accumulated capital losses | (111,228) | |||
Net unrealized appreciation on investments, futures contracts, forward foreign currency contracts and foreign currency | 259,572 | |||
Other cumulative effect of timing differences | (42,637) | |||
| ||||
Total | $ | 339,068 | ||
| ||||
Capital Losses: As of September 30, 2014, the Fund had no accumulated capital loss carryforwards.
The fund elect to defer to the period ending September 30, 2015, capital losses recognized during the period November 1, 2013 to September 30, 2014 in the amount of:
| Amount | ||||
| $ (111,228) |
28 |
www.gkefund.com |
Table of Contents
| GKE Asian Opportunities Fund | Notes to Financial Statements | |
September 30, 2014 |
5. SECURITIES TRANSACTIONS
Purchases and sales of securities, excluding short-term securities, during the fiscal year ended September 30, 2014 were as follows:
| Proceeds from Sales of | ||||
| Purchases of Securities | Securities | |||
| ||||
| $ 27,522,671 | $ 19,427,497 | |||
6. BENEFICIAL SHARE TRANSACTIONS
The capitalization of the Trust consists of an unlimited number of shares of beneficial interest with no par value per share. Holders of the shares of the Fund have one vote for each share held and a proportionate fraction of a vote for each fractional share. All shares issued and outstanding are fully paid and are non-assessable, transferable and redeemable at the option of the shareholder. Shares have no pre-emptive rights.
Shares redeemed within 45 calendar days of purchase may incur a 2% short-term redemption fee deducted from the redemption amount. For the fiscal year ended September 30, 2014, the redemption fees charged by the Fund are presented in the Statements of Changes in Net Assets.
| For the Year Ended September 30, 2014 | For the Period Ended | |||||||
| ||||||||
Shares Sold | 932,878 | 239,213 | ||||||
Shares issued in reinvestment of distributions to shareholders | 2,862 | – | ||||||
Shares Redeemed | (113,990) | – | ||||||
| ||||||||
Net increase from share transactions | 821,750 | 239,213 | ||||||
| ||||||||
| (a) | Commenced operations on August 5, 2013. |
Control is defined by the 1940 Act as the beneficial ownership, either directly or through one or more controlled companies, of more than 25% of the voting securities of a company. Approximately 98% of the shares outstanding are held within two omnibus accounts. Investment activities of these shareholders could have a material impact on the Fund.
7. MANAGEMENT AND RELATED PARTY TRANSACTIONS
Investment Advisory: Evergreen Capital Management, LLC (“Evergreen Capital” or the “Adviser”), subject to the authority of the Board, is responsible for the overall management and administration of the Fund’s business affairs. The Adviser has delegated daily management of the Fund to GaveKal Capital Limited (the “Sub-Adviser”). The Sub-Adviser manages the investments of the Fund in accordance with the Fund’s investment objective, policies and limitations and investment guidelines established by the Adviser and the Board.
Annual Report | September 30, 2014 | 29 |
Table of Contents
| GKE Asian Opportunities Fund | Notes to Financial Statements | |
September 30, 2014 |
Pursuant to the Investment Advisory Agreement with the Adviser (the “Advisory Agreement”), the Fund pays the Adviser an annual management fee of 1.50% based on the Fund’s average daily net assets, computed daily and payable monthly. Pursuant to an Investment Sub-Advisory Agreement (the “Sub-Advisor” Agreement) with the Sub-Adviser, the Adviser pays the Sub-Adviser an annual sub-advisory management fee of 0.825% based on the Fund’s average daily net assets, computed daily and payable monthly. The Adviser is required to pay all fees due to the Sub-Adviser out of the management fee the Adviser receives from the Fund. The initial term for both the Advisory Agreement and the Sub-Advisory Agreement is two years. The Board may extend the Advisory Agreement and/or the Sub-Advisory Agreement for additional one-year terms. The Board, shareholders of the Fund or the Adviser may terminate the Advisory Agreement or the Sub- Advisory Agreement upon 60 days’ notice.
Pursuant to a fee waiver letter agreement (the “Fee Waiver Agreement”), the Adviser has contractually agreed through January 31, 2016 to waive and/or reimburse fees or expenses in order to limit the Total Annual Fund Operating Expenses After Fee Waiver/Expense reimbursement to 1.81% of the Fund’s average daily net assets for the Institutional Class Shares. The obligation excludes brokerage expenses, interest expenses, taxes and extraordinary expenses. The Fee Waiver Agreement is in effect through January 31, 2016 and may not be terminated or modified prior to this date except with the approval of the Fund’s Board. The Adviser will be permitted to recover expenses it has borne through the Fee Waiver Agreement to the extent that the Fund’s expenses in later periods fall below the annual rates set forth in the Fee Waiver Agreement. The Fund will not be obligated to pay any such deferred fees and expenses more than three years after the end of the fiscal year(s) in which the fees and expenses were deferred.
For the fiscal year ended September 30, 2014, the fee waivers and/or reimbursements were $306,479.
As of September 30, 2014, the balance of recoupable expenses was $360,125, of which $53,646 expires in 2016 and $306,479 expires in 2017.
Administrator: ALPS Fund Services, Inc. (“ALPS”) (an affiliate of ALPS Distributors, Inc.) serves as administrator to the Fund. The Fund has agreed to pay expenses incurred in connection with its administrative activities. Pursuant to the Administration, Bookkeeping and Pricing Services Agreement with the Trust, ALPS will provide operational services to the Fund including, but not limited to, fund accounting and fund administration and generally assist in the Fund’s operations.
The Fund’s administration fee is accrued on a daily basis and paid on a monthly basis following the end of the month, based on the greater of (a) an annual total fee of $66,000 in year 1 of operations and $125,000 in year 2; or (b) the following basis point fee schedule:
| Average Total Net Assets | Contractual Fee | |
| ||
Between $0-$250M | 0.10% | |
| ||
$250M-$500M | 0.07% | |
| ||
Above $500M | 0.03% | |
Annually thereafter, the parties agree to reevaluate the compensation paid under the agreement by the Trust on behalf of the fund to ALPS for the services it performs for the Fund.
30 |
www.gkefund.com |
Table of Contents
| GKE Asian Opportunities Fund | Notes to Financial Statements | |
September 30, 2014 |
ALPS is reimbursed by the Fund for certain out-of-pocket expenses. ALPS has agreed to reimburse the Fund for expenses relating to insurance and certain routine legal services for the fiscal period ended September 30, 2014.
Transfer Agent: ALPS serves as transfer agent for the Fund under a Transfer Agency and Services Agreement with the Trust. Under this agreement, ALPS is paid an annual base fee of $20,000 for services performed on behalf of the Fund plus fees for open accounts and is reimbursed for certain out-of-pocket expenses.
Compliance Services: ALPS provides services as the Fund’s Chief Compliance Officer to monitor and test the policies and procedures of the Fund in conjunction with requirements of Rule 38a-1 of the 1940 Act pursuant to a Chief Compliance Officer Services Agreement with the Trust. Under this agreement, ALPS is paid an annual base fee of $20,000 for services performed on behalf of the Fund and is reimbursed for certain out-of-pocket expenses.
Distributor: ALPS Distributors, Inc. (the “Distributor”) (an affiliate of ALPS Fund Services, Inc.) acts as the principal underwriter of the Fund’s shares pursuant to a Distribution Agreement with the Trust. Shares of the Fund are offered on a continuous basis through the Distributor, as agent of the Fund. The Distributor is not obligated to sell any particular amount of shares and is not entitled to any compensation for its services as the Fund’s principal underwriter.
8. TRUSTEES
As of September 30, 2014, there were four Trustees, three of whom are not “interested persons” (as defined in the 1940 Act) of the Trust (the “Independent Trustees”). Prior to October 1, 2014, the Independent Trustees received a quarterly retainer of $2,000, plus $1,000 for each regular Board or Committee meeting attended, $1,000 for each special telephonic Board or Committee meeting attended and $1,000 for each special in-person Board meeting attended. Effective October 1, 2014, the Independent Trustees receive a quarterly retainer of $4,000, plus $2,000 for each regular Board or Committee meeting attended, $2,000 for each special telephonic Board or Committee meeting attended and $2,000 for each special in-person Board meeting attended. The Independent Trustees are also reimbursed for all reasonable out-of-pocket expenses relating to attendance at meetings and for meeting-related expenses. Officers of the Trust and Trustees who are interested persons of the Trust receive no salary or fees from the Trust.
9. INDEMNIFICATIONS
Under the Trust’s organizational documents, its officers and Trustees are indemnified against certain liabilities arising out of the performance of their duties to the Trust. Additionally, in the normal course of business, the Trust enters into contracts with service providers that may contain general indemnification clauses which may permit indemnification to the extent permissible under applicable law. The Trust’s maximum exposure under these arrangements is unknown, as this would involve future claims that may be made against the Trust that have not yet occurred.
Annual Report | September 30, 2014 | 31 |
Table of Contents
| GKE Asian Opportunities Fund | Notes to Financial Statements | |
September 30, 2014 |
10. CHANGES IN ACCOUNTANTS
On June 30, 2014, KPMG LLP acquired certain assets of ROTHSTEIN-KASS, P.A. (d/b/a Rothstein Kass & Company, P.C.) and certain of its affiliates (“Rothstein Kass”), the independent public accounting firm for the Fund. As a result of this transaction, on June 30, 2014, Rothstein Kass resigned as the independent registered public accounting firm for the Fund.
The Fund commenced operations on August 5, 2013 and the Fund’s fiscal year end is September 30th. The report of Rothstein Kass on the Fund’s financial statements for the fiscal year ended September 30, 2013 contained no adverse opinion or disclaimer of opinion and were not qualified or modified as to uncertainty, audit scope or accounting principles.
During the fiscal year ended September 30, 2013 and through June 30, 2014, there were no disagreements with Rothstein Kass on any matter of accounting principles or practices, financial statement disclosure or auditing scope or procedure, which disagreements, if not resolved to the satisfaction of Rothstein Kass, would have caused Rothstein Kass to make reference thereto in its reports on the financial statements for such year.
During the fiscal year ended September 30, 2013 and through June 30, 2014, there were no reportable events (as defined in Item 304(a)(1)(v)) of Regulation S-K).
The Board of Trustees of the Trust approved the selection of KPMG LLP to serve as the Fund’s independent registered public accounting firm for the Fund’s fiscal year ending September 30, 2014 at an in-person meeting held on August 22, 2014. During the fiscal year ended September 30, 2013 and through June 30, 2014, the Trust on behalf of the Fund had not consulted with Rothstein Kass regarding either (i) the application of accounting principles to a specified transaction, either completed or proposed; or the type of audit opinion that might be rendered on the Fund’s financial statements, and neither a written report was provided to the Trust on behalf of the Fund or oral advice was provided that Rothstein Kass concluded was an important factor considered by the Trust on behalf of the Fund in reaching a decision as to the accounting, auditing or financial reporting issue; or (ii) any matter that was either the subject of a disagreement, as that term is defined in Item 304(a)(1)(iv) of Regulation S-K and the related instructions to Item 304 of Regulation S-K, or a reportable event, as that term is defined in Item 304(a)(1)(v) of Regulation S-K.
32 |
www.gkefund.com |
Table of Contents
| GKE Asian Opportunities Fund | Report of Independent Registered Public Accounting Firm |
The Board of Trustees and Shareholders
ALPS Series Trust:
We have audited the accompanying statement of assets and liabilities of GKE Asian Opportunities Fund, including the portfolio of investments, as of September 30, 2014, and the related statement of operations, statement of changes in net assets, and the financial highlights for the year then ended. These financial statements and financial highlights are the responsibility of the Fund’s management. Our responsibility is to express an opinion on these financial statements and financial highlights based on our audit. The accompanying statement of changes in net assets and financial highlights of GKE Asian Opportunities Fund for the period from August 5, 2013 to September 30, 2013, were audited by other auditors whose report thereon dated November 22, 2013, expressed an unqualified opinion on those statements.
We conducted our audit in accordance with the standards of the Public Company Accounting Oversight Board (United States). Those standards require that we plan and perform the audit to obtain reasonable assurance about whether the financial statements and financial highlights are free of material misstatement. An audit includes examining, on a test basis, evidence supporting the amounts and disclosures in the financial statements. Our procedures included confirmation of securities owned as of September 30, 2014, by correspondence with custodians and brokers, or by other appropriate auditing procedures where replies from brokers were not received. An audit also includes assessing the accounting principles used and significant estimates made by management, as well as evaluating the overall financial statement presentation. We believe that our audit provides a reasonable basis for our opinion.
In our opinion, the financial statements and financial highlights referred to above present fairly, in all material respects, the financial position of GKE Asian Opportunities Fund, as of September 30, 2014, the results of its operations, the changes in its net assets and the financial highlights for the year then ended, in conformity with U.S. generally accepted accounting principles.
KPMG LLP
Denver, Colorado
November 24, 2014
Annual Report | September 30, 2014 | 33 |
Table of Contents
| GKE Asian Opportunities Fund | Additional Information | |
September 30, 2014 (Unaudited) |
1. PROXY VOTING POLICIES AND VOTING RECORD
A description of the policies and procedures that the Fund uses to determine how to vote proxies relating to portfolio securities is available without charge, upon request, (i) by calling the Fund (toll-free) at 1-855-331-6240 or (ii) on the Securities and Exchange Commission’s the (“SEC”) website at http://www.sec.gov.
Information regarding how the Fund voted proxies relating to portfolio securities during the most recent 12-month period ended June 30 is available (i) without charge, upon request, by calling the Fund (toll-free) at 1-855-331-6240 or (ii) on the SEC’s website at http://www.sec.gov.
2. PORTFOLIO HOLDINGS
The Fund files its complete schedule of portfolio holdings with the SEC for the first and third quarters of each fiscal year on Form N-Q. The Fund’s Forms N-Q are available on the SEC website at http://www.sec.gov. The Fund’s Forms N-Q may be reviewed and copied at the SEC’s Public Reference Room in Washington, D.C., and information on the operation of the Public Reference Room may be obtained by calling 1-800-SEC-0330.
3. TAX DESIGNATIONS
The Fund designates the following for federal income tax purposes for the year ended September 30, 2014:
| Foreign Taxes Paid | Foreign Source Income | |||||||
| ||||||||
GKE Asian Opportunities Fund | $ | 11,036 | $ | 169,546 | ||||
Of the distributions paid by the Fund from ordinary income for the calendar year ended December 31, 2013, the following percentages met the requirements to be treated as qualifying for the corporate dividends received deduction and qualified dividend income:
| Dividend Received | Qualified Dividend | |||||||
| Deduction | Income | |||||||
| ||||||||
GKE Asian Opportunities Fund | – | 8.55% | ||||||
In early 2014, if applicable, shareholders of record received this information for the distributions paid to them by the Fund during the calendar year 2013 via Form 1099. The Fund will notify shareholders in early 2015 of amounts paid to them by the Fund, if any, during the calendar year 2014.
34 |
www.gkefund.com |
Table of Contents
| GKE Asian Opportunities Fund | Trustees & Officers | |
September 30, 2014 (Unaudited) |
INDEPENDENT TRUSTEES
Name, Birth Year & Address* | Position(s) Held with Fund | Term of Office and Time Served | Principal Occupation(s) During Past 5 Years** | Number of Fund Complex by Trustee*** | Other Trustee | |||||
| ||||||||||
Cheryl Burgermeister Birth year: 1951 | Trustee | Ms. Burgermeister was elected to the Board on October 30, 2012; indefinite term. | Ms. Burgermeister is Trustee and Audit Committee Chair of The Select Sector SPDR Trust (October 1998 to present), Trustee of Russell Investment Funds (September 2012 to present) and Trustee, Treasurer and Finance Committee Chair of the Portland Community College Foundation (January 2001 to present). She also served as Trustee and Audit Committee Chair of E*Trade Funds (March 2004 to March 2010), Trustee of Zero Gravity Internet Fund (May 2000 to December 2001), Director and Treasurer of Crabbe Huson Family of Funds (1998 to 1999) and Director, Chief Financial Officer and Treasurer of The Crabbe Huson Group, Inc. (July 1987 to October 1999). From 1982 to 1986, Ms. Burgermeister was Supervising Senior Accountant at KPMG Peat Marwick. Ms. Burgermeister a licensed Certified Public Accountant and a member of the Oregon Society of Certified Public Accountants.
| 9 | Ms. Burgermeister is a Trustee and Audit Committee Chair of The Select Sector SPDR Trust (9 ETFs) and Trustee of Russell Investment Funds (42 funds). | |||||
| ||||||||||
| * | All communications to Trustees and Officers may be directed to ALPS Series Trust c/o 1290 Broadway, Suite 1100, Denver, CO 80203. |
| ** | Except as otherwise indicated, each individual has held the office shown or other offices in the same company for the last five years. |
| *** | The Fund Complex currently consists of nine series of the Trust and any other investment companies for which Evergreen Capital Management, LLC and GaveKal Capital Limited provide investment advisory services, currently none. |
Annual Report | September 30, 2014 | 35 |
Table of Contents
| GKE Asian Opportunities Fund | Trustees & Officers | |
September 30, 2014 (Unaudited) |
INDEPENDENT TRUSTEES (continued)
Name, Birth Year & Address* | Position(s) Held with Fund | Term of Office and | Principal Occupation(s) During Past 5 Years** | Number of Funds in Fund Complex Overseen by Trustee*** | Other Directorships Past 5 Years** | |||||
| ||||||||||
J. Wayne Hutchens Birth year: 1944 | Trustee | Mr. Hutchens was elected to the Board on October 30, 2012; indefinite term. | Mr. Hutchens is currently retired. From April 2006 to December 2012, he served as President and CEO of the University of Colorado (CU) Foundation and from April 2009 to December 2012, he was Executive Director of the CU Real Estate Foundation. Mr. Hutchens is also Trustee of the Denver Museum of Nature and Science (2000 to present), Director of AMG National Trust Bank (June 2012 to present) and Trustee of Children’s Hospital Colorado (May 2012 to present). Prior to these positions, Mr. Hutchens spent 29 years in the banking industry, retiring as Chairman of Chase Bank Colorado.
| 9 | None. | |||||
| ||||||||||
| * | All communications to Trustees and Officers may be directed to ALPS Series Trust c/o 1290 Broadway, Suite 1100, Denver, CO 80203. |
| ** | Except as otherwise indicated, each individual has held the office shown or other offices in the same company for the last five years. |
| *** | The Fund Complex currently consists of nine series of the Trust and any other investment companies for which Evergreen Capital Management, LLC and GaveKal Capital Limited provide investment advisory services, currently none. |
36 |
www.gkefund.com |
Table of Contents
| GKE Asian Opportunities Fund | Trustees & Officers | |
September 30, 2014 (Unaudited) |
INDEPENDENT TRUSTEES (continued)
Name, Birth Year & Address* | Position(s) Held with Fund | Term of Office and | Principal Occupation(s) During Past 5 Years** | Number of Funds in Fund Complex Overseen by Trustee*** | Other Directorships Past 5 Years** | |||||
| ||||||||||
Patrick Seese Birth year: 1971 | Trustee | Mr. Seese was elected to the Board on October 30, 2012; indefinite term. | Mr. Seese is an owner and a Managing Director of Integris Partners, a middle-market investment banking firm serving closely-held companies, financial sponsors and public companies (February 2008 to present). Prior to this, Mr. Seese was a Managing Director of Headwaters MB, a middle-market investing banking firm (December 2003 to February 2008). Prior to that, Mr. Seese worked in Credit Suisse First Boston’s Mergers and Acquisitions Group and served as Head of Corporation Development, Katy Industries, a publicly traded industrial and consumer products company and at Deloitte & Touche LLP, where he began his career in 1994.
| 9 | None. | |||||
| ||||||||||
| * | All communications to Trustees and Officers may be directed to ALPS Series Trust c/o 1290 Broadway, Suite 1100, Denver, CO 80203. |
| ** | Except as otherwise indicated, each individual has held the office shown or other offices in the same company for the last five years. |
| *** | The Fund Complex currently consists of nine series of the Trust and any other investment companies for which Evergreen Capital Management, LLC and GaveKal Capital Limited provide investment advisory services, currently none. |
Annual Report | September 30, 2014 | 37 |
Table of Contents
| GKE Asian Opportunities Fund | Trustees & Officers | |
September 30, 2014 (Unaudited) |
INTERESTED TRUSTEE AND OFFICERS
Name, Birth Year & Address* | Position(s) Held with Fund | Term of Office and | Principal Occupation(s) During Past 5 Years** | Number of Funds in Fund Complex Overseen by Trustee*** | Other Directorships Past 5 Years** | |||||
| ||||||||||
Jeremy O. May Birth year: 1970 | Trustee, Chairman and President | Mr. May was elected Trustee, Chairman and President on October 30, 2012; indefinite term. | Mr. May joined ALPS in 1995 and is currently President of ALPS Fund Services, Inc. and ALPS Distributors, Inc. and Executive Vice President of ALPS Holdings, Inc. and ALPS Advisors, Inc. Because of his positions with these entities, Mr. May is deemed an affiliate of the Trust as defined under the 1940 Act. Mr. May currently serves as Treasurer of Clough Global Allocation Fund, Clough Global Equity Fund, Clough Global Opportunities Fund, Mr. May is also Chairman and Trustee of the Reaves Utility Income Fund. Mr. May is currently Vice Chair of the Board of Directors of the University of Colorado Foundation. | 9 | Mr. May is Chairman and Trustee of the Reaves Utility Income Fund (1 fund). | |||||
| ||||||||||
| * | All communications to Trustees and Officers may be directed to ALPS Series Trust c/o 1290 Broadway, Suite 1100, Denver, CO 80203. |
| ** | Except as otherwise indicated, each individual has held the office shown or other offices in the same company for the last five years. |
| *** | The Fund Complex currently consists of nine series of the Trust and any other investment companies for which Evergreen Capital Management, LLC and GaveKal Capital Limited provide investment advisory services, currently none. |
| 38 |
www.gkefund.com |
Table of Contents
| GKE Asian Opportunities Fund | Trustees & Officers | |
September 30, 2014 (Unaudited) |
INTERESTED TRUSTEE AND OFFICERS (continued)
Name, Birth Year & Address* | Position(s) Held with Fund | Term of Office and Length of | Principal Occupation(s) During Past 5 Years** | |||
| ||||||
Kimberly R. Storms Birth year: 1972 | Treasurer | Ms. Storms was elected Treasurer of the Trust on October 30, 2012; indefinite term. | Ms. Storms is Senior Vice President - Director of Fund Administration of ALPS. Ms. Storms joined ALPS in 1998 as Assistant Controller. Because of her position with ALPS, Ms. Storms is deemed an affiliate of the Trust as defined under the 1940 Act. Ms. Storms is also Treasurer of Financial Investors Trust, Liberty All-Star Equity Fund and Liberty All-Star Growth Fund, Inc. She serves as Chief Financial Officer of Arbitrage Funds.
| |||
| ||||||
JoEllen L. Legg Birth year: 1961 | Secretary | Ms. Legg was elected Secretary of the Trust on October 30, 2012; indefinite term. | Ms. Legg joined ALPS in October 2007 and is Vice President, Senior Counsel of ALPS. Prior to joining ALPS, Ms. Legg served as Senior Counsel - Law (Corporate & Securities) for Adelphia Communications Corporation (February 2005 - March 2007). Prior to this, Ms. Legg held associate positions at Fried Frank Harris Shriver & Jacobson LLP (1998 - 2004) and at Patton Boggs LLP (2004 - 2005). Because of her position with ALPS, Ms. Legg is deemed an affiliate of the Trust as defined under the 1940 Act. Ms. Legg is also the Assistant Secretary of the Stone Harbor Investment Funds, Stone Harbor Emerging Markets Income Fund, Stone Harbor Emerging Markets Total Income Fund, James Advantage Funds, WesMark Funds, and Griffin Institutional Access Real Estate Fund.
| |||
| ||||||
Nate Mandeville Birth year: 1977 | Assistant Treasurer | Mr. Mandeville was elected Assistant Treasurer of the Trust on August 22, 2014; indefinite term.
| Mr. Mandeville joined ALPS in December 2013 and is Fund Controller of ALPS. Prior to joining ALPS, Mr. Mandeville worked for Great-West Financial (2011-2013), Virtuoso Sourcing Group (2008-2011) and Janus Capital Group (2000-2008). Because of his position with ALPS, Mr. Mandeville is deemed an affiliate of the Trust as defined under the 1940 Act. | |||
| ||||||
| * | All communications to Trustees and Officers may be directed to ALPS Series Trust c/o 1290 Broadway, Suite 1100, Denver, CO 80203. |
| ** | Except as otherwise indicated, each individual has held the office shown or other offices in the same company for the last five years. |
Annual Report | September 30, 2014 | 39 |
Table of Contents
| GKE Asian Opportunities Fund | Trustees & Officers | |
September 30, 2014 (Unaudited) |
INTERESTED TRUSTEE AND OFFICERS (continued)
Name, Birth Year & Address* | Position(s) Held with Fund | Term of Office and Length of | Principal Occupation(s) During Past 5 Years** | |||
| ||||||
Lucas Foss Birth year: 1977 | Chief Compliance Officer (“CCO”) | Mr. Foss was elected CCO of the Trust on October 30, 2012; indefinite term. | Mr. Foss joined ALPS in November 2004 and is Deputy Chief Compliance Officer of ALPS. Prior to his current role, Mr. Foss served as a Compliance Manager at ALPS (January 2010-August 2012), and a Senior Compliance Analyst at ALPS (November 2004-May 2006). Before joining ALPS, Mr. Foss held positions at Bisys Hedge Fund Services and Deutsche Asset Management. Because of his position with ALPS, Mr. Foss is deemed an affiliate of the Trust as defined under the 1940 Act. Mr. Foss is also CCO of Caldwell & Orkin Funds, Whitebox Mutual Funds, Boulder Growth & Income Fund, Boulder Total Return Fund, the Denali Fund, Wakefield Alternative Series Trust and The Principal Real Estate Income Fund. | |||
| ||||||
| * | All communications to Trustees and Officers may be directed to ALPS Series Trust c/o 1290 Broadway, Suite 1100, Denver, CO 80203. |
| ** | Except as otherwise indicated, each individual has held the office shown or other offices in the same company for the last five years. |
Additional information about members of the Board of Trustees and officers of the Trust is available in the Statement of Additional Information and is available, without charge, upon request, by calling the Fund (toll-free) at 1-855-331-6240.
40 |
www.gkefund.com |
Table of Contents

Table of Contents
Table of Contents
|
| 1
|
| ||
|
| 5
|
| ||
|
| 7
|
| ||
|
| 8
|
| ||
|
| 16
|
| ||
|
| 17
|
| ||
|
| 18
|
| ||
|
| 19
|
| ||
|
| 21
|
| ||
|
| 34
|
| ||
|
| 35
|
| ||
|
| 36
|
| ||
Table of Contents
| Insignia Macro Fund | Shareholder Letter | |
September 30, 2014 (Unaudited) |
The Insignia Macro Fund (the “Fund”) seeks long-term risk-adjusted total return. To reach its objective, the Fund provides exposure to commodities-related investment strategies with low correlation to the equity markets. Historically, managed futures have not been highly correlated to stocks or bonds. Adding low correlating investments to a portfolio of stocks and bonds can potentially reduce risk and improve returns.
Market Summary
Since the launch of the Fund, global capital markets climbed higher as market volatility remained subdued. Investor optimism was generally fueled by economic recovery, strong corporate fundamentals and accommodative monetary policy and guidance from global central banks. The drivers of investor optimism overwhelmed some negative undercurrents, including escalating geopolitical tensions in the Ukraine and Middle East. Commodity prices were mixed with volatile crude oil prices on uncertainties in the Middle East and with weakness across the agricultural complex on bearish USDA (United States Department of Agriculture) forecasts generally due to large production.
In early September, the European Central Bank surprised financial markets with an interest rate cut and new stimulus plan. This extended the broad based rally in the dollar that had begun in August. The Japanese yen continued to fall as the disappointing pace of Japan’s recovery contrasted with the positive fundamentals of the U.S. The perception that the U.S. economy was on stable ground, amplified pressure for the U.S. Federal Reserve to increase interest rates. This led to a rise in yields heading into the Federal Open Market Committee meeting mid-month. While the meeting did not explicitly provide a timetable for the increase, the Federal Reserve Economic Projections forecasted a policy normalization to occur in mid-to-late 2015. We are pleased with the Fund’s performance overall and believe we are well positioned by utilizing discretionary managers that navigate the changing macro environment.
Performance (as of September 30, 2014)
| Fund | 1 Month | 3 Month | YTD | Since Inception* | ||||||||||
Class A (Net Asset Value)1 | 4.62% | 6.44% | 4.02% | 4.20% | ||||||||||
Class A (Maximum Offering Price)1 | -1.14% | 0.58% | -1.51% | -1.51% | ||||||||||
Class I (Net Asset Value) | 4.62% | 6.44% | 4.20% | 4.20% | ||||||||||
HFRI Macro (Total) Index (HFRIMI)2 | 1.78% | 3.02% | 4.09% | 4.09% | ||||||||||
The performance data quoted above represents past performance. Past performance is not a guarantee of future results. Investment return and value of the Fund shares will fluctuate so that an investor’s shares, when sold or redeemed, may be worth more or less than their original cost. Performance may be lower or higher than performance data quoted. Fund performance current to the most recent month-end is available by calling (855) 674-4642 or by visiting www.insigniafunds.com.
| * | Inception date is December 31, 2013. |
| 1 | As of 12/19/2013, Meritage Capital, LLC (the “Adviser”) has contractually agreed to limit the amount of the Fund’s Total Annual Fund Operating Expenses, exclusive of Distribution and Service (12b-1) fees, Shareholder Service Fees, Acquired Fund Fees and Expenses, brokerage expenses, interest expenses, taxes and extraordinary expenses, to 1.75% and 1.50% of the Fund’s average daily net assets. This agreement is in effect through January 31, 2015. |
| 2 | The HFRI Macro (Total) Index is an equally weighted performance index. It uses the HFR database and consists only of macro funds with a minimum of US$50 million AUM or a 12-month track record and that report assets in USD. It is calculated and rebalanced monthly, and shown net of all fees and expenses. It is an index comprising of investment managers which trade a broad range of strategies in which the investment process is predicated on movements in underlying economic variables and the impact these have on equity, fixed income, hard currency and commodity markets. Managers employ a variety of techniques, both discretionary and systematic analysis, combinations of top down and bottom up theses, quantitative and fundamental approaches and long and short term holding periods. |
Annual Report | September 30, 2014 | 1 |
Table of Contents
| Insignia Macro Fund | Shareholder Letter | |
September 30, 2014 (Unaudited) |
Returns of less than 1 year are cumulative.
Indices are not actively managed and do not reflect deduction for fees, expenses, or taxes. An investor cannot invest directly in an index.
The returns shown above do not reflect the deduction of taxes a shareholder would pay on Fund distributions or redemption of Fund shares.
Maximum Offering Price (MOP) for Class A shares includes the Fund’s maximum sales charge of
5.50%. Performance shown at NAV does not include these sales charges and would have been lower had it been taken into account. The total annual operating expenses and total annual operating expenses after fee waivers and/or reimbursement you may pay as an investor in the Fund’s Class A and Class I shares (as reported in the December 19, 2013 Prospectus) are 2.61% and 2.25%; and 2.36% and
2.00%, respectively.
The Fund is new and has a limited operating history.
Fund Overview
The Insignia Macro Fund allocates to managers across the broad spectrum of global macro styles. These managers include discretionary global macro hedge funds whose top-down global economic analysis drives their trading themes, traders who employ a quantitative approach and momentum-based trend followers. The Fund’s primary underlying exposures are in very liquid markets including currencies, fixed income, commodities and equity indices. Our objective is to profit from directional opportunities in these markets while maintaining a low correlation to equities and other traditional and hedge fund strategies. The portfolio is expected to average between 5-15 managers with maximum allocation to any one manager of 20%. As such, the Fund is designed to complement investors’ existing portfolios.
The Fund provides managed futures exposure through investments in Commodity Trading Advisors (CTA). We invest in three different strategies of managers. The Quantitative Factor based strategies consist of 65.89% of the Fund. These managers take positions that are not solely base on price. They may look at economic data and other factors in determining which markets and direction in which they trade. Allocation to Discretionary managers consist of 28.28% of the Fund. These managers take positions based on their views of global economic activity. Finally, Trend Following strategies complete the portfolio with an allocation of 5.83%. These managers tend to be price based and will take longer term positions that could last several months.
2 | www.insigniafunds.com |
Table of Contents
| Insignia Macro Fund | Shareholder Letter | |
September 30, 2014 (Unaudited) |
Insignia Macro Fund Exposure by Manager (as of September 30, 2014)
| Underlying Manager | Exposure | Strategy Description | ||
H2O Asset Management | 17.58% | Discretionary Macro | Fundamental | ||
Cambridge Strategy EM Alpha | 11.93% | Quantitative | Fundamental & Technical Models | ||
Campbell FMEL | 11.90% | Quantitative | Trend & Non-Trend Strategies | ||
QMS Diversified GM | 11.12% | Quantitative | Fundamental & Technical Models | ||
Crabel Multi-Product | 10.84% | Quantitative | Short Term | ||
Revolution Alpha | 10.81% | Quantitative | Short Term | ||
Greenwave Flagship | 10.70% | Discretionary Macro | Fundamental | ||
Romanesco Persistence Strategy | 9.29% | Quantitative | Short Term | ||
Blackwater Global | 5.83% | Trend Follower | Pattern Recognition |
Subject to change.
The global macro/managed futures mangers selected by Meritage Capital to gain exposure to the global macro/managed futures managers, sub strategies and programs are subject to change at any time, and any such change may alter the Fund’s access and percentage exposures to each such manager, sub-strategy and program. Although the Fund intends to pursue its global macro/managed futures strategy by investing up to 25% of its total assets in a wholly-owned subsidiary, the Fund may also make global macro/managed futures investments directly, outside of such subsidiary.
Drivers of Fund Performance
The Insignia Macro Fund’s return for the fiscal period ending September 30, 2014 was +4.20%. This return included appreciation from a total return swap which provided exposure to the total return of a basket of independent managers. During the period we terminated one short term manager and equally distributed their allocation to the remaining nine managers.
Across the Fund, 8 of the 10 managers reported positive performance year-to-date. The largest contributor to the Fund’s positive performance was Cambridge Strategy’s Emerging Market Alpha strategy earning +13.36%. Also noteworthy, Campbell FMEL program reported +11.90%, Blackwater Global Program +11.80% and H2O Asset Management +12.04%. Romanesco was the only meaningful detractor ending the period at -11.92%.
Gains for the period were made in the currency markets primary from long dollar positions against both developed and emerging market currencies. Additionally, trading in grains, base metals and stock indexes contributed to positive performance. Both short term and long term interest rate markets were moderate detractors.
Annual Report | September 30, 2014 | 3 |
Table of Contents
| Insignia Macro Fund | Shareholder Letter | |
September 30, 2014 (Unaudited) |
Sector Attribution Month to Date (as of September 30, 2014)
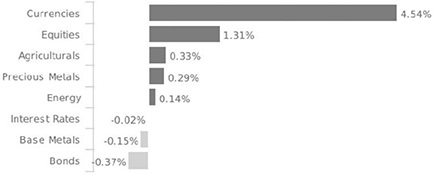
Subject to change.
Market Outlook
As of September 30, 2014, the Fund’s composition remains diversified primarily across a complementary roster of discretionary and quantitative managers. With escalating market volatility and a diverging global economic landscape, the Fund delivered strong, risk-adjusted performance with primary attribution drivers from trends in currencies. The Fund has maintained minimal directionality, either long or short, to global equity markets. Looking ahead, we anticipate increasing allocations to proven discretionary managers across asset classes who will utilize dynamic trading to navigate the emerging opportunities and risks ahead.
Compared to prior years, we are seeing an improved trading environment for managers in 2014. Across asset classes, there have been more persistent trends to capitalize on and more volatility. We anticipate that this climate will continue which should bode well for the managers and the Fund overall. We fervently believe that global macro and managed futures strategies play a valuable diversification role in strategic asset allocations over the long-term. As 2014 progresses, we believe now is an opportune time to increase allocations to these strategies. Furthermore, we believe the Insignia Macro Fund is well-positioned now and going forward.
We remain focused on our mission of compounding wealth through delivering superior, risk-adjusted returns. Thank you for your continuing support and for investing in the Insignia Macro Fund.
Sincerely,

Joe Wade
Chief Investment Officer
Diversification does not eliminate risk.
4 | www.insigniafunds.com |
Table of Contents
| Insignia Macro Fund | Portfolio Update | |
September 30, 2014 (Unaudited) |
Performance (as of September 30, 2014)
| 3 Month | Since Inception* | |||||||
Insignia Macro Fund - A NAV | 6.44% | 4.20% | ||||||
Insignia Macro Fund - A MOP | 0.58% | -1.51% | ||||||
Insignia Macro Fund - I | 6.44% | 4.20% | ||||||
HFRI Macro (Total) Index(a) | 3.02% | 4.09% | ||||||
S&P 500® Total Return Index(b) | 1.13% | 8.34% | ||||||
The performance data quoted above represents past performance. Past performance is not a guarantee of future results. Investment return and value of the Fund shares will fluctuate so that an investor’s shares, when sold or redeemed, may be worth more or less than their original cost. Performance may be lower or higher than performance data quoted. Fund performance current to the most recent month-end is available by calling (855) 674-4642 or by visiting www.insigniafunds.com.
| * | Fund’s inception date is December 31, 2013. |
| (a) | The HFRI Macro (Total) Index is an equally weighted performance index. It uses the HFR database and consists only of macro funds with a minimum of US$50 million AUM or a 12-month track record and that report assets in USD. It is calculated and rebalanced monthly, and shown net of all fees and expenses. It is an index comprising of investment managers which trade a broad range of strategies in which the investment process is predicated on movements in underlying economic variables and the impact these have on equity, fixed income, hard currency and commodity markets. Managers employ a variety of techniques, both discretionary and systematic analysis, combinations of top down and bottom up theses, quantitative and fundamental approaches and long and short term holding periods. |
| (b) | S&P 500® Total Return Index is the Standard & Poor’s composite index of 500 stocks, a widely recognized, unmanaged index of common stock prices. |
Returns of less than 1 year are cumulative.
Indices are not actively managed and do not reflect deduction for fees, expenses, or taxes. An investor cannot invest directly in an index.
The returns shown above do not reflect the deduction of taxes a shareholder would pay on Fund distributions or redemption of Fund shares.
Maximum Offering Price (MOP) for Class A shares includes the Fund’s maximum sales charge of 5.50%. Performance shown at NAV does not include these sales charges and would have been lower had it been taken into account. The total annual operating expenses and total annual operating expenses after fee waivers and/or reimbursement you may pay as an investor in the Fund’s Class A and Class I shares (as reported in the December 19, 2013 Prospectus) are 2.61% and 2.25%; and 2.36% and 2.00%, respectively.
The Fund is new and has a limited operating history.
Annual Report | September 30, 2014 | 5 |
Table of Contents
| Insignia Macro Fund | Portfolio Update | |
September 30, 2014 (Unaudited) |
Performance of $10,000 Initial Investment (as of September 30, 2014)
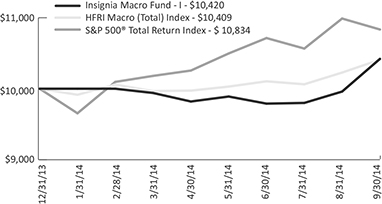
The graph shown above represents historical performance of a hypothetical investment of $10,000 in the Fund since inception. Past performance does not guarantee future results. All returns reflect reinvested dividends, but do not reflect the deduction of taxes that a shareholder would pay on Fund distributions or the redemption of Fund shares.
Sector Allocation (as a % of Net Assets)*
Corporate Bonds | 37.35% | |||
Mortgage Backed Securities | 9.77% | |||
U.S. Treasury Notes & Bonds | 8.64% | |||
Asset Backed Securities | 8.59% | |||
Municipal Bonds | 0.89% | |||
Cash, Cash Equivalents, & Other Net Assets | 34.76% | |||
| ||||
Total | 100.00% | |||
| ||||
| * | Holdings are subject to change. Tables present indicative values only. |
6 | www.insigniafunds.com |
Table of Contents
| Insignia Macro Fund | Disclosure of Fund Expenses | |
September 30, 2014 (Unaudited) |
Examples. As a shareholder of the Insignia Macro Fund (the “Fund”), you will incur two types of costs: (1) transaction costs, including applicable redemption fees; and (2) ongoing costs, including management fees, distribution and service (12b-1) fees and other Fund expenses. The following examples are intended to help you understand your ongoing costs (in dollars) of investing in the Fund and to compare these costs with the ongoing costs of investing in other mutual funds. The examples are based on an investment of $1,000 invested on April 1, 2014 and held until September 30, 2014.
Actual Expenses. The first line under each class in the table below provides information about actual account values and actual expenses. You may use the information in this line, together with the amount you invested, to estimate the expenses that you paid over the period. Simply divide your account value by $1,000 (for example, an $8,600 account value divided by $1,000 = 8.6), then multiply the result by the number in the first line under the heading “Expenses Paid During Period April 1, 2014 – September 30, 2014” to estimate the expenses you paid on your account during this period.
Hypothetical Example for Comparison Purposes. The second line under each class in the table below provides information about hypothetical account values and hypothetical expenses based on the Fund’s actual expense ratio and an assumed rate of return of 5% per year before expenses, which is not the Fund’s actual return. The hypothetical account values and expenses may not be used to estimate the actual ending account balance or expenses you paid for the period. You may use this information to compare the ongoing costs of investing in the Fund and other mutual funds. To do so, compare this 5% hypothetical example with the 5% hypothetical examples that appear in the shareholder reports of the other funds.
Please note that the expenses shown in the table are meant to highlight your ongoing costs only and do not reflect any transactional costs, such as redemption fees. Therefore, the second line under each class in the table below is useful in comparing ongoing costs only and will not help you determine the relative total costs of owning different funds. In addition, if these transactional costs were included, your costs would have been higher.
| Expenses Paid | ||||||||
| During Period | ||||||||
| Beginning | Ending | April 1, 2014 - | ||||||
| Account Value | Account Value | Expense | September 30, | |||||
| April 1, 2014 | September 30, 2014 | Ratio(a) | 2014(b) | |||||
Class A | ||||||||
Actual | $ 1,000.00 | $ 1,048.30 | 1.75% | $ 8.99 | ||||
Hypothetical (5% return before expenses) | $ 1,000.00 | $ 1,016.29 | 1.75% | $ 8.85 | ||||
Class I | ||||||||
Actual | $ 1,000.00 | $ 1,048.30 | 1.50% | $ 7.70 | ||||
Hypothetical (5% return before expenses) | $ 1,000.00 | $ 1,017.55 | 1.50% | $ 7.59 |
| (a) | The Fund’s expense ratios have been annualized based on the Fund’s most recent fiscal half-year expenses. |
| (b) | Expenses are equal to the Fund’s annualized expense ratio, multiplied by the average account value over the period, multiplied by the number of days in the most recent fiscal half year (183), divided by 365. |
Annual Report | September 30, 2014 | 7 |
Table of Contents
| Insignia Macro Fund | Consolidated Portfolio of Investments | |
September 30, 2014 |
| Principal Amount | Value (Note 2) | |||||||
| ||||||||
ASSET-BACKED SECURITIES (8.59%) | ||||||||
Automobile (7.39%) | ||||||||
Ally Auto Receivables Trust | ||||||||
Series 2012-5, 0.620% 01/15/2016 | $ | 149,980 | $ | 150,180 | ||||
AmeriCredit Automobile Receivables Trust | ||||||||
Series 2013-5, 0.539% 07/08/2015(a) | 98,838 | 98,918 | ||||||
BMW Vehicle Owner Trust | ||||||||
Series 2013-A, 0.410% 03/25/2015 | 80,299 | 80,315 | ||||||
CarMax Auto Owner Trust | ||||||||
Series 2013-4, 0.520% 11/15/2016 | 100,577 | 100,641 | ||||||
Series 2013-1, 0.600% 10/16/2017 | 145,000 | 145,089 | ||||||
Fifth Third Auto | ||||||||
Series 2013-1, 0.590% 03/15/2015 | 62,399 | 62,429 | ||||||
Ford Credit Auto Owner Trust | ||||||||
Series 2014-A, 0.480% 11/15/2016 | 105,687 | 105,691 | ||||||
Series 2013-B, 0.570% 06/15/2016 | 150,000 | 150,151 | ||||||
Hyundai Auto Receivables Trust | ||||||||
Series 2014-B, 0.440% 02/15/2017 | 159,000 | 159,031 | ||||||
Series 2012-C, 0.530% 12/15/2015 | 114,894 | 114,986 | ||||||
Series 2013-C, 0.570% 06/15/2016 | 135,702 | 135,808 | ||||||
Mercedes-Benz Auto Receivables Trust | ||||||||
Series 2012-1, 0.470% 08/15/2015 | 84,670 | 84,714 | ||||||
Series 2013-1, 0.500% 02/15/2015 | 55,820 | 55,837 | ||||||
Nissan Auto Receivables Owner Trust | ||||||||
Series 2012-B, 0.460% 08/15/2015 | 96,795 | 96,814 | ||||||
Series 2013-B, 0.520% 03/15/2015 | 65,930 | 65,965 | ||||||
Toyota Auto Receivables Owner Trust | ||||||||
Series 2012-B, 0.460% 09/15/2015 | 92,038 | 92,079 | ||||||
World Omni Auto Receivables Trust | ||||||||
Series 2012-A, 0.640% 10/15/2015 | 82,276 | 82,381 | ||||||
|
| |||||||
Total Automobile | 1,781,029 | |||||||
|
| |||||||
Credit Card (0.83%) | ||||||||
Cabela’s Master Credit Card Trust | ||||||||
Series 2014-1, 0.505% 03/16/2020(a) | 85,000 | 84,996 | ||||||
World Financial Network Credit Card Master Trust | ||||||||
Series 2011-A, 1.680% 08/15/2018 | 115,000 | 115,049 | ||||||
|
| |||||||
Total Credit Card | 200,045 | |||||||
|
| |||||||
| See Notes to Consolidated Financial Statements. | ||
8 | www.insigniafunds.com |
Table of Contents
| Insignia Macro Fund | Consolidated Portfolio of Investments | |
September 30, 2014 |
| Principal | Value | |||||||
| Amount | (Note 2) | |||||||
| ||||||||
Other (0.37%) | ||||||||
GE Equipment Midticket LLC | ||||||||
Series 2012-1, 0.600% 05/22/2015 | $ | 89,752 | $ | 89,821 | ||||
|
| |||||||
TOTAL ASSET-BACKED SECURITIES (Cost $2,071,200) | 2,070,895 | |||||||
|
| |||||||
CORPORATE BONDS (37.35%) | ||||||||
Basic Materials (4.05%) | ||||||||
Barrick Gold Corp., Sr Unsec. Notes | ||||||||
2.900% 05/30/2016 | 165,000 | 168,966 | ||||||
BHP Billiton Finance USA Ltd., Sr. Unsec. Notes | ||||||||
1.000% 02/24/2015 | 150,000 | 150,422 | ||||||
EI du Pont de Nemours & Co., Sr. Unsec. Notes | ||||||||
3.250% 01/15/2015 | 145,000 | 146,210 | ||||||
Freeport-McMoRan Copper & Gold, Inc., Sr. Unsec Notes | ||||||||
1.400% 02/13/2015 | 180,000 | 180,519 | ||||||
Potash Corp. of Saskatchewan, Inc., Sr. Unsec. Notes | ||||||||
3.750% 09/30/2015 | 165,000 | 170,126 | ||||||
Sherwin-Williams Co., Sr. Unsec. Notes | ||||||||
3.125% 12/15/2014 | 160,000 | 160,918 | ||||||
|
| |||||||
Total Basic Materials | 977,161 | |||||||
|
| |||||||
Communications (5.71%) | ||||||||
AT&T, Inc., Sr. Unsec. Notes | ||||||||
2.500% 08/15/2015 | 170,000 | 172,915 | ||||||
Comcast Corp. Sr. Unsec. Notes | ||||||||
6.500% 01/15/2015 | 165,000 | 167,817 | ||||||
DIRECTV Holdings LLC/DIRECTV Financing Co. Inc., Sr. | ||||||||
Unsec. Notes | ||||||||
3.550% 03/15/2015 | 170,000 | 172,401 | ||||||
Discovery Communications LLC, Sr. Unsec. Notes | ||||||||
3.700% 06/01/2015 | 170,000 | 173,644 | ||||||
Time Warner, Inc., Sr. Unsec. Notes | ||||||||
3.150% 07/15/2015 | 165,000 | 168,300 | ||||||
Verizon Communications, Inc., Sr. Unsec. Notes | ||||||||
2.500% 09/15/2016 | 170,000 | 174,506 | ||||||
Viacom, Inc., Sr. Unsec Notes | ||||||||
1.250% 02/27/2015 | 175,000 | 175,598 | ||||||
Vodafone Group PLC, Sr. Unsec. Notes | ||||||||
1.625% 03/20/2017 | 170,000 | 170,364 | ||||||
|
| |||||||
Total Communications | 1,375,545 | |||||||
|
| |||||||
| See Notes to Consolidated Financial Statements. | ||
Annual Report | September 30, 2014 | 9 | |
Table of Contents
| Insignia Macro Fund | Consolidated Portfolio of Investments | |
September 30, 2014 |
| Principal | Value | |||||||
| Amount | (Note 2) | |||||||
| ||||||||
Consumer, Cyclical (1.35%) | ||||||||
CVS Caremark Corp., Sr. Unsec. Notes | ||||||||
1.200% 12/05/2016 | $ | 110,000 | $ | 110,207 | ||||
Walgreen Co., Sr. Unsec Notes | ||||||||
1.000% 03/13/2015 | 215,000 | 215,564 | ||||||
|
| |||||||
Total Consumer, Cyclical | 325,771 | |||||||
|
| |||||||
Consumer, Non-cyclical (5.15%) | ||||||||
Anheuser-Busch InBev Finance, Inc., Sr. Unsec. Notes | ||||||||
0.425% 01/27/2017(a) | 200,000 | 200,024 | ||||||
Block Financial LLC, Sr. Unsec. Notes | ||||||||
5.125% 10/30/2014 | 165,000 | 165,501 | ||||||
Cardinal Health, Inc., Sr. Unsec. Notes | ||||||||
4.000% 06/15/2015 | 165,000 | 169,111 | ||||||
ConAgra Foods, Inc., Sr. Unsec. Notes | ||||||||
1.350% 09/10/2015 | 170,000 | 170,915 | ||||||
Express Scripts Holding Co., Sr. Unsec. Notes | ||||||||
2.100% 02/12/2015 | 200,000 | 201,162 | ||||||
Kroger Co., Sr. Unsec. Notes | ||||||||
4.950% 01/15/2015 | 157,000 | 159,038 | ||||||
Newell Rubbermaid Inc., Sr. Unsec. Notes | ||||||||
2.000% 06/15/2015 | 175,000 | 176,691 | ||||||
|
| |||||||
Total Consumer, Non-cyclical | 1,242,442 | |||||||
|
| |||||||
Energy (3.85%) | ||||||||
BP Capital Markets PLC, Sr. Unsec. Notes | ||||||||
0.700% 11/06/2015 | 175,000 | 175,173 | ||||||
Canadian Natural Resources Ltd., Sr. Unsec. Notes | ||||||||
4.900% 12/01/2014 | 160,000 | 161,204 | ||||||
Enterprise Products Operating LLC, Sr. Unsec. Notes | ||||||||
Series G, 5.600% 10/15/2014 | 60,000 | 60,114 | ||||||
Petroleos Mexicanos, Sr. Unsec. Notes | ||||||||
4.875% 03/15/2015 | 195,000 | 198,790 | ||||||
Phillips 66, Sr. Unsec. Notes | ||||||||
1.950% 03/05/2015 | 170,000 | 171,102 | ||||||
Valero Energy Corp., Sr. Unsec. Notes | ||||||||
4.500% 02/01/2015 | 160,000 | 162,059 | ||||||
|
| |||||||
Total Energy | 928,442 | |||||||
|
| |||||||
Financial (13.08%) | ||||||||
American Express Credit Corp., Sr. Unsec. Notes | ||||||||
0.744% 07/29/2016(a) | 240,000 | 241,376 | ||||||
Bank of America Corp., Sr. Unsec. Notes | ||||||||
4.500% 04/01/2015 | 30,000 | 30,587 | ||||||
1.053% 03/22/2016(a) | 225,000 | 226,650 | ||||||
| See Notes to Consolidated Financial Statements. | ||
10 | www.insigniafunds.com |
Table of Contents
| Insignia Macro Fund | Consolidated Portfolio of Investments | |
September 30, 2014 |
| Principal | Value | |||||||
| Amount | (Note 2) | |||||||
| ||||||||
Financial (continued) | ||||||||
Bank of New York Mellon Corp., Sr. Unsec. Notes | ||||||||
3.100% 01/15/2015 | $ | 78,000 | $ | 78,626 | ||||
Bank of Nova Scotia, Sr. Unsec. Notes | ||||||||
1.850% 01/12/2015 | 165,000 | 165,747 | ||||||
BlackRock, Inc., Sr. Unsec. Notes | ||||||||
3.500% 12/10/2014 | 160,000 | 160,954 | ||||||
Citigroup, Inc. Sub. Notes | ||||||||
4.875% 05/07/2015 | 95,000 | 97,398 | ||||||
Citigroup, Inc., Sr. Unsec. Notes | ||||||||
1.025% 04/01/2016(a) | 160,000 | 161,195 | ||||||
CNA Financial Corp., Sr. Unsec. Notes | ||||||||
5.850% 12/15/2014 | 140,000 | 141,611 | ||||||
First Horizon National Corp., Sr. Unsec. Notes | ||||||||
5.375% 12/15/2015 | 155,000 | 162,493 | ||||||
Ford Motor Credit Co. LLC, Sr. Unsec. Notes | ||||||||
3.875% 01/15/2015 | 200,000 | 201,934 | ||||||
General Electric Capital Corp., Sr. Unsec. Notes | ||||||||
Series GMTN, 3.750% 11/14/2014 | 160,000 | 160,671 | ||||||
Goldman Sachs Group, Inc., Sr. Unsec. Notes | ||||||||
5.000% 10/01/2014 | 185,000 | 185,000 | ||||||
Jefferies Group LLC, Sr. Unsec. Notes | ||||||||
3.875% 11/09/2015 | 170,000 | 175,559 | ||||||
JP Morgan Chase & Co., Sr. Unsec. Notes | ||||||||
Series MTN, 0.800% 04/23/2015 | 144,000 | 144,402 | ||||||
Morgan Stanley, Sr. Unsec. Notes | ||||||||
5.375% 10/15/2015 | 160,000 | 167,603 | ||||||
Nomura Holdings, Inc., Sr. Unsec. Notes | ||||||||
5.000% 03/04/2015 | 160,000 | 162,608 | ||||||
Prudential Financial, Inc., Sr. Unsec. Notes | ||||||||
3.875% 01/14/2015 | 20,000 | 20,198 | ||||||
Series MTN, 4.750% 09/17/2015 | 100,000 | 103,973 | ||||||
Royal Bank of Canada, Sr. Unsec. Notes | ||||||||
Series GMTN, 0.692% 09/09/2016(a) | 162,000 | 163,115 | ||||||
US Bancorp, Sr. Unsec. Notes | ||||||||
3.150% 03/04/2015 | 39,000 | 39,468 | ||||||
Wells Fargo & Co., Sr. Unsec. Notes | ||||||||
Series GMTN, 3.750% 10/01/2014 | 160,000 | 160,000 | ||||||
|
| |||||||
Total Financial | 3,151,168 | |||||||
|
| |||||||
Government (0.59%) | ||||||||
Export-Import Bank of Korea, Sr. Unsec. Notes | ||||||||
5.875% 01/14/2015 | 140,000 | 142,043 | ||||||
|
| |||||||
| See Notes to Consolidated Financial Statements. | ||
Annual Report | September 30, 2014 | 11 | |
Table of Contents
| Insignia Macro Fund | Consolidated Portfolio of Investments | |
September 30, 2014 |
Principal Amount | Value (Note 2) | |||||||
| ||||||||
Industrial (0.73%) | ||||||||
Ryder System, Inc., Sr. Unsec. Notes | ||||||||
Series MTN, 3.600% 03/01/2016 | 170,000 | $ | 176,520 | |||||
|
| |||||||
Technology (0.72%) | ||||||||
Hewlett-Packard Co., Sr. Unsec. Notes | ||||||||
2.125% 09/13/2015 | 170,000 | 172,404 | ||||||
|
| |||||||
Utilities (2.12%) | ||||||||
Consolidated Natural Gas Co., Sr. Unsec. Notes | ||||||||
Series A, 5.000% 12/01/2014 | 195,000 | 195,409 | ||||||
Exelon Corp. Sr. Unsec. Notes | ||||||||
4.900% 06/15/2015 | 165,000 | 169,846 | ||||||
Georgia Power Co., Sr. Unsec. Notes | ||||||||
0.554% 03/15/2016(a) | 145,000 | 145,065 | ||||||
|
| |||||||
Total Utilities | 510,320 | |||||||
|
| |||||||
TOTAL CORPORATE BONDS (Cost $9,004,310) | 9,001,816 | |||||||
|
| |||||||
MORTGAGE-BACKED SECURITIES (9.77%) | ||||||||
Commercial (9.06%) | ||||||||
Bank of America Merrill Lynch Commercial Mortgage, Inc. | ||||||||
Series 2005-6, 5.349% 11/10/2015(a) | 149,119 | 153,618 | ||||||
Bear Stearns Commercial Mortgage Securities Trust | ||||||||
Series 2005-T20, 5.289% 10/12/2042(a) | 160,000 | 165,046 | ||||||
CD Commercial Mortgage Trust | ||||||||
Series 2005-CD1, 5.400% 07/15/2044(a) | 147,392 | 151,455 | ||||||
Credit Suisse First Boston Mortgage Securities Corp. | ||||||||
Series 2005-C3, 4.686% 07/15/2037 | 152,038 | 153,787 | ||||||
GS Mortgage Securities Corp. | ||||||||
Series 2005-GG4, 4.751% 07/10/2039 | 196,394 | 197,975 | ||||||
JP Morgan Chase Commercial Mortgage Securities Trust | ||||||||
Series 2005-LDP2, 4.738% 07/15/2042 | 160,000 | 162,324 | ||||||
LB-UBS Commercial Mortgage Trust | ||||||||
Series 2005-C1, 4.742% 02/15/2030 | 25,644 | 25,699 | ||||||
Series 2005-C3, 4.843% 07/15/2040 | 145,000 | 147,527 | ||||||
Series 2005-C7, 5.197% 11/15/2030(a) | 160,000 | 163,152 | ||||||
Morgan Stanley Capital I Trust | ||||||||
Series 2005-IQ9, 4.700% 12/15/2014 | 124,648 | 124,782 | ||||||
Series 2005-T19, 4.890% 06/12/2047 | 153,637 | 156,406 | ||||||
Series 2006-T21, 5.162% 10/12/2052(a) | 155,000 | 160,588 | ||||||
| See Notes to Consolidated Financial Statements. | ||
12 | www.insigniafunds.com |
Table of Contents
| Insignia Macro Fund | Consolidated Portfolio of Investments | |
September 30, 2014 |
| Principal | Value | |||||||||||
| Amount | (Note 2) | |||||||||||
| ||||||||||||
Commercial (continued) | ||||||||||||
Wachovia Bank Commercial Mortgage Trust | ||||||||||||
Series 2005-C20, 5.118% 07/15/2042(a) | $ | 153,815 | $ | 156,789 | ||||||||
Series 2005-C20, 5.179% 07/15/2042(a) | 100,000 | 103,340 | ||||||||||
Series 2005-C21, 5.414% 10/15/2044(a) | 157,206 | 162,035 | ||||||||||
|
| |||||||||||
Total Commercial | 2,184,523 | |||||||||||
|
| |||||||||||
U.S. Government Agency (0.71%) | ||||||||||||
Fannie Mae Connecticut Avenue Securities | ||||||||||||
Series 2014-C03, 1.355% 07/25/2024(a) | 172,529 | 171,371 | ||||||||||
|
| |||||||||||
TOTAL MORTGAGE-BACKED SECURITIES (Cost $2,397,554) | 2,355,894 | |||||||||||
|
| |||||||||||
MUNICIPAL BONDS (0.89%) | ||||||||||||
Jefferson County, Ohio Various Purpose, General Obligation Limited Refunding Bonds, | ||||||||||||
Series 2010, 1.500% 12/01/2014 | 50,000 | 50,039 | ||||||||||
State of California Pre-refunded Various Purpose, General Obligation Unlimited Bonds (AD Valorem Property Tax), | ||||||||||||
5.450% 04/01/2015 | 160,000 | 164,044 | ||||||||||
|
| |||||||||||
TOTAL MUNICIPAL BONDS (Cost $213,972) | 214,083 | |||||||||||
|
| |||||||||||
U.S. TREASURY NOTES & BONDS (8.64%) | ||||||||||||
U.S. Treasury Notes | ||||||||||||
0.375% 11/15/2014 | 850,000 | 850,382 | ||||||||||
0.250% 02/15/2015 | 1,230,000 | 1,231,033 | ||||||||||
|
| |||||||||||
TOTAL U.S. TREASURY NOTES & BONDS (Cost $2,080,911) | 2,081,415 | |||||||||||
|
| |||||||||||
7-Day Yield | Shares | Value (Note 2) | ||||||||||
| ||||||||||||
SHORT-TERM INVESTMENTS (13.36%) | ||||||||||||
Money Market Funds (13.36%) | ||||||||||||
Morgan Stanley Liquidity Fund - Prime Portfolio, Institutional Class | 0.04000 | % | 2,631,455 | 2,631,455 | ||||||||
Morgan Stanley Liquidity Fund - Tax-Exempt Portfolio, Institutional Class | 0.01000 | % | 589,377 | 589,377 | ||||||||
|
| |||||||||||
Total Money Market Funds | 3,220,832 | |||||||||||
|
| |||||||||||
| See Notes to Consolidated Financial Statements. | ||
Annual Report | September 30, 2014 | 13 | |
Table of Contents
| Insignia Macro Fund | Consolidated Portfolio of Investments | |
September 30, 2014 |
| 7-Day | Value | |||||||
| Yield | Shares | (Note 2) | ||||||
| ||||||||
TOTAL SHORT-TERM INVESTMENTS (Cost $ 3,220,832) | $ | 3,220,832 | ||||||
|
| |||||||
TOTAL INVESTMENTS (78.60%) (Cost $ 18,988,779) | $ | 18,944,935 | ||||||
Other Assets In Excess Of Liabilities (21.40%) | 5,157,350 (b) | |||||||
|
| |||||||
NET ASSETS (100.00%) | $ | 24,102,285 | ||||||
|
| |||||||
| (a) | Floating or variable rate security. Interest rate disclosed is that which is in effect at September 30, 2014. |
| (b) | Includes cash which is being held as collateral for swap contracts. |
Common Abbreviations:
GMTN - Global Medium Term Notes.
LLC - Limited Liability Company.
MTN - Medium Term Notes
PLC - Public Limited Company.
Sr. - Senior.
Sub. - Subordinated.
Unsec. - Unsecured.
For Fund compliance purposes, the Fund’s industry classifications refer to any one or more of the industry sub-classifications used by one or more widely recognized market indexes or ratings group indexes, and/or as defined by Fund management. This definition may not apply for purposes of this report, which may combine industry sub-classifications for reporting ease. Industries are shown as a percentage of net assets. (Unaudited)
| See Notes to Consolidated Financial Statements. | ||
14 | www.insigniafunds.com |
Table of Contents
| Insignia Macro Fund | Consolidated Portfolio of Investments | |
September 30, 2014 |
TOTAL RETURN SWAP CONTRACTS
Total return swap with Deutsche Bank AG, London Branch. The swap provides exposure to the total returns on a basket of independent managers, including commodity pools, that is calculated on a daily basis with reference to a customized index that is also proprietary to Deutsche Bank. The basket is comprised of a diversified collection of portfolios with global macroeconomic and managed futures trading strategies including discretionary and systematic trading programs. Under the terms of the swap, the adviser has the ability to periodically adjust the notional level of the swap, the notional allocation to each manager, and the mix of trading programs. The notional amount of the swap is the exposure to the movement of the net asset value of the underlying portfolios in the basket. The swap was effective on March 5, 2014 and has a term of five years there from unless earlier terminated. Early termination may be triggered by either party. In addition, the swap provides for a 0.50% fee to Deutsche Bank. (Notional Value $23,038,805)
Exposure by Manager
| Underlying Manager | Exposure | Strategy Description | ||||
H2O Asset Management | 17.58% | Discretionary Macro | Fundamental | ||||
Cambridge Strategy EM Alpha | 11.93% | Quantitative | Fundamental & Technical Models | ||||
Campbell FMEL | 11.90% | Quantitative | Trend & Non-Trend Strategies | ||||
QMS Diversified GM | 11.12% | Quantitative | Fundamental & Technical Models | ||||
Crabel Multi-Product | 10.84% | Quantitative | Short Term | ||||
Revolution Alpha | 10.81% | Quantitative | Short Term | ||||
Greenwave Flagship | 10.70% | Discretionary Macro | Fundamental | ||||
Romanesco Persistence Strategy | 9.29% | Quantitative | Short Term | ||||
Blackwater Global | 5.83% | Trend Follower | Pattern Recognition | ||||
| Unrealized Appreciation | ||||
Total Net Unrealized Appreciation on Swap Contract | $ | 898,093 | ||
|
| |||
| See Notes to Consolidated Financial Statements. | ||
Annual Report | September 30, 2014 | 15 | |
Table of Contents
| Insignia Macro Fund | Consolidated Statement of Assets and Liabilities | |
September 30, 2014 |
ASSETS: | ||||
Investments, at value (cost $18,988,779) | $ | 18,944,935 | ||
Cash | 79,388 | |||
Deposit with broker for swap contracts | 4,737,761 | |||
Receivable for swap contract payments | 249,006 | |||
Unrealized gain on swap contracts | 898,093 | |||
Receivable for shares sold | 17,184 | |||
Receivable due from adviser | 24,796 | |||
Interest and dividends receivable | 84,879 | |||
Prepaid offering costs | 6,100 | |||
Prepaid expenses and other assets | 3,175 | |||
|
| |||
Total Assets | 25,045,317 | |||
|
| |||
LIABILITIES: | ||||
Payable for investments purchased | 842,781 | |||
Payable for shares redeemed | 11,680 | |||
Professional fees payable | 44,819 | |||
Payable for legal fees | 18,233 | |||
Payable to trustees | 2,256 | |||
Payable to chief compliance officer | 2,084 | |||
Accrued expenses and other liabilities | 21,179 | |||
|
| |||
Total Liabilities | 943,032 | |||
|
| |||
NET ASSETS | $ | 24,102,285 | ||
|
| |||
NET ASSETS CONSIST OF: | ||||
Paid-in capital (Note 7) | $ | 23,023,493 | ||
Accumulated net investment income | 194,199 | |||
Accumulated net realized gain on investments and swap contracts | 30,344 | |||
Net unrealized appreciation on investments and swap contracts | 854,249 | |||
|
| |||
NET ASSETS | $ | 24,102,285 | ||
|
| |||
PRICING OF SHARES | ||||
Class A: | ||||
Net Asset Value, offering and redemption price per share | $ | 10.42 | ||
Net Assets | $ | 85,031 | ||
Shares of beneficial interest outstanding | 8,162 | |||
Maximum offering price per share (NAV/0.945, based on maximum sales charge of 5.50% of the offering price) | $ | 11.03 | ||
Class I: | ||||
Net Asset Value, offering and redemption price per share | $ | 10.42 | ||
Net Assets | $ | 24,017,254 | ||
Shares of beneficial interest outstanding | 2,305,159 | |||
| See Notes to Consolidated Financial Statements. | ||
16 | www.insigniafunds.com |
Table of Contents
| Insignia Macro Fund | Consolidated Statement of Operations | |
For the Period ended September 30, 2014(a) |
INVESTMENT INCOME: | ||||
Interest | $ | 84,617 | ||
Dividends | 737 | |||
|
| |||
Total Investment Income | 85,354 | |||
|
| |||
EXPENSES: | ||||
Investment advisory fee (Note 8) | 164,504 | |||
Administration fee | 113,273 | |||
Distribution and service fees | ||||
Class A | 86 | |||
Custodian fee | 6,223 | |||
Legal fees | 26,236 | |||
Audit fees | 18,350 | |||
Transfer agent fee | 30,858 | |||
Trustees fees and expenses | 9,883 | |||
Registration fees | 4,587 | |||
Printing fees | 7,234 | |||
Chief compliance officer fee | 18,750 | |||
Offering costs | 92,298 | |||
Other expenses | 10,760 | |||
|
| |||
Total Expenses | 503,042 | |||
|
| |||
Less fees waived/reimbursed by investment advisor | ||||
Class A | (27,075) | |||
Class I | (272,155) | |||
|
| |||
Total fees waived/reimbursed by investment adviser (Note 8) | (299,230) | |||
|
| |||
Less fees waived by Administrator (Note 8) | (6,320) | |||
|
| |||
Net Expenses | 197,492 | |||
|
| |||
NET INVESTMENT LOSS | (112,138) | |||
|
| |||
REALIZED AND UNREALIZED GAIN/(LOSS) ON INVESTMENTS: | ||||
Net realized gain/loss on: | ||||
Investments | (3,787) | |||
Swap contracts | 249,006 | |||
|
| |||
Net realized gain | 245,219 | |||
|
| |||
Change in unrealized appreciation/(depreciation) on: | ||||
Investments | (43,844) | |||
Swap contracts | 898,093 | |||
|
| |||
Net change | 854,249 | |||
|
| |||
NET REALIZED AND UNREALIZED GAIN ON INVESTMENTS AND SWAP CONTRACTS | 1,099,468 | |||
|
| |||
NET INCREASE IN NET ASSETS RESULTING FROM OPERATIONS | $ | 987,330 | ||
|
| |||
| (a) | Commenced operations on January 2, 2014. |
| See Notes to Consolidated Financial Statements. | ||
Annual Report | September 30, 2014 | 17 | |
Table of Contents
| Insignia Macro Fund | Consolidated Statement of Changes in Net Assets | |
For the Period Ended September 30, 2014(a) | ||||
| ||||
OPERATIONS | ||||
Net investment loss | $ | (112,138) | ||
Net realized loss on investments | (3,787) | |||
Net realized gain on swap contracts | 249,006 | |||
Net change in unrealized appreciation on investments and swap contracts | 854,249 | |||
|
| |||
Net increase in net assets resulting from operations | 987,330 | |||
|
| |||
BENEFICIAL SHARE TRANSACTIONS (Note 7) | ||||
Class A | ||||
Shares sold | 80,158 | |||
|
| |||
Net increase from beneficial share transactions | 80,158 | |||
|
| |||
Class I | ||||
Shares sold | 24,941,071 | |||
Shares redeemed | (1,908,664) | |||
Redemption fees | 2,390 | |||
|
| |||
Net increase from beneficial share transactions | 23,034,797 | |||
|
| |||
Net increase in net assets | 24,102,285 | |||
|
| |||
NET ASSETS | ||||
Beginning of period | – | |||
|
| |||
End of period (including accumulated net investment income of $194,199) | $ | 24,102,285 | ||
|
| |||
| (a) | Commenced operations on January 2, 2014. |
| See Notes to Consolidated Financial Statements. | ||
18 | www.insigniafunds.com |
Table of Contents
| Insignia Macro Fund - Class A | Consolidated Financial Highlights | |
For a share outstanding through the period presented. |
For the Period Ended September 30, 2014(a) | ||||
| ||||
NET ASSET VALUE, BEGINNING OF PERIOD | $ | 10.00 | ||
INCOME/(LOSS) FROM OPERATIONS: | ||||
Net investment loss(b) | (0.08) | |||
Net realized and unrealized gain on investments and swap contracts | 0.50 | |||
|
| |||
Total from Investment Operations | 0.42 | |||
|
| |||
NET INCREASE IN NET ASSET VALUE | 0.42 | |||
|
| |||
NET ASSET VALUE, END OF PERIOD | $ | 10.42 | ||
|
| |||
TOTAL RETURN(c) | 4.20% | |||
SUPPLEMENTAL DATA: | ||||
Net assets, End of Period (in 000s) | $ | 85 | ||
RATIOS TO AVERAGE NET ASSETS | ||||
Operating expenses excluding reimbursement/waiver | 80.48%(d) | |||
Operating expenses including reimbursement/waiver | 1.75%(d) | |||
Net investment loss including reimbursement/waiver | (1.03)%(d) | |||
PORTFOLIO TURNOVER RATE | 43%(e) | |||
| (a) | Commenced operations on January 2, 2014. |
| (b) | Per share amounts are based upon average shares outstanding. |
| (c) | Total return is for the period indicated and has not been annualized. The total return would have been lower had certain expenses not been reimbursed / waived during the period. The return shown does not reflect the deduction of taxes that a shareholder would pay on fund distributions or the redemption of fund shares. |
| (d) | Annualized. |
| (e) | Not annualized. |
| See Notes to Consolidated Financial Statements. | ||
Annual Report | September 30, 2014 | 19 | |
Table of Contents
| Insignia Macro Fund - Class I | Consolidated Financial Highlights | |
For a share outstanding through the period presented. |
For the Period Ended September 30, 2014(a) | ||||
| ||||
NET ASSET VALUE, BEGINNING OF PERIOD | $ | 10.00 | ||
INCOME/(LOSS) FROM OPERATIONS: | ||||
Net investment loss(b) | (0.06) | |||
Net realized and unrealized gain on investments and swap contracts | 0.48 | |||
|
| |||
Total from Investment Operations | 0.42 | |||
|
| |||
REDEMPTION FEES (Note 7) | 0.00 (c) | |||
|
| |||
NET INCREASE IN NET ASSET VALUE | 0.42 | |||
|
| |||
NET ASSET VALUE, END OF PERIOD | $ | 10.42 | ||
|
| |||
TOTAL RETURN(d) | 4.20% | |||
SUPPLEMENTAL DATA: | ||||
Net assets, End of Period (in 000s) | $ | 24,017 | ||
RATIOS TO AVERAGE NET ASSETS | ||||
Operating expenses excluding reimbursement/waiver | 3.62%(e) | |||
Operating expenses including reimbursement/waiver | 1.50%(e) | |||
Net investment loss including reimbursement/waiver | (0.85)%(e) | |||
PORTFOLIO TURNOVER RATE | 43%(f) | |||
| (a) | Commenced operations on January 2, 2014. |
| (b) | Per share amounts are based upon average shares outstanding. |
| (c) | Less than $0.005 per share. |
| (d) | Total return is for the period indicated and has not been annualized. The total return would have been lower had certain expenses not been reimbursed / waived during the period. The return shown does not reflect the deduction of taxes that a shareholder would pay on fund distributions or the redemption of fund shares. |
| (e) | Annualized. |
| (f) | Not annualized. |
| See Notes to Consolidated Financial Statements. | ||
20 | www.insigniafunds.com |
Table of Contents
| Insignia Macro Fund | Notes to Consolidated Financial Statements | |
September 30, 2014 |
1. ORGANIZATION
The ALPS Series Trust (the “Trust”), a Delaware statutory trust, is an open-end management investment company registered under the Investment Company Act of 1940 (the “1940 Act”). As of September 30, 2014, the Trust had nine registered funds. This annual report describes the Insignia Macro Fund (the “Fund”). The Fund’s primary investment objective is to seek long-term risk-adjusted total return. The Fund currently offers Class A shares and Class I Shares. All classes of shares have identical rights to earnings, assets and voting privileges, except for class specific expenses and exclusive rights to vote on matters affecting only individual classes. The Trust has an unlimited number of shares with no par value per share. The Board of Trustees (the “Board”) may establish additional funds and classes of shares at any time in the future without shareholder approval.
Basis of Consolidation
Insignia Global Macro Offshore Ltd. (the “Subsidiary”), a Cayman Islands exempted company, was incorporated on September 27, 2013 and is a wholly owned subsidiary of the Fund. The Subsidiary acts as an investment vehicle for the Fund in order to effect certain commodity-related investments on behalf of the Fund. The Fund is the sole shareholder of the Subsidiary, and it is intended that the Fund will remain the sole shareholder and will continue to wholly own and control the Subsidiary. Under the Articles of Association of the Subsidiary, shares issued by the Subsidiary confer upon a shareholder the right to vote at general meetings of the Subsidiary and certain rights in connection with any winding-up or repayment of capital, as well as the right to participate in the profits or assets of the Subsidiary. The Fund may invest up to 25% of its total assets in shares of the Subsidiary. As a wholly owned subsidiary of the Fund, the investments of the Subsidiary are included in the consolidated statements of investments and financial highlights of the Fund. All investments held by the Subsidiary are disclosed in the accounts of the Fund. As of September 30, 2014, net assets of the Fund were $24,102,285, of which $5,962,732, or 24.74%, represented the Fund’s ownership of all issued shares and voting rights of the Subsidiary.
2. SIGNIFICANT ACCOUNTING POLICIES
The accompanying financial statements were prepared in accordance with accounting principles generally accepted in the United States of America for investment companies (“U.S. GAAP”). The Fund is considered an investment company for financial reporting purposes. The preparation of financial statements in conformity with U.S. GAAP requires management to make certain estimates and assumptions that affect the reported amounts of assets and liabilities and disclosures of contingent assets and liabilities at the date of the financial statements and the reported amounts of revenue and expenses during the period. Actual results could differ from those estimates. The following is a summary of significant accounting policies consistently followed by the Fund in preparation of its financial statements.
Investment Valuation: The Fund generally values its securities based on market prices determined at the close of regular trading on the New York Stock Exchange (“NYSE”), normally 4:00 p.m. Eastern Time, on each day the NYSE is open for trading.
Over-the-counter swap contracts for which market quotations are readily available are valued based on quotes received from independent pricing services or dealers that make markets in such securities.
Annual Report | September 30, 2014 | 21 |
Table of Contents
| Insignia Macro Fund | Notes to Consolidated Financial Statements | |
September 30, 2014 |
Redeemable securities issued by open-end registered investment companies are valued at the investment company’s applicable net asset value with the exception of exchange-traded open-end investment companies, which are priced as equity securities.
The market price for debt obligations is generally the price supplied by an independent third-party pricing service approved by the Board, which may use a matrix, formula or other objective method that takes into consideration quotations from dealers, market transactions in comparable investments, market indices and yield curves. If vendors are unable to supply a price, or if the price supplied is deemed to be unreliable, the market price may be determined using quotations received from one or more broker dealers that make a market in the security.
When such prices or quotations are not available, or when the fair value committee appointed by the Board believes that they are unreliable, securities may be priced using fair value procedures approved by the Board.
Fair Value Measurements: The Fund discloses the classification of its fair value measurements following a three-tier hierarchy based on the inputs used to measure fair value. Inputs refer broadly to the assumptions that market participants would use in pricing the asset or liability, including assumptions about risk. Inputs may be observable or unobservable. Observable inputs reflect the assumptions market participants would use in pricing the asset or liability that are developed based on market data obtained from sources independent of the reporting entity. Unobservable inputs reflect the reporting entity’s own assumptions about the assumptions market participants would use in pricing the asset or liability that are developed based on the best information available.
Various inputs are used in determining the value of the Fund’s investments as of the end of the reporting period. When inputs used fall into different levels of the fair value hierarchy, the level in the hierarchy within which the fair value measurement falls is determined based on the lowest level input that is significant to the fair value measurement in its entirety. The designated input levels are not necessarily an indication of the risk or liquidity associated with these investments. These inputs are categorized in the following hierarchy under applicable financial accounting standards:
Level 1 – | Unadjusted quoted prices in active markets for identical investments, unrestricted assets or liabilities that the Fund has the ability to access at the measurement date; | |
Level 2 – | Quoted prices which are not active, quoted prices for similar assets or liabilities in active markets or inputs other than quoted prices that are observable (either directly or indirectly) for substantially the full term of the asset or liability; and | |
Level 3 – | Significant unobservable prices or inputs (including the Fund’s own assumptions in determining the fair value of investments) where there is little or no market activity for the asset or liability at the measurement date. | |
22 | www.insigniafunds.com |
Table of Contents
| Insignia Macro Fund | Notes to Consolidated Financial Statements | |
September 30, 2014 |
The following is a summary of the inputs used to value the Fund’s investments as of September 30, 2014:
| Investments in Securities at Value | Level 1 - Quoted Prices | Level 2 - Other Observable Inputs | Level 3 - Unobservable | Total | ||||||||||||
| ||||||||||||||||
Asset-Backed Securities | $ | – | $ | 2,070,895 | $ | – | $ | 2,070,895 | ||||||||
Corporate Bonds | ||||||||||||||||
Basic Materials | – | 977,161 | – | 977,161 | ||||||||||||
Communications | – | 1,375,545 | – | 1,375,545 | ||||||||||||
Consumer, Cyclical | – | 325,771 | – | 325,771 | ||||||||||||
Consumer, Non-cyclical | – | 1,242,442 | – | 1,242,442 | ||||||||||||
Energy | – | 928,442 | – | 928,442 | ||||||||||||
Financial | – | 3,151,168 | – | 3,151,168 | ||||||||||||
Government | – | 142,043 | – | 142,043 | ||||||||||||
Industrial | – | 176,520 | – | 176,520 | ||||||||||||
Technology | – | 172,404 | – | 172,404 | ||||||||||||
Utilities | – | 510,320 | – | 510,320 | ||||||||||||
Mortgage-Backed Securities | – | 2,355,894 | – | 2,355,894 | ||||||||||||
Municipal Bond | – | 214,083 | – | 214,083 | ||||||||||||
Short-Term Investments | 3,220,832 | – | – | 3,220,832 | ||||||||||||
U.S. Treasury Notes & Bonds | – | 2,081,415 | – | 2,081,415 | ||||||||||||
| ||||||||||||||||
TOTAL | $ | 3,220,832 | $ | 15,724,103 | $ | – | $ | 18,944,935 | ||||||||
| ||||||||||||||||
| Valuation Inputs | ||||||||||||||||
| Other Financial Instruments | Level 1 | Level 2 | Level 3 | Total | ||||||||||||
Assets: | ||||||||||||||||
Total Return Swap | $ | – | $ | 898,093 | $ | – | $ | 898,093 | ||||||||
| ||||||||||||||||
TOTAL | $ | – | $ | 898,093 | $ | – | $ | 898,093 | ||||||||
| ||||||||||||||||
The Fund recognizes transfers between levels as of the end of the fiscal year. For the period ended September 30, 2014, the Fund did not have any transfers between Level 1 and Level 2 securities. There were no Level 3 securities held during the period.
Offering Costs: The Fund incurred offering costs during the period ended September 30, 2014. These offering costs, including fees for printing initial prospectuses, legal, and registration fees, are being amortized over the first twelve months from the inception date of the Fund. Amounts amortized through September 30, 2014 are shown on the Fund’s Statement of Operations and amounts that remain to be amortized are shown on the Fund’s Statement of Assets and Liabilities.
Fund Expenses: Some expenses can be directly attributed to the Fund and are apportioned among the classes based on average net assets of each class.
Trust Expenses: Some expenses of the Trust can be directly attributed to the Fund. Expenses which cannot be directly attributed to the Fund are apportioned among all funds in the Trust based on average net assets of each fund.
Annual Report | September 30, 2014 | 23 |
Table of Contents
| Insignia Macro Fund | Notes to Consolidated Financial Statements | |
September 30, 2014 |
Class Expenses: Expenses that are specific to a class of shares are charged directly to that share class. Fees provided under the distribution (Rule 12b-1) and/or shareholder service plans for a particular class of the Fund are charged to the operations of such class.
Federal Income Taxes: The Fund complies with the requirements under Subchapter M of the Internal Revenue Code of 1986 applicable to regulated investment companies and intends to distribute substantially all of its net taxable income and net capital gains, if any, each year so that it will not be subject to excise tax on undistributed income and gains. The Fund is not subject to income taxes to the extent such distributions are made.
As of and during the period ended September 30, 2014, the Fund did not have a liability for any unrecognized tax benefits in the accompanying financial statements. The Fund files U.S. federal, state and local income tax returns as required. The Fund’s tax returns are subject to examination by the relevant tax authorities until expiration of the applicable statute of limitations, which is generally three years after the filing of the tax return for federal purposes and four years for most state returns. The Fund’s Administrator has analyzed the Fund’s tax positions taken on federal and state income tax returns for all open tax years and has concluded that as of September 30, 2014, no provision for income tax is required in the Fund’s financial statements related to these tax positions.
Investment Transactions and Investment Income: Investment transactions are accounted for on the date the investments are purchased or sold (trade date basis). Realized gains and losses from investment transactions are reported on an identified cost basis. Interest income, which includes accretion of discounts and amortization of premiums, is accrued and recorded as earned. Dividend income is recognized on the ex-dividend date, or for certain foreign securities, as soon as information is available to the Fund. All of the realized and unrealized gains and losses and net investment income are allocated daily to each class in proportion to its average daily net assets.
Foreign Securities: The Fund may directly purchase securities of foreign issuers. Investing in securities of foreign issuers involves special risks not typically associated with investing in securities of U.S. issuers. The risks include possible reevaluation of currencies, the inability to repatriate foreign currency, less complete financial information about companies and possible future adverse political and economic developments. Moreover, securities of many foreign issuers and their markets may be less liquid and their prices more volatile than those of securities of comparable U.S. issuers.
Foreign Currency Translation: The books and records of the Fund are maintained in U.S. dollars. Investment valuations and other assets and liabilities initially expressed in foreign currencies are converted each business day into U.S. dollars based upon current exchange rates. The portion of realized and unrealized gains or losses on investments due to fluctuations in foreign currency exchange rates is not separately disclosed and is included in realized and unrealized gains or losses on investments, when applicable.
Foreign Exchange Transactions: The Fund may enter into foreign currency spot contracts to facilitate transactions in foreign securities or to convert foreign currency receipts into U.S. dollars. A foreign currency spot contract is an agreement between two parties to buy and sell currencies at the current market rate, for settlement generally within two business days. The U.S. dollar value of
24 | www.insigniafunds.com |
Table of Contents
| Insignia Macro Fund | Notes to Consolidated Financial Statements | |
September 30, 2014 |
the contracts is determined using current currency exchange rates supplied by a pricing service. The contract is marked-to-market daily for settlements beyond one day and any change in market value is recorded as an unrealized gain or loss. When the contract is closed, the Fund records a realized gain or loss equal to the difference between the value on the open and close date. Losses may arise from changes in the value of the foreign currency, or if the counterparties do not perform under the contract’s terms. The maximum potential loss from such contracts is the aggregate face value in U.S. dollars at the time the contract was opened.
Distributions to Shareholders: The Fund normally pays dividends, if any, and distributes capital gains, if any, on an annual basis. Income dividend distributions are derived from interest and other income the Fund receives from its investments, including short term capital gains. Long term capital gain distributions are derived from gains realized when the Fund sells a security it has owned for more than one year. The Fund may make additional distributions and dividends at other times if its portfolio manager or managers believe doing so may be necessary for the Fund to avoid or reduce taxes. Net investment income/(loss) and net realized gain/(loss) may differ for financial statement and tax purposes.
3. DERIVATIVE INSTRUMENTS
The Fund’s investment objectives permit the Fund to enter into various types of derivatives contracts, including, but not limited to, total return swaps and structured notes. In doing so, the Fund will employ strategies in differing combinations to permit it to increase, decrease, or change the level or types of exposure to market factors. Central to those strategies are features inherent in derivatives that make them more attractive for this purpose than equity or debt securities; they require little or no initial cash investment, they can focus exposure on only certain selected risk factors, and they may not require the ultimate receipt or delivery of the underlying security (or securities) to the contract. This may allow the Fund to pursue its objectives more quickly and efficiently than if it were to make direct purchases or sales of securities capable of affecting a similar response to market factors.
Risk of Investing in Derivatives: The Fund’s use of derivatives can result in losses due to unanticipated changes in the market risk factors and the overall market. In instances where the Fund is using derivatives to decrease, or hedge, exposures to market risk factors for securities held by the Fund, there are also risks that those derivatives may not perform as expected resulting in losses for the combined or hedged positions.
Derivatives may have little or no initial cash investment relative to their market value exposure and therefore can produce significant gains or losses in excess of their cost. This use of embedded leverage allows the Fund to increase its market value exposure relative to its net assets and can substantially increase the volatility of the Fund’s performance.
Additional associated risks from investing in derivatives also exist and potentially could have significant effects on the valuation of the derivative and the Fund. Typically, the associated risks are not the risks that the Fund is attempting to increase or decrease exposure to, per its investment objective, but are the additional risks from investing in derivatives.
Annual Report | September 30, 2014 | 25 |
Table of Contents
| Insignia Macro Fund | Notes to Consolidated Financial Statements | |
September 30, 2014 |
Examples of these associated risks are liquidity risk, which is the risk that the Fund will not be able to sell or close out the derivative in a timely manner, and counterparty credit risk, which is the risk that the counterparty will not fulfill its obligation to the Fund. In addition, use of derivatives may increase or decrease exposure to the following risk factors:
Equity Risk: Equity risk relates to the change in value of equity securities as they relate to increases or decreases in the general market. Associated risks can be different for each type of derivative and are discussed by each derivative type in the notes that follow.
Commodity Risk: Exposure to the commodities markets may subject the Fund to greater volatility than investments in traditional securities. Prices of various commodities may also be affected by factors, such as drought, floods, weather, livestock disease, embargoes, tariffs and other regulatory developments, which are unpredictable. The prices of commodities can also fluctuate widely due to supply and demand disruptions in major producing or consuming regions.
Foreign Currency Risk: Currency trading involves significant risks, including market risk, interest rate risk, country risk, counterparty credit risk and short sale risk. Market risk results from the price movement of foreign currency values in response to shifting market supply and demand.
Interest Rate Risk: Interest rate risk is the risk that fixed income securities will decline in value because of changes in interest rates. As nominal interest rates rise, the value of fixed income securities held by the Fund are likely to decrease. Securities with longer durations tend to be more sensitive to changes in interest rates, and are usually more volatile than equity securities.
Swap Contracts: The Fund may enter into swap transactions to seek to increase total return. Risks may arise as a result of the failure of the counterparty to the swap contract to comply with the terms of the swap contract. The loss incurred by the failure of a counterparty is generally limited to the net payment to be received by the Fund and/or the termination value at the end of the contract.
Therefore, the Fund considers the creditworthiness of each counterparty to a contract in evaluating potential credit risk. Additionally, risks may arise from unanticipated movements in interest rates or in the value of the underlying reference asset or index. Entering into these agreements involves, to varying degrees, market risk, liquidity risk and elements of credit, legal and documentation risk that are not directly reflected in the amounts recognized in the Consolidated Statement of Assets and Liabilities.
The Fund may pay or receive cash as collateral on these contracts which may be recorded as an asset and/or liability. The Fund must set aside liquid assets, or engage in other appropriate measures, to cover its obligations under these contracts. Swaps are marked to market daily using either pricing vendor quotations, counterparty prices or model prices and the change in value, if any, is recorded as an unrealized gain or loss. Upfront payments made and/or received by the Fund are recorded as an asset and/or liability and realized gains or losses are recognized ratably over the contract’s term/event, with the exception of forward starting interest rate swaps, whose
26 | www.insigniafunds.com |
Table of Contents
| Insignia Macro Fund | Notes to Consolidated Financial Statements | |
September 30, 2014 |
realized gains or losses are recognized ratably from the effective start date. Periodic payments received or made on swap contracts are recorded as realized gains or losses. Gains or losses are realized upon termination of a swap contract and are recorded on the Statement of Operations.
The Fund invests in total return swaps to obtain exposure to a security or market without owning such security or investing directly in that market. Total return swaps are agreements in which there is an exchange of cash flows whereby one party commits to make payments based on the total return (coupons plus capital gains/losses) of an underlying instrument in exchange for fixed or floating rate interest payments. To the extent the total return of the instrument or index underlying the transaction exceeds or falls short of the offsetting interest rate obligation, the Fund will receive a payment from or make a payment to the counterparty. Swap agreements held at September 30, 2014 are disclosed in the Consolidated Portfolio of Investments.
The notional of swap contracts held at September 30, 2014 is representative of swap contract activity for the period ended September 30, 2014.
Derivative Instruments: The following tables disclose the amounts related to the Fund’s use of derivative instruments.
The effect of derivative instruments on the Consolidated Statement of Assets and Liabilities as of September 30, 2014:
| Asset | ||||||||||
| Derivatives | ||||||||||
| Consolidated Statement of | Gross | Liability Derivatives | ||||||||
| Assets and Liabilities | Unrealized | Gross Unrealized | ||||||||
| Risk Exposure | Location | Appreciation | Depreciation | |||||||
| ||||||||||
Commodity Contracts | Unrealized appreciation on swap contracts | $ | 898,093 | $ | – | |||||
| ||||||||||
Total | $ | 898,093 | $ | – | ||||||
| ||||||||||
The effect of derivative instruments on the Consolidated Statement of Operations for the period ended September 30, 2014:
| Change in Unrealized | ||||||||||
| Consolidated Statement | Realized Gain on | Appreciation on | ||||||||
| Risk Exposure | of Operations Location | Derivatives Recognized | Derivatives Recognized | |||||||
| ||||||||||
Commodity Contracts | Net realized gain on Swap Contracts/Change in unrealized appreciation on swap contracts | $ | 249,006 | $ | 898,093 | |||||
| ||||||||||
Total | $ | 249,006 | $ | 898,093 | ||||||
| ||||||||||
Annual Report | September 30, 2014 | 27 |
Table of Contents
| Insignia Macro Fund | Notes to Consolidated Financial Statements | |
September 30, 2014 |
4. OFFSETTING AGREEMENTS
Certain derivative contracts are executed under standardized netting agreements. A derivative netting arrangement creates an enforceable right of set-off that becomes effective, and affects the realization of settlement on individual assets, liabilities and collateral amounts, only following a specified event of default or early termination. Default events may include the failure to make payments or deliver securities timely, material adverse changes in financial condition or insolvency, the breach of minimum regulatory capital requirements, or loss of license, charter or other legal authorization necessary to perform under the contract. The Fund may manage counterparty risk by entering into enforceable collateral arrangements with counterparties to securities lending agreements. These agreements mitigate counterparty credit risk by providing for a single net settlement with a counterparty of all financial transactions covered by the agreement in an event of default as defined under such agreement.
The following table presents derivative financial instruments and securities lending arrangements that are subject to enforceable netting arrangements, collateral arrangements or other similar agreements as of September 30, 2014.
| Gross Amounts Not Offset in the | ||||||||||||||||||
| Statement of Assets and Liabilities | ||||||||||||||||||
| Gross | Net Amounts | |||||||||||||||||
| Amounts | Presented in | |||||||||||||||||
| Offset in the | the | |||||||||||||||||
| Gross | Consolidated | Consolidated | ||||||||||||||||
| Amounts of | Statement of | Statement of | Cash | |||||||||||||||
| Recognized | Assets and | Assets and | Financial | Collateral | Net Amount | |||||||||||||
| Description | Assets | Liabilities | Liabilities | Instruments (a) | Received(a) | Receivable | ||||||||||||
| ||||||||||||||||||
Assets | ||||||||||||||||||
Total Return | ||||||||||||||||||
Swaps | $ | 898,093 | $– | $ | 898,093 | $– | $– | $ | 898,093 | |||||||||
| ||||||||||||||||||
Total | $ | 898,093 | $– | $ | 898,093 | $– | $– | $ | 898,093 | |||||||||
| ||||||||||||||||||
| (a) | These amounts are limited to the derivative liability balance and, accordingly, do not include excess collateral pledged. |
5. TAX BASIS INFORMATION
Tax Basis of Distributions to Shareholders: The character of distributions made during the period from net investment income or net realized gains may differ from its ultimate characterization for federal income tax purposes. Also, due to the timing of dividend distributions, the fiscal year in which amounts are distributed may differ from the fiscal year in which the income or realized gain were recorded by the Fund. The amounts and characteristics of tax basis distributions and composition of distributable earnings/(accumulated losses) are finalized at fiscal year-end. There were no distributions paid by the Fund for the period ended September 30, 2014.
28 | www.insigniafunds.com |
Table of Contents
| Insignia Macro Fund | Notes to Consolidated Financial Statements | |
September 30, 2014 |
Reclassifications: As of September 30. 2014, permanent differences in book and tax accounting were reclassified. The following reclassifications, which had no impact on results of operations or net assets, were recorded to reflect tax character:
| Accumulated Net | ||||||||||||
| Accumulated Net | Realized Loss on | |||||||||||
| Paid-in Capital | Investment Gain | Investments | ||||||||||
| ||||||||||||
| $ | (91,462) | $ | 306,337 | $ | (214,875) | |||||||
These differences are primarily attributed to the different tax treatment of foreign currency and organizational costs.
Tax Basis of Investments: As of September 30, 2014, the aggregate cost of investments, gross unrealized appreciation/(depreciation) and net unrealized appreciation for Federal tax purposes was as follows:
Gross unrealized appreciation (excess of value over tax cost) | $ | 3,929 | ||
Gross unrealized depreciation (excess of tax cost over value) | (47,773) | |||
Net appreciation of foreign currency and derivatives | 898,093 | |||
| ||||
Net unrealized appreciation | $ | 854,249 | ||
| ||||
Cost of investments for income tax purposes | $ | 18,988,779 | ||
| ||||
Components of Distributable Earnings: At September 30, 2014, components of distributable earnings were as follows:
Undistributed ordinary income | $ | 224,543 | ||
Net unrealized appreciation on investments | 854,249 | |||
| ||||
Total | $ | 1,078,792 | ||
| ||||
Capital Losses: As of September 30, 2014, the Fund had no accumulated capital loss carryforwards.
6. SECURITIES TRANSACTIONS
Purchases and sales of securities, excluding short-term securities, during the period ended September 30, 2014 were as follows:
| Purchases of Securities | Proceeds From Sales of Securities | |||||
|
| |||||
| $ | 19,460,320 | $ | 5,631,873 | |||
|
| |||||
Purchases and sales of U.S. Government Obligations during the period ended September 30, 2014 were as follows:
| Purchases of Securities | Proceeds From Sales of Securities | |||||
|
| |||||
| $ | 3,333,791 | $ | 1,250,733 | |||
|
| |||||
Annual Report | September 30, 2014 | 29 |
Table of Contents
| Insignia Macro Fund | Notes to Consolidated Financial Statements | |
September 30, 2014 |
7. BENEFICIAL SHARE TRANSACTIONS
The capitalization of the Trust consists of an unlimited number of shares of beneficial interest with no par value per share. Holders of the shares of the Fund have one vote for each share held and a proportionate fraction of a vote for each fractional share. All shares issued and outstanding are fully paid and are non-assessable, transferable and redeemable at the option of the shareholder. Shares have no pre-emptive rights.
Shares redeemed within 60 days of purchase may incur a 1.00% short-term redemption fee deducted from the redemption amount. For the period ended September 30, 2014, the redemption fees charged by the Fund are presented in the Statements of Changes in Net Assets.
Transactions in common shares were as follows:
| For the Period | ||||||
| Ended | ||||||
| September 30, 2014(a) | ||||||
| ||||||
Class A: | ||||||
Shares sold | 8,162 | |||||
| ||||||
Net increase from share transactions | 8,162 | |||||
| ||||||
Class I: | ||||||
Shares sold | 2,498,179 | |||||
Shares redeemed | (193,020) | |||||
| ||||||
Net increase from share transactions | 2,305,159 | |||||
| ||||||
| (a) | Commenced operations on January 2, 2014. |
Control is defined by the 1940 Act as the beneficial ownership, either directly or through one or more controlled companies, of more than 25% of the voting securities of a company. The Fund has two unaffiliated shareholders representing approximately 93% of total Fund shares. Investment activities of these shareholders could have a material impact on the Fund.
8. MANAGEMENT AND RELATED PARTY TRANSACTIONS
Investment Advisory: Meritage Capital, LLC (“Meritage Capital” or the “Adviser”), subject to the authority of the Board, is responsible for the overall management and administration of the Fund’s business affairs. The Adviser has delegated a portion of the daily management of the Fund to Sage Advisory Services, Ltd. Co. (the “Sub-Adviser”). The Adviser and the Sub-Adviser manage the investments of the Fund in accordance with the Fund’s investment objective, policies and limitations and investment guidelines established jointly by the Adviser and the Trustees.
Pursuant to the Investment Advisory Agreement (the “Advisory Agreement”) with the Adviser, the Fund pays the Adviser an annual management fee of 1.25%. Pursuant to an Investment Sub-Advisory Agreement (the “Sub-Advisory Agreement”), the Adviser pays the Sub-Adviser an annual sub-advisory management fee of 0.10% for the first $25 million, 0.18% basis points for the
30 | www.insigniafunds.com |
Table of Contents
| Insignia Macro Fund | Notes to Consolidated Financial Statements | |
September 30, 2014 |
subsequent $25 million and 0.10% basis points once assets have reached over $50 million, with a minimum annual fee of $25,000. These management fees are based on the Fund’s average daily net assets during the month and are paid on a monthly basis. The Adviser is required to pay all fees due to the Sub-Adviser out of the management fee the Adviser receives from the Fund. The initial term for both the Advisory Agreement and Sub-Advisory Agreement is two years. The Board may extend the Advisory Agreement and/or the Sub-Advisory Agreement for additional one-year terms. The Board, shareholders of the Fund or the Adviser may terminate the Advisory Agreement or the Sub-Advisory Agreement upon 60 days’ notice.
Pursuant to a fee waiver letter agreement (the “Fee Waiver Agreement”), the Adviser has contractually agreed to limit the amount of the Fund’s Total Annual Fund Operating Expenses, exclusive of Distribution and Service (12b-1) fees, Shareholder Service Fees, Acquired Fund Fees and Expenses, brokerage expenses, interest expenses, taxes and extraordinary expenses, to 1.75% and 1.50% of the Fund’s average daily net assets for Class A and Class I shares, respectively. The Fee Waiver Agreement is in effect through January 31, 2015. The Adviser will be permitted to recover, on a class-by-class basis, expenses it has borne through the Fee Waiver Agreement to the extent that the Fund’s expenses in later periods fall below the annual rates set forth in the Fee Waiver Agreement. The Fund will not be obligated to pay any such deferred fees and expenses more than three years after the end of the fiscal year in which the fees and expense were deferred. The Adviser may not discontinue the Fee Waiver Agreement without the approval by the Fund’s Board.
For the fiscal year ended September 30, 2014, the fee waivers and/or reimbursements were as follows:
| Fees | ||||
| Waived/Reimbursed | ||||
| by Adviser | ||||
| ||||
Class A | $ | (27,091) | ||
Class I | (278,459) | |||
| ||||
TOTAL | $ | (305,550) | ||
| ||||
As of September 30, 2014, the balances of recoupable expenses were as follows:
| Expires 2017 | ||||
| ||||
Class A | $ | (27,075) | ||
Class I | (272,155) | |||
Administrator: ALPS Fund Services, Inc (“ALPS”) (an affiliate of ALPS Distributors, Inc.) serves as administrator to the Fund. The Fund has agreed to pay expenses incurred in connection with its administrative activities. Pursuant to the Administration, Bookkeeping and Pricing Services Agreement with the Trust, ALPS will provide operational services to the Fund including, but not limited to, fund accounting and fund administration and generally assist in the Fund’s operations.
Annual Report | September 30, 2014 | 31 |
Table of Contents
| Insignia Macro Fund | Notes to Consolidated Financial Statements | |
September 30, 2014 |
The Fund’s administration fee is accrued on a daily basis and paid on a monthly basis following the end of the month, based on the greater of (a) an annual total fee of $115,000 in year 1 of operations and $130,000 in year 2; or (b) the following basis point fee schedule:
| Average Total Net Assets | Contractual Fee | ||||||
Between $0-$250M | 0.10 | % | |||||
$250M-$500M | 0.07 | % | |||||
Above $500M | 0.03 | % | |||||
Annually thereafter, the parties agree to reevaluate the compensation paid under the agreement by the Trust on behalf of the fund to ALPS for the services it performs for the Fund.
ALPS is reimbursed by the Fund for certain out-of-pocket expenses. ALPS has agreed to reimburse the Fund for expenses relating to insurance and certain routine legal services for the fiscal period ended September 30, 2014.
Transfer Agent: ALPS serves as transfer agent for the Fund under a Transfer Agency and Services Agreement with the Trust. Under this agreement, ALPS is paid an annual base fee of $25,000 for services performed on behalf of the Fund plus fees for open accounts and is reimbursed for certain out-of-pocket expenses.
Compliance Services: ALPS provides services as the Fund’s Chief Compliance Officer to monitor and test the policies and procedures of the Fund in conjunction with requirements under Rule 38a-1 under the 1940 Act pursuant to a Chief Compliance Officer Services Agreement with the Trust. Under this agreement, ALPS is paid an annual base fee of $25,000 for services performed on behalf of the Fund and is reimbursed for certain out-of-pocket expenses.
Distributor: ALPS Distributors, Inc. (the “Distributor”) (an affiliate of ALPS Fund Services, Inc.) acts as the principal underwriter of the Fund’s shares pursuant to a Distribution Agreement with the Trust. Shares of the Fund are offered on a continuous basis through the Distributor, as agent of the Fund. The Distributor is not obligated to sell any particular amount of shares and is not entitled to any compensation for its services as the Fund’s principal underwriter.
The Fund has adopted a separate plan of distribution for Class A shares pursuant to Rule 12b-1 under the 1940 Act (the “Plan”). The Plan allows the Fund to use Class A assets to pay fees in connection with the distribution and marketing of Class A shares and/or the provision of shareholder services to Class A shareholders. The Plan permits payment for services in connection with the administration of plans or programs that use Class A shares of the Fund as their funding medium and for related expenses. The Plan permits the Fund to make total payments at an annual rate of up to 0.25% of a Fund’s average daily net assets attributable to its Class A shares. Because these fees are paid out of the Fund’s Class A assets on an ongoing basis, over time they will increase the cost of an investment in Class A shares, and Plan fees may cost an investor more than other types of sales charges. Plan fees are shown as distribution and service fees on the Statement of Operations.
32 | www.insigniafunds.com |
Table of Contents
| Insignia Macro Fund | Notes to Consolidated Financial Statements | |
September 30, 2014 |
9. TRUSTEES
As of September 30, 2014, there were four Trustees, three of whom are not “interested persons” (as defined in the 1940 Act) of the Trust (the “Independent Trustees”). Prior to October 1, 2014, the Independent Trustees received a quarterly retainer of $2,000, plus $1,000 for each regular Board or Committee meeting attended, $1,000 for each special telephonic Board or Committee meeting attended and $1,000 for each special in-person Board meeting attended. Effective October 1, 2014, the Independent Trustees receive a quarterly retainer of $4,000, plus $2,000 for each regular Board or Committee meeting attended, $2,000 for each special telephonic Board or Commission meeting attended and $2,000 for each special in-person Board meeting attended. The Independent Trustees are also reimbursed for all reasonable out-of-pocket expenses relating to attendance at meetings and for meeting-related expenses. Officers of the Trust and Trustees who are interested persons of the Trust receive no salary or fees from the Trust.
10. INDEMNIFICATIONS
Under the Trust’s organizational documents, its officers and Trustees are indemnified against certain liabilities arising out of the performance of their duties to the Trust. Additionally, in the normal course of business, the Trust enters into contracts with service providers that may contain general indemnification clauses which may permit indemnification to the extent permissible under applicable law. The Trust’s maximum exposure under these arrangements is unknown, as this would involve future claims that may be made against the Trust that have not yet occurred.
11. CHANGES IN ACCOUNTANTS
On June 30, 2014, KPMG LLP acquired certain assets of ROTHSTEIN-KASS, P.A. (d/b/a Rothstein Kass & Company, P.C.) and certain of its affiliates (“Rothstein Kass”), the independent public accounting firm for the Fund. As a result of this transaction, on June 30, 2014, Rothstein Kass resigned as the independent registered public accounting firm for the Funds. As the Fund commenced operations on January 2, 2014 and the Fund’s fiscal year end is September 30th, there are no financial statements for the Fund for the fiscal year ended September 30, 2013.
The Board of Trustees of the Trust approved the selection of KPMG LLP to serve as the Fund’s independent registered public accounting firm for the Funds’ fiscal year ending September 30, 2014 at an in-person meeting held on August 22, 2014.
Annual Report | September 30, 2014 | 33 |
Table of Contents
| Insignia Macro Fund | Report of Independent Registered Public Accounting Firm |
The Board of Trustees and Shareholders
ALPS Series Trust:
We have audited the accompanying consolidated statement of assets and liabilities of Insignia Marco Fund and subsidiary, including the consolidated portfolio of investments, as of September 30, 2014, and the related consolidated statement of operations, the consolidated statement of changes in net assets, and the consolidated financial highlights for the period from January 2, 2014 (commencement of operations) to September 30, 2014. These consolidated financial statements and financial highlights are the responsibility of the Fund’s management. Our responsibility is to express an opinion on these consolidated financial statements and financial highlights based on our audit.
We conducted our audit in accordance with the standards of the Public Company Accounting Oversight Board (United States). Those standards require that we plan and perform the audit to obtain reasonable assurance about whether the financial statements and financial highlights are free of material misstatement. An audit includes examining, on a test basis, evidence supporting the amounts and disclosures in the financial statements. Our procedures included confirmation of securities owned as of September 30, 2014, by correspondence with custodians and brokers, or by other appropriate auditing procedures where replies from brokers were not received. An audit also includes assessing the accounting principles used and significant estimates made by management, as well as evaluating the overall financial statement presentation. We believe that our audit provides a reasonable basis for our opinion.
In our opinion, the consolidated financial statements and financial highlights referred to above present fairly, in all material respects, the financial position of Insignia Macro Fund and subsidiary as of September 30, 2014, the results of their operations, the changes in their net assets, and the consolidated financial highlights for the period from January 2, 2014 (commencement of operations) to September 30, 2014, in conformity with U.S. generally accepted accounting principles.
KPMG LLP
Denver, Colorado
November 24, 2014
34 | www.insigniafunds.com |
Table of Contents
| Insignia Macro Fund | Additional Information | |
September 30, 2014 (Unaudited) |
1. PROXY VOTING POLICIES AND VOTING RECORD
A description of the policies and procedures that the Fund uses to determine how to vote proxies relating to portfolio securities is available without charge, upon request, (i) by calling the Fund (toll-free) at 1-855-674-4642 or (ii) on the Securities and Exchange Commission’s the (“SEC”) website at http://www.sec.gov. Information regarding how the Fund voted proxies relating to portfolio securities during the most recent 12-month period ended June 30, 2014 will be available (i) without charge, upon request, by calling the Fund (toll-free) at 1-855-674-4642 or (ii) on the SEC’s website at http://www.sec.gov.
2. PORTFOLIO HOLDINGS
The Fund files its complete schedule of portfolio holdings with the SEC for the first and third quarters of each fiscal year on Form N-Q. The Fund’s Forms N-Q are available on the SEC website at http://www.sec.gov. The Fund’s Forms N-Q may be reviewed and copied at the SEC’s Public Reference Room in Washington, D.C., and information on the operation of the Public Reference Room may be obtained by calling 1-800-SEC-0330.
Annual Report | September 30, 2014 | 35 |
Table of Contents
| Insignia Macro Fund | Trustees and Officers | |
September 30, 2014 (Unaudited) |
INDEPENDENT TRUSTEES
| Number of | ||||||||||
| Funds in | ||||||||||
| Fund | Other | |||||||||
| Term of | Complex | Directorships | ||||||||
| Name, | Position(s) | Office and | Overseen | Held by | ||||||
| Birth Year | Held with | Length of | Principal Occupation(s) | by | Trustee During | |||||
| & Address* | Fund | Time Served | During Past 5 Years** | Trustee*** | Past 5 Years** | |||||
| Cheryl Burgermeister Birth year: 1951 | Trustee | Ms. Burgermeister was elected to the Board on October 30, 2012; indefinite term. | Ms. Burgermeister is Trustee and Audit Committee Chair of The Select Sector SPDR Trust (October 1998 to present), Trustee of Russell Investment Funds (September 2012 to present) and Trustee, Treasurer and Finance Committee Chair of the Portland Community College Foundation (January 2001 to present). She also served as Trustee and Audit Committee Chair of E*Trade Funds (March 2004 to March 2010), Trustee of Zero Gravity Internet Fund (May 2000 to December 2001), Director and Treasurer of Crabbe Huson Family of Funds (1998 to 1999) and Director, Chief Financial Officer and Treasurer of The Crabbe Huson Group, Inc. (July 1987 to October 1999). From 1982 to 1986, Ms. Burgermeister was Supervising Senior Accountant at KPMG Peat Marwick. Ms. Burgermeister a licensed Certified Public Accountant and a member of the Oregon Society of Certified Public Accountants. | 9 | Ms. Burgermeister is a Trustee and Audit Committee Chair of The Select Sector SPDR Trust (9 ETFs) and Trustee of Russell Investment Funds (42 funds). |
| * | All communications to Trustees and Officers may be directed to ALPS Series Trust c/o 1290 Broadway, Suite 1100, Denver, CO 80203. |
| ** | Except as otherwise indicated, each individual has held the office shown or other offices in the same company for the last five years. |
| *** | The Fund Complex currently consists of nine series of the Trust and any other investment companies for which Meritage Capital, LLC and Sage Advisory Services, Ltd. Co. provide investment advisory services, currently none. |
36 | www.insigniafunds.com |
Table of Contents
| Insignia Macro Fund | Trustees and Officers | |
September 30, 2014 (Unaudited) |
INDEPENDENT TRUSTEES (continued)
| Number | ||||||||||
| of Funds | Other | |||||||||
| in Fund | Directorships | |||||||||
| Term of | Complex | Held by | ||||||||
| Name, | Position(s) | Office and | Overseen | Trustee | ||||||
| Birth Year | Held with | Length of | Principal Occupation(s) | by | During Past 5 | |||||
| & Address* | Fund | Time Served | During Past 5 Years** | Trustee*** | Years** | |||||
J. Wayne Hutchens Birth year: 1944 | Trustee | Mr. Hutchens was elected to the Board on October 30, 2012; indefinite term. | Mr. Hutchens is currently retired. From April 2006 to December 2012, he served as President and CEO of the University of Colorado (CU) Foundation and from April 2009 to December 2012, he was Executive Director of the CU Real Estate Foundation. Mr. Hutchens is also Trustee of the Denver Museum of Nature and Science (2000 to present), Director of AMG National Trust Bank (June 2012 to present) and Trustee of Children’s Hospital Colorado (May 2012 to present). Prior to these positions, Mr. Hutchens spent 29 years in the banking industry, retiring as Chairman of Chase Bank Colorado. | 9 | None. |
| * | All communications to Trustees and Officers may be directed to ALPS Series Trust c/o 1290 Broadway, Suite 1100, Denver, CO 80203. |
| ** | Except as otherwise indicated, each individual has held the office shown or other offices in the same company for the last five years. |
| *** | The Fund Complex currently consists of nine series of the Trust and any other investment companies for which Meritage Capital, LLC and Sage Advisory Services, Ltd. Co. provide investment advisory services, currently none. |
Annual Report | September 30, 2014 | 37 |
Table of Contents
| Insignia Macro Fund | Trustees and Officers | |
September 30, 2014 (Unaudited) |
INDEPENDENT TRUSTEES (continued)
| Number of | ||||||||||
| Funds in | ||||||||||
| Fund | Other | |||||||||
| Term of | Complex | Directorships | ||||||||
| Name, | Position(s) | Office and | Overseen | Held by | ||||||
| Birth Year | Held with | Length of | Principal Occupation(s) | by | Trustee During | |||||
| & Address* | Fund | Time Served | During Past 5 Years** | Trustee*** | Past 5 Years** | |||||
Patrick Seese Birth year: 1971 | Trustee | Mr. Seese was elected to the Board on October 30, 2012; indefinite term. | Mr. Seese is an owner and a Managing Director of Integris Partners, a middle-market investment banking firm serving closely-held companies, financial sponsors and public companies (February 2008 to present). Prior to this, Mr. Seese was a Managing Director of Headwaters MB, a middle-market investing banking firm (December 2003 to February 2008). Prior to that, Mr. Seese worked in Credit Suisse First Boston’s Mergers and Acquisitions Group and served as Head of Corporation Development, Katy Industries, a publicly traded industrial and consumer products company and at Deloitte & Touche LLP, where he began his career in 1994. | 9 | None. |
| * | All communications to Trustees and Officers may be directed to ALPS Series Trust c/o 1290 Broadway, Suite 1100, Denver, CO 80203. |
| ** | Except as otherwise indicated, each individual has held the office shown or other offices in the same company for the last five years. |
| *** | The Fund Complex currently consists of nine series of the Trust and any other investment companies for which Meritage Capital, LLC and Sage Advisory Services, Ltd. Co. provide investment advisory services, currently none. |
38 | www.insigniafunds.com |
Table of Contents
| Insignia Macro Fund | Trustees and Officers | |
September 30, 2014 (Unaudited) |
INTERESTED TRUSTEE AND OFFICERS
| Number of | ||||||||||
| Funds in | ||||||||||
| Fund | Other | |||||||||
| Term of | Complex | Directorships | ||||||||
| Name, | Position(s) | Office and | Overseen | Held by | ||||||
| Birth Year | Held with | Length of | Principal Occupation(s) | by | Trustee During | |||||
| & Address* | Fund | Time Served | During Past 5 Years** | Trustee*** | Past 5 Years** | |||||
Jeremy O. May Birth year: 1970 | Trustee, Chairman and President | Mr. May was elected Trustee, Chairman and President on October 30, 2012; indefinite term. | Mr. May joined ALPS in 1995 and is currently President of ALPS Fund Services, Inc. and ALPS Distributors, Inc. and Executive Vice President of ALPS Holdings, Inc. and ALPS Advisors, Inc. Because of his positions with these entities, Mr. May is deemed an affiliate of the Trust as defined under the 1940 Act. Mr. May currently serves as Treasurer of Clough Global Allocation Fund, Clough Global Equity Fund, Clough Global Opportunities Fund, Mr. May is also Chairman and Trustee of the Reaves Utility Income Fund. Mr. May is currently Vice Chair of the Board of Directors of the University of Colorado Foundation. | 9 | Mr. May is Chairman and Trustee of the Reaves Utility Income Fund (1 fund). |
| * | All communications to Trustees and Officers may be directed to ALPS Series Trust c/o 1290 Broadway, Suite 1100, Denver, CO 80203. |
| ** | Except as otherwise indicated, each individual has held the office shown or other offices in the same company for the last five years. |
| *** | The Fund Complex currently consists of nine series of the Trust and any other investment companies for which Meritage Capital, LLC and Sage Advisory Services, Ltd. Co. provide investment advisory services, currently none. |
Annual Report | September 30, 2014 | 39 |
Table of Contents
| Insignia Macro Fund | Trustees and Officers | |
September 30, 2014 (Unaudited) |
INTERESTED TRUSTEE AND OFFICERS (continued)
Name, Birth Year | Position(s) Held with Fund | Term of Office and Length of Time Served | Principal Occupation(s) During Past 5 Years** | |||
Kimberly R. Storms Birth year: 1972 | Treasurer | Ms. Storms was elected Treasurer of the Trust on October 30, 2012; indefinite term. | Ms. Storms is Senior Vice President - Director of Fund Administration of ALPS. Ms. Storms joined ALPS in 1998 as Assistant Controller. Because of her position with ALPS, Ms. Storms is deemed an affiliate of the Trust as defined under the 1940 Act. Ms. Storms is also Treasurer of Financial Investors Trust, Liberty All-Star Equity Fund and Liberty All-Star Growth Fund, Inc. She serves as Chief Financial Officer of Arbitrage Funds. | |||
JoEllen L. Legg Birth year: 1961 | Secretary | Ms. Legg was elected Secretary of the Trust on October 30, 2012; indefinite term. | Ms. Legg joined ALPS in October 2007 and is Vice President, Senior Counsel of ALPS. Prior to joining ALPS, Ms. Legg served as Senior Counsel - Law (Corporate & Securities) for Adelphia Communications Corporation (February 2005 - March 2007). Prior to this, Ms. Legg held associate positions at Fried Frank Harris Shriver & Jacobson LLP (1998 - 2004) and at Patton Boggs LLP (2004 - 2005). Because of her position with ALPS, Ms. Legg is deemed an affiliate of the Trust as defined under the 1940 Act. Ms. Legg is also the Assistant Secretary of the Stone Harbor Investment Funds, Stone Harbor Emerging Markets Income Fund, Stone Harbor Emerging Markets Total Income Fund, James Advantage Funds, WesMark Funds, and Griffin Institutional Access Real Estate Fund. | |||
Nate Mandeville Birth year: 1977 | Assistant Treasurer | Mr. Mandeville was elected Assistant Treasurer of the Trust on August 22, 2014; indefinite term. | Mr. Mandeville joined ALPS in December 2013 and is Fund Controller of ALPS. Prior to joining ALPS, Mr. Mandeville worked for Great-West Financial (2011-2013), Virtuoso Sourcing Group (2008-2011) and Janus Capital Group (2000-2008). Because of his position with ALPS, Mr. Mandeville is deemed an affiliate of the Trust as defined under the 1940 Act. |
| * | All communications to Trustees and Officers may be directed to ALPS Series Trust c/o 1290 Broadway, Suite 1100, Denver, CO 80203. |
| ** | Except as otherwise indicated, each individual has held the office shown or other offices in the same company for the last five years. |
| *** | The Fund Complex currently consists of nine series of the Trust and any other investment companies for which Meritage Capital, LLC and Sage Advisory Services, Ltd. Co. provide investment advisory services, currently none. |
40 | www.insigniafunds.com |
Table of Contents
| Insignia Macro Fund | Trustees and Officers | |
September 30, 2014 (Unaudited) |
INTERESTED TRUSTEE AND OFFICERS (continued)
| Name, Birth Year & Address* | Position(s) Held with Fund | Term of Office and Length of Time Served | Principal Occupation(s) During Past 5 Years** | |||
| Lucas Foss Birth year: 1977 | Chief Compliance Officer (“CCO”) | Mr. Foss was elected CCO of the Trust on October 30, 2012; indefinite term. | Mr. Foss joined ALPS in November 2004 and is Deputy Chief Compliance Officer of ALPS. Prior to his current role, Mr. Foss served as a Compliance Manager at ALPS (January 2010 - August 2012), and a Senior Compliance Analyst at ALPS (November 2004 – May 2006). Before joining ALPS, Mr. Foss held positions at Bisys Hedge Fund Services and Deutsche Asset Management. Because of his position with ALPS, Mr. Foss is deemed an affiliate of the Trust as defined under the 1940 Act. Mr. Foss is also CCO of Caldwell & Orkin Funds, Whitebox Mutual Funds, Boulder Growth & Income Fund, Boulder Total Return Fund, the Denali Fund, Wakefield Alternative Series Trust and The Principal Real Estate Income Fund. |
| * | All communications to Trustees and Officers may be directed to ALPS Series Trust c/o 1290 Broadway, Suite 1100, Denver, CO 80203. |
| ** | Except as otherwise indicated, each individual has held the office shown or other offices in the same company for the last five years. |
| *** | The Fund Complex currently consists of nine series of the Trust and any other investment companies for which Meritage Capital, LLC and Sage Advisory Services, Ltd. Co. provide investment advisory services, currently none. |
Additional information about members of the Board of Trustees and officers of the Trust is available in the Statement of Additional Information and is available, without charge, upon request, by calling the Fund (toll-free) at 1-855-331-6240.
Annual Report | September 30, 2014 | 41 |
Table of Contents
Table of Contents
Table of Contents
| 1 | ||||
| 2 | ||||
| 4 | ||||
| 5 | ||||
| 7 | ||||
| 8 | ||||
| 9 | ||||
| 10 | ||||
| 11 | ||||
| 17 | ||||
| 18 | ||||
| 20 | ||||
Table of Contents
| New Sheridan Developing World Fund | Shareholder Letter | |
September 30, 2014 (Unaudited) |
Dear Shareholders,
During the period of September 8th to September 30th 2014, the New Sheridan Developing World Fund depreciated -2.10% versus the MSCI Emerging Markets Index which depreciated -8.07%. The outperformance of the fund versus the benchmark was primarily due to holding a high percentage of cash in the portfolio. Secondary effects include weakness in underweighted markets versus the MSCI Emerging Markets Index, such as Brazil.
Despite the recent global equity market volatility, we remain firmly convinced that developing economies are the engine of global economic growth. Importantly, not all developing economies are equal. In a global economic environment that likely disappoints for the next several years, certain developing economies will likely grow at elevated levels, while others will likely stumble. Our focus is to capitalize on the regions that look to prosper and avoid those that look to stumble.
Inflation has historically been the culprit of many crises in developing economies. However, we see two alternative sources of risk going forward: 1) geopolitical and 2) reform stagnation. First, geopolitical tensions continue to mount and are likely to increase as economic growth slows. We fear that the crisis in Ukraine/Russia as well as the threat from ISIS will be relevant for some time. There is also risk that these regional disputes could escalate and spread globally.
Second, structural reforms are required for developing economies to continue growing in future periods. Yesterday’s export led economic model is losing relevance and is unlikely to be as important a driver in the next decade. Instead, developing economies need to evolve and adapt to the changing global landscape. This often requires promulgating policies that may initially be unpopular with citizens.
At New Sheridan, our macro overlay focuses on investing in countries that look to prosper in a sluggish, and more competitive global economy. Despite the current market volatility, we are optimistic about the outlook in our core countries. Within these countries, we continue to find attractive and reasonably valued companies that could generate solid returns over the long term.
Thank you for your support and we look forward to future communication with our shareholders.
|
| |||
Russell Hoss, CFA | Richard Hoss | |||
Managing Partner | Managing Partner |


The New Sheridan Developing World Fund is not suitable for all investors. Subject to investment risks, including possible loss of principal amount invested.
Carefully consider the risks and special considerations associated with investing in the fund. You may lose money by investing in the fund. Small-cap stocks are subject to substantial risks such as market, business, size volatility, management experience, product diversification, financial resource, competitive strength, liquidity, and potential to fall out of favor that may cause their prices to fluctuate over time, sometimes rapidly and unpredictably. Foreign investments also present risks due to currency fluctuations, economic and political factors, lower liquidity, government regulations, differences in securities regulations and accounting standards, possible changes in taxation, limited public information and other factors. The risks are magnified in countries with emerging markets, since these countries may have relatively unstable governments and less established markets and economies.
Not FDIC Insured – No Bank Guarantee – May Lose Value
Annual Report | September 30, 2014 | 1 |
Table of Contents
| New Sheridan Developing World Fund | Portfolio Update | |
September 30, 2014 (Unaudited) |
Performance (for the period ended September 30, 2014)
| Since Inception* | ||||
| ||||
New Sheridan Developing World Fund | -2.10% | |||
MSCI Emerging Markets Index (a) | -8.07% | |||
MSCI Frontier Markets Index (b) | 0.27% | |||
| ||||
The performance data quoted above represents past performance. Past performance is not a guarantee of future results. Investment return and value of the Fund shares will fluctuate so that an investor’s shares, when sold or redeemed, may be worth more or less than their original cost. Performance may be lower or higher than performance data quoted. Fund performance current to the most recent month-end is available by calling (844) 805-5999 or by visiting www.newsheridanadvisors.com.
| * | Fund’s inception date is September 8, 2014. |
| (a) | MSCI Emerging Markets Index is a free float-adjusted market capitalization index that is designed to measure equity market performance in the global emerging markets. The index currently consists of 23 emerging economies. |
| (b) | MSCI Frontier Markets Index is a free float weighted index. MSCI currently classifies 33 countries as Frontier Markets, 24 of which are currently included in the MSCI Frontier Markets Index. |
Returns of less than 1 year are cumulative.
Indices are not actively managed and do not reflect deduction for fees, expenses, or taxes. An investor cannot invest directly in an index.
The returns shown above do not reflect the deduction of taxes a shareholder would pay on Fund distributions or redemption of Fund shares.
The total annual operating expenses and total annual operating expenses after fee waivers and/or reimbursement you may pay as an investor in the Fund (as reported in the August 29, 2014 Prospectus) are 2.29% and 1.85%, respectively. The Adviser has contractually agreed to limit expenses through January 31, 2016.
The Fund is new and has a limited operating history.
Performance of $10,000 Initial Investment (for the period ended September 30, 2014)
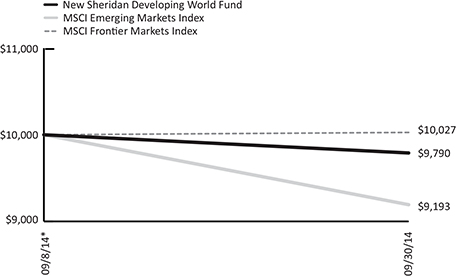
The graph shown above represents historical performance of a hypothetical investment of $10,000 in the Fund since inception. Past performance does not guarantee future results. All returns reflect reinvested dividends, but do not reflect the deduction of taxes that a shareholder would pay on Fund distributions or the redemption of Fund shares.
2 |
1.844.805.5999 | www.newsheridanadvisors.com |
Table of Contents
| New Sheridan Developing World Fund | Portfolio Update | |
September 30, 2014 (Unaudited) |
Top Ten Long Holdings (as a % of Net Assets)*
Hotel Shilla Co. Ltd. | 2.68% | |||
i-SENS, Inc. | 2.66% | |||
Universal Robina Corp. | 2.56% | |||
Kroton Educacional SA | 2.54% | |||
Grupo Lala SAB de CV | 2.54% | |||
Credito Real SA | 2.51% | |||
Kasikornbank Pub Co | 2.50% | |||
BDO Unibank, Inc. | 2.48% | |||
Cyfrowy Polsat SA | 2.47% | |||
Vieworks Co. Ltd. | 2.47% | |||
| ||||
Top Ten Holdings | 25.41% | |||
| ||||
Country Allocation (as a % of Net Assets)*
Mexico | 17.03% | |||
Indonesia | 11.79% | |||
South Korea | 7.81% | |||
Philippines | 7.40% | |||
Thailand | 7.39% | |||
Brazil | 4.95% | |||
Malaysia | 4.80% | |||
Colombia | 4.70% | |||
China | 4.38% | |||
Poland | 2.47% | |||
United States | 2.45% | |||
Great Britain | 2.45% | |||
United Arab Emirates | 2.42% | |||
Greece | 2.38% | |||
Hong Kong | 2.34% | |||
South Africa | 2.29% | |||
Panama | 2.28% | |||
Taiwan | 2.05% | |||
Cash, Cash Equivalents, & Other Net Assets | 8.62% | |||
| ||||
Total | 100.00% | |||
| ||||
| * | Holdings are subject to change. Tables present indicative values only. |
Annual Report | September 30, 2014 | 3 |
Table of Contents
| New Sheridan Developing World Fund | Disclosure of Fund Expenses | |
September 30, 2014 (Unaudited) |
Examples. As a shareholder of the New Sheridan Developing World Fund (the “Fund”), you incur two types of costs: (1) transaction costs, including applicable redemption fees; and (2) ongoing costs, including management fees, distribution and service (12b-1) fees and other Fund expenses. The following examples are intended to help you understand your ongoing costs (in dollars) of investing in the Fund and to compare these costs with the ongoing costs of investing in other mutual funds. The examples are based on an investment of $1,000 invested on April 1, 2014 and held through September 30, 2014.
Actual Expenses. The first line of the table below provides information about actual account values and actual expenses. You may use the information in this line, together with the amount you invested, to estimate the expenses that you paid over the period. Simply divide your account value by $1,000 (for example, an $8,600 account value divided by $1,000 = 8.6), then multiply the result by the number in the first line under the heading “Expenses Paid During Period April 1, 2014–September 30, 2014” to estimate the expenses you paid on your account during this period.
Hypothetical Example for Comparison Purposes. The second line of the table below provides information about hypothetical account values and hypothetical expenses based on the Fund’s actual expense ratio and an assumed rate of return of 5% per year before expenses, which is not the Fund’s actual return. The hypothetical account values and expenses may not be used to estimate the actual ending account balance or expenses you paid for the period. You may use this information to compare the ongoing costs of investing in the Fund and other mutual funds. To do so, compare this 5% hypothetical example with the 5% hypothetical examples that appear in the shareholder reports of the other mutual funds.
Please note that the expenses shown in the table are meant to highlight your ongoing Fund costs only and do not reflect any transactional costs, such as redemption fees. Therefore, the second line of the table below is useful in comparing ongoing costs only and may not help you determine the relative total costs of owning different funds. In addition, if these transactional costs were included, your costs would have been higher.
Beginning Account Value April 1, 2014 | Ending Account Value September 30, 2014 | Expense Ratio(a) | Expense Paid During Period April 1, 2014 - September 30, 2014(b) | |||||||||||||
| ||||||||||||||||
New Sheridan Developing World Fund | ||||||||||||||||
Investor | ||||||||||||||||
Actual(c) | $ | 1,000.00 | $ | 979.00 | 1.85% | $ | 1.10 | |||||||||
Hypothetical (5% return before expenses) | $ | 1,000.00 | $ | 1,015.79 | 1.85% | $ | 9.35 | |||||||||
| (a) | The Fund’s expense ratios have been annualized based on the Fund’s most recent fiscal half-year expenses. |
| (b) | Expenses are equal to the Fund’s annualized expense ratio multiplied by the average account value over the period, multiplied by the number of days in the most recent fiscal half year (183), divided by 365. |
| (c) | The actual expenses paid during the period is based on the commencement of operations on September 9, 2014. |
4 |
1.844.805.5999 | www.newsheridanadvisors.com |
Table of Contents
| New Sheridan Developing World Fund | Portfolio of Investments | |
September 30, 2014 |
| Shares | Value (Note 2) | |||||||
| ||||||||
COMMON STOCKS (89.10%) |
| |||||||
Brazil (4.95%) | ||||||||
BB Seguridade Participacoes SA | 3,700 | $ | 48,809 | |||||
Kroton Educacional SA | 8,200 | 51,524 | ||||||
|
| |||||||
Total Brazil | 100,333 | |||||||
|
| |||||||
China (4.38%) | ||||||||
ENN Energy Holdings Ltd. | 6,000 | 39,256 | ||||||
Sihuan Pharmaceutical Holdings Group Ltd. | 66,000 | 49,432 | ||||||
|
| |||||||
Total China | 88,688 | |||||||
|
| |||||||
Colombia (2.42%) | ||||||||
Organizacion Terpel (a) | 5,400 | 49,067 | ||||||
|
| |||||||
Great Britain (2.45%) | ||||||||
Stock Spirits Group PLC | 10,500 | 49,636 | ||||||
|
| |||||||
Greece (2.38%) | ||||||||
National Bank of Greece SA ADR(a) | 16,000 | 48,160 | ||||||
|
| |||||||
Hong Kong (2.34%) | ||||||||
AIA Group Ltd. | 9,200 | 47,479 | ||||||
|
| |||||||
Indonesia (11.79%) | ||||||||
PT Bank Rakyat Indonesia Persero Tbk | 58,000 | 49,581 | ||||||
PT Elnusa Tbk | 900,000 | 46,394 | ||||||
PT Matahari Department Store Tbk | 37,000 | 49,287 | ||||||
PT Siloam International Hospitals Tbk (a) | 38,000 | 46,857 | ||||||
Tiga Pilar Sejahtera Food Tbk (a) | 250,000 | 46,931 | ||||||
|
| |||||||
Total Indonesia | 239,050 | |||||||
|
| |||||||
Malaysia (4.80%) | ||||||||
IHH Healthcare Bhd | 32,000 | 49,554 | ||||||
SapuraKencana Petroleum Bhd | 38,000 | 47,713 | ||||||
|
| |||||||
Total Malaysia | 97,267 | |||||||
|
| |||||||
Mexico (17.03%) | ||||||||
Alfa SAB de CV | 14,200 | 48,847 | ||||||
Alsea SAB de CV (a) | 15,000 | 47,366 | ||||||
Compartamos SAB de CV | 23,000 | 49,235 | ||||||
Credito Real SA | 18,000 | 50,928 | ||||||
Grupo Lala SAB de CV | 21,000 | 51,442 | ||||||
Infraestructura Ener | 8,000 | 48,868 | ||||||
Mexichem SA de CV | 11,700 | 48,715 | ||||||
|
| |||||||
Total Mexico | 345,401 | |||||||
|
| |||||||
Panama (2.28%) | ||||||||
Copa Holdings SA | 430 | 46,135 | ||||||
|
| |||||||
| Shares | Value (Note 2) | |||||||
| ||||||||
Philippines (7.40%) | ||||||||
BDO Unibank, Inc. | 23,000 | $ | 50,191 | |||||
Robinsons Retail Holdings, Inc. | 34,000 | 47,957 | ||||||
Universal Robina Corp. | 12,500 | 51,905 | ||||||
|
| |||||||
Total Philippines | 150,053 | |||||||
|
| |||||||
Poland (2.47%) | ||||||||
Cyfrowy Polsat SA | 6,000 | 50,046 | ||||||
|
| |||||||
South Africa (2.29%) | ||||||||
MTN Group Ltd. | 2,200 | 46,383 | ||||||
|
| |||||||
South Korea (7.81%) | ||||||||
Hotel Shilla Co. Ltd. | 480 | 54,369 | ||||||
i-SENS, Inc. (a) | 1,000 | 53,820 | ||||||
Vieworks Co. Ltd. | 1,500 | 50,041 | ||||||
|
| |||||||
Total South Korea | 158,230 | |||||||
|
| |||||||
Taiwan (2.05%) | ||||||||
Hermes Microvision, Inc. | 1,000 | 41,598 | ||||||
|
| |||||||
Thailand (7.39%) | ||||||||
CP ALL PCL | 36,000 | 49,620 | ||||||
Kasikornbank Pub Co | 7,000 | 50,630 | ||||||
MC Group PCL | 87,000 | 49,582 | ||||||
|
| |||||||
Total Thailand | 149,832 | |||||||
|
| |||||||
United Arab Emirates (2.42%) |
| |||||||
First Gulf Bank PJSC | 9,600 | 49,007 | ||||||
|
| |||||||
United States (2.45%) | ||||||||
Nexteer Automotive Group Ltd. | 56,000 | 49,667 | ||||||
|
| |||||||
TOTAL COMMON STOCKS (Cost $1,847,553) |
| 1,806,032 | ||||||
|
| |||||||
PREFERRED STOCK (2.28%) |
| |||||||
Colombia (2.28%) | ||||||||
Banco Davivienda SA | 3,200 | 46,143 | ||||||
|
| |||||||
TOTAL PREFERRED STOCK (Cost $49,573) |
| 46,143 | ||||||
|
| |||||||
See Notes to Financial Statements. | ||
Annual Report | September 30, 2014 | 5 |
Table of Contents
| New Sheridan Developing World Fund | Portfolio of Investments | |
September 30, 2014 |
| 7 Day Yield | Shares | Value | ||||||||||
| ||||||||||||
SHORT TERM INVESTMENTS (11.15%) |
| |||||||||||
Morgan Stanley | ||||||||||||
Institutional Liquidity Funds | 0.040 | % | 226,027 | 226,027 | ||||||||
|
| |||||||||||
TOTAL SHORT TERM INVESTMENTS (Cost $226,027) |
| 226,027 | ||||||||||
|
| |||||||||||
TOTAL INVESTMENTS (102.53%) (Cost $2,123,153) |
| $ | 2,078,202 | |||||||||
Net Liabilities Less Other Assets |
| (51,140) | ||||||||||
|
| |||||||||||
NET ASSETS (100.00%) |
| $ | 2,027,062 | |||||||||
|
| |||||||||||
| (a) | Non-income producing security. |
Common Abbreviations:
ADR | - | American Depositary Receipt. | ||
Bhd | - | Berhad, Public Limited Company in Malaysia. | ||
Ltd. | - | Limited. | ||
PJSC | - | Private Joint Stock Company. | ||
PCL | - | A rearrangement of the letters for Public Limited Company, used in Thailand. | ||
PLC | - | Public Limited Company. | ||
SA | - | Generally designated corporations in various countries, mostly those employing civil law. | ||
SAB de CV | - | A variable capital company. | ||
PT | - | Perseroan Terbatas, meaning “private limited”, which is the equivalent of an incorporated entity in the U.S. | ||
Tbk | - | Terbuka is appended after the corporation name if the shares become publicly listed for trading. |
See Notes to Financial Statements. | ||
6 |
1.844.805.5999 | www.newsheridanadvisors.com |
Table of Contents
| New Sheridan Developing World Fund | Statement of Assets and Liabilities | |
September 30, 2014 |
ASSETS: | ||||
Investments, at value (Cost $2,123,153) | $ | 2,078,202 | ||
Dividends receivable | 26 | |||
Receivable due from advisor | 32,448 | |||
|
| |||
Total Assets | 2,110,676 | |||
|
| |||
LIABILITIES: | ||||
Payable for investments purchased | 49,227 | |||
Payable administration and transfer agency fees | 9,937 | |||
Payable distribution and services fees | 262 | |||
Payable to chief compliance officer | 1,205 | |||
Payable legal fees | 1,298 | |||
Payable audit and tax fees | 14,000 | |||
Accrued offering costs | 3,871 | |||
Accrued expenses and other liabilities | 3,814 | |||
|
| |||
Total Liabilities | 83,614 | |||
|
| |||
NET ASSETS | $ | 2,027,062 | ||
|
| |||
NET ASSETS CONSIST OF: | ||||
Paid-in capital (Note 5) | $ | 2,070,593 | ||
Accumulated net investment income | 1,420 | |||
Net unrealized depreciation on investments | (44,951) | |||
|
| |||
NET ASSETS | $ | 2,027,062 | ||
|
| |||
PRICING OF SHARES | ||||
Net Asset Value, offering and redemption price per share | $ | 9.79 | ||
Shares of beneficial interest outstanding | 207,105 | |||
See Notes to Financial Statements. | ||
Annual Report | September 30, 2014 | 7 |
Table of Contents
| New Sheridan Developing World Fund | Statement of Operations | |
For the Period Ended September 30, 2014(a) |
INVESTMENT INCOME: | ||||
Dividends | $ | 26 | ||
|
| |||
Total Investment Income | 26 | |||
|
| |||
EXPENSES: | ||||
Investment advisory fees (Note 6) | 1,416 | |||
Administrative and transfer agency fees | 9,937 | |||
Distribution and service fees | 262 | |||
Legal fees | 1,298 | |||
Audit and tax fees | 14,000 | |||
Printing fees | 1,697 | |||
SEC registration fees | 268 | |||
Custody fees | 754 | |||
Chief compliance officer fees | 1,205 | |||
Offering costs | 3,871 | |||
Other expenses | 1,095 | |||
|
| |||
Total Expenses | 35,803 | |||
Less fees waived/reimbursed by investment advisor (Note 6) | (33,864) | |||
|
| |||
Net Expenses | 1,939 | |||
|
| |||
NET INVESTMENT LOSS | (1,913) | |||
|
| |||
REALIZED AND UNREALIZED GAIN/(LOSS) ON INVESTMENTS: | ||||
Net realized gain on: | ||||
Foreign currency transactions | 2,989 | |||
|
| |||
Net realized gain | 2,989 | |||
|
| |||
Net Change in depreciation on: | ||||
Investments | (44,951) | |||
|
| |||
Net Change | (44,951) | |||
|
| |||
NET REALIZED AND UNREALIZED LOSS ON INVESTMENTS | (41,962) | |||
|
| |||
NET DECREASE IN NET ASSETS RESULTING FROM OPERATIONS | $ | (43,875) | ||
|
| |||
| (a) | Commenced operations on September 9, 2014. |
See Notes to Financial Statements. | ||
8 |
1.844.805.5999 | www.newsheridanadvisors.com |
Table of Contents
| New Sheridan Developing World Fund | Statement of Changes in Net Assets | |
| For the Period Ended September 30, 2014(a) | ||||
OPERATIONS: | ||||
Net investment loss | $ | (1,913) | ||
Net realized gain on foreign currency transactions | 2,989 | |||
Net change in unrealized depreciation on investments | (44,951) | |||
|
| |||
Net Decrease in Net Assets Resulting from Operations | (43,875) | |||
|
| |||
BENEFICIAL INTEREST TRANSACTIONS (NOTE 5): | ||||
Shares sold | 2,070,937 | |||
|
| |||
Net Increase from capital share transactions | 2,070,937 | |||
|
| |||
Net increase in net assets | 2,027,062 | |||
|
| |||
NET ASSETS | ||||
Beginning of period | – | |||
|
| |||
End of period (Including accumulated net investment income of $1,420) | $ | 2,027,062 | ||
|
| |||
| (a) | Commenced operations on September 9, 2014. |
See Notes to Financial Statements. | ||
Annual Report | September 30, 2014 | 9 |
Table of Contents
| New Sheridan Developing World Fund | Financial Highlights | |
For a Share Outstanding Throughout the Period Presented |
| For the Period Ended September 30, 2014(a) | ||||
Net asset value, beginning of period | $ | 10.00 | ||
INCOME FROM INVESTMENT OPERATIONS: | ||||
Net investment loss(b) | (0.01) | |||
Net realized and unrealized loss | (0.20) | |||
|
| |||
Total from investment operations | (0.21) | |||
|
| |||
Net decrease in net asset value | (0.21) | |||
|
| |||
Net asset value, end of year | $ | 9.79 | ||
|
| |||
TOTAL RETURN(c) | (2.10)% | |||
SUPPLEMENTAL DATA: | ||||
Net assets, end of year (000s) | $ | 2,027 | ||
RATIOS TO AVERAGE NET ASSETS | ||||
Ratio of expenses to average net assets excluding fee waivers and reimbursements | 34.14%(d) | |||
Ratio of expenses to average net assets including fee waivers and reimbursements | 1.85%(d) | |||
Ratio of net investment loss to average net assets | (1.82)%(d) | |||
Portfolio turnover rate(e) | 0.0% | |||
| (a) | Commenced operations on September 9, 2014. |
| (b) | Calculated using the average shares method. |
| (c) | Total returns are for the period indicated and have not been annualized. Total returns would have been lower had certain expenses not been waived during the period. Returns shown do not reflect the deduction of taxes that a shareholder would pay on Fund distributions or the redemption of Fund shares. |
| (d) | Annualized. |
| (e) | Portfolio turnover rate for periods less than one full year have not been annualized. |
See Notes to Financial Statements. | ||
10 |
1.844.805.5999 | www.newsheridanadvisors.com |
Table of Contents
| New Sheridan Developing World Fund | Notes to Financial Statements | |
September 30, 2014 |
1. ORGANIZATION
The ALPS Series Trust (the “Trust”), a Delaware statutory trust, is an open-end management investment company registered under the Investment Company Act of 1940 (the “1940 Act”). As of September 30, 2014, the Trust had nine registered funds. This annual report describes the New Sheridan Developing World Fund (the “Fund”). The Fund’s primary investment objective is to seek long term capital appreciation. The Fund currently offers Investor Class shares. The Trust has an unlimited number of shares with no par value per share. The Board of Trustees (the “Board”) may establish additional funds and classes of shares at any time in the future without shareholder approval.
As a newly organized entity, the Fund has little operating history. The Fund does not have any operations before September 9, 2014 other than those relating to the sale and issuance of one share each of the Fund’s Investor and Institutional share classes to ALPS Fund Services, Inc. (“ALPS” or the “Administrator”), the Fund’s Administrator and Transfer Agent. ALPS is an affiliate of ALPS Distributors, Inc. (the “Distributor”), the Fund’s principal underwriter.
2. SIGNIFICANT ACCOUNTING POLICIES
The accompanying financial statements were prepared in accordance with accounting principles generally accepted in the United States of America for investment companies (“U.S. GAAP”). The fund is considered an investment company for financial reporting purposes. The preparation of financial statements in conformity with U.S. GAAP requires management to make certain estimates and assumptions that affect the reported amounts of assets and liabilities and disclosures of contingent assets and liabilities at the date of the financial statements and the reported amounts of revenue and expenses during the period. Actual results could differ from those estimates. The following is a summary of significant accounting policies consistently followed by the Fund in preparation of its financial statements.
Investment Valuation: The Fund generally values its securities based on market prices determined at the close of regular trading on the New York Stock Exchange (“NYSE”), normally 4:00 p.m. Eastern Time, on each day the NYSE is open for trading.
For equity securities and mutual funds that are traded on an exchange, the market price is usually the closing sale or official closing price on that exchange. In the case of equity securities not traded on an exchange, or if such closing prices are not otherwise available, the securities are valued at the mean of the most recent bid and ask prices on such day.
Equity securities that are primarily traded on foreign securities exchanges are valued at the closing values of such securities on their respective foreign exchanges, except when an event occurs subsequent to the close of the foreign exchange and the close of the NYSE that was likely to have changed such value. In such an event, the fair values of those securities are determined in good faith through consideration of other factors in accordance with procedures established by and under the general supervision of the Board. The Fund will use a fair valuation model provided by an independent pricing service, which is intended to reflect fair value when a security’s value or a meaningful portion of the Fund’s portfolio is believed to have been materially affected by a valuation event that has occurred between the close of the exchange or market on which the security is traded and the close of the regular trading day on the NYSE.
Redeemable securities issued by open-end registered investment companies are valued at the investment company’s applicable net asset value, with the exception of exchange-traded open-end investment companies, which are priced as equity securities.
When such prices or quotations are not available, or when the Fair Value Committee appointed by the Board believes that they are unreliable, securities may be priced using fair value procedures approved by the Board.
Fair Value Measurements: The Fund discloses the classification of their fair value measurements following a three-tier hierarchy based on the inputs used to measure fair value. Inputs refer broadly to the assumptions that market participants would use in pricing the asset or liability, including assumptions about risk. Inputs may be observable or unobservable. Observable inputs reflect the assumptions market participants would use in pricing the asset or liability that are developed based on market data obtained from sources independent of the reporting entity. Unobservable inputs reflect the reporting entity’s own assumptions about the assumptions market participants would use in pricing the asset or liability that are developed based on the best information available.
Annual Report | September 30, 2014 | 11 |
Table of Contents
| New Sheridan Developing World Fund | Notes to Financial Statements | |
September 30, 2014 |
Various inputs are used in determining the value of the Fund’s investments as of the end of the reporting period. When inputs used fall into different levels of the fair value hierarchy, the level in the hierarchy within which the fair value measurement falls is determined based on the lowest level input that is significant to the fair value measurement in its entirety. The designated input levels are not necessarily an indication of the risk or liquidity associated with these investments. These inputs are categorized in the following hierarchy under applicable financial accounting standards:
Level 1 | – | Unadjusted quoted prices in active markets for identical investments, unrestricted assets or liabilities that the Funds have the ability to access at the measurement date; | ||
Level 2 | – | Quoted prices which are not active, quoted prices for similar assets or liabilities in active markets or inputs other than quoted prices that are observable (either directly or indirectly) for substantially the full term of the asset or liability; and | ||
Level 3 | – | Significant unobservable prices or inputs (including the Fund’s own assumptions in determining the fair value of investments) where there is little or no market activity for the asset or liability at the measurement date. | ||
The following is a summary of the inputs used to value the Fund’s investments as of September 30, 2014:
New Sheridan Developing World Fund
| Investments in Securities at Value | Level 1 - Quoted Prices | Level 2 - Other Significant Observable Inputs | Level 3 - Significant Unobservable Inputs | Total | ||||||||||||
| ||||||||||||||||
Common Stocks | ||||||||||||||||
Brazil | $ | 100,333 | $ | – | $ | – | $ | 100,333 | ||||||||
China | – | 88,688 | – | 88,688 | ||||||||||||
Colombia | 49,067 | – | – | 49,067 | ||||||||||||
Great Britain | 49,636 | – | – | 49,636 | ||||||||||||
Greece | 48,160 | – | – | 48,160 | ||||||||||||
Hong Kong | – | 47,479 | – | 47,479 | ||||||||||||
Indonesia | 46,857 | 192,193 | – | 239,050 | ||||||||||||
Malaysia | 49,554 | 47,713 | – | 97,267 | ||||||||||||
Mexico | 345,401 | – | – | 345,401 | ||||||||||||
Panama | 46,135 | – | – | 46,135 | ||||||||||||
Philippines | 47,957 | 102,096 | – | 150,053 | ||||||||||||
Poland | – | 50,046 | – | 50,046 | ||||||||||||
South Africa | – | 46,383 | – | 46,383 | ||||||||||||
South Korea | – | 158,230 | – | 158,230 | ||||||||||||
Taiwan | – | 41,598 | – | 41,598 | ||||||||||||
Thailand | – | 149,832 | – | 149,832 | ||||||||||||
United Arab Emirates | 49,007 | – | – | 49,007 | ||||||||||||
United States | – | 49,667 | – | 49,667 | ||||||||||||
Preferred Stocks | ||||||||||||||||
Colombia | 46,143 | – | – | 46,143 | ||||||||||||
Short Term Investments | 226,027 | – | – | 226,027 | ||||||||||||
| ||||||||||||||||
TOTAL | $ | 1,104,277 | $ | 973,925 | $ | – | $ | 2,078,202 | ||||||||
| ||||||||||||||||
The Fund recognizes transfers between levels as of the end of the fiscal year. For the period ended September 30, 2014, the Fund did not have any transfers between Level 1 and Level 2 securities. There were no Level 3 securities held during the period.
Offering Costs: The Fund incurred offering costs during the period ended September 30, 2014. These offering costs, including fees for printing initial prospectuses, legal, and registration fees, are being amortized over the first twelve months from the inception date of the Fund. Amounts amortized through September 30, 2014 are shown on the Fund’s Statement of Operations and amounts that remain to be amortized are shown on the Fund’s Statement of Assets and Liabilities.
Trust Expenses: Some expenses of the Trust can be directly attributed to the Fund. Expenses which cannot be directly attributed to the Fund are apportioned among all funds in the Trust based on average net assets of each fund.
12 |
1.844.805.5999 | www.newsheridanadvisors.com |
Table of Contents
| New Sheridan Developing World Fund | Notes to Financial Statements | |
September 30, 2014 |
Federal Income Taxes: The Fund complies with the requirements under Subchapter M of the Internal Revenue Code of 1986 applicable to regulated investment companies and intends to distribute substantially all of its net taxable income and net capital gains, if any, each year so that it will not be subject to excise tax on undistributed income and gains. The Fund is not subject to income taxes to the extent such distributions are made.
As of and during the period ended September 30, 2014, the Fund did not have a liability for any unrecognized tax benefits in the accompanying financial statements. The Fund files U.S federal, state and local income tax returns as required. The Fund’s tax returns are subject to examination by the relevant tax authorities until expiration of the applicable statute of limitations, which is generally three years after the filing of the tax return for federal purposes and four years for most state returns. The Fund’s administrator has analyzed the Fund’s tax positions taken on federal and state income tax returns for all open tax years and has concluded that as of September 30, 2014, no provision for income tax is required in the Fund’s financial statements related to these tax positions.
Investment Transactions and Investment Income: Investment transactions are accounted for on the date the investments are purchased or sold (trade date basis). Realized gains and losses from investment transactions are reported on an identified cost basis. Interest income, which includes accretion of discounts and amortization of premiums, is accrued and recorded as earned. Dividend income is recognized on the ex-dividend date, or for certain foreign securities, as soon as information is available to the Fund. All of the realized and unrealized gains and losses and net investment income are allocated daily to each class in proportion to its average daily net assets.
Foreign Securities: The Fund may directly purchase securities of foreign issuers. Investing in securities of foreign issuers involves special risks not typically associated with investing in securities of U.S. issuers. The risks include possible reevaluation of currencies, the inability to repatriate foreign currency, less complete financial information about companies and possible future adverse political and economic developments. Moreover, securities of many foreign issuers and their markets may be less liquid and their prices more volatile than those of securities of comparable U.S. issuers.
Foreign Currency Translation: The books and records of the Fund are maintained in U.S. dollars. Investment valuations and other assets and liabilities initially expressed in foreign currencies are converted each business day into U.S. dollars based upon current exchange rates. The portion of realized and unrealized gains or losses on investments due to fluctuations in foreign currency exchange rates is not separately disclosed and is included in realized and unrealized gains or losses on investments, when applicable.
Foreign Exchange Transactions: The Fund may enter into foreign currency spot contracts to facilitate transactions in foreign securities or to convert foreign currency receipts into U.S. dollars. A foreign currency spot contract is an agreement between two parties to buy and sell currencies at the current market rate, for settlement generally within two business days. The U.S. dollar value of the contracts is determined using current currency exchange rates supplied by a pricing service. The contract is marked-to-market daily for settlements beyond one day and any change in market value is recorded as an unrealized gain or loss. When the contract is closed, the Fund records a realized gain or loss equal to the difference between the value on the open and close date. Losses may arise from changes in the value of the foreign currency, or if the counterparties do not perform under the contract’s terms. The maximum potential loss from such contracts is the aggregate face value in U.S. dollars at the time the contract was opened.
Distributions to Shareholders: The Fund normally pays dividends, if any, and distributes capital gains, if any, on an annual basis. Income dividend distributions are derived from interest and other income the Fund receives from its investments, including short term capital gains. Long term capital gain distributions are derived from gains realized when the Fund sells a security it has owned for more than one year. The Fund may make additional distributions and dividends at other times if its portfolio manager or managers believe doing so may be necessary for the Fund to avoid or reduce taxes. Net investment income/(loss) and net realized gain/(loss) may differ for financial statement and tax purposes.
3. TAX BASIS INFORMATION
Tax Basis of Distributions to Shareholders: The character of distributions made during the period from net investment income or net realized gains may differ from its ultimate characterization for federal income tax purposes. Also, due to the timing of dividend distributions, the fiscal year in which amounts are distributed may differ from the fiscal year in which the income or realized gain were recorded by the Fund. The amounts and characteristics of tax basis distributions and composition of distributable earnings/(accumulated losses) are finalized at fiscal year-end. There were no distributions paid by the Fund for the period ended September 30, 2014.
Annual Report | September 30, 2014 | 13 |
Table of Contents
| New Sheridan Developing World Fund | Notes to Financial Statements | |
September 30, 2014 |
Reclassifications: As of September 30, 2014, permanent differences in book and tax accounting were reclassified. The following reclassifications, which had no impact on results of operations or net assets, were recorded to reflect tax character:
| Paid-in Capital | Accumulated Net Investment Income/(Loss) | Accumulated Net Realized Gain/(Loss) on Investments | ||||||||||
| $ | (344 | ) | $ | 3,333 | $ | (2,989 | ) | |||||
These differences are primarily attributed to the different tax treatment of foreign currency and organizational costs.
Unrealized Appreciation and Depreciation on Investments: As of March 31, 2014, the aggregate costs of investments, gross unrealized appreciation/(depreciation) and net unrealized appreciation for Federal tax purposes were as follows:
Gross unrealized apprecation (excess of value over tax cost) | $ | 10,020 | ||
Gross unrealized depreciation (excess of tax cost over value) | (55,801) | |||
| ||||
Net unrealized appreciation (depreciation) | (45,781) | |||
| ||||
Cost of investments for income tax purposes | $ | 2,123,983 | ||
| ||||
Components of Distributable Earnings: At September 30, 2014, components of distributable earnings were as follows: | ||||
Undistributed ordinary income | $ | 2,250 | ||
Net unrealized depreciation on investments | (45,781) | |||
| ||||
Total | $ | (43,531) | ||
| ||||
Capital Losses: As of September 30, 2014, the Fund had no accumulated capital loss carryforwards.
4. SECURITIES TRANSACTIONS
Purchases and sales of securities, excluding short-term securities, during the period ended September 30, 2014 were as follows:
| Purchases of Securities | Proceeds from Sales of Securities | |||||||
| ||||||||
| $ | 1,897,126 | $ | – | |||||
5. BENEFICIAL SHARE TRANSACTIONS
The capitalization of the Trust consists of an unlimited number of shares of beneficial interest with no par value per share. Holders of the shares of the Fund have one vote for each share held and a proportionate fraction of a vote for each fractional share. All shares issued and outstanding are fully paid and are non-assessable, transferable and redeemable at the option of the shareholder. Shares have no pre-emptive rights.
Shares redeemed within 30 calendar days of purchase may incur a 2% short-term redemption fee deducted from the redemption amount. For the fiscal year ended September 30, 2014, the redemption fees charged by the Fund are presented in the Statements of Changes in Net Assets.
Transactions in common shares were as follows:
For the Period Ended | ||||
| ||||
Shares sold | 207,105 | |||
Dividends reinvested | – | |||
Shares redeemed | – | |||
| ||||
Net increase in shares outstanding | 207,105 | |||
| ||||
| (a) | Commenced operations on September 9, 2014. |
14 |
1.844.805.5999 | www.newsheridanadvisors.com |
Table of Contents
| New Sheridan Developing World Fund | Notes to Financial Statements | |
September 30, 2014 |
Control is defined by the 1940 Act as the beneficial ownership, either directly or through one or more controlled companies, of more than 25% of the voting securities of a company. The Fund has one affiliated shareholder representing approximately 35% of total Fund shares. The Fund has one unaffiliated shareholder representing approximately 48% of total Fund shares. Investment activities of these shareholders could have a material impact on the Fund.
6. MANAGEMENT AND RELATED PARTY TRANSACTIONS
Investment Advisory: New Sheridan Advisors, LLC (“New Sheridan” or the “Adviser”), subject to the authority of the Board, is responsible for the overall management and administration of the Fund’s business affairs. The Adviser manages the investments of the Fund in accordance with the Fund’s investment objective, policies and limitations and investment guidelines established jointly by the Adviser and the Board.
Pursuant to the Investment Advisory Agreement (the “Advisory Agreement”) with the Adviser, the Fund pays the Adviser an annual management fee of 1.35% based on the Fund’s average daily net assets. The management fee is paid on a monthly basis. The initial term of the Advisory Agreement is two years. The Board may extend the Advisory Agreement for additional one-year terms. The Board, shareholders of the Fund or the Adviser may terminate the Advisory Agreement upon 60 days’ notice.
Pursuant to a fee waiver letter agreement (the “Fee Waiver Agreement”), the Adviser has contractually agreed to limit the amount of the Fund’s Total Annual Fund Operating Expenses, exclusive of Distribution and Service (12b-1) fees, Acquired Fund Fees and Expenses, brokerage expenses, interest expenses, taxes and extraordinary expenses, to 1.60% of the Fund’s average daily net assets. The Fee Waiver Agreement is in effect through January 31, 2016. The Adviser will be permitted to recover expenses it has borne through the Fee Waiver Agreement to the extent that the Fund’s expenses in later periods fall below the annual rates set forth in the Fee Waiver Agreement. The Fund will not be obligated to pay any such deferred fees and expenses more than three years after the end of the fiscal year in which the fees and expense were deferred. The Adviser may not discontinue the Fee Waiver Agreement without the approval by the Fund’s Board.
For the fiscal period ended September 30, 2014, the fee waivers and/or reimbursements were $33,864.
As of September 30, 2014, the balance of recoupable expenses was $33,864, and will expire in 2017.
Administrator: ALPS Fund Services, Inc. (“ALPS”) (an affiliate of ALPS Distributors, Inc.) serves as administrator to the Fund. The Fund has agreed to pay expenses incurred in connection with its administrative activities. Pursuant to the Administration, Bookkeeping and Pricing Services Agreement with the Trust, ALPS will provide operational services to the Fund including, but not limited to fund accounting and fund administration and generally assist in the Fund’s operations.
The Fund’s administration fee is accrued on a daily basis, and paid on a monthly basis following the end of the month, based on the greater of (a) an annual total fee of $110,000 in year 1 of operations and $120,000 in year 2; or (b) the following basis point fee schedule:
| Average Total Net Assets | Contractual Fee | |
| ||
Between $0-$500M | 0.08% | |
| ||
$500M-$1B | 0.06% | |
| ||
Above $1B | 0.02% | |
| ||
Annually thereafter, the parties agree to reevaluate the compensation paid under the agreement by the Trust on behalf of the fund to ALPS for the services it performs for the Fund.
ALPS is reimbursed by the Fund for certain out-of-pocket expenses.
Transfer Agent: ALPS serves as transfer agent for the Fund under a Transfer Agency and Services Agreement with the Trust. Under this agreement, ALPS is paid an annual base fee of $25,000 for services performed on behalf of the Fund plus fees for open accounts and is reimbursed for certain out-of-pocket expenses.
Compliance Services: ALPS provides services as the Fund’s Chief Compliance Officer to monitor and test the policies and procedures of the Fund in conjunction with requirements under Rule 38a-1 under the 1940 Act pursuant to a Chief Compliance Officer Services Agreement with the Trust. Under this agreement, ALPS is paid an annual base fee of $20,000 for services performed on behalf of the Fund and is reimbursed for certain out-of-pocket expenses.
Annual Report | September 30, 2014 | 15 |
Table of Contents
| New Sheridan Developing World Fund | Notes to Financial Statements | |
September 30, 2014 |
Distributor: ALPS Distributors, Inc. (the “Distributor”) (as affiliate of ALPS Fund Services, Inc.) acts as the principal underwriter of the Fund’s shares pursuant to a Distribution Agreement with the Trust. Shares of the Fund are offered on a continuous basis through the Distributor, as agent of the Fund. The Distributor is not obligated to sell any particular amount of shares and is not entitled to any compensation for its services as the Fund’s principal underwriter.
The Fund has adopted a separate plan of distribution for the Investor Class shares pursuant to Rule 12b-1 of the 1940 Act (the “Plan”). The Plan allows the Fund to use Investor Class assets to pay fees in connection with the distribution and marketing of the Investor Class shares and/or the provision of shareholder services to the Investor Class shareholders. The Plan permits payment for services in connection with the administration of plans or programs that use Investor Class assets of the Fund as their funding medium and for related expenses. The Plan permits the Fund to make total payments at an annual rate of up to 0.25% of the Investor Class’ average daily net assets attributable to the Investor Class shares. Because these fees are paid out of the Fund’s Investor Class assets on an ongoing basis, over time they will increase the cost of an investment in the Investor Class shares, and Plan fees may cost an investor more than other types of sales charges. Plan fees are shown as distribution and service fees on the Statement of Operations.
7. TRUSTEES
As of September 30, 2014, there were four Trustees, three of whom are not “interested persons” (within the meaning of the 1940 Act) of the Trust (the “Independent Trustees”). Prior to October 1, 2014, the Independent Trustees received a quarterly retainer of $2,000, plus $1,000 for each regular Board or Committee meeting attended, $1,000 for each special telephonic Board or Committee meeting attended and $1,000 for each special in-person Board meeting attended. Effective October 1, 2014, the Independent Trustees receive a quarterly retainer of $4,000, plus $2,000 for each regular Board or Committee meeting attended, $2,000 for each special telephonic Board or Committee meeting attended and $2,000 for each special in-person Board meeting attended. The Independent Trustees are also reimbursed for all reasonable out-of-pocket expenses relating to attendance at meetings and for meeting-related expenses. Officers of the Trust and Trustees who are interested persons of the Trust receive no salary or fees from the Trust.
8. INDEMNIFICATIONS
Under the Trust’s organizational documents, its officers and Trustees are indemnified against certain liabilities arising out of the performance of their duties to the Trust. Additionally, in the normal course of business, the Trust enters into contracts with service providers that may contain general indemnification clauses which may permit indemnification to the extent permissible under applicable law. The Trust’s maximum exposure under these arrangements is unknown, as this would involve future claims that may be made against the Trust that have not yet occurred.
9. CHANGES IN ACCOUNTANTS
On June 30, 2014, KPMG LLP acquired certain assets of ROTHSTEIN-KASS, P.A. (d/b/a Rothstein Kass & Company, P.C.) and certain of its affiliates (“Rothstein Kass”), the independent public accounting firm for the Fund. As a result of this transaction, on June 30, 2014, Rothstein Kass resigned as the independent registered public accounting firm for the Funds. As the Fund commenced operations on September 9, 2014 and the Fund’s fiscal year end is September 30th, there are no financial statements for the Fund for the fiscal year ended September 30, 2013.
The Board of Trustees of the Trust approved the selection of KPMG LLP to serve as the Fund’s independent registered public accounting firm for the Funds’ fiscal year ending September 30, 2014 at an in-person meeting held on August 22, 2014.
16 |
1.844.805.5999 | www.newsheridanadvisors.com |
Table of Contents
| New Sheridan Developing World Fund | Report of Independent Registered Public Accounting Firm | |
The Board of Trustees and Shareholders
ALPS Series Trust:
We have audited the accompanying statement of assets and liabilities of New Sheridan Developing World Fund, including the portfolio of investments, as of September 30, 2014, and the related statement of operations, the statement of changes in net assets, and the financial highlights for the period from September 9, 2014 (commencement of operations) to September 30, 2014. These financial statements and financial highlights are the responsibility of the Fund’s management. Our responsibility is to express an opinion on these financial statements and financial highlights based on our audit.
We conducted our audit in accordance with the standards of the Public Company Accounting Oversight Board (United States). Those standards require that we plan and perform the audit to obtain reasonable assurance about whether the financial statements and financial highlights are free of material misstatement. An audit includes examining, on a test basis, evidence supporting the amounts and disclosures in the financial statements. Our procedures included confirmation of securities owned as of September 30, 2014, by correspondence with custodians and brokers, or by other appropriate auditing procedures where replies from brokers were not received. An audit also includes assessing the accounting principles used and significant estimates made by management, as well as evaluating the overall financial statement presentation. We believe that our audit provides a reasonable basis for our opinion.
In our opinion, the financial statements and financial highlights referred to above present fairly, in all material respects, the financial position of New Sheridan Developing World Fund as of September 30, 2014, the results of its operations, the changes in its net assets, and the financial highlights for the period from September 9, 2014 (commencement of operations) to September 30, 2014, in conformity with U.S. generally accepted accounting principles.
KPMG LLP
Denver, Colorado
November 24, 2014
Annual Report | September 30, 2014 | 17 |
Table of Contents
| New Sheridan Developing World Fund | Additional Information | |
September 30, 2014 (Unaudited) |
1. PROXY VOTING POLICIES AND VOTING RECORD
A description of the policies and procedures that the Fund uses to determine how to vote proxies relating to portfolio securities is available without charge, upon request, (i) by calling the Fund (toll-free) at 1-855-674-4642 or (ii) on the Securities and Exchange Commission’s the (“SEC”) website at http://www.sec.gov. Information regarding how the Fund voted proxies relating to portfolio securities during the most recent 12-month period ended June 30 will be available (i) without charge, upon request, by calling the Fund (toll-free) at 1-855-674-4642 or (ii) on the SEC’s website at http://www.sec.gov.
2. PORTFOLIO HOLDINGS
The Fund files its complete schedule of portfolio holdings with the SEC for the first and third quarters of each fiscal year on Form N-Q. The Fund’s Forms N-Q are available on the SEC website at http://www.sec.gov. The Fund’s Forms N-Q may be reviewed and copied at the SEC’s Public Reference Room in Washington, D.C., and information on the operation of the Public Reference Room may be obtained by calling 1-800-SEC-0330.
3. DISCLOSURE REGARDING APPROVAL OF FUND ADVISORY AGREEMENT
On August 22, 2014, the Trustees met in person to discuss, among other things, the approval of the Investment Advisory Agreement (the “Advisory Agreement”) between the Trust and New Sheridan Advisors, LLC (the “Adviser”), on behalf of the New Sheridan Developing World Fund (the “Fund”) with in accordance with Section 15(c) of the 1940 Act. The Independent Trustees met with independent legal counsel during executive session and discussed the Advisory Agreement and related matters.
In approving the Advisory Agreement, the Trustees, including the Independent Trustees, considered the following factors with respect to the Fund:
Investment Advisory Fee Rate: The Trustees reviewed and considered the contractual annual advisory fee to be paid by the Trust, on behalf of the Fund, to the Adviser of 1.35% of the Fund’s daily average net assets, in light of the nature, extent and quality of the advisory services to be provided by the Adviser to the Fund.
The Trustees considered the information they received comparing the Fund’s contractual annual advisory fee and overall expenses with those of funds in the expense group and universe of funds provided by an independent provider of investment company data (the “Independent Provider”), and by New Sheridan which screened emerging market funds and frontier market funds peer groups based on a Bloomberg tool. The Trustees noted that the New Sheridan contractual advisory fee of 1.35% is at the top of the range of its emerging markets Independent Provider peer group of 0.70% to 1.35% and within the range of its frontier markets Independent Provider peer group of 1.25% to 1.75%, its emerging markets Bloomberg-based analysis of 0.76% to 2.00% and its frontier markets Bloomberg-based analysis of 1.25% to 1.75%. The Trustees also noted the Fund’s Investor Class total net expense of 1.85% is within the range of its emerging markets Independent Provider peer group of 1.28% to 1.95%, its frontier markets Independent Provider peer group of 1.80% to 2.25%, its emerging markets Bloomberg-based analysis of 1.15% to 2.41% and its frontier markets Bloomberg-based analysis of 1.85% to 2.38%. After consideration, the Trustees noted that the Fund is an emerging markets fund with a frontier market component and, therefore, the separate emerging markets and frontier markets peer groups provided by Independent Provider and the Bloomberg-based peer group ranges provided by the Adviser appear to be directly comparable to the Fund given that the frontier market component will add to the overall cost of operating the Fund. After further consideration, the Trustees determined that the contractual annual advisory fees and total net expenses set forth above for the Fund, taking into account the contractual fee waiver in place, is fair to the Fund’s shareholders.
Nature, Extent and Quality of the Services under the Advisory Agreement: The Trustees received and considered information regarding the nature, extent and quality of services to be provided to the Fund under the Advisory Agreement with the Adviser. The Trustees reviewed certain background materials supplied by the Adviser in its presentation, including its Form ADV.
The Trustees reviewed and considered the Adviser’s investment advisory personnel, its history as an asset manager and its performance and the amount of assets currently under management by the Adviser. The Trustees also reviewed the research and decision-making processes utilized by the Adviser, including the methods adopted to seek to achieve compliance with the investment objectives, policies and restrictions of the Fund.
The Trustees considered the background and experience of the Adviser’s management in connection with the Fund, including reviewing the qualifications, backgrounds and responsibilities of the management team primarily responsible for the day-to-day portfolio management of the Fund and the extent of the resources devoted to research and analysis of actual and potential investments. The Trustees noted that the Adviser currently sub-advises three existing registered investment companies and considered the fees the Adviser charges to sub-advise these funds.
The Trustees also reviewed, among other things, New Sheridan’s Code of Ethics.
| 18 |
1.844.805.5999 | www.newsheridanadvisors.com |
Table of Contents
| New Sheridan Developing World Fund | Additional Information | |
September 30, 2014 (Unaudited) |
Performance: The Trustees noted that since the Fund has not yet begun operations, there is no performance of the Fund to be reviewed or analyzed at this time. The Trustees considered the Adviser’s reputation generally and its investment techniques, risk management controls and decision-making processes.
The Adviser’s Profitability: The Trustees received and considered a projected profitability analysis prepared by the Adviser based on the fees payable under the Advisory Agreement. The Trustees considered the profits, if any, anticipated to be realized by the Adviser in connection with the operation of the Fund.
Economies of Scale: The Trustees considered whether economies of scale in the provision of services to the Fund would be passed along to the shareholders under the proposed Advisory Agreement.
Other Benefits to the Adviser: The Trustees reviewed and considered any other incidental benefits derived or to be derived by the Adviser from its relationship with the Fund, noting that the Adviser does not currently engage in soft dollar arrangements pursuant to its soft dollar policy.
In selecting the Adviser and the fees charged under the Advisory Agreement, the Trustees concluded that no single factor reviewed by the Trustees was identified by the Trustees to be determinative as the principal factor in whether to approve the Advisory Agreement. Further, the Independent Trustees were advised by independent legal counsel throughout the process. The Trustees, including all of the Independent Trustees, concluded that:
| — | the contractual annual advisory fees of 1.35% of the Fund’s daily average net assets to be paid to the Adviser under the Advisory Agreement and the total net expenses of 1.85% for the Fund’s Investor Class shares, taking into account the contractual fee waiver in place, were fair to the Fund’s shareholders; |
| — | the nature, extent and quality of services to be rendered by the Adviser under the Advisory Agreement were adequate; |
| — | there was no performance history for the Fund for the Board to consider; |
| — | the terms of the proposed fee waiver/expense reimbursement letter agreement between the Trust, on behalf of the Fund, and the Adviser were not unreasonable; |
| — | the profit, if any, anticipated to be realized by the Adviser in connection with the operation of the Fund was not unreasonable; and |
| — | there were no material economies of scale or other material incidental benefits accruing to the Adviser in connection with its relationship with the Fund. |
Based on the Trustees’ deliberations and their evaluation of the information described above, the Trustees, including all of the Independent Trustees, concluded that the Adviser’s compensation for investment advisory services is consistent with the best interests of the Fund and its shareholders.
Annual Report | September 30, 2014 | 19 |
Table of Contents
| New Sheridan Developing World Fund | Trustees and Officers | |
September 30, 2014 (Unaudited) |
INDEPENDENT TRUSTEES
Name, Birth Year & Address* | Position(s) Held with Fund | Term of Office and Length of Time Served | Principal Occupation(s) During Past 5 Years** | Number of Funds in Fund Complex Overseen by Trustee*** | Other Directorships Past 5 Years** | |||||
| ||||||||||
Cheryl Burgermeister Birth year: 1951 | Trustee | Ms. Burgermeister was elected to the Board on October 30, 2012; indefinite term. | Ms. Burgermeister is Trustee and Audit Committee Chair of The Select Sector SPDR Trust (October 1998 to present), Trustee of Russell Investment Funds (September 2012 to present) and Trustee, Treasurer and Finance Committee Chair of the Portland Community College Foundation (January 2001 to present). She also served as Trustee and Audit Committee Chair of E*Trade Funds (March 2004 to March 2010), Trustee of Zero Gravity Internet Fund (May 2000 to December 2001), Director and Treasurer of Crabbe Huson Family of Funds (1998 to 1999) and Director, Chief Financial Officer and Treasurer of The Crabbe Huson Group, Inc. (July 1987 to October 1999). From 1982 to 1986, Ms. Burgermeister was Supervising Senior Accountant at KPMG Peat Marwick. Ms. Burgermeister a licensed Certified Public Accountant and a member of the Oregon Society of Certified Public Accountants.
| 9 | Ms. Burgermeister is a Trustee and Audit Committee Chair of The Select Sector SPDR Trust (9 ETFs) and Trustee of Russell Investment Funds (42 funds). | |||||
| ||||||||||
J. Wayne Hutchens Birth year: 1944 | Trustee | Mr. Hutchens was elected to the Board on October 30, 2012; indefinite term. | Mr. Hutchens is currently retired. From April 2006 to December 2012, he served as President and CEO of the University of Colorado (CU) Foundation and from April 2009 to December 2012, he was Executive Director of the CU Real Estate Foundation. Mr. Hutchens is also Trustee of the Denver Museum of Nature and Science (2000 to present), Director of AMG National Trust Bank (June 2012 to present) and Trustee of Children’s Hospital Colorado (May 2012 to present). Prior to these positions, Mr. Hutchens spent 29 years in the banking industry, retiring as Chairman of Chase Bank Colorado. | 9 | None. | |||||
| ||||||||||
| * | All communications to Trustees and Officers may be directed to ALPS Series Trust c/o 1290 Broadway, Suite 1100, Denver, CO 80203. |
| ** | Except as otherwise indicated, each individual has held the office shown or other offices in the same company for the last five years. |
| *** | The Fund Complex currently consists of nine series of the Trust and any other investment companies for which New Sheridan Advisors, LLC provide investment advisory services, currently none. |
| 20 |
1.844.805.5999 | www.newsheridanadvisors.com |
Table of Contents
| New Sheridan Developing World Fund | Trustees and Officers | |
September 30, 2014 (Unaudited) |
INDEPENDENT TRUSTEES (continued)
| Name, Birth Year & Address* | Position(s) Held with Fund | Term of Office and Length of Time Served | Principal Occupation(s) During Past 5 Years** | Number of Complex | Other Directorships Held by Trustee During Past 5 Years** | |||||
| ||||||||||
Patrick Seese Birth year: 1971 | Trustee | Mr. Seese was elected to the Board on October 30, 2012; indefinite term. | Mr. Seese is an owner and a Managing Director of Integris Partners, a middle-market investment banking firm serving closely-held companies, financial sponsors and public companies (February 2008 to present). Prior to this, Mr. Seese was a Managing Director of Headwaters MB, a middle-market investing banking firm (December 2003 to February 2008). Prior to that, Mr. Seese worked in Credit Suisse First Boston’s Mergers and Acquisitions Group and served as Head of Corporation Development, Katy Industries, a publicly traded industrial and consumer products company and at Deloitte & Touche LLP, where he began his career in 1994. | 9 | None. | |||||
| ||||||||||
| INTERESTED TRUSTEE | ||||||||||
| ||||||||||
Jeremy O. May Birth year: 1970 | Trustee, Chairman and President | Mr. May was elected Trustee, Chairman and President on October 30, 2012; indefinite term. | Mr. May joined ALPS in 1995 and is currently President of ALPS Fund Services, Inc. and ALPS Distributors, Inc. and Executive Vice President of ALPS Holdings, Inc. and ALPS Advisors, Inc. Because of his positions with these entities, Mr. May is deemed an affiliate of the Trust as defined under the 1940 Act. Mr. May currently serves as Treasurer of Clough Global Allocation Fund, Clough Global Equity Fund, Clough Global Opportunities Fund, Mr. May is also Chairman and Trustee of the Reaves Utility Income Fund. Mr. May is currently Vice Chair of the Board of Directors of the University of Colorado Foundation. | 9 | Mr. May is Chairman and Trustee of the Reaves Utility Income Fund (1 fund). | |||||
| ||||||||||
| * | All communications to Trustees and Officers may be directed to ALPS Series Trust c/o 1290 Broadway, Suite 1100, Denver, CO 80203. |
| ** | Except as otherwise indicated, each individual has held the office shown or other offices in the same company for the last five years. |
| *** | The Fund Complex currently consists of nine series of the Trust and any other investment companies for which New Sheridan Advisors, LLC provide investment advisory services, currently none. |
Annual Report | September 30, 2014 | 21 |
Table of Contents
| New Sheridan Developing World Fund | Trustees and Officers | |
September 30, 2014 (Unaudited) |
OFFICERS
Name, Birth Year & Address* | Position(s) Held with Fund | Term of Office and Length of Time Served | Principal Occupation(s) During Past 5 Years** | |||
| ||||||
Kimberly R. Storms Birth year: 1972 | Treasurer | Ms. Storms was elected Treasurer of the Trust on October 30, 2012; indefinite term. | Ms. Storms is Senior Vice President - Director of Fund Administration of ALPS. Ms. Storms joined ALPS in 1998 as Assistant Controller. Because of her position with ALPS, Ms. Storms is deemed an affiliate of the Trust as defined under the 1940 Act. Ms. Storms is also Treasurer of ALPS ETF Trust, Liberty All-Star Equity Fund and Liberty All-Star Growth Fund, Inc. She serves as Chief Financial Officer of Arbitrage Funds and Assistant Treasurer of Financial Investors Trust. | |||
| ||||||
JoEllen L. Legg Birth year: 1961 | Secretary | Ms. Legg was elected Secretary of the Trust on October 30, 2012; indefinite term. | Ms. Legg joined ALPS in October 2007 and is Vice President, Senior Counsel of ALPS. Prior to joining ALPS, Ms. Legg served as Senior Counsel - Law (Corporate & Securities) for Adelphia Communications Corporation (February 2005 - March 2007). Prior to this, Ms. Legg held associate positions at Fried Frank Harris Shriver & Jacobson LLP (1998 - 2004) and at Patton Boggs LLP (2004 - 2005). Because of her position with ALPS, Ms. Legg is deemed an affiliate of the Trust as defined under the 1940 Act. Ms. Legg is also the Assistant Secretary of the Griffin Institutional Access Real Estate Fund, James Advantage Funds, Stone Harbor Investment Funds, Stone Harbor Emerging Markets Income Fund, Stone Harbor Emerging Markets Total Income Fund, WesMark Funds and Griffin Institutional Access Real Estate Fund. | |||
| ||||||
Nate Mandeville Birth year: 1977 | Assistant Treasurer | Mr. Mandeville was elected Assistant Treasurer of the Trust on August 22, 2014; indefinite term. | Mr. Mandeville joined ALPS in December 2013 and is Fund Controller of ALPS. Prior to joining ALPS, Mr. Mandeville worked for Great-West Financial (2011-2013), Virtuoso Sourcing Group (2008-2011) and Janus Capital Group (2000-2008). Because of his position with ALPS, Mr. Mandeville is deemed an affiliate of the Trust as defined under the 1940 Act. | |||
| ||||||
Lucas Foss Birth year: 1977 | Chief Compliance Officer (“CCO”) | Mr. Foss was elected CCO of the Trust on October 30, 2012; indefinite term. | Mr. Foss joined ALPS in November 2004 and is Deputy Chief Compliance Officer of ALPS. Prior to his current role, Mr. Foss served as a Compliance Manager at ALPS (January 2010 - August 2012), and a Senior Compliance Analyst at ALPS (November 2004 – May 2006). Before joining ALPS, Mr. Foss held positions at Bisys Hedge Fund Services and Deutsche Asset Management. Because of his position with ALPS, Mr. Foss is deemed an affiliate of the Trust as defined under the 1940 Act. Mr. Foss is also CCO of Caldwell & Orkin Funds, Whitebox Mutual Funds, Boulder Growth & Income Fund, Boulder Total Return Fund, the Denali Fund and The Principal Real Estate Income Fund. | |||
| ||||||
| * | All communications to Trustees and Officers may be directed to ALPS Series Trust c/o 1290 Broadway, Suite 1100, Denver, CO 80203. |
| ** | Except as otherwise indicated, each individual has held the office shown or other offices in the same company for the last five years. |
Additional information about members of the Board of Trustees and officers of the Trust is available in the Statement of Additional Information and is available, without charge, upon request, by calling the Fund (toll-free) at 1-855-331-6240.
22 |
1.844.805.5999 | www.newsheridanadvisors.com |
Table of Contents
Page Intentionally Left Blank
Table of Contents
Must be accompanied or preceded by a prospectus.
The New Sheridan Developing World Fund is distributed by ALPS Distributors, Inc.
|
Table of Contents

Table of Contents
| Riverside Frontier Markets Fund | Table of Contents |
| 1 | |||
| 7 | |||
| 9 | |||
| 10 | |||
Statement of Assets and Liabilities
| 17 | |||
| 19 | |||
Statement of Changes in Net Assets
| 20 | |||
| 21 | |||
| 23 | |||
Report of Independent Public Accounting Firm
| 36 | |||
| 37 | |||
| 38 | |||
Table of Contents
| Riverside Frontier Markets Fund | Shareholder Letter | |
September 30, 2014 (Unaudited) |
Since we launched the Riverside Frontier Markets Fund (the “Fund”) on February 28, 2014, it has delivered solid, relatively low volatility returns, gaining 6.40% and 6.20% for the Institutional and Investor class respectively. The Frontier Markets, as measured by the MSCI Frontier Markets Total Return Net Index (MSEUFMSN) (“FM Index”), decisively lead the global performance since we launched the Fund, returning 17.0% vs. 2.7% for the MSCI Developed Markets Total Return Net Index (NDDUWI) and 6.0% for the MSCI Emerging Markets Total Return Net Index (NDUEEGF). 90% of the FM Index performance came from the March through May time period and was led by United Arab Emirates (UAE) and Qatar constituents mainly as a result of their upgrade by MSCI to an emerging markets status. The upgrade, which was effectuated as of the end of May, resulted in a drastic shift in the composition of the FM Index. Prior to the end of May, the combined weight of UAE and Qatar represented 36% of the index. After May, Kuwait and Nigeria became the largest constituents, representing 44% of the index weight at the end of September. The high index country concentrations illustrate the risk and inefficiencies of the benchmark in this space and while we’re using it as a best available comparison, we are not investing relative to the benchmark and expect the fund to continue to perform with significant tracking error. We believe attractive long term opportunities lie in a broader array of countries that we have specified as our investable universe. One of the benefits of investing in that broad and diverse universe is the diversification we are able to achieve: currently our average correlation (R-Squared) between our individual holdings in the portfolio is only 2%. This low correlation stems from very low intra correlations between individual countries in Frontier Markets which generally have very internally focused economies with less exposure to the foreign capital flows than developed or emerging markets.
Investment Strategy
The Fund utilizes a value driven, bottom-up investment process. We begin with an investment universe of over 1500 companies, meeting certain liquidity requirements and domiciled in what we deem to be frontier markets in regions located around the world. Utilizing our proprietary fundamentals-based investment model, we rank the companies in our universe from a valuation perspective. We then filter the universe down to approximately 300 attractively ranked companies. Next, we subject the roughly 300 securities that we are still considering to what we call “corporate risk analysis”. In this phase of the process, we attempt to evaluate the risks facing the remaining companies for a variety of internal and external factors. The objective of this step of the process is to try to avoid those companies that we believe face risks that outweigh their attractive valuation rankings. Factors evaluated include financial fundamentals, management performance consistency, and corporate governance. Through this evaluation, we filter the list of purchase candidates down to approximately 125-150 names from which we build our portfolio. In the portfolio construction phase of the process, we focus on portfolio risk and diversification. In this phase, we consider such factors as individual position size, sector and industry diversification as well as country diversification. We also seek to statistically diversify the portfolio by considering the correlation of each security to the overall portfolio. The end result of the portfolio construction phase is a diversified portfolio of approximately 75-120 companies that we believe offer attractive reward/risk ratios within the context of a fully diversified portfolio.
Annual Report | September 30, 2014 | 1 |
Table of Contents
| Riverside Frontier Markets Fund | Shareholder Letter | |
September 30, 2014 (Unaudited) |
Portfolio Review
We believe that the valuation and growth metrics of the portfolio are very compelling as noted in the table below:
| Weighted Average Portfolio Valuation, September 30, 2014 | ||||||||||||
| Mkt Cap | Trl P/E | Est P/E | 3-Yr EPS Gth | 3-Yr Div Gth | P/B | P/CF | ||||||
$3.3 Bil | 11.8 | 9.4 | 14.6% | 16.0% | 2.5 | 10.2 | ||||||
In our judgment, stocks within frontier markets collectively offer a great combination of attractive valuations and long-term growth characteristics. As of September 30th, the Fund’s portfolio had a very low Price to Earnings Ratio (P/E) to Earnings Per Share (EPS) Growth Ratio of about 0.8, and annualized weighted average dividend growth of 16% on trailing 3-year basis. In comparison the S&P 500 has a P/E to EPS Growth Ratio of 2.2. Another way of saying this, per unit of growth, investors can purchase frontier stocks at about 1/3 the cost of S&P 500 stocks per unit of growth.
Since the inception of the Fund, the world has not been short of geopolitical headlines. Despite major events like the Ukraine – Russia conflict, another coup in Thailand, the rise of ISIS, the outbreak of Ebola, and political protests in Pakistan, the R-Squared of weekly returns of the countries in which we are invested has stayed at the very low level of 4% this year. Furthermore, nine of the top ten best performing global equity indices since the Fund was launched were from our defined frontier universe, including some from the above mentioned countries. Over the last 5 years, the 10 frontier markets where we have the highest exposure as of September 30, 2014 have an R-Squared of only 6%. This provides investors with the opportunity to significantly reduce individual country idiosyncratic risk through an effectively diversified frontier portfolio.
Since inception of the Fund, the returns of the country constituents within the fund continued to be driven very much by local/regional events. One of our largest exposure countries, Saudi Arabia, was positively impacted by the announcement of the stock market opening for direct investment by qualified foreign institutional investors (currently only available via SWAPs and p-notes) starting in 2015. The Capital Market Authority (Saudi regulatory authority) submitted proposed draft rules to the Kingdom’s Supreme Economic Council that are relatively strict in terms of Assets Under Management and operating history requirements (USD 5 billion and 5 year minimum track records) with the goal of limiting speculative flows. The Fund’s exposure to Saudi Arabia delivered strong returns and contributed positively to the Fund’s performance over time period, led by consumer and materials names.
Pakistan, which has also contributed positively to the Fund’s performance, has been the Fund’s second largest exposure market since the Fund’s inception. The market encountered a significant sell-off in August resulting from an onset of political instability with the opposing party organizing protests against the current government, claiming fraud in last year’s elections. Since then the situation has somewhat stabilized and markets have rebounded as so far as Pakistan’s movement towards democracy appears to be working. Just like all the other market exposures, the Fund’s exposure to Pakistan has been primarily driven by our bottom-up stock picking process which has identified many very attractively priced stocks in market. Our holdings in Pakistan as of September 30th have been trading at a weighted average Dividend Yield of 8.2% with 11% 3-year annualized payout growth, a Trailing P/E of 9.1x, an Estimated P/E of 7.9x, and a 3-year EPS growth of 22%.
2 | www.riversidefunds.com |
Table of Contents
| Riverside Frontier Markets Fund | Shareholder Letter | |
September 30, 2014 (Unaudited) |
Relative valuations are still very compelling and therefore the Fund will continue to hold its exposure to Pakistan for the foreseeable future.
Our Egyptian positions also positively contributed to the Fund’s performance, despite quite a bit of volatility in the market that was dominated by politics and fiscal policy. The EGX 30 Index had a strong run-up leading up to elections, and then experienced a sell-off after the results of the elections were in line with expectations, however at a much lower voter turnout. Post elections, the market continued to face headwinds from announcements of fiscal policies geared towards reducing the budget deficit, including levying new taxes on stock market capital gains and dividends, capping of wage limits, as well as cutting certain subsidies (such as for energy). As the market processed these developments, it staged a strong rebound with EGX 30 Index delivering a 20% rally, in USD terms, during the 3rd quarter. In August, there was a series of positive announcements including the development of a new Suez Canal hub to become a major industrial zone, the balance of payments registering a significant increase above expectations, the current account deficit decreasing to USD 2.4 Billion from USD 6.4 Billion a year ago, and tourism numbers growing by 16% year over year in July. Our diversified holdings in Egypt continued to trade at very attractive valuations as of September 30th with a weighted average Dividend Yield of 5.7%, Trailing P/E of 10.8x, and Estimated P/E of 8.0x.
The Fund’s portfolio continued to hold exposure to Nigerian names, chiefly in very attractively priced bank stocks that we deem to have solid fundamentals. This helped to boost the Fund’s performance from March to June as Nigerian bank names recovered from a weak start to the year, driven by regulatory headwinds such as an increase in required cash reserve ratios. While an increase in required cash reserve ratios and a full transition from Basel I to Basel II should be a drag on near term growth and earnings expectations in bank stocks, we think this is mainly reflected in valuations with an average P/E of our bank holdings at 8.2x, a 7.0% Dividend Yield, and EPS and Dividend growth of 46% and 29% respectively. We believe, the Fund’s bank stock holdings also have very attractive profitability ratios with an average Net Interest Margin ratio of 8.7% and an average Return on Equity of 20%.
The Fund’s Vietnamese positions were the largest detractor from performance as our stock picks have underperformed the overall market returns. We continued to hold attractively priced positions that traded at September 30th with average valuations of a 4.4% Dividend Yield, Trailing P/E of 14.4x, Estimated P/E at 11.3x and 3-year EPS and Dividend growth rates of 8% and 16% respectively. We deem these names to be well positioned to take advantage of a relative improvement in macroeconomic stability with a YTD trade surplus, vs. deficit in 2013, contained inflation outlook, and a solid build in Foreign Exchange (FX) reserves.
In terms of diversification, as of September 30th the Fund held 107 securities across 24 different countries (see country exposure below). Please note that mainly due to significant near-term Fund flows, as of September 30th the Fund held significantly more cash than is typical.
Annual Report | September 30, 2014 | 3 |
Table of Contents
| Riverside Frontier Markets Fund | Shareholder Letter | |
September 30, 2014 (Unaudited) |
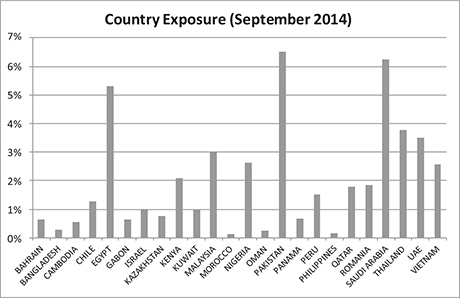
The composition of the Fund’s country exposure is subject to change.
As noted in the chart, the 3 largest country exposures as of September 30th were Pakistan, Saudi Arabia and Egypt at 7%, 6%, and 5% respectively.
Outlook
As long-term value investors, the Fund’s discipline is focused on identifying undervalued securities with very attractive reward/risk ratios, while mitigating idiosyncratic risk by diversifying across the Fund’s frontier markets universe. Comparing the Estimated P/E ratios for the MSCI Frontier Markets Index versus the MSCI U.S. and MSCI World Indexes, we note that the FM Index was selling at a discount of 33% and 27%, respectively as of September 30th, despite also having high long-term growth expectations. We also note that the long-term volatility of the FM Index is roughly 30% lower than the other two indexes as a result of the very low correlations across the constituent countries of the FM Index.
The Fund will continue to take advantage of these favorable investment characteristics of frontier markets by systematically implementing the long-term valuation discipline that is a core investment principle of Riverside Advisors. That discipline is focused on a 3 step process of (1) identifying the most attractively priced securities based on long-term metrics of value; (2) conducting corporate risk analysis to eliminate from consideration those securities with unappealing levels of idiosyncratic risk; and (3) constructing a portfolio consisting of those remaining securities that offers strong diversification benefits to the Fund’s portfolio.
Thank you for your interest in the Riverside Frontier Markets Fund.
Ana Kolar
Portfolio Manager
4 | www.riversidefunds.com |
Table of Contents
| Riverside Frontier Markets Fund | Shareholder Letter | |
September 30, 2014 (Unaudited) |
Notes:
3 Yr Dividend Growth: Annualized 3 year gross dividend growth rate.
3 Yr EPS Growth: Annualized 3 year growth in earnings per share before extraordinary items.
Balance of Payments: A statement that summarizes an economy’s transactions with the rest of the world for a specified time period. It includes current and capital accounts.
Basel I: First accord, issued in 1988 is a set of international banking regulations put forth by the Basel Committee on Bank Supervision, which set out the minimum capital requirements of financial institutions with the goal of minimizing credit risk.
Basel II: Second of the Basel Committee on Bank Supervision recommendations, attempting to integrate Basel capital standards with national regulations, by setting the minimum capital requirements of financial institutions with the goal of ensuring institution liquidity.
Bottom-up: an investment approach that de-emphasizes the significance of economic and market cycles and focuses on the analysis of individual stocks.
Budget Deficit: Refers to government spending and financial status in which expenditures exceed revenue.
Cash Reserve Ratio: The reserve requirement set by central bank regulation that sets the minimum fraction of depositors’ balances that commercial bank must hold as reserves either in cash or as deposits with central bank.
Correlation: a statistical measure of how two securities move in relation to each other: In this Factsheet measured as R-squared: A statistical measure that represents the percentage of a security’s movements that can be explained by movements in a benchmark.
Current Account Deficit: A measurement of country’s trade in which the value of goods and services it imports exceeds the value of goods and services it exports. The current account also includes net income, such as interest and dividends, as well as transfers, such as foreign aid.
Dividend Yield: The most recently announced gross dividend, annualized based on the dividend frequency, then divided by the current market price.
Earnings Per Share (EPS): a company’s net profit minus its preferred stock obligations, with the difference divided by the number of outstanding shares of common stock.
EGX 30 Index: a stock market index for the 30 most active stocks in the Egyptian stock market.
Estimated P/E Ratio: the ratio of a stock’s price to the company’s estimated earnings for current fiscal year, using the Bloomberg consensus estimates.
FX Reserves: A foreign currency held by central banks and other major financial institutions as a means to pay off international debt obligations, or to influence their domestic exchange rate.
Market Capitalization: The company’s worth calculated by multiplying the shares outstanding by the price per share.
MSCI Developed Markets Total Return Net Index: A free-float weighted equity index, with dividends reinvested net of withholding taxes. The index covers 23 developed markets, started with a base value of 100 as of December 31 1969.
MSCI Emerging Markets Total Return Net Index: A free-float weighted equity index, with dividends reinvested net of withholding taxes. The index covers 23 emerging markets and has daily data since January 1988.
MSCI U.S. Index: A broad market index that represents approximately 99.5% of the US equity market capitalization.
Net Interest Margin (NIM): A measure of the difference between the interest income generated by banks and the amount of interest paid out to their lenders, relative to the amount of their interest-earning assets.
P/B (Price to Book): Ratio of stock’s price to book value per share.
Annual Report | September 30, 2014 | 5 |
Table of Contents
| Riverside Frontier Markets Fund | Shareholder Letter | |
September 30, 2014 (Unaudited) |
P/CF (Price to Cash Flow): Ratio of stock’s price to cash flow per share.
P-note: Participation note is a financial instrument designed to provide the total return of an equity security.
Return on Equity: The amount of net income returned as a percentage of shareholders equity.
S&P 500® Index: The Standard & Poor’s composite index of 500 stocks, a widely recognized, unmanaged index of common stock prices.
Standard Deviation: a measure of the degree to which individual values vary from the distribution mean.
SWAP: In this case refers to total return equity SWAP, an agreement in which one party makes payments based on a set rate, while other party makes payments based on the total return of an underlying equity position.
Trade Deficit/Surplus: An economic measure of balance of trade where a trade surplus represents a net inflow of domestic currency from foreign markets and a trade deficit represents net outflow.
Trailing P/E ratio: the ratio of a stock’s price to the company’s earnings per share in the past 12 months.
The Riverside Frontier Markets Fund is not suitable for all investors. Subject to investment risks, including possible loss of the principal amount invested.
Diversification does not eliminate the risk of experiencing investment losses.
The Fund is subject to the following principal investment risks: concentration risk, counterparty, credit and custodial risk, currency risk, derivatives risk, emerging and frontier markets risk, foreign securities risk, foreign tax risk, small- and micro- cap risk, and value investing risk. See the Prospectus for additional information regarding the risks.
6 | www.riversidefunds.com |
Table of Contents
| Riverside Frontier Markets Fund | Portfolio Update | |
September 30, 2014 (Unaudited) |
Performance (as of September 30, 2014)
| 3 Month | Since Inception* | |||||||||
Riverside Frontier Markets Fund - Investor | 2.12% | 6.20% | ||||||||
Riverside Frontier Markets Fund - Institutional | 2.21% | 6.40% | ||||||||
MSCI Frontier Markets Index(a) | 1.53% | 16.98% | ||||||||
MSCI All Country World Index(b) | -2.30% | 3.07% | ||||||||
The performance data quoted above represents past performance. Past performance is not a guarantee of future results. Investment return and value of the Fund shares will fluctuate so that an investor’s shares, when sold or redeemed, may be worth more or less than their original cost. Performance may be lower or higher than performance data quoted. Fund performance current to the most recent month-end is available by calling (855) 384-2813 or by visiting www.riversidefunds.com.
| * | Fund’s inception date is February 28, 2014. |
| (a) | MSCI Frontier Markets Index is a free float weighted index. MSCI classifies 33 countries as Frontier Markets, 24 of which are currently included in the MSCI Frontier Markets Index. |
| (b) | MSCI All Country World Index is a market capitalization weighted index designed to provide a broad measure of equity-market performance throughout the world. |
Returns of less than 1 year are cumulative.
Indices are not actively managed and do not reflect deduction for fees, expenses, or taxes. An investor cannot invest directly in an index.
The returns shown above do not reflect the deduction of taxes a shareholder would pay on Fund distributions or redemption of Fund shares.
The total annual operating expenses and total annual operating expenses after fee waivers and/or reimbursement you may pay as an investor in the Fund’s Investor Class and Institutional Class shares (as reported in the February 24, 2014 Prospectus) are 3.03% and 2.24%; and 2.78% and 1.99%, respectively.
The Fund is new and has a limited operating history.
Performance of $10,000 Initial Investment (as of September 30, 2014)
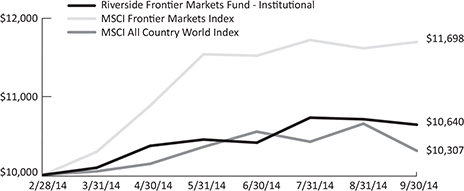
The graph shown above represents historical performance of a hypothetical investment of $10,000 in the Fund since inception. Past performance does not guarantee future results. All returns reflect reinvested dividends, but do not reflect the deduction of taxes that a shareholder would pay on Fund distributions or the redemption of Fund shares.
Annual Report | September 30, 2014 | 7 |
Table of Contents
| Riverside Frontier Markets Fund | Portfolio Update | |
September 30, 2014 (Unaudited) |
Geographical Breakdown (Market Value/Notional Exposure as a % of Net Assets)*
Middle East | 19.82% | |||
Asia/Pacific-Rim | 17.46% | |||
Africa | 5.52% | |||
Latin America | 3.47% | |||
Europe | 1.86% | |||
Cash & Equivalents | 51.87% | |||
| ||||
TOTAL | 100.00% | |||
| ||||
Sector Allocation (Market Value/Notional Exposure as a % of Net Assets)*
Financials | 16.24% | |||
Materials | 9.61% | |||
Utilities | 4.10% | |||
Industrials | 3.95% | |||
Energy | 3.58% | |||
Consumer Staples | 3.30% | |||
Consumer Discretionary | 2.52% | |||
Information Technology | 1.98% | |||
Telecommunication Services | 1.49% | |||
Diversified | 0.87% | |||
Health Care | 0.49% | |||
Cash & Equivalents | 51.87% | |||
| ||||
TOTAL | 100.00% | |||
| ||||
Top 10 Holdings (Market Value/Notional Exposure as a % of Net Assets)*
Advanced Petrochemicals Co. | 1.12% | |||
Hub Power Co. | 1.00% | |||
Petrovietnam Gas | 0.95% | |||
Bank Alfalah Ltd. | 0.89% | |||
Equity Bank Ltd. | 0.89% | |||
SC Fondul Proprietatea SA | 0.87% | |||
Qassim Cement Co. | 0.87% | |||
Boubyan Petrochemicals Co., KSCP | 0.85% | |||
Hua Yang Bhd | 0.85% | |||
Zenith Bank PLC | 0.84% |
| * | Holdings are subject to change. Tables present indicative values only. |
8 | www.riversidefunds.com |
Table of Contents
| Riverside Frontier Markets Fund | Disclosure of Fund Expenses | |
September 30, 2014 |
Examples: As a shareholder of the Riverside Frontier Markets Fund (the “Fund”), you will incur two types of costs: (1) transaction costs, including applicable redemption fees; and (2) ongoing costs, including management fees, distribution and service (12b-1) fees and other Fund expenses. The following examples are intended to help you understand your ongoing costs (in dollars) of investing in the Fund and to compare these costs with the ongoing costs of investing in other mutual funds. The examples are based on an investment of $1,000 invested on April 1, 2014 and held until September 30, 2014.
Actual Expenses. The first line under each class in the table below provides information about actual account values and actual expenses. You may use the information in this line, together with the amount you invested, to estimate the expenses that you paid over the period. Simply divide your account value by $1,000 (for example, an $8,600 account value divided by $1,000 = 8.6), then multiply the result by the number in the first line under the heading “Expenses Paid During Period April 1, 2014 – September 30, 2014” to estimate the expenses you paid on your account during this period.
Hypothetical Example for Comparison Purposes. The second line under each class in the table below provides information about hypothetical account values and hypothetical expenses based on the Fund’s actual expense ratio and an assumed rate of return of 5% per year before expenses, which is not the Fund’s actual return. The hypothetical account values and expenses may not be used to estimate the actual ending account balance or expenses you paid for the period. You may use this information to compare the ongoing costs of investing in the Fund and other mutual funds. To do so, compare this 5% hypothetical example with the 5% hypothetical examples that appear in the shareholder reports of the other funds.
Please note that the expenses shown in the table are meant to highlight your ongoing costs only and do not reflect any transactional costs, such as redemption fees. Therefore, the second line under each class in the table below is useful in comparing ongoing costs only and will not help you determine the relative total costs of owning different funds. In addition, if these transactional costs were included, your costs would have been higher.
Beginning Account Value | Ending Account Value September 30, 2014 | Expense Ratio(a) | Expenses Paid April 1, 2014 - September 30, 2014(b) | |||||||||||||||||
Investor Class | ||||||||||||||||||||
Actual | $ | 1,000.00 | $ | 1,052.50 | 2.22% | $ | 11.42 | |||||||||||||
Hypothetical (5% return before expenses) | $ | 1,000.00 | $ | 1,013.94 | 2.22% | $ | 11.21 | |||||||||||||
Institutional Class | ||||||||||||||||||||
Actual | $ | 1,000.00 | $ | 1,054.50 | 1.95% | $ | 10.04 | |||||||||||||
Hypothetical (5% return before expenses) | $ | 1,000.00 | $ | 1,015.29 | 1.95% | $ | 9.85 | |||||||||||||
| (a) | The Fund’s expense ratios have been annualized based on the Fund’s most recent fiscal half-year expenses. |
| (b) | Expenses are equal to the Fund’s annualized expense ratio, multiplied by the average account value over the period, multiplied by the number of days in the most recent fiscal half year (183), divided by 365. |
Annual Report | September 30, 2014 | 9 |
Table of Contents
| Riverside Frontier Markets Fund | Portfolio of Investments | |
September 30, 2014 |
| Value | ||||||||
| Shares | (Note 2) | |||||||
| ||||||||
COMMON STOCKS (13.05%) | ||||||||
Cambodia (0.54%) | ||||||||
NagaCorp Ltd. | 194,000 | $ | 138,913 | |||||
|
| |||||||
Total Cambodia | 138,913 | |||||||
|
| |||||||
Chile (0.17%) | ||||||||
A.F.P. Habitat SA | 23,800 | 34,987 | ||||||
Sigdo Koppers SA | 4,100 | 6,820 | ||||||
|
| |||||||
Total Chile | 41,807 | |||||||
|
| |||||||
Gabon (0.66%) | ||||||||
Total Gabon | 347 | 167,599 | ||||||
|
| |||||||
Total Gabon | 167,599 | |||||||
|
| |||||||
Israel (1.02%) | ||||||||
Matrix IT Ltd. | 6,200 | 33,618 | ||||||
Plasson Industries Ltd. | 800 | 32,235 | ||||||
Reit 1 Ltd. - REIT | 71,600 | 192,796 | ||||||
|
| |||||||
Total Israel | 258,649 | |||||||
|
| |||||||
Kazakhstan (0.76%) | ||||||||
KazMunaiGas Exploration Production JSC - GDR(a) | 11,050 | 193,375 | ||||||
|
| |||||||
Total Kazakhstan | 193,375 | |||||||
|
| |||||||
Malaysia (3.02%) | ||||||||
George Kent Malaysia Bhd | 66,200 | 31,077 | ||||||
Globetronics Technology Bhd | 141,400 | 201,723 | ||||||
HAP Seng Consolidated Bhd | 157,200 | 190,720 | ||||||
Hua Yang Bhd | 303,400 | 216,417 | ||||||
KLCC Stapled Group | 16,100 | 32,588 | ||||||
Media Prima Bhd | 46,800 | 31,813 | ||||||
Padini Holdings Bhd | 57,600 | 33,712 | ||||||
Protasco Bhd | 65,000 | 33,089 | ||||||
|
| |||||||
Total Malaysia | 771,139 | |||||||
|
| |||||||
| See Notes to Financial Statements | ||
10 | www.riversidefunds.com |
Table of Contents
| Riverside Frontier Markets Fund | Portfolio of Investments | |
September 30, 2014 |
| Value | ||||||||
| Shares | (Note 2) | |||||||
| ||||||||
Morocco (0.12%) | ||||||||
Lesieur Cristal | 2,722 | $ | 31,661 | |||||
|
| |||||||
Total Morocco | 31,661 | |||||||
|
| |||||||
Panama (0.67%) | ||||||||
Banco Latinoamericano de Comercio Exterior SA - Class E | 5,530 | 169,660 | ||||||
|
| |||||||
Total Panama | 169,660 | |||||||
|
| |||||||
Philippines (0.28%) | ||||||||
DMCI Holdings, Inc. | 18,400 | 32,370 | ||||||
Lafarge Republic, Inc. | 7,300 | 1,599 | ||||||
Marcventures Holdings, Inc. | 221,300 | 35,751 | ||||||
|
| |||||||
Total Philippines | 69,720 | |||||||
|
| |||||||
Thailand (3.79%) | ||||||||
Asia Plus Securities PCL | 1,382,400 | 167,977 | ||||||
Asia Sermkij Leasing PCL | 54,100 | 33,036 | ||||||
Bangkok Expressway PCL | 27,600 | 32,345 | ||||||
Delta Electronics Thailand PCL | 85,200 | 162,911 | ||||||
KGI Securities Thailand PCL | 338,600 | 34,669 | ||||||
Lalin Property PCL | 236,200 | 33,509 | ||||||
Lee Feed Mill PCL | 359,000 | 33,437 | ||||||
Pacific Pipe PCL | 188,900 | 32,916 | ||||||
Premier Marketing PCL | 586,200 | 178,075 | ||||||
Samart Telcoms PCL | 56,700 | 40,219 | ||||||
Thai Wah Starch PCL | 28,900 | 30,527 | ||||||
TTW PCL | 499,600 | 184,894 | ||||||
|
| |||||||
Total Thailand | 964,515 | |||||||
|
| |||||||
| See Notes to Financial Statements | ||
Annual Report | September 30, 2014 | 11 | |
Table of Contents
| Riverside Frontier Markets Fund | Portfolio of Investments | |
September 30, 2014 |
| Shares | Value (Note 2) | |||||||
| ||||||||
United Arab Emirates (2.02%) | ||||||||
Air Arabia PJSC | 317,730 | $ | 118,512 | |||||
Emirates NBD PJSC | 1,710 | 4,604 | ||||||
First Gulf Bank PJSC | 28,370 | 144,826 | ||||||
National Bank of Ras Al-Khaimah PSC | 56,600 | 141,309 | ||||||
Ras Al Khaimah Ceramics | 107,020 | 106,934 | ||||||
|
| |||||||
Total United Arab Emirates | 516,185 | |||||||
|
| |||||||
TOTAL COMMON STOCKS (Cost $3,348,326) | 3,323,223 | |||||||
|
| |||||||
7-Day Yield | Shares | Value (Note 2) | ||||||||||
| ||||||||||||
SHORT-TERM SECURITY (73.68%) |
| |||||||||||
Money Market Fund (73.68%) |
| |||||||||||
Fidelity Institutional Money Market Portfolio | 0.04738% | 18,763,916 | 18,763,916 | |||||||||
|
| |||||||||||
TOTAL SHORT-TERM SECURITY (Cost $18,763,916) | 18,763,916 | |||||||||||
|
| |||||||||||
TOTAL INVESTMENTS (86.73%) (Cost $22,112,242) | $ | 22,087,139 | ||||||||||
Other Assets In Excess Of Liabilities (13.27%) |
| 3,378,324 (b) | ||||||||||
|
| |||||||||||
NET ASSETS (100.00%) |
| $ | 25,465,463 | |||||||||
|
| |||||||||||
| (a) | Securities were purchased pursuant to Regulation S under the Securities Act of 1933, which exempts securities offered and sold outside of the United States from registration. Such securities cannot be sold in the United States without either an effective registration statement filed pursuant to the Securities Act of 1933 or pursuant to an exemption from registration. These securities have been deemed liquid under procedures approved by the Fund’s Board of Trustees. As of September 30, 2014, the aggregate market value of those securities was $193,375, representing 0.76% of the Fund’s net assets. |
| (b) | Includes cash which is being held as collateral for swap contracts. |
| See Notes to Financial Statements | ||
12 | www.riversidefunds.com |
Table of Contents
| Riverside Frontier Markets Fund | Portfolio of Investments | |
September 30, 2014 |
Common Abbreviations:
B.S.C. - Bahrain Stock Company.
Bhd - Berhad is the Malaysian term for public company.
GDR - Global Depositary Receipt.
JSC - Joint Stock Company.
KSCP- Designates a Closed Joint Stock Company in Kuwait.
Ltd. - Limited.
PCL - A rearrangement of the letters for Public Limited Company, used in Thailand.
PJSC - Private Joint Stock Company.
PLC - Public Limited Company.
PSC - Public Stock Company
QSC - Qatar Stock Company.
REIT - Real Estate Investment Trust.
SA - Generally designates corporations in various countries, mostly those employing the civil law.
SAE - Stands for Societe Anonyme Egyptienne meaning Egyptian Joint Stock Company.
TOTAL RETURN SWAP CONTRACTS (a)
| Reference Obligation | Swap Counterparty | Rate Paid by the Fund | Termination Date | Notional Amount | Unrealized Appreciation | |||||||||||||
| ||||||||||||||||||
Asia/Pacific-Rim | ||||||||||||||||||
Allied Bank Limited | JPMorgan | 2.03% | 10/05/2015 | $ | 31,800 | $ | 157 | |||||||||||
Bank Alfalah Ltd. | JPMorgan | 2.03% | 04/06/2015 | 819,000 | 106 | |||||||||||||
Hub Power Co. | JPMorgan | 2.03% | 04/06/2015 | 409,500 | 7,667 | |||||||||||||
Petroleum Equip Asmb | JPMorgan | 2.03% | 10/05/2015 | 25,500 | 5,005 | |||||||||||||
Southeast Bank Ltd. | Morgan Stanley | 3.04% | 03/04/2016 | 147,500 | 1,789 | |||||||||||||
Titas Gas Transmission & Distribution Co. | Morgan Stanley | 3.04% | 03/04/2016 | 32,000 | 2,575 | |||||||||||||
Africa | ||||||||||||||||||
Eastern Tobacco | JPMorgan | 1.98% | 04/06/2015 | 7,510 | 6,519 | |||||||||||||
Egyptian International Pharma | JPMorgan | 1.98% | 04/06/2015 | 14,880 | 3,724 | |||||||||||||
Equity Bank Ltd. | Morgan Stanley | 3.90% | 03/03/2016 | 391,400 | 31,391 | |||||||||||||
FCMB Group PLC | Morgan Stanley | 3.90% | 03/03/2016 | 1,288,500 | 22 | |||||||||||||
Guaranty Trust Bank | Morgan Stanley | 3.90% | 03/03/2016 | 1,145,150 | 2,040 | |||||||||||||
Kenya Commercial Bank Ltd. | Morgan Stanley | 3.90% | 03/03/2016 | 291,500 | 11,788 | |||||||||||||
| See Notes to Financial Statements | ||
Annual Report | September 30, 2014 | 13 | |
Table of Contents
| Riverside Frontier Markets Fund | Portfolio of Investments | |
September 30, 2014 |
TOTAL RETURN SWAP CONTRACTS (a) (continued)
| Reference Obligation | Swap Counterparty | Rate Paid by the Fund | Termination Date | Notional Amount | Unrealized Appreciation | |||||||||||||||
Zenith Bank PLC | Morgan Stanley | 3.90% | 03/03/2016 | $ | 1,430,610 | $ | 269 | |||||||||||||
Middle East | ||||||||||||||||||||
Advanced Petrochemicals Co. | JPMorgan | 2.03% | 04/06/2015 | 17,840 | 37,474 | |||||||||||||||
Al Tayyar | JPMorgan | 2.03% | 04/06/2015 | 5,155 | 18,396 | |||||||||||||||
Commercial Bank of Qatar QSC | JPMorgan | 2.03% | 04/06/2015 | 8,154 | 7,024 | |||||||||||||||
Doha Insurance Co | JPMorgan | 2.03% | 10/08/2015 | 4,100 | 523 | |||||||||||||||
Emirates NBD PJSC | JPMorgan | 1.23% | 04/06/2015 | 53,230 | 6,723 | |||||||||||||||
Etihad Etisalat Co. | JPMorgan | 2.03% | 04/06/2015 | 7,540 | 447 | |||||||||||||||
First Gulf Bank | JPMorgan | 1.23% | 04/06/2015 | 11,129 | 2,901 | |||||||||||||||
Mannai Corporation | JPMorgan | 2.03% | 10/08/2015 | 1,100 | 825 | |||||||||||||||
National Bank of Ras Al-Khaimah PSC | JPMorgan | 1.23% | 04/06/2015 | 34,140 | 591 | |||||||||||||||
National Gas & Industrialization | JPMorgan | 2.03% | 04/06/2015 | 20,100 | 18,147 | |||||||||||||||
Oriental Weavers Co. | JPMorgan | 1.98% | 04/06/2015 | 29,830 | 8,268 | |||||||||||||||
Qassim Cement Co. | JPMorgan | 2.03% | 04/06/2015 | 8,080 | 1,310 | |||||||||||||||
Qatar Navigation | JPMorgan | 2.03% | 04/06/2015 | 7,420 | 3,857 | |||||||||||||||
Ras Al Kmaimah Ceramics | JPMorgan | 1.23% | 04/06/2015 | 25,179 | 65 | |||||||||||||||
Riyad Bank | JPMorgan | 2.03% | 04/06/2015 | 30,380 | 12,157 | |||||||||||||||
Saudi Chemical Co | JPMorgan | 2.03% | 10/05/2015 | 1,700 | 721 | |||||||||||||||
Europe | ||||||||||||||||||||
SC Fondul Proprietatea SA | Morgan Stanley | 3.90% | 03/03/2016 | 814,280 | 11,724 | |||||||||||||||
Transelectrica SA | Morgan Stanley | 3.90% | 03/03/2016 | 4,900 | 3,095 | |||||||||||||||
|
| |||||||||||||||||||
| $ | 7,119,107 | 207,300 | ||||||||||||||||||
|
| |||||||||||||||||||
| See Notes to Financial Statements | ||
14 | www.riversidefunds.com |
Table of Contents
| Riverside Frontier Markets Fund | Portfolio of Investments | |
September 30, 2014 |
TOTAL RETURN SWAP CONTRACTS (a) (continued)
| Reference Obligation | Swap Counterparty | Rate Paid by the Fund | Termination Date | Notional Amount | Unrealized Depreciation | |||||||||||||
Middle East | ||||||||||||||||||
Agility Public Warehousing Co. | JPMorgan | 2.03% | 10/05/2015 | $ | 11,200 | $ | (99) | |||||||||||
AHLI United Bank B.S.C. | JPMorgan | 1.23% | 04/06/2015 | 196,926 | (126) | |||||||||||||
Air Arabia PJSC | JPMorgan | 1.23% | 04/06/2015 | 179,240 | (2,636) | |||||||||||||
Alexandria Mineral Oils Co. | JPMorgan | 1.98% | 04/06/2015 | 17,320 | (38) | |||||||||||||
Arriyadh Development | JPMorgan | 2.03% | 10/05/2015 | 5,100 | (1,280) | |||||||||||||
Boubyan Petrochemicals Co., KSCP | JPMorgan | 2.03% | 04/06/2015 | 82,225 | (1,328) | |||||||||||||
Credit Agricole Egypt | JPMorgan | 1.98% | 10/05/2015 | 11,900 | (1,017) | |||||||||||||
Doha Bank | JPMorgan | 2.03% | 10/08/2015 | 2,000 | (2,258) | |||||||||||||
National Co. For Maize Products | JPMorgan | 1.98% | 04/06/2015 | 23,930 | (5,658) | |||||||||||||
North Cairo Flour Mills | JPMorgan | 1.98% | 04/06/2015 | 35,640 | (5,132) | |||||||||||||
Oman Inv & Fin Co | JPMorgan | 1.23% | 10/08/2015 | 51,700 | (551) | |||||||||||||
Oman Telecom Co | JPMorgan | 1.23% | 10/08/2015 | 7,400 | (1,205) | |||||||||||||
Orascom Telecom SAE | JPMorgan | 1.98% | 04/06/2015 | 758,030 | (12,733) | |||||||||||||
Saudi Basic Industries Co. | JPMorgan | 2.03% | 10/05/2015 | 1,000 | (651) | |||||||||||||
Saudi Cement Co. | JPMorgan | 2.03% | 04/06/2015 | 6,180 | (5,309) | |||||||||||||
Saudi Vitrified Clay | JPMorgan | 2.03% | 10/05/2015 | 1,200 | (721) | |||||||||||||
Sidi Kerir Petrochemical Co. | JPMorgan | 1.98% | 04/06/2015 | 68,400 | (1,376) | |||||||||||||
Suez Cement Co. | JPMorgan | 1.98% | 04/06/2015 | 15,350 | (2,505) | |||||||||||||
Yanbu National Petro | JPMorgan | 2.03% | 10/05/2015 | 1,700 | (2,012) | |||||||||||||
Latin America | ||||||||||||||||||
Aguas Andinas SA | JPMorgan | 0.98% | 04/06/2015 | 244,780 | (11,914) | |||||||||||||
BBVA Banco Continental SA | JPMorgan | 1.00% | 04/06/2015 | 119,573 | (7,166) | |||||||||||||
Empresas Iansa SA | JPMorgan | 0.98% | 04/06/2015 | 4,093,520 | (2,240) | |||||||||||||
Intercorp Financial Services Inc. | JPMorgan | 1.13% | 04/06/2015 | 5,860 | (1,024) | |||||||||||||
| See Notes to Financial Statements | ||
Annual Report | September 30, 2014 | 15 | |
Table of Contents
| Riverside Frontier Markets Fund | Portfolio of Investments | |
September 30, 2014 |
TOTAL RETURN SWAP CONTRACTS (a) (continued)
| Reference Obligation | Swap Counterparty | Rate Paid by the Fund | Termination Date | Notional Amount | Unrealized Depreciation | |||||||||||||
Africa | ||||||||||||||||||
Bamburi Cement Co. | Morgan Stanley | 3.90% | 03/03/2016 | $ | 67,300 | $ | (28,925) | |||||||||||
British American Tob | Morgan Stanley | 3.90% | 03/03/2016 | 1,005 | (419) | |||||||||||||
FBN Holdings PLC | Morgan Stanley | 3.90% | 03/03/2016 | 2,263,910 | (20,089) | |||||||||||||
Lesieur Cristal | Morgan Stanley | 3.90% | 03/03/2016 | 78 | (21) | |||||||||||||
United Bank Africa | Morgan Stanley | 3.90% | 03/03/2016 | 720,600 | (3,445) | |||||||||||||
Asia/Pacific-Rim | ||||||||||||||||||
Bank Al Habib Ltd. | JPMorgan | 2.03% | 04/06/2015 | 102,800 | (2,443) | |||||||||||||
Fatima Fertilizer Co. | JPMorgan | 2.03% | 04/06/2015 | 680,200 | (5,861) | |||||||||||||
Fauji Cement Co., Ltd. | JPMorgan | 2.03% | 04/06/2015 | 1,113,000 | (5,957) | |||||||||||||
Fauji Fertilizer Co. | JPMorgan | 2.03% | 04/06/2015 | 170,500 | (2,763) | |||||||||||||
FPT Corp | JPMorgan | 2.03% | 04/29/2015 | 43,402 | (5,111) | |||||||||||||
Hoa Phat Group JSC | JPMorgan | 2.03% | 10/05/2016 | 12,300 | (1,723) | |||||||||||||
Hoa Sen Group | JPMorgan | 2.03% | 04/06/2015 | 59,560 | (4,519) | |||||||||||||
Pakistan Oilfields Ltd. | JPMorgan | 2.03% | 04/06/2015 | 37,600 | (17,525) | |||||||||||||
Pakistan Petroleum | JPMorgan | 2.03% | 10/05/2015 | 15,400 | (191) | |||||||||||||
Petroveitnam Fertilizer and Chemicals Co. | JPMorgan | 2.03% | 04/06/2015 | 29,900 | (9,821) | |||||||||||||
Petrovietnam Gas | JPMorgan | 2.03% | 04/06/2015 | 48,270 | (15,800) | |||||||||||||
PetroVietnam Southern Gas JSC | JPMorgan | 2.03% | 10/05/2015 | 18,500 | (3,368) | |||||||||||||
Southern Rubber Ind. | JPMorgan | 2.03% | 10/05/2015 | 15,500 | (35) | |||||||||||||
United Bank Ltd. | JPMorgan | 2.03% | 04/06/2015 | 111,100 | (27) | |||||||||||||
Europe | ||||||||||||||||||
OMV Pertom SA | Morgan Stanley | 3.90% | 03/03/2016 | 1,339,700 | (12,310) | |||||||||||||
Transgaz SA | Morgan Stanley | 3.90% | 03/03/2016 | 500 | (143) | |||||||||||||
|
| |||||||||||||||||
| $ | 12,791,299 | (209,475) | ||||||||||||||||
|
| |||||||||||||||||
(a) The Fund receives payments based on any positive return of the Reference Obligation at termination. The Fund makes payments on any negative return of such Reference Obligation at termination. Additionally, the rate paid by the fund is settled monthly.
| See Notes to Financial Statements | ||
16 | www.riversidefunds.com |
Table of Contents
| Riverside Frontier Markets Fund | Statement of Assets and Liabilities | |
September 30, 2014 |
ASSETS: | ||||
Investments, at value (Cost $22,112,242) | $ | 22,087,139 | ||
Foreign currency, at value (Cost $56,632) | 55,084 | |||
Deposit with broker for swap contracts | 3,310,000 | |||
Unrealized appreciation on total return swap contracts | 207,300 | |||
Receivable for swap contract payments | 44,435 | |||
Dividends and interest receivable | 13,356 | |||
Prepaid Offering Costs | 46,390 | |||
Prepaid assets | 1,810 | |||
|
| |||
Total Assets | 25,765,514 | |||
|
| |||
LIABILITIES: | ||||
Unrealized depreciation on total return swap contracts | 209,475 | |||
Payable to custodian | 16,384 | |||
Payable for swap contract payments | 6,359 | |||
Payable to advisor | 7,011 | |||
Payable for distribution and service fees | 63 | |||
Payable to trustees | 242 | |||
Payable for administration fees | 9,041 | |||
Payable for transfer agency fees | 5,100 | |||
Professional fees payable | 25,531 | |||
Payable to chief compliance officer | 1,667 | |||
Payable for printing | 1,624 | |||
Payable for custody | 10,462 | |||
Accrued expenses and other liabilities | 7,092 | |||
|
| |||
Total Liabilities | 300,051 | |||
|
| |||
NET ASSETS | $ | 25,465,463 | ||
|
| |||
NET ASSETS CONSIST OF: | ||||
Paid-in capital (Note 7) | $ | 25,493,063 | ||
Accumulated net investment income | 28,243 | |||
Accumulated net realized loss on investments, swap contracts and foreign currency transactions | (26,976) | |||
Net unrealized depreciation on investments, swap contracts and translation of assets and liabilities denominated in foreign currencies | (28,867) | |||
|
| |||
NET ASSETS | $ | 25,465,463 | ||
|
| |||
| See Notes to Financial Statements | ||
Annual Report | September 30, 2014 | 17 | |
Table of Contents
| Riverside Frontier Markets Fund | Statement of Assets and Liabilities | |
September 30, 2014 |
PRICING OF SHARES | ||||
Investor Class: | ||||
Net Asset Value, offering and redemption price per share | $ | 10.62 | ||
Net Assets | $ | 291,689 | ||
Shares of beneficial interest outstanding | 27,456 | |||
Institutional Class: | ||||
Net Asset Value, offering and redemption price per share | $ | 10.64 | ||
Net Assets | $ | 25,173,774 | ||
Shares of beneficial interest outstanding | 2,365,685 |
| See Notes to Financial Statements | ||
18 | www.riversidefunds.com |
Table of Contents
| Riverside Frontier Markets Fund | Statement of Operations | |
For the Year Ended September 30, 2014(a) |
INVESTMENT INCOME: | ||||
Dividends | $ | 45,555 | ||
Foreign taxes withheld | (13,223) | |||
|
| |||
Total Investment Income | 32,332 | |||
|
| |||
EXPENSES: | ||||
Investment advisory fee (Note 8) | 75,016 | |||
Administration fee | 71,078 | |||
Distribution and service fees | ||||
Investor Class | 354 | |||
Custodian fee | 14,378 | |||
Legal fees | 9,552 | |||
Audit fees | 18,100 | |||
Transfer agent fee | 24,170 | |||
Trustees fees and expenses | 1,231 | |||
Registration and filing fees | 4,550 | |||
Printing fees | 2,147 | |||
Chief compliance officer fee | 11,667 | |||
Offering cost expense | 55,445 | |||
Other expenses | 3,989 | |||
|
| |||
Total Expenses | 291,677 | |||
|
| |||
Less fees waived/reimbursed by investment adviser | ||||
Investor Class | (12,466) | |||
Institutional Class | (173,327) | |||
|
| |||
Total fees waived/reimbursed by investment adviser (Note 8) | (185,793) | |||
|
| |||
Less fees waived by Administrator (Note 8) | (4,647) | |||
|
| |||
Net Expenses | 101,237 | |||
|
| |||
NET INVESTMENT LOSS | (68,905) | |||
|
| |||
REALIZED AND UNREALIZED GAIN/(LOSS) ON INVESTMENTS: | ||||
Net realized gain/(loss) on: | ||||
Investments | 5,726 | |||
Swap contracts | 50,709 | |||
Foreign currency transactions | (13,016) | |||
|
| |||
Net realized gain | 43,419 | |||
|
| |||
Change in unrealized appreciation/(depreciation): | ||||
Investments | (25,103) | |||
Swap contracts | (2,175) | |||
Translation of assets and liabilities denominated in foreign currencies | (1,589) | |||
|
| |||
Net change | (28,867) | |||
|
| |||
NET REALIZED AND UNREALIZED GAIN ON INVESTMENTS | 14,552 | |||
|
| |||
NET DECREASE IN NET ASSETS RESULTING FROM OPERATIONS | $ | (54,353) | ||
|
| |||
| (a) | Commenced operations on March 1, 2014. |
| See Notes to Financial Statements | ||
Annual Report | September 30, 2014 | 19 | |
Table of Contents
| Riverside Frontier Markets Fund | Statement of Changes in Net Assets | |
| For the Period | ||||
| Ended | ||||
| September 30, 2014(a) | ||||
OPERATIONS: | ||||
Net investment loss | $ | (68,905) | ||
Net realized gain on investments, swap contracts, and foreign currency transactions | 43,419 | |||
Net change in unrealized depreciation on investments, swap contracts, and translation of assets and liabilities denominated in foreign currencies | (28,867) | |||
|
| |||
Net decrease in net assets resulting from operations | (54,353) | |||
|
| |||
BENEFICIAL SHARE TRANSACTIONS: | ||||
Investor Class | ||||
Shares sold | 364,573 | |||
Shares redeemed | (85,266) | |||
|
| |||
Net increase from beneficial share transactions | 279,307 | |||
|
| |||
Institutional Class | ||||
Shares sold | 25,240,534 | |||
Shares redeemed | (25) | |||
|
| |||
Net increase from beneficial share transactions | 25,240,509 | |||
|
| |||
Net increase in net assets | 25,465,463 | |||
|
| |||
NET ASSETS: | ||||
Beginning of period | 0 | |||
|
| |||
End of period (including accumulated net investment income of $28,243) | $ | 25,465,463 | ||
|
| |||
| (a) | Commenced operations on March 1, 2014. |
| See Notes to Financial Statements | ||
20 | www.riversidefunds.com |
Table of Contents
| Riverside Frontier Markets Fund | Financial Highlights | |
| Investor Class |
For a share outstanding throughout the period presented |
| For the Period | ||||
| Ended | ||||
| September 30, 2014(a) | ||||
NET ASSET VALUE, BEGINNING OF PERIOD | $ | 10.00 | ||
INCOME/(LOSS) FROM OPERATIONS: | ||||
Net investment loss(b) | (0.09) | |||
Net realized and unrealized gain on investments | 0.71 | |||
|
| |||
Total from Investment Operations | 0.62 | |||
|
| |||
NET INCREASE IN NET ASSET VALUE | 0.62 | |||
|
| |||
NET ASSET VALUE, END OF PERIOD | $ | 10.62 | ||
|
| |||
TOTAL RETURN(c) | 6.20% | |||
SUPPLEMENTAL DATA: | ||||
Net assets, End of Period (in 000s) | $ | 292 | ||
RATIOS TO AVERAGE NET ASSETS | ||||
Operating expenses excluding reimbursement/waiver | 11.10%(d) | |||
Operating expenses including reimbursement/waiver | 2.20%(d) | |||
Net investment loss including reimbursement/waiver | (1.47)%(d) | |||
PORTFOLIO TURNOVER RATE | 16%(e) | |||
| (a) | Commenced operations on March 1, 2014. |
| (b) | Per share amounts are based upon average shares outstanding. |
| (c) | Total return is for the period indicated and has not been annualized. The total return would have been lower had certain expenses not been reimbursed / waived during the period. The return shown does not reflect the deduction of taxes that a shareholder would pay on fund distributions or the redemption of fund shares. |
| (d) | Annualized. |
| (e) | Not annualized. |
| See Notes to Financial Statements | ||
Annual Report | September 30, 2014 | 21 | |
Table of Contents
| Riverside Frontier Markets Fund | Financial Highlights | |
| Institutional Class |
For a share outstanding throughout the period presented |
| For the Period | ||||
| Ended | ||||
| September 30, 2014(a) | ||||
NET ASSET VALUE, BEGINNING OF PERIOD | $ | 10.00 | ||
INCOME/(LOSS) FROM OPERATIONS: | ||||
Net investment loss(b) | (0.08) | |||
Net realized and unrealized gain on investments | 0.72 | |||
|
| |||
Total from Investment Operations | 0.64 | |||
|
| |||
NET INCREASE IN NET ASSET VALUE | 0.64 | |||
|
| |||
NET ASSET VALUE, END OF PERIOD | $ | 10.64 | ||
|
| |||
TOTAL RETURN(c) | 6.40% | |||
SUPPLEMENTAL DATA: | ||||
Net assets, End of Period (in 000s) | $ | 25,174 | ||
RATIOS TO AVERAGE NET ASSETS | ||||
Operating expenses excluding reimbursement/waiver | 5.48%(d) | |||
Operating expenses including reimbursement/waiver | 1.95%(d) | |||
Net investment loss including reimbursement/waiver | (1.33)%(d) | |||
PORTFOLIO TURNOVER RATE | 16%(e) | |||
| (a) | Commenced operations on March 1, 2014. |
| (b) | Per share amounts are based upon average shares outstanding. |
| (c) | Total return is for the period indicated and has not been annualized. The total return would have been lower had certain expenses not been reimbursed / waived during the period. The return shown does not reflect the deduction of taxes that a shareholder would pay on fund distributions or the redemption of fund shares. |
| (d) | Annualized. |
| (e) | Not annualized. |
| See Notes to Financial Statements | ||
22 | www.riversidefunds.com |
Table of Contents
| Riverside Frontier Markets Fund | Notes to Financial Statements | |
September 30, 2014 |
1. ORGANIZATION
ALPS Series Trust (the “Trust”), a Delaware statutory trust, is an open-end management investment company registered under the Investment Company Act of 1940 (the “1940 Act”). As of September 30, 2014, the Trust had nine registered funds. This annual report describes the Riverside Frontier Markets Fund (the “Fund”). The Fund’s primary investment objective is to provide capital appreciation as a primary objective and income as a secondary objective by investing at least 80% of its total assets in undervalued equity securities of companies located in “Frontier Markets” countries. The Fund currently offers Investor class shares and Institutional class shares. All classes of shares have identical rights to earnings, assets and voting privileges, except for class-specific expenses and exclusive rights to vote on matters affecting only individual classes. The Trust has an unlimited number of shares with no par value per share. The Board of Trustees (the “Board”) may establish additional funds and classes of shares at any time in the future without shareholder approval.
2. SIGNIFICANT ACCOUNTING POLICIES
The accompanying financial statements were prepared in accordance with accounting principles generally accepted in the United States of America for investment companies (“U.S. GAAP”). The Fund is considered an investment company for financial reporting purposes. The preparation of financial statements in conformity with U.S. GAAP requires management to make certain estimates and assumptions that affect the reported amounts of assets and liabilities and disclosures of contingent assets and liabilities at the date of the financial statements and the reported amounts of revenue and expenses during the period. Actual results could differ from those estimates. The following is a summary of significant accounting policies consistently followed by the Fund in preparation of its financial statements.
Investment Valuation: The Fund generally values its securities based on market prices determined at the close of regular trading on the New York Stock Exchange (“NYSE”), normally 4:00 p.m. Eastern Time, on each day the NYSE is open for trading. Equity securities that are primarily traded on foreign securities exchanges are valued at the closing values of such securities on their respective foreign exchanges.
Over-the-counter swap contracts for which market quotations are readily available are valued based on quotes received from independent pricing services or dealers that make markets in such securities.
Redeemable securities issued by open-end registered investment companies are valued at the investment company’s applicable net asset value.
When such prices or quotations are not available, or when the fair value committee appointed by the Board believes that they are unreliable, securities may be priced using fair value procedures approved by the Board.
Fair Value Measurements: The Fund discloses the classification of their fair value measurements following a three-tier hierarchy based on the inputs used to measure fair value. Inputs refer broadly to the assumptions that market participants would use in pricing the asset or liability, including assumptions about risk. Inputs may be observable or unobservable. Observable inputs reflect the assumptions market participants would use in pricing the asset or liability that are
Annual Report | September 30, 2014 | 23 |
Table of Contents
| Riverside Frontier Markets Fund | Notes to Financial Statements | |
September 30, 2014 |
developed based on market data obtained from sources independent of the reporting entity. Unobservable inputs reflect the reporting entity’s own assumptions about the assumptions market participants would use in pricing the asset or liability that are developed based on the best information available.
Various inputs are used in determining the value of the Fund’s investments as of the end of the reporting period. When inputs used fall into different levels of the fair value hierarchy, the level in the hierarchy within which the fair value measurement falls is determined based on the lowest level input that is significant to the fair value measurement in its entirety. The designated input levels are not necessarily an indication of the risk or liquidity associated with these investments. These inputs are categorized in the following hierarchy under applicable financial accounting standards:
Level 1 – | Unadjusted quoted prices in active markets for identical investments, unrestricted assets or liabilities that the Funds have the ability to access at the measurement date; | |
Level 2 – | Quoted prices which are not active, quoted prices for similar assets or liabilities in active markets or inputs other than quoted prices that are observable (either directly or indirectly) for substantially the full term of the asset or liability; and | |
Level 3 – | Significant unobservable prices or inputs (including the Fund’s own assumptions in determining the fair value of investments) where there is little or no market activity for the asset or liability at the measurement date. | |
The following is a summary of the inputs used to value the Fund’s investments as of September 30, 2014:
| Level 2 - Other | Level 3 - | |||||||||||||||
| Level 1 - | Significant | Significant | ||||||||||||||
| Unadjusted | Observable | Unobservable | ||||||||||||||
| Investments in Securities at Value | Quoted Prices | Inputs | Inputs | Total | ||||||||||||
| ||||||||||||||||
Common Stocks | ||||||||||||||||
Cambodia | $ | 138,913 | $ | – | $ | – | $ | 138,913 | ||||||||
Chile | 41,807 | – | – | 41,807 | ||||||||||||
Gabon | 167,599 | – | – | 167,599 | ||||||||||||
Israel | 258,649 | – | – | 258,649 | ||||||||||||
Kazakhstan | 193,375 | – | – | 193,375 | ||||||||||||
Malaysia | 771,139 | – | – | 771,139 | ||||||||||||
Morocco | 31,661 | – | – | 31,661 | ||||||||||||
Panama | 169,660 | – | – | 169,660 | ||||||||||||
Philippines | 69,720 | – | – | 69,720 | ||||||||||||
Thailand | 964,515 | – | – | 964,515 | ||||||||||||
United Arab Emirates | 516,185 | – | – | 516,185 | ||||||||||||
Short-Term Security | 18,763,916 | – | – | 18,763,916 | ||||||||||||
| ||||||||||||||||
TOTAL | $ | 22,087,139 | $ | – | $ | – | $ | 22,087,139 | ||||||||
| ||||||||||||||||
24 | www.riversidefunds.com |
Table of Contents
| Riverside Frontier Markets Fund | Notes to Financial Statements | |
September 30, 2014 |
| Other Financial Instruments | Level 1 | Level 2 | Level 3 | Total | ||||||||||||
| ||||||||||||||||
Assets | ||||||||||||||||
Total Return Swap Contracts | $ | – | $ | 207,300 | $ | – | $ | 207,300 | ||||||||
Liabilities | ||||||||||||||||
Total Return Swap Contracts | – | (209,475) | – | (209,475) | ||||||||||||
| ||||||||||||||||
TOTAL | $ | – | $ | (2,175) | $ | – | $ | (2,175) | ||||||||
| ||||||||||||||||
The Fund recognizes transfers between levels as of the end of the fiscal year. For the period ended September 30, 2014, the Fund did not have any transfers between Level 1 and Level 2 securities. There were no Level 3 securities held during the period.
Offering Costs: The Fund incurred offering costs during the period ended September 30, 2014. These offering costs, including fees for printing initial prospectuses, legal, and registration fees, are being amortized over the first twelve months from the inception date of the Fund. Amounts amortized through September 30, 2014 are shown on the Fund’s Statement of Operations and amounts that remain to be amortized are shown on the Fund’s Statement of Assets and Liabilities.
Trust Expenses: Some expenses of the Trust can be directly attributed to the Fund. Expenses which cannot be directly attributed to the Fund are apportioned among all funds in the Trust based on average net assets of each fund.
Fund Expenses: Some expenses can be directly attributed to the Fund and are apportioned among the classes based on average net assets of each class.
Class Expenses: Expenses that are specific to a class of shares are charged directly to that share class. Fees provided under the distribution (Rule 12b-1) and/or shareholder service plans for a particular class of the Fund are charged to the operations of such class.
Federal Income Taxes: The Fund complies with the requirements under Subchapter M of the Internal Revenue Code of 1986 applicable to regulated investment companies and intends to distribute substantially all of its net taxable income and net capital gains, if any, each year so that it will not be subject to excise tax on undistributed income and gains. The Fund is not subject to income taxes to the extent such distributions are made.
As of and during the period ended September 30, 2014, the Fund did not have a liability for any unrecognized tax benefits in the accompanying financial statements. The Fund files U.S. federal, state and local income tax returns as required. The Fund’s tax returns are subject to examination by the relevant tax authorities until expiration of the applicable statute of limitations, which is generally three years after the filing of the tax return for federal purposes and four years for most state returns. The Fund’s administrator has analyzed the Fund’s tax positions taken on federal and state income tax returns for all open tax years and has concluded that as of September 30, 2014, no provision for income tax is required in the Fund’s financial statements related to these tax positions.
Investment Transactions and Investment Income: Investment transactions are accounted for on the date the investments are purchased or sold (trade date basis). Realized gains and losses from
Annual Report | September 30, 2014 | 25 |
Table of Contents
| Riverside Frontier Markets Fund | Notes to Financial Statements | |
September 30, 2014 |
investment transactions are reported on an identified cost basis. Interest income, which includes accretion of discounts and amortization of premiums, is accrued and recorded as earned. Dividend income is recognized on the ex-dividend date, or for certain foreign securities, as soon as information is available to the Fund. All of the realized and unrealized gains and losses and net investment income are allocated daily to each class in proportion to its average daily net assets.
Foreign Securities: The Fund may directly purchase securities of foreign issuers. Investing in securities of foreign issuers involves special risks not typically associated with investing in securities of U.S. issuers. The risks include possible reevaluation of currencies, the inability to repatriate foreign currency, less complete financial information about companies and possible future adverse political and economic developments. Moreover, securities of many foreign issuers and their markets may be less liquid and their prices more volatile than those of securities of comparable U.S. issuers.
Foreign Currency Translation: The books and records of the Fund are maintained in U.S. dollars. Investment valuations and other assets and liabilities initially expressed in foreign currencies are converted each business day into U.S. dollars based upon current exchange rates. The portion of realized and unrealized gains or losses on investments due to fluctuations in foreign currency exchange rates is not separately disclosed and is included in realized and unrealized gains or losses on investments, when applicable.
Foreign Exchange Transactions: The Fund may enter into foreign currency spot contracts to facilitate transactions in foreign securities or to convert foreign currency receipts into U.S. dollars. A foreign currency spot contract is an agreement between two parties to buy and sell currencies at the current market rate, for settlement generally within two business days. The U.S. dollar value of the contracts is determined using current currency exchange rates supplied by a pricing service. The contract is marked-to-market daily for settlements beyond one day and any change in market value is recorded as an unrealized gain or loss. When the contract is closed, the Fund records a realized gain or loss equal to the difference between the value on the open and close date. Losses may arise from changes in the value of the foreign currency, or if the counterparties do not perform under the contract’s terms. The maximum potential loss from such contracts is the aggregate face value in U.S. dollars at the time the contract was opened.
Distributions to Shareholders: The Fund normally pays dividends, if any, and distributes capital gains, if any, on an annual basis. Income dividend distributions are derived from interest and other income the Fund receives from its investments, including short term capital gains. Long term capital gain distributions are derived from gains realized when the Fund sells a security it has owned for more than one year. The Fund may make additional distributions and dividends at other times if its portfolio manager or managers believe doing so may be necessary for the Fund to avoid or reduce taxes. Net investment income/(loss) and net realized gain/(loss) may differ for financial statement and tax purposes.
3. DERIVATIVE INSTRUMENTS
The Fund’s investment objectives permit the Fund to enter into various types of derivatives contracts, including, but not limited to, forward exchange contracts and total return swaps. In doing so, the Fund will employ strategies in differing combinations to permit it to increase, decrease or change the level or
26 | www.riversidefunds.com |
Table of Contents
| Riverside Frontier Markets Fund | Notes to Financial Statements | |
September 30, 2014 |
types of exposure to market factors. Central to those strategies are features inherent in derivatives that make them more attractive for this purpose than equity or debt securities; they require little or no initial cash investment, they can focus exposure on only certain selected risk factors, and they may not require the ultimate receipt or delivery of the underlying security (or securities) to the contract. This may allow the Fund to pursue its objectives more quickly and efficiently than if it were to make direct purchases or sales of securities capable of affecting a similar response to market factors.
Risk of Investing in Derivatives: The Fund’s use of derivatives can result in losses due to unanticipated changes in the market risk factors and the overall market. In instances where the Fund is using derivatives to decrease, or hedge, exposures to market risk factors for securities held by the Fund, there are also risks that those derivatives may not perform as expected resulting in losses for the combined or hedged positions.
Derivatives may have little or no initial cash investment relative to their market value exposure and therefore can produce significant gains or losses in excess of their cost. This use of embedded leverage allows the Fund to increase its market value exposure relative to its net assets and can substantially increase the volatility of the Fund’s performance.
Additional associated risks from investing in derivatives also exist and potentially could have significant effects on the valuation of the derivative and the Fund. Typically, the associated risks are not the risks that the Fund is attempting to increase or decrease exposure to, per its investment objective, but are the additional risks from investing in derivatives.
Examples of these associated risks are liquidity risk, which is the risk that the Fund will not be able to sell or close out the derivative in a timely manner, and counterparty credit risk, which is the risk that the counterparty will not fulfill its obligation to the Fund. In addition, use of derivatives may increase or decrease exposure to the following risk factors:
Equity Risk: Equity risk relates to the change in value of equity securities as they relate to increases or decreases in the general market. Associated risks can be different for each type of derivative and are discussed by each derivative type in the notes that follow.
Foreign Currency Risk: Currency trading involves significant risks, including market risk, interest rate risk, country risk, counterparty credit risk and short sale risk. Market risk results from the price movement of foreign currency values in response to shifting market supply and demand.
Interest Rate Risk: Interest rate risk is the risk that fixed income securities will decline in value because of changes in interest rates. As nominal interest rates rise, the value of fixed income securities held by the Fund are likely to decrease. Securities with longer durations tend to be more sensitive to changes in interest rates, and are usually more volatile than equity securities.
Swap Contracts: The Fund may enter into swap transactions to seek to increase total return. Risks may arise as a result of the failure of the counterparty to the swap contract to comply with the terms of the swap contract. The loss incurred by the failure of a counterparty is generally limited to the net payment to be received by the Fund and/or the termination value at the end of the contract.
Annual Report | September 30, 2014 | 27 |
Table of Contents
| Riverside Frontier Markets Fund | Notes to Financial Statements | |
September 30, 2014 |
Therefore, the Fund considers the creditworthiness of each counterparty to a contract in evaluating potential credit risk. Additionally, risks may arise from unanticipated movements in interest rates or in the value of the underlying reference asset or index. Entering into these agreements involves, to varying degrees, market risk, liquidity risk and elements of credit, legal and documentation risk that are not directly reflected in the amounts recognized in the Statements of Assets and Liabilities.
The Fund may pay or receive cash as collateral on these contracts which may be recorded as an asset and/or liability. The Fund must set aside liquid assets, or engage in other appropriate measures, to cover its obligations under these contracts. Swaps are marked to market daily using either pricing vendor quotations, counterparty prices or model prices and the change in value, if any, is recorded as an unrealized gain or loss. Upfront payments made and/or received by the Fund are recorded as an asset and/or liability and realized gains or losses are recognized ratably over the contract’s term/event, with the exception of forward starting interest rate swaps, whose realized gains or losses are recognized ratably from the effective start date. Periodic payments received or made on swap contracts are recorded as realized gains or losses. Gains or losses are realized upon termination of a swap contract and are recorded on the Statements of Operations.
The Fund invests in total return swaps to obtain exposure to a security or market without owning such security or investing directly in that market. Total return swaps are agreements in which there is an exchange of cash flows whereby one party commits to make payments based on the total return (coupons plus capital gains/losses) of an underlying instrument in exchange for fixed or floating rate interest payments. To the extent the total return of the instrument or index underlying the transaction exceeds or falls short of the offsetting interest rate obligation, the Fund will receive a payment from or make a payment to the counterparty. Swap agreements held at September 30, 2014 are disclosed in the Portfolio of Investments.
The average notional shares of the Fund’s swap positions for the year ending September 30, 2014 was 6,156,446.
Derivative Instruments: The following tables disclose the amounts related to the Fund’s use of derivative instruments.
The effect of derivative instruments on the Statement of Assets and Liabilities as of September 30, 2014:
| Risk Exposure | Statement of Assets and Liabilities Location | Asset Derivatives Gross Unrealized Appreciation | Liability Derivatives Gross Unrealized Depreciation | |||
Equity Contracts (Total Return Swap Contracts) | Unrealized appreciation/ (depreciation) on total return swap contracts | $ 207,300 | $ (209,475) | |||
Total | $ 207,300 | $ (209,475) | ||||
| ||||||
28 | www.riversidefunds.com |
Table of Contents
| Riverside Frontier Markets Fund | Notes to Financial Statements | |
September 30, 2014 |
The effect of derivative instruments on the Statement of Operations for the period ended September 30, 2014:
| Risk Exposure | Statement of Operations Location | Realized Derivatives Recognized | Net change in Unrealized Depreciation on Derivatives Recognized | |||
| ||||||
Equity Contracts (Total Return Swap Contracts) | Net realized gain/(loss) on swap contracts/change in unrealized appreciation/(depreciation) on swap contracts | $ 50,709 | $ (2,175) | |||
| ||||||
Total | $ 50,709 | $ (2,175) | ||||
| ||||||
4. OFFSETTING AGREEMENTS
Certain derivative contracts are executed under standardized netting agreements. A derivative netting arrangement creates an enforceable right of set-off that becomes effective, and affects the realization of settlement on individual assets, liabilities and collateral amounts, only following a specified event of default or early termination. Default events may include the failure to make payments or deliver securities timely, material adverse changes in financial condition or insolvency, the breach of minimum regulatory capital requirements, or loss of license, charter or other legal authorization necessary to perform under the contract. The Fund may manage counterparty risk by entering into enforceable collateral arrangements with counterparties to securities lending agreements. These agreements mitigate counterparty credit risk by providing for a single net settlement with a counterparty of all financial transactions covered by the agreement in an event of default as defined under such agreement.
The following table presents derivative financial instruments and securities lending arrangements that are subject to enforceable netting arrangements, collateral arrangements or other similar agreements as of September 30, 2014.
Gross Amounts Not Offset in the | ||||||||||||
| Description | Gross Amounts of Recognized Assets | Gross Assets and Liabilities | Net Amounts of Assets and Liabilities | Financial Instruments (a) | Cash Collateral Received(a) | Net Amount Receivable | ||||||
| ||||||||||||
Assets | ||||||||||||
Total Return | ||||||||||||
Swaps | $ 207,300 | $– | $ 207,300 | $– | $– | $ 207,300 | ||||||
| ||||||||||||
Total | $ 207,300 | $– | $ 207,300 | $– | $– | $ 207,300 | ||||||
| ||||||||||||
Annual Report | September 30, 2014 | 29 |
Table of Contents
| Riverside Frontier Markets Fund | Notes to Financial Statements | |
September 30, 2014 |
| Gross Amounts Not Offset in the Statement of Assets and Liabilities | ||||||||||||||||||||||||
| Description | Gross Amounts of Recognized Liabilities | Gross Liabilities | Net Amounts the Statement of Assets and Liabilities | Financial Instruments (a) | Cash Pledged(a) | Net Amount Payable | ||||||||||||||||||
| ||||||||||||||||||||||||
Liabilities | ||||||||||||||||||||||||
Total Return | ||||||||||||||||||||||||
Swaps | $ | (209,475) | $(2,175) | $ | 209,475 | $ | (207,300) | $ | (2,175) | $ | – | |||||||||||||
| ||||||||||||||||||||||||
Total | $ | (209,475) | $(2,175) | $ | 209,475 | $ | (207,300) | $ | (2,175) | $ | – | |||||||||||||
| ||||||||||||||||||||||||
| (a) | These amounts are limited to the derivative asset/liability balance and, accordingly, do not include excess collateral received/pledged. |
5. TAX BASIS INFORMATION
Tax Basis of Distributions to Shareholders: The character of distributions made during the period from net investment income or net realized gains may differ from its ultimate characterization for federal income tax purposes. Also, due to the timing of dividend distributions, the fiscal year in which amounts are distributed may differ from the fiscal year in which the income or realized gain were recorded by the Fund. The amounts and characteristics of tax basis distributions and composition of distributable earnings/(accumulated losses) are finalized at fiscal year-end. There were no distributions paid by the Fund for the period ended September 30, 2014.
Reclassifications: As of September 30, 2014, permanent differences in book and tax accounting were reclassified. The following reclassifications, which had no impact on results of operations or net assets, were recorded to reflect tax character:
| Paid-in Capital | Accumulated Net Investment Loss | Accumulated Net Realized Gain on Investments | ||||||||
| $ (26,753) | $ | 97,148 | $ | (70,395) | ||||||
These differences are primarily attributed to the different tax treatment of foreign currency and organizational costs.
30 | www.riversidefunds.com |
Table of Contents
| Riverside Frontier Markets Fund | Notes to Financial Statements | |
September 30, 2014 |
Unrealized Appreciation and Depreciation on Investments: As of September 30, 2014, the aggregate cost of investments, gross unrealized appreciation/(depreciation) and net unrealized appreciation for Federal tax purposes were as follows:
Gross unrealized appreciation (excess of value over tax cost) | $ | 147,920 | ||
Gross unrealized depreciation (excess of tax cost over value) | (184,904) | |||
Net depreciation of foreign currency and derivatives | (3,764) | |||
| ||||
Net unrealized depreciation | $ | (40,748) | ||
| ||||
Cost of investments for income tax purposes | $ | 22,124,123 | ||
| ||||
Components of Distributable Earnings: At September 30, 2013, components of distributable earnings were as follows:
Undistributed ordinary income | $ | 40,124 | ||
Accumulated Capital Losses | (26,976) | |||
Net unrealized depreciation on investments | (40,748) | |||
| ||||
Total | $ | (27,600) | ||
| ||||
Capital Losses: As of September 30, 2014, the Fund had no accumulated capital loss carryforwards.
The fund elect to defer to the period ending September 30, 2015, capital losses recognized during the period November 1, 2013 to September 30, 2014 in the amount of:
| Amount | ||||
| ||||
Riverside Frontier Markets Fund | $ | (26,976) | ||
6. SECURITIES TRANSACTIONS
Purchases and sales of securities, excluding short-term securities, during the fiscal year ended September 30, 2014 were as follows:
| Proceeds from Sales of | ||||||||
| Purchases of Securities | Securities | |||||||
| ||||||||
| $ | 3,545,531 | $ | 202,931 | |||||
7. BENEFICIAL SHARE TRANSACTIONS
The capitalization of the Trust consists of an unlimited number of shares of beneficial interest with no par value per share. Holders of the shares of the Fund have one vote for each share held and a proportionate fraction of a vote for each fractional share. All shares issued and outstanding are fully paid and are non-assessable, transferable and redeemable at the option of the shareholder. Shares have no pre-emptive rights.
Annual Report | September 30, 2014 | 31 |
Table of Contents
| Riverside Frontier Markets Fund | Notes to Financial Statements | |
September 30, 2014 |
Shares redeemed within 90 days of purchase may incur a 2.00% short-term redemption fee deducted from the redemption amount. For the fiscal year ended September 30, 2014, the redemption fees charged by the Fund are presented in the Statements of Changes in Net Assets.
Transactions in common shares were as follows:
For the Period Ended September 30, 2014(a) | ||||
Investor | ||||
Shares Sold | 35,410 | |||
Less Shares Redeemed | (7,954) | |||
| ||||
Net Increase from share transactions | 27,456 | |||
| ||||
Institutional | ||||
Shares Sold | 2,365,687 | |||
Less Shares Redeemed | (2) | |||
| ||||
Net Increase from share transactions | 2,365,685 | |||
| ||||
| (a) | Commenced operations on March 1, 2014. |
Control is defined by the 1940 Act as the beneficial ownership, either directly or through one or more controlled companies, of more than 25% of the voting securities of a company. The Fund has one unaffiliated shareholder representing approximately 82% of total Fund shares. Investment activities of these shareholders could have a material impact on the Fund.
8. MANAGEMENT AND RELATED-PARTY TRANSACTIONS
Investment Advisory: Riverside Advisors, LLC (“Riverside Advisors” or the “Adviser”), subject to the authority of the Board, is responsible for the overall management and administration of the Fund’s business affairs. The Adviser manages the investments of the Fund in accordance with the Fund’s investment objectives, policies and limitations and investment guidelines established jointly by the Adviser and the Board.
Pursuant to the Investment Advisory Agreement (the “Advisory Agreement”) with the Adviser, the Fund pays the Adviser an annual management fee of 1.45% based on the Fund’s average daily net assets. The management fee is paid on a monthly basis. The initial term of the Advisory Agreement is two years. The Board may extend the Advisory Agreement for additional one-year terms. The Board, shareholders of the Fund or the Adviser may terminate the Advisory Agreement upon 60 days’ notice.
Pursuant to a fee waiver letter agreement (the “Fee Waiver Agreement”), the Adviser has contractually agreed to limit the amount of the Fund’s Total Annual Fund Operating Expenses, exclusive of Distribution and Service (12b-1) fees, Acquired Fund Fees and Expenses, brokerage expenses, interest expenses, taxes and extraordinary expenses, to 1.95% of the Fund’s average daily net assets for the Investor Class and the Institutional Class. The Fee Waiver Agreement is in
32 | www.riversidefunds.com |
Table of Contents
| Riverside Frontier Markets Fund | Notes to Financial Statements | |
September 30, 2014 |
effect through January 31, 2016. The Adviser will be permitted to recover, on a class-by-class basis, expenses it has borne through the Fee Waiver Agreement to the extent that the Fund’s expenses in later periods fall below the annual rates set forth in the Fee Waiver Agreement. The Fund will not be obligated to pay any such deferred fees and expenses more than three years after the end of the fiscal year in which the fees and expenses were deferred. The Adviser may not discontinue the Fee Waiver Agreement without the approval by the Fund’s Board.
For the fiscal period ended September 30, 2014, the fee waivers and/or reimbursements were as follows:
| Fees Waived/Reimbursed by Adviser | ||||
| ||||
Investor Class | $ | (12,593) | ||
Institutional Class | (177,847) | |||
| ||||
TOTAL | $ | (190,440) | ||
| ||||
As of September 30, 2014, the balances of recoupable expenses were as follows:
| Expires 2017 | ||||
| ||||
Investor Class | $ | 12,466 | ||
| ||||
Institutional Class | 173,327 | |||
| ||||
Administrator: ALPS Fund Services, Inc. (“ALPS”) (an affiliate of ALPS Distributors, Inc.) serves as administrator to the Fund. The Fund has agreed to pay expenses incurred in connection with its administrative activities. Pursuant to the Administration, Bookkeeping and Pricing Services Agreement, the Trust with ALPS will provide operational services to the Fund including, but not limited to, fund accounting and fund administration and generally assist in the Fund’s operations.
The Fund’s administration fee is accrued on a daily basis and paid on a monthly basis following the end of the month, based on the greater of (a) an annual total fee of $110,000 in year 1 of operations and $125,000 in year 2; or (b) the following basis point fee schedule:
| Average Total Net Assets | Contractual Fee | |
| ||
Between $0-$250M | 0.08% | |
| ||
$250M-$500M | 0.07% | |
| ||
Above $500M | 0.03% | |
| ||
Annually thereafter, the parties agree to reevaluate the compensation paid under the agreement by the Trust on behalf of the fund to ALPS for the services it performs for the Fund.
ALPS is reimbursed by the Fund for certain out-of-pocket expenses. ALPS has agreed to reimburse the Fund for expenses relating to insurance and certain routine legal services for the fiscal period ended September 30, 2014.
Transfer Agent: ALPS serves as transfer agent for the Fund under a Transfer Agency and Services Agreement with the Trust. Under this agreement, ALPS is paid an annual base fee of $25,000 for services performed on behalf of the Fund plus fees for open accounts and is reimbursed for certain out-of-pocket expenses.
Annual Report | September 30, 2014 | 33 |
Table of Contents
| Riverside Frontier Markets Fund | Notes to Financial Statements | |
September 30, 2014 |
Compliance Services: ALPS provides services as the Fund’s Chief Compliance Officer to monitor and test the policies and procedures of the Fund in conjunction with requirements under Rule 38a-1 under the 1940 Act pursuant to a Chief Compliance Officer Services Agreement with the Trust. Under this agreement, ALPS is paid an annual base fee of $20,000 for services performed on behalf of the Fund and is reimbursed for certain out-of-pocket expenses.
Distributor: ALPS Distributors, Inc. (the “Distributor”) (as affiliate of ALPS Fund Services, Inc.) acts as the principal underwriter of the Fund’s shares pursuant to a Distribution Agreement with the Trust. Shares of the Fund are offered on a continuous basis through the Distributor, as agent of the Fund. The Distributor is not obligated to sell any particular amount of shares and is not entitled to any compensation for its services as the Fund’s principal underwriter.
The Fund has adopted a separate plan of distribution for the Investor class shares pursuant to Rule 12b-1 of the 1940 Act (the “Plan”). The Plan allows the Fund to use Investor class assets to pay fees in connection with the distribution and marketing of the Investor class shares and/or the provision of shareholder services to the Investor class shareholders. The Plan permits payment for services in connection with the administration of plans or programs that use the Investor class shares of the Fund as their funding medium and for related expenses. The Plan permits the Fund to make total payments at an annual rate of up to 0.25% of a Fund’s average daily net assets attributable to the Investor class shares. Because these fees are paid out of the Fund’s Investor class assets on an ongoing basis, over time they will increase the cost of an investment in the Investor class shares, and Plan fees may cost an investor more than other types of sales charges. Plan fees are shown as distribution and service fees on the Statement of Operations.
9. TRUSTEES
As of September 30, 2014, there were four Trustees, three of whom are not “interested persons” (within the meaning of the 1940 Act) of the Trust (the “Independent Trustees”). Prior to October 1, 2014, the Independent Trustees received a quarterly retainer of $2,000, plus $1,000 for each regular Board or Committee meeting attended, $1,000 for each special telephonic Board or Committee meeting attended and $1,000 for each special in-person Board meeting attended. Effective October 1, 2014, the Independent Trustees receive a quarterly retainer of $4,000, plus $2,000 for each regular Board or Committee meeting attended, $2,000 for each special telephonic Board or Committee meeting attended and $2,000 for each special in-person Board meeting attended. The Independent Trustees are also reimbursed for all reasonable out-of-pocket expenses relating to attendance at meetings and for meeting-related expenses. Officers of the Trust and Trustees who are interested persons of the Trust receive no salary or fees from the Trust.
10. INDEMNIFICATIONS
Under the Trust’s organizational documents, its officers and Trustees are indemnified against certain liabilities arising out of the performance of their duties to the Trust. Additionally, in the normal course of business, the Trust enters into contracts with service providers that may contain
34 | www.riversidefunds.com |
Table of Contents
| Riverside Frontier Markets Fund | Notes to Financial Statements | |
September 30, 2014 |
general indemnification clauses which may permit indemnification to the extent permissible under applicable law. The Trust’s maximum exposure under these arrangements is unknown, as this would involve future claims that may be made against the Trust that have not yet occurred.
11. CHANGES IN ACCOUNTANTS
On June 30, 2014, KPMG LLP acquired certain assets of ROTHSTEIN-KASS, P.A. (d/b/a Rothstein Kass & Company, P.C.) and certain of its affiliates (“Rothstein Kass”), the independent public accounting firm for the Fund. As a result of this transaction, on June 30, 2014, Rothstein Kass resigned as the independent registered public accounting firm for the Funds. As the Fund commenced operations on February 28, 2014 and the Fund’s fiscal year end is September 30th, there are no financial statements for the Fund for the fiscal year ended September 30, 2013.
The Board of Trustees of the Trust approved the selection of KPMG LLP to serve as the Fund’s independent registered public accounting firm for the Funds’ fiscal year ending September 30, 2014 at an in-person meeting held on August 22, 2014.
Annual Report | September 30, 2014 | 35 |
Table of Contents
| Riverside Frontier Markets Fund | Report of Independent Registered Public Accounting Firm | |
The Board of Trustees and Shareholders ALPS Series Trust:
We have audited the accompanying statement of assets and liabilities of Riverside Frontier Markets Fund, including the portfolio of investments, as of September 30, 2014, and the related statement of operations, the statement of changes in net assets, and the financial highlights for the period from March 1, 2014 (commencement of operations) to September 30, 2014. These financial statements and financial highlights are the responsibility of the Fund’s management. Our responsibility is to express an opinion on these financial statements and financial highlights based on our audit.
We conducted our audit in accordance with the standards of the Public Company Accounting Oversight Board (United States). Those standards require that we plan and perform the audit to obtain reasonable assurance about whether the financial statements and financial highlights are free of material misstatement. An audit includes examining, on a test basis, evidence supporting the amounts and disclosures in the financial statements. Our procedures included confirmation of securities owned as of September 30, 2014, by correspondence with custodians and brokers, or by other appropriate auditing procedures where replies from brokers were not received. An audit also includes assessing the accounting principles used and significant estimates made by management, as well as evaluating the overall financial statement presentation. We believe that our audit provides a reasonable basis for our opinion.
In our opinion, the financial statements and financial highlights referred to above present fairly, in all material respects, the financial position of Riverside Frontier Markets Fund as of September 30, 2014, the results of its operations, the changes in its net assets, and the financial highlights for the period from March 1, 2014 (commencement of operations) to September 30, 2014, in conformity with U.S. generally accepted accounting principles.
KPMG LLP
Denver, Colorado
November 24, 2014
36 | www.riversidefunds.com |
Table of Contents
| Riverside Frontier Markets Fund | Additional Information | |
September 30, 2014 (Unaudited) |
1. PROXY VOTING POLICIES AND VOTING RECORD
A description of the policies and procedures that the Fund uses to determine how to vote proxies relating to portfolio securities is available without charge, upon request, (i) by calling the Fund (toll-free) at 1-855-384-2813 or (ii) on the Securities and Exchange Commission’s the (“SEC”) website at http://www.sec.gov.
Information regarding how the Fund voted proxies relating to portfolio securities during the most recent 12-month period ended June 30 will be available (i) without charge, upon request, by calling the Fund (toll-free) at 1-855-384-2813 or (ii) on the SEC’s website at http://www.sec.gov.
2. PORTFOLIO HOLDINGS
The Fund files its complete schedule of portfolio holdings with the SEC for the first and third quarters of each fiscal year on Form N-Qs. The Fund’s Forms N-Q are available on the SEC’s website at http://www.sec.gov. The Fund’s Forms N-Q may be reviewed and copied at the SEC’s Public Reference Room in Washington, D.C., and information on the operation of the Public Reference Room may be obtained by calling 1-800-SEC-0330.
Annual Report | September 30, 2014 | 37 |
Table of Contents
| Riverside Frontier Markets Fund | Trustees and Officers | |
September 30, 2014 (Unaudited) |
INDEPENDENT TRUSTEES
| Number of | ||||||||||
| Funds in | ||||||||||
| Fund | Other | |||||||||
| Term of | Complex | Directorships | ||||||||
| Name, | Position(s) | Office and | Overseen | Held by | ||||||
| Birth Year | Held with | Length of | Principal Occupation(s) | by | Trustee During | |||||
| & Address* | Fund | Time Served | During Past 5 Years** | Trustee*** | Past 5 Years** | |||||
Cheryl Burgermeister Birth year: 1951 | Trustee | Ms. Burgermeister was elected to the Board on October 30, 2012; indefinite term. | Ms. Burgermeister is Trustee and Audit Committee Chair of The Select Sector SPDR Trust (October 1998 to present), Trustee of Russell Investment Funds (September 2012 to present) and Trustee, Treasurer and Finance Committee Chair of the Portland Community College Foundation (January 2001 to present). She also served as Trustee and Audit Committee Chair of E*Trade Funds (March 2004 to March 2010), Trustee of Zero Gravity Internet Fund (May 2000 to December 2001), Director and Treasurer of Crabbe Huson Family of Funds (1998 to 1999) and Director, Chief Financial Officer and Treasurer of The Crabbe Huson Group, Inc. (July 1987 to October 1999). From 1982 to 1986, Ms. Burgermeister was Supervising Senior Accountant at KPMG Peat Marwick. Ms. Burgermeister a licensed Certified Public Accountant and a member of the Oregon Society of Certified Public Accountants. | 9 | Ms. Burgermeister is a Trustee and Audit Committee Chair of The Select Sector SPDR Trust (9 ETFs) and Trustee of Russell Investment Funds (42 funds). |
| * | All communications to Trustees and Officers may be directed to ALPS Series Trust c/o 1290 Broadway, Suite 1100, Denver, CO 80203. |
| ** | Except as otherwise indicated, each individual has held the office shown or other offices in the same company for the last five years. |
| *** | The Fund Complex currently consists of nine series of the Trust and any other investment companies for which Riverside Advisors, LLC provides investment advisory services, currently none. |
38 | www.riversidefunds.com |
Table of Contents
| Riverside Frontier Markets Fund | Trustees and Officers | |
September 30, 2014 (Unaudited) |
INDEPENDENT TRUSTEES (continued)
| Number | ||||||||||
| of Funds | Other | |||||||||
| in Fund | Directorships | |||||||||
| Term of | Complex | Held by | ||||||||
| Name, | Position(s) | Office and | Overseen | Trustee | ||||||
| Birth Year | Held with | Length of | Principal Occupation(s) | by | During Past 5 | |||||
| & Address* | Fund | Time Served | During Past 5 Years** | Trustee*** | Years** | |||||
J. Wayne Hutchens Birth year: 1944 | Trustee | Mr. Hutchens was elected to the Board on October 30, 2012; indefinite term. | Mr. Hutchens is currently retired. From April 2006 to December 2012, he served as President and CEO of the University of Colorado (CU) Foundation and from April 2009 to December 2012, he was Executive Director of the CU Real Estate Foundation. Mr. Hutchens is also Trustee of the Denver Museum of Nature and Science (2000 to present), Director of AMG National Trust Bank (June 2012 to present) and Trustee of Children’s Hospital Colorado (May 2012 to present). Prior to these positions, Mr. Hutchens spent 29 years in the banking industry, retiring as Chairman of Chase Bank Colorado. | 9 | None. |
| * | All communications to Trustees and Officers may be directed to ALPS Series Trust c/o 1290 Broadway, Suite 1100, Denver, CO 80203. |
| ** | Except as otherwise indicated, each individual has held the office shown or other offices in the same company for the last five years. |
| *** | The Fund Complex currently consists of nine series of the Trust and any other investment companies for which Riverside Advisors, LLC provides investment advisory services, currently none. |
Annual Report | September 30, 2014 | 39 |
Table of Contents
| Riverside Frontier Markets Fund | Trustees and Officers | |
September 30, 2014 (Unaudited) |
INDEPENDENT TRUSTEES (continued)
| Number of | ||||||||||
| Funds in | ||||||||||
| Fund | Other | |||||||||
| Term of | Complex | Directorships | ||||||||
| Name, | Position(s) | Office and | Overseen | Held by | ||||||
| Birth Year | Held with | Length of | Principal Occupation(s) | by | Trustee During | |||||
| & Address* | Fund | Time Served | During Past 5 Years** | Trustee*** | Past 5 Years** | |||||
| Patrick Seese Birth year: 1971 | Trustee | Mr. Seese was elected to the Board on October 30, 2012; indefinite term. | Mr. Seese is an owner and a Managing Director of Integris Partners, a middle-market investment banking firm serving closely-held companies, financial sponsors and public companies (February 2008 to present). Prior to this, Mr. Seese was a Managing Director of Headwaters MB, a middle-market investing banking firm (December 2003 to February 2008). Prior to that, Mr. Seese worked in Credit Suisse First Boston’s Mergers and Acquisitions Group and served as Head of Corporation Development, Katy Industries, a publicly traded industrial and consumer products company and at Deloitte & Touche LLP, where he began his career in 1994. | 9 | None. |
| * | All communications to Trustees and Officers may be directed to ALPS Series Trust c/o 1290 Broadway, Suite 1100, Denver, CO 80203. |
| ** | Except as otherwise indicated, each individual has held the office shown or other offices in the same company for the last five years. |
| *** | The Fund Complex currently consists of nine series of the Trust and any other investment companies for which Riverside Advisors, LLC provides investment advisory services, currently none. |
40 | www.riversidefunds.com |
Table of Contents
| Riverside Frontier Markets Fund | Trustees and Officers | |
September 30, 2014 (Unaudited) |
INTERESTED TRUSTEE AND OFFICERS
| Number of | ||||||||||
| Funds in | ||||||||||
| Fund | Other | |||||||||
| Term of | Complex | Directorships | ||||||||
| Name, | Position(s) | Office and | Overseen | Held by | ||||||
| Birth Year | Held with | Length of | Principal Occupation(s) | by | Trustee During | |||||
| & Address* | Fund | Time Served | During Past 5 Years** | Trustee*** | Past 5 Years** | |||||
Jeremy O. May Birth year: 1970 | Trustee, Chairman and President | Mr. May was elected Trustee, Chairman and President on October 30, 2012; indefinite term. | Mr. May joined ALPS in 1995 and is currently President of ALPS Fund Services, Inc. and ALPS Distributors, Inc. and Executive Vice President of ALPS Holdings, Inc. and ALPS Advisors, Inc. Because of his positions with these entities, Mr. May is deemed an affiliate of the Trust as defined under the 1940 Act. Mr. May currently serves as Treasurer of Clough Global Allocation Fund, Clough Global Equity Fund, Clough Global Opportunities Fund, Mr. May is also Chairman and Trustee of the Reaves Utility Income Fund. Mr. May is currently Vice Chair of the Board of Directors of the University of Colorado Foundation. | 9 | Mr. May is Chairman and Trustee of the Reaves Utility Income Fund (1 fund). |
| * | All communications to Trustees and Officers may be directed to ALPS Series Trust c/o 1290 Broadway, Suite 1100, Denver, CO 80203. |
| ** | Except as otherwise indicated, each individual has held the office shown or other offices in the same company for the last five years. |
| *** | The Fund Complex currently consists of nine series of the Trust and any other investment companies for which Riverside Advisors, LLC provides investment advisory services, currently none. |
Annual Report | September 30, 2014 | 41 |
Table of Contents
| Riverside Frontier Markets Fund | Trustees and Officers | |
September 30, 2014 (Unaudited) |
INTERESTED TRUSTEE AND OFFICERS (continued)
| Term of | ||||||
| Name, | Position(s) | Office and | ||||
| Birth Year | Held with | Length of | ||||
| & Address* | Fund | Time Served | Principal Occupation(s) During Past 5 Years** | |||
Kimberly R. Storms Birth year: 1972 | Treasurer | Ms. Storms was elected Treasurer of the Trust on October 30, 2012; indefinite term. | Ms. Storms is Senior Vice President - Director of Fund Administration of ALPS. Ms. Storms joined ALPS in 1998 as Assistant Controller. Because of her position with ALPS, Ms. Storms is deemed an affiliate of the Trust as defined under the 1940 Act. Ms. Storms is also Treasurer of Financial Investors Trust, Liberty All-Star Equity Fund and Liberty All-Star Growth Fund, Inc. She serves as Chief Financial Officer of Arbitrage Funds. | |||
JoEllen L. Legg Birth year: 1961 | Secretary | Ms. Legg was elected Secretary of the Trust on October 30, 2012; indefinite term. | Ms. Legg joined ALPS in October 2007 and is Vice President, Senior Counsel of ALPS. Prior to joining ALPS, Ms. Legg served as Senior Counsel - Law (Corporate & Securities) for Adelphia Communications Corporation (February 2005 - March 2007). Prior to this, Ms. Legg held associate positions at Fried Frank Harris Shriver & Jacobson LLP (1998 - 2004) and at Patton Boggs LLP (2004 - 2005). Because of her position with ALPS, Ms. Legg is deemed an affiliate of the Trust as defined under the 1940 Act. Ms. Legg is also the Assistant Secretary of the Stone Harbor Investment Funds, Stone Harbor Emerging Markets Income Fund, Stone Harbor Emerging Markets Total Income Fund, James Advantage Funds, WesMark Funds, and Griffin Institutional Access Real Estate Fund. | |||
Nate Mandeville Birth year: 1977 | Assistant Treasurer | Mr. Mandeville was elected Assistant Treasurer of the Trust on August 22, 2014; indefinite term. | Mr. Mandeville joined ALPS in December 2013 and is Fund Controller of ALPS. Prior to joining ALPS, Mr. Mandeville worked for Great-West Financial (2011-2013), Virtuoso Sourcing Group (2008-2011) and Janus Capital Group (2000-2008). Because of his position with ALPS, Mr. Mandeville is deemed an affiliate of the Trust as defined under the 1940 Act. |
| * | All communications to Trustees and Officers may be directed to ALPS Series Trust c/o 1290 Broadway, Suite 1100, Denver, CO 80203. |
| ** | Except as otherwise indicated, each individual has held the office shown or other offices in the same company for the last five years. |
42 | www.riversidefunds.com |
Table of Contents
| Riverside Frontier Markets Fund | Trustees and Officers | |
September 30, 2014 (Unaudited) |
INTERESTED TRUSTEE AND OFFICERS (continued)
| Term of | ||||||
| Name, | Position(s) | Office and | ||||
| Birth Year | Held with | Length of | ||||
| & Address* | Fund | Time Served | Principal Occupation(s) During Past 5 Years** | |||
Lucas Foss Birth year: 1977 | Chief Compliance Officer (“CCO”) | Mr. Foss was elected CCO of the Trust on October 30, 2012; indefinite term. | Mr. Foss joined ALPS in November 2004 and is Deputy Chief Compliance Officer of ALPS. Prior to his current role, Mr. Foss served as a Compliance Manager at ALPS (January 2010 - August 2012), and a Senior Compliance Analyst at ALPS (November 2004 – May 2006). Before joining ALPS, Mr. Foss held positions at Bisys Hedge Fund Services and Deutsche Asset Management. Because of his position with ALPS, Mr. Foss is deemed an affiliate of the Trust as defined under the 1940 Act. Mr. Foss is also CCO of Caldwell & Orkin Funds, Whitebox Mutual Funds, Boulder Growth & Income Fund, Boulder Total Return Fund, the Denali Fund, Wakefield Alternative Series Trust and The Principal Real Estate Income Fund. |
| * | All communications to Trustees and Officers may be directed to ALPS Series Trust c/o 1290 Broadway, Suite 1100, Denver, CO 80203. |
| ** | Except as otherwise indicated, each individual has held the office shown or other offices in the same company for the last five years. |
Additional information about members of the Board of Trustees and officers of the Trust is available in the Statement of Additional Information and is available, without charge, upon request, by calling the Fund (toll-free) at 1-855-331-6240.
Annual Report | September 30, 2014 | 43 |
Table of Contents

Table of Contents
Item 2. Code of Ethics.
| (a) | The registrant, as of the end of the period covered by this report, has adopted a code of ethics that applies to the Registrant’s principal executive officer, principal financial officer, principal accounting officer or controller or any persons performing similar functions on behalf of the Registrant. |
| (b) | Not applicable. |
| (c) | During the period covered by this report, no amendments to the provisions of the code of ethics adopted in Item 2(a) above were made. |
| (d) | During the period covered by this report, no implicit or explicit waivers to the provisions of the code of ethics adopted in Item 2(a) above were granted. |
| (e) | Not applicable. |
| (f) | The registrant’s Code of Ethics is attached as an Exhibit to this report. |
Item 3. Audit Committee Financial Expert.
The Board of Trustees of the Registrant has determined that the registrant has at least one Audit Committee Financial Expert serving on its audit committee. The Board of Trustees of the Registrant has designated Cheryl Burgermeister, J. Wayne Hutchens and Patrick Seese, as the Registrant’s “Audit Committee Financial Experts.” Ms. Burgermeister, Mr. Hutchens and Mr. Seese are “independent” as defined in paragraph (a)(2) of Item 3 to Form N-CSR.
Item 4. Principal Accountant Fees and Services.
| (a) | Audit Fees: For the registrant’s fiscal years ended September 30, 2014 and September 30, 2013 the aggregate fees billed for professional services rendered by the principal accountant for the audit of the Registrant’s annual financial statements were $128,000 and $27,500, respectively. |
| (b) | Audit-Related Fees: For the registrant’s fiscal years ended September 30, 2014 and September 30, 2013, the aggregate fees billed for professional services rendered by the principal accountant for the verification of the registrant’s securities and similar investments in accordance with Rule 17f-2 under the Investment Company Act of 1940 were $0 and $0, respectively. |
Table of Contents
| (c) | Tax Fees: For the registrant’s fiscal years ended September 30, 2014 and September 30, 2013, the aggregate fees billed for professional services rendered by the principal accountant for tax compliance, tax advice and tax planning were $27,900 and $6,000, respectively. The fiscal year 2014 and 2013 tax fees were for services for dividend calculation, excise tax preparation and tax return preparation. |
| (d) | All Other Fees: For the registrant’s fiscal years ended September 30, 2014 and September 30, 2013, no fees were billed to registrant by the principal accountant for services other than the services reported in paragraphs (a) through (c) of this Item. |
| (e)(1) | Audit Committee Pre-Approval Policies and Procedures: All services to be performed by the registrant’s principal accountant must be pre-approved by the registrant’s audit committee. |
| (e)(2) | No services described in paragraphs (b) through (d) of this Item were approved by the registrant’s audit committee pursuant to paragraph (c)(7)(i)(C) of Rule 2-01 of Regulation S-X. |
| (f) | Not applicable. |
| (g) | For the registrant’s fiscal years ended September 30, 2014 and September 30, 2013, the aggregate non-audit fees billed by the registrant’s accountant consisted of $27,900 and $6,000, respectively as described in response to paragraph (c) above. |
| (h) | The registrant’s audit committee has considered whether the provision of non-audit services that were rendered to the registrant’s investment adviser (not including any sub-adviser whose role is primarily portfolio management and is subcontracted with or overseen by another investment adviser), and any entity controlling, controlled by, or under common control with the investment adviser that provides ongoing services to the Registrant that were not pre-approved pursuant to paragraph (c)(7)(ii) of Rule 2-01 of Regulation S-X, is compatible with maintaining the principal accountant’s independence. The registrant’s audit committee determined that the provision of such non-audit services is compatible with maintaining the principal accountant’s independence. |
Item 5. Audit Committee of Listed Registrants.
Not applicable.
Item 6. Investments.
| (a) | Schedule of Investments is included as part of the Reports to Stockholders filed under Item 1 of this Form N-CSR. |
Table of Contents
| (b) | Not applicable. |
| Item 7. | Disclosure of Proxy Voting Policies and Procedures for Closed-End Management Investment Companies. |
Not applicable to registrant.
| Item 8. | Portfolio Managers of Closed-End Management Investment Companies. |
Not applicable to registrant.
| Item 9. | Purchases of Equity Securities by Closed-End Management Investment Company and Affiliated Purchasers. |
Not applicable to registrant.
| Item 10. | Submission of Matters to Vote of Security Holders. |
There have been no material changes to the procedures by which shareholders may recommend nominees to the registrant’s Board of Trustees, where those changes were implemented after the registrant last provided disclosure in response to the requirements of Item 407(c)(2)(iv) of Regulation S-K, or this Item.
Table of Contents
Item 11. Controls and Procedures.
| (a) | The registrant’s principal executive officer and principal financial officer have evaluated the registrant’s disclosure controls and procedures (as defined in Rule 30a-3(c) under the Investment Company Act of 1940, as amended) within 90 days of this report and have concluded that the registrant’s disclosure controls and procedures were effective as of that date. |
| (b) | There was no change in the registrant’s internal control over financial reporting (as defined in Rule 30a-3(d) under the Investment Company Act of 1940, as amended) during the second fiscal quarter of the period covered by this report that has materially affected, or is reasonably likely to materially affect, the registrant’s internal control over financial reporting. |
Item 12. Exhibits.
| (a)(1) | Registrant’s Code of Ethics for Principal Executive and Senior Financial Officers, which is the subject of the disclosure required by Item 2 of Form N-CSR, is incorporated by reference to Exhibit 12(a)(1) to the Registrant’s Certified Shareholder Report on Form N-CSR, File No. 811-22747, filed on December 6, 2013. |
| (a)(2) | The certifications required by Rule 30a-2(a) of the Investment Company Act of 1940, as amended, and Section 302 of the Sarbanes-Oxley Act of 2002 are attached hereto as Exhibit 99.Cert. |
| (a)(3) | None. |
| (b) | The certifications by the registrant’s principal executive officer and principal financial officer, as required by Rule 30a-2(b) of the Investment Company Act of 1940, as amended, and Section 906 of the Sarbanes-Oxley Act of 2002 are attached hereto as Exhibit 99.906Cert. |
Table of Contents
SIGNATURES
Pursuant to the requirements of the Securities Exchange Act of 1934 and the Investment Company Act of 1940, the registrant has duly caused this report to be signed on its behalf by the undersigned, thereunto duly authorized.
ALPS SERIES TRUST
| By: | /s/ Jeremy O. May | |
| Jeremy O. May | ||
President (Principal Executive Officer)
| ||
| Date: | December 3, 2014 |
Pursuant to the requirements of the Securities Exchange Act of 1934 and the Investment Company Act of 1940, this report has been signed below by the following persons on behalf of the registrant and in the capacities and on the dates indicated.
| By: | /s/ Jeremy O. May | |
| Jeremy O. May | ||
President (Principal Executive Officer)
| ||
| Date: | December 3, 2014
| |
| By: | /s/ Kimberly R. Storms | |
| Kimberly R. Storms | ||
Treasurer (Principal Financial Officer)
| ||
| Date: | December 3, 2014 |