UNITED STATES
SECURITIES AND EXCHANGE COMMISSION
Washington, D.C. 20549
FORM N-CSR
CERTIFIED SHAREHOLDER REPORT OF REGISTERED
MANAGEMENT INVESTMENT COMPANIES
Investment Company Act file number: 811-22747
ALPS SERIES TRUST
(Exact name of registrant as specified in charter)
1290 Broadway, Suite 1000, Denver, Colorado 80203
(Address of principal executive offices) (Zip code)
Camilla Nwokonko, Secretary
ALPS Series Trust
1290 Broadway, Suite 1000
Denver, CO 80203
(Name and address of agent for service)
(303) 623-2577
(Registrant’s telephone number, including area code)
| Date of fiscal year end: | September 30 |
| | |
| Date of reporting period: | October 1, 2023 – September 30, 2024 |
| Item 1. | Reports to Stockholders. |
Beacon Accelerated Return Strategy Fund
Annual Shareholder Report | September 30, 2024
This annual shareholder report contains important information about Beacon Accelerated Return Strategy Fund - I Class for the period of October 1, 2023 to September 30, 2024.
You can find additional information about the Fund at https://www.beacontrust.com/services/investment-management/beacon-funds. You can also request this information by contacting us at 1-844-894-9222.
What were the Fund's Cost for the last year?
(based on a hypothetical $10,000 investment)
| CLASS NAME | COST OF A $10,000 INVESTMENT | COST PAID AS A PERCENTAGE OF A $10,000 INVESTMENT |
|---|
| Beacon Accelerated Return Strategy Fund - I | $141 | 1.28% |
How did the Fund perform last year?
The Beacon Accelerated Return Strategy Fund - I returned 20.42% for the 12 months ended September 30, 2024. This is in contrast to the CBOE S&P 500 BuyWrite Index, which had a 18.31% return for the same time period.
The returns sought to be generated by the Fund are derived from two distinct return elements, i.e. returns from Directional/Enhanced market movements and returns from Income (or option premium). Each return driver plays a crucial, and sometimes complementary role in the overall performance of the strategy.
Over the last year, the Directional/Enhanced component added value due to the increase in the S&P 500, and the Income component detracted from value since the premium collected from selling out of the money call options was less than the losses from the exercised options.
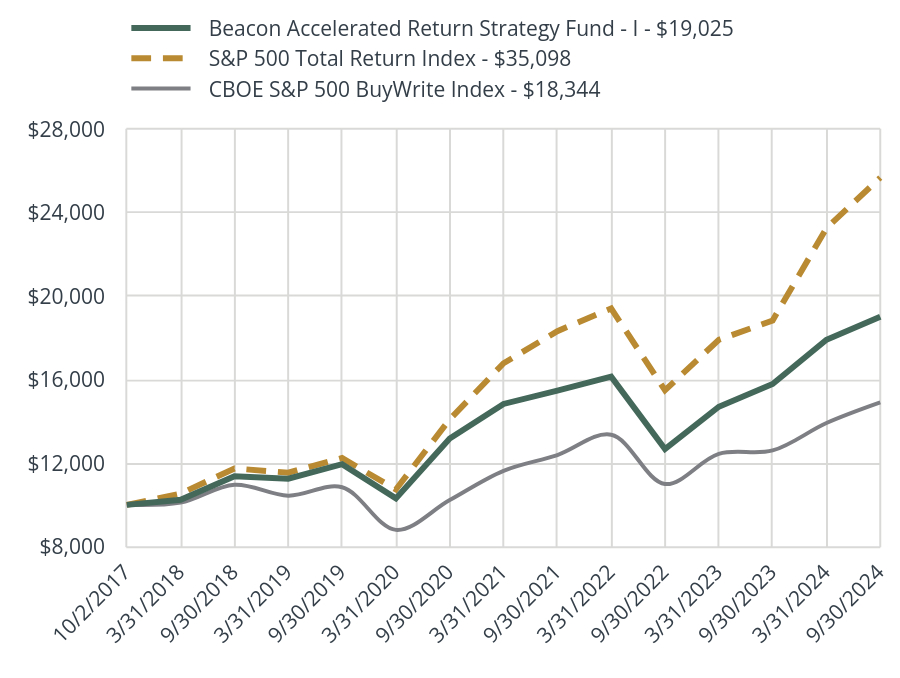
How did the Fund perform since inception?
Total Return Based on $10,000 Investment
| Beacon Accelerated Return Strategy Fund - I - $19,025 | S&P 500 Total Return Index - $35,098 | CBOE S&P 500 BuyWrite Index - $18,344 |
|---|
| 10/2/2017 | $10,000.00 | $10,000.00 | $10,000.00 |
| 3/31/2018 | $10,243.42 | $10,542.64 | $10,108.88 |
| 9/30/2018 | $11,370.39 | $11,745.49 | $10,965.39 |
| 3/31/2019 | $11,254.70 | $11,543.82 | $10,441.48 |
| 9/30/2019 | $11,949.29 | $12,245.13 | $10,843.96 |
| 3/31/2020 | $10,310.53 | $10,738.30 | $8,799.38 |
| 9/30/2020 | $13,182.74 | $14,100.17 | $10,230.23 |
| 3/31/2021 | $14,841.63 | $16,789.51 | $11,632.69 |
| 9/30/2021 | $15,478.84 | $18,330.91 | $12,389.07 |
| 3/31/2022 | $16,146.55 | $19,416.37 | $13,363.35 |
| 9/30/2022 | $12,672.40 | $15,494.73 | $11,000.36 |
| 3/31/2023 | $14,707.26 | $17,915.78 | $12,447.06 |
| 9/30/2023 | $15,799.14 | $18,844.28 | $12,609.14 |
| 3/31/2024 | $17,916.72 | $23,269.24 | $13,927.23 |
| 9/30/2024 | $19,025.14 | $25,694.46 | $14,917.28 |
Average Annual Total Retuns
| Class I | 1 Year | 5 Year | Since Inception |
|---|
| Beacon Accelerated Return Strategy Fund - Class I | 20.42% | 9.75% | 9.63% |
| S&P 500 Total Return Index | 36.35% | 15.98% | 14.44% |
| CBOE S&P 500 BuyWrite Index | 18.31% | 6.59% | 5.88% |
- Total Net Assets$86,392,330
- # of Portfolio Holdings51
- Portfolio Turnover Rate (Class I)-%
- Advisory Fees Paid$900,367
The Fund’s past performance is not a good predictor of the Fund’s future performance. The "Average Annual Total Returns" table and graph presented above do not reflect the deduction of taxes a shareholder would pay on fund distributions or the redemption of fund shares.
Call 1-844-894-9222 for current month-end performance.
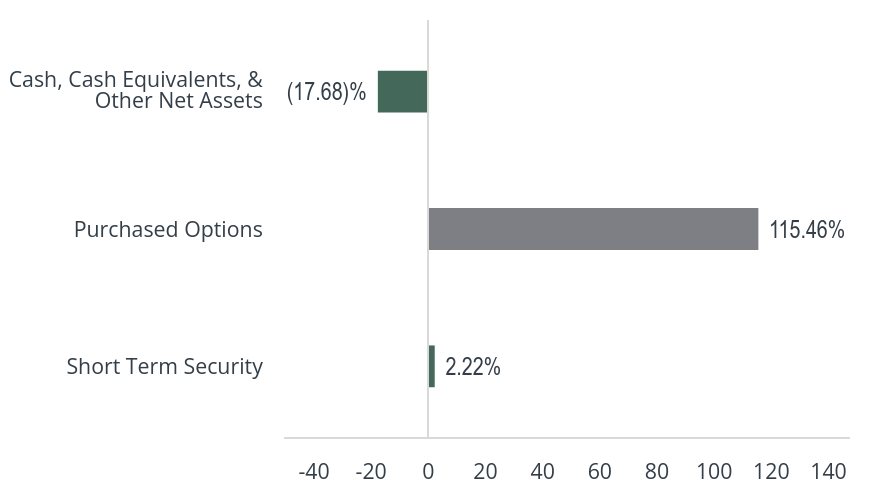
What did the Fund invest in?
| Top 10 | % |
|---|
| Call XSP October 0.01 10/14/2024 | 11.34% |
| Call XSP November 0.01 11/14/2024 | 10.67% |
| Call XSP December 0.01 12/13/2024 | 10.66% |
| Call XSP January 0.01 01/14/2025 | 10.33% |
| Call XSP Febuary 0.01 02/14/2025 | 9.32% |
| Call XSP May 0.01 05/14/2025 | 8.31% |
| Call XSP JUNE 0.01 06/13/2025 | 8.31% |
| Call XSP JULY 0.01 07/14/2025 | 8.30% |
| Call XSP March 0.01 03/14/2025 | 7.99% |
| Call XSP April 0.01 04/14/2025 | 7.98% |
| Total % of Top 10 Holdings | 93.21% |
| Value | Value |
|---|
| Short Term Security | 2.22% |
| Purchased Options | 115.46% |
| Cash, Cash Equivalents, & Other Net Assets | (17.68)% |
| Value | Value |
|---|
| United States | 117.68% |
There have been no material Fund changes during the reporting period.
Changes in and Disagreements with Accountants
There have been no changes in or disagreements with the Fund's independent accounting firm during the reporting period.
Availability of Additional Information
Additional information about the Fund, including its prospectus, financial information, holdings, and proxy voting information, can be found by visitinghttps://www.beacontrust.com/services/investment-management/beacon-funds.
If you have consented to receive a single annual or semi-annual shareholder report at a shared address you may revoke this consent by calling the Transfer Agent 1-973-206-7100.
Distributor, ALPS Distributors, Inc.
Phone: 1-844-894-9222
Email: mutualfunds@beacontrust.com
Beacon Accelerated Return Strategy Fund - Class I
Annual Shareholder Report | September 30, 2024
Beacon Planned Return Strategy Fund
Annual Shareholder Report | September 30, 2024
This annual shareholder report contains important information about Beacon Planned Return Strategy Fund - I Class for the period of October 1, 2023 to September 30, 2024.
You can find additional information about the Fund at https://www.beacontrust.com/services/investment-management/beacon-funds. You can also request this information by contacting us at 1-844-894-9222.
What were the Fund's Cost for the last year?
(based on a hypothetical $10,000 investment)
| CLASS NAME | COST OF A $10,000 INVESTMENT | COST PAID AS A PERCENTAGE OF A $10,000 INVESTMENT |
|---|
| Beacon Planned Return Strategy Fund - I | $129 | 1.20% |
How did the Fund perform last year?
The Beacon Planned Return Strategy Fund - I returned 14.70% for the 12 months ended September 30, 2024. This is in contrast to the CBOE S&P 500 BuyWrite Index, which had a 18.31% return for the same time period.
The returns sought to be generated by the Fund are derived from three distinct return elements, i.e., returns from Directional/Enhanced market movements, returns from Income (or option premium) and returns from the Hedge that creates constant “downside protection”. Each return driver plays a crucial and sometimes complementary role in the overall performance of the strategy.
Over the last year, the Directional/Enhanced component added value due to the increase in the S&P 500, the Income component detracted from value since selling the out of the money call options lost more than the gains received from selling put options, and the Hedge component detracted from value due to the rise in the S&P 500.
How did the Fund perform since inception?
Total Return Based on $10,000 Investment
| Beacon Planned Return Strategy Fund - I - $16,878 | S&P 500 Total Return Index - $35,098 | CBOE S&P 500 BuyWrite Index - $18,344 |
|---|
| 10/2/2017 | $10,000.00 | $10,000.00 | $10,000.00 |
| 3/31/2018 | $10,132.44 | $10,542.64 | $10,108.88 |
| 9/30/2018 | $10,764.46 | $11,745.49 | $10,965.39 |
| 3/31/2019 | $10,916.92 | $11,543.82 | $10,441.48 |
| 9/30/2019 | $11,385.88 | $12,245.13 | $10,843.96 |
| 3/31/2020 | $10,263.80 | $10,738.30 | $8,799.38 |
| 9/30/2020 | $12,207.17 | $14,100.17 | $10,230.23 |
| 3/31/2021 | $13,272.12 | $16,789.51 | $11,632.69 |
| 9/30/2021 | $13,614.63 | $18,330.91 | $12,389.07 |
| 3/31/2022 | $14,113.47 | $19,416.37 | $13,363.35 |
| 9/30/2022 | $12,197.17 | $15,494.73 | $11,000.36 |
| 3/31/2023 | $13,917.65 | $17,915.78 | $12,447.06 |
| 9/30/2023 | $14,714.94 | $18,844.28 | $12,609.14 |
| 3/31/2024 | $16,078.38 | $23,269.24 | $13,927.23 |
| 9/30/2024 | $16,877.86 | $25,694.46 | $14,917.28 |
Average Annual Total Retuns
| Class I | 1 Year | 5 Year | Since Inception |
|---|
| Beacon Planned Return Strategy Fund - Class I | 14.70% | 8.19% | 7.77% |
| S&P 500 Total Return Index | 36.35% | 15.98% | 14.44% |
| CBOE S&P 500 BuyWrite Index | 18.31% | 6.59% | 5.88% |
- Total Net Assets$384,241,502
- # of Portfolio Holdings97
- Portfolio Turnover Rate (Class I)-%
- Advisory Fees Paid$3,685,434
The Fund’s past performance is not a good predictor of the Fund’s future performance. The "Average Annual Total Returns" table and graph presented above do not reflect the deduction of taxes a shareholder would pay on fund distributions or the redemption of fund shares.
Call 1-844-894-9222 for current month-end performance.
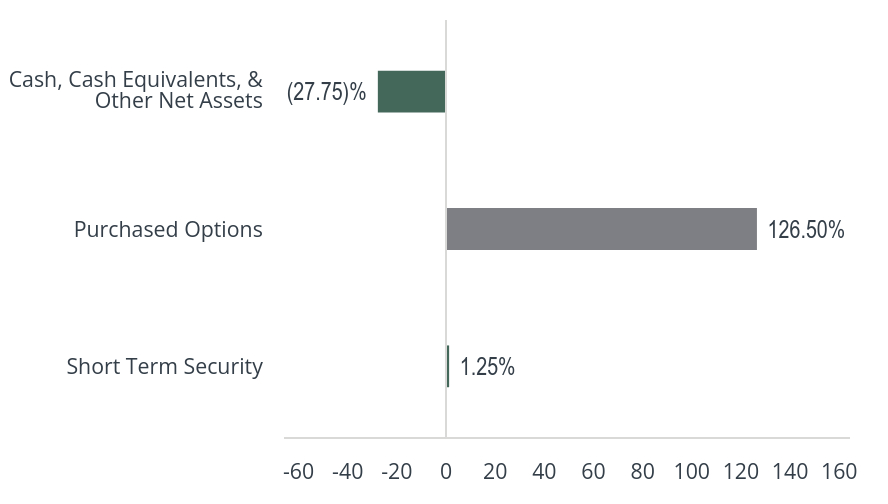
What did the Fund invest in?
| Top 10 | % |
|---|
| Call XSP October 56.75 10/14/2024 | 9.60% |
| Call XSP November 58.75 11/14/2024 | 9.43% |
| Call XSP AUGUST 72.00 08/14/2025 | 8.53% |
| Call XSP September 73.42 09/12/2025 | 8.36% |
| Call XSP July 73.55 07/14/2025 | 8.30% |
| Call XSP June 70.80 06/13/2025 | 7.50% |
| Call XSP Febuary 65.20 02/14/2025 | 7.32% |
| Call XSP April 67.30 04/14/2025 | 7.29% |
| Call XSP May 69.00 05/14/2025 | 7.20% |
| Call XSP March 67.18 03/14/2025 | 7.16% |
| Total % of Top 10 Holdings | 80.69% |
| Value | Value |
|---|
| Short Term Security | 1.25% |
| Purchased Options | 126.50% |
| Cash, Cash Equivalents, & Other Net Assets | (27.75)% |
| Value | Value |
|---|
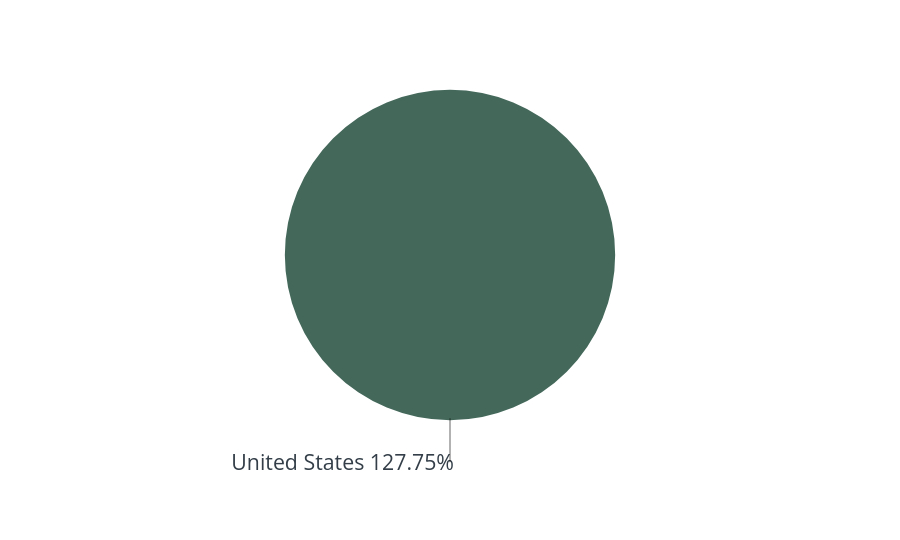
| United States | 127.75% |
There have been no material Fund changes during the reporting period.
Changes in and Disagreements with Accountants
There have been no changes in or disagreements with the Fund's independent accounting firm during the reporting period.
Availability of Additional Information
Additional information about the Fund, including its prospectus, financial information, holdings, and proxy voting information, can be found by visitinghttps://www.beacontrust.com/services/investment-management/beacon-funds.
If you have consented to receive a single annual or semi-annual shareholder report at a shared address you may revoke this consent by calling the Transfer Agent 1-973-206-7100.
Distributor, ALPS Distributors, Inc.
Phone: 1-844-894-9222
Email: mutualfunds@beacontrust.com
Beacon Planned Return Strategy Fund - Class I
Annual Shareholder Report | September 30, 2024
ANNUAL SHAREHOLDER REPORT | September 30, 2024
This annual shareholder report contains important information about Brigade High Income Fund - Founders Class for the period of October 1, 2023 to September 30, 2024.
You can find additional information about the Fund at https://www.brigadefunds.com/resources. You can also request this information by contacting us at 212.745.9700.
WHAT WERE THE FUND'S COST FOR THE LAST YEAR?
(based on a hypothetical $10,000 investment)
| CLASS NAME | COST OF A $10,000 INVESTMENT | COST PAID AS A PERCENTAGE OF A $10,000 INVESTMENT |
|---|
| Brigade High Income Fund - Founders | $56 | 0.52% |
HOW DID THE FUND PERFORM LAST YEAR?
The Founder’s Share Class for the Fund returned +15.34% (net) for the one-year ending September 30, 2024, outperforming the 60% ICE BofA US HY Constrained / 40% Credit Suisse Leveraged Loan Index (+13.26%) while slightly underperforming the ICE BofA US High Yield Constrained Index (+15.67%).
The key driver to Fund performance over the one-year period were positions in high yield bonds, specifically within the Healthcare, Telecom, Energy and Financials industries. Healthcare and Telecom were among the most disperse sectors that have begun to see catalysts play out.
Bank loans was also a positive contributor to Fund performance. Similar to high yield bonds, drivers were diverse across sectors with Healthcare, Technology, Energy and Gaming the top contributors over the one-year period.
We continue to actively monitor macroeconomic developments and their effect on leveraged finance markets and remain confident in our current positioning as well as the opportunity set that we expect to become available to us in the coming months.
HOW DID THE FUND PERFORM SINCE INCEPTION?
TOTAL RETURN BASED ON $10,000 INVESTMENT
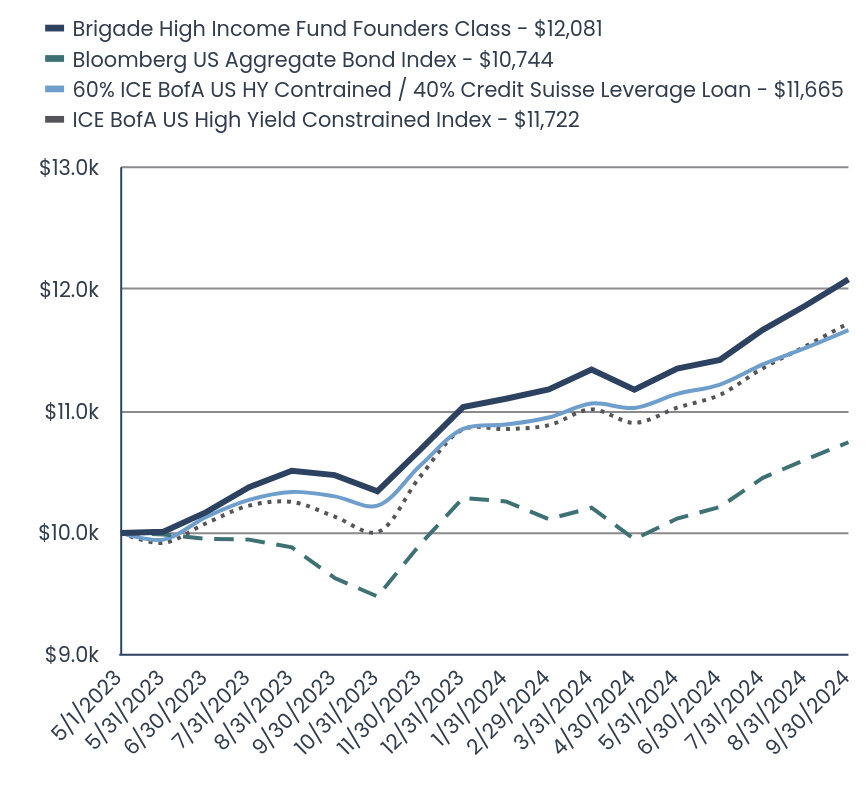
| Brigade High Income Fund Founders Class - $12,081 | Bloomberg US Aggregate Bond Index - $10,744 | 60% ICE BofA US HY Contrained / 40% Credit Suisse Leverage Loan - $11,665 | ICE BofA US High Yield Constrained Index - $11,722 |
|---|
| 5/1/2023 | $10,000.00 | $10,000.00 | $10,000.00 | $10,000.00 |
| 5/31/2023 | $10,010.00 | $9,987.39 | $9,944.92 | $9,918.28 |
| 6/30/2023 | $10,170.00 | $9,951.75 | $10,131.01 | $10,079.65 |
| 7/31/2023 | $10,375.31 | $9,944.85 | $10,270.63 | $10,223.73 |
| 8/31/2023 | $10,510.72 | $9,881.34 | $10,336.42 | $10,254.15 |
| 9/30/2023 | $10,474.48 | $9,630.21 | $10,299.81 | $10,133.66 |
| 10/31/2023 | $10,342.50 | $9,478.24 | $10,223.94 | $10,007.14 |
| 11/30/2023 | $10,683.74 | $9,907.46 | $10,552.73 | $10,463.95 |
| 12/31/2023 | $11,032.83 | $10,286.71 | $10,854.29 | $10,850.10 |
| 1/31/2024 | $11,101.21 | $10,258.45 | $10,889.52 | $10,852.19 |
| 2/29/2024 | $11,177.43 | $10,113.52 | $10,947.63 | $10,884.32 |
| 3/31/2024 | $11,341.18 | $10,206.92 | $11,062.27 | $11,013.97 |
| 4/30/2024 | $11,174.69 | $9,949.09 | $11,025.90 | $10,903.84 |
| 5/31/2024 | $11,348.61 | $10,117.76 | $11,141.06 | $11,027.57 |
| 6/30/2024 | $11,420.66 | $10,213.58 | $11,217.73 | $11,134.01 |
| 7/31/2024 | $11,666.50 | $10,452.15 | $11,382.75 | $11,352.50 |
| 8/31/2024 | $11,866.52 | $10,602.31 | $11,518.45 | $11,533.08 |
| 9/30/2024 | $12,081.16 | $10,744.29 | $11,665.22 | $11,721.54 |
AVERAGE ANNUAL TOTAL RETURNS
| Founders | 1 Year | Since Inception |
|---|
| Brigade High Income Fund - Founders (Incep. May 1, 2023) | 15.34% | 14.28% |
| Bloomberg US Aggregate Bond Index | 11.57% | 5.20% |
| 60% ICE BofA US HY Contrained / 40% Credit Suisse Leverage Loan | 13.26% | 11.49% |
| ICE BofA US High Yield Constrained Index | 15.67% | 11.87% |
- Total Net Assets$580,476,781
- # of Portfolio Holdings248
- Portfolio Turnover Rate49%
- Advisory Fees Paid$1,686,711
The Fund’s past performance is not a good predictor of the Fund’s future performance. The "Average Annual Total Return" table and graph presented above do not reflect the deduction of taxes a shareholder would pay on fund distributions or the redemption of fund shares. Call 212.745.9700 for current month-end performance.
WHAT DID THE FUND INVEST IN?
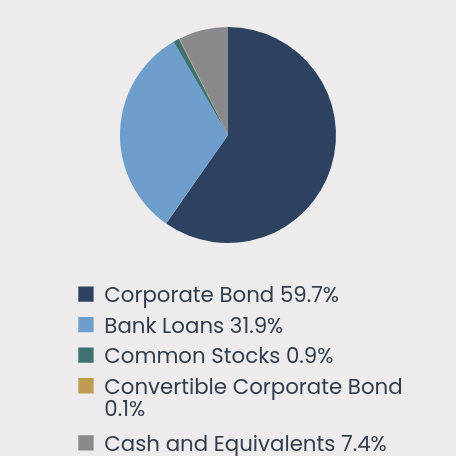
ASSET CLASS WEIGHTINGS
(as a % of Net Assets)
| Value | Value |
|---|
| Corporate Bond | 59.7% |
| Bank Loans | 31.9% |
| Common Stocks | 0.9% |
| Convertible Corporate Bond | 0.1% |
| Cash and Equivalents | 7.4% |
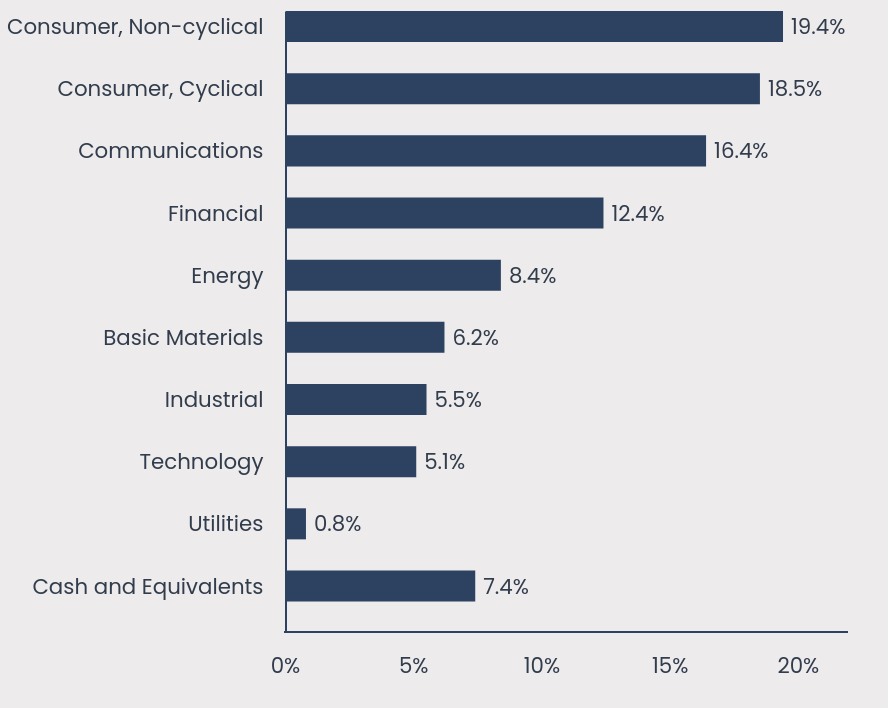
SECTOR WEIGHTINGS
(as a % of Net Assets)
| Value | Value |
|---|
| Cash and Equivalents | 7.4% |
| Utilities | 0.8% |
| Technology | 5.1% |
| Industrial | 5.5% |
| Basic Materials | 6.2% |
| Energy | 8.4% |
| Financial | 12.4% |
| Communications | 16.4% |
| Consumer, Cyclical | 18.5% |
| Consumer, Non-cyclical | 19.4% |
TOP TEN HOLDINGS
(as a % of Net Assets)
| Top 10 | Top 10 |
|---|
| Tenet Healthcare Corp. 06/15/2028 4.625% | 1.2% |
| TransDigm, Inc. 12/01/2031 7.125% | 1.2% |
| Team Health Holdings, Inc. 03/02/2027 3M SOFR + 5.25% | 1.2% |
| Radiology Partners, Inc. 01/31/2029 7.775% | 1.1% |
| Avaya Inc. 08/01/2028 1M SOFR + 7.50% | 1.0% |
| Syniverse Holdings LLC 05/13/2027 3M SOFR + 7.00% | 0.9% |
| Warhorse Gaming, LLC 06/15/2028 1M SOFR + 9.25% | 0.9% |
| Envision Healthcare Operating, INC. TL 1L 12/30/2027 1M SOFR + 8.25% | 0.9% |
| Carestream Health, Inc. 09/30/2027 3M SOFR + 7.50% | 0.9% |
| Team Health Holdings, Inc. 06/30/2028 13.50% | 0.9% |
| Total % of Top 10 Holdings | 10.1% |
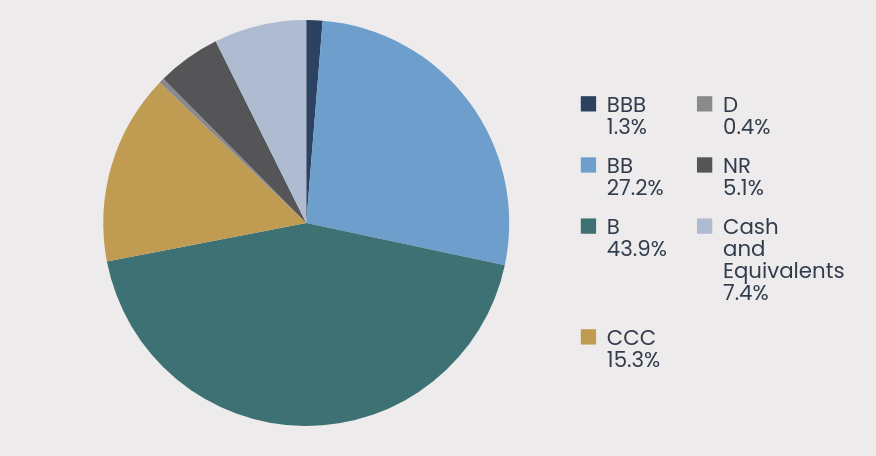
CREDIT QUALITY ALLOCATION
(as a % of Net Assets)
| Value | Value |
|---|
| BBB | 1.3% |
| BB | 27.2% |
| B | 43.9% |
| CCC | 15.3% |
| D | 0.4% |
| NR | 5.1% |
| Cash and Equivalents | 7.4% |
There have been no material Fund changes during the reporting period.
CHANGES IN AND DISAGREEMENTS WITH ACCOUNTANTS
There have been no changes in or disagreements with the Fund's independent accounting firm during the reporting period.
BRIGADE HIGH INCOME FUND - FOUNDERS CLASS
ANNUAL SHAREHOLDER REPORT | September 30, 2024
Distributor, ALPS Distributors, Inc.
Additional information about the Fund, including its prospectus, financial information, holdings, and proxy voting information, can be found by visiting https://www.brigadefunds.com.
If you have consented to receive a single annual or semi-annual shareholder report at a shared address you may revoke this consent by calling the Transfer Agent 212.745.9700.
INSTITUTIONAL CLASS: BHIIX
ANNUAL SHAREHOLDER REPORT | September 30, 2024
This annual shareholder report contains important information about Brigade High Income Fund - Institutional Class for the period of October 1, 2023 to September 30, 2024.
You can find additional information about the Fund at https://www.brigadefunds.com/resources. You can also request this information by contacting us at 212.745.9700.
WHAT WERE THE FUND'S COST FOR THE LAST YEAR?
(based on a hypothetical $10,000 investment)
| CLASS NAME | COST OF A $10,000 INVESTMENT | COST PAID AS A PERCENTAGE OF A $10,000 INVESTMENT |
|---|
| Brigade High Income Fund - Institutional | $74 | 0.69% |
HOW DID THE FUND PERFORM LAST YEAR?
The Institutional’s Share Class for the Fund returned +15.14% (net) for the one-year ending September 30, 2024, outperforming the 60% ICE BofA US HY Constrained / 40% Credit Suisse Leveraged Loan Index (+13.26%) while slightly underperforming the ICE BofA US High Yield Constrained Index (+15.67%).
The key driver to Fund performance over the one-year period was positions in high yield bonds, specifically within the Healthcare, Telecom, Energy and Financials industries. Healthcare and Telecom were among the most disperse sectors that have begun to see catalysts play out.
Bank loans was also a positive contributor to Fund performance. Similar to high yield bonds, drivers were diverse across sectors with Healthcare, Technology, Energy and Gaming the top contributors over the one-year period.
We continue to actively monitor macroeconomic developments and their effect on leveraged finance markets and remain confident in our current positioning as well as the opportunity set that we expect to become available to us in the coming months.
HOW DID THE FUND PERFORM SINCE INCEPTION?
TOTAL RETURN BASED ON $10,000 INVESTMENT
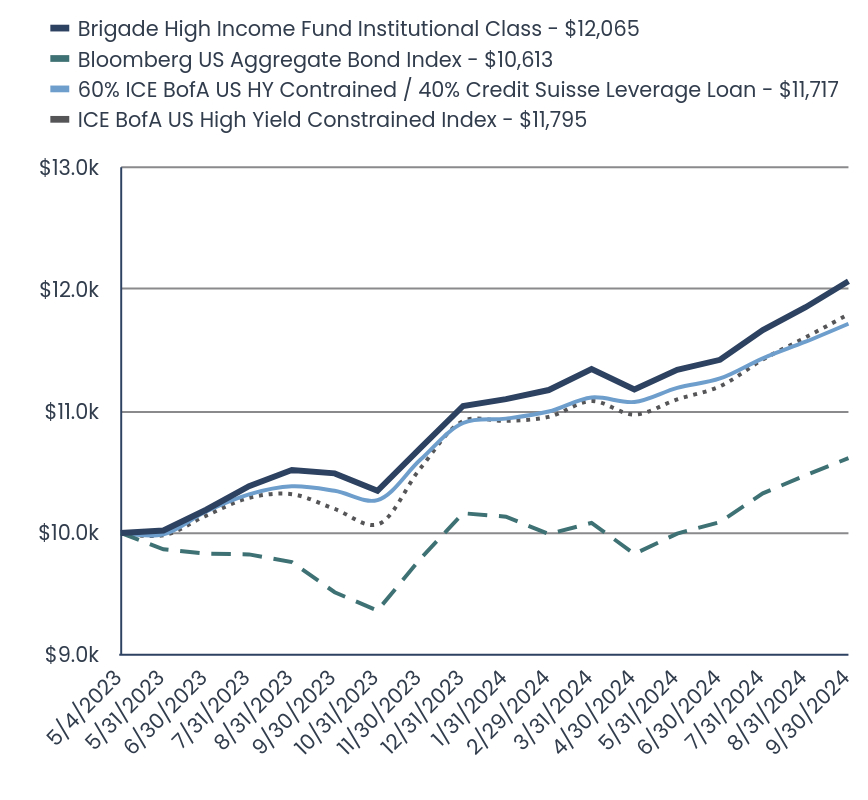
| Brigade High Income Fund Institutional Class - $12,065 | Bloomberg US Aggregate Bond Index - $10,613 | 60% ICE BofA US HY Contrained / 40% Credit Suisse Leverage Loan - $11,717 | ICE BofA US High Yield Constrained Index - $11,795 |
|---|
| 5/4/2023 | $10,000.00 | $10,000.00 | $10,000.00 | $10,000.00 |
| 5/31/2023 | $10,020.04 | $9,865.77 | $9,989.10 | $9,980.02 |
| 6/30/2023 | $10,190.38 | $9,830.56 | $10,176.02 | $10,142.40 |
| 7/31/2023 | $10,383.19 | $9,823.75 | $10,316.26 | $10,287.37 |
| 8/31/2023 | $10,516.63 | $9,761.00 | $10,382.35 | $10,317.98 |
| 9/30/2023 | $10,488.63 | $9,512.94 | $10,345.57 | $10,196.74 |
| 10/31/2023 | $10,345.54 | $9,362.82 | $10,269.36 | $10,069.43 |
| 11/30/2023 | $10,695.59 | $9,786.81 | $10,599.61 | $10,529.09 |
| 12/31/2023 | $11,042.25 | $10,161.45 | $10,902.51 | $10,917.65 |
| 1/31/2024 | $11,098.26 | $10,133.53 | $10,937.90 | $10,919.74 |
| 2/29/2024 | $11,172.73 | $9,990.36 | $10,996.27 | $10,952.07 |
| 3/31/2024 | $11,345.67 | $10,082.63 | $11,111.42 | $11,082.53 |
| 4/30/2024 | $11,177.41 | $9,827.93 | $11,074.89 | $10,971.72 |
| 5/31/2024 | $11,338.94 | $9,994.55 | $11,190.55 | $11,096.22 |
| 6/30/2024 | $11,420.95 | $10,089.21 | $11,267.57 | $11,203.32 |
| 7/31/2024 | $11,665.41 | $10,324.87 | $11,433.32 | $11,423.17 |
| 8/31/2024 | $11,852.53 | $10,473.20 | $11,569.62 | $11,604.87 |
| 9/30/2024 | $12,065.48 | $10,613.45 | $11,717.05 | $11,794.51 |
AVERAGE ANNUAL TOTAL RETURNS
| Institutional | 1 Year | Since Inception |
|---|
| Brigade High Income Fund - Institutional (Incep. May 4, 2023) | 15.14% | 14.34% |
| Bloomberg US Aggregate Bond Index | 11.57% | 4.32% |
| 60% ICE BofA US HY Contrained / 40% Credit Suisse Leverage Loan | 13.26% | 11.91% |
| ICE BofA US High Yield Constrained Index | 15.67% | 12.43% |
- Total Net Assets$580,476,781
- # of Portfolio Holdings248
- Portfolio Turnover Rate49%
- Advisory Fees Paid$1,686,711
The Fund’s past performance is not a good predictor of the Fund’s future performance. The "Average Annual Total Return" table and graph presented above do not reflect the deduction of taxes a shareholder would pay on fund distributions or the redemption of fund shares. Call 212.745.9700 for current month-end performance.
WHAT DID THE FUND INVEST IN?
ASSET CLASS WEIGHTINGS
(as a % of Net Assets)
| Value | Value |
|---|
| Corporate Bond | 59.7% |
| Bank Loans | 31.9% |
| Common Stocks | 0.9% |
| Convertible Corporate Bond | 0.1% |
| Cash and Equivalents | 7.4% |
SECTOR WEIGHTINGS
(as a % of Net Assets)
| Value | Value |
|---|
| Cash and Equivalents | 7.4% |
| Utilities | 0.8% |
| Technology | 5.1% |
| Industrial | 5.5% |
| Basic Materials | 6.2% |
| Energy | 8.4% |
| Financial | 12.4% |
| Communications | 16.4% |
| Consumer, Cyclical | 18.5% |
| Consumer, Non-cyclical | 19.4% |
TOP TEN HOLDINGS
(as a % of Net Assets)
| Top 10 | Top 10 |
|---|
| Tenet Healthcare Corp. 06/15/2028 4.625% | 1.2% |
| TransDigm, Inc. 12/01/2031 7.125% | 1.2% |
| Team Health Holdings, Inc. 03/02/2027 3M SOFR + 5.25% | 1.2% |
| Radiology Partners, Inc. 01/31/2029 7.775% | 1.1% |
| Avaya Inc. 08/01/2028 1M SOFR + 7.50% | 1.0% |
| Syniverse Holdings LLC 05/13/2027 3M SOFR + 7.00% | 0.9% |
| Warhorse Gaming, LLC 06/15/2028 1M SOFR + 9.25% | 0.9% |
| Envision Healthcare Operating, INC. TL 1L 12/30/2027 1M SOFR + 8.25% | 0.9% |
| Carestream Health, Inc. 09/30/2027 3M SOFR + 7.50% | 0.9% |
| Team Health Holdings, Inc. 06/30/2028 13.50% | 0.9% |
| Total % of Top 10 Holdings | 10.1% |
CREDIT QUALITY ALLOCATION
(as a % of Net Assets)
| Value | Value |
|---|
| BBB | 1.3% |
| BB | 27.2% |
| B | 43.9% |
| CCC | 15.3% |
| D | 0.4% |
| NR | 5.1% |
| Cash and Equivalents | 7.4% |
There have been no material Fund changes during the reporting period.
CHANGES IN AND DISAGREEMENTS WITH ACCOUNTANTS
There have been no changes in or disagreements with the Fund's independent accounting firm during the reporting period.
BRIGADE HIGH INCOME FUND - INSTITUTIONAL CLASS
ANNUAL SHAREHOLDER REPORT | September 30, 2024
Distributor, ALPS Distributors, Inc.
Additional information about the Fund, including its prospectus, financial information, holdings, and proxy voting information, can be found by visiting https://www.brigadefunds.com.
If you have consented to receive a single annual or semi-annual shareholder report at a shared address you may revoke this consent by calling the Transfer Agent 212.745.9700.
Carret Kansas Tax-Exempt Bond Fund
ANNUAL SHAREHOLDER REPORT | September 30, 2024
This annual shareholder report contains important information about Carret Kansas Tax-Exempt Bond Fund - A for the period of October 1, 2023 to September 30, 2024.
You can find additional information about the Fund at https://www.carret.com/carret-kansas-tax-exempt-bond-fund. You can also request this information by contacting us at 888.266.8787.
WHAT WERE THE FUND'S COST FOR THE LAST YEAR?
(based on a hypothetical $10,000 investment)
| CLASS NAME | COST OF A $10,000 INVESTMENT | COST PAID AS A PERCENTAGE OF A $10,000 INVESTMENT |
|---|
| Carret Kansas Tax-Exempt Bond Fund - A | $76 | 0.73% |
HOW DID THE FUND PERFORM LAST YEAR?
For the year ended September 30, 2024, the Carret Kansas Tax-Exempt Bond Fund returned 8.5% versus a return of 8.4% for the Bloomberg US Municipal Bond: 7 Year Index. The performance of the Fund was driven by the overall decline in interest rates during Fiscal Year 2024. The broad uncertainty of the macro and micro economies added a notable degree of volatility to the municipal bond landscape. The Fund’s high-quality focus, premium coupon bias, and intermediate-duration structure provided a cushion against market volatility.
HOW DID THE FUND PERFORM LAST 10 YEARS?
TOTAL RETURN BASED ON $10,000 INVESTMENT
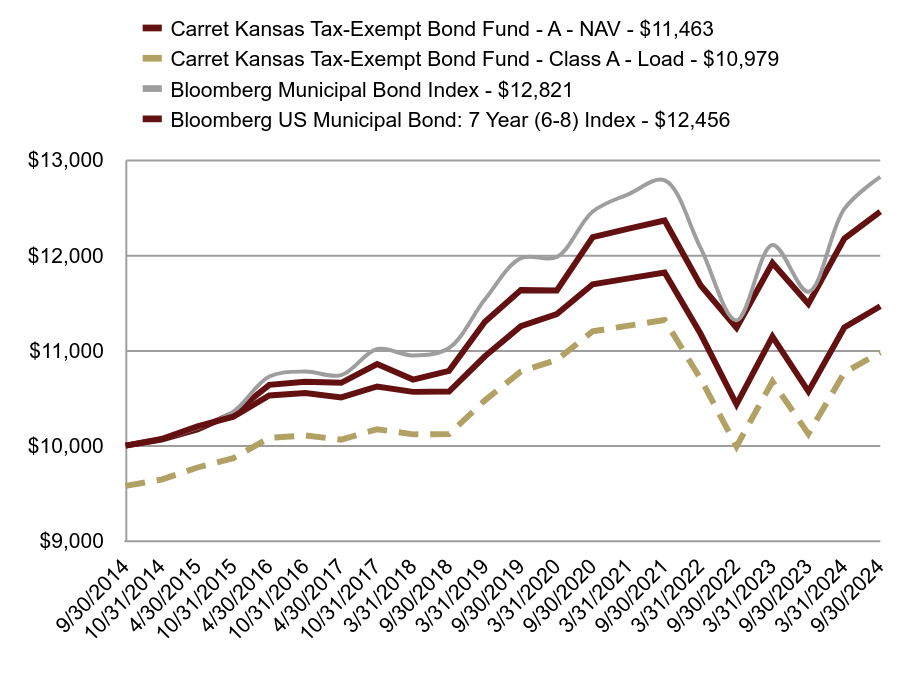
| Carret Kansas Tax-Exempt Bond Fund - A - NAV - $11,463 | Carret Kansas Tax-Exempt Bond Fund - Class A - Load - $10,979 | Bloomberg Municipal Bond Index - $12,821 | Bloomberg US Municipal Bond: 7 Year (6-8) Index - $12,456 |
|---|
| 9/30/2014 | $10,000.00 | $9,577.59 | $10,000.00 | $10,000.00 |
| 10/31/2014 | $10,069.24 | $9,643.90 | $10,068.55 | $10,064.46 |
| 4/30/2015 | $10,201.49 | $9,770.57 | $10,185.83 | $10,168.86 |
| 10/31/2015 | $10,304.35 | $9,869.08 | $10,357.26 | $10,337.47 |
| 4/30/2016 | $10,526.71 | $10,082.05 | $10,725.04 | $10,637.70 |
| 10/31/2016 | $10,552.30 | $10,106.56 | $10,777.57 | $10,671.52 |
| 4/30/2017 | $10,506.17 | $10,062.37 | $10,740.49 | $10,659.51 |
| 10/31/2017 | $10,620.96 | $10,172.32 | $11,013.84 | $10,855.82 |
| 3/31/2018 | $10,564.61 | $10,118.35 | $10,946.62 | $10,694.07 |
| 9/30/2018 | $10,567.25 | $10,120.87 | $11,025.32 | $10,785.48 |
| 3/31/2019 | $10,937.71 | $10,475.69 | $11,536.08 | $11,299.41 |
| 9/30/2019 | $11,254.44 | $10,779.04 | $11,968.05 | $11,634.19 |
| 3/31/2020 | $11,380.38 | $10,899.65 | $11,980.09 | $11,628.31 |
| 9/30/2020 | $11,694.44 | $11,200.45 | $12,457.76 | $12,190.03 |
| 3/31/2021 | $11,756.32 | $11,259.72 | $12,639.99 | $12,278.75 |
| 9/30/2021 | $11,816.89 | $11,317.72 | $12,785.15 | $12,363.55 |
| 3/31/2022 | $11,173.91 | $10,701.91 | $12,075.09 | $11,683.21 |
| 9/30/2022 | $10,432.48 | $9,991.80 | $11,314.78 | $11,237.65 |
| 3/31/2023 | $11,144.19 | $10,673.44 | $12,106.29 | $11,917.75 |
| 9/30/2023 | $10,569.79 | $10,123.30 | $11,616.19 | $11,488.13 |
| 3/31/2024 | $11,240.80 | $10,765.97 | $12,484.78 | $12,173.12 |
| 9/30/2024 | $11,463.49 | $10,979.26 | $12,820.99 | $12,455.95 |
AVERAGE ANNUAL TOTAL RETURNS
| Class A | 1 Year | 5 Year | 10 Year |
|---|
| Carret Kansas Tax-Exempt Bond Fund - Class A - NAV | 8.46% | 0.37% | 1.38% |
Carret Kansas Tax-Exempt Bond Fund - Class A - LoadFootnote Reference* | 3.81% | -0.50% | 0.94% |
| Bloomberg Municipal Bond Index | 10.37% | 1.39% | 2.52% |
| Bloomberg US Municipal Bond: 7 Year (6-8) Index | 8.41% | 1.38% | 2.22% |
- Total Net Assets$122,987,531
- # of Portfolio Holdings166
- Portfolio Turnover Rate10%
- Advisory Fees Paid$143,877
The Fund’s past performance is not a good predictor of the Fund’s future performance. The "Average Annual Total Returns" table and graph presented above do not reflect the deduction of taxes a shareholder would pay on fund distributions or the redemption of fund shares.
Call 888.266.8787 for current month-end performance.
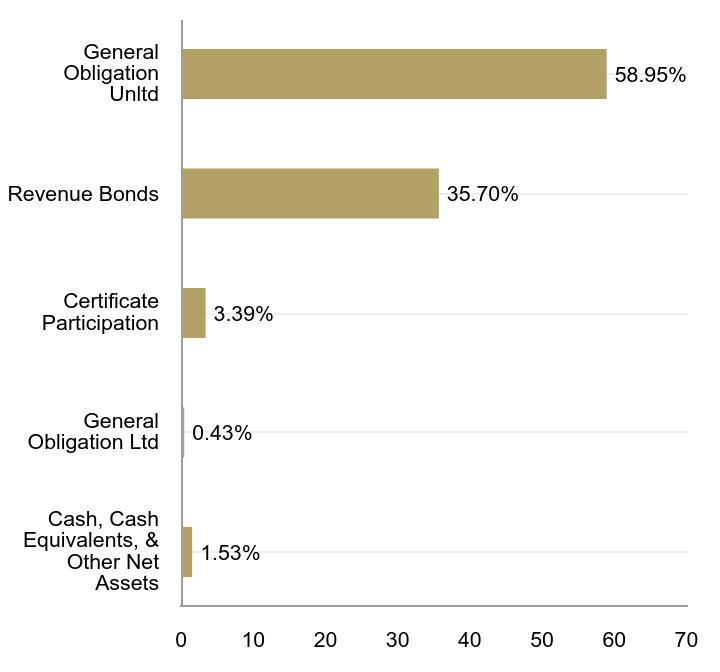
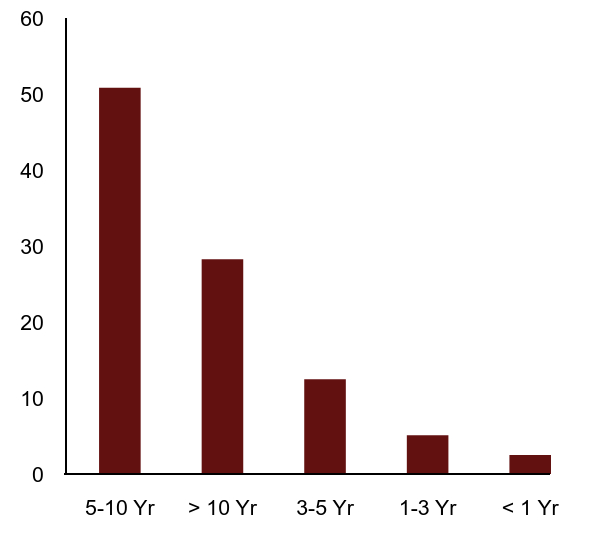
WHAT DID THE FUND INVEST IN?
| Value | Value |
|---|
| 5-10 Yr | 50.9% |
| > 10 Yr | 28.3% |
| 3-5 Yr | 12.5% |
| 1-3 Yr | 5.1% |
| < 1 Yr | 2.5% |
| Value | Value |
|---|
| Cash, Cash Equivalents, & Other Net Assets | 1.53% |
| General Obligation Ltd | 0.43% |
| Certificate Participation | 3.39% |
| Revenue Bonds | 35.70% |
| General Obligation Unltd | 58.95% |
| Top 10 | % |
|---|
| Allen County Unified School District No 257 09/01/2043 3.00% | 1.73% |
| State of Kansas Department of Transportation 09/01/2031 5.00% | 1.72% |
| State of Kansas Department of Transportation 09/01/2034 5.00% | 1.71% |
| Johnson & Miami Counties Unified School District No 230 Spring Hills 09/01/2030 5.00% | 1.68% |
| Kansas Development Finance Authority 05/01/2042 5.00% | 1.38% |
| State of Kansas Department of Transportation 09/01/2028 5.00% | 1.30% |
| Johnson County Unified School District No 229 Blue Valley 10/01/2040 4.00% | 1.27% |
| City of Lenexa KS 09/01/2033 3.00% | 1.27% |
| County of Johnson KS 09/01/2035 4.00% | 1.26% |
| Douglas County Unified School District No 497 Lawrence 09/01/2031 4.00% | 1.25% |
| Total % of Top 10 Holdings | 14.57% |
There have been no material Fund changes during the reporting period.
CHANGES IN AND DISAGREEMENTS WITH ACCOUNTANTS
There have been no changes in or disagreements with the Fund's independent accounting firm during the reporting period.
Additional information about the Fund, including its prospectus, financial information, holdings, and proxy voting information, can be found by visiting https://www.carret.com/carret-kansas-tax-exempt-bond-fund.
Distributor, ALPS Distributors, Inc.
Phone: 888.266.8787
Email: info@carret.com
If you have consented to receive a single annual or semi-annual shareholder report at a shared address you may revoke this consent by calling the Transfer Agent 888.266.8787.
CARRET KANSAS TAX-EXEMPT BOND FUND - CLASS A
ANNUAL SHAREHOLDER REPORT | September 30, 2024
Carret Kansas Tax-Exempt Bond Fund
ANNUAL SHAREHOLDER REPORT | September 30, 2024
This annual shareholder report contains important information about Carret Kansas Tax-Exempt Bond Fund - I for the period of October 1, 2023 to September 30, 2024.
You can find additional information about the Fund at https://www.carret.com/carret-kansas-tax-exempt-bond-fund. You can also request this information by contacting us at 888.266.8787.
WHAT WERE THE FUND'S COST FOR THE LAST YEAR?
(based on a hypothetical $10,000 investment)
| CLASS NAME | COST OF A $10,000 INVESTMENT | COST PAID AS A PERCENTAGE OF A $10,000 INVESTMENT |
|---|
| Carret Kansas Tax-Exempt Bond Fund - I | $50 | 0.48% |
HOW DID THE FUND PERFORM LAST YEAR?
For the year ended September 30, 2024, the Carret Kansas Tax-Exempt Bond Fund returned 8.7% versus a return of 8.4% for the Bloomberg US Municipal Bond: 7 Year Index. The performance of the Fund was driven by the overall decline in interest rates during Fiscal Year 2024. The broad uncertainty of the macro and micro economies added a notable degree of volatility to the municipal bond landscape. The Fund’s high-quality focus, premium coupon bias, and intermediate-duration structure provided a cushion against market volatility.
HOW DID THE FUND PERFORM LAST 10 YEARS?
TOTAL RETURN BASED ON $10,000 INVESTMENT
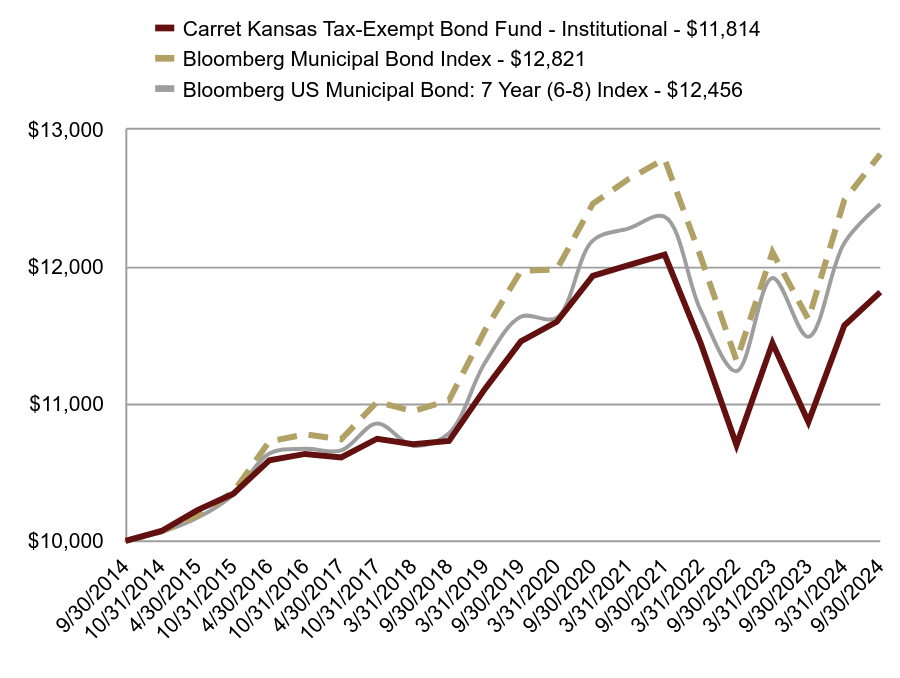
| Carret Kansas Tax-Exempt Bond Fund - Institutional - $11,814 | Bloomberg Municipal Bond Index - $12,821 | Bloomberg US Municipal Bond: 7 Year (6-8) Index - $12,456 |
|---|
| 9/30/2014 | $10,000.00 | $10,000.00 | $10,000.00 |
| 10/31/2014 | $10,072.56 | $10,068.55 | $10,064.46 |
| 4/30/2015 | $10,224.56 | $10,185.83 | $10,168.86 |
| 10/31/2015 | $10,344.23 | $10,357.26 | $10,337.47 |
| 4/30/2016 | $10,587.69 | $10,725.04 | $10,637.70 |
| 10/31/2016 | $10,634.21 | $10,777.57 | $10,671.52 |
| 4/30/2017 | $10,608.17 | $10,740.49 | $10,659.51 |
| 10/31/2017 | $10,745.14 | $11,013.84 | $10,855.82 |
| 3/31/2018 | $10,705.39 | $10,946.62 | $10,694.07 |
| 9/30/2018 | $10,728.66 | $11,025.32 | $10,785.48 |
| 3/31/2019 | $11,108.35 | $11,536.08 | $11,299.41 |
| 9/30/2019 | $11,455.29 | $11,968.05 | $11,634.19 |
| 3/31/2020 | $11,597.89 | $11,980.09 | $11,628.31 |
| 9/30/2020 | $11,932.85 | $12,457.76 | $12,190.03 |
| 3/31/2021 | $12,010.96 | $12,639.99 | $12,278.75 |
| 9/30/2021 | $12,087.96 | $12,785.15 | $12,363.55 |
| 3/31/2022 | $11,444.55 | $12,075.09 | $11,683.21 |
| 9/30/2022 | $10,698.61 | $11,314.78 | $11,237.65 |
| 3/31/2023 | $11,442.69 | $12,106.29 | $11,917.75 |
| 9/30/2023 | $10,866.59 | $11,616.19 | $11,488.13 |
| 3/31/2024 | $11,570.50 | $12,484.78 | $12,173.12 |
| 9/30/2024 | $11,814.48 | $12,820.99 | $12,455.95 |
AVERAGE ANNUAL TOTAL RETURNS
| Institutional | 1 Year | 5 Year | 10 Year |
|---|
| Carret Kansas Tax-Exempt Bond Fund - Institutional | 8.72% | 0.62% | 1.68% |
| Bloomberg Municipal Bond Index | 10.37% | 1.39% | 2.52% |
| Bloomberg US Municipal Bond: 7 Year (6-8) Index | 8.41% | 1.38% | 2.22% |
- Total Net Assets$122,987,531
- # of Portfolio Holdings166
- Portfolio Turnover Rate10%
- Advisory Fees Paid$143,877
The Fund’s past performance is not a good predictor of the Fund’s future performance. The "Average Annual Total Returns" table and graph presented above do not reflect the deduction of taxes a shareholder would pay on fund distributions or the redemption of fund shares.
Call 888.266.8787 for current month-end performance.
WHAT DID THE FUND INVEST IN?
| Value | Value |
|---|
| 5-10 Yr | 50.9% |
| > 10 Yr | 28.3% |
| 3-5 Yr | 12.5% |
| 1-3 Yr | 5.1% |
| < 1 Yr | 2.5% |
| Value | Value |
|---|
| Cash, Cash Equivalents, & Other Net Assets | 1.53% |
| General Obligation Ltd | 0.43% |
| Certificate Participation | 3.39% |
| Revenue Bonds | 35.70% |
| General Obligation Unltd | 58.95% |
| Top 10 | % |
|---|
| Allen County Unified School District No 257 09/01/2043 3.00% | 1.73% |
| State of Kansas Department of Transportation 09/01/2031 5.00% | 1.72% |
| State of Kansas Department of Transportation 09/01/2034 5.00% | 1.71% |
| Johnson & Miami Counties Unified School District No 230 Spring Hills 09/01/2030 5.00% | 1.68% |
| Kansas Development Finance Authority 05/01/2042 5.00% | 1.38% |
| State of Kansas Department of Transportation 09/01/2028 5.00% | 1.30% |
| Johnson County Unified School District No 229 Blue Valley 10/01/2040 4.00% | 1.27% |
| City of Lenexa KS 09/01/2033 3.00% | 1.27% |
| County of Johnson KS 09/01/2035 4.00% | 1.26% |
| Douglas County Unified School District No 497 Lawrence 09/01/2031 4.00% | 1.25% |
| Total % of Top 10 Holdings | 14.57% |
There have been no material Fund changes during the reporting period.
CHANGES IN AND DISAGREEMENTS WITH ACCOUNTANTS
There have been no changes in or disagreements with the Fund's independent accounting firm during the reporting period.
Additional information about the Fund, including its prospectus, financial information, holdings, and proxy voting information, can be found by visiting https://www.carret.com/carret-kansas-tax-exempt-bond-fund.
Distributor, ALPS Distributors, Inc.
Phone: 888.266.8787
Email: info@carret.com
If you have consented to receive a single annual or semi-annual shareholder report at a shared address you may revoke this consent by calling the Transfer Agent 888.266.8787.
CARRET KANSAS TAX-EXEMPT BOND FUND - INSTITUTIONAL
ANNUAL SHAREHOLDER REPORT | September 30, 2024
0001558107ast:C000159698Member2024-09-30
Annual Shareholder Report - September 30, 2024
This annual shareholder report contains important information about Clarkston Founders Fund - Founders Class for the period of October 1, 2023 to September 30, 2024.
You can find additional information about the Fund at https://www.clarkstonfunds.com/literature/clarkston-founders-fund. You can also request this information by contacting us at 844.680.6562.
WHAT WERE THE FUND'S COSTS FOR THE LAST YEAR?
(based on a hypothetical $10,000 investment)
| CLASS NAME | COST OF A $10,000 INVESTMENT | COST PAID AS A PERCENTAGE OF A $10,000 INVESTMENT |
|---|
| Clarkston Founders Fund - Founders Class | $86 | 0.80% |
HOW DID THE FUND PERFORM LAST YEAR?
During the fiscal year ended September 30, 2024, the Fund’s Founders Class earned a return of 16.16% compared to 29.33% for the Russell Midcap® Index and 35.19% for the Russell® 3000 Index.
Three largest contributors to the Fund’s performance for the period:
US Foods Holding Corp. (USFD), one of America’s largest food distribution companies, serving approximately 250,000 restaurants and foodservice operators across the country
Post Holdings, Inc. (POST), a group of consumer packaged goods businesses that operate in a manner similar to a private equity firm
Stericycle, Inc. (SRCL), a company that provides regulated waste and compliance services in the United States, Europe, and internationally
Three largest detractors from the Fund’s performance for the period:
Altice USA, Inc. (ATUS), a provider of broadband communications and video services in the United States, Canada, Puerto Rico, and the Virgin Islands offering broadband, video, telephony, and mobile services to residential and business customers
Warner Bros. Discovery, Inc. (WBD), a media and entertainment company that operates worldwide.
Dollar General Corporation (DG), a discount retailer that provides consumable products, seasonal products, and apparel in the southern, southwestern, midwestern, and eastern United States
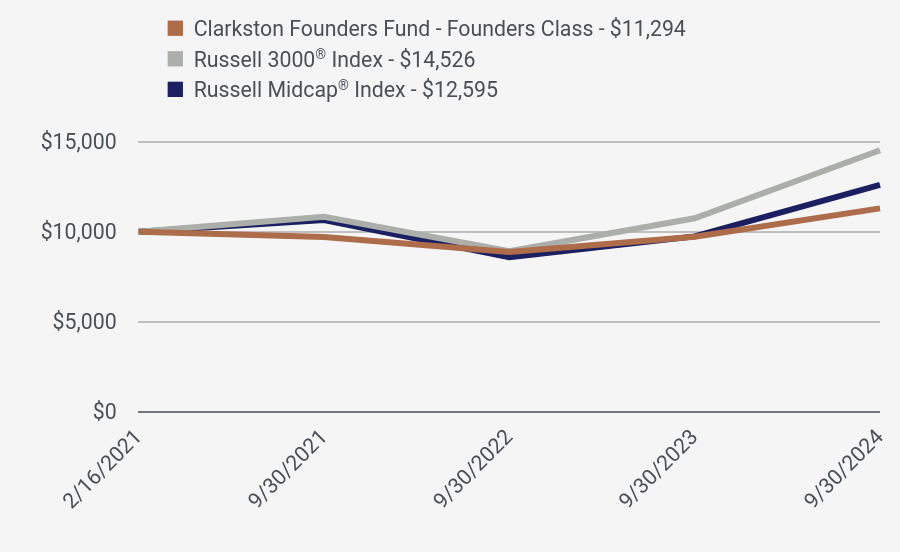
HOW DID THE FUND PERFORM SINCE INCEPTION?
TOTAL RETURN BASED ON $10,000 INVESTMENT
| Clarkston Founders Fund - Founders Class - $11,294 | Russell 3000® Index - $14,526 | Russell Midcap® Index - $12,595 |
|---|
| 2/16/2021 | $10,000.00 | $10,000.00 | $10,000.01 |
| 9/30/2021 | $9,709.86 | $10,828.58 | $10,650.09 |
| 9/30/2022 | $8,871.31 | $8,919.79 | $8,584.62 |
| 9/30/2023 | $9,723.29 | $10,744.89 | $9,738.90 |
| 9/30/2024 | $11,294.20 | $14,526.40 | $12,595.16 |
AVERAGE ANNUAL TOTAL RETURNS
| Founders | 1 Year | Since Inception |
|---|
| Clarkston Founders Fund - Founders Class (Incept. February 16, 2021) | 16.16% | 3.42% |
Russell 3000® Index | 35.19% | 10.87% |
Russell Midcap® Index | 29.33% | 6.58% |
The Fund’s past performance is not a good predictor of the Fund’s future performance. The table and graph presented above do not reflect the deduction of taxes a shareholder would pay on fund distributions or the redemption of fund shares. Call 844.680.6562 for current month-end performance.
- Total Net Assets$774,895,467
- # of Portfolio Holdings (excluding cash)21
- Portfolio Turnover Rate17%
- Advisory Fees Paid$5,035,060
There have been no material Fund changes during the reporting period.
CHANGES IN AND DISAGREEMENTS WITH ACCOUNTANTS
There have been no changes in or disagreements with the Fund's independent accounting firm during the reporting period.
AVAILABILITY OF ADDITIONAL INFORMATION
Additional information about the Fund, including its prospectus, financial information, holdings, and proxy voting information, can be found by visiting https://www.clarkstonfunds.com/literature/clarkston-founders-fund.
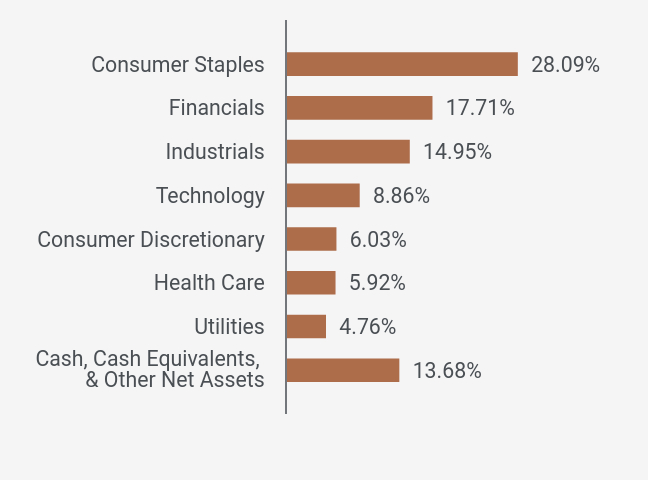
SECTOR WEIGHTINGS (as a % of Net Assets)
| Value | Value |
|---|
| Cash, Cash Equivalents, & Other Net Assets | 13.68% |
| Utilities | 4.76% |
| Health Care | 5.92% |
| Consumer Discretionary | 6.03% |
| Technology | 8.86% |
| Industrials | 14.95% |
| Financials | 17.71% |
| Consumer Staples | 28.09% |
If you have consented to receive a single annual or semi-annual shareholder report at a shared address you may revoke this consent by calling the Transfer Agent 844.680.6562.
FTSE Russell (“Russell”) is the source and owner of the trademarks, service marks and copyrights related to the Russell Indexes. Russell® is a trademark of Frank Russell Company. Neither Russell nor its licensors accept any liability for any errors or omissions in the Russell Indexes and/or Russell ratings or underlying data and no party may rely on any Russell Indexes and/or Russell ratings and/or underlying data contained in this communication. No further distribution of Russell Data is permitted without Russell’s express written consent. Russell does not promote, sponsor or endorse the content of this communication. You cannot invest directly in an index.
TOP TEN HOLDINGS (as a % of Net Assets)
| Top 10 | % |
|---|
| Clarivate PLC | 8.86% |
| Post Holdings, Inc. | 7.92% |
| US Foods Holding Corp. | 6.63% |
| Affiliated Managers Group, Inc. | 5.53% |
| GFL Environmental Inc. | 4.94% |
| Stericycle, Inc. | 4.76% |
| Molson Coors Beverage Co. | 4.38% |
| FedEx Corp. | 4.31% |
| Avantor, Inc. | 3.99% |
| Anheuser-Busch InBev SA/NV | 3.98% |
| Total % of Top 10 Holdings | 55.30% |
Clarkston Founders Fund - Founders Class : CFMDX
Annual Shareholder Report - September 30, 2024
Distributor, ALPS Distributors, Inc.
Institutional Class: CIMDX
Annual Shareholder Report - September 30, 2024
This annual shareholder report contains important information about Clarkston Founders Fund - Institutional Class for the period of October 1, 2023 to September 30, 2024.
You can find additional information about the Fund at https://www.clarkstonfunds.com/literature/clarkston-founders-fund. You can also request this information by contacting us at 844.680.6562.
WHAT WERE THE FUND'S COSTS FOR THE LAST YEAR?
(based on a hypothetical $10,000 investment)
| CLASS NAME | COST OF A $10,000 INVESTMENT | COST PAID AS A PERCENTAGE OF A $10,000 INVESTMENT |
|---|
| Clarkston Founders Fund - Institutional Class | $96 | 0.89% |
HOW DID THE FUND PERFORM LAST YEAR?
During the fiscal year ended September 30, 2024, the Fund’s Institutional Class earned a return of 16.00% compared to 29.33% for the Russell Midcap® Index and 35.19% for the Russell® 3000 Index.
Three largest contributors to the Fund’s performance for the period:
US Foods Holding Corp. (USFD), one of America’s largest food distribution companies, serving approximately 250,000 restaurants and foodservice operators across the country
Post Holdings, Inc. (POST), a group of consumer packaged goods businesses that operate in a manner similar to a private equity firm
Stericycle, Inc. (SRCL), a company that provides regulated waste and compliance services in the United States, Europe, and internationally
Three largest detractors from the Fund’s performance for the period:
Altice USA, Inc. (ATUS), a provider of broadband communications and video services in the United States, Canada, Puerto Rico, and the Virgin Islands offering broadband, video, telephony, and mobile services to residential and business customers
Warner Bros. Discovery, Inc. (WBD), a media and entertainment company that operates worldwide
Dollar General Corporation (DG), a discount retailer that provides consumable products, seasonal products, and apparel in the southern, southwestern, midwestern, and eastern United States
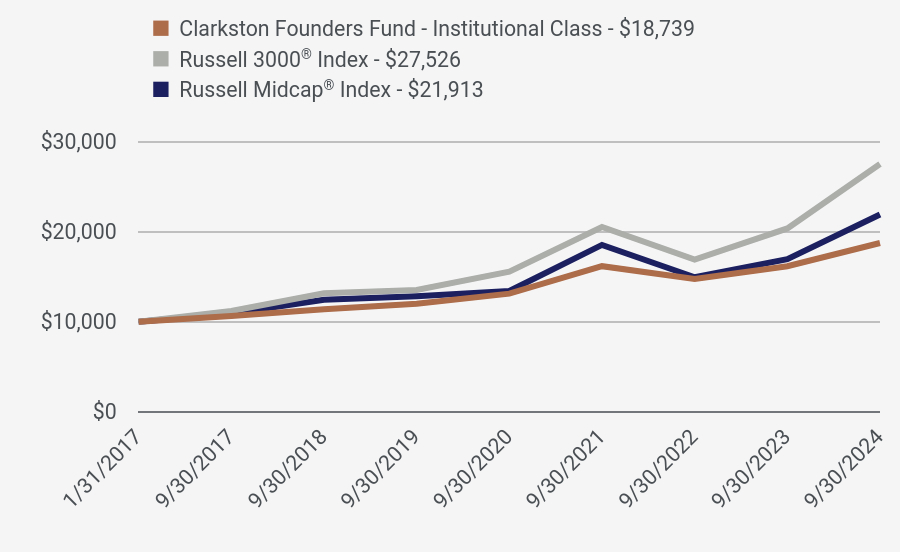
HOW DID THE FUND PERFORM SINCE INCEPTION?
TOTAL RETURN BASED ON $10,000 INVESTMENT
| Clarkston Founders Fund - Institutional Class - $18,739 | Russell 3000® Index - $27,526 | Russell Midcap® Index - $21,913 |
|---|
| 1/31/2017 | $10,000.00 | $10,000.00 | $10,000.00 |
| 9/30/2017 | $10,640.00 | $11,180.72 | $10,910.60 |
| 9/30/2018 | $11,385.78 | $13,146.27 | $12,435.94 |
| 9/30/2019 | $11,990.90 | $13,529.83 | $12,832.06 |
| 9/30/2020 | $13,110.31 | $15,559.49 | $13,416.23 |
| 9/30/2021 | $16,165.93 | $20,519.14 | $18,528.86 |
| 9/30/2022 | $14,753.59 | $16,902.16 | $14,935.38 |
| 9/30/2023 | $16,154.61 | $20,360.55 | $16,943.58 |
| 9/30/2024 | $18,738.58 | $27,526.15 | $21,912.85 |
AVERAGE ANNUAL TOTAL RETURNS
| Institutional | 1 Year | 5 Year | Since Inception |
|---|
| Clarkston Founders Fund - Institutional Class (Incept. January 31, 2017) | 16.00% | 9.34% | 8.54% |
Russell 3000® Index | 35.19% | 15.26% | 14.13% |
Russell Midcap® Index | 29.33% | 11.30% | 10.78% |
The Fund’s past performance is not a good predictor of the Fund’s future performance. The table and graph presented above do not reflect the deduction of taxes a shareholder would pay on fund distributions or the redemption of fund shares. Call 844.680.6562 for current month-end performance.
- Total Net Assets$774,895,467
- # of Portfolio Holdings (excluding cash)21
- Portfolio Turnover Rate17%
- Advisory Fees Paid$5,035,060
There have been no material Fund changes during the reporting period.
CHANGES IN AND DISAGREEMENTS WITH ACCOUNTANTS
There have been no changes in or disagreements with the Fund's independent accounting firm during the reporting period.
AVAILABILITY OF ADDITIONAL INFORMATION
Additional information about the Fund, including its prospectus, financial information, holdings, and proxy voting information, can be found by visiting https://www.clarkstonfunds.com/literature/clarkston-founders-fund.
SECTOR WEIGHTINGS (as a % of Net Assets)
| Value | Value |
|---|
| Cash, Cash Equivalents, & Other Net Assets | 13.68% |
| Utilities | 4.76% |
| Health Care | 5.92% |
| Consumer Discretionary | 6.03% |
| Technology | 8.86% |
| Industrials | 14.95% |
| Financials | 17.71% |
| Consumer Staples | 28.09% |
If you have consented to receive a single annual or semi-annual shareholder report at a shared address you may revoke this consent by calling the Transfer Agent 844.680.6562.
FTSE Russell (“Russell”) is the source and owner of the trademarks, service marks and copyrights related to the Russell Indexes. Russell® is a trademark of Frank Russell Company. Neither Russell nor its licensors accept any liability for any errors or omissions in the Russell Indexes and/or Russell ratings or underlying data and no party may rely on any Russell Indexes and/or Russell ratings and/or underlying data contained in this communication. No further distribution of Russell Data is permitted without Russell’s express written consent. Russell does not promote, sponsor or endorse the content of this communication. You cannot invest directly in an index.
TOP TEN HOLDINGS (as a % of Net Assets)
| Top 10 | % |
|---|
| Clarivate PLC | 8.86% |
| Post Holdings, Inc. | 7.92% |
| US Foods Holding Corp. | 6.63% |
| Affiliated Managers Group, Inc. | 5.53% |
| GFL Environmental Inc. | 4.94% |
| Stericycle, Inc. | 4.76% |
| Molson Coors Beverage Co. | 4.38% |
| FedEx Corp. | 4.31% |
| Avantor, Inc. | 3.99% |
| Anheuser-Busch InBev SA/NV | 3.98% |
| Total % of Top 10 Holdings | 55.30% |
Clarkston Founders Fund - Institutional Class : CIMDX
Annual Shareholder Report - September 30, 2024
Distributor, ALPS Distributors, Inc.
Institutional Class: CILGX
Annual Shareholder Report - September 30, 2024
This annual shareholder report contains important information about Clarkston Fund Institutional Class for the period of October 1, 2023 to September 30, 2024.
You can find additional information about the Fund at https://www.clarkstonfunds.com/literature/clarkston-fund. You can also request this information by contacting us at 844.680.6562.
WHAT WERE THE FUND'S COSTS FOR THE LAST YEAR?
(based on a hypothetical $10,000 investment)
| CLASS NAME | COST OF A $10,000 INVESTMENT | COST PAID AS A PERCENTAGE OF A $10,000 INVESTMENT |
|---|
| Clarkston Fund - Institutional Class | $70 | 0.64% |
HOW DID THE FUND PERFORM LAST YEAR?
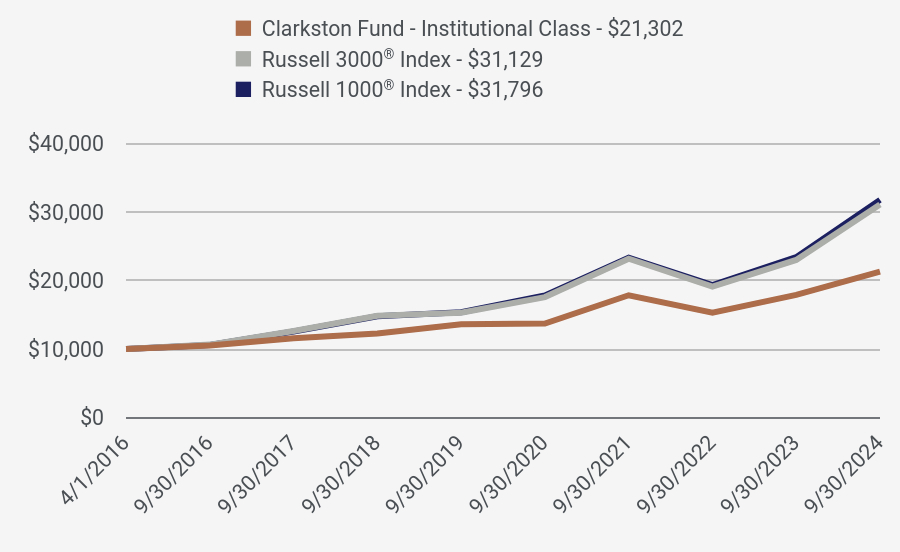
During the fiscal year ended September 30, 2024, the Fund earned a return of 18.94% compared to 35.68% for the Russell 1000® Index and 35.19% for the Russell® 3000 Index.
Three largest contributors to the Fund’s performance for the period:
US Foods Holding Corp. (USFD), one of America’s largest food distribution companies, serving approximately 250,000 restaurants and foodservice operators across the country
American Express Company (AXP), an integrated payments company offering credit card, charge card, banking, and other payment and financing products; network services; expense management products and services; and travel and lifestyle services
Affiliated Managers Group (AMG), a strategic investor and partner to a wide variety of independent investment management firms for over 30 years
Three largest detractors from the Fund’s performance for the period:
Lamb Weston Holdings, Inc. (LW), a company that engages in the production, distribution, and marketing of frozen potato products in the United States, Canada, Mexico, and internationally
Altice USA, Inc. (ATUS), a provider of broadband communications and video services in the United States, Canada, Puerto Rico, and the Virgin Islands offering broadband, video, telephony, and mobile services to residential and business customers
Warner Bros. Discovery, Inc. (WBD), a media and entertainment company that operates worldwide
HOW DID THE FUND PERFORM SINCE INCEPTION?
TOTAL RETURN BASED ON $10,000 INVESTMENT
| Clarkston Fund - Institutional Class - $21,302 | Russell 3000® Index - $31,129 | Russell 1000® Index - $31,796 |
|---|
| 4/1/2016 | $10,000.00 | $10,000.00 | $10,000.00 |
| 9/30/2016 | $10,520.00 | $10,651.67 | $10,602.18 |
| 9/30/2017 | $11,585.22 | $12,644.23 | $12,567.64 |
| 9/30/2018 | $12,279.68 | $14,867.07 | $14,800.27 |
| 9/30/2019 | $13,620.34 | $15,300.84 | $15,373.47 |
| 9/30/2020 | $13,731.26 | $17,596.17 | $17,835.24 |
| 9/30/2021 | $17,862.05 | $23,205.03 | $23,357.69 |
| 9/30/2022 | $15,301.96 | $19,114.60 | $19,336.60 |
| 9/30/2023 | $17,909.66 | $23,025.67 | $23,434.74 |
| 9/30/2024 | $21,301.83 | $31,129.23 | $31,796.21 |
AVERAGE ANNUAL TOTAL RETURNS
| Institutional | 1 Year | 5 Year | Since Inception |
|---|
| Clarkston Fund - Institutional Class (Incept. April 1, 2016) | 18.94% | 9.36% | 9.31% |
Russell 3000® Index | 35.19% | 15.26% | 14.30% |
Russell 1000® Index | 35.68% | 15.64% | 14.58% |
The Fund’s past performance is not a good predictor of the Fund’s future performance. The table and graph presented above do not reflect the deduction of taxes a shareholder would pay on fund distributions or the redemption of fund shares. Call 844.680.6562 for current month-end performance.
- Total Net Assets$167,886,810
- # of Portfolio Holdings (excluding cash)24
- Portfolio Turnover Rate23%
- Advisory Fees Paid$590,276
There have been no material Fund changes during the reporting period.
CHANGES IN AND DISAGREEMENTS WITH ACCOUNTANTS
There have been no changes in or disagreements with the Fund's independent accounting firm during the reporting period.
AVAILABILITY OF ADDITIONAL INFORMATION
Additional information about the Fund, including its prospectus, financial information, holdings, and proxy voting information, can be found by visiting https://www.clarkstonfunds.com/literature/clarkston-fund.
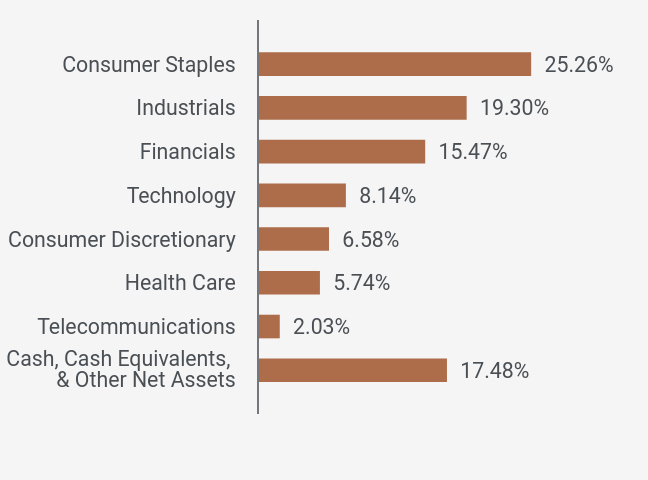
SECTOR WEIGHTINGS (as a % of Net Assets)
| Value | Value |
|---|
| Cash, Cash Equivalents, & Other Net Assets | 17.48% |
| Telecommunications | 2.03% |
| Health Care | 5.74% |
| Consumer Discretionary | 6.58% |
| Technology | 8.14% |
| Financials | 15.47% |
| Industrials | 19.30% |
| Consumer Staples | 25.26% |
If you have consented to receive a single annual or semi-annual shareholder report at a shared address you may revoke this consent by calling the Transfer Agent 844.680.6562.
FTSE Russell (“Russell”) is the source and owner of the trademarks, service marks and copyrights related to the Russell Indexes. Russell® is a trademark of Frank Russell Company. Neither Russell nor its licensors accept any liability for any errors or omissions in the Russell Indexes and/or Russell ratings or underlying data and no party may rely on any Russell Indexes and/or Russell ratings and/or underlying data contained in this communication. No further distribution of Russell Data is permitted without Russell’s express written consent. Russell does not promote, sponsor or endorse the content of this communication. You cannot invest directly in an index.
TOP TEN HOLDINGS (as a % of Net Assets)
| Top 10 | % |
|---|
| Clarivate PLC | 8.14% |
| US Foods Holding Corp. | 6.23% |
| Post Holdings, Inc. | 5.17% |
| Affiliated Managers Group, Inc. | 4.98% |
| FedEx Corp. | 4.81% |
| Anheuser-Busch InBev SA/NV | 4.34% |
| CH Robinson Worldwide, Inc. | 3.94% |
| Molson Coors Beverage Co. | 3.94% |
| Avantor, Inc. | 3.62% |
| Lamb Weston Holdings, Inc. | 3.39% |
| Total % of Top 10 Holdings | 48.56% |
Clarkston Fund - Institutional Class : CILGX
Annual Shareholder Report - September 30, 2024
Distributor, ALPS Distributors, Inc.
Annual Shareholder Report - September 30, 2024
This annual shareholder report contains important information about Clarkston Partners Fund - Founders Class for the period of October 1, 2023 to September 30, 2024.
You can find additional information about the Fund at https://www.clarkstonfunds.com/literature/clarkston-partners-fund. You can also request this information by contacting us at 844.680.6562.
WHAT WERE THE FUND'S COSTS FOR THE LAST YEAR?
(based on a hypothetical $10,000 investment)
| CLASS NAME | COST OF A $10,000 INVESTMENT | COST PAID AS A PERCENTAGE OF A $10,000 INVESTMENT |
|---|
| Clarkston Partners Fund - Founders Class | $91 | 0.85% |
HOW DID THE FUND PERFORM LAST YEAR?
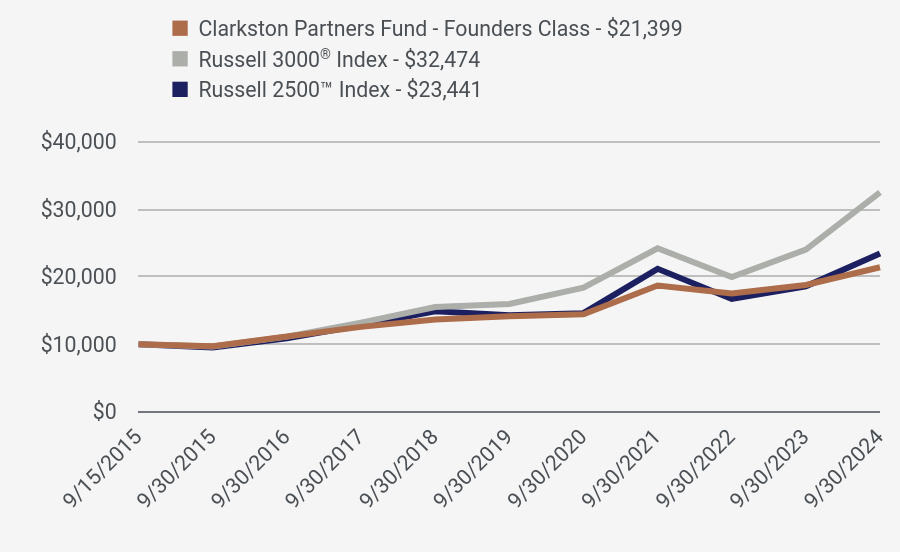
During the fiscal year ended September 30, 2024, the Fund’s Founders Class earned a return of 13.97% compared to 26.17% for the Russell 2500TMIndex and 35.19% for the Russell® 3000 Index.
Three largest contributors to the Fund’s performance for the period:
US Foods Holding Corp. (USFD), one of America’s largest food distribution companies, serving approximately 250,000 restaurants and foodservice operators across the country
Post Holdings, Inc. (POST), a group of consumer packaged goods businesses that operate in a manner similar to a private equity firm
Affiliated Managers Group, Inc. (AMG), a strategic investor and partner to a wide variety of independent investment management firms for over 30 years
Three largest detractors from the Fund’s performance for the period:
Leslie’s, Inc. (LESL), the largest direct-to-consumer brand in the U.S. pool and spa care industry
Hillenbrand, Inc. (HI), global industrial company that provides highly engineered processing equipment and services to customers around the world
Cable One, Inc. (CABO), a leading broadband communications provider to more than 1 million residential and business customers across 24 states
HOW DID THE FUND PERFORM SINCE INCEPTION?
TOTAL RETURN BASED ON $10,000 INVESTMENT
| Clarkston Partners Fund - Founders Class - $21,399 | Russell 3000® Index - $32,474 | Russell 2500™ Index - $23,441 |
|---|
| 9/15/2015 | $10,000.00 | $10,000.00 | $10,000.00 |
| 9/30/2015 | $9,700.00 | $9,665.53 | $9,498.31 |
| 9/30/2016 | $11,128.51 | $11,111.89 | $10,869.43 |
| 9/30/2017 | $12,559.25 | $13,190.54 | $12,803.44 |
| 9/30/2018 | $13,652.11 | $15,509.42 | $14,876.68 |
| 9/30/2019 | $14,127.99 | $15,961.93 | $14,275.04 |
| 9/30/2020 | $14,435.32 | $18,356.44 | $14,591.80 |
| 9/30/2021 | $18,689.92 | $24,207.63 | $21,162.24 |
| 9/30/2022 | $17,509.66 | $19,940.47 | $16,695.43 |
| 9/30/2023 | $18,775.22 | $24,020.53 | $18,579.37 |
| 9/30/2024 | $21,398.74 | $32,474.21 | $23,440.98 |
AVERAGE ANNUAL TOTAL RETURNS
| Founders | 1 Year | 5 Year | Since Inception |
|---|
| Clarkston Partners Fund - Founders Class (Incept. September 15, 2015) | 13.97% | 8.66% | 8.78% |
Russell 3000® Index | 35.19% | 15.26% | 13.91% |
| Russell 2500™ Index | 26.17% | 10.43% | 9.88% |
The Fund’s past performance is not a good predictor of the Fund’s future performance. The table and graph presented above do not reflect the deduction of taxes a shareholder would pay on fund distributions or the redemption of fund shares. Call 844.680.6562 for current month-end performance.
- Total Net Assets$1,181,212,973
- # of Portfolio Holdings (excluding cash)21
- Portfolio Turnover Rate22%
- Advisory Fees Paid$9,880,128
There have been no material Fund changes during the reporting period.
CHANGES IN AND DISAGREEMENTS WITH ACCOUNTANTS
There have been no changes in or disagreements with the Fund's independent accounting firm during the reporting period.
AVAILABILITY OF ADDITIONAL INFORMATION
Additional information about the Fund, including its prospectus, financial information, holdings, and proxy voting information, can be found by visiting https://www.clarkstonfunds.com/literature/clarkston-partners-fund.
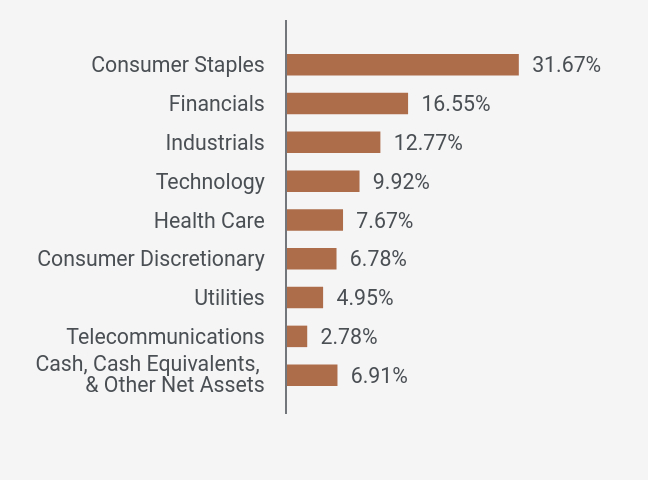
SECTOR WEIGHTINGS (as a % of Net Assets)
| Value | Value |
|---|
| Cash, Cash Equivalents, & Other Net Assets | 6.91% |
| Telecommunications | 2.78% |
| Utilities | 4.95% |
| Consumer Discretionary | 6.78% |
| Health Care | 7.67% |
| Technology | 9.92% |
| Industrials | 12.77% |
| Financials | 16.55% |
| Consumer Staples | 31.67% |
If you have consented to receive a single annual or semi-annual shareholder report at a shared address you may revoke this consent by calling the Transfer Agent 844.680.6562.
FTSE Russell (“Russell”) is the source and owner of the trademarks, service marks and copyrights related to the Russell Indexes. Russell® is a trademark of Frank Russell Company. Neither Russell nor its licensors accept any liability for any errors or omissions in the Russell Indexes and/or Russell ratings or underlying data and no party may rely on any Russell Indexes and/or Russell ratings and/or underlying data contained in this communication. No further distribution of Russell Data is permitted without Russell’s express written consent. Russell does not promote, sponsor or endorse the content of this communication. You cannot invest directly in an index.
TOP TEN HOLDINGS (as a % of Net Assets)
| Top 10 | % |
|---|
| Clarivate PLC | 9.92% |
| Post Holdings, Inc. | 8.25% |
| US Foods Holding Corp. | 7.18% |
| Affiliated Managers Group, Inc. | 6.88% |
| GFL Environmental Inc. | 5.54% |
| LPL Financial Holdings Inc. | 5.22% |
| Stericycle, Inc. | 4.95% |
| Molson Coors Beverage Co. | 4.75% |
| John Wiley & Sons, Inc. | 4.53% |
| CH Robinson Worldwide, Inc. | 4.32% |
| Total % of Top 10 Holdings | 61.54% |
Clarkston Partners Fund - Founders Class : CFSMX
Annual Shareholder Report - September 30, 2024
Distributor, ALPS Distributors, Inc.
Institutional Class: CISMX
Annual Shareholder Report - September 30, 2024
This annual shareholder report contains important information about Clarkston Partners Fund - Institutional Class for the period of October 1, 2023 to September 30, 2024.
You can find additional information about the Fund at https://www.clarkstonfunds.com/literature/clarkston-partners-fund. You can also request this information by contacting us at 844.680.6562.
WHAT WERE THE FUND'S COSTS FOR THE LAST YEAR?
(based on a hypothetical $10,000 investment)
| CLASS NAME | COST OF A $10,000 INVESTMENT | COST PAID AS A PERCENTAGE OF A $10,000 INVESTMENT |
|---|
| Clarkston Partners Fund - Institutional Class | $99 | 0.93% |
HOW DID THE FUND PERFORM LAST YEAR?
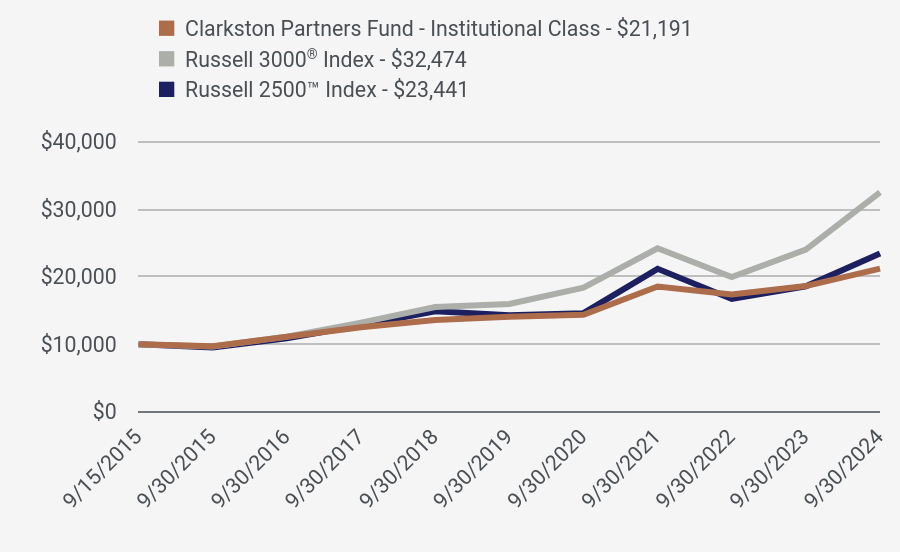
During the fiscal year ended September 30, 2024, the Fund’s Institutional Class earned a return of 13.88% compared to 26.17% for the Russell 2500TM Index and 35.19% for the Russell® 3000 Index.
Three largest contributors to the Fund’s performance for the period:
US Foods Holding Corp. (USFD), one of America’s largest food distribution companies, serving approximately 250,000 restaurants and foodservice operators across the country
Post Holdings, Inc. (POST), a group of consumer packaged goods businesses that operate in a manner similar to a private equity firm
Affiliated Managers Group, Inc. (AMG), a strategic investor and partner to a wide variety of independent investment management firms for over 30 years
Three largest detractors from the Fund’s performance for the period:
Leslie’s, Inc. (LESL), the largest direct-to-consumer brand in the U.S. pool and spa care industry
Hillenbrand, Inc. (HI), global industrial company that provides highly engineered processing equipment and services to customers around the world
Cable One, Inc. (CABO), a leading broadband communications provider to more than 1 million residential and business customers across 24 states
HOW DID THE FUND PERFORM SINCE INCEPTION?
TOTAL RETURN BASED ON $10,000 INVESTMENT
| Clarkston Partners Fund - Institutional Class - $21,191 | Russell 3000® Index - $32,474 | Russell 2500™ Index - $23,441 |
|---|
| 9/15/2015 | $10,000.00 | $10,000.00 | $10,000.00 |
| 9/30/2015 | $9,700.00 | $9,665.53 | $9,498.31 |
| 9/30/2016 | $11,103.21 | $11,111.89 | $10,869.43 |
| 9/30/2017 | $12,518.44 | $13,190.54 | $12,803.44 |
| 9/30/2018 | $13,584.55 | $15,509.42 | $14,876.68 |
| 9/30/2019 | $14,052.89 | $15,961.93 | $14,275.04 |
| 9/30/2020 | $14,343.09 | $18,356.44 | $14,591.80 |
| 9/30/2021 | $18,549.31 | $24,207.63 | $21,162.24 |
| 9/30/2022 | $17,364.47 | $19,940.47 | $16,695.43 |
| 9/30/2023 | $18,607.92 | $24,020.53 | $18,579.37 |
| 9/30/2024 | $21,191.26 | $32,474.21 | $23,440.98 |
AVERAGE ANNUAL TOTAL RETURNS
| Institutional | 1 Year | 5 Year | Since Inception |
|---|
| Clarkston Partners Fund - Institutional Class (Incept. September 15, 2015) | 13.88% | 8.56% | 8.66% |
Russell 3000® Index | 35.19% | 15.26% | 13.91% |
| Russell 2500™ Index | 26.17% | 10.43% | 9.88% |
The Fund’s past performance is not a good predictor of the Fund’s future performance. The table and graph presented above do not reflect the deduction of taxes a shareholder would pay on fund distributions or the redemption of fund shares. Call 844.680.6562 for current month-end performance.
- Total Net Assets$1,181,212,973
- # of Portfolio Holdings (excluding cash)21
- Portfolio Turnover Rate22%
- Advisory Fees Paid$9,880,128
There have been no material Fund changes during the reporting period.
CHANGES IN AND DISAGREEMENTS WITH ACCOUNTANTS
There have been no changes in or disagreements with the Fund's independent accounting firm during the reporting period.
AVAILABILITY OF ADDITIONAL INFORMATION
Additional information about the Fund, including its prospectus, financial information, holdings, and proxy voting information, can be found by visiting https://www.clarkstonfunds.com/literature/clarkston-partners-fund.
SECTOR WEIGHTINGS (as a % of Net Assets)
| Value | Value |
|---|
| Cash, Cash Equivalents, & Other Net Assets | 6.91% |
| Telecommunications | 2.78% |
| Utilities | 4.95% |
| Consumer Discretionary | 6.78% |
| Health Care | 7.67% |
| Technology | 9.92% |
| Industrials | 12.77% |
| Financials | 16.55% |
| Consumer Staples | 31.67% |
If you have consented to receive a single annual or semi-annual shareholder report at a shared address you may revoke this consent by calling the Transfer Agent 844.680.6562.
FTSE Russell (“Russell”) is the source and owner of the trademarks, service marks and copyrights related to the Russell Indexes. Russell® is a trademark of Frank Russell Company. Neither Russell nor its licensors accept any liability for any errors or omissions in the Russell Indexes and/or Russell ratings or underlying data and no party may rely on any Russell Indexes and/or Russell ratings and/or underlying data contained in this communication. No further distribution of Russell Data is permitted without Russell’s express written consent. Russell does not promote, sponsor or endorse the content of this communication. You cannot invest directly in an index.
TOP TEN HOLDINGS (as a % of Net Assets)
| Top 10 | % |
|---|
| Clarivate PLC | 9.92% |
| Post Holdings, Inc. | 8.25% |
| US Foods Holding Corp. | 7.18% |
| Affiliated Managers Group, Inc. | 6.88% |
| GFL Environmental Inc. | 5.54% |
| LPL Financial Holdings Inc. | 5.22% |
| Stericycle, Inc. | 4.95% |
| Molson Coors Beverage Co. | 4.75% |
| John Wiley & Sons, Inc. | 4.53% |
| CH Robinson Worldwide, Inc. | 4.32% |
| Total % of Top 10 Holdings | 61.54% |
Clarkston Partners Fund - Institutional Class : CISMX
Annual Shareholder Report - September 30, 2024
Distributor, ALPS Distributors, Inc.
ANNUAL SHAREHOLDER REPORT - September 30, 2024
This annual shareholder report contains important information about Hillman Value Fund for the period of October 1, 2023 to September 30, 2024.
You can find additional information about the Fund at https://hcmfunds.com/resources. You can also request this information by contacting us at 1-855-400-5944.
This report describes changes to the Fund that occurred during the September 30, 2024 annual reporting period.
What were the Fund’s cost for the last year?
(based on a hypothetical $10,000 investment)
| FUND NAME | COST OF A $10,000 INVESTMENT | COST PAID AS A PERCENTAGE OF A $10,000 INVESTMENT |
|---|
| Hillman Value Fund | $106 | 0.95% |
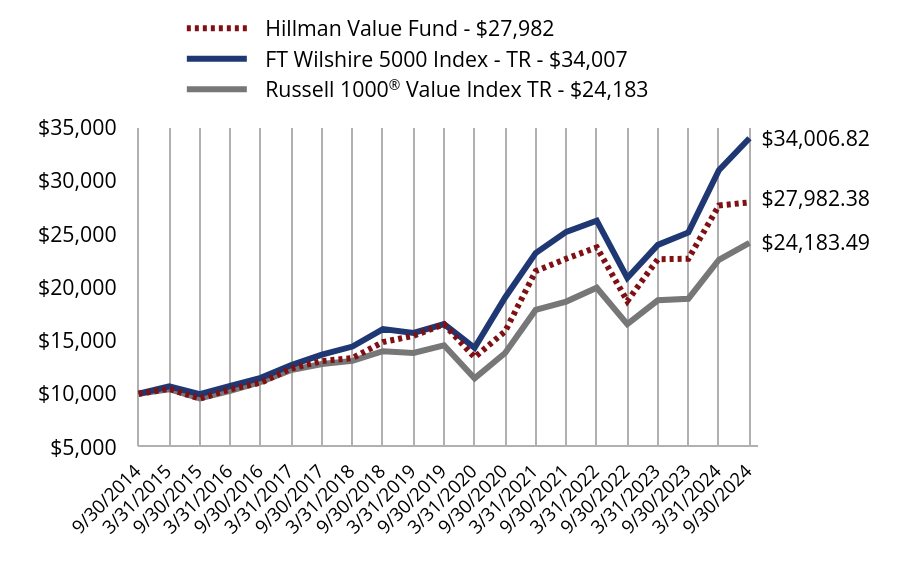
How has the Fund performed last 10 years?
TOTAL RETURN BASED ON $10,000 INVESTMENT
| Hillman Value Fund - $27,982 | FT Wilshire 5000 Index - TR - $34,007 | Russell 1000® Value Index TR - $24,183 |
|---|
| 9/30/2014 | $10,000.00 | $10,000.00 | $10,000.00 |
| 3/31/2015 | $10,463.65 | $10,695.82 | $10,422.23 |
| 9/30/2015 | $9,538.33 | $9,965.91 | $9,557.63 |
| 3/31/2016 | $10,414.56 | $10,724.02 | $10,261.64 |
| 9/30/2016 | $11,034.76 | $11,495.06 | $11,105.49 |
| 3/31/2017 | $12,371.27 | $12,692.76 | $12,234.24 |
| 9/30/2017 | $13,065.76 | $13,670.66 | $12,784.94 |
| 3/31/2018 | $13,352.97 | $14,433.47 | $13,084.25 |
| 9/30/2018 | $14,855.70 | $16,076.63 | $13,993.12 |
| 3/31/2019 | $15,441.16 | $15,715.80 | $13,826.72 |
| 9/30/2019 | $16,532.17 | $16,543.25 | $14,552.94 |
| 3/31/2020 | $13,420.29 | $14,311.24 | $11,452.89 |
| 9/30/2020 | $15,859.78 | $19,047.95 | $13,821.68 |
| 3/31/2021 | $21,518.27 | $23,218.15 | $17,876.53 |
| 9/30/2021 | $22,685.40 | $25,210.39 | $18,660.91 |
| 3/31/2022 | $23,757.17 | $26,258.82 | $19,962.50 |
| 9/30/2022 | $18,703.53 | $20,881.52 | $16,540.48 |
| 3/31/2023 | $22,637.92 | $23,988.01 | $18,782.01 |
| 9/30/2023 | $22,686.64 | $25,157.50 | $18,928.63 |
| 3/31/2024 | $27,689.42 | $31,007.29 | $22,588.76 |
| 9/30/2024 | $27,982.38 | $34,006.82 | $24,183.49 |
How did the Fund perform last year?
For the year ended September 30, 2024, the Hillman Value Fund returned 23.34% versus a return of 27.76% for the Russell 1000 Value Total Return Index. The Fund benefitted from strong performance in the Information Technology, Communication Services, and Financials Sectors, while investments in the Industrials and Health Care Sectors weighed on performance. The premiums generated from option writing nominally benefitted performance. The long-term pursuit of outperformance requires variability around the index, which necessarily includes periods of underperformance. It is our view that investment in enterprises which we believe possess sustainable competitive advantages, coupled with adherence to our fundamentally sound valuation discipline, should work well over the long term.
AVERAGE ANNUAL TOTAL RETURNS
| Fund | 1 Year | 5 Year | 10 Year |
|---|
| Hillman Value Fund | 23.34% | 11.10% | 10.84% |
| FT Wilshire 5000 Index - TR | 35.18% | 15.50% | 13.02% |
Russell 1000® Value Index TR | 27.76% | 10.69% | 9.23% |
- Total Net Assets$229,141,646
- # of Portfolio Holdings39
- Portfolio Turnover Rate35%
- Advisory Fees Paid$1,517,153
The Fund’s past performance is not a good predictor of the Fund’s future performance. The "Average Annual Total Return" table and graph presented above do not reflect the deduction of taxes a shareholder would pay on fund distributions or the redemption of fund shares.
Call 1-855-400-5994 for current month-end performance.
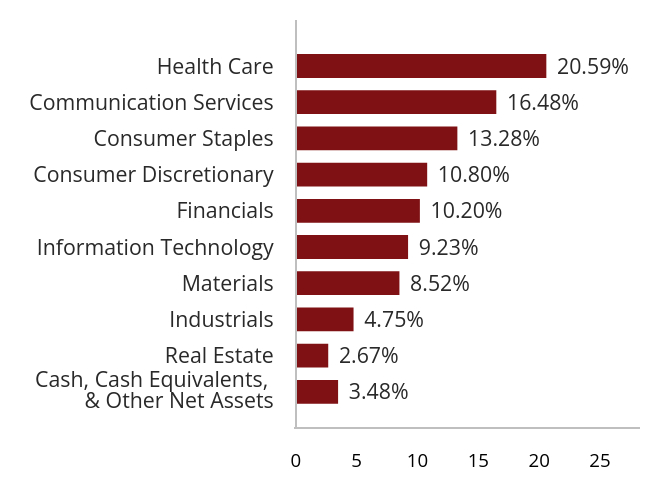
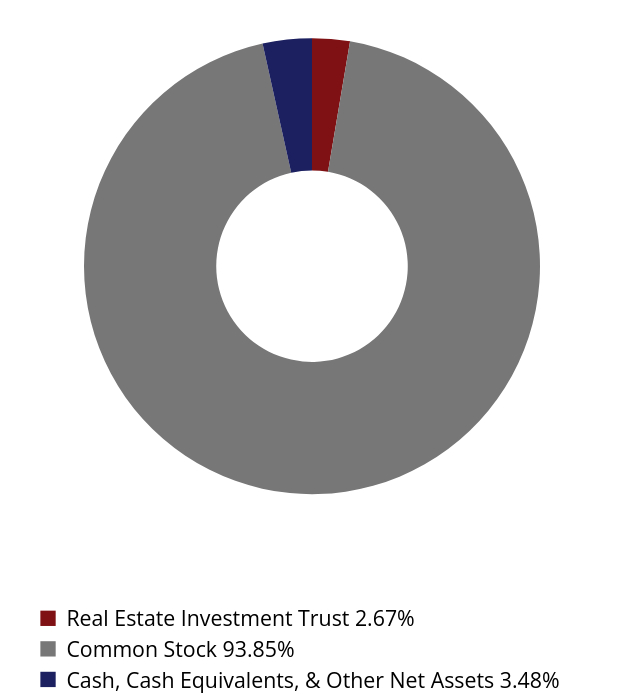
What did the Fund invest in?
| Value | Value |
|---|
| Cash, Cash Equivalents, & Other Net Assets | 3.48% |
| Real Estate | 2.67% |
| Industrials | 4.75% |
| Materials | 8.52% |
| Information Technology | 9.23% |
| Financials | 10.20% |
| Consumer Discretionary | 10.80% |
| Consumer Staples | 13.28% |
| Communication Services | 16.48% |
| Health Care | 20.59% |
| Value | Value |
|---|
| Real Estate Investment Trust | 2.67% |
| Common Stock | 93.85% |
| Cash, Cash Equivalents, & Other Net Assets | 3.48% |
| Top 10 | % |
|---|
| Bristol-Myers Squibb Co. | 3.48% |
| US Bancorp | 3.11% |
| AT&T, Inc. | 2.98% |
| DuPont de Nemours, Inc. | 2.95% |
| Campbell Soup Co. | 2.94% |
| NIKE, Inc. | 2.91% |
| Warner Bros Discovery, Inc. | 2.91% |
| International Flavors & Fragrances, Inc. | 2.88% |
| Pfizer, Inc. | 2.79% |
| Walt Disney Co. | 2.73% |
| Total % of Top 10 Holdings | 29.68% |
This is a summary of certain changes to the Fund since February 1, 2024. For more complete information, you may review the Fund’s prospectus, dated February 1, 2024, at https://hcmfunds.com/resources or upon request at 1-855-400-5944 or info@hillmancapital.com.
Effective February 1, 2024, the Fund's management fee was reduced to 0.70%. Prior to February 1, 2024, the management fee was 0.85%.
Changes in and Disagreements with Accountants
There have been no changes in or disagreements with the Fund's independent accounting firm during the reporting period.
Availability of Additional Information
Additional information about the Fund, including its prospectus, financial information, holdings, and proxy voting information, can be found by visiting https://hcmfunds.com/resources.
If you have consented to receive a single annual or semi-annual shareholder report at a shared address you may revoke this consent by calling the Transfer Agent at 1-855-400-5944.
Hillman Value Fund — HCMAX
ANNUAL SHAREHOLDER REPORT - September 30, 2024
Distributor, ALPS Distributors, Inc.
SEVEN CANYONS STRATEGIC GLOBAL FUND
Annual Shareholder Report - September 30, 2024
This annual shareholder report contains important information about Seven Canyons Strategic Global Fund - Investor for the period of October 1, 2023 to September 30, 2024.
You can find additional information about the Fund at https://sevencanyonsadvisors.com/investor-reports. You can also request this information by contacting us at
833-722-6966.
This report describes changes to the Fund that occurred during the September 30, 2024 annual reporting period.
WHAT WERE THE FUND’S COST FOR LAST YEAR?
(based on a hypothetical $10,000 investment)
| CLASS NAME | COST OF A $10,000 INVESTMENT | COST PAID AS A PERCENTAGE OF A $10,000 INVESTMENT |
|---|
| Seven Canyons Strategic Global Fund - Investor | $154 | 1.40% |
HOW DID THE FUND PERFORM LAST YEAR?
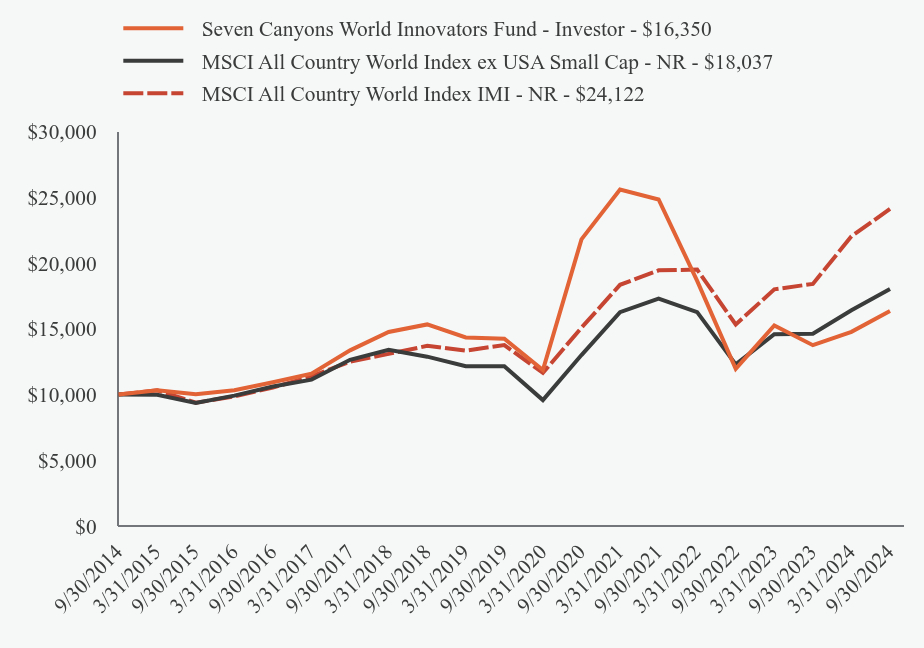
The Seven Canyons Strategic Global Fund - Investor Fund returned 19.45% for the 12 months ended September 30, 2024. This is in contrast to the S&P 500 Total Return Index, which had a 36.35% return for the same time period. Please see below tables for additional indexes.
The Fund slightly underperformed the benchmark during the year. The main cause of underperformance came from the Fund's underweight in US stocks – 51% of the benchmark weight is in US assets, compared to only 14% of the fund portfolio. The Fund's US stock picks actually outperformed the benchmark’s, but the Fund's general underweight in this strong geography led to a large disparity in the Fund’s relative performance to the bench. At fiscal year end, we believe current valuations in US markets are extremely elevated relative to similar companies in international markets, which led the decision for the Fund to remain underweight in US stocks.
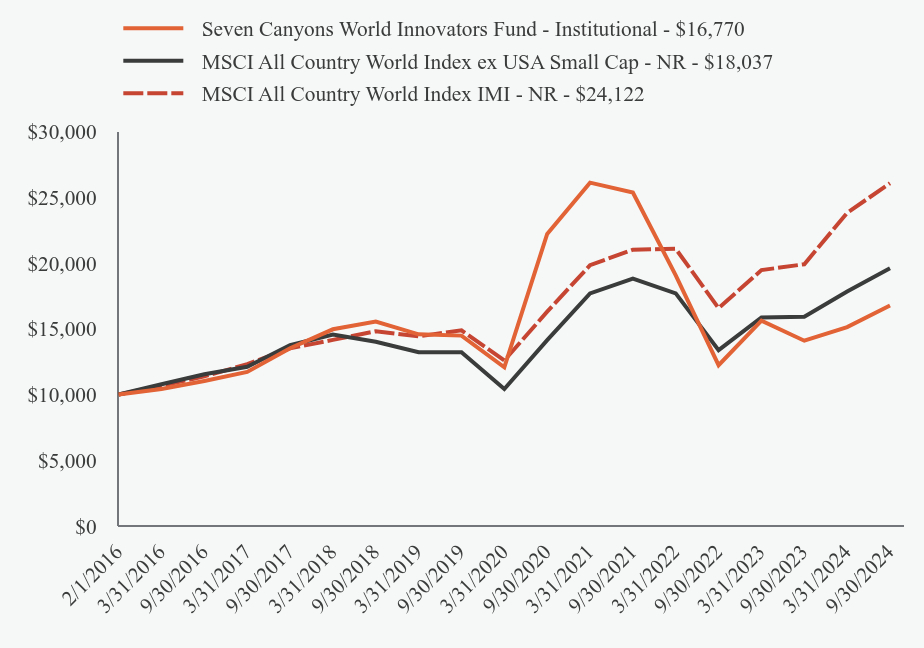
HOW DID THE FUND PERFORM LAST 10 YEARS?
TOTAL RETURN BASED ON $10,000 INVESTMENT
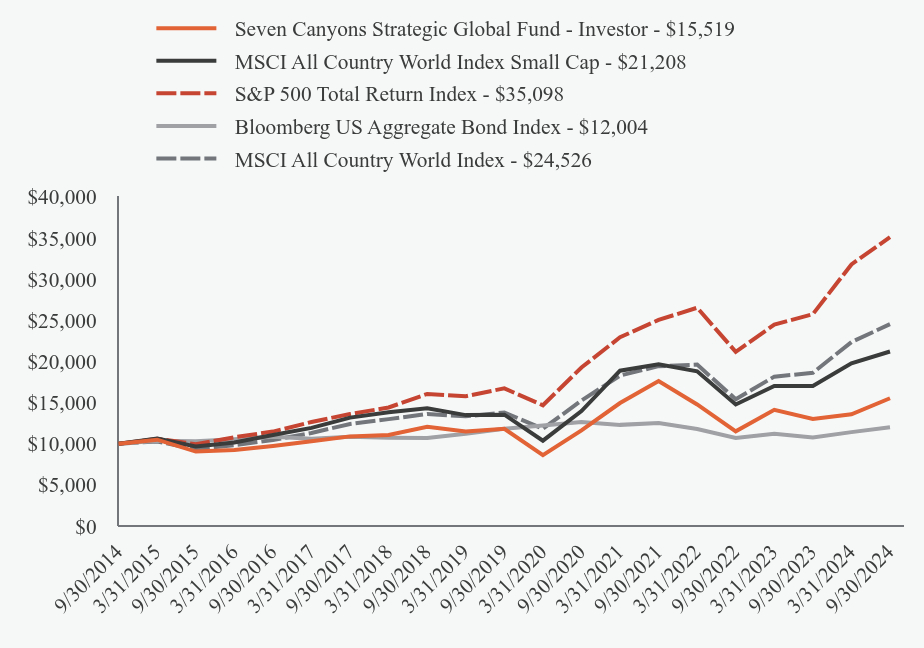
| Seven Canyons Strategic Global Fund - Investor - $15,519 | MSCI All Country World Index Small Cap - $21,208 | S&P 500 Total Return Index - $35,098 | Bloomberg US Aggregate Bond Index - $12,004 | MSCI All Country World Index - $24,526 |
|---|
| 9/30/2014 | $10,000.00 | $10,000.00 | $10,000.00 | $10,000.00 | $10,000.00 |
| 3/31/2015 | $10,488.12 | $10,621.56 | $10,593.00 | $10,342.99 | $10,272.87 |
| 9/30/2015 | $9,046.27 | $9,671.71 | $9,938.54 | $10,294.08 | $9,334.43 |
| 3/31/2016 | $9,231.89 | $10,143.17 | $10,781.85 | $10,545.74 | $9,827.24 |
| 9/30/2016 | $9,714.02 | $11,045.76 | $11,472.09 | $10,828.61 | $10,450.58 |
| 3/31/2017 | $10,296.40 | $11,918.05 | $12,633.34 | $10,592.20 | $11,305.41 |
| 9/30/2017 | $10,888.79 | $13,169.35 | $13,606.99 | $10,836.47 | $12,399.40 |
| 3/31/2018 | $11,063.13 | $13,833.37 | $14,400.98 | $10,719.63 | $12,983.85 |
| 9/30/2018 | $12,045.66 | $14,311.24 | $16,044.04 | $10,704.69 | $13,611.40 |
| 3/31/2019 | $11,489.86 | $13,474.05 | $15,768.56 | $11,199.93 | $13,321.57 |
| 9/30/2019 | $11,803.49 | $13,531.33 | $16,726.54 | $11,806.86 | $13,799.15 |
| 3/31/2020 | $8,611.92 | $10,366.25 | $14,668.25 | $12,200.51 | $11,822.21 |
| 9/30/2020 | $11,614.43 | $13,967.18 | $19,260.47 | $12,631.53 | $15,240.21 |
| 3/31/2021 | $14,938.53 | $18,868.13 | $22,934.04 | $12,287.16 | $18,277.12 |
| 9/30/2021 | $17,614.25 | $19,638.17 | $25,039.55 | $12,518.46 | $19,421.46 |
| 3/31/2022 | $14,771.73 | $18,802.37 | $26,522.27 | $11,776.98 | $19,607.46 |
| 9/30/2022 | $11,507.93 | $14,767.59 | $21,165.40 | $10,690.82 | $15,409.06 |
| 3/31/2023 | $14,121.62 | $17,003.09 | $24,472.49 | $11,213.64 | $18,149.10 |
| 9/30/2023 | $12,992.48 | $17,018.64 | $25,740.81 | $10,759.71 | $18,614.54 |
| 3/31/2024 | $13,577.81 | $19,776.18 | $31,785.18 | $11,404.06 | $22,350.79 |
| 9/30/2024 | $15,519.37 | $21,207.95 | $35,097.98 | $12,004.45 | $24,525.71 |
AVERAGE ANNUAL TOTAL RETURNS
| Investor | 1 Year | 5 Year | 10 Year |
|---|
| Seven Canyons Strategic Global Fund - Investor | 19.45% | 5.63% | 4.49% |
| MSCI All Country World Index Small Cap | 24.62% | 9.40% | 7.81% |
| S&P 500 Total Return Index | 36.35% | 15.98% | 13.38% |
| Bloomberg US Aggregate Bond Index | 11.57% | 0.33% | 1.84% |
| MSCI All Country World Index | 31.76% | 12.19% | 9.39% |
- Total Net Assets$14,230,052
- # of Portfolio Holdings61
- Portfolio Turnover Rate88%
- Advisory Fees Paid$5,379
The Fund’s past performance is not a good predictor of the Fund’s future performance. The "Average Annual Total Returns" table and graph presented above do not reflect the deduction of taxes a shareholder would pay on fund distributions or the redemption of fund shares.
Call 833-722-6966 for current month-end performance.
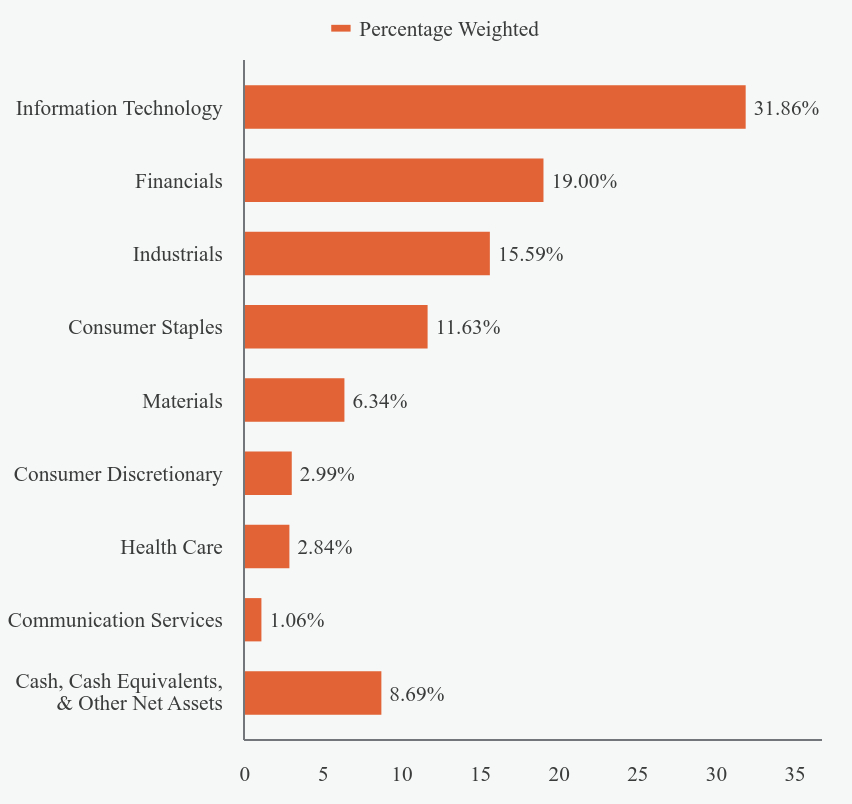
WHAT DID THE FUND INVEST IN?
SECTOR WEIGHTINGS (as a % of Net Assets)
| Value | Value |
|---|
| Cash, Cash Equivalents, & Other Net Assets | 8.69% |
| Communication Services | 1.06% |
| Health Care | 2.84% |
| Consumer Discretionary | 2.99% |
| Materials | 6.34% |
| Consumer Staples | 11.63% |
| Industrials | 15.59% |
| Financials | 19.00% |
| Information Technology | 31.86% |
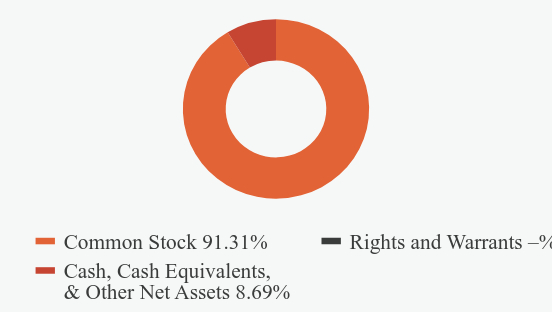
ASSET WEIGHTINGS
(as a % of Net Assets)
| Value | Value |
|---|
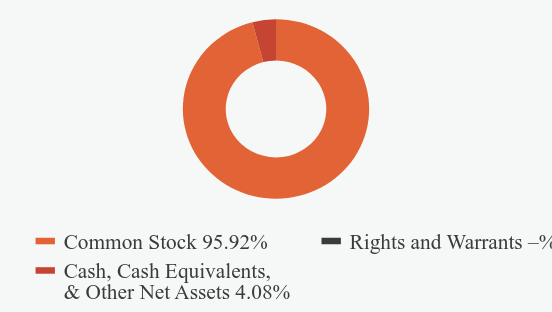
| Common Stock | 91.31% |
| Rights and Warrants | -% |
| Cash, Cash Equivalents, & Other Net Assets | 8.69% |
TOP TEN HOLDINGS
(as a % of Net Assets)
| Top 10 | % |
|---|
| State Street Institutional US Government Money Market Fund, Investor Class | 6.67% |
| flatexDEGIRO AG | 6.32% |
| JDC Group AG | 4.47% |
| ReposiTrack, Inc. | 4.23% |
| Elixirr International PLC | 4.13% |
| Blackline Safety Corp. | 3.98% |
| Kitwave Group PLC | 3.82% |
| Climb Global Solutions, Inc. | 2.73% |
| System Support, Inc. | 2.69% |
| IPD Group, Ltd. | 2.52% |
| Total % of Top 10 Holdings | 41.56% |
This is a summary of certain planned changes to the Fund since October 1, 2023. For more complete information, you may review the Fund’s next prospectus, which we expect to be available by January 28, 2025, at https://sevencanyonsadvisors.com/investor-reports or upon request at 1-833‐722‐6966.
On November 21, 2024, the Board of Trustees (the “Board”) of ALPS Series Trust (the “Trust”), based upon the recommendation of Seven Canyons Advisors, LLC, the investment adviser to the Funds, approved the proposed reorganization of the Seven Canyons Strategic Global Fund and the Seven Canyons World Innovators Fund.
CHANGES IN AND DISAGREEMENTS WITH ACCOUNTANTS
There have been no changes in or disagreements with the Fund's independent accounting firm during the reporting period.
AVAILABILITY OF ADDITIONAL INFORMATION
Additional information about the Fund, including its prospectus, financial information, holdings, and proxy voting information, can be found by visiting https://sevencanyonsadvisors.com/investor-reports.
If you have consented to receive a single annual or semi-annual shareholder report at a shared address you may revoke this consent by calling the Transfer Agent
833-722-6966.
SEVEN CANYONS STRATEGIC GLOBAL FUND - Investor : WASIX
Annual Shareholder Report - September 30, 2024
Distributor, ALPS Distributors, Inc.
SEVEN CANYONS WORLD INNOVATORS FUND
Annual Shareholder Report - September 30, 2024
This annual shareholder report contains important information about Seven Canyons World Innovators Fund - Institutional for the period of October 1, 2023 to September 30, 2024.
You can find additional information about the Fund at https://sevencanyonsadvisors.com/investor-reports. You can also request this information by contacting us at
833-722-6966.
This report describes changes to the Fund that occurred during the September 30, 2024 annual reporting period.
WHAT WERE THE FUND’S COST FOR LAST YEAR?
(based on a hypothetical $10,000 investment)
| CLASS NAME | COST OF A $10,000 INVESTMENT | COST PAID AS A PERCENTAGE OF A $10,000 INVESTMENT |
|---|
| Seven Canyons World Innovators Fund - Institutional | $172 | 1.57% |
HOW DID THE FUND PERFORM LAST YEAR?
The Seven Canyons World Innovators Fund - Institutional Fund returned 18.95% for the 12 months ended September 30, 2024. This is in contrast to the MSCI All Country World Index ex USA Small Cap - NR, which had a 23.25% return for the same time period. Please see below tables for additional indexes.
In 2024 the Fund did not perform as we had hoped, losing to the bench by 5%. The underperformance can largely be attributed to the Fund's Japan exposure and to the fact that small- and micro-cap companies were generally out of favor when compared to large- and mid-cap stocks.
The Fund's underperformance came almost exclusively from the Fund's sizable (14% weight) Japan exposure, which drastically underperformed the Japan benchmark. The Fund's exposure included fast-growing software companies that underperformed the market in the rising rate environment.
Unfavorable conditions for small- and micro-cap stocks hurt the Fund in many areas where the Fund transacts. The Fund invests in companies at the smallest-cap end of the benchmark. The Fund considers these companies to be fundamentally sound and priced attractively, but the market has not yet recognized their performance, as reflected in their stock prices.
HOW DID THE FUND PERFORM SINCE INCEPTION?
TOTAL RETURN BASED ON $10,000 INVESTMENT
| Seven Canyons World Innovators Fund - Institutional - $16,770 | MSCI All Country World Index ex USA Small Cap - NR - $18,037 | MSCI All Country World Index IMI - NR - $24,122 |
|---|
| 2/1/2016 | $10,000.00 | $10,000.00 | $10,000.00 |
| 3/31/2016 | $10,416.19 | $10,788.86 | $10,669.23 |
| 9/30/2016 | $11,037.63 | $11,540.55 | $11,382.39 |
| 3/31/2017 | $11,722.18 | $12,111.63 | $12,309.20 |
| 9/30/2017 | $13,526.96 | $13,755.35 | $13,514.07 |
| 3/31/2018 | $14,965.20 | $14,571.66 | $14,159.41 |
| 9/30/2018 | $15,559.70 | $14,011.65 | $14,815.14 |
| 3/31/2019 | $14,582.23 | $13,220.67 | $14,426.52 |
| 9/30/2019 | $14,483.76 | $13,222.40 | $14,885.91 |
| 3/31/2020 | $12,078.22 | $10,420.92 | $12,590.48 |
| 9/30/2020 | $22,221.40 | $14,143.71 | $16,310.20 |
| 3/31/2021 | $26,121.91 | $17,696.59 | $19,839.93 |
| 9/30/2021 | $25,369.99 | $18,819.98 | $21,026.74 |
| 3/31/2022 | $19,061.76 | $17,702.46 | $21,089.61 |
| 9/30/2022 | $12,231.78 | $13,374.69 | $16,572.50 |
| 3/31/2023 | $15,617.97 | $15,866.02 | $19,468.96 |
| 9/30/2023 | $14,097.64 | $15,916.59 | $19,913.68 |
| 3/31/2024 | $15,134.23 | $17,847.62 | $23,825.73 |
| 9/30/2024 | $16,769.74 | $19,617.70 | $26,078.75 |
AVERAGE ANNUAL TOTAL RETURNS
| Institutional | 1 Year | 5 Year | Since Inception |
|---|
| Seven Canyons World Innovators Fund - Institutional | 18.95% | 2.97% | 6.15% |
| MSCI All Country World Index ex USA Small Cap - NR | 23.25% | 8.21% | 8.09% |
| MSCI All Country World Index IMI - NR | 30.96% | 11.87% | 11.70% |
- Total Net Assets$48,485,282
- # of Portfolio Holdings63
- Portfolio Turnover Rate70%
- Advisory Fees Paid$490,211
The Fund’s past performance is not a good predictor of the Fund’s future performance. The "Average Annual Total Returns" table and graph presented above do not reflect the deduction of taxes a shareholder would pay on fund distributions or the redemption of fund shares.
Call 833-722-6966 for current month-end performance.
WHAT DID THE FUND INVEST IN?
SECTOR WEIGHTINGS (as a % of Net Assets)
| Value | Value |
|---|
| Cash, Cash Equivalents, & Other Net Assets | 4.08% |
| Real Estate | 0.83% |
| Communication Services | 2.62% |
| Materials | 2.66% |
| Health Care | 3.11% |
| Consumer Discretionary | 3.27% |
| Industrials | 9.79% |
| Consumer Staples | 12.00% |
| Financials | 22.87% |
| Information Technology | 38.77% |
ASSET WEIGHTINGS
(as a % of Net Assets)
| Value | Value |
|---|
| Common Stock | 95.92% |
| Rights and Warrants | -% |
| Cash, Cash Equivalents, & Other Net Assets | 4.08% |
TOP TEN HOLDINGS
(as a % of Net Assets)
| Top 10 | % |
|---|
| JDC Group AG | 7.56% |
| flatexDEGIRO AG | 6.32% |
| Blackline Safety Corp. | 4.57% |
| Kitwave Group PLC | 4.38% |
| Elixirr International PLC | 3.75% |
| Catapult Group International, Ltd. | 3.44% |
| SmartCraft ASA | 3.17% |
| Midi Utama Indonesia Tbk PT | 2.52% |
| M&A Research Institute Holdings, Inc. | 2.36% |
| Freee KK | 2.29% |
| Total % of Top 10 Holdings | 40.36% |
This is a summary of certain planned changes to the Fund since October 1, 2023. For more complete information, you may review the Fund’s next prospectus, which we expect to be available by January 28, 2025, at https://sevencanyonsadvisors.com/investor-reports or upon request at 1-833‐722‐6966.
Effective February 1, 2024, the Fund's Institutional Class expense limitation was amended to 1.60% (previously 1.55%).
On November 21, 2024, the Board of Trustees (the “Board”) of ALPS Series Trust (the “Trust”), based upon the recommendation of Seven Canyons Advisors, LLC, the investment adviser to the Funds, approved the proposed reorganization of the Seven Canyons Strategic Global Fund and the Seven Canyons World Innovators Fund.
CHANGES IN AND DISAGREEMENTS WITH ACCOUNTANTS
There have been no changes in or disagreements with the Fund's independent accounting firm during the reporting period.
AVAILABILITY OF ADDITIONAL INFORMATION
Additional information about the Fund, including its prospectus, financial information, holdings, and proxy voting information, can be found by visiting https://sevencanyonsadvisors.com/investor-reports.
If you have consented to receive a single annual or semi-annual shareholder report at a shared address you may revoke this consent by calling the Transfer Agent
833-722-6966.
SEVEN CANYONS WORLD INNOVATORS FUND - Institutional : WIGTX
Annual Shareholder Report - September 30, 2024
Distributor, ALPS Distributors, Inc.
SEVEN CANYONS WORLD INNOVATORS FUND
Annual Shareholder Report - September 30, 2024
This annual shareholder report contains important information about Seven Canyons World Innovators Fund - Investor for the period of October 1, 2023 to September 30, 2024.
You can find additional information about the Fund at https://sevencanyonsadvisors.com/investor-reports. You can also request this information by contacting us at
833-722-6966.
This report describes changes to the Fund that occurred during the September 30, 2024 annual reporting period.
WHAT WERE THE FUND’S COST FOR LAST YEAR?
(based on a hypothetical $10,000 investment)
| CLASS NAME | COST OF A $10,000 INVESTMENT | COST PAID AS A PERCENTAGE OF A $10,000 INVESTMENT |
|---|
| Seven Canyons World Innovators Fund - Investor | $188 | 1.72% |
HOW DID THE FUND PERFORM LAST YEAR?
The Seven Canyons World Innovators Fund - Investor Fund returned 18.86% for the 12 months ended September 30, 2024. This is in contrast to the MSCI All Country World Index ex USA Small Cap - NR, which had a 23.25% return for the same time period. Please see below tables for additional indexes.
In 2024 the Fund did not perform as we had hoped, losing to the bench by 5%. The underperformance can largely be attributed to the Fund's Japan exposure and to the fact that small- and micro-cap companies were generally out of favor when compared to large- and mid-cap stocks.
The Fund's underperformance came almost exclusively from the Fund's sizable (14% weight) Japan exposure, which drastically underperformed the Japan benchmark. The Fund's exposure included fast-growing software companies that underperformed the market in the rising rate environment.
Unfavorable conditions for small- and micro-cap stocks hurt the Fund in many areas where the Fund transacts. The Fund invests in companies at the smallest-cap end of the benchmark. The Fund considers these companies to be fundamentally sound and priced attractively, but the market has not yet recognized their performance, as reflected in their stock prices.
HOW DID THE FUND PERFORM LAST 10 YEARS?
TOTAL RETURN BASED ON $10,000 INVESTMENT
| Seven Canyons World Innovators Fund - Investor - $16,350 | MSCI All Country World Index ex USA Small Cap - NR - $18,037 | MSCI All Country World Index IMI - NR - $24,122 |
|---|
| 9/30/2014 | $10,000.00 | $10,000.00 | $10,000.00 |
| 3/31/2015 | $10,325.69 | $9,979.98 | $10,318.96 |
| 9/30/2015 | $10,032.23 | $9,358.47 | $9,379.08 |
| 3/31/2016 | $10,332.12 | $9,919.68 | $9,868.76 |
| 9/30/2016 | $10,931.90 | $10,610.80 | $10,528.41 |
| 3/31/2017 | $11,593.97 | $11,135.88 | $11,385.69 |
| 9/30/2017 | $13,361.84 | $12,647.17 | $12,500.16 |
| 3/31/2018 | $14,765.27 | $13,397.72 | $13,097.08 |
| 9/30/2018 | $15,335.51 | $12,882.82 | $13,703.62 |
| 3/31/2019 | $14,348.67 | $12,155.57 | $13,344.15 |
| 9/30/2019 | $14,241.66 | $12,157.16 | $13,769.08 |
| 3/31/2020 | $11,862.99 | $9,581.37 | $11,645.86 |
| 9/30/2020 | $21,807.09 | $13,004.24 | $15,086.51 |
| 3/31/2021 | $25,602.60 | $16,270.89 | $18,351.42 |
| 9/30/2021 | $24,842.71 | $17,303.77 | $19,449.18 |
| 3/31/2022 | $18,644.58 | $16,276.29 | $19,507.33 |
| 9/30/2022 | $11,956.98 | $12,297.17 | $15,329.12 |
| 3/31/2023 | $15,254.66 | $14,587.79 | $18,008.28 |
| 9/30/2023 | $13,755.71 | $14,634.29 | $18,419.63 |
| 3/31/2024 | $14,770.39 | $16,409.75 | $22,038.18 |
| 9/30/2024 | $16,350.04 | $18,037.23 | $24,122.16 |
AVERAGE ANNUAL TOTAL RETURNS
| Investor | 1 Year | 5 Year | 10 Year |
|---|
| Seven Canyons World Innovators Fund - Investor | 18.86% | 2.80% | 5.04% |
| MSCI All Country World Index ex USA Small Cap - NR | 23.25% | 8.21% | 6.08% |
| MSCI All Country World Index IMI - NR | 30.96% | 11.87% | 9.20% |
- Total Net Assets$48,485,282
- # of Portfolio Holdings63
- Portfolio Turnover Rate70%
- Advisory Fees Paid$490,211
The Fund’s past performance is not a good predictor of the Fund’s future performance. The "Average Annual Total Returns" table and graph presented above do not reflect the deduction of taxes a shareholder would pay on fund distributions or the redemption of fund shares.
Call 833-722-6966 for current month-end performance.
WHAT DID THE FUND INVEST IN?
SECTOR WEIGHTINGS (as a % of Net Assets)
| Value | Value |
|---|
| Cash, Cash Equivalents, & Other Net Assets | 4.08% |
| Real Estate | 0.83% |
| Communication Services | 2.62% |
| Materials | 2.66% |
| Health Care | 3.11% |
| Consumer Discretionary | 3.27% |
| Industrials | 9.79% |
| Consumer Staples | 12.00% |
| Financials | 22.87% |
| Information Technology | 38.77% |
ASSET WEIGHTINGS
(as a % of Net Assets)
| Value | Value |
|---|
| Common Stock | 95.92% |
| Rights and Warrants | -% |
| Cash, Cash Equivalents, & Other Net Assets | 4.08% |
TOP TEN HOLDINGS
(as a % of Net Assets)
| Top 10 | % |
|---|
| JDC Group AG | 7.56% |
| flatexDEGIRO AG | 6.32% |
| Blackline Safety Corp. | 4.57% |
| Kitwave Group PLC | 4.38% |
| Elixirr International PLC | 3.75% |
| Catapult Group International, Ltd. | 3.44% |
| SmartCraft ASA | 3.17% |
| Midi Utama Indonesia Tbk PT | 2.52% |
| M&A Research Institute Holdings, Inc. | 2.36% |
| Freee KK | 2.29% |
| Total % of Top 10 Holdings | 40.36% |
This is a summary of certain planned changes to the Fund since October 1, 2023. For more complete information, you may review the Fund’s next prospectus, which we expect to be available by January 28, 2025, at https://sevencanyonsadvisors.com/investor-reports or upon request at 1-833‐722‐6966.
Effective February 1, 2024, the Fund's Investor Class expense limitation was amended to 1.70% (previously 1.75%).
On November 21, 2024, the Board of Trustees (the “Board”) of ALPS Series Trust (the “Trust”), based upon the recommendation of Seven Canyons Advisors, LLC, the investment adviser to the Funds, approved the proposed reorganization of the Seven Canyons Strategic Global Fund and the Seven Canyons World Innovators Fund.
CHANGES IN AND DISAGREEMENTS WITH ACCOUNTANTS
There have been no changes in or disagreements with the Fund's independent accounting firm during the reporting period.
AVAILABILITY OF ADDITIONAL INFORMATION
Additional information about the Fund, including its prospectus, financial information, holdings, and proxy voting information, can be found by visiting https://sevencanyonsadvisors.com/investor-reports.
If you have consented to receive a single annual or semi-annual shareholder report at a shared address you may revoke this consent by calling the Transfer Agent
833-722-6966.
SEVEN CANYONS WORLD INNOVATORS FUND - Investor : WAGTX
Annual Shareholder Report - September 30, 2024
Distributor, ALPS Distributors, Inc.
| | (a) | The Registrant, as of the end of the period covered by this report, has adopted a Code of Ethics that applies to the Registrant’s principal executive officer, principal financial officer, principal accounting officer or controller or any persons performing similar functions on behalf of the Registrant. |
| | (c) | During the period covered by this report, no amendments to the provisions of the Code of Ethics referred to above in Item 2(a) were made. |
| | (d) | During the period covered by this report, no implicit or explicit waivers to the provisions of the Code of Ethics referred to above in Item 2(a) were granted. |
| | (f) | The Registrant’s Code of Ethics is attached as Exhibit hereto. |
| Item 3. | Audit Committee Financial Expert. |
| | | The Board of Trustees of the registrant has determined that the registrant has at least one Audit Committee Financial Expert serving on its audit committee. The Board of Trustees of the registrant has designated Patrick Seese, as the registrant’s “Audit Committee Financial Expert.” Mr. Seese is “independent” as defined in paragraph (a)(2) of Item 3 to Form N-CSR. |
| Item 4. | Principal Accountant Fees and Services. |
| | (a) | Audit Fees: For the registrant’s fiscal years ended September 30, 2023 and September 30, 2024, the aggregate fees billed for professional services rendered by the principal accountant for the audit of the registrant’s annual financial statements were $164,200 and $170,200, respectively. For the registrant’s fiscal years ended September 30, 2023 and 2024, Cohen & Company, Ltd. served as principal accountant. In 2023, the amount of $164,200 was paid to Cohen & Company, Ltd. and in 2024, the amount of $170,200 was paid to Cohen & Company, Ltd. |
| | | |
| | (b) | Audit-Related Fees: For the registrant’s fiscal years ended September 30, 2023 and September 30, 2024, the aggregate fees billed for assurance and related services by the principal accountant that were reasonably related to the performance of the audit of the registrant’s financial statements and are not reported under paragraph (a) of this Item were $0 and $0, respectively. |
| | | |
| | (c) | Tax Fees: For the registrant’s fiscal years ended September 30, 2023 and September 30, 2024, the aggregate fees billed for professional services rendered by the principal accountant for tax compliance, tax advice and tax planning were $35,000 and $35,000, respectively. The fiscal year 2023 and 2024 tax fees were for services for dividend calculation, excise tax preparation and tax return preparation. For the registrant’s fiscal years ended September 30, 2023 and September 30, 2024, Cohen & Company, Ltd. served as principal accountant. In 2023, the amount of $35,000 was paid to Cohen & Company, Ltd. and in 2023, the amount of $35,000 was paid to Cohen & Company, Ltd. |
| | (d) | All Other Fees: For the registrant’s fiscal year ended September 30, 2023, $1,500 of other fees were billed to registrant by the principal accountant, Cohen & Company, Ltd. For the registrant’s fiscal year ended September 30, 2024, $1,500 of other fees were billed to registrant by the principal accountant for services other than the services reported in paragraphs (a) through (c) of this Item. |
| | | |
| | (e)(1) | Audit Committee Pre-Approval Policies and Procedures: All services to be performed by the registrant’s principal accountant must be pre-approved by the registrant’s audit committee. |
| | | |
| | (e)(2) | No services described in paragraphs (b) through (d) of this Item were approved by the registrant’s audit committee pursuant to paragraph (c)(7)(i)(C) of Rule 2-01 of Regulation S-X. |
| | | |
| | (f) | Not applicable. |
| | | |
| | (g) | The aggregate non-audit fees billed by the registrant’s accountant for services rendered to the registrant, and rendered to the registrant’s investment adviser (not including any sub-adviser whose role is primarily portfolio management and is subcontracted with or overseen by another investment adviser), and any entity controlling, controlled by, or under common control with the adviser that provides ongoing services to the registrant, were $36,500 in fiscal year ended September 30, 2023 and $36,500 in fiscal year ended September 30, 2024. These fees consisted of tax fees billed to the registrant as described in response to paragraph (c) of this Item. For the registrant’s fiscal years ended September 30, 2023 and September 30, 2024, Cohen & Company, Ltd. served as principal accountant. |
| | | |
| | (h) | The registrant’s audit committee has considered whether the provision of non-audit services that were rendered to the registrant’s investment adviser (not including any sub-adviser whose role is primarily portfolio management and is subcontracted with or overseen by another investment adviser), and any entity controlling, controlled by, or under common control with the investment adviser that provides ongoing services to the registrant that were not pre-approved pursuant to paragraph (c)(7)(ii) of Rule 2-01 of Regulation S-X, is compatible with maintaining the principal accountant’s independence and has determined that the provision of such non-audit services is compatible with maintaining the principal accountant’s independence. |
| | | |
| | (i) | Not applicable. |
| | | |
| | (j) | Not applicable. |
| Item 5. | Audit Committee of Listed Registrants. |
| | | Not applicable to Registrant. |
| | (a) | Schedule of Investments is included as part of the Reports to Stockholders filed under Item 7 of this Form N-CSR. |
| Item 7. | Financial Statements and Financial Highlights for Open-End Management Investment Companies. |

Table of Contents
| Portfolio of Investments | |
| Beacon Accelerated Return Strategy Fund | 1 |
| Beacon Planned Return Strategy Fund | 4 |
| Statements of Assets and Liabilities | 8 |
| Statements of Operations | 9 |
| Statements of Changes in Net Assets | |
| Beacon Accelerated Return Strategy Fund | 10 |
| Beacon Planned Return Strategy Fund | 11 |
| Financial Highlights | 12 |
| Notes to Financial Statements and Financial Highlights | 16 |
| Report of Independent Registered Public Accounting Firm | 29 |
| Tax Designations | 30 |
| Beacon Accelerated Return Strategy Fund | Portfolio of Investments |
September 30, 2024
| Counterparty | | Expiration
Date | | Strike
Price | | | Contracts | | | Notional
Value | | | Value
(Note 2) | |
| PURCHASED OPTION CONTRACTS - (115.46%) | | | | | | | | | |
| Call Option Contracts (115.46%)(a) | | | | | | | | | | | | | | | | | | |
| S&P 500® Mini Index: | | | | | | | | | | | | | | | | | | |
| Goldman Sachs | | 10/14/2024 | | $ | 0.01 | | | | 170 | | | $ | 9,796,216 | | | $ | 9,794,976 | |
| Goldman Sachs | | 10/14/2024 | | | 435.48 | | | | 40 | | | | 2,304,992 | | | | 566,411 | |
| Goldman Sachs | | 10/14/2024 | | | 450.74 | | | | 130 | | | | 7,491,224 | | | | 1,643,046 | |
| Goldman Sachs | | 11/14/2024 | | | 0.01 | | | | 160 | | | | 9,219,968 | | | | 9,215,925 | |
| Goldman Sachs | | 11/14/2024 | | | 471.84 | | | | 160 | | | | 9,219,968 | | | | 1,725,467 | |
| Goldman Sachs | | 12/13/2024 | | | 0.01 | | | | 160 | | | | 9,219,968 | | | | 9,210,904 | |
| Goldman Sachs | | 12/13/2024 | | | 471.84 | | | | 25 | | | | 1,440,620 | | | | 275,400 | |
| Goldman Sachs | | 12/13/2024 | | | 476.48 | | | | 135 | | | | 7,779,348 | | | | 1,423,155 | |
| Goldman Sachs | | 01/14/2025 | | | 0.01 | | | | 155 | | | | 8,931,844 | | | | 8,923,113 | |
| Goldman Sachs | | 01/14/2025 | | | 476.48 | | | | 40 | | | | 2,304,992 | | | | 432,766 | |
| Goldman Sachs | | 01/14/2025 | | | 501.57 | | | | 115 | | | | 6,626,852 | | | | 973,845 | |
| Goldman Sachs | | 02/14/2025 | | | 0.01 | | | | 140 | | | | 8,067,472 | | | | 8,053,676 | |
| Goldman Sachs | | 02/14/2025 | | | 501.57 | | | | 45 | | | | 2,593,116 | | | | 392,640 | |
| Goldman Sachs | | 02/14/2025 | | | 514.32 | | | | 95 | | | | 5,474,356 | | | | 719,745 | |
| Goldman Sachs | | 03/14/2025 | | | 0.01 | | | | 120 | | | | 6,914,976 | | | | 6,900,133 | |
| Goldman Sachs | | 03/14/2025 | | | 514.32 | | | | 80 | | | | 4,609,984 | | | | 626,349 | |
| Goldman Sachs | | 03/14/2025 | | | 542.77 | | | | 40 | | | | 2,304,992 | | | | 217,495 | |
| Goldman Sachs | | 04/14/2025 | | | 0.01 | | | | 120 | | | | 6,914,976 | | | | 6,898,515 | |
| Goldman Sachs | | 04/14/2025 | | | 530.26 | | | | 70 | | | | 4,033,736 | | | | 472,704 | |
| Goldman Sachs | | 04/14/2025 | | | 542.77 | | | | 50 | | | | 2,881,240 | | | | 286,304 | |
| Goldman Sachs | | 05/14/2025 | | | 0.01 | | | | 125 | | | | 7,203,100 | | | | 7,181,604 | |
| Goldman Sachs | | 05/14/2025 | | | 542.77 | | | | 50 | | | | 2,881,240 | | | | 299,210 | |
| Goldman Sachs | | 05/14/2025 | | | 564.50 | | | | 75 | | | | 4,321,860 | | | | 323,287 | |
| Goldman Sachs | | 06/13/2025 | | | 0.01 | | | | 125 | | | | 7,203,100 | | | | 7,177,987 | |
| Goldman Sachs | | 06/13/2025 | | | 553.29 | | | | 50 | | | | 2,881,240 | | | | 271,378 | |
| Goldman Sachs | | 06/13/2025 | | | 564.50 | | | | 75 | | | | 4,321,860 | | | | 344,607 | |
| Goldman Sachs | | 07/14/2025 | | | 0.01 | | | | 125 | | | | 7,203,100 | | | | 7,166,925 | |
| Goldman Sachs | | 07/14/2025 | | | 553.29 | | | | 125 | | | | 7,203,100 | | | | 704,761 | |
| Goldman Sachs | | 08/14/2025 | | | 0.01 | | | | 120 | | | | 6,914,976 | | | | 6,884,262 | |
| Goldman Sachs | | 08/14/2025 | | | 561.55 | | | | 120 | | | | 6,914,976 | | | | 641,976 | |
| | | | | | | | | | | | | 175,179,392 | | | | 99,748,566 | |
| TOTAL PURCHASED OPTION CONTRACTS | | | | | | | |
| (Cost $82,676,103) | | | | | | | | | | | | $ | 175,179,392 | $ | | | 99,748,566 | |
See Notes to Financial Statements and Financial Highlights.
| Annual Report | September 30, 2024 | 1 |
| Beacon Accelerated Return Strategy Fund | Portfolio of Investments |
September 30, 2024
| | 7 Day Yield | | | Shares | | | Value
(Note 2) | |
| SHORT TERM INVESTMENTS (2.22%) | | | | | | | | | | | | |
| Money Market Funds | | | | | | | | | | | | |
| Goldman Sachs Financial Square Funds - Treasury Instruments Fund(b) | | | 4.640 | % | | | 359,331 | | | $ | 359,331 | |
| Invesco Short-Term Investments Trust Government & Agency Portfolio - Institutional Class | | | 4.849 | % | | | 1,562,317 | | | | 1,562,317 | |
| | | | | | | | | | | | 1,921,648 | |
| TOTAL SHORT TERM INVESTMENTS | | | | | | | | | | | | |
| (Cost $1,921,648) | | | | | | | | | | | 1,921,648 | |
| | | | | | | | | | | | | |
| TOTAL INVESTMENTS (117.68%) | | | | | | | | | | | | |
| (Cost $84,597,751) | | | | | | | | | | $ | 101,670,214 | |
| | | | | | | | | | | | | |
| LIABILITIES IN EXCESS OF OTHER ASSETS (-17.68%) | | | | | | | | | | | (15,277,884 | ) |
| | | | | | | | | | | | | |
| NET ASSETS (100.00%) | | | | | | | | | | $ | 86,392,330 | |
| (a) | Held in connection with written option contracts. |
| (b) | $359,331 is held as collateral at broker for written options. |
WRITTEN OPTION CONTRACTS (17.46%)
| Counterparty | | Expiration
Date | | Strike
Price | | | Contracts | | | Premiums
Received | | | Notional
Value | | | Value
(Note 2) | |
| Call Option Contracts - (17.46%) | | | | | | | | | | | | | | | | | | | | | | |
| S&P 500® Mini Index: | | | | | | | | | | | | | | | | | | | | | | |
| Goldman Sachs | | 10/14/24 | | $ | 475.33 | | | | (80 | ) | | $ | 130,717 | | | $ | (4,609,984 | ) | | $ | (815,027 | ) |
| Goldman Sachs | | 10/14/24 | | | 485.67 | | | | (260 | ) | | | 368,670 | | | | (14,982,448 | ) | | | (2,381,006 | ) |
| Goldman Sachs | | 11/14/24 | | | 506.76 | | | | (320 | ) | | | 447,028 | | | | (18,439,936 | ) | | | (2,364,349 | ) |
| Goldman Sachs | | 12/13/24 | | | 510.06 | | | | (50 | ) | | | 73,848 | | | | (2,881,240 | ) | | | (369,167 | ) |
| Goldman Sachs | | 12/13/24 | | | 512.45 | | | | (270 | ) | | | 376,907 | | | | (15,558,696 | ) | | | (1,924,595 | ) |
| Goldman Sachs | | 01/14/25 | | | 514.60 | | | | (80 | ) | | | 117,596 | | | | (4,609,984 | ) | | | (582,080 | ) |
| Goldman Sachs | | 01/14/25 | | | 539.94 | | | | (230 | ) | | | 361,089 | | | | (13,253,704 | ) | | | (1,159,176 | ) |
| Goldman Sachs | | 02/14/25 | | | 541.95 | | | | (90 | ) | | | 152,996 | | | | (5,186,232 | ) | | | (466,576 | ) |
| Goldman Sachs | | 02/14/25 | | | 554.44 | | | | (190 | ) | | | 315,201 | | | | (10,948,712 | ) | | | (791,804 | ) |
| Goldman Sachs | | 03/14/25 | | | 557.27 | | | | (160 | ) | | | 281,113 | | | | (9,219,968 | ) | | | (679,713 | ) |
| Goldman Sachs | | 03/14/25 | | | 577.62 | | | | (80 | ) | | | 117,276 | | | | (4,609,984 | ) | | | (223,958 | ) |
| Goldman Sachs | | 04/14/25 | | | 570.82 | | | | (140 | ) | | | 224,833 | | | | (8,067,472 | ) | | | (502,475 | ) |
| Goldman Sachs | | 04/14/25 | | | 579.68 | | | | (100 | ) | | | 156,595 | | | | (5,762,480 | ) | | | (297,484 | ) |
| Goldman Sachs | | 05/14/25 | | | 582.93 | | | | (100 | ) | | | 167,495 | | | | (5,762,480 | ) | | | (304,171 | ) |
| Goldman Sachs | | 05/14/25 | | | 603.56 | | | | (150 | ) | | | 240,593 | | | | (8,643,720 | ) | | | (276,104 | ) |
| Goldman Sachs | | 06/13/25 | | | 591.25 | | | | (100 | ) | | | 160,095 | | | | (5,762,480 | ) | | | (279,260 | ) |
| Goldman Sachs | | 06/13/25 | | | 606.50 | | | | (150 | ) | | | 256,793 | | | | (8,643,720 | ) | | | (290,990 | ) |
See Notes to Financial Statements and Financial Highlights.
| Beacon Accelerated Return Strategy Fund | Portfolio of Investments |
September 30, 2024
| Counterparty | | Expiration
Date | | Strike
Price | | | Contracts | | | Premiums
Received | | | Notional
Value | | | Value
(Note 2) | |
| Goldman Sachs | | 07/14/25 | | $ | 593.51 | | | | (250 | ) | | $ | 421,739 | | | $ | (14,406,200 | ) | | $ | (726,642 | ) |
| Goldman Sachs | | 08/14/25 | | | 602.43 | | | | (240 | ) | | | 412,789 | | | | (13,829,952 | ) | | | (645,375 | ) |
| | | | | | | | | | | | | | | | | | | | | | | |
| TOTAL WRITTEN OPTION CONTRACTS | | | $ | 4,783,373 | | | $ | (175,179,392 | ) | | $ | (15,079,952 | ) |
See Notes to Financial Statements and Financial Highlights.
| Annual Report | September 30, 2024 | 3 |
| Beacon Planned Return Strategy Fund | Portfolio of Investments |
September 30, 2024
| Counterparty | | Expiration
Date | | Strike
Price | | | Contracts | | | Notional
Value | | | Value
(Note 2) | |
| PURCHASED OPTION CONTRACTS - (126.50%) | | | | | | | | | |
| Call Option Contracts (124.47%)(a) | | | | | | | | | | | | | | | | | | |
| S&P 500® Mini Index: | | | | | | | | | | | | | | | | | | |
| Goldman Sachs | | 10/14/2024 | | $ | 56.75 | | | | 710 | | | $ | 40,913,608 | | | $ | 36,887,473 | |
| Goldman Sachs | | 10/14/2024 | | | 437.67 | | | | 710 | | | | 40,913,608 | | | | 9,898,750 | |
| Goldman Sachs | | 11/14/2024 | | | 58.75 | | | | 700 | | | | 40,337,360 | | | | 36,233,749 | |
| Goldman Sachs | | 11/14/2024 | | | 450.97 | | | | 700 | | | | 40,337,360 | | | | 8,981,322 | |
| Goldman Sachs | | 12/13/2024 | | | 61.50 | | | | 275 | | | | 15,846,820 | | | | 14,156,890 | |
| Goldman Sachs | | 12/13/2024 | | | 62.35 | | | | 440 | | | | 25,354,912 | | | | 22,613,242 | |
| Goldman Sachs | | 12/13/2024 | | | 472.00 | | | | 275 | | | | 15,846,820 | | | | 3,025,151 | |
| Goldman Sachs | | 12/13/2024 | | | 475.92 | | | | 440 | | | | 25,354,912 | | | | 4,662,199 | |
| Goldman Sachs | | 01/14/2025 | | | 62.35 | | | | 525 | | | | 30,253,020 | | | | 26,994,298 | |
| Goldman Sachs | | 01/14/2025 | | | 65.20 | | | | 175 | | | | 10,084,340 | | | | 8,948,890 | |
| Goldman Sachs | | 01/14/2025 | | | 475.92 | | | | 525 | | | | 30,253,020 | | | | 5,707,947 | |
| Goldman Sachs | | 01/14/2025 | | | 502.48 | | | | 175 | | | | 10,084,340 | | | | 1,467,242 | |
| Goldman Sachs | | 02/14/2025 | | | 65.20 | | | | 550 | | | | 31,693,640 | | | | 28,114,161 | |
| Goldman Sachs | | 02/14/2025 | | | 67.18 | | | | 125 | | | | 7,203,100 | | | | 6,365,048 | |
| Goldman Sachs | | 02/14/2025 | | | 502.48 | | | | 550 | | | | 31,693,640 | | | | 4,753,448 | |
| Goldman Sachs | | 02/14/2025 | | | 512.99 | | | | 125 | | | | 7,203,100 | | | | 966,229 | |
| Goldman Sachs | | 03/14/2025 | | | 67.18 | | | | 540 | | | | 31,117,392 | | | | 27,493,770 | |
| Goldman Sachs | | 03/14/2025 | | | 67.30 | | | | 125 | | | | 7,203,100 | | | | 6,363,070 | |
| Goldman Sachs | | 03/14/2025 | | | 512.74 | | | | 125 | | | | 7,203,100 | | | | 996,025 | |
| Goldman Sachs | | 03/14/2025 | | | 512.99 | | | | 540 | | | | 31,117,392 | | | | 4,304,632 | |
| Goldman Sachs | | 04/14/2025 | | | 67.30 | | | | 550 | | | | 31,693,640 | | | | 28,000,996 | |
| Goldman Sachs | | 04/14/2025 | | | 69.00 | | | | 120 | | | | 6,914,976 | | | | 6,089,594 | |
| Goldman Sachs | | 04/14/2025 | | | 512.74 | | | | 550 | | | | 31,693,640 | | | | 4,529,324 | |
| Goldman Sachs | | 04/14/2025 | | | 530.09 | | | | 120 | | | | 6,914,976 | | | | 812,053 | |
| Goldman Sachs | | 05/14/2025 | | | 69.00 | | | | 545 | | | | 31,405,516 | | | | 27,648,105 | |
| Goldman Sachs | | 05/14/2025 | | | 70.80 | | | | 100 | | | | 5,762,480 | | | | 5,055,510 | |
| Goldman Sachs | | 05/14/2025 | | | 530.09 | | | | 545 | | | | 31,405,516 | | | | 3,820,133 | |
| Goldman Sachs | | 05/14/2025 | | | 544.28 | | | | 100 | | | | 5,762,480 | | | | 586,481 | |
| Goldman Sachs | | 06/13/2025 | | | 70.80 | | | | 570 | | | | 32,846,136 | | | | 28,810,521 | |
| Goldman Sachs | | 06/13/2025 | | | 72.00 | | | | 55 | | | | 3,169,364 | | | | 2,773,618 | |
| Goldman Sachs | | 06/13/2025 | | | 544.28 | | | | 570 | | | | 32,846,136 | | | | 3,503,350 | |
| Goldman Sachs | | 06/13/2025 | | | 552.90 | | | | 55 | | | | 3,169,364 | | | | 300,137 | |
| Goldman Sachs | | 07/14/2025 | | | 73.55 | | | | 635 | | | | 36,591,748 | | | | 31,883,683 | |
| Goldman Sachs | | 07/14/2025 | | | 563.10 | | | | 635 | | | | 36,591,748 | | | | 3,116,725 | |
| Goldman Sachs | | 08/14/2025 | | | 72.00 | | | | 650 | | | | 37,456,120 | | | | 32,768,705 | |
| Goldman Sachs | | 08/14/2025 | | | 552.90 | | | | 650 | | | | 37,456,120 | | | | 3,892,029 | |
| Goldman Sachs | | 09/12/2025 | | | 73.42 | | | | 640 | | | | 36,879,872 | | | | 32,139,265 | |
| Goldman Sachs | | 09/12/2025 | | | 561.07 | | | | 640 | | | | 36,879,872 | | | | 3,575,045 | |
| | | | | | | | | | | | | | 925,454,288 | | | | 478,238,810 | |
See Notes to Financial Statements and Financial Highlights.
| Beacon Planned Return Strategy Fund | Portfolio of Investments |
September 30, 2024
| Counterparty | | Expiration
Date | | Strike
Price | | | Contracts | | | Notional
Value | | | Value
(Note 2) | |
| PURCHASED OPTION CONTRACTS - (126.50%) (continued) | | | | | | | | |
| Put Option Contracts (2.03%) | | | | | | | | | | | | | | | | | | |
| S&P 500® Mini Index: | | | | | | | | | | | | | | | | | | |
| Goldman Sachs | | 10/14/2024 | | $ | 437.67 | | | | 710 | | | $ | 40,913,608 | | | $ | 5,688 | |
| Goldman Sachs | | 11/14/2024 | | | 450.97 | | | | 700 | | | | 40,337,360 | | | | 38,139 | |
| Goldman Sachs | | 12/13/2024 | | | 472.00 | | | | 275 | | | | 15,846,820 | | | | 45,035 | |
| Goldman Sachs | | 12/13/2024 | | | 475.92 | | | | 440 | | | | 25,354,912 | | | | 72,122 | |
| Goldman Sachs | | 01/14/2025 | | | 475.92 | | | | 525 | | | | 30,253,020 | | | | 136,153 | |
| Goldman Sachs | | 01/14/2025 | | | 502.48 | | | | 175 | | | | 10,084,340 | | | | 68,571 | |
| Goldman Sachs | | 02/14/2025 | | | 502.48 | | | | 550 | | | | 31,693,640 | | | | 286,082 | |
| Goldman Sachs | | 02/14/2025 | | | 512.99 | | | | 125 | | | | 7,203,100 | | | | 77,935 | |
| Goldman Sachs | | 03/14/2025 | | | 512.74 | | | | 125 | | | | 7,203,100 | | | | 91,360 | |
| Goldman Sachs | | 03/14/2025 | | | 512.99 | | | | 540 | | | | 31,117,392 | | | | 403,359 | |
| Goldman Sachs | | 04/14/2025 | | | 512.74 | | | | 550 | | | | 31,693,640 | | | | 468,861 | |
| Goldman Sachs | | 04/14/2025 | | | 530.09 | | | | 120 | | | | 6,914,976 | | | | 128,304 | |
| Goldman Sachs | | 05/14/2025 | | | 530.09 | | | | 545 | | | | 31,405,516 | | | | 654,349 | |
| Goldman Sachs | | 05/14/2025 | | | 544.28 | | | | 100 | | | | 5,762,480 | | | | 143,849 | |
| Goldman Sachs | | 06/13/2025 | | | 544.28 | | | | 570 | | | | 32,846,136 | | | | 907,213 | |
| Goldman Sachs | | 06/13/2025 | | | 552.90 | | | | 55 | | | | 3,169,364 | | | | 96,330 | |
| Goldman Sachs | | 07/14/2025 | | | 563.10 | | | | 635 | | | | 36,591,748 | | | | 1,350,941 | |
| Goldman Sachs | | 08/14/2025 | | | 552.90 | | | | 650 | | | | 37,456,120 | | | | 1,324,352 | |
| Goldman Sachs | | 09/12/2025 | | | 561.07 | | | | 640 | | | | 36,879,872 | | | | 1,514,343 | |
| | | | | | | | | | 462,727,144 | | | | 7,812,986 | |
| TOTAL PURCHASED OPTION CONTRACTS | | | | | | | | | | | | | | | |
| (Cost $402,936,797) | | | | | | | | | $ | 1,388,181,432 | | | $ | 486,051,796 | |
| | | 7 Day Yield | | | Shares | | | Value
(Note 2) | |
| SHORT TERM INVESTMENTS (1.25%) | | | | | | | | | | | | |
| Money Market Funds | | | | | | | | | | | | |
| Goldman Sachs Financial Square Funds - Treasury Instruments Fund(b) | | | 4.640 | % | | | 3,280,164 | | | $ | 3,280,164 | |
| Invesco Short-Term Investments Trust Government & Agency Portfolio - Institutional Class | | | 4.849 | % | | | 1,519,390 | | | | 1,519,390 | |
| | | | | | | | | | | | 4,799,554 | |
| TOTAL SHORT TERM INVESTMENTS | | | | | | | | | | | | |
| (Cost $4,799,554) | | | | | | | | | | | 4,799,554 | |
| | | | | | | | | | | | | |
| TOTAL INVESTMENTS (127.75%) | | | | | | | | | | | | |
| (Cost $407,736,351) | | | | | | | | | | $ | 490,851,350 | |
| | | | | | | | | | | | | |
| LIABILITIES IN EXCESS OF OTHER ASSETS (-27.75%) | | | | | | | | | | | (106,609,848 | ) |
| | | | | | | | | | | | | |
| NET ASSETS (100.00%) | | | | | | | | | | $ | 384,241,502 | |
| (a) | Held in connection with written option contracts. |
| (b) | $3,280,164 is held as collateral at broker for written options. |
See Notes to Financial Statements and Financial Highlights.
| Annual Report | September 30, 2024 | 5 |
| Beacon Planned Return Strategy Fund | Portfolio of Investments |
September 30, 2024
WRITTEN OPTION CONTRACTS (27.61%)
| Counterparty | | Expiration
Date | | Strike
Price | | | Contracts | | | Premiums
Received | | | Notional
Value | | | Value
(Note 2) | |
| Put Option Contracts - (1.08%) | | | | | | | | | | | | | | | |
| S&P 500® Mini Index: | | | | | | | | | | | | | | | | | | | | | | |
| Goldman Sachs | | 10/14/24 | | $ | 393.90 | | | | (710 | ) | | $ | 824,283 | | | $ | (40,913,608 | ) | | $ | (3,004 | ) |
| Goldman Sachs | | 11/14/24 | | | 405.87 | | | | (700 | ) | | | 697,873 | | | | (40,337,360 | ) | | | (20,383 | ) |
| Goldman Sachs | | 12/13/24 | | | 424.80 | | | | (275 | ) | | | 289,839 | | | | (15,846,820 | ) | | | (24,252 | ) |
| Goldman Sachs | | 12/13/24 | | | 428.33 | | | | (440 | ) | | | 446,139 | | | | (25,354,912 | ) | | | (37,930 | ) |
| Goldman Sachs | | 01/14/25 | | | 452.23 | | | | (175 | ) | | | 175,867 | | | | (10,084,340 | ) | | | (32,866 | ) |
| Goldman Sachs | | 01/14/25 | | | 428.33 | | | | (525 | ) | | | 568,025 | | | | (30,253,020 | ) | | | (73,690 | ) |
| Goldman Sachs | | 02/14/25 | | | 452.23 | | | | (550 | ) | | | 598,374 | | | | (31,693,640 | ) | | | (145,125 | ) |
| Goldman Sachs | | 02/14/25 | | | 461.69 | | | | (125 | ) | | | 136,869 | | | | (7,203,100 | ) | | | (38,513 | ) |
| Goldman Sachs | | 03/14/25 | | | 461.47 | | | | (125 | ) | | | 147,744 | | | | (7,203,100 | ) | | | (46,587 | ) |
| Goldman Sachs | | 03/14/25 | | | 461.69 | | | | (540 | ) | | | 635,015 | | | | (31,117,392 | ) | | | (206,466 | ) |
| Goldman Sachs | | 04/14/25 | | | 461.47 | | | | (550 | ) | | | 686,924 | | | | (31,693,640 | ) | | | (247,631 | ) |
| Goldman Sachs | | 04/14/25 | | | 477.08 | | | | (120 | ) | | | 110,634 | | | | (6,914,976 | ) | | | (65,507 | ) |
| Goldman Sachs | | 05/14/25 | | | 477.08 | | | | (545 | ) | | | 547,699 | | | | (31,405,516 | ) | | | (342,567 | ) |
| Goldman Sachs | | 05/14/25 | | | 489.85 | | | | (100 | ) | | | 100,095 | | | | (5,762,480 | ) | | | (73,189 | ) |
| Goldman Sachs | | 06/13/25 | | | 489.85 | | | | (570 | ) | | | 618,423 | | | | (32,846,136 | ) | | | (469,176 | ) |
| Goldman Sachs | | 06/13/25 | | | 497.61 | | | | (55 | ) | | | 61,817 | | | | (3,169,364 | ) | | | (49,033 | ) |
| Goldman Sachs | | 07/14/25 | | | 506.79 | | | | (635 | ) | | | 742,920 | | | | (36,591,748 | ) | | | (707,862 | ) |
| Goldman Sachs | | 08/14/25 | | | 497.61 | | | | (650 | ) | | | 856,021 | | | | (37,456,120 | ) | | | (724,497 | ) |
| Goldman Sachs | | 09/12/25 | | | 504.96 | | | | (640 | ) | | | 986,210 | | | | (36,879,872 | ) | | | (839,767 | ) |
| | | | | | | | | | | | | | 9,230,771 | | | | (462,727,144 | ) | | | (4,148,045 | ) |
| Call Option Contracts - (26.53%) | | | | | | | | | | | | | | | | | | | | | | |
| S&P 500® Mini Index: | | | | | | | | | | | | | | | | | | | | | | |
| Goldman Sachs | | 10/14/24 | | | 463.80 | | | | (1,420 | ) | | | 3,341,204 | | | | (81,827,216 | ) | | | (16,098,455 | ) |
| Goldman Sachs | | 11/14/24 | | | 475.23 | | | | (1,400 | ) | | | 3,018,345 | | | | (80,674,720 | ) | | | (14,622,405 | ) |
| Goldman Sachs | | 12/13/24 | | | 496.69 | | | | (550 | ) | | | 1,168,728 | | | | (31,693,640 | ) | | | (4,750,783 | ) |
| Goldman Sachs | | 12/13/24 | | | 499.00 | | | | (880 | ) | | | 1,792,519 | | | | (50,709,824 | ) | | | (7,382,117 | ) |
| Goldman Sachs | | 01/14/25 | | | 500.67 | | | | (1,050 | ) | | | 2,246,951 | | | | (60,506,040 | ) | | | (8,978,941 | ) |
| Goldman Sachs | | 01/14/25 | | | 526.70 | | | | (350 | ) | | | 775,234 | | | | (20,168,680 | ) | | | (2,166,930 | ) |
| Goldman Sachs | | 02/14/25 | | | 528.71 | | | | (1,100 | ) | | | 2,598,148 | | | | (63,387,280 | ) | | | (6,940,105 | ) |
| Goldman Sachs | | 02/14/25 | | | 539.41 | | | | (250 | ) | | | 585,738 | | | | (14,406,200 | ) | | | (1,359,003 | ) |
| Goldman Sachs | | 03/14/25 | | | 540.53 | | | | (250 | ) | | | 613,738 | | | | (14,406,200 | ) | | | (1,397,932 | ) |
| Goldman Sachs | | 03/14/25 | | | 541.46 | | | | (1,080 | ) | | | 2,642,709 | | | | (62,234,784 | ) | | | (5,955,930 | ) |
| Goldman Sachs | | 04/14/25 | | | 542.38 | | | | (1,100 | ) | | | 2,870,948 | | | | (63,387,280 | ) | | | (6,320,320 | ) |
| Goldman Sachs | | 04/14/25 | | | 555.69 | | | | (240 | ) | | | 547,429 | | | | (13,829,952 | ) | | | (1,130,881 | ) |
| Goldman Sachs | | 05/14/25 | | | 557.81 | | | | (1,090 | ) | | | 2,608,319 | | | | (62,811,032 | ) | | | (5,253,775 | ) |
See Notes to Financial Statements and Financial Highlights.
| Beacon Planned Return Strategy Fund | Portfolio of Investments |
September 30, 2024
| Counterparty | | Expiration
Date | | Strike
Price | | | Contracts | | | Premiums
Received | | | Notional
Value | | | Value
(Note 2) | |
| Goldman Sachs | | 05/14/25 | | $ | 570.13 | | | | (200 | ) | | $ | 461,791 | | | $ | (11,524,960 | ) | | $ | (782,516 | ) |
| Goldman Sachs | | 06/13/25 | | | 572.47 | | | | (1,140 | ) | | | 2,769,007 | | | | (65,692,272 | ) | | | (4,613,862 | ) |
| Goldman Sachs | | 06/13/25 | | | 576.95 | | | | (110 | ) | | | 246,615 | | | | (6,338,728 | ) | | | (408,099 | ) |
| Goldman Sachs | | 07/14/25 | | | 591.87 | | | | (1,270 | ) | | | 3,238,441 | | | | (73,183,496 | ) | | | (3,811,825 | ) |
| Goldman Sachs | | 08/14/25 | | | 580.93 | | | | (1,300 | ) | | | 3,216,139 | | | | (74,912,240 | ) | | | (5,206,640 | ) |
| Goldman Sachs | | 09/12/25 | | | 588.67 | | | | (1,280 | ) | | | 3,261,378 | | | | (73,759,744 | ) | | | (4,752,345 | ) |
| | | | | | | | | | | | | | 38,003,381 | | | | (925,454,288 | ) | | | (101,932,864 | ) |
| | | | | | | | | | | | | | | | | | | | | | | |
| TOTAL WRITTEN OPTION CONTRACTS | | | | $ | 47,234,152 | | | $ | (1,388,181,432 | ) | | $ | (106,080,909 | ) |
See Notes to Financial Statements and Financial Highlights.
| Annual Report | September 30, 2024 | 7 |
| Beacon Funds Trust | Statements of Assets and Liabilities |
September 30, 2024
| | | BEACON
ACCELERATED
RETURN
STRATEGY FUND | | | BEACON
PLANNED
RETURN
STRATEGY FUND | |
| ASSETS: | | | | | | |
| Investments, at value (Cost $84,597,751 and $407,736,351) | | $ | 101,670,214 | | | $ | 490,851,350 | |
| Receivable for shares sold | | | – | | | | 6,500 | |
| Dividends and interest receivable | | | 253 | | | | 618 | |
| Other assets | | | 26,520 | | | | 19,939 | |
| Total Assets | | | 101,696,987 | | | | 490,878,407 | |
| | | | | | | | | |
| LIABILITIES: | | | | | | | | |
| Written options, at value (premiums received $4,783,373 and $47,234,152) | | | 15,079,952 | | | | 106,080,909 | |
| Payable for administration and transfer agent fees | | | 57,236 | | | | 137,705 | |
| Payable for shares redeemed | | | 44,961 | | | | 37,731 | |
| Payable to adviser | | | 70,323 | | | | 312,445 | |
| Payable for distribution and service fees | | | 0 | | | | 23,017 | |
| Payable for printing fees | | | 800 | | | | 2,120 | |
| Payable for professional fees | | | 35,232 | | | | 29,437 | |
| Payable for trustees' fees and expenses | | | 7,710 | | | | 2,696 | |
| Payable to Chief Compliance Officer fees | | | 6,486 | | | | 4,327 | |
| Accrued expenses and other liabilities | | | 1,957 | | | | 6,518 | |
| Total Liabilities | | | 15,304,657 | | | | 106,636,905 | |
| NET ASSETS | | $ | 86,392,330 | | | $ | 384,241,502 | |
| | | | | | | | | |
| NET ASSETS CONSIST OF: | | | | | | | | |
| Paid-in capital (Note 6) | | $ | 70,447,395 | | | $ | 336,961,941 | |
| Total distributable earnings | | | 15,944,935 | | | | 47,279,561 | |
| NET ASSETS | | $ | 86,392,330 | | | $ | 384,241,502 | |
| | | | | | | | | |
| PRICING OF SHARES | | | | | | | | |
| Institutional Class : | | | | | | | | |
| Net Asset Value, offering and redemption price per share | | $ | 11.50 | | | $ | 11.40 | |
| Net Assets | | $ | 86,392,330 | | | $ | 384,241,502 | |
| Shares of beneficial interest outstanding | | | 7,510,170 | | | | 33,716,259 | |
See Notes to Financial Statements and Financial Highlights.
| Beacon Funds Trust | Statements of Operations |
For the Year Ended September 30, 2024
| | | BEACON
ACCELERATED
RETURN
STRATEGY FUND | | | BEACON
PLANNED
RETURN
STRATEGY FUND | |
| INVESTMENT INCOME: | | | | | | |
| Dividends | | $ | 160,739 | | | $ | 302,604 | |
| Total Investment Income | | | 160,739 | | | | 302,604 | |
| | | | | | | | | |
| EXPENSES: | | | | | | | | |
| Investment advisory fees (Note 7) | | | 900,367 | | | | 3,685,434 | |
| Administration fees | | | 95,734 | | | | 348,627 | |
| Shareholder service fees | | | | | | | | |
| Institutional Class | | | 13,986 | | | | 148,936 | |
| Custody fees | | | 5,887 | | | | 6,506 | |
| Legal fees | | | 19,932 | | | | 28,306 | |
| Audit and tax fees | | | 20,096 | | | | 20,388 | |
| Transfer agent fees | | | 34,313 | | | | 66,641 | |
| Trustees' fees and expenses | | | 17,335 | | | | 40,676 | |
| Registration and filing fees | | | 24,776 | | | | 26,635 | |
| Printing fees | | | 2,514 | | | | 7,827 | |
| Chief Compliance Officer fees | | | 13,556 | | | | 33,044 | |
| Insurance fees | | | 1,056 | | | | 4,658 | |
| Other expenses | | | 5,623 | | | | 9,483 | |
| Total Expenses | | | 1,155,175 | | | | 4,427,161 | |
| NET INVESTMENT LOSS | | | (994,436 | ) | | | (4,124,557 | ) |
| | | | | | | | | |
| REALIZED AND UNREALIZED GAIN/(LOSS) ON INVESTMENTS AND WRITTEN OPTIONS: | | | | | | | | |
| Net realized gain/(loss) on: | | | | | | | | |
| Investments | | | 31,554,027 | | | | 116,087,483 | |
| Written options contracts | | | (15,161,108 | ) | | | (67,186,918 | ) |
| Net realized gain | | | 16,392,919 | | | | 48,900,565 | |
| Change in unrealized appreciation/(depreciation) on: | | | | | | | | |
| Investments | | | 13,937,939 | | | | 80,365,992 | |
| Written options contracts | | | (12,515,902 | ) | | | (74,946,340 | ) |
| Net change | | | 1,422,037 | | | | 5,419,652 | |
| | | | | | | | | |
| NET REALIZED AND UNREALIZED GAIN ON INVESTMENTS AND WRITTEN OPTIONS | | | 17,814,956 | | | | 54,320,217 | |
| NET INCREASE IN NET ASSETS RESULTING FROM OPERATIONS | | $ | 16,820,520 | | | $ | 50,195,660 | |
See Notes to Financial Statements and Financial Highlights.
| Annual Report | September 30, 2024 | 9 |
Beacon Accelerated
Return Strategy Fund | Statements of Changes in Net Assets |
| | | For the Year
Ended
September 30,
2024 | | | For the Year
Ended
September 30,
2023 | |
| OPERATIONS: | | | | | | | | |
| Net investment loss | | $ | (994,436 | ) | | $ | (991,633 | ) |
| Net realized gain on investments and written options | | | 16,392,919 | | | | 3,098,622 | |
| Net change in unrealized appreciation on investments and written options | | | 1,422,037 | | | | 17,120,497 | |
| Net increase in net assets resulting from operations | | | 16,820,520 | | | | 19,227,486 | |
| | | | | | | | | |
| BENEFICIAL SHARE TRANSACTIONS (Note 6): | | | | | | | | |
| Institutional Class | | | | | | | | |
| Shares sold | | | 1,523,935 | | | | 1,979,427 | |
| Shares redeemed | | | (19,264,282 | ) | | | (11,496,513 | ) |
| Net decrease from beneficial share transactions | | | (17,740,347 | ) | | | (9,517,086 | ) |
| Net increase/(decrease) in net assets | | | (919,827 | ) | | | 9,710,400 | |
| | | | | | | | | |
| NET ASSETS: | | | | | | | | |
| Beginning of year | | | 87,312,157 | | | | 77,601,757 | |
| End of year | | $ | 86,392,330 | | | $ | 87,312,157 | |
See Notes to Financial Statements and Financial Highlights.
Beacon Planned
Return Strategy Fund | Statements of Changes in Net Assets |
| | | For the Year
Ended
September 30,
2024 | | | For the Year
Ended
September 30,
2023 | |
| OPERATIONS: | | | | | | | | |
| Net investment loss | | $ | (4,124,557 | ) | | $ | (3,843,351 | ) |
| Net realized gain on investments and written options | | | 48,900,565 | | | | 11,988,827 | |
| Net change in unrealized appreciation on investments and written options | | | 5,419,652 | | | | 53,903,979 | |
| Net increase in net assets resulting from operations | | | 50,195,660 | | | | 62,049,455 | |
| | | | | | | | | |
| DISTRIBUTIONS TO SHAREHOLDERS | | | | | | | | |
| Institutional Class | | | (20,445,278 | ) | | | – | |
| Total distributions | | | (20,445,278 | ) | | | – | |
| | | | | | | | | |
| BENEFICIAL SHARE TRANSACTIONS (Note 6): | | | | | | | | |
| Institutional Class | | | | | | | | |
| Shares sold | | | 15,846,387 | | | | 5,572,509 | |
| Dividends reinvested | | | 18,074,605 | | | | – | |
| Shares redeemed | | | (31,613,818 | ) | | | (21,715,754 | ) |
| Net increase/(decrease) from beneficial share transactions | | | 2,307,174 | | | | (16,143,245 | ) |
| Net increase in net assets | | | 32,057,556 | | | | 45,906,210 | |
| | | | | | | | | |
| NET ASSETS: | | | | | | | | |
| Beginning of year | | | 352,183,946 | | | | 306,277,736 | |
| End of year | | $ | 384,241,502 | | | $ | 352,183,946 | |
See Notes to Financial Statements and Financial Highlights.
| Annual Report | September 30, 2024 | 11 |
Beacon Accelerated
| Return Strategy Fund – Institutional Class | Financial Highlights |
For a Share Outstanding Throughout the Period Presented
| NET ASSET VALUE, BEGINNING OF PERIOD |
| |
| INCOME/(LOSS) FROM OPERATIONS: |
| Net investment loss(a) |
| Net realized and unrealized gain/(loss) on investments |
| Total from investment operations |
| |
| LESS DISTRIBUTIONS: |
| From net realized gains on investments |
| Return of capital |
| Total Distributions |
| NET INCREASE/(DECREASE) IN NET ASSET VALUE |
| NET ASSET VALUE, END OF PERIOD |
| |
| TOTAL RETURN(b) |
| |
| SUPPLEMENTAL DATA: |
| Net assets, end of period (in 000s) |
| |
| RATIOS TO AVERAGE NET ASSETS |
| Operating expenses (c) |
| Net investment loss |
| |
| PORTFOLIO TURNOVER RATE |
See Notes to Financial Statements and Financial Highlights.
Beacon Accelerated
| Return Strategy Fund – Institutional Class | Financial Highlights |
For a Share Outstanding Throughout the Period Presented
For the Year
Ended
September 30,
2024 | | | For the Year
Ended
September 30,
2023 | | | For the Year
Ended
September 30,
2022 | | | For the Year
Ended
September 30,
2021 | | | For the Year
Ended
September 30,
2020 | |
| $ | 9.55 | | | $ | 7.66 | | | $ | 11.66 | | | $ | 10.74 | | | $ | 10.15 | |
| | | | | | | | | | | | | | | | | | | |
| | (0.12 | ) | | | (0.10 | ) | | | (0.12 | ) | | | (0.14 | ) | | | (0.12 | ) |
| | 2.07 | | | | 1.99 | | | | (1.46 | ) | | | 1.93 | | | | 1.15 | |
| | 1.95 | | | | 1.89 | | | | (1.58 | ) | | | 1.79 | | | | 1.03 | |
| | | | | | | | | | | | | | | | | | | |
| | – | | | | – | | | | (2.38 | ) | | | (0.87 | ) | | | (0.44 | ) |
| | – | | | | – | | | | (0.04 | ) | | | – | | | | – | |
| | – | | | | – | | | | (2.42 | ) | | | (0.87 | ) | | | (0.44 | ) |
| | 1.95 | | | | 1.89 | | | | (4.00 | ) | | | 0.92 | | | | 0.59 | |
| $ | 11.50 | | | $ | 9.55 | | | $ | 7.66 | | | $ | 11.66 | | | $ | 10.74 | |
| | | | | | | | | | | | | | | | | | | |
| | 20.42 | % | | | 24.67 | % | | | (18.13 | %) | | | 17.42 | % | | | 10.32 | % |
| | | | | | | | | | | | | | | | | | | |
| $ | 86,392 | | | $ | 87,312 | | | $ | 77,602 | | | $ | 119,714 | | | $ | 116,041 | |
| | | | | | | | | | | | | | | | | | | |
| | 1.28 | % | | | 1.27 | % | | | 1.23 | % | | | 1.22 | % | | | 1.22 | % |
| | (1.10 | %) | | | (1.11 | %) | | | (1.21 | %) | | | (1.22 | %) | | | (1.21 | %) |
| | | | | | | | | | | | | | | | | | | |
| | 0 | % | | | 0 | % | | | 0 | % | | | 0 | % | | | 0 | % |
| (a) | Calculated using the average shares method. |
| (b) | Assumes an initial investment on the business day before the first day of the fiscal period, with all dividends and distributions reinvested in additional shares on the reinvestment date, and redemption at the net asset value calculated on the last business day of the fiscal period. Total returns are for the period indicated and have not been annualized. Returns shown do not reflect the deduction of taxes that a shareholder would pay on Fund distributions or the redemption of Fund shares. |
| (c) | Pursuant to the Fund's shareholder services plan with respect to the Fund's Institutional Class shares, any amount of fees accrued according to the plan but not paid during the Fund's fiscal year for such service activities shall be reimbursed to the Fund as soon as practical. Fees were reimbursed to the Fund during the years ended September 30, 2020-2023 in the amount of 0.00%, and for the year ended September 30, 2024 0.01% of average net assets of Institutional Class shares. |
See Notes to Financial Statements and Financial Highlights.
| Annual Report | September 30, 2024 | 13 |
Beacon Planned
| Return Strategy Fund – Institutional Class | Financial Highlights |
For a Share Outstanding Throughout the Period Presented
| NET ASSET VALUE, BEGINNING OF PERIOD |
| |
| INCOME/(LOSS) FROM OPERATIONS: |
| Net investment loss(a) |
| Net realized and unrealized gain/(loss) on investments |
| Total from investment operations |
| |
| LESS DISTRIBUTIONS: |
| From net realized gains on investments |
| Return of capital |
| Total Distributions |
| NET INCREASE/(DECREASE) IN NET ASSET VALUE |
| NET ASSET VALUE, END OF PERIOD |
| |
| TOTAL RETURN(b) |
| |
| SUPPLEMENTAL DATA: |
| Net assets, end of period (in 000s) |
| |
| RATIOS TO AVERAGE NET ASSETS |
| Operating expenses (c) |
| Net investment loss |
| |
| PORTFOLIO TURNOVER RATE |
See Notes to Financial Statements and Financial Highlights.
Beacon Planned
| Return Strategy Fund – Institutional Class | Financial Highlights |
For a Share Outstanding Throughout the Period Presented
For the Year
Ended
September 30,
2024 | | | For the Year
Ended
September 30,
2023 | | | For the Year
Ended
September 30,
2022 | | | For the Year
Ended
September 30,
2021 | | | For the Year
Ended
September 30,
2020 | |
| $ | 10.52 | | | $ | 8.72 | | | $ | 11.13 | | | $ | 10.49 | | | $ | 10.44 | |
| | | | | | | | | | | | | | | | | | | |
| | (0.12 | ) | | | (0.11 | ) | | | (0.12 | ) | | | (0.13 | ) | | | (0.12 | ) |
| | 1.61 | | | | 1.91 | | | | (0.85 | ) | | | 1.31 | | | | 0.85 | |
| | 1.49 | | | | 1.80 | | | | (0.97 | ) | | | 1.18 | | | | 0.73 | |
| | | | | | | | | | | | | | | | | | | |
| | (0.61 | ) | | | – | | | | (1.41 | ) | | | (0.54 | ) | | | (0.68 | ) |
| | – | | | | – | | | | (0.03 | ) | | | – | | | | – | |
| | (0.61 | ) | | | – | | | | (1.44 | ) | | | (0.54 | ) | | | (0.68 | ) |
| | 0.88 | | | | 1.80 | | | | (2.41 | ) | | | 0.64 | | | | 0.05 | |
| $ | 11.40 | | | $ | 10.52 | | | $ | 8.72 | | | $ | 11.13 | | | $ | 10.49 | |
| | | | | | | | | | | | | | | | | | | |
| | 14.70 | % | | | 20.64 | % | | | (10.41 | %) | | | 11.53 | % | | | 7.21 | % |
| | | | | | | | | | | | | | | | | | | |
| $ | 384,242 | | | $ | 352,184 | | | $ | 306,278 | | | $ | 362,773 | | | $ | 315,389 | |
| | | | | | | | | | | | | | | | | | | |
| | 1.20 | % | | | 1.21 | % | | | 1.19 | % | | | 1.19 | % | | | 1.20 | % |
| | (1.12 | %) | | | (1.14 | %) | | | (1.18 | %) | | | (1.19 | %) | | | (1.19 | %) |
| | | | | | | | | | | | | | | | | | | |
| | 0 | % | | | 0 | % | | | 0 | % | | | 0 | % | | | 0 | % |
| (a) | Calculated using the average shares method. |
| (b) | Assumes an initial investment on the business day before the first day of the fiscal period, with all dividends and distributions reinvested in additional shares on the reinvestment date, and redemption at the net asset value calculated on the last business day of the fiscal period. Total returns are for the period indicated and have not been annualized. Returns shown do not reflect the deduction of taxes that a shareholder would pay on Fund distributions or the redemption of Fund shares. |
| (c) | Pursuant to the Fund's shareholder services plan with respect to the Fund's Institutional Class shares, any amount of fees accrued according to the plan but not paid during the Fund's fiscal year for such service activities shall be reimbursed to the Fund as soon as practical. Fees were reimbursed to the Fund during the years ended September 30, 2020-2023 in the amount of 0.00%, and for the year ended September 30, 2024 0.01% of average net assets of Institutional Class shares. |
See Notes to Financial Statements and Financial Highlights.
| Annual Report | September 30, 2024 | 15 |
| Beacon Funds Trust | Notes to Financial Statements and Financial Highlights |
September 30, 2024
1. ORGANIZATION
ALPS Series Trust (the “Trust”), a Delaware statutory trust, is an open-end management investment company registered under the Investment Company Act of 1940, as amended (the “1940 Act”). The Trust consists of multiple separate portfolios or series. This annual report describes the Beacon Accelerated Return Strategy Fund and the Beacon Planned Return Strategy Fund (each, a “Fund” and collectively, the “Funds”). The Funds are non-diversified and may invest a greater portion of assets in securities of individual issuers than a diversified fund. As a result, changes in the market value of a single investment could cause greater fluctuations in share price than would occur in a diversified Fund. The primary investment objectives are to deliver capital appreciation and generate positive alpha for the Beacon Accelerated Return Strategy Fund, and capital preservation and capital appreciation for the Beacon Planned Return Strategy Fund. The Funds currently offer Institutional Class shares. The Board of Trustees (the “Board” or "Trustees") may establish additional funds and classes of shares at any time in the future without shareholder approval.
2. SIGNIFICANT ACCOUNTING POLICIES
The accompanying financial statements were prepared in accordance with accounting principles generally accepted in the United States of America for investment companies (“U.S. GAAP”). The Funds are considered investment companies under U.S. GAAP and follow the accounting and reporting guidance applicable to investment companies in the Financial Accounting Standards Board (“FASB”) Accounting Standards Codification Topic 946, Financial Services - Investment Companies. The preparation of financial statements in conformity with U.S. GAAP requires management to make certain estimates and assumptions that affect the reported amounts of assets and liabilities and disclosures of contingent assets and liabilities at the date of the financial statements and the reported amounts of increases and decreases in net assets from operations during the period. Actual results could differ from those estimates. The following is a summary of significant accounting policies consistently followed by the Funds in preparation of their financial statements.
Investment Valuation: The Funds generally value their securities based on market prices determined at the close of regular trading on the New York Stock Exchange (“NYSE”), normally 4:00 p.m. Eastern Time, on each day the NYSE is open for trading.
Flexible Exchange ("FLEX") Options are customized option contracts available through the Chicago Board Options Exchange ("CBOE"). Flexible Exchange Options are valued based on prices supplied by an independent third-party pricing service, which utilizes pricing models that incorporate various inputs such as interest rates, credit spreads, currency exchange rates and volatility measurements for in-the-money, at-the-money, and out-of-money contracts on a given strike price.
Redeemable securities issued by open-end registered investment companies are valued at the investment company’s applicable net asset value (“NAV”). Money market funds, representing short-term investments, are valued at their NAV.
When such prices or quotations are not available, or when the valuation designee appointed by the Board believes that they are unreliable, securities may be priced using fair value procedures approved by the Board.
| Beacon Funds Trust | Notes to Financial Statements and Financial Highlights |
September 30, 2024
Fair Value Measurements: The Funds disclose the classification of their fair value measurements following a three-tier hierarchy based on the inputs used to measure fair value. Inputs refer broadly to the assumptions that market participants would use in pricing the asset or liability, including assumptions about risk. Inputs may be observable or unobservable. Observable inputs reflect the assumptions market participants would use in pricing the asset or liability that are developed based on market data obtained from sources independent of the reporting entity. Unobservable inputs reflect the reporting entity’s own assumptions about the assumptions market participants would use in pricing the asset or liability that are developed based on the best information available.
Various inputs are used in determining the value of the Funds’ investments as of the end of the reporting period. When inputs used fall into different levels of the fair value hierarchy, the level in the hierarchy within which the fair value measurement falls is determined based on the lowest level input that is significant to the fair value measurement in its entirety. The designated input levels are not necessarily an indication of the risk or liquidity associated with these investments. These inputs are categorized in the following hierarchy under applicable financial accounting standards:
| Level 1 – | Unadjusted quoted prices in active markets for identical investments, unrestricted assets or liabilities that the Fund has the ability to access at the measurement date; |
| Level 2 – | Quoted prices which are not active, quoted prices for similar assets or liabilities in active markets or inputs other than quoted prices that are observable (either directly or indirectly); and |
| Level 3 – | Significant unobservable prices or inputs (including the Fund’s own assumptions in determining the fair value of investments) where there is little or no market activity for the asset or liability at the measurement date. |
The following is a summary of the inputs used to value the Funds’ investments as of September 30, 2024:
BEACON ACCELERATED RETURN STRATEGY FUND
| Investments in Securities at Value | | Level 1 -
Unadjusted
Quoted Prices | | | Level 2 - Other
Significant
Observable
Inputs | | | Level 3 -
Significant
Unobservable
Inputs | | | Total | |
| Purchased Option Contracts | | $ | – | | | $ | 99,748,566 | | | $ | – | | | $ | 99,748,566 | |
| Short Term Investments | | | 1,921,648 | | | | – | | | | – | | | | 1,921,648 | |
| Total | | $ | 1,921,648 | | | $ | 99,748,566 | | | $ | – | | | $ | 101,670,214 | |
| | | Valuation Inputs | | | | |
| Other Financial Instruments | | Level 1 | | | Level 2 | | | Level 3 | | | Total | |
| Liabilities | | | | | | | | | | | | |
| Written Option Contracts | | $ | – | | | $ | (15,079,952 | ) | | $ | – | | | $ | (15,079,952 | ) |
| Total | | $ | – | | | $ | (15,079,952 | ) | | $ | – | | | $ | (15,079,952 | ) |
| Annual Report | September 30, 2024 | 17 |
| Beacon Funds Trust | Notes to Financial Statements and Financial Highlights |
September 30, 2024
BEACON PLANNED RETURN STRATEGY FUND
| Investments in Securities at Value | | Level 1 -
Unadjusted
Quoted Prices | | | Level 2 - Other
Significant
Observable
Inputs | | | Level 3 -
Significant
Unobservable
Inputs | | | Total | |
| Purchased Option Contracts | | $ | – | | | $ | 486,051,796 | | | $ | – | | | $ | 486,051,796 | |
| Short Term Investments | | | 4,799,554 | | | | – | | | | – | | | | 4,799,554 | |
| Total | | $ | 4,799,554 | | | $ | 486,051,796 | | | $ | – | | | $ | 490,851,350 | |
| | | Valuation Inputs | | | | |
| Other Financial Instruments | | Level 1 | | | Level 2 | | | Level 3 | | | Total | |
| Liabilities | | | | | | | | | | | | |
| Written Option Contracts | | $ | – | | | $ | (106,080,909 | ) | | $ | – | | | $ | (106,080,909 | ) |
| Total | | $ | – | | | $ | (106,080,909 | ) | | $ | – | | | $ | (106,080,909 | ) |
There were no Level 3 securities held during the year ended September 30, 2024.
Cash & Cash Equivalents: The Funds consider their investment in a Federal Deposit Insurance Corporation ("FDIC") insured interest bearing account to be cash and cash equivalents. Cash and cash equivalents are valued at cost plus any accrued interest. The Funds maintain cash balances, which, at times may exceed federally insured limits. The Funds maintain these balances with a high quality financial institution.
Concentration of Credit Risk: The Funds place their cash with a banking institution, which is insured by FDIC. The FDIC limit is $250,000. At various times throughout the year, the amount on deposit may exceed the FDIC limit and subject the Funds to a credit risk. The Funds do not believe that such deposits are subject to any unusual risk associated with investment activities.
Trust Expenses: Some expenses of the Trust can be directly attributed to a fund. Expenses that cannot be directly attributed to a fund are apportioned among all funds in the Trust based on average net assets of each fund, including Trustees' fees and expenses.
Federal Income Taxes: The Funds comply with the requirements under Subchapter M of the Internal Revenue Code of 1986, as amended, applicable to regulated investment companies and intend to distribute substantially all of their net taxable income and net capital gains, if any, each year so that they will not be subject to excise tax on undistributed income and gains. The Funds are not subject to income taxes to the extent such distributions are made.
As of and during the year ended September 30, 2024, the Funds did not have a liability for any unrecognized tax benefits in the accompanying financial statements. The Funds recognize interest and penalties, if any, related to tax liabilities as income tax expense in the Statements of Operations. The Funds file U.S. federal, state and local income tax returns as required. The Funds’ tax returns are subject to examination by the relevant tax authorities until expiration of the applicable statute of limitations, which is generally three years after the filing of the tax return for federal purposes and four years for most state returns. The Funds’ administrator has analyzed the Funds’ tax positions and has concluded that as of September 30, 2024, no provision for income tax is required in the Funds’ financial statements related to these tax positions.
| Beacon Funds Trust | Notes to Financial Statements and Financial Highlights |
September 30, 2024
Investment Transactions and Investment Income: Investment transactions are accounted for on the date the investments are purchased or sold (trade date basis for financial reporting purposes). Realized gains and losses from investment transactions are reported on an identified cost basis. Interest income, which includes accretion of discounts and amortization of premiums, is accrued and recorded as earned. Dividend income is recognized on the ex-dividend date.
Distributions to Shareholders: The Funds normally pay dividends, if any, and distribute capital gains, if any, on an annual basis. Income dividend distributions are derived from interest, dividends and other income the Funds receive from their investments, including short-term capital gains. Long-term capital gain distributions are derived from gains realized when a Fund sells a security it has owned for more than one year. A Fund may make additional distributions and dividends at other times if its portfolio manager or managers believe doing so may be necessary for the Fund to avoid or reduce taxes. Net investment income/(loss) and net realized gain/(loss) may differ for financial statement and tax purposes.
3. DERIVATIVE INSTRUMENTS
Each Fund's principal investment strategy permits it to enter into various types of derivatives contracts, including, but not limited to, futures contracts, forward foreign currency contracts, currency swaps and purchased and written options. In doing so, the Funds may employ strategies in differing combinations to permit it to increase, decrease, or change the level or types of exposure to market factors. Central to those strategies are features inherent in derivatives that make them more attractive for this purpose than equity or debt securities; they require little or no initial cash investment, they can focus exposure on only certain selected risk factors, and they may not require the ultimate receipt or delivery of the underlying security (or securities) to the contract. This may allow the Funds to pursue their objectives more quickly and efficiently than if they were to make direct purchases or sales of securities capable of affecting a similar response to market factors.
Risk of Investing in Derivatives: The Funds’ use of derivatives can result in losses due to unanticipated changes in the market risk factors and the overall market. In instances where the Funds are using derivatives to decrease, or hedge, exposures to market risk factors for securities held by the Funds, there are also risks that those derivatives may not perform as expected resulting in losses for the combined or hedged positions.
Derivatives may have little or no initial cash investment relative to their market value exposure and therefore can produce significant gains or losses in excess of their cost. This use of embedded leverage allows the Funds to increase their market value exposure relative to their net assets and can substantially increase the volatility of the Funds’ performance.
Additional associated risks from investing in derivatives also exist and potentially could have significant effects on the valuation of the derivative and the Funds. Typically, the associated risks are not the risks that the Funds are attempting to increase or decrease exposure to, per their investment objectives, but are the additional risks from investing in derivatives.
| Annual Report | September 30, 2024 | 19 |
| Beacon Funds Trust | Notes to Financial Statements and Financial Highlights |
September 30, 2024
Examples of these associated risks are liquidity risk, which is the risk that the Funds will not be able to sell or close out the derivative in a timely manner, and counterparty credit risk, which is the risk that the counterparty will not fulfill its obligation to the Funds. In addition, use of derivatives may increase or decrease exposure to the following risk factors:
Equity Risk: Equity risk relates to the change in value of equity securities as they relate to increases or decreases in the general market. Associated risks can be different for each type of derivative.
Option Contracts: Each Fund may enter into options transactions for hedging purposes and for nonhedging purposes such as seeking to enhance return. Each Fund may write covered put and call options on any stocks or stock indices, currencies traded on domestic and foreign securities exchanges, or futures contracts on stock indices, interest rates and currencies traded on domestic and, to the extent permitted by the U.S. Commodity Futures Trading Commission, foreign exchanges. A call option on an asset written by a Fund obligates the Fund to sell the specified asset to the holder (purchaser) at a stated price (the exercise price) if the option is exercised before a specified date (the expiration date). A put option on an asset written by a Fund obligates the Fund to buy the specified asset from the purchaser at the exercise price if the option is exercised before the expiration date. Premiums received when writing options are recorded as liabilities and are subsequently adjusted to the current value of the options written. Premiums received from writing options that expire are treated as realized gains. Premiums received from writing options, which are either exercised or closed, are offset against the proceeds received or amount paid on the transaction to determine realized gains or losses.
The Funds use FLEX Options, which are customized equity or index option contracts that trade on an exchange, but that provide investors with the ability to customize key contract terms like exercise prices, styles and expiration dates. Like standardized exchange-traded options, FLEX Options are guaranteed for settlement by The Options Clearing Corporation (“OCC”), a market clearinghouse. The OCC guarantees performance by each of the counterparties to the FLEX Options, becoming the “buyer for every seller and the seller for every buyer,” protecting clearing members and options traders from counterparty risk. FLEX Options provide investors with the ability to customize key terms, while achieving price discovery in competitive, transparent auctions markets and avoiding the counterparty exposure of Over-the-Counter (“OTC”) options positions. The Funds bear the risk that the OCC will be unable or unwilling to perform its obligations under the FLEX Options contracts. Additionally, FLEX Options may be less liquid than certain other securities such as standardized options. In a less liquid market for the FLEX Options, the Funds may have difficulty closing out certain FLEX Options positions at desired times and prices.
Purchased Options: When the Funds purchase an option, an amount equal to the premium paid by the Funds are recorded as an investment and is subsequently adjusted to the current value of the option purchased. If an option expires on the stipulated expiration date or if the Funds enter into a closing sale transaction, a gain or loss is realized. If a call option is exercised, the cost of the security acquired is increased by the premium paid for the call. If a put option is exercised, a gain or loss is realized from the sale of the underlying security, and the proceeds from such sale are decreased by the premium originally paid. Purchased options are non-income producing securities.
| Beacon Funds Trust | Notes to Financial Statements and Financial Highlights |
September 30, 2024
Written Options: When the Funds write an option, an amount equal to the premium received by the Funds are recorded as a liability and is subsequently adjusted to the current value of the option written. Premiums received from writing options that expire unexercised are treated by the Funds on the expiration date as realized gain from written options. The difference between the premium and the amount paid on effecting a closing purchase transaction, including brokerage commissions, is also treated as a realized gain, or if the premium is less than the amount paid for the closing purchase transaction, as a realized loss. If a call option is exercised, the premium is added to the proceeds from the sale of the underlying security in determining whether the Funds have realized a gain or loss. If a put option is exercised, the premium reduces the cost basis of the securities purchased by the Funds. The Funds, as writers of an option, bear the market risk of an unfavorable change in the price of the security underlying the written option.
The average option contract notional amount during the year ended September 30, 2024, is noted below for each of the Funds. These are equity options which have an element of equity security risk.
| Derivative Type | | Unit of Measurement | | Monthly Average | |
| Beacon Accelerated Return Strategy Fund | | | | |
| Purchased Option Contracts | | Notional value of contracts outstanding | | $ | 176,756,807 | |
| Written Option Contracts | | Notional value of contracts outstanding | | $ | 176,756,807 | |
| Derivative Type | | Unit of Measurement | | Monthly Average | |
| Beacon Planned Return Strategy Fund | | | | |
| Purchased Option Contracts | | Notional value of contracts outstanding | | $ | 1,310,579,814 | |
| Written Option Contracts | | Notional value of contracts outstanding | | $ | 1,310,579,814 | |
Derivative Instruments: The following tables disclose the amounts related to the Funds’ use of derivative instruments.
| Annual Report | September 30, 2024 | 21 |
| Beacon Funds Trust | Notes to Financial Statements and Financial Highlights |
September 30, 2024
The effect of derivative instruments on the Statements of Assets and Liabilities as of September 30, 2024:
| Risk Exposure | | Statements of Assets
and Liabilities
Location | | Fair Value of
Asset
Derivatives | | | Statements of
Assets
and Liabilities
Location | | Fair Value of
Liability
Derivatives | |
| Beacon Accelerated Return Strategy Fund | | | | | | | | | | |
| Equity Contracts (Purchased Options/Written Options) | | Investments, at value | | $ | 99,748,566 | | | Written Options, at value | | $ | 15,079,952 | |
| | | | $ | 99,748,566 | | | | | $ | 15,079,952 | |
| | | | | | | | | | | |
| Beacon Planned Return Strategy Fund | | | | | | | | | | |
| Equity Contracts (Purchased Options/Written Options) | | Investments, at value | | $ | 486,051,796 | | | Written Options, at value | | $ | 106,080,909 | |
| | | | | $ | 486,051,796 | | | | | $ | 106,080,909 | |
| Beacon Funds Trust | Notes to Financial Statements and Financial Highlights |
September 30, 2024
The effect of derivative instruments on the Statements of Operations for the year ended September 30, 2024:
| Risk Exposure | | Statements of Operations Location | | Realized Gain
(Loss) on
Derivatives
Recognized
in Income | | | Change in Unrealized
Gain (Loss) on
Derivatives
Recognized in
Income | |
| Beacon Accelerated Return Strategy Fund | | | | | | | | |
| Equity Contracts (Purchased Options) | | Net realized gain/(loss) on investments/Net change in unrealized appreciation/(depreciation) on investments | | $ | 31,554,027 | | | $ | 13,937,939 | |
| Equity Contracts (Written Options) | | Net realized gain/(loss) on written option contracts/Net change in unrealized appreciation/(depreciation) on written option contracts | | | (15,161,108 | ) | | | (12,515,902 | ) |
| Total | | | | $ | 16,392,919 | | | $ | 1,422,037 | |
| Beacon Planned Return Strategy Fund | | | | | | | | |
| Equity Contracts (Purchased Options) | | Net realized gain/(loss) on investments/Net change in unrealized appreciation/(depreciation) on investments | | $ | 116,087,483 | | | $ | 80,365,992 | |
| Equity Contracts (Written Options) | | Net realized gain/(loss) on written option contracts/Net change in unrealized appreciation/(depreciation) on written option contracts | | | (67,186,918 | ) | | | (74,946,340 | ) |
| Total | | | | $ | 48,900,565 | | | $ | 5,419,652 | |
4. TAX BASIS INFORMATION
Tax Basis of Distributions to Shareholders: The character of distributions made during the period from net investment income or net realized gains may differ from its ultimate characterization for federal income tax purposes. Also, due to the timing of dividend distributions, the fiscal year in which amounts are distributed may differ from the fiscal year in which the income or realized gain were recorded by the Funds. The amounts and characteristics of tax basis distributions and composition of distributable earnings/(accumulated losses) are finalized at fiscal year-end.
| Annual Report | September 30, 2024 | 23 |
| Beacon Funds Trust | Notes to Financial Statements and Financial Highlights |
September 30, 2024
The tax character of distributions paid during the fiscal year ended September 30, 2024, were as follows:
| | | Ordinary Income | | | Long-Term Capital Gains | |
| Beacon Accelerated Return Strategy Fund | | $ | – | | | $ | – | |
| Beacon Planned Return Strategy Fund | | | 5,781,380 | | | | 14,663,898 | |
No distributions were paid by the Funds during the fiscal year ended September 30, 2023.
As of September 30, 2024, there were no permanent reclassifications.
Unrealized Appreciation and Depreciation on Investments and Derivative Instruments: As of September 30, 2024, the aggregate costs of investments, gross unrealized appreciation/ (depreciation) and net unrealized appreciation of instruments and derivative instruments for federal tax purposes were as follows:
| | | Beacon Accelerated Return Strategy Fund | | | Beacon Planned Return Strategy Fund | |
| Gross unrealized appreciation (excess of value over tax cost)(a) | | $ | – | | | $ | – | |
| Gross unrealized depreciation (excess of tax cost over value)(a) | | | – | | | | – | |
| Net unrealized appreciation | | $ | – | | | $ | – | |
| Cost of investments for income tax purposes | | $ | 101,670,214 | | | $ | 490,851,350 | |
| (a) | Includes appreciation/(depreciation) on written options |
The primary reason for the temporary differences between book and tax basis unrealized is mark to market adjustments.
Components of Distributable Earnings: As of September 30, 2024, the components of distributable earnings on a tax basis were as follows:
| | | Beacon Accelerated Return Strategy Fund | | | Beacon Planned Return Strategy Fund | |
| Undistributed ordinary income | | $ | 5,317,933 | | | $ | 14,673,262 | |
| Accumulated capital gains | | | 10,627,002 | | | | 32,606,299 | |
| Total | | $ | 15,944,935 | | | $ | 47,279,561 | |
Beacon Accelerated Return Strategy Fund utilized $120,591 of Capital Loss Carryovers during the year ended September 30, 2024.
| Beacon Funds Trust | Notes to Financial Statements and Financial Highlights |
September 30, 2024
There were no Capital Loss Carryforwards for the year ended September 30, 2024 for the Funds.
5. SECURITIES TRANSACTIONS
Purchases and sales of securities, excluding short-term securities, during the year ended September 30, 2024, were as follows:
| | | Purchases of Securities | | | Proceeds from Sales of Securities | |
| Beacon Accelerated Return Strategy Fund | | $ | – | | | $ | – | |
| Beacon Planned Return Strategy Fund | | | – | | | | – | |
6. BENEFICIAL SHARE TRANSACTIONS
The capitalization of the Trust consists of an unlimited number of shares of beneficial interest with no par value per share. Holders of the shares of the Funds have one vote for each share held and a proportionate fraction of a vote for each fractional share. All shares issued and outstanding are fully paid and are transferable and redeemable at the option of the shareholder. Shares have no pre-emptive rights. Neither the Funds nor any of their creditors have the right to require shareholders to pay any additional amounts solely because the shareholder owns the shares.
Shares redeemed within 60 days of purchase may incur a 2.00% short-term redemption fee deducted from the redemption amount. For the year ended September 30, 2024, the redemption fees charged by the Funds, if any, are presented in the Statements of Changes in Net Assets.
| Annual Report | September 30, 2024 | 25 |
| Beacon Funds Trust | Notes to Financial Statements and Financial Highlights |
September 30, 2024
Transactions in common shares were as follows:
| | | For the Year Ended
September 30,
2024 | | | For the Year Ended
September 30,
2023 | |
| Beacon Accelerated Return Strategy Fund | | | | | | | | |
| Institutional Class | | | | | | | | |
| Shares sold | | | 148,634 | | | | 220,172 | |
| Shares issued in reinvestment of distributions to shareholders | | | – | | | | – | |
| Shares redeemed | | | (1,782,580 | ) | | | (1,206,376 | ) |
| Net decrease in shares outstanding | | | (1,633,946 | ) | | | (986,204 | ) |
| | | | | | | | | |
| Beacon Planned Return Strategy Fund | | | | | | | | |
| Institutional Class | | | | | | | | |
| Shares sold | | | 1,488,974 | | | | 561,038 | |
| Shares issued in reinvestment of distributions to shareholders | | | 1,724,676 | | | | – | |
| Shares redeemed | | | (2,967,716 | ) | | | (2,215,011 | ) |
| Net increase/(decrease) in shares outstanding | | | 245,934 | | | | (1,653,973 | ) |
Control is defined by the 1940 Act as the beneficial ownership, either directly or through one or more controlled companies, of more than 25% of the voting securities of a company. Approximately 98% of the outstanding shares of the Beacon Accelerated Return Strategy Fund are held by one omnibus account. Approximately 88% of the outstanding shares of the Beacon Planned Return Strategy Fund are owned by one omnibus account. Share transaction activities of these shareholders could have a material impact on the Funds.
7. MANAGEMENT AND RELATED PARTY TRANSACTIONS
Investment Advisory: Beacon Investment Advisory Services, Inc. (the “Adviser”), subject to the authority of the Board, is responsible for the management of the Funds’ portfolios. The Adviser manages the investments of the Funds in accordance with the Funds’ investment objectives, policies and limitations and investment guidelines established jointly by the Adviser and the Board.
Pursuant to the Investment Advisory Agreement (the “Advisory Agreement”) with the Adviser, each Fund pays the Adviser an annual management fee that is based on the Fund’s average daily net assets. The management fee is paid on a monthly basis. The contractual management fee rate is 1.00% based on average daily net assets for the Beacon Accelerated Return Strategy Fund and Beacon Planned Return Strategy Fund. The current term of the Advisory Agreement is one year. The Board may extend the Advisory Agreement for additional one-year terms. The Board and shareholders of a Fund may terminate the Advisory Agreement upon 30 days’ written notice. The Adviser may terminate the Advisory Agreement upon 60 days’ notice.
| Beacon Funds Trust | Notes to Financial Statements and Financial Highlights |
September 30, 2024
Pursuant to a fee waiver letter agreement (the “Fee Waiver Agreement”), the Adviser has contractually agreed to limit the amount of each Fund’s Total Annual Fund Operating Expenses (excluding Rule 12b-1 fees, Acquired Fund Fees and Expenses, brokerage expenses, interest expenses, taxes and extraordinary expenses) to an annual rate of 1.40% of the Beacon Accelerated Return Strategy Fund’s average daily net assets for the Institutional Class shares and 1.40% of the Beacon Planned Return Strategy Fund’s average daily net assets for the Institutional Class shares. The Fee Waiver Agreement shall continue at least through January 31, 2025, and will automatically continue upon annual approval of the Board for successive twelve-month periods unless (i) it is terminated earlier by the Board, or (ii) the Adviser provides at least 30 days written notice of its non-continuance prior to the end of the then effective term. Except due to the Adviser’s notice of non-renewal, the Fee Waiver Agreement may only be amended or terminated with the approval of the Board. The Adviser will be permitted to recover, on a class-by-class basis, expenses it has borne through the Fee Waiver Agreement (whether through a reduction of its management fee or otherwise) only to the extent that each Fund’s expenses in later periods do not exceed the lesser of: (1) the contractual expense limit in effect at the time the Adviser waives or limits the expenses; or (2) the contractual expense limit in effect at the time the Adviser seeks to recover the expenses; provided, however, that the Funds will not be obligated to pay any such deferred fees or expenses more than three years after the date on which the fee or expense was reduced, as calculated on a monthly basis. There were no fees waived or reimbursed for the year ended September 30, 2024.
Administrator: ALPS Fund Services, Inc. (“ALPS”) (an affiliate of ALPS Distributors, Inc.) serves as administrator to each Fund. The Funds have agreed to pay expenses incurred in connection with its administrative activities. Pursuant to the Administration, Bookkeeping and Pricing Services Agreement with the Trust, ALPS will provide operational services to the Funds including, but not limited to, fund accounting and fund administration and generally assist in each Fund’s operations. Each Fund’s administration fee is accrued on a daily basis and paid monthly. The officers of the Trust are employees of ALPS. Administration fees paid by the Funds for the year ended September 30, 2024, are disclosed in the Statements of Operations. ALPS is reimbursed by the Funds for certain out-of-pocket expenses.
Transfer Agent: ALPS serves as transfer agent for each Fund under a Transfer Agency and Services Agreement with the Trust. Under this agreement, ALPS is paid an annual fee for services performed on behalf of the Funds plus fees for open accounts and is reimbursed for certain out-of-pocket expenses.
Compliance Services: ALPS provides Chief Compliance Officer services to each Fund to monitor and test the policies and procedures of each Fund in conjunction with requirements under Rule 38a-1 of the 1940 Act pursuant to a Chief Compliance Officer Services Agreement with the Trust. Under this agreement, ALPS is paid an annual fee for services performed on behalf of the Funds and is reimbursed for certain out-of-pocket expenses.
Distribution: ALPS Distributors, Inc. (the “Distributor”) (an affiliate of ALPS) acts as the principal underwriter of each Fund’s shares pursuant to a Distribution Agreement with the Trust. Shares of each Fund are offered on a continuous basis through the Distributor, as agent of the Funds. The Distributor is not obligated to sell any particular amount of shares and is not entitled to any compensation for its services as the Funds’ principal underwriter pursuant to the Distribution Agreement.
| Annual Report | September 30, 2024 | 27 |
| Beacon Funds Trust | Notes to Financial Statements and Financial Highlights |
September 30, 2024
Each Fund has adopted a shareholder services plan (“Shareholder Services Plan”) for its Institutional Class. Under the Shareholder Services Plan each Fund is authorized to pay banks and their affiliates and other institutions, including broker-dealers and Fund affiliates (“Participating Organizations”), an aggregate fee in an amount not to exceed on an annual basis 0.15% of the average daily net assets of each Fund’s Institutional Class shares, respectively, to Participating Organizations as compensation for providing shareholder service activities, which do not include distribution services, pursuant to an agreement with a Participating Organization. Shareholder Services Plan fees paid by the Funds are disclosed in the Statements of Operations.
8. TRUSTEES AND OFFICERS
As of September 30, 2024, there were four Trustees, each of whom are not “interested persons” (as defined in the 1940 Act) of the Trust (the “Independent Trustees”). The Independent Trustees of the Trust and, if any, Interested Trustees who are not currently employed by the Adviser, ALPS or other service providers will receive a quarterly retainer of $16,250, plus $5,000 for each regular Board or Committee meeting attended and $2,000 for each special telephonic or in-person Board or Committee meeting attended. Additionally, the Audit Committee Chair receives a quarterly retainer of $1,875 and the Independent Chair receives a quarterly retainer of $4,250. These fees are allocated proportionately among the multiple portfolios/series of the Trust. The Independent Trustees and, if any, Interested Trustees who are not currently employed by the Adviser, ALPS or other service providers are also reimbursed for all reasonable out-of-pocket expenses relating to attendance at meetings.
Officers of the Trust receive no salary or fees from the Trust. As discussed in Note 7, the Funds pay ALPS an annual fee for compliance services.
9. INDEMNIFICATIONS
Under the Trust’s organizational documents, its officers and Trustees are indemnified against certain liabilities arising out of the performance of their duties to the Trust. Additionally, in the normal course of business, the Trust enters into contracts with service providers that may contain general indemnification clauses which may permit indemnification to the extent permissible under applicable law. The Trust’s maximum exposure under these arrangements is unknown, as this would involve future claims that may be made against the Trust that have not yet occurred.
10. SUBSEQUENT EVENTS
Subsequent events after the date of the Statements of Assets and Liabilities have been evaluated through the date the financial statements were issued. Management has determined that there were no subsequent events to report through the issuance of these financial statements.
| Beacon Funds Trust | Report of Independent Registered Public Accounting Firm |
To the Shareholders of Beacon Accelerated Return Strategy Fund and Beacon Planned Return Strategy Fund and Board of Trustees of ALPS Series Trust
Opinion on the Financial Statements
We have audited the accompanying statements of assets and liabilities, including the portfolios of investments, of Beacon Funds Trust, comprising Beacon Accelerated Return Strategy Fund and Beacon Planned Return Strategy Fund (the “Funds”), each a series of ALPS Series Trust, as of September 30, 2024, the related statements of operations for the year then ended, the statements of changes in net assets for each of the two years in the period then ended, the financial highlights for each of the five years in the period then ended, and the related notes (collectively referred to as the “financial statements”). In our opinion, the financial statements present fairly, in all material respects, the financial position of each of the Funds as of September 30, 2024, the results of their operations for the year then ended, the changes in net assets for each of the two years in the period then ended, and the financial highlights for each of the five years in the period then ended, in conformity with accounting principles generally accepted in the United States of America.
Basis for Opinion
These financial statements are the responsibility of the Funds’ management. Our responsibility is to express an opinion on the Funds’ financial statements based on our audits. We are a public accounting firm registered with the Public Company Accounting Oversight Board (United States) (“PCAOB”) and are required to be independent with respect to the Funds in accordance with the U.S. federal securities laws and the applicable rules and regulations of the Securities and Exchange Commission and the PCAOB.
We conducted our audits in accordance with the standards of the PCAOB. Those standards require that we plan and perform the audit to obtain reasonable assurance about whether the financial statements are free of material misstatement whether due to error or fraud.
Our audits included performing procedures to assess the risks of material misstatement of the financial statements, whether due to error or fraud, and performing procedures that respond to those risks. Such procedures included examining, on a test basis, evidence regarding the amounts and disclosures in the financial statements. Our procedures included confirmation of securities owned as of September 30, 2024, by correspondence with the custodian and broker. Our audits also included evaluating the accounting principles used and significant estimates made by management, as well as evaluating the overall presentation of the financial statements. We believe that our audits provide a reasonable basis for our opinion.
We have served as the Funds’ auditor since 2018.

COHEN & COMPANY, LTD.
Cleveland, Ohio
November 27, 2024
| Annual Report | September 30, 2024 | 29 |
| Beacon Funds Trust | Tax Designation |
September 30, 2024 (Unaudited)
Pursuant to Section 852(b)(3) of the Internal Revenue Code the following Funds designate the amounts listed below as long-term capital gain dividends:
| Beacon Accelerated Return Strategy Fund | | $ | 0 | |
| Beacon Planned Return Strategy Fund | | $ | 14,663,898 | |


TABLE OF CONTENTS

| Schedule of Investments | 1 |
| Statement of Assets and Liabilities | 9 |
| Statement of Operations | 10 |
| Statements of Changes in Net Assets | 11 |
| Financial Highlights | 12 |
| Notes to Financial Statements and Financial Highlights | 14 |
| Report of Independent Registered Public Accounting Firm | 22 |
| Tax Designations | 23 |
| Brigade High Income Fund | Schedule of Investments |
September 30, 2024
| | | | | | | Shares | | | Value
(Note 2) | |
| COMMON STOCKS (0.93%) | | | | | | | | | | | | |
| Consumer, Cyclical (0.12%) | | | | | | | | | | | | |
| Libbey Glass Inc.(a)(b) | | | | | | | 166,360 | | | $ | 693,222 | |
| | | | | | | | | | | | | |
| Consumer, Non-cyclical (0.45%) | | | | | | | | | | | | |
| Aquity Holdings Inc.(a)(b)(c)(d) | | | | | | | 122,254 | | | | 18,662 | |
| Envision Healthcare Corp.(a)(b) | | | | | | | 250,693 | | | | 2,608,712 | |
| Total Consumer, Non-cyclical | | | | | | | | | | | 2,627,374 | |
| | | | | | | | | | | | | |
| Energy (0.11%) | | | | | | | | | | | | |
| Greenfire Resources, Ltd.(a) | | | | | | | 83,181 | | | | 619,698 | |
| | | | | | | | | | | | | |
| Technology (0.25%) | | | | | | | | | | | | |
| Avaya Holdings Corp.(a)(b)(c)(d) | | | | | | | 48,689 | | | | 925,578 | |
| Matrix Parent, Inc.(a)(b) | | | | | | | 37,758 | | | | 528,612 | |
| New Procera GP Company (Sandvine)(a)(b)(c) | | | | | | | 89,998 | | | | 1 | |
| Procera II LP (Sandvine)(a)(b)(c) | | | | | | | 89,998 | | | | 1 | |
| Total Technology | | | | | | | | | | | 1,454,192 | |
| | | | | | | | | | | | | |
| TOTAL COMMON STOCKS | | | | | | | | | | | | |
| (Cost $5,277,762) | | | | | | | | | | | 5,394,486 | |
| | | | | | | | | | | | | |
| | | Rate | | Maturity Date | | Principal Amount | | | Value
(Note 2) | |
| BANK LOANS (31.87%) | | | | | | | | | | | | |
| Basic Materials (0.43%) | | | | | | | | | | | | |
| Spectrum Group Buyer, Inc.(e) | | 3M SOFR + 6.50%, 0.75% Floor | | 5/19/2028 | | $ | 3,158,577 | | | $ | 2,499,224 | |
| | | | | | | | | | | | | |
| Communications (3.95%) | | | | | | | | | | | | |
| CMG Media Corp.(e) | | 3M SOFR + 3.50% | | 12/17/2026 | | | 3,345,131 | | | | 2,936,858 | |
| Hubbard Radio LLC(e) | | 1M US L + 4.25%, 1.00% Floor | | 3/28/2025 | | | 2,830,152 | | | | 2,235,820 | |
| Plusgrade, Inc.(e) | | 3M SOFR + 4.00% | | 3/4/2031 | | | 2,410,714 | | | | 2,410,714 | |
| StubHub Holdco Sub LLC(e) | | 1M SOFR + 4.75% | | 3/15/2030 | | | 1,881,102 | | | | 1,875,609 | |
| Syniverse Holdings LLC(e) | | 3M SOFR + 7.00%, 0.50% Floor | | 5/13/2027 | | | 5,506,877 | | | | 5,428,404 | |
| Viasat, Inc.(e) | | 1M US L + 4.50%, 0.50% Floor | | 5/30/2030 | | | 1,408,287 | | | | 1,279,781 | |
| Windstream Services LLC(e) | | 1M SOFR + 6.25%, 1.00% Floor | | 9/21/2027 | | | 1,820,980 | | | | 1,817,939 | |
| Xplore, Inc.(c)(e) | | 3M US L + 3.00%, 0.50% Floor | | 10/2/2028 | | | 5,229,283 | | | | 2,128,841 | |
| Zayo Group Holdings, Inc.(e) | | 1M SOFR + 3.00% | | 3/9/2027 | | | 3,073,900 | | | | 2,803,028 | |
| Total Communications | | | | | | | | | | | 22,916,994 | |
See Notes to Financial Statements and Financial Highlights.
| Annual Report | September 30, 2024 | 1 |
| Brigade High Income Fund | Schedule of Investments |
September 30, 2024
| | | Rate | | Maturity Date | | Principal Amount | | | Value
(Note 2) | |
| Consumer, Cyclical (7.55%) | | | | | | | | | | | | |
| Alterra Mountain(e) | | 1M SOFR + 3.25% | | 5/2/2028 | | $ | 2,075,099 | | | $ | 2,076,822 | |
| Atlantic Aviation(e) | | 1M SOFR + 2.75% | | 9/25/2028 | | | 1,989,770 | | | | 1,985,731 | |
| Century Casinos, Inc.(e) | | 1M SOFR + 6.00%, 0.75% Floor | | 4/2/2029 | | | 2,468,160 | | | | 2,327,795 | |
| Champ Acquisition Corp.(e) | | 3M US L + 5.50% | | 12/22/2025 | | | 2,037,655 | | | | 2,044,277 | |
| Delivery Hero(e) | | 3M SOFR + 5.00% | | 12/12/2029 | | | 1,689,870 | | | | 1,693,487 | |
| DS Parents, INC.(e) | | 3M SOFR + 5.50% | | 12/13/2030 | | | 2,897,738 | | | | 2,803,561 | |
| ECL Entertainment LLC(e) | | 1M SOFR + 4.00%, 0.75% Floor | | 8/30/2030 | | | 3,047,013 | | | | 3,053,686 | |
| J&J Ventures Gaming LLC(e) | | 1M SOFR + 4.25%, 0.75% Floor | | 4/26/2028 | | | 1,716,375 | | | | 1,708,514 | |
| Libbey Glass LLC(e) | | 3M SOFR + 6.50%, 0.75% Floor | | 11/22/2027 | | | 1,788,437 | | | | 1,764,598 | |
| Mad Engine Global LLC(e) | | 3M US L + 7.00%, 1.00% Floor | | 7/16/2027 | | | 2,284,447 | | | | 1,842,795 | |
| Mountaineer Merger Corp.(e) | | 6M SOFR + 7.00%, 0.75% Floor | | 10/26/2028 | | | 2,805,948 | | | | 2,272,818 | |
| Petco Health & Wellness(e) | | 3M SOFR + 3.25% | | 3/6/2028 | | | 2,102,497 | | | | 1,996,363 | |
| PetSmart(e) | | 1M SOFR + 3.75% | | 2/14/2028 | | | 2,139,286 | | | | 2,118,279 | |
| Premier Brands Group Holdings LLC(e) | | 3M SOFR + 10.00%, 1.00% Floor | | 3/20/2026 | | | 1,277,536 | | | | 1,175,333 | |
| Restoration Hardware Inc.(e) | | 1M SOFR + 2.50%, 0.50% Floor | | 10/20/2028 | | | 3,024,440 | | | | 2,904,974 | |
| Sabre GLBL, Inc.(e) | | 1M SOFR + 3.50%, 0.50% Floor | | 12/17/2027 | | | 3,345,435 | | | | 3,114,031 | |
| Sabre GLBL, Inc.(e) | | 1M SOFR + 4.25%, 0.50% Floor | | 6/30/2028 | | | 578,690 | | | | 541,318 | |
| SWF Holdings I Corp.(e) | | 1M SOFR + 4.00%, 0.75% Floor | | 10/6/2028 | | | 1,593,283 | | | | 1,309,153 | |
| Swissport(e) | | 3M SOFR + 4.25% | | 5/2/2028 | | | 1,839,390 | | | | 1,836,520 | |
| Warhorse Gaming, LLC(e) | | 1M SOFR + 9.25% | | 6/15/2028 | | | 5,083,743 | | | | 5,261,674 | |
| Total Consumer, Cyclical | | | | | | | | | | | 43,831,729 | |
| | | | | | | | | | | | | |
| Consumer, Non-cyclical (8.00%) | | | | | | | | | | | | |
| Alphia(e) | | 1M SOFR + 5.00% | | 5/2/2028 | | | 1,903,223 | | | | 1,797,270 | |
| Bausch Health Americas, Inc.(e) | | 1M SOFR + 5.25%, 0.50% Floor | | 2/1/2027 | | | 2,090,909 | | | | 2,004,136 | |
| Carestream Health, Inc.(e) | | 3M SOFR + 7.50%, 1.00% Floor | | 9/30/2027 | | | 5,629,512 | | | | 5,129,893 | |
| Envision Healthcare Operating, INC. TL 1L(e) | | 1M SOFR + 8.25% | | 12/30/2027 | | | 5,280,359 | | | | 5,275,976 | |
| Global Medical Response PIK(e) | | 3M SOFR + 5.50% | | 10/2/2028 | | | 4,593,136 | | | | 4,560,111 | |
| Jazz Pharmaceuticals(e) | | 1M SOFR + 2.25% | | 5/2/2028 | | | 2,674,442 | | | | 2,670,859 | |
| KNS Midco Corp.(e) | | 1M SOFR + 6.25%, 0.75% Floor | | 4/21/2027 | | | 5,031,095 | | | | 3,068,968 | |
| LifeScan Global Corp.(e) | | 3M SOFR + 6.50% | | 12/31/2026 | | | 10,316,439 | | | | 4,126,576 | |
| MODIVCARE(e) | | 3M SOFR + 4.75% | | 6/20/2031 | | | 2,817,938 | | | | 2,655,906 | |
| Naked Juice LLC(e) | | 3M SOFR + 3.25%, 0.50% Floor | | 1/24/2029 | | | 4,411,342 | | | | 3,599,390 | |
| Pluto Acquisition I, Inc.(e) | | 3M US L + 4.00% | | 9/20/2028 | | | 4,591,382 | | | | 4,185,825 | |
| Radiology Partners(e) | | 3M SOFR + 5.00% | | 1/31/2029 | | | 733,147 | | | | 716,197 | |
| Team Health Holdings, Inc.(e) | | 3M SOFR + 5.25%, 1.00% Floor | | 3/2/2027 | | | 6,993,019 | | | | 6,672,879 | |
| Total Consumer, Non-cyclical | | | | | | | | | | | 46,463,986 | |
| | | | | | | | | | | | | |
| Energy (2.66%) | | | | | | | | | | | | |
| EPIC Y-Grade Services(e) | | 3M SOFR + 5.75% | | 6/29/2029 | | | 2,630,600 | | | | 2,620,078 | |
| Goodnight(e) | | 3M SOFR + 5.25% | | 5/23/2029 | | | 2,327,566 | | | | 2,323,214 | |
| IMTT(e) | | 1M SOFR + 3.00% | | 5/2/2028 | | | 1,990,000 | | | | 1,991,652 | |
| New Fortress Energy 10/23 Cov-Lite(e) | | 3M SOFR + 5.00% | | 10/27/2028 | | | 4,764,000 | | | | 4,296,127 | |
| Spencer Spirit(e) | | 3M SOFR + 5.50% | | 6/25/2031 | | | 4,195,000 | | | | 4,189,756 | |
| Total Energy | | | | | | | | | | | 15,420,827 | |
| | | | | | | | | | | | | |
| Financials (2.23%) | | | | | | | | | | | | |
| Acrisure(e) | | 3M US L + 3.25% | | 11/6/2030 | | | 4,690,595 | | | | 4,640,780 | |
| Asurion(e) | | 1M SOFR + 4.25% | | 9/12/2030 | | | 2,939,064 | | | | 2,883,957 | |
| HUB International, Ltd.(e) | | 3M SOFR + 3.00%, 0.75% Floor | | 6/20/2030 | | | 3,199,808 | | | | 3,194,689 | |
| LifeMiles(e) | | 3M SOFR + 5.25% | | 8/31/2026 | | | 2,256,836 | | | | 2,256,836 | |
| Total Financials | | | | | | | | | | | 12,976,262 | |
See Notes to Financial Statements and Financial Highlights.
| Brigade High Income Fund | Schedule of Investments |
September 30, 2024
| | | Rate | | Maturity Date | | Principal Amount | | | Value
(Note 2) | |
| Industrials (2.70%) | | | | | | | | | | | | |
| Arconic(e) | | 1M SOFR + 3.75% | | 8/19/2030 | | $ | 2,328,893 | | | $ | 2,324,235 | |
| Flynn Canada Ltd., TL(e) | | 1M SOFR + 4.50% | | 7/31/2028 | | | 3,430,921 | | | | 3,388,034 | |
| Iris Holding, Inc.(e) | | 3M SOFR + 4.75%, 0.50% Floor | | 6/28/2028 | | | 2,613,592 | | | | 2,466,029 | |
| LRS Holdings LLC(e) | | 1M SOFR + 4.25%, 0.75% Floor | | 8/31/2028 | | | 2,963,527 | | | | 2,804,237 | |
| Pixelle Receivables Bridge(b)(e) | | 1M SOFR + 7.00% | | 6/11/2025 | | | 171,137 | | | | 167,715 | |
| Tenneco(e) | | 3M SOFR + 5.00% | | 11/17/2028 | | | 2,984,109 | | | | 2,830,099 | |
| Trinseo(e) | | 3M SOFR + 2.50% | | 12/12/2029 | | | 2,140,362 | | | | 1,687,483 | |
| Total Industrials | | | | | | | | | | | 15,667,832 | |
| | | | | | | | | | | | | |
| Technology (4.35%) | | | | | | | | | | | | |
| Avaya Inc.(e) | | 1M SOFR + 7.50% | | 8/1/2028 | | | 6,314,179 | | | | 5,549,722 | |
| BCP V Everise Acquisition LLC(e) | | 3M SOFR + 6.00% | | 12/20/2029 | | | 2,523,063 | | | | 2,463,140 | |
| Castle US Holding Corp.(e) | | 1M SOFR + 3.75% | | 1/29/2027 | | | 2,081,772 | | | | 1,375,822 | |
| Castle US Holding Corp.(e) | | 3M SOFR + 4.00%, 0.75% Floor | | 1/29/2027 | | | 1,724,343 | | | | 1,120,823 | |
| Magenta Security Holdings, LLC First Out(e) | | 3M SOFR + 6.75% | | 7/27/2028 | | | 2,558,257 | | | | 2,417,553 | |
| Magenta Security Holdings, LLC Second Out(e) | | 3M SOFR + 7.00% | | 7/27/2028 | | | 3,394,275 | | | | 2,325,078 | |
| Magenta Security Holdings, LLC Third Out(e) | | 3M SOFR + 6.25% | | 7/27/2028 | | | 613,982 | | | | 179,590 | |
| Mavenir Systems, Inc.(e) | | 3M US L + 4.75%, 0.50% Floor | | 8/18/2028 | | | 5,143,072 | | | | 3,353,694 | |
| McAfee Enterprise(e) | | 3M SOFR + 6.25% | | 7/27/2028 | | | 741,141 | | | | 753,496 | |
| Mobileum PIK EXIT(e) | | 3M SOFR + 1.00% | | 9/12/2029 | | | 820,255 | | | | 783,343 | |
| Quest Software, Inc.(e) | | 3M SOFR +4.25%, 0.50% Floor | | 2/1/2029 | | | 2,905,235 | | | | 1,931,981 | |
| Sandvine Corp.(b)(e) | | 3M SOFR + 4.50% | | 11/3/2025 | | | 8,624,938 | | | | 1,336,865 | |
| SS&C Technologies(e) | | 1M SOFR + 2.00% | | 5/9/2031 | | | 1,635,715 | | | | 1,635,437 | |
| Total Technology | | | | | | | | | | | 25,226,544 | |
| | | | | | | | | | | | | |
| TOTAL BANK LOANS | | | | | | | | | | | | |
| (Cost $195,454,530) | | | | | | | | | | | 185,003,398 | |
| | | | | | | | | | | | | |
| CONVERTIBLE CORPORATE BOND (0.07%) | | | | | | | | | | | | |
| Consumer, Cyclical (0.07%) | | | | | | | | | | | | |
| Liberty Interactive LLC | | 4.000% | | 11/15/2029 | | | 270,000 | | | | 95,850 | |
| Liberty Interactive LLC | | 3.750% | | 2/15/2030 | | | 840,000 | | | | 289,800 | |
| Total Consumer, Cyclical | | | | | | | | | | | 385,650 | |
| | | | | | | | | | | | | |
| TOTAL CONVERTIBLE CORPORATE BOND | | | | | | | | | | | | |
| (Cost $308,949) | | | | | | | | | | | 385,650 | |
| | | | | | | | | | | | | |
| CORPORATE BOND (59.73%) | | | | | | | | | | | | |
| Basic Materials (5.81%) | | | | | | | | | | | | |
| ASP Unifrax Holdings, Inc.(f) | | 5.250% | | 9/30/2028 | | | 1,405,000 | | | | 707,671 | |
| Axalta Coating Systems LLC(f) | | 3.375% | | 2/15/2029 | | | 2,955,000 | | | | 2,762,034 | |
| Baffinland Iron Mines Corp. / Baffinland Iron Mines LP(f) | | 8.750% | | 7/15/2026 | | | 5,200,000 | | | | 4,664,346 | |
| Cleveland-Cliffs, Inc.(f) | | 7.000% | | 3/15/2032 | | | 1,750,000 | | | | 1,764,728 | |
| Domtar Corp.(f) | | 6.750% | | 10/1/2028 | | | 5,110,000 | | | | 4,670,018 | |
| First Quantum Minerals, Ltd.(f) | | 8.625% | | 6/1/2031 | | | 3,115,000 | | | | 3,122,788 | |
| First Quantum Minerals, Ltd.(f) | | 9.375% | | 3/1/2029 | | | 270,000 | | | | 286,200 | |
| INEOS Finance PLC(f) | | 7.500% | | 4/15/2029 | | | 1,840,000 | | | | 1,920,802 | |
| Innophos Holdings, Inc.(f) | | 9.375% | | 2/15/2028 | | | 975,000 | | | | 913,076 | |
| Iris Holdings, Inc.(f)(g) | | 8.750% | | 2/15/2026 | | | 2,015,000 | | | | 1,885,536 | |
| Mineral Resources, Ltd.(f) | | 8.500% | | 5/1/2030 | | | 2,500,000 | | | | 2,600,000 | |
| Rain Carbon, Inc.(f) | | 12.250% | | 9/1/2029 | | | 3,480,000 | | | | 3,753,180 | |
| Rain CII Carbon LLC / CII Carbon Corp.(f) | | 7.250% | | 4/1/2025 | | | 73,000 | | | | 71,996 | |
| Tronox, Inc.(f) | | 4.625% | | 3/15/2029 | | | 4,940,000 | | | | 4,602,073 | |
| Total Basic Materials | | | | | | | | | | | 33,724,448 | |
See Notes to Financial Statements and Financial Highlights.
| Annual Report | September 30, 2024 | 3 |
| Brigade High Income Fund | Schedule of Investments |
September 30, 2024
| | | Rate | | Maturity Date | | Principal Amount | | | Value
(Note 2) | |
| Communications (12.43%) | | | | | | | | | | | | |
| Altice Financing SA(f) | | 5.750 | % | 8/15/2029 | | $ | 2,790,000 | | | $ | 2,238,417 | |
| Altice France SA(f) | | 5.500 | % | 10/15/2029 | | | 1,435,000 | | | | 1,006,676 | |
| Beasley Mezzanine Holdings LLC(f) | | 8.625 | % | 2/1/2026 | | | 3,765,000 | | | | 2,178,052 | |
| CCO Holdings LLC / CCO Holdings Capital Corp.(f) | | 5.375 | % | 6/1/2029 | | | 3,945,000 | | | | 3,794,972 | |
| CCO Holdings LLC / CCO Holdings Capital Corp.(f) | | 4.500 | % | 8/15/2030 | | | 3,215,000 | | | | 2,909,099 | |
| CCO Holdings LLC / CCO Holdings Capital Corp.(f) | | 4.250 | % | 1/15/2034 | | | 1,960,000 | | | | 1,608,729 | |
| Charter Communications Operating LLC / Charter Communications Operating Capital | | 6.550 | % | 6/1/2034 | | | 1,560,000 | | | | 1,621,483 | |
| Ciena Corp.(f) | | 4.000 | % | 1/31/2030 | | | 1,850,000 | | | | 1,750,470 | |
| CMG Media Corp.(f) | | 8.875 | % | 12/15/2027 | | | 4,130,000 | | | | 2,431,193 | |
| CommScope LLC(f) | | 7.125 | % | 7/1/2028 | | | 1,750,000 | | | | 1,452,500 | |
| CommScope LLC(f) | | 8.250 | % | 3/1/2027 | | | 2,050,000 | | | | 1,847,563 | |
| CommScope LLC(f) | | 6.000 | % | 3/1/2026 | | | 885,000 | | | | 859,601 | |
| CommScope Technologies LLC(f) | | 6.000 | % | 6/15/2025 | | | 310,000 | | | | 300,254 | |
| CSC Holdings LLC(f) | | 6.500 | % | 2/1/2029 | | | 2,585,000 | | | | 2,139,087 | |
| CSC Holdings LLC(f) | | 7.500 | % | 4/1/2028 | | | 1,100,000 | | | | 734,456 | |
| Dish DBS Corp.(f) | | 5.250 | % | 12/1/2026 | | | 3,190,000 | | | | 2,947,586 | |
| Dish DBS Corp. | | 7.750 | % | 7/1/2026 | | | 1,515,000 | | | | 1,314,263 | |
| Dish DBS Corp. | | 7.375 | % | 7/1/2028 | | | 1,205,000 | | | | 906,763 | |
| Dish DBS Corp., Series WI | | 5.125 | % | 6/1/2029 | | | 1,000,000 | | | | 662,875 | |
| Gray Television, Inc.(f) | | 10.500 | % | 7/15/2029 | | | 2,825,000 | | | | 2,942,944 | |
| Gray Television, Inc.(f) | | 4.750 | % | 10/15/2030 | | | 2,440,000 | | | | 1,549,400 | |
| Gray Television, Inc.(f) | | 7.000 | % | 5/15/2027 | | | 1,355,000 | | | | 1,331,288 | |
| Gray Television, Inc.(f) | | 5.375 | % | 11/15/2031 | | | 2,420,000 | | | | 1,491,325 | |
| GrubHub Holdings, Inc.(f) | | 5.500 | % | 7/1/2027 | | | 3,260,000 | | | | 3,019,143 | |
| Level 3 Financing, Inc.(f) | | 3.625 | % | 1/15/2029 | | | 1,165,000 | | | | 812,588 | |
| Level 3 Financing, Inc.(f) | | 3.750 | % | 7/15/2029 | | | 3,535,000 | | | | 2,404,436 | |
| Level 3 Financing, Inc.(f) | | 10.500 | % | 5/15/2030 | | | 985,000 | | | | 1,068,725 | |
| Level 3 Financing, Inc.(f) | | 11.000 | % | 11/15/2029 | | | 549,309 | | | | 609,316 | |
| Level 3 Financing, Inc.(f) | | 4.875 | % | 6/15/2029 | | | 675,000 | | | | 568,333 | |
| Level 3 Financing, Inc.(f) | | 4.500 | % | 4/1/2030 | | | 885,000 | | | | 691,041 | |
| Level 3 Financing, Inc.(f) | | 3.875 | % | 10/15/2030 | | | 2,535,000 | | | | 1,873,555 | |
| Lumen Technologies, Inc.(f) | | 4.125 | % | 4/15/2030 | | | 423,226 | | | | 344,929 | |
| Lumen Technologies, Inc., Series P | | 7.600 | % | 9/15/2039 | | | 945,000 | | | | 645,908 | |
| Lumen Technologies, Inc.(f) | | 4.125 | % | 4/15/2029 | | | 423,184 | | | | 358,483 | |
| McGraw-Hill Education, Inc.(f) | | 7.375 | % | 9/1/2031 | | | 800,000 | | | | 830,110 | |
| McGraw-Hill Education, Inc.(f) | | 5.750 | % | 8/1/2028 | | | 2,800,000 | | | | 2,762,889 | |
| Spanish Broadcasting System, Inc.(f) | | 9.750 | % | 3/1/2026 | | | 4,390,000 | | | | 2,905,302 | |
| Urban One, Inc.(f) | | 7.375 | % | 2/1/2028 | | | 6,130,000 | | | | 4,242,982 | |
| Viasat, Inc.(f) | | 6.500 | % | 7/15/2028 | | | 900,000 | | | | 706,166 | |
| Viasat, Inc.(f) | | 7.500 | % | 5/30/2031 | | | 1,905,000 | | | | 1,307,306 | |
| Vmed O2 UK Financing I PLC(f) | | 4.250 | % | 1/31/2031 | | | 3,000,000 | | | | 2,650,065 | |
| Windstream Escrow LLC / Windstream Escrow Finance Corp.(f) | | 7.750 | % | 8/15/2028 | | | 1,650,000 | | | | 1,651,568 | |
| Zayo Group Holdings, Inc.(f) | | 4.000 | % | 3/1/2027 | | | 1,455,000 | | | | 1,304,683 | |
| Zayo Group Holdings, Inc.(f) | | 6.125 | % | 3/1/2028 | | | 1,670,000 | | | | 1,386,100 | |
| Total Communications | | | | | | | | | | | 72,162,624 | |
See Notes to Financial Statements and Financial Highlights.
| Brigade High Income Fund | Schedule of Investments |
September 30, 2024
| | | Rate | | Maturity Date | | Principal Amount | | | Value
(Note 2) | |
| Consumer, Cyclical (10.71%) | | | | | | | | | | | | |
| 1011778 BC ULC / New Red Finance, Inc.(f) | | 4.375 | % | 1/15/2028 | | $ | 1,500,000 | | | $ | 1,456,138 | |
| 1011778 BC ULC / New Red Finance, Inc.(f) | | 3.875 | % | 1/15/2028 | | | 2,500,000 | | | | 2,403,125 | |
| Academy, Ltd.(f) | | 6.000 | % | 11/15/2027 | | | 1,750,000 | | | | 1,754,375 | |
| Bath & Body Works, Inc.(f) | | 6.625 | % | 10/1/2030 | | | 2,890,000 | | | | 2,944,187 | |
| Brookfield Residential Properties, Inc. / Brookfield Residential US LLC(f) | | 4.875 | % | 2/15/2030 | | | 535,000 | | | | 503,462 | |
| Brookfield Residential Properties, Inc. / Brookfield Residential US LLC(f) | | 5.000 | % | 6/15/2029 | | | 2,985,000 | | | | 2,852,906 | |
| Caesars Entertainment, Inc.(f) | | 7.000 | % | 2/15/2030 | | | 2,620,000 | | | | 2,732,122 | |
| Carnival Corp.(f) | | 4.000 | % | 8/1/2028 | | | 1,870,000 | | | | 1,804,887 | |
| Carnival Corp.(f) | | 10.500 | % | 6/1/2030 | | | 2,240,000 | | | | 2,432,685 | |
| Carnival Holdings Bermuda, Ltd.(f) | | 10.375 | % | 5/1/2028 | | | 2,360,000 | | | | 2,547,148 | |
| Empire Resorts, Inc.(f) | | 7.750 | % | 11/1/2026 | | | 4,630,000 | | | | 4,451,976 | |
| Genting New York LLC / GENNY Capital, Inc.(f) | | 7.250 | % | 10/1/2029 | | | 2,000,000 | | | | 2,022,500 | |
| Hilton Domestic Operating Co., Inc.(f) | | 4.000 | % | 5/1/2031 | | | 4,505,000 | | | | 4,201,395 | |
| International Game Technology PLC(f) | | 6.250 | % | 1/15/2027 | | | 1,550,000 | | | | 1,583,015 | |
| International Game Technology PLC(f) | | 5.250 | % | 1/15/2029 | | | 940,000 | | | | 937,227 | |
| Jacobs Entertainment, Inc.(f) | | 6.750 | % | 2/15/2029 | | | 3,970,000 | | | | 3,848,161 | |
| Liberty Interactive LLC | | 8.500 | % | 7/15/2029 | | | 4,125,000 | | | | 2,165,736 | |
| Liberty Interactive LLC | | 8.250 | % | 2/1/2030 | | | 2,620,000 | | | | 1,371,495 | |
| QVC, Inc.(f) | | 6.875 | % | 4/15/2029 | | | 3,600,000 | | | | 2,988,000 | |
| Studio City Finance, Ltd.(f) | | 5.000 | % | 1/15/2029 | | | 2,530,000 | | | | 2,334,758 | |
| SWF Holdings I Corp.(f) | | 6.500 | % | 10/1/2029 | | | 930,000 | | | | 593,456 | |
| United Airlines, Inc.(f) | | 4.375 | % | 4/15/2026 | | | 2,520,000 | | | | 2,477,185 | |
| Victoria's Secret & Co.(f) | | 4.625 | % | 7/15/2029 | | | 2,570,000 | | | | 2,261,921 | |
| Walgreens Boots Alliance, Inc. | | 4.800 | % | 11/18/2044 | | | 2,350,000 | | | | 1,754,722 | |
| Wynn Macau, Ltd.(f) | | 5.625 | % | 8/26/2028 | | | 1,805,000 | | | | 1,753,197 | |
| Wynn Resorts Finance LLC / Wynn Resorts Capital Corp.(f) | | 7.125 | % | 2/15/2031 | | | 1,320,000 | | | | 1,419,000 | |
| Wynn Resorts Finance LLC / Wynn Resorts Capital Corp.(f) | | 6.250 | % | 3/15/2033 | | | 860,000 | | | | 871,266 | |
| Yum! Brands, Inc. | | 6.875 | % | 11/15/2037 | | | 2,335,000 | | | | 2,644,679 | |
| Yum! Brands, Inc. | | 3.625 | % | 3/15/2031 | | | 1,135,000 | | | | 1,048,385 | |
| Total Consumer, Cyclical | | | | | | | | | | | 62,159,109 | |
| | | | | | | | | | | | | |
| Consumer, Non-cyclical (10.94%) | | | | | | | | | | | | |
| Akumin, Inc.(f) | | 8.000 | % | 8/1/2028 | | | 200,000 | | | | 164,550 | |
| Akumin, Inc.(f)(g) | | 9.000 | % | 8/1/2027 | | | 4,910,000 | | | | 4,380,947 | |
| Bellis Acquisition Co. PLC(f) | | 8.125 | % | 5/14/2030 | | | 1,245,000 | | | | 1,643,398 | |
| Charles River Laboratories International, Inc.(f) | | 3.750 | % | 3/15/2029 | | | 2,450,000 | | | | 2,300,550 | |
| CPI CG, Inc.(f) | | 10.000 | % | 7/15/2029 | | | 1,840,000 | | | | 1,935,721 | |
| DaVita, Inc.(f) | | 3.750 | % | 2/15/2031 | | | 2,310,000 | | | | 2,081,888 | |
| DaVita, Inc.(f) | | 6.875 | % | 9/1/2032 | | | 130,000 | | | | 134,225 | |
| Embecta Corp.(f) | | 6.750 | % | 2/15/2030 | | | 2,590,000 | | | | 2,451,759 | |
| Embecta Corp.(f) | | 5.000 | % | 2/15/2030 | | | 310,000 | | | | 284,865 | |
| Global Medical Response, Inc.(f)(g) | | 10.000 | % | 10/31/2028 | | | 4,932,828 | | | | 4,953,073 | |
| Medline Borrower LP(f) | | 3.875 | % | 4/1/2029 | | | 2,825,000 | | | | 2,669,060 | |
| Molina Healthcare, Inc.(f) | | 3.875 | % | 11/15/2030 | | | 3,735,000 | | | | 3,465,788 | |
| New Albertsons LP | | 7.450 | % | 8/1/2029 | | | 4,000,000 | | | | 4,210,350 | |
| New Albertsons LP | | 8.000 | % | 5/1/2031 | | | 2,500,000 | | | | 2,681,993 | |
| Radiology Partners, Inc.(f)(g) | | 7.775 | % | 1/31/2029 | | | 6,375,563 | | | | 6,327,746 | |
| Radiology Partners, Inc.(f)(g) | | 9.781 | % | 2/15/2030 | | | 3,808,289 | | | | 3,598,833 | |
| StoneMor, Inc.(f) | | 8.500 | % | 5/15/2029 | | | 3,430,000 | | | | 3,058,631 | |
| Team Health Holdings, Inc.(b)(f)(g) | | 13.500 | % | 6/30/2028 | | | 4,580,325 | | | | 5,095,612 | |
| Tenet Healthcare Corp. | | 4.625 | % | 6/15/2028 | | | 7,270,000 | | | | 7,138,849 | |
| United Rentals North America, Inc. | | 4.000 | % | 7/15/2030 | | | 5,200,000 | | | | 4,909,550 | |
| Total Consumer, Non-cyclical | | | | | | | | | | | 63,487,388 | |
See Notes to Financial Statements and Financial Highlights.
| Annual Report | September 30, 2024 | 5 |
| Brigade High Income Fund | Schedule of Investments |
September 30, 2024
| | | Rate | | Maturity Date | | Principal Amount | | | Value
(Note 2) | |
| Energy (5.64%) | | | | | | | | | | |
| Antero Midstream Partners LP / Antero Midstream Finance Corp.(f) | | 5.375 | % | 6/15/2029 | | $ | 2,560,000 | | | $ | 2,533,818 | |
| Baytex Energy Corp.(f) | | 7.375 | % | 3/15/2032 | | | 2,040,000 | | | | 2,032,432 | |
| Blue Racer Midstream LLC / Blue Racer Finance Corp.(f) | | 7.000 | % | 7/15/2029 | | | 960,000 | | | | 997,600 | |
| Blue Racer Midstream LLC / Blue Racer Finance Corp.(f) | | 7.250 | % | 7/15/2032 | | | 960,000 | | | | 1,006,680 | |
| Civitas Resources, Inc.(f) | | 8.625 | % | 11/1/2030 | | | 1,640,000 | | | | 1,735,858 | |
| EnLink Midstream LLC | | 5.375 | % | 6/1/2029 | | | 970,000 | | | | 993,909 | |
| EnLink Midstream LLC(f) | | 6.500 | % | 9/1/2030 | | | 2,010,000 | | | | 2,166,184 | |
| EnLink Midstream Partners LP | | 5.600 | % | 4/1/2044 | | | 1,015,000 | | | | 968,772 | |
| Genesis Energy LP / Genesis Energy Finance Corp. | | 8.875 | % | 4/15/2030 | | | 2,700,000 | | | | 2,835,849 | |
| Greenfire Resources, Ltd.(f) | | 12.000 | % | 10/1/2028 | | | 2,955,000 | | | | 3,196,079 | |
| Occidental Petroleum Corp. | | 6.125 | % | 1/1/2031 | | | 1,900,000 | | | | 2,010,951 | |
| Transocean, Inc. | | 7.500 | % | 4/15/2031 | | | 1,795,000 | | | | 1,655,719 | |
| Transocean, Inc.(f) | | 8.000 | % | 2/1/2027 | | | 829,000 | | | | 827,121 | |
| Transocean, Inc.(f) | | 8.750 | % | 2/15/2030 | | | 2,103,750 | | | | 2,187,585 | |
| Valaris, Ltd.(f) | | 8.375 | % | 4/30/2030 | | | 2,375,000 | | | | 2,448,696 | |
| Venture Global Calcasieu Pass LLC(f) | | 4.125 | % | 8/15/2031 | | | 3,635,000 | | | | 3,376,006 | |
| Venture Global Calcasieu Pass LLC(f) | | 3.875 | % | 11/1/2033 | | | 1,990,000 | | | | 1,778,364 | |
| Total Energy | | | | | | | | | | | 32,751,623 | |
| | | | | | | | | | | | | |
| Financials (10.14%) | | | | | | | | | | | | |
| Apollo Commercial Real Estate Finance, Inc.(f) | | 4.625 | % | 6/15/2029 | | | 4,170,000 | | | | 3,737,362 | |
| Barclays PLC(h) | | 9.625 | % | Perpetual | | | 2,880,000 | | | | 3,236,400 | |
| Diversified Healthcare Trust | | 4.375 | % | 3/1/2031 | | | 6,040,000 | | | | 4,966,088 | |
| Finance of America Funding LLC(f) | | 7.875 | % | 11/15/2025 | | | 3,390,000 | | | | 2,744,770 | |
| Freedom Mortgage Corp.(f) | | 7.625 | % | 5/1/2026 | | | 500,000 | | | | 505,000 | |
| Freedom Mortgage Corp.(f) | | 6.625 | % | 1/15/2027 | | | 2,310,000 | | | | 2,309,655 | |
| Freedom Mortgage Corp.(f) | | 12.000 | % | 10/1/2028 | | | 970,000 | | | | 1,059,496 | |
| Icahn Enterprises LP / Icahn Enterprises Finance Corp.(f) | | 9.000 | % | 6/15/2030 | | | 1,735,000 | | | | 1,746,668 | |
| Ladder Capital Finance Holdings LLLP / Ladder Capital Finance Corp.(f) | | 4.250 | % | 2/1/2027 | | | 3,390,000 | | | | 3,305,963 | |
| Ladder Capital Finance Holdings LLLP / Ladder Capital Finance Corp.(f) | | 4.750 | % | 6/15/2029 | | | 1,380,000 | | | | 1,348,840 | |
| LD Holdings Group LLC(f) | | 6.125 | % | 4/1/2028 | | | 585,000 | | | | 516,215 | |
| LD Holdings Group LLC(f) | | 8.750 | % | 11/1/2027 | | | 1,336,000 | | | | 1,292,887 | |
| Lloyds Banking Group PLC(h) | | 7.500 | % | Perpetual | | | 3,170,000 | | | | 3,205,472 | |
| Midcap Financial Issuer Trust(f) | | 5.625 | % | 1/15/2030 | | | 2,235,000 | | | | 2,059,553 | |
| Midcap Financial Issuer Trust(f) | | 6.500 | % | 5/1/2028 | | | 2,350,000 | | | | 2,272,697 | |
| Navient Corp. | | 5.500 | % | 3/15/2029 | | | 1,105,000 | | | | 1,073,467 | |
| Navient Corp. | | 5.625 | % | 8/1/2033 | | | 2,110,000 | | | | 1,872,593 | |
| OneMain Finance Corp. | | 7.500 | % | 5/15/2031 | | | 1,310,000 | | | | 1,348,062 | |
| OneMain Finance Corp. | | 7.125 | % | 11/15/2031 | | | 735,000 | | | | 743,432 | |
| OneMain Finance Corp. | | 5.375 | % | 11/15/2029 | | | 2,615,000 | | | | 2,513,739 | |
| PennyMac Financial Services, Inc.(f) | | 5.375 | % | 10/15/2025 | | | 1,325,000 | | | | 1,321,688 | |
| PennyMac Financial Services, Inc.(f) | | 4.250 | % | 2/15/2029 | | | 2,890,000 | | | | 2,752,118 | |
| PennyMac Financial Services, Inc.(f) | | 7.875 | % | 12/15/2029 | | | 760,000 | | | | 809,831 | |
| Service Properties Trust | | 5.500 | % | 12/15/2027 | | | 1,080,000 | | | | 1,026,623 | |
| Service Properties Trust(f) | | 8.625 | % | 11/15/2031 | | | 3,190,000 | | | | 3,465,847 | |
| Starwood Property Trust, Inc.(f) | | 3.625 | % | 7/15/2026 | | | 4,835,000 | | | | 4,665,775 | |
| Uniti Group LP / Uniti Fiber Holdings, Inc. / CSL Capital LLC(f) | | 6.000 | % | 1/15/2030 | | | 935,000 | | | | 794,750 | |
| Uniti Group LP / Uniti Group Finance, Inc. / CSL Capital LLC(f) | | 6.500 | % | 2/15/2029 | | | 520,000 | | | | 450,284 | |
| Uniti Group LP / Uniti Group Finance, Inc. / CSL Capital LLC(f) | | 10.500 | % | 2/15/2028 | | | 1,590,000 | | | | 1,696,610 | |
| Total Financials | | | | | | | | | | | 58,841,885 | |
See Notes to Financial Statements and Financial Highlights.
| Brigade High Income Fund | Schedule of Investments |
September 30, 2024
| | | Rate | | | Maturity Date | | | Principal Amount | | | Value
(Note 2) | |
| Industrials (2.81%) | | | | | | | | | | | | | | | | |
| Ball Corp. | | | 3.125 | % | | | 9/15/2031 | | | $ | 4,100,000 | | | $ | 3,635,611 | |
| Builders FirstSource, Inc.(f) | | | 6.375 | % | | | 3/1/2034 | | | | 1,400,000 | | | | 1,454,124 | |
| Coherent Corp.(f) | | | 5.000 | % | | | 12/15/2029 | | | | 2,645,000 | | | | 2,583,607 | |
| Miter Brands Acquisition Holdco, Inc. / MIWD Borrower LLC(f) | | | 6.750 | % | | | 4/1/2032 | | | | 1,670,000 | | | | 1,729,886 | |
| TransDigm, Inc.(f) | | | 7.125 | % | | | 12/1/2031 | | | | 6,550,000 | | | | 6,926,625 | |
| Total Industrials | | | | | | | | | | | | | | | 16,329,853 | |
| | | | | | | | | | | | | | | | | |
| Technology (0.48%) | | | | | | | | | | | | | | | | |
| Pitney Bowes, Inc.(f) | | | 6.875 | % | | | 3/15/2027 | | | | 1,190,000 | | | | 1,182,563 | |
| Pitney Bowes, Inc.(f) | | | 7.250 | % | | | 3/15/2029 | | | | 1,660,000 | | | | 1,630,369 | |
| Total Technology | | | | | | | | | | | | | | | 2,812,932 | |
| | | | | | | | | | | | | | | | | |
| Utilities (0.77%) | | | | | | | | | | | | | | | | |
| Vistra Corp.(f)(h) | | | 5Y US TI + 5.74 | % | | | Perpetual | | | | 3,400,000 | | | | 3,476,330 | |
| Vistra Operations Co. LLC(f) | | | 5.625 | % | | | 2/15/2027 | | | | 1,000,000 | | | | 997,850 | |
| Total Utilities | | | | | | | | | | | | | | | 4,474,180 | |
| | | | | | | | | | | | | | | | | |
| TOTAL CORPORATE BOND | | | | | | | | | | | | | | | | |
| (Cost $330,545,229) | | | | | | | | | | | | | | | 346,744,042 | |
| | | | | | | | | | | | | | | | | |
| | | | | | | 7-Day Yield | | | Shares | | | Value
(Note 2) | |
| SHORT TERM INVESTMENTS (6.83%) | | | | | | | | | | | | | | | | |
| State Street Institutional US Government Money Market Fund, Premier Class | | | | | | | 4.944 | % | | | 39,661,970 | | | $ | 39,661,970 | |
| | | | | | | | | | | | | | | | | |
| TOTAL SHORT TERM INVESTMENTS | | | | | | | | | | | | | | | | |
| (Cost $39,661,970) | | | | | | | | | | | | | | | 39,661,970 | |
| | | | | | | | | | | | | | | | | |
| TOTAL INVESTMENTS (99.43%) | | | | | | | | | | | | | | | | |
| (Cost $571,248,440) | | | | | | | | | | | | | | $ | 577,189,546 | |
| | | | | | | | | | | | | | | | | |
| OTHER ASSETS IN EXCESS OF LIABILITIES (0.57%) | | | | | | | | | | | | | | | 3,287,235 | |
| | | | | | | | | | | | | | | | | |
| NET ASSETS (100.00%) | | | | | | | | | | | | | | $ | 580,476,781 | |
| (a) | Non-income producing security. |
| (b) | Security deemed to be illiquid under the procedures approved by the Fund's Board of Trustees. As of September 30, 2024, the fair value of illiquid securities in the aggregate was $11,374,980, representing 1.96% of the Fund's net assets. |
| (c) | As a result of the use of significant unobservable inputs to determine fair value, these investments have been classified as Level 3 assets. Additional information on Level 3 assets can be found in Note 2. Significant Accounting Policies in the Notes to Financial Statements section. |
| (d) | Security deemed to be restricted as of September 30, 2024. As of September 30, 2024, the fair value of restricted securities in the aggregate was $944,240 representing 0.16% of the Fund’s net assets. Additional information on restricted securities can be found in Note 2. Significant Accounting Policies in the Notes to Financial Statements section. |
| (e) | Floating or variable rate security. The reference rate is described below. The rate in effect as of September 30, 2024 is based on the reference rate plus the displayed spread as of the securities last reset date. |
| (f) | Securities exempt from registration under Rule 144A of the Securities Act of 1933. These securities may be resold in transactions exempt from registration, normally to qualified institutional buyers. As of September 30, 2024 the fair value of securities restricted under Rule 144A in the aggregate was $281,580,304, representing 48.51% of net assets. |
| (h) | Security is a perpetual bond. |
See Notes to Financial Statements and Financial Highlights.
| Annual Report | September 30, 2024 | 7 |
| Brigade High Income Fund | Schedule of Investments |
September 30, 2024
Investment Abbreviations:
LIBOR - London Interbank Offered Rate
SOFR - Standard Overnight Financing Rate
Rates:
1M US L - 1 Month LIBOR as of September 30, 2024 was 4.96%
3M US L - 3 Month LIBOR as of September 30, 2024 was 4.85%
1M SOFR - 1 Month US SOFR as of September 30, 2024 was 4.85%
3M SOFR - 3 Month US SOFR as of September 30, 2024 was 4.59%
5Y US TI - 5 Year US Treasury Index as of September 30, 2024 was 3.58%
For Fund compliance purposes, the Fund's industry classifications refer to any one or more of the industry sub-classifications used by one or more widely recognized market indices or ratings group indices and/or as defined by Fund management. This definition may not apply for purposes of this report, which may use a different classification system or may combine industry sub-classifications for reporting ease. Industries are shown as a percent of the Fund's net assets. (Unaudited)
See Notes to Financial Statements and Financial Highlights.
| Brigade High Income Fund | Statement of Assets and Liabilities |
September 30, 2024
| ASSETS: | | | |
| Investments, at value (Cost $571,248,440) | | $ | 577,189,546 | |
| Cash and cash equivalents | | | 11,789,788 | |
| Receivable for investments sold | | | 3,563,644 | |
| Dividends and interest receivable | | | 8,901,650 | |
| Other assets | | | 19,360 | |
| Total Assets | | | 601,463,988 | |
| | | | | |
| LIABILITIES: | | | | |
| Payable for administration and transfer agent fees | | | 59,686 | |
| Payable for investments purchased | | | 20,696,894 | |
| Payable to adviser | | | 176,612 | |
| Payable for printing fees | | | 2,932 | |
| Payable for professional fees | | | 33,934 | |
| Payable for trustees' fees and expenses | | | 364 | |
| Payable to Chief Compliance Officer fees | | | 2,500 | |
| Accrued expenses and other liabilities | | | 14,285 | |
| Total Liabilities | | | 20,987,207 | |
| NET ASSETS | | $ | 580,476,781 | |
| | | | | |
| NET ASSETS CONSIST OF: | | | | |
| Paid-in capital (Note 5) | | $ | 562,274,127 | |
| Total distributable earnings/(deficit) | | | 18,202,654 | |
| NET ASSETS | | $ | 580,476,781 | |
| | | | | |
| PRICING OF SHARES | | | | |
| Founders Class: | | | | |
| Net Asset Value, offering and redemption price per share | | $ | 10.46 | |
| Net Assets | | $ | 580,464,717 | |
| Shares of beneficial interest outstanding | | | 55,482,164 | |
| Institutional Class: | | | | |
| Net Asset Value, offering and redemption price per share | | $ | 10.45 | * |
| Net Assets | | $ | 12,064 | |
| Shares of beneficial interest outstanding | | | 1,154 | |
| * | Does not recalculate to actual daily NAV of 10.46 due to rounding of shares and assets for presentation purposes. |
See Notes to Financial Statements and Financial Highlights.
| Annual Report | September 30, 2024 | 9 |
| Brigade High Income Fund | Statement of Operations |
For the Year Ended September 30, 2024
| INVESTMENT INCOME: | | | |
| Dividends | | $ | 40,464 | |
| Interest | | | 57,485,857 | |
| Total Investment Income | | | 57,526,321 | |
| | | | | |
| EXPENSES: | | | | |
| Investment advisory fees (Note 6) | | | 2,550,492 | |
| Fund Accounting and Administration fees | | | 334,053 | |
| Co-administration fees | | | 255,049 | |
| Custody fees | | | 24,826 | |
| Legal fees | | | 45,364 | |
| Audit and tax fees | | | 26,013 | |
| Transfer agent fees | | | 20,622 | |
| Trustees' fees and expenses | | | 49,055 | |
| Registration and filing fees | | | 35,063 | |
| Printing fees | | | 10,544 | |
| Chief Compliance Officer fees | | | 30,000 | |
| Insurance fees | | | 14,725 | |
| Offering costs | | | 111,467 | |
| Other expenses | | | 11,513 | |
| Total Expenses | | | 3,518,786 | |
| Less fees waived/reimbursed by investment adviser (Note 6) | | | | |
| Founders Class | | | (863,781 | ) |
| Net Expenses | | | 2,655,005 | |
| NET INVESTMENT INCOME | | | 54,871,316 | |
| | | | | |
| REALIZED AND UNREALIZED GAIN/(LOSS) ON INVESTMENTS AND FOREIGN CURRENCY: | | | | |
| Net realized gain/(loss) on: | | | | |
| Investments | | | 12,692,045 | |
| Foreign currency transactions | | | (48,589 | ) |
| Net realized gain | | | 12,643,456 | |
| Change in unrealized appreciation/(depreciation) on: | | | | |
| Investments | | | 5,598,217 | |
| Translation of asset and liabilities denominated in foreign currency | | | (35,834 | ) |
| Net change | | | 5,562,383 | |
| | | | | |
| NET REALIZED AND UNREALIZED GAIN ON INVESTMENTS AND FOREIGN CURRENCY | | | 18,205,839 | |
| NET INCREASE IN NET ASSETS RESULTING FROM OPERATIONS | | $ | 73,077,155 | |
See Notes to Financial Statements and Financial Highlights.
| Brigade High Income Fund | Statements of Changes in Net Assets |
| | | For the Year
Ended
September 30,
2024 | | | For the Period
Ended
September 30,
2023 (a) | |
| OPERATIONS: | | | | | | | | |
| Net investment income | | $ | 54,871,316 | | | $ | 12,754,167 | |
| Net realized gain on investments and foreign currency | | | 12,643,456 | | | | 354,412 | |
| Net change in unrealized appreciation on investments and foreign currency | | | 5,562,383 | | | | 342,889 | |
| Net increase in net assets resulting from operations | | | 73,077,155 | | | | 13,451,468 | |
| | | | | | | | | |
| DISTRIBUTIONS TO SHAREHOLDERS | | | | | | | | |
| Founders Class | | | (58,815,049 | ) | | | (9,540,155 | ) |
| Institutional Class | | | (1,268 | ) | | | (288 | ) |
| Total distributions | | | (58,816,317 | ) | | | (9,540,443 | ) |
| | | | | | | | | |
| BENEFICIAL SHARE TRANSACTIONS (Note 5): | | | | | | | | |
| Founders Class | | | | | | | | |
| Shares sold | | | 118,771,360 | | | | 463,090,200 | |
| Dividends reinvested | | | 58,310,737 | | | | 9,540,155 | |
| Shares redeemed | | | (87,419,089 | ) | | | – | |
| Net increase from beneficial share transactions | | | 89,663,008 | | | | 472,630,355 | |
| | | | | | | | | |
| Institutional Class | | | | | | | | |
| Shares sold | | | – | | | | 10,360 | |
| Dividends reinvested | | | 1,267 | | | | 288 | |
| Shares redeemed | | | – | | | | (360 | ) |
| Net increase from beneficial share transactions | | | 1,267 | | | | 10,288 | |
| Net increase in net assets | | | 103,925,113 | | | | 476,551,668 | |
| | | | | | | | | |
| NET ASSETS: | | | | | | | | |
| Beginning of year | | | 476,551,668 | | | | – | |
| End of year | | $ | 580,476,781 | | | $ | 476,551,668 | |
| (a) | For the period May 2, 2023 (Commencement of Operations) to September 30, 2023. The Founders Class and Institutional Class commenced operations on May 2, 2023 and May 5, 2023, respectively. |
See Notes to Financial Statements and Financial Highlights.
| Annual Report | September 30, 2024 | 11 |
| Brigade High Income Fund | Financial Highlights |
| Founders Class | For a Share Outstanding Throughout the Period Presented |
| | | For the Year
Ended
September 30, 2024 | | | For the Period Ended September 30, 2023 (a) | |
| NET ASSET VALUE, BEGINNING OF PERIOD | | $ | 10.18 | | | $ | 10.00 | |
| INCOME/(LOSS) FROM OPERATIONS: | | | | | | | | |
| Net investment income(b) | | | 1.10 | | | | 0.43 | |
| Net realized and unrealized gain on investments | | | 0.36 | | | | 0.04 | |
| Total from investment operations | | | 1.46 | | | | 0.47 | |
| | | | | | | | | |
| LESS DISTRIBUTIONS: | | | | | | | | |
| From net investment income | | | (1.17 | ) | | | (0.29 | ) |
| From net realized gains on investments | | | (0.01 | ) | | | – | |
| Total Distributions | | | (1.18 | ) | | | (0.29 | ) |
| NET INCREASE IN NET ASSET VALUE | | | 0.28 | | | | 0.18 | |
| NET ASSET VALUE, END OF PERIOD | | $ | 10.46 | | | $ | 10.18 | |
| | | | | | | | | |
| TOTAL RETURN(c) | | | 15.34 | % | | | 4.74 | % |
| | | | | | | | | |
| SUPPLEMENTAL DATA: | | | | | | | | |
| Net assets, end of period (in 000s) | | $ | 580,465 | | | $ | 476,541 | |
| | | | | | | | | |
| RATIOS TO AVERAGE NET ASSETS | | | | | | | | |
| Operating expenses excluding reimbursement/waiver | | | 0.69 | % | | | 0.74 | %(d) |
| Operating expenses including reimbursement/waiver | | | 0.52 | % | | | 0.52 | %(d) |
| Net investment income including reimbursement/waiver | | | 10.75 | % | | | 10.27 | %(d) |
| | | | | | | | | |
| PORTFOLIO TURNOVER RATE | | | 49 | % | | | 8 | %(e) |
| (a) | For the period May 2, 2023 (Commencement of Operations) to September 30, 2023. |
| (b) | Calculated using the average shares method. |
| (c) | Assumes an initial investment on the business day before the first day of the fiscal period, with all dividends and distributions reinvested in additional shares on the reinvestment date, and redemption at the net asset value calculated on the last business day of the fiscal period. Total returns are for the period indicated and have not been annualized. Total returns would have been lower had certain expenses not been waived during the period. Returns shown do not reflect the deduction of taxes that a shareholder would pay on Fund distributions or the redemption of Fund shares. |
| (e) | Portfolio turnover rate for periods less than one full year have not been annualized. |
See Notes to Financial Statements and Financial Highlights.
| Brigade High Income Fund | Financial Highlights |
| Institutional Class | For a Share Outstanding Throughout the Period Presented |
| | | For the Year
Ended
September 30, 2024 | | | For the Period
Ended September 30, 2023 (a) | |
| NET ASSET VALUE, BEGINNING OF PERIOD | | $ | 10.18 | | | $ | 9.98 | |
| INCOME/(LOSS) FROM OPERATIONS: | | | | | | | | |
| Net investment income(b) | | | 1.08 | | | | 0.42 | |
| Net realized and unrealized gain on investments | | | 0.37 | | | | 0.06 | |
| Total from investment operations | | | 1.45 | | | | 0.48 | |
| | | | | | | | | |
| LESS DISTRIBUTIONS: | | | | | | | | |
| From net investment income | | | (1.16 | ) | | | (0.28 | ) |
| From net realized gains on investments | | | (0.01 | ) | | | – | |
| Total Distributions | | | (1.17 | ) | | | (0.28 | ) |
| NET INCREASE IN NET ASSET VALUE | | | 0.28 | | | | 0.20 | |
| NET ASSET VALUE, END OF PERIOD | | $ | 10.46 | | | $ | 10.18 | |
| | | | | | | | | |
| TOTAL RETURN(c) | | | 15.14 | % | | | 4.89 | % |
| | | | | | | | | |
| SUPPLEMENTAL DATA: | | | | | | | | |
| Net assets, end of period (in 000s) | | $ | 12 | | | $ | 10 | |
| | | | | | | | | |
| RATIOS TO AVERAGE NET ASSETS | | | | | | | | |
| Operating expenses excluding reimbursement/waiver | | | 0.69 | % | | | 0.75 | %(d) |
| Operating expenses including reimbursement/waiver | | | 0.69 | % | | | 0.75 | %(d) |
| Net investment income including reimbursement/waiver | | | 10.57 | % | | | 9.94 | %(d) |
| | | | | | | | | |
| PORTFOLIO TURNOVER RATE | | | 49 | % | | | 8 | %(e) |
| (a) | For the period May 5, 2023 (Commencement of Operations) to September 30, 2023. |
| (b) | Calculated using the average shares method. |
| (c) | Assumes an initial investment on the business day before the first day of the fiscal period, with all dividends and distributions reinvested in additional shares on the reinvestment date, and redemption at the net asset value calculated on the last business day of the fiscal period. Total returns are for the period indicated and have not been annualized. Total returns would have been lower had certain expenses not been waived during the period. Returns shown do not reflect the deduction of taxes that a shareholder would pay on Fund distributions or the redemption of Fund shares. |
| (e) | Portfolio turnover rate for periods less than one full year have not been annualized. |
See Notes to Financial Statements and Financial Highlights.
| Annual Report | September 30, 2024 | 13 |
| Brigade High Income Fund | Notes to Financial Statements and Financial Highlights |
September 30, 2024
1. ORGANIZATION
ALPS Series Trust (the “Trust”), a Delaware statutory trust, is an open-end management investment company registered under the Investment Company Act of 1940, as amended (the “1940 Act”). The Trust consists of multiple separate portfolios or series. This annual report describes the Brigade High Income Fund (the “Fund”). The Fund is diversified, and its investment objective is current income, with capital appreciation as a secondary objective. The Fund currently offers Founders Class shares that commenced operations on May 2, 2023 and Institutional Class shares that commenced operations on May 5, 2023. Each share class has identical rights to earnings, assets and voting privileges, except for class specific expenses and exclusive rights to vote on matters affecting only individual classes. The Board of Trustees (the “Board” or “Trustees”) may establish additional funds and classes of shares at any time in the future without shareholder approval.
2. SIGNIFICANT ACCOUNTING POLICIES
The accompanying financial statements were prepared in accordance with accounting principles generally accepted in the United States of America for investment companies (“U.S. GAAP”). The Fund is considered an investment company under U.S. GAAP and follows the accounting and reporting guidance applicable to investment companies in the Financial Accounting Standards Board (“FASB”) Accounting Standards Codification Topic 946. The preparation of financial statements in conformity with U.S. GAAP requires management to make certain estimates and assumptions that affect the reported amounts of assets and liabilities and disclosures of contingent assets and liabilities at the date of the financial statements and the reported amounts of increases and decreases in net assets from operations during the period. Actual results could differ from those estimates. The following is a summary of significant accounting policies consistently followed by the Fund in preparation of its financial statements.
Investment Valuation: The Fund generally values its securities based on market prices determined at the close of regular trading on the New York Stock Exchange (“NYSE”), normally 4:00 p.m. Eastern Time, on each day the NYSE is open for trading.
The market price for debt obligations is generally the price supplied by an independent third-party pricing service approved by the Board, which may use a matrix, formula or other objective method that takes into consideration quotations from dealers, market transactions in comparable investments, market indices and yield curves. If vendors are unable to supply a price, or if the price supplied is deemed to be unreliable or otherwise not representative of market conditions at the time of the valuation determination, the market price may be determined using quotations received from one or more brokers–dealers that make a market in the security. High yield bonds and notes are valued using market models that consider trade data, quotations from dealers and active market makers, relevant yield curve and spread data, creditworthiness, trade data or market information on comparable securities, and other relevant security specific information.
Loans are primarily valued by using a composite loan price from a nationally recognized loan pricing service. The methodology used by the Fund’s nationally recognized loan pricing provider for composite loan prices is to value loans at the mean of the bid and ask prices from one or more third party pricing services or dealers.
For equity securities and mutual funds that are traded on an exchange, the market price is usually the closing sale or official closing price on that exchange. In the case of equity securities not traded on an exchange, or if such closing prices are not otherwise available, the securities are valued at the mean of the most recent bid and ask prices on such day.
Money market funds, representing short-term investments, are valued at their Net Asset Value (“NAV”).
When such prices or quotations are not available, or when the valuation designee appointed by the Board believes that they are unreliable, securities may be priced using fair value procedures approved by the Board.
Fair Value Measurements: The Fund discloses the classification of its fair value measurements following a three-tier hierarchy based on the inputs used to measure fair value. Inputs refer broadly to the assumptions that market participants would use in pricing the asset or liability, including assumptions about risk. Inputs may be observable or unobservable. Observable inputs reflect the assumptions market participants would use in pricing the asset or liability that are developed based on market data obtained from sources independent of the reporting entity. Unobservable inputs reflect the reporting entity’s own assumptions about the assumptions market participants would use in pricing the asset or liability that are developed based on the best information available.
| Brigade High Income Fund | Notes to Financial Statements and Financial Highlights |
September 30, 2024
Various inputs are used in determining the value of the Fund’s investments as of the end of the reporting period. When inputs used fall into different levels of the fair value hierarchy, the level in the hierarchy within which the fair value measurement falls is determined based on the lowest level input that is significant to the fair value measurement in its entirety. The designated input levels are not necessarily an indication of the risk or liquidity associated with these investments. These inputs are categorized in the following hierarchy under applicable financial accounting standards:
| Level 1 – | Unadjusted quoted prices in active markets for identical investments, unrestricted assets or liabilities that the Fund has the ability to access at the measurement date; |
| Level 2 – | Quoted prices which are not active, quoted prices for similar assets or liabilities in active markets or inputs other than quoted prices that are observable (either directly or indirectly); and |
| Level 3 – | Significant unobservable prices or inputs (including the Fund’s own assumptions in determining the fair value of investments) where there is little or no market activity for the asset or liability at the measurement date. |
The following is a summary of the inputs used to value the Fund’s investments as of September 30, 2024:
Brigade High Income Fund
| Investments in Securities at Value | | Level 1 - Quoted and
Unadjusted Prices | | | Level 2 - Other
Significant
Observable Inputs | | | Level 3 - Significant
Unobservable Inputs | | | Total | |
| Common Stocks | | | | | | | | | | | | | | | | |
| Consumer, Cyclical | | $ | – | | | $ | 693,222 | | | $ | – | | | $ | 693,222 | |
| Consumer, Non-cyclical | | | – | | | | 2,608,712 | | | | 18,662 | | | | 2,627,374 | |
| Energy | | | 619,698 | | | | – | | | | – | | | | 619,698 | |
| Technology | | | – | | | | 528,612 | | | | 925,580 | | | | 1,454,192 | |
| Bank Loans | | | | | | | | | | | | | | | | |
| Basic Materials | | | – | | | | 2,499,224 | | | | – | | | | 2,499,224 | |
| Communications | | | – | | | | 20,788,153 | | | | 2,128,841 | | | | 22,916,994 | |
| Consumer, Cyclical | | | – | | | | 43,831,729 | | | | – | | | | 43,831,729 | |
| Consumer, Non-cyclical | | | – | | | | 46,463,986 | | | | – | | | | 46,463,986 | |
| Energy | | | – | | | | 15,420,827 | | | | – | | | | 15,420,827 | |
| Financials | | | – | | | | 12,976,262 | | | | – | | | | 12,976,262 | |
| Industrials | | | – | | | | 15,667,832 | | | | – | | | | 15,667,832 | |
| Technology | | | – | | | | 25,226,544 | | | | – | | | | 25,226,544 | |
| Convertible Corporate Bond | | | | | | | | | | | | | | | | |
| Consumer, Cyclical | | | – | | | | 385,650 | | | | – | | | | 385,650 | |
| Corporate Bond | | | | | | | | | | | | | | | | |
| Basic Materials | | | – | | | | 33,724,448 | | | | – | | | | 33,724,448 | |
| Communications | | | – | | | | 72,162,624 | | | | – | | | | 72,162,624 | |
| Consumer, Cyclical | | | – | | | | 62,159,109 | | | | – | | | | 62,159,109 | |
| Consumer, Non-cyclical | | | – | | | | 63,487,388 | | | | – | | | | 63,487,388 | |
| Energy | | | – | | | | 32,751,623 | | | | – | | | | 32,751,623 | |
| Financials | | | – | | | | 58,841,885 | | | | – | | | | 58,841,885 | |
| Industrials | | | – | | | | 16,329,853 | | | | – | | | | 16,329,853 | |
| Technology | | | – | | | | 2,812,932 | | | | – | | | | 2,812,932 | |
| Utilities | | | – | | | | 4,474,180 | | | | – | | | | 4,474,180 | |
| Short Term Investments | | | 39,661,970 | | | | – | | | | – | | | | 39,661,970 | |
| Total | | $ | 40,281,668 | | | $ | 533,834,795 | | | $ | 3,073,083 | | | $ | 577,189,546 | |
| Annual Report | September 30, 2024 | 15 |
| Brigade High Income Fund | Notes to Financial Statements and Financial Highlights |
September 30, 2024
The following is a reconciliation of assets in which Level 3 inputs were used in determining value:
| Asset Type | | Common Stocks | | | Bank Loan | | | Total | |
| Balance as of September 30, 2023 | | $ | 2,539,082 | | | $ | – | | | $ | 2,539,082 | |
| Return of Capital | | | – | | | | – | | | | – | |
| Realized Gain/(Loss) | | | 823,353 | | | | – | | | | 823,353 | |
| Change in Unrealized Appreciation/Depreciation | | | (677,936 | ) | | | – | | | | (677,936 | ) |
| Purchases | | | – | | | | – | | | | – | |
| Sales Proceeds | | | (1,740,257 | ) | | | – | | | | (1,740,257 | ) |
| Transfer into Level 3(a) | | | – | | | | 2,128,841 | | | | 2,128,841 | |
| Transfer Out of Level 3 | | | – | | | | – | | | | – | |
| Balance as of September 30, 2024 | | $ | 944,242 | | | $ | 2,128,841 | | | $ | 3,073,083 | |
| Net change in unrealized | | | | | | | | | | | | |
| appreciation/(depreciation) included in the Statement of Operations attributable to Level 3 investments held at September 30, 2024 | | $ | 17,689 | | | $ | (2,051,764 | ) | | $ | (2,034,075 | ) |
| (a) | Transferred from Level 2 to Level 3 because of a lack of observable market data, resulting from a decrease in market activity for the securities. |
The following table summarizes the significant unobservable inputs the Fund used to value its investments categorized within Level 3 as of September 30, 2024. In addition to the techniques and inputs noted in the table below, according to the Fund’s valuation policy, other valuation techniques and methodologies when determining the Fund’s fair value measurements may be used. The below table is not intended to be all inclusive, but rather provide information on the significant unobservable inputs as they relate to the Fund’s determination of fair values.
| Assets (at fair value) | | Fair Value at
September 30, 2024 | | | Valuation
Technique(s) | | Unobservable
Inputs(1) | | Value/Range | |
| Common Stocks | | $ | 925,578 | | | Market & Income Approach | | EBITDA | | | $356.0m | |
| | | | | | | | | EBITDA multiple | | | 4.0x-4.5x | |
| | | | 18,662 | | | Estimated recovery model | | Estimated Escrow | | | $2.50 | |
| | | | | | | | | Discount Rate | | | 35% | |
| Total Common Stocks | | $ | 944,240 | (2) | | | | | | | | |
| Bank Loans | | $ | 2,128,841 | | | Net Recovery Approach | | EBITDA | | | CAD 198m | |
| | | | | | | | | EBITDA Multiple | | | 14.0x | |
| | | | | | | | | Market Value of Spectrum Assets | | | CAD 1,398m | |
| | | | | | | | | Discount Rate | | | 18.75-22.50% | |
| Total Bank Loans | | $ | 2,128,841 | | | | | | | | | |
| (1) | A change to the unobservable input may result in a significant change to the value of the investment as follows: |
| (2) | Excludes insignificant Level 3 positions that amount to $2. |
| Unobservable Input | Impact to Value if Input Increases | Impact to Value if Input Decreases |
| EBITDA | Increase | Decrease |
| EBITDA Multiple | Increase | Decrease |
| Estimated Escrow | Increase | Decrease |
| Discount Rate | Decrease | Increase |
| Market Value of Spectrum Assets | Increase | Decrease |
Cash & Cash Equivalents: The Fund considers its investment in a Federal Deposit Insurance Corporation ("FDIC") insured interest bearing account to be cash and cash equivalents. Cash and cash equivalents are valued at cost plus any accrued interest. The Fund maintains cash balances, which, at times may exceed federally insured limits. The Fund maintains these balances with a high quality financial institution.
Concentration of Credit Risk: The Fund places its cash with a banking institution, which is insured by FDIC. The FDIC limit is $250,000. At various times throughout the year, the amount on deposit may exceed the FDIC limit and subject the Fund to a credit risk. The Fund does not believe that such deposits are subject to any unusual risk associated with investment activities.
| Brigade High Income Fund | Notes to Financial Statements and Financial Highlights |
September 30, 2024
Offering Costs: The Fund incurred offering costs during the year ended September 30, 2024. These offering costs, including fees for printing initial prospectuses, legal and registration fees, were amortized over the first twelve months from the inception date of the Fund. Amounts amortized through May 2, 2024 are expensed in the Fund’s Statement of Operations.
Trust Expenses: Some expenses of the Trust can be directly attributed to a fund in the Trust. Expenses that cannot be directly attributed to a fund are apportioned among all funds in the Trust based on average net assets of each fund, including Trustees’ fees and expenses.
Fund Expenses: Some expenses can be directly attributed to the Fund and are apportioned among the classes based on average net assets of each class.
Class Expenses: Expenses that are specific to a class of shares are charged directly to that share class.
Federal Income Taxes: The Fund complies with the requirements under Subchapter M of the Internal Revenue Code of 1986, as amended, applicable to regulated investment companies and intends to distribute substantially all of its net taxable income and net capital gains, if any, each year so that it will not be subject to excise tax on undistributed income and gains. The Fund is not subject to income taxes to the extent such distributions are made.
As of and during the year ended September 30, 2024, the Fund did not have a liability for any unrecognized tax benefits in the accompanying financial statements. The Fund recognizes interest and penalties, if any, related to tax liabilities as income tax expense in the Statement of Operations. The Fund files U.S. federal, state and local income tax returns as required. The Fund’s tax return is subject to examination by the relevant tax authorities until expiration of the applicable statute of limitations, which is generally three years after the filing of the tax return for federal purposes and four years for most state returns. The Fund’s administrator has analyzed the Fund’s tax positions and has concluded that as of September 30, 2024, no provision for income tax is required in the Fund’s financial statements related to these tax positions.
Investment Transactions and Investment Income: Investment transactions are accounted for on the date the investments are purchased or sold (trade date basis for financial reporting purposes). Realized gains and losses from investment transactions are reported on an identified cost basis. Interest income, which includes accretion of discounts and amortization of premiums, is accrued and recorded as earned using the effective yield method. Dividend income is recognized on the ex-dividend date. All of the realized and unrealized gains and losses and net investment income are allocated daily to each class in proportion to its average daily net assets. Paydown gains and losses on mortgage-related and other asset-backed securities, if any, are recorded as components of interest income in the Statement of Operations.
Distributions to Shareholders: The Fund normally pays dividends, if any, monthly, and distributes capital gains, if any, on an annual basis. Income dividend distributions are derived from interest and other income the Fund receives from its investments, including short term capital gains. Long term capital gain distributions are derived from gains realized when the Fund sells a security it has owned for more than one year. The Fund may make additional distributions and dividends at other times if its investment advisor has determined that doing so may be necessary for the Fund to avoid or reduce taxes. Net investment income/(loss) and net realized gain/(loss) may differ for financial statement and tax purposes.
Loan Assignments: The Fund acquires loans via loan assignments. The Fund considers loans acquired via assignment to be investments in debt instruments. When the Fund purchases loans from lenders via assignment, the Fund will acquire direct rights against the borrower on the loan except that under certain circumstances such rights may be more limited than those held by the assigning lender.
Loans and debt instruments are subject to credit risk. Credit risk relates to the ability of the borrower under such fixed income instruments to make interest and principal payments as they become due.
Liquidity Risk: Liquidity risk exists when particular investments are difficult to sell. The Fund may not be able to sell these investments at the best prices or at the value the Fund places on them. In such a market, the value of such investments, and as a result the Fund’s share price, may fall dramatically, even during periods of declining interest rates. Investments that are illiquid or that trade in lower volumes may be more difficult to value. The market for high yield securities in particular may be less liquid than higher quality fixed income securities, and therefore these securities may be harder to value or sell at an acceptable price, especially during times of market volatility or decline.
LIBOR Transition: Certain of the Fund's investments, payment obligations and financing terms may be based on floating rates, such as LIBOR, Euro Interbank Offered Rate and other similar types of reference rates (each, a “Reference Rate”). Plans are underway to phase out the use of LIBOR which indicates the continuation of LIBOR and other reference rates on the current basis cannot and will not be guaranteed after 2023. Any replacement rate chosen may be less favorable than the current rates. Until the announcement of the replacement rate, the Fund may continue to invest in assets that may reference LIBOR or otherwise use LIBOR. There remains uncertainty regarding the nature of any replacement rate and the impact of the transition from LIBOR on the Fund’s transactions and the financial markets generally. As such, the potential effect of a transition away from LIBOR on the Fund’s investments cannot yet be determined.
| Annual Report | September 30, 2024 | 17 |
| Brigade High Income Fund | Notes to Financial Statements and Financial Highlights |
September 30, 2024
Restricted Securities: Restricted securities are securities that may only be resold upon registration under federal securities laws or in transactions exempt from such registration. In some cases, the issuer of restricted securities has agreed to register such securities for resale, at the issuer’s expense, either upon demand by a fund or in connection with another registered offering of the securities. Many restricted securities may be resold in the secondary market in transactions exempt from registration. Such restricted securities may be determined to be liquid. The Fund will not incur any registration costs upon such resale. The Fund’s restricted securities are valued at the price provided by pricing services or dealers in the secondary market or, if no market prices are available, at the fair value price as determined by the Fund’s adviser or pursuant to the Fund’s fair value policy, subject to oversight by the Board. The Fund has acquired certain securities, the sale of which is restricted under applicable provisions of the Securities Act of 1933. It is possible that the fair value price may differ significantly from the amount that may ultimately be realized in the near term, and the difference could be material.
| Description | | Security Type | | Acquisition Date | | Acquisition Cost | | | Fair Value | | | % of Net Assets | |
| Aquity Holdings, Inc. | | Common Stock | | 10/27/23 | | $ | – | | | $ | 18,662 | | | | 0.00 | % |
| Avaya Holdings Corp. | | Common Stock | | 5/10/2023-5/12/2023 | | | 775,525 | | | | 925,578 | | | | 0.16 | % |
| | | | | | | | | | | $ | 944,240 | | | | | |
Restricted securities under Rule 144A, including the aggregate value and percentage of net assets of the Fund, have been identified in the Schedule of Investments.
3. TAX BASIS INFORMATION
Tax Basis of Distributions to Shareholders: The character of distributions made during the period from net investment income or net realized gains may differ from its ultimate characterization for federal income tax purposes. Also, due to the timing of dividend distributions, the fiscal year in which amounts are distributed may differ from the fiscal year in which the income or realized gain were recorded by the Fund. The amounts and characteristics of tax basis distributions and composition of distributable earnings/(accumulated losses) are finalized at fiscal year-end.
The tax character of distributions paid during the fiscal year ended September 30, 2024, were as follows:
| | | Ordinary Income | | | Long-Term Capital Gains | |
| Brigade High Income Fund | | $ | 58,816,317 | | | $ | – | |
The tax character of distributions paid during the fiscal period ended September 30, 2023, were as follows:
| | | Ordinary Income | | | Long-Term
Capital Gains | |
| Brigade High Income Fund | | $ | 9,540,443 | | | $ | – | |
Unrealized Appreciation and Depreciation on Investments: As of September 30, 2024, the aggregate costs of investments, gross unrealized appreciation/ (depreciation) and net unrealized appreciation of instruments for federal tax purposes were as follows:
| | | Brigade High
Income Fund | |
| Gross unrealized appreciation (excess of value over tax cost) | | $ | 26,636,278 | |
| Gross unrealized depreciation (excess of tax cost over value) | | | (20,748,025 | ) |
| Net appreciation (depreciation) of foreign currency | | | (35,834 | ) |
| Net unrealized appreciation | | $ | 5,852,419 | |
| Cost of investments for income tax purposes | | $ | 571,301,292 | |
| Brigade High Income Fund | Notes to Financial Statements and Financial Highlights |
September 30, 2024
The primary reason for the temporary difference between book and tax basis unrealized is wash sales.
As of September 30, 2024, the components of distributable earnings on a tax basis were as follows:
| Undistributed ordinary income | | $ | 9,787,607 | |
| Accumulated Capital Gains/(Losses) | | | 2,562,628 | |
| Net unrealized appreciation on investments | | | 5,852,419 | |
| Total | | $ | 18,202,654 | |
As of September 30, 2024, there were no permanent differences in book and tax accounting.
4. SECURITIES TRANSACTIONS
Purchases and sales of securities, excluding short-term securities, during the year ended September 30, 2024, were as follows:
| | | Purchases of Securities | | | Proceeds from Sales of
Securities | |
| Brigade High Income Fund | | $ | 324,242,639 | | | $ | 238,446,157 | |
5. BENEFICIAL SHARE TRANSACTIONS
The capitalization of the Trust consists of an unlimited number of shares of beneficial interest with no par value per share. Holders of the shares of the Fund have one vote for each share held and a proportionate fraction of a vote for each fractional share. All shares issued and outstanding are fully paid for and are transferable and redeemable at the option of the shareholder. Shares have no pre-emptive rights. Neither the Fund nor any of its creditors have the right to require shareholders to pay any additional amounts solely because the shareholder owns the shares.
Shares redeemed within 60 days of purchase may incur a 1.00% short-term redemption fee deducted from the redemption amount. For the year ended September 30, 2024, the redemption fees charged by the Fund, if any, are presented in the Statements of Changes in Net Assets.
Transactions in common shares were as follows:
| | | For the Year Ended September 30, 2024 | | | For the Year Ended September 30, 2023 (a) | |
| Brigade High Income Fund | | | | | | | | |
| Founders Class | | | | | | | | |
| Shares sold | | | 11,535,094 | | | | 45,859,150 | |
| Shares issued in reinvestment of distributions to shareholders | | | 5,711,353 | | | | 938,544 | |
| Shares redeemed | | | (8,561,977 | ) | | | – | |
| Net increase in shares outstanding | | | 8,684,470 | | | | 46,797,694 | |
| Institutional Class | | | | | | | | |
| Shares sold | | | – | | | | 1,037 | |
| Shares issued in reinvestment of distributions to shareholders | | | 124 | | | | 29 | |
| Shares redeemed | | | – | | | | (36 | ) |
| Net increase in shares outstanding | | | 124 | | | | 1,030 | |
| (a) | The Founders Class and Institutional Class commenced operations on May 2, 2023 and May 5, 2023, respectively. |
Control is defined by the 1940 Act as the beneficial ownership, either directly or through one or more controlled companies, of more than 25% of the voting securities of a company. Approximately 75% of the outstanding shares of the Fund are held by one omnibus account that owns shares on behalf of their underlying beneficial owners. Share transaction activities of these shareholders could have a material impact on the Funds.
| Annual Report | September 30, 2024 | 19 |
| Brigade High Income Fund | Notes to Financial Statements and Financial Highlights |
September 30, 2024
6. MANAGEMENT AND RELATED PARTY TRANSACTIONS
Investment Advisory: Brigade Capital Management, LP (the “Adviser”), subject to the authority of the Board, is responsible for the management of the Fund’s portfolio. The Adviser manages the investments of the Fund in accordance with the Fund’s investment objective, policies and limitations and investment guidelines established jointly by the Adviser and the Board.
Pursuant to the Investment Advisory Agreement (the "Advisory Agreement") with the Adviser, the Fund pays the Adviser an annual management fee of 0.50% based on the Fund’s average daily net assets. The management fee is paid on a monthly basis. The current term of the Advisory Agreement is one year. The Board may extend the Advisory Agreement for additional one-year terms. The Board and the shareholders of the Fund may terminate the Advisory Agreement upon 30 days’ written notice. The Adviser may terminate the Advisory Agreement upon 60 days’ written notice.
The Adviser has appointed Brigade Capital UK, LLP as the Sub-Adviser to the Fund. Pursuant to a Sub-Advisory Agreement, it is determined that the Adviser and Fund will not pay any fees to the Sub-Adviser for providing services in accordance with such Agreement.
Pursuant to a fee waiver letter agreement (the “Fee Waiver Agreement”), the Adviser has contractually agreed to limit the amount of the Fund’s Total Annual Fund Operating Expenses (excluding acquired fund fees and expenses, brokerage expenses, interest expenses, taxes and extraordinary expenses) to an annual rate of 0.52% and 0.75% of the Fund’s average daily net assets of each of the Founders Class and Institutional Class shares, respectively. The Fee Waiver Agreement is in effect through at least January 31, 2025, and will automatically continue upon approval by the Board for successive twelve-month periods unless (i) it is terminated earlier by the Board, or (ii) the Adviser provides at least 30 days written notice of its non-continuance prior to the end of the then effective term. The Adviser will be permitted to recover, on a class-by-class basis, expenses it has borne through the Fee Waiver Agreement (whether through reduction of its co-administration or management fee or otherwise) only to the extent that the Fund's expenses in later periods do not exceed the lesser of: (1) the contractual expense limit in effect at the time the Adviser waives or limits the expenses; or (2) the contractual expense limit in effect at the time the Adviser seeks to recover the expenses; provided, however, that the Fund will not be obligated to pay any such deferred fees or expenses more than three years after the date on which the fee and expense was reduced, as calculated on a monthly basis. The Adviser may not discontinue this waiver without the approval by the Trust's Board. Fees waived or reimbursed for the year ended September 30, 2024, are disclosed in the Statement of Operations.
As of September 30, 2024, the balances of recoupable expenses for the Fund were as follows:
| Brigade High Income Fund | | Expiring in 2026 | | | Expiring in 2027 | |
| Founders Class | | $ | 271,778 | | | $ | 863,781 | |
| Institutional Class | | | – | | | | – | |
Administrator: ALPS Fund Services, Inc. (“ALPS”) (an affiliate of ALPS Distributors, Inc.) serves as administrator to the Fund. The Fund has agreed to pay expenses incurred in connection with its administrative activities. Pursuant to the Services Agreement with the Trust, ALPS will provide operational services to the Fund including, but not limited to, fund accounting and fund administration and generally assist in the Fund’s operations. The Fund’s administration fee is accrued on a daily basis and paid monthly. The officers of the Trust are employees of ALPS. Administration fees paid by the Fund for the year ended September 30, 2024, are disclosed in the Statement of Operations. ALPS is reimbursed by the Fund for certain out-of-pocket expenses.
Brigade Capital Management, LP serves as co-administrator to the Fund. Pursuant to the Co-Administration Agreement, the Fund pays the co-administrator an annual fee of 0.05% based on the Fund's average daily net assets. Co-administration fees paid by the Fund for the year ended September 30, 2024, are disclosed in the Statement of Operations.
Transfer Agent: ALPS Fund Services, Inc. (“ALPS”) serves as transfer agent for the Fund under a Services Agreement with the Trust. Under this agreement, ALPS is paid an annual fee for services performed on behalf of the Fund plus fees for open accounts and is reimbursed for certain out-of-pocket expenses.
Compliance Services: ALPS provides Chief Compliance Officer services to the Fund to monitor and test the policies and procedures of the Fund in conjunction with requirements under Rule 38a-1 of the 1940 Act pursuant to Services Agreement with the Trust. Under this agreement, ALPS is paid an annual fee for services performed on behalf of the Fund and is reimbursed for certain out-of-pocket expenses.
Distribution: ALPS Distributors, Inc. (the “Distributor”) (an affiliate of ALPS) acts as the principal underwriter of the Fund’s shares pursuant to a Distribution Agreement with the Trust. Shares of the Fund are offered on a continuous basis through the Distributor, as agent of the Fund. The Distributor is not obligated to sell any particular amount of shares and is not entitled to any compensation for its services as the Fund’s principal underwriter pursuant to the Distribution Agreement.
| Brigade High Income Fund | Notes to Financial Statements and Financial Highlights |
September 30, 2024
7. TRUSTEES AND OFFICERS
As of September 30, 2024, there were four Trustees, each of whom are not “interested persons” (as defined in the 1940 Act) of the Trust (the “Independent Trustees”). The Independent Trustees of the Trust and, if any, Interested Trustees who are not currently employed by the Adviser, ALPS or other service providers will receive a quarterly retainer of $16,250, plus $5,000 for each regular Board or Committee meeting attended and $2,000 for each special telephonic or in-person Board or Committee meeting attended. Additionally, the Audit Committee Chair receives a quarterly retainer of $1,875 and the Independent Chair receives a quarterly retainer of $4,250. These fees are allocated proportionately among the multiple portfolios/series of the Trust. The Independent Trustees and, if any, Interested Trustees who are not currently employed by the Adviser, ALPS or other service providers are also reimbursed for all reasonable out-of-pocket expenses relating to attendance at meetings.
Officers of the Trust receive no salary or fees from the Trust. As discussed in Note 6, the Fund pays ALPS an annual fee for compliance services.
8. INDEMNIFICATIONS
Under the Trust’s organizational documents, its officers and Trustees are indemnified against certain liabilities arising out of the performance of their duties to the Trust. Additionally, in the normal course of business, the Trust enters into contracts with service providers that may contain general indemnification clauses which may permit indemnification to the extent permissible under applicable law. The Trust’s maximum exposure under these arrangements is unknown, as this would involve future claims that may be made against the Trust that have not yet occurred.
9. RECENT ACCOUNTING PROUNCEMENT
In March 2020, the FASB issued Accounting Standards Update (“ASU”) No. 2020-04, “Reference Rate Reform (Topic 848): Facilitation of the Effects of Reference Rate Reform on Financial Reporting.” ASU 2020-04 provides optional guidance to ease the potential accounting burden due to the discontinuation of the LIBOR and other interbank offered based reference rates. ASU 2020-04 is effective as of March 12, 2020, and can be applied through December 31, 2022. Management is currently evaluating the impact, if any, of applying ASU 2020-04. FASB has deferred the sunset date to December 31, 2024. At this time, management believes the adoption of ASU 2020-04 will not have a material impact to the financial statements.
10. SUBSEQUENT EVENTS
Subsequent events after the date of the Statements of Assets and Liabilities have been evaluated through the date the financial statements were issued. Management has determined that there were no subsequent events to report through the issuance of these financial statements.
| Annual Report | September 30, 2024 | 21 |
| Brigade High Income Fund | Report of Independent Registered Public Accounting Firm |
To the Shareholders of Brigade High Income Fund and
Board of Trustees of ALPS Series Trust
Opinion on the Financial Statements
We have audited the accompanying statement of assets and liabilities, including the schedule of investments, of Brigade High Income Fund (the “Fund”), a series of ALPS Series Trust, as of September 30, 2024, the related statement of operations for the year then ended, and the statements of changes in net assets and the financial highlights for the year then ended and the period May 2, 2023 (commencement of operations) through September 30, 2023, and the related notes (collectively referred to as the “financial statements”). In our opinion, the financial statements present fairly, in all material respects, the financial position of the Fund as of September 30, 2024, the results of its operations for the year then ended, and the changes in net assets and the financial highlights for the year then ended and the period May 2, 2023 (commencement of operations) through September 30, 2023, in conformity with accounting principles generally accepted in the United States of America.
Basis for Opinion
These financial statements are the responsibility of the Fund’s management. Our responsibility is to express an opinion on the Fund’s financial statements based on our audits. We are a public accounting firm registered with the Public Company Accounting Oversight Board (United States) (“PCAOB”) and are required to be independent with respect to the Fund in accordance with the U.S. federal securities laws and the applicable rules and regulations of the Securities and Exchange Commission and the PCAOB.
We conducted our audits in accordance with the standards of the PCAOB. Those standards require that we plan and perform the audit to obtain reasonable assurance about whether the financial statements are free of material misstatement whether due to error or fraud.
Our audits included performing procedures to assess the risks of material misstatement of the financial statements, whether due to error or fraud, and performing procedures that respond to those risks. Such procedures included examining, on a test basis, evidence regarding the amounts and disclosures in the financial statements. Our procedures included confirmation of securities owned as of September 30, 2024, by correspondence with the custodian, agent banks, transfer agents, issuers, and brokers; when replies were not received from agent banks or brokers, we performed other auditing procedures. Our audits also included evaluating the accounting principles used and significant estimates made by management, as well as evaluating the overall presentation of the financial statements. We believe that our audits provide a reasonable basis for our opinion.
We have served as the Fund’s auditor since 2023.

COHEN & COMPANY, LTD.
Cleveland, Ohio
November 27, 2024
| Brigade High Income Fund | Tax Designations |
September 30, 2024 (Unaudited)
Qualified Dividend Income
The percentage of ordinary income dividends distributed during the calendar year ended December 31, 2023 are designated as qualified dividend income (QDI) as defined in Section 1(h)(11) of the Internal Revenue Code in the following percentages:
| | Amount |
| Brigade High Income Fund | 0% |
Dividends Received Deduction
For corporate shareholders, the following ordinary dividends paid during the calendar year ended December 31, 2023 qualify for the corporate dividends received deduction:
| | Amount |
| Brigade High Income Fund | 0% |
| Annual Report | September 30, 2024 | 23 |

Table of Contents
| Schedule of Investments | 1 |
| Statement of Assets and Liabilities | 7 |
| Statement of Operations | 8 |
| Statements of Changes in Net Assets | 9 |
| Financial Highlights | 10 |
| Notes to Financial Statements and Financial Highlights | 12 |
| Report of Independent Registered Public Accounting Firm | 18 |
| Tax Designations | 19 |
| Carret Kansas Tax-Exempt Bond Fund | Schedule of Investments |
September 30, 2024
| | | Principal Amount | | | Value (Note 2) | |
| MUNICIPAL BONDS (98.47%) | | | | | | | | |
| Education (41.48%)(a) | | | | | | | | |
| Allen County Unified School District No. 257, General Obligation Unlimited Bonds | | | | | | | | |
| 3.000%, 09/01/2043 | | $ | 2,415,000 | | | $ | 2,129,020 | |
| Barton Community College, Certificate Participation Bonds | | | | | | | | |
| 4.000%, 12/01/2032 | | | 555,000 | | | | 561,697 | |
| 4.000%, 12/01/2034 | | | 250,000 | | | | 252,499 | |
| Bourbon County Unified School District No. 234-Fort Scott, General Obligation Unlimited Bonds | | | | | | | | |
| 5.000%, 09/01/2025 | | | 355,000 | | | | 355,659 | |
| Bourbon County Unified School District No. 234-Fort Scott, Certificate Participation Bonds | | | | | | | | |
| 4.000%, 09/01/2037 | | | 400,000 | | | | 419,531 | |
| Butler County Unified School District No. 206 Remington, General Obligation Unlimited Bonds | | | | | | | | |
| 3.000%, 09/01/2034 | | | 1,000,000 | | | | 955,562 | |
| 3.000%, 09/01/2035 | | | 510,000 | | | | 484,033 | |
| Butler County Unified School District No. 375 Circle, General Obligation Unlimited Bonds | | | | | | | | |
| 3.000%, 09/01/2035 | | | 750,000 | | | | 712,296 | |
| Butler County Unified School District No. 385 Andover, General Obligation Unlimited Bonds | | | | | | | | |
| 4.000%, 09/01/2030 | | | 690,000 | | | | 710,946 | |
| 4.000%, 09/01/2031 | | | 500,000 | | | | 512,885 | |
| Butler County Unified School District No. 490 El Dorado, General Obligation Unlimited Bonds | | | | | | | | |
| 4.000%, 09/01/2034 | | | 1,000,000 | | | | 1,017,770 | |
| 4.000%, 09/01/2036 | | | 500,000 | | | | 507,836 | |
| Denton Independent School District, General Obligation Unlimited Bonds | | | | | | | | |
| 5.000%, 08/15/2034 | | | 750,000 | | | | 792,277 | |
| Douglas County Unified School District No. 497 Lawrence, General Obligation Unlimited Bonds | | | | | | | | |
| 4.000%, 09/01/2031 | | | 1,500,000 | | | | 1,532,341 | |
| 4.000%, 09/01/2033 | | | 500,000 | | | | 500,281 | |
| Ellis County Unified School District No. 489 Hays, General Obligation Unlimited Bonds | | | | | | | | |
| 5.000%, 09/01/2042 | | | 535,000 | | | | 582,835 | |
| Finney County Unified School District No. 457 Garden City, General Obligation Unlimited Bonds | | | | | | | | |
| 4.000%, 09/01/2031 | | | 1,500,000 | | | | 1,531,122 | |
| 5.000%, 09/01/2027 | | | 800,000 | | | | 839,288 | |
| Ford County Unified School District No. 443 Dodge City, General Obligation Unlimited Bonds | | | | | | | | |
| 4.000%, 03/01/2030 | | | 1,150,000 | | | | 1,192,936 | |
| 4.000%, 03/01/2034 | | | 1,000,000 | | | | 1,037,336 | |
| Franklin County Unified School District No. 289 Wellsville, General Obligation Unlimited Bonds | | | | | | | | |
| 4.000%, 09/01/2030 | | | 645,000 | | | | 691,307 | |
| Franklin County Unified School District No. 290 Ottawa, General Obligation Unlimited Bonds | | | | | | | | |
| 5.000%, 09/01/2032 | | | 150,000 | | | | 153,149 | |
| Geary County Unified School District No. 475, General Obligation Unlimited Bonds | | | | | | | | |
| 3.000%, 09/01/2033 | | | 1,000,000 | | | | 967,658 | |
| Hernando County School District, Certificate Participation Bonds | | | | | | | | |
| 5.000%, 07/01/2031 | | | 685,000 | | | | 711,544 | |
| Jefferson County School District R-1, Certificate Participation Bonds | | | | | | | | |
| 5.000%, 12/15/2027 | | | 500,000 | | | | 514,530 | |
| Johnson & Miami Counties Unified School District No. 230 Spring Hills, General Obligation Unlimited Bonds | | | | | | | | |
| 4.000%, 09/01/2031 | | | 400,000 | | | | 411,219 | |
| 4.000%, 09/01/2033 | | | 1,000,000 | | | | 1,012,690 | |
| 4.000%, 09/01/2035 | | | 1,000,000 | | | | 1,011,767 | |
| 5.000%, 09/01/2030 | | | 1,970,000 | | | | 2,064,171 | |
| Johnson County Unified School District No. 229 Blue Valley, General Obligation Unlimited Bonds | | | | | | | | |
| 4.000%, 10/01/2040 | | | 1,500,000 | | | | 1,561,259 | |
| Johnson County Unified School District No. 232 De Soto, General Obligation Unlimited Bonds | | | | | | | | |
| 4.000%, 09/01/2031 | | | 1,165,000 | | | | 1,212,593 | |
| Johnson County Unified School District No. 233 Olathe, General Obligation Unlimited Bonds | | | | | | | | |
| 2.000%, 09/01/2030 | | | 750,000 | | | | 686,987 | |
| 4.000%, 09/01/2031 | | | 1,000,000 | | | | 1,017,371 | |
See Notes to Financial Statements and Financial Highlights.
| Annual Report | September 30, 2024 | 1 |
| Carret Kansas Tax-Exempt Bond Fund | Schedule of Investments |
September 30, 2024
| | | Principal Amount | | | Value (Note 2) | |
| Education (continued) | | | | | | | | |
| Johnson County Unified School District No. 512 Shawnee Mission, General Obligation Unlimited Bonds | | | | | | | | |
| 4.000%, 10/01/2035 | | $ | 425,000 | | | $ | 443,273 | |
| 5.000%, 10/01/2041 | | | 500,000 | | | | 565,730 | |
| Kansas City Kansas Community College Auxiliary Enterprise System, Revenue Bonds | | | | | | | | |
| 4.000%, 09/01/2032 | | | 140,000 | | | | 145,242 | |
| 4.000%, 09/01/2033 | | | 100,000 | | | | 103,081 | |
| Kansas Development Finance Authority, Revenue Bonds | | | | | | | | |
| 2.000%, 05/01/2031 | | | 630,000 | | | | 562,585 | |
| 2.000%, 06/01/2032 | | | 1,000,000 | | | | 871,514 | |
| 2.000%, 05/01/2033 | | | 800,000 | | | | 681,904 | |
| 3.000%, 05/01/2030 | | | 450,000 | | | | 450,004 | |
| 3.500%, 05/01/2033 | | | 500,000 | | | | 499,998 | |
| Leavenworth County Unified School District No. 453, General Obligation Unlimited Bonds | | | | | | | | |
| 4.000%, 09/01/2036 | | | 1,000,000 | | | | 1,029,190 | |
| Leavenworth County Unified School District No. 464, General Obligation Unlimited Bonds | | | | | | | | |
| 4.000%, 09/01/2034 | | | 675,000 | | | | 690,161 | |
| 4.000%, 09/01/2036 | | | 465,000 | | | | 474,102 | |
| Lyon County Unified School District No. 253 Emporia, General Obligation Unlimited Bonds | | | | | | | | |
| 4.000%, 09/01/2030 | | | 325,000 | | | | 335,794 | |
| Miami County Unified School District No. 416 Louisburg, General Obligation Unlimited Bonds | | | | | | | | |
| 3.000%, 09/01/2035 | | | 500,000 | | | | 480,171 | |
| Oklahoma County Elementary School District No. 29 Oakdale, General Obligation Unlimited Bonds | | | | | | | | |
| 4.000%, 05/01/2026 | | | 500,000 | | | | 510,983 | |
| Pennsylvania Higher Educational Facilities Authority, Revenue Bonds | | | | | | | | |
| 5.000%, 08/15/2046 | | | 750,000 | | | | 772,602 | |
| Riley County Unified School District No. 378 Riley, General Obligation Unlimited Bonds | | | | | | | | |
| 3.000%, 09/01/2039 | | | 925,000 | | | | 848,008 | |
| Riley County Unified School District No. 383 Manhattan-Ogden, General Obligation Unlimited Bonds | | | | | | | | |
| 5.000%, 09/01/2028 | | | 1,220,000 | | | | 1,279,781 | |
| Sedgwick County Unified School District No. 260 Derby, General Obligation Unlimited Bonds | | | | | | | | |
| 3.500%, 10/01/2036 | | | 845,000 | | | | 845,501 | |
| Sedgwick County Unified School District No. 264 Clearwater, General Obligation Unlimited Bonds | | | | | | | | |
| 4.000%, 09/01/2029 | | | 530,000 | | | | 544,453 | |
| Sedgwick County Unified School District No. 265 Goddard, General Obligation Unlimited Bonds | | | | | | | | |
| 5.000%, 10/01/2024 | | | 370,000 | | | | 370,000 | |
| Sedgwick County Unified School District No. 266 Maize, General Obligation Unlimited Bonds | | | | | | | | |
| 4.000%, 09/01/2032 | | | 750,000 | | | | 766,191 | |
| Sedgwick County Unified School District No. 267 Renwick, General Obligation Unlimited Bonds | | | | | | | | |
| 4.000%, 11/01/2033 | | | 350,000 | | | | 358,213 | |
| 4.000%, 11/01/2034 | | | 425,000 | | | | 434,489 | |
| 4.000%, 11/01/2035 | | | 635,000 | | | | 648,739 | |
| Seward County Unified School District No. 480 Liberal, General Obligation Unlimited Bonds | | | | | | | | |
| 4.000%, 09/01/2028 | | | 1,000,000 | | | | 1,042,276 | |
| 4.000%, 09/01/2032 | | | 500,000 | | | | 517,993 | |
| Spring Independent School District, General Obligation Unlimited Bonds | | | | | | | | |
| 5.000%, 08/15/2025 | | | 750,000 | | | | 763,841 | |
| University of Kansas Hospital Authority, Revenue Bonds | | | | | | | | |
| 5.000%, 09/01/2028 | | | 250,000 | | | | 255,167 | |
| 5.000%, 09/01/2030 | | | 350,000 | | | | 356,890 | |
| 5.000%, 09/01/2031 | | | 500,000 | | | | 509,375 | |
| Washburn University/Topeka, Revenue Bonds | | | | | | | | |
| 5.000%, 07/01/2035 | | | 500,000 | | | | 506,221 | |
| West Clermont Local School District, General Obligation Unlimited Bonds | | | | | | | | |
| 4.000%, 12/01/2032 | | | 400,000 | | | | 410,626 | |
| Wyandotte County Unified School District No. 202 Turner, General Obligation Unlimited Bonds | | | | | | | | |
| 4.000%, 09/01/2038 | | | 1,225,000 | | | | 1,282,115 | |
| 4.000%, 09/01/2039 | | | 400,000 | | | | 418,650 | |
See Notes to Financial Statements and Financial Highlights.
2
| Carret Kansas Tax-Exempt Bond Fund | Schedule of Investments |
September 30, 2024
| | | Principal Amount | | | Value (Note 2) | |
| Education (continued) | | | | | | | | |
| Wyandotte County Unified School District No. 203 Piper, General Obligation Unlimited Bonds | | | | | | | | |
| 5.000%, 09/01/2038 | | $ | 1,000,000 | | | $ | 1,066,716 | |
| Wyandotte County Unified School District No. 500 Kansas City, General Obligation Unlimited Bonds | | | | | | | | |
| 5.000%, 09/01/2030 | | | 500,000 | | | | 523,901 | |
| Total Education | | | | | | | 51,009,875 | |
| | | | | | | | | |
| General Obligation (35.00%)(a) | | | | | | | | |
| Abilene Public Building Commission, Revenue Bonds | | | | | | | | |
| 4.000%, 12/01/2029 | | | 325,000 | | | | 336,982 | |
| 4.000%, 12/01/2031 | | | 445,000 | | | | 457,190 | |
| Ashland Public Building Commission, Revenue Bonds | | | | | | | | |
| 5.000%, 09/01/2035 | | | 720,000 | | | | 720,632 | |
| City of Arkansas City, General Obligation Unlimited Bonds | | | | | | | | |
| 2.000%, 08/01/2035 | | | 1,000,000 | | | | 815,321 | |
| City of Brooklyn Center MN, General Obligation Unlimited Bonds | | | | | | | | |
| 5.000%, 02/01/2026 | | | 500,000 | | | | 515,766 | |
| City of Garden City, General Obligation Unlimited Bonds | | | | | | | | |
| 3.000%, 11/01/2028 | | | 950,000 | | | | 953,843 | |
| City of Goddard, General Obligation Unlimited Bonds | | | | | | | | |
| 4.000%, 12/01/2027 | | | 500,000 | | | | 517,702 | |
| City of Lawrence, General Obligation Unlimited Bonds | | | | | | | | |
| 4.000%, 09/01/2031 | | | 445,000 | | | | 453,897 | |
| City of Leawood, General Obligation Unlimited Bonds | | | | | | | | |
| 4.000%, 09/01/2029 | | | 300,000 | | | | 323,748 | |
| City of Lenexa, General Obligation Unlimited Bonds | | | | | | | | |
| 3.000%, 09/01/2033 | | | 1,560,000 | | | | 1,557,557 | |
| City of Maize, General Obligation Unlimited Bonds | | | | | | | | |
| 4.000%, 10/01/2038 | | | 375,000 | | | | 386,049 | |
| City of Manhattan, General Obligation Unlimited Bonds | | | | | | | | |
| 3.500%, 06/15/2027 | | | 885,000 | | | | 885,282 | |
| 4.000%, 11/01/2031 | | | 400,000 | | | | 419,374 | |
| 5.000%, 11/01/2025 | | | 570,000 | | | | 583,347 | |
| City of Olathe, General Obligation Unlimited Bonds | | | | | | | | |
| 3.000%, 10/01/2033 | | | 1,000,000 | | | | 1,000,655 | |
| 4.000%, 10/01/2028 | | | 1,315,000 | | | | 1,353,440 | |
| City of Overland Park, General Obligation Unlimited Bonds | | | | | | | | |
| 4.000%, 09/01/2037 | | | 475,000 | | | | 503,225 | |
| 4.000%, 09/01/2038 | | | 475,000 | | | | 499,802 | |
| 4.000%, 09/01/2039 | | | 350,000 | | | | 367,092 | |
| City of Paola, General Obligation Unlimited Bonds | | | | | | | | |
| 5.000%, 09/01/2030 | | | 535,000 | | | | 596,301 | |
| City of Park City, General Obligation Unlimited Bonds | | | | | | | | |
| 5.375%, 12/01/2025 | | | 5,000 | | | | 5,010 | |
| City of Salina, General Obligation Unlimited Bonds | | | | | | | | |
| 3.000%, 10/01/2033 | | | 620,000 | | | | 595,780 | |
| 3.000%, 10/01/2036 | | | 680,000 | | | | 639,537 | |
| City of Shawnee, General Obligation Unlimited Bonds | | | | | | | | |
| 4.000%, 12/01/2027 | | | 425,000 | | | | 426,174 | |
| City of Spring Hill, General Obligation Unlimited Bonds | | | | | | | | |
| 4.000%, 09/01/2029 | | | 810,000 | | | | 843,611 | |
| City of Wichita, Revenue Bonds | | | | | | | | |
| 5.000%, 09/01/2030 | | | 1,000,000 | | | | 1,064,737 | |
| City of Wichita, General Obligation Unlimited Bonds | | | | | | | | |
| 2.000%, 06/01/2035 | | | 400,000 | | | | 332,565 | |
| 3.000%, 10/01/2030 | | | 720,000 | | | | 714,975 | |
| 4.000%, 06/01/2030 | | | 820,000 | | | | 846,177 | |
See Notes to Financial Statements and Financial Highlights.
| Annual Report | September 30, 2024 | 3 |
| Carret Kansas Tax-Exempt Bond Fund | Schedule of Investments |
September 30, 2024
| | | Principal Amount | | | Value (Note 2) | |
| General Obligation (continued) | | | | | | | | |
| County of Anderson, General Obligation Unlimited Bonds | | | | | | | | |
| 3.000%, 08/01/2033 | | $ | 750,000 | | | $ | 737,714 | |
| County of Clay, General Obligation Unlimited Bonds | | | | | | | | |
| 4.000%, 10/01/2036 | | | 750,000 | | | | 750,000 | |
| County of Geary, General Obligation Unlimited Bonds | | | | | | | | |
| 4.000%, 09/01/2030 | | | 415,000 | | | | 422,941 | |
| County of Johnson, General Obligation Unlimited Bonds | | | | | | | | |
| 4.000%, 09/01/2028 | | | 1,125,000 | | | | 1,138,488 | |
| 4.000%, 09/01/2035 | | | 1,525,000 | | | | 1,555,745 | |
| County of Linn, General Obligation Unlimited Bonds | | | | | | | | |
| 4.000%, 07/01/2032 | | | 505,000 | | | | 524,240 | |
| County of Saline, General Obligation Unlimited Bonds | | | | | | | | |
| 4.000%, 09/01/2029 | | | 765,000 | | | | 815,642 | |
| Johnson County Public Building Commission, Revenue Bonds | | | | | | | | |
| 3.000%, 09/01/2030 | | | 790,000 | | | | 791,560 | |
| 4.000%, 09/01/2029 | | | 650,000 | | | | 665,628 | |
| 4.000%, 09/01/2030 | | | 500,000 | | | | 510,411 | |
| 4.000%, 09/01/2031 | | | 1,500,000 | | | | 1,529,449 | |
| Kansas Development Finance Authority, Revenue Bonds | | | | | | | | |
| 2.000%, 11/01/2033 | | | 950,000 | | | | 813,788 | |
| 2.000%, 11/01/2034 | | | 975,000 | | | | 820,122 | |
| 4.000%, 11/01/2030 | | | 800,000 | | | | 823,434 | |
| 4.000%, 11/01/2031 | | | 1,100,000 | | | | 1,128,677 | |
| 5.000%, 05/01/2042 | | | 1,500,000 | | | | 1,694,412 | |
| Loudoun County Economic Development Authority, Revenue Bonds | | | | | | | | |
| 5.000%, 12/01/2025 | | | 520,000 | | | | 534,245 | |
| New York City Transitional Finance Authority Future Tax Secured, Revenue Bonds | | | | | | | | |
| 5.000%, 11/01/2026 | | | 410,000 | | | | 431,624 | |
| Saline County Public Building Commission, Revenue Bonds | | | | | | | | |
| 2.000%, 09/01/2033 | | | 200,000 | | | | 171,826 | |
| 2.000%, 09/01/2034 | | | 225,000 | | | | 189,859 | |
| 2.000%, 09/01/2035 | | | 220,000 | | | | 181,997 | |
| State of Ohio, General Obligation Unlimited Bonds | | | | | | | | |
| 4.000%, 03/01/2026 | | | 500,000 | | | | 511,030 | |
| State of Wisconsin, General Obligation Unlimited Bonds | | | | | | | | |
| 5.000%, 05/01/2026 | | | 500,000 | | | | 520,118 | |
| Town of Watertown MA, General Obligation Limited Bonds | | | | | | | | |
| 5.000%, 06/15/2026 | | | 500,000 | | | | 523,096 | |
| Wyandotte County-Kansas City Unified Government, General Obligation Unlimited Bonds | | | | | | | | |
| 2.000%, 08/01/2033 | | | 1,000,000 | | | | 857,163 | |
| 4.000%, 08/01/2029 | | | 685,000 | | | | 708,351 | |
| 4.000%, 08/01/2030 | | | 2,105,000 | | | | 2,186,856 | |
| 4.000%, 08/01/2031 | | | 930,000 | | | | 930,675 | |
| 4.000%, 08/01/2032 | | | 1,000,000 | | | | 1,037,815 | |
| 5.000%, 08/01/2025 | | | 815,000 | | | | 829,551 | |
| Total General Obligation | | | | | | | 43,052,228 | |
| | | | | | | | | |
| Health Care (1.12%) | | | | | | | | |
| Lyon County Public Building Commission, Revenue Bonds | | | | | | | | |
| 5.000%, 12/01/2035 | | | 1,335,000 | | | | 1,380,410 | |
See Notes to Financial Statements and Financial Highlights.
4
| Carret Kansas Tax-Exempt Bond Fund | Schedule of Investments |
September 30, 2024
| | | Principal Amount | | | Value (Note 2) | |
| Public Services (1.39%) | | | | | | | | |
| Johnson County Park & Recreation District, Certificate Participation Bonds | | | | | | | | |
| 3.000%, 09/01/2028 | | $ | 1,165,000 | | | $ | 1,169,941 | |
| 3.000%, 09/01/2029 | | | 535,000 | | | | 536,279 | |
| Total Public Services | | | | | | | 1,706,220 | |
| | | | | | | | | |
| Transportation (11.08%) | | | | | | | | |
| Kansas Turnpike Authority, Revenue Bonds | | | | | | | | |
| 5.000%, 09/01/2031 | | | 630,000 | | | | 697,495 | |
| 5.000%, 09/01/2032 | | | 500,000 | | | | 552,116 | |
| 5.000%, 09/01/2036 | | | 1,000,000 | | | | 1,090,221 | |
| 5.000%, 09/01/2037 | | | 1,000,000 | | | | 1,088,279 | |
| 5.000%, 09/01/2038 | | | 1,150,000 | | | | 1,246,986 | |
| Massachusetts Transportation Trust Fund Metropolitan Highway System, Revenue Bonds | | | | | | | | |
| 5.000%, 01/01/2025 | | | 750,000 | | | | 753,404 | |
| Metropolitan Transportation Authority, Revenue Bonds | | | | | | | | |
| 5.000%, 11/15/2030 | | | 750,000 | | | | 780,672 | |
| State of Kansas Department of Transportation, Revenue Bonds | | | | | | | | |
| 5.000%, 09/01/2028 | | | 1,500,000 | | | | 1,604,342 | |
| 5.000%, 09/01/2031 | | | 3,020,000 | | | | 3,184,772 | |
| 5.000%, 09/01/2032 | | | 500,000 | | | | 526,139 | |
| 5.000%, 09/01/2034 | | | 2,000,000 | | | | 2,100,628 | |
| Total Transportation | | | | | | | 13,625,054 | |
| | | | | | | | | |
| Utilities (8.40%) | | | | | | | | |
| Brushy Creek Regional Utility Authority, Inc., Revenue Bonds | | | | | | | | |
| 5.000%, 08/01/2027 | | | 500,000 | | | | 524,693 | |
| City of Lawrence Water & Sewage System, Revenue Bonds | | | | | | | | |
| 4.000%, 11/01/2032 | | | 1,180,000 | | | | 1,235,436 | |
| City of Lebanon Authority, Revenue Bonds | | | | | | | | |
| 4.000%, 12/15/2028 | | | 550,000 | | | | 569,181 | |
| City of McPherson Water System, Revenue Bonds | | | | | | | | |
| 2.000%, 10/01/2038 | | | 440,000 | | | | 339,271 | |
| City of Olathe Water & Sewer System, Revenue Bonds | | | | | | | | |
| 2.000%, 07/01/2034 | | | 540,000 | | | | 452,831 | |
| 2.000%, 07/01/2035 | | | 550,000 | | | | 455,944 | |
| 3.000%, 07/01/2030 | | | 675,000 | | | | 669,114 | |
| 3.000%, 07/01/2031 | | | 555,000 | | | | 540,146 | |
| 3.000%, 07/01/2032 | | | 745,000 | | | | 712,951 | |
| 3.000%, 07/01/2033 | | | 755,000 | | | | 720,521 | |
| City of Wichita Water & Sewer Utility, Revenue Bonds | | | | | | | | |
| 3.000%, 10/01/2029 | | | 1,180,000 | | | | 1,176,197 | |
| 3.375%, 10/01/2039 | | | 1,000,000 | | | | 984,987 | |
| Wyandotte County-Kansas City Unified Government Utility System, Revenue Bonds | | | | | | | | |
| 3.000%, 09/01/2035 | | | 250,000 | | | | 240,425 | |
| 3.000%, 09/01/2040 | | | 250,000 | | | | 219,846 | |
| 5.000%, 09/01/2031 | | | 1,350,000 | | | | 1,385,782 | |
| 5.000%, 09/01/2033 | | | 100,000 | | | | 101,774 | |
| Total Utilities | | | | | | | 10,329,099 | |
| | | | | | | | | |
| TOTAL MUNICIPAL BONDS | | | | | | | | |
| (Cost $125,655,318) | | | | | | | 121,102,886 | |
See Notes to Financial Statements and Financial Highlights.
| Annual Report | September 30, 2024 | 5 |
| Carret Kansas Tax-Exempt Bond Fund | Schedule of Investments |
September 30, 2024
| | | Shares | | | Value (Note 2) | |
| SHORT TERM INVESTMENTS (0.86%) | | | | | | | | |
| Money Market Fund (0.86%) | | | | | | | | |
| First American Treasury Obligations Fund, Class X (4.796%, 7-Day Yield) | | | 1,059,125 | | | $ | 1,059,125 | |
| Total Money Market Fund | | | | | | | 1,059,125 | |
| | | | | | | | | |
| TOTAL SHORT TERM INVESTMENTS | | | | | | | | |
| (Cost $1,059,125) | | | | | | | 1,059,125 | |
| | | | | | | | | |
| TOTAL INVESTMENTS (99.33%) | | | | | | | | |
| (Cost $126,714,443) | | | | | | $ | 122,162,011 | |
| | | | | | | | | |
| OTHER ASSETS IN EXCESS OF LIABILITIES (0.67%) | | | | | | | 825,520 | |
| | | | | | | | | |
| NET ASSETS (100.00%) | | | | | | $ | 122,987,531 | |
| (a) | To the extent the Fund invests more heavily in particular sectors of the economy, its performance will be especially sensitive to developments that significantly affect those sectors. When sector categorization is broken down by industry, no industry exceeds the 25% maximum specified in the Statement of Additional Information. |
See Notes to Financial Statements and Financial Highlights.
6
| Carret Kansas Tax-Exempt Bond Fund | Statement of Assets and Liabilities |
September 30, 2024
| ASSETS: | | | | |
| Investments, at value (Cost $126,714,443) | | $ | 122,162,011 | |
| Cash and cash equivalents | | | 7,589 | |
| Receivable for shares sold | | | 248,401 | |
| Dividends and interest receivable | | | 891,019 | |
| Total Assets | | | 123,309,020 | |
| | | | | |
| LIABILITIES: | | | | |
| Distributions payable | | | 204,719 | |
| Payable for administration and transfer agent fees | | | 51,522 | |
| Payable for shares redeemed | | | 2,656 | |
| Payable to adviser | | | 241 | |
| Payable for distribution fees | | | 165 | |
| Payable for printing fees | | | 10,911 | |
| Payable for professional fees | | | 24,118 | |
| Payable for trustees' fees and expenses | | | 3,297 | |
| Payable to Chief Compliance Officer fees | | | 7,366 | |
| Accrued expenses and other liabilities | | | 16,494 | |
| Total Liabilities | | | 321,489 | |
| NET ASSETS | | $ | 122,987,531 | |
| | | | | |
| NET ASSETS CONSIST OF: | | | | |
| Paid-in capital (Note 5) | | $ | 129,996,587 | |
| Total distributable earnings/(deficit) | | | (7,009,056 | ) |
| NET ASSETS | | $ | 122,987,531 | |
| | | | | |
| PRICING OF SHARES | | | | |
| Institutional Class: | | | | |
| Net Asset Value, offering and redemption price per share | | $ | 10.23 | |
| Net Assets | | $ | 122,183,161 | |
| Shares of beneficial interest outstanding | | | 11,949,084 | |
| Class A : | | | | |
| Net Asset Value, offering and redemption price per share | | $ | 10.23 | |
| Net Assets | | $ | 804,370 | |
| Shares of beneficial interest outstanding | | | 78,664 | |
| Maximum offering price per share(a) | | $ | 10.68 | |
| (a) | Net Asset Value/100% minus maximum sales charge of net asset value, 4.25% for the Fund, adjusted to the nearest cent. |
See Notes to Financial Statements and Financial Highlights.
| Annual Report | September 30, 2024 | 7 |
| Carret Kansas Tax-Exempt Bond Fund | Statement of Operations |
For the Year Ended September 30, 2024
INVESTMENT INCOME:
| Interest | | $ | 3,045,005 | |
| Total Investment Income | | | 3,045,005 | |
| | | | | |
| EXPENSES: | | | | |
| Investment advisory fees (Note 6) | | | 367,524 | |
| Administration fees | | | 193,396 | |
| Distribution fees | | | | |
| Class A | | | 788 | |
| Custody fees | | | 14,812 | |
| Legal fees | | | 18,022 | |
| Audit and tax fees | | | 20,964 | |
| Transfer agent fees | | | 58,415 | |
| Trustees' fees and expenses | | | 10,768 | |
| Registration and filing fees | | | 46,539 | |
| Printing fees | | | 14,412 | |
| Chief Compliance Officer fees | | | 47,296 | |
| Insurance fees | | | 6,088 | |
| Fees recouped by investment adviser (Note 6) | | | | |
| Class A | | | 2,560 | |
| Other expenses | | | 12,505 | |
| Total Expenses | | | 814,089 | |
| Less fees waived/reimbursed by investment adviser (Note 6) | | | | |
| Institutional Class | | | (220,331 | ) |
| Class A | | | (3,316 | ) |
| Total fees waived by investment adviser | | | (223,647 | ) |
| Net Expenses | | | 590,442 | |
| NET INVESTMENT INCOME | | | 2,454,563 | |
| REALIZED AND UNREALIZED GAIN/(LOSS) ON INVESTMENTS: | | | | |
| Net realized gain/(loss) on: | | | | |
| Investments | | | (1,281,013 | ) |
| Net realized loss | | | (1,281,013 | ) |
| Change in unrealized appreciation/(depreciation) on: | | | | |
| Investments | | | 9,046,275 | |
| Net change | | | 9,046,275 | |
| NET REALIZED AND UNREALIZED GAIN ON INVESTMENTS | | | 7,765,262 | |
| NET INCREASE IN NET ASSETS RESULTING FROM OPERATIONS | | $ | 10,219,825 | |
See Notes to Financial Statements and Financial Highlights.
8
| Carret Kansas Tax-Exempt Bond Fund | Statements of Changes in Net Assets |
| | | For the Year Ended September 30, 2024 | | | For the Year Ended September 30, 2023 | |
| OPERATIONS: | | | | | | |
| Net investment income | | $ | 2,454,563 | | | $ | 2,594,311 | |
| Net realized loss on investments | | | (1,281,013 | ) | | | (1,250,238 | ) |
| Net change in unrealized appreciation on investments | | | 9,046,275 | | | | 1,219,951 | |
| Net increase in net assets resulting from operations | | | 10,219,825 | | | | 2,564,024 | |
| | | | | | | | | |
| DISTRIBUTIONS TO SHAREHOLDERS | | | | | | | | |
| Institutional Class | | | (2,444,968 | ) | | | (2,584,190 | ) |
| Class A | | | (16,126 | ) | | | (19,020 | ) |
| Total distributions | | | (2,461,094 | ) | | | (2,603,210 | ) |
| | | | | | | | | |
| BENEFICIAL SHARE TRANSACTIONS (Note 5): | | | | | | | | |
| Institutional Class | | | | | | | | |
| Shares sold | | | 14,670,691 | | | | 16,565,736 | |
| Dividends reinvested | | | 60,082 | | | | 112,701 | |
| Shares redeemed | | | (18,703,592 | ) | | | (36,307,952 | ) |
| Net decrease from beneficial share transactions | | | (3,972,819 | ) | | | (19,629,515 | ) |
| Class A | | | | | | | | |
| Shares sold | | | 24,000 | | | | 21,098 | |
| Dividends reinvested | | | 14,781 | | | | 16,960 | |
| Shares redeemed | | | (267,403 | )(a) | | | (188,781 | ) |
| Net decrease from beneficial share transactions | | | (228,622 | ) | | | (150,723 | ) |
| Net increase/(decrease) in net assets | | | 3,557,290 | | | | (19,819,424 | ) |
| | | | | | | | | |
| NET ASSETS: | | | | | | | | |
| Beginning of year | | | 119,430,241 | | | | 139,249,665 | |
| End of year | | $ | 122,987,531 | | | $ | 119,430,241 | |
| (a) | Shares redeemed amount was netted with $10 redemption fee. |
See Notes to Financial Statements and Financial Highlights.
| Annual Report | September 30, 2024 | 9 |
| Carret Kansas Tax-Exempt Bond Fund | Financial Highlights |
| Institutional Class | For a Share Outstanding Throughout the Periods Presented |
| | | For the Year Ended September 30, 2024 | | | For the Year Ended September 30, 2023 | | | For the Year Ended September 30, 2022 | | | For the Year Ended September 30, 2021 | | | For the Year Ended September 30, 2020 | |
| NET ASSET VALUE, BEGINNING OF PERIOD | | $ | 9.60 | | | $ | 9.64 | | | $ | 11.10 | | | $ | 11.16 | | | $ | 10.97 | |
| | | | | | | | | | | | | | | | | | | | | |
| INCOME/(LOSS) FROM OPERATIONS: | | | | | | | | | | | | | | | | | | | | |
| Net investment income(a) | | | 0.20 | | | | 0.20 | | | | 0.19 | | | | 0.20 | | | | 0.24 | |
| Net realized and unrealized gain/(loss) on investments | | | 0.63 | | | | (0.04 | ) | | | (1.45 | ) | | | (0.06 | ) | | | 0.21 | |
| Total from investment operations | | | 0.83 | | | | 0.16 | | | | (1.26 | ) | | | 0.14 | | | | 0.45 | |
| | | | | | | | | | | | | | | | | | | | | |
| LESS DISTRIBUTIONS: | | | | | | | | | | | | | | | | | | | | |
| From net investment income | | | (0.20 | ) | | | (0.20 | ) | | | (0.19 | ) | | | (0.20 | ) | | | (0.24 | ) |
| From net realized gains on investments | | | – | | | | (0.00 | )(b) | | | (0.01 | ) | | | (0.00 | )(b) | | | (0.02 | ) |
| Total Distributions | | | (0.20 | ) | | | (0.20 | ) | | | (0.20 | ) | | | (0.20 | ) | | | (0.26 | ) |
| NET INCREASE/(DECREASE) IN NET ASSET VALUE | | | 0.63 | | | | (0.04 | ) | | | (1.46 | ) | | | (0.06 | ) | | | 0.19 | |
| NET ASSET VALUE, END OF PERIOD | | $ | 10.23 | | | $ | 9.60 | | | $ | 9.64 | | | $ | 11.10 | | | $ | 11.16 | |
| | | | | | | | | | | | | | | | | | | | | |
| TOTAL RETURN(c) | | | 8.72 | % | | | 1.57 | % | | | (11.49 | %) | | | 1.30 | % | | | 4.17 | % |
| | | | | | | | | | | | | | | | | | | | | |
| SUPPLEMENTAL DATA: | | | | | | | | | | | | | | | | | | | | |
| Net assets, end of period (in 000s) | | $ | 122,183 | | | $ | 118,458 | | | $ | 138,130 | | | $ | 180,253 | | | $ | 178,827 | |
| | | | | | | | | | | | | | | | | | | | | |
| RATIOS TO AVERAGE NET ASSETS | | | | | | | | | | | | | | | | | | | | |
| Operating expenses excluding reimbursement/waiver | | | 0.66 | % | | | 0.60 | % | | | 0.58 | % | | | 0.56 | % | | | 0.57 | % |
| Operating expenses including reimbursement/waiver | | | 0.48 | % | | | 0.48 | % | | | 0.48 | % | | | 0.48 | % | | | 0.48 | % |
| Net investment income including reimbursement/waiver | | | 2.01 | % | | | 1.96 | % | | | 1.80 | % | | | 1.83 | % | | | 2.17 | % |
| | | | | | | | | | | | | | | | | | | | | |
| PORTFOLIO TURNOVER RATE | | | 10 | % | | | 8 | % | | | 6 | % | | | 8 | % | | | 16 | % |
| (a) | Per share amounts are based upon average shares outstanding, unless otherwise noted. |
| (b) | Less than $0.005 per share. |
| (c) | Assumes an initial investment on the business day before the first day of the fiscal period, with all dividends and distributions reinvested in additional shares on the reinvestment date, and redemption at the net asset value calculated on the last business day of the fiscal period. Total returns are for the period indicated and have not been annualized. Total returns would have been lower had certain expenses not been waived during the period. Returns shown do not reflect the deduction of taxes that a shareholder would pay on Fund distributions or the redemption of Fund shares. |
See Notes to Financial Statements and Financial Highlights.
10
| Carret Kansas Tax-Exempt Bond Fund | Financial Highlights |
| Class A | For a Share Outstanding Throughout the Periods Presented |
| | | For the Year Ended September 30, 2024 | | | For the Year Ended September 30, 2023 | | | For the Year Ended September 30, 2022 | | | For the Year Ended September 30, 2021 | | | For the Year Ended September 30, 2020 | |
| NET ASSET VALUE, BEGINNING OF PERIOD | | $ | 9.60 | | | $ | 9.64 | | | $ | 11.10 | | | $ | 11.16 | | | $ | 10.97 | |
| | | | | | | | | | | | | | | | | | | | | |
| INCOME/(LOSS) FROM OPERATIONS: | | | | | | | | | | | | | | | | | | | | |
| Net investment income(a) | | | 0.18 | | | | 0.17 | | | | 0.16 | | | | 0.18 | | | | 0.21 | |
| Net realized and unrealized gain/(loss) on investments | | | 0.63 | | | | (0.04 | ) | | | (1.45 | ) | | | (0.06 | ) | | | 0.21 | |
| Total from investment operations | | | 0.81 | | | | 0.13 | | | | (1.29 | ) | | | 0.12 | | | | 0.42 | |
| | | | | | | | | | | | | | | | | | | | | |
| LESS DISTRIBUTIONS: | | | | | | | | | | | | | | | | | | | | |
| From net investment income | | | (0.18 | ) | | | (0.17 | ) | | | (0.16 | ) | | | (0.18 | ) | | | (0.21 | ) |
| From net realized gains on investments | | | – | | | | (0.00 | )(b) | | | (0.01 | ) | | | (0.00 | )(b) | | | (0.02 | ) |
| Total Distributions | | | (0.18 | ) | | | (0.17 | ) | | | (0.17 | ) | | | (0.18 | ) | | | (0.23 | ) |
| NET INCREASE/(DECREASE) IN NET ASSET VALUE | | | 0.63 | | | | (0.04 | ) | | | (1.46 | ) | | | (0.06 | ) | | | 0.19 | |
| NET ASSET VALUE, END OF PERIOD | | $ | 10.23 | | | $ | 9.60 | | | $ | 9.64 | | | $ | 11.10 | | | $ | 11.16 | |
| | | | | | | | | | | | | | | | | | | | | |
| TOTAL RETURN(c) | | | 8.46 | % | | | 1.32 | % | | | (11.72 | %) | | | 1.05 | % | | | 3.91 | % |
| | | | | | | | | | | | | | | | | | | | | |
| SUPPLEMENTAL DATA: | | | | | | | | | | | | | | | | | | | | |
| Net assets, end of period (in 000s) | | $ | 804 | | | $ | 972 | | | $ | 1,120 | | | $ | 3,813 | | | $ | 4,253 | |
| | | | | | | | | | | | | | | | | | | | | |
| RATIOS TO AVERAGE NET ASSETS | | | | | | | | | | | | | | | | | | | | |
| Operating expenses excluding reimbursement/waiver | | | 0.81 | % | | | 0.91 | % | | | 0.90 | % | | | 0.87 | % | | | 0.86 | % |
| Operating expenses including reimbursement/waiver | | | 0.73 | % | | | 0.73 | % | | | 0.73 | % | | | 0.73 | % | | | 0.73 | % |
| Net investment income including reimbursement/waiver | | | 1.75 | % | | | 1.71 | % | | | 1.54 | % | | | 1.58 | % | | | 1.92 | % |
| | | | | | | | | | | | | | | | | | | | | |
| PORTFOLIO TURNOVER RATE | | | 10 | % | | | 8 | % | | | 6 | % | | | 8 | % | | | 16 | % |
| (a) | Per share amounts are based upon average shares outstanding, unless otherwise noted. |
| (b) | Less than $0.005 per share. |
| (c) | Assumes an initial investment on the business day before the first day of the fiscal period, with all dividends and distributions reinvested in additional shares on the reinvestment date, and redemption at the net asset value calculated on the last business day of the fiscal period. Total returns are for the period indicated and have not been annualized. Total returns would have been lower had certain expenses not been waived during the period. Returns shown do not reflect the deduction of taxes that a shareholder would pay on Fund distributions or the redemption of Fund shares. |
See Notes to Financial Statements and Financial Highlights.
| Annual Report | September 30, 2024 | 11 |
| Carret Kansas Tax-Exempt Bond Fund | Notes to Financial Statements and Financial Highlights |
September 30, 2024
1. ORGANIZATION
ALPS Series Trust (the “Trust”), a Delaware statutory trust, is an open-end management investment company registered under the Investment Company Act of 1940, as amended (“1940 Act”). The Trust consists of multiple separate portfolios or series. This annual report describes the Carret Kansas Tax-Exempt Bond Fund (the “Fund” or “Kansas Tax-Exempt Bond Fund”) formally known as the American Independence Kansas Tax-Exempt Bond Fund. On September 13, 2019, Carret Asset Management, LLC (the “Adviser” or “Carret") became the adviser to the Kansas Tax-Exempt Bond Fund, changing the Fund’s name from American Independence to Carret. The Fund’s investment objective is to preserve capital while producing current income for the investor that is exempt from both federal and Kansas state income taxes. The Fund is considered non-diversified and may invest a greater portion of assets in securities of individual issuers than a diversified fund. As a result, changes in the market value of a single investment could cause greater fluctuations in share price than would occur in a diversified fund. The Fund currently offers Institutional Class Shares and Class A Shares. Each share class has identical rights to earnings, assets and voting privileges, except for class specific expenses and exclusive rights to vote on matters affecting only individual classes. The Board of Trustees (the "Board" or "Trustees") may establish additional funds and classes of shares at any time in the future without shareholder approval.
2. SIGNIFICANT ACCOUNTING POLICIES
The accompanying financial statements were prepared in accordance with accounting principles generally accepted in the United States of America for investment companies (“U.S. GAAP”). The Fund is considered an investment company under U.S. GAAP and follows the accounting and reporting guidance applicable to investment companies in the Financial Accounting Standards Board (“FASB”) Accounting Standards Codification Topic 946, Financial Services - Investment Companies. The preparation of financial statements in conformity with U.S. GAAP requires management to make certain estimates and assumptions that affect the reported amounts of assets and liabilities and disclosures of contingent assets and liabilities at the date of the financial statements and the reported amounts of increases and decreases in net assets from operations during the period. Actual results could differ from those estimates. The following is a summary of significant accounting policies consistently followed by the Fund in preparation of its financial statements.
Investment Valuation: The Fund generally values its securities based on market prices determined at the close of regular trading on the New York Stock Exchange (“NYSE”), normally 4:00 p.m. Eastern Time, on each day the NYSE is open for trading.
The market price for debt obligations is generally the price supplied by an independent third-party pricing service approved by the Board, which may use a matrix, formula or other objective method that takes into consideration quotations from dealers, market transactions in comparable investments, market indices and yield curves. If vendors are unable to supply a price, or if the price supplied is deemed to be unreliable, the market price may be determined using quotations received from one or more broker-dealers that make a market in the security.
Redeemable securities issued by open-end registered investment companies are valued at the investment company’s applicable net asset value (“NAV”). Money market funds, representing short-term investments, are valued at their NAV.
When such prices or quotations are not available, or when the valuation designee appointed by the Board believes that they are unreliable, securities may be priced using fair value procedures approved by the Board.
Fair Value Measurements: The Fund discloses the classification of its fair value measurements following a three-tier hierarchy based on the inputs used to measure fair value. Inputs refer broadly to the assumptions that market participants would use in pricing the asset or liability, including assumptions about risk. Inputs may be observable or unobservable. Observable inputs reflect the assumptions market participants would use in pricing the asset or liability that are developed based on market data obtained from sources independent of the reporting entity. Unobservable inputs reflect the reporting entity’s own assumptions about the assumptions market participants would use in pricing the asset or liability that are developed based on the best information available.
Various inputs are used in determining the value of the Fund’s investments as of the end of the reporting period. When inputs used fall into different levels of the fair value hierarchy, the level in the hierarchy within which the fair value measurement falls is determined based on the lowest level input that is significant to the fair value measurement in its entirety. The designated input levels are not necessarily an indication of the risk or liquidity associated with these investments. These inputs are categorized in the following hierarchy under applicable financial accounting standards:
| Level 1 – | Unadjusted quoted prices in active markets for identical investments, unrestricted assets or liabilities that the Fund has the ability to access at the measurement date; |
12
| Carret Kansas Tax-Exempt Bond Fund | Notes to Financial Statements and Financial Highlights |
September 30, 2024
| Level 2 – | Quoted prices which are not active, quoted prices for similar assets or liabilities in active markets or inputs other than quoted prices that are observable (either directly or indirectly); and |
| Level 3 – | Significant unobservable prices or inputs (including the Fund’s own assumptions in determining the fair value of investments) where there is little or no market activity for the asset or liability at the measurement date. |
The following is a summary of the inputs used to value the Fund’s investments as of September 30, 2024:
| Investments in Securities at Value* | | Level 1 - Quoted and Unadjusted Prices | | | Level 2 - Other Significant Observable Inputs | | | Level 3 - Significant Unobservable Inputs | | | Total | |
| Municipal Bonds | | $ | – | | | $ | 121,102,886 | | | $ | – | | | $ | 121,102,886 | |
| Short Term Investments | | | 1,059,125 | | | | – | | | | – | | | | 1,059,125 | |
| Total | | $ | 1,059,125 | | | $ | 121,102,886 | | | $ | – | | | $ | 122,162,011 | |
| * | For a detailed Sector breakdown, see the accompanying Schedule of Investments. |
There were no Level 3 securities held in the Fund during the year ended September 30, 2024.
Securities Purchased on a When-Issued Basis: The Fund may purchase securities on a “when-issued” basis. When-issued securities are securities purchased for delivery beyond the normal settlement date at a stated price and/or yield, thereby involving the risk that the price and/or yield obtained may be more or less than those available in the market when delivery takes place. At the time the Fund makes the commitment to purchase a security on a when-issued basis, the Fund records the transaction and reflects the value of the security in determining net asset value. Normally, the settlement date occurs within one month of the purchase. No payment is made by the Fund and no interest accrues to the Fund during the period between purchase and settlement.
Cash & Cash Equivalents: The Fund considers its investment in a Federal Deposit Insurance Corporation ("FDIC") insured interest bearing account to be cash and cash equivalents. Cash and cash equivalents are valued at cost plus any accrued interest. The Fund maintains cash balances, which, at times may exceed federally insured limits. The Fund maintains these balances with a high-quality financial institution.
Concentration of Credit Risk: The Fund places its cash with a banking institution, which is insured by FDIC. The FDIC limit is $250,000. At various times throughout the year, the amount on deposit may exceed the FDIC limit and subject the Fund to a credit risk. The Fund does not believe that such deposits are subject to any unusual risk associated with investment activities.
The Fund invests primarily in debt obligations issued by the State of Kansas and its respective political subdivisions, agencies and public authorities. The Fund is more susceptible to economic and political factors adversely affecting issuers of Kansas specific municipal securities than are municipal bond funds that are not concentrated in these issuers to the same extent.
Trust Expenses: Some expenses of the Trust can be directly attributed to a fund. Expenses that cannot be directly attributed to a fund are apportioned among all funds in the Trust based on average net assets of each fund, including Trustees’ fees and expenses.
Fund Expenses: Some expenses can be directly attributed to the Fund and are apportioned among the classes based on average net assets of each class.
Class Expenses: Expenses that are specific to a class of shares are charged directly to that share class. Fees provided under the distribution (Rule 12b-1) and/or shareholder service plans for a particular class of each Fund are charged to the operations of such class.
Federal Income Taxes: The Fund complies with the requirements under Subchapter M of the Internal Revenue Code of 1986, as amended, applicable to regulated investment companies and intends to distribute substantially all of its net taxable income and net capital gains, if any, each year so that it will not be subject to excise tax on undistributed income and gains. The Fund is not subject to income taxes to the extent such distributions are made.
As of and during the year ended September 30, 2024, the Fund did not have a liability for any unrecognized tax benefits in the accompanying financial statements. The Fund recognizes interest and penalties, if any, related to tax liabilities as income tax expense in the Statement of Operations. The Fund files U.S. federal, state and local income tax returns as required. The Fund’s tax returns are subject to examination by the relevant tax authorities until expiration of the applicable statute of limitations, which is generally three years after the filing of the tax return for federal purposes and four years for most state returns. The Fund’s administrator has analyzed the Fund’s tax positions taken on federal and state income tax returns for all open tax years and has concluded that as of September 30, 2024, no provision for income tax is required in the Fund’s financial statements related to these tax positions.
| Annual Report | September 30, 2024 | 13 |
| Carret Kansas Tax-Exempt Bond Fund | Notes to Financial Statements and Financial Highlights |
September 30, 2024
Investment Transactions and Investment Income: Investment transactions are accounted for on the date the investments are purchased or sold (trade date basis for financial reporting purposes). Realized gains and losses from investment transactions are reported on an identified cost basis. Interest income, which includes accretion of discounts and amortization of premiums, is accrued and recorded as earned based on the effective yield method. Dividend income is recognized on the ex-dividend date. All of the realized and unrealized gains and losses and net investment income are allocated daily to each class in proportion to its average daily net assets.
Distributions to Shareholders: Distributions from net investment income for the Fund are declared daily and paid monthly. Distributions from net realized capital gains, if any, are distributed at least annually. Income dividend distributions are derived from interest and other income the Fund receives from its investments, including short-term capital gains. Long-term capital gain distributions are derived from gains realized when the Fund sells a security it has owned for more than one year. A Fund may make additional distributions and dividends at other times if its investment adviser has determined that doing so may be necessary for the Fund to avoid or reduce taxes. Net investment income/(loss) and net realized gain/(loss) may differ for financial statement and tax purposes.
3. TAX BASIS INFORMATION
Tax Basis of Distributions to Shareholders: The character of distributions made during the period from net investment income or net realized gains may differ from its ultimate characterization for federal income tax purposes. Also, due to the timing of dividend distributions, the fiscal year in which amounts are distributed may differ from the fiscal year in which the income or realized gain were recorded by the Fund. The amounts and characteristics of tax basis distributions are estimated at the time of distribution and composition of distributable earnings/(accumulated losses) are finalized at fiscal year-end.
The tax character of distributions paid by the Fund for the fiscal years ended September 30, 2024 and September 30, 2023, respectively were as follows:
| | | Ordinary Income | | | Tax-Exempt Income | | | Long-Term Capital Gains | |
| Kansas Tax-Exempt Bond Fund | | $ | 50,772 | | | $ | 2,410,322 | | | $ | – | |
| | | | | | | | | | |
| | | Ordinary Income | | | Tax-Exempt Income | | | Long-Term Capital Gains | |
| Kansas Tax-Exempt Bond Fund | | $ | 62,679 | | | $ | 2,531,707 | | | $ | 8,824 | |
Unrealized Appreciation and Depreciation on Investments: As of September 30, 2024, the aggregate cost of investments, gross unrealized appreciation/(depreciation) and net unrealized depreciation for Federal tax purposes were as follows:
| | | Kansas Tax-Exempt Bond Fund | |
| Gross unrealized appreciation (excess of value over tax cost) | | $ | 257,324 | |
| Gross unrealized depreciation (excess of tax cost over value) | | | (4,809,756 | ) |
| Net unrealized depreciation | | $ | (4,552,432 | ) |
| Cost of investments for income tax purposes | | $ | 126,714,443 | |
Reclassifications: As of September 30, 2024, there were no permanent differences in book and tax accounting.
Components of Distributable Earnings: At September 30, 2024, components of distributable earnings were as follows:
| | | Kansas Tax-Exempt Bond Fund | |
| Undistributed ordinary income | | $ | 4,127 | |
| Tax-Exempt Undistributed Income | | | 275,219 | |
| Accumulated capital losses | | | (2,531,251 | ) |
| Net unrealized depreciation | | | (4,552,432 | ) |
| Other cumulative effect of timing differences(a) | | | (204,719 | ) |
| Total | | $ | (7,009,056 | ) |
| (a) | Related to distribution payable at year end. |
14
| Carret Kansas Tax-Exempt Bond Fund | Notes to Financial Statements and Financial Highlights |
September 30, 2024
Under current law, capital losses maintain their character as short-term or long-term and are carried forward to the next tax year without expiration. As of the current fiscal year end, the following amounts are available as carry forwards to the next tax year:
| Short-Term | | | Long-Term | |
| $ | — | | | $ | 2,531,251 | |
4. SECURITIES TRANSACTIONS
Purchases and sales of securities, excluding short-term securities, during the year ended September 30, 2024, were as follows:
| | | Purchases of Securities | | | Proceeds from Sales of Securities | |
| Kansas Tax-Exempt Bond Fund | | $ | 11,534,193 | | | $ | 14,225,581 | |
5. BENEFICIAL SHARE TRANSACTIONS
The capitalization of the Trust consists of an unlimited number of shares of beneficial interest with no par value per share. Holders of the shares of the Fund have one vote for each share held and a proportionate fraction of a vote for each fractional share. All shares issued and outstanding are fully paid and are transferable and redeemable at the option of the shareholder. Shares have no pre-emptive rights. Neither the Fund nor any of their creditors have the right to require shareholders to pay any additional amounts solely because the shareholder owns the shares.
Transactions in common shares were as follows:
| | | For the Year Ended September 30, 2024 | | | For the Year Ended September 30, 2023 | |
| Kansas Tax-Exempt Bond Fund | | | | | | | | |
| Institutional Class | | | | | | | | |
| Shares sold | | | 1,463,621 | | | | 1,651,757 | |
| Shares issued in reinvestment of distributions to shareholders | | | 5,993 | | | | 11,296 | |
| Shares redeemed | | | (1,859,916 | ) | | | (3,653,062 | ) |
| Net decrease in shares outstanding | | | (390,302 | ) | | | (1,990,009 | ) |
| Class A | | | | | | | | |
| Shares sold | | | 2,392 | | | | 2,110 | |
| Shares issued in reinvestment of distributions to shareholders | | | 1,473 | | | | 1,699 | |
| Shares redeemed | | | (26,451 | ) | | | (18,725 | ) |
| Net decrease in shares outstanding | | | (22,586 | ) | | | (14,916 | ) |
Control is defined by the 1940 Act as the beneficial ownership, either directly or through one or more controlled companies, of more than 25% of the voting securities of a company. Approximately 98% of the shares outstanding of the Fund are owned by one omnibus account.
6. MANAGEMENT AND RELATED PARTY TRANSACTIONS
Investment Advisory: Carret Asset Management, LLC, serves as the investment adviser to the Fund. The Adviser, subject to the authority of the Board, is responsible for the overall management and administration of the Fund’s business affairs. The Adviser manages the investments of the Fund in accordance with the Fund’s investment objective, policies and limitations, and investment guidelines established jointly by the Adviser and the Board.
Pursuant to the Investment Advisory Agreement (“Advisory Agreement”) with the Adviser, the Fund pays the Adviser an annual management fee of 0.30% based on the Fund’s average daily net assets. The management fee is paid on a monthly basis. The current term of the Advisory Agreement is one year. The Board may extend the Advisory Agreement for additional one-year terms by approval at an in-person meeting called for the purpose of considering such matters. The Board and shareholders of the Fund may terminate the Advisory Agreement upon 60 days’ prior written notice. The Adviser may terminate the Advisory Agreement upon 120 days’ prior written notice.
| Annual Report | September 30, 2024 | 15 |
| Carret Kansas Tax-Exempt Bond Fund | Notes to Financial Statements and Financial Highlights |
September 30, 2024
Pursuant to a fee waiver letter agreement (“Fee Waiver Agreement”), the Adviser has contractually agreed to limit the amount of the Total Annual Fund Operating Expenses, (excluding Rule 12b-1 Fees, Acquired Fund Fees and Expenses, brokerage expenses, interest expenses, taxes and extraordinary expenses) to an annual rate of 0.48% of the Fund’s average daily net assets. The Fee Waiver Agreement is in effect through January 31, 2025, and will automatically continue upon annual approval by the Board for successive twelve-month periods unless (i) it is terminated earlier by the Board of Trustees, or (ii) the Adviser provides at least 30 days written notice of its non-continuance prior to the end of the then effective term. Except due to the Adviser’s notice of non-renewal, this Agreement may only be amended or terminated with the approval of the Board. The Adviser will be permitted to recover, on a class-by-class basis, expenses it has borne through the Fee Waiver Agreement (whether through reduction of its management fee or otherwise) only to the extent that the Fund's expenses in later periods do not exceed the lesser of: (1) the contractual expense limit in effect at the time the Adviser waives or limits the expenses; or (2) the contractual expense limit in effect at the time the Adviser seeks to recover the expenses; provided, however, that the Fund will not be obligated to pay any such deferred fees or expenses more than three years after the date on which the fee or expense was reduced, as calculated on a monthly basis. The Adviser recovered $2,560 of expenses previously waived within Class A, during the year ended September 30, 2024.
As of September 30, 2024, the balances of recoupable expenses for the Fund were as follows:
| Kansas Tax-Exempt Bond Fund | | Expiring in 2025 | | | Expiring in 2026 | | | Expiring in 2027 | | | Total | |
| Institutional Class | | $ | 171,583 | | | $ | 158,799 | | | $ | 220,331 | | | $ | 550,713 | |
| Class A | | | 3,027 | | | | 1,936 | | | | 3,316 | | | | 8,279 | |
Administrator: ALPS Fund Services, Inc. (“ALPS”) (an affiliate of ALPS Distributors, Inc.) serves as administrator to the Fund. The Fund has agreed to pay expenses incurred in connection with its administrative activities. Pursuant to the Administration, Bookkeeping and Pricing Services Agreement with the Trust, ALPS will provide operational services to the Fund including, but not limited to, fund accounting and fund administration, and will generally assist in the Fund’s operations. The Fund’s administration fee is accrued on a daily basis and paid monthly. The officers of the Trust are employees of ALPS. Administration fees paid by the Fund for the year ended September 30, 2024, are disclosed in the Statement of Operations. ALPS is reimbursed by the Fund for certain out of pocket expenses.
Transfer Agent: ALPS serves as transfer agent for the Fund under a Transfer Agency and Services Agreement with the Trust. Under this agreement, ALPS is paid an annual fee for services performed on behalf of the Fund plus fees for open accounts and is reimbursed for certain out-of-pocket expenses.
Compliance Services: ALPS provides Chief Compliance Officer services to the Fund to monitor and test the policies and procedures of the Fund in conjunction with requirements under Rule 38a-1 of the 1940 Act pursuant to a Chief Compliance Officer Services Agreement with the Trust. Under this agreement, ALPS is paid an annual fee for services performed on behalf of the Fund and is reimbursed for certain out-of-pocket expenses.
Distribution: ALPS Distributors, Inc. (the “Distributor”) (an affiliate of ALPS) acts as the principal underwriter of the Fund’s shares pursuant to a Distribution Agreement with the Trust. Shares of the Fund are offered on a continuous basis through the Distributor, as agent of the Fund. The Distributor is not obligated to sell any particular amount of shares of the Fund and is not entitled to any compensation for its services as the Fund’s principal underwriter pursuant to the Distribution Agreement.
The Fund has adopted a shareholder services plan (“Shareholder Services Plan”) for its Class A Shares. Under the Shareholder Services Plan the Fund is authorized to pay banks and their affiliates and other institutions, including broker-dealers and Fund affiliates (“Participating Organizations”), an aggregate fee in an amount not to exceed on an annual basis 0.25% of the average daily net assets of the Fund’s Class A Shares to Participating Organizations as compensation for providing shareholder service activities, which do not include distribution services, pursuant to an agreement with a Participating Organization. The Board authorized 0.00% to be paid of shareholder servicing fees.
The Fund has adopted a plan pursuant to Rule 12b-1 under the 1940 Act (the “Plan”) that allows its Class A shares to pay a distribution and service fee, as defined by the Financial Industry Regulatory Authority (“FINRA”), from its assets for selling and distributing its shares. The Fund was permitted to pay distribution and service fees at an annual rate of up to 0.25% of its Class A share assets. Distribution fees paid by the Fund for the year ended September 30, 2024, are disclosed in the Statement of Operations.
16
| Carret Kansas Tax-Exempt Bond Fund | Notes to Financial Statements and Financial Highlights |
September 30, 2024
7. TRUSTEES AND OFFICERS
As of September 30, 2024, there were four Trustees, each of whom are not “interested persons” (as defined in the 1940 Act) of the Trust (the “Independent Trustees”). The Independent Trustees of the Trust and, if any, Interested Trustees who are not currently employed by the Adviser, ALPS or other service providers receive a quarterly retainer of $16,250, plus $5,000 for each regular Board or Committee meeting attended and $2,000 for each special telephonic or in-person Board or Committee meeting attended. Additionally, the Audit Committee Chair receives a quarterly retainer of $1,875 and the Independent Chair receives a quarterly retainer of $4,250. These fees are allocated proportionately among the multiple portfolios/series of the Trust. The Independent Trustees and, if any, Interested Trustees who are not currently employed by the Adviser, ALPS or other service providers are also reimbursed for all reasonable out-of-pocket expenses relating to attendance at meetings.
Officers of the Trust receive no salary or fees from the Trust. As discussed in Note 6, the Fund pays ALPS an annual fee for compliance services.
8. INDEMNIFICATIONS
Under the Trust’s organizational documents, its officers and Trustees are indemnified against certain liabilities arising out of the performance of their duties to the Trust. Additionally, in the normal course of business, the Trust enters into contracts with service providers that may contain general indemnification clauses which may permit indemnification to the extent permissible under applicable law. The Trust’s maximum exposure under these arrangements is unknown, as such exposure would involve future claims that may be made against the Trust that have not yet occurred.
9. SUBSEQUENT EVENTS
Subsequent events after the date of the Statement of Assets and Liabilities have been evaluated through the date the financial statements were issued. Management has determined that there were no subsequent events to report through the issuance of these financial statements.
| Annual Report | September 30, 2024 | 17 |
| Carret Kansas Tax-Exempt Bond Fund | Report of Independent Registered Public Accounting Firm |
To the Shareholders of Carret Kansas Tax-Exempt Bond Fund and
Board of Trustees of ALPS Series Trust
Opinion on the Financial Statements
We have audited the accompanying statement of assets and liabilities, including the schedule of investments, of Carret Kansas Tax-Exempt Bond Fund (the “Fund”), a series of ALPS Series Trust, as of September 30, 2024, the related statement of operations for the year then ended, the statements of changes in net assets for each of the two years in the period then ended, the financial highlights for each of the five years in the period then ended, and the related notes (collectively referred to as the “financial statements”). In our opinion, the financial statements present fairly, in all material respects, the financial position of the Fund as of September 30, 2024, the results of its operations for the year then ended, the changes in net assets for each of the two years in the period then ended, and the financial highlights for each of the five years in the period then ended, in conformity with accounting principles generally accepted in the United States of America.
Basis for Opinion
These financial statements are the responsibility of the Fund’s management. Our responsibility is to express an opinion on the Fund’s financial statements based on our audits. We are a public accounting firm registered with the Public Company Accounting Oversight Board (United States) (“PCAOB”) and are required to be independent with respect to the Fund in accordance with the U.S. federal securities laws and the applicable rules and regulations of the Securities and Exchange Commission and the PCAOB.
We conducted our audits in accordance with the standards of the PCAOB. Those standards require that we plan and perform the audit to obtain reasonable assurance about whether the financial statements are free of material misstatement whether due to error or fraud.
Our audits included performing procedures to assess the risks of material misstatement of the financial statements, whether due to error or fraud, and performing procedures that respond to those risks. Such procedures included examining, on a test basis, evidence regarding the amounts and disclosures in the financial statements. Our procedures included confirmation of securities owned as of September 30, 2024, by correspondence with the custodian. Our audits also included evaluating the accounting principles used and significant estimates made by management, as well as evaluating the overall presentation of the financial statements. We believe that our audits provide a reasonable basis for our opinion.
We have served as the Fund’s auditor since 2018.

COHEN & COMPANY, LTD.
Cleveland, Ohio
November 27, 2024
18
| Carret Kansas Tax-Exempt Bond Fund | Tax Designations |
September 30, 2024 (Unaudited)
For the year ended September 30, 2024, pursuant to Section 852(b)(3) of the Internal Revenue Code, Carret Kansas Tax-Exempt Bond Fund designated $0 as long-term capital gain dividends.
For the year ended September 30, 2024, 97.93700% of the distributions from net investment income for Carret Kansas Tax-Exempt Bond Fund are exempt from federal income tax.
| Annual Report | September 30, 2024 | 19 |


Table of Contents
| Schedule of Investments | |
| Clarkston Partners Fund | 1 |
| Clarkston Fund | 3 |
| Clarkston Founders Fund | 5 |
| Statements of Assets and Liabilities | 7 |
| Statements of Operations | 8 |
| Statements of Changes in Net Assets | |
| Clarkston Partners Fund | 9 |
| Clarkston Fund | 10 |
| Clarkston Founders Fund | 11 |
| Financial Highlights | 12 |
| Notes to Financial Statements and Financial Highlights | 25 |
| Report of Independent Registered Public Accounting Firm | 36 |
| Tax Designations | 37 |
| Clarkston Partners Fund | Schedule of Investments |
September 30, 2024
| | | Shares | | | Value
(Note 2) | |
| COMMON STOCK (93.09%) | | | | | | | | |
| Consumer Discretionary (6.78%) | | | | | | | | |
| John Wiley & Sons, Inc., Class A | | | 1,110,000 | | | $ | 53,557,500 | |
| Leslie's, Inc.(a) | | | 8,415,000 | | | | 26,591,400 | |
| Total Consumer Discretionary | | | | | | | 80,148,900 | |
| | | | | | | | | |
| Consumer Staples (31.67%)(b) | | | | | | | | |
| Energizer Holdings, Inc. | | | 1,600,000 | | | | 50,816,000 | |
| Lamb Weston Holdings, Inc. | | | 700,000 | | | | 45,318,000 | |
| Molson Coors Beverage Co., Class B | | | 975,000 | | | | 56,082,000 | |
| Post Holdings, Inc.(a) | | | 842,000 | | | | 97,461,500 | |
| Sysco Corp. | | | 507,000 | | | | 39,576,420 | |
| US Foods Holding Corp.(a) | | | 1,380,000 | | | | 84,870,000 | |
| Total Consumer Staples | | | | | | | 374,123,920 | |
| | | | | | | | | |
| Financials (16.55%) | | | | | | | | |
| Affiliated Managers Group, Inc. | | | 457,000 | | | | 81,254,600 | |
| Brown & Brown, Inc. | | | 245,000 | | | | 25,382,000 | |
| LPL Financial Holdings Inc. | | | 265,000 | | | | 61,646,950 | |
| Willis Towers Watson PLC | | | 92,000 | | | | 27,096,760 | |
| Total Financials | | | | | | | 195,380,310 | |
| | | | | | | | | |
| Health Care (7.67%) | | | | | | | | |
| Avantor, Inc.(a) | | | 1,305,000 | | | | 33,760,350 | |
| Envista Holdings Corp.(a) | | | 1,509,000 | | | | 29,817,840 | |
| Henry Schein, Inc.(a) | | | 370,000 | | | | 26,973,000 | |
| Total Health Care | | | | | | | 90,551,190 | |
| | | | | | | | | |
| Industrials (12.77%) | | | | | | | | |
| CH Robinson Worldwide, Inc. | | | 462,000 | | | | 50,990,940 | |
| GFL Environmental Inc. | | | 1,640,000 | | | | 65,403,200 | |
| Hillenbrand, Inc. | | | 1,243,000 | | | | 34,555,400 | |
| Total Industrials | | | | | | | 150,949,540 | |
| | | | | | | | | |
| Technology (9.92%) | | | | | | | | |
| Clarivate PLC(a) | | | 16,500,000 | | | | 117,150,000 | |
| | | | | | | | | |
| Telecommunications (2.78%) | | | | | | | | |
| Cable One, Inc. | | | 94,000 | | | | 32,880,260 | |
See Notes to Financial Statements and Financial Highlights.
| Annual Report | September 30, 2024 | 1 |
| Clarkston Partners Fund | Schedule of Investments |
September 30, 2024
| | | Shares | | | Value
(Note 2) | |
| Utilities (4.95%) | | | | | | |
| Stericycle, Inc.(a) | | | 958,000 | | | $ | 58,438,000 | |
| | | | | | | | | |
| TOTAL COMMON STOCK | | | | | | | | |
| (Cost $829,226,939) | | | | | | | 1,099,622,120 | |
| | | | | | | | | |
| TOTAL INVESTMENTS (93.09%) | | | | | | | | |
| (Cost $829,226,939) | | | | | | $ | 1,099,622,120 | |
| | | | | | | | | |
| OTHER ASSETS IN EXCESS OF LIABILITIES (6.91%) | | | | | | | 81,590,853 | |
| | | | | | | | | |
| NET ASSETS (100.00%) | | | | | | $ | 1,181,212,973 | |
| (a) | Non-income producing security. |
| (b) | For additional information on portfolio concentration, see Note 2. |
The sector categorization above is based on the Industry Classification Benchmark (ICB®) industry classifications. Where ICB® has not assigned a classification for a company, the Fund's investment adviser will assign a classification that it believes most accurately represents the company's business. Sectors are shown as a percent of the Fund's net assets. Industry categorizations used for Fund compliance purposes are based on classifications used by one or more widely recognized market indices or ratings group indices and/or as defined by Fund management.(Unaudited)
See Notes to Financial Statements and Financial Highlights.
| Clarkston Fund | Schedule of Investments |
September 30, 2024
| | | Shares | | | Value
(Note 2) | |
| COMMON STOCK (82.52%) | | | | | | | | |
| Consumer Discretionary (6.58%) | | | | | | | | |
| Dollar General Corp. | | | 55,000 | | | $ | 4,651,350 | |
| The Walt Disney Co. | | | 12,000 | | | | 1,154,280 | |
| Warner Bros. Discovery, Inc.(a) | | | 635,000 | | | | 5,238,750 | |
| Total Consumer Discretionary | | | | | | | 11,044,380 | |
| | | | | | | | | |
| Consumer Staples (25.26%)(b) | | | | | | | | |
| Anheuser-Busch InBev SA/NV, Sponsored ADR | | | 110,000 | | | | 7,291,900 | |
| Lamb Weston Holdings, Inc. | | | 88,000 | | | | 5,697,120 | |
| Molson Coors Beverage Co., Class B | | | 115,000 | | | | 6,614,800 | |
| Post Holdings, Inc.(a) | | | 75,000 | | | | 8,681,250 | |
| Sysco Corp. | | | 47,000 | | | | 3,668,820 | |
| US Foods Holding Corp.(a) | | | 170,000 | | | | 10,455,000 | |
| Total Consumer Staples | | | | | | | 42,408,890 | |
| | | | | | | | | |
| Financials (15.47%) | | | | | | | | |
| Affiliated Managers Group, Inc. | | | 47,000 | | | | 8,356,600 | |
| Brown & Brown, Inc. | | | 33,000 | | | | 3,418,800 | |
| LPL Financial Holdings Inc. | | | 18,500 | | | | 4,303,655 | |
| The Charles Schwab Corp. | | | 80,000 | | | | 5,184,800 | |
| Willis Towers Watson PLC | | | 16,000 | | | | 4,712,480 | |
| Total Financials | | | | | | | 25,976,335 | |
| | | | | | | | | |
| Health Care (5.74%) | | | | | | | | |
| Avantor, Inc.(a) | | | 235,000 | | | | 6,079,450 | |
| IQVIA Holdings, Inc.(a) | | | 15,000 | | | | 3,554,550 | |
| Total Health Care | | | | | | | 9,634,000 | |
| | | | | | | | | |
| Industrials (19.30%) | | | | | | | | |
| American Express Co. | | | 14,000 | | | | 3,796,800 | |
| Capital One Financial Corp. | | | 34,000 | | | | 5,090,820 | |
| CH Robinson Worldwide, Inc. | | | 60,000 | | | | 6,622,200 | |
| FedEx Corp. | | | 29,500 | | | | 8,073,560 | |
| Fidelity National Information Services, Inc. | | | 63,000 | | | | 5,276,250 | |
| Fortive Corp. | | | 45,000 | | | | 3,551,850 | |
| Total Industrials | | | | | | | 32,411,480 | |
| | | | | | | | | |
| Technology (8.14%) | | | | | | | | |
| Clarivate PLC(a) | | | 1,925,000 | | | | 13,667,500 | |
See Notes to Financial Statements and Financial Highlights.
| Annual Report | September 30, 2024 | 3 |
| Clarkston Fund | Schedule of Investments |
September 30, 2024
| | | Shares | | | Value
(Note 2) | |
| Telecommunications (2.03%) | | | | | | |
| Charter Communications, Inc., Class A(a) | | | 10,500 | | | $ | 3,402,840 | |
| | | | | | | | | |
| TOTAL COMMON STOCK | | | | | | | | |
| (Cost $108,149,299) | | | | | | | 138,545,425 | |
| | | | | | | | | |
| TOTAL INVESTMENTS (82.52%) | | | | | | | | |
| (Cost $108,149,299) | | | | | | $ | 138,545,425 | |
| | | | | | | | | |
| OTHER ASSETS IN EXCESS OF LIABILITIES (17.48%) | | | | | | | 29,341,385 | |
| | | | | | | | | |
| NET ASSETS (100.00%) | | | | | | $ | 167,886,810 | |
| (a) | Non-income producing security. |
| (b) | For additional information on portfolio concentration, see Note 2. |
The sector categorization above is based on the Industry Classification Benchmark (ICB®) industry classifications. Where ICB® has not assigned a classification for a company, the Fund's investment adviser will assign a classification that it believes most accurately represents the company's business. Sectors are shown as a percent of the Fund's net assets. Industry categorizations used for Fund compliance purposes are based on classifications used by one or more widely recognized market indices or ratings group indices and/or as defined by Fund management.(Unaudited)
See Notes to Financial Statements and Financial Highlights.
| Clarkston Founders Fund | Schedule of Investments |
September 30, 2024
| | | Shares | | | Value
(Note 2) | |
| COMMON STOCK (86.32%) | | | | | | | | |
| Consumer Discretionary (6.03%) | | | | | | | | |
| Dollar General Corp. | | | 255,000 | | | $ | 21,565,350 | |
| Warner Bros. Discovery, Inc.(a) | | | 3,050,000 | | | | 25,162,500 | |
| Total Consumer Discretionary | | | | | | | 46,727,850 | |
| | | | | | | | | |
| Consumer Staples (28.09%)(b) | | | | | | | | |
| Anheuser-Busch InBev SA/NV, Sponsored ADR | | | 465,000 | | | | 30,824,850 | |
| Lamb Weston Holdings, Inc. | | | 410,000 | | | | 26,543,400 | |
| Molson Coors Beverage Co., Class B | | | 590,000 | | | | 33,936,800 | |
| Post Holdings, Inc.(a) | | | 530,000 | | | | 61,347,500 | |
| Sysco Corp. | | | 175,000 | | | | 13,660,500 | |
| US Foods Holding Corp.(a) | | | 835,000 | | | | 51,352,500 | |
| Total Consumer Staples | | | | | | | 217,665,550 | |
| | | | | | | | | |
| Financials (17.71%) | | | | | | | | |
| Affiliated Managers Group, Inc. | | | 240,879 | | | | 42,828,286 | |
| Brown & Brown, Inc. | | | 150,000 | | | | 15,540,000 | |
| LPL Financial Holdings Inc. | | | 120,000 | | | | 27,915,600 | |
| The Charles Schwab Corp. | | | 400,000 | | | | 25,924,000 | |
| Willis Towers Watson PLC | | | 85,000 | | | | 25,035,050 | |
| Total Financials | | | | | | | 137,242,936 | |
| | | | | | | | | |
| Health Care (5.92%) | | | | | | | | |
| Avantor, Inc.(a) | | | 1,195,000 | | | | 30,914,650 | |
| Henry Schein, Inc.(a) | | | 205,000 | | | | 14,944,500 | |
| Total Health Care | | | | | | | 45,859,150 | |
| | | | | | | | | |
| Industrials (14.95%) | | | | | | | | |
| CH Robinson Worldwide, Inc. | | | 250,000 | | | | 27,592,500 | |
| FedEx Corp. | | | 122,000 | | | | 33,388,960 | |
| Fortive Corp. | | | 210,000 | | | | 16,575,300 | |
| GFL Environmental Inc. | | | 960,000 | | | | 38,284,800 | |
| Total Industrials | | | | | | | 115,841,560 | |
| | | | | | | | | |
| Technology (8.86%) | | | | | | | | |
| Clarivate PLC(a) | | | 9,665,000 | | | | 68,621,500 | |
See Notes to Financial Statements and Financial Highlights.
| Annual Report | September 30, 2024 | 5 |
| Clarkston Founders Fund | Schedule of Investments |
September 30, 2024
| | | Shares | | | Value
(Note 2) | |
| Utilities (4.76%) | | | | | | |
| Stericycle, Inc.(a) | | | 605,000 | | | $ | 36,905,000 | |
| | | | | | | | | |
| TOTAL COMMON STOCK | | | | | | | | |
| (Cost $547,226,488) | | | | | | | 668,863,546 | |
| | | | | | | | | |
| TOTAL INVESTMENTS (86.32%) | | | | | | | | |
| (Cost $547,226,488) | | | | | | $ | 668,863,546 | |
| | | | | | | | | |
| OTHER ASSETS IN EXCESS OF LIABILITIES (13.68%) | | | | | | | 106,031,921 | |
| | | | | | | | | |
| NET ASSETS (100.00%) | | | | | | $ | 774,895,467 | |
| (a) | Non-income producing security. |
| (b) | For additional information on portfolio concentration, see Note 2. |
The sector categorization above is based on the Industry Classification Benchmark (ICB®) industry classifications. Where ICB® has not assigned a classification for a company, the Fund's investment adviser will assign a classification that it believes most accurately represents the company's business. Sectors are shown as a percent of the Fund's net assets. Industry categorizations used for Fund compliance purposes are based on classifications used by one or more widely recognized market indices or ratings group indices and/or as defined by Fund management.(Unaudited)
See Notes to Financial Statements and Financial Highlights.
| Clarkston Funds | Statements of Assets and Liabilities |
September 30, 2024
| | | Clarkston
Partners Fund | | | Clarkston
Fund | | | Clarkston
Founders Fund | |
| ASSETS: | | | | | | | | | |
| Investments, at value (Cost $829,226,939, $108,149,299 and $547,226,488) | | $ | 1,099,622,120 | | | $ | 138,545,425 | | | $ | 668,863,546 | |
| Cash and cash equivalents | | | 81,764,251 | | | | 28,558,525 | | | | 103,566,724 | |
| Receivable for shares sold | | | 496,232 | | | | 683,764 | | | | 2,389,366 | |
| Dividends and interest receivable | | | 751,213 | | | | 217,459 | | | | 849,944 | |
| Other assets | | | 53,171 | | | | 8,434 | | | | 12,811 | |
| Total Assets | | | 1,182,686,987 | | | | 168,013,607 | | | | 775,682,391 | |
| | | | | | | | | | | | | |
| LIABILITIES: | | | | | | | | | | | | |
| Payable for administration and transfer agent fees | | | 47,467 | | | | 9,801 | | | | 28,286 | |
| Payable for shares redeemed | | | 450,916 | | | | 8,000 | | | | 226,360 | |
| Payable to adviser | | | 809,703 | | | | 61,830 | | | | 451,793 | |
| Payable for shareholder service fees | | | 75,701 | | | | 17,448 | | | | 16,194 | |
| Payable for printing fees | | | 44,449 | | | | 5,746 | | | | 27,091 | |
| Payable for professional fees | | | 40,492 | | | | 20,500 | | | | 32,858 | |
| Payable to Chief Compliance Officer fees | | | 2,355 | | | | 315 | | | | 1,463 | |
| Accrued expenses and other liabilities | | | 2,931 | | | | 3,157 | | | | 2,879 | |
| Total Liabilities | | | 1,474,014 | | | | 126,797 | | | | 786,924 | |
| NET ASSETS | | $ | 1,181,212,973 | | | $ | 167,886,810 | | | $ | 774,895,467 | |
| | | | | | | | | | | | | |
| NET ASSETS CONSIST OF: | | | | | | | | | | | | |
| Paid-in capital (Note 5) | | $ | 900,040,860 | | | $ | 140,017,705 | | | $ | 695,822,673 | |
| Total distributable earnings | | | 281,172,113 | | | | 27,869,105 | | | | 79,072,794 | |
| NET ASSETS | | $ | 1,181,212,973 | | | $ | 167,886,810 | | | $ | 774,895,467 | |
| | | | | | | | | | | | | |
| PRICING OF SHARES | | | | | | | | | | | | |
| Founders Class: | | | | | | | | | | | | |
| Net Asset Value, offering and redemption price per share | | $ | 14.68 | | | | N/A | | | $ | 16.13 | |
| Net Assets | | $ | 507,784,871 | | | | N/A | | | $ | 560,407,714 | |
| Shares of beneficial interest outstanding | | | 34,580,073 | | | | N/A | | | | 34,750,203 | |
| Institutional Class: | | | | | | | | | | | | |
| Net Asset Value, offering and redemption price per share | | $ | 14.56 | | | $ | 15.70 | | | $ | 16.09 | |
| Net Assets | | $ | 673,428,102 | | | $ | 167,886,810 | | | $ | 214,487,753 | |
| Shares of beneficial interest outstanding | | | 46,251,429 | | | | 10,695,415 | | | | 13,330,672 | |
See Notes to Financial Statements and Financial Highlights.
| Annual Report | September 30, 2024 | 7 |
| Clarkston Funds | Statements of Operations |
For the Year Ended September 30, 2024
| | | Clarkston
Partners Fund | | | Clarkston Fund | | | Clarkston
Founders Fund | |
| INVESTMENT INCOME: | | | | | | | | | | | | |
| Dividends | | $ | 17,736,655 | | | $ | 2,394,223 | | | $ | 9,485,554 | |
| Foreign taxes withheld | | | (12,344 | ) | | | (37,881 | ) | | | (199,166 | ) |
| Total Investment Income | | | 17,724,311 | | | | 2,356,342 | | | | 9,286,388 | |
| | | | | | | | | | | | | |
| EXPENSES: | | | | | | | | | | | | |
| Investment advisory fees (Note 6) | | | 10,235,478 | | | | 728,076 | | | | 5,292,503 | |
| Administration fees | | | 529,049 | | | | 73,274 | | | | 297,885 | |
| Shareholder service fees Institutional Class | | | 618,503 | | | | 130,968 | | | | 182,242 | |
| Custody fees | | | 34,459 | | | | 4,690 | | | | 18,274 | |
| Legal fees | | | 19,964 | | | | 5,811 | | | | 26,386 | |
| Audit and tax fees | | | 19,381 | | | | 17,228 | | | | 18,177 | |
| Transfer agent fees | | | 63,154 | | | | 31,734 | | | | 24,010 | |
| Trustees fees and expenses | | | 115,118 | | | | 15,918 | | | | 74,922 | |
| Registration and filing fees | | | 42,241 | | | | 28,073 | | | | 53,224 | |
| Printing fees | | | 73,435 | | | | 14,187 | | | | 45,287 | |
| Chief Compliance Officer fees | | | 28,890 | | | | 3,427 | | | | 16,508 | |
| Insurance fees | | | 45,398 | | | | 4,388 | | | | 21,955 | |
| Other expenses | | | 20,365 | | | | 12,673 | | | | 16,559 | |
| Total Expenses | | | 11,845,435 | | | | 1,070,447 | | | | 6,087,932 | |
| Less fees waived by investment adviser (Note 6) | | | | | | | | | | | | |
| Founders Class | | | (137,409 | ) | | | – | | | | (186,726 | ) |
| Institutional Class | | | (217,941 | ) | | | (137,800 | ) | | | (70,717 | ) |
| Total fees waived by investment adviser (Note 6) | | | (355,350 | ) | | | (137,800 | ) | | | (257,443 | ) |
| Net Expenses | | | 11,490,085 | | | | 932,647 | | | | 5,830,489 | |
| NET INVESTMENT INCOME | | | 6,234,226 | | | | 1,423,695 | | | | 3,455,899 | |
| | | | | | | | | | | | | |
| REALIZED AND UNREALIZED GAIN/(LOSS) ON INVESTMENTS: | | | | | | | | | | | | |
| Net realized gain/(loss) on: | | | | | | | | | | | | |
| Investments | | | 22,223,997 | | | | (1,221,892 | ) | | | (45,264,132 | ) |
| Net realized gain/(loss) | | | 22,223,997 | | | | (1,221,892 | ) | | | (45,264,132 | ) |
| Change in unrealized appreciation/(depreciation) on: | | | | | | | | | | | | |
| Investments | | | 130,663,553 | | | | 24,797,559 | | | | 146,326,178 | |
| Net change | | | 130,663,553 | | | | 24,797,559 | | | | 146,326,178 | |
| NET REALIZED AND UNREALIZED GAIN ON INVESTMENTS | | | 152,887,550 | | | | 23,575,667 | | | | 101,062,046 | |
| NET INCREASE IN NET ASSETS RESULTING FROM OPERATIONS | | $ | 159,121,776 | | | $ | 24,999,362 | | | $ | 104,517,945 | |
See Notes to Financial Statements and Financial Highlights.
| Clarkston Partners Fund | Statements of Changes in Net Assets |
| | | For the Year
Ended
September 30,
2024 | | | For the Year
Ended
September 30,
2023 | |
| OPERATIONS: | | | | | | |
| Net investment income | | $ | 6,234,226 | | | $ | 19,591,802 | |
| Net realized gain on investments | | | 22,223,997 | | | | 157,448,855 | |
| Net change in unrealized appreciation/(depreciation) on investments | | | 130,663,553 | | | | (69,578,832 | ) |
| Net increase in net assets resulting from operations | | | 159,121,776 | | | | 107,461,825 | |
| | | | | | | | | |
| DISTRIBUTIONS TO SHAREHOLDERS | | | | | | | | |
| Founders Class | | | (19,684,887 | ) | | | (93,629,426 | ) |
| Institutional Class | | | (29,910,558 | ) | | | (127,859,221 | ) |
| Total distributions | | | (49,595,445 | ) | | | (221,488,647 | ) |
| | | | | | | | | |
| BENEFICIAL SHARE TRANSACTIONS (Note 5): | | | | | | | | |
| Founders Class | | | | | | | | |
| Shares sold | | | 436,755 | | | | 251,600 | |
| Dividends reinvested | | | 595,440 | | | | 3,294,955 | |
| Shares redeemed | | | (51,239,665 | ) | | | (45,702,290 | ) |
| Net decrease from beneficial share transactions | | | (50,207,470 | ) | | | (42,155,735 | ) |
| Institutional Class | | | | | | | | |
| Shares sold | | | 123,827,673 | | | | 146,349,508 | |
| Dividends reinvested | | | 28,886,182 | | | | 123,233,230 | |
| Shares redeemed | | | (335,962,564 | ) | | | (229,509,919 | ) |
| Net increase/(decrease) from beneficial share transactions | | | (183,248,709 | ) | | | 40,072,819 | |
| Net decrease in net assets | | | (123,929,848 | ) | | | (116,109,738 | ) |
| | | | | | | | | |
| NET ASSETS: | | | | | | | | |
| Beginning of year | | | 1,305,142,821 | | | | 1,421,252,559 | |
| End of year | | $ | 1,181,212,973 | | | $ | 1,305,142,821 | |
See Notes to Financial Statements and Financial Highlights.
| Annual Report | September 30, 2024 | 9 |
| Clarkston Fund | Statements of Changes in Net Assets |
| | | For the Year
Ended
September 30,
2024 | | | For the Year
Ended
September 30,
2023 | |
| OPERATIONS: | | | | | | |
| Net investment income | | $ | 1,423,695 | | | $ | 1,026,649 | |
| Net realized gain/(loss) on investments | | | (1,221,892 | ) | | | 2,514,516 | |
| Net change in unrealized appreciation on investments | | | 24,797,559 | | | | 13,706,218 | |
| Net increase in net assets resulting from operations | | | 24,999,362 | | | | 17,247,383 | |
| | | | | | | | | |
| DISTRIBUTIONS TO SHAREHOLDERS | | | | | | | | |
| Institutional Class | | | (4,699,381 | ) | | | (5,399,733 | ) |
| Total distributions | | | (4,699,381 | ) | | | (5,399,733 | ) |
| | | | | | | | | |
| BENEFICIAL SHARE TRANSACTIONS (Note 5): | | | | | | | | |
| Institutional Class | | | | | | | | |
| Shares sold | | | 38,023,892 | | | | 22,201,181 | |
| Dividends reinvested | | | 4,689,845 | | | | 5,384,897 | |
| Shares redeemed | | | (20,586,455 | ) | | | (14,584,598 | ) |
| Net increase from beneficial share transactions | | | 22,127,282 | | | | 13,001,480 | |
| Net increase in net assets | | | 42,427,263 | | | | 24,849,130 | |
| | | | | | | | | |
| NET ASSETS: | | | | | | | | |
| Beginning of year | | | 125,459,547 | | | | 100,610,417 | |
| End of year | | $ | 167,886,810 | | | $ | 125,459,547 | |
See Notes to Financial Statements and Financial Highlights.
| Clarkston Founders Fund | Statements of Changes in Net Assets |
| | | For the Year
Ended
September 30,
2024 | | | For the Year
Ended
September 30,
2023 | |
| OPERATIONS: | | | | | | |
| Net investment income | | $ | 3,455,899 | | | $ | 7,969,242 | |
| Net realized gain/(loss) on investments | | | (45,264,132 | ) | | | 28,735,167 | |
| Net change in unrealized appreciation on investments | | | 146,326,178 | | | | 14,898,385 | |
| Net increase in net assets resulting from operations | | | 104,517,945 | | | | 51,602,794 | |
| | | | | | | | | |
| DISTRIBUTIONS TO SHAREHOLDERS | | | | | | | | |
| Founders Class | | | (8,340,342 | ) | | | (26,517,576 | ) |
| Institutional Class | | | (3,035,281 | ) | | | (9,874,966 | ) |
| Total distributions | | | (11,375,623 | ) | | | (36,392,542 | ) |
| | | | | | | | | |
| BENEFICIAL SHARE TRANSACTIONS (Note 5): | | | | | | | | |
| Founders Class | | | | | | | | |
| Shares sold | | | 97,041,015 | | | | 137,576,936 | |
| Dividends reinvested | | | 111,165 | | | | 501,554 | |
| Shares redeemed | | | (76,390,737 | ) | | | (81,356,615 | ) |
| Net increase from beneficial share transactions | | | 20,761,443 | | | | 56,721,875 | |
| Institutional Class | | | | | | | | |
| Shares sold | | | 41,989,764 | | | | 27,713,169 | |
| Dividends reinvested | | | 3,013,276 | | | | 9,868,890 | |
| Shares redeemed | | | (32,256,421 | ) | | | (16,344,281 | ) |
| Net increase from beneficial share transactions | | | 12,746,619 | | | | 21,237,778 | |
| Net increase in net assets | | | 126,650,384 | | | | 93,169,905 | |
| | | | | | | | | |
| NET ASSETS: | | | | | | | | |
| Beginning of year | | | 648,245,083 | | | | 555,075,178 | |
| End of year | | $ | 774,895,467 | | | $ | 648,245,083 | |
See Notes to Financial Statements and Financial Highlights.
| Annual Report | September 30, 2024 | 11 |
| Clarkston Partners Fund – Founders Class | Financial Highlights |
For a Share Outstanding Throughout the Periods Presented
| NET ASSET VALUE, BEGINNING OF PERIOD |
| |
| INCOME/(LOSS) FROM OPERATIONS: |
| Net investment income(a) |
| Net realized and unrealized gain/(loss) on investments |
| Total from investment operations |
| |
| LESS DISTRIBUTIONS: |
| From net investment income |
| From net realized gains on investments |
| Total Distributions |
| NET INCREASE/(DECREASE) IN NET ASSET VALUE |
| NET ASSET VALUE, END OF PERIOD |
| |
| TOTAL RETURN(b) |
| |
| SUPPLEMENTAL DATA: |
| Net assets, end of period (in 000s) |
| |
| RATIOS TO AVERAGE NET ASSETS |
| Operating expenses excluding reimbursement/waiver |
| Operating expenses including reimbursement/waiver |
| Net investment income including reimbursement/waiver |
| |
| PORTFOLIO TURNOVER RATE |
See Notes to Financial Statements and Financial Highlights.
| Clarkston Partners Fund – Founders Class | Financial Highlights |
For a Share Outstanding Throughout the Periods Presented
For the Year
Ended
September 30,
2024 | | | For the Year
Ended
September 30,
2023 | | | For the Year
Ended
September 30,
2022 | | | For the Year
Ended
September 30,
2021 | | | For the Year
Ended
September 30,
2020 | |
| $ | 13.38 | | | $ | 14.61 | | | $ | 15.73 | | | $ | 12.61 | | | $ | 12.81 | |
| | | | | | | | | | | | | | | | | | | |
| | 0.08 | | | | 0.21 | | | | 0.03 | | | | 0.06 | | | | 0.10 | |
| | 1.75 | | | | 0.87 | | | | (1.01 | ) | | | 3.62 | | | | 0.21 | |
| | 1.83 | | | | 1.08 | | | | (0.98 | ) | | | 3.68 | | | | 0.31 | |
| | | | | | | | | | | | | | | | | | | |
| | (0.05 | ) | | | (0.17 | ) | | | (0.06 | ) | | | (0.06 | ) | | | (0.13 | ) |
| | (0.48 | ) | | | (2.14 | ) | | | (0.08 | ) | | | (0.50 | ) | | | (0.38 | ) |
| | (0.53 | ) | | | (2.31 | ) | | | (0.14 | ) | | | (0.56 | ) | | | (0.51 | ) |
| | 1.30 | | | | (1.23 | ) | | | (1.12 | ) | | | 3.12 | | | | (0.20 | ) |
| $ | 14.68 | | | $ | 13.38 | | | $ | 14.61 | | | $ | 15.73 | | | $ | 12.61 | |
| | | | | | | | | | | | | | | | | | | |
| | 13.97 | % | | | 7.23 | % | | | (6.31 | %) | | | 29.47 | % | | | 2.18 | % |
| | | | | | | | | | | | | | | | | | | |
| $ | 507,785 | | | $ | 511,462 | | | $ | 600,879 | | | $ | 669,345 | | | $ | 553,691 | |
| | | | | | | | | | | | | | | | | | | |
| | 0.88 | % | | | 0.88 | % | | | 0.88 | % | | | 0.88 | % | | | 0.91 | % |
| | 0.85 | % | | | 0.85 | % | | | 0.85 | % | | | 0.85 | % | | | 0.85 | % |
| | 0.55 | % | | | 1.47 | % | | | 0.21 | % | | | 0.40 | % | | | 0.77 | % |
| | | | | | | | | | | | | | | | | | | |
| | 22 | % | | | 16 | % | | | 21 | % | | | 9 | % | | | 25 | % |
| (a) | Calculated using the average shares method. |
| (b) | Assumes an initial investment on the business day before the first day of the fiscal period, with all dividends and distributions reinvested in additional shares on the reinvestment date, and redemption at the net asset value calculated on the last business day of the fiscal period. Total returns are for the period indicated and have not been annualized. Total returns would have been lower had certain expenses not been waived during the period. Returns shown do not reflect the deduction of taxes that a shareholder would pay on Fund distributions or the redemption of Fund shares. |
See Notes to Financial Statements and Financial Highlights.
| Annual Report | September 30, 2024 | 13 |
| Clarkston Partners Fund – Institutional Class | Financial Highlights |
For a Share Outstanding Throughout the Periods Presented
| NET ASSET VALUE, BEGINNING OF PERIOD |
| |
| INCOME/(LOSS) FROM OPERATIONS: |
| Net investment income(a) |
| Net realized and unrealized gain/(loss) on investments |
| Total from investment operations |
| |
| LESS DISTRIBUTIONS: |
| From net investment income |
| From net realized gains on investments |
| Total Distributions |
| NET INCREASE/(DECREASE) IN NET ASSET VALUE |
| NET ASSET VALUE, END OF PERIOD |
| |
| TOTAL RETURN(b) |
| |
| SUPPLEMENTAL DATA: |
| Net assets, end of period (in 000s) |
| |
| RATIOS TO AVERAGE NET ASSETS |
| Operating expenses excluding reimbursement/waiver |
| Operating expenses including reimbursement/waiver |
| Net investment income including reimbursement/waiver |
| |
| PORTFOLIO TURNOVER RATE |
See Notes to Financial Statements and Financial Highlights.
| Clarkston Partners Fund – Institutional Class | Financial Highlights |
For a Share Outstanding Throughout the Periods Presented
For the Year
Ended
September 30,
2024 | | | For the Year
Ended
September 30,
2023 | | | For the Year
Ended
September 30,
2022 | | | For the Year
Ended
September 30,
2021 | | | For the Year
Ended
September 30,
2020 | |
| $ | 13.28 | | | $ | 14.52 | | | $ | 15.64 | | | $ | 12.55 | | | $ | 12.76 | |
| | | | | | | | | | | | | | | | | | | |
| | 0.06 | | | | 0.18 | | | | 0.02 | | | | 0.05 | | | | 0.08 | |
| | 1.74 | | | | 0.88 | | | | (1.01 | ) | | | 3.59 | | | | 0.21 | |
| | 1.80 | | | | 1.06 | | | | (0.99 | ) | | | 3.64 | | | | 0.29 | |
| | | | | | | | | | | | | | | | | | | |
| | (0.04 | ) | | | (0.16 | ) | | | (0.05 | ) | | | (0.05 | ) | | | (0.12 | ) |
| | (0.48 | ) | | | (2.14 | ) | | | (0.08 | ) | | | (0.50 | ) | | | (0.38 | ) |
| | (0.52 | ) | | | (2.30 | ) | | | (0.13 | ) | | | (0.55 | ) | | | (0.50 | ) |
| | 1.28 | | | | (1.24 | ) | | | (1.12 | ) | | | 3.09 | | | | (0.21 | ) |
| $ | 14.56 | | | $ | 13.28 | | | $ | 14.52 | | | $ | 15.64 | | | $ | 12.55 | |
| | | | | | | | | | | | | | | | | | | |
| | 13.88 | % | | | 7.16 | % | | | (6.39 | %) | | | 29.33 | % | | | 2.07 | % |
| | | | | | | | | | | | | | | | | | | |
| $ | 673,428 | | | $ | 793,680 | | | $ | 820,374 | | | $ | 845,824 | | | $ | 574,777 | |
| | | | | | | | | | | | | | | | | | | |
| | 0.96 | % | | | 0.96 | % | | | 0.96 | % | | | 0.98 | % | | | 1.01 | % |
| | 0.93 | %(c) | | 0.94 | %(c) | | 0.94 | %(c) | | 0.95 | %(c) | | 0.95 | %(c) |
| | 0.47 | % | | | 1.29 | % | | | 0.12 | % | | | 0.30 | % | | | 0.68 | % |
| | | | | | | | | | | | | | | | | | | |
| | 22 | % | | | 16 | % | | | 21 | % | | | 9 | % | | | 25 | % |
See Notes to Financial Statements and Financial Highlights.
| Annual Report | September 30, 2024 | 15 |
| Clarkston Partners Fund – Institutional Class | Financial Highlights |
For a Share Outstanding Throughout the Periods Presented
| (a) | Calculated using the average shares method. |
| (b) | Assumes an initial investment on the business day before the first day of the fiscal period, with all dividends and distributions reinvested in additional shares on the reinvestment date, and redemption at the net asset value calculated on the last business day of the fiscal period. Total returns are for the period indicated and have not been annualized. Total returns would have been lower had certain expenses not been waived during the period. Returns shown do not reflect the deduction of taxes that a shareholder would pay on Fund distributions or the redemption of Fund shares. |
| (c) | According to the Fund's shareholder services plan with respect to the Fund's Institutional shares, any amount of fees accrued according to the plan but not paid during the Fund's fiscal year for such service activities shall be reimbursed to the Fund as soon as practicable. Fees were reimbursed to the Fund for the periods ended September 30, 2024, September 30, 2023, September 30, 2022, September 30, 2021, and September 30, 2020, respectively, in the amount of 0.07%, 0.06%, 0.06%, 0.05%, and 0.05% of average net assets of Institutional shares. |
See Notes to Financial Statements and Financial Highlights.
Page Intentionally Left Blank
| Clarkston Fund – Institutional Class | Financial Highlights |
For a Share Outstanding Throughout the Periods Presented
| NET ASSET VALUE, BEGINNING OF PERIOD |
| INCOME/(LOSS) FROM OPERATIONS: |
| Net investment income(a) |
| Net realized and unrealized gain/(loss) on investments |
| Total from investment operations |
| LESS DISTRIBUTIONS: |
| From net investment income |
| From net realized gains on investments |
| Total Distributions |
| NET INCREASE/(DECREASE) IN NET ASSET VALUE |
| NET ASSET VALUE, END OF PERIOD |
| TOTAL RETURN(b) |
| SUPPLEMENTAL DATA: |
| Net assets, end of period (in 000s) |
| RATIOS TO AVERAGE NET ASSETS |
| Operating expenses excluding reimbursement/waiver |
| Operating expenses including reimbursement/waiver |
| Net investment income including reimbursement/waiver |
| PORTFOLIO TURNOVER RATE |
See Notes to Financial Statements and Financial Highlights.
| Clarkston Fund – Institutional Class | | Financial Highlights |
For a Share Outstanding Throughout the Periods Presented
For the Year
Ended
September 30,
2024 | | | For the Year
Ended
September 30,
2023 | | | For the Year
Ended
September 30,
2022 | | | For the Year
Ended
September 30,
2021 | | | For the Year
Ended
September 30,
2020 | |
| $ | 13.66 | | | $ | 12.28 | | | $ | 14.80 | | | $ | 12.05 | | | $ | 12.50 | |
| | | | | | | | | | | | | | | | | | | |
| | 0.14 | | | | 0.12 | | | | 0.06 | | | | 0.07 | | | | 0.17 | |
| | 2.40 | | | | 1.92 | | | | (2.11 | ) | | | 3.49 | | | | (0.05 | ) |
| | 2.54 | | | | 2.04 | | | | (2.05 | ) | | | 3.56 | | | | 0.12 | |
| | | | | | | | | | | | | | | | | | | |
| | (0.12 | ) | | | (0.07 | ) | | | (0.05 | ) | | | (0.16 | ) | | | (0.14 | ) |
| | (0.38 | ) | | | (0.59 | ) | | | (0.42 | ) | | | (0.65 | ) | | | (0.43 | ) |
| | (0.50 | ) | | | (0.66 | ) | | | (0.47 | ) | | | (0.81 | ) | | | (0.57 | ) |
| | 2.04 | | | | 1.38 | | | | (2.52 | ) | | | 2.75 | | | | (0.45 | ) |
| $ | 15.70 | | | $ | 13.66 | | | $ | 12.28 | | | $ | 14.80 | | | $ | 12.05 | |
| | 18.94 | % | | | 17.04 | % | | | (14.33 | %) | | | 30.08 | % | | | 0.81 | % |
| | | | | | | | | | | | | | | | | | | |
| $ | 167,887 | | | $ | 125,460 | | | $ | 100,610 | | | $ | 97,936 | | | $ | 48,479 | |
| | | | | | | | | | | | | | | | | | | |
| | 0.73 | % | | | 0.73 | % | | | 0.76 | % | | | 0.80 | % | | | 0.86 | % |
| | 0.64 | %(c) | | | 0.65 | %(c) | | | 0.65 | %(c) | | | 0.66 | %(c) | | | 0.64 | %(c) |
| | 0.98 | % | | | 0.84 | % | | | 0.41 | % | | | 0.46 | % | | | 1.47 | % |
| | 23 | % | | | 12 | % | | | 18 | % | | | 18 | % | | | 31 | % |
| (a) | Calculated using the average shares method. |
| (b) | Assumes an initial investment on the business day before the first day of the fiscal period, with all dividends and distributions reinvested in additional shares on the reinvestment date, and redemption at the net asset value calculated on the last business day of the fiscal period. Total returns are for the period indicated and have not been annualized. Total returns would have been lower had certain expenses not been waived during the period. Returns shown do not reflect the deduction of taxes that a shareholder would pay on Fund distributions or the redemption of Fund shares. |
| (c) | According to the Fund’s shareholder services plan with respect to the Fund’s Institutional shares, any amount of fees accrued according to the plan but not paid during the Fund’s fiscal year for such service activities shall be reimbursed to the Fund as soon as practicable. Fees were reimbursed to the Fund for the periods ended September 30, 2024, September 30, 2023, September 30, 2022, September 30, 2021, and September 30, 2020, respectively, in the amount of 0.06%, 0.05%, 0.05%, 0.04%, and 0.06% of average net assets of Institutional shares. |
See Notes to Financial Statements and Financial Highlights.
| Annual Report | September 30, 2024 | 19 |
| Clarkston Founders Fund – Founders Class | Financial Highlights |
For a Share Outstanding Throughout the Periods Presented
| | | For the Year
Ended
September 30,
2024 | | | For the Year
Ended
September 30,
2023 | | | For the Year
Ended
September 30,
2022 | | | For the Year
Ended
September 30,
2021(a) | |
| NET ASSET VALUE, BEGINNING OF PERIOD | | $ | 14.12 | | | $ | 13.72 | | | $ | 15.09 | | | $ | 15.54 | |
| | | | | | | | | | | | | | | | | |
| INCOME/(LOSS) FROM OPERATIONS: | | | | | | | | | | | | | | | | |
| Net investment income(b) | | | 0.08 | | | | 0.19 | | | | 0.01 | | | | 0.02 | |
| Net realized and unrealized gain/(loss) on investments | | | 2.18 | | | | 1.11 | | | | (1.31 | ) | | | (0.47 | )(c) |
| Total from investment operations | | | 2.26 | | | | 1.30 | | | | (1.30 | ) | | | (0.45 | ) |
| | | | | | | | | | | | | | | | | |
| LESS DISTRIBUTIONS: | | | | | | | | | | | | | | | | |
| From net investment income | | | (0.10 | ) | | | (0.12 | ) | | | (0.01 | ) | | | – | |
| From net realized gains on investments | | | (0.15 | ) | | | (0.78 | ) | | | (0.06 | ) | | | – | |
| Total Distributions | | | (0.25 | ) | | | (0.90 | ) | | | (0.07 | ) | | | – | |
| NET INCREASE/(DECREASE) IN NET ASSET VALUE | | | 2.01 | | | | 0.40 | | | | (1.37 | ) | | | (0.45 | ) |
| NET ASSET VALUE, END OF PERIOD | | $ | 16.13 | | | $ | 14.12 | | | $ | 13.72 | | | $ | 15.09 | |
| | | | | | | | | | | | | | | | | |
| TOTAL RETURN(d) | | | 16.16 | % | | | 9.60 | % | | | (8.64 | %) | | | (2.90 | %) |
| | | | | | | | | | | | | | | | | |
| SUPPLEMENTAL DATA: | | | | | | | | | | | | | | | | |
| Net assets, end of period (in 000s) | | $ | 560,408 | | | $ | 472,102 | | | $ | 404,512 | | | $ | 278,749 | |
| | | | | | | | | | | | | | | | | |
| RATIOS TO AVERAGE NET ASSETS | | | | | | | | | | | | | | | | |
| Operating expenses excluding reimbursement/waiver | | | 0.84 | % | | | 0.82 | % | | | 0.84 | % | | | 0.86 | %(e) |
| Operating expenses including reimbursement/waiver | | | 0.80 | % | | | 0.80 | % | | | 0.80 | %(f) | | 0.80 | %(e) |
| Net investment income including reimbursement/waiver | | | 0.52 | % | | | 1.28 | % | | | 0.09 | % | | | 0.20 | %(e) |
| | | | | | | | | | | | | | | | | |
| PORTFOLIO TURNOVER RATE | | | 17 | % | | | 13 | % | | | 17 | % | | | 5 | %(g) |
| (a) | Commenced operations on February 17, 2017. |
| (b) | Calculated using the average shares method. |
| (c) | The amount shown for a share outstanding throughout the period may not correlate with the Statement of Operations for the period due to the timing of sales and redemptions of Fund shares in relation to income earned and/or fluctuating market value of the investments of the Fund. |
See Notes to Financial Statements and Financial Highlights.
| Clarkston Founders Fund – Founders Class | Financial Highlights |
For a Share Outstanding Throughout the Periods Presented
| (d) | Assumes an initial investment on the business day before the first day of the fiscal period, with all dividends and distributions reinvested in additional shares on the reinvestment date, and redemption at the net asset value calculated on the last business day of the fiscal period. Total returns are for the period indicated and have not been annualized. Total returns would have been lower had certain expenses not been waived during the period. Returns shown do not reflect the deduction of taxes that a shareholder would pay on Fund distributions or the redemption of Fund shares. |
| (f) | Ratio includes previously waived advisory fees recaptured. The net expense ratio would have been lower absent the impact of recaptured fees. |
| (g) | Portfolio turnover rate for periods less than one full year have not been annualized. |
See Notes to Financial Statements and Financial Highlights.
| Annual Report | September 30, 2024 | 21 |
| Clarkston Founders Fund – Institutional Class | Financial Highlights |
For a Share Outstanding Throughout the Periods Presented
| NET ASSET VALUE, BEGINNING OF PERIOD |
| |
| INCOME/(LOSS) FROM OPERATIONS: |
| Net investment income/(loss)(a) |
| Net realized and unrealized gain/(loss) on investments |
| Total from investment operations |
| |
| LESS DISTRIBUTIONS: |
| From net investment income |
| From net realized gains on investments |
| Total Distributions |
| NET INCREASE/(DECREASE) IN NET ASSET VALUE |
| NET ASSET VALUE, END OF PERIOD |
| |
| TOTAL RETURN(c) |
| |
| SUPPLEMENTAL DATA: |
| Net assets, end of period (in 000s) |
| |
| RATIOS TO AVERAGE NET ASSETS |
| Operating expenses excluding reimbursement/waiver |
| Operating expenses including reimbursement/waiver |
| Net investment income/(loss) including reimbursement/waiver |
| |
| PORTFOLIO TURNOVER RATE |
See Notes to Financial Statements and Financial Highlights.
| Clarkston Founders Fund – Institutional Class | Financial Highlights |
For a Share Outstanding Throughout the Periods Presented
For the Year
Ended
September 30,
2024 | | | For the Year
Ended
September 30,
2023 | | | For the Year
Ended
September 30,
2022 | | | For the Year
Ended
September 30,
2021 | | | For the Year
Ended
September 30,
2020 | |
| $ | 14.10 | | | $ | 13.71 | | | $ | 15.09 | | | $ | 12.35 | | | $ | 11.67 | |
| | | | | | | | | | | | | | | | | | | |
| | 0.06 | | | | 0.17 | | | | (0.00 | )(b) | | | (0.00 | )(b) | | | 0.08 | |
| | 2.17 | | | | 1.11 | | | | (1.32 | ) | | | 2.87 | | | | 1.00 | |
| | 2.23 | | | | 1.28 | | | | (1.32 | ) | | | 2.87 | | | | 1.08 | |
| | | | | | | | | | | | | | | | | | | |
| | (0.09 | ) | | | (0.11 | ) | | | 0.00 | (b) | | | (0.02 | ) | | | (0.10 | ) |
| | (0.15 | ) | | | (0.78 | ) | | | (0.06 | ) | | | (0.11 | ) | | | (0.30 | ) |
| | (0.24 | ) | | | (0.89 | ) | | | (0.06 | ) | | | (0.13 | ) | | | (0.40 | ) |
| | 1.99 | | | | 0.39 | | | | (1.38 | ) | | | 2.74 | | | | 0.68 | |
| $ | 16.09 | | | $ | 14.10 | | | $ | 13.71 | | | $ | 15.09 | | | $ | 12.35 | |
| | | | | | | | | | | | | | | | | | | |
| | 16.00 | % | | | 9.50 | % | | | (8.74 | %) | | | 23.31 | % | | | 9.34 | % |
| | | | | | | | | | | | | | | | | | | |
| $ | 214,488 | | | $ | 176,143 | | | $ | 150,563 | | | $ | 139,088 | | | $ | 76,111 | |
| | | | | | | | | | | | | | | | | | | |
| | 0.93 | % | | | 0.93 | % | | | 0.94 | % | | | 0.92 | % | | | 1.11 | % |
| | 0.89 | %(d) | | | 0.91 | %(d) | | | 0.90 | %(d)(e) | | | 0.86 | %(d) | | | 0.91 | %(d) |
| | 0.42 | % | | | 1.16 | % | | | (0.02 | %) | | | (0.00 | %)(f) | | | 0.73 | % |
| | | | | | | | | | | | | | | | | | | |
| | 17 | % | | | 13 | % | | | 17 | % | | | 5 | % | | | 22 | % |
| (a) | Calculated using the average shares method. |
| (b) | Less than $0.005 per share. |
| (c) | Assumes an initial investment on the business day before the first day of the fiscal period, with all dividends and distributions reinvested in additional shares on the reinvestment date, and redemption at the net asset value calculated on the last business day of the fiscal period. Total returns are for the period indicated and have not been annualized. Total returns would have been lower had certain expenses not been waived during the period. Returns shown do not reflect the deduction of taxes that a shareholder would pay on Fund distributions or the redemption of Fund shares. |
See Notes to Financial Statements and Financial Highlights.
| Annual Report | September 30, 2024 | 23 |
| Clarkston Founders Fund – Institutional Class | Financial Highlights |
For a Share Outstanding Throughout the Periods Presented
| (d) | According to the Fund’s shareholder services plan with respect to the Fund’s Institutional shares, any amount of fees accrued according to the plan but not paid during the Fund’s fiscal year for such service activities shall be reimbursed to the Fund as soon as practicable. Fees were reimbursed to the Fund for the periods ended September 30, 2024, September 30, 2023, September 30, 2022, September 30, 2021, and September 30, 2020, respectively, in the amount of 0.06%, 0.04%, 0.05%, 0.09% and 0.04% of average net assets of Institutional shares. |
| (e) | Ratio includes previously waived advisory fees recaptured. The net expense ratio would have been lower absent the impact of recaptured fees. |
See Notes to Financial Statements and Financial Highlights.
| Clarkston Funds | Notes to Financial Statements
and Financial Highlights |
1. ORGANIZATION
ALPS Series Trust (the “Trust”), a Delaware statutory trust, is an open-end management investment company registered under the Investment Company Act of 1940, as amended (the “1940 Act”). The Trust consists of multiple separate portfolios or series. This annual report describes the Clarkston Partners Fund, the Clarkston Fund and the Clarkston Founders Fund (each, a “Fund” and collectively, the “Funds”). The Funds are non-diversified and may invest a greater portion of assets in securities of individual issuers than a diversified fund. As a result, changes in the market value of a single investment could cause greater fluctuations in share price than would occur in a diversified fund. Each Fund’s investment objective is to achieve long-term capital appreciation. The Clarkston Partners Fund and Clarkston Founders Fund currently offer Founders Class shares and Institutional Class shares, and the Clarkston Fund currently offers Institutional Class shares. Each share class of the Clarkston Partners Fund and Clarkston Founders Fund have identical rights to earnings, assets and voting privileges, except for class-specific expenses and exclusive rights to vote on matters affecting only individual classes. The Board of Trustees (the “Board or Trustees”) may establish additional funds and classes of shares at any time in the future without shareholder approval.
2. SIGNIFICANT ACCOUNTING POLICIES
The accompanying financial statements were prepared in accordance with accounting principles generally accepted in the United States of America for investment companies (“U.S. GAAP”). The Funds are considered investment companies under U.S. GAAP and follow the accounting and reporting guidance applicable to investment companies in the Financial Accounting Standards Board (“FASB”) Accounting Standards Codification Topic 946 Financial Services - Investment Companies. The preparation of financial statements in conformity with U.S. GAAP requires management to make certain estimates and assumptions that affect the reported amounts of assets and liabilities and disclosures of contingent assets and liabilities at the date of the financial statements and the reported amounts of increases and decreases in net assets from operations during the period. Actual results could differ from those estimates. The following is a summary of significant accounting policies consistently followed by the Funds in preparation of their financial statements.
Investment Valuation: The Funds generally value their securities based on market prices determined at the close of regular trading on the New York Stock Exchange (“NYSE”), normally 4:00 p.m. Eastern Time, on each day the NYSE is open for trading.
Securities traded on a registered U.S. securities exchange (including exchange-traded derivatives other than futures and futures options) are valued based on the last sale price of the security reported on the principal exchange on which it is traded, prior to the time when the Funds’ assets are valued. In the case of equity securities not traded on an exchange, or if such closing prices are not otherwise available, the securities are valued at the mean of the most recent bid and ask prices on such day.
Redeemable securities issued by open-end registered investment companies are valued at the investment company’s applicable net asset value (“NAV”), with the exception of exchange-traded open-end investment companies, which are priced as equity securities. Money market funds, representing short-term investments, are valued at their NAV.
| Annual Report | September 30, 2024 | 25 |
| Clarkston Funds | Notes to Financial Statements
and Financial Highlights |
When prices or quotations for securities held by the Funds are not available, or when the valuation designee appointed by the Board believes that they are unreliable, securities may be priced using fair value procedures approved by the Board.
Fair Value Measurements: The Funds disclose the classification of their fair value measurements following a three-tier hierarchy based on the inputs used to measure fair value. Inputs refer broadly to the assumptions that market participants would use in pricing the asset or liability, including assumptions about risk. Inputs may be observable or unobservable. Observable inputs reflect the assumptions market participants would use in pricing the asset or liability that are developed based on market data obtained from sources independent of the reporting entity. Unobservable inputs reflect the reporting entity’s own assumptions about the assumptions market participants would use in pricing the asset or liability that are developed based on the best information available.
Various inputs are used in determining the value of the Funds’ investments as of the end of the reporting period. When inputs used fall into different levels of the fair value hierarchy, the level in the hierarchy within which the fair value measurement falls is determined based on the lowest level input that is significant to the fair value measurement in its entirety. The designated input levels are not necessarily an indication of the risk or liquidity associated with these investments. These inputs are categorized in the following hierarchy under applicable financial accounting standards:
| Level 1 – | Unadjusted quoted prices in active markets for identical investments, unrestricted assets or liabilities that the Fund has the ability to access at the measurement date; |
| Level 2 – | Quoted prices which are not active, quoted prices for similar assets or liabilities in active markets or inputs other than quoted prices that are observable (either directly or indirectly); and |
| Level 3 – | Significant unobservable prices or inputs (including a Fund’s own assumptions in determining the fair value of investments) where there is little or no market activity for the asset or liability at the measurement date. |
| Clarkston Funds | Notes to Financial Statements
and Financial Highlights |
The following is a summary of the inputs used to value the Funds’ investments as of September 30, 2024:
CLARKSTON PARTNERS FUND
| Investments in Securities at Value | | Level 1 -
Unadjusted
Quoted Prices | | | Level 2 - Other
Significant
Observable
Inputs | | | Level 3 -
Significant
Unobservable
Inputs | | | Total | |
| Common Stock | | | | | | | | | | | | | | | | |
| Consumer Discretionary | | $ | 80,148,900 | | | $ | – | | | $ | – | | | $ | 80,148,900 | |
| Consumer Staples | | | 374,123,920 | | | | – | | | | – | | | | 374,123,920 | |
| Financials | | | 195,380,310 | | | | – | | | | – | | | | 195,380,310 | |
| Health Care | | | 90,551,190 | | | | – | | | | – | | | | 90,551,190 | |
| Industrials | | | 150,949,540 | | | | – | | | | – | | | | 150,949,540 | |
| Technology | | | 117,150,000 | | | | – | | | | – | | | | 117,150,000 | |
| Telecommunications | | | 32,880,260 | | | | – | | | | – | | | | 32,880,260 | |
| Utilities | | | 58,438,000 | | | | – | | | | – | | | | 58,438,000 | |
| Total | | $ | 1,099,622,120 | | | $ | – | | | $ | – | | | $ | 1,099,622,120 | |
CLARKSTON FUND
| Investments in Securities at Value | | Level 1 -
Unadjusted
Quoted Prices | | | Level 2 - Other
Significant
Observable
Inputs | | | Level 3 -
Significant
Unobservable
Inputs | | | Total | |
| Common Stock | | | | | | | | | | | | | | | | |
| Consumer Discretionary | | $ | 11,044,380 | | | $ | – | | | $ | – | | | $ | 11,044,380 | |
| Consumer Staples | | | 42,408,890 | | | | – | | | | – | | | | 42,408,890 | |
| Financials | | | 25,976,335 | | | | – | | | | – | | | | 25,976,335 | |
| Health Care | | | 9,634,000 | | | | – | | | | – | | | | 9,634,000 | |
| Industrials | | | 32,411,480 | | | | – | | | | – | | | | 32,411,480 | |
| Technology | | | 13,667,500 | | | | – | | | | – | | | | 13,667,500 | |
| Telecommunications | | | 3,402,840 | | | | – | | | | – | | | | 3,402,840 | |
| Total | | $ | 138,545,425 | | | $ | – | | | $ | – | | | $ | 138,545,425 | |
CLARKSTON FOUNDERS FUND
| Investments in Securities at Value | | Level 1 -
Unadjusted
Quoted Prices | | | Level 2 - Other
Significant
Observable
Inputs | | | Level 3 -
Significant
Unobservable
Inputs | | | Total | |
| Common Stock | | | | | | | | | | | | | | | | |
| Consumer Discretionary | | $ | 46,727,850 | | | $ | – | | | $ | – | | | $ | 46,727,850 | |
| Consumer Staples | | | 217,665,550 | | | | – | | | | – | | | | 217,665,550 | |
| Financials | | | 137,242,936 | | | | – | | | | – | | | | 137,242,936 | |
| Health Care | | | 45,859,150 | | | | – | | | | – | | | | 45,859,150 | |
| Industrials | | | 115,841,560 | | | | – | | | | – | | | | 115,841,560 | |
| Technology | | | 68,621,500 | | | | – | | | | – | | | | 68,621,500 | |
| Utilities | | | 36,905,000 | | | | – | | | | – | | | | 36,905,000 | |
| Total | | $ | 668,863,546 | | | $ | – | | | $ | – | | | $ | 668,863,546 | |
| Annual Report | September 30, 2024 | 27 |
| Clarkston Funds | Notes to Financial Statements
and Financial Highlights |
September 30, 2024
There were no Level 3 securities held during the year ended September 30, 2024.
Cash & Cash Equivalents: The Funds consider their investment in a Federal Deposit Insurance Corporation (“FDIC”) insured interest bearing account to be cash and cash equivalents. Cash and cash equivalents are valued at cost plus any accrued interest. The Funds maintain cash balances, which, at times may exceed federally insured limits. The Funds maintain these balances with a high quality financial institution.
Concentration Risk: The Funds operate as “non-diversified” investment companies, as defined in the 1940 Act. As a result of being “non-diversified” with respect to 50% of the Funds’ portfolios, the Funds must limit the portion of their assets invested in the securities of a single issuer to 5%, measured at the time of purchase. In addition, no single investment can exceed 25% of the Funds’ total assets at the time of purchase. A more concentrated portfolio may cause the Funds’ net asset value to be more volatile and thus may subject stockholders to more risk. Thus, the volatility of the Funds’ net asset value and their performance in general, depends disproportionately more on the performance of a smaller number of holdings than that of a more diversified fund. As a result, the Funds are subject to a greater risk of loss than a fund that diversifies its investments more broadly.
Concentration of Credit Risk: Each Fund places its cash with a banking institution, which is insured by FDIC. The FDIC limit is $250,000. At various times throughout the period, the amount on deposit may exceed the FDIC limit and subject a Fund to a credit risk. The Funds do not believe that such deposits are subject to any unusual risk associated with investment activities.
Trust Expenses: Some expenses of the Trust can be directly attributed to a fund. Expenses that cannot be directly attributed to a fund are apportioned among all funds in the Trust based on average net assets of each fund, including Trustees’ fees and expenses.
Fund Expenses: Some expenses can be directly attributed to a Fund and are apportioned among the classes based on average net assets of each class.
Class Expenses: Expenses that are specific to a class of shares are charged directly to that share class. Fees provided under the shareholder service plan for a particular class of a Fund are charged to the operations of such class.
Federal Income Taxes: The Funds comply with the requirements under Subchapter M of the Internal Revenue Code of 1986, as amended, applicable to regulated investment companies and intend to distribute substantially all of their net taxable income and net capital gains, if any, each year so that they will not be subject to federal income or excise tax on undistributed income and gains. The Funds are not subject to income taxes to the extent such distributions are made.
As of and during the year ended September 30, 2024, the Funds did not have a liability for any unrecognized tax benefits in the accompanying financial statements. The Funds recognize interest and penalties, if any, related to tax liabilities as income tax expense in the Statements of Operations. The Funds file U.S. federal, state and local income tax returns as required. The Funds’ tax returns are subject to examination by the relevant tax authorities until expiration of the applicable statute of limitations, which is generally three years after the filing of the tax return for federal purposes and four years for most state returns. The Funds’ administrator has analyzed the Funds’ tax positions taken on federal and state income tax returns for all open tax years and has concluded that as of September 30, 2024, no provision for income tax is required in the Funds’ financial statements related to these tax positions.
| Clarkston Funds | Notes to Financial Statements
and Financial Highlights |
Investment Transactions and Investment Income: Investment transactions are accounted for on the date the investments are purchased or sold (trade date basis for financial reporting purposes). Realized gains and losses from investment transactions are reported on an identified cost basis. Interest income, which includes accretion of discounts and amortization of premiums, is accrued and recorded as earned using the effective yield method. Dividend income is recognized on the ex- dividend date, or for certain foreign securities, as soon as information is available to a Fund. Withholding taxes on foreign dividends are paid (a portion of which may be reclaimable) or provided for in accordance with the applicable country’s tax rules and rates and are disclosed in the Statements of Operations. All of the realized and unrealized gains and losses of a Fund and net investment income of a Fund are allocated daily to each class of the Fund in proportion to its average daily net assets.
Distributions to Shareholders: The Funds normally pay dividends, if any, and distribute capital gains, if any, on an annual basis. Income dividend distributions are derived from interest, dividends and other income the Funds receive from their investments, including short-term capital gains. Long-term capital gain distributions are derived from gains realized when a Fund sells a security it has owned for more than one year. A Fund may make additional distributions and dividends at other times if its portfolio manager or managers believe doing so may be necessary for the Fund to avoid or reduce taxes. Net investment income/(loss) and net realized gain/(loss) may differ for financial statement and tax purposes.
3. TAX BASIS INFORMATION
Tax Basis of Distributions to Shareholders: The character of distributions made during the period from net investment income or net realized gains may differ from its ultimate characterization for federal income tax purposes. Also, due to the timing of dividend distributions, the fiscal year in which amounts are distributed may differ from the fiscal year in which the income or realized gain were recorded by the Funds. The amounts and characteristics of tax basis distributions and composition of distributable earnings/(accumulated losses) are finalized at fiscal year-end.
The tax character of distributions paid during the fiscal year ended September 30, 2024, were as follows:
| | | | Ordinary Income | | | Long-Term Capital
Gains | |
| Clarkston Partners Fund | | | $ | 10,421,131 | | | $ | 39,174,314 | |
| Clarkston Fund | | | | 1,128,769 | | | | 3,570,612 | |
| Clarkston Founders Fund | | | | 7,042,936 | | | | 4,332,687 | |
| Annual Report | September 30, 2024 | 29 |
| Clarkston Funds | Notes to Financial Statements
and Financial Highlights |
The tax character of distributions paid during the fiscal year ended September 30, 2023, were as follows:
| | | | Ordinary Income | | | Long-Term Capital
Gains | |
| Clarkston Partners Fund | | | $ | 36,968,506 | | | $ | 184,520,141 | |
| Clarkston Fund | | | | 716,747 | | | | 4,682,986 | |
| Clarkston Founders Fund | | | | 9,515,714 | | | | 26,876,828 | |
As of September 30, 2024, permanent differences in book and tax accounting were reclassified. The following reclassifications, which had no impact on results of operations or net assets, were recorded to reflect tax character:
| | | | Paid-in Capital | | | Total Distributable
Earnings | |
| Clarkston Partners Fund | | | $ | 9,094,104 | | | $ | (9,094,104 | ) |
These differences are primarily attributable to tax treatment of earnings and profits on redemption of shares.
Unrealized Appreciation and Depreciation on Investments: As of September 30, 2024, the aggregate costs of investments, gross unrealized appreciation/(depreciation) and net unrealized appreciation/(depreciation) for Federal tax purposes were as follows:
| | | Clarkston Partners
Fund | | | Clarkston
Fund | | | Clarkston Founders
Fund | |
| Gross unrealized appreciation (excess of value over tax cost) | | $ | 391,044,121 | | | $ | 38,846,821 | | | $ | 169,191,646 | |
| Gross unrealized depreciation (excess of tax cost over value) | | | (120,648,940 | ) | | | (8,450,693 | ) | | | (47,554,588 | ) |
| Net unrealized appreciation | | $ | 270,395,181 | | | $ | 30,396,128 | | | $ | 121,637,058 | |
| Cost of investments for income tax purposes | | $ | 829,226,939 | | | $ | 108,149,299 | | | $ | 547,226,488 | |
Components of Distributable Earnings: As of September 30, 2024, components of distributable earnings on a tax basis were as follows:
| | | Clarkston Partners
Fund | | | Clarkston Fund | | | Clarkston Founders
Fund | |
| Undistributed ordinary income | | $ | 4,400,951 | | | $ | 1,142,381 | | | $ | 2,699,868 | |
| Accumulated capital gains/(losses) | | | 6,375,981 | | | | (3,669,404 | ) | | | (45,264,132 | ) |
| Net unrealized appreciation | | | 270,395,181 | | | | 30,396,128 | | | | 121,637,058 | |
| Total | | $ | 281,172,113 | | | $ | 27,869,105 | | | $ | 79,072,794 | |
| Clarkston Funds | Notes to Financial Statements
and Financial Highlights |
Under current law, capital losses maintain their character as short-term or long-term and are carried forward to the next tax year without expiration. As of the current fiscal year end, the following amounts are available as carry forwards to the next tax year:
| Fund | | | Short Term | | | Long-Term | |
| Clarkston Founders Fund | | | $ | – | | | $ | 45,264,132 | |
The Clarkston Fund elects to defer to the period ending September 30, 2025, capital losses recognized during the period November 1, 2023 - September 30, 2024 in the amount of $3,669,404.
4. SECURITIES TRANSACTIONS
Purchases and sales of securities, excluding short-term securities, during the year ended September 30, 2024, were as follows:
| | | | Purchases of Securities | | | Proceeds from Sales of
Securities | |
| Clarkston Partners Fund | | | $ | 256,162,267 | | | $ | 483,661,869 | |
| Clarkston Fund | | | | 32,033,013 | | | | 29,191,313 | |
| Clarkston Founders Fund | | | | 104,321,521 | | | | 110,433,023 | |
5. BENEFICIAL SHARE TRANSACTIONS
The capitalization of the Trust consists of an unlimited number of shares of beneficial interest with no par value per share. Holders of the shares of the Funds have one vote for each share held and a proportionate fraction of a vote for each fractional share. All shares issued and outstanding are fully paid and are transferable and redeemable at the option of the shareholder. Shares have no pre- emptive rights. Neither the Funds nor any of their creditors have the right to require shareholders to pay any additional amounts solely because the shareholder owns the shares.
| Annual Report | September 30, 2024 | 31 |
| Clarkston Funds | Notes to Financial Statements and Financial Highlights |
Transactions in common shares were as follows:
| | | For the Year Ended
September 30,
2024 | | | For the Year Ended
September 30,
2023 | |
| Clarkston Partners Fund | | | | | | |
| Founders Class | | | | | | | | |
| Shares sold | | | 28,504 | | | | 18,325 | |
| Shares issued in reinvestment of distributions to shareholders | | | 43,782 | | | | 243,890 | |
| Shares redeemed | | | (3,707,220 | ) | | | (3,182,643 | ) |
| Net decrease in shares outstanding | | | (3,634,934 | ) | | | (2,920,428 | ) |
| Institutional Class | | | | | | | | |
| Shares sold | | | 8,936,530 | | | | 10,156,961 | |
| Shares issued in reinvestment of distributions to shareholders | | | 2,139,717 | | | | 9,189,652 | |
| Shares redeemed | | | (24,587,289 | ) | | | (16,095,878 | ) |
| Net increase/(decrease) in shares outstanding | | | (13,511,042 | ) | | | 3,250,735 | |
| | | | | | | | | |
| Clarkston Fund | | | | | | | | |
| Institutional Class | | | | | | | | |
| Shares sold | | | 2,575,609 | | | | 1,639,731 | |
| Shares issued in reinvestment of distributions to shareholders | | | 325,458 | | | | 426,358 | |
| Shares redeemed | | | (1,392,939 | ) | | | (1,071,591 | ) |
| Net increase in shares outstanding | | | 1,508,128 | | | | 994,498 | |
| | | | | | | | | |
| Clarkston Founders Fund | | | | | | | | |
| Founders Class | | | | | | | | |
| Shares sold | | | 6,415,334 | | | | 9,488,224 | |
| Shares issued in reinvestment of distributions to shareholders | | | 7,446 | | | | 36,345 | |
| Shares redeemed | | | (5,100,651 | ) | | | (5,572,329 | ) |
| Net increase in shares outstanding | | | 1,322,129 | | | | 3,952,240 | |
| Institutional Class | | | | | | | | |
| Shares sold | | | 2,775,699 | | | | 1,925,860 | |
| Shares issued in reinvestment of distributions to shareholders | | | 202,233 | | | | 716,175 | |
| Shares redeemed | | | (2,143,260 | ) | | | (1,128,842 | ) |
| Net increase in shares outstanding | | | 834,672 | | | | 1,513,193 | |
| Clarkston Funds | Notes to Financial Statements
and Financial Highlights |
Control is defined by the 1940 Act as the beneficial ownership, either directly or through one or more controlled companies, of more than 25% of the voting securities of a company. Approximately 73% of the outstanding shares of the Clarkston Partners Fund are held by two omnibus accounts that own shares on behalf of their underlying beneficial owners. Approximately 77% of the outstanding shares of the Clarkston Fund are owned by one omnibus account that owns shares on behalf of its underlying beneficial owners. Approximately 90% of the outstanding shares of the Clarkston Founders Fund are held by two omnibus accounts that own shares on behalf of their underlying beneficial owners. Share transaction activities of these shareholders could have a material impact on the Funds.
6. MANAGEMENT AND RELATED PARTY TRANSACTIONS
Investment Advisory: Clarkston Capital Partners, LLC (“Clarkston” or the “Adviser”), subject to the authority of the Board, is responsible for the management of the Funds’ portfolios. The Adviser manages the investments of the Funds in accordance with the Funds’ investment objectives, policies and limitations and investment guidelines established jointly by the Adviser and the Board.
Pursuant to the Investment Advisory Agreement (the “Advisory Agreement”) with the Adviser, each Fund pays the Adviser an annual management fee that is based on each Fund’s average daily net assets. The management fee is paid on a monthly basis. The contractual management fee rates are 0.80%, 0.50% and 0.75% for the Clarkston Partners Fund, the Clarkston Fund and the Clarkston Founders Fund, respectively. The Board may extend the Advisory Agreement for additional one-year terms. The Board and shareholders of a Fund may terminate the Advisory Agreement upon 30 days’ written notice. The Adviser may terminate the Advisory Agreement upon 60 days’ notice.
Pursuant to a fee waiver letter agreement (the “Fee Waiver Agreement”), the Adviser has contractually agreed to limit the amount of each Fund’s Total Annual Fund Operating Expenses, (excluding shareholder servicing fees, brokerage expenses, interest expenses, taxes, acquired fund fees and expenses and extraordinary expenses) to an annual rate of 0.85% of the Clarkston Partners Fund’s average daily net assets for each of the Founders Class shares and the Institutional Class shares, 0.55% of the Clarkston Fund’s average daily net assets for the Institutional Class shares and 0.80% of the Clarkston Founders Fund’s average daily net assets for each of the Founders Class shares and the Institutional Class shares. The Fee Waiver Agreement is in effect through January 31, 2025 and will automatically continue upon annual approval by the Board for successive twelve-month periods unless (i) it is terminated earlier by the Board, or (ii) the Adviser provides at least 30 days written notice of its non-continuance prior to the end of the then effective term. The Adviser may not terminate the Fee Waiver Agreement without the approval of the Trust’s Board. The Adviser will be permitted to recover, on a class-by-class basis, expenses it has borne through the Fee Waiver Agreement (whether through a reduction of its management fee or otherwise) only to the extent that a Fund’s expenses in later periods do not exceed the lesser of: (1) the contractual expense limit in effect at the time the Adviser waives or limits the expenses; or (2) the contractual expense limit in effect at the time the Adviser seeks to recover the expenses; provided, however, that the Funds will not be obligated to pay any such deferred fees or expenses more than three years after the date on which the fee or expense was reduced, as calculated on a monthly basis.
For the year ended September 30, 2024, the fee waivers and/or reimbursements were $137,409, $217,941, $137,800, $186,726, and $70,717 for the Clarkston Partners Fund Founders Class, Clarkston Partners Fund Institutional Class, Clarkston Fund Institutional Class, Clarkston Founders Fund Founders Class and Clarkston Founders Fund Institutional Class, respectively.
| Annual Report | September 30, 2024 | 33 |
| Clarkston Funds | Notes to Financial Statements
and Financial Highlights |
As of September 30, 2024, the balances of recoupable expenses for each Fund and class were as follows:
| | | | Expiring in 2025 | | | Expiring in 2026 | | | Expiring in 2027 | |
| Clarkston Partners Fund | | | | | | | | | | | | | |
| Founders | | | $ | 167,096 | | | $ | 145,168 | | | $ | 137,409 | |
| Institutional | | | | 223,604 | | | | 222,408 | | | | 217,941 | |
| | | | | | | | | | | | | | |
| Clarkston Fund | | | | 118,133 | | | | 102,951 | | | | 137,800 | |
| | | | | | | | | | | | | | |
| Clarkston Founders Fund | | | | | | | | | | | | | |
| Founders | | | | 164,493 | | | | 97,656 | | | | 186,726 | |
| Institutional | | | | 62,763 | | | | 37,878 | | | | 70,717 | |
Administrator: ALPS Fund Services, Inc. (“ALPS”) (an affiliate of ALPS Distributors, Inc.) serves as administrator to each Fund. The Funds have agreed to pay expenses incurred in connection with their administrative activities. Pursuant to the Administration, Bookkeeping and Pricing Services Agreement with the Trust, ALPS provides operational services to the Funds including, but not limited to, fund accounting and fund administration and generally assists in each Fund’s operations. Each Fund’s administration fee is accrued on a daily basis and paid monthly. The officers of the Trust are employees of ALPS. Administration fees paid by the Funds for year ended September 30, 2024, are disclosed in the Statements of Operations. ALPS is reimbursed by the Funds for certain out-of-pocket expenses.
Transfer Agent: ALPS serves as transfer agent for each Fund under a Transfer Agency and Services Agreement with the Trust. Under this agreement, ALPS is paid an annual fee for services performed on behalf of the Funds plus fees for open accounts and is reimbursed for certain out-of-pocket expenses.
Compliance Services: ALPS provides Chief Compliance Officer services to each Fund to monitor and test the policies and procedures of each Fund in conjunction with requirements under Rule 38a-1 of the 1940 Act pursuant to a Chief Compliance Officer Services Agreement with the Trust. Under this agreement, ALPS is paid an annual fee for services performed on behalf of the Funds and is reimbursed for certain out-of-pocket expenses.
Distribution: ALPS Distributors, Inc. (the “Distributor”) (an affiliate of ALPS) acts as the principal underwriter of each Fund’s shares pursuant to a Distribution Agreement with the Trust. Shares of each Fund are offered on a continuous basis through the Distributor, as agent of the Funds. The Distributor is not obligated to sell any particular amount of shares and is not entitled to any compensation for its services as the Funds’ principal underwriter pursuant to the Distribution Agreement.
Each Fund has adopted a shareholder services plan (“Shareholder Services Plan”) for its Institutional Class. Under the Shareholder Services Plan each Fund is authorized to pay banks and their affiliates and other institutions, including broker-dealers and Fund affiliates (“Participating Organizations”), an aggregate fee in an amount not to exceed on an annual basis 0.15% of the average daily net asset value of each Fund’s Institutional Class shares to Participating Organizations as compensation for providing shareholder service activities, which do not include distribution services, pursuant to an agreement with a Participating Organization.
| Clarkston Funds | Notes to Financial Statements and Financial Highlights |
7. TRUSTEES AND OFFICERS
As of September 30, 2024, there were four Trustees, each of whom are not “interested persons” (as defined in the 1940 Act) of the Trust (the “Independent Trustees”). The Independent Trustees of the Trust and, if any, Interested Trustees who are not currently employed by the Adviser, ALPS or other service providers will receive a quarterly retainer of $16,250, plus $5,000 for each regular Board or Committee meeting attended and $2,000 for each special telephonic or in-person Board or Committee meeting attended. Additionally, the Audit Committee Chair receives a quarterly retainer of $1,875 and the Independent Chair receives a quarterly retainer of $4,250. These fees are allocated proportionately among the multiple portfolios/series of the Trust. The Independent Trustees and, if any, Interested Trustees who are not currently employed by the Adviser, ALPS or other service providers are also reimbursed for all reasonable out-of-pocket expenses relating to attendance at meetings.
Officers of the Trust receive no salary or fees from the Trust. As discussed in Note 6, the Funds pay ALPS an annual fee for compliance services.
8. INDEMNIFICATIONS
Under the Trust’s organizational documents, its officers and Trustees are indemnified against certain liabilities arising out of the performance of their duties to the Trust. Additionally, in the normal course of business, the Trust enters into contracts with service providers that may contain general indemnification clauses which may permit indemnification to the extent permissible under applicable law. The Trust’s maximum exposure under these arrangements is unknown, as this would involve future claims that may be made against the Trust that have not yet occurred.
9. SUBSEQUENT EVENTS
Subsequent events after the date of the Statements of Assets and Liabilities have been evaluated through the date the financial statements were issued. Management has determined that there were no subsequent events to report through the issuance of these financial statements.
| Annual Report | September 30, 2024 | 35 |
| Clarkston Funds | Report of Independent Registered
Public Accounting Firm |
To the Shareholders of Clarkston Partners Fund, Clarkston Fund, and Clarkston Founders Fund and Board of Trustees of ALPS Series Trust
Opinion on the Financial Statements
We have audited the accompanying statements of assets and liabilities, including the schedules of investments, of Clarkston Funds, comprising Clarkston Partners Fund, Clarkston Fund, and Clarkston Founders Fund (the “Funds”), each a series of ALPS Series Trust, as of September 30, 2024, the related statements of operations for the year then ended, the statements of changes in net assets for each of the two years in the period then ended, the financial highlights for each of the five years or period in the period then ended, and the related notes (collectively referred to as the “financial statements”). In our opinion, the financial statements present fairly, in all material respects, the financial position of each of the Funds as of September 30, 2024, the results of their operations for the year then ended, the changes in net assets for each of the two years in the period then ended, and the financial highlights for each of the five years or period in the period then ended, in conformity with accounting principles generally accepted in the United States of America.
Basis for Opinion
These financial statements are the responsibility of the Funds’ management. Our responsibility is to express an opinion on the Funds’ financial statements based on our audits. We are a public accounting firm registered with the Public Company Accounting Oversight Board (United States) (“PCAOB”) and are required to be independent with respect to the Funds in accordance with the U.S. federal securities laws and the applicable rules and regulations of the Securities and Exchange Commission and the PCAOB.
We conducted our audits in accordance with the standards of the PCAOB. Those standards require that we plan and perform the audit to obtain reasonable assurance about whether the financial statements are free of material misstatement whether due to error or fraud.
Our audits included performing procedures to assess the risks of material misstatement of the financial statements, whether due to error or fraud, and performing procedures that respond to those risks. Such procedures included examining, on a test basis, evidence regarding the amounts and disclosures in the financial statements. Our procedures included confirmation of securities owned as of September 30, 2024, by correspondence with the custodian. Our audits also included evaluating the accounting principles used and significant estimates made by management, as well as evaluating the overall presentation of the financial statements. We believe that our audits provide a reasonable basis for our opinion.
We have served as the Funds’ auditor since 2017.

COHEN & COMPANY, LTD.
Cleveland, Ohio
November 27, 2024
| Clarkston Funds | Tax Designations |
September 30, 2024 (Unaudited)
Qualified Dividend Income
The percentage of ordinary income dividends distributed during the calendar year ended December 31, 2023 are designated as qualified dividend income (QDI) as defined in Section 1(h)(11) of the Internal Revenue Code in the following percentages:
| | Amount |
| Clarkston Partners Fund | 100.00% |
| Clarkston Fund | 100.00% |
| Clarkston Founders Fund | 75.74% |
Dividends Received Deduction
For corporate shareholders, the following ordinary dividends paid during the calendar year ended December 31, 2023 qualify for the corporate dividends received deduction:
| | Amount |
| Clarkston Partners Fund | 100.00% |
| Clarkston Fund | 97.55% |
| Clarkston Founders Fund | 67.00% |
Pursuant to Section 852(b)(3) of the Internal Revenue Code the following Funds designate the amounts listed below as long-term capital gain dividends:
| | Amount |
| Clarkston Partners Fund | $39,174,314 |
| Clarkston Fund | $3,570,612 |
| Clarkston Founders Fund | $4,332,606 |
| Annual Report | September 30, 2024 | 37 |

Annual Financial Statements
As of September 30, 2024
Hillman Value Fund
No Load Shares

This report and the financial statements contained herein are submitted for the general information of the shareholders of the Hillman Value Fund (“Fund”). The Fund’s shares are not deposits or obligations of, or guaranteed by, any depository institution. The Fund’s shares are not insured by the FDIC, Federal Reserve Board or any other agency, and are subject to investment risks, including possible loss of principal amount invested. Neither the Fund nor the Fund’s distributor is a bank.
TABLE OF CONTENTS
| Schedule of Investments | 1 |
| Statement of Assets and Liabilities | 4 |
| Statement of Operations | 5 |
| Statements of Changes in Net Assets | 6 |
| Financial Highlights | 8 |
| Notes to Financial Statements and Financial Highlights | 11 |
| Report of Independent Registered Public Accounting Firm | 22 |
| Tax Designations | 23 |
| Hillman Value Fund | Schedule of Investments |
September 30, 2024
| | | | | | Value | |
| | | Shares | | | (Note 2) | |
| COMMON STOCK (93.85%) | | | | | | | | |
| Communication Services (16.48%) | | | | | | | | |
| Alphabet, Inc., Class A | | | 35,700 | | | $ | 5,920,845 | |
| AT&T, Inc. | | | 310,600 | | | | 6,833,200 | |
| Comcast Corp., Class A | | | 142,400 | | | | 5,948,048 | |
| Verizon Communications, Inc. | | | 137,000 | | | | 6,152,670 | |
| Walt Disney Co. | | | 65,000 | | | | 6,252,350 | |
| Warner Bros Discovery, Inc.(a) | | | 808,000 | | | | 6,666,000 | |
| Total Communication Services | | | | | | | 37,773,113 | |
| | | | | | | | | |
| Consumer Discretionary (10.80%) | | | | | | | | |
| Amazon.com, Inc.(a) | | | 31,700 | | | | 5,906,661 | |
| CarMax, Inc.(a) | | | 77,000 | | | | 5,958,260 | |
| NIKE, Inc., Class B | | | 75,500 | | | | 6,674,200 | |
| Nordstrom, Inc. | | | 275,600 | | | | 6,198,244 | |
| Total Consumer Discretionary | | | | | | | 24,737,365 | |
| | | | | | | | | |
| Consumer Staples (13.28%) | | | | | | | | |
| Anheuser-Busch InBev NV, Sponsored ADR(b) | | | 88,800 | | | | 5,886,552 | |
| Campbell Soup Co. | | | 137,800 | | | | 6,741,176 | |
| Conagra Brands, Inc. | | | 186,000 | | | | 6,048,720 | |
| Estee Lauder Cos., Inc., Class A | | | 58,000 | | | | 5,782,020 | |
| Kraft Heinz Co.(b) | | | 170,000 | | | | 5,968,700 | |
| Total Consumer Staples | | | | | | | 30,427,168 | |
| | | | | | | | | |
| Financials (10.20%) | | | | | | | | |
| T Rowe Price Group, Inc. | | | 50,000 | | | | 5,446,500 | |
| US Bancorp | | | 156,000 | | | | 7,133,880 | |
| Wells Fargo & Co.(b) | | | 99,200 | | | | 5,603,808 | |
| Western Union Co. | | | 435,000 | | | | 5,189,550 | |
| Total Financials | | | | | | | 23,373,738 | |
| | | | | | | | | |
| Health Care (20.59%) | | | | | | | | |
| Baxter International, Inc. | | | 155,000 | | | | 5,885,350 | |
| Becton Dickinson & Co. | | | 24,000 | | | | 5,786,400 | |
| Biogen, Inc.(a)(c) | | | 24,400 | | | | 4,729,696 | |
| Bristol-Myers Squibb Co. | | | 154,000 | | | | 7,967,960 | |
See Notes to Financial Statements and Financial Highlights.
| Annual Report | September 30, 2024 | 1 |
| Hillman Value Fund | Schedule of Investments |
September 30, 2024
| | | | | | Value | |
| | | Shares | | | (Note 2) | |
| Health Care (continued) | | | | | | | | |
| CVS Health Corp. | | | 82,000 | | | $ | 5,156,160 | |
| GSK PLC, Sponsored ADR | | | 135,100 | | | | 5,522,888 | |
| Pfizer, Inc. | | | 221,200 | | | | 6,401,528 | |
| Zimmer Biomet Holdings, Inc. | | | 53,300 | | | | 5,753,735 | |
| Total Health Care | | | | | | | 47,203,717 | |
| | | | | | | | | |
| Industrials (4.75%) | | | | | | | | |
| Boeing Co.(a)(c) | | | 31,100 | | | | 4,728,444 | |
| Emerson Electric Co. | | | 56,200 | | | | 6,146,594 | |
| Total Industrials | | | | | | | 10,875,038 | |
| | | | | | | | | |
| Information Technology (9.23%) | | | | | | | | |
| Adobe, Inc.(a) | | | 9,900 | | | | 5,126,022 | |
| Intel Corp.(b) | | | 183,000 | | | | 4,293,180 | |
| Microsoft Corp. | | | 14,400 | | | | 6,196,320 | |
| Salesforce, Inc. | | | 20,200 | | | | 5,528,942 | |
| Total Information Technology | | | | | | | 21,144,464 | |
| | | | | | | | | |
| Materials (8.52%) | | | | | | | | |
| DuPont de Nemours, Inc. | | | 75,900 | | | | 6,763,449 | |
| International Flavors & Fragrances, Inc. | | | 62,900 | | | | 6,600,097 | |
| Nucor Corp. | | | 40,900 | | | | 6,148,906 | |
| Total Materials | | | | | | | 19,512,452 | |
| | | | | | | | | |
| TOTAL COMMON STOCK | | | | | | | | |
| (Cost $210,187,280) | | | | | | | 215,047,055 | |
| | | | | | | | | |
| REAL ESTATE INVESTMENT TRUST (2.67%) | | | | | | | | |
| Real Estate (2.67%) | | | | | | | | |
| Simon Property Group, Inc. | | | 36,200 | | | | 6,118,524 | |
| | | | | | | | | |
| TOTAL REAL ESTATE INVESTMENT TRUST | | | | | | | | |
| (Cost $3,184,487) | | | | | | | 6,118,524 | |
| | | | | | | | | |
| TOTAL INVESTMENTS (96.52%) | | | | | | | |
| (Cost $213,371,767) | | | | | | $ | 221,165,579 | |
| | | | | | | | | |
| OTHER ASSETS IN EXCESS OF LIABILITIES (3.48%) | | | | | | | 7,976,067 | |
| | | | | | | | | |
| NET ASSETS (100.00%) | | | | | | $ | 229,141,646 | |
See Notes to Financial Statements and Financial Highlights.
| Hillman Value Fund | Schedule of Investments |
September 30, 2024
| (a) | Non-income producing security. |
| (b) | All or a portion is held as collateral at custodian for written options. The aggregate value of the collateral pledged was $19,267,901. |
| (c) | Held in connection with written option contracts. |
WRITTEN OPTION CONTRACTS (0.04%)
| | | Expiration | | | Strike | | | | | | Premiums | | | Notional | | | Value | |
| Counterparty | | Date | | | Price | | | Contracts | | | Received | | | Value | | | (Note 2) | |
| Option Contracts - (0.04%) | | | | | | | | | | | | | | | | | | | | | | |
| Biogen Inc. StoneX | | 10/21/24 | | | $ | 192.50 | | | (86 | ) | | $ | 36,016 | | | $ | (1,667,024 | ) | | $ | (36,120 | ) |
| Boeing Co. StoneX | | 10/21/24 | | | | 152.50 | | | (100 | ) | | | 50,410 | | | | (1,520,400 | ) | | | (53,700 | ) |
| | | | | | | | | | | | | | | | | | | | | | |
| TOTAL WRITTEN OPTION CONTRACTS | | | $ | 86,426 | | | $ | (3,187,424 | ) | | $ | (89,820 | ) |
See Notes to Financial Statements and Financial Highlights.
| Annual Report | September 30, 2024 | 3 |
| Hillman Value Fund | Statement of Assets and Liabilities |
September 30, 2024
| ASSETS: | | | |
| Investments, at value (Cost $213,371,767) | | $ | 221,165,579 | |
| Cash and cash equivalents | | | 7,562,687 | |
| Cash collateral held at custodian | | | 60,800 | |
| Deposit with broker for written options | | | 68 | |
| Receivable for investments sold | | | 86,426 | |
| Receivable for shares sold | | | 308,035 | |
| Dividends and interest receivable | | | 271,109 | |
| Other assets | | | 10,523 | |
| Total Assets | | | 229,465,227 | |
| | | | | |
| LIABILITIES: | | | | |
| Written options, at value (premiums received $86,426) | | | 89,820 | |
| Payable for administration and transfer agent fees | | | 80,324 | |
| Payable for shares redeemed | | | 14,478 | |
| Payable to adviser | | | 104,827 | |
| Payable for professional fees | | | 22,001 | |
| Payable to Chief Compliance Officer fees | | | 1,741 | |
| Accrued expenses and other liabilities | | | 10,390 | |
| Total Liabilities | | | 323,581 | |
| NET ASSETS | | $ | 229,141,646 | |
| | | | | |
| NET ASSETS CONSIST OF: | | | | |
| Paid-in capital (Note 6) | | $ | 196,564,506 | |
| Total distributable earnings | | | 32,577,140 | |
| NET ASSETS | | $ | 229,141,646 | |
| | | | | |
| PRICING OF SHARES | | | | |
| Net Asset Value, offering and redemption price per share | | $ | 33.43 | |
| Net Assets | | $ | 229,141,646 | |
| Shares of beneficial interest outstanding | | | 6,855,344 | |
See Notes to Financial Statements and Financial Highlights.
| Hillman Value Fund | Statement of Operations |
For the Year Ended September 30, 2024
| INVESTMENT INCOME: | | | |
| Dividends | | $ | 5,735,850 | |
| Foreign taxes withheld | | | (34,304 | ) |
| Total Investment Income | | | 5,701,546 | |
| | | | | |
| EXPENSES: | | | | |
| Investment advisory fees (Note 7) | | | 1,705,598 | |
| Administration fees | | | 154,470 | |
| Custody fees | | | 25,613 | |
| Audit and tax fees | | | 20,091 | |
| Transfer agent fees | | | 361,333 | |
| Trustees fees and expenses | | | 19,419 | |
| Registration and filing fees | | | 26,703 | |
| Chief Compliance Officer fees | | | 20,732 | |
| Insurance fees | | | 5,886 | |
| Other expenses | | | 13,192 | |
| Total Expenses | | | 2,353,037 | |
| Less fees waived by investment adviser (Note 7) | | | (188,445 | ) |
| Net Expenses | | | 2,164,592 | |
| NET INVESTMENT INCOME | | | 3,536,954 | |
| | | | | |
| REALIZED AND UNREALIZED GAIN/(LOSS) ON INVESTMENTS AND WRITTEN OPTIONS: | | | | |
| Net realized gain/(loss) on: | | | (23,080,111 | ) |
| Investments | | | 22,205,953 | |
| Written options | | | 874,158 | |
| Net realized gain | | | 23,080,111 | |
| Change in unrealized appreciation/(depreciation) on: | | | 20,157,026 | |
| Investments | | | 20,157,026 | |
| Written options | | | 302,432 | |
| Net change | | | 20,459,458 | |
| | | | |
| NET REALIZED AND UNREALIZED GAIN ON INVESTMENTS AND WRITTEN OPTIONS | | | 43,539,569 | |
| NET INCREASE IN NET ASSETS RESULTING FROM OPERATIONS | | $ | 47,076,523 | |
See Notes to Financial Statements and Financial Highlights.
| Annual Report | September 30, 2024 | 5 |
| Hillman Value Fund | Statements of Changes in Net Assets |
| | | For the Year | | | For the Year | |
| | | Ended | | | Ended | |
| | | September 30, | | | September 30, | |
| | | 2024 | | | 2023 | |
| OPERATIONS: | | | | | | | | |
| Net investment income | | $ | 3,536,954 | | | $ | 3,022,081 | |
| Net realized gain on investments and written options | | | 23,080,111 | | | | 2,537,360 | |
| Net change in unrealized appreciation on investments and written options | | | 20,459,458 | | | | 30,806,419 | |
| Net increase in net assets resulting from operations | | | 47,076,523 | | | | 36,365,860 | |
| | | | | | | | | |
| DISTRIBUTIONS TO SHAREHOLDERS | | | | | | | | |
| From distributable earnings | | | (7,019,817 | ) | | | (20,852,781 | ) |
| Total distributions | | | (7,019,817 | ) | | | (20,852,781 | ) |
| | | | | | | | | |
| BENEFICIAL SHARE TRANSACTIONS (Note 6): | | | | | | | | |
| Shares sold | | | 38,184,444 | | | | 47,928,272 | |
| Dividends reinvested | | | 6,522,532 | | | | 20,181,259 | |
| Shares redeemed | | | (66,482,584 | ) | | | (52,541,116 | ) |
| Net increase/(decrease) from beneficial share transactions | | | (21,775,608 | ) | | | 15,568,415 | |
| Net increase in net assets | | | 18,281,098 | | | | 31,081,494 | |
| | | | | | | | | |
| NET ASSETS: | | | | | | | | |
| Beginning of year | | | 210,860,548 | | | | 179,779,054 | |
| End of year | | $ | 229,141,646 | | | $ | 210,860,548 | |
See Notes to Financial Statements and Financial Highlights.
Intentionally Left Blank
| Hillman Value Fund | Financial Highlights |
For a Share Outstanding Throughout the Periods Presented
| NET ASSET VALUE, BEGINNING OF PERIOD |
| |
INCOME/(LOSS) FROM OPERATIONS: |
| Net investment income(b) |
Net realized and unrealized gain/(loss) on investments |
| Total from investment operations |
| |
| LESS DISTRIBUTIONS: |
| From net investment income |
From net realized gains on investments |
| Total Distributions |
| NET INCREASE/(DECREASE) IN NET ASSET VALUE |
| NET ASSET VALUE, END OF PERIOD |
| |
| TOTAL RETURN(d) |
| |
| SUPPLEMENTAL DATA: |
| Net assets, end of period (in 000s) |
| |
| RATIOS TO AVERAGE NET ASSETS |
Operating expenses excluding reimbursement/waiver |
Operating expenses including reimbursement/waiver |
| Net investment income including reimbursement/waiver |
| |
| PORTFOLIO TURNOVER RATE |
See Notes to Financial Statements and Financial Highlights.
| Hillman Value Fund | Financial Highlights |
For a Share Outstanding Throughout the Periods Presented
| For the Year | | | For the Year | | | For the Year | | | For the Year | | | For the Year | |
| Ended | | | Ended | | | Ended | | | Ended | | | Ended | |
| September 30, | | | September 30, | | | September 30, | | | September 30, | | | September 30, | |
| 2024 | | | 2023 | | | 2022 | | | 2021 (a) | | | 2020 | |
| $ | 27.94 | | | $ | 25.87 | | | $ | 33.82 | | | $ | 25.68 | | | $ | 27.74 | |
| | | | | | | | | | | | | | | | | | | |
| | 0.48 | | | | 0.42 | | | | 0.55 | | | | 0.62 | | | | 0.29 | |
| | 5.97 | | | | 4.82 | | | | (5.98 | ) | | | 9.97 | | | | (1.32 | ) |
| | 6.45 | | | | 5.24 | | | | (5.43 | ) | | | 10.59 | | | | (1.03 | ) |
| | | | | | | | | | | | | | | | | | | |
| | (0.15 | ) | | | (0.26 | ) | | | (0.41 | ) | | | (0.27 | ) | | | (0.12 | ) |
| | (0.81 | ) | | | (2.91 | ) | | | (2.11 | ) | | | (2.18 | ) | | | (0.91 | ) |
| | (0.96 | ) | | | (3.17 | ) | | | (2.52 | ) | | | (2.45 | ) | | | (1.03 | ) |
| | 5.49 | | | | 2.07 | | | | (7.95 | ) | | | 8.14 | | | | (2.06 | ) |
| $ | 33.43 | | | $ | 27.94 | | | $ | 25.87 | | | $ | 33.82 | | | $ | 25.68 | (c) |
| | | | | | | | | | | | | | | | | | | |
| | 23.34 | % | | | 21.30 | % | | | (17.55 | %) | | | 43.04 | % | | | (4.10 | %) |
| | | | | | | | | | | | | | | | | | | |
| $ | 229,142 | | | $ | 210,861 | | | $ | 179,779 | | | $ | 216,130 | | | $ | 104,395 | |
| | | | | | | | | | | | | | | | | | | |
| | 1.03 | % | | | 1.14 | % | | | 1.12 | % | | | 1.15 | % | | | 1.31 | % |
| | 0.95 | % | | | 0.95 | % | | | 0.95 | % | | | 0.95 | % | | | 0.99 | % |
| | 1.55 | % | | | 1.49 | % | | | 1.75 | % | | | 1.94 | % | | | 1.54 | % |
| | | | | | | | | | | | | | | | | | | |
| | 35 | % | | | 23 | % | | | 31 | % | | | 27 | % | | | 30 | % |
| (a) | Effective March 15, 2021, the Hillman Value Fund merged into the ALPS Series Trust. The Fund was previously advised by Hillman Capital Management, and was recognized as the Hillman Value Fund, a series of Hillman Capital Management Investment Trust. |
| (b) | Calculated using the average shares method. |
| (c) | Includes adjustments in accordance with the accounting principles generally accepted in the United States of America, and, consequently, the net asset values for financial reporting purposes and the total returns based upon those net asset values may differ from the net asset values and totals returns for shareholder transactions. |
See Notes to Financial Statements and Financial Highlights.
| Annual Report | September 30, 2024 | 9 |
| Hillman Value Fund | Financial Highlights |
For a Share Outstanding Throughout the Periods Presented
| (d) | Assumes an initial investment on the business day before the first day of the fiscal period, with all dividends and distributions reinvested in additional shares on the reinvestment date, and redemption at the net asset value calculated on the last business day of the fiscal period. Total returns are for the period indicated and have not been annualized. Total returns would have been lower had certain expenses not been waived during the period. Returns shown do not reflect the deduction of taxes that a shareholder would pay on Fund distributions or the redemption of Fund shares. |
See Notes to Financial Statements and Financial Highlights.
| Hillman Value Fund | Notes to Financial Statements and Financial Highlights |
September 30, 2024
1. ORGANIZATION
ALPS Series Trust (the “Trust”), a Delaware statutory trust, is an open-end management investment company registered under the Investment Company Act of 1940, as amended (the “1940 Act”). The Trust consists of multiple separate portfolios or series. This annual report describes the Hillman Value Fund (the “Fund”). The Fund is diversified, and its primary investment objective is to provide long-term total return from a combination of income and capital gains. The Fund currently offers one share class. The Board of Trustees (the “Board” or “Trustees”) may establish additional funds and classes of shares at any time in the future without shareholder approval.
2. SIGNIFICANT ACCOUNTING POLICIES
The accompanying financial statements were prepared in accordance with accounting principles generally accepted in the United States of America for investment companies (“U.S. GAAP”). The Fund is considered an investment company under U.S. GAAP and follows the accounting and reporting guidance applicable to investment companies in the Financial Accounting Standards Board (“FASB”) Accounting Standards Codification Topic 946 Financial Services - Investment Companies. The preparation of financial statements in conformity with U.S. GAAP requires management to make certain estimates and assumptions that affect the reported amounts of assets and liabilities and disclosures of contingent assets and liabilities at the date of the financial statements and the reported amounts of increases and decreases in net assets from operations during the period. Actual results could differ from those estimates. The following is a summary of significant accounting policies consistently followed by the Fund in preparation of its financial statements.
Investment Valuation: The Fund generally values its securities based on market prices determined at the close of regular trading on the New York Stock Exchange (“NYSE”), normally 4:00 p.m. Eastern Time, on each day the NYSE is open for trading.
For equity securities, real estate investment trusts, limited partnerships and mutual funds that are traded on an exchange, the market price is usually the closing sale or official closing price on that exchange. In the case of equity securities and real estate investment trusts not traded on an exchange, or if such closing prices are not otherwise available, the securities are valued at the mean of the most recent bid and ask prices on such day.
Options are valued at the National Best Bid and Offer (“NBBO”) last trade as of the valuation time. Options will be valued on the basis of prices provided by pricing services when such prices are reasonably believed to reflect the market value of such options and may include the use of composite or NBBO pricing information provided by the pricing services.
Redeemable securities issued by open-end registered investment companies are valued at the investment company’s applicable net asset value (“NAV”). Money market funds, representing short-term investments, are valued at their NAV.
When such prices or quotations are not available, or when the valuation designee appointed by the Board believes that they are unreliable, securities may be priced using fair value procedures approved by the Board.
| Annual Report | September 30, 2024 | 11 |
| Hillman Value Fund | Notes to Financial Statements and Financial Highlights |
September 30, 2024
Fair Value Measurements: The Fund discloses the classification of its fair value measurements following a three-tier hierarchy based on the inputs used to measure fair value. Inputs refer broadly to the assumptions that market participants would use in pricing the asset or liability, including assumptions about risk. Inputs may be observable or unobservable. Observable inputs reflect the assumptions market participants would use in pricing the asset or liability that are developed based on market data obtained from sources independent of the reporting entity. Unobservable inputs reflect the reporting entity’s own assumptions about the assumptions market participants would use in pricing the asset or liability that are developed based on the best information available.
Various inputs are used in determining the value of the Fund’s investments as of the end of the reporting period. When inputs used fall into different levels of the fair value hierarchy, the level in the hierarchy within which the fair value measurement falls is determined based on the lowest level input that is significant to the fair value measurement in its entirety. The designated input levels are not necessarily an indication of the risk or liquidity associated with these investments. These inputs are categorized in the following hierarchy under applicable financial accounting standards:
| Level 1 – | Unadjusted quoted prices in active markets for identical investments, unrestricted assets or liabilities that the Fund has the ability to access at the measurement date; |
| Level 2 – | Quoted prices which are not active, quoted prices for similar assets or liabilities in active markets or inputs other than quoted prices that are observable (either directly or indirectly); and |
| Level 3 – | Significant unobservable prices or inputs (including the Fund’s own assumptions in determining the fair value of investments) where there is little or no market activity for the asset or liability at the measurement date. |
| Hillman Value Fund | Notes to Financial Statements and Financial Highlights |
September 30, 2024
The following is a summary of the inputs used to value the Fund’s investments as of September 30, 2024:
HILLMAN VALUE FUND
| | | | | | Level 2 - Other | | | Level 3 - | | | | |
| | | Level 1 - | | | Significant | | | Significant | | | | |
| | | Unadjusted | | | Observable | | | Unobservable | | | | |
| Investments in Securities at Value | | Quoted Prices | | | Inputs | | | Inputs | | | Total | |
| Common Stock | | | | | | | | | | | | | | | | |
| Communication Services | | $ | 37,773,113 | | | $ | – | | | $ | – | | | $ | 37,773,113 | |
| Consumer Discretionary | | | 24,737,365 | | | | – | | | | – | | | | 24,737,365 | |
| Consumer Staples | | | 30,427,168 | | | | – | | | | – | | | | 30,427,168 | |
| Financials | | | 23,373,738 | | | | – | | | | – | | | | 23,373,738 | |
| Health Care | | | 47,203,717 | | | | – | | | | – | | | | 47,203,717 | |
| Industrials | | | 10,875,038 | | | | – | | | | – | | | | 10,875,038 | |
| Information Technology | | | 21,144,464 | | | | – | | | | – | | | | 21,144,464 | |
| Materials | | | 19,512,452 | | | | – | | | | – | | | | 19,512,452 | |
| Real Estate Investment Trust | | | | | | | | | | | | | | | | |
| Real Estate | | | 6,118,524 | | | | – | | | | – | | | | 6,118,524 | |
| Total | | $ | 221,165,579 | | | $ | – | | | $ | – | | | $ | 221,165,579 | |
| | | Valuation Inputs | | | | |
| Other Financial Instruments | | Level 1 | | | Level 2 | | | Level 3 | | | Total | |
| Liabilities | | | | | | | | | | | | |
| Written Option Contracts | | $ | (89,820 | ) | | $ | – | | | $ | – | | | $ | (89,820 | ) |
| Total | | $ | (89,820 | ) | | $ | – | | | $ | – | | | $ | (89,820 | ) |
The Fund did not hold any level 3 securities during the year ended September 30, 2024.
Cash & Cash Equivalents: The Fund considers its investment in a Federal Deposit Insurance Corporation ("FDIC") insured interest bearing account to be cash and cash equivalents. Cash and cash equivalents are valued at cost plus any accrued interest. The Fund maintains cash balances, which, at times may exceed federally insured limits. The Fund maintains these balances with a high-quality financial institution.
Concentration of Credit Risk: The Fund places its cash with a banking institution, which is insured by FDIC. The FDIC limit is $250,000. At various times throughout the year, the amount on deposit may exceed the FDIC limit and subject the Fund to a credit risk. The Fund does not believe that such deposits are subject to any unusual risk associated with investment activities.
Trust Expenses: Some expenses of the Trust can be directly attributed to a fund. Expenses that cannot be directly attributed to a fund are apportioned among all funds in the Trust based on average net assets of each fund, including Trustees’ fees and expenses.
| Annual Report | September 30, 2024 | 13 |
| Hillman Value Fund | Notes to Financial Statements and Financial Highlights |
September 30, 2024
Federal Income Taxes: The Fund complies with the requirements under Subchapter M of the Internal Revenue Code of 1986, as amended, applicable to regulated investment companies and intends to distribute substantially all of its net taxable income and net capital gains, if any, each year so that it will not be subject to excise tax on undistributed income and gains. The Fund is not subject to income taxes to the extent such distributions are made.
As of and during the year ended September 30, 2024, the Fund did not have a liability for any unrecognized tax benefits in the accompanying financial statements. The Fund recognizes interest and penalties, if any, related to tax liabilities as income tax expense in the Statement of Operations. The Fund files U.S. federal, state and local income tax returns as required. The Fund’s tax returns are subject to examination by the relevant tax authorities until expiration of the applicable statute of limitations, which is generally three years after the filing of the tax return for federal purposes and four years for most state returns. The Fund’s administrator has analyzed the Fund’s tax positions taken on federal and state income tax returns for all open tax years and has concluded that as of September 30, 2024, no provision for income tax is required in the Fund’s financial statements related to these tax positions.
Investment Transactions and Investment Income: Investment transactions are accounted for on the date the investments are purchased or sold (trade date basis for financial reporting purposes). Realized gains and losses from investment transactions are reported on a first in first out basis. Interest income, which includes accretion of discounts and amortization of premiums, is accrued and recorded as earned using the effective yield method. Dividend income is recognized on the ex-dividend date, or for certain foreign securities, as soon as information is available to the Fund. Withholding taxes on foreign dividends are paid (a portion of which may be reclaimable) or provided for in accordance with the applicable country’s tax rules and rates and are disclosed in the Statement of Operations.
Distributions to Shareholders: The Fund normally pays dividends, if any, and distributes capital gains, if any, on an annual basis. Income dividend distributions are derived from interest, dividends and other income the Fund receives from their investments, including short-term capital gains. Long-term capital gain distributions are derived from gains realized when the Fund sells a security it has owned for more than one year. The Fund may make additional distributions and dividends at other times if its portfolio manager or managers believe doing so may be necessary for the Fund to avoid or reduce taxes. Net investment income/(loss) and net realized gain/(loss) may differ for financial statement and tax purposes.
3. DERIVATIVE INSTRUMENTS
The Fund may invest in derivative financial instruments (derivatives) in order to manage risk or gain exposure to various other investments or markets. Derivatives may contain various risks including the potential inability of the counterparty to fulfill their obligations under the terms of the contract, the potential for an illiquid secondary market, and the potential for market movements which may expose the Fund to gains or losses in excess of the amounts shown on the Statement of Assets and Liabilities.
| Hillman Value Fund | Notes to Financial Statements and Financial Highlights |
September 30, 2024
Risk of Investing in Derivatives: The Fund's use of derivatives can result in losses due to unanticipated changes in the market risk factors and the overall market. In instances where the Fund is using derivatives to decrease, or hedge, exposures to market risk factors for securities held by the Fund, there are also risks that those derivatives may not perform as expected resulting in losses for the combined or hedged positions.
Derivatives may have little or no initial cash investment relative to their market value exposure and therefore can produce significant gains or losses in excess of their cost. This use of embedded leverage allows the Fund to increase its market value exposure relative to its net assets and can substantially increase the volatility of the Fund's performance.
Additional associated risks from investing in derivatives also exist and potentially could have significant effects on the valuation of the derivative and the Fund. Typically, the associated risks are not the risks that the Fund are attempting to increase or decrease exposure to, per its investment objectives, but are the additional risks from investing in derivatives.
Examples of these associated risks are liquidity risk, which is the risk that the Fund will not be able to sell or close out the derivative in a timely manner, and counterparty credit risk, which is the risk that the counterparty will not fulfill its obligation to the Fund. In addition, use of derivatives may increase or decrease exposure to the following risk factors:
Equity Risk: Equity risk relates to the change in value of equity securities as they relate to increases or decreases in the general market. Associated risks can be different for each type of derivative.
Option Contracts: The Fund may enter into options transactions for hedging purposes and for non-hedging purposes such as seeking to enhance return. The Fund may write covered put and call options on any stocks or stock indices, currencies traded on domestic and foreign securities exchanges, or futures contracts on stock indices, interest rates and currencies traded on domestic and, to the extent permitted by the U.S. Commodity Futures Trading Commission, foreign exchanges. A call option on an asset written by a Fund obligates the Fund to sell the specified asset to the holder (purchaser) at a stated price (the exercise price) if the option is exercised before a specified date (the expiration date). A put option on an asset written by a Fund obligates the Fund to buy the specified asset from the purchaser at the exercise price if the option is exercised before the expiration date. Premiums received when writing options are recorded as liabilities and are subsequently adjusted to the current value of the options written. Premiums received from writing options that expire are treated as realized gains. Premiums received from writing options, which are either exercised or closed, are offset against the proceeds received or amount paid on the transaction to determine realized gains or losses.
Purchased Options: When the Fund purchases an option, an amount equal to the premium paid by the Fund is recorded as an investment and is subsequently adjusted to the current value of the option purchased. If an option expires on the stipulated expiration date or if the Fund enters into a closing sale transaction, a gain or loss is realized. If a call option is exercised, the cost of the security acquired is increased by the premium paid for the call. If a put option is exercised, a gain or loss is realized from the sale of the underlying security, and the proceeds from such sale are decreased by the premium originally paid. Purchased options are non-income producing securities.
| Annual Report | September 30, 2024 | 15 |
| Hillman Value Fund | Notes to Financial Statements and Financial Highlights |
September 30, 2024
Written Options: When the Fund writes an option, an amount equal to the premium received by the Fund is recorded as a liability and is subsequently adjusted to the current value of the option written. Premiums received from writing options that expire unexercised are treated by the Fund on the expiration date as realized gain from written options. The difference between the premium and the amount paid on effecting a closing purchase transaction, including brokerage commissions, is also treated as a realized gain, or if the premium is less than the amount paid for the closing purchase transaction, as a realized loss. If a call option is exercised, the premium is added to the proceeds from the sale of the underlying security in determining whether the Fund has realized a gain or loss. If a put option is exercised, the premium reduces the cost basis of the securities purchased by the Fund. The Fund, as a writer of an option, bears the market risk of an unfavorable change in the price of the security underlying the written option.
The average notional amount of the written options held for the year ended September 30, 2024, was $5,384,936. These are written equity options which have an element of equity security risk.
Derivative Instruments: The following tables disclose the amounts related to the Fund's use of derivative instruments.
The effect of derivative instruments on the Statement of Assets and Liabilities for the year ended September 30, 2024:
| Risk Exposure | | Statement of Assets and Liabilities Location | | Fair Value of Asset Derivatives | | | Statement of Assets and Liabilities Location | | Fair Value of Liability Derivatives | |
| Hillman Value Fund | | | | | | | | | | | | |
Equity Contracts
(Written Options) | | Investments, at value | | $ | – | | | Written options, at value | | $ | 89,820 | |
| | | | | $ | – | | | | | $ | 89,820 | |
| Hillman Value Fund | Notes to Financial Statements and Financial Highlights |
September 30, 2024
The effect of derivative instruments on the Statement of Operations for the year ended September 30, 2024:
Risk Exposure | | Statement of Operations Location | | | Realized Gain/(Loss) on Derivatives Recognized in Income | | | | Change in Unrealized Gain/(Loss) on Derivatives Recognized in Income | |
Equity Contracts
(Written Options) | | Net realized gain/(loss) on written option contracts/Net change in unrealized appreciation/ (depreciation) on written option contracts | | $ | 874,158 | | | $ | 302,432 | |
| Total | | | | $ | 874,158 | | | $ | 302,432 | |
4. TAX BASIS INFORMATION
Tax Basis of Distributions to Shareholders: The character of distributions made during the period from net investment income or net realized gains may differ from its ultimate characterization for federal income tax purposes. Also, due to the timing of dividend distributions, the fiscal year in which amounts are distributed may differ from the fiscal year in which the income or realized gain were recorded by the Fund. The amounts and characteristics of tax basis distributions are estimated at the time of distribution and composition of distributable earnings/(accumulated losses) are finalized at fiscal year-end.
The tax character of distributions paid during the fiscal year ended September 30, 2024, were as follows:
| | | | Ordinary Income | | | Long-Term Capital Gains | |
| Hillman Value Fund | | | $ | 4,818,177 | | | $ | 2,201,640 | |
The tax character of distributions paid during the fiscal year ended September 30, 2023, were as follows:
| | | | Ordinary Income | | | Long-Term Capital Gains | |
| Hillman Value Fund | | | $ | 8,033,592 | | | $ | 12,819,189 | |
| Annual Report | September 30, 2024 | 17 |
| Hillman Value Fund | Notes to Financial Statements and Financial Highlights |
September 30, 2024
Unrealized Appreciation and Depreciation on Investments: As of September 30, 2024, the aggregate costs of investments, gross unrealized appreciation/(depreciation) and net unrealized depreciation for Federal tax purposes were as follows:
| | | Hillman Value Fund | |
| Gross unrealized appreciation (excess of value over tax cost) | | $ | 28,062,237 | |
| Gross unrealized depreciation (excess of tax cost over value) | | | (21,074,672 | ) |
| Net appreciation (depreciation) of foreign currency and derivatives | | | (3,394 | ) |
| Net unrealized appreciation | | $ | 6,984,171 | |
| Cost of investments for income tax purposes | | $ | 214,173,875 | |
These temporary differences between book and tax basis unrealized are primarily attributable to wash sales.
Reclassifications: As of September 30, 2024, permanent differences in book and tax accounting were reclassified. The following reclassifications, which had no impact on results of operations or net assets, were recorded to reflect tax character:
| | | Paid-in Capital | | | Total Distributable Earnings | |
| Hillman Value Fund | | $ | 622 | | | $ | (622 | ) |
Components of Distributable Earnings: At September 30, 2024, components of distributable earnings on a tax basis were as follows:
| | | Hillman Value Fund | |
| Undistributed ordinary income | | $ | 6,618,789 | |
| Accumulated capital gains | | | 18,974,180 | |
| Net unrealized appreciation | | | 6,984,171 | |
| Total | | $ | 32,577,140 | |
5. SECURITIES TRANSACTIONS
Purchases and sales of securities, excluding short-term securities, during the year ended September 30, 2024, were as follows:
| | | Purchases of Securities | | | Proceeds from Sales of Securities | |
| Hillman Value Fund | | $ | 77,009,349 | | | $ | 98,420,331 | |
| Hillman Value Fund | Notes to Financial Statements and Financial Highlights |
September 30, 2024
6. BENEFICIAL SHARE TRANSACTIONS
The capitalization of the Trust consists of an unlimited number of shares of beneficial interest with no par value per share. Holders of the shares of the Fund have one vote for each share held and a proportionate fraction of a vote for each fractional share. All shares issued and outstanding are fully paid and are transferable and redeemable at the option of the shareholder. Shares have no pre-emptive rights. Neither the Fund nor any of its creditors has the right to require shareholders to pay any additional amounts solely because the shareholder owns the shares.
Transactions in common shares were as follows:
| | | For the Year Ended September 30, 2024 | | | For the Year Ended September 30, 2023 | |
Hillman Value Fund | | | | | | |
| Shares sold | | 1,235,253 | | | 1,698,366 | |
| Shares issued in reinvestment of distributions to shareholders | | 210,880 | | | 785,569 | |
| Shares redeemed | | (2,138,944 | ) | | (1,884,434 | ) |
| Net increase/(decrease) in shares outstanding | | (692,811 | ) | | 599,501 | |
Control is defined by the 1940 Act as the beneficial ownership, either directly or through one or more controlled companies, of more than 25% of the voting securities of a company. As of September 30, 2024, approximately 85% of the outstanding shares of the Fund were owned by two omnibus accounts.
7. MANAGEMENT AND RELATED PARTY TRANSACTIONS
Investment Advisory: Hillman Capital Management, Inc. (the “Adviser”), subject to the authority of the Board, is responsible for the overall management and administration of the Fund's business affairs. The Adviser manages the investments of the Fund in accordance with the Fund’s investment objective, policies and limitations, and investment guidelines established jointly by the Adviser and the Board.
Pursuant to the Investment Advisory Agreement (the “Advisory Agreement”) with the Adviser, the Fund pays the Adviser an annual management fee based on the Fund’s average daily net assets. Effective February 1, 2024, the Fund's management fee was reduced to 0.70%. Prior to February 1, 2024, the management fee was 0.85%. The management fees are paid on a monthly basis. The Board may extend the Advisory Agreements for successive one year terms. The Board and shareholders of the Fund may terminate the Advisory Agreement upon 60 days’ written notice. The Adviser may terminate the Advisory Agreement upon 120 days’ written notice.
| Annual Report | September 30, 2024 | 19 |
| Hillman Value Fund | Notes to Financial Statements and Financial Highlights |
September 30, 2024
Pursuant to a fee waiver letter agreement (the “Fee Waiver Agreement”), the Adviser has contractually agreed to limit the Total Annual Fund Operating Expenses of the Fund (exclusive of (i) any front-end or contingent deferred loads; (ii) brokerage fees and commissions, (iii) acquired fund fees and expenses; (iv) fees and expenses associated with investments in other collective investment vehicles or derivative instruments (including for example option and swap fees and expenses); (v) borrowing costs (such as interest and dividend expense on securities sold short); (vi) taxes; and (vii) extraordinary expenses, such as litigation expenses (which may include indemnification of Fund officers and Trustees and contractual indemnification of Fund service providers (other than the Adviser))), to 0.95% of the Fund’s average daily net assets for the Fund’s No Load Class. The Fee Waiver Agreement is in effect through January 31, 2025, and will automatically continue upon annual approval by the Board for successive twelve-month periods unless (i) it is terminated earlier by the Board, or (ii) the Adviser provides at least 30 days written notice of its non-continuance prior to the end of the then effective term. Except due to the Adviser’s notice of non-renewal, this Agreement may only be amended or terminated with the approval of the Board of Trustees. Fees waived or reimbursed for the year ended September 30, 2024, are disclosed in the Statement of Operations. Previously waived fees are not subject to recoupment by the Adviser.
Administrator: ALPS Fund Services, Inc. (“ALPS”) (an affiliate of ALPS Distributors, Inc.) serves as administrator to the Fund. The Fund has agreed to pay expenses incurred in connection with its administrative activities. Pursuant to the Services Agreement with the Trust, ALPS will provide operational services to the Fund including, but not limited to, fund accounting and fund administration, and will generally assist in the Fund’s operations. The Fund’s administration fee is accrued on a daily basis and paid monthly. The officers of the Trust are employees of ALPS. Administration fees paid by the Fund for the year ended September 30, 2024, are disclosed in the Statement of Operations. ALPS is reimbursed by the Fund for certain out of pocket expenses.
Transfer Agent: ALPS serves as transfer agent for the Fund under a Transfer Agency and Services Agreement with the Trust. Under this agreement, ALPS is paid an annual fee for services performed on behalf of the Fund plus fees for open accounts and is reimbursed for certain out-of-pocket expenses.
Compliance Services: ALPS provides Chief Compliance Officer services to the Fund to monitor and test the policies and procedures of the Fund in conjunction with requirements under Rule 38a-1 of the 1940 Act pursuant to a Chief Compliance Officer Services Agreement with the Trust. Under this agreement, ALPS is paid an annual fee for services performed on behalf of the Fund and is reimbursed for certain out-of-pocket expenses.
Distribution: ALPS Distributors, Inc. (the “Distributor”) (an affiliate of ALPS) acts as the principal underwriter of the Fund’s shares pursuant to a Distribution Agreement with the Trust. Shares of the Fund are offered on a continuous basis through the Distributor, as agent of the Fund. The Distributor is not obligated to sell any particular amount of shares of the Fund and is not entitled to any compensation for its services as the Fund’s principal underwriter pursuant to the Distribution Agreement.
| Hillman Value Fund | Notes to Financial Statements and Financial Highlights |
September 30, 2024
8. TRUSTEES AND OFFICERS
As of September 30, 2024, there were four Trustees, each of whom are not “interested persons” (as defined in the 1940 Act) of the Trust (the “Independent Trustees”). The Independent Trustees of the Trust and, if any, Interested Trustees who are not currently employed by the Adviser, ALPS or other service providers will receive a quarterly retainer of $16,250, plus $5,000 for each regular Board or Committee meeting attended and $2,000 for each special telephonic or in-person Board or Committee meeting attended. Additionally, the Audit Committee Chair receives a quarterly retainer of $1,875 and the Independent Chair receives a quarterly retainer of $4,250. These fees are allocated proportionately among the multiple portfolios/series of the Trust. The Independent Trustees and, if any, Interested Trustees who are not currently employed by the Adviser, ALPS or other service providers are also reimbursed for all reasonable out-of-pocket expenses relating to attendance at meetings.
Officers of the Trust receive no salary or fees from the Trust. As discussed in Note 7 the Fund pays ALPS an annual fee for compliance services.
9. INDEMNIFICATIONS
Under the Trust’s organizational documents, its officers and Trustees are indemnified against certain liabilities arising out of the performance of their duties to the Trust. Additionally, in the normal course of business, the Trust enters into contracts with service providers that may contain general indemnification clauses which may permit indemnification to the extent permissible under applicable law. The Trust’s maximum exposure under these arrangements is unknown; as such exposure would involve future claims that may be made against the Trust that have not yet occurred.
10. SUBSEQUENT EVENTS
Subsequent events after the date of the Statement of Assets and Liabilities have been evaluated through the date the financial statements were issued. Management has determined that there were no subsequent events to report through the issuance of these financial statements.
| Annual Report | September 30, 2024 | 21 |
| Hillman Value Fund | Report of Independent Registered Public Accounting Firm |
To the Shareholders of Hillman Value Fund and
Board of Trustees of ALPS Series Trust
Opinion on the Financial Statements
We have audited the accompanying statement of assets and liabilities, including the schedule of investments, of Hillman Value Fund (the “Fund”), a series of ALPS Series Trust, as of September 30, 2024, the related statement of operations for the year then ended, the statements of changes in net assets for each of the two years in the period then ended, the financial highlights for each of the four years in the period then ended, and the related notes (collectively referred to as the “financial statements”). In our opinion, the financial statements present fairly, in all material respects, the financial position of the Fund as of September 30, 2024, the results of its operations for the year then ended, the changes in net assets for each of the two years in the period then ended, and the financial highlights for each of the four years in the period then ended, in conformity with accounting principles generally accepted in the United States of America.
The Fund’s financial highlights for the year ended September 30, 2020 was audited by other auditors whose report dated November 23, 2020, expressed an unqualified opinion on those financial highlights.
Basis for Opinion
These financial statements are the responsibility of the Fund’s management. Our responsibility is to express an opinion on the Fund’s financial statements based on our audits. We are a public accounting firm registered with the Public Company Accounting Oversight Board (United States) (“PCAOB”) and are required to be independent with respect to the Fund in accordance with the U.S. federal securities laws and the applicable rules and regulations of the Securities and Exchange Commission and the PCAOB.
We conducted our audits in accordance with the standards of the PCAOB. Those standards require that we plan and perform the audit to obtain reasonable assurance about whether the financial statements are free of material misstatement whether due to error or fraud.
Our audits included performing procedures to assess the risks of material misstatement of the financial statements, whether due to error or fraud, and performing procedures that respond to those risks. Such procedures included examining, on a test basis, evidence regarding the amounts and disclosures in the financial statements. Our procedures included confirmation of securities owned as of September 30, 2024, by correspondence with the custodian and broker. Our audits also included evaluating the accounting principles used and significant estimates made by management, as well as evaluating the overall presentation of the financial statements. We believe that our audits provide a reasonable basis for our opinion.
We have served as the Fund’s auditor since 2021.
COHEN & COMPANY, LTD.
Cleveland, Ohio
November 27, 2024
| Hillman Value Fund | Tax Designations |
September 30, 2024 (Unaudited)
Qualified Dividend Income
The percentage of ordinary income dividends distributed during the calendar year ended December 31, 2023 are designated as qualified dividend income (QDI) as defined in Section 1(h)(11) of the Internal Revenue Code in the following percentages:
| | Amount |
| Hillman Value Fund | 100.00% |
Dividends Received Deduction
For corporate shareholders, the following ordinary dividends paid during the calendar year ended December 31, 2023 qualify for the corporate dividends received deduction:
| | Amount |
| Hillman Value Fund | 100.00% |
Pursuant to Section 852(b)(3) of the Internal Revenue Code the following Funds designate the amounts listed below as long-term capital gain dividends:
| | Amount |
| Hillman Value Fund | $12,819,189 |
| Annual Report | September 30, 2024 | 23 |
Hillman Value Fund
is a series of the
ALPS Series Trust
For Shareholder Service Inquiries:
Hillman Value Fund
c/o ALPS Funds
P.O. Box 1920
Denver, CO 80201
Telephone
1-855-400-5944

Hillman Value Fund distributed by ALPS Distributors, Inc.
Must be accompanied or preceded by a prospectus.

Table of Contents
| Portfolios of Investments | |
| Seven Canyons Strategic Global Fund | 1 |
| Seven Canyons World Innovators Fund | 6 |
| Statements of Assets and Liabilities | 11 |
| Statements of Operations | 13 |
| Statements of Changes in Net Assets | |
| Seven Canyons Strategic Global Fund | 15 |
| Seven Canyons World Innovators Fund | 16 |
| Financial Highlights | |
| Seven Canyons Strategic Global Fund – Investor Class | 18 |
| Seven Canyons World Innovators Fund – Investor Class | 20 |
| Seven Canyons World Innovators Fund – Institutional Class | 22 |
| Notes to Financial Statements and Financial Highlights | 24 |
| Report of Independent Registered Public Accounting Firm | 38 |
| Tax Designations | 39 |
| Seven Canyons Strategic Global Fund | Portfolio of Investments |
September 30, 2024
| | | Shares | | | Value (Note 2) | |
| COMMON STOCKS (91.31%) | | | | | | | | |
| Agricultural Chemicals (4.23%) | | | | | | | | |
| ReposiTrack, Inc. | | | 32,600 | | | $ | 602,122 | |
| | | | | | | | | |
| Agricultural Products & Services (1.92%) | | | | | | | | |
| Winfarm SAS(a) | | | 53,800 | | | | 272,489 | |
| | | | | | | | | |
| Alternative Carriers (1.06%) | | | | | | | | |
| KINX, Inc. | | | 2,627 | | | | 151,469 | |
| | | | | | | | | |
| Application Software (4.95%) | | | | | | | | |
| 91APP, Inc. | | | 35,000 | | | | 97,104 | |
| AGMO HOLDINGS BHD(a) | | | 2,484 | | | | 343 | |
| Hyundai Ezwel Co., Ltd. | | | 37,000 | | | | 150,524 | |
| P E Analytics Ltd(a) | | | 13,200 | | | | 43,640 | |
| RS Software India, Ltd. | | | 17,780 | | | | 55,090 | |
| Sidetrade | | | 302 | | | | 75,302 | |
| SmartCraft ASA(a) | | | 92,639 | | | | 281,790 | |
| Total Application Software | | | | | | | 703,793 | |
| | | | | | | | | |
| Asset Management & Custody Banks (1.10%) | | | | | | | | |
| JTC PLC(b)(c)(d) | | | 11,100 | | | | 157,009 | |
| | | | | | | | | |
| Automotive Parts & Equipment (0.22%) | | | | | | | | |
| hGears AG(a) | | | 11,476 | | | | 31,042 | |
| | | | | | | | | |
| Commercial & Residential Mortgage Finance (1.80%) | | | | | | | | |
| Aavas Financiers, Ltd.(a) | | | 11,800 | | | | 255,773 | |
| | | | | | | | | |
| Data Processing & Outsourced Services (0.98%) | | | | | | | | |
| Datamatics Global Services, Ltd. | | | 19,132 | | | | 139,093 | |
| | | | | | | | | |
| Distributors (0.96%) | | | | | | | | |
| Inter Cars SA | | | 584 | | | | 78,291 | |
| Sirca Paints India, Ltd.(b)(c)(d) | | | 14,514 | | | | 58,428 | |
| Total Distributors | | | | | | | 136,719 | |
| | | | | | | | | |
| Drug Retail (0.74%) | | | | | | | | |
| Corporativo Fragua SAB de CV | | | 2,299 | | | | 105,084 | |
| | | | | | | | | |
| Electrical Components & Equipment (1.95%) | | | | | | | | |
| Arcure SA(a) | | | 49,733 | | | | 276,802 | |
See Notes to Financial Statements and Financial Highlights.
| Annual Report | September 30, 2024 | 1 |
| Seven Canyons Strategic Global Fund | Portfolio of Investments |
September 30, 2024
| | | Shares | | | Value (Note 2) | |
| Electronic Components (0.29%) | | | | | | | | |
| Segyung Hitech Co., Ltd. | | | 9,300 | | | $ | 41,817 | |
| | | | | | | | | |
| Electronic Equipment & Instruments (8.43%) | | | | | | | | |
| Blackline Safety Corp.(a) | | | 137,100 | | | | 566,667 | |
| GL Sciences, Inc. | | | 12,500 | | | | 239,955 | |
| Next Vision Stabilized Systems, Ltd. | | | 22,506 | | | | 238,468 | |
| Suprema, Inc.(a) | | | 8,100 | | | | 155,162 | |
| Total Electronic Equipment & Instruments | | | | | | | 1,200,252 | |
| | | | | | | | | |
| Electronic Manufacturing Services (1.26%) | | | | | | | | |
| Hanza AB | | | 33,800 | | | | 178,554 | |
| | | | | | | | | |
| Environmental & Facilities Services (1.66%) | | | | | | | | |
| Water Intelligence PLC(a) | | | 44,700 | | | | 236,059 | |
| | | | | | | | | |
| Food Distributors (3.82%) | | | | | | | | |
| Kitwave Group PLC | | | 116,205 | | | | 543,762 | |
| | | | | | | | | |
| Food Retail (2.20%) | | | | | | | | |
| Midi Utama Indonesia Tbk PT | | | 9,871,100 | | | | 312,954 | |
| | | | | | | | | |
| Health Care Technology (0.20%) | | | | | | | | |
| Reliq Health Technologies, Inc.(a)(e)(f) | | | 915,996 | | | | 29,123 | |
| | | | | | | | | |
| Home Improvement Retail (1.81%) | | | | | | | | |
| Victorian Plumbing Group PLC | | | 187,400 | | | | 258,061 | |
| | | | | | | | | |
| Industrial Machinery & Supplies & Components (1.30%) | | | | | | | | |
| XRF Scientific, Ltd. | | | 159,595 | | | | 185,364 | |
| | | | | | | | | |
| Investment Banking & Brokerage (13.15%) | | | | | | | | |
| flatexDEGIRO AG | | | 62,813 | | | | 898,827 | |
| JDC Group AG(a) | | | 24,400 | | | | 635,565 | |
| M&A Research Institute Holdings, Inc.(a) | | | 16,200 | | | | 336,455 | |
| Total Investment Banking & Brokerage | | | | | | | 1,870,847 | |
| | | | | | | | | |
| IT Consulting & Other Services (5.77%) | | | | | | | | |
| Allied Digital Services, Ltd. | | | 54,500 | | | | 175,594 | |
| Converge Technology Solutions Corp. | | | 20,600 | | | | 70,370 | |
| Spyrosoft SA(a) | | | 1,900 | | | | 193,505 | |
| System Support, Inc. | | | 28,100 | | | | 382,226 | |
| Total IT Consulting & Other Services | | | | | | | 821,695 | |
See Notes to Financial Statements and Financial Highlights.
| 2 | www.sevencanyonsadvisors.com |
| Seven Canyons Strategic Global Fund | Portfolio of Investments |
September 30, 2024
| | | Shares | | | Value (Note 2) | |
| Metal, Glass & Plastic Containers (1.65%) | | | | | | | | |
| Time Technoplast, Ltd. | | | 50,400 | | | $ | 235,337 | |
| | | | | | | | | |
| Packaged Foods & Meats (2.95%) | | | | | | | | |
| Ifuji Sangyo Co., Ltd. | | | 23,200 | | | | 233,412 | |
| LT Foods, Ltd. | | | 39,100 | | | | 185,956 | |
| Total Packaged Foods & Meats | | | | | | | 419,368 | |
| | | | | | | | | |
| Passenger Airlines (1.05%) | | | | | | | | |
| Controladora Vuela Cia de Aviacion SAB de CV, ADR(a) | | | 23,600 | | | | 149,388 | |
| | | | | | | | | |
| Pharmaceuticals (2.64%) | | | | | | | | |
| Beta Drugs, Ltd.(a)(b)(d) | | | 7,100 | | | | 135,893 | |
| Genomma Lab Internacional SAB de CV(c) | | | 208,932 | | | | 240,341 | |
| Total Pharmaceuticals | | | | | | | 376,234 | |
| | | | | | | | | |
| Research & Consulting Services (6.13%) | | | | | | | | |
| Elixirr International PLC | | | 69,700 | | | | 587,069 | |
| Intloop, Inc.(a) | | | 7,800 | | | | 284,919 | |
| Total Research & Consulting Services | | | | | | | 871,988 | |
| | | | | | | | | |
| Semiconductor Materials & Equipment (3.84%) | | | | | | | | |
| FNS Tech Co., Ltd. | | | 24,000 | | | | 194,540 | |
| Gudeng Precision Industrial Co., Ltd. | | | 7,400 | | | | 132,116 | |
| Qualitau, Ltd. | | | 4,600 | | | | 220,134 | |
| Total Semiconductor Materials & Equipment | | | | | | | 546,790 | |
| | | | | | | | | |
| Semiconductors (2.63%) | | | | | | | | |
| EnSilica PLC(a) | | | 287,155 | | | | 213,071 | |
| QuickLogic Corp.(a) | | | 9,700 | | | | 74,399 | |
| ZillTek Technology Corp. | | | 8,200 | | | | 87,062 | |
| Total Semiconductors | | | | | | | 374,532 | |
| | | | | | | | | |
| Specialized Finance (1.95%) | | | | | | | | |
| CSL Finance, Ltd. | | | 54,444 | | | | 278,031 | |
| | | | | | | | | |
| Specialty Chemicals (0.46%) | | | | | | | | |
| DingZing Advanced Materials, Inc. | | | 12,600 | | | | 65,097 | |
| | | | | | | | | |
| Systems Software (1.50%) | | | | | | | | |
| TECSYS, Inc. | | | 7,200 | | | | 214,012 | |
See Notes to Financial Statements and Financial Highlights.
| Annual Report | September 30, 2024 | 3 |
| Seven Canyons Strategic Global Fund | Portfolio of Investments |
September 30, 2024
| | | Shares | | | Value (Note 2) | |
| Technology Distributors (2.98%) | | | | | | | | |
| Climb Global Solutions, Inc. | | | 3,900 | | | $ | 388,206 | |
| Richardson Electronics, Ltd./United States | | | 2,855 | | | | 35,231 | |
| Total Technology Distributors | | | | | | | 423,437 | |
| | | | | | | | | |
| Technology Hardware, Storage & Peripherals (0.21%) | | | | | | | | |
| Asetek A/S(a) | | | 127,411 | | | | 29,186 | |
| | | | | | | | | |
| Trading Companies & Distributors (2.52%) | | | | | | | | |
| IPD Group, Ltd. | | | 102,000 | | | | 358,229 | |
| | | | | | | | | |
| Transaction & Payment Processing Services (1.00%) | | | | | | | | |
| CSU Digital SA | | | 44,500 | | | | 142,542 | |
| | | | | | | | | |
| TOTAL COMMON STOCKS | | | | | | | | |
| (Cost $11,072,405) | | | | | | | 12,994,054 | |
| | | | | | | | | |
| WARRANTS (0.00%) | | | | | | | | |
| Transaction & Payment Processing | | | | | | | | |
| Services (0.00%) | | | | | | | | |
| Reliq Health Technologies Warrants, Strike Price $0.52, Expires 04/05/2026(f) | | | 937,500 | | | | – | |
| TOTAL WARRANTS | | | | | | | | |
| (Cost $0) | | | | | | | – | |
| | | 7 Day Yield | | | Shares | | | Value (Note 2) | |
| SHORT-TERM INVESTMENT (6.67%) | | | | | | | | | | | | |
| | | | | | | | | | | | | |
| State Street Institutional US Government Money Market Fund, Investor Class | | | 4.879 | % | | | 948,638 | | | $ | 948,638 | |
| | | | | | | | | | | | 948,638 | |
| TOTAL SHORT-TERM INVESTMENT | | | | | | | | | | | | |
| (Cost $948,638) | | | | | | | | | | | 948,638 | |
| | | | | | | | | | | | | |
| TOTAL INVESTMENTS (97.98%) | | | | | | | | | | | | |
| (Cost $12,021,043) | | | | | | | | | | $ | 13,942,692 | |
| | | | | | | | | | | | | |
| OTHER ASSETS IN EXCESS OF LIABILITIES (2.02%) | | | | | | | | | | | 287,360 | |
| | | | | | | | | | | | | |
| NET ASSETS (100.00%) | | | | | | | | | | $ | 14,230,052 | |
| (a) | Non-income producing security. |
See Notes to Financial Statements and Financial Highlights.
| 4 | www.sevencanyonsadvisors.com |
| Seven Canyons Strategic Global Fund | Portfolio of Investments |
September 30, 2024
| (b) | Securities exempt from registration under Rule 144A of the Securities Act of 1933. These securities may be resold in transactions exempt from registration, normally to qualified institutional buyers. As of September 30, 2024 the fair value of securities restricted under Rule 144A in the aggregate was $351,330, representing 2.47% of net assets. |
| (c) | Security deemed to be restricted as of September 30, 2024. As of September 30, 2024, the fair value of restricted securities in the aggregate was $351,330, representing 2.47% of the Fund’s net assets. Additional information on restricted securities can be found in Note 8. Restricted Securities in the Notes to Financial Statements. |
| (d) | Securities were purchased pursuant to Regulation S under the Securities Act of 1933, which exempts securities offered and sold outside of the United States from registration. Such securities cannot be sold in the United States without either an effective registration statement filed pursuant to the Securities Act of 1933, or pursuant to an exemption from registration. As of September 30, 2024, the fair value of those securities was $351,330 representing 2.47% of net assets. |
| (e) | As a result of the use of significant unobservable inputs to determine fair value, these investments have been classified as Level 3 assets. Additional information on Level 3 assets can be found in Note 2. Significant Accounting Policies in the Notes to Financial Statements section. |
| (f) | Security deemed to be illiquid under the procedures utilized by the valuation designee. As of September 30, 2024, the fair value of illiquid securities in the aggregate was $29,123, representing 0.20% of the Fund's net assets. |
At September 30, 2024, Seven Canyons Strategic Global Fund's investments, excluding short-term investments, were in the following countries:
| Country | | % of Total Fair Value | |
| Australia | | | 4.2 | |
| Brazil | | | 1.1 | |
| Canada | | | 6.8 | |
| Denmark | | | 0.2 | |
| France | | | 4.8 | |
| Germany | | | 12.0 | |
| Great Britain | | | 14.1 | |
| India | | | 12.0 | |
| Indonesia | | | 2.4 | |
| Israel | | | 3.5 | |
| Japan | | | 11.4 | |
| Jersey | | | 1.2 | |
| Malaysia | | | 0.1 | |
| Mexico | | | 3.8 | |
| Norway | | | 2.2 | |
| Poland | | | 2.1 | |
| South Korea | | | 5.3 | |
| Sweden | | | 1.4 | |
| Taiwan | | | 2.9 | |
| United States | | | 8.5 | |
| | | | 100.0 | |
See Notes to Financial Statements and Financial Highlights.
| Annual Report | September 30, 2024 | 5 |
| Seven Canyons World Innovators Fund | Portfolio of Investments |
September 30, 2024
| | | Shares | | | Value (Note 2) | |
| COMMON STOCKS (95.92%) | | | | | | | | |
| Agricultural Products & Services (1.12%) | | | | | | | | |
| Winfarm SAS(a)(b) | | | 107,247 | | | $ | 543,189 | |
| | | | | | | | | |
| Alternative Carriers (1.06%) | | | | | | | | |
| KINX, Inc. | | | 8,946 | | | | 515,813 | |
| | | | | | | | | |
| Application Software (19.01%) | | | | | | | | |
| AGMO HOLDINGS BHD(b) | | | 10,350 | | | | 1,431 | |
| Beonic, Ltd.(b)(c) | | | 11,116,217 | | | | 230,555 | |
| Catapult Group International, Ltd.(b) | | | 993,170 | | | | 1,668,501 | |
| Cerillion PLC | | | 21,126 | | | | 508,400 | |
| CYND Co., Ltd.(b) | | | 104,700 | | | | 654,899 | |
| Fabasoft AG | | | 27,901 | | | | 464,318 | |
| Freee KK(b) | | | 65,200 | | | | 1,108,706 | |
| Onesoft Solutions, Inc. | | | 1,503,100 | | | | 955,796 | |
| P E Analytics Ltd(b) | | | 56,400 | | | | 186,461 | |
| RS Software India, Ltd. | | | 61,320 | | | | 189,994 | |
| Sidetrade | | | 3,605 | | | | 898,892 | |
| SmartCraft ASA(b) | | | 505,246 | | | | 1,536,859 | |
| SpiderPlus & Co.(b) | | | 257,700 | | | | 814,025 | |
| Total Application Software | | | | | | | 9,218,837 | |
| | | | | | | | | |
| Asset Management & Custody Banks (2.73%) | | | | | | | | |
| JTC PLC(d)(e)(f) | | | 20,711 | | | | 292,956 | |
| Pensionbee Group PLC(b) | | | 445,120 | | | | 1,032,506 | |
| Total Asset Management & Custody Banks | | | | | | | 1,325,462 | |
| | | | | | | | | |
| Automotive Parts & Equipment (0.31%) | | | | | | | | |
| hGears AG(b) | | | 54,970 | | | | 148,692 | |
| | | | | | | | | |
| Cargo Ground Transportation (0.00%)(g) | | | | | | | | |
| Vamos Locacao de Caminhoes Maquinas e Equipamentos SA | | | 19 | | | | 23 | |
| | | | | | | | | |
| Commercial & Residential Mortgage Finance (1.53%) | | | | | | | | |
| Aavas Financiers, Ltd.(b) | | | 34,218 | | | | 741,699 | |
| | | | | | | | | |
| Distributors (0.76%) | | | | | | | | |
| Sirca Paints India, Ltd.(d)(e)(f) | | | 91,803 | | | | 369,562 | |
| | | | | | | | | |
| Electrical Components & Equipment (2.05%) | | | | | | | | |
| Arcure SA(b) | | | 178,198 | | | | 991,807 | |
See Notes to Financial Statements and Financial Highlights.
| 6 | www.sevencanyonsadvisors.com |
| Seven Canyons World Innovators Fund | Portfolio of Investments |
September 30, 2024
| | | Shares | | | Value (Note 2) | |
| Electronic Components (0.44%) | | | | | | | | |
| Segyung Hitech Co., Ltd. | | | 47,500 | | | $ | 213,581 | |
| | | | | | | | | |
| Electronic Equipment & Instruments (8.60%) | | | | | | | | |
| Blackline Safety Corp.(b) | | | 536,500 | | | | 2,217,483 | |
| GL Sciences, Inc. | | | 42,500 | | | | 815,846 | |
| Next Vision Stabilized Systems, Ltd. | | | 84,100 | | | | 891,105 | |
| Suprema, Inc.(b) | | | 12,800 | | | | 245,194 | |
| Total Electronic Equipment & Instruments | | | | | | | 4,169,628 | |
| | | | | | | | | |
| Food Distributors (4.38%) | | | | | | | | |
| Kitwave Group PLC | | | 453,869 | | | | 2,123,804 | |
| | | | | | | | | |
| Food Retail (2.52%) | | | | | | | | |
| Midi Utama Indonesia Tbk PT | | | 38,538,400 | | | | 1,221,825 | |
| | | | | | | | | |
| Health Care Equipment (0.13%) | | | | | | | | |
| Angle PLC(b) | | | 575,000 | | | | 63,422 | |
| | | | | | | | | |
| Health Care Technology (0.58%) | | | | | | | | |
| Reliq Health Technologies, Inc.(b)(c)(h) | | | 4,073,306 | | | | 129,507 | |
| SyntheticMR AB(b) | | | 120,400 | | | | 152,340 | |
| Total Health Care Technology | | | | | | | 281,847 | |
| | | | | | | | | |
| Home Improvement Retail (2.20%) | | | | | | | | |
| Victorian Plumbing Group PLC | | | 775,500 | | | | 1,067,911 | |
| | | | | | | | | |
| Industrial Machinery & Supplies & Components (0.86%) | | | | | | | | |
| XRF Scientific, Ltd. | | | 356,576 | | | | 414,150 | |
| | | | | | | | | |
| Interactive Media & Services (1.56%) | | | | | | | | |
| Trustpilot Group PLC(b)(d)(e)(f) | | | 250,100 | | | | 755,680 | |
| | | | | | | | | |
| Investment Banking & Brokerage (16.24%) | | | | | | | | |
| flatexDEGIRO AG | | | 214,102 | | | | 3,063,707 | |
| JDC Group AG(b) | | | 140,819 | | | | 3,668,019 | |
| M&A Research Institute Holdings, Inc.(b) | | | 55,000 | | | | 1,142,285 | |
| Total Investment Banking & Brokerage | | | | | | | 7,874,011 | |
| | | | | | | | | |
| IT Consulting & Other Services (5.41%) | | | | | | | | |
| Allied Digital Services, Ltd. | | | 206,400 | | | | 665,002 | |
| Converge Technology Solutions Corp. | | | 64,800 | | | | 221,358 | |
| Spyrosoft SA(b) | | | 6,500 | | | | 661,990 | |
See Notes to Financial Statements and Financial Highlights.
| Annual Report | September 30, 2024 | 7 |
| Seven Canyons World Innovators Fund | Portfolio of Investments |
September 30, 2024
| | | Shares | | | Value (Note 2) | |
| IT Consulting & Other Services (continued) | | | | | | | | |
| System Support, Inc. | | | 79,000 | | | $ | 1,074,587 | |
| Total IT Consulting & Other Services | | | | | | | 2,622,937 | |
| | | | | | | | | |
| Metal, Glass & Plastic Containers (2.20%) | | | | | | | | |
| Time Technoplast, Ltd. | | | 228,800 | | | | 1,068,354 | |
| | | | | | | | | |
| Packaged Foods & Meats (3.98%) | | | | | | | | |
| Ifuji Sangyo Co., Ltd. | | | 88,000 | | | | 885,357 | |
| LT Foods, Ltd. | | | 148,200 | | | | 704,824 | |
| Manorama Industries, Ltd. | | | 34,095 | | | | 337,751 | |
| Total Packaged Foods & Meats | | | | | | | 1,927,932 | |
| | | | | | | | | |
| Pharmaceuticals (2.40%) | | | | | | | | |
| Beta Drugs, Ltd.(b)(d)(e)(f) | | | 17,200 | | | | 329,207 | |
| Genomma Lab Internacional SAB de CV | | | 723,132 | | | | 831,840 | |
| Total Pharmaceuticals | | | | | | | 1,161,047 | |
| | | | | | | | | |
| Real Estate Operating Companies (0.83%) | | | | | | | | |
| Arealink Co., Ltd. | | | 34,000 | | | | 402,393 | |
| | | | | | | | | |
| Research & Consulting Services (5.38%) | | | | | | | | |
| Elixirr International PLC | | | 215,800 | | | | 1,817,640 | |
| Intloop, Inc.(b) | | | 21,600 | | | | 789,007 | |
| Total Research & Consulting Services | | | | | | | 2,606,647 | |
| | | | | | | | | |
| Semiconductor Materials & Equipment (2.23%) | | | | | | | | |
| FNS Tech Co., Ltd. | | | 59,000 | | | | 478,244 | |
| Gudeng Precision Industrial Co., Ltd. | | | 33,700 | | | | 601,662 | |
| Total Semiconductor Materials & Equipment | | | | | | | 1,079,906 | |
| | | | | | | | | |
| Semiconductors (1.73%) | | | | | | | | |
| EnSilica PLC(b) | | | 684,647 | | | | 508,014 | |
| ZillTek Technology Corp. | | | 31,100 | | | | 330,197 | |
| Total Semiconductors | | | | | | | 838,211 | |
| | | | | | | | | |
| Specialized Finance (1.62%) | | | | | | | | |
| CSL Finance, Ltd. | | | 154,200 | | | | 787,457 | |
| | | | | | | | | |
| Specialty Chemicals (0.46%) | | | | | | | | |
| DingZing Advanced Materials, Inc. | | | 43,000 | | | | 222,157 | |
See Notes to Financial Statements and Financial Highlights.
| 8 | www.sevencanyonsadvisors.com |
| Seven Canyons World Innovators Fund | Portfolio of Investments |
September 30, 2024
| | | Shares | | | Value (Note 2) | |
| Systems Software (1.20%) | | | | | | | | |
| TECSYS, Inc. | | | 19,500 | | | $ | 579,615 | |
| | | | | | | | | |
| Technology Hardware, Storage & Peripherals (0.15%) | | | | | | | | |
| Asetek A/S(b) | | | 318,193 | | | | 72,890 | |
| | | | | | | | | |
| Trading Companies & Distributors (1.50%) | | | | | | | | |
| IPD Group, Ltd. | | | 207,600 | | | | 729,101 | |
| | | | | | | | | |
| Transaction & Payment Processing Services (0.75%) | | | | | | | | |
| CSU Digital SA | | | 114,100 | | | | 365,484 | |
| | | | | | | | | |
| TOTAL COMMON STOCKS | | | | | | | | |
| (Cost $41,184,684) | | | | | | | 46,505,074 | |
| | | | | | | | | |
| WARRANTS (0.00%)(g) | | | | | | | | |
| Transaction & Payment Processing | | | | | | | | |
| Services (0.00%) | | | | | | | | |
| Reliq Health Technologies Warrants, Strike Price $0.52, Expires 04/05/2026(c)(h) | | | 2,812,500 | | | | – | |
| TOTAL WARRANTS | | | | | | | | |
| (Cost $0) | | | | | | | – | |
| | | 7 Day Yield | | | Shares | | | Value (Note 2) | |
| SHORT-TERM INVESTMENT (2.17%) | | | | | | | | | | | | |
| | | | | | | | | | | | | |
| State Street Institutional US Government Money Market Fund, Investor Class | | | 4.879 | % | | | 1,051,992 | | | $ | 1,051,992 | |
| | | | | | | | | | | | 1,051,992 | |
| TOTAL SHORT-TERM INVESTMENT | | | | | | | | | | | | |
| (Cost $1,051,992) | | | | | | | | | | | 1,051,992 | |
| | | | | | | | | | | | | |
| TOTAL INVESTMENTS (98.09%) | | | | | | | | | | | | |
| (Cost $42,236,676) | | | | | | | | | | $ | 47,557,066 | |
| | | | | | | | | | | | | |
| OTHER ASSETS IN EXCESS OF LIABILITIES (1.91%) | | | | | | | | | | | 928,216 | |
| | | | | | | | | | | | | |
| NET ASSETS (100.00%) | | | | | | | | | | $ | 48,485,282 | |
| (a) | Affiliated Company. See Note 2 in Notes to Financial Statements. |
| (b) | Non-income producing security. |
See Notes to Financial Statements and Financial Highlights.
| Annual Report | September 30, 2024 | 9 |
| Seven Canyons World Innovators Fund | Portfolio of Investments |
September 30, 2024
| (c) | Security deemed to be illiquid under the procedures utilized by the valuation designee. As of September 30, 2024, the fair value of illiquid securities in the aggregate was $360,062, representing 0.74% of the Fund's net assets. |
| (d) | Securities exempt from registration under Rule 144A of the Securities Act of 1933. These securities may be resold in transactions exempt from registration, normally to qualified institutional buyers. As of September 30, 2024 the fair value of securities restricted under Rule 144A in the aggregate was $1,747,405, representing 3.60% of net assets. |
| (e) | Security deemed to be restricted as of September 30, 2024. As of September 30, 2024, the fair value of restricted securities in the aggregate was $1,747,405, representing 3.60% of the Fund’s net assets. Additional information on restricted securities can be found in Note 8. Restricted Securities in the Notes to Financial Statements. |
| (f) | Securities were purchased pursuant to Regulation S under the Securities Act of 1933, which exempts securities offered and sold outside of the United States from registration. Such securities cannot be sold in the United States without either an effective registration statement filed pursuant to the Securities Act of 1933, or pursuant to an exemption from registration. As of September 30, 2024, the fair value of those securities was $1,747,405 representing 3.60% of net assets. |
| (h) | As a result of the use of significant unobservable inputs to determine fair value, these investments have been classified as Level 3 assets. Additional information on Level 3 assets can be found in Note 2. Significant Accounting Policies in the Notes to Financial Statements section. |
At September 30, 2024, Seven Canyons World Innovators Fund's investments, excluding short-term investments, were in the following countries:
| Country | | % of Total Fair Value | |
| Australia | | | 6.5 | |
| Austria | | | 1.0 | |
| Brazil | | | 0.8 | |
| Canada | | | 8.8 | |
| Denmark | | | 0.2 | |
| France | | | 5.2 | |
| Germany | | | 14.8 | |
| Great Britain | | | 16.9 | |
| India | | | 11.6 | |
| Indonesia | | | 2.6 | |
| Israel | | | 1.9 | |
| Japan | | | 16.5 | |
| Jersey | | | 0.6 | |
| Malaysia | | | 0.2 | |
| Mexico | | | 1.8 | |
| Norway | | | 3.3 | |
| Poland | | | 1.4 | |
| South Korea | | | 3.1 | |
| Sweden | | | 0.3 | |
| Taiwan | | | 2.5 | |
| | | | 100.0 | |
See Notes to Financial Statements and Financial Highlights.
| 10 | www.sevencanyonsadvisors.com |
| Seven Canyons Advisors | Statements of Assets and Liabilities |
September 30, 2024
| | | SEVEN CANYONS STRATEGIC GLOBAL FUND | | | SEVEN CANYONS WORLD INNOVATORS FUND | |
| ASSETS: | | | | | | |
| Unaffiliated Investments, at value (Cost $12,021,043 and $39,483,073) | | $ | 13,942,692 | | | $ | 47,013,877 | |
| Investments in affiliates, at value (Cost $– and $2,753,603) | | | – | | | | 543,189 | |
| Foreign currency, at value (Cost $143,382 and $171,868, respectively) | | | 144,116 | | | | 173,156 | |
| Receivable for investments sold | | | 205,276 | | | | 1,049,246 | |
| Receivable for shares sold | | | – | | | | 178 | |
| Dividends and interest receivable | | | 22,286 | | | | 74,677 | |
| Receivable due from adviser | | | 31,454 | | | | – | |
| Other assets | | | 31,547 | | | | 29,364 | |
| Total Assets | | | 14,377,371 | | | | 48,883,687 | |
| | | | | | | | | |
| LIABILITIES: | | | | | | | | |
| Deferred Foreign Capital Gains Tax | | | 70,675 | | | | 291,112 | |
| Payable for administration and transfer agent fees | | | 7,239 | | | | 11,227 | |
| Payable for shares redeemed | | | 30,000 | | | | 10,397 | |
| Payable to adviser | | | – | | | | 6,814 | |
| Payable for printing fees | | | 4,406 | | | | 32,083 | |
| Payable for professional fees | | | 18,636 | | | | 20,123 | |
| Payable for trustees' fees and expenses | | | 53 | | | | 1,369 | |
| Payable to Chief Compliance Officer fees | | | 1,463 | | | | 2,127 | |
| Accrued expenses and other liabilities | | | 14,847 | | | | 23,153 | |
| Total Liabilities | | | 147,319 | | | | 398,405 | |
| NET ASSETS | | $ | 14,230,052 | | | $ | 48,485,282 | |
| | | | | | | | | |
| NET ASSETS CONSIST OF: | | | | | | | | |
| Paid-in capital (Note 5) | | $ | 14,502,536 | | | $ | 113,253,513 | |
| Total accumulated deficit | | | (272,484 | ) | | | (64,768,231 | ) |
| NET ASSETS | | $ | 14,230,052 | | | $ | 48,485,282 | |
See Notes to Financial Statements and Financial Highlights.
| Annual Report | September 30, 2024 | 11 |
| Seven Canyons Advisors | Statements of Assets and Liabilities |
September 30, 2024
| | | SEVEN CANYONS STRATEGIC GLOBAL FUND | | | SEVEN CANYONS WORLD INNOVATORS FUND | |
| PRICING OF SHARES | | | | | | |
| Investor Class: | | | | | | | | |
| Net Asset Value, offering and redemption price per share | | $ | 11.83 | | | $ | 14.18 | |
| Net Assets | | $ | 14,230,052 | | | $ | 44,476,402 | |
| Shares of beneficial interest outstanding | | | 1,203,082 | | | | 3,137,094 | |
| Institutional Class: | | | | | | | | |
| Net Asset Value, offering and redemption price per share | | | N/A | | | $ | 14.56 | |
| Net Assets | | | N/A | | | $ | 4,008,880 | |
| Shares of beneficial interest outstanding | | | N/A | | | | 275,290 | |
See Notes to Financial Statements and Financial Highlights.
| 12 | www.sevencanyonsadvisors.com |
| Seven Canyons Advisors | Statements of Operations |
For the Year Ended September 30, 2024
| | | SEVEN CANYONS STRATEGIC GLOBAL FUND | | | SEVEN CANYONS WORLD INNOVATORS FUND | |
| INVESTMENT INCOME: | | | | | | |
| Dividends | | $ | 273,553 | | | $ | 667,422 | |
| Foreign taxes withheld | | | (14,380 | ) | | | (33,699 | ) |
| Total Investment Income | | | 259,173 | | | | 633,723 | |
| | | | | | | | | |
| EXPENSES: | | | | | | | | |
| Investment advisory fees (Note 6) | | | 134,980 | | | | 984,083 | |
| Administration fees | | | 68,778 | | | | 187,757 | |
| Custody fees | | | 49,135 | | | | 97,448 | |
| Legal fees | | | 6,272 | | | | 25,288 | |
| Audit and tax fees | | | 22,523 | | | | 22,594 | |
| Transfer agent fees | | | 58,204 | | | | 127,658 | |
| Trustees' fees and expenses | | | 4,035 | | | | 16,744 | |
| Registration and filing fees | | | 18,868 | | | | 31,679 | |
| Printing fees | | | 4,912 | | | | 36,868 | |
| Chief Compliance Officer fees | | | 10,488 | | | | 31,857 | |
| Insurance fees | | | 784 | | | | 3,224 | |
| Other expenses | | | 20,320 | | | | 29,576 | |
| Total Expenses | | | 399,299 | | | | 1,594,776 | |
| Less fees waived/reimbursed by investment adviser (Note 6) | | | | | | | | |
| Investor Class | | | (129,601 | ) | | | (378,129 | ) |
| Institutional Class | | | – | | | | (115,743 | ) |
| Total fees waived/reimbursed by investment adviser (Note 6) | | | (129,601 | ) | | | (493,872 | ) |
| Net Expenses | | | 269,698 | | | | 1,100,904 | |
| NET INVESTMENT LOSS | | | (10,525 | ) | | | (467,181 | ) |
See Notes to Financial Statements and Financial Highlights.
| Annual Report | September 30, 2024 | 13 |
| Seven Canyons Advisors | Statements of Operations |
For the Year Ended September 30, 2024
| | | SEVEN CANYONS STRATEGIC GLOBAL FUND | | | SEVEN CANYONS WORLD INNOVATORS FUND | |
| REALIZED AND UNREALIZED GAIN/(LOSS) ON INVESTMENTS AND FOREIGN CURRENCY: | | | | | | |
| Net realized gain/(loss) on: | | | | | | |
| Investments | | | 2,586,486 | | | | 1,129,261 | |
| Foreign capital gains tax | | | (211,720 | ) | | | (627,619 | ) |
| Foreign currency transactions | | | (58,030 | ) | | | (145,937 | ) |
| Net realized gain | | | 2,316,736 | | | | 355,705 | |
| Change in unrealized appreciation on: | | | | | | | | |
| Unaffiliated Investments (net of change in foreign capital gains tax of $157,663 and $28,261) | | | 858,513 | | | | 11,603,601 | |
| Affiliated Investments | | | – | | | | (249,551 | ) |
| Translation of asset and liabilities denominated in foreign currency | | | 25,136 | | | | 5,977 | |
| Net change | | | 883,649 | | | | 11,360,027 | |
| | | | | | | | | |
| NET REALIZED AND UNREALIZED GAIN ON INVESTMENTS AND FOREIGN CURRENCY | | | 3,200,385 | | | | 11,715,732 | |
| NET INCREASE IN NET ASSETS RESULTING FROM OPERATIONS | | $ | 3,189,860 | | | $ | 11,248,551 | |
See Notes to Financial Statements and Financial Highlights.
| 14 | www.sevencanyonsadvisors.com |
| Seven Canyons Strategic Global Fund | Statements of Changes in Net Assets |
| | | For the Year Ended September 30, 2024 | | | For the Year Ended September 30, 2023 | |
| OPERATIONS: | | | | | | |
| Net investment income/(loss) | | $ | (10,525 | ) | | $ | 134,258 | |
| Net realized gain/(loss) on investments and foreign currency | | | 2,316,736 | | | | (963,102 | ) |
| Net change in unrealized appreciation on investments and foreign currency translation | | | 883,649 | | | | 3,731,656 | |
| Net increase in net assets resulting from operations | | | 3,189,860 | | | | 2,902,812 | |
| DISTRIBUTIONS TO SHAREHOLDERS | | | | | | | | |
| Investor Class | | | (445,119 | ) | | | (1,455,593 | ) |
| Total distributions | | | (445,119 | ) | | | (1,455,593 | ) |
| | | | | | | | | |
| BENEFICIAL SHARE TRANSACTIONS (Note 5): | | | | | | | | |
| Investor Class | | | | | | | | |
| Shares sold | | | 442,790 | | | | 769,849 | |
| Dividends reinvested | | | 434,662 | | | | 1,420,312 | |
| Shares redeemed | | | (10,589,173 | ) | | | (4,108,233 | ) |
| Redemption fees | | | 85 | | | | 19 | |
| Net decrease from beneficial share transactions | | | (9,711,636 | ) | | | (1,918,053 | ) |
| Net decrease in net assets | | | (6,966,895 | ) | | | (470,834 | ) |
| | | | | | | | | |
| NET ASSETS: | | | | | | | | |
| Beginning of year | | | 21,196,947 | | | | 21,667,781 | |
| End of year | | $ | 14,230,052 | | | $ | 21,196,947 | |
See Notes to Financial Statements and Financial Highlights.
| Annual Report | September 30, 2024 | 15 |
| Seven Canyons World Innovators Fund | Statements of Changes in Net Assets |
| | | For the Year Ended September 30, 2024 | | | For the Year Ended September 30, 2023 | |
| OPERATIONS: | | | | | | |
| Net investment loss | | $ | (467,181 | ) | | $ | (442,041 | ) |
| Net realized gain/(loss) on investments and foreign currency | | | 355,705 | | | | (14,236,686 | ) |
| Net change in unrealized appreciation on investments and foreign currency translation | | | 11,360,027 | | | | 29,134,507 | |
| Net increase in net assets resulting from operations | | | 11,248,551 | | | | 14,455,780 | |
| | | | | | | | | |
| BENEFICIAL SHARE TRANSACTIONS (Note 5): | | | | | | | | |
| Investor Class | | | | | | | | |
| Shares sold | | | 745,012 | | | | 2,824,879 | |
| Shares redeemed | | | (20,925,197 | ) | | | (21,523,156 | ) |
| Redemption fees | | | 750 | | | | 3,429 | |
| Net decrease from beneficial share transactions | | | (20,179,435 | ) | | | (18,694,848 | ) |
| Institutional Class | | | | | | | | |
| Shares sold | | | 1,775,454 | | | | 14,089,626 | |
| Shares redeemed | | | (31,822,315 | ) | | | (17,004,252 | ) |
| Redemption fees | | | 171 | | | | 2,010 | |
| Net decrease from beneficial share transactions | | | (30,046,690 | ) | | | (2,912,616 | ) |
| Net decrease in net assets | | | (38,977,574 | ) | | | (7,151,684 | ) |
| | | | | | | | | |
| NET ASSETS: | | | | | | | | |
| Beginning of year | | | 87,462,856 | | | | 94,614,540 | |
| End of year | | $ | 48,485,282 | | | $ | 87,462,856 | |
See Notes to Financial Statements and Financial Highlights.
| 16 | www.sevencanyonsadvisors.com |
Page Intentionally Left Blank
| Seven Canyons | |
| Strategic Global Fund – Investor Class | Financial Highlights |
For a Share Outstanding Throughout the Years Presented
| NET ASSET VALUE, BEGINNING OF PERIOD |
| INCOME/(LOSS) FROM OPERATIONS: |
| Net investment income/(loss)(a) |
| Net realized and unrealized gain/(loss) on investments |
| Total from investment operations |
| LESS DISTRIBUTIONS: |
| From net investment income |
| From net realized gains on investments |
| From tax return of capital |
| Total Distributions |
| REDEMPTION FEES |
| NET INCREASE/(DECREASE) IN NET ASSET VALUE |
| NET ASSET VALUE, END OF PERIOD |
| TOTAL RETURN(c) |
| SUPPLEMENTAL DATA: |
| Net assets, end of period (in 000s) |
| RATIOS TO AVERAGE NET ASSETS |
| Operating expenses excluding reimbursement/waiver |
| Operating expenses including reimbursement/waiver |
| Net investment income/(loss) including reimbursement/waiver |
| PORTFOLIO TURNOVER RATE |
See Notes to Financial Statements and Financial Highlights.
| 18 | www.sevencanyonsadvisors.com |
| Seven Canyons | |
| Strategic Global Fund – Investor Class | Financial Highlights |
For a Share Outstanding Throughout the Years Presented
For the Year Ended September 30, 2024 | | | For the Year Ended September 30, 2023 | | | For the Year Ended September 30, 2022 | | | For the Year Ended September 30, 2021 | | | For the Year Ended September 30, 2020 | |
| $ | 10.10 | | | $ | 9.52 | | | $ | 17.15 | | | $ | 11.45 | | | $ | 12.05 | |
| | | | | | | | | | | | | | | | | | | |
| | (0.01 | ) | | | 0.06 | | | | 0.04 | | | | 0.17 | | | | 0.23 | |
| | 1.96 | | | | 1.18 | | | | (5.06 | ) | | | 5.73 | | | | (0.41 | ) |
| | 1.95 | | | | 1.24 | | | | (5.02 | ) | | | 5.90 | | | | (0.18 | ) |
| | | | | | | | | | | | | | | | | | | |
| | (0.22 | ) | | | (0.66 | ) | | | – | | | | (0.20 | ) | | | (0.17 | ) |
| | – | | | | – | | | | (2.61 | ) | | | – | | | | (0.23 | ) |
| | – | | | | – | | | | – | | | | – | | | | (0.02 | ) |
| | (0.22 | ) | | | (0.66 | ) | | | (2.61 | ) | | | (0.20 | ) | | | (0.42 | ) |
| | 0.00 | (b) | | | 0.00 | (b) | | | 0.00 | (b) | | | 0.00 | (b) | | | 0.00 | (b) |
| | 1.73 | | | | 0.58 | | | | (7.63 | ) | | | 5.70 | | | | (0.60 | ) |
| $ | 11.83 | | | $ | 10.10 | | | $ | 9.52 | | | $ | 17.15 | | | $ | 11.45 | |
| | 19.45 | % | | | 12.90 | % | | | (34.67 | %) | | | 51.66 | % | | | (1.60 | %) |
| | | | | | | | | | | | | | | | | | | |
| $ | 14,230 | | | $ | 21,197 | | | $ | 21,668 | | | $ | 50,946 | | | $ | 27,217 | |
| | | | | | | | | | | | | | | | | | | |
| | 2.07 | % | | | 1.59 | % | | | 1.47 | % | | | 1.29 | % | | | 1.46 | % |
| | 1.40 | % | | | 1.25 | %(d) | | | 0.95 | % | | | 0.95 | % | | | 0.95 | % |
| | (0.05 | %) | | | 0.57 | % | | | 0.34 | % | | | 1.11 | % | | | 2.09 | % |
| | 88 | % | | | 102 | % | | | 77 | % | | | 90 | % | | | 128 | % |
| (a) | Calculated using the average shares method. |
| (b) | Less than $0.005 per share. |
| (c) | Assumes an initial investment on the business day before the first day of the fiscal period, with all dividends and distributions reinvested in additional shares on the reinvestment date, and redemption at the net asset value calculated on the last business day of the fiscal period. Total returns are for the period indicated and have not been annualized. Total returns would have been lower had certain expenses not been waived during the period. Returns shown do not reflect the deduction of taxes that a shareholder would pay on Fund distributions or the redemption of Fund shares. |
| (d) | Prior to February 1, 2023, the Adviser had contractually agreed to limit the amount of the Total Annual Fund Operating Expenses to an annual rate of 0.95% of the fund’s average daily net assets. See Note 6 in the Notes to Financial Statements. |
See Notes to Financial Statements and Financial Highlights.
| Annual Report | September 30, 2024 | 19 |
| Seven Canyons | |
| World Innovators Fund – Investor Class | Financial Highlights |
For a Share Outstanding Throughout the Years Presented
| NET ASSET VALUE, BEGINNING OF PERIOD |
| INCOME/(LOSS) FROM OPERATIONS: |
| Net investment loss(a) |
| Net realized and unrealized gain/(loss) on investments |
| Total from investment operations |
| LESS DISTRIBUTIONS: |
| From net realized gains on investments |
| From tax return of capital |
| Total Distributions |
| REDEMPTION FEES |
| NET INCREASE/(DECREASE) IN NET ASSET VALUE |
| NET ASSET VALUE, END OF PERIOD |
| TOTAL RETURN(c) |
| SUPPLEMENTAL DATA: |
| Net assets, end of period (in 000s) |
| RATIOS TO AVERAGE NET ASSETS |
| Operating expenses excluding reimbursement/waiver |
| Operating expenses including reimbursement/waiver |
| Net investment (loss) including reimbursement/waiver |
| PORTFOLIO TURNOVER RATE |
See Notes to Financial Statements and Financial Highlights.
| 20 | www.sevencanyonsadvisors.com |
| Seven Canyons | |
| World Innovators Fund – Investor Class | Financial Highlights |
For a Share Outstanding Throughout the Years Presented
For the Year Ended September 30, 2024 | | | For the Year Ended September 30, 2023 | | | For the Year Ended September 30, 2022 | | | For the Year Ended September 30, 2021 | | | For the Year Ended September 30, 2020 | |
| $ | 11.93 | | | $ | 10.37 | | | $ | 25.50 | | | $ | 24.32 | | | $ | 15.97 | |
| | | | | | | | | | | | | | | | | | | |
| | (0.09 | ) | | | (0.06 | ) | | | (0.22 | ) | | | (0.38 | ) | | | (0.20 | ) |
| | 2.34 | | | | 1.62 | | | | (11.28 | ) | | | 3.88 | | | | 8.65 | |
| | 2.25 | | | | 1.56 | | | | (11.50 | ) | | | 3.50 | | | | 8.45 | |
| | | | | | | | | | | | | | | | | | | |
| | – | | | | – | | | | (3.62 | ) | | | (2.33 | ) | | | (0.10 | ) |
| | – | | | | – | | | | (0.01 | ) | | | – | | | | – | |
| | – | | | | – | | | | (3.63 | ) | | | (2.33 | ) | | | (0.10 | ) |
| | 0.00 | (b) | | | 0.00 | (b) | | | 0.00 | (b) | | | 0.01 | | | | 0.00 | (b) |
| | 2.25 | | | | 1.56 | | | | (15.13 | ) | | | 1.18 | | | | 8.35 | |
| $ | 14.18 | | | $ | 11.93 | | | $ | 10.37 | | | $ | 25.50 | | | $ | 24.32 | |
| | 18.86 | % | | | 15.04 | % | | | (51.87 | %) | | | 13.92 | % | | | 53.12 | % |
| | | | | | | | | | | | | | | | | | | |
| $ | 44,476 | | | $ | 56,289 | | | $ | 64,684 | | | $ | 204,662 | | | $ | 149,179 | |
| | | | | | | | | | | | | | | | | | | |
| | 2.49 | % | | | 1.85 | % | | | 1.94 | % | | | 1.88 | % | | | 2.02 | % |
| | 1.72 | %(d) | | | 1.75 | % | | | 1.75 | % | | | 1.75 | % | | | 1.75 | % |
| | (0.74 | %) | | | (0.51 | %) | | | (1.30 | %) | | | (1.39 | %) | | | (1.12 | %) |
| | 70 | % | | | 114 | % | | | 62 | % | | | 101 | % | | | 176 | % |
| (a) | Calculated using the average shares method. |
| (b) | Less than $0.005 per share. |
| (c) | Assumes an initial investment on the business day before the first day of the fiscal period, with all dividends and distributions reinvested in additional shares on the reinvestment date, and redemption at the net asset value calculated on the last business day of the fiscal period. Total returns are for the period indicated and have not been annualized. Total returns would have been lower had certain expenses not been waived during the period. Returns shown do not reflect the deduction of taxes that a shareholder would pay on Fund distributions or the redemption of Fund shares. |
| (d) | Prior to February 1, 2024, the Adviser had contractually agreed to limit the amount of the Total Annual Fund Operating Expenses to an annual rate of 1.75% of the Fund's average daily net assets for the Investor class. See Note 6 in the Notes to the Financial Statements. |
See Notes to Financial Statements and Financial Highlights.
| Annual Report | September 30, 2024 | 21 |
| Seven Canyons | |
| World Innovators Fund – Institutional Class | Financial Highlights |
For a Share Outstanding Throughout the Years Presented
| NET ASSET VALUE, BEGINNING OF PERIOD |
| INCOME/(LOSS) FROM OPERATIONS: |
| Net investment loss(a) |
| Net realized and unrealized gain/(loss) on investments |
| Total from investment operations |
| LESS DISTRIBUTIONS: |
| From net realized gains on investments |
| From tax return of capital |
| Total Distributions |
| REDEMPTION FEES |
| NET INCREASE/(DECREASE) IN NET ASSET VALUE |
| NET ASSET VALUE, END OF PERIOD |
| TOTAL RETURN(c) |
| SUPPLEMENTAL DATA: |
| Net assets, end of period (in 000s) |
| RATIOS TO AVERAGE NET ASSETS |
| Operating expenses excluding reimbursement/waiver |
| Operating expenses including reimbursement/waiver |
| Net investment (loss) including reimbursement/waiver |
| PORTFOLIO TURNOVER RATE |
See Notes to Financial Statements and Financial Highlights.
| 22 | www.sevencanyonsadvisors.com |
| Seven Canyons | |
| World Innovators Fund – Institutional Class | Financial Highlights |
For a Share Outstanding Throughout the Years Presented
For the Year Ended September 30, 2024 | | | For the Year Ended September 30, 2023 | | | For the Year Ended September 30, 2022 | | | For the Year Ended September 30, 2021 | | | For the Year Ended September 30, 2020 | |
| $ | 12.24 | | | $ | 10.62 | | | $ | 25.98 | | | $ | 24.69 | | | $ | 16.18 | |
| | | | | | | | | | | | | | | | | | | |
| | (0.08 | ) | | | (0.04 | ) | | | (0.19 | ) | | | (0.32 | ) | | | (0.20 | ) |
| | 2.40 | | | | 1.66 | | | | (11.54 | ) | | | 3.93 | | | | 8.81 | |
| | 2.32 | | | | 1.62 | | | | (11.73 | ) | | | 3.61 | | | | 8.61 | |
| | | | | | | | | | | | | | | | | | | |
| | – | | | | – | | | | (3.62 | ) | | | (2.33 | ) | | | (0.10 | ) |
| | – | | | | – | | | | (0.01 | ) | | | – | | | | – | |
| | – | | | | – | | | | (3.63 | ) | | | (2.33 | ) | | | (0.10 | ) |
| | 0.00 | (b) | | | 0.00 | (b) | | | 0.00 | (b) | | | 0.01 | | | | 0.00 | (b) |
| | 2.32 | | | | 1.62 | | | | (15.36 | ) | | | 1.29 | | | | 8.51 | |
| $ | 14.56 | | | $ | 12.24 | | | $ | 10.62 | | | $ | 25.98 | | | $ | 24.69 | |
| | 18.95 | % | | | 15.25 | % | | | (51.79 | %) | | | 14.17 | % | | | 53.42 | % |
| | | | | | | | | | | | | | | | | | | |
| $ | 4,009 | | | $ | 31,174 | | | $ | 29,931 | | | $ | 93,312 | | | $ | 37,373 | |
| | | | | | | | | | | | | | | | | | | |
| | 2.26 | % | | | 1.91 | % | | | 1.94 | % | | | 1.88 | % | | | 1.97 | % |
| | 1.56 | %(d) | | | 1.55 | % | | | 1.55 | % | | | 1.55 | % | | | 1.55 | % |
| | (0.64 | %) | | | (0.30 | %) | | | (1.09 | %) | | | (1.17 | %) | | | (1.01 | %) |
| | 70 | % | | | 114 | % | | | 62 | % | | | 101 | % | | | 176 | % |
| (a) | Calculated using the average shares method. |
| (b) | Less than $0.005 per share. |
| (c) | Assumes an initial investment on the business day before the first day of the fiscal period, with all dividends and distributions reinvested in additional shares on the reinvestment date, and redemption at the net asset value calculated on the last business day of the fiscal period. Total returns are for the period indicated and have not been annualized. Total returns would have been lower had certain expenses not been waived during the period. Returns shown do not reflect the deduction of taxes that a shareholder would pay on Fund distributions or the redemption of Fund shares. |
| (d) | Prior to February 1, 2024, the Adviser had contractually agreed to limit the amount of the Total Annual Fund Operating Expenses to an annual rate of 1.55% of the Fund's average daily net assets for the Institutional class. See Note 6 in the Notes to the Financial Statements. |
See Notes to Financial Statements and Financial Highlights.
| Annual Report | September 30, 2024 | 23 |
| Seven Canyons Advisors | Notes to Financial Statements and Financial Highlights |
September 30, 2024
1. ORGANIZATION
ALPS Series Trust (the “Trust”), a Delaware statutory trust, is an open-end management investment company registered under the Investment Company Act of 1940, as amended (the “1940 Act”). The Trust consists of multiple separate portfolios or series. This annual report describes the Seven Canyons Strategic Global Fund (the “Strategic Global Fund”) and Seven Canyons World Innovators Fund (the “World Innovators Fund”) (each individually a “Fund” or collectively “Funds”). Prior to January 28, 2022, the Strategic Global Fund was known as the Seven Canyons Strategic Income Fund. The Strategic Global and World Innovators Funds' primary investment objectives are long-term growth of capital. The Funds are each classified as diversified under the 1940 Act. The Strategic Global Fund currently offers Investor Class shares and the World Innovators Fund currently offers Investor Class and Institutional Class shares. Each share class has identical rights to earnings, assets and voting privileges, except for class specific expenses and exclusive rights to vote on matters affecting only individual classes. The Board of Trustees (the “Board” or "Trustees") may establish additional funds and classes of shares at any time in the future without shareholder approval.
2. SIGNIFICANT ACCOUNTING POLICIES
The accompanying financial statements were prepared in accordance with accounting principles generally accepted in the United States of America for investment companies (“U.S. GAAP”). Each Fund is considered an investment company under U.S. GAAP and follows the accounting and reporting guidance applicable to investment companies in the Financial Accounting Standards Board (“FASB”) Accounting Standards Codification Topic 946, Financial Services - Investment Companies. The preparation of financial statements in conformity with U.S. GAAP requires management to make certain estimates and assumptions that affect the reported amounts of assets and liabilities and disclosures of contingent assets and liabilities at the date of the financial statements and the reported amounts of increases and decreases in net assets from operations during the period. Actual results could differ from those estimates. The following is a summary of significant accounting policies consistently followed by each Fund in preparation of its financial statements.
Investment Valuation: Each Fund generally values its securities based on market prices determined at the close of regular trading on the New York Stock Exchange (“NYSE”), normally 4:00 p.m. Eastern Time, on each day the NYSE is open for trading.
For equity securities and mutual funds that are traded on an exchange, the market price is usually the closing sale or official closing price on that exchange. In the case of equity securities not traded on an exchange, or if such closing prices are not otherwise available, the securities are valued at the mean of the most recent bid and ask prices on such day.
Equity securities that are primarily traded on foreign securities exchanges are valued at the last sale price or closing values of such securities on their respective foreign exchanges, except when an event occurs subsequent to the close of the foreign exchange and the close of the NYSE that was likely to have changed such value. In such an event, the fair value of those securities are determined in good faith through consideration of other factors in accordance with procedures utilized by the valuation designee. The Funds will use a fair valuation model provided by an independent pricing service, which is intended to reflect fair value when a security’s value or a meaningful portion of a Fund’s portfolio is believed to have been materially affected by a valuation event that has occurred between the close of the exchange or market on which the security is traded and the close of the regular trading day on the NYSE. The Funds’ valuation procedures set forth certain triggers which instruct when to use the fair valuation model. Foreign securities, currencies, and other assets and liabilities denominated in foreign currencies are translated into U.S. Dollars at the exchange rate of said currencies against the U.S. Dollar, as of valuation time, as provided by an independent pricing service approved by the Board.
| 24 | www.sevencanyonsadvisors.com |
| Seven Canyons Advisors | Notes to Financial Statements and Financial Highlights |
September 30, 2024
Redeemable securities issued by open-end registered investment companies are valued at the investment company’s applicable net asset value (“NAV”), with the exception of exchange-traded open-end investment companies, which are priced as equity securities.
When such prices or quotations are not available, or when the valuation designee appointed by the Board believes that they are unreliable, securities may be priced using fair value procedures approved by the Board.
Fair Value Measurements: The Funds disclose the classification of their fair value measurements following a three-tier hierarchy based on the inputs used to measure fair value. Inputs refer broadly to the assumptions that market participants would use in pricing the asset or liability, including assumptions about risk. Inputs may be observable or unobservable. Observable inputs reflect the assumptions market participants would use in pricing the asset or liability that are developed based on market data obtained from sources independent of the reporting entity. Unobservable inputs reflect the reporting entity’s own assumptions about the assumptions market participants would use in pricing the asset or liability that are developed based on the best information available.
Various inputs are used in determining the value of the Funds’ investments as of the end of the reporting period. When inputs used fall into different levels of the fair value hierarchy, the level in the hierarchy within which the fair value measurement falls is determined based on the lowest level input that is significant to the fair value measurement in its entirety. The designated input levels are not necessarily an indication of the risk or liquidity associated with these investments. These inputs are categorized in the following hierarchy under applicable financial accounting standards:
| Level 1 – | Unadjusted quoted prices in active markets for identical investments, unrestricted assets or liabilities that the Fund has the ability to access at the measurement date; |
| Level 2 – | Quoted prices which are not active, quoted prices for similar assets or liabilities in active markets or inputs other than quoted prices that are observable (either directly or indirectly); and |
| Level 3 – | Significant unobservable prices or inputs (including the Fund’s own assumptions in determining the fair value of investments) where there is little or no market activity for the asset or liability at the measurement date. |
| Annual Report | September 30, 2024 | 25 |
| Seven Canyons Advisors | Notes to Financial Statements and Financial Highlights |
September 30, 2024
The following is a summary of the inputs used to value the Funds’ investments as of September 30, 2024:
SEVEN CANYONS STRATEGIC GLOBAL FUND
| Investments in Securities at Value* | | Level 1 -
Unadjusted
Quoted Prices | | | Level 2 - Other
Significant
Observable
Inputs | | | Level 3 -
Significant
Unobservable
Inputs | | | Total | |
| Common Stocks | | $ | 12,724,976 | | | $ | 239,955 | | | $ | 29,123 | | | $ | 12,994,054 | |
| Short-Term Investment | | | 948,638 | | | | – | | | | – | | | | 948,638 | |
| Warrants | | | – | | | | – | | | | – | | | | – | |
| Total | | $ | 13,673,614 | | | $ | 239,955 | | | $ | 29,123 | | | $ | 13,942,692 | |
SEVEN CANYONS WORLD INNOVATORS FUND
| Investments in Securities at Value* | | Level 1 -
Unadjusted
Quoted Prices | | | Level 2 - Other
Significant
Observable
Inputs | | | Level 3 -
Significant
Unobservable
Inputs | | | Total | |
| Common Stocks | | $ | 45,559,721 | | | $ | 815,846 | | | $ | 129,507 | | | $ | 46,505,074 | |
| Short-Term Investment | | | 1,051,992 | | | | – | | | | – | | | | 1,051,992 | |
| Warrants | | | – | | | | – | | | | – | | | | – | |
| Total | | $ | 46,611,713 | | | $ | 815,846 | | | $ | 129,507 | | | $ | 47,557,066 | |
| * | For a detailed Industry breakdown, see the accompanying Portfolio of Investments. |
| ** | Includes Level 3 security valued at zero. |
The following is a reconciliation of assets in which Level 3 inputs were used in determining value:
| Seven Canyons Strategic Global Fund | | Common Stocks | | | Total | |
| Balance as of September 30, 2023 | | $ | 330,921 | | | $ | 330,921 | |
| Realized Gain/(Loss)(a) | | | – | | | | – | |
| Change in Unrealized Appreciation/(Depreciation) | | | (111,262 | ) | | | (111,262 | ) |
| Purchases | | | – | | | | – | |
| Sales Proceeds | | | (219,659 | ) | | | (219,659 | ) |
| Transfer into Level 3(b) | | | 29,123 | | | | 29,123 | |
| Transfer out of Level 3 | | | – | | | | – | |
| Balance as of September 30, 2024 | | $ | 29,123 | | | $ | 29,123 | |
| Net change in unrealized appreciation/(depreciation) included in the Statements of Operations attributable to Level 3 investments held at September 30, 2024 | | $ | (216,638 | ) | | $ | (216,638 | ) |
| (a) | Sale of investment is the result of an exchange which did not result in a realized gain or loss. |
| (b) | Transferred from Level 1 to Level 3 because of a lack of observable market data, resulting from a decrease in market activity for the securities. |
| 26 | www.sevencanyonsadvisors.com |
| Seven Canyons Advisors | Notes to Financial Statements and Financial Highlights |
September 30, 2024
| Seven Canyons World Innovators Fund | | Common Stocks | | | Total | |
| Balance as of September 30, 2023 | | $ | 1,709,760 | | | $ | 1,709,760 | |
| Realized Gain/(Loss)(a) | | | – | | | | – | |
| Change in Unrealized Appreciation/(Depreciation) | | | (574,856 | ) | | | (574,856 | ) |
| Purchases | | | – | | | | – | |
| Sales Proceeds | | | (1,134,904 | ) | | | (1,134,904 | ) |
| Transfer into Level 3(b) | | | 129,507 | | | | 129,507 | |
| Transfer out of Level 3 | | | – | | | | – | |
| Balance as of September 30, 2024 | | $ | 129,507 | | | $ | 129,507 | |
| Net change in unrealized appreciation/(depreciation) included in the Statements of Operations attributable to Level 3 investments held at September 30, 2024 | | $ | (1,029,426 | ) | | $ | (1,029,426 | ) |
| (a) | Sale of investment is the result of an exchange which did not result in a realized gain or loss. |
| (b) | Transferred from Level 1 to Level 3 because of a lack of observable market data, resulting from a decrease in market activity for the securities. |
Quantitative information about Level 3 measurements as of September 30, 2024:
Seven Canyons Strategic Global Fund
| Asset Class | | Fair Value | | | Valuation Technique(s) | | Unobservable Input(s)(a) | | Value/Range |
| Common Stock | | $ | 29,123 | | | Market Approach | | Liquidity Discount | | 80% |
Seven Canyons World Innovators Fund
| Asset Class | | Fair Value | | | Valuation Technique(s) | | Unobservable Input(s)(a) | | Value/Range |
| Common Stock | | $ | 129,507 | | | Market Approach | | Liquidity Discount | | 80% |
| (a) | A change to the unobservable input may result in a significant change to the value of the investment as follows: An increase or decrease in the liquidity discount would result in a corresponding decrease or increase in the fair value of the investment. |
Affiliated Companies: As defined by the Investment Company Act of 1940, an affiliated person, including an affiliated company, is one in which a Fund owns 5% or more of the outstanding voting securities, or a company which is under common ownership or control with the Fund.
For the period ended September 30, 2024, the Seven Canyons World Innovators Fund held shares in the following affiliate, as defined by the Investment Company Act of 1940:
| Security Name | | Fair Value as of September 30, 2023 | | | Purchases | | | Sales | | | Change in
Unrealized
Gain/(Loss) | | | Realized
Gain/(Loss) | | | Fair Value as of September 30, 2024 | | | Share
Balance as
of June 30,
2024 | |
| Winfarm SAS | | $ | 620,547 | | | $ | 172,193 | | | $ | – | | | $ | (249,551 | ) | | $ | – | | | $ | 543,189 | | | | 107,247 | |
| | | $ | 620,547 | | | $ | 172,193 | | | $ | – | | | $ | (249,551 | ) | | $ | – | | | $ | 543,189 | | | | 107,247 | |
| Annual Report | September 30, 2024 | 27 |
| Seven Canyons Advisors | Notes to Financial Statements and Financial Highlights |
September 30, 2024
Cash & Cash Equivalents: The Funds consider their investment in a Federal Deposit Insurance Corporation (“FDIC”) insured interest bearing account to be cash and cash equivalents. Cash and cash equivalents are valued at cost plus any accrued interest. The Funds maintain cash balances, which, at times may exceed federally insured limits. The Funds maintain these balances with a high quality financial institution.
Concentration of Credit Risk: Each Fund places its cash with a banking institution, which is insured by the FDIC. The FDIC limit is $250,000. At various times throughout the year, the amount on deposit may exceed the FDIC limit and subject the Fund to a credit risk. The Funds do not believe that such deposits are subject to any unusual risk associated with investment activities.
Trust Expenses: Some expenses of the Trust can be directly attributed to a fund. Expenses that cannot be directly attributed to a fund are apportioned among all funds in the Trust based on average net assets of each fund, including Trustees’ fees and expenses.
Fund Expenses: Some expenses can be directly attributed to a Fund and are apportioned among the classes based on average net assets of each class.
Class Expenses: Expenses that are specific to a class of shares are charged directly to that share class.
Federal Income Taxes: The Funds comply with the requirements under Subchapter M of the Internal Revenue Code of 1986, as amended, applicable to regulated investment companies and intend to distribute substantially all of their net taxable income and net capital gains, if any, each year so that it will not be subject to excise tax on undistributed income and gains. The Funds are not subject to income taxes to the extent such distributions are made.
As of and during the year ended September 30, 2024, the Funds did not have a liability for any unrecognized tax benefits in the accompanying financial statements. The Funds recognize interest and penalties, if any, related to tax liabilities as income tax expense in the Statements of Operations. The Funds file U.S. federal, state and local income tax returns as required. The Funds’ tax returns are subject to examination by the relevant tax authorities until expiration of the applicable statute of limitations, which is generally three years after the filing of the tax return for federal purposes and four years for most state returns. The Funds’ administrator has analyzed the Funds’ tax positions taken on federal and state income tax returns for all open tax years and has concluded that as of September 30, 2024, no provision for income tax is required in the Funds’ financial statements related to these tax positions.
In addition to the requirements of the Code, the Funds may also be subject to capital gains tax in India and potentially other foreign jurisdictions, on gains realized upon the sale of securities, payable upon repatriation of sales proceeds. Any realized losses in excess of gains in India may be carried forward to offset future gains. Funds with exposure to Indian securities and potentially other foreign jurisdictions accrue a deferred liability for unrealized gains in excess of available loss carryforwards based on existing tax rates and holding periods of the securities. As of September 30, 2024, Seven Canyons Strategic Global Fund and Seven Canyons World Innovators Fund recorded a deferred liability for potential future India capital gains taxes of $70,675 and $291,112, respectively.
| 28 | www.sevencanyonsadvisors.com |
| Seven Canyons Advisors | Notes to Financial Statements and Financial Highlights |
September 30, 2024
Investment Transactions and Investment Income: Investment transactions are accounted for on the date the investments are purchased or sold (trade date basis for financial reporting purposes). Realized gains and losses from investment transactions are reported on an identified cost basis. Interest income, which includes accretion of discounts and amortization of premiums, is accrued and recorded as earned using the effective interest method. Dividend income is recognized on the ex-dividend date, or for certain foreign securities, as soon as information is available to the Funds. Withholding taxes on foreign dividends are paid (a portion of which may be reclaimable) or provided for in accordance with the applicable country’s tax rules and rates and are disclosed in the Statements of Operations. All of the realized and unrealized gains and losses and net investment income are allocated daily to each class in proportion to its average daily net assets.
Foreign Securities: The Funds may directly purchase securities of foreign issuers. Investing in securities of foreign issuers involves special risks not typically associated with investing in securities of U.S. issuers. The risks include possible re-evaluation of currencies, the inability to repatriate foreign currency, less complete financial information about companies and possible future adverse political and economic developments. Moreover, securities of many foreign issuers and their markets may be less liquid and their prices more volatile than those of securities of comparable U.S. issuers.
Foreign Currency Translation: Values of investments denominated in foreign currencies are converted into U.S. dollars using the current exchange rates each business day (generally 4:00 p.m. Eastern Time). Investment securities and other assets and liabilities denominated in foreign currencies are translated into U.S. dollar amounts at the date of valuation. Purchases and sales of investment securities and income and expense items denominated in foreign currencies are translated into U.S. dollar amounts on the respective dates of such transactions. The Funds do not isolate that portion of the results of operations resulting from changes in foreign exchange rates on investments from the fluctuations arising from changes in market prices of securities held. Such fluctuations are included with the net realized and unrealized gain or loss from investments. Reported net realized foreign exchange gains or losses arise from sales of foreign currencies, currency gains or losses realized between the trade and settlement dates on securities transactions, and the difference between the amounts of dividends, interest, and foreign withholding taxes recorded on the Funds' books and the U.S. dollar equivalent of the amounts actually received or paid. Net unrealized foreign exchange gains and losses arise from changes in the fair values of assets and liabilities, other than investments in securities at fiscal period-end, resulting from changes in exchange rates.
Foreign Exchange Transactions: The Funds may enter into foreign currency spot contracts to facilitate transactions in foreign securities or to convert foreign currency receipts into U.S. dollars. A foreign currency spot contract is an agreement between two parties to buy and sell currencies at the current market rate, for settlement generally within two business days. The U.S. dollar value of the contracts is determined using current currency exchange rates supplied by a pricing service. The contract is marked-to-market daily for settlements beyond one day and any change in market value is recorded as an unrealized gain or loss. When the contract is closed, a Fund records a realized gain or loss equal to the difference between the value on the open and close date. Losses may arise from changes in the value of the foreign currency, or if the counterparties do not perform under the contract’s terms. The maximum potential loss from such contracts is the aggregate face value in U.S. dollars at the time the contract was opened.
| Annual Report | September 30, 2024 | 29 |
| Seven Canyons Advisors | Notes to Financial Statements and Financial Highlights |
September 30, 2024
Distributions to Shareholders: The Funds normally pay dividends, if any, quarterly, and distribute capital gains, if any, on an annual basis. Income dividend distributions are derived from interest and other income a Fund receives from its investments, including short term capital gains. Long term capital gain distributions are derived from gains realized when a Fund sells a security it has owned for more than one year. The Funds may make additional distributions and dividends at other times if its investment advisor has determined that doing so may be necessary for the Fund to avoid or reduce taxes. Net investment income/(loss) and net realized gain/(loss) may differ for financial statement and tax purposes.
3. TAX BASIS INFORMATION
Tax Basis of Distributions to Shareholders: The character of distributions made during the period from net investment income or net realized gains may differ from its ultimate characterization for federal income tax purposes. Also, due to the timing of dividend distributions, the fiscal year in which amounts are distributed may differ from the fiscal year in which the income or realized gain were recorded by the Funds. The amounts and characteristics of tax basis distributions are estimated at the time of distribution and composition of distributable earnings/(accumulated losses) are finalized at fiscal year-end.
The tax character of distributions paid by the Funds for the fiscal year ended September 30, 2024, were as follows:
| | | Ordinary Income | | | Long-Term
Capital Gains | |
| Seven Canyons Strategic Global Fund | | $ | 445,119 | | | $ | – | |
The tax character of distributions paid by the Funds for the fiscal year ended September 30, 2023, were as follows:
| | | Ordinary Income | | | Long-Term
Capital Gains | |
| Seven Canyons Strategic Global Fund | | $ | 1,455,593 | | | $ | – | |
| 30 | www.sevencanyonsadvisors.com |
| Seven Canyons Advisors | Notes to Financial Statements and Financial Highlights |
September 30, 2024
Reclassifications: As of September 30, 2024, permanent differences in book and tax accounting were reclassified. The following reclassifications, which had no impact on results of operations or net assets, were recorded to reflect tax character:
| | | Paid-in Capital | | | Total Distributable
Earnings | |
| Seven Canyons Strategic Global Fund | | $ | (5,976 | ) | | $ | 5,976 | |
| Seven Canyons World Innovators Fund | | | (257,608 | ) | | | 257,608 | |
To the extent these book and tax differences are permanent in nature, such amounts are reclassified at the end of the fiscal year among additional paid-in capital and distributable earnings on investments and foreign currency translations. The reclassifications generally relate to net operating losses. These reclassifications have no impact on the net asset values of the Funds.
Unrealized Appreciation and Depreciation on Investments: As of September 30, 2024, the aggregate costs of investments, gross unrealized appreciation/(depreciation) and net unrealized appreciation for Federal tax purposes were as follows:
| | | Seven Canyons
Strategic Global
Fund | | | Seven Canyons
World Innovators
Fund | |
| Gross unrealized appreciation (excess of value over tax cost) | | $ | 2,765,965 | | | $ | 12,063,283 | |
| Gross unrealized depreciation (excess of tax cost over value) | | | (899,130 | ) | | | (7,017,302 | ) |
| Net appreciation (depreciation) of foreign currency | | | (69,869 | ) | | | (288,819 | ) |
| Net unrealized appreciation | | $ | 1,796,966 | | | $ | 4,757,162 | |
| Cost of investments for income tax purposes | | $ | 12,075,857 | | | $ | 42,511,085 | |
These temporary differences between book and tax unrealized are primarily attributed to wash sales and passive foreign investment companies.
Components of Distributable Earnings: As of September 30, 2024, components of distributable earnings were as follows:
| | | Seven Canyons
Strategic Global
Fund | | | Seven Canyons
World Innovators
Fund | |
| Accumulated capital losses | | $ | (1,737,455 | ) | | $ | (68,399,956 | ) |
| Net unrealized appreciation | | | 1,796,966 | | | | 4,757,162 | |
| Other cumulative effect of timing differences | | | (331,995 | ) | | | (1,125,437 | ) |
| Total | | $ | (272,484 | ) | | $ | (64,768,231 | ) |
| Annual Report | September 30, 2024 | 31 |
| Seven Canyons Advisors | Notes to Financial Statements and Financial Highlights |
September 30, 2024
Under current law, capital losses maintain their character as short-term or long-term and are carried forward to the next tax year without expiration. As of the current fiscal year end, the following amounts are available as carry forwards to the next tax year:
| Fund | | Short-Term
Non-expiring | | | Long-Term
Non-expiring | |
| Seven Canyons Strategic Global Fund | | $ | 1,737,455 | | | $ | – | |
| Seven Canyons World Innovators Fund | | | 47,880,575 | | | | 20,519,381 | |
Capital loss carryovers used during the period ended September 30, 2024, were:
| | | Seven Canyons
Strategic
Global Fund | | | Seven Canyons
World
Innovators Fund | |
| | $ | 1,802,289 | | | $ | 221,748 | |
The Funds elect to defer to the period ending September 30, 2025, late year ordinary losses during the period January 1, 2024 to September 30, 2024 in the amount of:
| Fund | | Amount | |
| Seven Canyons Strategic Global Fund | | $ | 331,995 | |
| Seven Canyons World Innovators Fund | | | 1,125,437 | |
4. SECURITIES TRANSACTIONS
Purchases and sales of securities, excluding short-term securities, during the year ended September 30, 2024, were as follows:
| | | Purchases of
Securities | | | Proceeds from
Sales of
Securities | |
| Seven Canyons Strategic Global Fund | | $ | 15,761,314 | | | $ | 25,903,468 | |
| Seven Canyons World Innovators Fund | | | 43,081,990 | | | | 90,638,373 | |
5. BENEFICIAL SHARE TRANSACTIONS
The capitalization of the Trust consists of an unlimited number of shares of beneficial interest with no par value per share. Holders of the shares of the Funds have one vote for each share held and a proportionate fraction of a vote for each fractional share. All shares issued and outstanding are fully paid and are transferable and redeemable at the option of the shareholder. Shares have no pre-emptive rights. Neither the Funds nor any of their creditors have the right to require shareholders to pay any additional amounts solely because the shareholder owns the shares.
| 32 | www.sevencanyonsadvisors.com |
| Seven Canyons Advisors | Notes to Financial Statements and Financial Highlights |
September 30, 2024
Shares redeemed within 60 days of purchase may incur a 2.00% redemption fee deducted from the redemption amount. For the year ended September 30, 2024, the redemption fees charged by a Fund, if any, are presented in the Statements of Changes in Net Assets.
Transactions in common shares were as follows:
| | | For the
Year Ended
September 30,
2024 | | | For the
Year Ended
September 30,
2023 | |
| Seven Canyons Strategic Global Fund | | | | | | | | |
| Investor Class | | | | | | | | |
| Shares sold | | | 40,381 | | | | 71,671 | |
| Shares issued in reinvestment of distributions to shareholders | | | 39,804 | | | | 137,381 | |
| Shares redeemed | | | (975,716 | ) | | | (385,799 | ) |
| Net decrease in shares outstanding | | | (895,531 | ) | | | (176,746 | ) |
| | | | | | | | | |
| Seven Canyons World Innovators Fund | | | | | | | | |
| Investor Class | | | | | | | | |
| Shares sold | | | 58,722 | | | | 225,626 | |
| Shares issued in reinvestment of distributions to shareholders | | | – | | | | – | |
| Shares redeemed | | | (1,640,895 | ) | | | (1,742,910 | ) |
| Net decrease in shares outstanding | | | (1,582,173 | ) | | | (1,517,284 | ) |
| Institutional Class | | | | | | | | |
| Shares sold | | | 136,167 | | | | 1,077,718 | |
| Shares issued in reinvestment of distributions to shareholders | | | – | | | | – | |
| Shares redeemed | | | (2,407,381 | ) | | | (1,348,471 | ) |
| Net decrease in shares outstanding | | | (2,271,214 | ) | | | (270,753 | ) |
Control is defined by the 1940 Act as the beneficial ownership, either directly or through one or more controlled companies, of more than 25% of the voting securities of a company. As of September 30, 2024, the Strategic Global Fund did not have any shareholder or accounts that exceeded the 25% ownership threshold for disclosure. As of September 30, 2024, the World Innovators Fund did not have any shareholder or accounts that exceeded the 25% ownership threshold for disclosure.
6. MANAGEMENT AND RELATED PARTY TRANSACTIONS
Investment Advisory: Seven Canyons Advisors, LLC (the “Adviser”), subject to the authority of the Board, is responsible for the overall management and administration of the Funds’ business affairs. The Adviser manages the investments of the Funds in accordance with each Fund’s investment objective, policies and limitations, and investment guidelines established jointly by the Adviser and the Board.
| Annual Report | September 30, 2024 | 33 |
| Seven Canyons Advisors | Notes to Financial Statements and Financial Highlights |
September 30, 2024
Pursuant to the Investment Advisory Agreement (the “Advisory Agreement”) with the Adviser, the Strategic Global Fund pays the Adviser an annual management fee of 0.70% based on the Fund’s average daily net assets, and the World Innovators Fund pays the Adviser an annual management fee of 1.50% based on the Fund’s average daily net assets. The management fees are paid on a monthly basis. The Board may extend the Advisory Agreements for an additional one-year term. The Board and shareholders of the Funds may terminate the Advisory Agreement upon 30 days’ written notice. The Adviser may terminate the Advisory Agreement upon 60 days’ written notice.
Pursuant to a fee waiver letter agreement (the “Fee Waiver Agreement”), the Adviser has contractually agreed to limit the amount of the Total Annual Fund Operating Expenses (exclusive of interest, dividend expense on short sales/interest expense, taxes, brokerage commissions, other investment related costs, acquired fund fees and expenses, and extraordinary expenses such as litigation and other expenses not incurred in the ordinary course of business) to an annual rate of 1.40% of the Strategic Global Fund’s average daily net assets, and 1.70% and 1.60% of the World Innovators Fund’s average daily net assets for the Investor Class and the Institutional Class, respectively. Prior to February 1, 2024, the Adviser had contractually agreed to limit the amount of the Total Annual Fund Operating Expenses (exclusive of interest, dividend expense on short sales/interest expense, taxes, brokerage commissions, other investment related costs, acquired fund fees and expenses, and extraordinary expenses such as litigation and other expenses not incurred in the ordinary course of business) to an annual rate of 1.75% and 1.55% of the World Innovators Fund’s average daily net assets for the Investor Class and the Institutional Class, respectively. The Fee Waiver Agreement is in effect through at least January 31, 2025, and will automatically continue upon annual approval by the Board for successive twelve-month periods unless (i) it is terminated earlier by the Board, or (ii) the Adviser provides at least 30 days written notice of non-continuance prior to the end of the then effective term. The Adviser will be permitted to recover, on a class-by-class basis, expenses it has borne through the Fee Waiver Agreement (whether through reduction of its management fee or otherwise) only to the extent that each Fund's expenses in later periods do not exceed the lesser of: (1) the contractual expense limit in effect at the time the Adviser waives or limits the expenses; or (2) the contractual expense limit in effect at the time the Adviser seeks to recover the expenses; provided, however, that each Fund will not be obligated to pay any such deferred fees or expenses more than three years after the date on which the fee and expense was reduced, as calculated on a monthly basis. The Adviser may not discontinue this waiver without the approval by the Trust's Board. Fees waived or reimbursed for the year ended September 30, 2024, are disclosed in the Statements of Operations.
| 34 | www.sevencanyonsadvisors.com |
| Seven Canyons Advisors | Notes to Financial Statements and Financial Highlights |
September 30, 2024
As of September 30, 2024, the balance of recoupable expenses was as follows:
| | | Expiring in
2025 | | | Expiring in
2026 | | | Expiring in
2027 | |
| Seven Canyons Strategic Global Fund | | | | | | | | | | | | |
| Investor | | $ | 171,242 | | | $ | 80,837 | | | $ | 129,601 | |
| Seven Canyons World Innovators Fund | | | | | | | | | | | | |
| Institutional | | | 223,908 | | | | 118,906 | | | | 115,743 | |
| Investor | | | 229,615 | | | | 65,847 | | | | 378,129 | |
Administrator: ALPS Fund Services, Inc. (“ALPS”) (an affiliate of ALPS Distributors, Inc.) serves as administrator to each Fund. The Funds have agreed to pay expenses incurred in connection with its administrative activities. Pursuant to the Administration, Bookkeeping and Pricing Services Agreement with the Trust, ALPS will provide operational services to each Fund including, but not limited to, fund accounting and fund administration, and will generally assist in the Funds’ operations. The Funds’ administration fee is accrued on a daily basis and paid monthly. The officers of the Trust are employees of ALPS. Administration fees paid by each Fund for the year ended September 30, 2024, are disclosed in the Statements of Operations. ALPS is reimbursed by the Funds for certain out-of-pocket expenses.
Transfer Agent: ALPS serves as transfer agent for each Fund under a Transfer Agency and Services Agreement with the Trust. Under this agreement, ALPS is paid an annual fee for services performed on behalf of the Funds plus fees for open accounts and is reimbursed for certain out-of-pocket expenses.
Compliance Services: ALPS provides Chief Compliance Officer services to each Fund to monitor and test the policies and procedures of each Fund in conjunction with requirements under Rule 38a-1 of the 1940 Act pursuant to a Chief Compliance Officer Services Agreement with the Trust. Under this agreement, ALPS is paid an annual fee for services performed on behalf of each Fund and is reimbursed for certain out-of-pocket expenses.
Distribution: ALPS Distributors, Inc. (the “Distributor”) (an affiliate of ALPS) acts as the principal underwriter of the Funds’ shares pursuant to a Distribution Agreement with the Trust. Shares of the Funds are offered on a continuous basis through the Distributor, as agent of the Funds. The Distributor is not obligated to sell any particular amount of shares and is not entitled to any compensation for its services as the Funds’ principal underwriter pursuant to the Distribution Agreement.
7. TRUSTEES AND OFFICERS
As of September 30, 2024, there were four Trustees, each of whom are not “interested persons” (as defined in the 1940 Act) of the Trust (the “Independent Trustees”). The Independent Trustees of the Trust and, if any, Interested Trustees who are not currently employed by the Adviser, ALPS or other service providers will receive a quarterly retainer of $16,250, plus $5,000 for each regular Board or Committee meeting attended and $2,000 for each special telephonic or in-person Board or Committee meeting attended. Additionally, the Audit Committee Chair receives a quarterly retainer of $1,875 and the Independent Chair receives a quarterly retainer of $4,250. These fees are allocated proportionately among the multiple portfolios/series of the Trust. The Independent Trustees and, if any, Interested Trustees who are not currently employed by the Adviser, ALPS or other service providers are also reimbursed for all reasonable out-of-pocket expenses relating to attendance at meetings.
| Annual Report | September 30, 2024 | 35 |
| Seven Canyons Advisors | Notes to Financial Statements and Financial Highlights |
September 30, 2024
Officers of the Trust receive no salary or fees from the Trust. As discussed in Note 6 the Funds pay ALPS an annual fee for compliance services.
8. RESTRICTED SECURITIES
Restricted securities are securities that may only be resold upon registration under federal securities laws or in transactions exempt from such registration. In some cases, the issuer of restricted securities has agreed to register such securities for resale, at the issuer’s expense, either upon demand by a fund or in connection with another registered offering of the securities. Many restricted securities may be resold in the secondary market in transactions exempt from registration. Such restricted securities may be determined to be liquid. The Funds will not incur any registration costs upon such resale. The Funds’ restricted securities are valued at the price provided by pricing services or dealers in the secondary market or, if no market prices are available, at the fair value price as determined by the Fund Adviser or pursuant to the Fund’s fair value policy, subject to oversight by the Board. The Funds have acquired certain securities, the sale of which is restricted under applicable provisions of the Securities Act of 1933. It is possible that the fair value price may differ significantly from the amount that may ultimately be realized in the near term, and the difference could be material. At September 30, 2024, the Funds held the following restricted securities:
| Fund | | Security
Type | | Acquisition
Date | | Amortized
Cost | | | Fair
Value | | | % of Net
Assets | |
| Seven Canyons Strategic Global Fund | |
| Beta Drugs, Ltd. | | Common Stock | | 05/21/24 – 05/22/24 | | $ | 104,670 | | | $ | 135,893 | | | | 0.95 | % |
| JTC PLC | | Common Stock | | 06/07/23 - 11/20/23 | | | 103,342 | | | | 157,009 | | | | 1.10 | % |
| Sirca Paints India, Ltd. | | Common Stock | | 05/11/23 | | | — | | | | 58,428 | | | | 0.41 | % |
| Total | | | | | | | | | | $ | 351,330 | | | | | |
| Seven Canyons World Innovators Fund | |
| Beta Drugs, Ltd. | | Common Stock | | 05/21/24 - 05/22/24 | | $ | 253,563 | | | $ | 329,207 | | | | 0.68 | % |
| JTC PLC | | Common Stock | | 10/04/23 | | | 178,187 | | | | 292,956 | | | | 0.60 | % |
| Sirca Paints India, Ltd. | | Common Stock | | 06/08/23 | | | 374,595 | | | | 369,562 | | | | 0.76 | % |
| Trustpilot Group PLC | | Common Stock | | 12/14/22 - 03/01/23 | | | 311,820 | | | | 755,680 | | | | 1.56 | % |
| Total | | | | | | | | | | $ | 1,747,405 | | | | | |
Restricted securities under Rule 144a, including the aggregate value and percentage of net assets of each Fund, have been identified in the Portfolios of Investments.
| 36 | www.sevencanyonsadvisors.com |
| Seven Canyons Advisors | Notes to Financial Statements and Financial Highlights |
September 30, 2024
9. INDEMNIFICATIONS
Under the Trust’s organizational documents, its officers and Trustees are indemnified against certain liabilities arising out of the performance of their duties to the Trust. Additionally, in the normal course of business, the Trust enters into contracts with service providers that may contain general indemnification clauses which may permit indemnification to the extent permissible under applicable law. The Trust’s maximum exposure under these arrangements is unknown; as such exposure would involve future claims that may be made against the Trust that have not yet occurred.
10. SUBSEQUENT EVENTS
On [November 21, 2024], the Board of Trustees (the “Board”) of ALPS Series Trust (the “Trust”), based upon the recommendation of Seven Canyons Advisors, LLC, the investment adviser to the Funds, approved the proposed reorganization of the Seven Canyons Strategic Global Fund and the Seven Canyons World Innovators Fund, severally and not jointly (each a “Target Fund” and together the “Target Funds”) into the Hood River International Opportunity Fund (the “Acquiring Fund”), a series of Manager Directed Portfolios, (each, a “Reorganization” and together, the “Reorganizations”). Each Reorganization is subject to approval by shareholders of the applicable Target Fund.
The Board also approved an Agreement and Plan of Reorganization (the “Plan”) that provides that the reorganization of each Target Fund, will separately consist of (a) the transfer of the Target Fund’s Assets to the Acquiring Fund in exchange for shares of beneficial interest, par value $0.01 per share, of the Acquiring Fund; (b) the assumption by the Acquiring Fund of the Target Fund’s liabilities; and (c) the distribution to the shareholders of each class of the Target Fund full and fractional shares of the corresponding class of the Acquiring Fund in redemption of all outstanding shares of beneficial interest, no par value, of the Target Fund and in complete liquidation of the Target Fund, all upon the terms and conditions set forth in the Plan.
The Trust anticipates holding a shareholder meeting during the first quarter of 2025, or any adjournment thereof, at which shareholders of record of each Target Fund as of a to be determined record date, will be asked to consider and vote on the Plan. Subject to such approval, the Reorganizations are expected to take effect in the first quarter of 2025.
| Annual Report | September 30, 2024 | 37 |
| Seven Canyons Advisors | Report of Independent Registered Public Accounting Firm |
To the Shareholders of Seven Canyons Strategic Global Fund and Seven Canyons World Innovators Fund and Board of Trustees of ALPS Series Trust
Opinion on the Financial Statements
We have audited the accompanying statements of assets and liabilities, including the portfolios of investments, of Seven Canyons Strategic Global Fund and Seven Canyons World Innovators Fund (the “Funds”), each a series of ALPS Series Trust, as of September 30, 2024, the related statements of operations for the year then ended, the statements of changes in net assets for each of the two years in the period then ended, the financial highlights for each of the five years in the period then ended, and the related notes (collectively referred to as the “financial statements”). In our opinion, the financial statements present fairly, in all material respects, the financial position of each of the Funds as of September 30, 2024, the results of their operations for the year then ended, the changes in net assets for each of the two years in the period then ended, and the financial highlights for each of the five years in the period then ended, in conformity with accounting principles generally accepted in the United States of America.
Basis for Opinion
These financial statements are the responsibility of the Funds’ management. Our responsibility is to express an opinion on the Funds’ financial statements based on our audits. We are a public accounting firm registered with the Public Company Accounting Oversight Board (United States) (“PCAOB”) and are required to be independent with respect to the Funds in accordance with the U.S. federal securities laws and the applicable rules and regulations of the Securities and Exchange Commission and the PCAOB.
We conducted our audits in accordance with the standards of the PCAOB. Those standards require that we plan and perform the audit to obtain reasonable assurance about whether the financial statements are free of material misstatement whether due to error or fraud.
Our audits included performing procedures to assess the risks of material misstatement of the financial statements, whether due to error or fraud, and performing procedures that respond to those risks. Such procedures included examining, on a test basis, evidence regarding the amounts and disclosures in the financial statements. Our procedures included confirmation of securities owned as of September 30, 2024, by correspondence with the custodian and brokers. Our audits also included evaluating the accounting principles used and significant estimates made by management, as well as evaluating the overall presentation of the financial statements. We believe that our audits provide a reasonable basis for our opinion.
We have served as the Funds’ auditor since 2018.

COHEN & COMPANY, LTD.
Cleveland, Ohio
November 27, 2024
| 38 | www.sevencanyonsadvisors.com |
| Seven Canyons Advisors | Tax Designations |
September 30, 2024 (Unaudited)
Qualified Dividend Income
The percentage of ordinary income dividends distributed during the calendar year ended December 31, 2023 are designated as qualified dividend income (QDI) as defined in Section 1(h)(11) of the Internal Revenue Code in the following percentages:
| | Amount |
| Seven Canyons Strategic Global Fund | 35.95% |
| Seven Canyons World Innovators Fund | 0.00% * |
Dividends Received Deduction
For corporate shareholders, the following ordinary dividends paid during the calendar year ended December 31, 2023 qualify for the corporate dividends received deduction:
| | Amount |
| Seven Canyons Strategic Global Fund | 2.75% |
| Seven Canyons World Innovators Fund | 0.00% * |
Pursuant to Section 852(b)(3) of the Internal Revenue Code, the Seven Canyons World Innovators Fund and Seven Canyons Strategic Global Fund designated $0 and $0 respectively as long-term capital gain dividends.
| * | Fund did not pay ordinary distributions in 2023. |
| Annual Report | September 30, 2024 | 39 |

| Item 8. | Changes in and Disagreements with Accountants for Open-End Management Investment Companies. None. |
| Item 9. | Proxy Disclosures for Open-End Management Investment Companies. During the year ended September 30, 2024, there were no matters submitted to a vote of security holders through the solicitation of proxies or otherwise. |
Item 10. | Remuneration Paid to Directors, Officers, and Others of Open-End Management Investment Companies. The following chart provides certain information about the Trustee fees paid by the Trust for the period ended September 30, 2024: |
| | Aggregate Regular Compensation from Trust | Aggregate Special Compensation from the Trust | Total Compensation from the Trust |
| Ward Armstrong | $104,000.00 | $- | $104,000.00 |
| J.W. Hutchens | $87,000.00 | $- | $87,000.00 |
| Merrillyn Kosier | $87,000.00 | $- | $87,000.00 |
| Patrick Seese | $94,500.00 | $- | $94,500.00 |
| Totals | $ 372,500.00 | $- | $ 372,500.00 |
Item 11. | Statement Regarding Basis for Approval of Investment Advisory Contract. Basis of Approval of the Investment Advisory Contract for the Beacon Accelerated Return Strategy Fund (“BARS Fund”) and the Beacon Planned Return Strategy Fund (“BPRS Fund” and together with the BARS Fund, the “Beacon Funds”) On August 15, 2024, the Board of Trustees (the “Board”) of ALPS Series Trust (the “Trust”) met in person to discuss, among other things, the renewal and approval of the Investment Advisory Agreement between the Trust and Beacon Investment Advisory Services, Inc. (“Beacon”) in accordance with Section 15(c) of the 1940 Act (“Beacon Agreement”). The Independent Trustees met with independent legal counsel during executive session and discussed the Investment Advisory Agreement and other related materials. The Trustees noted that in evaluating Beacon and the fees charged under the Beacon Agreement, no single factor reviewed by the Trustees was identified by the Trustees to be determinative as the principal factor in whether to renew the Beacon Agreement. Further, the Independent Trustees were advised by independent legal counsel throughout the process. The following summary does not identify all the matters considered by the Board, but instead provides a summary of the principal matters the Board considered. Nature, Extent and Quality of the Services: The Trustees acknowledged and reflected on the information provided concerning the nature, extent and quality of services provided to the Beacon Funds under the Beacon Agreement. The Trustees examined the materials supplied by Beacon, including but not limited to its compliance reports, Form ADV, ownership structure as a subsidiary of a larger organization, and consolidated financial statements of its parent company. The Trustees discussed Beacon’s history as an asset manager, its performance, and its investment advisory personnel. The Trustees observed Beacon’s disciplined, systematic approach to allocations while incorporating some level of downside protection. The Trustees also evaluated the research and decision-making processes utilized by Beacon, including the methods adopted in pursuit of its investment objectives and compliance with the policies and restrictions of the Beacon Funds. The Trustees considered Beacon’s strong compliance record and its commitment to a culture of compliance. The Trustees considered the background and experience of Beacon’s team, which included the review of qualifications, background, and responsibilities of the portfolio managers primarily responsible for the day-to-day portfolio management of the Beacon Funds, the extent of the resources devoted to research and analysis. They discussed Beacon’s approach to achieving best execution of trades. The Trustees concluded that the nature, extent and quality of the services provided by Beacon supported the renewal of the Agreement. Performance: The Board reviewed the performance information provided for the Funds for the period ended May 31, 2024, as compared to each Fund’s benchmark index, and for the one-year, three-year, five-year and since inception periods ended May 31, 2024, against a peer group selected by an independent data provider (the “Data Provider”). The Trustees noted that the Institutional Class of both Funds had outperformed the Cboe BXM Buy/Write Index for the three-month period ended May 31, 2024. They further observed that each Fund’s Institutional Class performance ranked in the top quartile versus its peer group for each period, except that the BPRS Fund’s Institutional Class was in the second lowest performing quartile over the one-year period. They discussed each Fund’s Morningstar rating. The Board noted their satisfaction with each Beacon Fund’s performance, noting Beacon’s disciplined implementation of its strategy. |
| Investment Advisory Fee Rate and Net Expense Ratio: The Trustees reviewed the contractual annual advisory fee of 1.00% of the BARS Fund’s daily average net assets paid to Beacon and compared the fees paid by a peer group of other funds with similar investment strategies selected by the Data Provider. They considered that the BARS Fund’s advisory fee and the Institutional Class’s total net expense ratio were each below the median of the peer group. The Trustees noted that the BPRS Fund’s contractual annual advisory fee of 1.00% was higher than its peer group median, and that the net expenses paid by the Institutional Class were above the median of the peer group, but in both cases within the range of fees and expenses paid by peers and the funds in the applicable category. The Board acknowledged Beacon’s depictions regarding the differences in strategies of the peer funds compared to the Beacon Funds, noting that the adviser believed the execution of each Beacon Fund’s strategy required more resources than certain peer funds. After further discussion, the Trustees determined that the contractual annual advisory fees, taking into consideration the total net expenses for each Fund, were not unreasonable for the quality of services provided. Profitability: The Trustees received and considered a profitability analysis based on the fees paid under the Beacon Agreement prepared by Beacon. The Trustees observed that Beacon’s work with each Fund was profitable, but that the amount of profit was not unreasonable. The Trustees reviewed and discussed the financial statements of Beacon’s parent company, acknowledging that Beacon’s parent company was well capitalized. In consideration of the fact that Beacon’s work with the Funds was profitable, and that Beacon’s parent company was well capitalized, the Board did not have concerns regarding the firm’s continued viability. Comparable Accounts: The Trustees observed that Beacon did not manage any other accounts with similar strategies. Economies of Scale: The Trustees deliberated whether Beacon was benefiting from economies of scale in the provision of services to each Beacon Fund and whether such economies should be shared with the shareholders. The Board noted Beacon’s belief that it was able to achieve certain internal economies of scale through resource sharing with its parent company because the firm was part of a large organization and thus was able to charge the Funds a lower advisory fee at each of their respective current asset levels than it otherwise would be able to if Beacon was a smaller organization. The Board reviewed each Beacon Fund’s assets under management and each of their prospects for growth. Other Benefits to the Adviser: The Trustees evaluated and contemplated any incidental benefits derived or to be derived by Beacon from its relationship with each Beacon Fund, including research and other support services. Having requested and reviewed such information from Beacon as the Board believed to be reasonably necessary to evaluate the terms of the Beacon Agreement, the Trustees, including all the Independent Trustees, determined that renewal of the Beacon Agreement was in the best interests of each Beacon Fund and its respective shareholders. |
| Basis of Approval of the Investment Advisory Contract for the Carret Kansas Tax-Exempt Bond Fund (the “Fund” or the “Carret Fund”) On August 17, 2023, the Board of Trustees (the “Board”) of ALPS Series Trust (the “Trust”) met in person to discuss, among other things, the renewal and approval of the Investment Advisory Agreement between the Trust and Carret Asset Management, LLC (“Carret”) in accordance with Section 15(c) of the 1940 Act (“Carret Agreement”). The Independent Trustees met with independent legal counsel during executive session and discussed the Investment Advisory Agreement and other related materials. In evaluating Carret and the fees charged under the Carret Agreement, the Trustees resolved that no single factor reviewed by the Trustees was identified by the Trustees to be determinative as the principal factor in whether to renew the Carret Agreement. Further, the Independent Trustees were advised by independent legal counsel throughout the process. The following summary does not identify all the matters considered by the Board but provides a summary of the principal matters the Board considered. Nature, Extent and Quality of the Services: The Trustees received and considered information included in the Meeting Materials regarding the nature, extent and quality of services provided to the Carret Fund under the Carret Agreement. The Trustees reviewed the background materials supplied by Carret, including audited consolidated financial statements with its parent company, organizational chart, Form ADV, compliance reports, and expense limitation agreement. The Trustees assessed Carret’s history as an asset manager. The Trustees discussed the research and decision-making processes utilized by Carret, including the methods adopted to achieve compliance with the investment objective, policies, and restrictions of the Carret Fund, and observed that the portfolio managers of the Fund had a clear methodology for selecting assets for inclusion in the Fund’s portfolio. The Trustees considered the background and experience of Carret’s management team, including the qualifications, background, and responsibilities of the portfolio managers primarily responsible for the day-to-day portfolio management of the Carret Fund, and noted there were no personnel changes since the last renewal. The Trustees examined the backgrounds of key investment personnel responsible for servicing the Fund and took note of their education and diverse financial industry experience. The Trustees also considered the reputation of Carret and its ability to deliver all services required of an adviser. The Trustees considered Carret’s commitment to providing high quality service to the Carret Fund, as observed by the Trustees in their interaction with Carret personnel and confirmed by the officers of the Trust and concluded that the quality of services provided by Carret to the Carret Fund were of high quality. Performance: The Trustees discussed the Fund’s performance relative to its benchmark index and a peer group of other funds provided by an independent third-party. The Trustees acknowledged that the Fund’s performance may differ compared to its peers based on the individual investment mandates of each fund and discussed the impact of the Fund’s strategy change in April 2024 that allowed for investment outside of Kansas. The Trustees noted that the Fund’s returns relative to the Fund’s peer group for the one-year, three-year, five-year, and ten-year periods ended May 31, 2024 were below median. They also reviewed performance compared to a group of Kansas focused funds that was provided by Carret. It was the consensus of the Trustees that the returns were not unreasonable given the Fund’s focus on Kansas bonds. |
| Investment Advisory Fee Rate and Net Expense Ratio: The Trustees noted that the Carret Fund’s contractual annual advisory fee was 0.30%. The Trustees noted that both the advisory fee and the net operating expenses of the Fund were below the peer group median. After further consideration, the Trustees determined that the annual advisory fee was not unreasonable for the quality of services provided. Profitability: The Trustees received and reviewed information related to Carret’s profitability with respect to its relationship with the Fund. The Trustees also considered the impact of the expense limitation agreement with respect to Carret’s profits earned. The Trustees then reviewed and discussed Carret’s consolidated financial statements to analyze Carret’s stability. The Trustees considered the level of profit earned by Carret and concluded it was not excessive either in terms of a total dollar amount or as a percentage of gross revenue earned. Comparable Accounts: The Trustees noted certain information provided by Carret regarding fees charged to its clients utilizing a strategy similar to that employed by the Carret Fund. The Trustees determined that the fee structures applicable to Carret’s other clients employing a comparable strategy to the Fund were not indicative of any unreasonableness with respect to the advisory fee payable by the Fund, taking into consideration the limitations of comparing different types of managed accounts and the different levels of service typically associated with such accounts. Economies of Scale: The Trustees considered whether economies of scale had been reached with respect to Carret’s management of the Fund. They noted the benefits received by shareholders from the expense limitation agreement. The Trustees also considered that Fund shareholders benefited from the scale of Carret’s advisory business, which afforded opportunities in terms of execution, access to markets and research, and similar benefits of institutional investing, but that the Fund’s assets under management now and during the renewal period would likely not result in material additional economies of scale for Carret. Other Benefits to the Adviser: The Trustees also contemplated whether any other benefits were derived by Carret from its relationship with the Fund, noting that Carret identified no material ancillary benefits. Having requested and reviewed such information from Carret as the Board believed to be reasonably necessary to evaluate the terms of the Carret Agreement, the Trustees concluded that the compensation of Carret was appropriate under the Carret Agreement and the renewal of the Carret Agreement was in the best interests of the Carret Fund and its shareholders. |
| Item 12. | Disclosure of Proxy Voting Policies and Procedures for Closed-End Management Investment Companies. |
| | | Not applicable to the registrant. |
| Item 13. | Portfolio Managers of Closed-End Management Investment Companies. |
| | | Not applicable to the registrant. |
| Item 14. | Purchases of Equity Securities by Closed-End Management Investment Company and Affiliated Purchasers. |
| | | Not applicable to the registrant. |
| Item 15. | Submission of Matters to a Vote of Security Holders. |
| | | There have been no material changes to the procedures by which shareholders may recommend nominees to the registrant’s Board of Trustees, where those changes were implemented after the registrant last provided disclosure in response to the requirements of Item 407(c)(2)(iv) of Regulation S-K, or this Item. |
| Item 16. | Controls and Procedures. |
| | (a) | The registrant’s principal executive officer and principal financial officer have evaluated the registrant’s disclosure controls and procedures (as defined in Rule 30a-3(c) under the Investment Company Act of 1940, as amended) within 90 days of this report and have concluded that the registrant’s disclosure controls and procedures were effective as of that date. |
| | (b) | There was no change in the registrant’s internal control over financial reporting (as defined in Rule 30a-3(d) under the Investment Company Act of 1940, as amended) during the period covered by this report that has materially affected, or is reasonably likely to materially affect, the registrant’s internal control over financial reporting. |
| Item 17. | Disclosure of Securities Lending Activities for Closed-end Management Investment Companies. |
| | | Not applicable to the registrant. |
| Item 18. | Recovery of Erroneously Awarded Compensation. |
| | (a)(4) | Not applicable to this report. |
SIGNATURES
Pursuant to the requirements of the Securities Exchange Act of 1934 and the Investment Company Act of 1940, the registrant has duly caused this report to be signed on its behalf by the undersigned, thereunto duly authorized.
ALPS SERIES TRUST
| By: | /s/ Lucas Foss | |
| | Lucas Foss | |
| | President (Principal Executive Officer) | |
| | | |
| Date: | December 9, 2024 | |
Pursuant to the requirements of the Securities Exchange Act of 1934 and the Investment Company Act of 1940, this report has been signed below by the following persons on behalf of the registrant and in the capacities and on the dates indicated.
| By: | /s/ Lucas Foss | |
| | Lucas Foss | |
| | President (Principal Executive Officer) | |
| | | |
| Date: | December 9, 2024 | |
| | | |
| By: | /s/ Jill McFate | |
| | Jill McFate | |
| | Treasurer (Principal Financial Officer) | |
| | | |
| Date: | December 9, 2024 | |