UNITED STATES
SECURITIES AND EXCHANGE COMMISSION
Washington, D.C. 20549
FORM N-CSR
CERTIFIED SHAREHOLDER REPORT OF REGISTERED MANAGEMENT INVESTMENT COMPANIES
Investment Company Act file number: 811-22819
ETFis Series Trust I
(Exact name of registrant as specified in charter)
1540 Broadway, 16th Floor, New York, New York 10036
(Address of principal executive offices) (Zip code)
William J. Smalley, President, 1540 Broadway, 16th Floor, New York, New York 10036
(Name and address of agent for service)
Registrant's telephone number, including area code: (212) 593-4383
Date of fiscal year end: 10/31/2015
Date of reporting period: 10/31/2015
Form N-CSR is to be used by management investment companies to file reports with the Commission not later than 10 days after the transmission to stockholders of any report that is required to be transmitted to stockholders under Rule 30e-1 under the Investment Company Act of 1940 (17 CFR 270.30e-1). The Commission may use the information provided on Form N-CSR in its regulatory, disclosure review, inspection, and policymaking roles.
A registrant is required to disclose the information specified by Form N-CSR, and the Commission will make this information public. A registrant is not required to respond to the collection of information contained in Form N-CSR unless the Form displays a currently valid Office of Management and Budget ("OMB") control number. Please direct comments concerning the accuracy of the information collection burden estimate and any suggestions for reducing the burden to Secretary, Securities and Exchange Commission, 450 Fifth Street, NW, Washington, DC 20549-0609. The OMB has reviewed this collection of information under the clearance requirements of 44 U.S.C. § 3507.
Item 1. Reports to Stockholders.
ETFis Series Trust I
BIOSHARES BIOTECHNOLOGY CLINICAL TRIALS FUND
BIOSHARES BIOTECHNOLOGY PRODUCTS FUND
TUTTLE TACTICAL MANAGEMENT MULTI-STRATEGY INCOME ETF
TUTTLE TACTICAL MANAGEMENT U.S. CORE ETF
VIRTUS NEWFLEET MULTI-SECTOR UNCONSTRAINED BOND ETF
INFRACAP MLP ETF
| Virtus ETFs | ANNUAL REPORT |
| | October 31, 2015 |
|
| Table of Contents |
| October 31, 2015 |
|
| Shareholder Letter |
| October 31, 2015 |
Dear Fellow ETFis Funds Shareholder:
I am pleased to present the second annual report for the ETFis Series Trust I, which reviews the performance of the Funds within the Trust for the twelve months ended October 31, 2015.
Over the reporting period, the Trust expanded from one fund to seven funds representing the distinct investment strategies of five sub-advisers. New additions include two funds which provide exposure to the niche areas of clinical trials and product within the biotechnology space; two tactical asset allocation funds: one focused primarily on the U.S. equity market, the other on fixed income and non-traditional income strategies; an unconstrained global bond fund with the flexibility to invest across fixed income sectors; and a fund that offers exposure to equity securities of companies in the utility sector.
| Fund | | Sub-adviser | | Inception Date |
| BioShares Biotechnology Clinical Trials Fund (BBC) | | LifeSci Index Partners, LLC | | December 16, 2014 |
| BioShares Biotechnology Products Fund (BBP) | | LifeSci Index Partners, LLC | | December 16, 2014 |
| Tuttle Tactical Management Multi-Strategy Income ETF (TUTI) | | Tuttle Tactical Management | | June 9, 2015 |
| Tuttle Tactical Management U.S. Core ETF (TUTT) | | Tuttle Tactical Management | | February 24, 2015 |
| Virtus Newfleet Multi-Sector Unconstrained Bond ETF (NFLT) | | Newfleet Asset Management | | August 10, 2015 |
| InfraCap MLP ETF (AMZA) | | Infrastructure Capital Advisers, LLC | | October 1, 2014 |
| Reaves Utilities ETF (UTES)* | | Reaves Asset Management | | September 23, 2015 |
| * | Fund not included within this report as its fiscal year-end is July 31. |
The report provides financial statements and portfolio information for all of the above Funds, with the exception of Reaves Utilities ETF. For the Funds with a performance history of more than six months, the report also provides commentary from the portfolio manager on how the Fund performed relative to the markets in which it invests.
On behalf of the sub-advisers, thank you for your investment. If you have questions, please contact your financial adviser, or call 1-888-383-0553. We also invite you to visit our website, www.virtusetfs.com, to learn more about the funds.
Sincerely,
William Smalley
President
ETFis Series Trust I
This material must be accompanied or preceded by the prospectus.
|
| Portfolio Summaries |
| October 31, 2015 |
BioShares Biotechnology Clinical Trials Fund
For the partial fiscal year from inception date (12/16/2014) through fiscal year end (10/31/2015), the S&P 500 index was up 5.4% compared to 9.6% for the LifeSci Biotechnology Clinical Trials Index. Although volatility has been high, biotechnology stocks in general have outperformed the broader stock market.
The BioShares Biotechnology Clinical Trials Fund (“BBC” or “the Fund”) performed in-line with its respective index up 9.46%.
BBC benefited from (1) continued advancement of various clinical trials particularly in various cancers, Duchenne’s muscular dystrophy and Alzheimer’s, (2) technological advancements in areas including gene therapy, immuno-oncology, microbial research and gene editing, and (3) continued M&A trends resulting in 4 stocks in the portfolio entering into definitive acquisition agreements. BBC suffered from (1) questions on valuation levels of individual stocks, particularly as stocks in the portfolio are unprofitable, (2) increasing concerns on the high prices of prescription pharmaceutical products, and (3) various clinical trial failures or disappointments in areas such as sickle-cell disease, macular degeneration and various cancers.
Biotechnology Sector Risk: The fund’s assets will be concentrated in investments in the securities of issuers engaged primarily in the biotechnology industry. Companies within the biotechnology sector spend heavily on research and development, which may not necessarily lead to commercially successful products in the near or long term. In order to fund operations, these companies may require financing from the capital markets, which may not always be available on satisfactory terms or at all. The biotechnology sector is also subject to significant governmental regulation, and the need for governmental approvals, including, without limitation, FDA approval. The securities of biotechnology companies, especially those of smaller or newer companies, tend to be more volatile than those of companies with larger capitalizations or markets generally.
| Asset Allocation as of 10/31/2015 (based on net assets) (unaudited) |
| Healthcare | | | 99.8 | % |
| Other Assets | | | 0.2 | % |
| Total | | | 100 | % |
Performance as of 10/31/2015 (unaudited)
| | | Total Return |
| | | Fund
Net Asset Value | | Fund
Market Price | | LifeSci Biotechnology
Clinical Trials Index1 |
| Since Inception2 | | 9.46% | | 9.40% | | 9.63% |
| 1 | The LifeSci Biotechnology Clinical Trials Index is designed to track the performance of U.S. listed biotechnology stocks with a lead drug in the clinical trial stage of development, typically a Phase 1, Phase 2 or Phase 3 trial, but prior to receiving marketing approval. The index is unmanaged, its returns do not reflect any fees, expenses, or sales charges, and is not available for direct investment. |
Performance data quoted represents past performance and past performance does not guarantee future results. Investment return and principal value of an investment will fluctuate so that an investor’s shares, when sold or redeemed, may be worth more or less than the original cost. Current performance data may be higher or lower than actual data quoted. Returns do not reflect the deduction of taxes a shareholder would pay on Fund distributions or the redemption of Fund shares. For the most current month-end performance data please visit www.bioshares.com or call toll free (888) 383-0553. Market price returns are based on the mid-point of the highest bid and lowest offer for Fund shares as of the scheduled close of regular trading on the New York Stock Exchange (“NYSE”) Arca, ordinarily 4:00 p.m. Eastern time, on each day during which the NYSE is open for trading, and do not represent the returns an investor would receive if shares were traded at other times.
Exchange Traded Funds: The value of an ETF may be more volatile than the underlying portfolio of securities the ETF is designed to track. The costs of owning the ETF may exceed the cost of investing directly in the underlying securities.
Industry/Sector Concentration: A fund that focuses its investments in a particular industry or sector will be more sensitive to conditions that affect that industry or sector than a non-concentrated fund.
Market Price/NAV: At the time of purchase and/or sale, an investor’s shares may have a market price that is above or below the fund’s NAV, which may increase the investor’s risk of loss.
Correlation to Index: The performance of the fund and its index may vary somewhat due to factors such as fund flows, transaction costs, and timing differences associated with additions to and deletions from its index.
|
| Portfolio Summaries (continued) |
| October 31, 2015 |
BioShares Biotechnology Clinical Trials Fund (continued)
Non-Diversified: The fund is non-diversified and may be more susceptible to factors negatively impacting its holdings to the extent that each security represents a larger portion of the fund’s assets.
No Guarantee: There is no guarantee that the portfolio will meet its objective.
Prospectus: For additional information on risks, please see the fund’s prospectus. The Fund may not be suitable for all investors.
Value of a $10,000 Investment Since Inception at Net Asset Value (unaudited)
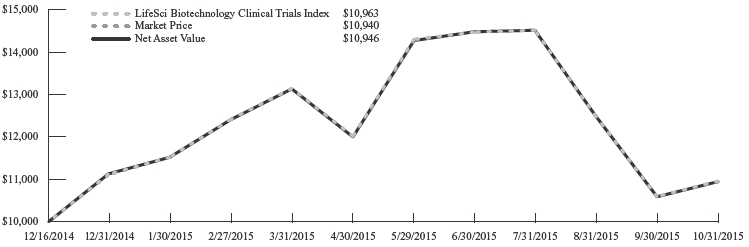
The chart above represents historical performance of a hypothetical investment of $10,000 over the life of the Fund, assuming reinvestment of distributions. Past performance does not guarantee future results.
|
| Portfolio Summaries (continued) |
| October 31, 2015 |
BioShares Biotechnology Products Fund
For the partial fiscal year from inception date (12/16/2014) through fiscal year end (10/31/2015), the S&P 500 index was up 5.4% compared The LifeSci Biotechnology Products Index, 22.8%. Although volatility has been high, biotechnology stocks in general have outperformed the broader stock market.
BioShares Biotechnology Products Fund (“BBP” or “the Fund”) NAV was up 21.99%.
The Fund benefited from (1) continued M&A trends resulting in 5 stocks in the portfolio entering into definitive acquisition agreements and (2) continued strong revenue growth. The Fund suffered from (1) increasing concerns on the high prices of prescription pharmaceutical products and (2) questions on valuation levels of individual stocks.
Biotechnology Sector Risk: The fund’s assets will be concentrated in investments in the securities of issuers engaged primarily in the biotechnology industry. Companies within the biotechnology sector spend heavily on research and development, which may not necessarily lead to commercially successful products in the near or long term. In order to fund operations, these companies may require financing from the capital markets, which may not always be available on satisfactory terms or at all. The biotechnology sector is also subject to significant governmental regulation, and the need for governmental approvals, including, without limitation, FDA approval. The securities of biotechnology companies, especially those of smaller or newer companies, tend to be more volatile than those of companies with larger capitalizations or markets generally.
| Asset Allocation as of 10/31/2015 (based on net assets) (unaudited) |
| Healthcare | | | 100 | % |
| Other Liabilities | | | (0.0 | )%* |
| Total | | | 100 | % |
* Amount rounds to less than 0.05%.
Performance as of 10/31/2015 (unaudited)
| | | Total Return |
| | | Fund
Net Asset Value | | Fund
Market Price | | LifeSci Biotechnology
Products Index1 |
| Since Inception2 | | 21.99% | | 22.00% | | 22.75% |
| 1 | The LifeSci Biotechnology Products Index is designed to track the performance of U.S. listed biotechnology stocks with at least one drug therapy approved by the U.S. Food and Drug Administration for marketing. The index is unmanaged, its returns do not reflect any fees, expenses, or sales charges, and is not available for direct investment. |
Performance data quoted represents past performance and past performance does not guarantee future results. Investment return and principal value of an investment will fluctuate so that an investor’s shares, when sold or redeemed, may be worth more or less than the original cost. Current performance data may be higher or lower than actual data quoted. Returns do not reflect the deduction of taxes a shareholder would pay on Fund distributions or the redemption of Fund shares. For the most current month-end performance data please visit www.bioshares.com or call toll free (888) 383-0553. Market price returns are based on the mid-point of the highest bid and lowest offer for Fund shares as of the scheduled close of regular trading on the New York Stock Exchange (“NYSE”) Arca, ordinarily 4:00 p.m. Eastern time, on each day during which the NYSE is open for trading, and do not represent the returns an investor would receive if shares were traded at other times.
Exchange Traded Funds: The value of an ETF may be more volatile than the underlying portfolio of securities the ETF is designed to track. The costs of owning the ETF may exceed the cost of investing directly in the underlying securities.
Industry/Sector Concentration: A fund that focuses its investments in a particular industry or sector will be more sensitive to conditions that affect that industry or sector than a non-concentrated fund.
Market Price/NAV: At the time of purchase and/or sale, an investor’s shares may have a market price that is above or below the fund’s NAV, which may increase the investor’s risk of loss.
Correlation to Index: The performance of the fund and its index may vary somewhat due to factors such as fund flows, transaction costs, and timing differences associated with additions to and deletions from its index.
|
| Portfolio Summaries (continued) |
| October 31, 2015 |
BioShares Biotechnology Products Fund (continued)
Non-Diversified: The fund is non-diversified and may be more susceptible to factors negatively impacting its holdings to the extent that each security represents a larger portion of the fund’s assets.
No Guarantee: There is no guarantee that the portfolio will meet its objective.
Prospectus: For additional information on risks, please see the fund’s prospectus. The Fund may not be suitable for all investors.
Value of a $10,000 Investment Since Inception at Net Asset Value (unaudited)
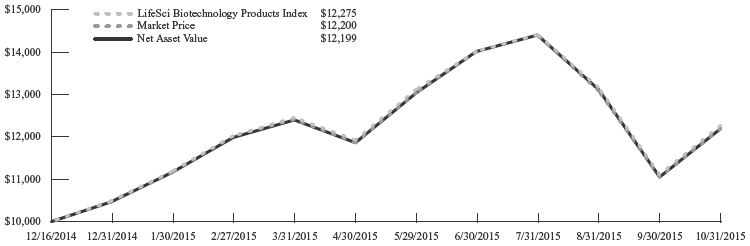
The chart above represents historical performance of a hypothetical investment of $10,000 over the life of the Fund, assuming reinvestment of distributions. Past performance does not guarantee future results.
|
| Portfolio Summaries (continued) |
| October 31, 2015 |
Tuttle Tactical Management Multi-Strategy Income ETF
This discussion of operations relates to a short fiscal period. Tuttle Tactical Management Multi Strategy Income ETF (“TUTI” or “the Fund”) began operations on June 9, 2015 (commencement of operations), and the fiscal year ended on October 31, 2015. During this period, the net asset value of TUTI fell from $24.61 to $23.72. During the same period, the Barclay’s Aggregate Bond Index rose 1.52%.
TUTI was launched during a period of market turmoil. June and July saw crisis’ in Greece and China and August saw a global market selloff followed by a swift rally in October. While the Fund’s defensive positions helped insulate it from much of the market volatility during the period, the Fund’s performance was, nevertheless, negatively impacted by its exposure to equity markets during the selloff.
Key elements of the portfolio strategy for the Fund were initiated during the period:
| • | The models were enhanced to be more sensitive to increasing stock market volatility |
| • | The models were enhanced to be less sensitive to rebalance date risk. |
These key elements will better allow the Fund to adapt to choppy market environments.
| Asset Allocation as of 10/31/2015 (based on net assets) (unaudited) |
| Debt Funds | | | 63.8 | % |
| Equity Funds | | | 32.3 | % |
| Other Assets | | | 3.9 | % |
| Total | | | 100 | % |
Performance as of 10/31/2015 (unaudited)
| | | Total Return |
| | | Fund
Net Asset Value | | Fund
Market Price | | Barclays Global
Aggregate Bond Index1 | | Composite: 80%
Barclays Global Aggregate
Bond / 20% MSCI USA High
Dividend Yield (net)2 |
| Since Inception3 | | (3.63)% | | (3.58)% | | 1.52% | | 2.20% |
| 1 | The Barclays Global Aggregate Bond Index measures the global investment grade fixed rate bond market. The index is calculated on a total return basis. The index is unmanaged, its returns do not reflect any fees, expenses, or sales charges, and is not available for direct investment. |
| 2 | The composite index consists of 80% Barclays Global Aggregate Bond Index (an index measuring the global investment grade bond market, calculated on a total return basis) and 20% MSCI USA High Dividend Yield Index (an index that measures performance of equities in the large and mid cap segments (excluding REITs) of the US market, that have higher dividend income and quality characteristics than average dividend yields that are both sustainable and persistent, calculated on a total return basis with net dividends reinvested). The composite index is unmanaged, its returns do not reflect any fees, expenses, or sales charges, and is not available for direct investment. |
Performance data quoted represents past performance and past performance does not guarantee future results. Investment return and principal value of an investment will fluctuate so that an investor’s shares, when sold or redeemed, may be worth more or less than the original cost. Current performance data may be higher or lower than actual data quoted. Returns do not reflect the deduction of taxes a shareholder would pay on Fund distributions or the redemption of Fund shares. For the most current month-end performance data please visit www.tuttlefunds.com or call toll free (888) 383-0553. Market price returns are based on the mid-point of the highest bid and lowest offer for Fund shares as of the scheduled close of regular trading on the New York Stock Exchange (“NYSE”) Arca, ordinarily 4:00 p.m. Eastern time, on each day during which the NYSE is open for trading, and do not represent the returns an investor would receive if shares were traded at other times.
Exchange Traded Funds: The value of an ETF may be more volatile than the underlying portfolio of securities the ETF is designed to track. The costs of owning the ETF may exceed the cost of investing directly in the underlying securities.
Equity Securities: The market price of equity securities may be adversely affected by financial market, industry, or issuer-specific events. Focus on a particular style or on small or medium-sized companies may enhance that risk.
Market Price/NAV: At the time of purchase and/or sale, an investor’s shares may have a market price that is above or below the fund’s NAV, which may increase the investor’s risk of loss.
Portfolio Turnover: The fund’s principal investments strategies will result in a consistently high portfolio turnover rate. A higher portfolio turnover rate may indicate higher transaction costs and may result in higher taxes when fund shares are held in a taxable account.
|
| Portfolio Summaries (continued) |
| October 31, 2015 |
Tuttle Tactical Management Multi-Strategy Income ETF (continued)
Allocation: The fund’s exposure to different asset classes may not be optimal for market conditions at a given time. Asset allocation does not guarantee a profit or protect against a loss in declining markets.
No Guarantee: There is no guarantee that the portfolio will meet its objective.
Prospectus: For additional information on risks, please see the fund’s prospectus. The Fund may not be suitable for all investors.
Value of a $10,000 Investment Since Inception at Net Asset Value (unaudited)
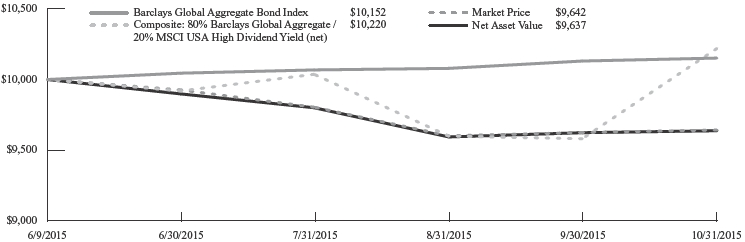
The chart above represents historical performance of a hypothetical investment of $10,000 over the life of the Fund, assuming reinvestment of distributions. Past performance does not guarantee future results.
|
| Portfolio Summaries (continued) |
| October 31, 2015 |
Tuttle Tactical Management U.S. Core ETF
This discussion of operations relates to a short fiscal period. Tuttle Tactical Management U.S. Core ETF (“TUTT” or “the Fund”) began operations on February 24, 2015 (commencement of operations), and the fiscal year ended on October 31, 2015. During this period, the net asset value of TUTT fell from $24.62 to $23.01. During the same period, the S&P 500 rose 0.36%.
February was an extremely strong month for the market but the Fund launched at an intermediate term market top from a near fully invested market position. Through mid-year, the Fund’s performance generally followed the equity markets, which experienced mild volatility, but remained relatively steady. However, stock prices broadly declined during August and September and quickly reversed in October.
Tactical strategies like the Fund’s can underperform in these types of choppy market environments because market downturns that rapidly reverse may result in the portfolio experiencing some of the market decline while shifting to defensive allocations that then miss out on the unexpected rally. The Fund experienced this scenario during the August-October period, when the Fund’s performance was adversely impacted by the timing of the Fund’s shift into more defensive positions.
Key elements of the portfolio strategy for the Fund were initiated during the period:
| • | The models were enhanced to be more sensitive to increasing stock market volatility |
| • | The models were enhanced to be less sensitive to rebalance date risk. |
These key elements will better allow the Fund to adapt to choppy market environments.
| Asset Allocation as of 10/31/2015 (based on net assets) (unaudited) |
| Debt Funds | | | 57.9 | % |
| Equity Funds | | | 40.2 | % |
| Other Assets | | | 1.9 | % |
| Total | | | 100 | % |
Performance as of 10/31/2015 (unaudited)
| | | Total Return |
| | | Fund
Net Asset Value | | Fund
Market Price | | S&P 500® Index1 |
| Since Inception2 | | (6.53)% | | (6.48)% | | 0.36% |
| 1 | The S&P 500® Index is a free-float market capitalization-weighted index of 500 of the largest U.S. companies. The index is calculated on a total return basis with dividends reinvested. The index is unmanaged, its returns do not reflect any fees, expenses, or sales charges, and is not available for direct investment. |
Performance data quoted represents past performance and past performance does not guarantee future results. Investment return and principal value of an investment will fluctuate so that an investor’s shares, when sold or redeemed, may be worth more or less than the original cost. Current performance data may be higher or lower than actual data quoted. Returns do not reflect the deduction of taxes a shareholder would pay on Fund distributions or the redemption of Fund shares. For the most current month-end performance data please visit www.tuttlefunds.com or call toll free (888) 383-0553. Market price returns are based on the mid-point of the highest bid and lowest offer for Fund shares as of the scheduled close of regular trading on the New York Stock Exchange (“NYSE”) Arca, ordinarily 4:00 p.m. Eastern time, on each day during which the NYSE is open for trading, and do not represent the returns an investor would receive if shares were traded at other times.
Exchange Traded Funds: The value of an ETF may be more volatile than the underlying portfolio of securities the ETF is designed to track. The costs of owning the ETF may exceed the cost of investing directly in the underlying securities.
Equity Securities: The market price of equity securities may be adversely affected by financial market, industry, or issuer-specific events. Focus on a particular style or on small or medium-sized companies may enhance that risk.
Market Price/NAV: At the time of purchase and/or sale, an investor’s shares may have a market price that is above or below the fund’s NAV, which may increase the investor’s risk of loss.
Portfolio Turnover: The fund’s principal investments strategies will result in a consistently high portfolio turnover rate. A higher portfolio turnover rate may indicate higher transaction costs and may result in higher taxes when fund shares are held in a taxable account.
Allocation: The fund’s exposure to different asset classes may not be optimal for market conditions at a given time. Asset allocation does not guarantee a profit or protect against a loss in declining markets.
|
| Portfolio Summaries (continued) |
| October 31, 2015 |
Tuttle Tactical Management U.S. Core ETF (continued)
No Guarantee: There is no guarantee that the portfolio will meet its objective.
Prospectus: For additional information on risks, please see the fund’s prospectus. The Fund may not be suitable for all investors.
Value of a $10,000 Investment Since Inception at Net Asset Value (unaudited)

The chart above represents historical performance of a hypothetical investment of $10,000 over the life of the Fund, assuming reinvestment of distributions. Past performance does not guarantee future results.
|
| Portfolio Summaries (continued) |
| October 31, 2015 |
Virtus Newfleet Multi-Sector Unconstrained Bond ETF
The Virtus Newfleet Multi-Sector Unconstrained Bond ETF (NYSE: NFLT) launched on August 10, 2015. This actively managed ETF seeks to provide a high level of current income and, secondarily, capital appreciation.
Newfleet Asset Management’s cornerstone philosophy emphasizes choosing the right pockets of the global bond market at the right times. Newfleet believes the most effective way to achieve long-term excess returns is through the combination of active sector rotation and disciplined risk management. NFLT is a logical extension of Newfleet’s proven multi-sector approach. While NFLT embraces the virtues of diversification, the lack of formal sector, industry, or country limitations means that the portfolio management team can express its highest conviction ideas within the portfolio.
At its inception, NFLT was seeded with $122.5 million of investor capital. The portfolio management team made the conscious decision to methodically invest the proceeds as the period of mid-to-late August is generally quiet with many on Wall Street taking mandatory vacation pre-Labor Day. Rather than invest rapidly at potentially unattractive levels, the team was patient in entering the most attractive fixed income sectors over the period.
The Fund continued to receive inflows during September and October. Throughout this period, the team continued to methodically invest the proceeds in the sectors believed to offer the best relative value. By the end of September, a little over seven weeks after launch, NFLT was 49% invested, with $130 million of assets under management. As of October 31, 2015, NFLT was 68% invested, with $153 million of net assets under management.
| Asset Allocation as of 10/31/2015 (based on net assets) (unaudited) |
| Corporate Bonds | | | 32.7 | % |
| Term Loans | | | 14.1 | % |
| Mortgage Backed Securities | | | 11.1 | % |
| Foreign Bonds | | | 6.2 | % |
| Asset Backed Securities | | | 3.8 | % |
| Money Market Funds | | | 42.7 | % |
| Other Liabilities | | | (10.6 | )% |
| Total | | | 100 | % |
Performance as of 10/31/2015 (unaudited)
| | | Total Return |
| | | Fund
Net Asset Value | | Fund
Market Price | | Barclays U.S.
Aggregate Bond Index1 |
| Since Inception2 | | 0.47% | | 0.44% | | 0.75% |
| 1 | The Barclays U.S. Aggregate Bond Index measures the U.S. investment grade fixed rate bond market. The index is calculated on a total return basis. The index is unmanaged, its returns do not reflect any fees, expenses, or sales charges, and is not available for direct investment. |
Performance data quoted represents past performance and past performance does not guarantee future results. Investment return and principal value of an investment will fluctuate so that an investor’s shares, when sold or redeemed, may be worth more or less than the original cost. Current performance data may be higher or lower than actual data quoted. Returns do not reflect the deduction of taxes a shareholder would pay on Fund distributions or the redemption of Fund shares. For the most current month-end performance data please visit www.virtus.com or call toll free (888) 383-0553. Market price returns are based on the mid-point of the highest bid and lowest offer for Fund shares as of the scheduled close of regular trading on the New York Stock Exchange (“NYSE”) Arca, ordinarily 4:00 p.m. Eastern time, on each day during which the NYSE is open for trading, and do not represent the returns an investor would receive if shares were traded at other times.
Credit & Interest: Debt securities are subject to various risks, the most prominent of which are credit and interest rate risk. The issuer of a debt security may fail to make interest and/or principal payments. Values of debt securities may rise or fall in response to changes in interest rates, and this risk may be enhanced with longer-term maturities.
High Yield-High Risk Fixed Income Securities: There is a greater level of credit risk and price volatility involved with high yield securities than investment grade securities.
Foreign & Emerging Markets: Investing internationally, especially in emerging markets, involves additional risks such as currency, political, accounting, economic, and market risk.
|
| Portfolio Summaries (continued) |
| October 31, 2015 |
Virtus Newfleet Multi-Sector Unconstrained Bond ETF (continued)
Bank Loans: Loans may be unsecured or not fully collateralized, may be subject to restrictions on resale and/or trade infrequently on the secondary market. Loans can carry significant credit and call risk, can be difficult to value and have longer settlement times than other investments, which can make loans relatively illiquid at times.
ABS/MBS: Changes in interest rates can cause both extension and prepayment risks for asset- and mortgage-backed securities. These securities are also subject to risks associated with the repayment of underlying collateral.
Derivatives: Investments in derivatives such as futures, options, forwards, and swaps may increase volatility or cause a loss greater than the principal investment.
Market Price/NAV: At the time of purchase and/or sale, an investor’s shares may have a market price that is above or below the fund’s NAV, which may increase the investor’s risk of loss.
Prospectus: For additional information on risks, please see the fund’s prospectus.
Value of a $10,000 Investment Since Inception at Net Asset Value (unaudited)
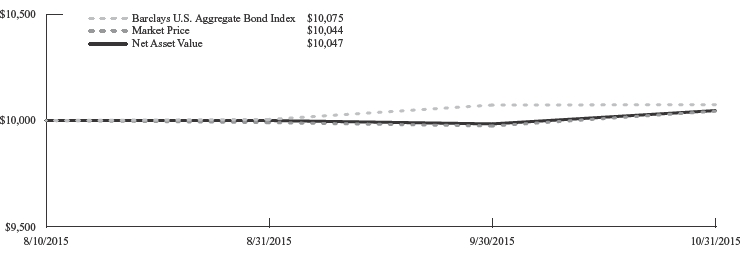
The chart above represents historical performance of a hypothetical investment of $10,000 over the life of the Fund, assuming reinvestment of distributions. Past performance does not guarantee future results.
|
| Portfolio Summaries (continued) |
| October 31, 2015 |
InfraCap MLP ETF
Management’s Discussion of Operations
Overview
InfraCap MLP ETF (“the Fund”) seeks to provide a high level of current income, a growing income stream, and long-term capital appreciation. The Fund is an actively-managed portfolio of high quality, midstream energy master limited partnerships (MLPs) and related general partners. The Fund also utilizes options strategies and modest leverage to enhance income and total return.
The Fund focuses on the midstream MLP sector because most of these companies have a long-term history of relatively stable and growing cash distributions. These companies are typically involved in the production, gathering, transportation, storage, and processing of oil, natural gas, natural gas liquids and refined products.
Update
During the fiscal year ended on October 31, 2015, the net asset value of the Fund fell from $24.21 to $14.28. This decline occurred during a period of unrelenting weakness in crude oil prices and continued weakness in natural gas prices. Stocks in the midstream energy sector underperformed the broader market and other energy-related indices by a substantial margin.
The Fund’s performance was specifically enhanced by its underweight position in Shell Midstream Partners LP (SHLX) as well as overweight positions in Spectra Energy Corporation (SE) and Oneok Inc. (OKE).
Conversely, the Fund’s performance was hindered by its overweight positions in Targa Resources Corporation (TRGP), Williams Partners LP (WPZ) and Energy Transfer Equity L.P. (ETE).
The use of leverage was a significant drag on performance during the period. The ratio of leverage to total assets increased during this period primarily due to the reduction in asset values.
Dividends paid to investors during the year increased sequentially from quarter to quarter. The cumulative dividend payout to investors during the fiscal year was $2.03 per share.
Shares outstanding increased during the fiscal year from 250,004 to 1,400,004.
Dividend Payments
The dividend rate is determined on a quarterly basis, and the rate may be adjusted during the year. An important consideration in determining the level of dividend payments is the estimated amount of distributable cash flow (“DCF”).
DCF is investment income less expenses. Investment income includes cash distributions from master limited partnerships, dividends received from stocks, and net realized gains (losses) from written and purchased options contracts. Expenses include advisory fees, other miscellaneous fees and leverage costs.
The Supplemental Financial Data table includes the calculation of distributable cash flow and should be reviewed as part of this discussion. It should be noted that this calculation differs from the Statement of Operations because of the following factors: 1) GAAP does not include MLP distributions in investment income because these distributions are typically treated as return of capital; and 2) GAAP does not include net realized gains (losses) on written and purchased options contracts as investment income but reports them separately as realized and unrealized gains (losses).
Use of Leverage
The Fund’s use of leverage is consistent with the limits set forth in the Investment Company Act of 1940 which states that the ratio of debt to total assets should not exceed 33%. The leverage ratio is impacted by increases and decreases in the market value of the Fund’s investments, the use of debt to finance the purchase of new securities, and/or the sale of investments where proceeds are used to pay down debt.
The Fund’s policy is to maintain the leverage ratio in a range of 10-33% over the long term. Additional leverage may be used when attractive investment opportunities arise but such leverage would be reduced over time. This leverage policy is consistent with the Fund’s investment objective to provide investors with a high level of current income. Total leverage represented 25.3% of total assets at year-end which was at the high-end of the long-term target range.
|
| Portfolio Summaries (continued) |
| October 31, 2015 |
InfraCap MLP ETF (continued)
Taxes
It should be noted that AMZA is fully taxed as a corporation. This tax treatment is the same as for other open-end and closed-end funds that focus on the Master Limited Partnership asset class. One consequence is that the Fund’s net asset value may be impacted by a tax reserve. The gross expenses that are reported in the Fund’s financial highlights include the tax reserve. The net expenses reported in the financial highlights exclude the tax reserve.
Another consequence of our tax status is that owners of the Fund will receive a Form 1099 for tax reporting purposes. So shareholders of the Fund do not face the complications of Schedule K-1 reporting, state filing requirements and UBTI (unrelated business tax income) that direct owners of MLP shares must address.
| Asset Allocation as of 10/31/2015 (based on net assets) (unaudited) |
| Energy | | | 133.8 | % |
| Purchased Options | | | 0.0 | %* |
| Written Options | | | (0.7 | )% |
| Other Liabilities | | | (33.1 | )% |
| Total | | | 100 | % |
* Amount rounds to less than 0.05%.
Performance as of 10/31/2015 (unaudited)
| | | Average Annual Total Return |
| | | Fund
Net Asset Value | | Fund
Market Price | | Alerian MLP
Infrastructure Index1 |
| 1 Year | | (34.34)% | | (33.95)% | | (29.05)% |
| Since Inception2 | | (34.27)% | | (34.01)% | | (29.10)% |
| 1 | The Alerian MLP Infrastructure Index is a composite of energy infrastructure Master Limited Partnerships (MLPs), whose constituents earn the majority of their cash flow from the transportation, storage, and processing of energy commodities. The index is calculated using a float-adjusted, capitalization-weighted methodology on a total-return basis. The index is unmanaged, its returns do not reflect any fees, expenses, or sales charges, and is not available for direct investment. |
Performance data quoted represents past performance and past performance does not guarantee future results. Investment return and principal value of an investment will fluctuate so that an investor’s shares, when sold or redeemed, may be worth more or less than the original cost. Current performance data may be higher or lower than actual data quoted. Returns do not reflect the deduction of taxes a shareholder would pay on Fund distributions or the redemption of Fund shares. For the most current month-end performance data please visit www.infracapmlp.com or call toll free (888) 383-0553. Market price returns are based on the mid-point of the highest bid and lowest offer for Fund shares as of the scheduled close of regular trading on the New York Stock Exchange (“NYSE”) Arca, ordinarily 4:00 p.m. Eastern time, on each day during which the NYSE is open for trading, and do not represent the returns an investor would receive if shares were traded at other times.
Interest Rate Risk: As yield-based investments, MLPs carry interest rate risk and may underperform in rising interest rate environments. Additionally, when investors have heightened fears about the economy, the risk spread between MLPs and competing investment options can widen, which may have an adverse effect on the stock price of MLPs. Rising interest rates may increase the potential cost of MLPs financing projects or cost of operations, and may affect the demand for MLP investments, either of which may result in lower performance by or distributions from the Fund’s MLP investments.
Exchange Traded Funds: The value of an ETF may be more volatile than the underlying portfolio of securities the ETF is designed to track. The costs of owning the ETF may exceed the cost of investing directly in the underlying securities.
Industry/Sector Concentration: A fund that focuses its investments in a particular industry or sector will be more sensitive to conditions that affect that industry or sector than a non-concentrated fund.
Short Sales: The fund may engage in short sales, and may experience a loss if the price of a borrowed security increases before the date on which the fund replaces the security.
Leverage: When a fund leverages its portfolio, the value of its shares may be more volatile and all other risks may be compounded.
|
| Portfolio Summaries (continued) |
| October 31, 2015 |
InfraCap MLP ETF (continued)
Derivatives: Investments in derivatives such as futures, options, forwards, and swaps may increase volatility or cause a loss greater than the principal investment.
MLPs: Investments in Master Limited Partnerships may be adversely impacted by tax law changes, regulation, or factors affecting underlying assets.
Prospectus: For additional information on risks, please see the fund’s prospectus.
Value of a $10,000 Investment Since Inception at Net Asset Value (unaudited)

The chart above represents historical performance of a hypothetical investment of $10,000 over the life of the Fund, assuming reinvestment of distributions. Past performance does not guarantee future results.
|
| Shareholder Expense Examples (unaudited) |
As a shareholder of a Fund, you incur ongoing costs, including advisory fees and other fund expenses, if any. The following example is intended to help you understand your ongoing costs (in dollars and cents) of investing in a Fund and to compare these costs with the ongoing costs of investing in other funds. The examples are based on an investment of $1,000 invested at the beginning of the period and held throughout the entire period (May 1, 2015 to October 31, 2015), unless otherwise noted for Funds with operations less than six months.
Actual expenses
The first line under each Fund in the table below provides information about actual account values and actual expenses. You may use the information in this line, together with the amount you invested, to estimate the expenses that you paid over the period. Simply divide your account value by $1,000 (for example, an $8,600 account value divided by $1,000 = 8.6), then multiply the result by the number in the first line for your Fund under the heading entitled “Expenses Paid Through 10/31/15” to estimate the expenses you paid on your account during this period.
Hypothetical example for comparison purposes
The second line under each Fund in the table provides information about hypothetical account values and hypothetical expenses based on each Fund’s actual expense ratio and an assumed rate of return of 5% per year before expenses, which is not the Fund’s actual return. The hypothetical account values and expenses may not be used to estimate the actual ending account balance or expenses you paid for the period. You may use this information to compare the ongoing costs of investing in your Fund and other funds. To do so, compare this 5% hypothetical example with the 5% hypothetical examples that appear in the shareholder reports of the other funds. Please note that the expenses shown in the table are meant to highlight your ongoing costs only and do not reflect any transactional costs, such as brokerage commissions paid on purchases and sales of Fund shares. Therefore, the second line under each Fund in the table is useful in comparing ongoing Fund costs only and will not help you determine the relative total costs of owning different funds. In addition, if these transactional costs were included, your costs would have been higher.
| | | Beginning
Account
Value | | Ending
Account
Value
10/31/15 | | Annualized
Expense Ratios(2) | | Expenses Paid
During the
Period |
| BioShares Biotechnology Clinical Trials Fund | | | | | | | | |
| Actual | | $1,000.00 | | $ 912.14 | | 0.85% | | $4.10(3) |
| Hypothetical(1) | | $1,000.00 | | $1,020.92 | | 0.85% | | $4.33(3) |
| |
| BioShares Biotechnology Products Fund | | | | | | | | |
| Actual | | $1,000.00 | | $1,028.21 | | 0.87% | | $4.45(3) |
| Hypothetical(1) | | $1,000.00 | | $1,020.82 | | 0.87% | | $4.43(3) |
| |
| Tuttle Tactical Management Multi-Strategy Income ETF | | | | | | | | |
| Actual | | $1,000.00 | | $ 963.80 | | 0.93% | | $3.63(4) |
| Hypothetical(1) | | $1,000.00 | | $1,020.52 | | 0.93% | | $4.74(5) |
| |
| Tuttle Tactical Management U.S. Core ETF | | | | | | | | |
| Actual | | $1,000.00 | | $ 955.06 | | 0.90% | | $4.44(3) |
| Hypothetical(1) | | $1,000.00 | | $1,020.67 | | 0.90% | | $4.58(3) |
| |
| Virtus Newfleet Multi-Sector Unconstrained Bond ETF | | | | | | | | |
| Actual | | $1,000.00 | | $1,004.70 | | 0.80% | | $1.78(6) |
| Hypothetical(1) | | $1,000.00 | | $1,021.70 | | 0.80% | | $4.08(5) |
| |
| InfraCap MLP ETF | | | | | | | | |
| Actual | | $1,000.00 | | $ 676.93 | | 1.15% | | $4.86(3) |
| Hypothetical(1) | | $1,000.00 | | $1,019.41 | | 1.15% | | $5.85(3) |
| 1 | Assuming 5% return before expenses. |
| 2 | Annualized expense ratios reflect expenses net of waived fees or reimbursed expenses, if applicable. |
| 3 | Expenses are calculated using each Fund’s annualized expense ratio, multiplied by the average account value for the period, multiplied by 184/365 (to reflect the six-month period). |
| 4 | Actual expenses are calculated using the Fund’s annualized expense ratio, multiplied by the average account value for the period, multiplied by 144/365 (to reflect the period June 9, 2015 to October 31, 2015). |
| 5 | Hypothetical expenses are calculated using the Fund’s annualized expense ratio, multiplied by the average account value for the period, multiplied by 184/365 (to reflect the six-month period). |
| 6 | Actual expenses are calculated using the Fund’s annualized expense ratio, multiplied by the average account value for the period, multiplied by 82/365 (to reflect the period August 10, 2015 to October 31, 2015). |
|
| Schedule of Investments — BioShares Biotechnology Clinical Trials Fund |
| October 31, 2015 |
| | | | | |
| Security Description | | Shares | | Value |
| Common Stocks — 99.8% | | | | | | | | |
| Health Care — 99.8% | | | | | | | | |
| ACADIA Pharmaceuticals, Inc.* | | | 8,801 | | | $ | 306,451 | |
| Acceleron Pharma, Inc.* | | | 11,075 | | | | 345,651 | |
| Achillion Pharmaceuticals, Inc.* | | | 39,379 | | | | 307,944 | |
| Advaxis, Inc.* | | | 14,020 | | | | 155,482 | |
| Affimed N.V.* | | | 27,836 | | | | 176,480 | |
| Agenus, Inc.* | | | 35,550 | | | | 162,108 | |
| Agios Pharmaceuticals, Inc.* | | | 3,297 | | | | 240,219 | |
| Alder Biopharmaceuticals, Inc.* | | | 7,099 | | | | 227,026 | |
| Alnylam Pharmaceuticals, Inc.* | | | 2,651 | | | | 227,853 | |
| Amicus Therapeutics, Inc.* | | | 24,555 | | | | 184,162 | |
| Arbutus Biopharma Corp.* | | | 23,026 | | | | 126,643 | |
| Array BioPharma, Inc.* | | | 47,879 | | | | 245,140 | |
| Arrowhead Research Corp.* | | | 51,005 | | | | 262,676 | |
| Atara Biotherapeutics, Inc.* | | | 6,116 | | | | 157,609 | |
| Avalanche Biotechnologies, Inc.* | | | 8,840 | | | | 74,521 | |
| Bellicum Pharmaceuticals, Inc.* | | | 13,757 | | | | 172,100 | |
| BioCryst Pharmaceuticals, Inc.* | | | 27,790 | | | | 249,832 | |
| Bluebird Bio, Inc.* | | | 1,916 | | | | 147,781 | |
| Celldex Therapeutics, Inc.* | | | 13,912 | | | | 167,779 | |
| Cempra, Inc.* | | | 10,319 | | | | 229,082 | |
| Chimerix, Inc.* | | | 8,401 | | | | 329,151 | |
| Clovis Oncology, Inc.* | | | 4,047 | | | | 404,336 | |
| Concert Pharmaceuticals, Inc.* | | | 19,882 | | | | 451,520 | |
| CTI BioPharma Corp.* | | | 161,393 | | | | 214,653 | |
| Curis, Inc.* | | | 104,809 | | | | 213,810 | |
| Dicerna Pharmaceuticals, Inc.* | | | 21,234 | | | | 212,765 | |
| Dynavax Technologies Corp.* | | | 16,679 | | | | 378,780 | |
| Endocyte, Inc.* | | | 58,665 | | | | 301,538 | |
| Epizyme, Inc.* | | | 17,363 | | | | 227,282 | |
| Esperion Therapeutics, Inc.* | | | 4,392 | | | | 105,408 | |
| FibroGen, Inc.* | | | 18,296 | | | | 426,480 | |
| Five Prime Therapeutics, Inc.* | | | 15,158 | | | | 487,330 | |
| Galena Biopharma, Inc.* | | | 172,749 | | | | 290,218 | |
| Geron Corp.* | | | 87,922 | | | | 305,089 | |
| Idera Pharmaceuticals, Inc.* | | | 92,409 | | | | 255,049 | |
| Ignyta, Inc.* | | | 20,823 | | | | 213,228 | |
| Immune Design Corp.* | | | 13,331 | | | | 173,303 | |
| ImmunoGen, Inc.* | | | 24,660 | | | | 288,522 | |
| Immunomedics, Inc.* | | | 84,051 | | | | 251,312 | |
| Infinity Pharmaceuticals, Inc.* | | | 31,082 | | | | 321,699 | |
| Inovio Pharmaceuticals, Inc.* | | | 40,446 | | | | 256,023 | |
| Insmed, Inc.* | | | 14,934 | | | | 296,291 | |
| Intercept Pharmaceuticals, Inc.* | | | 1,407 | | | | 221,180 | |
| Juno Therapeutics, Inc.* | | | 5,721 | | | | 296,119 | |
| Karyopharm Therapeutics, Inc.* | | | 12,837 | | | | 171,374 | |
| Kite Pharma, Inc.* | | | 5,877 | | | | 399,930 | |
| La Jolla Pharmaceutical Co.* | | | 15,477 | | | | 386,770 | |
| Lexicon Pharmaceuticals, Inc.* | | | 43,515 | | | | 413,828 | |
| Lion Biotechnologies, Inc.* | | | 29,483 | | | | 190,755 | |
| MacroGenics, Inc.* | | | 9,722 | | | | 302,063 | |
| Merrimack Pharmaceuticals, Inc.* | | | 31,480 | | | | 294,023 | |
| Mirati Therapeutics, Inc.* | | | 11,075 | | | | 391,834 | |
| Neurocrine Biosciences, Inc.* | | | 8,077 | | | | 396,500 | |
| NewLink Genetics Corp.* | | | 7,610 | | | | 291,235 | |
| Northwest Biotherapeutics, Inc.* | | | 33,937 | | | | 165,613 | |
| Novavax, Inc.* | | | 38,758 | | | | 261,617 | |
| OncoMed Pharmaceuticals, Inc.* | | | 13,624 | | | | 272,616 | |
| Oncothyreon, Inc.* | | | 88,374 | | | | 261,587 | |
| Ophthotech Corp.* | | | 7,041 | | | | 351,557 | |
| Paratek Pharmaceuticals, Inc.* | | | 12,478 | | | | 216,618 | |
| | | | | |
| Security Description | | Shares | | Value |
| Common Stocks (continued) | | | | | | | | |
| Portola Pharmaceuticals, Inc.* | | | 7,738 | | | $ | 368,406 | |
| Prothena Corp. PLC* | | | 7,260 | | | | 373,963 | |
| PTC Therapeutics, Inc.* | | | 6,840 | | | | 170,111 | |
| Puma Biotechnology, Inc.* | | | 2,647 | | | | 218,166 | |
| Radius Health, Inc.* | | | 7,032 | | | | 451,665 | |
| Regulus Therapeutics, Inc.* | | | 32,339 | | | | 215,054 | |
| Relypsa, Inc.* | | | 10,034 | | | | 160,444 | |
| Rigel Pharmaceuticals, Inc.* | | | 97,110 | | | | 246,659 | |
| Sage Therapeutics, Inc.* | | | 4,405 | | | | 221,263 | |
| Sangamo BioSciences, Inc.* | | | 31,596 | | | | 222,752 | |
| Sarepta Therapeutics, Inc.* | | | 12,044 | | | | 289,779 | |
| Sorrento Therapeutics, Inc.* | | | 22,949 | | | | 198,279 | |
| Spark Therapeutics, Inc.* | | | 4,739 | | | | 255,432 | |
| Synergy Pharmaceuticals, Inc.* | | | 70,157 | | | | 449,706 | |
| Synta Pharmaceuticals Corp.* | | | 145,664 | | | | 97,595 | |
| Tetraphase Pharmaceuticals, Inc.* | | | 8,014 | | | | 72,366 | |
| TG Therapeutics, Inc.* | | | 23,086 | | | | 285,574 | |
| Threshold Pharmaceuticals, Inc.* | | | 82,836 | | | | 315,605 | |
| Tokai Pharmaceuticals, Inc.* | | | 24,225 | | | | 267,686 | |
| Trevena, Inc.* | | | 49,605 | | | | 477,200 | |
| Ultragenyx Pharmaceutical, Inc.* | | | 3,877 | | | | 385,180 | |
| uniQure N.V.* | | | 10,633 | | | | 188,523 | |
| Verastem, Inc.* | | | 42,334 | | | | 77,895 | |
| Versartis, Inc.* | | | 18,888 | | | | 195,113 | |
| Xencor, Inc.* | | | 16,868 | | | | 182,680 | |
| XOMA Corp.* | | | 93,418 | | | | 113,970 | |
| Zafgen, Inc.* | | | 9,657 | | | | 92,997 | |
| ZIOPHARM Oncology, Inc.* | | | 32,067 | | | | 365,243 | |
| ZS Pharma, Inc.* | | | 6,314 | | | | 410,473 | |
| TOTAL INVESTMENTS — 99.8% | | | | | | | | |
| (Cost $30,855,074) | | | | | | | 23,225,324 | |
| Other Assets in Excess of Liabilities — 0.2% | | | | | | | 35,420 | |
| Net Assets — 100.0% | | | | | | $ | 23,260,744 | |
| * | Non-income producing security. |
The accompanying notes are an integral part of these financial statements.
|
| Schedule of Investments — BioShares Biotechnology Products Fund |
| October 31, 2015 |
| | | | | |
| Security Description | | Shares | | Value |
| Common Stocks — 100.0% | | | | | | | | |
| Health Care — 100.0% | | | | | | | | |
| Acorda Therapeutics, Inc.* | | | 20,833 | | | $ | 750,821 | |
| Aegerion Pharmaceuticals, Inc.* | | | 36,387 | | | | 534,161 | |
| Alexion Pharmaceuticals, Inc.* | | | 3,871 | | | | 681,296 | |
| Amgen, Inc. | | | 4,316 | | | | 682,705 | |
| Anacor Pharmaceuticals, Inc.* | | | 9,654 | | | | 1,085,206 | |
| Arena Pharmaceuticals, Inc.* | | | 158,535 | | | | 299,631 | |
| ARIAD Pharmaceuticals, Inc.* | | | 78,433 | | | | 536,482 | |
| Biogen, Inc.* | | | 1,727 | | | | 501,711 | |
| BioMarin Pharmaceutical, Inc.* | | | 5,500 | | | | 643,720 | |
| Celgene Corp.* | | | 6,041 | | | | 741,291 | |
| Dyax Corp.* | | | 26,569 | | | | 731,445 | |
| Enanta Pharmaceuticals, Inc.* | | | 15,520 | | | | 435,957 | |
| Exelixis, Inc.* | | | 194,378 | | | | 1,170,156 | |
| Gilead Sciences, Inc. | | | 5,676 | | | | 613,746 | |
| Halozyme Therapeutics, Inc.* | | | 32,824 | | | | 513,696 | |
| Incyte Corp.* | | | 6,469 | | | | 760,302 | |
| Ironwood Pharmaceuticals, Inc.* | | | 55,605 | | | | 631,673 | |
| Isis Pharmaceuticals, Inc.* | | | 10,739 | | | | 517,083 | |
| Keryx Biopharmaceuticals, Inc.* | | | 69,278 | | | | 310,365 | |
| Ligand Pharmaceuticals, Inc.* | | | 7,428 | | | | 671,120 | |
| MannKind Corp.* | | | 109,936 | | | | 363,888 | |
| Medicines Co. (The)* | | | 23,415 | | | | 801,730 | |
| Medivation, Inc.* | | | 11,924 | | | | 501,523 | |
| Momenta Pharmaceuticals, Inc.* | | | 29,529 | | | | 484,571 | |
| Nektar Therapeutics* | | | 59,929 | | | | 711,357 | |
| Omeros Corp.* | | | 34,267 | | | | 429,366 | |
| Orexigen Therapeutics, Inc.* | | | 151,722 | | | | 461,235 | |
| PDL BioPharma, Inc. | | | 103,575 | | | | 474,373 | |
| Progenics Pharmaceuticals, Inc.* | | | 98,765 | | | | 724,935 | |
| Raptor Pharmaceutical Corp.* | | | 46,027 | | | | 250,847 | |
| Regeneron Pharmaceuticals, Inc.* | | | 1,343 | | | | 748,575 | |
| Retrophin, Inc.* | | | 21,703 | | | | 415,178 | |
| Seattle Genetics, Inc.* | | | 14,339 | | | | 594,925 | |
| Theravance Biopharma, Inc.* | | | 46,995 | | | | 702,575 | |
| United Therapeutics Corp.* | | | 3,608 | | | | 529,041 | |
| Vanda Pharmaceuticals, Inc.* | | | 51,625 | | | | 554,452 | |
| Vertex Pharmaceuticals, Inc.* | | | 5,431 | | | | 677,463 | |
| XenoPort, Inc.* | | | 104,782 | | | | 640,218 | |
| TOTAL INVESTMENTS — 100.0% | | | | | | | | |
| (Cost $26,417,862) | | | | | | | 22,878,819 | |
| Liabilities in Excess of Other Assets — (0.0)%(1) | | | | | | | (4,672 | ) |
| Net Assets — 100.0% | | | | | | $ | 22,874,147 | |
| * | Non-income producing security. |
The accompanying notes are an integral part of these financial statements.
|
| Schedule of Investments — Tuttle Tactical Management Multi-Strategy Income ETF |
| October 31, 2015 |
| | | | | |
| Security Description | | Shares | | Value |
| Exchange Traded Funds — 96.1% | | | | | | | | |
| Debt Funds — 63.8% | | | | | | | | |
| iShares 1-3 Year Treasury Bond ETF | | | 262,131 | | | $ | 22,236,573 | |
| iShares Core U.S. Aggregate Bond ETF | | | 4,422 | | | | 483,988 | |
| iShares iBoxx $ High Yield Corporate Bond ETF | | | 45,238 | | | | 3,871,015 | |
| ProShares Short 20+ Year Treasury* | | | 179,625 | | | | 4,416,979 | |
| SPDR Barclays International Treasury Bond ETF | | | 1 | | | | 52 | |
| Total Debt Funds | | | | | | | 31,008,607 | |
| |
| Equity Funds — 32.3% | | | | | | | | |
| iShares Select Dividend ETF | | | 44,452 | | | | 3,417,025 | |
| ProShares S&P 500 Dividend Aristocrats ETF | | | 62,814 | | | | 3,135,047 | |
| Schwab US Dividend Equity ETF | | | 152,265 | | | | 5,953,561 | |
| Vanguard Dividend Appreciation ETF | | | 40,943 | | | | 3,222,624 | |
| Total Equity Funds | | | | | | | 15,728,257 | |
| |
| TOTAL INVESTMENTS — 96.1% | | | | | | | | |
| (Cost $46,612,906) | | | | | | | 46,736,864 | |
| Other Assets in Excess of Liabilities — 3.9% | | | | | | | 1,883,681 | |
| Net Assets — 100.0% | | | | | | $ | 48,620,545 | |
| * | Non-income producing security. |
The accompanying notes are an integral part of these financial statements.
|
| Schedule of Investments — Tuttle Tactical Management U.S. Core ETF |
| October 31, 2015 |
| | | | | |
| Security Description | | Shares | | Value |
| Exchange Traded Funds — 98.1% | | | | | | | | |
| Debt Funds — 57.9% | | | | | | | | |
| Direxion Daily 20 Year Plus Treasury | | | | | | | | |
| Bull 3x Shares* | | | 17,054 | | | $ | 1,333,282 | |
| iShares 1-3 Year Treasury Bond ETF | | | 305,083 | | | | 25,880,191 | |
| iShares 20+ Year Treasury Bond ETF | | | 136,617 | | | | 16,773,835 | |
| Total Debt Funds | | | | | | | 43,987,308 | |
| |
| Equity Funds — 40.2% | | | | | | | | |
| Consumer Discretionary Select Sector | | | | | | | | |
| SPDR Fund | | | 20,085 | | | | 1,626,282 | |
| Consumer Staples Select Sector SPDR Fund | | | 31,520 | | | | 1,572,218 | |
| Direxion Daily S&P 500 Bull 3x Shares* | | | 20,221 | | | | 1,771,764 | |
| iShares Core S&P Small-Cap ETF | | | 118,883 | | | | 13,439,723 | |
| SPDR S&P 500 ETF Trust | | | 50,741 | | | | 10,550,576 | |
| Technology Select Sector SPDR Fund | | | 36,490 | | | | 1,592,789 | |
| Total Equity Funds | | | | | | | 30,553,352 | |
| |
| TOTAL INVESTMENTS — 98.1% | | | | | | | | |
| (Cost $74,079,925) | | | | | | | 74,540,660 | |
| Other Assets in Excess of Liabilities — 1.9% | | | | | | | 1,406,494 | |
| Net Assets — 100.0% | | | | | | $ | 75,947,154 | |
| * | Non-income producing security. |
The accompanying notes are an integral part of these financial statements.
|
| Schedule of Investments — Virtus Newfleet Multi-Sector Unconstrained Bond ETF |
| October 31, 2015 |
| | | | | |
| Investments | | Principal | | Value |
| CORPORATE BONDS — 32.7% | | | | | | | | |
| Communications — 1.1% | | | | | | | | |
| Level 3 Financing, Inc., 5.38%, 01/15/24(1) | | $ | 160,000 | | | $ | 162,400 | |
| Neptune Finco Corp., 10.13%, 01/15/23(1) | | | 400,000 | | | | 424,000 | |
| Neptune Finco Corp., 6.63%, 10/15/25(1) | | | 200,000 | | | | 211,000 | |
| Sprint Communications, Inc., 6.00%, 11/15/22 | | | 465,000 | | | | 398,500 | |
| T-Mobile USA, Inc., 6.13%, 01/15/22 | | | 500,000 | | | | 510,000 | |
| Total Communications | | | | | | | 1,705,900 | |
| |
| Consumer Discretionary — 7.7% | | | | | | | | |
| Argos Merger Sub, Inc., 7.13%, 03/15/23(1) | | | 600,000 | | | | 633,000 | |
| Boyd Gaming Corp., 6.88%, 05/15/23 | | | 600,000 | | | | 639,000 | |
| Caesars Entertainment Resort Properties LLC / | | | | | | | | |
| Caesars Entertainment Resort Properties, | | | | | | | | |
| 8.00%, 10/01/20 | | | 250,000 | | | | 249,375 | |
| Caesars Growth Properties Holdings LLC / | | | | | | | | |
| Caesars Growth Properties Finance, Inc., | | | | | | | | |
| 9.38%, 05/01/22 | | | 300,000 | | | | 249,750 | |
| CalAtlantic Group, Inc., 5.88%, 11/15/24 | | | 440,000 | | | | 464,200 | |
| CCO Holdings LLC / CCO Holdings | | | | | | | | |
| Capital Corp., 5.13%, 05/01/23(1) | | | 325,000 | | | | 326,625 | |
| CCO Safari II LLC, 4.91%, 07/23/25(1) | | | 500,000 | | | | 509,007 | |
| Clear Channel Worldwide | | | | | | | | |
| Holdings, Inc., 7.63%, 03/15/20 | | | 750,000 | | | | 780,937 | |
| DISH DBS Corp., 5.00%, 03/15/23 | | | 580,000 | | | | 537,950 | |
| iHeartCommunications, Inc., 9.00%, 12/15/19 | | | 520,000 | | | | 442,000 | |
| Jarden Corp., 5.00%, 11/15/23(1) | | | 180,000 | | | | 185,850 | |
| Landry’s, Inc., 9.38%, 05/01/20(1) | | | 600,000 | | | | 646,500 | |
| Lennar Corp., 4.50%, 06/15/19 | | | 450,000 | | | | 469,125 | |
| Lennar Corp., 4.88%, 12/15/23 | | | 145,000 | | | | 145,181 | |
| MDC Holdings, Inc., 5.50%, 01/15/24 | | | 640,000 | | | | 656,000 | |
| MGM Resorts International, 6.75%, 10/01/20 | | | 850,000 | | | | 909,500 | |
| Penn National Gaming, Inc., 5.88%, 11/01/21 | | | 450,000 | | | | 461,250 | |
| QVC, Inc., 5.13%, 07/02/22 | | | 600,000 | | | | 609,670 | |
| RCN Telecom Services LLC / RCN Capital | | | | | | | | |
| Corp., 8.50%, 08/15/20(1) | | | 500,000 | | | | 527,500 | |
| Scientific Games International, Inc., | | | | | | | | |
| 7.00%, 01/01/22(1) | | | 455,000 | | | | 459,550 | |
| Signet UK Finance PLC, 4.70%, 06/15/24 | | | 500,000 | | | | 502,384 | |
| Toll Brothers Finance Corp., 5.88%, 02/15/22 | | | 600,000 | | | | 648,750 | |
| TRI Pointe Holdings, Inc., 4.38%, 06/15/19 | | | 150,000 | | | | 149,813 | |
| TRI Pointe Holdings, Inc., 5.88%, 06/15/24 | | | 600,000 | | | | 603,000 | |
| Total Consumer Discretionary | | | | | | | 11,805,917 | |
| |
| Consumer Staples — 1.2% | | | | | | | | |
| Dole Food Co., Inc., 7.25%, 05/01/19(1) | | | 500,000 | | | | 503,000 | |
| Rite Aid Corp., 6.13%, 04/01/23(1) | | | 600,000 | | | | 648,750 | |
| Safeway, Inc., 7.25%, 02/01/31 | | | 185,000 | | | | 180,375 | |
| Tops Holding LLC / Tops Markets II Corp., | | | | | | | | |
| 8.00%, 06/15/22(1) | | | 500,000 | | | | 520,000 | |
| Total Consumer Staples | | | | | | | 1,852,125 | |
| |
| Energy — 2.0% | | | | | | | | |
| Enbridge Energy Partners LP, 4.38%, 10/15/20 | | | 80,000 | | | | 81,121 | |
| Kinder Morgan, Inc., 5.63%, 11/15/23(1) | | | 600,000 | | | | 584,032 | |
| Regency Energy Partners LP / Regency Energy | | | | | | | | |
| Finance Corp., 5.00%, 10/01/22 | | | 530,000 | | | | 515,819 | |
| Sunoco LP / Sunoco Finance Corp., | | | | | | | | |
| 6.38%, 04/01/23(1) | | | 1,075,000 | | | | 1,088,438 | |
| Transocean, Inc., 5.05%, 12/15/16 | | | 755,000 | | | | 753,822 | |
| Total Energy | | | | | | | 3,023,232 | |
| | | | | |
| Investments | | Principal | | Value |
| CORPORATE BONDS — (continued) | | | | | | | | |
| Financials — 8.4% | | | | | | | | |
| Air Lease Corp., 2.63%, 09/04/18 | | $ | 400,000 | | | $ | 398,658 | |
| American Campus Communities Operating | | | | | | | | |
| Partnership LP, 3.35%, 10/01/20 | | | 80,000 | | | | 80,731 | |
| Ares Finance Co. II LLC, 5.25%, 09/01/25(1) | | | 625,000 | | | | 631,315 | |
| Aviation Capital Group Corp., 2.88%, 09/17/18 | | | 455,000 | | | | 455,218 | |
| Aviation Capital Group Corp., 2.88%, 09/17/18(1) | | | 190,000 | | | | 190,091 | |
| Bank of New York Mellon Corp. (The), | | | | | | | | |
| 4.95%, 12/29/49(2) | | | 760,000 | | | | 760,950 | |
| Block Financial LLC, 4.13%, 10/01/20 | | | 380,000 | | | | 386,311 | |
| Capital One Financial Corp., 4.20%, 10/29/25 | | | 460,000 | | | | 460,928 | |
| Compass Bank, 3.88%, 04/10/25 | | | 500,000 | | | | 466,517 | |
| Corrections Corp. of America, 5.00%, 10/15/22 | | | 700,000 | | | | 712,250 | |
| Digital Delta Holdings LLC, 3.40%, 10/01/20(1) | | | 645,000 | | | | 648,972 | |
| DuPont Fabros Technology LP, 5.88%, 09/15/21 | | | 600,000 | | | | 633,000 | |
| First Cash Financial Services, Inc., | | | | | | | | |
| 6.75%, 04/01/21 | | | 300,000 | | | | 300,750 | |
| First Horizon National Corp., 3.50%, 12/15/20 | | | 610,000 | | | | 608,631 | |
| General Motors Financial Co., Inc., | | | | | | | | |
| 3.45%, 04/10/22 | | | 650,000 | | | | 635,646 | |
| JPMorgan Chase & Co., 5.00%, 12/29/49(2) | | | 615,000 | | | | 607,159 | |
| Kilroy Realty LP, 4.38%, 10/01/25 | | | 640,000 | | | | 650,235 | |
| Kimco Realty Corp., 3.40%, 11/01/22 | | | 395,000 | | | | 395,834 | |
| McGraw Hill Financial, Inc., 3.30%, 08/14/20(1) | | | 259,000 | | | | 263,851 | |
| McGraw Hill Financial, Inc., 4.00%, 06/15/25(1) | | | 400,000 | | | | 398,136 | |
| National Retail Properties, Inc., 4.00%, 11/15/25 | | | 185,000 | | | | 184,479 | |
| Prudential Financial, Inc., 5.63%, 06/15/43(2) | | | 450,000 | | | | 472,050 | |
| Sabra Health Care LP / Sabra Capital | | | | | | | | |
| Corp., 5.50%, 02/01/21 | | | 355,000 | | | | 371,756 | |
| Select Income REIT, 4.15%, 02/01/22 | | | 540,000 | | | | 532,692 | |
| Teachers Insurance & Annuity Association of | | | | | | | | |
| America, 4.38%, 09/15/54(1)(2) | | | 550,000 | | | | 553,498 | |
| Ventas Realty LP, 4.13%, 01/15/26 | | | 450,000 | | | | 451,167 | |
| Wells Fargo & Co., 7.98%, 03/29/49(2) | | | 500,000 | | | | 533,125 | |
| Total Financials | | | | | | | 12,783,950 | |
| |
| Health Care — 4.3% | | | | | | | | |
| AbbVie, Inc., 3.60%, 05/14/25 | | | 500,000 | | | | 492,496 | |
| Acadia Healthcare Co., Inc., 5.63%, 02/15/23(1) | | | 90,000 | | | | 90,563 | |
| Acadia Healthcare Co., Inc., 5.63%, 02/15/23 | | | 385,000 | | | | 387,406 | |
| Capsugel SA, 7.00%, 05/15/19(1)(3) | | | 455,000 | | | | 459,266 | |
| Endo Ltd. / Endo Finance LLC / Endo | | | | | | | | |
| Finco, Inc., 6.00%, 07/15/23(1) | | | 450,000 | | | | 452,250 | |
| HCA, Inc., 6.50%, 02/15/20 | | | 700,000 | | | | 784,875 | |
| HealthSouth Corp., 5.75%, 09/15/25(1) | | | 495,000 | | �� | | 495,309 | |
| inVentiv Health, Inc., 9.00%, 01/15/18(1) | | | 150,000 | | | | 155,250 | |
| Mallinckrodt International Finance SA / | | | | | | | | |
| Mallinckrodt CB LLC, 5.63%, 10/15/23(1) | | | 775,000 | | | | 735,281 | |
| Owens & Minor, Inc., 3.88%, 09/15/21 | | | 625,000 | | | | 633,747 | |
| Quintiles Transnational Corp., | | | | | | | | |
| 4.88%, 05/15/23(1) | | | 200,000 | | | | 206,624 | |
| Tenet Healthcare Corp., 4.50%, 04/01/21 | | | 750,000 | | | | 753,750 | |
| Tenet Healthcare Corp., 8.13%, 04/01/22 | | | 370,000 | | | | 393,125 | |
| Valeant Pharmaceuticals International, Inc., | | | | | | | | |
| 5.38%, 03/15/20(1) | | | 625,000 | | | | 546,875 | |
| Total Health Care | | | | | | | 6,586,817 | |
| |
| Industrials — 4.5% | | | | | | | | |
| ADS Waste Holdings, Inc., 8.25%, 10/01/20 | | | 375,000 | | | | 395,156 | |
| ADT Corp. (The), 6.25%, 10/15/21 | | | 600,000 | | | | 651,000 | |
| Builders FirstSource, Inc., 10.75%, 08/15/23(1) | | | 200,000 | | | | 207,500 | |
The accompanying notes are an integral part of these financial statements.
|
| Schedule of Investments — Virtus Newfleet Multi-Sector Unconstrained Bond ETF (continued) |
| October 31, 2015 |
| | | | | |
| Investments | | Principal | | Value |
| CORPORATE BONDS — (continued) | | | | | | | | |
| Industrials — (continued) | | | | | | | | |
| CEB, Inc., 5.63%, 06/15/23(1) | | $ | 300,000 | | | $ | 305,625 | |
| Hawaiian Airlines Pass-Through Certificates, | | | | | | | | |
| Class B, Series 2013-1, 4.95%, 01/15/22 | | | 1,105,410 | | | | 1,073,630 | |
| HD Supply, Inc., 5.25%, 12/15/21(1) | | | 700,000 | | | | 737,625 | |
| Masco Corp., 5.95%, 03/15/22 | | | 600,000 | | | | 666,000 | |
| NCI Building Systems, Inc., 8.25%, 01/15/23(1) | | | 350,000 | | | | 372,750 | |
| Penske Truck Leasing Co. LP / PTL Finance | | | | | | | | |
| Corp., 3.38%, 02/01/22(1) | | | 500,000 | | | | 498,100 | |
| SBA Tower Trust, 3.16%, 10/15/20(1) | | | 375,000 | | | | 374,850 | |
| Toll Brothers Finance Corp., 4.88%, 11/15/25 | | | 400,000 | | | | 400,500 | |
| TransDigm, Inc., 6.00%, 07/15/22 | | | 600,000 | | | | 609,000 | |
| United Rentals North America, Inc., | | | | | | | | |
| 5.50%, 07/15/25 | | | 535,000 | | | | 535,669 | |
| Total Industrials | | | | | | | 6,827,405 | |
| |
| Information Technology — 1.9% | | | | | | | | |
| Fidelity National Information Services, Inc., | | | | | | | | |
| 2.85%, 10/15/18 | | | 65,000 | | | | 65,734 | |
| Fidelity National Information Services, Inc., | | | | | | | | |
| 3.63%, 10/15/20 | | | 210,000 | | | | 213,970 | |
| Fidelity National Information Services, Inc., | | | | | | | | |
| 4.50%, 10/15/22 | | | 340,000 | | | | 347,605 | |
| First Data Corp., 11.75%, 08/15/21 | | | 1,025,000 | | | | 1,171,063 | |
| First Data Corp., 7.00%, 12/01/23(1) | | | 120,000 | | | | 122,400 | |
| Hewlett Packard Enterprise Co., 2.45%, | | | | | | | | |
| 10/05/17(1) | | | 135,000 | | | | 135,458 | |
| Hewlett Packard Enterprise Co., 2.85%, | | | | | | | | |
| 10/05/18(1) | | | 130,000 | | | | 130,364 | |
| Hewlett Packard Enterprise Co., | | | | | | | | |
| 3.60%, 10/15/20(1) | | | 25,000 | | | | 25,207 | |
| Hewlett Packard Enterprise Co., | | | | | | | | |
| 4.40%, 10/15/22(1) | | | 135,000 | | | | 136,319 | |
| Hewlett Packard Enterprise Co., | | | | | | | | |
| 4.90%, 10/15/25(1) | | | 135,000 | | | | 133,659 | |
| KLA-Tencor Corp., 4.65%, 11/01/24 | | | 450,000 | | | | 453,937 | |
| Total Information Technology | | | | | | | 2,935,716 | |
| |
| Materials — 0.3% | | | | | | | | |
| Berry Plastics Corp., 6.00%, 10/15/22(1) | | | 500,000 | | | | 525,000 | |
| |
| Telecommunication Services — 0.8% | | | | | | | | |
| AT&T, Inc., 3.00%, 06/30/22 | | | 600,000 | | | | 589,407 | |
| CenturyLink, Inc., 5.63%, 04/01/20 | | | 385,000 | | | | 386,882 | |
| Frontier Communications Corp., | | | | | | | | |
| 8.88%, 09/15/20(1) | | | 90,000 | | | | 93,656 | |
| Frontier Communications Corp., | | | | | | | | |
| 10.50%, 09/15/22(1) | | | 100,000 | | | | 104,000 | |
| Total Telecommunication Services | | | | | | | 1,173,945 | |
| |
| Utilities — 0.5% | | | | | | | | |
| Calpine Corp., 5.38%, 01/15/23 | | | 470,000 | | | | 451,787 | |
| Exelon Corp., 2.85%, 06/15/20 | | | 30,000 | | | | 30,056 | |
| NRG Yield Operating LLC, 5.38%, 08/15/24 | | | 345,000 | | | | 317,400 | |
| Total Utilities | | | | | | | 799,243 | |
| Total Corporate Bonds | | | | | | | | |
| (Cost $49,559,450) | | | | | | | 50,019,250 | |
| | | | | |
| Investments | | Principal | | Value |
| TERM LOANS — 14.1% | | | | | | | | |
| Consumer Discretionary — 4.1% | | | | | | | | |
| Aristocrat International Pty, Ltd., 4.75%, | | | | | | | | |
| 10/20/21(2) | | $ | 640,000 | | | $ | 642,602 | |
| Brickman Group Ltd LLC (The), 7.50%, | | | | | | | | |
| 12/18/21(2) | | | 325,000 | | | | 308,425 | |
| Caesars Entertainment Resort Properties | | | | | | | | |
| LLC, 7.00%, 10/11/20(2) | | | 249,365 | | | | 237,053 | |
| CDS US Intermediate Holdings, Inc., | | | | | | | | |
| 5.00%, 07/08/22(2) | | | 450,000 | | | | 452,624 | |
| CS Intermediate Holdco 2 LLC, 4.00%, | | | | | | | | |
| 04/04/21(2) | | | 498,737 | | | | 496,166 | |
| Delta 2 Lux Sarl, 4.75%, 07/30/21(2) | | | 460,000 | | | | 452,364 | |
| iHeartCommunications, Inc., 6.94%, | | | | | | | | |
| 01/30/19(2) | | | 175,000 | | | | 147,014 | |
| Infiltrator Systems Integrated LLC, 5.25%, | | | | | | | | |
| 05/21/22(2) | | | 400,000 | | | | 400,400 | |
| Mohegan Tribal Gaming Authority, 5.50%, | | | | | | | | |
| 06/15/18(2) | | | 640,000 | | | | 634,240 | |
| Party City Holdings, Inc., 4.25%, | | | | | | | | |
| 08/19/22(2) | | | 380,000 | | | | 380,473 | |
| Scientific Games International, Inc., 6.00%, | | | | | | | | |
| 10/01/21(2) | | | 299,246 | | | | 292,950 | |
| Staples, Inc., 3.50%, 04/24/21(2) | | | 400,000 | | | | 398,614 | |
| TI Group Automotive Systems LLC, | | | | | | | | |
| 4.50%, 06/30/22(2) | | | 515,000 | | | | 510,707 | |
| TWCC Holding Corp., 5.75%, 02/13/20(2) | | | 448,872 | | | | 449,815 | |
| Virgin Media Investment Holdings, Ltd., | | | | | | | | |
| 3.50%, 06/30/23(2) | | | 400,000 | | | | 398,358 | |
| Total Consumer Discretionary | | | | | | | 6,201,805 | |
| |
| Consumer Staples — 0.9% | | | | | | | | |
| Albertsons LLC, 5.50%, 08/25/21(2) | | | 600,000 | | | | 600,783 | |
| Coty, Inc., 3.75%, 10/27/22(2) | | | 107,000 | | | | 107,569 | |
| Galleria Co., 3.75%, 10/22/22(2) | | | 214,000 | | | | 214,569 | |
| Hostess Brands LLC, 8.50%, 08/03/23(2) | | | 500,000 | | | | 499,845 | |
| Total Consumer Staples | | | | | | | 1,422,766 | |
| |
| Energy — 0.2% | | | | | | | | |
| Chelsea Petroleum Products I LLC, 5.25%, | | | | | | | | |
| 07/22/22(2) | | | 330,000 | | | | 328,763 | |
| |
| Health Care — 2.7% | | | | | | | | |
| Concordia Healthcare Corp., 5.25%, 10/21/21(2) | | | 262,000 | | | | 252,613 | |
| Greatbatch, Ltd., 5.25%, 10/27/22(2) | | | 212,000 | | | | 212,895 | |
| inVentiv Health, Inc., 7.75%, 05/15/18(2) | | | 500,000 | | | | 499,065 | |
| MedImpact OpCo Holdings, Inc., 5.75%, | | | | | | | | |
| 10/23/22(2) | | | 275,000 | | | | 274,656 | |
| NVA Holdings, Inc., 8.00%, 08/14/22(2) | | | 380,000 | | | | 377,308 | |
| Onex Schumacher Finance LP, 5.00%, | | | | | | | | |
| 07/31/22(2) | | | 282,000 | | | | 280,942 | |
| Ortho-Clinical Diagnostics, Inc., 4.75%, | | | | | | | | |
| 06/30/21(2) | | | 750,000 | | | | 740,625 | |
| RegionalCare Hospital Partners, Inc., | | | | | | | | |
| 5.25%, 04/23/19(2) | | | 500,000 | | | | 494,585 | |
| Sedgwick Claims Management Services, | | | | | | | | |
| Inc., 6.75%, 02/28/22(2) | | | 650,000 | | | | 611,409 | |
| Surgery Center Holdings, Inc., 5.25%, | | | | | | | | |
| 11/03/20(2) | | | 380,000 | | | | 378,735 | |
| Total Health Care | | | | | | | 4,122,833 | |
The accompanying notes are an integral part of these financial statements.
|
| Schedule of Investments — Virtus Newfleet Multi-Sector Unconstrained Bond ETF (continued) |
| October 31, 2015 |
| | | | | |
| Investments | | Principal | | Value |
| TERM LOANS — (continued) | | | | | | | | |
| Industrials — 0.5% | | | | | | | | |
| TransDigm, Inc., 3.75%, 06/04/21(2) | | $ | 324,179 | | | $ | 320,173 | |
| Waste Industries USA, Inc., 4.25%, 02/27/20(2) | | | 448,872 | | | | 451,047 | |
| Total Industrials | | | | | | | 771,220 | |
| |
| Information Technology — 3.9% | | | | | | | | |
| First Data Corp., 3.70%, 03/24/18(2) | | | 6,050,000 | | | | 6,012,732 | |
| |
| Materials — 0.8% | | | | | | | | |
| Anchor Glass Container Corp., 4.50%, | | | | | | | | |
| 06/24/22(2) | | | 325,000 | | | | 325,405 | |
| Summit Materials LLC, 4.25%, 07/17/22(2) | | | 450,000 | | | | 449,156 | |
| Univar USA, Inc., 4.25%, 07/01/22(2) | | | 450,000 | | | | 444,737 | |
| Total Materials | | | | | | | 1,219,298 | |
| |
| Technology — 0.3% | | | | | | | | |
| Applied Systems, Inc., 7.50%, 01/23/22(2) | | | 414,000 | | | | 401,321 | |
| |
| Telecommunication Services — 0.3% | | | | | | | | |
| Crown Castle Operating Co., 3.00%, 01/31/21(2) | | | 523,668 | | | | 524,348 | |
| |
| Utilities — 0.4% | | | | | | | | |
| NRG Energy, Inc., 2.75%, 07/01/18(2) | | | 538,619 | | | | 525,040 | |
| |
| Total Term Loans | | | | | | | | |
| (Cost $21,583,177) | | | | | | | 21,530,126 | |
| |
| MORTGAGE BACKED SECURITIES — 11.1% |
| Commercial Mortgage Backed Securities — 4.3% |
| Colony Multifamily Mortgage Trust, Class A, | | | | | | | | |
| Series 2014-1, 2.54%, 04/20/50(1) | | | 955,508 | | | | 954,234 | |
| Credit Suisse Commercial Mortgage Trust, | | | | | | | | |
| Class A1AM, Series 2007-C5, | | | | | | | | |
| 5.87%, 09/15/40(2) | | | 1,000,000 | | | | 1,017,551 | |
| Csail Commercial Mortgage Trust, Class AS, | | | | | | | | |
| Series 2015-C2, 3.85%, 06/15/57 | | | 340,000 | | | | 348,034 | |
| DBUBS Mortgage Trust, Class D, | | | | | | | | |
| Series 2011-LC3A, 5.58%, 08/10/44(1)(2) | | | 905,000 | | | | 953,842 | |
| FREMF Mortgage Trust, Class B, | | | | | | | | |
| Series 2015-K720, 3.39%, 07/25/22(1)(2)(4)(5) | | | 330,000 | | | | 294,355 | |
| Hilton USA Trust, Class EFX, | | | | | | | | |
| Series 2013-HLT, 4.60%, 11/05/30(1)(2) | | | 1,000,000 | | | | 1,009,885 | |
| JPMorgan Chase Commercial Mortgage | | | | | | | | |
| Securities Trust, Class D, Series 2010-CNTR, | | | | | | | | |
| 6.39%, 08/05/32(1)(2) | | | 400,000 | | | | 451,333 | |
| Morgan Stanley Bank of America Merrill | | | | | | | | |
| Lynch Trust, Class AS, Series 2015-C22, | | | | | | | | |
| 3.56%, 04/15/48 | | | 1,000,000 | | | | 1,004,488 | |
| Morgan Stanley Bank of America Merrill | | | | | | | | |
| Lynch Trust, Class C, Series 2015-C26, | | | | | | | | |
| 4.41%, 11/15/48(4)(5) | | | 385,000 | | | | 383,542 | |
| Total Commercial Mortgage Backed Securities | | | | | | | 6,417,264 | |
| |
| Mortgage Securities — 1.9% | | | | | | | | |
| Fannie Mae, 3.50%, 08/01/45 | | | 2,483,064 | | | | 2,587,185 | |
| Freddie Mac Gold, 3.00%, 04/01/45 | | | 252,859 | | | | 255,142 | |
| Total Mortgage Securities | | | | | | | 2,842,327 | |
| |
| Residential Mortgage Backed Securities — 4.9% |
| American Homes 4 Rent Trust, Class C, | | | | | | | | |
| Series 2015-SFR2, 4.69%, 10/17/45(1) | | | 510,000 | | | | 518,328 | |
| Colony American Finance Ltd., Class A, | | | | | | | | |
| Series 2015-1 (Cayman Islands), 2.90%, | | | | | | | | |
| 10/15/47(1) | | | 305,000 | | | | 304,185 | |
| | | | | |
| Investments | | Principal | | Value |
| MORTGAGE BACKED SECURITIES — (continued) |
| Residential Mortgage Backed Securities — (continued) |
| Fannie Mae Connecticut Avenue Securities, | | | | | | | | |
| Class 2M2, Series 2014-C02, 2.80%, | | | | | | | | |
| 05/25/24(2) | | $ | 1,000,000 | | | $ | 893,540 | |
| GMACM Mortgage Loan Trust, Class 2A, | | | | | | | | |
| Series 2005-AR2, 3.16%, 05/25/35(2) | | | 783,299 | | | | 743,436 | |
| GSR Mortgage Loan Trust, Class B1, | | | | | | | | |
| Series 2005-5F, 5.75%, 06/25/35(2) | | | 466,782 | | | | 456,215 | |
| MASTR Alternative Loan Trust, Class 7A1, | | | | | | | | |
| Series 2004-6, 6.00%, 07/25/34 | | | 476,021 | | | | 486,318 | |
| New Residential Mortgage Loan Trust, Class A, | | | | | | | | |
| Series 2014-1A, 3.75%, 01/25/54(1)(2) | | | 341,237 | | | | 352,957 | |
| New Residential Mortgage Loan Trust, Class A3, | | | | | | | | |
| Series 2014-2A, 3.75%, 05/25/54(1)(2) | | | 269,049 | | | | 276,973 | |
| Resecuritization Pass-Through Trust, Class A5, | | | | | | | | |
| Series 2005-8R, 6.00%, 10/25/34 | | | 210,135 | | | | 213,077 | |
| Residential Asset Securitization Trust, Class A3, | | | | | | | | |
| Series 2005-A1, 5.50%, 04/25/35 | | | 1,848,660 | | | | 1,872,665 | |
| Sequoia Mortgage Trust, Class A1, | | | | | | | | |
| Series 2015-1, 3.50%, 01/25/45(1)(2) | | | 329,850 | | | | 332,762 | |
| VOLT XXIX LLC, Class A1, Series 2014-NP10, | | | | | | | | |
| 3.38%, 10/25/54(1)(6) | | | 1,143,913 | | | | 1,142,629 | |
| Total Residential Mortgage Backed Securities | | | | | | | 7,593,085 | |
| |
| Total Mortgage Backed Securities | | | | | | | | |
| (Cost $16,832,915) | | | | | | | 16,852,676 | |
| |
| FOREIGN BONDS — 6.2% | | | | | | | | |
| Communications — 0.8% | | | | | | | | |
| Altice Financing SA, 6.63%, 02/15/23 | | | | | | | | |
| (Luxembourg)(1) | | | 400,000 | | | | 402,000 | |
| Altice Luxembourg SA, 7.63%, 02/15/25 | | | | | | | | |
| (Luxembourg)(1) | | | 425,000 | | | | 391,850 | |
| Intelsat Jackson Holdings SA, 7.25%, | | | | | | | | |
| 04/01/19 (Luxembourg) | | | 520,000 | | | | 490,100 | |
| Total Communications | | | | | | | 1,283,950 | |
| |
| Consumer Discretionary — 0.7% | | | | | | | | |
| Hyundai Capital America, 3.00%, 10/30/20 | | | | | | | | |
| (South Korea)(1) | | | 600,000 | | | | 599,847 | |
| Numericable-SFR SAS, 6.00%, 05/15/22 | | | | | | | | |
| (France)(1) | | | 460,000 | | | | 462,300 | |
| Total Consumer Discretionary | | | | | | | 1,062,147 | |
| |
| Financials — 1.4% | | | | | | | | |
| AerCap Ireland Capital Ltd. / AerCap Global | | | | | | | | |
| Aviation Trust, 4.63%, 10/30/20 (Netherlands) | | | 375,000 | | | | 389,531 | |
| Guanay Finance Ltd., 6.00%, 12/15/20 | | | | | | | | |
| (Chile)(1) | | | 1,000,000 | | | | 1,015,000 | |
| Ukreximbank Via Biz Finance PLC, 9.63%, | | | | | | | | |
| 04/27/22 (Ukraine)(1) | | | 310,000 | | | | 282,798 | |
| WEA Finance LLC / Westfield UK & Europe | | | | | | | | |
| Finance PLC, 3.25%, 10/05/20 (Australia)(1) | | | 450,000 | | | | 454,781 | |
| Total Financials | | | | | | | 2,142,110 | |
| |
| Government — 0.8% | | | | | | | | |
| Banco Nacional de Comercio Exterior SNC, | | | | | | | | |
| 4.38%, 10/14/25 (Mexico)(1) | | | 400,000 | | | | 403,000 | |
| Sri Lanka Government International Bond, | | | | | | | | |
| 6.85%, 11/03/25 (Sri Lanka)(1) | | | 900,000 | | | | 889,875 | |
| Total Government | | | | | | | 1,292,875 | |
The accompanying notes are an integral part of these financial statements.
|
| Schedule of Investments — Virtus Newfleet Multi-Sector Unconstrained Bond ETF (continued) |
| October 31, 2015 |
| | | | | |
| Investments | | Principal | | Value |
| FOREIGN BONDS — (continued) | | | | |
| Health Care — 0.1% | | | | |
| Fresenius US Finance II, Inc., 4.50%, | | | | |
| 01/15/23 (Germany)(1) | | $ | 145,000 | | | $ | 148,806 | |
| |
| Industrials — 1.2% | | | | | | | | |
| Air Canada Pass Through Trust, Class B, | | | | | | | | |
| Series 2013-1, 5.38%, 05/15/21 (Canada)(1) | | | 1,769,524 | | | | 1,815,974 | |
| |
| Materials — 0.8% | | | | | | | | |
| BHP Billiton Finance USA Ltd., 6.75%, | | | | | | | | |
| 10/19/75 (Australia)(1)(2) | | | 240,000 | | | | 245,100 | |
| Corp. Nacional del Cobre de Chile, 4.50%, | | | | | | | | |
| 09/16/25 (Chile)(1) | | | 935,000 | | | | 929,970 | |
| Total Materials | | | | | | | 1,175,070 | |
| |
| Utilities — 0.4% | | | | | | | | |
| Majapahit Holding BV, 7.75%, 01/20/20 | | | | | | | | |
| (Indonesia)(1) | | | 550,000 | | | | 622,050 | |
| |
| Total Foreign Bonds | | | | | | | | |
| (Cost $9,490,472) | | | | | | | 9,542,982 | |
| |
| ASSET BACKED SECURITIES — 3.8% | | | | | | | | |
| CKE Restaurant Holdings, Inc., Class A2, | | | | | | | | |
| Series 2013-1A, 4.47%, 03/20/43(1) | | | 962,500 | | | | 988,957 | |
| Domino’s Pizza Master Issuer LLC, Class A2, | | | | | | | | |
| Series 2012-1A, 5.22%, 01/25/42(1) | | | 1,146,094 | | | | 1,193,705 | |
| DT Auto Owner Trust, Class C, Series 2015-3A, | | | | | | | | |
| 3.25%, 07/15/21(1) | | | 675,000 | | | | 673,878 | |
| Exeter Automobile Receivables Trust, Class D, | | | | | | | | |
| Series 2015-3A, 6.55%, 10/17/22(1) | | | 455,000 | | | | 453,023 | |
| Global SC Finance II SRL, Class A, | | | | | | | | |
| Series 2013-1A (Barbados), 2.98%, 04/17/28(1) | | | 705,000 | | | | 703,954 | |
| OneMain Financial Issuance Trust, Class A, | | | | | | | | |
| Series 2015-1A, 3.19%, 03/18/26(1) | | | 840,000 | | | | 849,223 | |
| Wendys Funding LLC, Class A2II, | | | | | | | | |
| Series 2015-1A, 4.08%, 06/15/45(1) | | | 1,000,000 | | | | 1,005,300 | |
| |
| Total Asset Backed Securities | | | | | | | | |
| (Cost $5,840,049) | | | | | | | 5,868,040 | |
| | | | | |
| Investments | | Shares | | Value |
| MONEY MARKET FUND — 42.7% | | | | |
Bank of America Money Market Reserve,
0.08%(7) | | | | |
| (Cost $65,384,324) | | $ | 65,384,324 | | | $ | 65,384,324 | |
| Total Investments — 110.6% | | | | | | | | |
| (Cost $168,690,387) | | | | | | | 169,197,398 | |
| Liabilities in Excess of Other Assets — (10.6)% | | | | | | | (16,162,458 | ) |
| Net Assets — 100.0% | | | | | | $ | 153,034,940 | |
| (1) | Security was purchased pursuant to Rule 144A under the Securities Act of 1933 and may not be resold subject to that rule except to qualified institutional buyers. Unless otherwise noted, 144A securities are deemed to be liquid. At October 31, 2015, the aggregate value of these securities was $38,282,320, or 25.02% of net assets. |
| (2) | Variable rate instrument. The interest rate shown reflects the rate in effect at October 31, 2015. |
| (3) | Payment in-kind security. |
| (6) | Represents step coupon bond. Rate shown reflects the rate in effect as of October 31, 2015. |
| (7) | The rate shown reflects the seven day yield as of October 31, 2015. |
The accompanying notes are an integral part of these financial statements.
|
| Statements of Assets and Liabilities |
| October 31, 2015 |
| | | BioShares
Biotechnology
Clinical Trials Fund | | BioShares
Biotechnology
Products Fund | | Tuttle Tactical
Management
Multi-Strategy
Income ETF | | Tuttle Tactical
Management
U.S. Core ETF | | Virtus Newfleet
Multi-Sector
Unconstrained
Bond ETF |
| Assets: | | | | | | | | | | |
| Investments, at cost | | $ | 30,855,074 | | | $ | 26,417,862 | | | $ | 46,612,906 | | | $ | 74,079,925 | | | $ | 168,690,387 | |
| Investments, at value | | | 23,225,324 | | | | 22,878,819 | | | | 46,736,864 | | | | 74,540,660 | | | | 169,197,398 | |
| Cash | | | 52,767 | | | | 11,042 | | | | 1,919,221 | | | | 1,475,210 | | | | 28,420 | |
| Receivables: | | | | | | | | | | | | | | | | | | | | |
| Dividends and interest receivable | | | — | | | | — | | | | — | | | | — | | | | 831,527 | |
| Investment securities sold | | | — | | | | — | | | | — | | | | 12,055,514 | | | | 758,649 | |
| Total Assets | | | 23,278,091 | | | | 22,889,861 | | | | 48,656,085 | | | | 88,071,384 | | | | 170,815,994 | |
| |
| Liabilities: | | | | | | | | | | | | | | | | | | | | |
| Payables: | | | | | | | | | | | | | | | | | | | | |
| Investment securities purchased | | | — | | | | — | | | | — | | | | 12,069,233 | | | | 17,643,140 | |
| Advisory fees | | | — | | | | — | | | | — | | | | — | | | | 51,139 | |
| Subadvisory fees | | | 17,347 | | | | 15,714 | | | | 35,540 | | | | 54,997 | | | | — | |
| Transfer Agent fees | | | — | | | | — | | | | — | | | | — | | | | 2,247 | |
| Professional fees | | | — | | | | — | | | | — | | | | — | | | | 26,739 | |
| Custody fees | | | — | | | | — | | | | — | | | | — | | | | 2,984 | |
| Insurance fees | | | — | | | | — | | | | — | | | | — | | | | 2,696 | |
| Report to Shareholder fees | | | — | | | | — | | | | — | | | | — | | | | 2,135 | |
| Trustee fees | | | — | | | | — | | | | — | | | | — | | | | 510 | |
| Accounting and Administration fees | | | — | | | | — | | | | — | | | | — | | | | 40,077 | |
| Distribution fees | | | — | | | | — | | | | — | | | | — | | | | 2,984 | |
| Pricing fees | | | — | | | | — | | | | — | | | | — | | | | 2,471 | |
| Exchange Listing fees | | | — | | | | — | | | | — | | | | — | | | | 3,932 | |
| Total Liabilities | | | 17,347 | | | | 15,714 | | | | 35,540 | | | | 12,124,230 | | | | 17,781,054 | |
| Net Assets | | $ | 23,260,744 | | | $ | 22,874,147 | | | $ | 48,620,545 | | | $ | 75,947,154 | | | $ | 153,034,940 | |
| |
| Net Assets Consist of: | | | | | | | | | | | | | | | | | | | | |
| Paid-in capital | | $ | 31,611,418 | | | $ | 26,609,320 | | | $ | 49,945,589 | | | $ | 79,410,740 | | | $ | 152,457,670 | |
| Undistributed (Accumulated) net investment income (loss) | | | — | | | | — | | | | 130,888 | | | | — | | | | 106,546 | |
| Undistributed (Accumulated) net realized gain (loss) on | | | | | | | | | | | | | | | | | | | | |
| investments | | | (720,924 | ) | | | (196,130 | ) | | | (1,579,890 | ) | | | (3,924,321 | ) | | | (36,287 | ) |
| Net unrealized appreciation (depreciation) on investments | | | (7,629,750 | ) | | | (3,539,043 | ) | | | 123,958 | | | | 460,735 | | | | 507,011 | |
| Net Assets | | $ | 23,260,744 | | | $ | 22,874,147 | | | $ | 48,620,545 | | | $ | 75,947,154 | | | $ | 153,034,940 | |
| Shares outstanding (unlimited number of shares of beneficial | | | | | | | | | | | | | | | | | | | | |
| interest authorized, no par value) | | | 850,004 | | | | 750,004 | | | | 2,050,000 | | | | 3,300,004 | | | | 6,100,004 | |
| Net asset value per share | | $ | 27.37 | | | $ | 30.50 | | | $ | 23.72 | | | $ | 23.01 | | | $ | 25.09 | |
The accompanying notes are an integral part of these financial statements.
|
| Statements of Operations |
| For the Period Ended October 31, 2015 |
| | | BioShares
Biotechnology
Clinical Trials
Fund1 | | BioShares
Biotechnology
Products Fund1 | | Tuttle Tactical
Management
Multi-Strategy
Income ETF2 | | Tuttle Tactical
Management
U.S. Core ETF3 | | Virtus Newfleet
Multi-Sector
Unconstrained
Bond ETF4 |
| Investment Income: | | | | | | | | | | | | | | | | | | | | |
| Dividend income | | $ | — | | | $ | 38,659 | | | $ | 269,268 | | | $ | 305,185 | | | $ | — | |
| Interest income | | | — | | | | — | | | | — | | | | — | | | | 501,012 | |
| Total Investment Income | | | — | | | | 38,659 | | | | 269,268 | | | | 305,185 | | | | 501,012 | |
| |
| Expenses: | | | | | | | | | | | | | | | | | | | | |
| Advisory fees | | | — | | | | — | | | | — | | | | — | | | | 208,854 | |
| Subadvisory fees | | | 158,359 | | | | 117,711 | | | | 133,013 | | | | 324,085 | | | | — | |
| Transfer Agent fees | | | — | | | | — | | | | — | | | | — | | | | 2,247 | |
| Professional fees | | | — | | | | — | | | | — | | | | — | | | | 26,739 | |
| Custody fees | | | — | | | | — | | | | — | | | | — | | | | 2,984 | |
| Insurance fees | | | — | | | | — | | | | — | | | | — | | | | 2,696 | |
| Report to Shareholders fees | | | — | | | | — | | | | — | | | | — | | | | 2,134 | |
| Trustee fees | | | — | | | | — | | | | — | | | | — | | | | 1,348 | |
| Accounting and Administration fees | | | — | | | | — | | | | — | | | | — | | | | 40,077 | |
| Distribution fees | | | — | | | | — | | | | — | | | | — | | | | 2,984 | |
| Pricing fees | | | — | | | | — | | | | — | | | | — | | | | 2,472 | |
| Exchange Listing fees | | | — | | | | — | | | | — | | | | — | | | | 3,932 | |
| Interest expense | | | 621 | | | | 2,096 | | | | 5,367 | | | | — | | | | — | |
| Total Expenses | | | 158,980 | | | | 119,807 | | | | 138,380 | | | | 324,085 | | | | 296,467 | |
| Less expense waivers/reimbursements | | | — | | | | — | | | | — | | | | — | | | | (57,777 | ) |
| Net Investment Income (Loss) | | | (158,980 | ) | | | (81,148 | ) | | | 130,888 | | | | (18,900 | ) | | | 262,322 | |
| |
| Net Realized Gain (Loss) on: | | | | | | | | | | | | | | | | | | | | |
| Investments | | | (748,569 | ) | | | (297,876 | ) | | | (1,579,890 | ) | | | (3,925,464 | ) | | | (12,424 | ) |
| Investments in violation of restrictions | | | — | | | | — | | | | — | 5 | | | — | 6 | | | — | |
| In-kind transactions | | | 2,647,246 | | | | 1,811,265 | | | | — | | | | 2,625 | | | | — | |
| Total Net Realized Gain (Loss) | | | 1,898,677 | | | | 1,513,389 | | | | (1,579,890 | ) | | | (3,922,839 | ) | | | (12,424 | ) |
| |
| Change in Net Unrealized Appreciation (Depreciation) on:— | | | (3,539,043 | ) | | | 123,958 | | | | 460,735 | | | | | |
| Investments | | | (7,629,750 | ) | | | (3,539,043 | ) | | | 123,958 | | | | 460,735 | | | | 507,011 | |
| Total Change in Net Unrealized Appreciation (Depreciation) | | | (7,629,750 | ) | | | (3,539,043 | ) | | | 123,958 | | | | 460,735 | | | | 507,011 | |
| Net Realized and Net Change in Unrealized Gain (Loss) | | | (5,731,073 | ) | | | (2,025,654 | ) | | | (1,455,932 | ) | | | (3,462,104 | ) | | | 494,587 | |
| |
| Net Increase (Decrease) in Net Assets Resulting from | | | | | | | | | | | | | | | | | | | | |
| Operations | | $ | (5,890,053 | ) | | $ | (2,106,802 | ) | | $ | (1,325,044 | ) | | $ | (3,481,004 | ) | | $ | 756,909 | |
| 1 | From December 16, 2014 (commencement of operations) through October 31, 2015. |
| 2 | From June 9, 2015 (commencement of operations) through October 31, 2015. |
| 3 | From February 24, 2015 (commencement of operations) through October 31, 2015. |
| 4 | From August 10, 2015 (commencement of operations) through October 31, 2015. |
| 5 | The Adviser reimbursed the Fund $2,803 for losses incurred on investments not meeting investment guidelines. See Note 3. |
| 6 | The Adviser reimbursed the Fund $35,277 for losses incurred on investments not meeting investment guidelines. See Note 3. |
The accompanying notes are an integral part of these financial statements.
|
| Statements of Changes in Net Assets |
| | | BioShares
Biotechnology
Clinical Trials Fund | | BioShares
Biotechnology
Products Fund | | Tuttle Tactical
Management
Multi-Strategy
Income ETF | | Tuttle Tactical
Management
U.S. Core ETF | | Virtus Newfleet
Multi-Sector
Unconstrained
Bond ETF |
| | | For the Period
December 16, 20141
Through
October 31, 2015 | | For the Period
December 16, 20141
Through
October 31, 2015 | | For the Period
June 9, 20151
Through
October 31, 2015 | | For the Period
February 24, 20151
Through
October 31, 2015 | | For the Period
August 10, 20151
Through
October 31, 2015 |
| Increase (Decrease) in Net Assets Resulting | | | | | | | | | | |
| from Operations: | | | | | | | | | | |
| Net investment income (loss) | | $ | (158,980 | ) | | $ | (81,148 | ) | | $ | 130,888 | | | $ | (18,900 | ) | | $ | 262,322 | |
| Net realized gain (loss) on investments | | | 1,898,677 | | | | 1,513,389 | | | | (1,579,890 | ) | | | (3,922,839 | ) | | | (12,424 | ) |
| Net change in unrealized appreciation (depreciation) | | | | | | | | | | | | | | | | | | | | |
| on investments | | | (7,629,750 | ) | | | (3,539,043 | ) | | | 123,958 | | | | 460,735 | | | | 507,011 | |
| Net increase (decrease) in net assets resulting | | | | | | | | | | | | | | | | | | | | |
| from operations | | | (5,890,053 | ) | | | (2,106,802 | ) | | | (1,325,044 | ) | | | (3,481,004 | ) | | | 756,909 | |
| |
| Distributions to Shareholders from: | | | | | | | | | | | | | | | | | | | | |
| Net investment income | | | — | | | | — | | | | — | | | | — | | | | (179,639 | ) |
| Total distributions | | | — | | | | — | | | | — | | | | — | | | | (179,639 | ) |
| |
| Shareholder Transactions: | | | | | | | | | | | | | | | | | | | | |
| Proceeds from shares sold | | | 43,806,752 | | | | 36,716,553 | | | | 49,945,589 | | | | 80,633,448 | | | | 153,708,649 | |
| Cost of shares redeemed | | | (14,655,955 | ) | | | (11,735,604 | ) | | | — | | | | (1,205,290 | ) | | | (1,250,979 | ) |
| Net increase (decrease) in net assets resulting from | | | | | | | | | | | | | | | | | | | | |
| shareholder transactions | | | 29,150,797 | | | | 24,980,949 | | | | 49,945,589 | | | | 79,428,158 | | | | 152,457,670 | |
| Increase (decrease) in net assets | | | 23,260,744 | | | | 22,874,147 | | | | 48,620,545 | | | | 75,947,154 | | | | 153,034,940 | |
| |
| Net Assets: | | | | | | | | | | | | | | | | | | | | |
| Beginning of period | | | — | | | | — | | | | — | | | | — | | | | — | |
| End of period | | $ | 23,260,744 | | | $ | 22,874,147 | | | $ | 48,620,545 | | | $ | 75,947,154 | | | $ | 153,034,940 | |
| Undistributed (Accumulated) net investment | | | | | | | | | | | | | | | | | | | | |
| income (loss) | | | — | | | | — | | | | 130,888 | | | | — | | | | 106,546 | |
| |
| Changes in Shares Outstanding: | | | | | | | | | | | | | | | | | | | | |
| Shares outstanding, beginning of period | | | — | | | | — | | | | — | | | | — | | | | — | |
| Shares sold | | | 1,300,004 | | | | 1,100,004 | | | | 2,050,000 | | | | 3,350,004 | | | | 6,150,004 | |
| Shares redeemed | | | (450,000 | ) | | | (350,000 | ) | | | — | | | | (50,000 | ) | | | (50,000 | ) |
| Shares outstanding, end of period | | | 850,004 | | | | 750,004 | | | | 2,050,000 | | | | 3,300,004 | | | | 6,100,004 | |
| 1 | Commencement of operations. |
The accompanying notes are an integral part of these financial statements.
| | | BioShares
Biotechnology
Clinical
Trials Fund |
| | | For the Period
December 16, 20141
Through
October 31, 2015 |
| Per Share Data for a Share Outstanding Throughout the Period: | | |
| Net asset value, beginning of period | | $ | 25.00 | |
| Investment operations: | | | | |
| Net investment loss2 | | | (0.24 | ) |
| Net realized and unrealized gain on investments7 | | | 2.61 | |
| Total from investment operations | | | 2.37 | |
| Net Asset Value, End of Period | | $ | 27.37 | |
| Net Asset Value Total Return3 | | | 9.46 | % |
| Net assets, end of period (000’s omitted) | | $ | 23,261 | |
| |
| RATIOS/SUPPLEMENTAL DATA: | | | | |
| Ratios to Average Net Assets: | | | | |
| Expenses | | | 0.85 | %4,8 |
| Net investment loss | | | (0.85 | )%4 |
| Portfolio turnover rate5 | | | 76 | %6 |
| 1 | Commencement of operations. |
| 2 | Based on average shares outstanding. |
| 3 | Net Asset Value Total Return is calculated assuming an initial investment made at the net asset value on the first day of the period, reinvestment of dividends and distributions at net asset value during the period, and redemption at net asset value on the last day of the period. Total return calculated for a period of less than one year is not annualized. |
| 5 | Portfolio turnover excludes the value of portfolio securities received or delivered as a result of in-kind creations or redemptions of the Fund’s capital shares. |
| 7 | The per share amount of realized and unrealized gain (loss) on investments does not accord with the amounts reported in the Statements of Operations due to the timing of creation of fund shares in relation to fluctuating market values. |
| 8 | The ratio of expenses to average net assets include interest expense fees of less than 0.01%. |
The accompanying notes are an integral part of these financial statements.
|
| Financial Highlights (continued) |
| | | BioShares
Biotechnology
Products Fund |
| | | For the Period
December 16, 20141
Through
October 31, 2015 |
| Per Share Data for a Share Outstanding Throughout the Period: | | |
| Net asset value, beginning of period | | $ | 25.00 | |
| Investment operations: | | | | |
| Net investment loss2 | | | (0.17 | ) |
| Net realized and unrealized gain on investments7 | | | 5.67 | |
| Total from investment operations | | | 5.50 | |
| Net Asset Value, End of Period | | $ | 30.50 | |
| Net Asset Value Total Return3 | | | 21.99 | % |
| Net assets, end of period (000’s omitted) | | $ | 22,874 | |
| |
| RATIOS/SUPPLEMENTAL DATA: | | | | |
| Ratios to Average Net Assets: | | | | |
| Expenses | | | 0.86 | %4,8 |
| Net investment loss | | | (0.58 | )%4 |
| Portfolio turnover rate5 | | | 45 | %6 |
| 1 | Commencement of operations. |
| 2 | Based on average shares outstanding. |
| 3 | Net Asset Value Total Return is calculated assuming an initial investment made at the net asset value on the first day of the period, reinvestment of dividends and distributions at net asset value during the period, and redemption at net asset value on the last day of the period. Total return calculated for a period of less than one year is not annualized. |
| 5 | Portfolio turnover excludes the value of portfolio securities received or delivered as a result of in-kind creations or redemptions of the Fund’s capital shares. |
| 7 | The per share amount of realized and unrealized gain (loss) on investments does not accord with the amounts reported in the Statements of Operations due to the timing of creation of fund shares in relation to fluctuating market values. |
| 8 | The ratio of expenses to average net assets include interest expense fees of 0.01%. |
The accompanying notes are an integral part of these financial statements.
|
| Financial Highlights (continued) |
| | | Tuttle Tactical
Management
Multi-Strategy
Income ETF |
| | | For the Period
June 9, 20151
Through
October 31, 2015 |
| Per Share Data for a Share Outstanding Throughout the Period: | | |
| Net asset value, beginning of period | | $ | 24.61 | |
| Investment operations: | | | | |
| Net investment income2 | | | 0.08 | |
| Net realized and unrealized loss on investments | | | (0.97 | ) |
| Total from investment operations | | | (0.89 | ) |
| Net Asset Value, End of Period | | $ | 23.72 | |
| Net Asset Value Total Return3 | | | (3.63 | )%8 |
| Net assets, end of period (000’s omitted) | | $ | 48,621 | |
| |
| RATIOS/SUPPLEMENTAL DATA: | | | | |
| Ratios to Average Net Assets: | | | | |
| Expenses | | | 0.93 | %4,7 |
| Net investment income | | | 0.87 | %4 |
| Portfolio turnover rate5 | | | 920 | %6 |
| 1 | Commencement of operations. |
| 2 | Based on average shares outstanding. |
| 3 | Net Asset Value Total Return is calculated assuming an initial investment made at the net asset value on the first day of the period, reinvestment of dividends and distributions at net asset value during the period, and redemption at net asset value on the last day of the period. Total return calculated for a period of less than one year is not annualized. |
| 5 | Portfolio turnover excludes the value of portfolio securities received or delivered as a result of in-kind creations or redemptions of the Fund’s capital shares. |
| 7 | The ratio of expenses to average net assets include interest expense fees of 0.03%. |
| 8 | During the period ended October 31, 2015, the Fund experienced a loss on the disposal of an investment security that did not meet investment guidelines. The Adviser reimbursed the Fund for the loss, which otherwise would have reduced Net Asset Value Total Return by 0.01%. |
The accompanying notes are an integral part of these financial statements.
|
| Financial Highlights (continued) |
| | | Tuttle Tactical
Management
U.S. Core ETF |
| | | For the Period
February 24, 20151
Through
October 31, 2015 |
| Per Share Data for a Share Outstanding Throughout the Period: | | |
| Net asset value, beginning of period | | $ | 24.62 | |
| Investment operations: | | | | |
| Net investment loss2 | | | (0.01 | ) |
| Net realized and unrealized loss on investments | | | (1.60 | ) |
| Total from investment operations | | | (1.61 | ) |
| Net Asset Value, End of Period | | $ | 23.01 | |
| Net Asset Value Total Return3 | | | (6.53 | )%7 |
| Net assets, end of period (000’s omitted) | | $ | 75,947 | |
| |
| RATIOS/SUPPLEMENTAL DATA: | | | | |
| Ratios to Average Net Assets: | | | | |
| Expenses | | | 0.90 | %4 |
| Net investment loss | | | (0.05 | )%4 |
| Portfolio turnover rate5 | | | 1,687 | %6 |
| 1 | Commencement of operations. |
| 2 | Based on average shares outstanding. |
| 3 | Net Asset Value Total Return is calculated assuming an initial investment made at the net asset value on the first day of the period, reinvestment of dividends and distributions at net asset value during the period, and redemption at net asset value on the last day of the period. Total return calculated for a period of less than one year is not annualized. |
| 5 | Portfolio turnover excludes the value of portfolio securities received or delivered as a result of in-kind creations or redemptions of the Fund’s capital shares. |
| 7 | During the period ended October 31, 2015, the Fund experienced a loss on the disposal of an investment security that did not meet investment guidelines. The Adviser reimbursed the Fund for the loss, which otherwise would have reduced Net Asset Value Total Return by 0.04%. |
The accompanying notes are an integral part of these financial statements.
|
| Financial Highlights (continued) |
| | | Virtus Newfleet
Multi-Sector
Unconstrained
Bond ETF |
| | | For the Period
August 10, 20151
Through
October 31, 2015 |
| Per Share Data for a Share Outstanding Throughout the Period: | | |
| Net asset value, beginning of period | | $ | 25.00 | |
| Investment operations: | | | | |
| Net investment income2 | | | 0.05 | |
| Net realized and unrealized gain on investments | | | 0.07 | |
| Total from investment operations | | | 0.12 | |
| Distributions from Net Investment Income | | | (0.03 | ) |
| Net Asset Value, End of Period | | $ | 25.09 | |
| Net Asset Value Total Return3 | | | 0.47 | % |
| Net assets, end of period (000’s omitted) | | $ | 153,035 | |
| |
| RATIOS/SUPPLEMENTAL DATA: | | | | |
| Ratios to Average Net Assets: | | | | |
| Expenses, net of expense waivers | | | 0.80 | %4 |
| Expenses, prior to expense waivers | | | 0.99 | %4 |
| Net investment income, net of waivers | | | 0.88 | %4 |
| Portfolio turnover rate5 | | | 20 | %6 |
| 1 | Commencement of operations. |
| 2 | Based on average shares outstanding. |
| 3 | Net Asset Value Total Return is calculated assuming an initial investment made at the net asset value on the first day of the period, reinvestment of dividends and distributions at net asset value during the period, and redemption at net asset value on the last day of the period. Total return calculated for a period of less than one year is not annualized. |
| 5 | Portfolio turnover excludes the value of portfolio securities received or delivered as a result of in-kind creations or redemptions of the Fund’s capital shares. |
The accompanying notes are an integral part of these financial statements.
|
| Notes to Financial Statements |
| October 31, 2015 |
1. ORGANIZATION
The ETFis Series Trust I (the “Trust”) was organized as a Delaware statutory trust on September 20, 2012 and is registered with the Securities and Exchange Commission (the “SEC”) as an open-end management investment company under the Investment Company Act of 1940, as amended (the “1940 Act”). The Trust currently consists of ten separate investment portfolios. BioShares Biotechnology Clinical Trials Fund, BioShares Biotechnology Products Fund, Tuttle Tactical Management Multi-Strategy Income ETF, Tuttle Tactical Management U.S. Core ETF, and Virtus Newfleet Multi-Sector Unconstrained Bond ETF (each a “Fund”, and collectively the “Funds”) are presented herein. The shares of the Funds are referred to herein as “Fund Shares” or “Shares”. The offering of Shares is registered under the Securities Act of 1933, as amended (the “Securities Act”).
A change in control of the Adviser, the Distributor and certain of their affiliates occurred on April 10, 2015 whereby the Adviser, the Distributor and certain of their affiliates became majority-owned subsidiaries of Virtus Partners, Inc., a wholly-owned subsidiary of Virtus Investment Partners, Inc. (Ticker: VRTS). This transaction resulted in the termination of the investment advisory and sub-advisory agreements for, BioShares Biotechnology Products Fund and BioShares Biotechnology Clinical Trials Fund (the “Impacted Funds”) and the termination of the distribution agreement between the Trust, on behalf of each Fund, and the Distributor. On February 19, 2015, the Trust’s Board of Trustees approved new investment advisory agreements and investment sub-advisory agreements for each Impacted Fund with the Adviser and the Impacted Fund’s Sub-Adviser (the “New Advisory Agreements”) and a new distribution agreement with the Distributor on behalf of the Impacted Funds (“New Distribution Agreement”), as well as interim advisory and sub-advisory agreements between each Impacted Fund, the Adviser and the Impacted Fund’s Sub-Adviser (the “Interim Agreements”) to ensure continuity of advisory and sub-advisory services during the period of time between the closing of the transaction and the approval by each Fund’s shareholders of the New Advisory Agreements. The Interim Agreements became effective as of the closing of the transaction on April 10, 2015. At a special meeting held on June 12, 2015, shareholders of each Impacted Fund approved the New Advisory Agreements, which became effective as of June 12, 2015. The terms of the Interim Agreements and the New Advisory Agreements provide for the same advisory and sub-advisory services from the Adviser and Sub-Advisers, on the same terms and for the same advisory fees, as provided under the previous advisory and sub-advisory agreements, except for certain escrow provisions in the Interim Agreements as required by law. Under the New Distribution Agreement, the Distributor provides the underwriting services on the same terms and for the same fees provided for under the previous distribution agreement. Virtus is a public company that operates a multi-manager asset management business and has substantial experience in the investment management and investment company industries.
| Funds | Commencement
of Operations |
| BioShares Biotechnology Clinical Trials Fund | December 16, 2014 |
| BioShares Biotechnology Products Fund | December 16, 2014 |
| Tuttle Tactical Management Multi-Strategy Income ETF | June 9, 2015 |
| Tuttle Tactical Management U.S. Core ETF | February 24, 2015 |
| Virtus Newfleet Multi-Sector Unconstrained Bond ETF | August 10, 2015 |
The BioShares Biotechnology Clinical Trials Fund and BioShares Biotechnology Products Fund seeks investment results that correspond, before fees and expenses, to the price and yield performance of the LifeSci Biotechnology Clinical Trials Index and LifeSci Biotechnology Products Index, respectively.
The Tuttle Tactical Management Multi-Strategy Income ETF seeks current income while maintaining secondary emphasis on long-term capital appreciation and low volatility.
The Tuttle Tactical Management U.S. Core ETF seeks long-term capital appreciation while maintaining a secondary emphasis on capital preservation, primarily through the U.S. equity market.
The Virtus Newfleet Multi-Sector Unconstrained Bond ETF seeks to provide a high level of current income and, secondarily, capital appreciation.
2. SIGNIFICANT ACCOUNTING POLICIES
Each Fund is an investment company and accordingly follows the investment company accounting and reporting guidance of the Financial Accounting Standards Board (FASB) Accounting Standard Codification Topic 946 Financial Services — Investment Companies. Each Fund prepares its financial statements in accordance with generally accepted accounting principles (“GAAP”) in the United States of America and follows the significant accounting policies described below.
|
| Notes to Financial Statements (continued) |
| October 31, 2015 |
Use of Estimates
Management makes certain estimates and assumptions that affect the reported amounts of assets and liabilities and disclosure of contingent assets and liabilities at the date of the financial statements and reported amounts of increases and decreases in the net assets from operations during the reporting period. Actual results could differ from those estimates.
Indemnification
In the normal course of business, the Funds may enter into contracts that contain a variety of representations which provide general indemnifications for certain liabilities. The Funds’ maximum exposure under these arrangements is unknown. However, the Funds have not had prior claims or losses pursuant to these contracts and expects the risk of loss to be remote.
Security Valuation
Security holdings traded on a national securities exchange are valued based on their last sale price. Price information on listed securities is taken from the exchange where the security is primarily traded. Securities regularly traded in an over the counter market are valued at the latest quoted sale price in such market or in the case of the New York Stock Exchange (“NYSE”) or NASDAQ, at the NYSE or NASDAQ Official Closing Price. If market quotations are not readily available, or if it is determined that a quotation of a security does not represent fair value, then the security is valued at fair value as determined in good faith using procedures adopted by the Trust’s Board of Trustees (the “Board”).
Debt securities, including restricted securities, are valued based on evaluated quotations received from independent pricing services or from dealers who make markets in such securities. For most bond types, the pricing service utilizes matrix pricing that considers one or more of the following factors: yield or price of bonds of comparable quality, coupon, maturity, current cash flows, type, and current day trade information, as well as dealer-supplied prices.
Short-term securities with 60 days or less remaining to maturity are valued using the amortized cost method, which approximates current market value.
Fair Value Measurement
Accounting Standards Codification, Fair Value Measurements and Disclosures (“ASC 820”) defines fair value, establishes a framework for measuring fair value in accordance with GAAP, and requires disclosure about fair value measurements. It also provides guidance on determining when there has been a significant decrease in the volume and level of activity for an asset or liability, when a transaction is not orderly, and how that information must be incorporated into fair value measurement. Under ASC 820, various inputs are used in determining the value of the Funds’ investments. These inputs are summarized in the following hierarchy:
| • | Level 1 — Unadjusted quoted prices in active markets for identical assets or liabilities that the Funds have the ability to access. |
| • | Level 2 — Observable inputs other than quoted prices included in Level 1 that are observable for the asset or liability, either directly or indirectly. These inputs may include quoted prices for the identical instrument on an inactive market, prices for similar securities, interest rates, prepayment speeds, credit risk, yield curves, default rates and similar data. |
| • | Level 3 — Unobservable inputs for the asset or liability, to the extent relevant observable inputs are not available; representing the Funds’ own assumptions about the assumptions a market participant would use in valuing the asset or liability, and would be based on the best information available. |
|
| Notes to Financial Statements (continued) |
| October 31, 2015 |
The inputs or methodology used for valuing securities are not necessarily an indication of the risk associated with investing in those securities. The following summarizes inputs used as of October 31, 2015 in valuing the Funds’ assets carried at fair value:
| | | BioShares
Biotechnology
Clinical Trials
Fund | | BioShares
Biotechnology
Products Fund | | Tuttle Tactical
Management
Multi-Strategy
Income ETF | | Tuttle Tactical
Management
U.S. Core ETF | | Virtus Newfleet
Multi-Sector
Unconstrained
Bond ETF |
| Assets | | | | | | | | | | | | | | | | | | | | |
| Level 1 | | | | | | | | | | | | | | | | | | | | |
| Common Stocks | | $ | 23,225,324 | | | $ | 22,878,819 | | | $ | — | | | $ | — | | | $ | — | |
| Exchange Traded Funds | | | — | | | | — | | | | 46,736,864 | | | | 74,540,660 | | | | — | |
| Money Market Fund | | | — | | | | — | | | | — | | | | — | | | | 65,384,324 | |
| Level 2 | | | | | | | | | | | | | | | | | | | | |
| Corporate Bonds | | | — | | | | — | | | | — | | | | — | | | | 50,019,250 | |
| Term Loans | | | — | | | | — | | | | — | | | | — | | | | 21,530,126 | |
| Mortgage Backed Securities | | | — | | | | — | | | | — | | | | — | | | | 16,852,676 | |
| Foreign Bonds | | | — | | | | — | | | | — | | | | — | | | | 9,542,982 | |
| Asset Backed Securities | | | — | | | | — | | | | — | | | | — | | | | 5,868,040 | |
| Totals | | $ | 23,225,324 | | | $ | 22,878,819 | | | $ | 46,736,864 | | | $ | 74,540,660 | | | $ | 169,197,398 | |
For significant movements between levels within the fair value hierarchy, the Funds adopted a policy of recognizing the transfers as of the date of the underlying event which caused the movement. There were no significant transfers between levels during the period ended October 31, 2015.
A reconciliation of assets in which Level 3 inputs are used in determining fair value is presented when there are significant Level 3 investments at the end of the period. There were no Level 3 securities as of October 31, 2015.
Security Transactions
Security transactions are accounted for on the trade date. Realized gains and losses on sales of investment securities are calculated using specific identification.
Investment Income and Expenses
Dividend income is recognized on the ex-dividend date. Expenses are recognized on the accrual basis.
Each Fund pays all of its expenses not assumed by the Sub-Adviser or the Adviser. General Trust expenses that are allocated among and charged to the assets of the Funds and other series of the Trust are done so on a basis that the Board deems fair and equitable, which may be on a basis of relative net assets of the Funds and other series of the Trust or the nature of the services performed and relative applicability to the Funds and other series of the Trust.
Distributions to Shareholders
Distributions are recorded by the Funds on the ex-dividend date. Income and capital gain distributions are determined in accordance with income tax regulations that may differ from accounting principles generally accepted in the United States of America.
Foreign Currency Translation
Non-U.S. investment securities and other assets and liabilities denominated in foreign currencies are translated into U.S. dollar amounts at the foreign currency exchange rate effective at the end of the reporting period. Cost of investments is translated at the currency exchange rate effective at the trade date. The gain or loss resulting from a change in currency exchange rates between the trade and settlement date of a portfolio transaction is treated as a gain or loss on foreign currency. Likewise, the gain or loss resulting from a change in currency exchange rates between the date income is accrued and the date it is paid is treated as a gain or loss on foreign currency. The Funds do not isolate that portion of the results of operations arising from changes in foreign exchange rates on investments from the fluctuations arising from changes in the market prices of securities held. Such fluctuations are included with the net realized and unrealized gain or loss on investments. During the period ended October 31, 2015, the Funds did not have any net realized and unrealized gains or loss on foreign currency translations included in investments.
When-issued Purchases and Forward Commitments (Delayed Delivery)
The Funds may engage in when-issued or forward commitment transactions. Securities purchased on a when-issued or forward commitment basis are also known as delayed delivery transactions. Delayed delivery transactions involve a commitment by a fund to
|
| Notes to Financial Statements (continued) |
| October 31, 2015 |
purchase or sell a security at a future date, ordinarily up to 90 days later. When-issued or forward commitments enable a fund to lock in what is believed to be an attractive price or yield on a particular security for a period of time, regardless of future changes in interest rates. The Funds record when-issued and delayed delivery securities on the trade date. The Funds maintain collateral for the securities purchased. Securities purchased on a when-issued or delayed delivery basis begin earning interest on the settlement date.
Loan Agreements
The Virtus Newfleet Multi-Sector Unconstrained Bond ETF may invest in direct debt instruments which are interests in amounts owed by a corporate, governmental, or other borrower to lenders or lending syndicates. Loan agreements are generally non-investment grade and often involve borrowers that are highly leveraged. The Fund may invest in obligations of borrowers who are in bankruptcy proceedings. Loan agreements are typically senior in the corporate capital structure of the borrower. A loan is often administered by a bank or other financial institution (the “lender”) that acts as agent for all holders. The agent administers the terms of the loan, as specified in the loan agreement. The Fund’s investments in loans may be in the form of participations in loans or assignments of all or a portion of loans from third parties. When investing in loan participations, the Fund has the right to receive payments of principal, interest and any fees to which it is entitled only from the lender selling the loan participation and only upon receipt by the lender of payments from the borrower. The Fund generally has no right to enforce compliance with the terms of the loan agreement with the borrower. As a result, the Fund may be subject to the credit risk of both the borrower and the lender that is selling the loan agreement. When the Fund purchases assignments from lenders it acquires direct rights against the borrower on the loan.
The Fund may invest in multiple series or tranches of a loan, which may have varying terms and carry different associated risks. Loan agreements may involve foreign borrowers, and investments may be denominated in foreign currencies. Direct indebtedness of emerging countries involves a risk that the government entities responsible for the repayment of the debt may be unable, or unwilling, to pay the principal and interest when due.
The loan agreements have floating rate loan interests which generally pay interest at rates that are periodically determined by reference to a base lending rate plus a premium. The base lending rates are generally LIBOR (London Interbank Offered Rate), the prime rate offered by one or more U.S. banks or the certificate of deposit rate. When a loan agreement is purchased the Fund may pay an assignment fee. On an ongoing basis, the Fund may receive a commitment fee based on the undrawn portion of the underlying line of credit portion of a loan agreement. Prepayment penalty fees are received upon the prepayment of a loan agreement by a borrower. Prepayment penalty, facility, commitment, consent and amendment fees are recorded to income as earned or paid.
At October 31, 2015, all loan agreements held by the Fund are assignment loans.
3. INVESTMENT MANAGEMENT AGREEMENT, RELATED PARTIES AND OTHER AGREEMENTS
Investment Advisory Agreement
The Trust has entered into an Investment Advisory Agreement (the “Advisory Agreement”) with the Adviser, a wholly owned subsidiary of ETF Holdings, LLC, on behalf of the Funds. ETFis Holdings, LLC is majority owned by Virtus Partners, Inc. Pursuant to the Advisory Agreement, the Adviser has overall supervisory responsibility for the general management and investment of the Funds’ securities portfolio. For its services of the BioShares Biotechnology Clinical Trials Fund, BioShares Biotechnology Products Fund, Tuttle Tactical Management Multi-Strategy Income ETF, and Tuttle Tactical Management U.S. Core ETF the Adviser is entitled to receive a fee, payable monthly, at an annual rate of 0.075% of each Fund’s average daily net assets, paid by the sub-adviser as defined below. For its services on the Virtus Newfleet Multi-Sector Unconstrained Bond ETF the Adviser is entitled to receive a fee, payable monthly, at an annual rate of 0.70% of the Fund’s average daily net assets.
For the period ended October 31, 2015, the Adviser reimbursed Tuttle Tactical Management U.S. Core ETF and Tuttle Tactical Management Multi-Strategy Income ETF $35,277 and $2,803, respectively, for losses realized on investments that did not meet investment guidelines. The reimbursements of losses are netted and the netted amounts are reflected on the Funds’ Statement of Operations. The effect of the reimbursement on each Fund’s total return is detailed in a footnote to each Fund’s financial highlights.
Expense Limitation Agreement
The Adviser has contractually agreed to reduce its fees and reimburse expenses in order to keep net expenses (excluding interest, taxes, brokerage commissions, acquired fund fees and expenses, and extraordinary expenses) from exceeding a specified amount for the Virtus NewFleet Multi-Sector Unconstrained Bond ETF’s average daily net assets. The expense limitation agreement will be terminated upon termination of the investment advisory agreement between the Adviser and the Fund. The investment advisory agreement may be terminated on behalf of the Fund with the approval of the Fund’s Board or by a vote of the majority of the Fund’s shareholders and on behalf of the Adviser, upon not less than 30 days’ written notice. The expense cap in effect for Virtus NewFleet Multi-Sector Unconstrained Bond ETF during the period ended October 31, 2015 was 0.80%.
|
| Notes to Financial Statements (continued) |
| October 31, 2015 |
For the period ended October 31, 2015, the Adviser waived fees and reimbursed expenses for Virtus Newfleet Multi-Sector Unconstrained Bond ETF as follows. The Fund may recoup such waivers until the date indicated.
| Fund | | Expenses
Reimbursed | | Recoupment
Balance | | Recoupment
Expiration |
| Virtus Newfleet Multi-Sector Unconstrained Bond ETF | | $57,777 | | $57,777 | | 10/31/2018 |
Sub-Advisory Agreement
Each Sub-Adviser provides investment advice and management services to its Fund. Pursuant to an investment sub-advisory agreement (“Investment Sub-Advisory Agreement”) among the Trust, the Sub-Adviser and the Adviser, the Sub-adviser fee is based on the average daily net assets as specified below. The Sub-Advisers, except the Sub-Adviser of Virtus Newfleet Multi-Sector Unconstrained Bond ETF, have agreed to pay all expenses of their respective Funds, except the Sub-Adviser’s fee, brokerage expenses, taxes, interest, litigation expenses, payments under any 12b-1 plan adopted by the Funds, and other non-routine or extraordinary expenses of the Funds. The Subadvisory fees are listed below.
| Funds | | Sub-Advisory
Agreement |
| BioShares Biotechnology Clinical Trials Fund | | 0.85% |
| BioShares Biotechnology Products Fund | | 0.85% |
| Tuttle Tactical Management Multi-Strategy Income ETF | | 0.90% |
| Tuttle Tactical Management U.S. Core ETF | | 0.90% |
| Virtus Newfleet Multi-Sector Unconstrained Bond ETF | | 50% of the Advisory Fee |
Principal Underwriter
Pursuant to the terms of a Distribution Agreement with the Trust, ETF Distributors LLC (the “Distributor”) serves as the Funds’ principal underwriter. The Distributor receives compensation for the statutory underwriting services it provides to the Funds. The Distributor will not distribute shares in less than Creation Units (as hereinafter defined), and does not maintain a secondary market in shares. The shares are expected to be traded in the secondary market in shares. The Distributor is a wholly-owned subsidiary of Virtus.
BioShares Biotechnology Clinical Trials Fund, BioShares Biotechnology Products Fund, Tuttle Tactical Management Multi-Strategy Income ETF, and Tuttle Tactical Management U.S. Core ETF do not pay directly for the services they receive from the Distributor, but rather the Funds’ respective Sub-Advisers have agreed to pay the Distributor’s fees under the Sub-Advisers’ unified fee arrangements with the Funds. Virtus Newfleet Multi-Sector Unconstrained Bond ETF pays the Distributor directly for the services it receives from the Distributor, which amounted to $2,984 for the period ended October 31, 2015.
Distribution and Service (12b-1 Plan)
The Board of Trustees has adopted a distribution and service plan, where the Funds are authorized to pay an amount up to 0.25% of its average daily net assets each year to finance activities primarily intended to result in the sale of Creation Units of the Funds or the provision of investor services. No 12b-1 fees are currently paid by the Funds and there are no current plans to impose the fees.
Operational Administrator
The Administrator serves as the Funds’ operational administrator. The Administrator supervises the overall administration of the Trust and the Funds including, among other responsibilities, the coordination and day-to-day oversight of the Funds’ operations, the service providers’ communications with the Funds and each other and assistance with Trust, Board and contractual matters related to the Funds and other series of the Trust. The Administrator also provides persons satisfactory to the Board to serve as officers of the Trust.
Accounting Services Administrator, Custodian and Transfer Agent
The Bank of New York Mellon (“BNY Mellon”) provides administrative, accounting, tax and financial reporting for the maintenance and operations of the Trust as the Funds’ accounting services administrator. BNY Mellon also serves as the custodian for the Funds’ assets, and serves as transfer agent and dividend paying agent for the Funds.
4. CREATION AND REDEMPTION TRANSACTIONS
The Funds issue and redeem shares on a continuous basis at Net Asset Value (“NAV”) in groups of 50,000 shares called “Creation Units.” Creation Units of the Funds, with the exception of Virtus Newfleet Multi-Sector Unconstrained Bond ETF, are issued and redeemed generally in exchange for specified securities held by the Funds and a specified cash payment. Creations Units of Virtus Newfleet Multi-Sector Unconstrained Bond ETF are issued and redeemed principally for cash. In each instance of such cash creations or redemptions, the Trust may impose transaction fees based on transaction expenses related to the particular exchange that will be higher than the transaction fees associated with in-kind purchases or redemptions.
|
| Notes to Financial Statements (continued) |
| October 31, 2015 |
Only “Authorized Participants” who have entered into contractual arrangements with the Distributor may purchase or redeem shares directly from the Funds. An Authorized Participant is either (i) a broker-dealer or other participant in the clearing process through the Continuous Net Settlement System of the National Securities Clearing Corporation or (ii) a DTC participant and, in each case, must have executed a Participant Agreement with the Distributor. Most retail investors will not qualify as Authorized Participants or have the resources to buy and sell whole Creation Units. Therefore, they will be unable to purchase or redeem the shares directly from the Funds. Rather, most retail investors will purchase shares in the secondary market with the assistance of a broker and will be subject to customary brokerage commissions or fees.
5. FEDERAL INCOME TAX
The Funds intend to qualify as a “regulated investment company” under Sub-chapter M of the Internal Revenue Code of 1986, as amended, by distributing substantially all of their net investment income and net capital gains to shareholders. Accounting for Uncertainty in Income Taxes provides guidance for how uncertain tax positions should be recognized, measured, presented and disclosed in the financial statements, and requires the evaluation of tax positions taken or expected to be taken in the course of preparing a Fund’s tax returns to determine whether the tax positions are “more-likely-than-not” of being sustained by the applicable tax authority. Tax positions not deemed to meet the more-likely-than-not threshold would be recorded as a tax benefit or expense in the current year. Interest and penalty related to income taxes would be recorded as income tax expense. Management of each Fund is required to analyze all open tax years, as defined by IRS statute of limitations, for all major jurisdictions, including federal tax authorities and certain state tax authorities. As of October 31, 2015, the Funds did not have a liability for any unrecognized tax benefits. The Funds have no examinations in progress and are not aware of any tax positions for which it is reasonably possible that the amounts of unrecognized tax benefits will significantly change in the next twelve months.
The Funds recognizes interest accrued related to unrecognized tax benefits and penalties as income tax expense. For the period from inception to October 31, 2015, the Funds had no accrued penalties or interest.
The adjusted cost basis of investments and gross unrealized appreciation and depreciation of investments for federal income tax purposes were as follows:
| Funds | | Federal Tax Cost
Of Investments | | Gross
Unrealized
Appreciation | | Gross
Unrealized
Depreciation | | Net Unrealized
Appreciation
(Depreciation) |
| BioShares Biotechnology Clinical Trials Fund | | $ | 31,701,228 | | | $ | 1,268,331 | | | $ | (9,744,235 | ) | | $ | (8,475,904 | ) |
| BioShares Biotechnology Products Fund | | | 26,892,066 | | | | 891,777 | | | | (4,905,024 | ) | | | (4,013,247 | ) |
| Tuttle Tactical Management Multi-Strategy Income ETF | | | 46,679,163 | | | | 119,328 | | | | (61,627 | ) | | | 57,701 | |
| Tuttle Tactical Management U.S. Core ETF | | | 75,388,385 | | | | 112,693 | | | | (960,418 | ) | | | (847,725 | ) |
| Virtus Newfleet Multi-Sector Unconstrained Bond ETF | | | 168,690,387 | | | | 867,327 | | | | (360,316 | ) | | | 507,011 | |
The differences between book basis and tax basis components of net assets are primarily attributable to tax deferral of losses on wash sales and undistributed short-term capital gains treated as ordinary income for tax purposes. At October 31, 2015, the components of accumulated earnings/loss on a tax-basis were as follows:
| Funds | | Undistributed
Ordinary Income | | Accumulated
Capital and
Other Gain (Loss) | | Net Unrealized
Appreciation
(Depreciation) | | Total
Accumulated
Earnings (Loss) |
| BioShares Biotechnology Clinical Trials Fund | | $ | 125,230 | | | $ | — | | | $ | (8,475,904 | ) | | $ | (8,350,674 | ) |
| BioShares Biotechnology Products Fund | | | 278,074 | | | | — | | | | (4,013,247 | ) | | | (3,735,173 | ) |
| Tuttle Tactical Management Multi-Strategy Income ETF | | | 130,888 | | | | (1,513,633 | ) | | | 57,701 | | | | (1,325,044 | ) |
| Tuttle Tactical Management U.S. Core ETF | | | — | | | | (2,615,861 | ) | | | (847,725 | ) | | | (3,463,586 | ) |
| Virtus Newfleet Multi-Sector Unconstrained Bond ETF | | | 106,546 | | | | (36,287 | ) | | | 507,011 | | | | 577,270 | |
The tax character of distributions paid during the periods ended October 31, 2015:
| Funds | | Distributions
Paid From
Ordinary Income | | Distributions
Paid From
Long-Term
Capital Gains |
| BioShares Biotechnology Clinical Trials Fund | | $ | — | | | $ | — | |
| BioShares Biotechnology Products Fund | | | — | | | | — | |
| Tuttle Tactical Management Multi-Strategy Income ETF | | | — | | | | — | |
| Tuttle Tactical Management U.S. Core ETF | | | — | | | | — | |
| Virtus Newfleet Multi-Sector Unconstrained Bond ETF | | | 179,639 | | | | — | |
|
| Notes to Financial Statements (continued) |
| October 31, 2015 |
At October 31, 2015, for Federal income tax purposes, the following Funds have capital loss carryforwards available to offset future capital gains through the years indicated. To the extent that these loss carryforwards are utilized, capital gains so offset will not be distributed to shareholders.
| Funds | | Short-Term
No Expiration | | Long-Term
No Expiration | | Total |
| BioShares Biotechnology Clinical Trials Fund | | $ | — | | | $ | — | | | $ | — | |
| BioShares Biotechnology Products Fund | | | — | | | | — | | | | — | |
| Tuttle Tactical Management Multi-Strategy | | | | | | | | | | | | |
| Income ETF | | | 1,513,633 | | | | — | | | | 1,513,633 | |
| Tuttle Tactical Management U.S. Core ETF | | | 2,615,861 | | | | — | | | | 2,615,861 | |
| Virtus Newfleet Multi-Sector Unconstrained | | | | | | | | | | | | |
| Bond ETF | | | 36,287 | | | | — | | | | 36,287 | |
For financial reporting purposes, capital accounts are adjusted to reflect the tax character of permanent book/tax differences. Reclassifications are primarily due to tax treatment of redemptions in kind. Results of operations and net assets were not affected by these reclassifications. At October 31, 2015, the effect of permanent book/tax reclassifications resulted in increases (decreases) to the components of net assets as follows:
| Funds | | Undistributed
Net Investment
Income | | Accumulated
Net Realized
Gain/(Loss)
On Investments | | Paid-in-
Capital |
| BioShares Biotechnology Clinical Trials Fund | | $ | 158,980 | | | $ | (2,619,601 | ) | | $ | 2,460,621 | |
| BioShares Biotechnology Products Fund | | | 81,148 | | | | (1,709,519 | ) | | | 1,628,371 | |
| Tuttle Tactical Management Multi-Strategy Income ETF | | | — | | | | — | | | | — | |
| Tuttle Tactical Management U.S. Core ETF | | | 18,900 | | | | (1,482 | ) | | | (17,418 | ) |
| Virtus Newfleet Multi-Sector Unconstrained Bond ETF | | | 23,863 | | | | (23,863 | ) | | | — | |
6. INVESTMENT TRANSACTIONS
Purchases and sales of investments (excluding short-term investments) for the period ended October 31, 2015 were as follows:
| Funds | | Purchases | | Sales | | Purchases
In-Kind | | Sales
In-Kind |
| BioShares Biotechnology Clinical Trials Fund | | $ | 15,861,101 | | | $ | 16,776,794 | | | $ | 43,899,628 | | | $ | 14,027,534 | |
| BioShares Biotechnology Products Fund | | | 7,246,637 | | | | 8,201,263 | | | | 36,545,516 | | | | 10,686,510 | |
| Tuttle Tactical Management Multi-Strategy Income ETF | | | 346,166,849 | | | | 339,534,692 | | | | 41,563,628 | | | | — | |
| Tuttle Tactical Management U.S. Core ETF | | | 833,989,645 | | | | 830,818,343 | | | | 76,037,131 | | | | 1,170,391 | |
| Virtus Newfleet Multi-Sector Unconstrained Bond ETF | | | 116,868,191 | | | | 13,523,744 | | | | — | | | | — | |
7. INVESTMENT RISKS
As with any investment, an investment in the Funds could result in a loss or the performance of the Funds could be inferior to that of other investments. An investor should consider each Fund’s investment objectives, risks, and charges and expenses carefully before investing. Each Fund’s prospectus and statement of additional information contain this and other important information.
8. CREDIT RISK
High-yield/high-risk securities typically entail greater price volatility and/or principal and interest rate risk. There is a greater chance that an issuer will not be able to make principal and interest payments on time. Analysis of the creditworthiness of issuers of high-yield/high-risk securities may be complex, and as a result, it may be more difficult for the Adviser and/or sub-adviser to accurately predict risk.
|
| Notes to Financial Statements (continued) |
| October 31, 2015 |
9. ASSET CONCENTRATION RISK
Certain Funds may invest a high percentage of their assets in specific sectors of the market in the pursuit of their investment objectives. Fluctuations in these sectors of concentration may have a greater impact on a Fund, positive or negative, than if a Fund did not concentrate its investments in such sectors.
At October 31, 2015, the following Funds held a security with a significant concentration to the portfolio as detailed below:
| Fund | | Security | | Percentage of
Net Assets |
| Tuttle Tactical Management Multi-Strategy Income ETF | | iShares 1-3 Year Treasury Bond ETF | | 45.7% |
| Tuttle Tactical Management U.S. Core ETF | | iShares 1-3 Year Treasury Bond ETF | | 34.1% |
The iShares 1-3 Year Treasury Bond ETF is registered under the 1940 Act as an open-ended management investment company. The financial statements of iShares 1-3 Year Treasury Bond ETF can be found at the iShares website or the Securities and Exchange Commission’s website (www.sec.gov) and should be read in conjunction with the Funds’ financial statements.
10. 10% SHAREHOLDERS
As of October 31, 2015, certain Funds had individual shareholder account(s) and/or omnibus shareholder account(s) (comprised of a group of individual shareholders), which individually amounted to more than 10% of the total shares outstanding of each such Fund as detailed below:
| | | % of Shares
Outstanding | | Number of
Accounts |
| Virtus Newfleet Multi-Sector Unconstrained Bond ETF | | 80% | | 1 |
11. SUBSEQUENT EVENTS
The Funds are required to recognize in the financial statements the effects of all subsequent events that provide additional evidence about conditions that existed as of the date of the Statements of Assets and Liabilities. For non-recognized subsequent events that must be disclosed to keep the financial statements from being misleading, the Funds are required to disclose the nature of the event as well as an estimate of its financial effect, or a statement that such an estimate cannot be made. Management has evaluated subsequent events through the issuance of these financial statements and has determined that there are no other material events that would require disclosure.
|
| Schedule of Investments — InfraCap MLP ETF |
| October 31, 2015 |
| | | | | |
| Security Description | | Shares | | Value |
| Common Stocks — 133.8%(1) | | | | | | | | |
| Energy — 133.8% | | | | | | | | |
| Buckeye Partners LP(2) | | | 21,119 | | | $ | 1,432,502 | |
| Crestwood Equity Partners LP | | | 166,160 | | | | 480,202 | |
| DCP Midstream Partners LP | | | 140 | | | | 4,022 | |
| Enbridge Energy Partners LP(2) | | | 34,552 | | | | 965,383 | |
| Energy Transfer Equity LP(2) | | | 21,051 | | | | 453,649 | |
| Energy Transfer Partners LP(2) | | | 46,752 | | | | 2,064,568 | |
| EnLink Midstream LLC | | | 7,006 | | | | 138,018 | |
| EnLink Midstream Partners LP | | | 15,554 | | | | 268,307 | |
| Enterprise Products Partners LP(2) | | | 85,071 | | | | 2,350,512 | |
| EQT Midstream Partners LP | | | 6,838 | | | | 506,286 | |
| Genesis Energy LP(2) | | | 13,813 | | | | 556,802 | |
| Kinder Morgan, Inc.(2) | | | 20,543 | | | | 561,851 | |
| Magellan Midstream Partners LP | | | 35,901 | | | | 2,290,843 | |
| MarkWest Energy Partners LP(2) | | | 36,692 | | | | 1,602,707 | |
| MPLX LP | | | 3,612 | | | | 140,109 | |
| NGL Energy Partners LP | | | 16,341 | | | | 302,635 | |
| NuStar Energy LP | | | 645 | | | | 32,669 | |
| ONEOK Partners LP(2) | | | 34,277 | | | | 1,091,037 | |
| ONEOK, Inc. | | | 151 | | | | 5,122 | |
| Phillips 66 Partners LP | | | 8,131 | | | | 493,064 | |
| Plains All American Pipeline LP(2) | | | 72,899 | | | | 2,312,356 | |
| Plains GP Holdings LP, Class A | | | 33,854 | | | | 526,430 | |
| Shell Midstream Partners LP | | | 584 | | | | 19,990 | |
| Spectra Energy Corp. | | | 14,940 | | | | 426,836 | |
| Spectra Energy Partners LP | | | 2,018 | | | | 87,057 | |
| Sunoco Logistics Partners LP | | | 42,067 | | | | 1,221,626 | |
| Targa Resources Corp. | | | 17,008 | | | | 972,007 | |
| Targa Resources Partners LP | | | 24,243 | | | | 727,290 | |
| TC PipeLines LP | | | 4,209 | | | | 217,437 | |
| Tesoro Logistics LP | | | 11,575 | | | | 649,010 | |
| Western Gas Equity Partners LP | | | 7,367 | | | | 317,739 | |
| Western Gas Partners LP | | | 12,135 | | | | 620,341 | |
| Williams Cos., Inc. (The) | | | 12,730 | | | | 502,071 | |
| Williams Partners LP(2) | | | 71,239 | | | | 2,407,878 | |
| |
| Total Common Stocks | | | | | | | | |
| (Cost $34,311,014) | | | | | | $ | 26,748,356 | |
| |
| Security Description | | Number of
Contracts | | | | |
| Purchased Call Options -0.0%(3) | | | | | | | | |
| United States Oil Fund LP, | | | | | | | | |
| Expires 01/15/16, | | | | | | | | |
| Strike Price $16.00 | | | 50 | | | | 3,025 | |
| Williams Cos., Inc. (The), | | | | | | | | |
| Expires 01/15/16, | | | | | | | | |
| Strike Price $45.00 | | | 50 | | | | 2,850 | |
| |
| Total Purchased Call Options | | | | | | | | |
| (Cost $20,814) | | | | | | | 5,875 | |
| |
| TOTAL INVESTMENTS — 133.8% | | | | | | | | |
| (Cost $34,331,828) | | | | | | | 26,754,231 | |
| Liabilities in Excess of | | | | | | | | |
| Other Assets — (33.8)% | | | | | | | (6,764,846 | ) |
| Net Assets — 100.0% | | | | | | $ | 19,989,385 | |
| | | | | |
| | | Number of | | |
| Security Description | | Contracts | | Value |
| Written Options — (0.7)% | | | | | | | | |
| Calls | | | | | | | | |
| Buckeye Partners LP, | | | | | | | | |
| Expires 11/20/15, | | | | | | | | |
| Strike Price $75.00 | | | (50 | ) | | $ | (1,000 | ) |
| Buckeye Partners LP, | | | | | | | | |
| Expires 11/20/15, | | | | | | | | |
| Strike Price $80.00 | | | (50 | ) | | | (625 | ) |
| Buckeye Partners LP, | | | | | | | | |
| Expires 02/19/16, | | | | | | | | |
| Strike Price $80.00 | | | (50 | ) | | | (3,000 | ) |
| Buckeye Partners LP, | | | | | | | | |
| Expires 05/20/16, | | | | | | | | |
| Strike Price $80.00 | | | (50 | ) | | | (6,625 | ) |
| Enbridge Energy Partners LP, | | | | | | | | |
| Expires 11/20/15, | | | | | | | | |
| Strike Price $27.50 | | | (50 | ) | | | (4,500 | ) |
| Energy Transfer Equity LP, | | | | | | | | |
| Expires 12/18/15, | | | | | | | | |
| Strike Price $22.50 | | | (50 | ) | | | (4,000 | ) |
| Energy Transfer Equity LP, | | | | | | | | |
| Expires 01/15/16, | | | | | | | | |
| Strike Price $25.00 | | | (50 | ) | | | (2,125 | ) |
| Energy Transfer Equity LP, | | | | | | | | |
| Expires 01/15/16, | | | | | | | | |
| Strike Price $35.00 | | | (50 | ) | | | (500 | ) |
| Energy Transfer Equity LP, | | | | | | | | |
| Expires 01/15/16, | | | | | | | | |
| Strike Price $38.75 | | | (40 | ) | | | (700 | ) |
| Energy Transfer Partners LP, | | | | | | | | |
| Expires 12/18/15, | | | | | | | | |
| Strike Price $57.50 | | | (50 | ) | | | (625 | ) |
| Energy Transfer Partners LP, | | | | | | | | |
| Expires 01/15/16, | | | | | | | | |
| Strike Price $57.50 | | | (50 | ) | | | (875 | ) |
| Enterprise Products Partners LP, | | | | | | | | |
| Expires 12/18/15, | | | | | | | | |
| Strike Price $27.50 | | | (50 | ) | | | (6,875 | ) |
| Enterprise Products Partners LP, | | | | | | | | |
| Expires 12/18/15, | | | | | | | | |
| Strike Price $32.50 | | | (81 | ) | | | (608 | ) |
| Enterprise Products Partners LP, | | | | | | | | |
| Expires 12/18/15, | | | | | | | | |
| Strike Price $35.00 | | | (50 | ) | | | (375 | ) |
| Enterprise Products Partners LP, | | | | | | | | |
| Expires 01/15/16, | | | | | | | | |
| Strike Price $30.00 | | | (100 | ) | | | (6,750 | ) |
| Enterprise Products Partners LP, | | | | | | | | |
| Expires 01/15/16, | | | | | | | | |
| Strike Price $32.50 | | | (50 | ) | | | (1,000 | ) |
| Enterprise Products Partners LP, | | | | | | | | |
| Expires 03/18/16, | | | | | | | | |
| Strike Price $32.50 | | | (50 | ) | | | (2,125 | ) |
| Genesis Energy LP, | | | | | | | | |
| Expires 12/18/15, | | | | | | | | |
| Strike Price $42.50 | | | (100 | ) | | | (13,500 | ) |
| Kinder Morgan, Inc., | | | | | | | | |
| Expires 12/18/15, | | | | | | | | |
| Strike Price $40.00 | | | (30 | ) | | | (105 | ) |
The accompanying notes are an integral part of these financial statements.
|
| Schedule of Investments — InfraCap MLP ETF (continued) |
| October 31, 2015 |
| Security Description | | Number of
Contracts | | Value |
| Written Options (continued) | | | | | | | | |
| Calls (continued) | | | | | | | | |
| Kinder Morgan, Inc., | | | | | | | | |
| Expires 12/18/15, | | | | | | | | |
| Strike Price $45.00 | | | (20 | ) | | $ | (120 | ) |
| MarkWest Energy Partners LP, | | | | | | | | |
| Expires 01/15/16, | | | | | | | | |
| Strike Price $70.00 | | | (50 | ) | | | (1,500 | ) |
| ONEOK Partners LP, | | | | | | | | |
| Expires 11/20/15, | | | | | | | | |
| Strike Price $35.00 | | | (50 | ) | | | (1,375 | ) |
| ONEOK Partners LP, | | | | | | | | |
| Expires 12/18/15, | | | | | | | | |
| Strike Price $35.00 | | | (50 | ) | | | (3,500 | ) |
| Plains All American Pipeline LP, | | | | | | | | |
| Expires 11/20/15, | | | | | | | | |
| Strike Price $35.00 | | | (50 | ) | | | (750 | ) |
| Plains All American Pipeline LP, | | | | | | | | |
| Expires 11/20/15, | | | | | | | | |
| Strike Price $40.00 | | | (50 | ) | | | (875 | ) |
| Plains All American Pipeline LP, | | | | | | | | |
| Expires 11/20/15, | | | | | | | | |
| Strike Price $50.00 | | | (50 | ) | | | (625 | ) |
| Plains All American Pipeline LP, | | | | | | | | |
| Expires 01/15/16, | | | | | | | | |
| Strike Price $35.00 | | | (50 | ) | | | (3,875 | ) |
| Plains All American Pipeline LP, | | | | | | | | |
| Expires 01/15/16, | | | | | | | | |
| Strike Price $40.00 | | | (50 | ) | | | (750 | ) |
| Plains All American Pipeline LP, | | | | | | | | |
| Expires 01/15/16, | | | | | | | | |
| Strike Price $47.50 | | | (50 | ) | | | (375 | ) |
| United States Oil Fund LP, | | | | | | | | |
| Expires 11/06/15, | | | | | | | | |
| Strike Price $16.00 | | | (50 | ) | | | (200 | ) |
| United States Oil Fund LP, | | | | | | | | |
| Expires 11/20/15, | | | | | | | | |
| Strike Price $16.00 | | | (100 | ) | | | (1,650 | ) |
| United States Oil Fund LP, | | | | | | | | |
| Expires 11/20/15, | | | | | | | | |
| Strike Price $17.00 | | | (150 | ) | | | (900 | ) |
| United States Oil Fund LP, | | | | | | | | |
| Expires 11/20/15, | | | | | | | | |
| Strike Price $20.00 | | | (100 | ) | | | (150 | ) |
| United States Oil Fund LP, | | | | | | | | |
| Expires 11/20/15, | | | | | | | | |
| Strike Price $21.00 | | | (50 | ) | | | (75 | ) |
| United States Oil Fund LP, | | | | | | | | |
| Expires 12/18/15, | | | | | | | | |
| Strike Price $17.00 | | | (250 | ) | | | (5,250 | ) |
| United States Oil Fund LP, | | | | | | | | |
| Expires 12/18/15, | | | | | | | | |
| Strike Price $18.00 | | | (100 | ) | | | (1,100 | ) |
| United States Oil Fund LP, | | | | | | | | |
| Expires 01/15/16, | | | | | | | | |
| Strike Price $17.00 | | | (200 | ) | | | (7,400 | ) |
| United States Oil Fund LP, | | | | | | | | |
| Expires 01/15/16, | | | | | | | | |
| Strike Price $18.00 | | | (200 | ) | | | (4,400 | ) |
| Security Description | | Number of
Contracts | | Value |
| Written Options (continued) | | | | | | | | |
| Calls (continued) | | | | | | | | |
| United States Oil Fund LP, | | | | | | | | |
| Expires 01/15/16, | | | | | | | | |
| Strike Price $19.00 | | | (50 | ) | | $ | (675 | ) |
| United States Oil Fund LP, | | | | | | | | |
| Expires 01/15/16, | | | | | | | | |
| Strike Price $22.00 | | | (100 | ) | | | (450 | ) |
| United States Oil Fund LP, | | | | | | | | |
| Expires 01/15/16, | | | | | | | | |
| Strike Price $25.00 | | | (100 | ) | | | (200 | ) |
| United States Oil Fund LP, | | | | | | | | |
| Expires 04/15/16, | | | | | | | | |
| Strike Price $18.00 | | | (50 | ) | | | (2,775 | ) |
| Williams Partners LP, | | | | | | | | |
| Expires 11/20/15, | | | | | | | | |
| Strike Price $35.00 | | | (100 | ) | | | (4,000 | ) |
| Williams Partners LP, | | | | | | | | |
| Expires 12/18/15, | | | | | | | | |
| Strike Price $35.00 | | | (150 | ) | | | (14,250 | ) |
| Williams Partners LP, | | | | | | | | |
| Expires 12/18/15, | | | | | | | | |
| Strike Price $45.00 | | | (100 | ) | | | (1,250 | ) |
| Williams Partners LP, | | | | | | | | |
| Expires 12/18/15, | | | | | | | | |
| Strike Price $50.00 | | | (50 | ) | | | (625 | ) |
| Williams Partners LP, | | | | | | | | |
| Expires 12/18/15, | | | | | | | | |
| Strike Price $55.00 | | | (80 | ) | | | (1,600 | ) |
| Williams Partners LP, | | | | | | | | |
| Expires 03/18/16, | | | | | | | | |
| Strike Price $35.00 | | | (100 | ) | | | (18,500 | ) |
| Puts | | | | | | | | |
| Enterprise Products Partners LP, | | | | | | | | |
| Expires 11/20/15, | | | | | | | | |
| Strike Price $27.00 | | | (50 | ) | | | (3,000 | ) |
| Enterprise Products Partners LP, | | | | | | | | |
| Expires 12/18/15, | | | | | | | | |
| Strike Price $26.00 | | | (50 | ) | | | (3,250 | ) |
|
| TOTAL WRITTEN OPTIONS — (0.7)% | | | | | | | | |
| (Premiums Received $210,900) | | | | | | $ | (141,358 | ) |
| (1) | Substantially all the securities, or a portion thereof, have been pledged as collateral for open written option contracts. The aggregate market value of the collateral at October 31, 2015 was $11,483,959. |
| (2) | Subject to written call and/or put options. |
| (3) | Amount rounds to less than 0.05%. |
The accompanying notes are an integral part of these financial statements.
|
| Statement of Assets and Liabilities |
| October 31, 2015 |
| | | InfraCap MLP
ETF |
| Assets: | | |
| Investments, at cost | | $ | 34,331,828 | |
| Investments, at value | | | 26,754,231 | |
| Cash | | | 343,074 | |
| Receivables: | | | | |
| Return of capital from master limited partnerships | | | 227,238 | |
| Dividends | | | 27,833 | |
| Deferred tax asset, net of valuation allowance | | | 63,302 | |
| Total Assets | | | 27,415,678 | |
| |
| Liabilities: | | | | |
| Due broker | | | 7,205,404 | |
| Payables: | | | | |
| Subadvisory and Advisory fees | | | 16,229 | |
| Current income tax payable | | | 63,302 | |
| Written options, at value (a) | | | 141,358 | |
| Total Liabilities | | | 7,426,293 | |
| Net Assets | | $ | 19,989,385 | |
| |
| Net Assets Consist of: | | | | |
| Paid-in capital | | $ | 27,249,272 | |
| Undistributed (Accumulated) net investment income (loss), net of income taxes | | | (266,253 | ) |
| Undistributed (Accumulated) net realized gain (loss) on investments, written options, net of income taxes | | | 514,421 | |
| Net unrealized appreciation (depreciation) on investments, written options, net of income taxes | | | (7,508,055 | ) |
| Net Assets | | $ | 19,989,385 | |
| Shares outstanding (unlimited number of shares of beneficial interest authorized, no par value) | | | 1,400,004 | |
| Net asset value per share | | $ | 14.28 | |
| (a) Premiums received | | $ | 210,900 | |
The accompanying notes are an integral part of these financial statements.
|
| Statement of Operations |
| For the Year Ended October 31, 2015 |
| | | InfraCap MLP
ETF |
| Investment Income: | | | | |
| Distributions from master limited partnerships | | $ | 912,154 | |
| Less: Return of capital distributions | | | (912,154 | ) |
| Dividend income | | | 100,421 | |
| Total Investment Income | | | 100,421 | |
| Expenses: | | | | |
| Subadvisory fees | | | 118,905 | |
| Franchise tax expense | | | 613 | |
| Interest expense | | | 25,361 | |
| Total Expenses | | | 144,879 | |
| Net Investment Income (Loss) Before Income Taxes | | | (44,458 | ) |
| Income tax benefit (expense) | | | (613 | ) |
| Net Investment Income (Loss) | | | (45,071 | ) |
| Net Realized Gain (Loss) on: | | | | |
| Investments | | | 369,093 | |
| Written options | | | 145,320 | |
| Income tax benefit, net of valuation allowance | | | 3 | |
| Total Net Realized Gain (Loss) | | | 514,416 | |
| Change in Net Unrealized Appreciation (Depreciation) on: | | | | |
| Investments | | | (7,595,216 | ) |
| Written options | | | 69,879 | |
| Income tax benefit, net of valuation allowance | | | 6,187 | |
| Total Change in Net Unrealized Appreciation (Depreciation) | | | (7,519,150 | ) |
| Net Realized and Net Change in Unrealized Gain (Loss) | | | (7,004,734 | ) |
| Net Increase (Decrease) in Net Assets Resulting from Operations | | $ | (7,049,805 | ) |
The accompanying notes are an integral part of these financial statements.
|
| Statements of Changes in Net Assets |
| | | InfraCap MLP ETF |
| | | For the
Year Ended
October 31, 2015 | | For the Period
October 1, 20141
Through
October 31, 2014 |
| Increase (Decrease) in Net Assets Resulting from Operations: | | | | |
| Net investment income (loss), net of income taxes | | $ | (45,071 | ) | | $ | (1,099 | ) |
| Net realized gain (loss) on investments, written options, net of income taxes | | | 514,416 | | | | 5 | |
| Net change in unrealized appreciation (depreciation) on investments, written options, net of income taxes | | | (7,519,150 | ) | | | 11,095 | |
| Net increase (decrease) in net assets resulting from operations | | | (7,049,805 | ) | | | 10,001 | |
| Distributions to Shareholders from: | | | | | | | | |
| Net investment income | | | (220,083 | ) | | | — | |
| Return of capital | | | (1,286,175 | ) | | | — | |
| Total distributions | | | (1,506,258 | ) | | | — | |
| Shareholder Transactions: | | | | | | | | |
| Proceeds from shares sold | | | 22,493,584 | | | | 6,041,863 | |
| Cost of shares redeemed | | | — | | | | — | |
| Net increase in net assets resulting from shareholder transactions | | | 22,493,584 | | | | 6,041,863 | |
| Increase in net assets | | | 13,937,521 | | | | 6,051,864 | |
| Net Assets: | | | | | | | | |
| Beginning of period | | | 6,051,864 | | | | — | |
| End of period | | $ | 19,989,385 | | | $ | 6,051,864 | |
| Undistributed (Accumulated) net investment income (loss) | | | (266,253 | ) | | | (1,099 | ) |
| Changes in Shares Outstanding: | | | | | | | | |
| Shares outstanding, beginning of period | | | 250,004 | | | | — | |
| Shares sold | | | 1,150,000 | | | | 250,004 | |
| Shares redeemed | | | — | | | | — | |
| Shares outstanding, end of period | | | 1,400,004 | | | | 250,004 | |
| 1 | Commencement of operations. |
The accompanying notes are an integral part of these financial statements.
|
| Statement of Cash Flows |
| October 31, 2015 |
| Cash Flows From Operating Activities: | | | | |
| Net decrease in net assets from operations | | $ | (7,049,805 | ) |
| Adjustments to reconcile net decrease in net assets from operations to net cash provided by operating activities: | | | | |
| Purchases of investment securities | | | (10,145,059 | ) |
| Proceeds from sales of investment securities | | | 10,973,350 | |
| Net proceeds from purchased and written options | | | 981,847 | |
| Net realized gain on investments | | | (369,093 | ) |
| Net realized gain on written options | | | (145,320 | ) |
| Net change in unrealized depreciation on investments | | | 7,595,216 | |
| Net change in unrealized appreciation on written options | | | (69,879 | ) |
| Increase in deferred tax asset, net of valuation allowance | | | (63,302 | ) |
| Increase in dividends receivable | | | (26,519 | ) |
| Increase in return of capital from master limited partnerships receivable | | | (191,861 | ) |
| Increase in due to broker | | | 6,986,696 | |
| Increase in current income tax payable | | | 57,725 | |
| Increase in subadvisory fees payable | | | 13,206 | |
| Net cash provided by operating activities | | | 8,547,202 | |
|
| Cash Flows from Financing Activities: | | | | |
| Payments for fund shares sold in excess of in-kind creations | | | (6,648,656 | ) |
| Distributions paid | | | (1,506,258 | ) |
| Net cash used in financing activities | | | (8,154,914 | ) |
| Net increase in cash | | | 392,288 | |
| Cash, beginning of year | | | (49,214 | ) |
| Cash, end of year | | $ | 343,074 | |
The accompanying notes are an integral part of these financial statements.
| | | InfraCap MLP ETF |
| | | For the
Year Ended
October 31, 2015 | | For the Period
October 1, 20141
Through
October 31, 2014 |
| Per Share Data for a Share Outstanding Throughout the Period: | | | | |
| Net asset value, beginning of period | | $ | 24.21 | | | $ | 25.00 | |
| Investment operations: | | | | | | | | |
| Net investment loss2 | | | (0.06 | ) | | | (0.01 | )8 |
| Net realized and unrealized loss on investments | | | (7.84 | ) | | | (0.78 | ) |
| Total from investment operations | | | (7.90 | ) | | | (0.79 | ) |
|
| Less Distributions from:— | | | | | | | | |
| Net investment income | | | (0.30 | ) | | | — | |
| Return of capital | | | (1.73 | ) | | | — | |
| Total distributions | | | (2.03 | ) | | | — | |
| Net asset value, End of period | | $ | 14.28 | | | $ | 24.21 | |
| |
| Net Asset Value Total Return3 | | | (34.34 | )% | | | (3.17 | )% |
| Net assets, end of period (000’s omitted) | | $ | 19,989 | | | $ | 6,052 | |
| |
| RATIOS/SUPPLEMENTAL DATA: | | | | | | | | |
| Ratios to Average Net Assets: | | | | | | | | |
| Net expenses, including deferred income tax expense/benefit9 | | | 1.11 | %11 | | | 2.70 | %4 |
| Net expenses, excluding deferred income tax expense/benefit9 | | | 1.16 | %11 | | | 0.95 | %4 |
| Net investment loss10 | | | (0.36 | )% | | | (0.35 | )%4 |
| Portfolio turnover rate5 | | | 60 | % | | | — | %6,7 |
| 1 | Commencement of operations. |
| 2 | Based on average shares outstanding. |
| 3 | Net Asset Value Total Return is calculated assuming an initial investment made at the net asset value on the first day of the period, reinvestment of dividends and distributions at net asset value during the period, and redemption at net asset value on the last day of the period. Total return calculated for a period of less than one year is not annualized. |
| 5 | Portfolio turnover excludes the value of portfolio securities received or delivered as a result of in-kind creations or redemptions of the Fund’s capital shares. |
| 6 | Amount rounds to less than 1%. |
| 8 | The per share amount of realized and unrealized loss on investments does not accord with the amounts reported in the Statements of Operations due to the timing of creation of fund shares in relation to fluctuating market values. |
| 9 | Deferred tax expense/benefit estimate for the ratios of expenses to average net assets is derived from net investment loss and net realized and unrealized gains on investments. |
| 10 | The ratio of net investment loss to average net assets is net of a deferred tax benefit estimate derived from net investment loss only. |
| 11 | The ratio of expenses to average net assets include interest expense fees of 0.21%. |
The accompanying notes are an integral part of these financial statements.
|
| Notes to Financial Statements |
| October 31, 2015 |
1. ORGANIZATION
The ETFis Series Trust I (the “Trust”) was organized as a Delaware statutory trust on September 20, 2012 and is registered with the Securities and Exchange Commission (the “SEC”) as an open-end management investment company under the Investment Company Act of 1940, as amended (the “1940 Act”). The Trust currently consists of ten separate investment portfolios. The shares of the InfraCap MLP ETF are presented and referred to herein as “Fund Shares” or “Shares”. The offering of Shares is registered under the Securities Act of 1933, as amended (the “Securities Act”).
A change in control of the Adviser, the Distributor and certain of their affiliates occurred on April 10, 2015 whereby the Adviser, the Distributor and certain of their affiliates became majority-owned subsidiaries of Virtus Partners, Inc., a wholly-owned subsidiary of Virtus Investment Partners, Inc. (Ticker: VRTS). This transaction resulted in the termination of the investment advisory and sub-advisory agreements for InfraCap MLP ETF (the “Fund”) and the termination of the distribution agreement between the Trust, on behalf of the Fund, and the Distributor. On February 19, 2015, the Trust’s Board of Trustees approved new investment advisory and investment sub-advisory agreements for the Fund with the Adviser and the Fund’s Sub-Adviser (the “New Advisory Agreements”) and a new distribution agreement with the Distributor on behalf of the Fund (“New Distribution Agreement”), as well as an interim advisory and sub-advisory agreements between the Fund, the Adviser and the Fund’s Sub-Adviser (the “Interim Agreements”) to ensure continuity of advisory and sub-advisory services during the period of time between the closing of the transaction and the approval by the Fund’s shareholders of the New Advisory Agreements. The Interim Agreements became effective as of the closing of the transaction on April 10, 2015. At a special meeting held on June 12, 2015, shareholders of the Fund approved the New Advisory Agreements, which became effective as of June 12, 2015. The terms of the Interim Agreements and the New Advisory Agreements provide for the same advisory and sub-advisory services from the Adviser and Sub-Advisers, on substantially the same terms and for the same total advisory fees, as provided under the previous advisory and sub-advisory agreements, except for certain escrow provisions in the Interim Agreements as required by law. Under the New Distribution Agreement, the Distributor provides the underwriting services on the same terms and for the same fees provided for under the previous distribution agreement. Virtus is a public company that operates a multi-manager asset management business and has substantial experience in the investment management and investment company industries.
| Fund | Commencement
of Operations |
| InfraCap MLP ETF | October 1, 2014 |
The Fund’s investment objective is to seek total return primarily through investments in equity securities of publicly traded master limited partnerships and limited liability companies taxed as partnerships (“MLPs”).
2. SIGNIFICANT ACCOUNTING POLICIES
The Fund is an investment company and accordingly follows the investment company accounting and reporting guidance of the Financial Accounting Standards Board (FASB) Accounting Standard Codification Topic 946 Financial Services — Investment Companies. The Fund prepares its financial statements in accordance with generally accepted accounting principles (“GAAP”) in the United States of America and follows the significant accounting policies described below.
Use of Estimates
Management makes certain estimates and assumptions that affect the reported amounts of assets and liabilities and disclosure of contingent assets and liabilities at the date of the financial statements and reported amounts of increases and decreases in the net assets from operations during the reporting period. Actual results could differ from those estimates.
Indemnification
In the normal course of business, the Fund may enter into contracts that contain a variety of representations which provide general indemnifications for certain liabilities. The Fund’s maximum exposure under these arrangements is unknown. However, the Fund has not had prior claims or losses pursuant to these contracts and expects the risk of loss to be remote.
Security Valuation
Security holdings traded on a national securities exchange are valued based on their last sale price. Price information on listed securities is taken from the exchange where the security is primarily traded. Securities regularly traded in an over the counter market are valued at the latest quoted sale price in such market or in the case of the New York Stock Exchange (“NYSE”) or NASDAQ, at the NYSE or NASDAQ Official Closing Price. If market quotations are not readily available, or if it is determined that a quotation of a security does not represent fair value, then the security is valued at fair value as determined in good faith using procedures adopted by the Trust’s Board of Trustees (the “Board”).
|
| Notes to Financial Statements (continued) |
| October 31, 2015 |
Short-term securities with 60 days or less remaining to maturity are valued using the amortized cost method, which approximates current market value.
Purchased and written options contracts listed on exchanges are valued at their reported mean of bid and ask quotations; over-the-counter derivative contracts are fair valued using price evaluations provided by a pricing service approved by the Board of Trustees of the Trust.
Fair Value Measurement
Accounting Standards Codification, Fair Value Measurements and Disclosures (“ASC 820”) defines fair value, establishes a framework for measuring fair value in accordance with GAAP, and requires disclosure about fair value measurements. It also provides guidance on determining when there has been a significant decrease in the volume and level of activity for an asset or liability, when a transaction is not orderly, and how that information must be incorporated into fair value measurement. Under ASC 820, various inputs are used in determining the value of the Fund’s investments. These inputs are summarized in the following hierarchy:
| • | Level 1 — Unadjusted quoted prices in active markets for identical assets or liabilities that the Fund has the ability to access. |
| • | Level 2 — Observable inputs other than quoted prices included in Level 1 that are observable for the asset or liability, either directly or indirectly. These inputs may include quoted prices for the identical instrument on an inactive market, prices for similar securities, interest rates, prepayment speeds, credit risk, yield curves, default rates and similar data. |
| • | Level 3 — Unobservable inputs for the asset or liability, to the extent relevant observable inputs are not available; representing the Fund’s own assumptions about the assumptions a market participant would use in valuing the asset or liability, and would be based on the best information available. |
The inputs or methodology used for valuing securities are not necessarily an indication of the risk associated with investing in those securities. The following summarizes inputs used as of October 31, 2015 in valuing the Fund’s assets and liabilities carried at fair value:
| | | InfraCap
MLP ETF |
| Assets | | | | |
| Level 1 | | | | |
| Common Stocks | | $ | 26,748,356 | |
| Level 2 | | | | |
| Purchased Options | | | 5,875 | |
| |
| Liabilities | | | | |
| Level 2 | | | | |
| Written Options | | | (141,358 | ) |
| Total | | $ | 26,612,873 | |
For significant movements between levels within the fair value hierarchy, the Fund has adopted a policy of recognizing the transfers as of the date of the underlying event which caused the movement. There were no significant transfers between levels during the year ended October 31, 2015.
A reconciliation of assets in which Level 3 inputs are used in determining fair value is presented when there are significant Level 3 investments at the end of the period. There were no Level 3 securities as of October 31, 2015.
Security Transactions
Security transactions are accounted for on the trade date. Realized gains and losses on sales of investment securities are calculated using specific identification.
Investment Income and Expenses
Dividend income is recognized on the ex-dividend date. Expenses are recognized on the accrual basis.
The Fund pays all of its expenses not assumed by the Sub-Adviser. General Trust expenses that are allocated among and charged to the assets of the Fund and other series of the Trust are done so on a basis that the Board deems fair and equitable, which may be on a basis
|
| Notes to Financial Statements (continued) |
| October 31, 2015 |
of relative net assets of the Fund and other series of the Trust or the nature of the services performed and relative applicability to the Fund and other series of the Trust.
Distributions to shareholders
Distributions to shareholders are declared and paid on a quarterly basis and are recorded on the ex-dividend date. The Fund uses a cash flow-based distribution approach based on the Fund’s net cash flow received from portfolio investments.
The estimated character of the distributions paid will either be a dividend (ordinary income eligible to be treated as qualified dividend income) or a return of capital. Distributions made from current or accumulated earnings and profits of the Fund will be taxable to shareholders as dividend income. Distributions that are in an amount greater than the Fund’s current and accumulated earnings and profits will represent a return of capital to the extent of a shareholder’s basis in their common shares, and such distributions will correspondingly increase the realized gain upon the sale of their common shares. Additionally, distributions not paid from current or accumulated earnings and profits that exceed a shareholder’s tax basis in their common shares will generally be taxed as a capital gain. This estimate is based on the Fund’s operating results during the period. The Fund is unable to make a final determination as to the tax character of distributions until after the end of the calendar year when the Fund can determine earnings and profits for federal income tax purposes. The Fund will inform the shareholder of the final tax character of its distributions on Form 1099-DIV in February 2016.
3. INVESTMENT MANAGEMENT, RELATED PARTIES AND OTHER AGREEMENTS
Investment Advisory Agreement
The Trust has entered into an Investment Advisory Agreement (the “Advisory Agreement”) with the Adviser, a wholly owned subsidiary of ETFis Holdings, LLC, on behalf of the Fund. ETFis Holdings, LLC is majority owned by Virtus Partners, Inc. Pursuant to the Advisory Agreement, the Adviser has overall supervisory responsibility for the general management and investment of the Fund’s securities portfolio. For its services, the Adviser is entitled to receive a fee, payable monthly, at an annual rate of 0.075% of the Fund’s average daily net assets, paid by the Sub-Adviser as defined below.
Sub-Advisory Agreement
The Sub-Adviser, as defined below, provides investment advice and management services to the Fund. Pursuant to an investment sub-advisory agreement (“Investment Sub-Advisory Agreement”) among the Trust, the Sub-Adviser and the Adviser, the Sub-adviser fee is based on the average daily net assets as specified below. The Sub-Adviser has agreed to pay all expenses of the Fund, except the Sub-Adviser’s fee, brokerage expenses, taxes, interest, litigation expenses, payments under any 12b-1 plan adopted by the Fund, and other non-routine or extraordinary expenses of the Fund.
| Fund | | Sub-Adviser | | Sub-Advisory
Agreement |
| InfraCap MLP ETF | | Infrastructure Capital Advisors, LLC | | 0.95% |
Principal Underwriter
Pursuant to the terms of a Distribution Agreement with the Trust, ETF Distributors LLC (the “Distributor”) serves as the Fund’s principal underwriter. The Distributor receives compensation for the statutory underwriting services it provides to the Fund. The Distributor will not distribute shares in less than Creation Units (as hereinafter defined), and does not maintain a secondary market in shares. The shares are expected to be traded in the secondary market in shares. The Distributor is a wholly-owned subsidiary of Virtus.
The Fund does not pay directly for the services it receives from the Distributor, but rather the Fund’s Sub-Adviser has agreed to pay the Distributor’s fees under the Sub-Adviser’s unified fee arrangement with the Fund.
Distribution and Service (12b-1 Plan)
The Board of Trustees has adopted a distribution and service plan, where the Fund is authorized to pay an amount up to 0.25% of its average daily net assets each year to finance activities primarily intended to result in the sale of Creation Units of the Fund or the provision of investor services. No 12b-1 fees are currently paid by the Fund and there are no current plans to impose the fees.
Operational Administrator
The Administrator serves as the Fund’s operational administrator. The Administrator supervises the overall administration of the Trust and the Fund including, among other responsibilities, the coordination and day-to-day oversight of the Fund’s operations, the service providers’ communications with the Fund and each other and assistance with Trust, Board and contractual matters related to the Fund and other series of the Trust. The Administrator also provides persons satisfactory to the Board to serve as officers of the Trust.
|
| Notes to Financial Statements (continued) |
| October 31, 2015 |
Accounting Services Administrator, Custodian and Transfer Agent
The Bank of New York Mellon (“BNY Mellon”) provides administrative, accounting, tax and financial reporting for the maintenance and operations of the Trust as the Fund’s accounting services administrator. BNY Mellon also serves as the custodian for the Fund’s assets, and serves as transfer agent and dividend paying agent for the Fund.
Affiliated Shareholders
At October 31, 2015, the Sub-Adviser held 367,035 shares of InfraCap MLP ETF, which represent 26.22% of shares outstanding. These shares may be sold at any time.
4. CREATION AND REDEMPTION TRANSACTIONS
The Fund issues and redeems shares on a continuous basis at Net Asset Value (“NAV”) in groups of 50,000 shares called “Creation Units.” Creation Units of the Fund are issued and redeemed generally in exchange for specified securities held by the Fund generally included in the Index and a specified cash payment. Redemptions of Creation Units are affected principally for cash. In each instance of such cash creations or redemptions, the Trust may impose transaction fees based on transaction expenses related to the particular exchange that will be higher than the transaction fees associated with in-kind purchases or redemptions.
Only “Authorized Participants” who have entered into contractual arrangements with the Distributor may purchase or redeem shares directly from the Fund. An Authorized Participant is either (i) a broker-dealer or other participant in the clearing process through the Continuous Net Settlement System of the National Securities Clearing Corporation or (ii) a DTC participant and, in each case, must have executed a Participant Agreement with the Distributor. Most retail investors will not qualify as Authorized Participants or have the resources to buy and sell whole Creation Units. Therefore, they will be unable to purchase or redeem the shares directly from the Fund. Rather, most retail investors will purchase shares in the secondary market with the assistance of a broker and will be subject to customary brokerage commissions or fees.
5. FEDERAL INCOME TAX
The Fund is taxed as a regular C-corporation for federal income tax purposes and as such is obligated to pay federal and applicable state and foreign corporate taxes on its taxable income. Currently, the maximum marginal regular federal income tax rate for a corporation is 35 percent, but the Fund expects to pay tax at a rate of 34 percent, or less depending on earnings. The Fund may be subject to a 20 percent federal alternative minimum tax on its federal alternative taxable income to the extent that its alternative minimum tax exceeds its regular federal income tax. This treatment differs from most investment companies, which elect to be treated as “regulated investment companies” under the Code in order to avoid paying entity level income taxes. Under current law, the Fund is not eligible to elect treatment as a regulated investment company due to its investments primarily in MLPs invested in energy assets. The Fund expects that substantially all of the distributions it receives from MLPs may be treated as a tax-deferred return of capital, thus reducing the Fund’s current tax liability. However, the amount of taxes paid by the Fund will vary depending on the amount of income and gains derived from investments and/or sales of MLP interests and such taxes will reduce your return from an investment in the Fund.
Cash distributions from MLPs to the Fund that exceed the Fund’s allocable share of such MLP’s net taxable income are considered a tax-deferred return of capital that will reduce the Fund’s adjusted tax basis in the equity securities of the MLP. These reductions in the Fund’s adjusted tax basis in the MLP equity securities will increase the amount of any taxable gain (or decrease the amount of any tax loss) recognized by the Fund on a subsequent sale of the securities. The Fund will accrue deferred income taxes for any future tax liability associated with (i) that portion of MLP distributions considered to be a tax-deferred return of capital as well as (ii) capital appreciation of its investments. Upon the sale of an MLP security, the Fund may be liable for previously deferred taxes. The Fund will rely to some extent on information provided by the MLPs, which is not necessarily timely, to estimate deferred tax liability for purposes of financial statement reporting and determining the Fund’s NAV. From time to time, the Adviser will modify the estimates or assumptions related to the Fund’s deferred tax liability as new information becomes available. The Fund will generally compute deferred income taxes based on the marginal regular federal income tax rate applicable to corporations and an assumed rate attributable to state taxes.
|
| Notes to Financial Statements (continued) |
| October 31, 2015 |
The Fund’s income tax expense/(benefit) consists of the following:
| October 31, 2015 | | Current | | Deferred | | Total |
| Federal | | $ | 60,119 | | | $ | (2,475,513 | ) | | $ | (2,415,394 | ) |
| State | | | 3,183 | | | | (131,057 | ) | | | (127,874 | ) |
| Valuation Allowance | | | — | | | | 2,537,691 | | | | 2,537,691 | |
| Total tax expense/(benefit) | | $ | 63,302 | | | $ | (68,879 | ) | | $ | (5,577 | ) |
Components of the Fund’s deferred tax assets and liabilities are as follows:
| | | As of
October 31, 2015 |
| Deferred tax assets: | | | | |
| Net unrealized loss on investment securities | | $ | 2,592,982 | |
| Other | | | 8,011 | |
| Valuation Allowance | | | (2,537,691 | ) |
| Net Deferred tax asset | | $ | 63,302 | |
The Fund reviews the recoverability of its deferred tax assets based upon the weight of available evidence. When assessing the recoverability of its deferred tax assets, significant weight was given to the effects of potential future realized and unrealized gains on investments and the period over which these deferred tax assets can be realized. Currently, any capital losses that may be generated by the Fund in the future are eligible to be carried back up to three years and can be carried forward for five years to offset capital gains recognized by the Fund in those years. Net operating losses that may be generated by the Fund in the future are eligible to be carried back up to two years and can be carried forward for 20 years to offset income generated by the Fund in those years.
Based upon the Fund’s assessment, it has determined that it is “more-likely-than-not” that a portion of its deferred tax assets will be realized through future taxable income of the appropriate character. Accordingly, a valuation allowance has been established for a portion of the Fund’s deferred tax assets. The Fund will continue to assess the need for a valuation allowance in the future. Significant increases in the fair value of its portfolio of investments may change the Fund’s assessment of the recoverability of these assets and may result in the removal of the valuation allowance against all or a portion of the Fund’s gross deferred tax assets.
Total income tax benefit (current and deferred) differs from the amount computed by applying the federal statutory income tax rate of 34% to net investment and realized and unrealized gain/(losses) on investment before taxes as follows for the Fund:
| | | Amount | | Rate |
| Income tax expense/(benefit) at statutory rate | | $ | (2,396,725 | ) | | | 34.00 | % |
| State income taxes (net of federal benefit) | | | (126,887 | ) | | | 1.80 | % |
| Permanent differences, net | | | (17,002 | ) | | | 0.24 | % |
| Other | | | (2,654 | ) | | | 0.04 | % |
| Effect of valuation allowance | | | 2,537,691 | | | | (36.00 | )% |
| Net income tax expense/(benefit) | | $ | (5,577 | ) | | | 0.08 | % |
The Fund recognizes interest accrued related to unrecognized tax benefits and penalties as income tax expense. For the period from inception to October 31, 2015, the Funds had no accrued penalties or interest.
The Fund recognizes the tax benefits of uncertain tax positions only where the position is “more-likely-than-not” to be sustained assuming examination by tax authorities. Management has analyzed the Funds tax positions, and has concluded that no liability for unrecognized tax benefits should be recorded related to uncertain tax positions taken on U.S. tax returns and state tax returns filed since inception of the Fund. No U.S. federal or state income tax returns are currently under examination. The Fund’s initial tax year, October 31, 2014, remains subject to examination by tax authorities in the United States. Due to the nature of the Fund’s investments, the Fund may be required to file income tax returns in several states. The Fund is not aware of any tax positions for which it is reasonably possible that the total amounts of unrecognized tax benefits will change materially in the next 12 months.
The adjusted cost basis of investment and gross unrealized appreciation and depreciation of investments, excluding written options, for federal income tax purposes were as follows:
| Fund | | Federal Tax Cost
Of Investments | | Gross
Unrealized
Appreciation | | Gross
Unrealized
Depreciation | | Net Unrealized
Appreciation
(Depreciation) |
| InfraCap MLP ETF | | $34,051,800 | | $16,969 | | $(7,314,538) | | $(7,297,569) |
|
| Notes to Financial Statements (continued) |
| October 31, 2015 |
6. INVESTMENT TRANSACTIONS
Purchases and sales of investments (excluding short-term investments) for the year ended October 31, 2015 were as follows:
| Fund | | Purchases | | Sales | | Purchases
In-Kind | | Sales
In-Kind |
| InfraCap MLP ETF | | $9,793,008 | | $10,033,674 | | $29,142,240 | | $ — |
7. DERIVATIVE FINANCIAL INSTRUMENTS
Options
Transactions in options written during the year ended October 31, 2015, which serve as an indicator of the volume of activity, were as follows:
| | | Contracts | | Premiums
Received (Paid) |
| Options outstanding, at beginning of year | | | 30 | | | $ | 2,313 | |
| Options written | | | 11,164 | | | | 624,067 | |
| Options closed | | | (1,220 | ) | | | (50,551 | ) |
| Options exercised | | | (995 | ) | | | (77,552 | ) |
| Options expired | | | (5,278 | ) | | | (287,377 | ) |
| Options outstanding, at end of year | | | 3,701 | | | $ | 210,900 | |
The Fund may write covered call and put options on portfolio securities and other financial instruments. Premiums received are recorded as liabilities. The liabilities are subsequently adjusted to reflect the current value of the options written. Premiums received from writing options which expire are treated as realized gains. Premiums received from writing options which are exercised or are closed are added to or offset against the proceeds or amount paid on the transactions to determine the net realized gain or loss. By writing a covered call option, the Fund, in exchange for the premium, foregoes the opportunity for capital appreciation above the exercise price should the market of the price of the underlying security increase. By writing a put option, the Fund, in exchange for the premium, accepts the risk of having to purchase a security at an exercise price that is above the current price. Changes in value of written options are reported as change in unrealized gain (loss) on written options in the Statement of Operations. When the written option expires, is terminated or is sold, the Fund will record a gain or loss, which is reported as realized gain (loss) on written options in the Statement of Operations.
The Fund may purchase call and put options on the portfolio securities or other financial instruments. The Fund may purchase call options to protect against an increase in the price of the security or financial instrument it anticipates purchasing. The Fund may purchase put options on securities which it holds or other financial instruments to protect against a decline in the value of the security or financial instrument or to close out covered written positions. Changes in value of purchased options are reported as part of change in unrealized gain (loss) on investments in the Statement of Operations. When the purchased option expires, is terminated or is sold, the Fund will record a gain or loss, which is reported as part of realized gain (loss) on investments in the Statement of Operations. Risks may arise from an imperfect correlation between the change in market value of the securities held by the Fund and the prices of options relating to the securities purchased or sold by the Fund and from the possible lack of liquid secondary market for an option. The maximum exposure to loss for any purchased option is limited to the premium initially paid for the option. Written uncovered call options subject the Fund to unlimited risk of loss. Written covered call options limit the upside potential of a security above the strike price. Put options written subject the Fund to risk of loss if the value of the security declines below the exercise price minus the put premium.
Transactions in derivative instruments reflected on the Statement of Assets and Liabilities at October 31, 2015, are:
| | | Equity Risk |
| Assets | | | | |
| Investments, at value* | | $ | 5,875 | |
| Liabilities | | | | |
| Written options, at value | | | 141,358 | |
*Purchased option contracts are included in Investments, at value on the Statement of Assets and Liabilities.
Transactions in derivative instruments reflected on the Statement of Operations during the year were as follows:
| Net Realized Gain (Loss) on: | | Equity Risk |
| Investments* | | $ | 579,872 | |
| Written options | | | 145,320 | |
*Purchased option contracts are included in Net Realized Gain (Loss) on Investments on the Statement of Operations.
|
| Notes to Financial Statements (continued) |
| October 31, 2015 |
| Change in Net Unrealized Appreciation (Depreciation) on: | | Equity Risk |
| Investments* | | $ | (14,939 | ) |
| Written options | | | 69,879 | |
*Purchased option contracts are included in Change in Net Unrealized Appreciation (Depreciation) on Investments in the Statement of Operations.
For the year ended October 31, 2015, the monthly average value of the purchased options and written options contracts held by the Fund were $3,515 and $(88,477) respectively.
8. INVESTMENT RISKS
As with any investment, an investment in the Fund could result in a loss or the performance of the Fund could be inferior to that of other investments. An investor should consider the Fund’s investment objectives, risks, and charges and expenses carefully before investing. The Fund’s prospectus and statement of additional information contain this and other important information.
MLP Risk
Investments in securities of MLPs involve risks that differ from investments in common stock including risks related to limited control and limited rights to vote on matters affecting the MLP, risks related to potential conflicts of interest between the MLP and the MLP’s general partner and cash flow risks. MLP common units and other equity securities can be affected by macro-economic and other factors affecting the stock market in general, expectations of interest rates, investor sentiment towards MLPs or the energy sector, changes in a particular issuer’s financial condition or unfavorable or unanticipated poor performance of a particular issuer (in the case of MLPs, generally measured in terms of distributable cash flow). Prices of common units of individual MLPs and other equity securities also can be affected by fundamentals unique to the partnership or company, including earnings power and coverage ratios.
9. SUBSEQUENT EVENTS
The Fund is required to recognize in the financial statements the effects of all subsequent events that provide additional evidence about conditions that existed as of the date of the Statements of Assets and Liabilities. For non-recognized subsequent events that must be disclosed to keep the financial statements from being misleading, the Fund is required to disclose the nature of the event as well as an estimate of its financial effect, or a statement that such an estimate cannot be made. Management has evaluated subsequent events through the issuance of these financial statements and has determined that there are no other material events that would require disclosure.
|
| Report of Independent Registered Public Accounting Firm |

To the Board of Trustees of ETFis Series Trust I and the Shareholders of BioShares Biotechnology Clinical Trials Fund, BioShares Biotechnology Products Fund, Tuttle Tactical Management Multi-Strategy Income ETF, Tuttle Tactical Management U.S. Core ETF and Virtus NewFleet Multi-Sector Unconstrained Bond ETF
We have audited the accompanying statements of assets and liabilities of BioShares Biotechnology Clinical Trials Fund, BioShares Biotechnology Products Fund, Tuttle Tactical Management Multi-Strategy Income ETF, Tuttle Tactical Management U.S. Core ETF and Virtus NewFleet Multi-Sector Unconstrained Bond ETF (the “Funds”), each a series of shares of beneficial interest in ETFis Series Trust I, including the schedules of investments, as of October 31, 2015, and the related statements of operations, changes in net assets and the financial highlights for the periods then ended. These financial statements and financial highlights are the responsibility of the Funds’ management. Our responsibility is to express an opinion on these financial statements and financial highlights based on our audits.
We conducted our audits in accordance with the standards of the Public Company Accounting Oversight Board (United States). Those standards require that we plan and perform the audits to obtain reasonable assurance about whether the financial statements and financial highlights are free of material misstatement. An audit includes examining, on a test basis, evidence supporting the amounts and disclosures in the financial statements. Our procedures included confirmation of securities owned as of October 31, 2015 by correspondence with the custodian, brokers or by other appropriate auditing procedures where replies from brokers were not received, and other appropriate parties. An audit also includes assessing the accounting principles used and significant estimates made by management, as well as evaluating the overall financial statement presentation. We believe that our audits provide a reasonable basis for our opinion.
In our opinion, the financial statements and financial highlights referred to above present fairly, in all material respects, the financial position of BioShares Biotechnology Clinical Trials Fund, BioShares Biotechnology Products Fund, Tuttle Tactical Management Multi-Strategy Income ETF, Tuttle Tactical Management U.S. Core ETF and Virtus NewFleet Multi-Sector Unconstrained Bond ETF, as of October 31, 2015, and the results of their operations, changes in their net assets and their financial highlights for the periods then ended, in conformity with accounting principles generally accepted in the United States of America.

BBD, LLP
Philadelphia, Pennsylvania
December 29, 2015
|
| Report of Independent Registered Public Accounting Firm |

To the Board of Trustees of ETFis Series Trust I and the Shareholders of InfraCap MLP ETF
We have audited the accompanying statement of assets and liabilities of InfraCap MLP ETF, (the “Fund”), a series of shares of beneficial interest in ETFis Series Trust I, including the schedule of investments, as of October 31, 2015, and the related statements of operations and cash flows for the year then ended, and the statements changes in net assets and the financial highlights for the year then ended and for the period October 1, 2014 (commencement of operations) through October 31, 2014. These financial statements and financial highlights are the responsibility of the Fund’s management. Our responsibility is to express an opinion on these financial statements and financial highlights based on our audits.
We conducted our audits in accordance with the standards of the Public Company Accounting Oversight Board (United States). Those standards require that we plan and perform the audits to obtain reasonable assurance about whether the financial statements and financial highlights are free of material misstatement. An audit includes examining, on a test basis, evidence supporting the amounts and disclosures in the financial statements. Our procedures included confirmation of securities owned as of October 31, 2015 by correspondence with the custodian and broker. An audit also includes assessing the accounting principles used and significant estimates made by management, as well as evaluating the overall financial statement presentation. We believe that our audits provide a reasonable basis for our opinion.
In our opinion, the financial statements and financial highlights referred to above present fairly, in all material respects, the financial position of InfraCap MLP ETF, as of October 31, 2015, and the results of its operations and cash flows for the year then ended and the changes in its net assets and its financial highlights for the year then ended and for the period October 1, 2014 through October 31, 2014, in conformity with accounting principles generally accepted in the United States of America.

BBD, LLP
Philadelphia, Pennsylvania
December 29, 2015
|
| Approval of Advisory Agreements & Board Considerations (unaudited) |
February 19, 2015 Approvals with Respect to Virtus Newfleet Multi-Sector Unconstrained Bond ETF
On February 19, 2015 at an in-person meeting at which all of the Independent Trustees were present, the Board of Trustees, including the Independent Trustees voting separately, reviewed and unanimously approved an investment advisory agreement between Etfis Capital LLC (the “Adviser”) and the Trust (the “Advisory Agreement”) and an investment sub-advisory agreement among Newfleet Asset Management, LLC (“Newfleet”), the Adviser and the Trust (the “Newfleet Sub-Advisory Agreement”), each with respect to Virtus Newfleet Multi-Sector Unconstrained Bond ETF (the “Newfleet Fund”).
The Board received and reviewed a substantial amount of information provided by the Adviser and Newfleet in response to requests of the Board and counsel, including, without limitation, a memorandum from the Adviser that included a description of the Adviser’s business, a copy of the Adviser’s Form ADV and certain other information about the Adviser to be considered in connection with the Trustees’ review process (the “Adviser Memorandum”) and a memorandum from Newfleet that included a description of Newfleet’s business, a copy of Newfleet’s Form ADV and certain other information about Newfleet to be considered in connection with the Trustees’ review process (the “Newfleet Memorandum”).
In deciding on whether to approve the Advisory Agreement on behalf of the Newfleet Fund, the Board considered numerous factors, including:
The nature, extent, and quality of the services to be provided by the Adviser. In this regard, the Board considered the responsibilities the Adviser would have under the Advisory Agreement. Accordingly, the Board considered the services that would be provided by the Adviser to the Newfleet Fund including, without limitation, the management, oversight and administrative services that the Adviser and its employees would provide to the Newfleet Fund, the services already provided by the Adviser related to organizing the Newfleet Fund, the Adviser’s coordination of services for the Newfleet Fund by the Fund’s service providers, its compliance procedures and practices, and its efforts to promote the Newfleet Fund. The Board noted that many of the Trust’s executive officers are employees of the Adviser, and serve the Trust without additional compensation from the Newfleet Fund. The Board also noted the expected enhancements following the Transaction to the distribution and marketing efforts of the Adviser with respect to the Newfleet Fund. After reviewing the foregoing information and further information in the Adviser Memorandum (including descriptions of the Adviser’s investment advisory services and its related non-advisory business), and discussing the Adviser’s proposed services to the Newfleet Fund with the Adviser, the Board concluded that the quality, extent, and nature of the services proposed to be provided by the Adviser are satisfactory and adequate for the Newfleet Fund.
The investment management capabilities and experience of the Adviser. In this regard, the Board evaluated the management experience of the Adviser, in the light of the services they will be providing. In particular, the Board received information from the Adviser regarding, among other things, the Adviser’s experience in organizing, managing and overseeing exchange traded funds and coordinating their operation and administration. After consideration of these factors, the Board determined that the Adviser would be an appropriate manager for the Newfleet Fund.
The costs of the services to be provided and profits to be realized by the Adviser from its relationship with the Newfleet Fund. In this regard, the Board examined and evaluated the arrangements between the Adviser and the Newfleet Fund under the proposed Advisory Agreement, including the fact that the Newfleet Fund would utilize an expense limitation agreement to limit the Fund’s total expenses (excluding interest, taxes, brokerage fees and commissions, other expenditures that are capitalized in accordance with generally accepted accounting principles, acquired fund fees and expenses, extraordinary expenses not incurred in the ordinary course of the Newfleet Fund’s business, and amounts, if any, payable pursuant to a plan adopted in accordance with Rule 12b-1 under the 1940 Act) to 0.80%. The Board also considered the proposed management fees for the Newfleet Fund in the context of fees paid to other investment advisers to exchange traded funds. The Board also considered the expense ratios of other funds compared to the Newfleet Fund’s proposed capped fee structure, noting the Newfleet Fund’s expense ratio relative to the expense ratio of some other funds that the Board determined to be comparable to the Newfleet Fund based on the type of fund, the style of investment management and/or the nature of the markets invested in, among other factors. The Board also considered that the proposed fees were not as low as that of some other funds, but noted that funds with lower expense ratios generally have large amounts of assets.
The Board also considered potential benefits for the Adviser in managing the Newfleet Fund, including promotion of the Adviser’s name and the interests of the Adviser in providing administrative services to the Newfleet Fund. Following these comparisons and upon further consideration and discussion of the foregoing, the Board concluded that the fees to be paid to the Adviser by the Newfleet Fund are appropriate and within the range of what would have been negotiated at arm’s length.
The extent to which economies of scale would be realized as the Newfleet Fund grows and whether management fee levels reflect these economies of scale for the benefit of the Newfleet Fund’s investors. In this regard, the Board considered that the Newfleet Fund’s fee arrangements with the Adviser would involve an expense limitation agreement with the Newfleet Fund’s adviser and sub-adviser. The Board considered that the Newfleet Fund would likely experience benefits from the proposed capped fee structure. Following further discussion of the Newfleet Fund’s projected asset levels, expectations for growth and levels of proposed fees, the Board determined that the Newfleet Fund’s fee arrangements with the Adviser would provide benefits, particularly with the proposed capped fee structure, and that, at the Newfleet Fund’s projected asset levels for the next two years, the Fund’s proposed arrangements with the Adviser would be appropriate.
|
| Approval of Advisory Agreements & Board Considerations (unaudited) (continued) |
The Board did not identify any single factor as being of paramount importance, and different Trustees may have given different weight to different factors. The Board reviewed with Trustee counsel the legal standards applicable to its consideration of the Advisory Agreement. Based on its review, including consideration of each of the factors referenced above, the Board determined, in the exercise of its reasonable business judgment, that the advisory arrangement, as outlined in the Advisory Agreement, was fair and reasonable in light of the services performed or to be performed, expenses incurred or to be incurred and such other matters as the Board considered relevant.
After full consideration of the above factors as well as other factors, the Board unanimously approved the Advisory Agreement on behalf of the Newfleet Fund, and, in order to avoid the premature termination of the Advisory Agreement, the Board also approved the continuance of the Advisory Agreement following the closing of the proposed transaction (the “Transaction”) between ETF Issuer Solutions LLC (the “Adviser’s Parent”), which is the sole member and owner of the Adviser, and Virtus Partners, Inc., a Delaware corporation (“VPI”), whereby VPI would acquire a majority ownership interest in a new holding company (“NewCo”), which will wholly own the Adviser’s Parent and the Adviser.
In deciding on whether to approve the Newfleet Sub-Advisory Agreement on behalf of the Newfleet Fund, the Board considered numerous factors, including:
The nature, extent, and quality of the services to be provided by Newfleet. In this regard, the Board considered the responsibilities Newfleet would have under the Newfleet Sub-Advisory Agreement. Accordingly, the Board considered the services that would be provided by Newfleet including, without limitation, its investment advisory services, its compliance procedures and practices, and its efforts to promote the Newfleet Fund. After reviewing the foregoing information and further information in the materials information in the Newfleet Sub-Adviser Memorandum (including descriptions of Newfleet’s business and Newfleet’s Form ADV), the Board concluded that the quality, extent, and nature of the services provided by Newfleet would be satisfactory and adequate for the Newfleet Fund.
The investment management capabilities and experience of Newfleet. In this regard, the Board evaluated the investment management experience of Newfleet. In particular, the Board received information from Newfleet regarding the experience of its portfolio managers in implementing the proposed strategy for the Newfleet Fund and managing ETFs and other registered investment companies. The Board discussed with Newfleet the investment objective and strategies for the Newfleet Fund and Newfleet’s plans for implementing the strategies. The Board also considered the ability of Newfleet to manage the Newfleet Fund. After consideration of these factors, the Board determined that Newfleet would be an appropriate manager for the Newfleet Fund.
The costs of the services to be provided and profits to be realized by Newfleet from its relationship with the Newfleet Fund. In this regard, the Board examined and evaluated the proposed arrangements between Newfleet and the Newfleet Fund under the proposed Newfleet Sub-Advisory Agreement, including the fact that the Newfleet Fund would utilize an expense limitation agreement with the Adviser to cap the Fund’s total expenses (excluding interest, taxes, brokerage fees and commissions, other expenditures that are capitalized in accordance with generally accepted accounting principles, acquired fund fees and expenses, extraordinary expenses not incurred in the ordinary course of the Newfleet Fund’s business, and amounts, if any, payable pursuant to a plan adopted in accordance with Rule 12b-1 under the 1940 Act) to 0.80%, and that Newfleet would agree, pursuant to the Newfleet Sub-Advisory Agreement, to fund 50% of the Adviser’s waivers and reimbursements under the expense limitation agreement. The Board noted that, under such an arrangement, Newfleet would likely supplement a portion of the cost of operating the Newfleet Fund for some period of time. The Board considered Newfleet’s staffing, personnel, and methods of operating; Newfleet’s compliance policies and procedures; the financial condition of Newfleet and the level of commitment to the Newfleet Fund by Newfleet; the projected asset levels of the Newfleet Fund; Newfleet’s payment of startup costs for the Newfleet Fund and the overall projected expenses of the Newfleet Fund.
The Board also considered potential benefits to Newfleet in managing the Newfleet Fund, including promotion of Newfleet’s name. The Board compared the fees and expenses of the Newfleet Fund (including the management fee) to other funds considered by Newfleet to have a similar investment objective and strategies to the Newfleet Fund. Following these comparisons and upon further consideration and discussion of the foregoing, the Board concluded that the fees to be paid to Newfleet by the Newfleet Fund would be appropriate and representative of an arm’s length negotiation.
The extent to which economies of scale would be realized as the Newfleet Fund grows and whether management fee levels reflect these economies of scale for the benefit of the Newfleet Fund’s investors. In this regard, the Board considered that the Newfleet Fund’s fee arrangements with Newfleet involve a capped fee arrangement. The Board considered that the Newfleet Fund would likely experience benefits from the capped fee and would continue to do so until the Newfleet Fund’s assets grow to a level where Newfleet begins to receive the full fee. Following further discussion of the Newfleet Fund’s projected asset levels, the Board concluded that it is premature to evaluate the potential economies of scale of the Newfleet Fund.
The Board did not identify any single factor as being of paramount importance, and different Trustees may have given different weight to different factors. The Board reviewed with Trustee counsel the legal standards applicable to its consideration of the Newfleet Sub-Advisory Agreement. Based on its review, including consideration of each of the factors referenced above, the Board determined, in the exercise of its reasonable business judgment, that the advisory arrangement, as outlined in the Newfleet Sub-Advisory Agreement, was fair and reasonable in light of the services performed or to be performed, expenses incurred or to be incurred and such other matters as the Board considered relevant.
|
| Approval of Advisory Agreements & Board Considerations (unaudited) (continued) |
After full consideration of the above factors as well as other factors, the Board unanimously approved the Newfleet Sub-Advisory Agreement on behalf of the Newfleet Fund, and, in order to avoid the premature termination of the Newfleet Sub-Advisory Agreement, the Board also approved the continuance of the Advisory Agreement following the closing of the Transaction.
February 19, 2015 Approvals with Respect to Tuttle Tactical Management Multi-Strategy Income ETF
On February 19, 2015 at an in-person meeting at which all of the Independent Trustees were present, the Board of Trustees, including the Independent Trustees voting separately, reviewed and unanimously approved an investment advisory agreement between Etfis Capital LLC (the “Adviser”) and the Trust (the “Advisory Agreement”) and an investment sub-advisory agreement among Tuttle Tactical Management LLC (“TTM”), the Adviser and the Trust (the “Tuttle Sub-Advisory Agreement”), each with respect to Tuttle Tactical Management Multi-Strategy Income ETF (the “Tuttle Fund”).
The Board received and reviewed a substantial amount of information provided by the Adviser and TTM in response to requests of the Board and counsel, including, without limitation, a memorandum from the Adviser that included a description of the Adviser’s business, a copy of the Adviser’s Form ADV and certain other information about the Adviser to be considered in connection with the Trustees’ review process (the “Adviser Memorandum”) and a memorandum from TTM that included a description of TTM’s business, a copy of TTM’s Form ADV and certain other information about TTM to be considered in connection with the Trustees’ review process (the “Tuttle Memorandum”).
In deciding on whether to approve the Advisory Agreement on behalf of the Tuttle Fund, the Board considered numerous factors, including:
The nature, extent, and quality of the services to be provided by the Adviser. In this regard, the Board considered the responsibilities the Adviser would have under the Advisory Agreement. Accordingly, the Board considered the services that would be provided by the Adviser to the Tuttle Fund including, without limitation, the management, oversight and administrative services that the Adviser and its employees would provide to the Tuttle Fund, the services already provided by the Adviser related to organizing the Tuttle Fund, the Adviser’s coordination of services for the Tuttle Fund by the Fund’s service providers, its compliance procedures and practices, and its efforts to promote the Tuttle Fund. The Board noted that many of the Trust’s executive officers are employees of the Adviser, and serve the Trust without additional compensation from the Tuttle Fund. The Board also noted the expected enhancements following the Transaction to the distribution and marketing efforts of the Adviser with respect to the Tuttle Fund. After reviewing the foregoing information and further information in the Adviser Memorandum (including descriptions of the Adviser’s investment advisory services and its related non-advisory business), and discussing the Adviser’s proposed services to the Tuttle Fund with the Adviser, the Board concluded that the quality, extent, and nature of the services proposed to be provided by the Adviser are satisfactory and adequate for the Tuttle Fund.
The investment management capabilities and experience of the Adviser. In this regard, the Board evaluated the management experience of the Adviser, in the light of the services they will be providing. In particular, the Board received information from the Adviser regarding, among other things, the Adviser’s experience in organizing, managing and overseeing exchange traded funds and coordinating their operation and administration. After consideration of these factors, the Board determined that the Adviser would be an appropriate manager for the Tuttle Fund.
The costs of the services to be provided and profits to be realized by the Adviser from its relationship with the Tuttle Fund. In this regard, the Board examined and evaluated the arrangements between the Adviser and the Tuttle Fund under the proposed Advisory Agreement. The Board also considered the proposed management fees for the Tuttle Fund in the context of fees paid to other investment advisers to exchange traded funds, particularly where the funds have sub-advisers. The Board also considered the expense ratios of other funds compared to the Tuttle Fund’s proposed unified fee structure, noting the Tuttle Fund’s expense ratio relative to the expense ratio of some other funds that the Board determined to be comparable to the Tuttle Fund based on the type of fund, the style of investment management and/or the nature of the markets invested in, among other factors. The Board also considered that the proposed fees were not as low as that of some other funds, but noted that funds with lower expense ratios generally have large amounts of assets.
The Board also considered potential benefits for the Adviser in managing the Tuttle Fund, including promotion of the Adviser’s name and the interests of the Adviser in providing administrative services to the Tuttle Fund. Following these comparisons and upon further consideration and discussion of the foregoing, the Board concluded that the fees to be paid to the Adviser by the Tuttle Fund are appropriate and within the range of what would have been negotiated at arm’s length.
The extent to which economies of scale would be realized as the Tuttle Fund grows and whether management fee levels reflect these economies of scale for the benefit of the Tuttle Fund’s investors. In this regard, the Board considered that the Tuttle Fund’s fee arrangements with the Adviser involve a unified fee arrangement with the Tuttle Fund’s sub-adviser. The Board considered that the Tuttle Fund would likely experience benefits from their proposed unified fee structure. Following further discussion of the Tuttle Fund’s projected asset levels, expectations for growth and levels of proposed fees, the Board determined that the Tuttle Fund’s fee arrangements with the Adviser would provide benefits, particularly with the proposed underlying unified fee structure, and that, at the Tuttle Fund’s projected asset levels for the next two years, the Fund’s proposed arrangements with the Adviser would be appropriate.
|
| Approval of Advisory Agreements & Board Considerations (unaudited) (continued) |
The Board did not identify any single factor as being of paramount importance, and different Trustees may have given different weight to different factors. The Board reviewed with Trustee counsel the legal standards applicable to its consideration of the Advisory Agreement. Based on its review, including consideration of each of the factors referenced above, the Board determined, in the exercise of its reasonable business judgment, that the advisory arrangement, as outlined in the Advisory Agreement, was fair and reasonable in light of the services performed or to be performed, expenses incurred or to be incurred and such other matters as the Board considered relevant.
After full consideration of the above factors as well as other factors, the Board unanimously approved the Advisory Agreement on behalf of the Tuttle Fund, and, in order to avoid the premature termination of the Advisory Agreement, the Board also approved the continuance of the Advisory Agreement following the closing of the proposed transaction (the “Transaction”) between ETF Issuer Solutions LLC (the “Adviser’s Parent”), which is the sole member and owner of the Adviser, and Virtus Partners, Inc., a Delaware corporation (“VPI”), whereby VPI would acquire a majority ownership interest in a new holding company (“NewCo”), which will wholly own the Adviser’s Parent and the Adviser.
In deciding on whether to approve the Tuttle Sub-Advisory Agreement on behalf of the Tuttle Fund, the Board considered numerous factors, including:
The nature, extent, and quality of the services to be provided by TTM. In this regard, the Board considered the responsibilities TTM would have under the Tuttle Sub-Advisory Agreement. Accordingly, the Board considered the services that would be provided by TTM including, without limitation, its investment advisory services, its compliance procedures and practices, and its efforts to promote the Tuttle Fund. After reviewing the foregoing information and further information in the materials information in the Tuttle Memorandum (including descriptions of TTM’s business and TTM’s Form ADV), the Board concluded that the quality, extent, and nature of the services provided by TTM would be satisfactory and adequate for the Tuttle Fund.
The investment management capabilities and experience of TTM. In this regard, the Board evaluated the investment management experience of TTM. In particular, the Board received information from TTM regarding the experience of its portfolio managers researching and investing in securities. The Board discussed with TTM the investment objective and strategies for the Tuttle Fund and TTM’s plans for implementing the strategies. The Board also considered the ability of TTM to manage the Tuttle Fund. After consideration of these factors, the Board determined that TTM would be an appropriate manager for the Tuttle Fund.
The costs of the services to be provided and profits to be realized by TTM from its relationship with the Tuttle Fund. In this regard, the Board examined and evaluated the proposed arrangements between TTM and the Tuttle Fund under the proposed Tuttle Sub-Advisory Agreement, including the fact that the Tuttle Fund would utilize a “unified fee structure” whereby a single fee would be paid to TTM for the provision of investment management and all other services to the Tuttle Fund. The Board noted that, under such an arrangement, TTM would likely supplement the cost of operating the Tuttle Fund for some period of time, until assets are sufficient to generate enough fees for TTM to pay for all of the Tuttle Fund’s service providers and expenses. The Board considered TTM’s staffing, personnel, and methods of operating; TTM’s compliance policies and procedures; the financial condition of TTM and the level of commitment to the Tuttle Fund by TTM; the projected asset levels of the Tuttle Fund; TTM’s payment of startup costs for the Tuttle Fund and the overall projected expenses of the Tuttle Fund. The Board reviewed the Tuttle Fund’s proposed unified fee arrangement with TTM and noted the benefit that would result to the Tuttle Fund from TTM’s likely waiver of a portion of its management fees for a period of time based on the projected asset levels of the Tuttle Fund.
The Board also considered potential benefits to TTM in managing the Tuttle Fund, including promotion of TTM’s name. The Board compared the fees and expenses of the Tuttle Fund (including the management fee) to other funds considered by TTM to have a similar investment objective and strategies to the Tuttle Fund. Following these comparisons and upon further consideration and discussion of the foregoing, the Board concluded that the fees to be paid to TTM by the Tuttle Fund are appropriate and within the range of what would have been negotiated at arm’s length.
The extent to which economies of scale would be realized as the Tuttle Fund grows and whether management fee levels reflect these economies of scale for the benefit of the Tuttle Fund’s investors. In this regard, the Board considered that the Tuttle Fund’s fee arrangements with TTM involve a unified fee arrangement. The Board considered that the Tuttle Fund would likely experience benefits from the unified fee and would continue to do so until the Tuttle Fund’s assets grow to a level where TTM begins to receive the full fee. Following further discussion of the Tuttle Fund’s projected asset levels, expectations for growth and level of fees, the Board determined that the Tuttle Fund’s fee arrangements with TTM would provide benefits through the proposed unified fee and that, at the Tuttle Fund’s projected asset levels for the next two years, the Fund’s arrangements with the Adviser are appropriate.
The Board did not identify any single factor as being of paramount importance, and different Trustees may have given different weight to different factors. The Board reviewed with Trustee counsel the legal standards applicable to its consideration of the Tuttle Sub-Advisory Agreement. Based on its review, including consideration of each of the factors referenced above, the Board determined, in the exercise of its reasonable business judgment, that the advisory arrangement, as outlined in the Tuttle Sub-Advisory Agreement, was fair and reasonable in light of the services performed or to be performed, expenses incurred or to be incurred and such other matters as the Board considered relevant.
After full consideration of the above factors as well as other factors, the Board unanimously approved the Tuttle Sub-Advisory Agreement on behalf of the Tuttle Fund, and, in order to avoid the premature termination of the Tuttle Sub-Advisory Agreement, the Board also approved the continuance of the Tuttle Sub-Advisory Agreement following the closing of the Transaction.
|
| Supplemental Information (unaudited) |
TRUSTEES AND OFFICERS OF THE TRUST
The Trustees of the Trust, their addresses, positions with the Trust, ages, term of office and length of time served, principal occupations during the past five years, the number of portfolios in the Fund Complex overseen by each Trustee and other directorships, if any, held by the Trustees are set forth below. The SAI includes additional information about the Fund’s Trustees and is available, without charge, upon request, by calling the Adviser (collect) at (212) 593-4383.
Name and
Year of Birth | Position(s) held
with Trust | Length of
Time Served | Principal Occupation(s) During Past Five Years | Number of
Portfolios in
Fund Complex*
Overseen by
Trustee | Other
Directorships
Held by Trustee
During Past
Five Years |
| INDEPENDENT TRUSTEES |
James A. Simpson
1970 | Trustee | Since Inception | President, ETP Resources, LLC (2009-Present) (a financial
services consulting company) | Ten | Trustee, Virtus
ETF Trust II,
Nov. 2015-
present |
Robert S. Tull
1952 | Trustee | Since Inception | Independent Consultant (2013-present); Chief Operating
Officer, Factor Advisors, LLC (2010-2013); Chief Operating
Officer, GlobalShares (2009-2010) | Ten | Trustee, Virtus
ETF Trust II,
Nov. 2015-
present |
Stephen O’Grady
1946 | Trustee | Since September
2014 | Lead Market Maker, GFI Group (2011-2012); Partner, Kellogg
Capital Markets (2004-2011) | Ten | Trustee,
Greenhaven
Continuous
Commodity ETF
(GCC), January
2013-present;
Trustee, Acacia
Group LLC,
June 2014-
present; Trustee,
Virtus ETF Trust
II, Nov. 2015-
present |
| INTERESTED TRUSTEE** |
William J. Smalley
1983 | Trustee,
President, Chief
Executive Officer
and Secretary | Since Inception | President, Virtus ETF Solutions LLC† (2012-Present);
Managing Principal, ETF Distributors LLC (2012-Present);
Vice President, Factor Advisors, LLC (2010-2012); Vice
President, MacroMarkets, LLC (2006-2010) | Ten | None |
| OTHER EXECUTIVE OFFICERS |
Brinton W. Frith
1969 | Treasurer and
Chief Financial
Officer | Since Inception | Managing Director, Virtus ETF Solutions LLC† (2013-
Present); President, Javelin Investment Management, LLC
(2008-2013) | N/A | N/A |
Nancy J. Engberg
1956 | Chief
Compliance
Officer | Since Aug. 2015 | Vice President (since 2008) and Chief Compliance Officer
(2008 to 2011), Virtus Investment Partners, Inc. and/or certain
of its subsidiaries; various officer positions (since 2003) with
Virtus affiliates; Vice President and Chief Compliance Officer
(since 2011), Virtus Mutual Fund Complex; Vice President
(since 2010), Chief Compliance Officer (since 2011), Virtus
Variable Insurance Trust; Vice President and Chief Compliance
Officer (since 2011), Virtus Closed-End Funds; Vice President
and Chief Compliance Officer (since 2012), The Zweig Closed-
End Funds; Vice President and Chief Compliance Officer (since
2013), Virtus Alternative Solutions Trust; Chief Compliance
Officer (since Aug. 2015), ETFis Series Trust I; and Chief
Compliance Officer (since Nov. 2015), Virtus ETF Trust II. | N/A | N/A |
Matthew B. Brown
1977 | Deputy Chief
Compliance
Officer | Since May 2015 | Deputy Chief Compliance Officer, Virtus ETF Trust II; CEO,
Virtus ETF Solutions LLC† (2012-Present); Managing
Principal, ETF Distributors LLC (2012-Present); Director,
Factor Advisors, LLC (2010-2012); Director of U.S.
Operations, SPA ETFs (2009-2010) | N/A | N/A |
The address for each Trustee and officer is 1540 Broadway, 16th Floor, New York, NY 10036. Each Trustee serves until resignation, death, retirement or removal. Officers are elected yearly by the Trustees. For the fiscal year ended October 31, 2015, the Board of Trustees received an aggregate of $24,907.02.
|
| Supplemental Information (unaudited) (continued) |
| October 31, 2015 |
| * | As of October 31, 2015, the Fund Complex consisted of ten portfolios, InfraCap MLP ETF, InfraCap REIT Preferred ETF, BioShares Biotechnology Products Fund, BioShares Biotechnology Clinical Trials Fund, Tuttle Tactical Management U.S. Core ETF, Tuttle Tactical Management Multi-Strategy Income ETF, Virtus Newfleet Multi-Sector Unconstrained Bond ETF, Reaves Utilities ETF, The Credit Strategist High Yield Opportunities Fund and ActiveAlts Contrarian ETF. |
| ** | Mr. Smalley is an Interested Trustee because he is an employee of the Adviser. |
| † | ETF Issuer Solutions LLC changed its name to Virtus ETF Solutions LLC on 7/29/2015 |
INFORMATION ABOUT PORTFOLIO HOLDINGS
The Funds file their complete schedule of portfolio holdings for their first and third fiscal quarters with the Securities and Exchange Commission (“SEC”) on Form N-Q. The Funds Form N-Q are available without charge, upon request, by calling toll-free at (888) 383-4184. Furthermore, you may obtain the Form N-Q on the SEC’s website at www.sec.gov. The Funds’ portfolio holdings are posted on the Funds’ website at www.etfissuersolutions.com daily.
The Funds’ premium/discount information that is current as of the most recent month-end is available by visiting www.etfissuersolutions.com or by calling (888) 383-4184.
INFORMATION ABOUT PROXY VOTING
A description of the policies and procedures the Funds use to determine how to vote proxies relating to portfolio securities is provided in the Statement of Additional Information (“SAI”). The SAI is available without charge upon request by calling toll-free at (888) 383-4184, by accessing the SEC’s website at www.sec.gov, or by accessing the Funds’ website at www.etfissuersolutions.com.
Information regarding how the Funds voted proxies relating to portfolio securities during the most recent twelve-month period ended June 30th is available by calling toll-free at (888) 383-4184 or by accessing the SEC’s website at www.sec.gov.
c/o ETF Distributors LLC
1540 Broadway, Suite 1610
New York, NY 10036
Item 2. Code of Ethics.
As of the end of the period covered by this report, the registrant has adopted a code of ethics that applies to the registrant’s principal executive officer, principal financial officer, principal accounting officer or controller, or persons performing similar functions, regardless of whether these individuals are employed by the registrant or a third party. Pursuant to Item 12(a)(1), a copy of registrant’s code of ethics has been filed with the Commission. During the period covered by this report, the code of ethics has not been amended, and the registrant has not granted any waivers, including implicit waivers, from the provisions of the code of ethics.
Item 3. Audit Committee Financial Expert.
The registrant's board of trustees has determined that the registrant does not have an audit committee financial expert serving on its audit committee. At this time, the registrant's board of trustees believes that the collective experience provided by the members of the audit committee together offer the registrant adequate oversight for the registrant's level of financial complexity.
Item 4. Principal Accountant Fees and Services.
(a) Audit Fees. The aggregate fees billed for professional services rendered by the principal accountant for the audit of the registrant’s annual financial statements or for services that are normally provided by the accountant in connection with statutory and regulatory filings or engagements were $10,000.00 and $78,000.00, respectively, for the registrant’s fiscal years ended October 31, 2014 and 2015.
(b) Audit-Related Fees. No fees were billed in the registrant’s fiscal years ended October 31, 2014 and 2015 for assurance and related services by the principal accountant that are reasonably related to the performance of the audit of the registrant’s financial statements and are not reported under paragraph (a) of this Item.
(c) Tax Fees. The aggregate fees billed for professional services rendered by the principal accountant for tax compliance, tax advice, and tax planning were $0.00 and $11,000, respectively, for the registrant’s fiscal years ended October 31, 2014 and 2015.
(d) All Other Fees. None.
(e)(1) The audit committee has not adopted pre-approval policies and procedures described in paragraph (c)(7) of Rule 2-01 of Regulation S-X.
(e)(2) None of the services described in paragraph (b) through (d) of this Item were approved by the audit committee pursuant to paragraph (c)(7)(i)(C) of Rule 2-01 of Regulation S-X.
(f) Less than 50% of hours expended on the principal accountant’s engagement to audit the registrant’s financial statements for the most recent fiscal year were attributed to work performed by persons other than the principal accountant’s full-time, permanent employees.
(g) During the fiscal years ended October 31, 2014 and 2015, aggregate non-audit fees of $0.00 and $11,000.00, respectively, were billed by the registrant’s accountant for services rendered to the registrant. No non-audit fees were billed in the either of the registrant’s last two fiscal years by the registrant’s accountant for services rendered to the registrant’s investment adviser (not including any sub-adviser whose role is primarily portfolio management and is subcontracted with or overseen by another investment adviser), and any entity controlling, controlled by, or under common control with the adviser that provides ongoing services to the registrant.
(h) Not applicable.
Item 5. Audit Committee of Listed Registrants.
The registrant has established a separately-designated standing audit committee comprised of all of the independent trustees of the board of trustees of the registrant. The members of the audit committee are Stephen G. O’Grady, James Simpson and Robert S. Tull.
Item 6. Schedule of Investments
| (a) | Included as part of the report to shareholders filed under Item 1 of this Form. |
Item 7. Disclosure of Proxy Voting Policies and Procedures for Closed-End Management Investment Companies.
Not applicable.
Item 8. Portfolio Managers of Closed-End Management Investment Companies.
Not applicable.
Item 9. Purchases of Equity Securities by Closed-End Management Investment Company and Affiliated Purchasers.
Not applicable.
Item 10. Submission of Matters to a Vote of Security Holders.
The registrant does not have procedures in place to consider nominees recommended by shareholders. The registrant’s nominating committee generally will not consider nominees recommended by shareholders.
Item 11. Controls and Procedures.
| (a) | The registrant’s principal executive and principal financial officers, or persons performing similar functions, have concluded that the registrant’s disclosure controls and procedures (as defined in Rule 30a-3(c) under the Investment Company Act of 1940, as amended (the “1940 Act”) (17 CFR 270.30a-3(c))) are effective, as of a date within 90 days of the filing date of the report that includes the disclosure required by this paragraph, based on their evaluation of these controls and procedures required by Rule 30a-3(b) under the 1940 Act (17 CFR 270.30a-3(b)) and Rules 13a-15(b) or 15d-15(b) under the Securities Exchange Act of 1934, as amended (17 CFR 240.13a-15(b) or 240.15d-15(b)). |
| (b) | There were no changes in the registrant’s internal control over financial reporting (as defined in Rule 30a-3(d) under the 1940 Act (17 CFR 270.30a-3(d)) that occurred during the registrant’s second fiscal quarter of the period covered by this report that has materially affected, or is reasonably likely to materially affect, the registrant’s internal control over financial reporting. |
Item 12. Exhibits.
(a)(1) Code of ethics, or any amendment thereto, that is the subject of disclosure required by Item 2 is attached hereto.
(a)(2) Certifications pursuant to Rule 30a-2(a) under the 1940 Act and Section 302 of the Sarbanes-Oxley Act of 2002 are attached hereto.
(a)(3) Not applicable.
(b) Certifications pursuant to Rule 30a-2(b) under the 1940 Act and Section 906 of the Sarbanes-Oxley Act of 2002 are attached hereto.
SIGNATURES
Pursuant to the requirements of the Securities Exchange Act of 1934 and the Investment Company Act of 1940, the registrant has duly caused this report to be signed on its behalf by the undersigned, thereunto duly authorized.
ETFis SERIES TRUST I
| By: | /s/ William J. Smalley |
| William J. Smalley, President |
| (Principal Executive Officer) |
Date: January 6, 2016
Pursuant to the requirements of the Securities Exchange Act of 1934 and the Investment Company Act of 1940, this report has been signed below by the following persons on behalf of the registrant and in the capacities and on the dates indicated.
| By: | /s/ William J. Smalley |
| William J. Smalley, President |
| (Principal Executive Officer) |
Date: January 6, 2016
| By: | /s/ Brinton W. Frith |
| Brinton W. Frith, Treasurer |
| (Principal Financial Officer) |
| | |
Date: January 6, 2016