UNITED STATES SECURITIES AND EXCHANGE COMMISSION Washington, D.C. 20549
FORM N-CSR
CERTIFIED SHAREHOLDER REPORT OF REGISTERED MANAGEMENT INVESTMENT COMPANIES
Investment Company Act file number 811-22819
ETFis Series Trust I (Exact name of registrant as specified in charter)
1540 Broadway, 16th Floor New York, NY 10036 (Address of principal executive offices) (Zip code)
ETFis Series Trust I
c/o Corporation Service Company
2711 Centerville Road, Suite 400
Wilmington, DE 19808 (Name and address of agent for service)
Registrant’s telephone number, including area code: (212) 593-4383
Date of fiscal year end: October 31
Date of reporting period: April 30, 2018
Form N-CSR is to be used by management investment companies to file reports with the Commission not later than 10 days after the transmission to stockholders of any report that is required to be transmitted to stockholders under Rule 30e-1 under the Investment Company Act of 1940 (17 CFR 270.30e-1). The Commission may use the information provided on Form N-CSR in its regulatory, disclosure review, inspection, and policymaking roles.
A registrant is required to disclose the information specified by Form N-CSR, and the Commission will make this information public. A registrant is not required to respond to the collection of information contained in Form N-CSR unless the Form displays a currently valid Office of Management and Budget ("OMB") control number. Please direct comments concerning the accuracy of the information collection burden estimate and any suggestions for reducing the burden to Secretary, Securities and Exchange Commission, 100 F Street, NE, Washington, DC 20549. The OMB has reviewed this collection of information under the clearance requirements of 44 U.S.C. § 3507.
On behalf of Virtus ETF Advisers LLC (the “Adviser”), I am pleased to present the shareholder report for the ETFis Series Trust I (the “Trust”) for the semiannual fiscal period ended April 30, 2018.
The Adviser is part of Virtus Investment Partners, a distinctive partnership of boutique investment managers singularly committed to the long-term success of individual and institutional investors.
The report provides financial statements and portfolio information for the following funds within the Trust:
•
InfraCap REIT Preferred ETF (PFFR)
•
iSectors® Post-MPT Growth ETF (PMPT)
•
Virtus Cumberland Municipal Bond ETF (CUMB)
•
Virtus Glovista Emerging Markets ETF (EMEM)
•
Virtus LifeSci Biotech Clinical Trials ETF (BBC)
•
Virtus LifeSci Biotech Products ETF (BBP)
•
Virtus Newfleet Multi-Sector Bond ETF (NFLT)
•
Virtus WMC Global Factor Opportunities ETF (VGFO)
•
InfraCap MLP ETF (AMZA)
On behalf of the Adviser and our fund Sub-Advisers, thank you for your investment. If you have questions, please contact your financial adviser, or call 1-888-383-0553. For more information about the fund and the other ETFs we offer, we invite you to visit our website, www.virtusetfs.com.
Sincerely,
William Smalley President
ETFis Series Trust I
This material must be accompanied or preceded by the prospectus.
3
Portfolio CompositionApril 30, 2018 (unaudited)
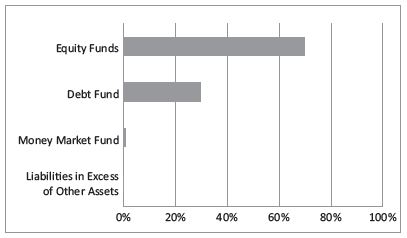
Asset Allocation as of 04/30/2018 (based on net assets)
As a shareholder of a Fund, you incur ongoing costs, including advisory fees and other fund expenses, if any. The following example is intended to help you understand your ongoing costs (in dollars and cents) of investing in a Fund and to compare these costs with the ongoing costs of investing in other funds. The examples are based on an investment of $1,000 invested at the beginning of the period and held throughout the entire period (November 1, 2017 to April 30, 2018), except as noted in footnotes below.
Actual expenses
The first line under each Fund in the table below provides information about actual account values and actual expenses. You may use the information in this line, together with the amount you invested, to estimate the expenses that you paid over the period. Simply divide your account value by $1,000 (for example, an $8,600 account value divided by $1,000 = 8.6), then multiply the result by the number in the first line for your Fund under the heading entitled “Expenses Paid During Period” to estimate the expenses you paid on your account during this period.
Hypothetical example for comparison purposes
The second line under each Fund in the table provides information about hypothetical account values and hypothetical expenses based on each Fund’s actual expense ratio and an assumed rate of return of 5% per year before expenses, which is not each Fund’s actual return. The hypothetical account values and expenses may not be used to estimate the actual ending account balance or expenses you paid for the period. You may use this information to compare the ongoing costs of investing in each Fund and other funds. To do so, compare this 5% hypothetical example with the 5% hypothetical examples that appear in the shareholder reports of the other funds. Please note that the expenses shown in the table are meant to highlight your ongoing costs only and do not reflect any transactional costs, such as brokerage commissions paid on purchases and sales of Fund shares. Therefore, the second line under each Fund in the table is useful in comparing ongoing Fund costs only and will not help you determine the relative total costs of owning different funds. In addition, if these transactional costs were included, your costs would have been higher.
Beginning Account Value 11/1/2017
Ending Account Value 4/30/18
Annualized Expense Ratios(2)
Expenses Paid During the Period
InfraCap REIT Preferred ETF
Actual
$
1000.00
$
957.60
0.45%
$
2.18(3)
Hypothetical(1)
$
1000.00
$
1,022.56
0.45%
$
2.26(4)
iSectors® Post-MPT Growth ETF
Actual
$
1000.00
$
989.30
0.75%
$
3.70(3)
Hypothetical(1)
$
1000.00
$
1,021.08
0.75%
$
3.76(4)
Virtus Cumberland Municipal Bond ETF
Actual
$
1000.00
$
990.00
0.59%
$
2.91(3)
Hypothetical(1)
$
1000.00
$
1,021.87
0.59%
$
2.96(4)
Virtus Glovista Emerging Markets ETF
Actual
$
1000.00
$
1,021.80
0.65%
$
3.11(5)
Hypothetical(1)
$
1000.00
$
1,020.62
0.65%
$
3.26(4)
Virtus LifeSci Biotech Clinical Trials ETF
Actual
$
1000.00
$
1,129.20
0.79%
$
4.17(3)
Hypothetical(1)
$
1000.00
$
1,020.88
0.79%
$
3.96(4)
Virtus LifeSci Biotech Products ETF
Actual
$
1000.00
$
1,025.30
0.79%
$
3.97(3)
Hypothetical(1)
$
1000.00
$
1,020.88
0.79%
$
3.96(4)
Virtus Newfleet Multi-Sector Bond ETF
Actual
$
1000.00
$
987.50
0.80%
$
3.94(3)
Hypothetical(1)
$
1000.00
$
1,020.83
0.80%
$
4.01(4)
Virtus WMC Global Factor Opportunities ETF
Actual
$
1000.00
$
1,059.70
0.49%
$
2.50(3)
Hypothetical(1)
$
1000.00
$
1,022.36
0.49%
$
2.46(4)
InfraCap MLP ETF
Actual
$
1000.00
$
965.70
0.95%
$
4.63(3)
Hypothetical(1)
$
1000.00
$
1,020.08
0.95%
$
4.76(4)
1
Assuming 5% return before expenses.
2
Annualized expense ratios reflect expenses net of waived fees or reimbursed expenses, if applicable.
3
Expenses are calculated using each Fund’s annualized expense ratio, multiplied by the average account value for the period, multiplied by 181/365 (to reflect the six-month period).
4
Hypothetical expenses are calculated using the Fund’s annualized expense ratio, multiplied by the average account value for the period, multiplied by 181/365 (to reflect the six-month period).
5
Actual expenses are calculated using the Fund’s annualized expense ratio, multiplied by the average account value for the period, multiplied by 173/365 (to reflect the period November 9, 2017 to April 30, 2018).
Represents step coupon security. Rate shown reflects the rate in effect as of April 30, 2018.
(2)
The rate shown reflects the seven-day yield as of April 30, 2018.
(3)
Amount rounds to less than 0.05%.
The following table summarizes valuation of the Fund’s investments under the fair value hierarchy levels as of April 30, 2018:
Level 1
Level 2
Level 3
Total
Asset Valuation Inputs
Preferred Stocks
$
20,785,612
$
136,494
$
—
$
20,922,106
Money Market Fund
645,183
—
—
645,183
Total
$
21,430,795
$
136,494
$
—
$
21,567,289
For significant movements between levels within the fair value hierarchy, the Fund adopted a policy of recognizing transfers at the end of the reporting period. The Fund transferred $136,494 from level 1 to level 2 due to change in data availability used in investment valuation during the period ended April 30, 2018.
A reconciliation of assets in which Level 3 inputs are used in determining fair value is presented when there are significant Level 3 investments at the end of reporting period. There were no Level 3 securities as of April 30, 2018.
The accompanying notes are an integral part of these financial statements.
The rate shown reflects the seven day yield as of April 30, 2018.
The following table summarizes valuation of the Fund’s investments under the fair value hierarchy levels as of April 30, 2018:
Level 1
Level 2
Level 3
Total
Asset Valuation Inputs
Exchange Traded Funds
$
13,083,324
$
—
$
—
$
13,083,324
Money Market Fund
119,629
—
—
119,629
Total
$
13,202,953
$
—
$
—
$
13,202,953
For significant movements between levels within the fair value hierarchy, the Fund adopted a policy of recognizing transfers at the end of the reporting period. There were no significant transfers between levels during the period ended April 30, 2018.
A reconciliation of assets in which Level 3 inputs are used in determining fair value is presented when there are significant Level 3 investments at the end of the reporting period. There were no Level 3 securities as of April 30, 2018.
The accompanying notes are an integral part of these financial statements.
10
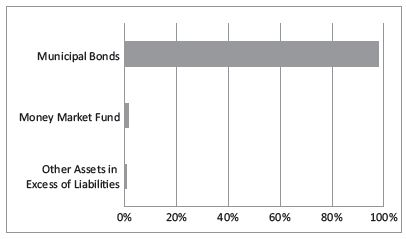
Schedule of Investments — Virtus Cumberland Municipal Bond ETFApril 30, 2018 (unaudited)
Security Description
Principal
Value
MUNICIPAL BONDS — 97.8%
ALABAMA — 2.0%
Auburn University, Series A, 5.00%, 06/01/26 (Call 6/01/21)
$
250,000
$
272,217
ARIZONA — 4.3%
Arizona Department of Transportation State Highway Fund Revenue, Series A, 5.25%, 07/01/29 (Call 7/01/21)
200,000
219,440
City of Phoenix Civic Improvement Corp., Series A, 5.00%, 07/01/22 (Call 7/01/20)
130,000
138,044
Salt River Project Agricultural Improvement & Power District, Series A, 5.00%, 01/01/38 (Call 1/01/27)
200,000
229,488
Total Arizona
586,972
ARKANSAS — 1.6%
State of Arkansas, 5.00%, 04/01/20
200,000
211,286
CALIFORNIA — 7.1%
Beverly Hills Unified School District CA, 4.00%, 08/01/40 (Call 8/01/26)
150,000
157,632
California Health Facilities Financing Authority, Series A, 5.00%, 08/15/52 (Call 8/15/23)
200,000
217,168
California Statewide Communities Development Authority, Series A, 5.00%, 04/01/42 (Call 4/01/22)
200,000
216,972
County of Sacramento CA Airport System Revenue, 5.00%, 07/01/40 (Call 7/01/20)
200,000
211,330
State of California, 5.00%, 10/01/41 (Call 10/01/21)
150,000
163,479
Total California
966,581
COLORADO — 5.3%
City & County of Denver Co. Airport System Revenue, Series A, 5.00%, 11/15/31 (Call 11/15/26)
175,000
202,325
Denver City & County School District No 1, (ST AID WITHHLDG), 4.00%, 12/01/41 (Call 12/01/26)
250,000
259,942
Regional Transportation District, Series A, 4.50%, 06/01/44 (Call 6/01/23)
250,000
260,945
Total Colorado
723,212
CONNECTICUT — 1.8%
State of Connecticut Clean Water Fund—State Revolving Fund, Series A, 5.00%, 05/01/27
200,000
240,778
DISTRICT OF COLUMBIA — 1.7%
District of Columbia, Series G, 5.00%, 12/01/36 (Call 12/01/21)
100,000
108,832
District of Columbia Water & Sewer Authority, Series A, 5.00%, 10/01/52 (Call 4/01/27)
110,000
124,518
Total District of Columbia
233,350
Security Description
Principal
Value
MUNICIPAL BONDS (continued)
FLORIDA — 6.3%
Central Florida Expressway Authority, Series B, 4.00%, 07/01/38 (Call 7/01/26)
$
200,000
$
205,750
City of Tampa FL, Series A, 4.00%, 11/15/46 (Call 5/15/26)
200,000
202,054
County of Miami-Dade FL Aviation Revenue, Series A, (AGC Insured), 5.50%, 10/01/24 (Call 10/01/18)
Represents a zero coupon bond. Rate shown reflects the effective yield.
(2)
The rate shown reflects the seven-day yield as of April 30, 2018.
Abbreviations:
AGC — Assured Guaranty Corp.
AGM — Assured Guaranty Municipal Corp.
FHLMC — Federal Home Loan Mortgage Corp.
FNMA — Federal National Mortgage Association.
GNMA — Government National Mortgage Association.
NATL — National Public Finance Guarantee Corp.
SONYMA — State of New York Mortgage Agency.
ST AID WITHHLDG — State Aid Withholding.
ST APPROP — State Appropriation.
The following table summarizes valuation of the Fund’s investments under the fair value hierarchy levels as of April 30, 2018:
Level 1
Level 2
Level 3
Total
Asset Valuation Inputs
Municipal Bonds
$
—
$
13,299,789
$
—
$
13,299,789
Money Market Fund
193,103
—
—
193,103
Total
$
193,103
$
13,299,789
$
—
$
13,492,892
For significant movements between levels within the fair value hierarchy, the Fund adopted a policy of recognizing transfers at the end of the reporting period. There were no significant transfers between levels during the period ended April 30, 2018.
A reconciliation of assets in which Level 3 inputs are used in determining fair value is presented when there are significant Level 3 investments at the end of the period. There were no Level 3 securities as of April 30, 2018.
The accompanying notes are an integral part of these financial statements.
Security was purchased pursuant to Rule 144A under the Securities Act of 1933 and may not be resold subject to that rule except to qualified institutional buyers. Unless otherwise noted, 144A securities are deemed to be liquid. At April 30, 2018, the aggregate value of these securities was $240,831, or 0.90% of net assets.
(3)
Global Depositary Receipts.
(4)
The rate shown reflects the seven-day yield as of April 30, 2018.
Industry Breakdown
As of April 30, 2018 (based on net assets)
Financials
29.7
%
Information Technology
10.7
%
Consumer Discretionary
8.7
%
Consumer Staples
8.3
%
Materials
8.1
%
Energy
8.0
%
Industrials
6.3
%
Telecommunication Services
5.2
%
Utilities
3.3
%
Real Estate
2.7
%
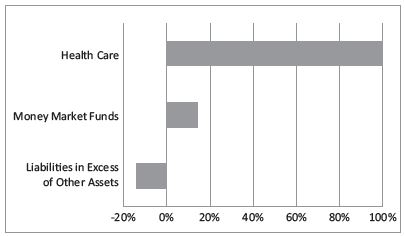
Health Care
1.9
%
Equity Fund
3.4
%
Money Market Fund
0.5
%
Other Assets in Excess of Liabilities
3.2
%
Total
100.0
%
The following table summarizes valuation of the Fund’s investments under the fair value hierarchy levels as of April 30, 2018:
Level 1
Level 2
Level 3
Total
Asset Valuation Inputs
Common Stocks
$
23,998,551
$
516,081
$
—
$
24,514,632
Exchange Traded Fund
899,229
—
—
899,229
Preferred Stocks
265,202
—
—
265,202
Money Market Fund
133,403
—
—
133,403
Total
$
25,296,385
$
516,081
$
—
$
25,812,466
For significant movements between levels within the fair value hierarchy, the Fund adopted a policy of recognizing transfers at the end of the reporting period. There were no significant transfers between levels during the period ended April 30, 2018.
A reconciliation of assets in which Level 3 inputs are used in determining fair value is presented when there are significant Level 3 investments at the end of reporting period. There were no Level 3 securities as of April 30, 2018.
The accompanying notes are an integral part of these financial statements.
All or a portion of the security was on loan. The aggregate market value of securities on loan was $17,446,858; total market value of collateral held by the Fund was $18,043,464. Market value of the collateral held includes non-cash U.S. Treasury securities having a value of $8,045,637.
(2)
American Depositary Receipts.
(3)
The rate shown reflects the seven day yield as of April 30, 2018.
(4)
Represents securities purchased with cash collateral received for securities on loan.
The accompanying notes are an integral part of these financial statements.
The following table summarizes valuation of the Fund’s investments under the fair value hierarchy levels as of April 30, 2018:
Level 1
Level 2
Level 3
Total
Asset Valuation Inputs
Common Stocks
$
71,039,668
$
—
$
—
$
71,039,668
Money Market Funds
10,219,447
—
—
10,219,447
Total
$
81,259,115
$
—
$
—
$
81,259,115
For significant movements between levels within the fair value hierarchy, the Fund adopted a policy of recognizing transfers at the end of the reporting period. There were no significant transfers between levels during the period ended April 30, 2018.
A reconciliation of assets in which Level 3 inputs are used in determining fair value is presented when there are significant Level 3 investments at the end of reporting period. There were no Level 3 securities as of April 30, 2018.
The accompanying notes are an integral part of these financial statements.
All or a portion of the security was on loan. The aggregate market value of securities on loan was $9,373,550; total market value of collateral held by the Fund was $9,849,315. Market value of the collateral held includes non-cash U.S. Treasury securities having a value of $2,898,007.
(2)
The rate shown reflects the seven day yield as of April 30, 2018.
(3)
Represents securities purchased with cash collateral received for securities on loan.
The following table summarizes valuation of the Fund’s investments under the fair value hierarchy levels as of April 30, 2018:
Level 1
Level 2
Level 3
Total
Asset Valuation Inputs
Common Stocks
$
32,105,411
$
—
$
—
$
32,105,411
Money Market Funds
7,073,674
—
—
7,073,674
Total
$
39,179,085
$
—
$
—
$
39,179,085
For significant movements between levels within the fair value hierarchy, the Fund adopted a policy of recognizing transfers at the end of the reporting period. There were no significant transfers between levels during the period ended April 30, 2018.
A reconciliation of assets in which Level 3 inputs are used in determining fair value is presented when there are significant Level 3 investments at the end of reporting period. There were no Level 3 securities as of April 30, 2018.
The accompanying notes are an integral part of these financial statements.
22
Schedule of Investments — Virtus Newfleet Multi-Sector Bond ETFApril 30, 2018 (unaudited)
Security Description
Principal
Value
CORPORATE BONDS — 37.2%
Consumer Discretionary — 7.9%
American Axle & Manufacturing, Inc., 6.25%, 03/15/26
Aqua Finance Trust, Class A, Series 2017-A, 3.72%, 11/15/35(1)
442,856
435,288
Carnow Auto Receivables Trust, Class D, Series 2016-1A, 7.34%, 11/15/21(1)
430,000
434,559
Chrysler Capital Auto Receivables Trust, Class D, Series 2016-BA, 3.51%, 09/15/23(1)
470,000
463,967
Conn’s Receivables Funding LLC, Class B, Series 2017-B, 4.52%, 11/15/20(1)
415,000
417,465
Consumer Installment Loan Trust, Class A, Series 2016-LD1, 3.96%, 07/15/22(1)
98,953
98,962
Drug Royalty III LP 1, Class A, Series 2016-1A, 3.98%, 04/15/27(1)
375,328
372,530
DT Auto Owner Trust, Class C, Series 2018-1A, 3.47%, 12/15/23(1)
375,000
374,771
Exeter Automobile Receivables Trust, Class D, Series 2014-3A, 5.69%, 04/15/21(1)
575,000
587,627
Flagship Credit Auto Trust, Class D, Series 2015-1, 5.26%, 07/15/21(1)
435,000
444,508
Flagship Credit Auto Trust, Class D, Series 2016-3, 3.89%, 11/15/22(1)
525,000
525,927
Foursight Capital Automobile Receivables Trust, Class B, Series 2017-1, 3.05%, 12/15/22(1)
440,000
434,271
GLS Auto Receivables Trust, Class B, Series 2018-1A, 3.52%, 08/15/23(1)
470,000
465,031
GLS Auto Receivables Trust, Class C, Series 2017-1A, 3.50%, 07/15/22(1)
560,000
553,348
Mariner Finance Issuance Trust, Class A, Series 2017-AA, 3.62%, 02/20/29(1)
500,000
501,447
OnDeck Asset Securitization Trust LLC, Class A, Series 2018-1A, 3.50%, 04/18/22(1)
370,000
369,989
Skopos Auto Receivables Trust, Class B, Series 2018-1A, 3.93%, 05/16/22(1)
565,000
564,222
Springleaf Funding Trust, Class A, Series 2016-AA, 2.90%, 11/15/29(1)
515,000
512,132
TCF Auto Receivables Owner Trust, Class C, Series 2016-PT1A, 3.21%, 01/17/23(1)
430,000
422,959
Security Description
Principal
Value
ASSET BACKED SECURITIES (continued)
TGIF Funding LLC, Class A2, Series 2017-1A, 6.20%, 04/30/47(1)
$
392,000
$
394,607
Upstart Securitization Trust, Class B, Series 2018-1, 3.89%, 08/20/25(1)
295,000
295,148
Total Asset Backed Securities
(Cost $8,699,847)
8,668,758
MONEY MARKET FUND — 1.9%
JP Morgan U.S. Government Money Market Institutional Shares, 1.56%(11) (Cost $2,607,501)
2,607,501
2,607,501
TOTAL INVESTMENTS — 99.4%
(Cost $136,290,516)
134,058,988
Other Assets in Excess of Liabilities — 0.6%
765,736
Net Assets — 100.0%
$
134,824,724
(1)
Security was purchased pursuant to Rule 144A under the Securities Act of 1933 and may not be resold subject to that rule except to qualified institutional buyers. Unless otherwise noted, 144A securities are deemed to be liquid. At April 30, 2018, the aggregate value of these securities was $64,297,334, or 47.69% of net assets.
(2)
Is In Default.
(3)
Variable rate instrument. The interest rate shown reflects the rate in effect at April 30, 2018.
(4)
Perpetual security with no stated maturity date.
(5)
Adjustable rate security with an interest rate that is not based on a published reference index and spread. The rate is based on the structure of the agreement and current market conditions.
(6)
Payment in-kind security.100% of the income was received in cash.
(7)
This security is subject to US and/or EU sanctions.
(8)
Security valued at fair value as determined in good faith by or under the direction of the Trustees. This security is disclosed as a Level 3 security in the Fair Value Hierarchy table located after the Schedule of Investments.
(9)
Represents step coupon bond. Rate shown reflects the rate in effect as of April 30, 2018.
(10)
The loan will settle after April 30, 2018 at which the interest will be determined.
(11)
The rate shown reflects the seven-day yield as of April 30, 2018.
Abbreviations:
LIBOR — London InterBank Offered Rate
CMT — 1 Year Constant Maturity Treasury Index
MTN — Medium Term Note
Currency Abbreviations
BRL
Brazilian Real
COP
Colombian Peso
IDR
Indonesian Rupiah
KZT
Kazakhstani Tenge
MXN
Mexican Peso
NGN
Nigerian Naira
RUB
Russian Ruble
ZAR
South African Rand
The accompanying notes are an integral part of these financial statements.
30
Schedule of Investments — Virtus Newfleet Multi-Sector Bond ETF (continued)April 30, 2018 (unaudited)
The following table summarizes valuation of the Fund’s investments under the fair value hierarchy levels as of April 30, 2018:
Level 1
Level 2
Level 3
Total
Asset Valuation Inputs
Corporate Bonds
$
—
$
50,222,383
$
—
$
50,222,383
Foreign Bonds
—
38,836,132
257,150
39,093,282
Mortgage Backed Securities
—
16,806,413
—
16,806,413
Term Loans
—
16,660,651
—
16,660,651
Asset Backed Securities
—
8,668,758
—
8,668,758
Money Market Fund
2,607,501
—
—
2,607,501
Total
$
2,607,501
$
131,194,337
$
257,150
$
134,058,988
For significant movements between levels within the fair value hierarchy, the Fund adopted a policy of recognizing transfers at the end of the period. The Fund transferred $709,080 from Level 2 to Level 3 due to change in data availability used in investment valuation during the period ended April 30, 2018.
A reconciliation of assets in which Level 3 inputs are used in determining fair value is presented when there are significant Level 3 investments at the end of the period. The following summarizes inputs (level 3) used as of April 30, 2018:
Foreign Bonds
Balance as of October 31, 2017
$
—
Realized gain (loss)
2,433
Change in unrealized appreciation (depreciation)
(451,930
)
Purchases
—
Sales
(2,433
)
Amortization (accretion)
—
Transfers into Level 3
709,080
Transfers out of Level 3
—
Balance as of April 30, 2018
257,150
Net change in unrealized appreciation (depreciation) from investments still held as of April 30, 2018:
$
(451,930
)
The accompanying notes are an integral part of these financial statements.
31
Schedule of Investments — Virtus WMC Global Factor Opportunities ETFApril 30, 2018 (unaudited)
Security Description
Shares
Value
Common Stocks — 97.8%
Consumer Discretionary — 12.1%
Amazon.com, Inc.*
33
$
51,682
Barratt Developments PLC (United Kingdom)
1,360
10,448
Berkeley Group Holdings PLC (United Kingdom)
232
13,006
Best Buy Co., Inc.
308
23,571
Compass Group PLC (United Kingdom)
988
21,219
Daimler AG (Germany)
380
30,057
Discovery, Inc. Class C*
676
15,021
Dollar General Corp.
220
21,237
Fiat Chrysler Automobiles NV (United Kingdom)*
1,121
25,138
Haier Electronics Group Co. Ltd. (Hong Kong)*
3,785
13,165
Home Depot, Inc. (The)
226
41,765
Hotel Shilla Co. Ltd. (South Korea)
126
13,685
Hyundai Mobis Co. Ltd. (South Korea)
48
11,146
ITV PLC (United Kingdom)
5,600
11,692
Kering (France)
52
30,116
Kia Motors Corp. (South Korea)
507
15,712
Kohl’s Corp.
300
18,636
Lear Corp.
120
22,436
Macy’s, Inc.
452
14,044
Michael Kors Holdings Ltd.*
272
18,610
Naspers Ltd. Class N (South Africa)
45
11,045
Netflix, Inc.*
109
34,058
Omnicom Group, Inc.
166
12,228
Panasonic Corp. (Japan)
1,195
17,840
Ralph Lauren Corp.
128
14,061
Renault SA (France)
156
16,924
Sony Corp. (Japan)
355
17,536
Starbucks Corp.
436
25,100
Subaru Corp. (Japan)
471
15,851
Suzuki Motor Corp. (Japan)
258
13,903
Target Corp.
381
27,661
Telenet Group Holding NV (Belgium)*
256
15,012
Total Consumer Discretionary
643,605
Consumer Staples — 4.7%
Altria Group, Inc.
564
31,646
Chocoladefabriken Lindt & Spruengli AG (Switzerland)*
4
25,752
Danone SA (France)
220
17,824
Nestle SA (Switzerland)
350
27,188
PepsiCo, Inc.
256
25,840
Pernod Ricard SA (France)
160
26,577
Pick n Pay Stores Ltd. (South Africa)
3,864
24,932
SPAR Group Ltd. (The) (South Africa)
1,336
22,663
Tesco PLC (United Kingdom)
7,030
22,831
Walgreens Boots Alliance, Inc.
342
22,726
Total Consumer Staples
247,979
Energy — 10.1%
Anadarko Petroleum Corp.
307
20,667
Apache Corp.
555
22,727
BP PLC (United Kingdom)
3,687
27,309
China Petroleum & Chemical Corp. Class H (China)
23,868
23,325
CNOOC Ltd. (China)
11,043
18,516
Concho Resources, Inc.*
127
19,966
ConocoPhillips
335
21,943
EOG Resources, Inc.
225
26,588
Security Description
Shares
Value
Common Stocks (continued)
Energy (continued)
EQT Corp.
220
$
11,042
Halliburton Co.
585
30,999
LUKOIL PJSC (Russia)(1)
379
24,972
Marathon Oil Corp.
1,330
24,273
Marathon Petroleum Corp.
232
17,379
Occidental Petroleum Corp.
232
17,924
OMV AG (Austria)
255
15,859
Petronas Dagangan Bhd (Malaysia)
2,285
15,725
Pioneer Natural Resources Co.
105
21,163
Reliance Industries Ltd. (India)(2)(3)
617
17,831
Royal Dutch Shell PLC Class B (Netherlands)
1,510
54,081
SK Innovation Co. Ltd. (South Korea)
86
15,822
Statoil ASA (Norway)
695
17,803
TransCanada Corp. (Canada)
530
22,472
Valero Energy Corp.
371
41,155
Yanzhou Coal Mining Co. Ltd. Class H (China)
6,009
7,625
Total Energy
537,166
Financials — 21.3%
3i Group PLC (United Kingdom)
1,852
24,008
Affiliated Managers Group, Inc.
88
14,508
Aflac, Inc.
484
22,056
AIA Group Ltd. (Hong Kong)
2,644
23,817
Allstate Corp. (The)
204
19,955
American Express Co.
243
23,996
Arch Capital Group Ltd.*
212
16,988
Assicurazioni Generali SpA (Italy)
820
16,576
Australia & New Zealand Banking Group Ltd. (Australia)
744
15,034
Aviva PLC (United Kingdom)
4,290
31,243
AXA SA (France)
712
20,395
Banco do Brasil SA (Brazil)
972
10,183
Bank Central Asia Tbk PT (Indonesia)
9,795
15,559
Bank of New York Mellon Corp. (The)
394
21,477
Barclays PLC (United Kingdom)
7,132
20,349
BNP Paribas SA (France)
308
23,797
Capital One Financial Corp.
304
27,548
Chailease Holding Co. Ltd. (Taiwan)
4,571
16,840
Chiba Bank Ltd. (The) (Japan)
1,880
15,202
Cincinnati Financial Corp.
280
19,695
Commonwealth Bank of Australia (Australia)
372
20,114
Dai-ichi Life Holdings, Inc. (Japan)
1,025
20,384
Deutsche Bank AG (Germany)
940
12,902
Discover Financial Services
344
24,510
E*TRADE Financial Corp.*
430
26,092
Everest Re Group Ltd.
72
16,752
Franklin Resources, Inc.
468
15,744
Hartford Financial Services Group, Inc. (The)
460
24,766
Hong Kong Exchanges & Clearing Ltd. (Hong Kong)
640
20,973
KB Financial Group, Inc. (South Korea)
276
15,815
Kinnevik AB Class B (Sweden)
513
18,577
Lloyds Banking Group PLC (United Kingdom)
28,800
25,637
MetLife, Inc.
520
24,788
Mitsubishi UFJ Financial Group, Inc. (Japan)
1,948
13,065
Mizuho Financial Group, Inc. (Japan)
6,084
11,042
National Australia Bank Ltd. (Australia)
776
16,913
NN Group NV (Netherlands)
432
20,706
Old Mutual PLC (United Kingdom)
3,977
13,776
The accompanying notes are an integral part of these financial statements.
32
Schedule of Investments — Virtus WMC Global Factor Opportunities ETF (continued)April 30, 2018 (unaudited)
Security Description
Shares
Value
Common Stocks (continued)
Financials (continued)
Ping An Insurance Group Co. of China Ltd. Class H (China)
1,866
$
18,437
Principal Financial Group, Inc.
348
20,609
Progressive Corp. (The)
553
33,340
Prudential Financial, Inc.
256
27,218
Reinsurance Group of America, Inc.
111
16,583
Royal Bank of Canada (Canada)
260
19,772
Royal Bank of Scotland Group PLC (United Kingdom)*
Security was purchased pursuant to Rule 144A under the Securities Act of 1933 and may not be resold subject to that rule except to qualified institutional buyers. Unless otherwise noted, 144A securities are deemed to be liquid. At April 30, 2018, the aggregate value of these securities was $32,795, or 0.62% of net assets.
(3)
Global Depositary Receipts.
(4)
Rate shown reflects the effective yield as of April 30, 2018.
(5)
The rate shown reflects the seven-day yield as of April 30, 2018.
The accompanying notes are an integral part of these financial statements.
34
Schedule of Investments — Virtus WMC Global Factor Opportunities ETF (continued)April 30, 2018 (unaudited)
The following table summarizes valuation of the Fund’s investments under the fair value hierarchy levels as of April 30, 2018:
Level 1
Level 2
Level 3
Total
Asset Valuation Inputs
Common Stocks
$
5,168,805
$
14,887
$
—
$
5,183,692
Preferred Stocks
84,572
—
—
84,572
Money Market Fund
22,242
—
—
22,242
Total
$
5,275,619
$
14,887
$
—
$
5,290,506
For significant movements between levels within the fair value hierarchy, the Fund adopted a policy of recognizing transfers at the end of the reporting period. There were no significant transfers between levels during the period ended April 30, 2018.
A reconciliation of assets in which Level 3 inputs are used in determining fair value is presented when there are significant Level 3 investments at the end of reporting period. There were no Level 3 securities as of April 30, 2018.
The accompanying notes are an integral part of these financial statements.
35
Statements of Assets and LiabilitiesApril 30, 2018 (unaudited)
InfraCap REIT Preferred ETF
iSectors® Post-MPT Growth ETF
Virtus Cumberland Municipal Bond ETF
Virtus Glovista Emerging Markets ETF
Virtus LifeSci Biotech Clinical Trials ETF
Assets:
Investments, at cost
$
22,526,633
$
12,789,798
$
13,544,878
$
25,821,977
$
78,942,491
Investments, at value (including securities on loan)1
21,567,289
13,202,953
13,492,892
25,812,466
81,259,115
Foreign currency
—
—
—
2,692
—
Receivables:
Dividends and interest
7,233
39
179,944
38,067
81
Due from Sub-Adviser
—
—
391
—
—
Securities lending
—
—
—
—
25,245
Investment securities sold
—
1,765,668
—
5,280,055
—
Reclaim
—
—
—
2,789
—
Prepaid expenses
—
29
13,596
85
56
Total Assets
21,574,522
14,968,689
13,686,823
31,136,154
81,284,497
Liabilities:
Payables:
Investment securities purchased
—
1,766,389
—
4,422,932
—
Deferred foreign tax payable
—
—
—
14,746
—
Collateral for securities on loan
—
—
—
—
9,997,827
Sub-Advisory fees
—
6,754
—
—
—
Advisory fees
7,729
1,023
—
15,348
46,889
Professional fees
—
—
54,468
—
—
Trustee fees
—
—
293
—
—
Other accrued expenses
—
—
23,928
7,919
—
Total Liabilities
7,729
1,774,166
78,689
4,460,945
10,044,716
Net Assets
$
21,566,793
$
13,194,523
$
13,608,134
$
26,675,209
$
71,239,781
Net Assets Consist of:
Paid-in capital
$
23,130,906
$
12,538,480
$
13,542,508
$
27,140,861
$
81,876,541
Undistributed net investment income/(distributions in excess of net investment income)
34,699
33,971
35,511
138,603
(662,663
)
Undistributed (Accumulated) net realized gain (loss) on investments
(639,468
)
208,917
82,101
(594,372
)
(12,290,721
)
Net unrealized appreciation (depreciation) on investments
(959,344
)
413,155
(51,986
)
(9,883
)
2,316,624
Net Assets
$
21,566,793
$
13,194,523
$
13,608,134
$
26,675,209
$
71,239,781
Shares outstanding (unlimited number of shares of beneficial interest authorized, no par value)
900,004
500,004
550,004
1,050,004
2,300,004
Net asset value per share
$
23.96
$
26.39
$
24.74
$
25.40
$
30.97
1 Market value of securities on loan
$
—
$
—
$
—
$
—
$
17,446,858
Foreign currency, at cost
$
—
$
—
$
—
$
2,690
$
—
The accompanying notes are an integral part of these financial statements.
36
Statements of Assets and Liabilities (continued)April 30, 2018 (unaudited)
Virtus LifeSci Biotech Products ETF
Virtus Newfleet Multi-Sector Bond ETF
Virtus WMC Global Factor Opportunities ETF
Assets:
Investments, at cost
$
37,988,852
$
136,290,516
$
5,109,663
Investments, at value (including securities on loan)1
39,179,085
134,058,988
5,290,506
Cash
—
105,751
—
Foreign currency
—
—
570
Receivables:
Investment securities sold
—
2,203,760
396
Dividends and interest
45
1,272,570
10,850
Securities lending
5,731
Reclaim
—
—
804
Prepaid expenses
56
50,013
—
Total Assets
39,184,917
137,691,082
5,303,126
Liabilities:
Payables:
Investment securities purchased
—
1,407,646
397
Collateral for securities on loan
6,951,308
—
—
Capital shares payable
—
1,225,860
—
Advisory fees
21,089
129,526
3,610
Professional fees
—
64,744
—
Other accrued expenses
—
38,582
22
Total Liabilities
6,972,397
2,866,358
4,029
Net Assets
$
32,212,520
$
134,824,724
$
5,299,097
Net Assets Consist of:
Paid-in capital
$
31,830,858
$
136,539,179
$
5,000,100
Undistributed net investment income/(distributions in excess of net investment income)
(148,280
)
208,751
26,209
Undistributed (Accumulated) net realized gain (loss) on investments
(660,291
)
310,174
92,108
Net unrealized appreciation (depreciation) on investments
1,190,233
(2,233,380
)
180,680
Net Assets
$
32,212,520
$
134,824,724
$
5,299,097
Shares outstanding (unlimited number of shares of beneficial interest authorized, no par value)
800,004
5,500,004
200,004
Net asset value per share
$
40.27
$
24.51
$
26.49
1 Market value of securities on loan
$
9,373,550
$
—
$
—
Foreign currency, at cost
$
—
$
—
$
572
The accompanying notes are an integral part of these financial statements.
37
Statements of OperationsFor the Period Ended April 30, 2018 (unaudited)
InfraCap REIT Preferred ETF
iSectors® Post-MPT Growth ETF
Virtus Cumberland Municipal Bond ETF
Virtus Glovista Emerging Markets ETF1
Virtus LifeSci Biotech Clinical Trials ETF
Investment Income:
Dividend income (net of foreign withholding taxes)
$
739,805
$
139,281
$
2,468
$
252,776
$
152
Interest income
—
—
212,020
—
—
Securities lending, net of fees
—
—
—
—
72,109
Total Investment Income
739,805
139,281
214,488
252,776
72,261
Expenses:
Advisory fees
49,020
8,332
19,069
65,360
187,612
Tax expense
43
57
—
—
57
Custody fees
—
—
493
—
—
Sub-Advisory fees
—
54,994
19,069
—
—
Exchange listing fees
—
—
6,816
—
—
Professional fees
—
—
23,338
—
—
Insurance fees
—
—
1,716
—
—
Accounting and administration fees
—
—
2,952
—
—
Transfer agent fees
—
—
4,231
—
—
Trustee fees
—
—
4,380
—
—
Report to shareholders fees
—
—
3,906
—
—
Offering costs
—
—
1,674
—
—
Pricing fees
—
—
6,731
—
—
Other expenses
—
—
6
—
—
Total Expenses
49,063
63,383
94,381
65,360
187,669
Less expense waivers/reimbursements
—
(13,332
)
(48,459
)
(2,883
)
—
Net Expenses
49,063
50,051
45,922
62,477
187,669
Net Investment Income (Loss)
690,742
89,230
168,566
190,299
(115,408
)
Net Realized Gain (Loss) on:
Investments
(612,368
)
296,004
82,105
(594,779
)
(1,713,641
)
In-kind transactions
—
—
—
—
4,921,653
Foreign currency transactions
—
—
—
407
—
Total Net Realized Gain (Loss)
(612,368
)
296,004
82,105
(594,372
)
3,208,012
Change in Net Unrealized Appreciation (Depreciation) on:
Investments
(1,041,594
)
(525,354
)
(383,060
)
(9,511
)
(1,833,113
)
Foreign currency transactions
—
—
—
(372
)
—
Total Change in Net Unrealized Appreciation (Depreciation)
(1,041,594
)
(525,354
)
(383,060
)
(9,883
)
(1,833,113
)
Net Realized and Change in Unrealized Gain (Loss)
(1,653,962
)
(229,350
)
(300,955
)
(604,255
)
1,374,899
Net Increase (Decrease) in Net Assets Resulting from Operations
$
(963,220
)
$
(140,120
)
$
(132,389
)
$
(413,956
)
$
1,259,491
Foreign withholding taxes
$
—
$
—
$
—
$
33,869
$
—
1
From November 7, 2017 (Commencement of operations) through April 30, 2018.
The accompanying notes are an integral part of these financial statements.
38
Statements of Operations (continued)For the Period Ended April 30, 2018 (unaudited)
Virtus LifeSci Biotech Products ETF
Virtus Newfleet Multi-Sector Bond ETF
Virtus WMC Global Factor Opportunities ETF
Investment Income:
Dividend income (net of foreign withholding taxes)
$
29,681
$
—
$
56,320
Interest Income
—
4,065,753
241
Securities lending, net of fees
35,783
—
—
Total Investment Income
65,464
4,065,753
��
56,561
Expenses:
Advisory fees
145,002
542,861
12,782
Custody fees
—
4,859
—
Exchange listing fees
—
5,035
—
Professional fees
—
14,499
—
Insurance fees
—
3,452
—
Accounting and administration fees
—
29,227
—
Transfer agent fees
—
8,643
—
Trustee fees
—
4,239
—
Report to shareholders fees
—
3,225
—
Tax expense
57
—
30
Pricing fees
—
16,629
—
Other expenses
—
215
—
Total Expenses
145,059
632,884
12,812
Less expense waivers/reimbursements
—
(12,471
)
—
Net Expenses
145,059
620,413
12,812
Net Investment Income (Loss)
(79,595
)
3,445,340
43,749
Net Realized Gain (Loss) on:
Investments
(733,095
)
383,113
93,497
In-kind transactions
4,910,779
1,084
—
Foreign currency transactions
—
(910
)
353
Total Net Realized Gain (Loss)
4,177,684
383,287
93,850
Change in Net Unrealized Appreciation (Depreciation) on:
Investments
(2,704,779
)
(5,636,548
)
161,942
Foreign currency transactions
—
105
(169
)
Total Change in Net Unrealized Appreciation (Depreciation)
(2,704,779
)
(5,636,443
)
161,773
Net Realized and Change in Unrealized Gain (Loss)
1,472,905
(5,253,156
)
255,623
Net Increase (Decrease) in Net Assets Resulting from Operations
$
1,393,310
$
(1,807,816
)
$
299,372
Foreign withholding taxes
$
—
$
—
$
2,948
The accompanying notes are an integral part of these financial statements.
39
Statements of Changes in Net Assets
InfraCap REIT Preferred ETF
iSectors® Post-MPT Growth ETF
For the Six Months Ended April 30, 2018 (unaudited)
For the Period February 7, 20171 Through October 31, 2017
For the Six Months Ended April 30, 2018 (unaudited)
For the Year Ended October 31, 2017
Increase (Decrease) in Net Assets Resulting from Operations:
Net investment income (loss)
$
690,742
$
506,827
$
89,230
$
134,982
Net realized gain (loss) on investments
(612,368
)
10,405
296,004
521,147
Net change in unrealized appreciation (depreciation) on investments
(1,041,594
)
82,250
(525,354
)
1,013,409
Net increase (decrease) in net assets resulting from operations
(963,220
)
599,482
(140,120
)
1,669,538
Distributions to Shareholders from:
Net investment income
(652,503
)
(554,337
)
(140,746
)
(60,825
)
Total distributions
(652,503
)
(554,337
)
(140,746
)
(60,825
)
Shareholder Transactions:
Proceeds from shares sold
2,573,173
20,564,198
—
4,966,461
Cost of shares redeemed
—
—
—
(2,435,021
)
Net increase in net assets resulting from shareholder transactions
2,573,173
20,564,198
—
2,531,440
Increase (decrease) in net assets
957,450
20,609,343
(280,866
)
4,140,153
Net Assets:
Beginning of period
20,609,343
—
13,475,389
9,335,236
End of period
$
21,566,793
$
20,609,343
$
13,194,523
$
13,475,389
Undistributed net investment income/(distributions in excess of net investment income)
34,699
(3,540
)
33,971
85,487
Changes in Shares Outstanding:
Shares outstanding, beginning of period
800,004
—
500,004
400,004
Shares sold
100,000
800,004
—
200,000
Shares redeemed
—
—
—
(100,000
)
Shares outstanding, end of period
900,004
800,004
500,004
500,004
1
Commencement of operations.
The accompanying notes are an integral part of these financial statements.
40
Statements of Changes in Net Assets (continued)
Virtus Cumberland Municipal Bond ETF
Virtus Glovista Emerging Markets ETF
For the Six Months Ended April 30, 2018 (unaudited)
For the Period January 17, 20171 Through October 31, 2017
For the Period November 7, 20171 Through April 30, 2018 (unaudited)
Increase (Decrease) in Net Assets Resulting from Operations:
Net investment income (loss)
$
168,566
$
378,358
$
190,299
Net realized gain (loss) on investments
82,105
223,262
(594,372
)
Net change in unrealized appreciation (depreciation) on investments
(383,060
)
331,074
(9,883
)
Net increase (decrease) in net assets resulting from operations
(132,389
)
932,694
(413,956
)
Distributions to Shareholders from:
Net investment income
(192,607
)
(318,806
)
(51,696
)
Net realized gains
(223,266
)
—
—
Total distributions
(415,873
)
(318,806
)
(51,696
)
Shareholder Transactions:
Proceeds from shares sold
1,299,481
24,998,500
27,140,861
Cost of shares redeemed
(3,804,730
)
(8,950,743
)
—
Net increase (decrease) in net assets resulting from shareholder transactions
(2,505,249
)
16,047,757
27,140,861
Increase (decrease) in net assets
(3,053,511
)
16,661,645
26,675,209
Net Assets:
Beginning of period
16,661,645
—
—
End of period
$
13,608,134
$
16,661,645
$
26,675,209
Undistributed net investment income/(distributions in excess of net investment income)
35,511
59,552
138,603
Changes in Shares Outstanding:
Shares outstanding, beginning of period
650,004
—
—
Shares sold
50,000
1,000,004
1,050,004
Shares redeemed
(150,000
)
(350,000
)
—
Shares outstanding, end of period
550,004
650,004
1,050,004
1
Commencement of operations.
The accompanying notes are an integral part of these financial statements.
41
Statements of Changes in Net Assets (continued)
Virtus LifeSci Biotech Clinical Trials ETF
Virtus LifeSci Biotech Products ETF
For the Six Months Ended April 30, 2018 (unaudited)
For the Year Ended October 31, 2017
For the Six Months Ended April 30, 2018 (unaudited)
For the Year Ended October 31, 2017
Increase (Decrease) in Net Assets Resulting from Operations:
Net investment income (loss)
$
(115,408
)
$
(125,271
)
$
(79,595
)
$
68,690
Net realized gain (loss) on investments
3,208,012
(3,329,315
)
4,177,684
1,814,779
Net change in unrealized appreciation (depreciation) on investments
(1,833,113
)
12,951,955
(2,704,779
)
7,433,275
Net increase (decrease) in net assets resulting from operations
1,259,491
9,497,369
1,393,310
9,316,744
Distributions to Shareholders from:
Net investment income
(326,965
)
—
(68,685
)
—
Total distributions
(326,965
)
—
(68,685
)
—
Shareholder Transactions:
Proceeds from shares sold
48,648,864
14,913,738
5,996,439
15,741,453
Cost of shares redeemed
(8,842,690
)
(11,955,467
)
(12,485,556
)
(10,811,233
)
Net increase (decrease) in net assets resulting from shareholder transactions
39,806,174
2,958,271
(6,489,117
)
4,930,220
Increase (decrease) in net assets
40,738,700
12,455,640
(5,164,492
)
14,246,964
Net Assets:
Beginning of period
30,501,081
18,045,441
37,377,012
23,130,048
End of period
$
71,239,781
$
30,501,081
$
32,212,520
$
37,377,012
Undistributed net investment income/(distributions in excess of net investment income)
(662,663
)
(220,290
)
(148,280
)
—
Changes in Shares Outstanding:
Shares outstanding, beginning of period
1,100,004
1,000,004
950,004
800,004
Shares sold
1,500,000
650,000
150,000
450,000
Shares redeemed
(300,000
)
(550,000
)
(300,000
)
(300,000
)
Shares outstanding, end of period
2,300,004
1,100,004
800,004
950,004
The accompanying notes are an integral part of these financial statements.
42
Statements of Changes in Net Assets (continued)
Virtus Newfleet Multi-Sector Bond ETF
Virtus WMC Global Factor Opportunities ETF
For the Six Months Ended April 30, 2018 (unaudited)
For the Year Ended October 31, 2017
For the Six Months Ended April 30, 2018 (unaudited)
For the Period October 10, 20171 Through October 31, 2017
Increase (Decrease) in Net Assets Resulting from Operations:
Net investment income (loss)
$
3,445,340
$
7,948,778
$
43,749
$
2,084
Net realized gain (loss) on investments
383,287
2,853,526
93,850
(1,957
)
Net change in unrealized appreciation (depreciation) on investments
(5,636,443
)
(734,753
)
161,773
18,907
Net increase (decrease) in net assets resulting from operations
(1,807,816
)
10,067,551
299,372
19,034
Distributions to Shareholders from:
Net investment income
(3,511,255
)
(7,931,960
)
(19,409
)
—
Net realized gain
(2,867,906
)
(2,638,127
)
—
—
Total distributions
(6,379,161
)
(10,570,087
)
(19,409
)
—
Shareholder Transactions:
Proceeds from shares sold
6,370,775
48,492,343
—
5,000,100
Cost of shares redeemed
(32,642,637
)
(46,179,993
)
—
—
Net increase (decrease) in net assets resulting from shareholder transactions
(26,271,862
)
2,312,350
—
5,000,100
Increase (decrease) in net assets
(34,458,839
)
1,809,814
279,963
5,019,134
Net Assets:
Beginning of period
169,283,563
167,473,749
5,019,134
—
End of period
$
134,824,724
$
169,283,563
$
5,299,097
$
5,019,134
Undistributed net investment income/(distributions in excess of net investment income)
208,751
274,666
26,209
1,869
Changes in Shares Outstanding:
Shares outstanding, beginning of period
6,550,004
6,450,004
200,004
—
Shares sold
250,000
1,900,000
—
200,004
Shares redeemed
(1,300,000
)
(1,800,000
)
—
—
Shares outstanding, end of period
5,500,004
6,550,004
200,004
200,004
1
Commencement of operations.
The accompanying notes are an integral part of these financial statements.
43
Financial Highlights
InfraCap REIT Preferred ETF
For the Six Months Ended April 30, 2018 (unaudited)
For the Period February 7, 20171 Through October 31, 2017
Per Share Data for a Share Outstanding throughout each period presented:
Net asset value, beginning of period
$
25.76
$
25.06
Investment operations:
Net investment income2
0.78
1.03
Net realized and unrealized gain (loss)
(1.85
)
0.60
Total from investment operations
(1.07
)
1.63
Less Distributions from:
Net investment income
(0.73
)
(0.93
)
Total distributions
(0.73
)
(0.93
)
Net Asset Value, End of period
$
23.96
$
25.76
Net Asset Value Total Return3
(4.24
)%
6.54
%
Net assets, end of period (000’s omitted)
$
21,567
$
20,609
RATIOS/SUPPLEMENTAL DATA:
Ratios to Average Net Assets:
Expenses
0.45
%4,5
0.45
%4
Net investment income
6.34
%4
5.48
%4
Portfolio turnover rate6
38
%7
91
%7
1
Commencement of operations.
2
Based on average shares outstanding.
3
Net Asset Value Total Return is calculated assuming an initial investment made at the net asset value on the first day of the period, reinvestment of dividends and distributions at net asset value during the period, and redemption at net asset value on the last day of the period. Total return calculated for a period of less than one year is not annualized.
4
Annualized.
5
The ratio of expenses to average net assets include tax expense fees of less than 0.01%.
6
Portfolio turnover excludes the value of portfolio securities received or delivered as a result of in-kind creations or redemptions of the Fund’s capital shares.
7
Not annualized.
The accompanying notes are an integral part of these financial statements.
44
Financial Highlights (continued)
iSectors® Post-MPT Growth ETF
For the Six Months Ended April 30, 2018 (unaudited)
For the Year Ended October 31, 2017
For the Period August 16, 20161 Through October 31, 2016
Per Share Data for a Share Outstanding throughout each period presented:
Net asset value, beginning of period
$
26.95
$
23.34
$
24.89
Investment operations:
Net investment income2
0.18
0.31
0.04
Net realized and unrealized gain (loss)
(0.46
)
3.45
(1.59
)
Total from investment operations
(0.28
)
3.76
(1.55
)
Less Distributions from:
Net investment income
(0.28
)
(0.15
)
—
Total distributions
(0.28
)
(0.15
)
—
Net Asset Value, End of period
$
26.39
$
26.95
$
23.34
Net Asset Value Total Return3
(1.07
)%
16.20
%
(6.25
)%
Net assets, end of period (000’s omitted)
$
13,195
$
13,475
$
9,335
RATIOS/SUPPLEMENTAL DATA:
Ratios to Average Net Assets:4
Expenses, net of expense waivers
0.75
%5,6
0.81
%
0.95
%5
Expenses, prior to expense waivers
0.95
%5,6
0.95
%
0.95
%5
Net investment income
1.34
%5
1.25
%
0.80
%5
Portfolio turnover rate7
71
%8
207
%
78
%8
1
Commencement of operations.
2
Based on average shares outstanding.
3
Net Asset Value Total Return is calculated assuming an initial investment made at the net asset value on the first day of the period, reinvestment of dividends and distributions at net asset value during the period, and redemption at net asset value on the last day of the period. Total return calculated for a period of less than one year is not annualized.
4
Does not include expenses of the underlying funds in which the Fund invests.
5
Annualized.
6
The ratio of expenses to average net assets include tax expense fees of less than 0.01%.
7
Portfolio turnover excludes the value of portfolio securities received or delivered as a result of in-kind creations or redemptions of the Fund’s capital shares. Does not include portfolio activity of the underlying funds in which the Fund invests.
8
Not annualized.
The accompanying notes are an integral part of these financial statements.
45
Financial Highlights (continued)
Virtus Cumberland Municipal Bond ETF
For the Six Months Ended April 30, 2018 (unaudited)
For the Period January 17, 20171 Through October 31, 2017
Per Share Data for a Share Outstanding throughout each period presented:
Net asset value, beginning of period
$
25.63
$
25.00
Investment operations:
Net investment income2
0.27
0.41
Net realized and unrealized gain (loss)
(0.52
)
0.56
Total from investment operations
(0.25
)
0.97
Less Distributions from:
Net investment income
(0.32
)
(0.34
)
Net realized gains
(0.32
)
—
Total distributions
(0.64
)
(0.34
)
Net Asset Value, End of period
$
24.74
$
25.63
Net Asset Value Total Return3
(1.00
)%
3.92
%
Net assets, end of period (000’s omitted)
$
13,608
$
16,662
RATIOS/SUPPLEMENTAL DATA:
Ratios to Average Net Assets:
Expenses, net of expense waivers
0.59
%4
0.59
%4
Expenses, prior to expense waivers
1.21
%4
1.07
%4
Net investment income
2.17
%4
2.05
%4
Portfolio turnover rate5
10
%6
60
%6
1
Commencement of operations.
2
Based on average shares outstanding.
3
Net Asset Value Total Return is calculated assuming an initial investment made at the net asset value on the first day of the period, reinvestment of dividends and distributions at net asset value during the period, and redemption at net asset value on the last day of the period. Total return calculated for a period of less than one year is not annualized.
4
Annualized.
5
Portfolio turnover excludes the value of portfolio securities received or delivered as a result of in-kind creations or redemptions of the Fund’s capital shares.
6
Not annualized.
The accompanying notes are an integral part of these financial statements.
46
Financial Highlights (continued)
Virtus Glovista Emerging Markets ETF
For the Period November 7, 20171 Through April 30, 2018 (unaudited)
Per Share Data for a Share Outstanding throughout the period presented:
Net asset value, beginning of period
$
24.95
Investment operations:
Net investment income2
0.24
Net realized and unrealized gain
0.30
3
Total from investment operations
0.54
Less Distributions from:
Net investment income
(0.09
)
Total distributions
(0.09
)
Net Asset Value, End of period
$
25.40
Net Asset Value Total Return4
2.18
%
Net assets, end of period (000’s omitted)
$
26,675
RATIOS/SUPPLEMENTAL DATA:
Ratios to Average Net Assets:
Expenses, net of expense waivers
0.65
%5
Expenses, prior to expense waivers
0.68
%5
Net investment income
1.98
%5
Portfolio turnover rate6
73
%7
1
Commencement of operations.
2
Based on average shares outstanding.
3
The per share amount of realized and unrealized gain (loss) on investments does not accord with the amounts reported in the Statements of Changes due to the timing of creation of Fund shares in relation to fluctuating market values.
4
Net Asset Value Total Return is calculated assuming an initial investment made at the net asset value on the first day of the period, reinvestment of dividends and distributions at net asset value during the period, and redemption at net asset value on the last day of the period. Total return calculated for a period of less than one year is not annualized.
5
Annualized.
6
Portfolio turnover excludes the value of portfolio securities received or delivered as a result of in-kind creations or redemptions of the Fund’s capital shares.
7
Not annualized.
The accompanying notes are an integral part of these financial statements.
47
Financial Highlights (continued)
Virtus LifeSci Biotech Clinical Trials ETF
For the Six Months Ended April 30, 2018 (unaudited)
For the Year Ended October 31, 2017
For the Year Ended October 31, 2016
For the Period December 16, 20141 Through October 31, 2015
Per Share Data for a Share Outstanding throughout each period presented:
Net asset value, beginning of period
$
27.73
$
18.05
$
27.37
$
25.00
Investment operations:
Net investment loss2
(0.08
)
(0.12
)
(0.14
)
(0.24
)
Net realized and unrealized gain (loss)
3.62
9.80
(9.03
)
2.61
3
Total from investment operations
3.54
9.68
(9.17
)
2.37
Less Distributions from:
Net investment income
(0.30
)
—
—
—
Net realized gains
—
—
(0.15
)
—
Total distributions
(0.30
)
—
(0.15
)
—
Net Asset Value, End of period
$
30.97
$
27.73
$
18.05
$
27.37
Net Asset Value Total Return4
12.92
%
53.66
%
(33.73
)%
9.46
%
Net assets, end of period (000’s omitted)
$
71,240
$
30,501
$
18,045
$
23,261
RATIOS/SUPPLEMENTAL DATA:
Ratios to Average Net Assets:
Expenses
0.79
%5,6
0.83
%
0.85
%6
0.85
%5,7
Net investment loss
(0.49
)%5
(0.53
)%
(0.67
)%
(0.85
)%5
Portfolio turnover rate8
20
%9
45
%
54
%
76
%9
1
Commencement of operations.
2
Based on average shares outstanding.
3
The per share amount of realized and unrealized gain (loss) on investments does not accord with the amounts reported in the Statements of Changes in Net Assets due to the timing of creation of Fund shares in relation to fluctuating market values.
4
Net Asset Value Total Return is calculated assuming an initial investment made at the net asset value on the first day of the period, reinvestment of dividends and distributions at net asset value during the period, and redemption at net asset value on the last day of the period. Total return calculated for a period of less than one year is not annualized.
5
Annualized.
6
The ratio of expenses to average net assets include tax expense fees of less than 0.01%.
7
The ratio of expenses to average net assets include interest expense fees of less than 0.01%.
8
Portfolio turnover excludes the value of portfolio securities received or delivered as a result of in-kind creations or redemptions of the Fund’s capital shares.
9
Not annualized.
The accompanying notes are an integral part of these financial statements.
48
Financial Highlights (continued)
Virtus LifeSci Biotech Products ETF
For the Six Months Ended April 30, 2018 (unaudited)
For the Year Ended October 31, 2017
For the Year Ended October 31, 2016
For the Period December 16, 20141 Through October 31, 2015
Per Share Data for a Share Outstanding throughout each period presented:
Net asset value, beginning of period
$
39.34
$
28.91
$
30.50
$
25.00
Investment operations:
Net investment income (loss)2
(0.09
)
0.07
(0.12
)
(0.17
)
Net realized and unrealized gain (loss)
1.09
10.36
(1.07
)
5.67
3
Total from investment operations
1.00
10.43
(1.19
)
5.50
Less Distributions from:
Net investment income
(0.07
)
—
—
—
Net realized gains
—
—
(0.40
)
—
Total distributions
(0.07
)
—
(0.40
)
—
Net Asset Value, End of period
$
40.27
$
39.34
$
28.91
$
30.50
Net Asset Value Total Return4
2.53
%
36.08
%
(3.97
)%
21.99
%
Net assets, end of period (000’s omitted)
$
32,213
$
37,377
$
23,130
$
22,874
RATIOS/SUPPLEMENTAL DATA:
Ratios to Average Net Assets:
Expenses
0.79
%5,6
0.84
%
0.85
%6
0.86
%5,7
Net investment income (loss)
(0.43
)%5
0.19
%
(0.43
)%
(0.58
)%5
Portfolio turnover rate8
18
%9
34
%
35
%
45
%9
1
Commencement of operations.
2
Based on average shares outstanding.
3
The per share amount of realized and unrealized gain (loss) on investments does not accord with the amounts reported in the Statements of Changes in Net Assets due to the timing of creation of Fund shares in relation to fluctuating market values.
4
Net Asset Value Total Return is calculated assuming an initial investment made at the net asset value on the first day of the period, reinvestment of dividends and distributions at net asset value during the period, and redemption at net asset value on the last day of the period. Total return calculated for a period of less than one year is not annualized.
5
Annualized.
6
The ratio of expenses to average net assets include tax expense fees of less than 0.01%.
7
The ratio of expenses to average net assets include interest expense fees of 0.01%.
8
Portfolio turnover excludes the value of portfolio securities received or delivered as a result of in-kind creations or redemptions of the Fund’s capital shares.
9
Not annualized.
The accompanying notes are an integral part of these financial statements.
49
Financial Highlights (continued)
Virtus Newfleet Multi-Sector Bond ETF
For the Six Months Ended April 30, 2018 (unaudited)
For the Year Ended October 31, 2017
For the Year Ended October 31, 2016
For the Period August 10, 20151 Through October 31, 2015
Per Share Data for a Share Outstanding throughout each period presented:
Net asset value, beginning of period
$
25.84
$
25.96
$
25.09
$
25.00
Investment operations:
Net investment income2
0.56
1.09
0.95
0.05
Net realized and unrealized gain (loss)
(0.87
)
0.22
0.85
0.07
Total from investment operations
(0.31
)
1.31
1.80
0.12
Less Distributions from:
Net investment income
(0.57
)
(1.10
)
(0.93
)
(0.03
)
Net realized gains
(0.45
)
(0.33
)
—
—
Total distributions
(1.02
)
(1.43
)
(0.93
)
(0.03
)
Net Asset Value, End of period
$
24.51
$
25.84
$
25.96
$
25.09
Net Asset Value Total Return3
(1.25
)%
5.26
%
7.37
%
0.47
%
Net assets, end of period (000’s omitted)
$
134,825
$
169,284
$
167,474
$
153,035
RATIOS/SUPPLEMENTAL DATA:
Ratios to Average Net Assets:
Expenses, net of expense waivers
0.80
%4
0.80
%
0.80
%5
0.80
%4
Expenses, prior to expense waivers
0.82
%4
0.84
%
0.91
%5
0.99
%4
Net investment income
4.44
%4
4.26
%
3.75
%
0.88
%4
Portfolio turnover rate6
38
%7
113
%
100
%
20
%7
1
Commencement of operations.
2
Based on average shares outstanding.
3
Net Asset Value Total Return is calculated assuming an initial investment made at the net asset value on the first day of the period, reinvestment of dividends and distributions at net asset value during the period, and redemption at net asset value on the last day of the period. Total return calculated for a period of less than one year is not annualized.
4
Annualized.
5
The ratio of expenses to average net assets include tax expense fees of less than 0.01%.
6
Portfolio turnover excludes the value of portfolio securities received or delivered as a result of in-kind creations or redemptions of the Fund’s capital shares.
7
Not annualized.
The accompanying notes are an integral part of these financial statements.
50
Financial Highlights (continued)
Virtus WMC Global Factor Opportunities ETF
For the Six Months Ended April 30, 2018 (unaudited)
For the Period October 10, 20171 Through October 31, 2017
Per Share Data for a Share Outstanding throughout each period presented:
Net asset value, beginning of period
$
25.10
$
25.00
Investment operations:
Net investment income2
0.22
0.01
Net realized and unrealized gain
1.27
0.09
Total from investment operations
1.49
0.10
Less Distributions from:
—
Net investment income
(0.10
)
—
Total distributions
(0.10
)
—
Net Asset Value, End of period
$
26.49
$
25.10
Net Asset Value Total Return3
5.97
%
0.38
%
Net assets, end of period (000’s omitted)
$
5,299
$
5,019
RATIOS/SUPPLEMENTAL DATA:
Ratios to Average Net Assets:
Expenses
0.49
%4,5
0.49
%4
Net investment income
1.68
%4
0.76
%4
Portfolio turnover rate6
35
%7
23
%7
1
Commencement of operations.
2
Based on average shares outstanding.
3
Net Asset Value Total Return is calculated assuming an initial investment made at the net asset value on the first day of the period, reinvestment of dividends and distributions at net asset value during the period, and redemption at net asset value on the last day of the period. Total return calculated for a period of less than one year is not annualized.
4
Annualized.
5
The ratio of expenses to average net assets include tax expense fees of less than 0.01%.
6
Portfolio turnover excludes the value of portfolio securities received or delivered as a result of in-kind creations or redemptions of the Fund’s capital shares.
7
Not annualized.
The accompanying notes are an integral part of these financial statements.
51
Notes to Financial StatementsApril 30, 2018 (unaudited)
1. ORGANIZATION
The ETFis Series Trust I (the “Trust”) was organized as a Delaware statutory trust on September 20, 2012 and is registered with the Securities and Exchange Commission (the “SEC”) as an open-end management investment company under the Investment Company Act of 1940, as amended (the “1940 Act”). InfraCap REIT Preferred ETF, iSectors® Post-MPT Growth ETF, Virtus Cumberland Municipal Bond ETF, Virtus Glovista Emerging Markets ETF, Virtus LifeSci Biotech Clinical Trials ETF, Virtus LifeSci Biotech Products ETF, Virtus Newfleet Multi-Sector Bond ETF, and Virtus WMC Global Factor Opportunities ETF (each, a “Fund”, and collectively, the “Funds”), each a separate investment portfolio of the Trust, are presented herein. iSectors® Post-MPT Growth ETF is a “fund of funds”, in that the Fund will generally invest in other registered investment companies. The offering of shares is registered under the Securities Act of 1933, as amended (the “Securities Act”).
Funds
Commencement of Operations
InfraCap REIT Preferred ETF
February 7, 2017
iSectors® Post-MPT Growth ETF
August 16, 2016
Virtus Cumberland Municipal Bond ETF
January 17, 2017
Virtus Glovista Emerging Markets ETF
November 7, 2017
Virtus LifeSci Biotech Clinical Trials ETF
December 16, 2014
Virtus LifeSci Biotech Products ETF
December 16, 2014
Virtus Newfleet Multi-Sector Bond ETF
August 10, 2015
Virtus WMC Global Factor Opportunities ETF
October 10, 2017
InfraCap REIT Preferred ETF, Virtus Cumberland Municipal Bond ETF, Virtus LifeSci Biotech Clinical Trials ETF and Virtus LifeSci Biotech Products ETF are “non-diversified” Funds, as defined under the 1940 Act.
InfraCap REIT Preferred ETF seeks investment results that correspond, before fees and expenses, to the price and yield performance of the Indxx REIT Preferred Stock Index.
The iSectors® Post-MPT Growth ETF seeks growth of capital, with a secondary emphasis on capital preservation, independent of individual market conditions.
The Virtus Cumberland Municipal Bond ETF seeks to provide a competitive level of current income exempt from federal income tax, while preserving capital.
The Virtus Glovista Emerging Markets ETF seeks investment results that correspond, before fees and expenses, to the price and yield performance of the Solactive Most Favored Emerging Market Index.
The Virtus LifeSci Biotech Clinical Trials ETF and Virtus LifeSci Biotech Products ETF seek investment results that correspond, before fees and expenses, to the price and yield performance of the LifeSci Biotechnology Clinical Trials Index and LifeSci Biotechnology Products Index, respectively.
The Virtus Newfleet Multi-Sector Bond ETF seeks to provide a high level of current income and, secondarily, capital appreciation.
The Virtus WMC Global Factor Opportunities ETF seeks capital appreciation.
2. SIGNIFICANT ACCOUNTING POLICIES
Each Fund is an investment company and accordingly follows the investment company accounting and reporting guidance of the Financial Accounting Standards Board (FASB) Accounting Standard Codification Topic 946 Financial Services — Investment Companies. Each Fund prepares its financial statements in accordance with generally accepted accounting principles (“GAAP”) in the United States of America and follows the significant accounting policies described below.
Use of Estimates
Management makes certain estimates and assumptions that affect the reported amounts of assets and liabilities and disclosure of contingent assets and liabilities at the date of the financial statements and reported amounts of increases and decreases in the net assets from operations during the reporting period. Actual results could differ from those estimates.
52
Notes to Financial Statements (continued)April 30, 2018 (unaudited)
Indemnification
In the normal course of business, the Funds may enter into contracts that contain a variety of representations which provide general indemnifications for certain liabilities. The Funds’ maximum exposure under these arrangements is unknown. However, the Funds have not had prior claims or losses pursuant to these contracts and expect the risk of loss to be remote.
Organization and Offering Costs
During the period, Virtus ETF Advisers LLC, the Funds’ investment adviser (the “Adviser”), has assumed organization costs for the Trust relating to the organization of the Virtus Cumberland Municipal Bond ETF. Offering costs, consisting primarily of legal fees related to preparing the initial registration statement, were deferred and amortized over a 12 month period beginning with the commencement of operations of the Fund.
Security Valuation
Equity securities and Exchange-Traded Funds are valued based on their last sale price. Price information on listed securities is taken from the exchange where the security is primarily traded. Securities regularly traded in an over the counter market are valued at the latest quoted sale price in such market or in the case of the New York Stock Exchange (“NYSE”) or NASDAQ, at the NYSE or NASDAQ Official Closing Price. Such valuations are typically categorized as Level 1 in the fair value hierarchy described below.
If market quotations are not readily available, or if it is determined that a quotation of a security does not represent fair value, then the security is valued at fair value as determined in good faith using procedures adopted by the Trust’s Board of Trustees (the “Board”). Such valuations are typically categorized as Level 2 or Level 3 in the fair value hierarchy described below.
Debt securities, including restricted securities, are valued based on evaluated quotations received from independent pricing services or from dealers who make markets in such securities. For most bond types, the pricing service utilizes matrix pricing that considers one or more of the following factors: yield or price of bonds of comparable quality, coupon, maturity, current cash flows, type, and current day trade information, as well as dealer-supplied prices. Such valuations are typically categorized as Level 2 in the fair value hierarchy described below. Debt securities that are not widely traded, are illiquid, or are internally fair valued using procedures adopted by the Board are generally categorized as Level 3 in the hierarchy.
Investments in other open-end investment companies are valued based on their net asset value each business day and are typically categorized as Level 1 in the fair value hierarchy described below.
Fair Value Measurement
Accounting Standards Codification, Fair Value Measurements and Disclosures (“ASC 820”) defines fair value, establishes a framework for measuring fair value in accordance with GAAP, and requires disclosure about fair value measurements. It also provides guidance on determining when there has been a significant decrease in the volume and level of activity for an asset or liability, when a transaction is not orderly, and how that information must be incorporated into fair value measurement. Under ASC 820, various inputs are used in determining the value of the Funds’ investments. These inputs are summarized in the following hierarchy:
•
Level 1 — Unadjusted quoted prices in active markets for identical assets or liabilities that the Funds have the ability to access.
•
Level 2 — Observable inputs other than quoted prices included in Level 1 that are observable for the asset or liability, either directly or indirectly. These inputs may include quoted prices for the identical instrument on an inactive market, prices for similar securities, interest rates, prepayment speeds, credit risk, yield curves, default rates and similar data.
•
Level 3 — Unobservable inputs for the asset or liability, to the extent relevant observable inputs are not available; representing the Funds’ own assumptions about the assumptions a market participant would use in valuing the asset or liability, and would be based on the best information available.
The inputs or methodology used for valuing securities are not necessarily an indication of the risk associated with investing in those securities. The hierarchy classification of inputs used to value each Fund’s investments at April 30, 2018, is disclosed at the end of each Fund’s Schedule of Investments.
Security Transactions
Security transactions are accounted for on the trade date. Realized gains and losses on sales of investment securities are calculated using specific identification.
53
Notes to Financial Statements (continued)April 30, 2018 (unaudited)
Foreign Taxes
Certain Funds may be subject to foreign taxes on income, gains on investments or currency repatriation, a portion of which may be recoverable. Each Fund will accrue such taxes and recoveries as applicable based upon current interpretations of the tax rules and regulations that exist in the markets in which it invests.
Investment Income and Expenses
Dividend income is recognized on the ex-dividend date. Expenses and interest income are recognized on the accrual basis. Amortization of premium and accretion of discount on debt securities are included in interest income. Each Fund amortizes premiums and accretes discounts using the effective interest method.
Each Fund pays all of its expenses not assumed by its Sub-Adviser, if any, as defined in Note 3, or the Adviser. General Trust expenses that are allocated among and charged to the assets of the Funds and other series of the Trust are done so on a basis that the Board deems fair and equitable, which may be on a basis of relative net assets of each Fund and other series of the Trust or the nature of the services performed and relative applicability to each Fund and other series of the Trust.
Distributions to Shareholders
Distributions are recorded by the Funds on the ex-dividend date. Income and capital gain distributions are determined in accordance with income tax regulations that may differ from GAAP in the United States of America.
Dividend income from REIT investments is recorded using management’s estimate of the income included in distributions received from the REIT investments. Distributions received in excess of this estimated amount are recorded as a reduction of the cost of investments or reclassified to capital gains. The actual amounts of income, return of capital, and capital gains are only determined by each domestic REIT after its fiscal year-end, and may differ from the estimated amounts.
Foreign Currency Translation
Non-U.S. investment securities and other assets and liabilities denominated in foreign currencies are translated into U.S. dollar amounts at the foreign currency exchange rate effective at the end of the reporting period. Cost of investments is translated at the currency exchange rate effective at the trade date. The gain or loss resulting from a change in currency exchange rates between the trade and settlement date of a portfolio transaction is treated as a gain or loss on foreign currency. Likewise, the gain or loss resulting from a change in currency exchange rates between the date the income is accrued and the date it is paid is treated as a gain or loss on foreign currency. The Funds do not isolate that portion of the results of operations arising from changes in foreign exchange rates on investments from the fluctuations arising from changes in the market prices of securities held. Such fluctuations are included with the net realized and unrealized gain or loss on investments.
Loan Agreements
The Virtus Newfleet Multi-Sector Bond ETF may invest in direct debt instruments which are interests in amounts owed by a corporate, governmental, or other borrower to lenders or lending syndicates. Loan agreements are generally non-investment grade and often involve borrowers that are highly leveraged. The Fund may invest in obligations of borrowers who are in bankruptcy proceedings. Loan agreements are typically senior in the corporate capital structure of the borrower. A loan is often administered by a bank or other financial institution (the “lender”) that acts as agent for all holders. The lender administers the terms of the loan, as specified in the loan agreement. The Fund’s investments in loans may be in the form of participations in loans or assignments of all or a portion of loans from third parties. When investing in loan participations, the Fund has the right to receive payments of principal, interest and any fees to which it is entitled only from the lender selling the loan participation and only upon receipt by the lender of payments from the borrower. The Fund generally has no right to enforce compliance with the terms of the loan agreement with the borrower. As a result, the Fund may be subject to the credit risk of both the borrower and the lender that is selling the loan agreement. When the Fund purchases assignments from lenders, it acquires direct rights against the borrower on the loan.
The Fund may invest in multiple series or tranches of a loan, which may have varying terms and carry different associated risks. Loan agreements may involve foreign borrowers, and investments may be denominated in foreign currencies. Direct indebtedness of emerging countries involves a risk that the government entities responsible for the repayment of the debt may be unable, or unwilling, to pay the principal and interest when due.
The loan agreements have floating rate loan interests which generally pay interest at rates that are periodically determined by reference to a base lending rate plus a premium. The base lending rates are generally LIBOR (London Interbank Offered Rate), the prime rate offered by one or more U.S. banks or the certificate of deposit rate. When a loan agreement is purchased, the Fund may pay an assignment
54
Notes to Financial Statements (continued)April 30, 2018 (unaudited)
fee. On an ongoing basis, the Fund may receive a commitment fee based on the undrawn portion of the underlying line of credit portion of a loan agreement. Prepayment penalty fees are received upon the prepayment of a loan agreement by a borrower. Prepayment penalty, facility, commitment, consent and amendment fees are recorded to income as earned or paid.
Securities Lending
Certain Funds may loan securities to qualified brokers through an agreement with The Bank of New York Mellon (“BNY Mellon”), as a third party lending agent. Under the terms of the agreement, a Fund doing so is required to maintain collateral with a market value not less than 102% of the market value of loaned securities. Collateral is adjusted daily in connection with changes in the market value of securities on loan. Collateral may consist of cash and securities issued by the U.S. Government or its agencies. Cash collateral is invested in a short-term money market fund. Dividends earned on the collateral and premiums paid by the broker are recorded as income by a Fund net of fees and rebates charged by BNY Mellon for its services as securities lending agent and in connection with this securities lending program. Lending portfolio securities involves a risk of delay in the recovery of the loaned securities or in the declining value of the collateral.
At April 30, 2018, the following Funds had securities on loan:
Funds
Market Value
Cash Collateral
Non Cash Collateral(a)
Net Amount
Virtus LifeSci Biotech Clinical Trials ETF
$
17,446,858
$
9,997,827
$
7,449,031
$
—
Virtus LifeSci Biotech Products ETF
9,373,550
6,951,308
2,422,242
$
—
a
Collateral received in excess of the market value of securities on loan is not presented in this table. The total cash collateral received by each Fund is disclosed in the Fund’s statement of assets and liabilities.
Funds not listed in table above did not have any securities on loan at April 30, 2018.
The following table presents the contract value of securities lending transactions and the type of collateral provided to counterparties.
Remaining Contractual Maturity of the Agreements, as of April 30, 2018
Between
Overnight and Continuous
<30 Days
30 & 90 Days
>90 Days
Total
Virtus LifeSci Biotech Clinical Trials ETF
Securities Lending Transactions
Common Stocks
$9,997,827
$
—
$
—
$
—
$9,997,827
Gross amount of recognized liabilities for securities lending transactions:
$9,997,827
Virtus LifeSci Biotech Products ETF
Securities Lending Transactions
Common Stocks
$6,951,308
$
—
$
—
$
—
$6,951,308
Gross amount of recognized liabilities for securities lending transactions:
$6,951,308
3. INVESTMENT MANAGEMENT RELATED PARTIES AND OTHER AGREEMENTS
Investment Advisory Agreements
The Trust has entered into Investment Advisory Agreements (collectively, “Advisory Agreement”) with the Adviser, a wholly owned subsidiary of ETFis Holdings LLC, on behalf of each Fund. ETFis Holdings LLC is majority-owned by Virtus Investment Partners, Inc. (Ticker: VRTS) (together with its affiliates, “Virtus”). Pursuant to the Advisory Agreement, the Adviser has overall supervisory responsibility for the general management and investment of the Funds’ securities portfolios. The Adviser pays all of the ordinary operating expenses of the Virtus Glovista Emerging Markets ETF, Virtus LifeSci Biotech Clinical Trials ETF, Virtus LifeSci Biotech Products ETF and Virtus WMC Global Factor Opportunities ETF, except for each Fund’s management fee; payments under any 12b-1 plan; taxes and other governmental fees; brokerage fees, commissions and other transaction expenses; interest and other costs of borrowing; litigation or arbitration expenses; acquired fund fees and expenses; and extraordinary or other non-routine expenses of the
55
Notes to Financial Statements (continued)April 30, 2018 (unaudited)
Funds. The Adviser is entitled to receive a fee from each Fund (unless otherwise noted below) based on each Fund’s average daily net assets, computed and accrued daily and payable monthly, at an annual rate as follows:
Funds
Rate
InfraCap REIT Preferred ETF
0.45%, subject to a minimum annual fee of $25,000 per year
iSectors® Post-MPT Growth ETF
0.125%, subject to a minimum annual fee of $25,000 per year.
Virtus Cumberland Municipal Bond ETF
0.245%
Virtus Glovista Emerging Markets ETF
0.68%
Virtus LifeSci Biotech Clinical Trials ETF
0.79%
Virtus LifeSci Biotech Products ETF
0.79%
Virtus Newfleet Multi-Sector Bond ETF
0.70%
Virtus WMC Global Factor Opportunities ETF
0.49%
The Advisory Agreement may be terminated by the Trust on behalf of a Fund with the approval of a Fund’s Board or by a vote of the majority of a Fund’s shareholders. The Advisory Agreement may also be terminated by the Adviser by not more than 60 days’ nor less than 30 days’ written notice.
Fee Waiver Agreement
The Adviser has contractually agreed to waive a portion of the Virtus Glovista Emerging Markets ETF’s management fee equal to 0.03% of the Fund’s average daily net assets, which will have the effect of reducing acquired fund fees and expenses (the “Fee Waiver Agreement”). Unless the Adviser continues the Fee Waiver Agreement, it will terminate on February 28, 2019.
Expense Limitation Agreement
The Adviser and, with respect to iSectors® Post-MPT Growth ETF, the Sub-Adviser, has contractually agreed to reduce its fees and reimburse expenses in order to keep net expenses (excluding interest, taxes, brokerage fees and commissions, other expenditures that are capitalized in accordance with generally accepted accounting principles, acquired fund fees and expenses, other extraordinary expenses not incurred in the ordinary course of the Funds’ business, and amounts, if any, payable pursuant to a plan adopted in accordance with Rule 12b-1 under the 1940 Act) from exceeding a specified amount. The expense cap in effect for the Funds during the period ended April 30, 2018 are as follows:
Funds
Expense Limit
Expense Limit Effective Through
iSectors® Post-MPT Growth ETF
0.75%
February 28, 2019
Virtus Cumberland Municipal Bond ETF
0.59%
February 28, 2019
Virtus Newfleet Multi-Sector Bond ETF
0.80%
February 28, 2019
Funds not listed in the table above do not have an expense limitation agreement.
The expense limitation agreement with respect to a Fund will be terminated upon termination of the Advisory Agreement between the Adviser and the Fund, or, with respect to iSectors® Post-MPT Growth ETF, the Sub-Advisory Agreement between the Sub-Adviser and the Fund. Under certain conditions, the Adviser may recapture operating expenses reimbursed within three years after the date on which such waiver or reimbursement occurred. The Fund must pay its ordinary operating expenses before the Adviser is entitled to any reimbursement and must remain in compliance with any applicable expense limitation, or if none, the expense limitation in effect at the time of the waiver or reimbursement. All or a portion of the following Adviser reimbursed expenses may be recaptured by the fiscal year ending:
Funds
2018
2019
2020
Virtus Cumberland Municipal Bond ETF
—
—
88,591
Virtus Newfleet Multi-Sector Bond ETF
57,777
183,990
83,625
Sub-Advisory Agreement
Each Sub-Adviser provides investment advice and management services to its respective Fund. Pursuant to an investment sub-advisory agreement among the Trust, the Sub-Adviser and the Adviser, the sub-advisory fee is based on a Fund’s average daily net assets as specified below. The Adviser has delegated to the InfraCap REIT Preferred ETF’s sub-adviser the obligation to pay all of the ordinary operating expenses of the Fund, except for the management fee paid to the Adviser; payments under any 12b-1 plan adopted by the Fund; taxes and other governmental fees; brokerage fees, commissions and other transaction expenses; interest and other costs of borrowing; litigation or arbitration expenses; acquired fund fees and expenses; and extraordinary or other non-routine expenses of the
56
Notes to Financial Statements (continued)April 30, 2018 (unaudited)
Fund. The iSectors® Post-MPT Growth ETF’s sub-adviser pays all routine expenses of the Fund, except for the management fees paid to the Adviser and sub-adviser; payments under a 12b-1 plan (if any); brokerage expenses; taxes; interest; litigation expenses; acquired fund fees and expenses; and extraordinary expenses of the Fund. The Sub-Advisers and sub-advisory fees for each Fund are listed below.
Funds
Sub-Advisers
Sub-Advisory Fees
InfraCap REIT Preferred ETF
Infrastructure Capital Advisors, LLC
0.375%*
iSectors® Post-MPT Growth ETF
iSectors, LLC
0.825%
Virtus Cumberland Municipal Bond ETF
Cumberland Advisors Inc.
0.245%
Virtus Glovista Emerging Markets ETF
Glovista Investments LLC
60% of the Net Advisory Fee*+
Virtus Newfleet Multi-Sector Bond ETF
Newfleet Asset Management, LLC1
50% of the Net Advisory Fee*++
Virtus WMC Global Factor Opportunities ETF
Wellington Management Company LLP
0.21%*
1
An indirect wholly-owned subsidiary of Virtus.
*
InfraCap REIT Preferred ETF, Virtus Glovista Emerging Markets ETF, Virtus Newfleet Multi-Sector Bond ETF, and Virtus WMC Global Factor Opportunities ETF’s sub-advisory fees are paid for by the Adviser, not the Funds.
+
Net advisory fee: The advisory fee paid by the Fund to the Adviser for investment advisory services under the Adviser’s investment advisory agreement with the Fund, after deducting the payment of all of the ordinary operating expenses of the Fund under the Adviser’s unified fee arrangement. In the event that the Adviser waives all or a portion of its fee pursuant to an applicable waiver agreement, then the Sub-Adviser will waive its fee in the same proportion as the Adviser.
++
Net Advisory Fee: In the event the Adviser waives its entire fee and also assumes expenses of the Trust pursuant to an applicable expense limitation agreement, the Sub-Adviser will similarly waive its entire fee and will share in the expense assumption by promptly paying to the Adviser (or its designee) 50% of the assumed amount. If during the term of the Sub-Advisory Agreement the Adviser later recaptures some or all of fees waived or expenses reimbursed by the Adviser and the Sub-Adviser together, then the Adviser will pay to the Sub-Adviser 50% of the amount recaptured.
Principal Underwriter
Pursuant to the terms of a Distribution Agreement with the Trust, ETF Distributors LLC (the “Distributor”) serves as the Funds’ principal underwriter. The Distributor receives compensation for the statutory underwriting services it provides to the Funds. The Distributor will not distribute shares in less than Creation Units (as hereinafter defined), and does not maintain a secondary market in shares. The shares are traded in the secondary market. The Distributor is a wholly-owned subsidiary of Virtus.
Distribution and Service (12b-1 Plan)
The Board of Trustees has adopted a distribution and service plan, under which InfraCap REIT Preferred ETF, Virtus Glovista Emerging Markets ETF, Virtus LifeSci Biotech Clinical Trials ETF, Virtus LifeSci Biotech Products ETF and Virtus WMC Global Factor Opportunities ETF (collectively, the “12b-1 Funds”) are authorized to pay an amount up to 0.25% of their average daily net assets each year to finance activities primarily intended to result in the sale of Creation Units of the 12b-1 Funds or the provision of investor services. No 12b-1 fees are currently paid by the 12b-1 Funds and there are no current plans to impose these fees.
Operational Administrator
Virtus ETF Solutions LLC (the “Administrator”) serves as the Funds’ operational administrator. The Administrator supervises the overall administration of the Trust and the Funds including, among other responsibilities, the coordination and day-to-day oversight of the Funds’ operations, the service providers’ communications with the Funds and each other and assistance with Trust, Board and contractual matters related to the Funds and other series of the Trust. The Administrator also provides persons satisfactory to the Board to serve as officers of the Trust. The Administrator is a wholly-owned subsidiary of Virtus.
Accounting Services Administrator, Custodian and Transfer Agent
The Bank of New York Mellon (“BNY Mellon”) provides administrative, accounting, tax and financial reporting for the maintenance and operations of the Trust as the Funds’ accounting services administrator. BNY Mellon also serves as the custodian for the Funds’ assets, and serves as transfer agent and dividend paying agent for the Funds.
Affiliated Shareholders
At April 30, 2018, the Sub-Adviser held 143,182 shares of InfraCap REIT Preferred ETF, which represent 15.9% of shares outstanding. These shares may be sold at any time.
4. CREATION AND REDEMPTION TRANSACTIONS
The Funds issue and redeem shares on a continuous basis at Net Asset Value (“NAV”) in groups of 50,000 shares called “Creation Units.” The Funds’ Creation Units may be issued and redeemed generally for cash or an in-kind deposit of securities held by the Funds. In each instance of cash creations or redemptions, the Trust may impose transaction fees based on transaction expenses related to the particular exchange that will be higher than the transaction fees associated with in-kind purchases or redemptions.
57
Notes to Financial Statements (continued)April 30, 2018 (unaudited)
Only “Authorized Participants” who have entered into contractual arrangements with the Distributor may purchase or redeem shares directly from the Funds. An Authorized Participant is either (i) a broker-dealer or other participant in the clearing process through the Continuous Net Settlement System of the National Securities Clearing Corporation or (ii) a DTC participant and, in each case, must have executed a Participant Agreement with the Distributor. Most retail investors will not qualify as Authorized Participants or have the resources to buy and sell whole Creation Units. Therefore, they will be unable to purchase or redeem the shares directly from the Funds. Rather, most retail investors will purchase shares in the secondary market with the assistance of a broker and will be subject to customary brokerage commissions or fees.
5. FEDERAL INCOME TAX
Each Fund intends to qualify as a “regulated investment company” under Sub-chapter M of the Internal Revenue Code of 1986 (the “Code”), as amended. Each Fund intends to distribute substantially all of its net investment income and net capital gains to shareholders. Therefore, no federal income or excise tax provision is required. Accounting for Uncertainty in Income Taxes as issued by the Financial Accounting Standards Board provides guidance for how uncertain tax positions should be recognized, measured, presented and disclosed in the financial statements, and requires the evaluation of tax positions taken or expected to be taken in the course of preparing a Fund’s tax returns to determine whether the tax positions are “more-likely-than-not” of being sustained by the applicable tax authority. Tax positions not deemed to meet the more-likely-than-not threshold would be recorded as a tax benefit or expense in the current year. Interest and penalties related to income taxes would be recorded as income tax expense. Management of the Funds is required to analyze all open tax years (2015, 2016 and 2017), as defined by IRS statute of limitations, for all major jurisdictions, including federal tax authorities and certain state tax authorities. As of April 30, 2018, the Funds did not have a liability for any unrecognized tax benefits. The Funds have no examination in progress and are not aware of any tax positions for which it is reasonably possible that the amounts of unrecognized tax benefits will significantly change in the next twelve months.
The Funds recognize interest accrued related to unrecognized tax benefits and penalties as income tax expense. For the period ended April 30, 2018, the Funds had no accrued penalties or interest.
The adjusted cost basis of investments and gross unrealized appreciation and depreciation of investments for federal income tax purposes were as follows:
Funds
Federal Tax Cost Of Investments
Gross Unrealized Appreciation
Gross Unrealized Depreciation
Net Unrealized Appreciation (Depreciation)
InfraCap REIT Preferred ETF
$
22,557,273
$
25,229
$
(1,015,213
)
$ (989,984)
iSectors® Post-MPT Growth ETF
12,849,878
594,165
(241,090
)
353,075
Virtus Cumberland Municipal Bond ETF
13,544,878
64,304
(116,290
)
(51,986)
Virtus Glovista Emerging Markets ETF
25,821,977
903,825
(913,336
)
(9,511)
Virtus LifeSci Biotech Clinical Trials ETF
81,409,407
9,376,985
(9,527,277
)
(150,292)
Virtus LifeSci Biotech Products ETF
38,766,665
5,358,017
(4,945,597
)
412,420
Virtus Newfleet Multi-Sector Bond ETF
136,363,519
1,420,810
(3,725,341
)
(2,304,531)
Virtus WMC Global Factor Opportunities ETF
5,112,181
360,276
(181,951
)
178,325
At October 31, 2017, for Federal income tax purposes, the following Funds have capital loss carryforwards available to offset future capital gains for an unlimited period. To the extent that these loss carryforwards are utilized, capital gains so offset will not be distributed to shareholders:
Funds
Short-Term No Expiration
Long-Term No Expiration
Total
iSectors® Post-MPT Growth ETF
$
26,362
$
—
$
26,362
Virtus LifeSci Biotech Clinical Trials ETF
7,317,392
6,166,663
13,484,055
Virtus LifeSci Biotech Products ETF
2,541,776
983,154
3,524,930
Virtus WMC Global Factor Opportunities ETF
1,742
—
1,742
58
Notes to Financial Statements (continued)April 30, 2018 (unaudited)
6. INVESTMENT TRANSACTIONS
Purchases and sales of investments (excluding short-term investments), subscription in-kind and redemption in-kind for the period ended April 30, 2018 were as follows:
Purchases
Sales
Subscriptions In-Kind
Redemptions In-Kind
InfraCap REIT Preferred ETF
$
8,174,738
$
8,663,224
$
2,573,276
$
—
iSectors® Post-MPT Growth ETF
9,534,848
9,552,369
—
—
Virtus Cumberland Municipal Bond ETF
1,561,729
3,881,510
—
—
Virtus Glovista Emerging Markets ETF
23,997,015
14,573,337
16,836,052
—
Virtus LifeSci Biotech Clinical Trials ETF
9,491,280
9,649,120
48,651,335
9,165,885
Virtus LifeSci Biotech Products ETF
6,732,021
6,712,832
5,996,653
12,560,327
Virtus Newfleet Multi-Sector Bond ETF
57,704,922
86,601,819
733,598
743,682
Virtus WMC Global Factor Opportunities ETF
1,850,590
1,823,742
—
—
7. INVESTMENT RISKS
As with any investment, an investment in the Funds could result in a loss or the performance of the Funds could be inferior to that of other investments. An investor should consider each Fund’s investment objectives, risks, and charges and expenses carefully before investing. Each Fund’s prospectus and statement of additional information contain this and other important information.
8. CREDIT RISK
Junk Bonds or High Yield Securities: High yield securities are generally subject to greater levels of credit quality risk than investment grade securities. The retail secondary market for these “junk bonds” may be less liquid than that of higher-rated fixed income securities, and adverse conditions could make it difficult at times to sell these securities or could result in lower prices than higher-rated fixed income securities. These risks can reduce the value of the Fund’s shares and the income it earns.
9. CASH CONCENTRATION RISK
At various times, the Funds may have cash and cash collateral balances that exceed federally insured limits.
10. ASSET CONCENTRATION RISK
Certain Funds may invest a high percentage of their assets in specific investments, including other funds. Fluctuations in these investments may have a greater impact on a Fund, positive or negative, than if a Fund did not concentrate its investments in such investments.
At April 30, 2018, the following Fund held a security with a significant concentration in the portfolio as detailed below:
Security
Percentage of Net Assets
iSectors® Post-MPT Growth ETF
iShares 20+ Year Treasury Bond ETF
29.6%
The iShares 20+ Year Treasury Bond ETF is registered under the 1940 Act as open-ended management investment companies. The financial statements of iShares 20+ Year Treasury Bond ETF can be found at the iShares website or the Securities and Exchange Commission’s website (www.sec.gov) and should be read in conjunction with the iSectors® Post-MPT Growth ETF’s financial statements.
59
Notes to Financial Statements (continued)April 30, 2018 (unaudited)
11. 10% SHAREHOLDERS
As of April 30, 2018, certain Funds had individual shareholder account(s) and/or omnibus shareholder account(s) (comprised of a group of individual shareholders), which individually amounted to more than 10% of the total shares outstanding of each such Fund as detailed below:
Funds
% of Shares Outstanding
Number of Accounts
InfraCap REIT Preferred ETF
49%
2
iSectors® Post-MPT Growth ETF
62%
2
Virtus Cumberland Municipal Bond ETF
77%
1
Virtus Glovista Emerging Markets ETF
81%
4
Virtus LifeSci Biotech Clinical Trials ETF
63%
2
Virtus LifeSci Biotech Products ETF
68%
5
Virtus Newfleet Multi-Sector Bond ETF
88%
1
Virtus WMC Global Factor Opportunities ETF
98%
2
12. SUBSEQUENT EVENTS
The Funds are required to recognize in the financial statements the effects of all subsequent events that provide additional evidence about conditions that existed as of the date of the Statements of Assets and Liabilities. For non-recognized subsequent events that must be disclosed to keep the financial statements from being misleading, the Funds are required to disclose the nature of the event as well as an estimate of its financial effect, or a statement that such an estimate cannot be made. Management has evaluated subsequent events through the issuance of these financial statements and has determined that there are no material events that would require disclosure.
60
Schedule of Investments — InfraCap MLP ETFApril 30, 2018 (unaudited)
Security Description
Shares
Value
Common Stocks — 123.6%(1)
Energy — 123.6%
Andeavor(2)
147,238
$
20,365,960
Andeavor Logistics LP(2)
1,566,361
66,476,361
Antero Midstream Partners LP
437,073
11,717,927
Boardwalk Pipeline Partners LP
519,222
5,903,554
BP Midstream Partners LP
285,493
5,415,802
Buckeye Partners LP(2)
933,636
38,792,576
Crestwood Equity Partners LP(2)
185,213
5,065,576
DCP Midstream LP(2)
66,236
2,434,835
Dominion Energy Midstream Partners LP
222,300
3,223,350
Enbridge Energy Partners LP
3,129,675
33,111,961
Enbridge, Inc. (Canada)(2)
50,858
1,539,472
Energy Transfer Equity LP(2)
702,862
11,105,220
Energy Transfer Partners LP(2)
4,794,416
86,395,376
EnLink Midstream LLC
298,778
4,436,853
EnLink Midstream Partners LP
2,440,128
35,625,869
Enterprise Products Partners LP(2)
813,926
21,845,774
EQT GP Holdings LP(2)
179,116
4,477,900
EQT Midstream Partners LP(2)
429,664
24,172,897
Genesis Energy LP
810,681
16,983,767
Kinder Morgan, Inc.(2)
756,446
11,966,976
Magellan Midstream Partners LP(2)
654,473
43,083,958
Marathon Petroleum Corp.
172
12,884
MPLX LP(2)
2,394,790
84,607,931
NGL Energy Partners LP
904,205
11,438,193
Noble Midstream Partners LP
91,330
4,109,850
NuStar Energy LP
34,203
723,735
ONEOK, Inc.(2)
246,388
14,837,485
Phillips 66 Partners LP(2)
445,039
22,065,034
Plains All American Pipeline LP(2)
640,426
15,056,415
Rice Midstream Partners LP
538,414
9,896,049
Shell Midstream Partners LP(2)
53,725
1,159,923
Spectra Energy Partners LP(2)
7,913
282,098
Tallgrass Energy Partners LP
373,517
15,392,636
Targa Resources Corp.
12,226
574,255
TC PipeLines LP
155,797
5,466,917
Western Gas Equity Partners LP
204,976
6,946,637
Western Gas Partners LP(2)
470,314
22,603,291
Williams Cos., Inc. (The)(2)
272,129
7,001,879
Williams Partners LP(2)
1,464,315
53,301,066
Total Common Stocks
(Cost $797,596,675)
729,618,242
Exchange Traded Note — 0.4%(1)
Equity Fund — 0.4%
JPMorgan Alerian MLP Index ETN(2)
84,148
2,184,482
Total Exchange Traded Note
(Cost $2,208,787)
2,184,482
Notional Amount
Number of contracts
Value
Purchased Options — 0.1%
Purchased Call Options — 0.1%
iShares 20+ Year Treasury Bond ETF, Expires 06/15/18,Strike Price $130.00
10,000
100
400
iShares 20+ Year Treasury Bond ETF, Expires 06/15/18, Strike Price $135.00
81,900
819
2,867
iShares 20+ Year Treasury Bond ETF, Expires 06/15/18, Strike Price $136.00
460,000
4,600
0
Security Description
Notional Amount
Number of contracts
Value
Purchased Options (continued)
Purchased Call Options (continued)
iShares 20+ Year Treasury Bond ETF, Expires 09/21/18, Strike Price $140.00
60,000
600
$
600
JPMorgan Alerian MLP Index ETN, Expires 05/18/18, Strike Price $30.00
10,000
100
100
JPMorgan Alerian MLP Index ETN, Expires 06/15/18, Strike Price $30.00
40,200
402
2,010
JPMorgan Alerian MLP Index ETN, Expires 06/15/18, Strike Price $31.00
Plains All American Pipeline LP, Expires 05/04/18, Strike Price $23.00
(240,000
)
(2,400
)
(48,000
)
Plains All American Pipeline LP, Expires 05/04/18, Strike Price $24.00
(110,000
)
(1,100
)
(68,750
)
Plains All American Pipeline LP, Expires 05/11/18, Strike Price $23.00
(110,000
)
(1,100
)
(55,000
)
Plains All American Pipeline LP, Expires 05/18/18, Strike Price $24.00
(210,000
)
(2,100
)
(231,000
)
United States Natural Gas Fund LP, Expires 05/04/18, Strike Price $22.00
(80,000
)
(800
)
(4,800
)
United States Natural Gas Fund LP, Expires 05/11/18, Strike Price $22.00
(70,000
)
(700
)
(11,200
)
United States Natural Gas Fund LP, Expires 05/18/18, Strike Price $22.00
(148,300
)
(1,483
)
(31,143
)
United States Natural Gas Fund LP, Expires 05/25/18, Strike Price $22.00
(170,000
)
(1,700
)
(45,900
)
United States Natural Gas Fund LP, Expires 06/01/18, Strike Price $22.00
(50,000
)
(500
)
(17,500
)
United States Oil Fund LP, Expires 05/04/18, Strike Price $13.00
(520,000
)
(5,200
)
(5,200
)
United States Oil Fund LP, Expires 05/11/18, Strike Price $13.50
(300,000
)
(3,000
)
(39,000
)
Security Description
Notional Amount
Number of contracts
Value
Written Options (continued)
Written Put Option (continued)
United States Oil Fund LP, Expires 05/18/18, Strike Price $12.50
(310,100
)
(3,101
)
$
(6,202
)
United States Oil Fund LP, Expires 05/18/18, Strike Price $13.00
(364,600
)
(3,646
)
(29,168
)
United States Oil Fund LP, Expires 05/18/18, Strike Price $13.50
(300,000
)
(3,000
)
(60,000
)
United States Oil Fund LP, Expires 05/25/18, Strike Price $12.50
(240,000
)
(2,400
)
(7,200
)
United States Oil Fund LP, Expires 05/25/18, Strike Price $13.50
(300,000
)
(3,000
)
(57,000
)
United States Oil Fund LP, Expires 06/01/18, Strike Price $13.50
(220,000
)
(2,200
)
(48,400
)
United States Oil Fund LP, Expires 06/15/18, Strike Price $12.50
(400,700
)
(4,007
)
(40,070
)
United States Oil Fund LP, Expires 06/15/18, Strike Price $13.00
(344,900
)
(3,449
)
(65,531
)
United States Oil Fund LP, Expires 06/15/18, Strike Price $13.50
(200,000
)
(2,000
)
(70,000
)
TOTAL WRITTEN OPTIONS — (1.8)%
(Premiums Received $7,681,990)
$
(10,389,993
)
Abbreviations:
ETF — Exchange Traded Fund
ETN — Exchange Traded Note
*
Non-income producing security.
(1)
Substantially all the securities, or a portion thereof, have been pledged as collateral for line of credit borrowings, short sales and open written option contracts. The aggregate market value of the collateral at April 30, 2018 was $593,454,344.
(2)
Subject to written call options.
(3)
Amount rounds to less than 0.05%.
(4)
The rate shown reflects the seven-day yield as of April 30, 2018.
The accompanying notes are an integral part of these financial statements.
The following table summarizes valuation of the Fund’s investments under the fair value hierarchy levels as of April 30, 2018:
Level 1
Level 2
Level 3
Total
Asset Valuation Inputs
Common Stocks
$
729,618,242
$
—
$
—
$
729,618,242
Exchange Traded Note
2,184,482
—
—
2,184,482
Money Market Fund
285,639
—
—
285,639
Purchased Options
143,782
68,213
—
211,995
Exchange Traded Fund
46,554
—
—
46,554
Total
$
732,278,699
$
68,213
$
—
$
732,346,912
Liability Valuation Inputs
Exchange Traded Funds
$
38,487,178
$
—
$
—
$
38,487,178
Written Options
9,189,804
1,200,189
—
10,389,993
Total
$
47,676,982
$
1,200,189
$
—
$
48,877,171
For significant movements between levels within the fair value hierarchy, the Fund adopted a policy of recognizing transfers at the end of the reporting period. There were no significant transfers between levels during the period ended April 30, 2018.
A reconciliation of assets in which Level 3 inputs are used in determining fair value is presented when there are significant Level 3 investments at the end of reporting period. There were no Level 3 securities as of April 30, 2018.
The accompanying notes are an integral part of these financial statements.
67
Statement of Assets and LiabilitiesApril 30, 2018 (unaudited)
Assets:
InfraCap MLP ETF
Investments, at cost
$
800,494,602
Investments, at value
732,346,912
Cash
45,538
Cash collateral for securities sold short
12,575,807
Receivables:
Investment securities sold
20,114,324
Capital shares sold
1,821,811
Dividends and interest receivable
350,999
Reclaim
6,868
Prepaid taxes
7,089,938
Total Assets
774,352,197
Liabilities:
Borrowings
111,042,398
Payables:
Investment securities purchased
23,719,963
Sub-Advisory fees
446,727
Written options, at value(a)
10,389,993
Security sold short, at value(b)
38,487,178
Total Liabilities
184,086,259
Net Assets
$
590,265,938
Net Assets Consist of:
Paid-in capital
$
669,575,654
Distributions in excess of net investment income, net of income taxes
(33,968,646
)
Undistributed (Accumulated) net realized gain (loss) on investments, written options, securities sold short, net of income taxes
26,615,265
Net unrealized appreciation (depreciation) on investments, written options, securities sold short, net of income taxes
(71,956,335
)
Net Assets
$
590,265,938
Shares outstanding (unlimited number of shares of beneficial interest authorized, no par value)
81,000,004
Net asset value per share
$
7.29
(a) Premiums received
$
7,681,990
(b) Proceeds received from securities sold short
$
37,385,840
The accompanying notes are an integral part of these financial statements.
68
Statement of OperationsFor the Period Ended April 30, 2018 (unaudited)
InfraCap MLP ETF
Investment Income:
Distributions from master limited partnerships
$
26,791,131
Dividend income (net of foreign withholding taxes)
1,289,201
Less: Return of capital distributions
(26,916,051
)
Total Investment Income
1,164,281
Expenses:
Dividend and interest expenses on securities sold short
3,626,230
Sub-Advisory fees
2,726,430
Total Expenses
6,352,660
Net Investment Income (Loss)
(5,188,379
)
Net Realized Gain (Loss) on:
Investments
(15,363,498
)
In-kind redemptions
1,206,233
Written options
25,711,024
Securities sold short
(16,220,653
)
Total Net Realized Loss
(4,666,894
)
Change in Net Unrealized Appreciation (Depreciation) on:
Investments
(5,270,085
)
Written options
(4,773,464
)
Securities sold short
1,685,614
Total Change in Net Unrealized Appreciation (Depreciation)
(8,357,935
)
Net Realized and Change in Unrealized Loss
(13,024,829
)
Net Decrease in Net Assets Resulting from Operations
$
(18,213,208
)
Foreign withholding taxes
$
6,420
The accompanying notes are an integral part of these financial statements.
69
Statement of Changes in Net Assets
InfraCap MLP ETF
For the Six Months Ended April 30, 2018 (unaudited)
For the Year Ended October 31, 2017
Increase (Decrease) in Net Assets Resulting from Operations:
Net investment loss, net of income taxes
$
(5,188,379
)
��
$
(5,888,340
)
Net realized gain (loss) on investments, written options and securities sold short, net of income taxes
(4,666,894
)
31,422,159
Net change in unrealized appreciation (depreciation) on investments, written options and securities sold short, net of income taxes
(8,357,935
)
(64,713,427
)
Net decrease in net assets resulting from operations
(18,213,208
)
(39,179,608
)
Distributions to Shareholders from:
Net investment income
—
(22,241,012
)
Return of capital
(63,574,003
)
(56,174,997
)
Total distributions
(63,574,003
)
(78,416,009
)
Shareholder Transactions:
Proceeds from shares sold
185,091,033
507,687,243
Cost of shares redeemed
(17,917,248
)
(4,818,432
)
Net increase in net assets resulting from shareholder transactions
167,173,785
502,868,811
Increase in net assets
85,386,574
385,273,194
Net Assets:
Beginning of period
504,879,364
119,606,170
End of period
$
590,265,938
$
504,879,364
Distributions in excess of net investment income
(33,968,646
)
(28,780,267
)
Changes in Shares Outstanding:
Shares outstanding, beginning of period
60,300,004
11,250,004
Shares sold
22,850,000
49,500,000
Shares redeemed
(2,150,000
)
(450,000
)
Shares outstanding, end of period
81,000,004
60,300,004
The accompanying notes are an integral part of these financial statements.
70
Statement of Cash FlowsFor the six months ended April 30, 2018
InfraCap MLP ETF
Cash Flows From Operating Activities:
Net decrease in net assets from operations
$
(18,213,208
)
Adjustments to reconcile net decrease in net assets from operations to net cash used in operating activities:
Purchases of investment securities
(455,109,698
)
Proceeds from sales of investment securities
558,613,619
Net proceeds from purchased and written options
30,925,750
Net proceeds from securities sold short
431,019,070
Payments made to cover securities sold short
(466,079,688
)
Net realized loss on investments
15,363,498
Net realized loss on securities sold shorts
16,220,653
Net realized gain on written options
(25,711,024
)
Net realized gain on in-kind redemptions
(1,206,233
)
Net change in unrealized depreciation on investments
5,270,085
Net change in unrealized appreciation on securities sold short
(1,685,614
)
Net change in unrealized depreciation on written options
4,773,464
Net increase in short-term investments
(285,639
)
Decrease in deferred tax asset, net of valuation allowance
7,334,344
Increase in capital shares receivable
(1,821,811
)
Increase in dividends receivable
(163,156
)
Decrease in income tax receivable
62,493
Increase in current tax payable
(7,334,344
)
Decrease in prepaid expenses
2,173
Increase in prepaid taxes
(7,089,938
)
Increase in reclaim receivable
(4,280
)
Decrease in cash collateral for securities sold short
38,018,006
Increase in sub-advisory fees payable
(349,820
)
Net cash provided by operating activities
122,548,702
Cash Flows from Financing Activities:
Proceeds from borrowings
(31,640,615
)
Payments for fund shares sold in excess of in-kind creations
(56,560,949
)
Distributions paid
(63,574,003
)
Net cash used in financing activities
(151,775,567
)
Net decrease in cash
(29,226,865
)
Cash, beginning of year
29,272,403
Cash, end of period
$
45,538
Supplementary information:
Interest paid on borrowings
$
1,880,187
Non-cash financing activities:
In-kind creations — Issued
$
227,291,536
In-kind creations — Redeemed
$
3,556,801
The accompanying notes are an integral part of these financial statements.
71
Financial Highlights
InfraCap MLP ETF
For the Six Months Ended April 30, 2018 (unaudited)
For the Year Ended October 31, 2017
For the Year Ended October 31, 2016
For the Year Ended October 31, 2015
For the Period October 1, 20141 Through October 31, 2014
Per Share Data for a Share Outstanding throughout each period presented:
Net asset value, beginning of period
$
8.37
$
10.63
$
14.28
$
24.21
$25.00
Investment operations:
Net investment loss2
(0.07
)
(0.17
)
(0.08
)
(0.06
)
(0.01
)
Net realized and unrealized loss
(0.16
)
(0.01
)
(1.49
)3
(7.84
)
(0.78
)3
Total from investment operations
(0.23
)
(0.18
)
(1.57
)
(7.90
)
(0.79
)
Less Distributions from:
Net investment income
—
(0.59
)
—
(0.30
)
—
Return of capital
(0.85
)
(1.49
)
(2.08
)
(1.73
)
—
Total distributions
(0.85
)
(2.08
)
(2.08
)
(2.03
)
—
Net Asset Value, End of period
$
7.29
$
8.37
$
10.63
$
14.28
$24.21
Net Asset Value Total Return4
(3.43
)%
(3.44
)%
(8.60
)%
(34.34
)%
(3.17
)%
Net assets, end of period (000’s omitted)
$
590,266
$
504,879
$
119,606
$
19,989
$6,052
RATIOS/SUPPLEMENTAL DATA:
Ratios to Average Net Assets:
Expenses, including deferred income tax expense/benefit
2.21
%7,12
1.93
%8
1.36
%5
1.11
%6
2.70
%7
Expenses, excluding deferred income tax expense/benefit
2.21
%7,12
1.89
%8
1.58
%5
1.16
%6
0.95
%7
Net investment loss
(1.81
)%
(1.73
)%
(0.70
)%
(0.36
)%
(0.35
)%7
Portfolio turnover rate9
127
%
104
%
90
%
60
%
0
%10,11
(1)
Commencement of operations.
(2)
Based on average shares outstanding.
(3)
The per share amount of realized and unrealized loss on investments does not accord with the amounts reported in the Statements of Operations due to the timing of creation of fund shares in relation to fluctuating market values.
(4)
Net Asset Value Total Return is calculated assuming an initial investment made at the net asset value on the first day of the period, reinvestment of dividends and distributions at net asset value during the period, and redemption at net asset value on the last day of the period. Total return calculated for a period of less than one year is not annualized.
(5)
The ratios of expenses to average net assets include interest expense fees of 0.63%.
(6)
The ratios of expenses to average net assets include interest expense fees of 0.21%.
(7)
Annualized.
(8)
The ratios of expenses to average net assets include interest expense fees of 0.94%.
(9)
Portfolio turnover excludes the value of portfolio securities received or delivered as a result of in-kind creations or redemptions of the Fund’s capital shares.
(10)
Not annualized.
(11)
Amount rounds to less than 1%.
(12)
The ratios of expenses to average net assets include dividend and interest expenses on securities sold short of 1.26%.
The accompanying notes are an integral part of these financial statements.
72
Notes to Financial StatementsApril 30, 2018 (unaudited)
1. ORGANIZATION
The ETFis Series Trust I (the “Trust”) was organized as a Delaware statutory trust on September 20, 2012 and is registered with the Securities and Exchange Commission (the “SEC”) as an open-end management investment company under the Investment Company Act of 1940, as amended (the “1940 Act”). The shares of the InfraCap MLP ETF, a separate investment portfolio of the Trust, are presented and referred to herein as “Fund Shares” or “Shares”. The offering of Shares is registered under the Securities Act of 1933, as amended (the “Securities Act”).
Fund
Commencement of Operations
InfraCap MLP ETF
October 1, 2014
The Fund’s investment objective is to seek total return primarily through investments in equity securities of publicly traded master limited partnerships and limited liability companies taxed as partnerships (“MLPs”).
2. SIGNIFICANT ACCOUNTING POLICIES
The Fund is an investment company and accordingly follows the investment company accounting and reporting guidance of the Financial Accounting Standards Board (FASB) Accounting Standard Codification Topic 946 Financial Services — Investment Companies. The Fund prepares its financial statements in accordance with generally accepted accounting principles (“GAAP”) in the United States of America and follows the significant accounting policies described below.
Use of Estimates
Management makes certain estimates and assumptions that affect the reported amounts of assets and liabilities and disclosure of contingent assets and liabilities at the date of the financial statements and reported amounts of increases and decreases in the net assets from operations during the reporting period. Actual results could differ from those estimates.
Indemnification
In the normal course of business, the Fund may enter into contracts that contain a variety of representations which provide general indemnifications for certain liabilities. The Fund’s maximum exposure under these arrangements is unknown. However, the Fund has not had prior claims or losses pursuant to these contracts and expects the risk of loss to be remote.
Security Valuation
Equity securities and Exchange-Traded Funds are valued based on their last sale price. Price information on listed securities is taken from the exchange where the security is primarily traded. Securities regularly traded in an over the counter market are valued at the latest quoted sale price in such market or in the case of the New York Stock Exchange (“NYSE”) or NASDAQ, at the NYSE or NASDAQ Official Closing Price. If market quotations are not readily available, or if it is determined that a quotation of a security does not represent fair value, then the security is valued at fair value as determined in good faith using procedures adopted by the Trust’s Board of Trustees (the “Board”).
Purchased and written options contracts listed on exchanges are valued at their reported mean of bid and ask quotations; over-the-counter derivative contracts are fair valued using price evaluations provided by a pricing service approved by the Board.
Fair Value Measurement
Accounting Standards Codification, Fair Value Measurements and Disclosures (“ASC 820”) defines fair value, establishes a framework for measuring fair value in accordance with GAAP, and requires disclosure about fair value measurements. It also provides guidance on determining when there has been a significant decrease in the volume and level of activity for an asset or liability, when a transaction is not orderly, and how that information must be incorporated into fair value measurement. Under ASC 820, various inputs are used in determining the value of the Fund’s investments. These inputs are summarized in the following hierarchy:
•
Level 1 — Unadjusted quoted prices in active markets for identical assets or liabilities that the Fund has the ability to access.
•
Level 2 — Observable inputs other than quoted prices included in Level 1 that are observable for the asset or liability, either directly or indirectly. These inputs may include quoted prices for the identical instrument on an inactive market, prices for similar securities, interest rates, prepayment speeds, credit risk, yield curves, default rates and similar data.
•
Level 3 — Unobservable inputs for the asset or liability, to the extent relevant observable inputs are not available; representing the Fund’s own assumptions about the assumptions a market participant would use in valuing the asset or liability, and would be based on the best information available.
73
Notes to Financial Statements (continued)April 30, 2018 (unaudited)
The inputs or methodology used for valuing securities are not necessarily an indication of the risk associated with investing in those securities. The hierarchy classification of inputs used to value the Fund’s investments at October 31, 2017, is disclosed at the end of the Fund’s Schedule of Investments.
Security Transactions
Security transactions are accounted for on the trade date. Realized gains and losses on sales of investment securities are calculated using specific identification.
Investment Income and Return of Capital Estimates
The Fund invests in master limited partnerships (“MLPs”) which make distributions that are primarily attributable to return of capital. The Fund records investment income and return of capital in the Statement of Operations using management’s estimate of the percentage of income included in the distributions received from each MLP based on historical information from the MLPs and other industry sources. These estimates may be adjusted based on information received from the MLPs after the tax and fiscal year ends.
The return of capital portion of the MLP distributions is a reduction to investment income and a reduction in the cost basis of each investment which increases net realized gain (loss) and net change in unrealized appreciation (depreciation). If the return of capital distributions exceed its cost basis, the distributions are treated as realized gains. The actual amounts of income and return of capital are only determined by each MLP after its fiscal year-end and may differ from the estimated amounts.
Investment Income and Expenses
Dividend income is recognized on the ex-dividend date. Expenses are recognized on the accrual basis. The Fund amortizes premiums and accretes discounts using the effective interest method.
The Fund pays all of its expenses not assumed by Infrastructure Capital Advisors, LLC (the “Sub-Adviser”) or Virtus ETF Advisers LLC (the “Adviser”). General Trust expenses that are allocated among and charged to the assets of the Fund and other series of the Trust are done so on a basis that the Board deems fair and equitable, which may be on a basis of relative net assets of the Fund and other series of the Trust or the nature of the services performed and relative applicability to the Fund and other series of the Trust.
Short Sales
The Fund may sell securities short. A short sale is a transaction in which the Fund sells a security it does not own in anticipation of a decline in market price. To sell a security short, the Fund must borrow the security. The Fund’s obligation to replace the security borrowed and sold short will be fully collateralized at all times by the proceeds from the short sale retained by the broker and by cash and securities deposited in a segregated account with the Fund’s custodian. If the price of the security sold short increases between the time of the short sale and the time the Fund replaces the borrowed security, the Fund will realize a loss, and if the price declines during the period, the Fund will realize a gain. Any realized gain will be decreased, and any realized loss increased, by the amount of transaction costs. On the ex-dividend date, dividends on short sales are recorded as an expense to the Fund.
In accordance with the terms of its prime brokerage agreement, the Fund may receive rebate income or be charged a fee on borrowed securities which is reported as “Interest Expense” on the Statement of Operations. Such income or fee is calculated on a daily basis based upon the market value of each borrowed security and a variable rate that is dependent upon the availability of such security.
Distributions to Shareholders
Distributions to shareholders are declared and paid on a quarterly basis and are recorded on the ex-dividend date. The Fund uses a cash flow-based distribution approach based on the Fund’s net cash flow received from portfolio investments.
The estimated character of the distributions paid will either be a dividend (ordinary income eligible to be treated as qualified dividend income) or a return of capital. Distributions made from current or accumulated earnings and profits of the Fund will be taxable to shareholders as dividend income. Distributions that are in an amount greater than the Fund’s current and accumulated earnings and profits will represent a return of capital to the extent of a shareholder’s basis in their common shares, and such distributions will correspondingly increase the realized gain upon the sale of their common shares. Additionally, distributions not paid from current or accumulated earnings and profits that exceed a shareholder’s tax basis in their common shares will generally be taxed as a capital gain. This estimate is based on the Fund’s operating results during the period.
74
Notes to Financial Statements (continued)April 30, 2018 (unaudited)
3. INVESTMENT MANAGEMENT RELATED PARTIES AND OTHER AGREEMENTS
Investment Advisory Agreement
The Trust has entered into an Investment Advisory Agreement (the “Advisory Agreement”) with the Adviser, a wholly owned subsidiary of ETFis Holdings LLC, on behalf of the Fund. ETFis Holdings LLC is majority-owned by Virtus Investment Partners, Inc. (Ticker: VRTS) (together with its affiliates, “Virtus”). Pursuant to the Advisory Agreement, the Adviser has overall supervisory responsibility for the general management and investment of the Fund’s securities portfolio. For its services to the Fund, the Adviser is entitled to receive a fee, payable monthly, at an annual rate of 0.075% of the Fund’s average daily net assets, subject to a minimum annual fee of $25,000, paid by the Sub-Adviser as described below.
Sub-Advisory Agreement
The Sub-Adviser provides investment advice and management services to the Fund. Pursuant to an investment sub-advisory agreement among the Trust, the Sub-Adviser and the Adviser, the Sub-Adviser is entitled to receive a fee, payable monthly, at an annual rate of 0.95% of the Fund’s average daily net assets. The Sub-Adviser has agreed to pay all expenses of the Fund, except the Sub-Adviser’s fee, brokerage expenses, taxes, interest, litigation expenses, payments under any 12b-1 plan adopted by the Fund, and other non-routine or extraordinary expenses of the Fund.
Principal Underwriter
Pursuant to the terms of a Distribution Agreement with the Trust, ETF Distributors LLC (the “Distributor”) serves as the Fund’s principal underwriter. The Distributor receives compensation for the statutory underwriting services it provides to the Fund. The Distributor will not distribute shares in less than Creation Units (as hereinafter defined), and does not maintain a secondary market in shares. The shares are traded in the secondary market. The Distributor is a wholly-owned subsidiary of Virtus.
Operational Administrator
Virtus ETF Solutions LLC (the “Administrator”) serves as the Fund’s operational administrator. The Administrator supervises the overall administration of the Trust and the Fund including, among other responsibilities, the coordination and day-to-day oversight of the Fund’s operations, the service providers’ communications with the Fund and each other and assistance with Trust, Board and contractual matters related to the Fund. The Administrator also provides persons satisfactory to the Board to serve as officers of the Trust. The Administrator is a wholly-owned subsidiary of Virtus.
Accounting Services Administrator, Custodian and Transfer Agent
The Bank of New York Mellon (“BNY Mellon”) provides administrative, accounting, tax and financial reporting for the maintenance and operations of the Trust as the Fund’s accounting services administrator. BNY Mellon also serves as the custodian for the Fund’s assets, and serves as transfer agent and dividend paying agent for the Fund.
Affiliated Shareholders
At April 30, 2018, the Sub-Adviser held 461,533 shares of InfraCap MLP ETF, which represent 0.6% of shares outstanding. These shares may be sold at any time.
4. CREATION AND REDEMPTION TRANSACTIONS
The Fund issues and redeems shares on a continuous basis at Net Asset Value (“NAV”) in groups of 50,000 shares called “Creation Units.” Creation Units of the Fund are issued and redeemed generally in exchange for specified securities held by the Fund and a specified cash payment. Redemptions of Creation Units are effected principally for cash. In each instance of such cash creations or redemptions, the Trust may impose transaction fees based on transaction expenses related to the particular exchange that will be higher than the transaction fees associated with in-kind purchases or redemptions.
Only “Authorized Participants” who have entered into contractual arrangements with the Distributor may purchase or redeem shares directly from the Fund. An Authorized Participant is either (i) a broker-dealer or other participant in the clearing process through the Continuous Net Settlement System of the National Securities Clearing Corporation or (ii) a DTC participant and, in each case, must have executed a Participant Agreement with the Distributor. Most retail investors will not qualify as Authorized Participants or have the resources to buy and sell whole Creation Units. Therefore, they will be unable to purchase or redeem the shares directly from the Fund. Rather, most retail investors will purchase shares in the secondary market with the assistance of a broker and will be subject to customary brokerage commissions or fees.
75
Notes to Financial Statements (continued)April 30, 2018 (unaudited)
5. FEDERAL INCOME TAX
The Fund is taxed as a regular C-corporation for federal income tax purposes and as such is obligated to pay federal and applicable state and foreign corporate taxes on its taxable income. Currently, the federal income tax rate for a corporation is 21 percent. This treatment differs from most investment companies, which elect to be treated as “regulated investment companies” under the Code in order to avoid paying entity level income taxes. Under current law, the Fund is not eligible to elect treatment as a regulated investment company due to its investments primarily in MLPs invested in energy assets. The Fund expects that substantially all of the distributions it receives from MLPs may be treated as a tax- deferred return of capital, thus reducing the Fund’s current tax liability. However, the amount of taxes paid by the Fund will vary depending on the amount of income and gains derived from investments and/or sales of MLP interests and such taxes will reduce your return from an investment in the Fund.
Cash distributions from MLPs to the Fund that exceed the Fund’s allocable share of such MLP’s net taxable income are considered a tax deferred return of capital that will reduce the Fund’s adjusted tax basis in the equity securities of the MLP. These reductions in the Fund’s adjusted tax basis in the MLP equity securities will increase the amount of any taxable gain (or decrease the amount of any tax loss) recognized by the Fund on a subsequent sale of the securities. The Fund will accrue deferred income taxes for any future tax liability associated with (i) that portion of MLP distributions considered to be a tax-deferred return of capital as well as (ii) capital appreciation of its investments. Upon the sale of an MLP security, the Fund may be liable for previously deferred taxes. The Fund will rely to some extent on information provided by the MLPs, which is not necessarily timely, to estimate the deferred tax liability for purposes of financial statement reporting and determining the Fund’s NAV. From time to time, the Adviser will modify the estimates or assumptions related to the Fund’s deferred tax liability as new information becomes available. The Fund will generally compute deferred income taxes based on the federal income tax rate applicable to corporations and an assumed rate attributable to state taxes.
The Fund’s income tax expense/(benefit) consists of the following:
As of April 30, 2018
Current
Deferred
Total
Federal
$
(6,932,272
)
$
8,350,310
$
1,418,038
State
(402,072
)
(249,253
)
(651,325
)
Valuation Allowance
—
(766,713
)
(766,713
)
Total tax expense/(benefit)
$
(7,334,344
)
$
7,334,344
$
—
Components of the Fund’s deferred tax assets and liabilities are as follows:
As of April 30, 2018
Deferred tax assets:
Net operating loss carryforward
$
7,492,298
Capital Loss Carryforward
908,101
Net Unrealized Loss on Investments
5,446,018
Other
9,933
Valuation Allowance
(13,856,350
)
Net Deferred tax assets
$
—
The Fund reviews the recoverability of its deferred tax assets based upon the weight of available evidence. When assessing the recoverability of its deferred tax assets, significant weight was given to the effects of potential future realized and unrealized gains on investments and the period over which these deferred tax assets can be realized. Currently, any capital losses that may be generated by the Fund in the future are eligible to be carried back up to three years and can be carried forward for five years to offset capital gains recognized by the Fund in those years. The Tax Cuts and Jobs Act (TCJA) eliminated the net operating loss carryback ability and replaced the 20 year carryforward period with an indefinite carryforward period for any net operating losses arising in tax years ending after December 31, 2017. Therefore, net operating losses that may be generated by the Fund in the future are eligible to be carried forward indefinitely to offset income generated by the Fund in those years but are no longer eligible to be carried back. The TCJA also established a limitation for any net operating losses generated in tax years beginning after December 31, 2017 to the lesser of the aggregate of available net operating losses or 80% of taxable income before any net operating loss utilization.
Based upon the Fund’s assessment, it has determined that it is “more-likely-than-not” that a portion of its deferred tax assets will not be realized through future taxable income of the appropriate character. Accordingly, a valuation allowance has been established for the Fund’s deferred tax assets. The Fund will continue to assess the need for a valuation allowance in the future. Significant increases in
76
Notes to Financial Statements (continued)April 30, 2018 (unaudited)
the fair value of its portfolio of investments may change the Fund’s assessment of the recoverability of these assets and may result in the removal of the valuation allowance against all or a portion of the Fund’s gross deferred tax assets.
Total income tax (benefit)/expense (current and deferred) differs from the amount computed by applying the federal statutory income tax rate of 21% to net investment and realized and unrealized gain/(losses) on investment before taxes as follows for the Fund:
Amount
Rate
Income tax expense at statutory rate
$
(3,824,774
)
(21.00
)%
State income taxes (net of federal benefit)
(448,045
)
(2.46
)%
Permanent differences, net
(360,209
)
(1.98
)%
Effect of tax rate change*
8,055,790
44.23
%
Provision to Return Adjustment
64,682
0.36
%
Impact of Capital Loss Carryback
(2,720,731
)
(14.94
)%
Valuation Allowance
(766,713
)
(4.21
)%
Net Income tax expense/(benefit)
$
—
0.00
%
*
The tax rate change listed in the table above is reflective of the change in deferred tax assets and liabilities due to the federal corporate tax rate change enacted by the TCJA as of December 22, 2017 (date of enactment). For tax years beginning after December 31, 2017, corporations will be taxed at a flat rate of 21% and no longer subject to the alternative minimum tax.
The Fund recognizes interest accrued related to unrecognized tax benefits and penalties as income tax expense. For the period from inception to April 30, 2018, the Fund had no accrued penalties or interest.
The Fund recognizes the tax benefits of uncertain tax positions only where the position is “more-likely-than-not” to be sustained assuming examination by tax authorities. Management has analyzed the Fund’s tax positions, and has concluded that no liability for unrecognized tax benefits should be recorded related to uncertain tax positions taken on U.S. tax returns and state tax returns filed since inception of the Fund. No U.S. federal or state income tax returns are currently under examination. The Fund’s tax years, October 31, 2014, October 31, 2015, October 31, 2016, and October 31, 2017, remain subject to examination by tax authorities in the United States. Due to the nature of the Fund’s investments, the Fund may be required to file income tax returns in several states. The Fund is not aware of any tax positions for which it is reasonably possible that the total amounts of unrecognized tax benefits will change materially in the next 12 months.
The adjusted cost basis of investments and gross unrealized appreciation and depreciation of investments excluding written options and securities sold short, for federal income tax purposes were as follows:
Fund
Federal Tax Cost Of Investments
Gross Unrealized Appreciation
Gross Unrealized Depreciation
Net Unrealized Appreciation (Depreciation)
InfraCap MLP ETF
$
754,302,648
$
28,168,269
$
(50,336,000
)
$(22,167,731)
6. INVESTMENT TRANSACTIONS
Purchases and sales of investments (excluding short-term investments), subscriptions in-kind and redemptions in-kind for the period ended April 30, 2018 were as follows:
Purchases
Sales
Subscriptions In-Kind
Redemptions In-Kind
InfraCap MLP ETF
$
937,507,677
$
979,455,857
$
227,291,536
$3,556,801
7. DERIVATIVE FINANCIAL INSTRUMENTS
Options
The Fund may write covered call and put options on portfolio securities and other financial instruments. Premiums received are recorded as liabilities. The liabilities are subsequently adjusted to reflect the current value of the options written. Premiums received from writing options which expire are treated as realized gains. Premiums received from writing options which are exercised or are closed are added to or offset against the proceeds or amount paid on the transactions to determine the net realized gain or loss. By writing a covered call option, the Fund, in exchange for the premium, foregoes the opportunity for capital appreciation above the exercise price should the market price of the underlying security increase. By writing a put option, the Fund, in exchange for the premium, accepts the risk
77
Notes to Financial Statements (continued)April 30, 2018 (unaudited)
of having to purchase a security at an exercise price that is above the current price. Changes in value of written options are reported as change in unrealized gain (loss) on written options in the Statement of Operations. When the written option expires, is terminated or is sold, the Fund will record a gain or loss, which is reported as realized gain (loss) on written options in the Statement of Operations.
The Fund may purchase call and put options on the portfolio securities or other financial instruments. The Fund may purchase call options to protect against an increase in the price of the security or financial instrument it anticipates purchasing. The Fund may purchase put options on securities which it holds or other financial instruments to protect against a decline in the value of the security or financial instrument or to close out covered written positions. Changes in value of purchased options are reported as part of change in unrealized gain (loss) on investments in the Statement of Operations. When the purchased option expires, is terminated or is sold, the Fund will record a gain or loss, which is reported as part of realized gain (loss) on investments in the Statement of Operations. Risks may arise from an imperfect correlation between the change in market value of the securities held by the Fund and the prices of options relating to the securities purchased or sold by the Fund and from the possible lack of liquid secondary market for an option. The maximum exposure to loss for any purchased option is limited to the premium initially paid for the option. Written uncovered call options subject the Fund to unlimited risk of loss. Written covered call options limit the upside potential of a security above the strike price. Put options written subject the Fund to risk of loss if the value of the security declines below the exercise price minus the put premium.
Transactions in derivative instruments reflected on the Statement of Assets and Liabilities at April 30, 2018, are:
Liabilities
Equity Risk
Written options, at value
$
10,389,993
Transactions in derivative instruments reflected on the Statement of Operations during the period were as follows:
Net Realized Gain (Loss) on:
Equity Risk
��
Investments*
$
3,775,188
Written options
(4,773,464
)
*
Purchased option contracts are included in Net Realized Gain (Loss) on Investments on the Statement of Operations.
Change in Net Unrealized Appreciation (Depreciation) on:
Equity Risk
Investments**
$
195,273
Written options
(4,773,464
)
**
Purchased option contracts are included in Change in Net Unrealized Appreciation (Depreciation) on Investments in the Statement of Operations.
For the period ended April 30, 2018, the monthly average market value of the purchased options and written options contracts held by the Fund were $535,704 and $(9,895,519), respectively.
8. BORROWINGS
The Fund entered into a Lending Agreement (the “Agreement”) with a commercial bank (the “Bank”) that allows the Fund to borrow cash from the Bank. Borrowings under the Agreement are collateralized by investments of the Fund. If the Fund defaults with respect to any of its obligations under the Agreement, the Bank may foreclose on assets of the Fund and/or the Fund may be required to repay immediately, in part or in full, the loan balance outstanding under the Agreement, necessitating the sale of securities at potentially inopportune times. Interest is charged at the 3 Month LIBOR (London Interbank Offered Rate) plus an additional percentage rate on the amount borrowed. The Agreement has an on-demand commitment term. For the period ended April 30, 2018, the average daily borrowings under the Agreement and the daily average interest rate were $123,146,565 and 3.06%, respectively.
At April 30, 2018, the amount of such outstanding borrowings was as follows:
Outstanding Borrowings
Interest Rate
$111,042,398
3.56%
9. INVESTMENT RISKS
As with any investment, an investment in the Fund could result in a loss or the performance of the Fund could be inferior to that of other investments. An investor should consider the Fund’s investment objectives, risks, and charges and expenses carefully before investing. The Fund’s prospectus and statement of additional information contain this and other important information.
78
Notes to Financial Statements (continued)April 30, 2018 (unaudited)
MLP Risk
Investments in securities of MLPs involve risks that differ from investments in common stock including risks related to limited control and limited rights to vote on matters affecting the MLP, risks related to potential conflicts of interest between the MLP and the MLP’s general partner and cash flow risks. MLP common units and other equity securities can be affected by macro-economic and other factors affecting the stock market in general, expectations of interest rates, investor sentiment towards MLPs or the energy sector, changes in a particular issuer’s financial condition or unfavorable or unanticipated poor performance of a particular issuer (in the case of MLPs, generally measured in terms of distributable cash flow). Prices of common units of individual MLPs and other equity securities also can be affected by fundamentals unique to the partnership or company, including earnings power and coverage ratios.
10. 10% SHAREHOLDERS
As of April 30, 2018, the Fund had individual shareholder account(s) and/or omnibus shareholder account(s) (comprised of a group of individual shareholders), which individually amounted to more than 10% of the total shares outstanding of the Fund as detailed below:
Fund
% of Shares Outstanding
Number of Accounts
InfraCap MLP ETF
61
%
4
11. NEW ACCOUNTING PRONOUNCEMENT
On November 17, 2016, the FASB issued ASU 2016-18, Statement of Cash Flows (Topic 230): Restricted Cash. This update intends to reduce diversity in the presentation of restricted cash and restricted cash equivalents in the statement. Any restricted cash and restricted cash equivalents will be included as components of cash and cash equivalents as presented on the statement of cash flows. For the Trust, the effective date of this update is for periods beginning after December 15, 2017. At this time, management is evaluating the implications of this ASU and believes it will not have a material impact on the financial statements.
12. SUBSEQUENT EVENTS
The Fund is required to recognize in the financial statements the effects of all subsequent events that provide additional evidence about conditions that existed as of the date of the Statement of Assets and Liabilities. For non-recognized subsequent events that must be disclosed to keep the financial statements from being misleading, the Fund is required to disclose the nature of the event as well as an estimate of its financial effect, or a statement that such an estimate cannot be made. Management has evaluated subsequent events through the issuance of these financial statements and has determined that there are no material events that would require disclosure.
79
Approval of Advisory Agreements & Board Considerations (unaudited)
February 8, 2018 Annual Consideration of Advisory and Sub-Advisory Agreements for: InfraCap MLP ETF (“AMZA”) InfraCap REIT Preferred ETF (“PFFR”) iSectors® Post-MPT Growth ETF (“PMPT”) Virtus Cumberland Municipal Bond ETF (“CUMB”) Virtus Newfleet Multi-Sector Bond ETF (“NFLT”) (each, a “Fund” and collectively, the “Funds”)
On February 8, 2018, at an in-person meeting (the “Meeting”) at which all of the Trustees were present, including all of the Trustees who were not “interested persons” (as that term is defined in the Investment Company Act of 1940) of the Trust (the “Independent Trustees”), the Board of Trustees (the “Board”) of ETFis Series Trust I (the “Trust”), including the Independent Trustees voting separately, reviewed and unanimously approved for each of the respective Funds the continuance of an investment advisory agreement between Virtus ETF Advisers LLC (the “Adviser”) and the Trust (each, an “Advisory Agreement” and collectively, the “Advisory Agreements”) and an investment sub-advisory agreement among each Sub-Adviser,1 the Adviser and the Trust (each, a “Sub-Advisory Agreement” and collectively, the “Sub-Advisory Agreements”).
At the Meeting, the Board received and reviewed information provided by the Adviser and each of the Sub-Advisers in response to requests of the Board and its counsel, including a memorandum from the Adviser that included a description of the Adviser’s business, a copy of the Adviser’s Form ADV, and certain other information about the Adviser to be considered in connection with the Trustees’ review process (the “Adviser Memorandum”), and a memorandum from each Sub-Adviser that included a description of the Sub-Adviser’s business, a copy of the Sub-Adviser’s Form ADV and certain other information about the Sub-Adviser to be considered in connection with the Trustees’ review process (each, a “Sub-Adviser Memorandum”). The Board also met in person with representatives of the Adviser to discuss the Funds.
Advisory Agreements
In deciding on whether to approve the continuance of the Advisory Agreements with the Adviser on behalf of the Funds, the Board considered numerous factors, including:
The nature, extent, and quality of the services provided by the Adviser. The Board considered the responsibilities the Adviser has under the respective Advisory Agreement, and the services provided by the Adviser to the Funds, including, without limitation, the management, oversight, and administrative services that the Adviser and its employees provide to the Funds, the Adviser’s coordination of services for the Funds by the Trust’s service providers, and its compliance procedures and practices, particularly with respect to the Trust’s exemptive order permitting the operation of the Funds as exchange-traded funds. The Board noted that many of the Trust’s executive officers are employees of the Adviser, and serve the Trust without additional compensation from the Funds. The Board also considered the information in the Adviser Memorandum, including descriptions of the Adviser’s investment advisory services and its related non-advisory business. The Board concluded that the quality, extent, and nature of the services provided by the Adviser are satisfactory and adequate for the Funds.
The investment management capabilities and experience of the Adviser. The Board evaluated the management experience of the Adviser, in light of the services it has provided to each Fund. In particular, the Board received information from the Adviser regarding, among other things, the Adviser’s experience in organizing, managing and overseeing the Funds and coordinating their operation and administration. The Board determined that the Adviser possessed adequate capabilities and experience for the management of each Fund.
The costs of the services provided and profits to be realized by the Adviser from its relationship with the Funds. The Board examined and evaluated the arrangements between the Adviser and the Funds under the Advisory Agreements. The Board considered the fact that AMZA and PFFR utilize a “unified fee” structure in which a Fund’s ordinary operating expenses (subject to customary exclusions) are paid from the Adviser’s and/or Sub-Adviser’s management fee. The Board also considered that NFLT, CUMB and PMPT are each subject to an expense limitation agreement (in each case, subject to customary exclusions) to cap the Fund’s total expenses. The Board noted that, under either arrangement, the Adviser would likely supplement a portion of the cost of operating each Fund (except for AMZA and PMPT) for some period of time and considered the benefits that would accrue to those Funds.
The Board also considered potential benefits for the Adviser in managing the Funds, including promotion of the Adviser’s name and the interests of the Adviser in providing management and oversight services to the Funds. In addition, at the Meeting, the Board compared the management fee and total expense ratio of the Funds to the expense ratios of other funds considered by the Adviser to have similar
1
The Sub-Advisers include Infrastructure Capital Advisors, LLC; iSectors, LLC; Cumberland Advisors, Inc.; and Newfleet Asset Management, LLC.
80
Approval of Advisory Agreements & Board Considerations (unaudited) (continued)
investment objectives and strategies to the Funds and comparable assets under management (“AUM”). Following these comparisons and upon further consideration and discussion of the foregoing, the Board concluded that the fees to be paid to the Adviser by the Funds (including, where applicable, pursuant to the Sub-Advisory Agreements) are appropriate and representative of arm’s-length negotiations.
The extent to which economies of scale would be realized as the Funds grow and whether management fee levels reflect these economies of scale for the benefit of the Funds’ investors. The Board considered the AUM and operational history of each of the Funds, together with the fees paid to the Adviser (including, where applicable, any capped fees). The Board considered that AMZA and PFFR are subject to a unified fee. The Board considered that the Funds have experienced benefits from the unified fee arrangement, and would continue to do so even after each Fund’s assets grow to a level where the Adviser and/or Sub-Adviser is no longer required to reimburse the Fund’s ordinary operating expenses in excess of the amount received by the Adviser and/or Sub-Adviser under the unified fee. Accordingly, the Board concluded that each Fund’s fee arrangement with the Adviser and Sub-Adviser would provide benefits through the unified fee structure, and that, at each Fund’s current and projected asset levels, each Fund’s arrangement with the Adviser would be appropriate.
The Board considered that NFLT, CUMB and PMPT currently experience benefits from the capped fees pursuant to the expense limitation agreement. Accordingly, the Board concluded that, in light of the current AUM for each of the Funds, it was not necessary to consider economies of scale at this time.
Other benefits derived by the Adviser from its relationship with the Funds. The Board considered material “fall-out” or ancillary benefits that accrue to the Adviser as a result of its relationship with each Fund (other than the advisory fee). The Board noted that ETF Distributors LLC (the “Distributor”), an affiliate of the Adviser, serves as principal underwriter for the Funds, and that Virtus ETF Solutions LLC (the “Administrator”), also an affiliate of the Adviser, serves as the operational administrator for the Funds. The Board noted that the Adviser is responsible for the payment of any fees to the Distributor and the Administrator. The Board considered that the association of the Distributor and the Administrator with the Funds could result in non-quantifiable reputational benefits for those entities. Based on the foregoing information, the Board concluded that such potential benefits are immaterial to its consideration and approval of the continuance of the Advisory Agreements.
Conclusion. The Board did not identify any single factor as being of paramount importance, and different Trustees may have given different weight to different factors. The Board reviewed with counsel to the Independent Trustees the legal standards applicable to its consideration of the Advisory Agreements. Based on its review, including consideration of each of the factors referenced above, the Board determined, in the exercise of its reasonable business judgment, that the Advisory Agreements were fair and reasonable in light of the services performed or to be performed, expenses incurred or to be incurred and such other matters as the Board considered relevant.
After full consideration of the above factors as well as other factors, the Board, including the Independent Trustees, unanimously approved the continuance of the Advisory Agreements on behalf of the Funds.
Sub-Advisory Agreements
In deciding on whether to approve the continuance of the Sub-Advisory Agreements with each Sub-Adviser on behalf of the respective Funds, the Board considered numerous factors, including:
The nature, extent, and quality of the services provided by the Sub-Advisers. The Board considered the responsibilities the Sub-Advisers have under the Sub-Advisory Agreements and the services provided by the Sub-Advisers including, without limitation, the investment advisory services and each Sub-Adviser’s compliance procedures and practices. After reviewing the foregoing information and further information in the materials, including each Sub-Adviser Memorandum (which included descriptions of each Sub-Adviser’s business and each Sub-Adviser’s Form ADV), the Board concluded that the quality, extent, and nature of the services provided by the Sub-Advisers are satisfactory and adequate for the Funds.
The investment management capabilities and experience of the Sub-Advisers. The Board evaluated the investment management experience of the Sub-Advisers and experience of the Sub-Advisers in carrying out the day-to-day management of the respective Fund’s portfolio. In particular, the Board received information from each Sub-Adviser regarding the performance of its portfolio managers in implementing the investment strategies for the respective Fund. The Board discussed the investment objective and strategies for each Fund and each Sub-Adviser’s performance in implementing the strategies. After consideration of these factors, the Board determined that each Sub-Adviser continued to be an appropriate sub-adviser to the respective Fund.
The costs of the services provided and profits to be realized by the Sub-Advisers from their relationship with the respective Funds. The Board examined and evaluated the arrangements between the respective Sub-Adviser and the Adviser under the Sub-Advisory Agreements. The Board considered the fact that AMZA and PFFR utilize a “unified fee” structure in which a Fund’s ordinary operating expenses (subject to customary exclusions) are paid from the Adviser’s and/or Sub-Adviser’s management fee. The Board also considered
81
Approval of Advisory Agreements & Board Considerations (unaudited) (continued)
that NFLT, CUMB and PMPT are each subject to an expense limitation agreement (in each case, subject to customary exclusions) to cap the Fund’s total expenses. The Board considered the extent to which each Sub-Adviser bears a portion of Fund expenses. The Board noted that, under either arrangement, the Sub-Advisers would likely supplement a portion of the cost of operating the Funds for some period of time and considered the benefits that would accrue to those Funds.
The Board considered the Sub-Advisers’ staffing, personnel, and methods of operating; the Sub-Advisers’ compliance policies and procedures; the financial condition of the Sub-Advisers and the level of commitment to the Funds by the Sub-Advisers; the current and projected asset levels of the Funds; the Sub-Advisers’ payment of startup costs for the Funds; and the overall projected expenses of the Funds. The Board also considered potential benefits to the Sub-Advisers in sub-advising the respective Funds, including promotion of the Sub-Advisers’ names.
The Board compared the fees and expenses of the Funds (including the sub-advisory fee) to other funds considered by the Adviser to have investment objectives and strategies similar to the Funds and comparable AUM. Following these comparisons and upon further consideration and discussion of the foregoing, the Board concluded that the fees to be paid to the Sub-Advisers (including, where applicable, pursuant to the Advisory Agreements) are appropriate and representative of arm’s-length negotiations.
The extent to which economies of scale would be realized as the Funds grow and whether sub-advisory fee levels reflect these economies of scale for the benefit of the Funds’ investors. The Board considered the AUM and operational history of each of the Funds, together with the fees paid to the respective Sub-Advisers (including, where applicable, any capped fees). The Board considered that AMZA and PFFR are subject to a unified fee. The Board considered that the Funds have experienced benefits from the unified fee arrangement, and that NFLT, CUMB and PMPT benefit from any additional capped fees, particularly where Sub-Advisers are paying Fund expenses in excess of their sub-advisory fee. The Board considered that the applicable Funds would continue to experience such benefits even after each Fund’s assets grow to a level where the Sub-Adviser is no longer required to waive its sub-advisory fee or reimburse the Fund’s expenses in excess of the amount received by the Sub-Adviser under its Sub-Advisory Agreement. Accordingly, the Board concluded that, in light of the current AUM for each of the Funds, it was not necessary to consider economies of scale at this time.
Conclusion. The Board did not identify any single factor as being of paramount importance, and different Trustees may have given different weight to different factors. The Board reviewed with counsel to the Independent Trustees the legal standards applicable to its consideration of each Sub-Advisory Agreement. Based on its review, including consideration of each of the factors referenced above, the Board determined, in the exercise of its reasonable business judgment, that the sub-advisory arrangements, as outlined in each Sub-Adviser’s Sub-Advisory Agreement, were fair and reasonable in light of the services performed or to be performed, expenses incurred or to be incurred, and such other matters as the Board considered relevant.
After full consideration of the above factors as well as other factors, the Board, including the Independent Trustees, unanimously approved the continuance of each of the Sub-Advisory Agreements with the respective Sub-Adviser on behalf of each Fund.
82
Supplemental Information (unaudited)
INFORMATION ABOUT PORTFOLIO HOLDINGS
The Funds file their complete schedule of portfolio holdings for their first and third fiscal quarters with the Securities and Exchange Commission (“SEC”) on Form N-Q (or any successor Form). The Funds Form N-Q (or any successor Form) are available without charge, upon request, by calling toll-free at (888) 383-4184. Furthermore, you may obtain the Form N-Q (or any successor Form) on the SEC’s website at www.sec.gov. The Funds’ portfolio holdings are posted daily on the Funds’ website at www.virtusetfs.com.
The Funds’ premium/discount information that is current as of the most recent month-end is available by visiting www.virtusetfs.com or by calling (888) 383-4184.
INFORMATION ABOUT PROXY VOTING
A description of the policies and procedures the Funds use to determine how to vote proxies relating to portfolio securities is provided in the Statement of Additional Information (“SAI”). The SAI is available without charge upon request by calling toll-free at (888) 383-4184, by accessing the SEC’s website at www.sec.gov, or by accessing the Funds’ website at www.virtusetfs.com.
Information regarding how the Funds voted proxies relating to portfolio securities during the most recent twelve-month period ended June 30th is available by calling toll-free at (888) 383-4184 or by accessing the SEC’s website at www.sec.gov.
83
c/o ETF Distributors LLC 1540 Broadway, Suite 1610 New York, NY 10036
8572(6/18)
Item 2. Code of Ethics.
Not applicable.
Item 3. Audit Committee Financial Expert.
Not applicable.
Item 4. Principal Accountant Fees and Services.
Not applicable.
Item 5. Audit Committee of Listed Registrants.
Not applicable.
Item 6. Investments.
(a)
Schedule of Investments in securities of unaffiliated issuers as of the close of the reporting period is included as part of the report to shareholders filed under Item 1 of this form.
(b)
Not applicable.
Item 7. Disclosure of Proxy Voting Policies and Procedures for Closed-End Management Investment Companies.
Not applicable.
Item 8. Portfolio Managers of Closed-End Management Investment Companies.
Not applicable.
Item 9. Purchases of Equity Securities by Closed-End Management Investment Company and Affiliated Purchasers.
Not applicable.
Item 10. Submission of Matters to a Vote of Security Holders.
The registrant does not have procedures in place to consider nominees recommended by shareholders. The registrant’s nominating committee generally will not consider nominees recommended by shareholders.
Item 11. Controls and Procedures.
(a)
The registrant’s principal executive and principal financial officers, or persons performing similar functions, have concluded that the registrant’s disclosure controls and procedures (as defined in Rule 30a-3(c) under the Investment Company Act of 1940, as amended (the “1940 Act”) (17 CFR 270.30a-3(c))) are effective, as of a date within 90 days of the filing date of the report that includes the disclosure required by this paragraph, based on their evaluation of these controls and procedures required by Rule 30a-3(b) under the 1940 Act (17 CFR 270.30a-3(b)) and Rules 13a-15(b) or 15d-15(b) under the Securities Exchange Act of 1934, as amended (17 CFR 240.13a-15(b) or 240.15d-15(b)).
(b)
There were no changes in the registrant’s internal control over financial reporting (as defined in Rule 30a-3(d) under the 1940 Act (17 CFR 270.30a-3(d))) that occurred during the registrant’s last fiscal quarter that has materially affected, or is reasonably likely to materially affect, the registrant’s internal control over financial reporting.
Item 12. Disclosure of Securities Lending Activities for Closed-End Management Investment Companies.
Not applicable.
Item 13. Exhibits.
(a)(1)
Not applicable.
(a)(2)
Certifications pursuant to Rule 30a-2(a) under the 1940 Act and Section 302 of the Sarbanes-Oxley Act of 2002 are attached hereto.
(a)(3) Not applicable.
(a)(4)
Not applicable.
(b)
Certifications pursuant to Rule 30a-2(b) under the 1940 Act and Section 906 of the Sarbanes-Oxley Act of 2002 are attached hereto.
SIGNATURES
Pursuant to the requirements of the Securities Exchange Act of 1934 and the Investment Company Act of 1940, the registrant has duly caused this report to be signed on its behalf by the undersigned, thereunto duly authorized.
(Registrant)
ETFis Series Trust I
By
(Signature and Title)*
/s/ William J. Smalley
William J. Smalley, President and Principal Executive Officer
(Principal Executive Officer)
Date
7/05/2018
Pursuant to the requirements of the Securities Exchange Act of 1934 and the Investment Company Act of 1940, this report has been signed below by the following persons on behalf of the registrant and in the capacities and on the dates indicated.
By
(Signature and Title)*
/s/ William J. Smalley
William J. Smalley, President and Principal Executive Officer
(Principal Executive Officer)
Date
7/05/2018
By
(Signature and Title)*
/s/ Brinton W. Frith
Brinton W. Frith, Treasurer and Principal Financial Officer
(Principal Financial Officer)
Date
7/05/2018
* Print the name and title of each signing officer under his or her signature.
We use cookies on this site to provide a more responsive and personalized service. Continuing to browse, clicking I Agree, or closing this banner indicates agreement. See our Cookie Policy for more information.