UNITED STATES
SECURITIES AND EXCHANGE COMMISSION
Washington, D.C. 20549
FORM N-CSR
CERTIFIED SHAREHOLDER REPORT OF REGISTERED MANAGEMENT INVESTMENT COMPANIES
Investment Company Act file number811-22819
ETFis Series Trust I
(Exact name of registrant as specified in charter)
1540 Broadway, 16th Floor
New York, NY 10036
(Address of principal executive offices) (Zip code)
ETFis Series Trust I
c/o Corporation Service Company
2711 Centerville Road, Suite 400
Wilmington, DE 19808
(Name and address of agent for service)
Registrant’s telephone number, including area code:(212) 593-4383
Date of fiscal year end:October 31
Date of reporting period:April 30, 2019
Form N-CSR is to be used by management investment companies to file reports with the Commission not later than 10 days after the transmission to stockholders of any report that is required to be transmitted to stockholders under Rule 30e-1 under the Investment Company Act of 1940 (17 CFR 270.30e-1). The Commission may use the information provided on Form N-CSR in its regulatory, disclosure review, inspection, and policymaking roles.
A registrant is required to disclose the information specified by Form N-CSR, and the Commission will make this information public. A registrant is not required to respond to the collection of information contained in Form N-CSR unless the Form displays a currently valid Office of Management and Budget ("OMB") control number. Please direct comments concerning the accuracy of the information collection burden estimate and any suggestions for reducing the burden to Secretary, Securities and Exchange Commission, 100 F Street, NE, Washington, DC 20549. The OMB has reviewed this collection of information under the clearance requirements of 44 U.S.C. § 3507.
Item 1. Reports to Stockholders.
The Report to Shareholders is attached herewith.

ETFis Series Trust I
INFRACAP REIT PREFERRED ETF
VIRTUS GLOVISTA EMERGING MARKETS ETF
VIRTUS INFRACAP U.S. PREFERRED STOCK ETF
VIRTUS LIFESCI BIOTECH CLINICAL TRIALS ETF
VIRTUS LIFESCI BIOTECH PRODUCTS ETF
VIRTUS NEWFLEET MULTI-SECTOR BOND ETF
VIRTUS PRIVATE CREDIT STRATEGY ETF
VIRTUS REAL ASSET INCOME ETF
VIRTUS WMC GLOBAL FACTOR OPPORTUNITIES ETF
INFRACAP MLP ETF
SEMI-ANNUAL REPORT
April 30, 2019
| | | | Page (s)
|
| | | | | 1 | |
| | | | | 2 | |
| | | | | 6 | |
InfraCap REIT Preferred ETF
| | | | | | |
Virtus Glovista Emerging Markets ETF
| | | | | | |
Virtus InfraCap U.S. Preferred Stock ETF
| | | | | | |
Virtus LifeSci Biotech Clinical Trials ETF
| | | | | | |
Virtus LifeSci Biotech Products ETF
| | | | | | |
Virtus Newfleet Multi-Sector Bond ETF
| | | | | | |
Virtus Private Credit Strategy ETF
| | | | | | |
Virtus Real Asset Income ETF
| | | | | | |
Virtus WMC Global Factor Opportunities ETF
| | | | | | |
| | | | | 7 | |
| | | | | 35 | |
| | | | | 37 | |
| | | | | 39 | |
| | | | | 44 | |
| | | | | 45 | |
| | | | | 54 | |
InfraCap MLP ETF
| | | | | | |
| | | | | 64 | |
| | | | | 67 | |
| | | | | 68 | |
| | | | | 69 | |
| | | | | 70 | |
| | | | | 71 | |
| | | | | 72 | |
| | | | | 79 | |
| | | | | 84 | |
Shareholder Letter(unaudited)
June 2019
Dear Shareholder:
On behalf of Virtus ETF Advisers LLC (the “Adviser”), I am pleased to present the shareholder report for the ETFis Series Trust I (the “Trust”) for the semiannual fiscal period ended April 30, 2019.
The Adviser is part of Virtus Investment Partners, a distinctive partnership of boutique investment managers singularly committed to the long-term success of individual and institutional investors.
The report provides financial statements and portfolio information for the following funds within the Trust:
• | | InfraCap REIT Preferred ETF (PFFR) |
• | | Virtus Glovista Emerging Markets ETF (EMEM) |
• | | Virtus InfraCap U.S. Preferred Stock ETF (PFFA) |
• | | Virtus LifeSci Biotech Clinical Trials ETF (BBC) |
• | | Virtus LifeSci Biotech Products ETF (BBP) |
• | | Virtus Newfleet Multi-Sector Bond ETF (NFLT) |
• | | Virtus Private Credit Strategy ETF (VPC) |
• | | Virtus Real Asset Income ETF (VRAI) |
• | | Virtus WMC Global Factor Opportunities ETF (VGFO) |
• | | InfraCap MLP ETF (AMZA) |
On behalf of the Adviser and our fund subadvisers, thank you for your investment. If you have questions, please contact your financial adviser, or call 1-888-383-0553. For more information about the fund and the other ETFs we offer, we invite you to visit our website, www.virtusetfs.com.
Sincerely,
William Smalley
President
ETFis Series Trust I
This material must be accompanied or preceded by the prospectus.
1
Portfolio Composition
April 30, 2019 (unaudited)
Asset Allocation as of 04/30/2019 (based on net assets)
| InfraCap REIT Preferred ETF | | |
| Real Estate | 69.0 | % |
| Financials | 29.3 | % |
| Other Assets in Excess of Liabilities | 1.7 | % |
| Total | 100.0 | % |
| | | |
| Virtus Glovista Emerging Markets ETF | | |
| Financials | 28.1 | % |
| Energy | 10.2 | % |
| Consumer Staples | 8.6 | % |
| Consumer Discretionary | 8.2 | % |
| Materials | 8.0 | % |
| Communication Services | 7.7 | % |
| Information Technology | 7.2 | % |
| Industrials | 6.5 | % |
| Utilities | 3.3 | % |
| Real Estate | 2.6 | % |
| Health Care | 1.7 | % |
| Equity Fund | 5.2 | % |
| Other Assets in Excess of Liabilities | 2.7 | % |
| Total | 100.0 | % |
| | | |
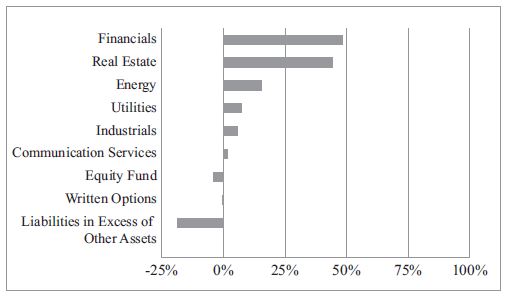
| Virtus InfraCap U.S. Preferred Stock ETF | | |
| Financials | 48.2 | %* |
| Real Estate | 44.4 | %* |
| Energy | 15.4 | % |
| Utilities | 7.4 | % |
| Industrials | 5.8 | % |
| Communication Services | 1.5 | % |
| Equity Fund | (3.9 | )% |
| Written Options | (0.2 | )% |
| Liabilities in Excess of Other Assets | (18.6 | )% |
| Total | 100.0 | % |
| | | |
* | | Amounts represent investments in particular sectors. No industry within these sectors represented more than 25% of the Fund’s total assets at the time of investment. |
2
Portfolio Composition(continued)
April 30, 2019 (unaudited)
Asset Allocation as of 04/30/2019 (based on net assets)
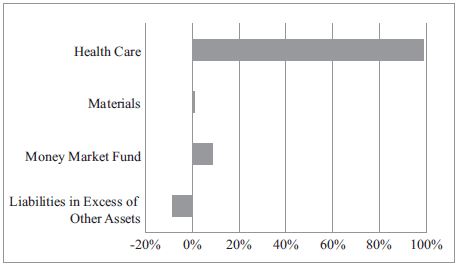
| Virtus LifeSci Biotech Clinical Trials ETF | | |
| Health Care | 98.7 | % |
| Materials | 1.1 | % |
| Money Market Fund | 8.8 | % |
| Liabilities in Excess of Other Assets | (8.6 | )% |
| Total | 100.0 | % |
| | | |
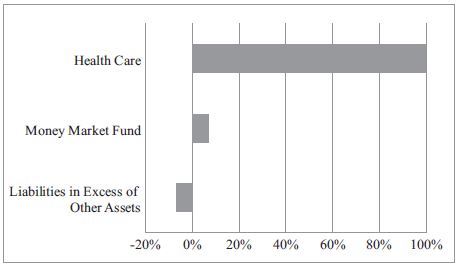
| Virtus LifeSci Biotech Products ETF | | |
| Health Care | 99.8 | % |
| Money Market Fund | 7.1 | % |
| Liabilities in Excess of Other Assets | (6.9 | )% |
| Total | 100.0 | % |
| | | |
| Virtus Newfleet Multi-Sector Bond ETF | | |
| Corporate Bonds | 13.1 | % |
| Term Loans | 11.0 | % |
| Foreign Bonds | 8.7 | % |
| U.S. Treasury Notes | 4.7 | % |
| Mortgage Backed Securities | 3.8 | % |
| Asset Backed Securities | 2.4 | % |
| Money Market Fund | 10.5 | % |
| Other Assets in Excess of Liabilities | 45.8 | %* |
| Total | 100.0 | % |
| | | |
| * | | Amounts represent receivables from unsettled trades and certain other assets, net of liabilities. |
3
Portfolio Composition(continued)
April 30, 2019 (unaudited)
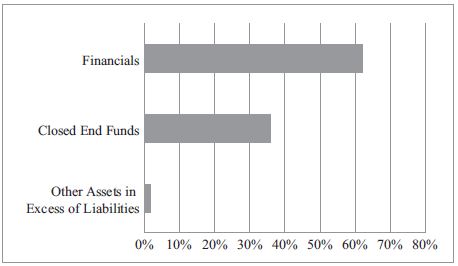
| Virtus Private Credit Strategy ETF | | |
| Financials | 62.2 | % |
| Closed End Funds | 36.0 | % |
| Other Assets in Excess of Liabilities | 1.8 | % |
| Total | 100.0 | % |
| | | |
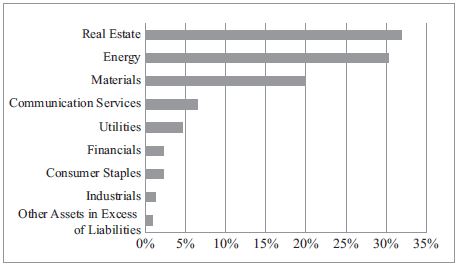
| Virtus Real Asset Income ETF | | |
| Real Estate | 31.9 | % |
| Energy | 30.3 | % |
| Materials | 19.9 | % |
| Communication Services | 6.5 | % |
| Utilities | 4.6 | % |
| Financials | 2.3 | % |
| Consumer Staples | 2.3 | % |
| Industrials | 1.3 | % |
| Other Assets in Excess of Liabilities | 0.9 | % |
| Total | 100.0 | % |
| | | |
Virtus WMC Global Factor Opportunities ETF
| | |
| Financials | 27.1 | % |
| Information Technology | 14.1 | % |
| Industrials | 10.1 | % |
| Consumer Discretionary | 9.7 | % |
| Consumer Staples | 9.1 | % |
| Health Care | 7.0 | % |
| Utilities | 5.1 | % |
| Communication Services | 4.9 | % |
| Real Estate | 4.3 | % |
| Energy | 3.8 | % |
| Materials | 3.6 | % |
| Other Assets in Excess of Liabilities | 1.2 | % |
| Total | 100.0 | % |
| | | |
| * | | Amounts represent investments in particular sectors. No industry within these sectors represented more than 25% of the Fund’s total assets at the time of investment. |
4
Portfolio Composition(continued)
April 30, 2019 (unaudited)
| InfraCap MLP ETF | | |
| Energy | 125.4 | % |
| Purchased Options | 0.0 | %* |
| Written Options | (0.4 | )% |
| Liabilities in Excess of Other Assets | (25.0 | )% |
| Total | 100.0 | % |
| | | |
| * | | Amount rounds to less than 0.05%. |
5
Shareholder Expense Examples(unaudited)
We believe it is important for you to understand the impact of costs on your investment. All funds have operating expenses. As a shareholder of the ETFis Series Trust I Funds (each, a “Fund”) you may incur two types of costs: (1) transaction costs, which include brokerage commissions that you pay when purchasing or selling shares of a Fund; and (2) ongoing costs, which include advisory fees and other fund expenses, if any. The following example is intended to help you understand your ongoing costs (in dollars and cents) of investing in a Fund and to compare these costs with the ongoing costs of investing in other funds. The examples are based on an investment of $1,000 invested at the beginning of the period and held throughout the entire period (November 1, 2018 to April 30, 2019), except as noted in footnotes below.
Actual expenses
The first line under each Fund in the table below provides information about actual account values and actual expenses. You may use the information in this line, together with the amount you invested, to estimate the expenses that you paid over the period. Simply divide your account value by $1,000 (for example, an $8,600 account value divided by $1,000 = 8.6), then multiply the result by the number in the first line for your Fund under the heading entitled “Expenses Paid During Period” to estimate the expenses you paid on your account during this period.
Hypothetical example for comparison purposes
The second line under each Fund in the table provides information about hypothetical account values and hypothetical expenses based on each Fund’s actual expense ratio and an assumed rate of return of 5% per year before expenses, which is not each Fund’s actual return. The hypothetical account values and expenses may not be used to estimate the actual ending account balance or expenses you paid for the period. You may use this information to compare the ongoing costs of investing in each Fund and other funds. To do so, compare this 5% hypothetical example with the 5% hypothetical examples that appear in the shareholder reports of the other funds. Please note that the expenses shown in the table are meant to highlight your ongoing costs only and do not reflect any transactional costs, such as brokerage commissions paid on purchases and sales of Fund shares. Therefore, the second line under each Fund in the table is useful in comparing ongoing Fund costs only and will not help you determine the relative total costs of owning different funds.
In addition, if these transactional costs were included, your costs would have been higher.
| | | | Beginning
Account Value
11/01/18
| | Ending
Account
Value 4/30/19
| | Annualized
Expense Ratios(2)
| | Expenses Paid
During the
Period
|
InfraCap REIT Preferred ETF | | | | | | | | | | | | | | | | | | |
Actual | | | | $ | 1000.00 | | | $ | 1,065.50 | | | | 0.45 | % | | $ | 2.30(3) | |
Hypothetical(1) | | | | $ | 1000.00 | | | $ | 1,022.56 | | | | 0.45 | % | | $ | 2.26(4) | |
Virtus Glovista Emerging Markets ETF | | | | | | | | | | | | | | | | | | |
Actual | | | | $ | 1000.00 | | | $ | 1,105.50 | | | | 0.65 | % | | $ | 3.39(3) | |
Hypothetical(1) | | | | $ | 1000.00 | | | $ | 1,021.57 | | | | 0.65 | % | | $ | 3.26(4) | |
Virtus InfraCap U.S. Preferred Stock ETF | | | | | | | | | | | | | | | | | | |
Actual | | | | $ | 1000.00 | | | $ | 1,086.20 | | | | 0.80 | % | | $ | 4.14(3) | |
Hypothetical(1) | | | | $ | 1000.00 | | | $ | 1,020.83 | | | | 0.80 | % | | $ | 4.01(4) | |
Virtus LifeSci Biotech Clinical Trials ETF | | | | | | | | | | | | | | | | | | |
Actual | | | | $ | 1000.00 | | | $ | 1,034.80 | | | | 0.79 | % | | $ | 3.99(3) | |
Hypothetical(1) | | | | $ | 1000.00 | | | $ | 1,020.88 | | | | 0.79 | % | | $ | 3.96(4) | |
Virtus LifeSci Biotech Products ETF | | | | | | | | | | | | | | | | | | |
Actual | | | | $ | 1000.00 | | | $ | 1,153.00 | | | | 0.79 | % | | $ | 4.22(3) | |
Hypothetical(1) | | | | $ | 1000.00 | | | $ | 1,020.88 | | | | 0.79 | % | | $ | 3.96(4) | |
Virtus Newfleet Multi-Sector Bond ETF | | | | | | | | | | | | | | | | | | |
Actual | | | | $ | 1000.00 | | | $ | 1,042.30 | | | | 0.80 | % | | $ | 4.05(3) | |
Hypothetical(1) | | | | $ | 1000.00 | | | $ | 1,020.83 | | | | 0.80 | % | | $ | 4.01(4) | |
Virtus Private Credit Strategy ETF | | | | | | | | | | | | | | | | | | |
Actual | | | | $ | 1000.00 | | | $ | 1,051.40 | | | | 0.75 | % | | $ | 1.73(5) | |
Hypothetical(1) | | | | $ | 1000.00 | | | $ | 1,009.55 | | | | 0.75 | % | | $ | 3.74(4) | |
Virtus Real Asset Income ETF | | | | | | | | | | | | | | | | | | |
Actual | | | | $ | 1000.00 | | | $ | 1,030.90 | | | | 0.55 | % | | $ | 1.25(5) | |
Hypothetical(1) | | | | $ | 1000.00 | | | $ | 1,010.00 | | | | 0.55 | % | | $ | 2.74(4) | |
Virtus WMC Global Factor Opportunities ETF | | | | | | | | | | | | | | | | | | |
Actual | | | | $ | 1000.00 | | | $ | 1,089.90 | | | | 0.49 | % | | $ | 2.54(3) | |
Hypothetical(1) | | | | $ | 1000.00 | | | $ | 1,022.36 | | | | 0.49 | % | | $ | 2.46(4) | |
InfraCap MLP ETF | | | | | | | | | | | | | | | | | | |
Actual | | | | $ | 1000.00 | | | $ | 993.20 | | | | 0.95 | % | | $ | 4.69(3) | |
Hypothetical(1) | | | | $ | 1000.00 | | | $ | 1,020.08 | | | | 0.95 | % | | $ | 4.76(4) | |
| 1 | | Assuming 5% return before expenses. |
| 2 | | Annualized expense ratios reflect expenses net of waived fees or reimbursed expenses, if applicable. |
| 3 | | Expenses are calculated using each Fund’s annualized expense ratio, multiplied by the average account value for the period, multiplied by 181/365 (to reflect the six-month period). |
| 4 | | Hypothetical expenses are calculated using the Fund’s annualized expense ratio, multiplied by the average account value for the period, multiplied by 181/365 (to reflect the six-month period). |
| 5 | | Actual expenses are calculated using the Fund’s annualized expense ratio, multiplied by the average account value for the period, multiplied by 82/365 (to reflect the period February 8, 2019 to April 30, 2019). |
6
Schedule of Investments — InfraCap REIT Preferred ETF
April 30, 2019 (unaudited)
Security Description
| | | | Shares
| | Value
|
PREFERRED STOCKS — 98.3% | | | | | | | | | | |
| | | | | | | | | | | |
Financials — 29.3% | | | | | | | | | | |
AGNC Investment Corp., Series C, 7.00% | | | | | 15,096 | | | $ | 390,987 | |
Annaly Capital Management, Inc.,
Series F, 6.95% | | | | | 33,444 | | | | 857,504 | |
Annaly Capital Management, Inc.,
Series G, 6.50% | | | | | 19,741 | | | | 486,221 | |
Apollo Global Management LLC,
Series B, 6.38% | | | | | 13,935 | | | | 350,326 | |
Arch Capital Group Ltd., Series F, 5.45% | | | | | 15,328 | | | | 374,923 | |
ARMOUR Residential REIT, Inc.,
Series B, 7.88% | | | | | 7,396 | | | | 185,862 | |
Capstead Mortgage Corp., Series E, 7.50% | | | | | 11,994 | | | | 303,088 | |
Chimera Investment Corp., Series A, 8.00% | | | | | 6,735 | | | | 172,281 | |
Chimera Investment Corp., Series B, 8.00% | | | | | 15,096 | | | | 385,552 | |
Chimera Investment Corp., Series C, 7.75% | | | | | 12,077 | | | | 307,601 | |
Invesco Mortgage Capital, Inc., Series B, 7.75% | | | | | 7,200 | | | | 191,160 | |
Invesco Mortgage Capital, Inc., Series C, 7.50% | | | | | 13,354 | | | | 338,658 | |
KKR & Co., Inc., Series A, 6.75% | | | | | 16,025 | | | | 424,502 | |
KKR & Co., Inc., Series B, 6.50% | | | | | 7,200 | | | | 189,792 | |
MFA Financial, Inc., Series B, 7.50% | | | | | 9,290 | | | | 236,152 | |
New York Mortgage Trust, Inc.,
Series D, 8.00% | | | | | 6,677 | | | | 161,450 | |
PennyMac Mortgage Investment Trust,
Series A, 8.13% | | | | | 5,342 | | | | 137,129 | |
PennyMac Mortgage Investment Trust,
Series B, 8.00% | | | | | 9,058 | | | | 232,428 | |
Two Harbors Investment Corp., Series A, 8.13% | | | | | 6,677 | | | | 178,410 | |
Two Harbors Investment Corp., Series B, 7.63% | | | | | 13,354 | | | | 334,918 | |
Two Harbors Investment Corp., Series C, 7.25% | | | | | 13,703 | | | | 338,738 | |
Two Harbors Investment Corp., Series E, 7.50% | | | | | 9,290 | | | | 226,304 | |
Total Financials | | | | | | | | | 6,803,986 | |
| | | | | | | | | | | |
Real Estate — 69.0% | | | | | | | | | | |
American Homes 4 Rent, Series D, 6.50% | | | | | 12,483 | | | | 330,175 | |
American Homes 4 Rent, Series E, 6.35% | | | | | 10,683 | | | | 282,031 | |
American Homes 4 Rent, Series F, 5.88% | | | | | 7,200 | | | | 178,920 | |
American Homes 4 Rent, Series G, 5.88% | | | | | 5,342 | | | | 133,283 | |
American Homes 4 Rent, Series H, 6.25% | | | | | 5,342 | | | | 136,542 | |
Ashford Hospitality Trust, Inc., Series F, 7.38% | | | | | 5,574 | | | | 130,933 | |
Ashford Hospitality Trust, Inc., Series G, 7.38% | | | | | 7,200 | | | | 164,808 | |
Ashford Hospitality Trust, Inc., Series H, 7.50% | | | | | 4,413 | | | | 102,426 | |
Ashford Hospitality Trust, Inc., Series I, 7.50% | | | | | 6,271 | | | | 146,365 | |
Bluerock Residential Growth REIT, Inc.,
Series A, 8.25% | | | | | 6,643 | | | | 176,039 | |
Boston Properties, Inc., Series B, 5.25% | | | | | 9,290 | | | | 235,409 | |
Brookfield Property REIT, Inc.,
Series A, 6.38% | | | | | 11,612 | | | | 293,667 | |
Cedar Realty Trust, Inc., Series C, 6.50% | | | | | 5,806 | | | | 129,880 | |
City Office REIT, Inc., Series A, 6.63% | | | | | 5,202 | | | | 128,749 | |
Colony Capital, Inc., Series B, 8.25% | | | | | 7,100 | | | | 178,281 | |
Colony Capital, Inc., Series E, 8.75% | | | | | 11,612 | | | | 290,648 | |
Colony Capital, Inc., Series H, 7.13% | | | | | 13,354 | | | | 269,217 | |
Colony Capital, Inc., Series I, 7.15% | | | | | 16,025 | | | | 326,910 | |
Colony Capital, Inc., Series J, 7.13% | | | | | 14,690 | | | | 297,766 | |
Digital Realty Trust, Inc., Series C, 6.63% | | | | | 9,348 | | | | 249,779 | |
Digital Realty Trust, Inc., Series G, 5.88% | | | | | 11,612 | | | | 292,622 | |
Digital Realty Trust, Inc., Series I, 6.35% | | | | | 11,612 | | | | 301,099 | |
Digital Realty Trust, Inc., Series J, 5.25% | | | | | 9,290 | | | | 228,998 | |
EPR Properties, Series G, 5.75% | | | | | 6,967 | | | | 171,110 | |
Farmland Partners, Inc., Series B, 6.00% | | | | | 6,964 | | | | 165,604 | |
| | | | | | | | | | | |
Security Description
| | | | Shares
| | Value
|
PREFERRED STOCKS (continued) | | | | | | | | | | |
| | | | | | | | | | | |
Real Estate (continued) | | | | | | | | | | |
Federal Realty Investment Trust,
Series C, 5.00% | | | | | 6,967 | | | $ | 167,765 | |
Global Net Lease, Inc., Series A, 7.25% | | | | | 6,290 | | | | 161,024 | |
Hersha Hospitality Trust, Series D, 6.50% | | | | | 8,944 | | | | 210,184 | |
Hersha Hospitality Trust, Series E, 6.50% | | | | | 4,647 | | | | 109,669 | |
Investors Real Estate Trust, Series C, 6.63% | | | | | 4,782 | | | | 119,550 | |
iStar, Inc., Series I, 7.50% | | | | | 5,806 | | | | 147,240 | |
Kimco Realty Corp., Series I, 6.00% | | | | | 18,580 | | | | 469,888 | |
Kimco Realty Corp., Series J, 5.50% | | | | | 10,451 | | | | 256,781 | |
Kimco Realty Corp., Series K, 5.63% | | | | | 8,129 | | | | 202,412 | |
Kimco Realty Corp., Series L, 5.13% | | | | | 10,451 | | | | 244,031 | |
Kimco Realty Corp., Series M, 5.25% | | | | | 12,286 | | | | 285,158 | |
Monmouth Real Estate Investment Corp.,
Series C, 6.13% | | | | | 13,391 | | | | 324,330 | |
National Retail Properties, Inc., Series E, 5.70% | | | | | 13,354 | | | | 331,179 | |
National Retail Properties, Inc., Series F, 5.20% | | | | | 16,025 | | | | 384,760 | |
National Storage Affiliates Trust, Series A, 6.00% | | | | | 8,013 | | | | 203,290 | |
Pebblebrook Hotel Trust, Series D, 6.38% | | | | | 5,806 | | | | 150,027 | |
Pennsylvania Real Estate Investment Trust,
Series C, 7.20% | | | | | 8,013 | | | | 174,283 | |
Pennsylvania Real Estate Investment Trust,
Series D, 6.88% | | | | | 5,806 | | | | 124,829 | |
PS Business Parks, Inc., Series U, 5.75% | | | | | 10,683 | | | | 271,776 | |
PS Business Parks, Inc., Series V, 5.70% | | | | | 5,109 | | | | 130,279 | |
PS Business Parks, Inc., Series W, 5.20% | | | | | 8,814 | | | | 213,739 | |
PS Business Parks, Inc., Series X, 5.25% | | | | | 10,683 | | | | 263,870 | |
PS Business Parks, Inc., Series Y, 5.20% | | | | | 9,290 | | | | 224,075 | |
Public Storage, Series A, 5.88% | | | | | 5,121 | | | | 130,278 | |
Public Storage, Series B, 5.40% | | | | | 8,085 | | | | 204,551 | |
Public Storage, Series C, 5.13% | | | | | 5,390 | | | | 132,864 | |
Public Storage, Series D, 4.95% | | | | | 8,759 | | | | 213,019 | |
Public Storage, Series E, 4.90% | | | | | 9,433 | | | | 224,411 | |
Public Storage, Series F, 5.15% | | | | | 7,546 | | | | 186,160 | |
Public Storage, Series G, 5.05% | | | | | 8,085 | | | | 200,751 | |
Public Storage, Series U, 5.63% | | | | | 7,749 | | | | 194,965 | |
Public Storage, Series V, 5.38% | | | | | 13,341 | | | | 331,124 | |
Public Storage, Series W, 5.20% | | | | | 13,476 | | | | 333,127 | |
Public Storage, Series X, 5.20% | | | | | 6,064 | | | | 151,600 | |
QTS Realty Trust, Inc., Series A, 7.13% | | | | | 4,970 | | | | 129,071 | |
Senior Housing Properties Trust, 5.63% | | | | | 16,257 | | | | 349,526 | |
Senior Housing Properties Trust, 6.25% | | | | | 11,612 | | | | 287,165 | |
SITE Centers Corp., Series A, 6.38% | | | | | 8,129 | | | | 207,046 | |
SITE Centers Corp., Series K, 6.25% | | | | | 6,967 | | | | 178,355 | |
Spirit Realty Capital, Inc., Series A, 6.00% | | | | | 8,013 | | | | 194,956 | |
Summit Hotel Properties, Inc., Series E, 6.25% | | | | | 7,432 | | | | 176,436 | |
Taubman Centers, Inc., Series J, 6.50% | | | | | 8,942 | | | | 229,183 | |
UMH Properties, Inc., Series C, 6.75% | | | | | 6,677 | | | | 167,192 | |
Urstadt Biddle Properties, Inc., Series H, 6.25% | | | | | 5,342 | | | | 139,426 | |
Vornado Realty Trust, Series K, 5.70% | | | | | 13,935 | | | | 351,998 | |
Vornado Realty Trust, Series L, 5.40% | | | | | 13,935 | | | | 344,055 | |
Vornado Realty Trust, Series M, 5.25% | | | | | 14,841 | | | | 350,990 | |
Washington Prime Group, Inc., Series H, 7.50% | | | | | 4,645 | | | | 99,868 | |
Total Real Estate | | | | | | | | | 16,019,517 | |
TOTAL INVESTMENTS — 98.3% | | | | | | | | | | |
(Cost $22,836,648) | | | | | | | | | 22,823,503 | |
Other Assets in Excess of Liabilities — 1.7% | | | | | | | | | 402,800 | |
Net Assets — 100.0% | | | | | | | | $ | 23,226,303 | |
The accompanying notes are an integral part of these financial statements.
7
Schedule of Investments — InfraCap REIT Preferred ETF(continued)
April 30, 2019 (unaudited)
The following table summarizes valuation of the Fund’s investments under the fair value hierarchy levels as of April 30, 2019 (See Note 2 in the Notes to Financial Statements):
| | | | Level 1
| | Level 2
| | Level 3
| | Total
|
Asset Valuation Inputs | | | | | | | | | | | | | | | | | | |
Preferred Stocks | | | | $ | 22,823,503 | | | $ | — | | | $ | — | | | $ | 22,823,503 | |
Total | | | | $ | 22,823,503 | | | $ | — | | | $ | — | | | $ | 22,823,503 | |
The accompanying notes are an integral part of these financial statements.
8
Schedule of Investments — Virtus Glovista Emerging Markets ETF
April 30, 2019 (unaudited)
Security Description
| | | | Shares
| | Value
|
Common Stocks — 91.3% | | | | | | | | | | |
| | | | | | | | | | | |
Brazil — 5.4% | | | | | | | | | | |
Ambev SA(1) | | | | | 6,492 | | | $ | 30,577 | |
Atacadao SA | | | | | 859 | | | | 4,644 | |
B3 SA — Brasil Bolsa Balcao | | | | | 3,011 | | | | 26,454 | |
Banco Bradesco SA(1) | | | | | 6,135 | | | | 55,583 | |
Banco do Brasil SA | | | | | 1,710 | | | | 21,666 | |
Banco Santander Brasil SA | | | | | 5,131 | | | | 58,898 | |
BB Seguridade Participacoes SA | | | | | 1,001 | | | | 7,214 | |
BR Malls Participacoes SA | | | | | 1,321 | | | | 4,144 | |
BRF SA* | | | | | 1,181 | | | | 9,352 | |
CCR SA | | | | | 1,778 | | | | 5,301 | |
Cia de Saneamento Basico do Estado
de Sao Paulo | | | | | 461 | | | | 5,526 | |
Cielo SA | | | | | 1,821 | | | | 3,567 | |
Cosan SA | | | | | 232 | | | | 2,773 | |
Embraer SA(1) | | | | | 264 | | | | 5,283 | |
Engie Brasil Energia SA | | | | | 383 | | | | 4,346 | |
Equatorial Energia SA* | | | | | 307 | | | | 6,428 | |
Estacio Participacoes SA | | | | | 396 | | | | 2,745 | |
Gerdau SA(1) | | | | | 1,629 | | | | 5,832 | |
Hapvida Participacoes e Investimentos SA(2) | | | | | 1,021 | | | | 7,879 | |
Hypera SA | | | | | 499 | | | | 3,573 | |
IRB Brasil Resseguros SA | | | | | 305 | | | | 7,304 | |
Itau Unibanco Holding SA(1) | | | | | 7,246 | | | | 62,678 | |
Kroton Educacional SA | | | | | 2,392 | | | | 5,948 | |
Localiza Rent a Car SA | | | | | 814 | | | | 7,515 | |
Lojas Renner SA | | | | | 1,029 | | | | 12,303 | |
Magazine Luiza SA | | | | | 100 | | | | 4,878 | |
Multiplan Empreendimentos Imobiliarios SA | | | | | 592 | | | | 3,617 | |
Natura Cosmeticos SA | | | | | 223 | | | | 2,971 | |
Notre Dame Intermedica Participacoes SA | | | | | 801 | | | | 7,174 | |
Petrobras Distribuidora SA | | | | | 540 | | | | 3,264 | |
Petroleo Brasileiro SA(1) | | | | | 3,635 | | | | 50,163 | |
Raia Drogasil SA | | | | | 338 | | | | 5,960 | |
Rumo SA* | | | | | 1,586 | | | | 7,321 | |
Sul America SA | | | | | 618 | | | | 4,917 | |
Suzano SA | | | | | 837 | | | | 8,694 | |
TIM Participacoes SA | | | | | 1,276 | | | | 3,804 | |
Transmissora Alianca de Energia Eletrica SA | | | | | 526 | | | | 3,521 | |
Ultrapar Participacoes SA | | | | | 1,258 | | | | 6,737 | |
Vale SA(1) | | | | | 4,766 | | | | 60,910 | |
WEG SA | | | | | 1,182 | | | | 5,601 | |
Total Brazil | | | | | | | | | 547,065 | |
| | | | | | | | | | | |
Chile — 6.3% | | | | | | | | | | |
Aguas Andinas SA Class A | | | | | 25,971 | | | | 14,954 | |
Banco de Chile | | | | | 257,960 | | | | 37,847 | |
Banco de Credito e Inversiones SA | | | | | 427 | | | | 28,431 | |
Banco Santander Chile | | | | | 623,628 | | | | 43,828 | |
Cencosud SA | | | | | 14,198 | | | | 26,937 | |
Cia Cervecerias Unidas SA | | | | | 1,535 | | | | 21,213 | |
Colbun SA | | | | | 96,568 | | | | 21,586 | |
Empresa Nacional de Telecomunicaciones SA | | | | | 1,358 | | | | 14,221 | |
Empresas CMPC SA | | | | | 16,218 | | | | 54,590 | |
Empresas COPEC SA | | | | | 4,034 | | | | 50,626 | |
Enel Americas SA | | | | | 250,793 | | | | 44,008 | |
Enel Chile SA | | | | | 267,724 | | | | 26,978 | |
Engie Energia Chile SA | | | | | 5,030 | | | | 9,647 | |
Itau CorpBanca | | | | | 1,435,662 | | | | 12,824 | |
Latam Airlines Group SA | | | | | 3,068 | | | | 30,426 | |
| | | | | | | | | | | |
Security Description
| | | | Shares
| | Value
|
Common Stocks (continued) | | | | | | | | | | |
| | | | | | | | | | | |
Chile (continued) | | | | | | | | | | |
Parque Arauco SA* | | | | | 6,128 | | | $ | 16,919 | |
Quinenco SA | | | | | 2,845 | | | | 7,666 | |
SACI Falabella | | | | | 10,347 | | | | 76,383 | |
Sociedad Matriz del Banco de Chile SA Class B | | | | | 110,527 | | | | 54,180 | |
Sociedad Quimica y Minera de Chile SA(1) | | | | | 1,040 | | | | 37,066 | |
Vina Concha y Toro SA | | | | | 4,449 | | | | 9,367 | |
Total Chile | | | | | | | | | 639,697 | |
| | | | | | | | | | | |
China — 6.9% | | | | | | | | | | |
51job, Inc.*(1) | | | | | 30 | | | | 2,770 | |
AAC Technologies Holdings, Inc. | | | | | 391 | | | | 2,527 | |
Agricultural Bank of China Ltd. Class H | | | | | 16,065 | | | | 7,413 | |
Alibaba Group Holding Ltd.*(1) | | | | | 394 | | | | 73,115 | |
Anhui Conch Cement Co. Ltd. Class H | | | | | 611 | | | | 3,727 | |
ANTA Sports Products Ltd. | | | | | 402 | | | | 2,834 | |
Autohome, Inc.*(1) | | | | | 59 | | | | 6,814 | |
Baidu, Inc.*(1) | | | | | 138 | | | | 22,940 | |
Bank of China Ltd. Class H | | | | | 43,432 | | | | 20,706 | |
Bank of Communications Co. Ltd. Class H | | | | | 8,390 | | | | 7,069 | |
Bilibili, Inc.*(1) | | | | | 113 | | | | 2,011 | |
BYD Co. Ltd. Class H | | | | | 380 | | | | 2,587 | |
China CITIC Bank Corp. Ltd. Class H | | | | | 4,752 | | | | 3,047 | |
China Conch Venture Holdings Ltd. | | | | | 658 | | | | 2,223 | |
China Construction Bank Corp. Class H | | | | | 124,118 | | | | 109,644 | |
China Evergrande Group | | | | | 710 | | | | 2,276 | |
China Life Insurance Co. Ltd. Class H | | | | | 3,898 | | | | 11,031 | |
China Merchants Bank Co. Ltd. Class H | | | | | 2,035 | | | | 10,078 | |
China Pacific Insurance Group Co. Ltd. Class H | | | | | 1,473 | | | | 6,037 | |
China Petroleum & Chemical Corp. Class H | | | | | 13,534 | | | | 10,403 | |
China Shenhua Energy Co. Ltd. Class H | | | | | 1,782 | | | | 3,939 | |
China Telecom Corp. Ltd. Class H | | | | | 7,271 | | | | 3,763 | |
China Tower Corp. Ltd. Class H(2) | | | | | 25,984 | | | | 7,022 | |
China Vanke Co. Ltd. Class H | | | | | 508 | | | | 1,965 | |
CITIC Securities Co. Ltd. Class H | | | | | 953 | | | | 2,060 | |
Country Garden Holdings Co. Ltd. | | | | | 3,763 | | | | 6,063 | |
Ctrip.com International Ltd.*(1) | | | | | 146 | | | | 6,431 | |
ENN Energy Holdings Ltd. | | | | | 401 | | | | 3,788 | |
Hengan International Group Co. Ltd. | | | | | 277 | | | | 2,442 | |
Huazhu Group Ltd.(1) | | | | | 525 | | | �� | 22,260 | |
Industrial & Commercial Bank of China Ltd. Class H | | | | | 45,218 | | | | 33,950 | |
iQIYI, Inc.*(1) | | | | | 173 | | | | 3,825 | |
JD.com, Inc.*(1) | | | | | 621 | | | | 18,798 | |
Longfor Group Holdings Ltd. | | | | | 799 | | | | 2,943 | |
Meituan Dianping Class B* | | | | | 2,038 | | | | 14,808 | |
Momo, Inc.(1) | | | | | 67 | | | | 2,350 | |
NetEase, Inc.(1) | | | | | 65 | | | | 18,494 | |
New China Life Insurance Co. Ltd. Class H | | | | | 492 | | | | 2,725 | |
New Oriental Education & Technology
Group, Inc.*(1) | | | | | 61 | | | | 5,823 | |
PetroChina Co. Ltd. Class H | | | | | 10,982 | | | | 6,972 | |
PICC Property & Casualty Co. Ltd. Class H | | | | | 1,925 | | | | 2,162 | |
Ping An Insurance Group Co. of China Ltd.
Class H | | | | | 2,871 | | | | 34,566 | |
Postal Savings Bank of China Co. Ltd.
Class H(2) | | | | | 4,141 | | | | 2,518 | |
Sunac China Holdings Ltd. | | | | | 1,191 | | | | 6,141 | |
Sunny Optical Technology Group Co. Ltd. | | | | | 366 | | | | 4,463 | |
TAL Education Group*(1) | | | | | 89 | | | | 3,424 | |
The accompanying notes are an integral part of these financial statements.
9
Schedule of Investments — Virtus Glovista Emerging Markets ETF(continued)
April 30, 2019 (unaudited)
Security Description
| | | | Shares
| | Value
|
Common Stocks (continued) | | | | | | | | | | |
| | | | | | | | | | | |
China (continued) | | | | | | | | | | |
| | | | | | | | | | | |
Tencent Holdings Ltd. | | | | | 3,000 | | | $ | 148,379 | |
Wuxi Biologics Cayman, Inc.*(2) | | | | | 294 | | | | 2,957 | |
Xiaomi Corp. Class B*(2) | | | | | 4,038 | | | | 6,187 | |
Yum China Holdings, Inc. | | | | | 196 | | | | 9,318 | |
Total China | | | | | | | | | 699,788 | |
| | | | | | | | | | | |
India — 1.7% | | | | | | | | | | |
Axis Bank Ltd.*(3) | | | | | 165 | | | | 8,976 | |
Dr Reddy’s Laboratories Ltd.(1) | | | | | 47 | | | | 1,969 | |
Dr Reddy’s Laboratories Ltd.(1) | | | | | 5 | | | | 209 | |
HDFC Bank Ltd.(1) | | | | | 606 | | | | 69,478 | |
ICICI Bank Ltd.(1) | | | | | 3,280 | | | | 37,556 | |
Infosys Ltd.(1) | | | | | 151 | | | | 1,625 | |
Larsen & Toubro Ltd.(3) | | | | | 1,130 | | | | 21,741 | |
Mahindra & Mahindra Ltd.(3) | | | | | 368 | | | | 3,367 | |
Reliance Industries Ltd.(2)(3) | | | | | 378 | | | | 15,139 | |
State Bank of India*(3) | | | | | 207 | | | | 9,253 | |
Tata Motors Ltd.*(1) | | | | | 365 | | | | 5,621 | |
Vedanta Ltd.(1) | | | | | 84 | | | | 803 | |
Total India | | | | | | | | | 175,737 | |
| | | | | | | | | | | |
Indonesia — 5.6% | | | | | | | | | | |
Ace Hardware Indonesia Tbk PT | | | | | 24,148 | | | | 2,796 | |
Adaro Energy Tbk PT | | | | | 52,468 | | | | 4,805 | |
Astra International Tbk PT | | | | | 86,625 | | | | 46,352 | |
Bank Central Asia Tbk PT | | | | | 43,851 | | | | 88,471 | |
Bank Danamon Indonesia Tbk PT | | | | | 5,612 | | | | 3,485 | |
Bank Mandiri Persero Tbk PT* | | | | | 78,600 | | | | 42,609 | |
Bank Negara Indonesia Persero Tbk PT* | | | | | 31,585 | | | | 21,278 | |
Bank Rakyat Indonesia Persero Tbk PT* | | | | | 527,153 | | | | 161,660 | |
Bank Tabungan Negara Persero Tbk PT* | | | | | 18,307 | | | | 3,250 | |
Barito Pacific Tbk PT | | | | | 18,766 | | | | 5,307 | |
Bumi Serpong Damai Tbk PT* | | | | | 27,685 | | | | 2,788 | |
Charoen Pokphand Indonesia Tbk PT | | | | | 36,538 | | | | 13,526 | |
Ciputra Development Tbk PT | | | | | 44,825 | | | | 3,555 | |
Gudang Garam Tbk PT | | | | | 1,661 | | | | 9,847 | |
Hanjaya Mandala Sampoerna Tbk PT | | | | | 31,217 | | | | 7,667 | |
Indah Kiat Pulp & Paper Corp Tbk PT | | | | | 9,694 | | | | 5,034 | |
Indocement Tunggal Prakarsa Tbk PT | | | | | 6,171 | | | | 9,527 | |
Indofood CBP Sukses Makmur Tbk PT | | | | | 8,996 | | | | 6,139 | |
Indofood Sukses Makmur Tbk PT | | | | | 17,558 | | | | 8,563 | |
Jasa Marga Persero Tbk PT* | | | | | 29,657 | | | | 12,695 | |
Kalbe Farma Tbk PT | | | | | 70,630 | | | | 7,658 | |
Pabrik Kertas Tjiwi Kimia Tbk PT | | | | | 4,507 | | | | 3,187 | |
Pakuwon Jati Tbk PT | | | | | 66,124 | | | | 3,318 | |
Perusahaan Gas Negara Persero Tbk | | | | | 37,281 | | | | 6,070 | |
Sarana Menara Nusantara Tbk PT | | | | | 92,735 | | | | 5,044 | |
Semen Indonesia Persero Tbk PT | | | | | 10,177 | | | | 9,641 | |
Telekomunikasi Indonesia Persero Tbk PT | | | | | 193,575 | | | | 51,484 | |
Unilever Indonesia Tbk PT | | | | | 5,346 | | | | 17,070 | |
United Tractors Tbk PT | | | | | 5,544 | | | | 10,573 | |
Total Indonesia | | | | | | | | | 573,399 | |
| | | | | | | | | | | |
Malaysia — 5.5% | | | | | | | | | | |
AirAsia Group Bhd | | | | | 8,215 | | | | 5,424 | |
Alliance Bank Malaysia Bhd | | | | | 5,041 | | | | 4,950 | |
AMMB Holdings Bhd | | | | | 5,354 | | | | 5,788 | |
Axiata Group Bhd | | | | | 31,873 | | | | 30,605 | |
British American Tobacco Malaysia Bhd | | | | | 522 | | | | 4,401 | |
| | | | | | | | | | | |
Security Description
| | | | Shares
| | Value
|
Common Stocks (continued) | | | | | | | | | | |
| | | | | | | | | | | |
Malaysia (continued) | | | | | | | | | | |
Bursa Malaysia Bhd | | | | | 2,045 | | | $ | 3,339 | |
Carlsberg Brewery Malaysia Bhd | | | | | 586 | | | | 3,580 | |
CIMB Group Holdings Bhd | | | | | 38,758 | | | | 49,402 | |
Dialog Group Bhd | | | | | 19,813 | | | | 15,431 | |
DiGi.Com Bhd | | | | | 10,384 | | | | 11,553 | |
Fraser & Neave Holdings Bhd | | | | | 396 | | | | 3,343 | |
Gamuda Bhd | | | | | 6,395 | | | | 5,414 | |
Genting Bhd | | | | | 11,256 | | | | 19,166 | |
Genting Malaysia Bhd | | | | | 12,338 | | | | 9,490 | |
HAP Seng Consolidated Bhd | | | | | 1,615 | | | | 3,859 | |
Hartalega Holdings Bhd | | | | | 4,670 | | | | 5,681 | |
Heineken Malaysia Bhd | | | | | 548 | | | | 3,247 | |
Hong Leong Bank Bhd | | | | | 1,509 | | | | 7,292 | |
Hong Leong Financial Group Bhd | | | | | 709 | | | | 3,296 | |
IHH Healthcare Bhd | | | | | 23,391 | | | | 31,456 | |
IJM Corp. Bhd | | | | | 8,507 | | | | 4,815 | |
Inari Amertron Bhd | | | | | 9,187 | | | | 3,844 | |
IOI Corp. Bhd | | | | | 6,835 | | | | 7,456 | |
Kuala Lumpur Kepong Bhd | | | | | 1,250 | | | | 7,480 | |
Malayan Banking Bhd | | | | | 23,067 | | | | 51,607 | |
Malaysia Airports Holdings Bhd | | | | | 6,387 | | | | 11,787 | |
Maxis Bhd | | | | | 5,243 | | | | 6,797 | |
MISC Bhd | | | | | 3,172 | | | | 5,294 | |
Nestle Malaysia Bhd | | | | | 177 | | | | 6,255 | |
Petronas Chemicals Group Bhd | | | | | 9,481 | | | | 20,638 | |
Petronas Dagangan Bhd | | | | | 672 | | | | 3,930 | |
Petronas Gas Bhd | | | | | 1,682 | | | | 7,193 | |
PPB Group Bhd | | | | | 1,637 | | | | 7,428 | |
Press Metal Aluminium Holdings Bhd | | | | | 4,989 | | | | 5,732 | |
Public Bank Bhd | | | | | 12,850 | | | | 69,930 | |
QL Resources Bhd | | | | | 2,023 | | | | 3,337 | |
RHB Bank Bhd | | | | | 8,211 | | | | 11,836 | |
Sime Darby Bhd | | | | | 10,881 | | | | 6,106 | |
Sime Darby Plantation Bhd | | | | | 11,679 | | | | 14,576 | |
Telekom Malaysia Bhd | | | | | 9,551 | | | | 6,722 | |
Tenaga Nasional Bhd | | | | | 21,983 | | | | 65,292 | |
Top Glove Corp. Bhd | | | | | 5,749 | | | | 6,772 | |
Total Malaysia | | | | | | | | | 561,544 | |
| | | | | | | | | | | |
Mexico — 7.4% | | | | | | | | | | |
Alfa SAB de CV Class A | | | | | 20,204 | | | | 20,420 | |
Alsea SAB de CV* | | | | | 1,513 | | | | 3,382 | |
America Movil SAB de CV Class L(1) | | | | | 5,052 | | | | 74,618 | |
Arca Continental SAB de CV | | | | | 1,210 | | | | 6,868 | |
Banco del Bajio SA*(2) | | | | | 3,454 | | | | 7,426 | |
Banco Santander Mexico SA Institucion de Banca Multiple Grupo Financiero Santand Class B | | | | | 6,639 | | | | 11,150 | |
Becle SAB de CV | | | | | 2,075 | | | | 3,261 | |
Bolsa Mexicana de Valores SAB de CV | | | | | 1,676 | | | | 3,456 | |
Cemex SAB de CV*(1) | | | | | 3,942 | | | | 18,133 | |
Concentradora Fibra Danhos SA de CV | | | | | 3,857 | | | | 5,642 | |
Corp. Inmobiliaria Vesta SAB de CV | | | | | 1,633 | | | | 2,575 | |
El Puerto de Liverpool SAB de CV | | | | | 570 | | | | 3,690 | |
Fibra Uno Administracion SA de CV | | | | | 11,704 | | | | 17,447 | |
Fomento Economico Mexicano SAB de CV(1) | | | | | 687 | | | | 67,044 | |
Gentera SAB de CV | | | | | 4,528 | | | | 4,132 | |
GMexico Transportes SAB de CV(2) | | | | | 17,188 | | | | 21,034 | |
Gruma SAB de CV Class B | | | | | 1,661 | | | | 16,602 | |
Grupo Aeroportuario del Centro Norte SAB de CV | | | | | 908 | | | | 5,594 | |
The accompanying notes are an integral part of these financial statements.
10
Schedule of Investments — Virtus Glovista Emerging Markets ETF(continued)
April 30, 2019 (unaudited)
Security Description
| | | | Shares
| | Value
|
Common Stocks (continued) | | | | | | | | | | |
| | | | | | | | | | | |
Mexico (continued) | | | | | | | | | | |
Grupo Aeroportuario del Pacifico SAB de CV Class B | | | | | 1,358 | | | $ | 13,808 | |
Grupo Aeroportuario del Sureste SAB de CV Class B | | | | | 803 | | | | 13,226 | |
Grupo Bimbo SAB de CV, Series A | | | | | 17,763 | | | | 39,559 | |
Grupo Carso SAB de CV, Series A1 | | | | | 8,946 | | | | 34,689 | |
Grupo Cementos de Chihuahua SAB de CV | | | | | 871 | | | | 4,991 | |
Grupo Elektra SAB DE CV | | | | | 219 | | | | 11,649 | |
Grupo Financiero Banorte SAB de CV Class O | | | | | 10,932 | | | | 69,100 | |
Grupo Financiero Inbursa SAB de CV Class O | | | | | 25,734 | | | | 39,393 | |
Grupo Herdez SAB de CV | | | | | 1,755 | | | | 3,761 | |
Grupo Lala SAB de CV | | | | | 9,809 | | | | 13,091 | |
Grupo Mexico SAB de CV, Series B | | | | | 14,371 | | | | 42,140 | |
Grupo Televisa SAB(1) | | | | | 2,031 | | | | 20,594 | |
Industrias Penoles SAB de CV | | | | | 384 | | | | 4,407 | |
Infraestructura Energetica Nova SAB de CV | | | | | 2,414 | | | | 10,552 | |
Kimberly-Clark de Mexico SAB de CV Class A* | | | | | 6,222 | | | | 10,755 | |
Megacable Holdings SAB de CV | | | | | 3,438 | | | | 15,145 | |
Mexichem SAB de CV | | | | | 4,009 | | | | 9,307 | |
Nemak SAB de CV(2) | | | | | 8,806 | | | | 4,808 | |
PLA Administradora Industrial S de RL de CV | | | | | 2,122 | | | | 3,529 | |
Prologis Property Mexico SA de CV | | | | | 1,853 | | | | 3,963 | |
Promotora y Operadora de Infraestructura
SAB de CV | | | | | 1,469 | | | | 14,943 | |
Qualitas Controladora SAB de CV* | | | | | 1,312 | | | | 3,480 | |
Regional SAB de CV | | | | | 953 | | | | 5,193 | |
Telesites SAB de CV* | | | | | 9,434 | | | | 6,410 | |
Wal-Mart de Mexico SAB de CV | | | | | 19,517 | | | | 57,354 | |
Total Mexico | | | | | | | | | 748,321 | |
| | | | | | | | | | | |
Philippines — 4.9% | | | | | | | | | | |
Aboitiz Equity Ventures, Inc. | | | | | 11,917 | | | | 12,715 | |
Aboitiz Power Corp. | | | | | 6,997 | | | | 5,062 | |
Alliance Global Group, Inc. | | | | | 21,026 | | | | 6,036 | |
Ayala Corp. | | | | | 1,668 | | | | 28,935 | |
Ayala Land, Inc. | | | | | 45,866 | | | | 43,083 | |
Bank of the Philippine Islands | | | | | 10,529 | | | | 17,143 | |
BDO Unibank, Inc. | | | | | 13,165 | | | | 33,852 | |
Bloomberry Resorts Corp. | | | | | 19,238 | | | | 4,703 | |
DMCI Holdings, Inc. | | | | | 17,579 | | | | 3,765 | |
Globe Telecom, Inc. | | | | | 151 | | | | 5,158 | |
GT Capital Holdings, Inc. | | | | | 440 | | | | 7,303 | |
International Container Terminal Services, Inc. | | | | | 8,886 | | | | 21,570 | |
JG Summit Holdings, Inc. | | | | | 20,651 | | | | 26,154 | |
Jollibee Foods Corp. | | | | | 2,754 | | | | 16,097 | |
Manila Electric Co. | | | | | 1,213 | | | | 8,961 | |
Megaworld Corp. | | | | | 55,301 | | | | 5,943 | |
Metro Pacific Investments Corp. | | | | | 66,175 | | | | 5,803 | |
Metropolitan Bank & Trust Co. | | | | | 11,864 | | | | 16,904 | |
PLDT, Inc. | | | | | 665 | | | | 15,696 | |
Puregold Price Club, Inc. | | | | | 4,230 | | | | 3,401 | |
Robinsons Retail Holdings, Inc. | | | | | 3,805 | | | | 5,695 | |
San Miguel Corp. | | | | | 1,847 | | | | 6,397 | |
San Miguel Food and Beverage, Inc. | | | | | 27,904 | | | | 62,113 | |
Security Bank Corp. | | | | | 2,339 | | | | 8,079 | |
SM Investments Corp. | | | | | 3,215 | | | | 58,609 | |
SM Prime Holdings, Inc. | | | | | 57,463 | | | | 45,706 | |
Universal Robina Corp. | | | | | 6,126 | | | | 17,903 | |
Total Philippines | | | | | | | | | 492,786 | |
| | | | | | | | | | | |
Security Description
| | | | Shares
| | Value
|
Common Stocks (continued) | | | | | | | | | | |
| | | | | | | | | | | |
Poland — 5.9% | | | | | | | | | | |
Alior Bank SA* | | | | | 889 | | | $ | 13,644 | |
Asseco Poland SA | | | | | 747 | | | | 10,360 | |
Bank Millennium SA* | | | | | 6,029 | | | | 15,217 | |
Bank Polska Kasa Opieki SA | | | | | 1,574 | | | | 46,831 | |
CCC SA | | | | | 319 | | | | 17,313 | |
CD Projekt SA* | | | | | 668 | | | | 37,565 | |
Cyfrowy Polsat SA* | | | | | 2,447 | | | | 16,969 | |
Dino Polska SA*(2) | | | | | 473 | | | | 15,719 | |
Grupa Lotos SA | | | | | 873 | | | | 18,998 | |
Jastrzebska Spolka Weglowa SA* | | | | | 537 | | | | 8,157 | |
KGHM Polska Miedz SA* | | | | | 1,419 | | | | 38,191 | |
LPP SA | | | | | 13 | | | | 29,137 | |
mBank SA | | | | | 131 | | | | 15,186 | |
Orange Polska SA* | | | | | 6,487 | | | | 8,379 | |
PGE Polska Grupa Energetyczna SA* | | | | | 7,788 | | | | 19,401 | |
Polski Koncern Naftowy ORLEN SA | | | | | 3,007 | | | | 77,051 | |
Polskie Gornictwo Naftowe i Gazownictwo SA | | | | | 16,022 | | | | 24,317 | |
Powszechna Kasa Oszczednosci Bank Polski SA | | | | | 8,462 | | | | 86,891 | |
Powszechny Zaklad Ubezpieczen SA | | | | | 5,678 | | | | 62,405 | |
Santander Bank Polska SA | | | | | 336 | | | | 34,889 | |
Total Poland | | | | | | | | | 596,620 | |
| | | | | | | | | | | |
Russia — 7.6% | | | | | | | | | | |
Aeroflot PJSC | | | | | 1,789 | | | | 2,665 | |
Alrosa PJSC | | | | | 10,845 | | | | 15,805 | |
Gazprom Neft PJSC | | | | | 915 | | | | 5,095 | |
Gazprom PJSC | | | | | 37,434 | | | | 94,922 | |
Lenta Ltd.*(3) | | | | | 1,315 | | | | 4,714 | |
LUKOIL PJSC | | | | | 2,251 | | | | 191,865 | |
Magnit PJSC | | | | | 167 | | | | 9,608 | |
Magnitogorsk Iron & Steel Works PJSC | | | | | 4,829 | | | | 3,301 | |
MMC Norilsk Nickel PJSC | | | | | 277 | | | | 61,444 | |
Mobile TeleSystems PJSC | | | | | 2,591 | | | | 10,215 | |
Moscow Exchange MICEX-RTS PJSC | | | | | 4,787 | | | | 6,741 | |
Novatek PJSC | | | | | 2,985 | | | | 55,641 | |
Novolipetsk Steel PJSC | | | | | 2,602 | | | | 6,886 | |
PhosAgro PJSC | | | | | 94 | | | | 3,435 | |
Polyus PJSC | | | | | 62 | | | | 4,831 | |
Rosneft Oil Co PJSC | | | | | 4,422 | | | | 29,327 | |
RusHydro PJSC | | | | | 427,089 | | | | 3,567 | |
Sberbank of Russia PJSC | | | | | 38,100 | | | | 132,686 | |
Severstal PJSC | | | | | 475 | | | | 7,679 | |
Surgutneftegas PJSC | | | | | 129,557 | | | | 49,223 | |
Tatneft PJSC | | | | | 5,386 | | | | 63,101 | |
VTB Bank PJSC | | | | | 11,872,922 | | | | 6,519 | |
Total Russia | | | | | | | | | 769,270 | |
| | | | | | | | | | | |
South Africa — 7.9% | | | | | | | | | | |
Absa Group Ltd. | | | | | 1,701 | | | | 19,532 | |
Anglo American Platinum Ltd. | | | | | 152 | | | | 7,671 | |
AngloGold Ashanti Ltd.(1) | | | | | 1,032 | | | | 12,178 | |
Aspen Pharmacare Holdings Ltd. | | | | | 923 | | | | 6,639 | |
Assore Ltd. | | | | | 265 | | | | 6,880 | |
AVI Ltd. | | | | | 788 | | | | 5,065 | |
Barloworld Ltd. | | | | | 514 | | | | 4,572 | |
Bid Corp. Ltd. | | | | | 815 | | | | 17,210 | |
Bidvest Group Ltd. (The) | | | | | 815 | | | | 12,369 | |
Capitec Bank Holdings Ltd. | | | | | 109 | | | | 10,185 | |
Clicks Group Ltd. | | | | | 598 | | | | 8,179 | |
The accompanying notes are an integral part of these financial statements.
11
Schedule of Investments — Virtus Glovista Emerging Markets ETF(continued)
April 30, 2019 (unaudited)
Security Description
| | | | Shares
| | Value
|
Common Stocks (continued) | | | | | | | | | | |
| | | | | | | | | | | |
South Africa (continued) | | | | | | | | | | |
Discovery Ltd. | | | | | 984 | | | $ | 9,909 | |
Exxaro Resources Ltd. | | | | | 621 | | | | 7,090 | |
FirstRand Ltd. | | | | | 7,559 | | | | 35,885 | |
Fortress REIT Ltd. Class A | | | | | 2,823 | | | | 3,803 | |
Foschini Group Ltd. (The) | | | | | 571 | | | | 7,375 | |
Gold Fields Ltd. | | | | | 1,914 | | | | 7,218 | |
Growthpoint Properties Ltd. | | | | | 6,969 | | | | 12,121 | |
Impala Platinum Holdings Ltd.* | | | | | 1,723 | | | | 6,897 | |
Investec Ltd. | | | | | 651 | | | | 4,157 | |
Kumba Iron Ore Ltd. | | | | | 225 | | | | 6,742 | |
Life Healthcare Group Holdings Ltd. | | | | | 2,817 | | | | 5,130 | |
Motus Holdings Ltd. | | | | | 472 | | | | 2,928 | |
Mr Price Group Ltd. | | | | | 619 | | | | 9,374 | |
MTN Group Ltd. | | | | | 2,903 | | | | 20,977 | |
Naspers Ltd. Class N | | | | | 1,012 | | | | 258,578 | |
Nedbank Group Ltd. | | | | | 882 | | | | 16,404 | |
Netcare Ltd. | | | | | 3,174 | | | | 5,321 | |
Northam Platinum Ltd.* | | | | | 846 | | | | 3,525 | |
Old Mutual Ltd. | | | | | 11,468 | | | | 18,431 | |
Pick n Pay Stores Ltd. | | | | | 844 | | | | 4,093 | |
PSG Group Ltd. | | | | | 398 | | | | 7,375 | |
Rand Merchant Investment Holdings Ltd. | | | | | 2,428 | | | | 5,878 | |
Redefine Properties Ltd. | | | | | 11,929 | | | | 8,214 | |
Remgro Ltd. | | | | | 1,247 | | | | 16,925 | |
RMB Holdings Ltd. | | | | | 2,212 | | | | 12,909 | |
Sanlam Ltd. | | | | | 4,635 | | | | 24,787 | |
Sappi Ltd. | | | | | 1,230 | | | | 5,862 | |
Sasol Ltd. | | | | | 1,446 | | | | 47,963 | |
Shoprite Holdings Ltd. | | | | | 1,110 | | | | 13,373 | |
Sibanye Gold Ltd.* | | | | | 3,362 | | | | 3,161 | |
SPAR Group Ltd. (The) | | | | | 471 | | | | 6,388 | |
Standard Bank Group Ltd. | | | | | 3,829 | | | | 53,266 | |
Telkom SA SOC Ltd. | | | | | 730 | | | | 4,327 | |
Tiger Brands Ltd. | | | | | 451 | | | | 7,833 | |
Truworths International Ltd. | | | | | 1,018 | | | | 5,379 | |
Vodacom Group Ltd. | | | | | 1,450 | | | | 11,689 | |
Vukile Property Fund Ltd. | | | | | 2,166 | | | | 3,112 | |
Woolworths Holdings Ltd. | | | | | 2,473 | | | | 8,248 | |
Total South Africa | | | | | | | | | 803,127 | |
| | | | | | | | | | | |
South Korea — 5.7% | | | | | | | | | | |
Amorepacific Corp. | | | | | 33 | | | | 5,876 | |
Celltrion Healthcare Co. Ltd.* | | | | | 34 | | | | 2,200 | |
Celltrion, Inc.* | | | | | 85 | | | | 15,426 | |
E-MART, Inc. | | | | | 13 | | | | 1,914 | |
Fila Korea Ltd. | | | | | 48 | | | | 3,386 | |
Hana Financial Group, Inc. | | | | | 301 | | | | 9,482 | |
Helixmith Co. Ltd.* | | | | | 9 | | | | 2,005 | |
Hotel Shilla Co. Ltd. | | | | | 33 | | | | 3,249 | |
Hyundai Engineering & Construction Co. Ltd. | | | | | 50 | | | | 2,247 | |
Hyundai Heavy Industries Co. Ltd.* | | | | | 26 | | | | 2,771 | |
Hyundai Mobis Co. Ltd. | | | | | 66 | | | | 13,136 | |
Hyundai Motor Co. | | | | | 140 | | | | 16,599 | |
Hyundai Steel Co. | | | | | 53 | | | | 2,101 | |
Industrial Bank of Korea | | | | | 167 | | | | 2,023 | |
Kakao Corp. | | | | | 33 | | | | 3,390 | |
Kangwon Land, Inc. | | | | | 76 | | | | 2,212 | |
KB Financial Group, Inc. | | | | | 392 | | | | 15,504 | |
Kia Motors Corp. | | | | | 242 | | | | 9,374 | |
| | | | | | | | | | | |
Security Description
| | | | Shares
| | Value
|
Common Stocks (continued) | | | | | | | | | | |
| | | | | | | | | | | |
South Korea (continued) | | | | | | | | | | |
Korea Electric Power Corp.* | | | | | 530 | | | $ | 12,840 | |
Korea Zinc Co. Ltd. | | | | | 6 | | | | 2,324 | |
KT Corp.(1) | | | | | 473 | | | | 5,690 | |
KT&G Corp. | | | | | 123 | | | | 10,740 | |
LG Chem Ltd. | | | | | 47 | | | | 14,525 | |
LG Corp. | | | | | 94 | | | | 5,874 | |
LG Display Co. Ltd.* | | | | | 147 | | | | 2,511 | |
LG Electronics, Inc. | | | | | 106 | | | | 6,878 | |
LG Household & Health Care Ltd. | | | | | 10 | | | | 12,173 | |
LG Uplus Corp. | | | | | 180 | | | | 2,204 | |
Lotte Chemical Corp. | | | | | 11 | | | | 2,528 | |
NAVER Corp. | | | | | 142 | | | | 14,526 | |
NCSoft Corp. | | | | | 16 | | | | 7,205 | |
POSCO | | | | | 81 | | | | 17,682 | |
Samsung Biologics Co. Ltd.*(2) | | | | | 18 | | | | 5,239 | |
Samsung C&T Corp. | | | | | 110 | | | | 9,652 | |
Samsung Card Co. Ltd. | | | | | 72 | | | | 2,287 | |
Samsung Electro-Mechanics Co. Ltd. | | | | | 36 | | | | 3,344 | |
Samsung Electronics Co. Ltd. | | | | | 5,257 | | | | 206,338 | |
Samsung Fire & Marine Insurance Co. Ltd. | | | | | 31 | | | | 8,067 | |
Samsung Heavy Industries Co. Ltd.* | | | | | 287 | | | | 2,020 | |
Samsung Life Insurance Co. Ltd. | | | | | 72 | | | | 5,233 | |
Samsung SDI Co. Ltd. | | | | | 51 | | | | 10,325 | |
Samsung SDS Co. Ltd. | | | | | 34 | | | | 6,316 | |
Shinhan Financial Group Co. Ltd. | | | | | 458 | | | | 17,290 | |
SillaJen, Inc.* | | | | | 43 | | | | 2,407 | |
SK Holdings Co. Ltd. | | | | | 36 | | | | 7,905 | |
SK Hynix, Inc. | | | | | 505 | | | | 34,152 | |
SK Innovation Co. Ltd. | | | | | 59 | | | | 9,218 | |
SK Telecom Co. Ltd. | | | | | 50 | | | | 10,594 | |
S-Oil Corp. | | | | | 28 | | | | 2,210 | |
Woongjin Coway Co. Ltd. | | | | | 37 | | | | 2,781 | |
Total South Korea | | | | | | | | | 575,973 | |
| | | | | | | | | | | |
Taiwan — 6.8% | | | | | | | | | | |
ASE Technology Holding Co. Ltd.* | | | | | 4,203 | | | | 9,752 | |
Asia Cement Corp. | | | | | 1,362 | | | | 1,840 | |
Asustek Computer, Inc. | | | | | 883 | | | | 6,744 | |
AU Optronics Corp. | | | | | 5,477 | | | | 1,958 | |
Catcher Technology Co. Ltd. | | | | | 877 | | | | 6,939 | |
Cathay Financial Holding Co. Ltd. | | | | | 10,337 | | | | 14,953 | |
Chailease Holding Co. Ltd. | | | | | 1,193 | | | | 5,077 | |
Chang Hwa Commercial Bank Ltd. | | | | | 3,149 | | | | 1,885 | |
Cheng Shin Rubber Industry Co. Ltd. | | | | | 1,235 | | | | 1,649 | |
China Development Financial Holding Corp. | | | | | 15,857 | | | | 5,106 | |
China Steel Corp. | | | | | 14,480 | | | | 11,691 | |
Chunghwa Telecom Co. Ltd. | | | | | 5,983 | | | | 21,492 | |
Compal Electronics, Inc. | | | | | 5,284 | | | | 3,411 | |
CTBC Financial Holding Co. Ltd. | | | | | 20,764 | | | | 14,212 | |
Delta Electronics, Inc. | | | | | 2,499 | | | | 13,142 | |
E.Sun Financial Holding Co. Ltd. | | | | | 12,490 | | | | 10,246 | |
Eclat Textile Co. Ltd. | | | | | 242 | | | | 3,446 | |
Far Eastern New Century Corp. | | | | | 1,994 | | | | 2,175 | |
Far EasTone Telecommunications Co. Ltd. | | | | | 2,287 | | | | 5,610 | |
First Financial Holding Co. Ltd. | | | | | 11,372 | | | | 8,115 | |
Formosa Chemicals & Fibre Corp. | | | | | 4,388 | | | | 15,762 | |
Formosa Petrochemical Corp. | | | | | 1,505 | | | | 5,577 | |
Formosa Plastics Corp. | | | | | 4,765 | | | | 17,271 | |
Fubon Financial Holding Co. Ltd. | | | | | 8,606 | | | | 12,700 | |
The accompanying notes are an integral part of these financial statements.
12
Schedule of Investments — Virtus Glovista Emerging Markets ETF(continued)
April 30, 2019 (unaudited)
Security Description
| | | | Shares
| | Value
|
Common Stocks (continued) | | | | | | | | | | |
| | | | | | | | | | | |
Taiwan (continued) | | | | | | | | | | |
Hon Hai Precision Industry Co. Ltd. | | | | | 15,989 | | | $ | 44,964 | |
Hotai Motor Co. Ltd. | | | | | 227 | | | | 3,431 | |
Hua Nan Financial Holdings Co. Ltd. | | | | | 9,348 | | | | 6,111 | |
Innolux Corp. | | | | | 5,347 | | | | 1,713 | |
Largan Precision Co. Ltd. | | | | | 138 | | | | 20,766 | |
Lite-On Technology Corp. | | | | | 1,230 | | | | 1,733 | |
MediaTek, Inc. | | | | | 1,916 | | | | 18,322 | |
Mega Financial Holding Co. Ltd. | | | | | 11,898 | | | | 11,416 | |
Nan Ya Plastics Corp. | | | | | 6,436 | | | | 16,266 | |
Novatek Microelectronics Corp. | | | | | 748 | | | | 4,878 | |
Pegatron Corp. | | | | | 2,534 | | | | 4,781 | |
Pou Chen Corp. | | | | | 1,811 | | | | 2,201 | |
President Chain Store Corp. | | | | | 721 | | | | 6,720 | |
Quanta Computer, Inc. | | | | | 3,421 | | | | 6,554 | |
Realtek Semiconductor Corp. | | | | | 377 | | | | 2,550 | |
Shanghai Commercial & Savings Bank Ltd. (The) | | | | | 2,666 | | | | 4,296 | |
Shin Kong Financial Holding Co. Ltd. | | | | | 6,402 | | | | 1,811 | |
SinoPac Financial Holdings Co. Ltd. | | | | | 12,619 | | | | 4,860 | |
Taishin Financial Holding Co. Ltd. | | | | | 12,264 | | | | 5,556 | |
Taiwan Cement Corp. | | | | | 5,824 | | | | 7,916 | |
Taiwan Cooperative Financial Holding Co. Ltd. | | | | | 10,725 | | | | 7,115 | |
Taiwan Mobile Co. Ltd. | | | | | 2,048 | | | | 7,489 | |
Taiwan Semiconductor Manufacturing Co. Ltd. | | | | | 31,981 | | | | 268,052 | |
Uni-President Enterprises Corp. | | | | | 6,520 | | | | 15,487 | |
United Microelectronics Corp. | | | | | 7,610 | | | | 3,312 | |
Yuanta Financial Holding Co. Ltd. | | | | | 12,320 | | | | 7,137 | |
Total Taiwan | | | | | | | | | 686,190 | |
| | | | | | | | | | | |
Thailand — 9.6% | | | | | | | | | | |
Advanced Info Service PCL | | | | | 5,120 | | | | 30,471 | |
Airports of Thailand PCL | | | | | 21,565 | | | | 46,271 | |
B Grimm Power PCL | | | | | 3,094 | | | | 3,271 | |
Bangchak Corp. PCL | | | | | 3,857 | | | | 3,926 | |
Bangkok Bank PCL | | | | | 9,364 | | | | 59,542 | |
Bangkok Dusit Medical Services PCL | | | | | 43,618 | | | | 34,840 | |
Bangkok Expressway & Metro PCL | | | | | 35,684 | | | | 12,183 | |
Bangkok Life Assurance PCL | | | | | 3,051 | | | | 2,700 | |
Banpu PCL | | | | | 21,724 | | | | 11,160 | |
Berli Jucker PCL | | | | | 6,082 | | | | 9,811 | |
BTS Group Holdings PCL | | | | | 34,724 | | | | 12,835 | |
Bumrungrad Hospital PCL | | | | | 2,419 | | | | 13,412 | |
Central Pattana PCL | | | | | 12,116 | | | | 28,653 | |
Central Plaza Hotel PCL | | | | | 2,301 | | | | 3,081 | |
CH Karnchang PCL | | | | | 4,131 | | | | 3,461 | |
Charoen Pokphand Foods PCL | | | | | 22,005 | | | | 18,783 | |
CP ALL PCL* | | | | | 28,497 | | | | 69,178 | |
CPN Retail Growth Leasehold REIT | | | | | 5,314 | | | | 4,869 | |
Delta Electronics Thailand PCL | | | | | 6,328 | | | | 14,817 | |
Electricity Generating PCL | | | | | 1,304 | | | | 12,090 | |
Energy Absolute PCL | | | | | 9,452 | | | | 16,506 | |
Gulf Energy Development PCL | | | | | 4,162 | | | | 13,623 | |
Home Product Center PCL | | | | | 22,448 | | | | 11,039 | |
Indorama Ventures PCL | | | | | 9,656 | | | | 13,837 | |
Intouch Holdings PCL | | | | | 11,168 | | | | 20,814 | |
IRPC PCL | | | | | 53,627 | | | | 9,491 | |
Kasikornbank PCL | | | | | 12,209 | | | | 73,044 | |
Kiatnakin Bank PCL | | | | | 2,206 | | | | 4,561 | |
Krung Thai Bank PCL | | | | | 71,437 | | | | 42,292 | |
Land & Houses PCL | | | | | 36,485 | | | | 12,800 | |
| | | | | | | | | | | |
Security Description
| | | | Shares
| | Value
|
Common Stocks (continued) | | | | | | | | | | |
| | | | | | | | | | | |
Thailand (continued) | | | | | | | | | | |
Minor International PCL | | | | | 14,607 | | | $ | 17,158 | |
Muangthai Capital PCL | | | | | 2,215 | | | | 3,573 | |
PTT Exploration & Production PCL | | | | | 7,004 | | | | 29,288 | |
PTT Global Chemical PCL | | | | | 11,560 | | | | 24,894 | |
PTT PCL | | | | | 71,506 | | | | 109,191 | |
Robinson PCL | | | | | 1,457 | | | | 2,658 | |
Siam Cement PCL (The) | | | | | 3,646 | | | | 52,763 | |
Siam Commercial Bank PCL (The) | | | | | 12,794 | | | | 52,498 | |
Sino-Thai Engineering & Construction PCL | | | | | 6,466 | | | | 5,114 | |
Srisawad Corp. PCL | | | | | 2,717 | | | | 4,660 | |
Supalai PCL | | | | | 4,829 | | | | 3,343 | |
Thai Oil PCL | | | | | 4,950 | | | | 10,737 | |
Thai Union Group PCL | | | | | 14,477 | | | | 8,571 | |
Thanachart Capital PCL | | | | | 3,323 | | | | 5,517 | |
Tisco Financial Group PCL | | | | | 3,030 | | | | 7,949 | |
TMB Bank PCL | | | | | 73,673 | | | | 4,661 | |
Total Access Communication PCL | | | | | 2,248 | | | | 3,574 | |
True Corp. PCL | | | | | 72,856 | | | | 11,753 | |
WHA Corp. PCL | | | | | 27,267 | | | | 3,741 | |
Total Thailand | | | | | | | | | 975,004 | |
| | | | | | | | | | | |
Turkey — 4.0% | | | | | | | | | | |
Akbank T.A.S.* | | | | | 45,545 | | | | 46,714 | |
Arcelik AS* | | | | | 3,879 | | | | 11,922 | |
Aselsan Elektronik Sanayi Ve Ticaret AS | | | | | 4,353 | | | | 14,911 | |
BIM Birlesik Magazalar AS | | | | | 3,212 | | | | 44,706 | |
Enka Insaat ve Sanayi AS | | | | | 21,010 | | | | 18,908 | |
Eregli Demir ve Celik Fabrikalari TAS | | | | | 20,176 | | | | 30,973 | |
Haci Omer Sabanci Holding AS | | | | | 19,689 | | | | 25,408 | |
KOC Holding AS | | | | | 16,659 | | | | 45,229 | |
Tekfen Holding AS | | | | | 2,676 | | | | 11,938 | |
Tupras Turkiye Petrol Rafinerileri AS | | | | | 1,809 | | | | 37,381 | |
Turk Hava Yollari AO* | | | | | 10,051 | | | | 24,105 | |
Turkcell Iletisim Hizmetleri AS | | | | | 15,799 | | | | 33,097 | |
Turkiye Garanti Bankasi AS* | | | | | 32,137 | | | | 44,003 | |
Turkiye Is Bankasi AS Class C* | | | | | 22,623 | | | | 20,322 | |
Total Turkey | | | | | | | | | 409,617 | |
| | | | | | | | | | | |
United Kingdom — 0.0%(4) | | | | | | | | | | |
Mondi Ltd. | | | | | 228 | | | | 5,025 | |
| | | | | | | | | | | |
United States — 0.1% | | | | | | | | | | |
JBS SA | | | | | 1,475 | | | | 7,437 | |
| | | | | | | | | | | |
Total Common Stocks | | | | | | | | | | |
(Cost $8,980,421) | | | | | | | | | 9,266,600 | |
| | | | | | | | | | | |
Exchange Traded Fund — 5.2% | | | | | | | | | | |
| | | | | | | | | | | |
United States — 5.2% | | | | | | | | | | |
Franklin FTSE India ETF | | | | | 22,317 | | | | 523,798 | |
| | | | | | | | | | | |
Total Exchange Traded Fund | | | | | | | | | | |
(Cost $486,922) | | | | | | | | | 523,798 | |
| | | | | | | | | | | |
PREFERRED STOCKS — 0.8% | | | | | | | | | | |
| | | | | | | | | | | |
Brazil — 0.6% | | | | | | | | | | |
Azul SA, 0.00%* | | | | | 366 | | | | 3,173 | |
Bradespar SA, 7.91% | | | | | 353 | | | | 2,872 | |
Braskem SA, 3.95% Class A | | | | | 291 | | | | 3,546 | |
Centrais Eletricas Brasileiras SA, 4.01% Class B | | | | | 367 | | | | 3,243 | |
The accompanying notes are an integral part of these financial statements.
13
Schedule of Investments — Virtus Glovista Emerging Markets ETF(continued)
April 30, 2019 (unaudited)
Security Description
| | | | Shares
| | Value
|
PREFERRED STOCKS (continued) | | | | | | | | | | |
| | | | | | | | | | | |
Brazil (continued) | | | | | | | | | | |
Cia Brasileira de Distribuicao, 1.83% | | | | | 237 | | | $ | 5,833 | |
Cia Energetica de Minas Gerais, 4.37% | | | | | 1,462 | | | | 5,496 | |
Itausa—Investimentos Itau SA, 3.43% | | | | | 6,807 | | | | 20,676 | |
Lojas Americanas SA, 0.48% | | | | | 1,131 | | | | 4,534 | |
Telefonica Brasil SA, 10.87% | | | | | 644 | | | | 7,649 | |
Total Brazil | | | | | | | | | 57,022 | |
| | | | | | | | | | | |
Chile — 0.1% | | | | | | | | | | |
Embotelladora Andina SA, 3.91% Class B | | | | | 3,391 | | | | 12,106 | |
| | | | | | | | | | | |
Russia — 0.1% | | | | | | | | | | |
Transneft PJSC, 4.53% | | | | | 6 | | | | 15,590 | |
| | | | | | | | | | | |
Total Preferred Stocks | | | | | | | | | | |
(Cost $80,270) | | | | | | | | | 84,718 | |
| | | | | | | | | | | |
Warrants — 0.0%(4) | | | | | | | | | | |
| | | | | | | | | | | |
Thailand — 0.0%(4) | | | | | | | | | | |
BTS Group Holdings PCL, expiring 12/31/2019* | | | | | 5,645 | | | | 200 | |
Minor International PCL, expiring 12/31/2021* | | | | | 730 | | | | 0 | |
Total Thailand | | | | | | | | | 200 | |
| | | | | | | | | | | |
Total Warrants | | | | | | | | | | |
(Cost $0) | | | | | | | | | 200 | |
| | | | | | | | | | | |
Security Description
| | | | Shares
| | Value
|
PREFERRED STOCKS (continued) | | | | | | | | | | |
| | | | | | | | | | | |
TOTAL INVESTMENTS — 97.3% | | | | | | | | | | |
(Cost $9,547,613) | | | | | | | | $ | 9,875,316 | |
Other Assets in Excess of Liabilities — 2.7% | | | | | | | | | 270,509 | |
Net Assets — 100.0% | | | | | | | | $ | 10,145,825 | |
* | | Non-income producing security. |
(1) | | American Depositary Receipts. |
(2) | | Security was purchased pursuant to Rule 144A under the Securities Act of 1933 and may not be resold subject to that rule except to qualified institutional buyers. Unless otherwise noted, 144A securities are deemed to be liquid. At April 30, 2019, the aggregate value of these securities was $95,928, or 0.9% of net assets. |
(3) | | Global Depositary Receipts. |
(4) | | Amount rounds to less than 0.05%. |
The following table summarizes valuation of the Fund’s investments under the fair value hierarchy levels as of April 30, 2019 (See Note 2 in the Notes to Financial Statements):
| | | | Level 1
| | Level 2
| | Level 3
| | Total
|
Asset Valuation Inputs | | | | | | | | | | | | | | | | | | |
Common Stocks | | | | $ | 9,266,600 | | | $ | — | | | $ | — | | | $ | 9,266,600 | |
Exchange Traded Fund | | | | | 523,798 | | | | — | | | | — | | | | 523,798 | |
Preferred Stocks | | | | | 84,718 | | | | — | | | | — | | | | 84,718 | |
Warrants | | | | | 200 | | | | — | | | | — | | | | 200 | |
Total | | | | $ | 9,875,316 | | | $ | — | | | $ | — | | | $ | 9,875,316 | |
The accompanying notes are an integral part of these financial statements.
14
Schedule of Investments — Virtus InfraCap U.S. Preferred Stock ETF
April 30, 2019 (unaudited)
Security Description
| | | | Shares
| | Value
|
PREFERRED STOCKS — 119.4%(1) | | | | | | | | | | |
| | | | | | | | | | | |
Communication Services — 1.0% | | | | | | | | | | |
Telephone & Data Systems, Inc., 5.88% | | | | | 10,927 | | | $ | 254,927 | |
| | | | | | | | | | | |
Energy — 15.0% | | | | | | | | | | |
DCP Midstream LP, Series B, 7.88% | | | | | 47,967 | | | | 1,187,183 | |
Energy Transfer Operating LP, Series C, 7.38% | | | | | 47,797 | | | | 1,172,461 | |
Energy Transfer Operating LP, Series E, 7.60%* | | | | | 5,885 | | | | 146,360 | |
GasLog Partners LP, Series A, 8.63% (Monaco) | | | | | 4,794 | | | | 115,248 | |
GasLog Partners LP, Series B, 8.20% (Monaco) | | | | | 6,657 | | | | 154,442 | |
NuStar Energy LP, Series A, 8.50% | | | | | 13,605 | | | | 319,173 | |
NuStar Energy LP, Series B, 7.63% | | | | | 2,155 | | | | 44,479 | |
NuStar Energy LP, Series C, 9.00% | | | | | 27,498 | | | | 650,878 | |
NuStar Logistics LP, 9.31% | | | | | 77 | | | | 1,946 | |
Total Energy | | | | | | | | | 3,792,170 | |
| | | | | | | | | | | |
Financials — 48.2% | | | | | | | | | | |
Annaly Capital Management, Inc.,
Series F, 6.95% | | | | | 779 | | | | 19,974 | |
Annaly Capital Management, Inc.,
Series G, 6.50% | | | | | 18,615 | | | | 458,487 | |
Apollo Global Management LLC,
Series A, 6.38% | | | | | 12,929 | | | | 325,423 | |
Arch Capital Group Ltd., Series E, 5.25% | | | | | 5,294 | | | | 123,985 | |
ARMOUR Residential REIT, Inc.,
Series B, 7.88% | | | | | 28,744 | | | | 722,337 | |
Axis Capital Holdings Ltd., 5.50% | | | | | 2,935 | | | | 71,819 | |
Axis Capital Holdings Ltd., Series E, 5.50% | | | | | 3,734 | | | | 91,595 | |
Brighthouse Financial, Inc., 6.25% | | | | | 46,318 | | | | 1,188,520 | |
Capital One Financial Corp., Series G, 5.20% | | | | | 5,114 | | | | 127,390 | |
Carlyle Group LP, Series A, 5.88% | | | | | 27,669 | | | | 643,581 | |
Chimera Investment Corp., Series A, 8.00% | | | | | 19,809 | | | | 506,714 | |
Chimera Investment Corp., Series B, 8.00% | | | | | 9,172 | | | | 234,253 | |
Chimera Investment Corp., Series D, 8.00%* | | | | | 6,010 | | | | 156,020 | |
Compass Diversified Holdings, Series A, 7.25% | | | | | 5,809 | | | | 124,196 | |
Cowen, Inc., 7.35% | | | | | 10,591 | | | | 268,800 | |
Invesco Mortgage Capital, Inc., Series B, 7.75% | | | | | 6,318 | | | | 167,743 | |
Invesco Mortgage Capital, Inc., Series C, 7.50% | | | | | 32,241 | | | | 817,632 | |
National General Holdings Corp.,
Series B, 7.50% | | | | | 56,344 | | | | 1,317,886 | |
National General Holdings Corp.,
Series C, 7.50% | | | | | 14,560 | | | | 338,374 | |
New York Mortgage Trust, Inc.,
Series D, 8.00% | | | | | 21,124 | | | | 510,778 | |
Oaktree Capital Group LLC, Series A, 6.63% | | | | | 44,333 | | | | 1,123,842 | |
PennyMac Mortgage Investment Trust,
Series A, 8.13% | | | | | 9,802 | | | | 251,617 | |
PennyMac Mortgage Investment Trust,
Series B, 8.00% | | | | | 17,706 | | | | 454,336 | |
Two Harbors Investment Corp., Series C, 7.25% | | | | | 5,234 | | | | 129,384 | |
Two Harbors Investment Corp., Series E, 7.50% | | | | | 43,824 | | | | 1,067,553 | |
Wells Fargo & Co., Series X, 5.50% | | | | | 37,942 | | | | 970,936 | |
Total Financials | | | | | | | | | 12,213,175 | |
| | | | | | | | | | | |
Industrials — 5.8% | | | | | | | | | | |
Seaspan Corp., Series G, 8.20% (Hong Kong) | | | | | 40,408 | | | | 1,013,837 | |
Seaspan Corp., Series I, 8.00% (Hong Kong) | | | | | 18,594 | | | | 459,829 | |
Total Industrials | | | | | | | | | 1,473,666 | |
| | | | | | | | | | | |
Real Estate — 42.6% | | | | | | | | | | |
American Homes 4 Rent, Series F, 5.88% | | | | | 5,374 | | | | 133,544 | |
American Homes 4 Rent, Series G, 5.88% | | | | | 5,476 | | | | 136,626 | |
| | | | | | | | | | | |
Security Description
| | | | Shares
| | Value
|
PREFERRED STOCKS (continued) | | | | | | | | | | |
| | | | | | | | | | | |
Real Estate (continued) | | | | | | | | | | |
Ashford Hospitality Trust, Inc.,
Series F, 7.38% | | | | | 20,579 | | | $ | 483,401 | |
Ashford Hospitality Trust, Inc.,
Series G, 7.38% | | | | | 9,625 | | | | 220,316 | |
Ashford Hospitality Trust, Inc.,
Series H, 7.50% | | | | | 6,525 | | | | 151,445 | |
Ashford Hospitality Trust, Inc., Series I, 7.50% | | | | | 17,904 | | | | 417,879 | |
Boston Properties, Inc., Series B, 5.25% | | | | | 540 | | | | 13,684 | |
City Office REIT, Inc., Series A, 6.63% | | | | | 8,704 | | | | 215,424 | |
Colony Capital, Inc., Series I, 7.15% | | | | | 20,550 | | | | 419,220 | |
CorEnergy Infrastructure Trust, Inc.,
Series A, 7.38% | | | | | 790 | | | | 20,003 | |
Digital Realty Trust, Inc., Series J, 5.25% | | | | | 5,414 | | | | 133,455 | |
EPR Properties, Series G, 5.75% | | | | | 52,205 | | | | 1,282,155 | |
Federal Realty Investment Trust,
Series C, 5.00% | | | | | 4,505 | | | | 108,481 | |
Global Net Lease, Inc., Series A, 7.25% | | | | | 29,350 | | | | 751,360 | |
Hersha Hospitality Trust, Series D, 6.50% | | | | | 39,350 | | | | 924,725 | |
Hersha Hospitality Trust, Series E, 6.50% | | | | | 19,365 | | | | 457,014 | |
Kimco Realty Corp., Series J, 5.50% | | | | | 12,734 | | | | 312,874 | |
Kimco Realty Corp., Series M, 5.25% | | | | | 6,049 | | | | 140,397 | |
Monmouth Real Estate Investment Corp.,
Series C, 6.13% | | | | | 5,214 | | | | 126,283 | |
National Retail Properties, Inc., Series F, 5.20% | | | | | 5,454 | | | | 130,951 | |
National Storage Affiliates Trust, Series A, 6.00% | | | | | 3,538 | | | | 89,759 | |
Pennsylvania Real Estate Investment Trust,
Series C, 7.20% | | | | | 25,443 | | | | 553,385 | |
PS Business Parks, Inc., Series W, 5.20% | | | | | 15,384 | | | | 373,062 | |
Public Storage, Series W, 5.20% | | | | | 24,211 | | | | 598,496 | |
Public Storage, Series X, 5.20% | | | | | 18,956 | | | | 473,900 | |
RLJ Lodging Trust, Series A, 1.95% | | | | | 40,677 | | | | 1,031,162 | |
Summit Hotel Properties, Inc., Series E, 6.25% | | | | | 35,181 | | | | 835,197 | |
Vornado Realty Trust, Series L, 5.40% | | | | | 5,454 | | | | 134,659 | |
Washington Prime Group, Inc., Series H, 7.50% | | | | | 5,789 | | | | 124,464 | |
Total Real Estate | | | | | | | | | 10,793,321 | |
| | | | | | | | | | | |
Utilities — 6.8% | | | | | | | | | | |
NextEra Energy Capital Holdings, Inc., 5.00% | | | | | 5,174 | | | | 124,383 | |
NextEra Energy Capital Holdings, Inc.,
Series I, 5.13% | | | | | 5,134 | | | | 126,348 | |
SCE Trust II, 5.10% | | | | | 15,163 | | | | 323,275 | |
SCE Trust VI, 5.00% | | | | | 53,203 | | | | 1,157,165 | |
Total Utilities | | | | | | | | | 1,731,171 | |
| | | | | | | | | | | |
Total Preferred Stocks | | | | | | | | | | |
(Cost $29,382,569) | | | | | | | | | 30,258,430 | |
| | | | | | | | | | | |
Common Stocks — 3.3%(1) | | | | | | | | | | |
| | | | | | | | | | | |
Communication Services — 0.5% | | | | | | | | | | |
Verizon Communications, Inc.(2) | | | | | 2,356 | | | | 134,740 | |
| | | | | | | | | | | |
Energy — 0.4% | | | | | | | | | | |
Kinder Morgan, Inc.(2) | | | | | 4,848 | | | | 96,330 | |
| | | | | | | | | | | |
Real Estate — 1.8% | | | | | | | | | | |
Boston Properties, Inc.(2) | | | | | 3,334 | | | | 458,825 | |
The accompanying notes are an integral part of these financial statements.
15
Schedule of Investments — Virtus InfraCap U.S. Preferred Stock ETF(continued)
April 30, 2019 (unaudited)
Security Description
| | | | Shares
| | Value
|
PREFERRED STOCKS (continued) | | | | | | | | | | |
| | | | | | | | | | | |
Utilities — 0.6% | | | | | | | | | | |
Sempra Energy(2) | | | | | 467 | | | $ | 59,753 | |
Southern Co. (The)(2) | | | | | 1,580 | | | | 84,087 | |
Total Utilities | | | | | | | | | 143,840 | |
| | | | | | | | | | | |
Total Common Stocks | | | | | | | | | | |
(Cost $817,034) | | | | | | | | | 833,735 | |
| | | | | | | | | | | |
Exchange Traded Fund — 1.6%(1) | | | | | | | | | | |
| | | | | | | | | | | |
Equity Fund — 1.6% | | | | | | | | | | |
iShares U.S. Real Estate ETF(2) | | | | | 4,732 | | | | 411,684 | |
| | | | | | | | | | | |
Total Exchange Traded Fund | | | | | | | | | | |
(Cost $410,428) | | | | | | | | | 411,684 | |
| | | | | | | | | | | |
TOTAL INVESTMENTS — 124.3% | | | | | | | | | | |
(Cost $30,610,031) | | | | | | | | | 31,503,849 | |
| | | | | | | | | | | |
PREFERRED STOCKS (continued) | | | | | | | | | | |
| | | | | | | | | | | |
Securities Sold Short — (5.5)% | | | | | | | | | | |
| | | | | | | | | | | |
Exchange Traded Funds — (5.5)% | | | | | | | | | | |
| | | | | | | | | | | |
Equity Funds — (5.5)% | | | | | | | | | | |
iShares 20+ Year Treasury Bond ETF | | | | | (7,000 | ) | | | (865,550 | ) |
iShares 7-10 Year Treasury Bond ETF | | | | | (5,000 | ) | | | (529,500 | ) |
| | | | | | | | | | | |
Total Equity Funds | | | | | | | | | (1,395,050 | ) |
| | | | | | | | | | | |
Total Exchange Traded Funds | | | | | | | | | | |
(Proceeds $(1,346,730)) | | | | | | | | | (1,395,050 | ) |
| | | | | | | | | | | |
Total Securities Sold Short — (5.5)% | | | | | | | | | | |
(Proceeds $(1,346,730)) | | | | | | | | | (1,395,050 | ) |
Liabilities in Excess of Other Assets — (18.8)% | | | | | | | | | (4,771,259 | ) |
| | | | | | | | | | | |
Net Assets — 100.0% | | | | | | | | $ | 25,337,540 | |
| | | | Notional
Amount
| | Number of
contracts
| | |
Written Options — (0.2)% | | | | | | | | | | | | | | |
| | | | | | | | | | | | | | | |
Written Call Options | | | | | | | | | | | | | | |
Boston Properties, Inc., | | | | | | | | | | | | | | |
Expires 05/17/19, | | | | | | | | | | | | | | |
Strike Price $140.00 | | | | | (3,300 | ) | | | (33 | ) | | | (4,554 | ) |
iShares 20+ Year Treasury Bond ETF, | | | | | | | | | | | | | | |
Expires 05/03/19, | | | | | | | | | | | | | | |
Strike Price $126.00 | | | | | (2,000 | ) | | | (20 | ) | | | (100 | ) |
iShares 20+ Year Treasury Bond ETF, | | | | | | | | | | | | | | |
Expires 05/10/19, | | | | | | | | | | | | | | |
Strike Price $126.50 | | | | | (5,300 | ) | | | (53 | ) | | | (451 | ) |
iShares 20+ Year Treasury Bond ETF, | | | | | | | | | | | | | | |
Expires 05/17/19, | | | | | | | | | | | | | | |
Strike Price $125.00 | | | | | (3,000 | ) | | | (30 | ) | | | (1,170 | ) |
iShares 20+ Year Treasury Bond ETF, | | | | | | | | | | | | | | |
Expires 05/24/19, | | | | | | | | | | | | | | |
Strike Price $126.50 | | | | | (3,000 | ) | | | (30 | ) | | | (570 | ) |
iShares 20+ Year Treasury Bond ETF, | | | | | | | | | | | | | | |
Expires 05/31/19, | | | | | | | | | | | | | | |
Strike Price $125.50 | | | | | (3,000 | ) | | | (30 | ) | | | (1,470 | ) |
iShares 20+ Year Treasury Bond ETF, | | | | | | | | | | | | | | |
Expires 06/07/19, | | | | | | | | | | | | | | |
Strike Price $125.50 | | | | | (4,000 | ) | | | (40 | ) | | | (2,340 | ) |
| | | | | | | | | | | | | | | |
| | | | Notional
Amount
| | Number of
contracts
| | Value
|
Written Options (continued) | | | | | | | | | | | | | | |
| | | | | | | | | | | | | | | |
Written Call Options (continued) | | | | | | | | | | | | | | |
iShares 7-10 Year Treasury Bond ETF, | | | | | | | | | | | | | | |
Expires 06/21/19, | | | | | | | | | | | | | | |
Strike Price $107.00 | | | | | (2,000 | ) | | | (20 | ) | | $ | (650 | ) |
iShares U.S. Real Estate ETF, | | | | | | | | | | | | | | |
Expires 05/03/19, | | | | | | | | | | | | | | |
Strike Price $87.00 | | | | | (4,100 | ) | | | (41 | ) | | | (1,763 | ) |
iShares U.S. Real Estate ETF, | | | | | | | | | | | | | | |
Expires 05/10/19, | | | | | | | | | | | | | | |
Strike Price $88.00 | | | | | (600 | ) | | | (6 | ) | | | (162 | ) |
Kinder Morgan, Inc., | | | | | | | | | | | | | | |
Expires 05/17/19, | | | | | | | | | | | | | | |
Strike Price $20.50 | | | | | (800 | ) | | | (8 | ) | | | (112 | ) |
Kinder Morgan, Inc., | | | | | | | | | | | | | | |
Expires 05/24/19, | | | | | | | | | | | | | | |
Strike Price $20.00 | | | | | (4,000 | ) | | | (40 | ) | | | (1,680 | ) |
Sempra Energy, | | | | | | | | | | | | | | |
Expires 05/17/19, | | | | | | | | | | | | | | |
Strike Price $130.00 | | | | | (400 | ) | | | (4 | ) | | | (408 | ) |
Southern Co. (The), | | | | | | | | | | | | | | |
Expires 05/17/19, | | | | | | | | | | | | | | |
Strike Price $47.00 | | | | | (1,000 | ) | | | (10 | ) | | | (6,040 | ) |
Verizon Communications, Inc., | | | | | | | | | | | | | | |
Expires 05/17/19, | | | | | | | | | | | | | | |
Strike Price $58.00 | | | | | (2,700 | ) | | | (27 | ) | | | (1,188 | ) |
| | | | | | | | | | | | | | | |
Written Put Options | | | | | | | | | | | | | | |
iShares 20+ Year Treasury Bond ETF, | | | | | | | | | | | | | | |
Expires 05/03/19, | | | | | | | | | | | | | | |
Strike Price $122.00 | | | | | (2,000 | ) | | | (20 | ) | | | (140 | ) |
iShares 20+ Year Treasury Bond ETF, | | | | | | | | | | | | | | |
Expires 05/10/19, | | | | | | | | | | | | | | |
Strike Price $121.00 | | | | | (3,000 | ) | | | (30 | ) | | | (330 | ) |
iShares 20+ Year Treasury Bond ETF, | | | | | | | | | | | | | | |
Expires 05/17/19, | | | | | | | | | | | | | | |
Strike Price $118.00 | | | | | (1,000 | ) | | | (10 | ) | | | (40 | ) |
iShares 20+ Year Treasury Bond ETF, | | | | | | | | | | | | | | |
Expires 05/17/19, | | | | | | | | | | | | | | |
Strike Price $120.00 | | | | | (5,000 | ) | | | (50 | ) | | | (450 | ) |
iShares 20+ Year Treasury Bond ETF, | | | | | | | | | | | | | | |
Expires 05/17/19, | | | | | | | | | | | | | | |
Strike Price $122.00 | | | | | (3,000 | ) | | | (30 | ) | | | (1,050 | ) |
iShares 20+ Year Treasury Bond ETF, | | | | | | | | | | | | | | |
Expires 05/24/19, | | | | | | | | | | | | | | |
Strike Price $120.00 | | | | | (4,000 | ) | | | (40 | ) | | | (560 | ) |
iShares 20+ Year Treasury Bond ETF, | | | | | | | | | | | | | | |
Expires 05/31/19, | | | | | | | | | | | | | | |
Strike Price $120.00 | | | | | (4,000 | ) | | | (40 | ) | | | (840 | ) |
iShares 20+ Year Treasury Bond ETF, | | | | | | | | | | | | | | |
Expires 06/07/19, | | | | | | | | | | | | | | |
Strike Price $120.00 | | | | | (2,000 | ) | | | (20 | ) | | | (680 | ) |
iShares 20+ Year Treasury Bond ETF, | | | | | | | | | | | | | | |
Expires 06/21/19, | | | | | | | | | | | | | | |
Strike Price $120.00 | | | | | (6,200 | ) | | | (62 | ) | | | (2,480 | ) |
iShares 7-10 Year Treasury Bond ETF, | | | | | | | | | | | | | | |
Expires 05/17/19, | | | | | | | | | | | | | | |
Strike Price $104.00 | | | | | (3,000 | ) | | | (30 | ) | | | (120 | ) |
iShares 7-10 Year Treasury Bond ETF, | | | | | | | | | | | | | | |
Expires 05/17/19, | | | | | | | | | | | | | | |
Strike Price $105.00 | | | | | (3,000 | ) | | | (30 | ) | | | (525 | ) |
The accompanying notes are an integral part of these financial statements.
16
Schedule of Investments — Virtus InfraCap U.S. Preferred Stock ETF(continued)
April 30, 2019 (unaudited)
| | | | Notional
Amount
| | Number of
contracts
| | Value
|
Written Options (continued) | | | | | | | | | | | | | | |
| | | | | | | | | | | | | | | |
Written Call Options (continued) | | | | | | | | | | | | | | |
iShares 7-10 Year Treasury Bond ETF, | | | | | | | | | | | | | | |
Expires 05/17/19, | | | | | | | | | | | | | | |
Strike Price $106.00 | | | | | (2,000 | ) | | | (20 | ) | | $ | (1,240 | ) |
iShares 7-10 Year Treasury Bond ETF, | | | | | | | | | | | | | | |
Expires 06/21/19, | | | | | | | | | | | | | | |
Strike Price $103.00 | | | | | (2,000 | ) | | | (20 | ) | | | (200 | ) |
iShares 7-10 Year Treasury Bond ETF, | | | | | | | | | | | | | | |
Expires 06/21/19, | | | | | | | | | | | | | | |
Strike Price $105.00 | | | | | (1,000 | ) | | | (10 | ) | | | (425 | ) |
iShares 7-10 Year Treasury Bond ETF, | | | | | | | | | | | | | | |
Expires 07/19/19, | | | | | | | | | | | | | | |
Strike Price $105.00 | | | | | (1,000 | ) | | | (10 | ) | | | (600 | ) |
iShares U.S. Real Estate ETF, | | | | | | | | | | | | | | |
Expires 05/03/19, | | | | | | | | | | | | | | |
Strike Price $84.00 | | | | | (1,000 | ) | | | (10 | ) | | | (40 | ) |
iShares U.S. Real Estate ETF, | | | | | | | | | | | | | | |
Expires 05/10/19, | | | | | | | | | | | | | | |
Strike Price $84.00 | | | | | (2,000 | ) | | | (20 | ) | | | (260 | ) |
iShares U.S. Real Estate ETF, | | | | | | | | | | | | | | |
Expires 05/10/19, | | | | | | | | | | | | | | |
Strike Price $85.50 | | | | | (4,000 | ) | | | (40 | ) | | | (1,120 | ) |
iShares U.S. Real Estate ETF, | | | | | | | | | | | | | | |
Expires 05/17/19, | | | | | | | | | | | | | | |
Strike Price $83.00 | | | | | (4,000 | ) | | | (40 | ) | | | (640 | ) |
iShares U.S. Real Estate ETF, | | | | | | | | | | | | | | |
Expires 05/17/19, | | | | | | | | | | | | | | |
Strike Price $85.00 | | | | | (4,000 | ) | | | (40 | ) | | | (1,360 | ) |
iShares U.S. Real Estate ETF, | | | | | | | | | | | | | | |
Expires 05/24/19, | | | | | | | | | | | | | | |
Strike Price $84.00 | | | | | (5,000 | ) | | | (50 | ) | | | (2,000 | ) |
Kinder Morgan, Inc., | | | | | | | | | | | | | | |
Expires 05/03/19, | | | | | | | | | | | | | | |
Strike Price $19.00 | | | | | (3,000 | ) | | | (30 | ) | | | (30 | ) |
Kinder Morgan, Inc., | | | | | | | | | | | | | | |
Expires 05/10/19, | | | | | | | | | | | | | | |
Strike Price $19.50 | | | | | (5,000 | ) | | | (50 | ) | | | (650 | ) |
Kinder Morgan, Inc., | | | | | | | | | | | | | | |
Expires 05/24/19, | | | | | | | | | | | | | | |
Strike Price $19.00 | | | | | (5,000 | ) | | | (50 | ) | | | (500 | ) |
Kinder Morgan, Inc., | | | | | | | | | | | | | | |
Expires 05/31/19, | | | | | | | | | | | | | | |
Strike Price $19.50 | | | | | (5,000 | ) | | | (50 | ) | | | (1,450 | ) |
Kinder Morgan, Inc., | | | | | | | | | | | | | | |
Expires 06/07/19, | | | | | | | | | | | | | | |
Strike Price $19.50 | | | | | (5,000 | ) | | | (50 | ) | | | (1,550 | ) |
Kinder Morgan, Inc., | | | | | | | | | | | | | | |
Expires 06/21/19, | | | | | | | | | | | | | | |
Strike Price $19.00 | | | | | (5,000 | ) | | | (50 | ) | | | (1,300 | ) |
| | | | | | | | | | | | | | | |
| | | | Notional
Amount
| | Number of
contracts
| | Value
|
Written Options (continued) | | | | | | | | | | | | | | |
| | | | | | | | | | | | | | | |
Written Call Options (continued) | | | | | | | | | | | | | | |
Public Storage, | | | | | | | | | | | | | | |
Expires 06/21/19, | | | | | | | | | | | | | | |
Strike Price $200.00 | | | | | (2,000 | ) | | | (20 | ) | | $ | (1,600 | ) |
Sempra Energy, | | | | | | | | | | | | | | |
Expires 05/17/19, | | | | | | | | | | | | | | |
Strike Price $120.00 | | | | | (2,000 | ) | | | (20 | ) | | | (900 | ) |
Sempra Energy, | | | | | | | | | | | | | | |
Expires 05/17/19, | | | | | | | | | | | | | | |
Strike Price $125.00 | | | | | (1,000 | ) | | | (10 | ) | | | (900 | ) |
Southern Co. (The), | | | | | | | | | | | | | | |
Expires 05/03/19, | | | | | | | | | | | | | | |
Strike Price $50.00 | | | | | (4,000 | ) | | | (40 | ) | | | (200 | ) |
Southern Co. (The), | | | | | | | | | | | | | | |
Expires 05/10/19, | | | | | | | | | | | | | | |
Strike Price $50.00 | | | | | (4,000 | ) | | | (40 | ) | | | (460 | ) |
Southern Co. (The), | | | | | | | | | | | | | | |
Expires 05/17/19, | | | | | | | | | | | | | | |
Strike Price $50.00 | | | | | (4,000 | ) | | | (40 | ) | | | (880 | ) |
Southern Co. (The), | | | | | | | | | | | | | | |
Expires 05/24/19, | | | | | | | | | | | | | | |
Strike Price $50.00 | | | | | (3,000 | ) | | | (30 | ) | | | (675 | ) |
Southern Co. (The), | | | | | | | | | | | | | | |
Expires 05/31/19, | | | | | | | | | | | | | | |
Strike Price $50.00 | | | | | (3,000 | ) | | | (30 | ) | | | (780 | ) |
Verizon Communications, Inc., | | | | | | | | | | | | | | |
Expires 05/03/19, | | | | | | | | | | | | | | |
Strike Price $56.00 | | | | | (3,000 | ) | | | (30 | ) | | | (210 | ) |
Verizon Communications, Inc., | | | | | | | | | | | | | | |
Expires 05/03/19, | | | | | | | | | | | | | | |
Strike Price $57.00 | | | | | (4,000 | ) | | | (40 | ) | | | (760 | ) |
Verizon Communications, Inc., | | | | | | | | | | | | | | |
Expires 05/10/19, | | | | | | | | | | | | | | |
Strike Price $56.00 | | | | | (3,000 | ) | | | (30 | ) | | | (570 | ) |
Verizon Communications, Inc., | | | | | | | | | | | | | | |
Expires 05/24/19, | | | | | | | | | | | | | | |
Strike Price $56.00 | | | | | (3,000 | ) | | | (30 | ) | | | (1,110 | ) |
| | | | | | | | |
TOTAL WRITTEN OPTIONS — (0.2)% | | | | | | | |
(Premiums Received $64,432) | | | | | | | | | | | | $ | (52,283 | ) |
* | | Non-income producing security. |
(1) | | Substantially all the securities, or a portion thereof, have been pledged as collateral for line of credit borrowings, short sales and open written option contracts. The aggregate market value of the collateral at April 30, 2019 was $25,853,482. |
(2) | | Subject to written call options. |
The accompanying notes are an integral part of these financial statements.
17
Schedule of Investments — Virtus InfraCap U.S. Preferred Stock ETF(continued)
April 30, 2019 (unaudited)
The following table summarizes valuation of the Fund’s investments under the fair value hierarchy levels as of April 30, 2019 (See Note 2 in the Notes to Financial Statements):
| | | | Level 1
| | Level 2
| | Level 3
| | Total
|
Asset Valuation Inputs | | | | | | | | | | | | | | | | | | |
Preferred Stocks | | | | $ | 30,258,430 | | | $ | — | | | $ | — | | | $ | 30,258,430 | |
Common Stocks | | | | | 833,735 | | | | — | | | | — | | | | 833,735 | |
Exchange Traded Fund | | | | | 411,684 | | | | — | | | | — | | | | 411,684 | |
Total | | | | $ | 31,503,849 | | | $ | — | | | $ | — | | | $ | 31,503,849 | |
| | | | | | | | | | | | | | | | | | | |
Liability Valuation Inputs | | | | | | | | | | | | | | | | | | |
Exchange Traded Funds | | | | $ | 1,395,050 | | | $ | — | | | $ | — | | | $ | 1,395,050 | |
Written Options | | | | | 52,163 | | | | 120 | | | | — | | | | 52,283 | |
Total | | | | $ | 1,447,213 | | | $ | 120 | | | $ | — | | | $ | 1,447,333 | |
The accompanying notes are an integral part of these financial statements.
18
Schedule of Investments — Virtus LifeSci Biotech Clinical Trials ETF
April 30, 2019 (unaudited)
Security Description
| | | | Shares
| | Value
|
Common Stocks — 99.8% | | | | | | | | | | |
| | | | | | | | | | | |
Health Care — 98.7% | | | | | | | | | | |
Abeona Therapeutics, Inc.*(1) | | | | | 35,468 | | | $ | 273,104 | |
Acceleron Pharma, Inc.*(1) | | | | | 5,810 | | | | 236,641 | |
Achillion Pharmaceuticals, Inc.* | | | | | 86,904 | | | | 257,236 | |
Adaptimmune Therapeutics PLC*(1)(2) | | | | | 50,655 | | | | 243,144 | |
Agenus, Inc.* | | | | | 107,479 | | | | 276,221 | |
Aimmune Therapeutics, Inc.*(1) | | | | | 11,993 | | | | 241,539 | |
Akcea Therapeutics, Inc.*(1) | | | | | 8,527 | | | | 213,942 | |
Akebia Therapeutics, Inc.*(1) | | | | | 33,514 | | | | 202,425 | |
Alder Biopharmaceuticals, Inc.*(1) | | | | | 24,561 | | | | 333,784 | |
Allakos, Inc.*(1) | | | | | 4,437 | | | | 173,975 | |
AnaptysBio, Inc.*(1) | | | | | 3,855 | | | | 280,336 | |
Apellis Pharmaceuticals, Inc.*(1) | | | | | 14,338 | | | | 284,036 | |
Aptinyx, Inc.* | | | | | 12,427 | | | | 47,844 | |
Arena Pharmaceuticals, Inc.*(1) | | | | | 6,299 | | | | 288,179 | |
ArQule, Inc.* | | | | | 79,630 | | | | 475,391 | |
Arrowhead Pharmaceuticals, Inc.*(1) | | | | | 18,120 | | | | 325,798 | |
Ascendis Pharma A/S (Denmark)*(2) | | | | | 4,250 | | | | 473,365 | |
Assembly Biosciences, Inc.* | | | | | 11,966 | | | | 188,823 | |
Assertio Therapeutics, Inc.*(1) | | | | | 64,315 | | | | 268,194 | |
Atara Biotherapeutics, Inc.*(1) | | | | | 6,237 | | | | 209,563 | |
Athenex, Inc.*(1) | | | | | 21,463 | | | | 212,054 | |
Audentes Therapeutics, Inc.* | | | | | 11,716 | | | | 442,748 | |
Autolus Therapeutics PLC (United Kingdom)*(2) | | | | | 8,434 | | | | 220,802 | |
Avrobio, Inc.*(1) | | | | | 10,850 | | | | 204,088 | |
BeiGene Ltd. (China)*(1)(2) | | | | | 2,041 | | | | 253,553 | |
BioCryst Pharmaceuticals, Inc.*(1) | | | | | 31,277 | | | | 232,388 | |
Biohaven Pharmaceutical Holding Co., Ltd.* | | | | | 7,409 | | | | 443,429 | |
Bluebird Bio, Inc.*(1) | | | | | 2,635 | | | | 373,722 | |
Blueprint Medicines Corp.*(1) | | | | | 4,741 | | | | 358,467 | |
Cara Therapeutics, Inc.* | | | | | 19,092 | | | | 364,275 | |
ChemoCentryx, Inc.* | | | | | 26,452 | | | | 351,018 | |
Corbus Pharmaceuticals Holdings, Inc.*(1) | | | | | 40,628 | | | | 290,084 | |
Crinetics Pharmaceuticals, Inc.*(1) | | | | | 7,934 | | | | 205,887 | |
Cymabay Therapeutics, Inc.* | | | | | 30,947 | | | | 396,431 | |
Cytokinetics, Inc.*(1) | | | | | 33,758 | | | | 297,746 | |
CytomX Therapeutics, Inc.*(1) | | | | | 18,085 | | | | 171,988 | |
Deciphera Pharmaceuticals, Inc.*(1) | | | | | 10,578 | | | | 243,294 | |
Denali Therapeutics, Inc.*(1) | | | | | 13,201 | | | | 323,028 | |
Dicerna Pharmaceuticals, Inc.*(1) | | | | | 21,767 | | | | 282,100 | |
Eidos Therapeutics, Inc.*(1) | | | | | 17,604 | | | | 461,401 | |
Epizyme, Inc.*(1) | | | | | 45,462 | | | | 564,183 | |
Esperion Therapeutics, Inc.*(1) | | | | | 5,483 | | | | 236,317 | |
Fate Therapeutics, Inc.* | | | | | 16,612 | | | | 279,082 | |
FibroGen, Inc.* | | | | | 6,840 | | | | 319,633 | |
Five Prime Therapeutics, Inc.*(1) | | | | | 27,492 | | | | 304,611 | |
G1 Therapeutics, Inc.*(1) | | | | | 8,654 | | | | 185,196 | |
Geron Corp.*(1) | | | | | 192,961 | | | | 351,189 | |
| | | | | | | | | | | |
Security Description
| | | | Shares
| | Value
|
Common Stocks (continued) | | | | | | | | | | |
| | | | | | | | | | | |
Health Care (continued) | | | | | | | | | | |
Global Blood Therapeutics, Inc.*(1) | | | | | 6,342 | | | $ | 351,347 | |
GlycoMimetics, Inc.*(1) | | | | | 26,550 | | | | 323,114 | |
ImmunoGen, Inc.* | | | | | 50,045 | | | | 119,608 | |
Immunomedics, Inc.*(1) | | | | | 14,024 | | | | 224,664 | |
Inovio Pharmaceuticals, Inc.*(1) | | | | | 52,943 | | | | 199,066 | |
Insmed, Inc.*(1) | | | | | 17,912 | | | | 545,241 | |
Intra-Cellular Therapies, Inc.*(1) | | | | | 18,878 | | | | 248,623 | |
Iovance Biotherapeutics, Inc.* | | | | | 26,984 | | | | 307,618 | |
Kadmon Holdings, Inc.*(1) | | | | | 119,987 | | | | 281,969 | |
Karyopharm Therapeutics, Inc.*(1) | | | | | 27,391 | | | | 127,916 | |
Kiniksa Pharmaceuticals Ltd Class A* | | | | | 11,763 | | | | 175,622 | |
Kura Oncology, Inc.*(1) | | | | | 19,441 | | | | 294,337 | | |
La Jolla Pharmaceutical Co.*(1) | | | | | 20,779 | | | | 167,271 | |
MacroGenics, Inc.* | | | | | 18,582 | | | | 311,620 | |
Madrigal Pharmaceuticals, Inc.*(1) | | | | | 2,425 | | | | 257,244 | |
Marker Therapeutics, Inc.*(1) | | | | | 39,672 | | | | 209,468 | |
Mirati Therapeutics, Inc.*(1) | | | | | 6,506 | | | | 387,042 | |
MyoKardia, Inc.* | | | | | 4,859 | | | | 233,135 | |
Neuronetics, Inc.*(1) | | | | | 13,535 | | | | 225,628 | |
Nightstar Therapeutics PLC*(2) | | | | | 23,777 | | | | 607,740 | |
Novavax, Inc.*(1) | | | | | 116,769 | | | | 62,039 | |
Optinose, Inc.*(1) | | | | | 34,499 | | | | 343,610 | |
Principia Biopharma, Inc.* | | | | | 9,048 | | | | 270,626 | |
Progenics Pharmaceuticals, Inc.*(1) | | | | | 57,283 | | | | 294,435 | |
ProQR Therapeutics NV (Netherlands)* | | | | | 14,925 | | | | 164,474 | |
Prothena Corp. PLC (Ireland)* | | | | | 22,918 | | | | 238,347 | |
PTC Therapeutics, Inc.* | | | | | 7,947 | | | | 297,377 | |
Ra Pharmaceuticals, Inc.* | | | | | 16,188 | | | | 359,374 | |
Reata Pharmaceuticals, Inc. Class A*(1) | | | | | 4,396 | | | | 344,910 | |
REGENXBIO, Inc.*(1) | | | | | 5,841 | | | | 294,386 | |
Rhythm Pharmaceuticals, Inc.*(1) | | | | | 9,468 | | | | 239,351 | |
Rocket Pharmaceuticals, Inc.* | | | | | 17,799 | | | | 330,349 | |
Sage Therapeutics, Inc.*(1) | | | | | 2,645 | | | | 444,968 | |
Sangamo Therapeutics, Inc.* | | | | | 23,214 | | | | 271,372 | |
Savara, Inc.* | | | | | 36,474 | | | | 389,542 | |
Solid Biosciences, Inc.* | | | | | 11,384 | | | | 103,367 | |
Sorrento Therapeutics, Inc.*(1) | | | | | 107,761 | | | | 393,328 | |
Stemline Therapeutics, Inc.* | | | | | 26,854 | | | | 402,810 | |
TG Therapeutics, Inc.*(1) | | | | | 53,943 | | | | 428,847 | |
Tricida, Inc.*(1) | | | | | 8,627 | | | | 295,561 | |
uniQure N.V. (Netherlands)* | | | | | 9,543 | | | | 536,221 | |
UNITY Biotechnology, Inc.* | | | | | 16,533 | | | | 136,067 | |
Viking Therapeutics, Inc.*(1) | | | | | 28,854 | | | | 225,927 | |
Voyager Therapeutics, Inc.* | | | | | 25,651 | | | | 541,236 | |
WaVe Life Sciences Ltd*(1) | | | | | 5,373 | | | | 142,546 | |
Xencor, Inc.*(1) | | | | | 7,160 | | | | 219,884 | |
ZIOPHARM Oncology, Inc.*(1) | | | | | 92,148 | | | | 407,294 | |
Total Health Care | | | | | | | | | 27,438,775 | |
The accompanying notes are an integral part of these financial statements.
19
Schedule of Investments — Virtus LifeSci Biotech Clinical Trials ETF(continued)
April 30, 2019 (unaudited)
Security Description
| | | | Shares
| | Value
|
Common Stocks (continued) | | | | | | | | | | |
| | | | | | | | | | | |
Materials — 1.1% | | | | | | | | | | |
Amyris, Inc.*(1) | | | | | 65,658 | | | $ | 294,148 | |
Total Materials | | | | | | | | | 294,148 | |
| | | | | | | | | | | |
Total Common Stocks | | | | | | | | | | |
(Cost $33,585,055) | | | | | | | | | 27,732,923 | |
| | | | |
SECURITIES LENDING COLLATERAL — 8.8% | | | |
| | | | | | | | | | | |
Money Market Fund — 8.8% | | | | | | | | | | |
Dreyfus Government Cash Management
Fund, 2.33%(3)(4) | | | | | | | | | | |
(Cost $2,448,388) | | | | | 2,448,388 | | | | 2,448,388 | |
| | | | | | | | | | | |
TOTAL INVESTMENTS — 108.6% | | | | | | | | | | |
(Cost $36,033,443) | | | | | | | | $ | 30,181,311 | |
| | | | | | | | | | | |
Liabilities in Excess of Other Assets — (8.6)% | | | | | | | | | (2,380,818 | ) |
| | | | | | | | | | | |
Net Assets — 100.0% | | | | | | | | $ | 27,800,493 | |
* | | Non-income producing security. |
(1) | | All or a portion of the security was on loan. The aggregate market value of securities on loan was $8,133,811; total market value of collateral held by the Fund was $8,510,669. Market value of the collateral held includes non-cash U.S. Treasury securities having a value of $6,062,281. |
(2) | | American Depositary Receipts. |
(3) | | Represents securities purchased with cash collateral received for securities on loan. |
(4) | | The rate shown reflects the seven-day yield as of April 30, 2019. |
The following table summarizes valuation of the Fund’s investments under the fair value hierarchy levels as of April 30, 2019 (See Note 2 in the Notes to Financial Statements):
| | | | Level 1
| | Level 2
| | Level 3
| | Total
|
Asset Valuation Inputs | | | | | | | | | | | | | | | | | | |
Common Stocks | | | | $ | 27,732,923 | | | $ | — | | | $ | — | | | $ | 27,732,923 | |
Money Market Fund | | | | | 2,448,388 | | | | — | | | | — | | | | 2,448,388 | |
Total | | | | $ | 30,181,311 | | | $ | — | | | $ | — | | | $ | 30,181,311 | |
The accompanying notes are an integral part of these financial statements.
20
Schedule of Investments — Virtus LifeSci Biotech Products ETF
April 30, 2019 (unaudited)
Security Description
| | | | Shares
| | Value
|
Common Stocks — 99.8% | | | | | | | | | | |
| | | | | | | | | | | |
Health Care — 99.8% | | | | | | | | | | |
ACADIA Pharmaceuticals, Inc.*(1) | | | | | 45,936 | | | $ | 1,104,761 | |
Acorda Therapeutics, Inc.*(1) | | | | | 51,534 | | | | 538,530 | |
Agios Pharmaceuticals, Inc.*(1) | | | | | 15,470 | | | | 865,082 | |
Alexion Pharmaceuticals, Inc.* | | | | | 7,328 | | | | 997,561 | |
Alnylam Pharmaceuticals, Inc.*(1) | | | | | 10,890 | | | | 972,913 | |
Amgen, Inc. | | | | | 4,207 | | | | 754,399 | |
Amicus Therapeutics, Inc.* | | | | | 78,285 | | | | 1,044,322 | |
Array BioPharma, Inc.*(1) | | | | | 51,924 | | | | 1,174,002 | |
Biogen, Inc.* | | | | | 2,578 | | | | 590,981 | |
BioMarin Pharmaceutical, Inc.* | | | | | 8,772 | | | | 750,269 | |
Celgene Corp.* | | | | | 11,806 | | | | 1,117,556 | |
Clovis Oncology, Inc.*(1) | | | | | 38,065 | | | | 695,448 | |
Cyclerion Therapeutics, Inc.* | | | | | 7,311 | | | | 111,347 | |
Dynavax Technologies Corp.*(1) | | | | | 78,506 | | | | 522,065 | |
Enanta Pharmaceuticals, Inc.*(1) | | | | | 11,314 | | | | 986,468 | |
Exelixis, Inc.* | | | | | 38,676 | | | | 760,370 | |
Gilead Sciences, Inc. | | | | | 12,349 | | | | 803,179 | |
Halozyme Therapeutics, Inc.*(1) | | | | | 53,994 | | | | 870,923 | |
Incyte Corp.* | | | | | 12,230 | | | | 939,264 | |
Intercept Pharmaceuticals, Inc.*(1) | | | | | 7,616 | | | | 656,347 | |
Ionis Pharmaceuticals, Inc.*(1) | | | | | 15,403 | | | | 1,144,905 | |
Ironwood Pharmaceuticals, Inc.*(1) | | | | | 73,078 | | | | 868,897 | |
Lexicon Pharmaceuticals, Inc.*(1) | | | | | 116,147 | | | | 673,653 | |
Ligand Pharmaceuticals, Inc.*(1) | | | | | 5,801 | | | | 730,056 | |
Medicines Co. (The)*(1) | | | | | 41,679 | | | | 1,331,644 | |
Momenta Pharmaceuticals, Inc.* | | | | | 73,654 | | | | 1,030,419 | |
Nektar Therapeutics*(1) | | | | | 21,679 | | | | 694,162 | |
Neurocrine Biosciences, Inc.* | | | | | 11,281 | | | | 814,939 | |
Omeros Corp.*(1) | | | | | 61,509 | | | | 1,158,830 | |
Portola Pharmaceuticals, Inc.*(1) | | | | | 43,087 | | | | 1,520,971 | |
Puma Biotechnology, Inc.*(1) | | | | | 35,487 | | | | 1,139,842 | |
Radius Health, Inc.*(1) | | | | | 51,602 | | | | 1,136,276 | |
Regeneron Pharmaceuticals, Inc.* | | | | | 2,171 | | | | 744,957 | |
| | | | | | | | | | | |
Security Description
| | | | Shares
| | Value
|
Common Stocks (continued) | | | | | | | | | | |
| | | | | | | | | | | |
Health Care (continued) | | | | | | | | | | |
Retrophin, Inc.*(1) | | | | | 33,316 | | | $ | 635,669 | |
Sarepta Therapeutics, Inc.*(1) | | | | | 6,751 | | | | 789,462 | |
Seattle Genetics, Inc.* | | | | | 13,503 | | | | 915,233 | |
Theravance Biopharma, Inc. (Cayman Islands)*(1) | | | | | 30,398 | | | | 724,992 | |
Ultragenyx Pharmaceutical, Inc.*(1) | | | | | 17,404 | | | | 1,148,664 | |
United Therapeutics Corp.* | | | | | 7,481 | | | | 767,326 | |
Vanda Pharmaceuticals, Inc.* | | | | | 31,484 | | | | 512,874 | |
Vertex Pharmaceuticals, Inc.* | | | | | 4,750 | | | | 802,655 | |
Total Health Care | | | | | | | | | 35,542,213 | |
| | | | | | | | | | | |
Total Common Stocks | | | | | | | | | | |
(Cost $38,708,267) | | | | | | | | | 35,542,213 | |
| | | | |
SECURITIES LENDING COLLATERAL — 7.1% | | | |
| | | | | | | | | | | |
Money Market Fund — 7.1% | | | | | | | | | | |
Dreyfus Government Cash Management
Fund, 2.33%(2)(3) | | | | | | | | | | |
(Cost $2,527,736) | | | | | 2,527,736 | | | | 2,527,736 | |
| | | | | | | | | | | |
TOTAL INVESTMENTS — 106.9% | | | | | | | | | | |
(Cost $41,236,003) | | | | | | | | | 38,069,949 | |
Liabilities in Excess of Other Assets — (6.9)% | | | | | | | | | (2,463,297 | ) |
Net Assets — 100.0% | | | | | | | | $ | 35,606,652 | |
* | | Non-income producing security. |
(1) | | All or a portion of the security was on loan. The aggregate market value of securities on loan was $10,393,167; total market value of collateral held by the Fund was $10,853,522. Market value of the collateral held includes non-cash U.S. Treasury securities having a value of $8,325,786. |
(2) | | Represents securities purchased with cash collateral received for securities on loan. |
(3) | | The rate shown reflects the seven-day yield as of April 30, 2019. |
The following table summarizes valuation of the Fund’s investments under the fair value hierarchy levels as of April 30, 2019 (See Note 2 in the Notes to Financial Statements):
| | | | Level 1
| | Level 2
| | Level 3
| | Total
|
Asset Valuation Inputs | | | | | | | | | | | | | | | | | | |
Common Stocks | | | | $ | 35,542,213 | | | $ | — | | | $ | — | | | $ | 35,542,213 | |
Money Market Fund | | | | | 2,527,736 | | | | — | | | | — | | | | 2,527,736 | |
Total | | | | $ | 38,069,949 | | | $ | — | | | $ | — | | | $ | 38,069,949 | |
The accompanying notes are an integral part of these financial statements.
21
Schedule of Investments — Virtus Newfleet Multi-Sector Bond ETF
April 30, 2019 (unaudited)
Security Description
| | | | Principal
| | Value
|
CORPORATE BONDS — 13.1% | | | | | | | | | | |
| | | | | | | | | | | |
Communication Services — 1.4% | | | | | | | | | | |
AT&T, Inc., 3.78%, (3-Month USD LIBOR + 1.18%), 06/12/24(1) | | | | $ | 63,000 | | | $ | 63,309 | |
Charter Communications Operating, LLC / Charter Communications Operating Capital, 4.91%, 07/23/25 | | | | | 120,000 | | | | 127,392 | |
Cincinnati Bell, Inc., 7.00%, 07/15/24(2) | | | | | 54,000 | | | | 50,087 | |
Clear Channel Worldwide Holdings, Inc.,
9.25%, 02/15/24(2) | | | | | 55,000 | | | | 59,331 | |
Consolidated Communications, Inc., 6.50%,
10/01/22 | | | | | 70,000 | | | | 66,762 | |
Discovery Communications LLC,
3.95%, 03/20/28 | | | | | 112,000 | | | | 110,371 | |
DISH DBS Corp., 5.88%, 07/15/22 | | | | | 40,000 | | | | 39,178 | |
DISH DBS Corp., 7.75%, 07/01/26 | | | | | 33,000 | | | | 29,617 | |
Frontier Communications Corp., 8.50%,
04/15/20 | | | | | 22,000 | | | | 21,065 | |
Frontier Communications Corp., 7.63%,
04/15/24 | | | | | 55,000 | | | | 30,663 | |
Frontier Communications Corp., 8.50%,
04/01/26(2) | | | | | 18,000 | | | | 17,010 | |
iHeartCommunications, Inc., 9.00%, 12/15/19(3) | | | | | 265,000 | | | | 197,425 | |
McGraw-Hill Global Education Holdings LLC / McGraw-Hill Global Education Finance, 7.88%, 05/15/24(2) | | | | | 55,000 | | | | 47,231 | |
Meredith Corp., 6.88%, 02/01/26 | | | | | 33,000 | | | | 34,485 | |
Total Communication Services | | | | | | | | | 893,926 | |
| | | | | | | | | | | |
Consumer Discretionary — 2.0% | | | | | | | | | | |
Beazer Homes USA, Inc., 6.75%, 03/15/25 | | | | | 45,000 | | | | 43,594 | |
Beazer Homes USA, Inc., 5.88%, 10/15/27 | | | | | 30,000 | | | | 27,225 | |
Boyd Gaming Corp., 6.00%, 08/15/26 | | | | | 56,000 | | | | 58,380 | |
Bunge Ltd. Finance Corp., 4.35%, 03/15/24 | | | | | 77,000 | | | | 78,341 | |
Caesars Resort Collection LLC / CRC Finco, Inc., 5.25%, 10/15/25(2) | | | | | 31,000 | | | | 30,380 | |
Dollar Tree, Inc., 4.00%, 05/15/25 | | | | | 54,000 | | | | 55,147 | |
Downstream Development Authority of the Quapaw Tribe of Oklahoma,
10.50%, 02/15/23(2) | | | | | 21,000 | | | | 22,050 | |
Eldorado Resorts, Inc., 6.00%, 09/15/26 | | | | | 23,000 | | | | 23,977 | |
frontdoor, Inc., 6.75%, 08/15/26(2) | | | | | 46,000 | | | | 48,357 | |
GLP Capital LP / GLP Financing II, Inc.,
5.25%, 06/01/25 | | | | | 52,000 | | | | 54,779 | |
Golden Nugget, Inc., 6.75%, 10/15/24(2) | | | | | 45,000 | | | | 46,125 | |
Golden Nugget, Inc., 8.75%, 10/01/25(2) | | | | | 25,000 | | | | 26,250 | |
Lear Corp., 3.80%, 09/15/27 | | | | | 141,000 | | | | 137,415 | |
M/I Homes, Inc., 5.63%, 08/01/25 | | | | | 55,000 | | | | 54,244 | |
MGM Growth Properties Operating
Partnership LP / MGP Finance Co.-Issuer, Inc., 5.75%, 02/01/27(2) | | | | | 70,000 | | | | 73,762 | |
Neiman Marcus Group Ltd. LLC, 8.00%,
10/15/21(2) | | | | | 106,000 | | | | 59,360 | |
Panther Bf Aggregator 2 LP / Panther Finance Co., Inc., 6.25%, 05/15/26(2) | | | | | 5,000 | | | | 5,231 | |
Panther Bf Aggregator 2 LP / Panther Finance Co., Inc., 8.50%, 05/15/27(2) | | | | | 45,000 | | | | 46,575 | |
Prime Security Services Borrower LLC / Prime Finance, Inc., 5.25%, 04/15/24(2) | | | | | 10,000 | | | | 10,050 | |
| | | | | | | | | | | |
Security Description
| | | | Shares
| | Value
|
CORPORATE BONDS (continued) | | | | | | | | | | |
| | | | | | | | | | | |
Consumer Discretionary (continued) | | | | | | | | | | |
Prime Security Services Borrower LLC / Prime Finance, Inc., 5.75%, 04/15/26(2) | | | | $ | 5,000 | | | $ | 5,069 | |
Scientific Games International, Inc., 6.63%,
05/15/21 | | | | | 24,000 | | | | 24,360 | |
Scientific Games International, Inc., 8.25%,
03/15/26(2) | | | | | 25,000 | | | | 25,969 | |
Tenneco, Inc., 5.00%, 07/15/26 | | | | | 57,000 | | | | 46,883 | |
Under Armour, Inc., 3.25%, 06/15/26 | | | | | 65,000 | | | | 60,035 | |
Viking Cruises Ltd., 5.88%, 09/15/27(2) | | | | | 65,000 | | | | 64,838 | |
Vista Outdoor, Inc., 5.88%, 10/01/23 | | | | | 68,000 | | | | 62,900 | |
Weekley Homes LLC / Weekley Finance Corp., 6.63%, 08/15/25 | | | | | 70,000 | | | | 69,650 | |
William Lyon Homes, Inc., 6.00%, 09/01/23 | | | | | 70,000 | | | | 69,650 | |
Total Consumer Discretionary | | | | | | | | | 1,330,596 | |
| | | | | | | | | | | |
Consumer Staples — 0.4% | | | | | | | | | | |
Albertsons Cos. LLC / Safeway, Inc. / New Albertsons LP / Albertson’s LLC, 5.75%,
03/15/25 | | | | | 30,000 | | | | 29,925 | |
Altria Group, Inc., 4.40%, 02/14/26 | | | | | 12,000 | | | | 12,420 | |
Altria Group, Inc., 4.80%, 02/14/29 | | | | | 117,000 | | | | 121,445 | |
CVS Health Corp., 4.30%, 03/25/28 | | | | | 80,000 | | | | 80,659 | |
Total Consumer Staples | | | | | | | | | 244,449 | |
| | | | | | | | | | | |
Energy — 1.3% | | | | | | | | | | |
Blue Racer Midstream LLC / Blue Racer Finance Corp., 6.63%, 07/15/26(2) | | | | | 80,000 | | | | 82,100 | |
Callon Petroleum Co., 6.13%, 10/01/24 | | | | | 25,172 | | | | 25,983 | |
Cheniere Energy Partners LP, 5.63%, 10/01/26(2) | | | | | 30,000 | | | | 31,064 | |
Citgo Holding, Inc., 10.75%, 02/15/20(2) | | | | | 46,000 | | | | 47,495 | |
CrownRock LP / CrownRock Finance, Inc., 5.63%, 10/15/25(2) | | | | | 65,000 | | | | 64,431 | |
Denbury Resources, Inc., 9.25%, 03/31/22(2) | | | | | 26,000 | | | | 26,455 | |
Denbury Resources, Inc., 7.50%, 02/15/24(2) | | | | | 25,000 | | | | 23,125 | |
EP Energy LLC / Everest Acquisition Finance, Inc., 9.38%, 05/01/24(2) | | | | | 25,000 | | | | 9,500 | |
EP Energy LLC / Everest Acquisition Finance, Inc., 8.00%, 11/29/24(2) | | | | | 20,000 | | | | 13,700 | |
Kinder Morgan, Inc., Series G, 7.75%, 01/15/32 | | | | | 63,000 | | | | 82,753 | |
MPLX LP, 4.00%, 03/15/28 | | | | | 45,000 | | | | 45,096 | |
Nabors Industries, Inc., 5.50%, 01/15/23 | | | | | 56,000 | | | | 53,620 | |
Rowan Cos., Inc., 5.40%, 12/01/42 | | | | | 95,000 | | | | 60,325 | |
Sabine Pass Liquefaction LLC, 4.20%, 03/15/28 | | | | | 50,000 | | | | 50,599 | |
Sanchez Energy Corp., 7.25%, 02/15/23(2) | | | | | 12,000 | | | | 10,170 | |
Targa Resources Partners LP / Targa Resources Partners Finance Corp., 5.88%, 04/15/26 | | | | | 39,000 | | | | 41,157 | |
Transocean, Inc., 9.00%, 07/15/23(2) | | | | | 18,000 | | | | 19,327 | |
USA Compression Partners LP / USA Compression Finance Corp., 6.88%, 04/01/26 | | | | | 53,000 | | | | 55,849 | |
USA Compression Partners LP / USA Compression Finance Corp., 6.88%,
09/01/27(2) | | | | | 15,000 | | | | 15,863 | |
Vine Oil & Gas LP / Vine Oil & Gas Finance Corp., 8.75%, 04/15/23(2) | | | | | 130,000 | | | | 101,075 | |
Weatherford International Ltd., 9.88%, 02/15/24 | | | | | 35,000 | | | | 24,675 | |
Total Energy | | | | | | | | | 884,362 | |
The accompanying notes are an integral part of these financial statements.
22
Schedule of Investments — Virtus Newfleet Multi-Sector Bond ETF(continued)
April 30, 2019 (unaudited)
Security Description
| | | | Principal
| | Value
|
CORPORATE BONDS (continued) | | | | | | | | | | |
| | | | | | | | | | | |
Financials — 3.8% | | | | | | | | | | |
Acrisure, LLC / Acrisure Finance, Inc., 8.13%, 02/15/24(2) | | | | $ | 30,000 | | | $ | 31,425 | |
Acrisure, LLC / Acrisure Finance, Inc., 7.00%, 11/15/25(2) | | | | | 70,000 | | | | 63,700 | |
Allstate Corp. (The), Series B, 5.75%, (3-Month USD LIBOR + 2.94%), 08/15/53(1) | | | | | 95,000 | | | | 98,013 | |
Ares Capital Corp., 3.50%, 02/10/23 | | | | | 56,000 | | | | 55,446 | |
Athene Holding Ltd., 4.13%, 01/12/28 | | | | | 102,000 | | | | 99,162 | |
Aviation Capital Group LLC, 3.50%, 11/01/27(2) | | | | | 91,000 | | | | 87,138 | |
Bank of America Corp., 4.20%, 08/26/24 | | | | | 68,000 | | | | 70,604 | |
Brighthouse Financial, Inc., 3.70%, 06/22/27 | | | | | 148,000 | | | | 137,107 | |
BrightSphere Investment Group PLC, 4.80%, 07/27/26 | | | | | 80,000 | | | | 78,127 | |
Capital One Financial Corp., 3.75%, 07/28/26 | | | | | 95,000 | | | | 93,605 | |
E*TRADE Financial Corp., 4.50%, 06/20/28 | | | | | 102,000 | | | | 104,360 | |
FS KKR Capital Corp., 4.25%, 01/15/20 | | | | | 78,000 | | | | 78,181 | |
Goldman Sachs Group, Inc. (The), 3.85%,
(3-Month USD LIBOR + 1.17%), 05/15/26(1) | | | | | 84,000 | | | | 83,351 | |
Huntington Bancshares, Inc., 5.70%, (3-Month USD LIBOR + 2.88%), perpetual(1),(4) | | | | | 20,000 | | | | 20,063 | |
iStar, Inc., 5.25%, 09/15/22 | | | | | 25,000 | | | | 25,250 | |
JPMorgan Chase & Co., Series Z, 5.30%,
(3-Month USD LIBOR + 3.80%), 12/01/65, perpetual(1),(4) | | | | | 80,000 | | | | 81,433 | |
KeyCorp, Series D, 5.00%, (3-Month USD LIBOR + 3.61%), perpetual(1),(4) | | | | | 95,000 | | | | 94,372 | |
M&T Bank Corp., Series F, 5.13%, (3-Month USD LIBOR + 3.52%), perpetual(1),(4) | | | | | 35,000 | | | | 35,556 | |
MetLife, Inc., Series D, 5.88%, (3-Month USD LIBOR + 2.96%), perpetual(1),(4) | | | | | 52,000 | | | | 54,256 | |
Morgan Stanley, 3.13%, 07/27/26 | | | | | 80,000 | | | | 77,997 | |
Nationstar Mortgage Holdings, Inc., 8.13%,
07/15/23(2) | | | | | 55,000 | | | | 55,550 | |
Navient Corp., 6.75%, 06/25/25 | | | | | 84,000 | | | | 85,890 | |
PNC Financial Services Group, Inc.
(The), 5.00%, (3-Month USD LIBOR + 3.30%), perpetual(1),(4) | | | | | 95,000 | | | | 95,401 | |
Prudential Financial, Inc., 5.63%, (3-Month USD LIBOR + 3.92%), 06/15/43(1) | | | | | 90,000 | | | | 94,429 | |
Santander Holdings USA, Inc., 4.45%, 12/03/21 | | | | | 21,000 | | | | 21,705 | |
Santander Holdings USA, Inc., 4.40%, 07/13/27 | | | | | 74,000 | | | | 75,244 | |
Springleaf Finance Corp., 6.88%, 03/15/25 | | | | | 30,000 | | | | 32,250 | |
Springleaf Finance Corp., 7.13%, 03/15/26 | | | | | 22,000 | | | | 23,664 | |
Synchrony Financial, 3.95%, 12/01/27 | | | | | 170,000 | | | | 162,941 | |
Synovus Financial Corp., 5.90%, (USD 5 Year Swap + 3.38%), 02/07/29(1) | | | | | 55,000 | | | | 56,375 | |
Teachers Insurance & Annuity Association of America, 4.38%, (3-Month USD LIBOR + 2.66%), 09/15/54(1)(2) | | | | | 115,000 | | | | 118,010 | |
Wells Fargo & Co., Series S, 5.90%, (3-Month USD LIBOR + 3.11%), perpetual(1),(4) | | | | | 164,000 | | | | 170,501 | |
Total Financials | | | | | | | | | 2,461,106 | |
| | | | | | | | | | | |
Health Care — 1.0% | | | | | | | | | | |
Avantor, Inc., 6.00%, 10/01/24(2) | | | | | 32,000 | | | | 33,470 | |
Avantor, Inc., 9.00%, 10/01/25(2) | | | | | 45,000 | | | | 49,050 | |
Bausch Health Americas, Inc., 9.25%,
04/01/26(2) | | | | | 24,000 | | | | 26,760 | |
| | | | | | | | | | | |
Security Description
| | | | Shares
| | Value
|
CORPORATE BONDS (continued) | | | | | | | | | | |
| | | | | | | | | | | |
Health Care (continued) | | | | | | | | | | |
Bausch Health Americas, Inc., 8.50%,
01/31/27(2) | | | | $ | 10,000 | | | $ | 10,919 | |
Bausch Health Cos., Inc., 6.50%, 03/15/22(2) | | | | | 9,000 | | | | 9,326 | |
Bausch Health Cos., Inc., 7.00%, 03/15/24(2) | | | | | 9,000 | | | | 9,506 | |
Bausch Health Cos., Inc., 5.50%, 11/01/25(2) | | | | | 51,000 | | | | 52,387 | |
Centene Corp., 5.38%, 06/01/26(2) | | | | | 19,000 | | | | 19,879 | |
Cigna Corp., 4.13%, 11/15/25(2) | | | | | 63,000 | | | | 65,177 | |
Cigna Corp., 4.38%, 10/15/28(2) | | | | | 6,000 | | | | 6,195 | |
Eagle Holding Co. II LLC, 7.63%, 05/15/22(2)(5) | | | | | 36,000 | | | | 36,225 | |
HCA, Inc., 5.63%, 09/01/28 | | | | | 37,000 | | | | 39,498 | |
HCA, Inc., 5.88%, 02/01/29 | | | | | 10,000 | | | | 10,775 | |
MPH Acquisition Holdings LLC, 7.13%,
06/01/24(2) | | | | | 22,000 | | | | 22,169 | |
Mylan NV, 3.95%, 06/15/26 | | | | | 85,000 | | | | 81,934 | |
Ortho-Clinical Diagnostics, Inc. / Ortho-Clinical Diagnostics SA, 6.63%, 05/15/22(2) | | | | | 43,000 | | | | 42,462 | |
Par Pharmaceutical, Inc., 7.50%, 04/01/27(2) | | | | | 35,000 | | | | 36,393 | |
Surgery Center Holdings, Inc., 6.75%,
07/01/25(2) | | | | | 12,000 | | | | 11,220 | |
Surgery Center Holdings, Inc., 10.00%,
04/15/27(2) | | | | | 30,000 | | | | 30,900 | |
Tenet Healthcare Corp., 6.25%, 02/01/27(2) | | | | | 30,000 | | | | 31,313 | |
West Street Merger Sub, Inc., 6.38%,
09/01/25(2) | | | | | 39,000 | | | | 37,928 | |
Total Health Care | | | | | | | | | 663,486 | |
| | | | | | | | | | | |
Industrials — 0.9% | | | | | | | | | | |
Hillman Group, Inc. (The), 6.38%, 07/15/22(2) | | | | | 70,000 | | | | 65,100 | |
Navistar International Corp., 6.63%, 11/01/25(2) | | | | | 55,000 | | | | 56,375 | |
New Enterprise Stone & Lime Co., Inc., 10.13%, 04/01/22(2) | | | | | 112,000 | | | | 115,276 | |
Oshkosh Corp., 4.60%, 05/15/28 | | | | | 112,000 | | | | 113,342 | |
TransDigm, Inc., 6.50%, 05/15/25 | | | | | 100,000 | | | | 101,375 | |
US Airways Pass-Through Trust, Class B, Series 2012-1 8.00%, 10/01/19 | | | | | 125,501 | | | | 127,522 | |
Total Industrials | | | | | | | | | 578,990 | |
| | | | | | | | | | | |
Information Technology — 0.9% | | | | | | | | | | |
Banff Merger Sub, Inc., 9.75%, 09/01/26(2) | | | | | 10,000 | | | | 10,050 | |
Broadcom Corp. / Broadcom Cayman Finance Ltd., 3.63%, 01/15/24 | | | | | 117,000 | | | | 116,240 | |
Citrix Systems, Inc., 4.50%, 12/01/27 | | | | | 90,000 | | | | 90,106 | |
CommScope, Inc., 8.25%, 03/01/27(2) | | | | | 35,000 | | | | 37,887 | |
Dell International LLC / EMC Corp., 4.90%, 10/01/26(2) | | | | | 50,000 | | | | 51,267 | |
Dell International LLC / EMC Corp., 8.10%, 07/15/36(2) | | | | | 44,000 | | | | 53,135 | |
Everi Payments, Inc., 7.50%, 12/15/25(2) | | | | | 15,000 | | | | 15,637 | |
Exela Intermediate LLC / Exela Finance, Inc., 10.00%, 07/15/23(2) | | | | | 45,000 | | | | 45,548 | |
ViaSat, Inc., 5.63%, 09/15/25(2) | | | | | 55,000 | | | | 54,863 | |
ViaSat, Inc., 5.63%, 04/15/27(2) | | | | | 55,000 | | | | 56,238 | |
VMware, Inc., 3.90%, 08/21/27 | | | | | 80,000 | | | | 77,961 | |
Total Information Technology | | | | | | | | | 608,932 | |
| | | | | | | | | | | |
Materials — 0.5% | | | | | | | | | | |
Greif, Inc., 6.50%, 03/01/27(2) | | | | | 45,000 | | | | 46,350 | |
Hexion, Inc., 10.38%, 02/01/22(2)(3) | | | | | 138,000 | | | | 108,675 | |
The accompanying notes are an integral part of these financial statements.
23
Schedule of Investments — Virtus Newfleet Multi-Sector Bond ETF(continued)
April 30, 2019 (unaudited)
Security Description
| | | | Principal
| | Value
|
CORPORATE BONDS (continued) | | | | | | | | | | |
| | | | | | | | | | | |
Materials (continued) | | | | | | | | | | |
Kraton Polymers LLC / Kraton Polymers Capital Corp., 7.00%, 04/15/25(2) | | | | $ | 60,000 | | | $ | 62,307 | |
LSB Industries, Inc., 9.63%, 05/01/23(2) | | | | | 35,000 | | | | 36,488 | |
Reynolds Group Issuer, Inc. / Reynolds Group Issuer LLC / Reynolds Group Issuer Lu, 7.00%, 07/15/24(2) | | | | | 42,000 | | | | 43,496 | |
Trident Merger Sub, Inc., 6.63%, 11/01/25(2) | | | | | 40,000 | | | | 37,500 | |
Total Materials | | | | | | | | | 334,816 | |
| | | | | | | | | | | |
Real Estate — 0.7% | | | | | | | | | | |
EPR Properties, 4.75%, 12/15/26 | | | | | 75,000 | | | | 77,355 | |
Healthcare Trust of America Holdings LP, 3.75%, 07/01/27 | | | | | 59,000 | | | | 58,456 | |
Hospitality Properties Trust, 4.38%, 02/15/30 | | | | | 100,000 | | | | 93,850 | |
Life Storage LP, 3.88%, 12/15/27 | | | | | 19,000 | | | | 18,660 | |
LifeStorage LP, 3.50%, 07/01/26 | | | | | 54,000 | | | | 52,167 | |
MPT Operating Partnership LP / MPT Finance Corp., 5.00%, 10/15/27 | | | | | 32,000 | | | | 32,160 | |
Physicians Realty LP, 4.30%, 03/15/27 | | | | | 126,000 | | | | 125,646 | |
Realogy Group LLC / Realogy Co.-Issuer Corp., 9.38%, 04/01/27(2) | | | | | 15,000 | | | | 15,619 | |
Total Real Estate | | | | | | | | | 473,913 | |
| | | | | | | | | | | |
Utilities — 0.2% | | | | | | | | | | |
DPL, Inc., 4.35%, 04/15/29(2) | | | | | 73,000 | | | | 73,590 | |
Ferrellgas Partners LP / Ferrellgas Partners Finance Corp., 8.63%, 06/15/20 | | | | | 25,000 | | | | 18,969 | |
TerraForm Power Operating LLC, 5.00%,
01/31/28(2) | | | | | 50,000 | | | | 49,500 | |
Total Utilities | | | | | | | | | 142,059 | |
Total Corporate Bonds | | | | | | | | | | |
(Cost $8,659,527) | | | | | | | | | 8,616,635 | |
| | | | | | | | | | | |
TERM LOANS — 11.0% | | | | | | | | | | |
| | | | | | | | | | | |
Aerospace — 0.2% | | | | | | | | | | |
Dynasty Acquisition Co., Inc. (aka StandardAero Holding Corp.), 6.60%, (3-Month USD LIBOR + 4.00%), 04/06/26(1) | | | | | 22,762 | | | | 22,907 | |
Dynasty Acquisition Co., Inc. (aka StandardAero Holding Corp.), 6.60%, (3-Month USD LIBOR + 4.00%), 04/06/26(1) | | | | | 12,238 | | | | 12,316 | |
TransDigm, Inc., 4.98%, (1-Month USD LIBOR + 2.50%), 06/09/23(1) | | | | | 98,161 | | | | 97,977 | |
Total Aerospace | | | | | | | | | 133,200 | |
| | | | | | | | | | | |
Chemicals — 0.2% | | | | | | | | | | |
New Arclin U.S. Holding Corp., 5.98%, (1-Month USD LIBOR + 3.50%), 02/14/24(1) | | | | | 150,753 | | | | 151,224 | |
| | | | | | | | | | | |
Consumer Durables — 0.1% | | | | | | | | | | |
Global Appliance, Inc. (aka SharkNinja Operating LLC), 6.49%, (1-Month USD LIBOR + 4.00%), 09/29/24(1) | | | | | 74,125 | | | | 74,403 | |
| | | | | | | | | | | |
Consumer Non-Durables — 0.9% | | | | | | | | | | |
American Greetings Corp., 6.98%, (1-Month USD LIBOR + 4.50%), 04/06/24(1) | | | | | 213,400 | | | | 214,333 | |
Kronos Acquisition Intermediate, Inc. (aka KIK Custom Products), 6.48%, (1-Month USD LIBOR + 4.00%), 05/15/23 (Canada)(1) | | | | | 26,202 | | | | 25,215 | |
| | | | | | | | | | | |
Security Description
| | | | Shares
| | Value
|
TERM LOANS (continued) | | | | | | | | | | |
| | | | |
Consumer Non-Durables (continued) | | | |
Parfums Holding Co., Inc., 6.88%, (3-Month USD LIBOR + 4.25%), 06/30/24(1) | | | | $ | 125,205 | | | $ | 124,631 | |
Rodan & Fields, LLC, 6.47%, (1-Month USD LIBOR + 4.00%), 06/16/25 (Kazakhstan)(1) | | | | | 277,900 | | | | 247,331 | |
Total Consumer Non-Durables | | | | | | | | | 611,510 | |
| | | | | | | | | | | |
Energy — 0.5% | | | | | | | | | | |
CITGO Petroleum Corp., 7.60%, (3-Month USD LIBOR + 5.00%), 03/28/24(1) | | | | | 95,000 | | | | 95,039 | |
Medallion Midland Acquisition, LLC, 5.73%, (1-Month USD LIBOR + 3.25%), 10/30/24 (1) | | | | | 167,241 | | | | 166,562 | |
Traverse Midstream Partners LLC, 6.59%,
(3-Month USD LIBOR + 4.00%), 09/27/24 (Turkey)(1) | | | | | 54,100 | | | | 54,047 | |
Total Energy | | | | | | | | | 315,648 | |
| | | | | | | | | | | |
Financials — 1.0% | | | | | | | | | | |
Asurion, LLC (fka Asurion Corp.), 8.98%,
(1-Month USD LIBOR + 6.50%), 08/04/25(1) | | | | | 86,228 | | | | 88,159 | |
Blackhawk Network Holdings, Inc., 5.48%,
(1-Month USD LIBOR + 3.00%), 06/15/25(1) | | | | | 43,988 | | | | 44,034 | |
Ditech Holding Corp., 12.50%, (3-Month USD LIBOR + 5.00%), 06/30/22(1) | | | | | 478,472 | | | | 307,717 | |
Financial & Risk US Holdings, Inc. (aka Refinitiv), 6.23%, (1-Month USD LIBOR + 3.75%), 10/01/25(1) | | | | | 64,600 | | | | 64,008 | |
FinCo I, LLC (aka Fortress Investment Group), 4.48%, (1-Month USD LIBOR + 2.00%),
12/27/22(1) | | | | | 79,493 | | | | 79,957 | |
iStar, Inc. (fka iStar Financial, Inc.), 5.24%, (1-Month USD LIBOR + 2.75%), 06/28/23(1) | | | | | 68,514 | | | | 68,598 | |
Total Financials | | | | | | | | | 652,473 | |
| | | | | | | | | | | |
Food and Drug — 0.1% | | | | | | | | | | |
Albertson’s LLC, 5.61%, (3-Month USD LIBOR + 3.00%), 12/21/22(1) | | | | | 43,713 | | | | 43,834 | |
| | | | | | | | | | | |
Food/Tobacco — 0.2% | | | | | | | | | | |
H-Food Holdings, LLC (aka Hearthside Food Solutions, LLC), 6.17%, (1-Month USD LIBOR + 3.69%), 05/23/25(1) | | | | | 19,663 | | | | 19,310 | |
Milk Specialties Co., 6.48%, (1-Month USD LIBOR + 4.00%), 08/16/23(1) | | | | | 137,139 | | | | 137,654 | |
Total Food/Tobacco | | | | | | | | | 156,964 | |
| | | | | | | | | | | |
Gaming/Leisure — 0.4% | | | | | | | | | | |
Playa Resorts Holding B.V., 5.23%, (1-Month USD LIBOR + 2.75%), 04/29/24(1) | | | | | 26,509 | | | | 26,172 | |
Scientific Games International, Inc., 5.23%,
(1-Month USD LIBOR + 2.75%), 08/14/24(1) | | | | | 33,951 | | | | 33,913 | |
Stars Group Holdings B.V., 6.10%, (3-Month USD LIBOR + 3.50%), 07/10/25(1) | | | | | 44,716 | | | | 44,985 | |
UFC Holdings, LLC, 5.75%, (1-Month USD LIBOR + 3.25%), 08/18/23(1) | | | | | 177,618 | | | | 178,491 | |
Total Gaming/Leisure | | | | | | | | | 283,561 | |
| | | | | | | | | | | |
Health Care — 1.4% | | | | | | | | | | |
Accelerated Health Systems, LLC, 5.98%,
(1-Month USD LIBOR + 3.50%), 10/31/25(1) | | | | | 99,750 | | | | 100,218 | |
The accompanying notes are an integral part of these financial statements.
24
Schedule of Investments — Virtus Newfleet Multi-Sector Bond ETF(continued)
April 30, 2019 (unaudited)
Security Description
| | | | Principal
| | Value
|
TERM LOANS (continued) | | | | | | | | | | |
| | | | | | | | | | | |
Health Care (continued) | | | | | | | | | | |
AHP Health Partners, Inc. (aka Ardent Health Partners, LLC), 6.98%, (1-Month USD LIBOR + 4.50%), 06/30/25(1) | | | | $ | 48,901 | | | $ | 49,100 | |
Bausch Health Companies, Inc. (fka Valeant Pharmaceuticals International, Inc.), 5.47%, (1-Month USD LIBOR + 3.00%), 06/02/25 (Canada)(1) | | | | | 44,371 | | | | 44,623 | |
CCS-CMGC Holdings, Inc., 7.98%, (1-Month USD LIBOR + 5.50%), 10/01/25(1) | | | | | 159,600 | | | | 154,612 | |
CHG Healthcare Services, Inc. (fka CHG Buyer Corp.), 5.48%, (1-Month USD LIBOR + 3.00%), 06/07/23(1) | | | | | 212,530 | | | | 212,907 | |
Concordia Healthcare Corp., 7.98%, (1-Month USD LIBOR + 5.50%), 09/06/24 (Canada)(1) | | | | | 157,410 | | | | 148,113 | |
Envision Health Care Corp., 6.23%, (1-Month USD LIBOR + 3.75%), 10/10/25(1) | | | | | 45,855 | | | | 44,385 | |
Ortho-Clinical Diagnostics, Inc., 5.73%, (1-Month USD LIBOR + 3.25%), 06/30/25(1) | | | | | 51,707 | | | | 50,802 | |
Prospect Medical Holdings, Inc., 8.00%, (1-Month USD LIBOR + 5.50%), 02/22/24(1) | | | | | 38,801 | | | | 36,716 | |
U.S. Renal Care, Inc., 6.85%, (3-Month USD LIBOR + 4.25%), 12/30/22(1) | | | | | 84,219 | | | | 84,412 | |
Total Health Care | | | | | | | | | 925,888 | |
| | | | | | | | | | | |
Housing — 0.4% | | | | | | | | | | |
American Builders & Contractors Supply Co., Inc., 4.48%, (1-Month USD LIBOR + 2.00%), 10/31/23 (Mexico)(1) | | | | | 57,745 | | | | 57,373 | |
Capital Automotive L.P., 8.48%, (1-Month USD LIBOR + 6.00%), 03/24/25 (Chile)(1) | | | | | 33,153 | | | | 33,401 | |
CPG International LLC (fka CPG International, Inc.), 6.63%, (3-Month USD LIBOR + 3.75%), 05/05/24(1) | | | | | 194,873 | | | | 194,711 | |
Total Housing | | | | | | | | | 285,485 | |
| | | | | | | | | | | |
Information Technology — 1.2% | | | | | | | | | | |
Applied Systems, Inc., 9.48%, (1-Month USD LIBOR + 7.00%), 09/19/25(1) | | | | | 50,000 | | | | 51,025 | |
BMC Software Finance, Inc., 6.85%, (3-Month USD LIBOR + 4.25%), 10/02/25(1) | | | | | 44,725 | | | | 44,529 | |
Dell International LLC / EMC Corp., 4.49%, (1-Month USD LIBOR + 2.00%), 09/07/23(1) | | | | | 94,759 | | | | 94,920 | |
Kronos, Inc., 5.74%, (3-Month USD LIBOR + 3.00%), 11/01/23 (Oman)(1) | | | | | 127,445 | | | | 127,793 | |
Kronos, Inc., 10.99%, (3-Month USD LIBOR + 8.25%), 11/01/24(1) | | | | | 118,000 | | | | 122,204 | |
SS&C Technologies, Inc., 4.73%, (1-Month USD LIBOR + 2.25%), 04/16/25(1) | | | | | 34,316 | | | | 34,381 | |
SS&C Technologies, Inc., 4.73%, (1-Month USD LIBOR + 2.25%), 04/16/25(1) | | | | | 25,964 | | | | 26,013 | |
Ultimate Software Group, Inc. (The), 04/08/26(6) | | | | | 65,000 | | | | 65,544 | |
Vertafore, Inc., 5.73%, (1-Month USD LIBOR + 3.25%), 07/02/25(1) | | | | | 194,513 | | | | 193,275 | |
Total Information Technology | | | | | | | | | 759,684 | |
| | | | | | | | | | | |
Manufacturing — 0.5% | | | | | | | | | | |
CPI Acquisition, Inc., 7.35%, (3-Month USD LIBOR + 4.50%), 08/17/22(1) | | | | | 315,000 | | | | 235,463 | |
| | | | | | | | | | | |
Security Description
| | | | Principal
| | Value
|
TERM LOANS (continued) | | | | | | | | | | |
| | | | | | | | | | | |
Manufacturing (continued) | | | | | | | | | | |
Filtration Group Corp., 5.48%, (1-Month USD LIBOR + 3.00%), 03/29/25 (Israel)(1) | | | | $ | 19,376 | | | $ | 19,454 | |
Hillman Group, Inc. (The), 6.48%, (1-Month USD LIBOR + 4.00%), 05/30/25(1) | | | | | 84,238 | | | | 83,396 | |
Total Manufacturing | | | | | | | | | 338,313 | |
| | | | |
Media/Telecom – Cable/Wireless Video — 0.2% | | | |
CSC Holdings, LLC, 4.72%, (1-Month USD LIBOR + 2.25%), 01/15/26(1) | | | | | 109,325 | | | | 109,079 | |
| | | | | | | | | | | |
Media/Telecom – Diversified Media — 0.1% | | | | | | | | | | |
Cineworld Finance US, Inc., 4.73%, (1-Month USD LIBOR + 2.25%), 02/28/25
(Kazakhstan)(1) | | | | | 90,880 | | | | 90,615 | |
| | | | | | | | | | | |
Media/Telecom – Telecommunications — 0.7% | | | | | | | | | | |
CenturyLink, Inc., 5.23%, (1-Month USD LIBOR + 2.75%), 01/31/25(1) | | | | | 227,202 | | | | 226,113 | |
Securus Technologies Holdings, Inc., 6.98%, (1-Month USD LIBOR + 4.50%), 11/01/24(1) | | | | | 25,894 | | | | 25,549 | |
Securus Technologies Holdings, Inc., 10.73%, (1-Month USD LIBOR + 8.25%), 11/01/25(1) | | | | | 140,000 | | | | 136,990 | |
West Corp., 6.63%, (3-Month USD LIBOR + 4.00%), 10/10/24(1) | | | | | 34,785 | | | | 33,751 | |
Total Media/Telecom – Telecommunications | | | | | | | | | 422,403 | |
| | |
Media/Telecom – Wireless Communications — 0.1% | |
CommScope, Inc., 5.73%, (1-Month USD LIBOR + 3.25%), 04/03/26(1) | | | | | 60,000 | | | | 60,609 | |
| | | | | | | | | | | |
Metals/Minerals — 0.2% | | | | | | | | | | |
GrafTech Finance, Inc., 5.98%, (1-Month USD LIBOR + 3.50%), 02/12/25(1) | | | | | 141,641 | | | | 141,818 | |
| | | | | | | | | | | |
Retail — 0.4% | | | | | | | | | | |
Neiman Marcus Group, Inc. (The), 5.72%,
(1-Month USD LIBOR + 3.25%), 10/25/20(1) | | | | | 300,247 | | | | 278,854 | |
| | | | | | | | | | | |
Service — 1.2% | | | | | | | | | | |
Dun & Bradstreet Corporation, The, 7.48%,
(1-Month USD LIBOR + 5.00%), 02/06/26(1) | | | | | 40,000 | | | | 40,350 | |
GFL Environmental, Inc., 5.50%, (1-Month USD LIBOR + 3.00%), 05/30/25(1) | | | | | 83,922 | | | | 83,372 | |
Hoya Midco, LLC, 5.98%, (1-Month USD LIBOR + 3.50%), 06/30/24(1) | | | | | 224,902 | | | | 223,638 | |
PI UK Holdco II Limited, 5.98%, (1-Month USD LIBOR + 3.50%), 01/03/25(1) | | | | | 161,480 | | | | 161,783 | |
Red Ventures, LLC, 5.48%, (1-Month USD LIBOR + 3.00%), 11/08/24(1) | | | | | 91,683 | | | | 92,141 | |
Sedgwick Claims Management Services, Inc., 5.73%, (1-Month USD LIBOR + 3.25%),
12/31/25(1) | | | | | 4,963 | | | | 4,958 | |
TKC Holdings, Inc., 6.24%, (1-Month USD LIBOR + 3.75%), 02/01/23(1) | | | | | 143,025 | | | | 142,847 | |
Total Service | | | | | | | | | 749,089 | |
| | | | | | | | | | | |
Transportation – Automotive — 0.2% | | | | | | | | | | |
Panther BF Aggregator 2 LP, 03/18/26 (6) | | | | | 120,000 | | | | 120,637 | |
| | | | | | | | | | | |
Utilities — 0.8% | | | | | | | | | | |
APLP Holdings Limited Partnership, 5.23%, (1-Month USD LIBOR + 2.75%), 04/13/23(1) | | | | | 120,725 | | | | 121,649 | |
The accompanying notes are an integral part of these financial statements.
25
Schedule of Investments — Virtus Newfleet Multi-Sector Bond ETF(continued)
April 30, 2019 (unaudited)
Security Description
| | | | Principal
| | Value
|
TERM LOANS (continued) | | | | | | | | | | |
| | | | | | | | | | | |
Utilities (continued) | | | | | | | | | | |
Brookfield WEC Holdings, Inc. (aka Westinghouse Electric Co. LLC), 5.98%, (1-Month USD LIBOR + 3.50%), 08/01/25(1) | | | | $ | 54,675 | | | $ | 55,085 | |
Brookfield WEC Holdings, Inc. (aka Westinghouse Electric Co. LLC), 9.23%, (1-Month USD LIBOR + 6.75%), 08/03/26(1) | | | | | 25,000 | | | | 25,469 | |
Calpine Corp., 5.34%, (3-Month USD LIBOR + 2.75%), 04/05/26(1) | | | | | 155,000 | | | | 155,688 | |
Talen Energy Supply, LLC, 6.48%, (1-Month USD LIBOR + 4.00%), 04/15/24(1) | | | | | 152,911 | | | | 153,342 | |
Total Utilities | | | | | | | | | 511,233 | |
| | | | | | | | | | | |
Total Term Loans | | | | | | | | | | |
(Cost $7,424,251) | | | | | | | | | 7,216,524 | |
| | | | | | | | | | | |
FOREIGN BONDS — 8.7% | | | | | | | | | | |
| | | | | | | | | | | |
Communication Services — 0.3% | | | | | | | | | | |
Tencent Holdings Ltd., 3.98%, 04/11/29
(China)(2) | | | | | 200,000 | | | | 201,866 | |
| | | | | | | | | | | |
Consumer Discretionary — 0.1% | | | | | | | | | | |
Gateway Casinos & Entertainment Ltd., 8.25%, 03/01/24 (Canada)(2) | | | | | 35,000 | | | | 36,750 | |
| | | | | | | | | | | |
Consumer Staples — 0.2% | | | | | | | | | | |
Anheuser-Busch InBev Worldwide, Inc., 4.00%, 04/13/28 (Belgium) | | | | | 60,000 | | | | 61,278 | |
Anheuser-Busch InBev Worldwide, Inc., 4.75%, 01/23/29 (Belgium) | | | | | 22,000 | | | | 23,557 | |
Kronos Acquisition Holdings, Inc., 9.00%,
08/15/23 (Canada)(2) | | | | | 61,000 | | | | 54,595 | |
Total Consumer Staples | | | | | | | | | 139,430 | |
| | | | | | | | | | | |
Energy — 1.9% | | | | | | | | | | |
Encana Corp., 8.13%, 09/15/30 (Canada) | | | | | 125,000 | | | | 161,955 | |
KazMunayGas National Co. JSC, 4.75%, 04/19/27 (Kazakhstan)(2) | | | | | 300,000 | | | | 311,206 | |
Petrobras Global Finance BV, 7.38%, 01/17/27 (Brazil) | | | | | 280,000 | | | | 312,480 | |
Petrobras Global Finance BV, 5.75%, 02/01/29 (Brazil) | | | | | 230,000 | | | | 231,150 | |
Petroleos Mexicanos, 4.63%, 09/21/23 (Mexico) | | | | | 50,000 | | | | 49,800 | |
Petroleos Mexicanos, 6.50%, 03/13/27 (Mexico) | | | | | 30,000 | | | | 30,462 | |
Petroleos Mexicanos, 5.35%, 02/12/28 (Mexico) | | | | | 90,000 | | | | 84,492 | |
Petroleos Mexicanos, 6.50%, 06/02/41 (Mexico) | | | | | 40,000 | | | | 36,960 | |
Total Energy | | | | | | | | | 1,218,505 | |
| | | | | | | | | | | |
Financials — 1.6% | | | | | | | | | | |
AerCap Ireland Capital DAC / AerCap Global Aviation Trust, 3.65%, 07/21/27 (Ireland) | | | | | 150,000 | | | | 142,821 | |
Australia & New Zealand Banking Group Ltd., 4.40%, 05/19/26 (Australia)(2) | | | | | 290,000 | | | | 297,033 | |
Bank of Montreal, 3.80%, (USD 5 Year Swap + 1.43%), 12/15/32 (Canada)(1) | | | | | 72,000 | | | | 70,113 | |
BBVA Bancomer SA, 5.13%, (US 5 Year CMT T-Note + 2.65%), 01/18/33 (Mexico)(1)(2) | | | | | 200,000 | | | | 190,250 | |
Security Description
| | | | | | Principal
| | Value
|
FOREIGN BONDS (continued) | | | | | | | | | | | | | | |
| | | | | | | | | | | | | | | |
Financials (continued) | | | | | | | | | | | | | | |
Development Bank of Kazakhstan JSC, 8.95%, 05/04/23 (Kazakhstan)(2) | | | | | KZT | | | $ | 70,000,000 | | | $ | 183,056 | |
Fairfax Financial Holdings Ltd., 4.85%, 04/17/28 (Canada) | | | | | | | | | 105,000 | | | | 105,043 | |
Toronto-Dominion Bank (The), 3.63%,
(USD 5 Year Swap + 2.21%), 09/15/31 (Canada)(1) | | | | | | | | | 90,000 | | | | 88,920 | |
Total Financials | | | | | | | | | | | | | 1,077,236 | |
| | | | | | | | | | | | | | | |
Government — 2.8% | | | | | | | | | | | | | | |
Argentine Republic Government International Bond, 6.88%, 01/26/27 (Argentina) | | | | | | | | | 250,000 | | | | 181,159 | |
Indonesia Government International Bond, 8.50%, 10/12/35 (Indonesia)(2) | | | | | | | | | 200,000 | | | | 288,460 | |
Indonesia Treasury Bond, Series FR77, 8.13%, 05/15/24 (Indonesia) | | | | | IDR | | | | 970,000,000 | | | | 70,504 | |
Ivory Coast Government International Bond, 6.38%, 03/03/28 (Ivory Coast)(2) | | | | | | | | | 200,000 | | | | 194,931 | |
Mexican Bonos, Series M, 6.50%, 06/09/22 (Mexico) | | | | | MXN | | | | 2,200,000 | | | | 111,474 | |
Oman Government International Bond, 5.38%, 03/08/27 (Oman)(2) | | | | | | | | | 200,000 | | | | 188,746 | |
Provincia De Buenos Aire, 9.13%, 03/16/24 (Argentina)(2) | | | | | | | | | 450,000 | | | | 341,437 | |
Republic of South Africa Government Bond, Series 2023, 7.75%, 02/28/23 (South Africa) | | | | | ZAR | | | | 1,400,000 | | | | 98,005 | |
Republic of South Africa Government International Bond, 5.65%, 09/27/47 (South Africa) | | | | | | | | | 200,000 | | | | 188,106 | |
Ukraine Government International Bond, 7.75%, 09/01/26 (Ukraine)(2) | | | | | | | | | 185,000 | | | | 172,702 | |
Total Government | | | | | | | | | | | | | 1,835,524 | |
| | | | | | | | | | | | | | | |
Health Care — 0.0% | | | | | | | | | | | | | | |
Advanz Pharma Corp., 8.00%, 09/06/24 (Canada) | | | | | | | | | 17,000 | | | | 15,980 | |
| | | | | | | | | | | | | | | |
Industrials — 0.9% | | | | | | | | | | | | | | |
Avolon Holdings Funding Ltd., 4.38%, 05/01/26 (Ireland)(2) | | | | | | | | | 87,000 | | | | 86,594 | |
CNH Industrial NV, 4.50%, 08/15/23 (United Kingdom) | | | | | | | | | 98,000 | | | | 101,685 | |
Garda World Security Corp., 8.75%, 05/15/25 (Canada)(2) | | | | | | | | | 174,000 | | | | 164,900 | |
GFL Environmental, Inc., 7.00%, 06/01/26 (Canada)(2) | | | | | | | | | 22,000 | | | | 21,505 | |
GFL Environmental, Inc., 8.50%, 05/01/27 (Canada)(2) | | | | | | | | | 25,000 | | | | 26,094 | |
Norwegian Air Shuttle ASA Pass-Through Trust, Class A, Series 2016-1, 4.88%, 05/10/28 (Norway)(2) | | | | | | | | | 194,603 | | | | 186,751 | |
Titan Acquisition Ltd. / Titan Co.-Borrower LLC, 7.75%, 04/15/26 (Canada)(2) | | | | | | | | | 40,000 | | | | 36,900 | |
Total Industrials | | | | | | | | | | | | | 624,429 | |
The accompanying notes are an integral part of these financial statements.
26
Schedule of Investments — Virtus Newfleet Multi-Sector Bond ETF(continued)
April 30, 2019 (unaudited)
Security Description
| | | | Principal
| | Value
|
FOREIGN BONDS (continued) | | | | | | | | | | |
| | | | | | | | | | | |
Materials — 0.9% | | | | | | | | | | |
ArcelorMittal, 4.55%, 03/11/26 (Luxembourg) | | | | $ | 90,000 | | | $ | 93,342 | |
BHP Billiton Finance USA Ltd., 6.75%, (USD 5 Year Swap + 5.09%), 10/19/75 (Australia)(1)(2) | | | | | 240,000 | | | | 270,412 | |
Eldorado Gold Corp., 6.13%, 12/15/20 (Canada)(2) | | | | | 50,000 | | | | 49,875 | |
Glencore Funding LLC, 4.00%, 03/27/27 (Switzerland)(2) | | | | | 106,000 | | | | 104,084 | |
NOVA Chemicals Corp., 4.88%, 06/01/24 (Canada)(2) | | | | | 15,000 | | | | 14,719 | |
NOVA Chemicals Corp., 5.00%, 05/01/25 (Canada)(2) | | | | | 30,000 | | | | 29,287 | |
Total Materials | | | | | | | | | 561,719 | |
| | | | | | | | | | | |
Total Foreign Bonds | | | | | | | | | | |
(Cost $5,823,225) | | | | | | | | | 5,711,439 | |
| | | | | | | | | | | |
U.S. TREASURY NOTES — 4.7% | | | | | | | | | | |
U.S. Treasury Bill 2.50%, 09/05/19(7) | | | | | 500,000 | | | | 495,833 | |
U.S. Treasury Note 2.25%, 03/31/21 | | | | | 530,000 | | | | 529,752 | |
U.S. Treasury Note 2.38%, 01/31/23 | | | �� | | 2,055,000 | | | | 2,063,910 | |
| | | | | | | | | | | |
Total U.S. Treasury Notes | | | | | | | | | | |
(Cost $3,046,107) | | | | | | | | | 3,089,495 | |
| | | | | | | | | | | |
MORTGAGE BACKED SECURITIES — 3.8% | | | | | | | | | | |
| | | | |
Commercial Mortgage Backed Securities — 0.1% | | | |
Sutherland Commercial Mortgage Loans, Class A, Series 2017-SBC6, 3.19%, 05/25/37(1)(2)(8) | | | | | 86,203 | | | | 85,973 | |
| |
Residential Mortgage Backed Securities — 3.7% |
Angel Oak Mortgage Trust I LLC, Class A1, Series 2019-1, 3.92%, 11/25/48(1)(2)(8) | | | | | 285,383 | | | | 288,987 | |
Banc of America Funding Trust, Class 5A1, Series 2004-D, 4.49%,
01/25/35(1)(8) | | | | | 337,173 | | | | 338,628 | |
Colony Starwood Homes Trust, Class C, Series 2016-2A, 4.62%, (1-Month USD LIBOR + 2.15%), 12/17/33(1)(2) | | | | | 268,281 | | | | 268,767 | |
COLT Mortgage Loan Trust, Class A3, Series 2017-1, 3.07%, 05/27/47(1)(2)(8) | | | | | 69,869 | | | | 69,853 | |
Deephaven Residential Mortgage Trust, Class A2, Series 2017-1A, 2.93%, 12/26/46(1)(2)(8) | | | | | 33,008 | | | | 32,995 | |
| | | | | | | | | | | |
Security Description
| | | | Principal
| | Value
|
FOREIGN BONDS (continued) | | | | | | | | | | |
| | | | |
Residential Mortgage Backed Securities (continued) | | | |
Deephaven Residential Mortgage Trust, Class A2, Series 2017-2A, 2.61%, 06/25/47(1)(2)(8) | | | | $ | 65,747 | | | $ | 65,242 | |
JPMorgan Mortgage Trust, Class A3, Series
2018-8, 4.00%, 01/25/49(1)(2)(8) | | | | | 102,747 | | | | 104,436 | |
Mill City Mortgage Loan Trust, Class A1B, Series 2018-4, 3.50%, 04/25/66(1)(2)(8) | | | | | 100,000 | | | | 100,118 | |
New Residential Mortgage Loan Trust, Class A1, Series 2016-1A, 3.75%, 03/25/56(1)(2)(8) | | | | | 122,210 | | | | 123,657 | |
PRPM LLC, Class A1, Series 2019-1A, 4.50%, 01/25/24(2)(9) | | | | | 97,166 | | | | 98,314 | |
Sequoia Mortgage Trust, Class B1, Series 2013-8, 3.53%, 06/25/43(1)(8) | | | | | 268,955 | | | | 270,421 | |
Structured Adjustable Rate Mortgage Loan Trust, Class 3A2, Series 2004-4, 4.72%, 04/25/34(1)(8) | | | | | 112,932 | | | | 116,898 | |
Towd Point Mortgage Trust, Class A2, Series 2016-4, 3.00%, 07/25/56(1)(2)(8) | | | | | 250,000 | | | | 245,387 | |
VOLT LXXI LLC, Class A1A, Series 2018-NPL7, 3.97%, 09/25/48(2)(9) | | | | | 118,022 | | | | 118,667 | |
VOLT LXXV LLC, Class A1A, Series 2019-NPL1, 4.34%, 01/25/49(2)(9) | | | | | 140,442 | | | | 141,912 | |
Total Residential Mortgage Backed Securities | | | | | | | | | 2,384,282 | |
| | | | | | | | | | | |
Total Mortgage Backed Securities | | | | | | | | | | |
(Cost $2,429,831) | | | | | | | | | 2,470,255 | |
| | | | | | | | | | | |
ASSET BACKED SECURITIES — 2.4% | | | | | | | | | | |
Arbys Funding LLC, Class A2, Series 2015-1A, 4.97%, 10/30/45(2) | | | | | 328,100 | | | | 336,454 | |
Drug Royalty III LP 1, Class A, Series 2016-1A, 3.98%, 04/15/27(2) | | | | | 179,932 | | | | 180,217 | |
Genesis Sales Finance Master Trust, Class A, Series 2019-AA, 4.68%, 08/20/23(2) | | | | | 115,000 | | | | 116,628 | |
OnDeck Asset Securitization Trust LLC, Class A, Series 2018-1A, 3.50%, 04/18/22(2) | | | | | 370,000 | | | | 371,392 | |
Skopos Auto Receivables Trust, Class B, Series 2018-1A, 3.93%, 05/16/22(2) | | | | | 565,000 | | | | 565,440 | |
| | | | | | | | | | | |
Total Asset Backed Securities | | | | | | | | | | |
(Cost $1,562,312) | | | | | | | | | 1,570,131 | |
The accompanying notes are an integral part of these financial statements.
27
Schedule of Investments — Virtus Newfleet Multi-Sector Bond ETF(continued)
April 30, 2019 (unaudited)
Security Description
| | | | Shares
| | Value
|
MONEY MARKET FUND — 10.5% | | | | | | | | | | |
JP Morgan U.S. Government Money Market Institutional Shares, 2.29%(10)
(Cost $6,892,675) | | | | | 6,892,675 | | | $ | 6,892,675 | |
TOTAL INVESTMENTS — 54.2% | | | | | | | | | | |
(Cost $35,837,928) | | | | | | | | | 35,567,154 | |
Other Assets in Excess of Liabilities — 45.8%(11) | | | | | | | | | 30,057,165 | |
Net Assets — 100.0% | | | | | | | | $ | 65,624,319 | |
| (1) | | Variable rate instrument. The interest rate shown reflects the rate in effect at April 30, 2019. |
| (2) | | Security was purchased pursuant to Rule 144A under the Securities Act of 1933 and may not be resold subject to that rule except to qualified institutional buyers. Unless otherwise noted, 144A securities are deemed to be liquid. At April 30, 2019, the aggregate value of these securities was $9,770,575, or 14.9% of net assets. |
| (3) | | Security in default, no interest payments are being received during the bankruptcy proceedings. |
| (4) | | Perpetual security with no stated maturity date. |
| (5) | | Payment in-kind security.100% of the income was received in cash. |
| (6) | | The loan will settle after April 30, 2019 at which the interest rate will be determined. |
| (7) | | Represents a zero coupon bond. Rate shown reflects the effective yield. |
| (8) | | Adjustable rate security with an interest rate that is not based on a published reference index and spread. The rate is based on the structure of the agreement and current market conditions. |
| (9) | | Represents step coupon bond. Rate shown reflects the rate in effect as of April 30, 2019. |
| (10) | | The rate shown reflects the seven-day yield as of April 30, 2019. |
| (11) | | Amounts represent receivables from unsettled trades and certain other assets, net of liabilities. |
CMT — 1 Year Constant Maturity Treasury Index
LIBOR — London InterBank Offered Rate
LP — Limited Partnership
PLC — Public Limited Company
USD — United States Dollar
IDR Indonesian Rupiah
KZT Kazakhstani Tenge
MXN Mexican Peso
ZAR South African Rand
The following table summarizes valuation of the Fund’s investments under the fair value hierarchy levels as of April 30, 2019 (See Note 2 in the Notes to Financial Statements):
| | | | Level 1
| | Level 2
| | Level 3
| | Total
|
Asset Valuation Inputs | | | | | | | | | | | | | | | | | | |
Corporate Bonds | | | | $ | — | | | $ | 8,616,635 | | | $ | — | | | $ | 8,616,635 | |
Term Loans | | | | | — | | | | 7,216,524 | | | | — | | | | 7,216,524 | |
Foreign Bonds | | | | | — | | | | 5,711,439 | | | | — | | | | 5,711,439 | |
U.S. Treasury Notes | | | | | — | | | | 3,089,495 | | | | — | | | | 3,089,495 | |
Mortgage Backed Securities | | | | | — | | | | 2,470,255 | | | | — | | | | 2,470,255 | |
Asset Backed Securities | | | | | — | | | | 1,570,131 | | | | — | | | | 1,570,131 | |
Money Market Fund | | | | | 6,892,675 | | | | — | | | | — | | | | 6,892,675 | |
Total | | | | $ | 6,892,675 | | | $ | 28,674,479 | | | $ | — | | | $ | 35,567,154 | |
Some of the Fund’s investments that were categorized as Level 3 were valued utilizing third party pricing information without adjustment. Such valuations are based on unobservable inputs. A significant change in third party information could result in a significantly lower or higher value of Level 3 investments. For the period ended April 30, 2019, securities with a fair value of $204,640 transferred from Level 3 to Level 2 due to a change in data availability used in investment valuation.
A reconciliation of assets in which Level 3 inputs were used in determining fair value is presented when there are significant Level 3 investments during the reporting period. The following summarizes inputs (level 3) that were used for the period ended April 30, 2019:
| | | | Mortgage Backed
Securities
|
Balance as of October 31, 2018 | | | | $ | 272,105 | |
Realized gain (loss) | | | | | — | |
Change in unrealized appreciation (depreciation) | | | | | (47 | ) |
Purchases | | | | | — | |
Sales | | | | | (67,418 | ) |
Amortization (accretion) | | | | | — | |
Transfers into Level 3 | | | | | — | |
Transfers out of Level 3 | | | | | (204,640 | ) |
Balance as of April 30, 2019 | | | | | — | |
Net change in unrealized appreciation (depreciation) from investments still held as of April 30, 2019: | | | | $ | — | |
The accompanying notes are an integral part of these financial statements.
28
Schedule of Investments — Virtus Private Credit Strategy ETF
April 30, 2019 (unaudited)
Security Description
| | | | Shares
| | Value
|
Common Stocks — 62.2% | | | | | | | | | | |
| | | | | | | | | | | |
Financials — 62.2% | | | | | | | | | | |
Apollo Investment Corp. | | | | | 266,840 | | | $ | 4,170,709 | |
Ares Capital Corp. | | | | | 171,606 | | | | 3,088,908 | |
Barings BDC, Inc. | | | | | 664,099 | | | | 6,601,144 | |
BlackRock Capital Investment Corp. | | | | | 634,769 | | | | 3,948,263 | |
BlackRock TCP Capital Corp. | | | | | 222,156 | | | | 3,221,262 | |
Capital Southwest Corp. | | | | | 85,467 | | | | 1,837,541 | |
Capitala Finance Corp. | | | | | 203,497 | | | | 1,764,319 | |
CM Finance, Inc. | | | | | 218,729 | | | | 1,572,662 | |
Fidus Investment Corp. | | | | | 234,392 | | | | 3,679,954 | |
FS KKR Capital Corp. | | | | | 673,721 | | | | 4,264,654 | |
Garrison Capital, Inc. | | | | | 231,003 | | | | 1,619,331 | |
Gladstone Capital Corp. | | | | | 327,481 | | | | 3,111,070 | |
Gladstone Investment Corp. | | | | | 205,418 | | | | 2,571,833 | |
Goldman Sachs BDC, Inc. | | | | | 137,096 | | | | 2,837,887 | |
Golub Capital BDC, Inc. | | | | | 141,554 | | | | 2,608,840 | |
Hercules Capital, Inc. | | | | | 246,452 | | | | 3,201,411 | |
Horizon Technology Finance Corp. | | | | | 136,706 | | | | 1,621,333 | |
Main Street Capital Corp. | | | | | 63,076 | | | | 2,489,610 | |
Medley Capital Corp. | | | | | 541,615 | | | | 1,814,410 | |
Monroe Capital Corp. | | | | | 301,757 | | | | 3,708,594 | |
MVC Capital, Inc. | | | | | 189,188 | | | | 1,736,746 | |
New Mountain Finance Corp. | | | | | 233,298 | | | | 3,280,170 | |
Oaktree Specialty Lending Corp. | | | | | 569,734 | | | | 3,008,196 | |
Oaktree Strategic Income Corp. | | | | | 202,632 | | | | 1,760,872 | |
OFS Capital Corp. | | | | | 147,091 | | | | 1,834,225 | |
Oxford Square Capital Corp. | | | | | 670,734 | | | | 4,326,234 | |
PennantPark Floating Rate Capital Ltd. | | | | | 218,495 | | | | 2,881,949 | |
PennantPark Investment Corp. | | | | | 545,138 | | | | 3,892,285 | |
Portman Ridge Finance Corp. | | | | | 478,667 | | | | 1,459,934 | |
Prospect Capital Corp. | | | | | 646,277 | | | | 4,362,370 | |
Saratoga Investment Corp. | | | | | 74,134 | | | | 1,858,539 | |
Solar Capital Ltd. | | | | | 122,435 | | | | 2,622,558 | |
Solar Senior Capital Ltd. | | | | | 167,701 | | | | 2,894,519 | |
Stellus Capital Investment Corp. | | | | | 115,415 | | | | 1,657,359 | |
TCG BDC, Inc. | | | | | 142,001 | | | | 2,124,335 | |
THL Credit, Inc. | | | | | 248,383 | | | | 1,698,940 | |
TPG Specialty Lending, Inc. | | | | | 132,517 | | | | 2,688,770 | |
TriplePoint Venture Growth BDC Corp. | | | | | 288,172 | | | | 4,022,881 | |
WhiteHorse Finance, Inc. | | | | | 123,069 | | | | 1,791,885 | |
Total Financials | | | | | | | | | 109,636,502 | |
| | | | | | | | | | | |
Total Common Stocks | | | | | | | | | | |
(Cost $110,703,943) | | | | | | | | $ | 109,636,502 | |
| | | | | | | | | | | |
Security Description
| | | | Shares
| | Value
|
Closed End Funds — 36.0% | | | | | | | | | | |
Barings Corporate Investors | | | | | 162,916 | | | $ | 2,590,365 | |
BlackRock Debt Strategies Fund, Inc. | | | | | 235,423 | | | | 2,551,985 | |
BlackRock Floating Rate Income Strategies
Fund, Inc. | | | | | 161,233 | | | | 2,068,619 | |
BlackRock Floating Rate Income Trust | | | | | 165,365 | | | | 2,085,253 | |
Blackstone / GSO Long-Short Credit
Income Fund | | | | | 200,283 | | | | 3,142,440 | |
Blackstone / GSO Senior Floating Rate
Term Fund | | | | | 150,121 | | | | 2,511,524 | |
Blackstone / GSO Strategic Credit Fund | | | | | 212,617 | | | | 3,065,937 | |
Eagle Point Credit Co., Inc. | | | | | 313,301 | | | | 5,360,580 | |
Eaton Vance Floating-Rate Income Trust | | | | | 163,868 | | | | 2,241,714 | |
Eaton Vance Senior Floating-Rate Trust | | | | | 179,803 | | | | 2,396,774 | |
Eaton Vance Senior Income Trust | | | | | 338,405 | | | | 2,145,488 | |
First Trust Senior Floating Rate Income Fund II | | | | | 182,152 | | | | 2,209,504 | |
Invesco Senior Income Trust | | | | | 529,395 | | | | 2,297,574 | |
KKR Income Opportunities Fund | | | | | 223,153 | | | | 3,557,059 | |
Nuveen Credit Strategies Income Fund | | | | | 334,171 | | | | 2,670,026 | |
Nuveen Floating Rate Income Fund | | | | | 264,520 | | | | 2,642,555 | |
Nuveen Floating Rate Income Opportunity Fund | | | | | 276,559 | | | | 2,729,637 | |
Nuveen Senior Income Fund | | | | | 440,358 | | | | 2,615,727 | |
Nuveen Short Duration Credit
Opportunities Fund | | | | | 169,068 | | | | 2,688,181 | |
Oxford Lane Capital Corp. | | | | | 669,364 | | | | 7,282,680 | |
Pioneer Floating Rate Trust | | | | | 228,676 | | | | 2,453,694 | |
Voya Prime Rate Trust | | | | | 445,438 | | | | 2,164,829 | |
| | | | | | | | | | | |
Total Closed End Funds | | | | | | | | | | |
(Cost $62,731,774) | | | | | | | | | 63,472,145 | |
TOTAL INVESTMENTS — 98.2% | | | | | | | | | | |
(Cost $173,435,717) | | | | | | | | | 173,108,647 | |
Other Assets in Excess of Liabilities — 1.8% | | | | | | | | | 3,229,347 | |
Net Assets — 100.0% | | | | | | | | $ | 176,337,994 | |
The following table summarizes valuation of the Fund’s investments under the fair value hierarchy levels as of April 30, 2019 (See Note 2 in the Notes to Financial Statements):
| | | | Level 1
| | Level 2
| | Level 3
| | Total
|
Asset Valuation Inputs | | | | | | | | | | | | | | | | | | |
Common Stocks | | | | $ | 109,636,502 | | | $ | — | | | $ | — | | | $ | 109,636,502 | |
Closed End Funds | | | | | 63,472,145 | | | | — | | | | — | | | | 63,472,145 | |
Total | | | | $ | 173,108,647 | | | $ | — | | | $ | — | | | $ | 173,108,647 | |
The accompanying notes are an integral part of these financial statements.
29
Schedule of Investments — Virtus Real Asset Income ETF
April 30, 2019 (unaudited)
Security Description
| | | | Shares
| | Value
|
Common Stocks — 99.1% | | | | | | | | | | |
| | | | | | | | | | | |
Communication Services — 6.5% | | | | | | | | | | |
BCE, Inc. (Canada) | | | | | 51,540 | | | $ | 2,305,899 | |
China Mobile Ltd. (China)(1) | | | | | 43,054 | | | | 2,052,384 | |
Cogent Communications Holdings, Inc. | | | | | 43,120 | | | | 2,381,518 | |
Telecom Argentina SA (Argentina)*(1) | | | | | 148,084 | | | | 1,947,305 | |
Telefonica Brasil SA (Brazil)(1) | | | | | 181,910 | | | | 2,164,729 | |
TELUS Corp. (Canada) | | | | | 62,621 | | | | 2,306,958 | |
Total Communication Services | | | | | | | | | 13,158,793 | |
| | | | | | | | | | | |
Consumer Staples — 2.3% | | | | | | | | | | |
Bunge Ltd. | | | | | 43,558 | | | | 2,282,875 | |
Ingredion, Inc. | | | | | 23,795 | | | | 2,254,576 | |
Total Consumer Staples | | | | | | | | | 4,537,451 | |
| | | | | | | | | | | |
Energy — 30.3% | | | | | | | | | | |
Andeavor Logistics LP | | | | | 64,392 | | | | 2,159,064 | |
Black Stone Minerals LP | | | | | 126,110 | | | | 2,286,374 | |
Canadian Natural Resources Ltd. (Canada) | | | | | 80,054 | | | | 2,400,019 | |
China Petroleum & Chemical Corp. (China)(1) | | | | | 26,916 | | | | 2,065,534 | |
CNX Midstream Partners LP | | | | | 152,345 | | | | 2,362,871 | |
CONSOL Coal Resources LP | | | | | 128,168 | | | | 2,278,827 | |
CVR Energy, Inc. | | | | | 54,381 | | | | 2,480,317 | |
Delek Logistics Partners LP | | | | | 70,316 | | | | 2,294,411 | |
Delek US Holdings, Inc. | | | | | 61,806 | | | | 2,290,530 | |
Dorchester Minerals LP | | | | | 124,660 | | | | 2,358,567 | |
Enbridge, Inc. (Canada) | | | | | 61,925 | | | | 2,287,509 | |
EQM Midstream Partners LP | | | | | 51,171 | | | | 2,353,866 | |
Green Plains Partners LP | | | | | 142,345 | | | | 2,280,367 | |
Marathon Petroleum Corp. | | | | | 36,273 | | | | 2,207,938 | |
MPLX LP | | | | | 66,342 | | | | 2,140,193 | |
ONEOK, Inc. | | | | | 32,604 | | | | 2,214,790 | |
Pembina Pipeline Corp. (Canada) | | | | | 60,671 | | | | 2,169,595 | |
Permian Basin Royalty Trust | | | | | 294,255 | | | | 1,921,485 | |
Phillips 66 | | | | | 23,108 | | | | 2,178,391 | |
Phillips 66 Partners LP | | | | | 41,524 | | | | 2,056,684 | |
RPC, Inc. | | | | | 217,116 | | | | 2,234,124 | |
Shell Midstream Partners LP | | | | | 114,508 | | | | 2,302,756 | |
Suncor Energy, Inc. (Canada) | | | | | 65,882 | | | | 2,174,106 | |
TransCanada Corp. (Canada) | | | | | 50,187 | | | | 2,396,931 | |
Valero Energy Corp. | | | | | 26,365 | | | | 2,390,251 | |
Viper Energy Partners LP | | | | | 67,005 | | | | 2,252,708 | |
Western Midstream Partners LP | | | | | 69,310 | | | | 2,188,810 | |
Total Energy | | | | | | | | | 60,727,018 | |
| | | | | | | | | | | |
Financials — 2.3% | | | | | | | | | | |
Arbor Realty Trust, Inc. | | | | | 176,417 | | | | 2,409,856 | |
New Residential Investment Corp. | | | | | 134,766 | | | | 2,265,417 | |
Total Financials | | | | | | | | | 4,675,273 | |
| | | | | | | | | | | |
Industrials — 1.3% | | | | | | | | | | |
Grupo Aeroportuario del Pacifico SAB de CV (Mexico)(1) | | | | | 25,144 | | | | 2,548,847 | |
| | | | | | | | | | | |
Security Description
| | | | Shares
| | Value
|
Common Stocks (continued) | | | | | | | | | | |
| | | | | | | | | | | |
Materials — 19.9% | | | | | | | | | | |
Air Products & Chemicals, Inc. | | | | | 12,166 | | | $ | 2,503,641 | |
Braskem SA (Brazil)(1) | | | | | 82,520 | | | | 2,017,614 | |
Eastman Chemical Co. | | | | | 28,825 | | | | 2,273,716 | |
Huntsman Corp. | | | | | 99,542 | | | | 2,213,814 | |
LyondellBasell Industries NV Class A | | | | | 25,793 | | | | 2,275,716 | |
Mercer International, Inc. (Canada) | | | | | 161,184 | | | | 2,282,366 | |
Methanex Corp. (Canada) | | | | | 37,719 | | | | 2,071,528 | |
Neenah, Inc. | | | | | 34,873 | | | | 2,366,133 | |
Norbord, Inc. (Canada) | | | | | 84,542 | | | | 2,152,439 | |
PolyOne Corp. | | | | | 74,747 | | | | 2,066,007 | |
Reliance Steel & Aluminum Co. | | | | | 25,219 | | | | 2,319,139 | |
Rio Tinto PLC (Australia)(1) | | | | | 40,074 | | | | 2,360,359 | |
Sensient Technologies Corp. | | | | | 34,319 | | | | 2,406,448 | |
Sociedad Quimica y Minera de
Chile SA (Chile)(1) | | | | | 57,895 | | | | 2,063,378 | |
Southern Copper Corp. (Peru) | | | | | 57,748 | | | | 2,218,678 | |
Steel Dynamics, Inc. | | | | | 63,618 | | | | 2,015,418 | |
Vale SA (Brazil)(1) | | | | | 169,208 | | | | 2,162,478 | |
Vedanta Ltd. (India)(1) | | | | | 225,723 | | | | 2,157,912 | |
Total Materials | | | | | | | | | 39,926,784 | |
| | | | | | | | | | | |
Real Estate — 31.9% | | | | | | | | | | |
Alexander’s, Inc. | | | | | 6,192 | | | | 2,350,669 | |
Apple Hospitality REIT, Inc. | | | | | 138,875 | | | | 2,284,494 | |
Armada Hoffler Properties, Inc. | | | | | 147,224 | | | | 2,377,668 | |
Braemar Hotels & Resorts, Inc. | | | | | 183,525 | | | | 2,550,997 | |
Brandywine Realty Trust | | | | | 145,902 | | | | 2,245,432 | |
Brixmor Property Group, Inc. | | | | | 126,041 | | | | 2,253,613 | |
Community Healthcare Trust, Inc. | | | | | 63,902 | | | | 2,331,145 | |
Easterly Government Properties, Inc. | | | | | 126,391 | | | | 2,275,038 | |
EPR Properties | | | | | 29,793 | | | | 2,349,476 | |
Gaming and Leisure Properties, Inc. | | | | | 60,573 | | | | 2,445,938 | |
GEO Group, Inc. (The) | | | | | 117,885 | | | | 2,360,058 | |
Global Net Lease, Inc. | | | | | 119,182 | | | | 2,272,801 | |
Iron Mountain, Inc. | | | | | 64,647 | | | | 2,099,734 | |
Jernigan Capital, Inc. | | | | | 106,179 | | | | 2,237,191 | |
Kimco Realty Corp. | | | | | 125,346 | | | | 2,179,767 | |
Lamar Advertising Co. Class A | | | | | 28,453 | | | | 2,352,209 | |
Medical Properties Trust, Inc. | | | | | 120,887 | | | | 2,110,687 | |
Monmouth Real Estate Investment Corp. | | | | | 172,281 | | | | 2,367,141 | |
National Health Investors, Inc. | | | | | 28,556 | | | | 2,153,979 | |
Omega Healthcare Investors, Inc. | | | | | 61,274 | | | | 2,168,487 | |
One Liberty Properties, Inc. | | | | | 76,763 | | | | 2,172,393 | |
Pebblebrook Hotel Trust | | | | | 71,018 | | | | 2,312,346 | |
Ryman Hospitality Properties, Inc. | | | | | 27,128 | | | | 2,159,389 | |
Sabra Health Care REIT, Inc. | | | | | 119,808 | | | | 2,343,444 | |
Summit Hotel Properties, Inc. | | | | | 200,664 | | | | 2,329,709 | |
Taubman Centers, Inc. | | | | | 43,307 | | | | 2,135,035 | |
Weingarten Realty Investors | | | | | 80,507 | | | | 2,329,873 | |
Xenia Hotels & Resorts, Inc. | | | | | 112,526 | | | | 2,436,188 | |
Total Real Estate | | | | | | | | | 63,984,901 | |
The accompanying notes are an integral part of these financial statements.
30
Schedule of Investments — Virtus Real Asset Income ETF(continued)
April 30, 2019 (unaudited)
Security Description
| | | | Shares
| | Value
|
Common Stocks (continued) | | | | | | | | | | |
| | | | | | | | | | | |
Utilities — 4.6% | | | | | | | | | | |
Algonquin Power & Utilities Corp. (Canada) | | | | | 203,532 | | | $ | 2,320,265 | |
Dominion Energy, Inc. | | | | | 30,324 | | | | 2,361,330 | |
Duke Energy Corp. | | | | | 25,333 | | | | 2,308,343 | |
Edison International | | | | | 35,049 | | | | 2,235,074 | |
Total Utilities | | | | | | | | | 9,225,012 | |
| | | | | | | | | | | |
Total Common Stocks | | | | | | | | | | |
(Cost $200,377,763) | | | | | | | | | 198,784,079 | |
| | | | | | | | | | | |
TOTAL INVESTMENTS — 99.1% | | | | | | | | | | |
(Cost $200,377,763) | | | | | | | | $ | 198,784,079 | |
Other Assets in Excess of Liabilities — 0.9% | | | | | | | | | 1,812,565 | |
Net Assets — 100.0% | | | | | | | | $ | 200,596,644 | |
* | | Non-income producing security. |
(1) | | American Depositary Receipts. |
The following table summarizes valuation of the Fund’s investments under the fair value hierarchy levels as of April 30, 2019 (See Note 2 in the Notes to Financial Statements):
| | | | Level 1
| | Level 2
| | Level 3
| | Total
|
Asset Valuation Inputs | | | | | | | | | | | | | | | | | | |
Common Stocks | | | | $ | 198,784,079 | | | $ | — | | | $ | — | | | $ | 198,784,079 | |
Total | | | | $ | 198,784,079 | | | $ | — | | | $ | — | | | $ | 198,784,079 | |
The accompanying notes are an integral part of these financial statements.
31
Schedule of Investments — Virtus WMC Global Factor Opportunities ETF
April 30, 2019 (unaudited)
Security Description
| | | | Shares
| | Value
|
Common Stocks — 97.7% | | | | | | | | | | |
| | | | | | | | | | | |
Communication Services — 4.9% | | | | | | | | | | |
China Mobile Ltd. (China) | | | | | 1,114 | | | $ | 10,615 | |
Chunghwa Telecom Co. Ltd. (Taiwan) | | | | | 4,121 | | | | 14,803 | |
Deutsche Telekom AG (Germany) | | | | | 732 | | | | 12,245 | |
Facebook, Inc. Class A* | | | | | 435 | | | | 84,129 | |
Liberty Global PLC Class A (United Kingdom)* | | | | | 1,003 | | | | 27,091 | |
Omnicom Group, Inc. | | | | | 467 | | | | 37,374 | |
Pearson PLC (United Kingdom) | | | | | 858 | | | | 9,289 | |
SK Telecom Co. Ltd. (South Korea) | | | | | 46 | | | | 9,746 | |
SoftBank Group Corp. (Japan) | | | | | 159 | | | | 16,493 | |
Ubisoft Entertainment SA (France)* | | | | | 103 | | | | 9,824 | |
Viacom, Inc. Class B | | | | | 407 | | | | 11,766 | |
Vodafone Group PLC (United Kingdom) | | | | | 7,248 | | | | 13,421 | |
Total Communication Services | | | | | | | | | 256,796 | |
| | | | | | | | | | | |
Consumer Discretionary — 9.7% | | | | | | | | | | |
adidas AG (Germany) | | | | | 51 | | | | 13,105 | |
Advance Auto Parts, Inc. | | | | | 92 | | | | 15,301 | |
AutoZone, Inc.* | | | | | 25 | | | | 25,708 | |
Berkeley Group Holdings PLC (United Kingdom) | | | | | 300 | | | | 14,693 | |
Best Buy Co., Inc. | | | | | 360 | | | | 26,788 | |
Chipotle Mexican Grill, Inc. Class A* | | | | | 30 | | | | 20,641 | |
Daimler AG (Germany)* | | | | | 300 | | | | 19,630 | |
Darden Restaurants, Inc. | | | | | 172 | | | | 20,227 | |
eBay, Inc. | | | | | 494 | | | | 19,142 | |
Fiat Chrysler Automobiles NV (United Kingdom) | | | | | 808 | | | | 12,446 | |
General Motors Co. | | | | | 585 | | | | 22,786 | |
H&R Block, Inc. | | | | | 385 | | | | 10,476 | |
Haier Electronics Group Co. Ltd. (Hong Kong)* | | | | | 5,938 | | | | 16,993 | |
Home Depot, Inc. (The) | | | | | 188 | | | | 38,296 | |
Kohl’s Corp. | | | | | 239 | | | | 16,993 | |
Lear Corp. | | | | | 110 | | | | 15,730 | |
Lululemon Athletica, Inc.* | | | | | 151 | | | | 26,629 | |
Macy’s, Inc. | | | | | 452 | | | | 10,640 | |
Panasonic Corp. (Japan) | | | | | 2,408 | | | | 22,071 | |
Peugeot SA (France) | | | | | 643 | | | | 16,847 | |
PulteGroup, Inc. | | | | | 506 | | | | 15,919 | |
PVH Corp. | | | | | 142 | | | | 18,317 | |
Sankyo Co. Ltd. (Japan) | | | | | 326 | | | | 12,833 | |
Starbucks Corp. | | | | | 417 | | | | 32,393 | |
Tata Motors Ltd. (India)*(1) | | | | | 1,202 | | | | 18,511 | |
VF Corp. | | | | | 215 | | | | 20,298 | |
Total Consumer Discretionary | | | | | | | | | 503,413 | |
| | | | | | | | | | | |
Consumer Staples — 8.8% | | | | | | | | | | |
Aeon Co. Ltd. (Japan) | | | | | 1,044 | | | | 19,255 | |
Archer-Daniels-Midland Co. | | | | | 535 | | | | 23,861 | |
BIM Birlesik Magazalar AS (Turkey) | | | | | 628 | | | | 8,741 | |
Chocoladefabriken Lindt & Spruengli AG (Switzerland) | | | | | 2 | | | | 13,298 | |
Church & Dwight Co., Inc. | | | | | 302 | | | | 22,635 | |
Coca-Cola Co. (The) | | | | | 254 | | | | 12,461 | |
Danone SA (France) | | | | | 225 | | | | 18,190 | |
Diageo PLC (United Kingdom) | | | | | 776 | | | | 32,720 | |
Heineken NV (Netherlands) | | | | | 146 | | | | 15,760 | |
Koninklijke Ahold Delhaize NV (Netherlands) | | | | | 824 | | | | 19,833 | |
Lamb Weston Holdings, Inc. | | | | | 191 | | | | 13,380 | |
L’Oreal SA (France) | | | | | 117 | | | | 32,164 | |
Nestle SA (Switzerland) | | | | | 350 | | | | 33,679 | |
NH Foods Ltd. (Japan) | | | | | 466 | | | | 18,699 | |
| | | | | | | | | | | |
Security Description
| | | | Shares
| | Value
|
Common Stocks (continued) | | | | | | | | | | |
| | | | | | | | | | | |
Consumer Staples (continued) | | | | | | | | | | |
PepsiCo, Inc. | | | | | 154 | | | $ | 19,720 | |
Pernod Ricard SA (France) | | | | | 131 | | | | 22,826 | |
Pick n Pay Stores Ltd. (South Africa) | | | | | 2,863 | | | | 13,884 | |
Procter & Gamble Co. (The) | | | | | 273 | | | | 29,069 | |
SPAR Group Ltd. (The) (South Africa) | | | | | 841 | | | | 11,405 | |
Unilever NV (United Kingdom) | | | | | 342 | | | | 20,698 | |
Unilever PLC (United Kingdom) | | | | | 374 | | | | 22,714 | |
Walmart, Inc. | | | | | 322 | | | | 33,115 | |
Total Consumer Staples | | | | | | | | | 458,107 | |
| | | | | | | | | | | |
Energy — 3.8% | | | | | | | | | | |
BP PLC (United Kingdom) | | | | | 4,212 | | | | 30,703 | |
China Petroleum & Chemical Corp.
Class H (China) | | | | | 23,868 | | | | 18,346 | |
CNOOC Ltd. (China) | | | | | 10,662 | | | | 19,272 | |
Equinor ASA (Norway) | | | | | 728 | | | | 16,239 | |
JXTG Holdings, Inc. (Japan) | | | | | 3,774 | | | | 18,319 | |
LUKOIL PJSC (Russia)(1) | | | | | 303 | | | | 25,906 | |
Marathon Petroleum Corp. | | | | | 330 | | | | 20,087 | |
Suncor Energy, Inc. (Canada) | | | | | 443 | | | | 14,609 | |
Tatneft PJSC (Russia)(1) | | | | | 220 | | | | 15,461 | |
TransCanada Corp. (Canada) | | | | | 408 | | | | 19,473 | |
Total Energy | | | | | | | | | 198,415 | |
| | | | | | | | | | | |
Financials — 26.3% | | | | | | | | | | |
Affiliated Managers Group, Inc. | | | | | 183 | | | | 20,298 | |
Aflac, Inc. | | | | | 484 | | | | 24,384 | |
AIA Group Ltd. (Hong Kong) | | | | | 2,644 | | | | 26,946 | |
Allianz SE (Germany) | | | | | 130 | | | | 31,320 | |
Allstate Corp. (The) | | | | | 204 | | | | 20,208 | |
American Express Co. | | | | | 485 | | | | 56,857 | |
American Financial Group, Inc. | | | | | 137 | | | | 14,184 | |
Athene Holding Ltd. Class A* | | | | | 333 | | | | 15,038 | |
Australia & New Zealand Banking Group Ltd. (Australia) | | | | | 744 | | | | 14,266 | |
Aviva PLC (United Kingdom) | | | | | 4,290 | | | | 24,027 | |
AXA SA (France) | | | | | 492 | | | | 13,103 | |
Axis Bank Ltd. (India)*(2) | | | | | 259 | | | | 14,090 | |
Banco Santander SA (Spain) | | | | | 4,554 | | | | 23,044 | |
Bank Central Asia Tbk PT (Indonesia) | | | | | 7,674 | | | | 15,483 | |
Bank of America Corp. | | | | | 4,094 | | | | 125,195 | |
Bank of New York Mellon Corp. (The) | | | | | 495 | | | | 24,582 | |
Berkshire Hathaway, Inc. Class B* | | | | | 82 | | | | 17,770 | |
Capital One Financial Corp. | | | | | 304 | | | | 28,220 | |
China Construction Bank Corp. Class H (China) | | | | | 18,968 | | | | 16,756 | |
Cincinnati Financial Corp. | | | | | 280 | | | | 26,930 | |
Commonwealth Bank of Australia (Australia) | | | | | 372 | | | | 19,542 | |
Deutsche Bank AG (Germany) | | | | | 1,242 | | | | 10,265 | |
Discover Financial Services | | | | | 344 | | | | 28,033 | |
E*TRADE Financial Corp. | | | | | 430 | | | | 21,784 | |
East West Bancorp, Inc. | | | | | 339 | | | | 17,452 | |
Everest Re Group Ltd. | | | | | 72 | | | | 16,956 | |
EXOR NV (Netherlands) | | | | | 244 | | | | 16,245 | |
Franklin Resources, Inc. | | | | | 468 | | | | 16,188 | |
Groupe Bruxelles Lambert SA (Belgium) | | | | | 145 | | | | 13,860 | |
Hanwha Life Insurance Co. Ltd. (South Korea) | | | | | 5,231 | | | | 17,867 | |
Hartford Financial Services Group, Inc. (The) | | | | | 460 | | | | 24,063 | |
Hong Kong Exchanges & Clearing Ltd.
(Hong Kong) | | | | | 647 | | | | 22,433 | |
The accompanying notes are an integral part of these financial statements.
32
Schedule of Investments — Virtus WMC Global Factor Opportunities ETF(continued)
April 30, 2019 (unaudited)
Security Description
| | | | Shares
| | Value
|
Common Stocks (continued) | | | | | | | | | | |
| | | | | | | | | | | |
Financials (continued) | | | | | | | | | | |
HSBC Holdings PLC (United Kingdom) | | | | | 2,555 | | | $ | 22,226 | |
Industrial & Commercial Bank of China Ltd. Class H (China) | | | | | 23,006 | | | | 17,273 | |
Invesco Ltd. | | | | | 952 | | | | 20,915 | |
Investec PLC (South Africa) | | | | | 1,879 | | | | 11,884 | |
Legal & General Group PLC (United Kingdom) | | | | | 9,333 | | | | 33,858 | |
Lloyds Banking Group PLC (United Kingdom) | | | | | 28,800 | | | | 23,498 | |
MetLife, Inc. | | | | | 520 | | | | 23,988 | |
Morgan Stanley | | | | | 508 | | | | 24,511 | |
National Australia Bank Ltd. (Australia) | | | | | 776 | | | | 13,867 | |
Northern Trust Corp. | | | | | 107 | | | | 10,545 | |
Ping An Insurance Group Co. of China Ltd.
Class H (China) | | | | | 1,415 | | | | 17,036 | |
Powszechna Kasa Oszczednosci Bank
Polski SA (Poland) | | | | | 1,052 | | | | 10,802 | |
Principal Financial Group, Inc. | | | | | 348 | | | | 19,892 | |
Progressive Corp. (The) | | | | | 701 | | | | 54,783 | |
Prudential Financial, Inc. | | | | | 256 | | | | 27,062 | |
Reinsurance Group of America, Inc. | | | | | 111 | | | | 16,818 | |
Royal Bank of Canada (Canada) | | | | | 260 | | | | 20,721 | |
Signature Bank/New York NY | | | | | 101 | | | | 13,339 | |
State Street Corp. | | | | | 256 | | | | 17,321 | |
Sumitomo Mitsui Financial Group, Inc. (Japan) | | | | | 318 | | | | 11,479 | |
Swiss Life Holding AG (Switzerland)* | | | | | 49 | | | | 23,039 | |
Synchrony Financial | | | | | 644 | | | | 22,327 | |
Torchmark Corp. | | | | | 355 | | | | 31,119 | |
Toronto-Dominion Bank (The) (Canada) | | | | | 468 | | | | 26,696 | |
Travelers Cos., Inc. (The) | | | | | 166 | | | | 23,862 | |
Voya Financial, Inc. | | | | | 348 | | | | 19,102 | |
Westpac Banking Corp. (Australia) | | | | | 764 | | | | 14,816 | |
Zurich Insurance Group AG (Switzerland) | | | | | 52 | | | | 16,581 | |
Total Financials | | | | | | | | | 1,366,749 | |
| | | | | | | | | | | |
Health Care — 7.0% | | | | | | | | | | |
Agilent Technologies, Inc. | | | | | 333 | | | | 26,140 | |
Alfresa Holdings Corp. (Japan) | | | | | 569 | | | | 15,809 | |
Anthem, Inc. | | | | | 127 | | | | 33,405 | |
Astellas Pharma, Inc. (Japan) | | | | | 1,216 | | | | 16,472 | |
Cardinal Health, Inc. | | | | | 243 | | | | 11,837 | |
Cigna Corp. | | | | | 193 | | | | 30,656 | |
CSL Ltd. (Australia) | | | | | 98 | | | | 13,718 | |
DexCom, Inc.* | | | | | 103 | | | | 12,470 | |
Gilead Sciences, Inc. | | | | | 596 | | | | 38,764 | |
Humana, Inc. | | | | | 99 | | | | 25,286 | |
Intuitive Surgical, Inc.* | | | | | 32 | | | | 16,340 | |
Johnson & Johnson | | | | | 178 | | | | 25,134 | |
Medtronic PLC | | | | | 121 | | | | 10,746 | |
Nektar Therapeutics* | | | | | 232 | | | | 7,429 | |
Pfizer, Inc. | | | | | 505 | | | | 20,508 | |
Roche Holding AG (Switzerland) | | | | | 78 | | | | 20,561 | |
Suzuken Co. Ltd. (Japan) | | | | | 280 | | | | 16,087 | |
Veeva Systems, Inc. Class A* | | | | | 187 | | | | 26,156 | |
Total Health Care | | | | | | | | | 367,518 | |
| | | | | | | | | | | |
Industrials — 10.1% | | | | | | | | | | |
AMETEK, Inc. | | | | | 256 | | | | 22,571 | |
Boeing Co. (The) | | | | | 104 | | | | 39,280 | |
Canadian National Railway Co. (Canada) | | | | | 175 | | | | 16,255 | |
CH Robinson Worldwide, Inc. | | | | | 204 | | | | 16,524 | |
| | | | | | | | | | | |
Security Description
| | | | Shares
| | Value
|
Common Stocks (continued) | | | | | | | | | | |
| | | | | | | | | | | |
Financials (continued) | | | | | | | | | | |
CoStar Group, Inc.* | | | | | 68 | | | $ | 33,745 | |
GS Engineering & Construction Corp.
(South Korea) | | | | | 257 | | | | 8,932 | |
IDEX Corp. | | | | | 165 | | | | 25,849 | |
Kingspan Group PLC (Ireland) | | | | | 217 | | | | 11,410 | |
Legrand SA (France) | | | | | 195 | | | | 14,330 | |
Lockheed Martin Corp. | | | | | 119 | | | | 39,666 | |
Marubeni Corp. (Japan) | | | | | 1,900 | | | | 13,562 | |
Obayashi Corp. (Japan) | | | | | 1,590 | | | | 15,544 | |
PACCAR, Inc. | | | | | 366 | | | | 26,231 | |
Safran SA (France) | | | | | 122 | | | | 17,775 | |
Samsung C&T Corp. (South Korea) | | | | | 111 | | | | 9,740 | |
Schindler Holding AG (Switzerland) | | | | | 87 | | | | 18,477 | |
Southwest Airlines Co. | | | | | 241 | | | | 13,069 | |
Sumitomo Corp. (Japan) | | | | | 961 | | | | 13,713 | |
Taisei Corp. (Japan) | | | | | 289 | | | | 12,648 | |
Toppan Printing Co. Ltd. (Japan) | | | | | 1,100 | | | | 17,784 | |
Toshiba Corp. (Japan) | | | | | 549 | | | | 18,235 | |
Transurban Group (Australia) | | | | | 1,944 | | | | 18,418 | |
Union Pacific Corp. | | | | | 160 | | | | 28,326 | |
Vestas Wind Systems A/S (Denmark) | | | | | 130 | | | | 11,757 | |
Vinci SA (France) | | | | | 194 | | | | 19,588 | |
Waste Management, Inc. | | | | | 181 | | | | 19,429 | |
Wolters Kluwer NV (Netherlands) | | | | | 310 | | | | 21,620 | |
Total Industrials | | | | | | | | | 524,478 | |
| | | | | | | | | | | |
Information Technology — 14.1% | | | | | | | | | | |
Adobe, Inc.* | | | | | 146 | | | | 42,230 | |
Alliance Data Systems Corp. | | | | | 53 | | | | 8,485 | |
Amphenol Corp. Class A | | | | | 233 | | | | 23,197 | |
Automatic Data Processing, Inc. | | | | | 131 | | | | 21,535 | |
Cadence Design Systems, Inc.* | | | | | 389 | | | | 26,989 | |
Canon, Inc. (Japan) | | | | | 710 | | | | 19,688 | |
CGI, Inc. Class A (Canada)* | | | | | 110 | | | | 7,918 | |
Citrix Systems, Inc. | | | | | 125 | | | | 12,620 | |
Compal Electronics, Inc. (Taiwan) | | | | | 21,524 | | | | 13,896 | |
Corning, Inc. | | | | | 683 | | | | 21,754 | |
DXC Technology Co. | | | | | 192 | | | | 12,622 | |
Fortinet, Inc.* | | | | | 261 | | | | 24,383 | |
Fujitsu Ltd. (Japan) | | | | | 273 | | | | 19,937 | |
Hon Hai Precision Industry Co. Ltd. (Taiwan) | | | | | 6,154 | | | | 17,306 | |
HP, Inc. | | | | | 1,280 | | | | 25,536 | |
Keysight Technologies, Inc.* | | | | | 296 | | | | 25,761 | |
Lam Research Corp. | | | | | 126 | | | | 26,136 | |
Mastercard, Inc. Class A | | | | | 165 | | | | 41,950 | |
Micro Focus International PLC (United Kingdom) | | | | | 270 | | | | 6,834 | |
Micron Technology, Inc.* | | | | | 653 | | | | 27,465 | |
Microsoft Corp. | | | | | 323 | | | | 42,184 | |
NEC Corp. (Japan) | | | | | 587 | | | | 19,734 | |
NXP Semiconductors NV (Netherlands) | | | | | 152 | | | | 16,054 | |
Seagate Technology PLC | | | | | 296 | | | | 14,303 | |
Splunk, Inc.* | | | | | 118 | | | | 16,289 | |
SS&C Technologies Holdings, Inc. | | | | | 318 | | | | 21,516 | |
Synopsys, Inc.* | | | | | 263 | | | | 31,844 | |
Taiwan Semiconductor Manufacturing Co. Ltd. (Taiwan) | | | | | 2,164 | | | | 18,138 | |
Telefonaktiebolaget LM Ericsson Class B (Sweden) | | | | | 1,712 | | | | 16,945 | |
The accompanying notes are an integral part of these financial statements.
33
Schedule of Investments — Virtus WMC Global Factor Opportunities ETF(continued)
April 30, 2019 (unaudited)
Security Description
| | | | Shares
| | Value
|
Common Stocks (continued) | | | | | | | | | | |
| | | | | | | | | | | |
Information Technology (continued) | | | | | | | | | | |
Western Digital Corp. | | | | | 273 | | | $ | 13,956 | |
Wirecard AG (Germany) | | | | | 86 | | | | 12,896 | |
Workday, Inc. Class A* | | | | | 80 | | | | 16,450 | |
Worldpay, Inc. Class A* | | | | | 250 | | | | 29,303 | |
WPG Holdings Ltd. (Taiwan) | | | | | 12,541 | | | | 16,538 | |
Xilinx, Inc. | | | | | 173 | | | | 20,784 | |
Total Information Technology | | | | | | | | | 733,176 | |
| | | | | | | | | | | |
Materials — 3.6% | | | | | | | | | | |
Air Products & Chemicals, Inc. | | | | | 124 | | | | 25,518 | |
Anglo American Platinum Ltd. (South Africa) | | | | | 168 | | | | 8,479 | |
BHP Group Ltd. (Australia) | | | | | 624 | | | | 16,452 | |
BHP Group PLC (Australia) | | | | | 1,174 | | | | 27,700 | |
Covestro AG (Germany)(3) | | | | | 291 | | | | 15,911 | |
Empresas CMPC SA (Chile) | | | | | 5,829 | | | | 19,620 | |
Freeport-McMoRan, Inc. | | | | | 1,194 | | | | 14,698 | |
Givaudan SA (Switzerland) | | | | | 6 | | | | 15,540 | |
Jiangxi Copper Co. Ltd. Class H (China) | | | | | 10,594 | | | | 14,045 | |
LyondellBasell Industries NV Class A | | | | | 204 | | | | 17,999 | |
Teck Resources Ltd. Class B (Canada) | | | | | 434 | | | | 10,263 | |
Total Materials | | | | | | | | | 186,225 | |
| | | | | | | | | | | |
Real Estate — 4.3% | | | | | | | | | | |
Ascendas Real Estate Investment
Trust (Singapore) | | | | | 14,000 | | | | 30,880 | |
CK Asset Holdings Ltd. (Hong Kong) | | | | | 1,664 | | | | 13,363 | |
Equity Residential | | | | | 371 | | | | 28,352 | |
Link REIT (Hong Kong) | | | | | 1,124 | | | | 13,110 | |
Prologis, Inc. | | | | | 161 | | | | 12,344 | |
Public Storage | | | | | 102 | | | | 22,561 | |
Realty Income Corp. | | | | | 175 | | | | 12,252 | |
Redefine Properties Ltd. (South Africa) | | | | | 23,507 | | | | 16,186 | |
Simon Property Group, Inc. | | | | | 77 | | | | 13,375 | |
Sun Hung Kai Properties Ltd. (Hong Kong) | | | | | 851 | | | | 14,688 | |
Swiss Prime Site AG (Switzerland)* | | | | | 272 | | | | 21,836 | |
Vonovia SE (Germany) | | | | | 513 | | | | 25,587 | |
Total Real Estate | | | | | | | | | 224,534 | |
| | | | | | | | | | | |
Security Description
| | | | Shares
| | Value
|
Common Stocks (continued) | | | | | | | | | | |
| | | | | | | | | | | |
Utilities — 5.1% | | | | | | | | | | |
Chubu Electric Power Co., Inc. (Japan) | | | | | 987 | | | $ | 14,318 | |
CMS Energy Corp. | | | | | 214 | | | | 11,888 | |
Consolidated Edison, Inc. | | | | | 147 | | | | 12,665 | |
Dominion Energy, Inc. | | | | | 179 | | | | 13,939 | |
Fortis, Inc. (Canada) | | | | | 619 | | | | 22,880 | |
National Grid PLC (United Kingdom) | | | | | 1,784 | | | | 19,451 | |
NextEra Energy, Inc. | | | | | 141 | | | | 27,416 | |
OGE Energy Corp. | | | | | 576 | | | | 24,388 | |
Sempra Energy | | | | | 98 | | | | 12,539 | |
Southern Co. (The) | | | | | 266 | | | | 14,156 | |
Terna Rete Elettrica Nazionale SpA (Italy) | | | | | 3,038 | | | | 18,189 | |
WEC Energy Group, Inc. | | | | | 451 | | | | 35,372 | |
Xcel Energy, Inc. | | | | | 680 | | | | 38,420 | |
Total Utilities | | | | | | | | | 265,621 | |
| | | | | | | | | | | |
Total Common Stocks | | | | | | | | | | |
(Cost $4,796,841) | | | | | | | | | 5,085,032 | |
| | | | | | | | | | | |
PREFERRED STOCKS-1.1% | | | | | | | | | | |
| | | | | | | | | | | |
Consumer Staples — 0.3% | | | | | | | | | | |
Henkel AG & Co. KGaA, 2.04% (Germany) | | | | | 138 | | | | 13,967 | |
| | | | | | | | | | | |
Financials — 0.8% | | | | | | | | | | |
Banco Bradesco SA, 2.70% (Brazil) | | | | | 2,332 | | | | 21,161 | |
Itau Unibanco Holding SA, 4.23% (Brazil) | | | | | 2,672 | | | | 23,053 | |
Total Financials | | | | | | | | | 44,214 | |
| | | | | | | | | | | |
Total Preferred Stocks | | | | | | | | | | |
(Cost $62,632) | | | | | | | | | 58,181 | |
| | | | | | | | | | | |
TOTAL INVESTMENTS — 98.8% | | | | | | | | | | |
(Cost $4,859,473) | | | | | | | | | 5,143,213 | |
Other Assets in Excess of Liabilities — 1.2% | | | | | | | | | 60,659 | |
Net Assets — 100.0% | | | | | | | | $ | 5,203,872 | |
* | | Non-income producing security. |
(1) | | American Depositary Receipts. |
(2) | | Global Depositary Receipts. |
(3) | | Security was purchased pursuant to Rule 144A under the Securities Act of 1933 and may not be resold subject to that rule except to qualified institutional buyers. Unless otherwise noted, 144A securities are deemed to be liquid. At April 30, 2019, the aggregate value of these securities was $15,911, or 0.3% of net assets. |
The following table summarizes valuation of the Fund’s investments under the fair value hierarchy levels as of April 30, 2019 (See Note 2 in the Notes to Financial Statements):
| | | | Level 1
| | Level 2
| | Level 3
| | Total
|
Asset Valuation Inputs | | | | | | | | | | | | | | | | | | |
Common Stocks | | | | $ | 5,085,032 | | | $ | — | | | $ | — | | | $ | 5,085,032 | |
Preferred Stocks | | | | | 58,181 | | | | — | | | | — | | | | 58,181 | |
Total | | | | $ | 5,143,213 | | | $ | — | | | $ | — | | | $ | 5,143,213 | |
The accompanying notes are an integral part of these financial statements.
34
Statements of Assets and Liabilities
April 30, 2019 (unaudited)
| | | | InfraCap REIT
Preferred ETF
| | Virtus Glovista
Emerging
Markets ETF
| | Virtus
InfraCap U.S.
Preferred
Stock ETF
| | Virtus
LifeSci Biotech
Clinical
Trials ETF
| | Virtus
LifeSci Biotech
Products ETF
|
Assets: | | | | | | | | | | | | | | | | | | | | | | |
Investments, at cost | | | | $ | 22,836,648 | | | $ | 9,547,613 | | | $ | 30,610,031 | | | $ | 36,033,443 | | | $ | 41,236,003 | |
Investments, at value (including securities on loan)(a) | | | | | 22,823,503 | | | | 9,875,316 | | | | 31,503,849 | | | | 30,181,311 | | | | 38,069,949 | |
Cash and Cash equivalents | | | | | 405,375 | | | | 259,313 | | | | 530,724 | | | | 71,893 | | | | 85,391 | |
Foreign currency(b) | | | | | — | | | | 2,372 | | | | — | | | | — | | | | — | |
Due from brokers | | | | | — | | | | — | | | | 106,733 | | | | — | | | | — | |
Receivables: | | | | | | | | | | | | | | | | | | | | | | |
Dividends and interest | | | | | 5,965 | | | | 11,982 | | | | 36,906 | | | | 71 | | | | 92 | |
Securities lending | | | | | — | | | | — | | | | — | | | | 14,070 | | | | 2,943 | |
Tax reclaim | | | | | — | | | | 1,176 | | | | — | | | | — | | | | — | |
Investment securities sold | | | | | — | | | | 1,480,374 | | | | 80,536 | | | | — | | | | — | |
Prepaid expenses | | | | | 57 | | | | 142 | | | | 30 | | | | 113 | | | | 113 | |
Total Assets | | | | | 23,234,900 | | | | 11,630,675 | | | | 32,258,778 | | | | 30,267,458 | | | | 38,158,488 | |
| | | | | | | | | | | | | | | | | | | | | | | |
Liabilities: | | | | | | | | | | | | | | | | | | | | | | |
Borrowings | | | | | — | | | | — | | | | 5,373,023 | | | | — | | | | — | |
Payables: | | | | | | | | | | | | | | | | | | | | | | |
Investment securities purchased | | | | | — | | | | 1,470,538 | | | | 85,962 | | | | — | | | | — | |
Collateral for securities on loan | | | | | — | | | | — | | | | — | | | | 2,448,388 | | | | 2,527,736 | |
Deferred foreign tax payable | | | | | — | | | | 6,413 | | | | — | | | | — | | | | — | |
Advisory fees | | | | | 8,597 | | | | 6,618 | | | | 14,920 | | | | 18,577 | | | | 24,100 | |
Written options, at value(c) | | | | | — | | | | — | | | | 52,283 | | | | — | | | | — | |
Securities sold short, at value(d) | | | | | — | | | | — | | | | 1,395,050 | | | | — | | | | — | |
Other accrued expenses | | | | | — | | | | 1,281 | | | | — | | | | — | | | | — | |
Total Liabilities | | | | | 8,597 | | | | 1,484,850 | | | | 6,921,238 | | | | 2,466,965 | | | | 2,551,836 | |
Net Assets | | | | $ | 23,226,303 | | | $ | 10,145,825 | | | $ | 25,337,540 | | | $ | 27,800,493 | | | $ | 35,606,652 | |
| | | | | | | | | | | | | | | | | | | | | | | |
Net Assets Consist of: | | | | | | | | | | | | | | | | | | | | | | |
Paid-in capital | | | | $ | 24,141,980 | | | $ | 13,404,452 | | | $ | 24,487,249 | | | $ | 59,437,049 | | | $ | 42,639,749 | |
Total distributable earnings (accumulated deficit) | | | | | (915,677 | ) | | | (3,258,627 | )(e) | | | 850,291 | | | | (31,636,556 | ) | | | (7,033,097 | ) |
Net Assets | | | | $ | 23,226,303 | | | $ | 10,145,825 | | | $ | 25,337,540 | | | $ | 27,800,493 | | | $ | 35,606,652 | |
| | | | | | | | | | | | | | | | | | | | | | | |
Shares outstanding (unlimited number of shares of beneficial interest authorized, no par value) | | | | | 950,004 | | | | 450,004 | | | | 1,000,004 | | | | 1,000,004 | | | | 850,004 | |
Net asset value per share | | | | $ | 24.45 | | | $ | 22.55 | | | $ | 25.34 | | | $ | 27.80 | | | $ | 41.89 | |
(a) Market value of securities on loan | | | | $ | — | | | $ | — | | | $ | — | | | $ | 8,133,811 | | | $ | 10,393,167 | |
(b) Foreign currency, at cost | | | | $ | — | | | $ | 2,374 | | | $ | — | | | $ | — | | | $ | — | |
(c) Premiums received from written options | | | | $ | — | | | $ | — | | | $ | 64,432 | | | $ | — | | | $ | — | |
(d) Proceeds received from securities sold short | | | | $ | — | | | $ | — | | | $ | 1,346,730 | | | $ | — | | | $ | — | |
(e) Net of foreign taxes | | | | $ | — | | | $ | (6,413 | ) | | $ | — | | | $ | — | | | $ | — | |
The accompanying notes are an integral part of these financial statements.
35
Statements of Assets and Liabilities(continued)
April 30, 2019 (unaudited)
| | | | Virtus
Newfleet
Multi-Sector
Bond ETF
| | Virtus
Private Credit
Strategy ETF
| | Virtus
Real Asset
Income ETF
| | Virtus
WMC Global
Factor
Opportunities ETF
|
Assets: | | | | | | | | | | | | | | | | | | |
Investments, at cost | | | | $ | 35,837,928 | | | $ | 173,435,717 | | | $ | 200,377,763 | | | $ | 4,859,473 | |
Investments, at value | | | | | 35,567,154 | | | | 173,108,647 | | | | 198,784,079 | | | | 5,143,213 | |
Cash and Cash equivalents | | | | | 217,478 | | | | 3,043,846 | | | | 1,544,951 | | | | 48,854 | |
Foreign currency(a) | | | | | 2 | | | | — | | | | — | | | | 2,097 | |
Receivables: | | | | | | | | | | | | | | | | | | |
Investment securities sold | | | | | 33,437,835 | | | | — | | | | 135,656 | | | | 764 | |
Dividends and interest | | | | | 274,053 | | | | 289,888 | | | | 218,930 | | | | 11,570 | |
Tax reclaim | | | | | 1,061 | | | | — | | | | — | | | | 1,929 | |
Capital shares sold | | | | | — | | | | 3,918,619 | | | | 3,830,268 | | | | — | |
Prepaid expenses | | | | | 22,067 | | | | — | | | | — | | | | 57 | |
Total Assets | | | | | 69,519,650 | | | | 180,361,000 | | | | 204,513,884 | | | | 5,208,484 | |
| | | | | | | | | | | | | | | | | | | |
Liabilities: | | | | | | | | | | | | | | | | | | |
Payables: | | | | | | | | | | | | | | | | | | |
Investment securities purchased | | | | | 194,575 | | | | 3,919,019 | | | | 3,828,427 | | | | 767 | |
Capital shares payable | | | | | 3,649,436 | | | | — | | | | — | | | | — | |
Advisory fees | | | | | 23,599 | | | | 103,987 | | | | 88,813 | | | | 3,845 | |
Professional fees | | | | | 1,322 | | | | — | | | | — | | | | — | |
Trustee fees | | | | | 182 | | | | — | | | | — | | | | — | |
Other accrued expenses | | | | | 26,217 | | | | — | | | | — | | | | — | |
Total Liabilities | | | | | 3,895,331 | | | | 4,023,006 | | | | 3,917,240 | | | | 4,612 | |
Net Assets | | | | $ | 65,624,319 | | | $ | 176,337,994 | | | $ | 200,596,644 | | | $ | 5,203,872 | |
| | | | | | | | | | | | | | | | | | | |
Net Assets Consist of: | | | | | | | | | | | | | | | | | | |
Paid-in capital | | | | $ | 69,230,784 | | | $ | 173,660,605 | | | $ | 200,933,375 | | | $ | 5,000,100 | |
Total distributable earnings (accumulated deficit) | | | | | (3,606,465 | ) | | | 2,677,389 | | | | (336,731 | ) | | | 203,772 | |
Net Assets | | | | $ | 65,624,319 | | | $ | 176,337,994 | | | $ | 200,596,644 | | | $ | 5,203,872 | |
| | | | | | | | | | | | | | | | | | | |
Shares outstanding (unlimited number of shares of beneficial interest authorized, no par value) | | | | | 2,700,004 | | | | 6,750,004 | | | | 7,850,004 | | | | 200,004 | |
Net asset value per share | | | | $ | 24.31 | | | $ | 26.12 | | | $ | 25.55 | | | $ | 26.02 | |
(a) Foreign currency, at cost | | | | $ | 2 | | | $ | — | | | $ | — | | | $ | 2,088 | |
The accompanying notes are an integral part of these financial statements.
36
Statements of Operations
For the Period Ended April 30, 2019 (unaudited)
| | | | InfraCap
REIT
Preferred ETF
| | Virtus
Glovista
Emerging
Markets ETF
| | Virtus
InfraCap U.S.
Preferred
Stock ETF
| | Virtus
LifeSci Biotech
Clinical
Trials ETF
| | Virtus
LifeSci Biotech
Products ETF
|
Investment Income: | | | | | | | | | | | | | | | | | | | | | | |
Dividend income (net of foreign withholding taxes) | | | | $ | 719,084 | | | $ | 112,972 | | | $ | 511,314 | | | $ | — | | | $ | 23,577 | |
Interest income | | | | | 1,488 | | | | 930 | | | | 688 | | | | 1,982 | | | | 1,202 | |
Securities lending, net of fees | | | | | — | | | | — | | | | — | | | | 43,804 | | | | 11,266 | |
Total Investment Income | | | | | 720,572 | | | | 113,902 | | | | 512,002 | | | | 45,786 | | | | 36,045 | |
Expenses: | | | | | | | | | | | | | | | | | | | | | | |
Advisory fees | | | | | 50,140 | | | | 40,007 | | | | 51,441 | | | | 116,762 | | | | 119,605 | |
Dividend and interest expenses | | | | | — | | | | — | | | | 81,898 | | | | — | | | | — | |
Total Expenses | | | | | 50,140 | | | | 40,007 | | | | 133,339 | | | | 116,762 | | | | 119,605 | |
Less expense waivers/reimbursements | | | | | — | | | | (1,765 | ) | | | — | | | | — | | | | — | |
Net Expenses | | | | | 50,140 | | | | 38,242 | | | | 133,339 | | | | 116,762 | | | | 119,605 | |
Net Investment Income (Loss) | | | | | 670,432 | | | | 75,660 | | | | 378,663 | | | | (70,976 | ) | | | (83,560 | ) |
| | | | | | | | | | | | | | | | | | | | | | | |
Net Realized Gain (Loss) on: | | | | | | | | | | | | | | | | | | | | | | |
Investments | | | | | (355,688 | ) | | | (602,973 | ) | | | 178,031 | | | | (7,740,638 | ) | | | (2,271,731 | ) |
In-kind redemptions | | | | | — | | | | 229,361 | | | | — | | | | 1,094,680 | | | | 3,961,029 | |
Written options | | | | | — | | | | — | | | | 97,367 | | | | — | | | | — | |
Securities sold short | | | | | — | | | | — | | | | (23,136 | ) | | | — | | | | — | |
Foreign currency transactions | | | | | — | | | | (4,549 | ) | | | — | | | | — | | | | — | |
Total Net Realized Gain (Loss) | | | | | (355,688 | ) | | | (378,161 | ) | | | 252,262 | | | | (6,645,958 | ) | | | 1,689,298 | |
| | | | | | | | | | | | | | | | | | | | | | | |
Change in Net Unrealized Appreciation (Depreciation) on: | | | | | | | | | | | | | | | | | | | | | | |
Investments | | | | | 1,112,841 | | | | 1,579,155 | (1) | | | 1,110,853 | | | | 7,173,026 | | | | 2,024,893 | |
Written options | | | | | — | | | | — | | | | 12,291 | | | | — | | | | — | |
Securities sold short | | | | | — | | | | — | | | | (46,310 | ) | | | — | | | | — | |
Foreign currency translations | | | | | — | | | | 403 | | | | — | | | | — | | | | — | |
Total Change in Net Unrealized Appreciation | | | | | 1,112,841 | | | | 1,579,558 | | | | 1,076,834 | | | | 7,173,026 | | | | 2,024,893 | |
Net Realized and Change in Unrealized Gain | | | | | 757,153 | | | | 1,201,397 | | | | 1,329,096 | | | | 527,068 | | | | 3,714,191 | |
Net Increase in Net Assets Resulting from Operations | | | | $ | 1,427,585 | | | $ | 1,277,057 | | | $ | 1,707,759 | | | $ | 456,092 | | | $ | 3,630,631 | |
Foreign withholding taxes | | | | $ | — | | | $ | 16,147 | | | $ | — | | | $ | — | | | $ | — | |
(1) | | Net of change in deferred taxes of $(2,112). |
The accompanying notes are an integral part of these financial statements.
37
Statements of Operations(continued)
For the Period Ended April 30, 2019 (unaudited)
| | | | Virtus
Newfleet
Multi-Sector
Bond ETF
| | Virtus
Private Credit
Strategy ETF(1)
| | Virtus
Real Asset
Income ETF(1)
| | Virtus
WMC Global
Factor
Opportunities ETF
|
Investment Income: | | | | | | | | | | | | | | | | | | |
Dividend income (net of foreign withholding taxes) | | | | $ | 29,344 | | | $ | 3,606,067 | | | $ | 1,599,210 | | | $ | 61,527 | |
Interest income | | | | | 2,000,575 | | | | 1,838 | | | | 1,060 | | | | 136 | |
Total Investment Income | | | | | 2,029,919 | | | | 3,607,905 | | | | 1,600,270 | | | | 61,663 | |
Expenses: | | | | | | | | | | | | | | | | | | |
Advisory fees | | | | | 267,906 | | | | 221,660 | | | | 188,731 | | | | 11,936 | |
Pricing fees | | | | | 34,090 | | | | — | | | | — | | | | — | |
Accounting and administration fees | | | | | 11,099 | | | | — | | | | — | | | | — | |
Transfer agent fees | | | | | 10,113 | | | | — | | | | — | | | | — | |
Trustee fees | | | | | 5,996 | | | | — | | | | — | | | | — | |
Professional fees | | | | | 5,462 | | | | — | | | | — | | | | — | |
Report to shareholders fees | | | | | 3,672 | | | | — | | | | — | | | | — | |
Custody fees | | | | | 1,594 | | | | — | | | | — | | | | — | |
Insurance fees | | | | | 435 | | | | — | | | | — | | | | — | |
Exchange listing fees | | | | | 407 | | | | — | | | | — | | | | — | |
Other expenses | | | | | 568 | | | | — | | | | — | | | | — | |
Total Expenses | | | | | 341,342 | | | | 221,660 | | | | 188,731 | | | | 11,936 | |
Less expense waivers/reimbursements | | | | | (35,164 | ) | | | — | | | | — | | | | — | |
Net Expenses | | | | | 306,178 | | | | 221,660 | | | | 188,731 | | | | 11,936 | |
Net Investment Income | | | | | 1,723,741 | | | | 3,386,245 | | | | 1,411,539 | | | | 49,727 | |
| | | | | | | | | | | | | | | | | | | |
Net Realized Gain (Loss) on: | | | | | | | | | | | | | | | | | | |
Investments | | | | | (1,420,587 | ) | | | (446,002 | ) | | | (306,854 | ) | | | (113,407 | ) |
In-kind redemptions | | | | | — | | | | 64,216 | | | | 152,268 | | | | — | |
Foreign currency transactions | | | | | (6,583 | ) | | | — | | | | — | | | | (366 | ) |
Total Net Realized Loss | | | | | (1,427,170 | ) | | | (381,786 | ) | | | (154,586 | ) | | | (113,773 | ) |
| | | | | | | | | | | | | | | | | | | |
Change in Net Unrealized Appreciation (Depreciation) on: | | | | | | | | | | | | | | | | | | |
Investments | | | | | 2,741,056 | | | | (327,070 | ) | | | (1,593,684 | ) | | | 478,173 | |
Foreign currency translations | | | | | 1,871 | | | | — | | | | — | | | | (18 | ) |
Total Change in Net Unrealized Appreciation (Depreciation) | | | | | 2,742,927 | | | | (327,070 | ) | | | (1,593,684 | ) | | | 478,155 | |
Net Realized and Change in Unrealized Gain (Loss) | | | | | 1,315,757 | | | | (708,856 | ) | | | (1,748,270 | ) | | | 364,382 | |
Net Increase (Decrease) in Net Assets Resulting from Operations | | | | $ | 3,039,498 | | | $ | 2,677,389 | | | $ | (336,731 | ) | | $ | 414,109 | |
Foreign withholding taxes | | | | $ | — | | | $ | — | | | $ | 44,460 | | | $ | 3,694 | |
(1) | | From February 7, 2019 (commencement of operations) through April 30, 2019. |
The accompanying notes are an integral part of these financial statements.
38
Statements of Changes in Net Assets
| | | | InfraCap REIT Preferred ETF
| | Virtus Glovista Emerging Markets ETF
|
| | | | For the
Six Months Ended
April 30, 2019
(unaudited)
| | For the
Year Ended
October 31, 2018
| | For the
Six Months Ended
April 30, 2019
(unaudited)
| | For the Period
November 7, 2017(1)
Through
October 31, 2018
|
Increase (Decrease) in Net Assets Resulting from Operations: | | | | | | | | | | | | | | | | | | |
Net investment income | | | | $ | 670,432 | | | $ | 1,107,168 | | | $ | 75,660 | | | $ | 437,830 | |
Net realized loss on investments | | | | | (355,688 | ) | | | (489,779 | ) | | | (378,161 | ) | | | (3,285,966 | ) |
Net change in unrealized appreciation (depreciation) on investments | | | | | 1,112,841 | | | | (1,208,236 | ) | | | 1,579,558 | | | | (1,258,775 | ) |
Net increase (decrease) in net assets resulting from operations | | | | | 1,427,585 | | | | (590,847 | ) | | | 1,277,057 | | | | (4,106,911 | ) |
Distributions to Shareholders | | | | | (669,753 | ) | | | (1,137,316 | ) | | | (670,109 | ) | | | (51,696 | ) |
Distributions to Shareholders from return of capital | | | | | — | | | | (218,190 | ) | | | — | | | | — | |
Total distributions | | | | | (669,753 | ) | | | (1,355,506 | ) | | | (670,109 | ) | | | (51,696 | ) |
| | | | | | | | | | | | | | | | | | | |
Shareholder Transactions: | | | | | | | | | | | | | | | | | | |
Proceeds from shares sold | | | | | — | | | | 3,805,481 | | | | — | | | | 28,302,634 | |
Cost of shares redeemed | | | | | — | | | | — | | | | (3,353,381 | ) | | | (11,251,769 | ) |
Net increase (decrease) in net assets resulting from shareholder transactions | | | | | — | | | | 3,805,481 | | | | (3,353,381 | ) | | | 17,050,865 | |
Increase (decrease) in net assets | | | | | 757,832 | | | | 1,859,128 | | | | (2,746,433 | ) | | | 12,892,258 | |
| | | | | | | | | | | | | | | | | | | |
Net Assets: | | | | | | | | | | | | | | | | | | |
Beginning of period/year | | | | | 22,468,471 | | | | 20,609,343 | | | | 12,892,258 | | | | — | |
End of period/year | | | | $ | 23,226,303 | | | $ | 22,468,471 | | | $ | 10,145,825 | | | $ | 12,892,258 | |
| | | | | | | | | | | | | | | | | | | |
Changes in Shares Outstanding: | | | | | | | | | | | | | | | | | | |
Shares outstanding, beginning of period/year | | | | | 950,004 | | | | 800,004 | | | | 600,004 | | | | — | |
Shares sold | | | | | — | | | | 150,000 | | | | — | | | | 1,100,004 | |
Shares redeemed | | | | | — | | | | — | | | | (150,000 | ) | | | (500,000 | ) |
Shares outstanding, end of period/year | | | | | 950,004 | | | | 950,004 | | | | 450,004 | | | | 600,004 | |
(1) | | Commencement of operations. |
The accompanying notes are an integral part of these financial statements.
39
Statements of Changes in Net Assets(continued)
| | | | Virtus InfraCap U.S. Preferred Stock ETF
| | Virtus LifeSci Biotech Clinical Trials ETF
|
| | | | For the
Six Months
Ended
April 30, 2019
(unaudited)
| | For the Period
May 15, 2018(1)
Through
October 31, 2018
| | For the
Six Months
Ended
April 30, 2019
(unaudited)
| | For the
Year Ended
October 31, 2018
|
Increase (Decrease) in Net Assets Resulting from Operations: | | | | | | | | | | | | | | | | | | |
Net investment income (loss) | | | | $ | 378,663 | | | $ | 106,736 | | | $ | (70,976 | ) | | $ | (246,528 | ) |
Net realized gain (loss) on investments, written options and securities sold short | | | | | 252,262 | | | | 52,990 | | | | (6,645,958 | ) | | | 14,813,371 | |
Net change in unrealized appreciation (depreciation) on investments, written options and securities sold short | | | | | 1,076,834 | | | | (219,187 | ) | | | 7,173,026 | | | | (17,174,895 | ) |
Net increase (decrease) in net assets resulting from operations | | | | | 1,707,759 | | | | (59,461 | ) | | | 456,092 | | | | (2,608,052 | ) |
Distributions to Shareholders | | | | | (665,004 | ) | | | (133,003 | ) | | | — | | | | (326,965 | ) |
| | | | | | | | | | | | | | | | | | | |
Shareholder Transactions: | | | | | | | | | | | | | | | | | | |
Proceeds from shares sold | | | | | 18,177,272 | | | | 6,309,977 | | | | 6,331,272 | | | | 72,952,271 | |
Cost of shares redeemed | | | | | — | | | | — | | | | (15,256,015 | ) | | | (64,249,191 | ) |
Net increase (decrease) in net assets resulting from shareholder transactions | | | | | 18,177,272 | | | | 6,309,977 | | | | (8,924,743 | ) | | | 8,703,080 | |
Increase (decrease) in net assets | | | | | 19,220,027 | | | | 6,117,513 | | | | (8,468,651 | ) | | | 5,768,063 | |
| | | | | | | | | | | | | | | | | | | |
Net Assets: | | | | | | | | | | | | | | | | | | |
Beginning of period/year | | | | | 6,117,513 | | | | — | | | | 36,269,144 | | | | 30,501,081 | |
End of period/year | | | | $ | 25,337,540 | | | $ | 6,117,513 | | | $ | 27,800,493 | | | $ | 36,269,144 | |
| | | | | | | | | | | | | | | | | | | |
Changes in Shares Outstanding: | | | | | | | | | | | | | | | | | | |
Shares outstanding, beginning of period/year | | | | | 250,004 | | | | — | | | | 1,350,004 | | | | 1,100,004 | |
Shares sold | | | | | 750,000 | | | | 250,004 | | | | 250,000 | | | | 2,200,000 | |
Shares redeemed | | | | | — | | | | — | | | | (600,000 | ) | | | (1,950,000 | ) |
Shares outstanding, end of period/year | | | | | 1,000,004 | | | | 250,004 | | | | 1,000,004 | | | | 1,350,004 | |
(1) | | Commencement of operations. |
The accompanying notes are an integral part of these financial statements.
40
Statements of Changes in Net Assets(continued)
| | | | Virtus LifeSci Biotech Products ETF
| | Virtus Newfleet Multi-Sector Bond ETF
|
| | | | For the
Six Months
Ended
April 30, 2019
(unaudited)
| | For the
Year Ended
October 31, 2018
| | For the
Six Months
Ended
April 30, 2019
(unaudited)
| | For the
Year Ended
October 31, 2018
|
Increase (Decrease) in Net Assets Resulting from Operations: | | | | | | | | | | | | | | | | | | |
Net investment income (loss) | | | | $ | (83,560 | ) | | $ | (170,625 | ) | | $ | 1,723,741 | | | $ | 6,180,088 | |
Net realized gain (loss) on investments | | | | | 1,689,298 | | | | 7,902,704 | | | | (1,427,170 | ) | | | (2,016,169 | ) |
Net change in unrealized appreciation (depreciation) on investments | | | | | 2,024,893 | | | | (9,085,959 | ) | | | 2,742,927 | | | | (6,416,795 | ) |
Net increase (decrease) in net assets resulting from operations | | | | | 3,630,631 | | | | (1,353,880 | ) | | | 3,039,498 | | | | (2,252,876 | ) |
Distributions to Shareholders | | | | | — | | | | (68,685 | ) | | | (1,695,447 | ) | | | (9,169,422 | ) |
| | | | | | | | | | | | | | | | | | | |
Shareholder Transactions: | | | | | | | | | | | | | | | | | | |
Proceeds from shares sold | | | | | 16,438,488 | | | | 14,861,049 | | | | 8,370,585 | | | | 10,021,681 | |
Cost of shares redeemed | | | | | (11,710,012 | ) | | | (23,567,951 | ) | | | (43,049,577 | ) | | | (68,923,686 | ) |
Net increase (decrease) in net assets resulting from shareholder transactions | | | | | 4,728,476 | | | | (8,706,902 | ) | | | (34,678,992 | ) | | | (58,902,005 | ) |
Increase (decrease) in net assets | | | | | 8,359,107 | | | | (10,129,467 | ) | | | (33,334,941 | ) | | | (70,324,303 | ) |
| | | | | | | | | | | | | | | | | | | |
Net Assets: | | | | | | | | | | | | | | | | | | |
Beginning of period/year | | | | | 27,247,545 | | | | 37,377,012 | | | | 98,959,260 | | | | 169,283,563 | |
End of period/year | | | | $ | 35,606,652 | | | $ | 27,247,545 | | | $ | 65,624,319 | | | $ | 98,959,260 | |
| | | | | | | | | | | | | | | | | | | |
Changes in Shares Outstanding: | | | | | | | | | | | | | | | | | | |
Shares outstanding, beginning of period/year | | | | | 750,004 | | | | 950,004 | | | | 4,150,004 | | | | 6,550,004 | |
Shares sold | | | | | 400,000 | | | | 350,000 | | | | 350,000 | | | | 400,000 | |
Shares redeemed | | | | | (300,000 | ) | | | (550,000 | ) | | | (1,800,000 | ) | | | (2,800,000 | ) |
Shares outstanding, end of period/year | | | | | 850,004 | | | | 750,004 | | | | 2,700,004 | | | | 4,150,004 | |
The accompanying notes are an integral part of these financial statements.
41
Statements of Changes in Net Assets(continued)
| | | | Virtus
Private Credit
Strategy ETF
| | Virtus
Real Asset
Income ETF
|
| | | | For the Period
February 7, 2019(1)
Through
April 30, 2019
(unaudited)
| | For the Period
February 7, 2019(1)
Through
April 30, 2019
(unaudited)
|
Increase (Decrease) in Net Assets Resulting from Operations: | | | | | | | | | | |
Net investment income | | | | $ | 3,386,245 | | | $ | 1,411,539 | |
Net realized loss on investments | | | | | (381,786 | ) | | | (154,586 | ) |
Net change in unrealized depreciation on investments | | | | | (327,070 | ) | | | (1,593,684 | ) |
Net increase (decrease) in net assets resulting from operations | | | | | 2,677,389 | | | | (336,731 | ) |
| | | | | | | | | | | |
Shareholder Transactions: | | | | | | | | | | |
Proceeds from shares sold | | | | | 176,212,732 | | | | 203,484,263 | |
Cost of shares redeemed | | | | | (2,552,127 | ) | | | (2,550,888 | ) |
Net increase in net assets resulting from shareholder transactions | | | | | 173,660,605 | | | | 200,933,375 | |
Increase in net assets | | | | | 176,337,994 | | | | 200,596,644 | |
| | | | | | | | | | | |
Net Assets: | | | | | | | | | | |
Beginning of period/year | | | | | — | | | | — | |
End of period/year | | | | $ | 176,337,994 | | | $ | 200,596,644 | |
| | | | | | | | | | | |
Changes in Shares Outstanding: | | | | | | | | | | |
Shares outstanding, beginning of period/year | | | | | — | | | | — | |
Shares sold | | | | | 6,850,004 | | | | 7,950,004 | |
Shares redeemed | | | | | (100,000 | ) | | | (100,000 | ) |
Shares outstanding, end of period/year | | | | | 6,750,004 | | | | 7,850,004 | |
(1) | | Commencement of operations. |
The accompanying notes are an integral part of these financial statements.
42
Statements of Changes in Net Assets(continued)
| | | | Virtus WMC Global Factor
Opportunities ETF
|
| | | | For the
Six Months
Ended
April 30, 2019
(unaudited)
| | For the
Year Ended
October 31, 2018
|
Increase (Decrease) in Net Assets Resulting from Operations: | | | | | | | | | | |
Net investment income | | | | $ | 49,727 | | | $ | 99,437 | |
Net realized gain (loss) on investments | | | | | (113,773 | ) | | | 109,039 | |
Net change in unrealized appreciation (depreciation) on investments | | | | | 478,155 | | | | (213,407 | ) |
Net increase (decrease) in net assets resulting from operations | | | | | 414,109 | | | | (4,931 | ) |
Distributions to Shareholders | | | | | (205,032 | ) | | | (19,408 | ) |
Increase (decrease) in net assets | | | | | 209,077 | | | | (24,339 | ) |
| | | | | | | | | | | |
Net Assets: | | | | | | | | | | |
Beginning of period/year | | | | | 4,994,795 | | | | 5,019,134 | |
End of period/year | | | | $ | 5,203,872 | | | $ | 4,994,795 | |
| | | | | | | | | | | |
Changes in Shares Outstanding: | | | | | | | | | | |
Shares outstanding, beginning of period/year | | | | | 200,004 | | | | 200,004 | |
Shares outstanding, end of period/year | | | | | 200,004 | | | | 200,004 | |
The accompanying notes are an integral part of these financial statements.
43
Statement of Cash Flows
For the period ended April 30, 2019
| | | | Virtus
InfraCap
U.S. Preferred
Stock ETF
|
Cash Flows From Operating Activities: | | | | | | |
Net increase in net assets from operations | | | | $ | 1,707,759 | |
Adjustments to reconcile net decrease in net assets from operations to net cash used in operating activities: | | | | | | |
Purchases of investment securities | | | | | (12,679,130 | ) |
Proceeds from sales of investment securities | | | | | 12,954,469 | |
Net proceeds from purchased and written options | | | | | 176,369 | |
Net proceeds from securities sold short | | | | | 2,040,017 | |
Payments made to cover securities sold short | | | | | (793,625 | ) |
Net realized gain on investments | | | | | (178,031 | ) |
Net realized loss on securities sold shorts | | | | | 23,136 | |
Net realized gain on written options | | | | | (97,367 | ) |
Net change in unrealized appreciation on investments | | | | | (1,110,853 | ) |
Net change in unrealized depreciation on securities sold short | | | | | 46,310 | |
Net change in unrealized appreciation on written options | | | | | (12,291 | ) |
Increase in dividends and interest receivable | | | | | (26,323 | ) |
Increase in prepaid taxes | | | | | (30 | ) |
Decrease in due from brokers | | | | | 43,486 | |
Increase in advisory fees payable | | | | | 10,370 | |
Net cash used in operating activities | | | | | 2,104,266 | |
| | | | | | | |
Cash Flows from Financing Activities: | | | | | | |
Proceeds from borrowings | | | | | 3,494,126 | |
Payments for fund shares sold in excess of in-kind creations | | | | | (4,676,312 | ) |
Distributions paid | | | | | (665,005 | ) |
Net cash provided by financing activities | | | | | (1,847,191 | ) |
Net increase in cash | | | | | 257,075 | |
Cash, beginning of period | | | | | 273,649 | |
Cash, end of period | | | | $ | 530,724 | |
| | | | | | | |
Supplementary information: | | | | | | |
Interest paid on borrowings | | | | | 57,071 | |
Non-cash financing activiities: | | | | | | |
In-kind creations — Issued | | | | | 22,853,584 | |
In-kind creations — Redeemed | | | | | — | |
The accompanying notes are an integral part of these financial statements.
44
| | | | InfraCap REIT Preferred ETF
|
| | | | For the
Six Months Ended
April 30, 2019
(unaudited)
| | For the
Year Ended
October 31, 2018
| | For the Period
February 7, 2017(1)
Through
October 31, 2017
|
Per Share Data for a Share Outstanding throughout each period presented: | | | | | | | | | | | | | | |
Net asset value, beginning of period | | | | $ | 23.65 | | | $ | 25.76 | | | $ | 25.06 | |
Investment operations: | | | | | | | | | | | | |
Net investment income(2) | | | | | 0.71 | | | | 1.21 | | | | 1.03 | |
Net realized and unrealized gain (loss) | | | | | 0.80 | | | | (1.85 | ) | | | 0.60 | |
Total from investment operations | | | | | 1.51 | | | | (0.64 | ) | | | 1.63 | |
| | | | | | | | | | | | | |
Less Distributions from: | | | | | | | | | | | | |
Net Investment income | | | | | (0.71 | ) | | | (1.23 | ) | | | (0.93 | ) |
Return of capital | | | | | — | | | | (0.24 | ) | | | — | |
Total distributions | | | | | (0.71 | ) | | | (1.47 | ) | | | (0.93 | ) |
Net Asset Value, End of period | | | | $ | 24.45 | | | $ | 23.65 | | | $ | 25.76 | |
Net Asset Value Total Return(3) | | | | | 6.55 | % | | | (2.60 | )% | | | 6.54 | % |
Net assets, end of period (000’s omitted) | | | | $ | 23,226 | | | $ | 22,468 | | | $ | 20,609 | |
| | | | | | | | | | | | | |
RATIOS/SUPPLEMENTAL DATA: | | | | | | | | | | | | |
Ratios to Average Net Assets: | | | | | | | | | | | | |
Expenses | | | | | 0.45 | %(4) | | | 0.45 | %(5) | | | 0.45 | %(4) |
Net investment income | | | | | 6.02 | %(4) | | | 4.93 | % | | | 5.48 | %(4) |
Portfolio turnover rate(6) | | | | | 24 | %(7) | | | 70 | % | | | 91 | %(7) |
(1) | | Commencement of operations. |
(2) | | Based on average shares outstanding. |
(3) | | Net Asset Value Total Return is calculated assuming an initial investment made at the net asset value on the first day of the period, reinvestment of dividends and distributions at net asset value during the period, and redemption at net asset value on the last day of the period. Total return calculated for a period of less than one year is not annualized. |
(5) | | The ratios of expenses to average net assets includes tax expense fees of less than 0.01%. |
(6) | | Portfolio turnover excludes the value of portfolio securities received or delivered as a result of in-kind creations or redemptions of the Fund’s capital shares. |
The accompanying notes are an integral part of these financial statements.
45
Financial Highlights(continued)
| | | | Virtus Glovista Emerging
Markets ETF
|
| | | | For the
Six Months Ended
April 30, 2019
(unaudited)
| | For the Period
November 7, 2017(1)
Through
October 31, 2018
|
Per Share Data for a Share Outstanding throughout each period presented: | | | | | | | | | | |
Net asset value, beginning of period | | | | $ | 21.49 | | | $ | 24.95 | |
Investment operations: | | | | | | | | | | |
Net investment income(2) | | | | | 0.14 | | | | 0.53 | |
Net realized and unrealized gain (loss) | | | | | 2.04 | | | | (3.90 | ) |
Total from investment operations | | | | | 2.18 | | | | (3.37 | ) |
| | | | | | | | | | | |
Less Distributions from: | | | | | | | | | | |
Net Investment income | | | | | (1.12 | ) | | | (0.09 | ) |
Total distributions | | | | | (1.12 | ) | | | (0.09 | ) |
Net Asset Value, End of period | | | | $ | 22.55 | | | $ | 21.49 | |
Net Asset Value Total Return(3) | | | | | 10.55 | % | | | (13.58 | )% |
Net assets, end of period (000’s omitted) | | | | $ | 10,146 | | | $ | 12,892 | |
| | | | | | | | | | | |
RATIOS/SUPPLEMENTAL DATA: | | | | | | | | | | |
Ratios to Average Net Assets: | | | | | | | | | | |
Expenses, net of expense waivers | | | | | 0.65 | %(4) | | | 0.65 | %(4) |
Expenses, prior to expense waivers | | | | | 0.68 | %(4) | | | 0.68 | %(4) |
Net investment income | | | | | 1.29 | %(4) | | | 2.20 | %(4) |
Portfolio turnover rate(5) | | | | | 56 | %(6) | | | 162 | %(6) |
(1) | | Commencement of operations. |
(2) | | Based on average shares outstanding. |
(3) | | Net Asset Value Total Return is calculated assuming an initial investment made at the net asset value on the first day of the period, reinvestment of dividends and distributions at net asset value during the period, and redemption at net asset value on the last day of the period. Total return calculated for a period of less than one year is not annualized. |
(5) | | Portfolio turnover excludes the value of portfolio securities received or delivered as a result of in-kind creations or redemptions of the Fund’s capital shares. |
The accompanying notes are an integral part of these financial statements.
46
Financial Highlights(continued)
| | | | Virtus InfraCap U.S.
Preferred Stock ETF
|
| | | | For the
Six Months Ended
April 30, 2019
(unaudited)
| | For the Period
May 15, 2018(1)
Through
October 31, 2018
|
Per Share Data for a Share Outstanding throughout each period presented: | | | | | | | | | | |
Net asset value, beginning of period | | | | $ | 24.47 | | | $ | 24.96 | |
Investment operations: | | | | | | | | | | |
Net investment income(2) | | | | | 0.70 | | | | 0.72 | |
Net realized and unrealized gain (loss) | | | | | 1.31 | | | | (0.45 | ) |
Total from investment operations | | | | | 2.01 | | | | 0.27 | |
| | | | | | | | | | | |
Less Distributions from: | | | | | | | | | | |
Net Investment income | | | | | (1.14 | ) | | | (0.76 | ) |
Total distributions | | | | | (1.14 | ) | | | (0.76 | ) |
Net Asset Value, End of period | | | | $ | 25.34 | | | $ | 24.47 | |
Net Asset Value Total Return(3) | | | | | 8.62 | % | | | 1.02 | % |
Net assets, end of period (000’s omitted) | | | | $ | 25,338 | | | $ | 6,118 | |
| | | | | | | | | | | |
RATIOS/SUPPLEMENTAL DATA: | | | | | | | | | | |
Ratios to Average Net Assets: | | | | | | | | | | |
Expenses | | | | | 2.07 | %(4),(5) | | | 2.13 | %(4),(6) |
Net investment income | | | | | 5.89 | %(4) | | | 6.22 | %(4) |
Portfolio turnover rate(7) | | | | | 75 | %(8) | | | 55 | %(8) |
(1) | | Commencement of operations. |
(2) | | Based on average shares outstanding. |
(3) | | Net Asset Value Total Return is calculated assuming an initial investment made at the net asset value on the first day of the period, reinvestment of dividends and distributions at net asset value during the period, and redemption at net asset value on the last day of the period. Total return calculated for a period of less than one year is not annualized. |
(5) | | The ratios of expenses to average net assets include interest expense of 0.89% and dividend expense on securities sold short fees of 0.38%. |
(6) | | The ratios of expenses to average net assets include interest expense of 1.05% and dividend expense on securities sold short fees of 0.28%. |
(7) | | Portfolio turnover excludes the value of portfolio securities received or delivered as a result of in-kind creations or redemptions of the Fund’s capital shares. |
The accompanying notes are an integral part of these financial statements.
47
Financial Highlights(continued)
| | | | Virtus LifeSci Biotech Clinical Trials ETF
|
| | | | For the
Six Months Ended
April 30, 2019
(unaudited)
| | For the
Year Ended
October 31, 2018
| | For the
Year Ended
October 31, 2017
| | For the
Year Ended
October 31, 2016
| | For the Period
December 16, 2014(1)
Through
October 31, 2015
|
Per Share Data for a Share Outstanding throughout each period presented: | | | | | | | | | | | | | | | | | | | | | | |
Net asset value, beginning of period | | | | $ | 26.87 | | | $ | 27.73 | | | $ | 18.05 | | | $ | 27.37 | | | $ | 25.00 | |
Investment operations: | | | | | | | | | | | | | | | | | | | | | | |
Net investment loss(2) | | | | | (0.06 | ) | | | (0.15 | ) | | | (0.12 | ) | | | (0.14 | ) | | | (0.24 | ) |
Net realized and unrealized gain (loss) | | | | | 0.99 | | | | (0.41 | ) | | | 9.80 | | | | (9.03 | ) | | | 2.61 | (3) |
Total from investment operations | | | | | 0.93 | | | | (0.56 | ) | | | 9.68 | | | | (9.17 | ) | | | 2.37 | |
| | | | | | | | | | | | | | | | | | | | | | | |
Less Distributions from: | | | | | | | | | | | | | | | | | | | | | | |
Net Investment income | | | | | — | | | | (0.30 | ) | | | — | | | | — | | | | — | |
Net realized gains | | | | | — | | | | — | | | | — | | | | (0.15 | ) | | | — | |
Total distributions | | | | | — | | | | (0.30 | ) | | | — | | | | (0.15 | ) | | | — | |
Net Asset Value, End of period | | | | $ | 27.80 | | | $ | 26.87 | | | $ | 27.73 | | | $ | 18.05 | | | $ | 27.37 | |
Net Asset Value Total Return(4) | | | | | 3.48 | % | | | (2.05 | )% | | | 53.66 | % | | | (33.73 | )% | | | 9.46 | % |
Net assets, end of period (000’s omitted) | | | | $ | 27,800 | | | $ | 36,269 | | | $ | 30,501 | | | $ | 18,045 | | | $ | 23,261 | |
| | | | | | | | | | | | | | | | | | | | | | | |
RATIOS/SUPPLEMENTAL DATA: | | | | | | | | | | | | | | | | | | | | | | |
Ratios to Average Net Assets: | | | | | | | | | | | | | | | | | | | | | | |
Expenses | | | | | 0.79 | %(5) | | | 0.79 | %(6) | | | 0.83 | % | | | 0.85 | %(6) | | | 0.85 | %(5)(7) |
Net investment loss | | | | | (0.48 | )%(5) | | | (0.45 | )% | | | (0.53 | )% | | | (0.67 | )% | | | (0.85 | )%(5) |
Portfolio turnover rate(8) | | | | | 32 | %(9) | | | 65 | % | | | 45 | % | | | 54 | % | | | 76 | %(9) |
(1) | | Commencement of operations. |
(2) | | Based on average shares outstanding. |
(3) | | The per share amount of realized and unrealized gain (loss) on investments does not accord with the amounts reported in the Statements of Changes in Net Assets due to the timing of creation of Fund shares in relation to fluctuating market values. |
(4) | | Net Asset Value Total Return is calculated assuming an initial investment made at the net asset value on the first day of the period, reinvestment of dividends and distributions at net asset value during the period, and redemption at net asset value on the last day of the period. Total return calculated for a period of less than one year is not annualized. |
(6) | | The ratios of expenses to average net assets includes tax expense fees of less than 0.01%. |
(7) | | The ratios of expenses to average net assets includes interest expense fees of less than 0.01%. |
(8) | | Portfolio turnover excludes the value of portfolio securities received or delivered as a result of in-kind creations or redemptions of the Fund’s capital shares. |
The accompanying notes are an integral part of these financial statements.
48
Financial Highlights(continued)
| | | | Virtus LifeSci Biotech Products ETF
|
| | | | For the
Six Months Ended
April 30, 2019
(unaudited)
| | For the
Year Ended
October 31, 2018
| | For the
Year Ended
October 31, 2017
| | For the
Year Ended
October 31, 2016
| | For the Period
December 16, 2014(1)
Through
October 31, 2015
|
Per Share Data for a Share Outstanding throughout each period presented: | | | | | | | | | | | | | | | | | | | | | | |
Net asset value, beginning of period | | | | $ | 36.33 | | | $ | 39.34 | | | $ | 28.91 | | | $ | 30.50 | | | $ | 25.00 | |
Investment operations: | | | | | | | | | | | | | | | | | | | | | | |
Net investment income (loss)(2) | | | | | (0.11 | ) | | | (0.21 | ) | | | 0.07 | | | | (0.12 | ) | | | (0.17 | ) |
Net realized and unrealized gain (loss) | | | | | 5.67 | | | | (2.73 | ) | | | 10.36 | | | | (1.07 | ) | | | 5.67 | (3) |
Total from investment operations | | | | | 5.56 | | | | (2.94 | ) | | | 10.43 | | | | (1.19 | ) | | | 5.50 | |
| | | | | | | | | | | | | | | | | | | | | | | |
Less Distributions from: | | | | | | | | | | | | | | | | | | | | | | |
Net Investment income | | | | | — | | | | (0.07 | ) | | | — | | | | — | | | | — | |
Net realized gains | | | | | — | | | | — | | | | — | | | | (0.40 | ) | | | — | |
Total distributions | | | | | — | | | | (0.07 | ) | | | — | | | | (0.40 | ) | | | — | |
Net Asset Value, End of period | | | | $ | 41.89 | | | $ | 36.33 | | | $ | 39.34 | | | $ | 28.91 | | | $ | 30.50 | |
Net Asset Value Total Return(4) | | | | | 15.30 | % | | | (7.49 | )% | | | 36.08 | % | | | (3.97 | )% | | | 21.99 | % |
Net assets, end of period (000’s omitted) | | | | $ | 35,607 | | | $ | 27,248 | | | $ | 37,377 | | | $ | 23,130 | | | $ | 22,874 | |
| | | | | | | | | | | | | | | | | | | | | | | |
RATIOS/SUPPLEMENTAL DATA: | | | | | | | | | | | | | | | | | | | | | | |
Ratios to Average Net Assets: | | | | | | | | | | | | | | | | | | | | | | |
Expenses | | | | | 0.79 | %(5) | | | 0.79 | %(6) | | | 0.84 | % | | | 0.85 | %(6) | | | 0.86 | %(5)(7) |
Net investment income (loss) | | | | | (0.55 | )%(5) | | | (0.49 | )% | | | 0.19 | % | | | (0.43 | )% | | | (0.58 | )%(5) |
Portfolio turnover rate(8) | | | | | 22 | %(9) | | | 32 | % | | | 34 | % | | | 35 | % | | | 45 | %(9) |
(1) | | Commencement of operations. |
(2) | | Based on average shares outstanding. |
(3) | | The per share amount of realized and unrealized gain (loss) on investments does not accord with the amounts reported in the Statements of Changes in Net Assets due to the timing of creation of Fund shares in relation to fluctuating market values. |
(4) | | Net Asset Value Total Return is calculated assuming an initial investment made at the net asset value on the first day of the period, reinvestment of dividends and distributions at net asset value during the period, and redemption at net asset value on the last day of the period. Total return calculated for a period of less than one year is not annualized. |
(6) | | The ratios of expenses to average net assets includes tax expense fees of less than 0.01%. |
(7) | | The ratios of expenses to average net assets includes interest expense fees of 0.01%. |
(8) | | Portfolio turnover excludes the value of portfolio securities received or delivered as a result of in-kind creations or redemptions of the Fund’s capital shares. |
The accompanying notes are an integral part of these financial statements.
49
Financial Highlights(continued)
| | | | Virtus Newfleet Multi-Sector Bond ETF
|
| | | | For the
Six Months Ended
April 30, 2019
(unaudited)
| | For the
Year Ended
October 31, 2018
| | For the
Year Ended
October 31, 2017
| | For the
Year Ended
October 31, 2016
| | For the Period
August 10, 2015(1)
Through
October 31, 2015
|
Per Share Data for a Share Outstanding throughout each period presented: | | | | | | | | | | | | | | | | | | | | | | |
Net asset value, beginning of period | | | | $ | 23.85 | | | $ | 25.84 | | | $ | 25.96 | | | $ | 25.09 | | | $ | 25.00 | |
Investment operations: | | | | | | | | | | | | | | | | | | | | | | |
Net investment income(2) | | | | | 0.54 | | | | 1.12 | | | | 1.09 | | | | 0.95 | | | | 0.05 | |
Net realized and unrealized gain (loss) | | | | | 0.45 | | | | (1.51 | ) | | | 0.22 | | | | 0.85 | | | | 0.07 | |
Total from investment operations | | | | | 0.99 | | | | (0.39 | ) | | | 1.31 | | | | 1.80 | | | | 0.12 | |
| | | | | | | | | | | | | | | | | | | | | | | |
Less Distributions from: | | | | | | | | | | | | | | | | | | | | | | |
Net Investment income | | | | | (0.53 | ) | | | (1.15 | ) | | | (1.10 | ) | | | (0.93 | ) | | | (0.03 | ) |
Net realized gains | | | | | — | | | | (0.45 | ) | | | (0.33 | ) | | | — | | | | — | |
Total distributions | | | | | (0.53 | ) | | | (1.60 | ) | | | (1.43 | ) | | | (0.93 | ) | | | (0.03 | ) |
Net Asset Value, End of period | | | | $ | 24.31 | | | $ | 23.85 | | | $ | 25.84 | | | $ | 25.96 | | | $ | 25.09 | |
Net Asset Value Total Return(3) | | | | | 4.23 | % | | | (1.62 | )% | | | 5.26 | % | | | 7.37 | % | | | 0.47 | % |
Net assets, end of period (000’s omitted) | | | | $ | 65,624 | | | $ | 98,959 | | | $ | 169,284 | | | $ | 167,474 | | | $ | 153,035 | |
| | | | | | | | | | | | | | | | | | | | | | | |
RATIOS/SUPPLEMENTAL DATA: | | | | | | | | | | | | | | | | | | | | | | |
Ratios to Average Net Assets: | | | | | | | | | | | | | | | | | | | | | | |
Expenses, net of expense waivers | | | | | 0.80 | %(4) | | | 0.80 | % | | | 0.80 | % | | | 0.80 | %(5) | | | 0.80 | %(4) |
Expenses, prior to expense waivers | | | | | 0.89 | %(4) | | | 0.86 | % | | | 0.84 | % | | | 0.91 | %(5) | | | 0.99 | %(4) |
Net investment income | | | | | 4.50 | %(4) | | | 4.51 | % | | | 4.26 | % | | | 3.75 | % | | | 0.88 | %(4) |
Portfolio turnover rate(6) | | | | | 49 %(7 | | | | 82 | % | | | 113 | % | | | 100 | % | | | 20 | %(7) |
(1) | | Commencement of operations. |
(2) | | Based on average shares outstanding. |
(3) | | Net Asset Value Total Return is calculated assuming an initial investment made at the net asset value on the first day of the period, reinvestment of dividends and distributions at net asset value during the period, and redemption at net asset value on the last day of the period. Total return calculated for a period of less than one year is not annualized. |
(5) | | The ratios of expenses to average net assets includes tax expense fees of less than 0.01%. |
(6) | | Portfolio turnover excludes the value of portfolio securities received or delivered as a result of in-kind creations or redemptions of the Fund’s capital shares. |
The accompanying notes are an integral part of these financial statements.
50
Financial Highlights(continued)
| | | | Virtus Private
Credit
Strategy ETF
|
| | | | For the Period
February 7, 2019(1)
Through
April 30, 2019
|
Per Share Data for a Share Outstanding throughout the period presented: | | | | | | |
Net asset value, beginning of period | | | | $ | 24.85 | |
Investment operations: | | | | | | |
Net investment income(2) | | | | | 0.65 | |
Net realized and unrealized gain | | | | | 0.62 | (3) |
Total from investment operations | | | | | 1.27 | |
Net Asset Value, End of period | | | | $ | 26.12 | |
Net Asset Value Total Return(4) | | | | | 5.14 | % |
Net assets, end of period (000’s omitted) | | | | $ | 176,338 | |
| | | | | | | |
RATIOS/SUPPLEMENTAL DATA: | | | | | | |
Ratios to Average Net Assets: | | | | | | |
Expenses | | | | | 0.75 | %(5) |
Net investment income | | | | | 11.46 | %(5) |
Portfolio turnover rate(6) | | | | | 7 | %(7) |
(1) | | Commencement of operations. |
(2) | | Based on average shares outstanding. |
(3) | | The per share amount of realized and unrealized gain (loss) on investments does not accord with the amounts reported in the Statements of Changes in Net Assets due to the timing of creation of Fund shares in relation to fluctuating market values. |
(4) | | Net Asset Value Total Return is calculated assuming an initial investment made at the net asset value on the first day of the period, reinvestment of dividends and distributions at net asset value during the period, and redemption at net asset value on the last day of the period. Total return calculated for a period of less than one year is not annualized. |
(6) | | Portfolio turnover excludes the value of portfolio securities received or delivered as a result of in-kind creations or redemptions of the Fund’s capital shares. |
The accompanying notes are an integral part of these financial statements.
51
Financial Highlights(continued)
| | | | Virtus Real
Asset
Income ETF
|
| | | | For the Period
February 7, 2019(1)
Through
April 30, 2019
|
Per Share Data for a Share Outstanding throughout the period presented: | | | | | | |
Net asset value, beginning of period | | | | $ | 24.79 | |
Investment operations: | | �� | | | | |
Net investment income(2) | | | | | 0.23 | |
Net realized and unrealized gain | | | | | 0.53 | (3) |
Total from investment operations | | | | | 0.76 | |
Net Asset Value, End of period | | | | $ | 25.55 | |
Net Asset Value Total Return(4) | | | | | 3.09 | % |
Net assets, end of period (000’s omitted) | | | | $ | 200,597 | |
| | | | | | | |
RATIOS/SUPPLEMENTAL DATA: | | | | | | |
Ratios to Average Net Assets: | | | | | | |
Expenses | | | | | 0.55 | %(5) |
Net investment income | | | | | 4.11 | %(5) |
Portfolio turnover rate(6) | | | | | 6 | %(7) |
(1) | | Commencement of operations. |
(2) | | Based on average shares outstanding. |
(3) | | The per share amount of realized and unrealized gain (loss) on investments does not accord with the amounts reported in the Statements of Changes in Net Assets due to the timing of creation of Fund shares in relation to fluctuating market values. |
(4) | | Net Asset Value Total Return is calculated assuming an initial investment made at the net asset value on the first day of the period, reinvestment of dividends and distributions at net asset value during the period, and redemption at net asset value on the last day of the period. Total return calculated for a period of less than one year is not annualized. |
(6) | | Portfolio turnover excludes the value of portfolio securities received or delivered as a result of in-kind creations or redemptions of the Fund’s capital shares. |
The accompanying notes are an integral part of these financial statements.
52
Financial Highlights(continued)
| | | | Virtus WMC Global Factor Opportunities ETF
|
| | | | For the
Six Months Ended
April 30, 2019
(unaudited)
| | For the
Year Ended
October 31, 2018
| | For the Period
October 10, 2017(1)
Through
October 31, 2017
|
Per Share Data for a Share Outstanding throughout each period presented: | | | | | | | | | | | | | | |
Net asset value, beginning of period | | | | $ | 24.97 | | | $ | 25.10 | | | $ | 25.00 | |
Investment operations: | | | | | | | | | | | | | | |
Net investment income(2) | | | | | 0.25 | | | | 0.50 | | | | 0.01 | |
Net realized and unrealized gain (loss) | | | | | 1.83 | | | | (0.53 | ) | | | 0.09 | |
Total from investment operations | | | | | 2.08 | | | | (0.03 | ) | | | 0.10 | |
| | | | | | | | | | | | | | | |
Less Distributions from: | | | | | | | | | | | | | | |
Net Investment income | | | | | (0.49 | ) | | | (0.10 | ) | | | — | |
Net realized gains | | | | | (0.54 | ) | | | — | | | | — | |
Total distributions | | | | | (1.03 | ) | | | (0.10 | ) | | | — | |
Net Asset Value, End of period | | | | $ | 26.02 | | | $ | 24.97 | | | $ | 25.10 | |
Net Asset Value Total Return(3) | | | | | 8.99 | % | | | (0.11 | )% | | | 0.38 | % |
Net assets, end of period (000’s omitted) | | | | $ | 5,204 | | | $ | 4,995 | | | $ | 5,019 | |
| | | | | | | | | | | | | | | |
RATIOS/SUPPLEMENTAL DATA: | | | | | | | | | | | | | | |
Ratios to Average Net Assets: | | | | | | | | | | | | | | |
Expenses | | | | | 0.49 | %(4) | | | 0.49 | %(5) | | | 0.49 | %(4) |
Net investment income | | | | | 2.04 | %(4) | | | 1.88 | % | | | 0.76 | %(4) |
Portfolio turnover rate(6) | | | | | 57 | %(7) | | | 80 | % | | | 23 | %(7) |
(1) | | Commencement of operations. |
(2) | | Based on average shares outstanding. |
(3) | | Net Asset Value Total Return is calculated assuming an initial investment made at the net asset value on the first day of the period, reinvestment of dividends and distributions at net asset value during the period, and redemption at net asset value on the last day of the period. Total return calculated for a period of less than one year is not annualized. |
(5) | | The ratios of expenses to average net assets includes tax expense fees of less than 0.01%. |
(6) | | Portfolio turnover excludes the value of portfolio securities received or delivered as a result of in-kind creations or redemptions of the Fund’s capital shares. |
The accompanying notes are an integral part of these financial statements.
53
Notes to Financial Statements
April 30, 2019 (unaudited)
The ETFis Series Trust I (the “Trust”) was organized as a Delaware statutory trust on September 20, 2012 and is registered with the U.S. Securities and Exchange Commission (the “SEC”) as an open-end management investment company under the Investment Company Act of 1940 (the “1940 Act”).
As of April 30, 2019, 11 funds of the Trust are offered for sale. The InfraCap REIT Preferred ETF, Virtus Glovista Emerging Markets ETF, Virtus InfraCap U.S. Preferred Stock ETF, Virtus LifeSci Biotech Clinical Trials ETF, Virtus LifeSci Biotech Products ETF, Virtus Newfleet Multi-Sector Bond ETF, Virtus Private Credit Strategy ETF, Virtus Real Asset Income ETF and Virtus WMC Global Factor Opportunities ETF, (each a “Fund” and collectively, the “Funds”) are reported in this semiannual report. The offering of shares of each Fund is registered under the Securities Act of 1933 (the “Securities Act”).
Funds
| | Commencement
of Operations
|
InfraCap REIT Preferred ETF | | February 7, 2017 |
Virtus Glovista Emerging Markets ETF | | November 7, 2017 |
Virtus InfraCap U.S. Preferred Stock ETF | | May 15, 2018 |
Virtus LifeSci Biotech Clinical Trials ETF | | December 16, 2014 |
Virtus LifeSci Biotech Products ETF | | December 16, 2014 |
Virtus Newfleet Multi-Sector Bond ETF | | August 10, 2015 |
Virtus Private Credit Strategy ETF | | February 7, 2019 |
Virtus Real Asset Income ETF | | February 7, 2019 |
Virtus WMC Global Factor Opportunities ETF | | October 10, 2017 |
InfraCap REIT Preferred ETF, Virtus Glovista Emerging Markets ETF, Virtus InfraCap U.S. Preferred Stock ETF, Virtus Private Credit Strategy ETF and Virtus Real Asset Income ETF are “non-diversified” Funds, as defined under the 1940 Act, as of the period ended April 30, 2019.
The Funds have the following investment objectives:
InfraCap REIT Preferred ETF seeks investment results that correspond, before fees and expenses, to the price and yield performance of the Indxx REIT Preferred Stock Index.
The Virtus Glovista Emerging Markets ETF seeks investment results that correspond, before fees and expenses, to the price and yield performance of the Solactive Most Favored Nations Emerging Market Index.
Virtus InfraCap U.S. Preferred Stock ETF seeks current income and, secondarily, capital appreciation.
The Virtus LifeSci Biotech Clinical Trials ETF and Virtus LifeSci Biotech Products ETF seek investment results that correspond, before fees and expenses, to the price and yield performance of the LifeSci Biotechnology Clinical Trials Index and LifeSci Biotechnology Products Index, respectively.
The Virtus Newfleet Multi-Sector Bond ETF seeks to provide a high level of current income and, secondarily, capital appreciation.
The Virtus Private Credit Strategy ETF seeks investment results that correspond, before fees and expenses, to the price and yield performance of the Indxx Private Credit Index.
Virtus Real Asset Income ETF seeks investment results that correspond, before fees and expenses, to the price and yield performance of the Indxx Real Asset Income Index.
The Virtus WMC Global Factor Opportunities ETF seeks capital appreciation.
There is no guarantee that a Fund will achieve its objective(s).
2. SIGNIFICANT ACCOUNTING POLICIES
Each Fund is an investment company and accordingly follows the investment company accounting and reporting guidance of the Financial Accounting Standards Board (FASB) Accounting Standard Codification Topic 946 Financial Services — Investment Companies. Each Fund prepares its financial statements in accordance with generally accepted accounting principles (“GAAP”) in the United States of America and follows the significant accounting policies described below.
54
Notes to Financial Statements(continued)
April 30, 2019 (unaudited)
(a) Use of Estimates
Management makes certain estimates and assumptions that affect the reported amounts of assets and liabilities and disclosure of contingent assets and liabilities at the date of the financial statements and reported amounts of increases and decreases in the net assets from operations during the reporting period. Actual results could differ from those estimates.
(b) Indemnification
In the normal course of business, the Funds may enter into contracts that contain a variety of representations which provide general indemnifications for certain liabilities. The Funds’ maximum exposure under these arrangements is unknown. However, the Funds have not had prior claims or losses pursuant to these contracts and expect the risk of loss to be remote.
(c) Security Valuation
A description of the valuation techniques applied to the Funds’ major categories of assets and liabilities measured at fair value on a recurring basis is as follows:
Equity securities and Exchange-Traded Funds are valued based on their last sale price. Price information on listed securities is taken from the exchange where the security is primarily traded. Securities regularly traded in an over the counter market are valued at the latest quoted sale price in such market or in the case of the New York Stock Exchange (“NYSE”), at the NYSE Official Closing Price. Such valuations are typically categorized as Level 1 in the fair value hierarchy. If market quotations are not readily available, or if it is determined that a quotation of a security does not represent fair value, then the security is valued at fair value as determined in good faith using procedures adopted by the Trust’s Board of Trustees (the “Board”). Such valuations are typically categorized as Level 2 or Level 3 in the fair value hierarchy.
Debt securities, including restricted securities, are valued based on evaluated quotations received from independent pricing services or from dealers who make markets in such securities. For most bond types, the pricing service utilizes matrix pricing that considers one or more of the following factors: yield or price of bonds of comparable quality, coupon, maturity, current cash flows, type, and current day trade information, as well as dealer-supplied prices. Such valuations are typically categorized as Level 2 in the fair value hierarchy. Debt securities that are not widely traded, are illiquid, or are internally fair valued using procedures adopted by the Board are generally categorized as Level 3 in the fair value hierarchy.
Purchased and written options contracts listed on exchanges are valued at their reported mean of bid and ask quotations; over-the-counter derivative contracts are fair valued using price evaluations provided by a pricing service approved by the Board.
Investments in other open-end investment companies are valued based on their net asset value each business day. Investments in closed-end funds are valued as of the close of regular trading on the NYSE each business day. Each is categorized as Level 1 in the fair value hierarchy.
(d) Fair Value Measurement
Accounting Standards Codification, Fair Value Measurements and Disclosures (“ASC 820”) defines fair value, establishes a framework for measuring fair value in accordance with GAAP, and requires disclosure about fair value measurements. It also provides guidance on determining when there has been a significant decrease in the volume and level of activity for an asset or liability, when a transaction is not orderly, and how that information must be incorporated into fair value measurement. Under ASC 820, various inputs are used in determining the value of the Funds’ investments. These inputs are summarized in the following hierarchy:
• | | Level 1 — Unadjusted quoted prices in active markets for identical assets or liabilities that the Funds have the ability to access. |
• | | Level 2 — Observable inputs other than quoted prices included in Level 1 that are observable for the asset or liability, either directly or indirectly. These inputs may include quoted prices for the identical instrument on an inactive market, prices for similar securities, interest rates, prepayment speeds, credit risk, yield curves, default rates and similar data. |
• | | Level 3 — Unobservable inputs for the asset or liability, to the extent relevant observable inputs are not available; representing the Funds’ own assumptions about the assumptions a market participant would use in valuing the asset or liability, and would be based on the best information available. |
The inputs or methodology used for valuing securities are not necessarily an indication of the risk associated with investing in those securities. The hierarchy classification of inputs used to value each Fund’s investments at April 30, 2019, is disclosed at the end of each Fund’s Schedule of Investments.
55
Notes to Financial Statements(continued)
April 30, 2019 (unaudited)
(e) Security Transactions and Investment Income
Security transactions are accounted for on the trade date. Realized gains and losses on sales of investment securities are calculated using specific identification. Dividend income is recognized on the ex-dividend date. Expenses and interest income are recognized on the accrual basis. Amortization of premium and accretion of discount on debt securities are included in interest income. Each Fund amortizes premiums and accretes discounts using the effective interest method.
Dividend income from REIT investments is recorded using management’s estimate of the income included in distributions received from the REIT investments. Distributions received in excess of this estimated amount are recorded as a reduction of the cost of investments or reclassified to capital gains. The actual amounts of income, return of capital, and capital gains are only determined by each domestic REIT after its fiscal year-end, and may differ from the estimated amounts.
(f) Foreign Taxes
Certain Funds may be subject to foreign taxes on income, gains on investments or currency repatriation, a portion of which may be recoverable. Each Fund will accrue such taxes and recoveries as applicable based upon current interpretations of the tax rules and regulations that exist in the markets in which it invests.
(g) Expenses
Each Fund pays all of its expenses not assumed by its Sub-Adviser, if any, as defined in Note 3, or the Adviser. General Trust expenses that are allocated among and charged to the assets of the Funds and other series of the Trust are done so on a basis that the Board deems fair and equitable, which may be on a basis of relative net assets of each Fund and other series of the Trust or the nature of the services performed and relative applicability to each Fund and other series of the Trust.
(h) Short Sales
The Virtus InfraCap U.S. Preferred Stock ETF Fund may sell securities short. A short sale is a transaction in which the Fund sells a security it does not own in anticipation of a decline in market price. To sell a security short, the Fund must borrow the security. The Fund’s obligation to replace the security borrowed and sold short will be fully collateralized at all times by the proceeds from the short sale retained by the broker and by cash and securities deposited in a segregated account with the Fund’s custodian. If the price of the security sold short increases between the time of the short sale and the time the Fund replaces the borrowed security, the Fund will realize a loss, and if the price declines during the period, the Fund will realize a gain. Any realized gain will be decreased, and any realized loss increased, by the amount of transaction costs. On the ex-dividend date, dividends on short sales are recorded as an expense to the Fund.
In accordance with the terms of its prime brokerage agreement, the Fund may receive rebate income or be charged a fee on borrowed securities which is reported as “Interest Expense” on the Statement of Operations. Such income or fee is calculated on a daily basis based upon the market value of each borrowed security and a variable rate that is dependent upon the availability of such security.
(i) Distributions to Shareholders
Distributions are recorded by the Funds on the ex-dividend date. Income and capital gain distributions are determined in accordance with income tax regulations that may differ from GAAP in the United States of America.
(j) Foreign Currency Translation
Non-U.S. investment securities and other assets and liabilities denominated in foreign currencies are translated into U.S. dollar amounts at the foreign currency exchange rate effective at the end of the reporting period. Cost of investments is translated at the currency exchange rate effective at the trade date. The gain or loss resulting from a change in currency exchange rates between the trade and settlement date of a portfolio transaction is treated as a gain or loss on foreign currency. Likewise, the gain or loss resulting from a change in currency exchange rates between the date the income is accrued and the date it is paid is treated as a gain or loss on foreign currency. The Funds do not isolate that portion of the results of operations arising from changes in foreign exchange rates on investments from the fluctuations arising from changes in the market prices of securities held. Such fluctuations are included with the net realized and unrealized gain or loss on investments.
(k) Loan Agreements
The Virtus Newfleet Multi-Sector Bond ETF may invest in direct debt instruments which are interests in amounts owed by a corporate, governmental, or other borrower to lenders or lending syndicates. Loan agreements are generally non-investment grade and often involve borrowers that are highly leveraged. The Fund may invest in obligations of borrowers who are in bankruptcy proceedings. Loan
56
Notes to Financial Statements(continued)
April 30, 2019 (unaudited)
agreements are typically senior in the corporate capital structure of the borrower. A loan is often administered by a bank or other financial institution (the “lender”) that acts as agent for all holders. The lender administers the terms of the loan, as specified in the loan agreement. The Fund’s investments in loans may be in the form of participations in loans or assignments of all or a portion of loans from third parties. When investing in loan participations, the Fund has the right to receive payments of principal, interest and any fees to which it is entitled only from the lender selling the loan participation and only upon receipt by the lender of payments from the borrower. The Fund generally has no right to enforce compliance with the terms of the loan agreement with the borrower. As a result, the Fund may be subject to the credit risk of both the borrower and the lender that is selling the loan agreement. When the Fund purchases assignments from lenders, it acquires direct rights against the borrower on the loan.
The Fund may invest in multiple series or tranches of a loan, which may have varying terms and carry different associated risks. Loan agreements may involve foreign borrowers, and investments may be denominated in foreign currencies. Direct indebtedness of emerging countries involves a risk that the government entities responsible for the repayment of the debt may be unable, or unwilling, to pay the principal and interest when due.
The loan agreements have floating rate loan interests which generally pay interest at rates that are periodically determined by reference to a base lending rate plus a premium. The base lending rates are generally LIBOR (London Interbank Offered Rate), the prime rate offered by one or more U.S. banks or the certificate of deposit rate. When a loan agreement is purchased, the Fund may pay an assignment fee. On an ongoing basis, the Fund may receive a commitment fee based on the undrawn portion of the underlying line of credit portion of a loan agreement. Prepayment penalty fees are received upon the prepayment of a loan agreement by a borrower. Prepayment penalty, facility, commitment, consent and amendment fees are recorded to income as earned or paid.
(l) Securities Lending
Certain Funds may loan securities to qualified brokers through an agreement with The Bank of New York Mellon (“BNY Mellon”), as a third party lending agent. Under the terms of the agreement, a Fund doing so is required to maintain collateral with a market value not less than 102% of the market value of loaned securities. Collateral is adjusted daily in connection with changes in the market value of securities on loan. Collateral may consist of cash and securities issued by the U.S. Government or its agencies. Cash collateral is invested in a short-term money market fund. Dividends earned on the collateral and premiums paid by the broker are recorded as income by a Fund net of fees and rebates charged by BNY Mellon for its services as securities lending agent and in connection with this securities lending program. Lending portfolio securities involves a risk of delay in the recovery of the loaned securities or in the declining value of the collateral.
At April 30, 2019, the following Funds had securities on loan:
Funds
| | | | Market
Value
| | Cash
Collateral
| | Non Cash
Collateral(a)
|
Virtus LifeSci Biotech Clinical Trials ETF | | | | $ | 8,133,811 | | | $ | 2,448,388 | | | $ | 6,062,282 | |
Virtus LifeSci Biotech Products ETF | | | | | 10,393,167 | | | | 2,527,736 | | | | 8,325,786 | |
(a) | | Collateral received in excess of the market value of securities on loan is not presented in this table. The total cash collateral received by each Fund is disclosed in the Fund’s statement of assets and liabilities. |
Funds not listed in table above did not have any securities on loan at April 30, 2019.
The following table presents the contract value of securities lending transactions and the type of collateral provided to counterparties.
Remaining Contractual Maturity of the Agreements, as of April 30, 2019
| | | | Overnight and | | | Between
| | |
| | | | Continuous
| | | <30 Days
| | | 30 & 90 Days
| | | >90 Days
| | Total
|
Virtus LifeSci Biotech Clinical Trials ETF | | | | | | | | | | | | | | | | | | | | |
Securities Lending Transactions | | | | | | | | | | | | | | | | | | | | |
Common Stocks | | | | $ | 8,510,669 | | | $ | — | | | $ | — | | | $ | — | | $ | 8,510,669 |
Gross amount of recognized liabilities for securities lending transactions: | | | | | | | | | | | | | | | | | | | $ | 8,510,669 |
Virtus LifeSci Biotech Products ETF | | | | | | | | | | | | | | | | | | | | |
Securities Lending Transactions | | | | | | | | | | | | | | | | | | | | |
Common Stocks | | | | $ | 10,853,522 | | | $ | — | | | $ | — | | | $ | — | | $ | 10,853,522 |
Gross amount of recognized liabilities for securities lending transactions: | | | | | | | | | | | | | | | | | | | $ | 10,853,522 |
57
Notes to Financial Statements(continued)
April 30, 2019 (unaudited)
3. INVESTMENT MANAGEMENT RELATED PARTIES AND OTHER AGREEMENTS
Investment Advisory Agreements
The Trust has entered into Investment Advisory Agreements (collectively, “Advisory Agreement”) with the Adviser, a wholly owned subsidiary of ETFis Holdings LLC, on behalf of each Fund. ETFis Holdings LLC is majority-owned by Virtus Investment Partners, Inc. (Ticker: VRTS) (together with its affiliates, “Virtus”). Pursuant to the Advisory Agreement, the Adviser has overall supervisory responsibility for the general management and investment of the Funds’ securities portfolios. The Adviser pays all of the ordinary operating expenses of the Virtus Glovista Emerging Markets ETF, Virtus LifeSci Biotech Clinical Trials ETF, Virtus LifeSci Biotech Products ETF, Virtus Private Credit Strategy ETF, Virtus Real Asset Income ETF, and Virtus WMC Global Factor Opportunities ETF, except for each Fund’s management fee; payments under any 12b-1 plan; taxes and other governmental fees; brokerage fees, commissions and other transaction expenses; interest and other costs of borrowing; litigation or arbitration expenses; acquired fund fees and expenses; and extraordinary or other non-routine expenses of the Funds. The Adviser is entitled to receive a fee from each Fund (unless otherwise noted below) based on each Fund’s average daily net assets, computed and accrued daily and payable monthly, at an annual rate as follows:
Funds
| | | | Rate
|
InfraCap REIT Preferred ETF | | | | 0.45%, subject to a minimum annual fee of $25,000 per year |
Virtus Glovista Emerging Markets ETF | | | | 0.68% |
Virtus InfraCap U.S. Preferred Stock ETF | | | | 0.80% |
Virtus LifeSci Biotech Products ETF | | | | 0.79% |
Virtus LifeSci Biotech Clinical Trials ETF | | | | 0.79% |
Virtus Newfleet Multi-Sector Bond ETF | | | | 0.70% |
Virtus Private Credit Strategy ETF | | | | 0.75% |
Virtus Real Asset Income ETF | | | | 0.55% |
Virtus WMC Global Factor Opportunities ETF | | | | 0.49% |
The Advisory Agreement may be terminated by the Trust on behalf of a Fund with the approval of a Fund’s Board or by a vote of the majority of a Fund’s shareholders. The Advisory Agreement may also be terminated by the Adviser by not more than 60 days’ nor less than 30 days’ written notice.
Fee Waiver Agreement
The Adviser has contractually agreed to waive a portion of the Virtus Glovista Emerging Markets ETF’s management fee equal to 0.03% of the Fund’s average daily net assets, which will have the effect of reducing acquired fund fees and expenses (the “Fee Waiver Agreement”). Unless the Adviser continues the Fee Waiver Agreement, it will terminate on February 28, 2020.
Expense Limitation Agreement
The Adviser has contractually agreed to reduce its fees and reimburse expenses in order to keep net expenses (excluding interest, taxes, brokerage fees and commissions, other expenditures that are capitalized in accordance with generally accepted accounting principles, acquired fund fees and expenses, other extraordinary expenses not incurred in the ordinary course of the Funds’ business, and amounts, if any, payable pursuant to a plan adopted in accordance with Rule 12b-1 under the 1940 Act) from exceeding a specified amount. The expense cap in effect for the Funds during the period ended April 30, 2019 are as follows:
Funds
| | | | | Expense
Limit
| | Expense Limit
Effective Through
|
Virtus Newfleet Multi-Sector Bond ETF | | | | | 0.80% | | February 28, 2020 |
Funds not listed in the table above do not have an expense limitation agreement.
The expense limitation agreement with respect to a Fund will be terminated upon termination of the Advisory Agreement between the Adviser and the Fund. In addition, while the Adviser or the Fund may discontinue the expense limitation agreement after the contractual period, it may only be terminated during its term with the approval of the Fund’s Board of Trustees.
58
Notes to Financial Statements(continued)
April 30, 2019 (unaudited)
Under certain conditions, the Adviser may recapture operating expenses reimbursed within three years after the date on which such waiver or reimbursement occurred. The Fund must pay its ordinary operating expenses before the Adviser is entitled to any reimbursement and must remain in compliance with any applicable expense limitation, or if none, the expense limitation in effect at the time of the waiver or reimbursement. All or a portion of the following Adviser reimbursed expenses may be recaptured during the fiscal years indicated:
Funds
| | | | 2019
| | 2020
| | 2021
|
Virtus Glovista Emerging Markets ETF | | | | $ | — | | | $ | — | | | $ | 5,983 | |
Virtus Newfleet Multi-Sector Bond ETF | | | | | 183,990 | | | | 83,625 | | | | 81,340 | |
Sub-Advisory Agreement
Each Sub-Adviser provides investment advice and management services to its respective Fund. Pursuant to an investment sub-advisory agreement among the Trust, the Sub-Adviser and the Adviser, the sub-advisory fee is based on a Fund’s average daily net assets as specified below. The Adviser has delegated to the InfraCap U.S. Preferred Stock ETF and InfraCap REIT Preferred ETF’s sub-adviser the obligation to pay all of the ordinary operating expenses of each of those Funds, except for the management fee paid to the Adviser; payments under any 12b-1 plan adopted by the Fund; taxes and other governmental fees; brokerage fees, commissions and other transaction expenses; interest and other costs of borrowing; litigation or arbitration expenses; acquired fund fees and expenses; and extraordinary or other non-routine expenses of the Fund. The Sub-Advisers and sub-advisory fees for each Fund are listed below.
Funds
| | | | Sub-Advisers
| | Sub-Advisory Fees
|
InfraCap REIT Preferred ETF | | | | Infrastructure Capital Advisors, LLC | | 0.375%* |
Virtus Glovista Emerging Markets ETF | | | | Glovista Investments LLC | | 60% of the Net Advisory Fee*+ |
Virtus InfraCap U.S. Preferred Stock ETF | | | | Infrastructure Capital Advisors, LLC | | 0.66%* |
Virtus Newfleet Multi-Sector Bond ETF | | | | Newfleet Asset Management, LLC(1) | | 50% of the Net Advisory Fee*++ |
Virtus WMC Global Factor Opportunities ETF | | | | Wellington Management Company LLP | | 0.21%* |
(1) | | An indirect wholly owned subsidiary of Virtus. |
* | | InfraCap REIT Preferred ETF, Virtus Glovista Emerging Markets ETF, Virtus InfraCap U.S. Preferred Stock ETF, Virtus Newfleet Multi-Sector Bond ETF and Virtus WMC Global Factor Opportunities ETF’s sub-advisory fees are paid for by the Adviser, not the Funds. |
+ | | Net advisory fee: The advisory fee paid by the Fund to the Adviser for investment advisory services under the Adviser’s investment advisory agreement with the Fund, after deducting the payment of all of the ordinary operating expenses of the Fund under the Adviser’s unified fee arrangement. In the event that the Adviser waives all or a portion of its fee pursuant to an applicable waiver agreement, then the Sub-Adviser will waive its fee in the same proportion as the Adviser. |
++ | | Net Advisory Fee: In the event the Adviser waives its entire fee and also assumes expenses of the Trust pursuant to an applicable expense limitation agreement, the Sub-Adviser will similarly waive its entire fee and will share in the expense assumption by promptly paying to the Adviser (or its designee) 50% of the assumed amount. If during the term of the Sub-Advisory Agreement the Adviser later recaptures some or all of fees waived or expenses reimbursed by the Adviser and the Sub-Adviser together, then the Adviser will pay to the Sub-Adviser 50% of the amount recaptured. |
Principal Underwriter
Pursuant to the terms of a Distribution Agreement with the Trust, ETF Distributors LLC (the “Distributor”) serves as the Funds’ principal underwriter. The Distributor receives compensation from the Adviser for the statutory underwriting services it provides to the Funds. The Distributor will not distribute shares in less than Creation Units (as hereinafter defined), and does not maintain a secondary market in shares. The shares are traded in the secondary market. The Distributor is a wholly-owned subsidiary of Virtus.
Distribution and Service (12b-1 Plan)
The Board of Trustees has adopted a distribution and service plan, under which InfraCap REIT Preferred ETF, Virtus Glovista Emerging Markets ETF, Virtus InfraCap U.S. Preferred Stock ETF, Virtus LifeSci Biotech Clinical Trials ETF, Virtus LifeSci Biotech Products ETF, Virtus Private Credit Strategy ETF, Virtus Real Asset Income ETF, and Virtus WMC Global Factor Opportunities ETF (collectively, the “12b-1 Funds”) are authorized to pay an amount up to 0.25% of their average daily net assets each year to finance activities primarily intended to result in the sale of Creation Units of the 12b-1 Funds or the provision of investor services. No 12b-1 fees are currently paid by the 12b-1 Funds and there are no current plans to impose these fees.
Operational Administrator
Virtus ETF Solutions LLC (the “Administrator”) serves as the Funds’ operational administrator. The Administrator supervises the overall administration of the Trust and the Funds including, among other responsibilities, the coordination and day-to-day oversight of the Funds’ operations, the service providers’ communications with the Funds and each other and assistance with Trust, Board and contractual matters related to the Funds and other series of the Trust. The Administrator also provides persons satisfactory to the Board to serve as officers of the Trust. The Administrator is a wholly-owned subsidiary of Virtus.
59
Notes to Financial Statements(continued)
April 30, 2019 (unaudited)
Accounting Services Administrator, Custodian and Transfer Agent
The Bank of New York Mellon (“BNY Mellon”) provides administrative, accounting, tax and financial reporting for the maintenance and operations of the Trust as the Funds’ accounting services administrator. BNY Mellon also serves as the custodian for the Funds’ assets, and serves as transfer agent and dividend paying agent for the Funds.
Affiliated Shareholders
At April 30, 2019, Virtus Partners, Inc. held shares of Virtus WMC Global Factor Opportunities ETF which may be redeemed at any time that aggregated to the following:
| | | | Shares
| | % of shares
outstanding
|
Virtus WMC Global Factor Opportunities ETF | | | | | 184,503 | | | | 92.3 | % |
At April 30, 2019, the Sub-Adviser held shares of certain Funds which may be redeemed at any time that aggregated to the following:
| | | | Shares
| | % of shares
outstanding
|
InfraCap REIT Preferred ETF | | | | | 161,557 | | | | 17.0 | % |
Virtus InfraCap U.S. Preferred Stock ETF | | | | | 139,832 | | | | 14.0 | % |
4. CREATION AND REDEMPTION TRANSACTIONS
The Funds issue and redeem shares on a continuous basis at Net Asset Value (“NAV”) in groups of 50,000 shares called “Creation Units.” The Funds’ Creation Units may be issued and redeemed generally for cash or an in-kind deposit of securities held by the Funds. In each instance of cash creations or redemptions, the Trust may impose transaction fees based on transaction expenses related to the particular exchange that will be higher than the transaction fees associated with in-kind purchases or redemptions. Only “Authorized Participants” who have entered into contractual arrangements with the Distributor may purchase or redeem shares directly from the Funds. An Authorized Participant is either (i) a broker-dealer or other participant in the clearing process through the Continuous Net Settlement System of the National Securities Clearing Corporation or (ii) a DTC participant and, in each case, must have executed a Participant Agreement with the Distributor. Most retail investors will not qualify as Authorized Participants or have the resources to buy and sell whole Creation Units. Therefore, they will be unable to purchase or redeem the shares directly from the Funds. Rather, most retail investors will purchase shares in the secondary market with the assistance of a broker and will be subject to customary brokerage commissions or fees.
5. FEDERAL INCOME TAX
Each Fund intends to qualify as a “regulated investment company” under Sub-chapter M of the Internal Revenue Code of 1986 (the “Code”), as amended. Each Fund intends to distribute substantially all of its net investment income and net capital gains to shareholders. Therefore, no federal income or excise tax provision is required.Accounting for Uncertainty in Income Taxes as issued by the Financial Accounting Standards Board provides guidance for how uncertain tax positions should be recognized, measured, presented and disclosed in the financial statements, and requires the evaluation of tax positions taken or expected to be taken in the course of preparing a Fund’s tax returns to determine whether the tax positions are “more-likely-than-not” of being sustained by the applicable tax authority. Tax positions not deemed to meet the more-likely-than-not threshold would be recorded as a tax benefit or expense in the current year. Interest and penalties related to income taxes would be recorded as income tax expense. Management of the Funds is required to analyze all open tax years (2016, 2017 and 2018), as defined by IRS statute of limitations, for all major jurisdictions, including federal tax authorities and certain state tax authorities. As of April 30, 2019, the Funds did not have a liability for any unrecognized tax benefits. The Funds have no examination in progress and are not aware of any tax positions for which it is reasonably possible that the amounts of unrecognized tax benefits will significantly change in the next twelve months.
The Funds recognize interest accrued related to unrecognized tax benefits and penalties as income tax expense. For the period ended April 30, 2019, the Funds had no accrued penalties or interest.
60
Notes to Financial Statements(continued)
April 30, 2019 (unaudited)
As at October 31, 2018, the adjusted cost basis of investments and gross unrealized appreciation and depreciation of investments for federal income tax purposes were as follows:
| Funds | | Federal Tax Cost
Of Investments | | Gross
Unrealized
Appreciation | | Gross
Unrealized
Depreciation | | Net Unrealized
Appreciation
(Depreciation) |
| InfraCap REIT Preferred ETF | | $ | 23,251,928 | | | $ | 60,259 | | | $ | (1,225,866 | ) | | $ | (1,165,607 | ) |
| Virtus Glovista Emerging Markets ETF | | | 14,450,215 | | | | 367,524 | | | | (2,362,880 | ) | | | (1,995,356 | ) |
| Virtus InfraCap U.S. Preferred Stock ETF | | | 7,872,539 | | | | 27,009 | | | | (244,564 | ) | | | (217,555 | ) |
| Virtus LifeSci Biotech Clinical Trials ETF | | | 54,055,249 | | | | 1,979,488 | | | | (17,053,831 | ) | | | (15,074,343 | ) |
| Virtus LifeSci Biotech Products ETF | | | 36,404,662 | | | | 2,616,305 | | | | (9,154,125 | ) | | | (6,537,820 | ) |
| Virtus Newfleet Multi-Sector Bond ETF | | | 98,798,857 | | | | 601,337 | | | | (3,659,964 | ) | | | (3,058,627 | ) |
| Virtus WMC Global Factor Opportunities ETF | | | 5,164,844 | | | | 231,235 | | | | (425,750 | ) | | | (194,515 | ) |
Ordinary losses incurred after December 31 (“LateYear Ordinary Losses”) within the taxable year are deemed to arise on the first business day of the Fund’s next taxable year. During the fiscal year ended October 31, 2018, the following Funds incurred and elected to defer Late Year Ordinary Losses as follows:
Virtus LifeSci Biotech Clinical Trials ETF | | | | $ | 213,799 | |
Virtus LifeSci Biotech Products ETF | | | | | 146,172 | |
At October 31, 2018, for Federal income tax purposes, the following Funds have capital loss carryforwards available to offset future capital gains for an unlimited period. To the extent that these loss carryforwards are utilized, capital gains so offset will not be distributed to shareholders:
| | | | Short-Term
No Expiration
| | Long-Term
No Expiration
| | Total
|
InfraCap REIT Preferred ETF | | | | $ | 507,902 | | | $ | — | | | $ | 507,902 | |
Virtus Glovista Emerging Markets ETF | | | | | 2,256,112 | | | | 9,733 | | | | 2,265,845 | |
Virtus LifeSci Biotech Clinical Trials ETF | | | | | 9,151,704 | | | | 7,652,802 | | | | 16,804,506 | |
Virtus LifeSci Biotech Products ETF | | | | | 2,964,974 | | | | 1,014,762 | | | | 3,979,736 | |
Virtus Newfleet Multi-Sector Bond ETF | | | | | 1,170,437 | | | | 814,430 | | | | 1,984,867 | |
6. INVESTMENT TRANSACTIONS
Purchases and sales of investments (excluding short-term investments), subscription in-kind and redemption in-kind for the period ended April 30, 2019 were as follows:
Funds
| | | | Purchases
| | Sales
| | Subscriptions
In-Kind
| | Redemptions
In-Kind
|
InfraCap REIT Preferred ETF | | | | $ | 5,208,878 | | | $ | 5,195,576 | | | $ | — | | | $ | — | |
Virtus Glovista Emerging Markets ETF | | | | | 6,545,020 | | | | 7,895,213 | | | | — | | | | 2,438,276 | |
Virtus InfraCap U.S. Preferred Stock ETF | | | | | 12,765,092 | | | | 12,992,861 | | | | 22,853,584 | | | | — | |
Virtus LifeSci Biotech Clinical Trials ETF | | | | | 10,530,479 | | | | 9,484,281 | | | | 6,328,725 | | | | 15,396,276 | |
Virtus LifeSci Biotech Products ETF | | | | | 7,062,963 | | | | 6,698,733 | | | | 16,436,639 | | | | 11,801,469 | |
Virtus Newfleet Multi-Sector Bond ETF | | | | | 33,032,668 | | | | 101,995,957 | | | | | | | | | |
Virtus Private Credit Strategy ETF | | | | | 8,623,096 | | | | 8,462,481 | | | | 176,209,129 | | | | 2,552,241 | |
Virtus Real Asset Income ETF | | | | | 9,191,973 | | | | 9,151,859 | | | | 203,453,805 | | | | 2,531,151 | |
Virtus WMC Global Factor Opportunities ETF | | | | | 2,805,515 | | | | 2,997,080 | | | | — | | | | — | |
7. DERIVATIVE FINANCIAL INSTRUMENTS
Options
The Virtus InfraCap U.S. Preferred Stock ETF may write covered call and put options on portfolio securities and other financial instruments. Premiums received are recorded as liabilities. The liabilities are subsequently adjusted to reflect the current value of the options written. Premiums received from writing options that expire are treated as realized gains. Premiums received from writing options that are exercised or are closed are added to or offset against the proceeds or amount paid on the transactions to determine the net realized gain or loss. By writing a covered call option, the Fund, in exchange for the premium, foregoes the opportunity for capital appreciation above the exercise price should the market price of the underlying security increase. By writing a put option, the Fund, in exchange
61
Notes to Financial Statements(continued)
April 30, 2019 (unaudited)
for the premium, accepts the risk of having to purchase a security at an exercise price that is above the current price. Changes in value of written options are reported as change in unrealized gain (loss) on written options in the Statement of Operations. When the written option expires, is terminated or is sold, the Fund will record a gain or loss, which is reported as realized gain (loss) on written options in the Statement of Operations. Written covered call options limit the upside potential of a security above the strike price. Written put options subject the Fund to risk of loss if the value of the security declines below the exercise price minus the put premium.
The Virtus InfraCap U.S. Preferred Stock may purchase call and put options on the portfolio securities or other financial instruments. The Fund may purchase call options to protect against an increase in the price of the security or financial instrument it anticipates purchasing. The Fund may purchase put options on securities which it holds or other financial instruments to protect against a decline in the value of the security or financial instrument or to close out covered written positions. Changes in value of purchased options are reported as part of change in unrealized gain (loss) on investments in the Statement of Operations. When the purchased option expires, is terminated or is sold, the Fund will record a gain or loss, which is reported as part of realized gain (loss) on investments in the Statement of Operations. Risks may arise from an imperfect correlation between the change in market value of the securities held by the Fund and the prices of options relating to the securities purchased or sold by the Fund and from the possible lack of liquid secondary market for an option. The maximum exposure to loss for any purchased option is limited to the premium initially paid for the option.
Transactions in derivative instruments reflected on the Statement of Assets and Liabilities at April 30, 2019, are:
Liabilities
| | | | Equity Risk
|
Written options, at value | | | | $52,283 |
Transactions in derivative instruments reflected on the Statement of Operations during the period were as follows:
Net Realized Gain (Loss) on:
| | | | Equity Risk
|
Investments* | | | | $ (2,504) |
Written options | | | | 97,367 |
| * | | Purchased option contracts are included in Net Realized Gain (Loss) on Investments on the Statement of Operations. |
Change in Net Unrealized Appreciation (Depreciation) on:
| | | | Equity Risk
|
Investments** | | | | $ 989 |
Written options | | | | 12,291 |
** | | Purchased option contracts are included in Change in Net Unrealized Appreciation (Depreciation) on Investments in the Statement of Operations. |
For the period ended April 30, 2019, the monthly average market value of the purchased options and written options contracts held by the Fund were $5,210 and $(37,929), respectively.
8. BORROWINGS
The Virtus InfraCap U.S. Preferred Stock ETF entered into a Lending Agreement (the “Agreement”) with a commercial bank (the “Bank”) that allows the Fund to borrow cash from the Bank. Borrowings under the Agreement are collateralized by investments of the Fund. If the Fund defaults with respect to any of its obligations under the Agreement, the Bank may foreclose on assets of the Fund and/or the Fund may be required to repay immediately, in part or in full, the loan balance outstanding under the Agreement, necessitating the sale of securities at potentially inopportune times. Interest is charged at the 3 Month LIBOR (London Interbank Offered Rate) plus an additional percentage rate on the amount borrowed. The Agreement has an on-demand commitment term. For the period ended April 30, 2019, the average daily borrowings under the Agreement and the daily average interest rate were $2,932,960 and 3.88%, respectively.
At April 30, 2019, the amount of such outstanding borrowings was as follows:
Outstanding Borrowings
| | Interest Rate
|
$5,373,023 | | 3.78% |
9. INVESTMENT RISKS
As with any investment, an investment in the Funds could result in a loss or the performance of the Funds could be inferior to that of other investments. An investor should consider each Fund’s investment objectives, risks, and charges and expenses carefully before investing. Each Fund’s prospectus and statement of additional information contain this and other important information.
62
Notes to Financial Statements(continued)
April 30, 2019 (unaudited)
10. CREDIT RISK
Junk Bonds or High Yield Securities: High yield securities are generally subject to greater levels of credit quality risk than investment grade securities. The retail secondary market for these “junk bonds” may be less liquid than that of higher-rated fixed income securities, and adverse conditions could make it difficult at times to sell these securities or could result in lower prices than higher-rated fixed income securities. These risks can reduce the value of the Fund’s shares and the income it earns.
11. CASH CONCENTRATION RISK
At various times, the Funds may have cash and cash collateral balances that exceed federally insured limits.
12. 10% SHAREHOLDERS
As of April 30, 2019, certain Funds had individual shareholder account(s) and/or omnibus shareholder account(s) (comprised of a group of individual shareholders), which individually amounted to more than 10% of the total shares outstanding of each such Fund as detailed below:
Funds
| | | | % of Shares
Outstanding
| | Number of
Accounts
|
InfraCap REIT Preferred ETF | | | | | 58 | % | | | 3 | |
Virtus Glovista Emerging Markets ETF | | | | | 79 | % | | | 4 | |
Virtus InfraCap U.S. Preferred Stock ETF | | | | | 68 | % | | | 3 | |
Virtus LifeSci Biotech Clinical Trials ETF | | | | | 62 | % | | | 4 | |
Virtus LifeSci Biotech Products ETF | | | | | 71 | % | | | 5 | |
Virtus Newfleet Multi-Sector Bond ETF | | | | | 72 | % | | | 1 | |
Virtus Private Credit Strategy ETF | | | | | 100 | % | | | 1 | |
Virtus Real Asset Income ETF | | | | | 100 | % | | | 1 | |
Virtus WMC Global Factor Opportunities ETF | | | | | 92 | % | | | 1 | * |
* | | Shareholder account is affiliated. |
13. RECENT ACCOUNTING PRONOUNCEMENT
On November 17, 2016, the FASB issued ASU 2016-18, Statement of Cash Flows (Topic 230): Restricted Cash. This update intends to reduce diversity in the presentation of restricted cash and restricted cash equivalents in the statement. Any restricted cash and restricted cash equivalents will be included as components of cash and cash equivalents as presented on the statement of cash flows. For the Trust, the effective date of this update is for periods beginning after December 15, 2017. The ASU has been adopted for the current reporting period. The adoption had no significant impact to the Statements of Cash Flows.
14. SUBSEQUENT EVENTS
The Funds are required to recognize in the financial statements the effects of all subsequent events that provide additional evidence about conditions that existed as of the date of the Statements of Assets and Liabilities. For non-recognized subsequent events that must be disclosed to keep the financial statements from being misleading, the Funds are required to disclose the nature of the event as well as an estimate of its financial effect, or a statement that such an estimate cannot be made. Management has evaluated subsequent events through the issuance of these financial statements and has determined that there are no material events that would require disclosure.
63
Schedule of Investments — InfraCap MLP ETF
April 30, 2019 (Unaudited)
Security Description
| | | | Shares
| | Value
|
Common Stocks — 125.4%(1) | | | | | | | | | | |
| | | | | | | | | | | |
Energy — 125.4% | | | | | | | | | | |
Andeavor Logistics LP | | | | | 706,966 | | | $ | 23,704,570 | |
Antero Midstream Corp.(2) | | | | | 84,189 | | | | 1,027,948 | |
BP Midstream Partners LP | | | | | 1,492,823 | | | | 21,586,221 | |
Buckeye Partners LP | | | | | 12,917 | | | | 432,203 | |
Cheniere Energy Partners LP | | | | | 273,157 | | | | 11,969,740 | |
Crestwood Equity Partners LP(2) | | | | | 4,849 | | | | 177,910 | |
DCP Midstream LP(2) | | | | | 294,520 | | | | 9,159,572 | |
Enable Midstream Partners LP | | | | | 100,514 | | | | 1,399,155 | |
Energy Transfer LP(2) | | | | | 4,645,128 | | | | 70,234,335 | |
EnLink Midstream LLC(2) | | | | | 2,452,336 | | | | 28,667,808 | |
Enterprise Products Partners LP(2) | | | | | 1,316,523 | | | | 37,692,053 | |
EQM Midstream Partners LP(2) | | | | | 399,861 | | | | 18,393,606 | |
Genesis Energy LP(2) | | | | | 270,965 | | | | 6,010,004 | |
Holly Energy Partners LP | | | | | 12,878 | | | | 350,153 | |
Kinder Morgan, Inc.(2) | | | | | 256,428 | | | | 5,095,224 | |
Magellan Midstream Partners LP(2) | | | | | 392,805 | | | | 24,357,838 | |
Marathon Petroleum Corp.(2) | | | | | 747,837 | | | | 45,520,838 | |
MPLX LP(2) | | | | | 1,859,984 | | | | 60,003,084 | |
NGL Energy Partners LP | | | | | 965,963 | | | | 13,774,632 | |
Noble Midstream Partners LP(2) | | | | | 640,552 | | | | 22,054,205 | |
NuStar Energy LP | | | | | 414,629 | | | | 11,273,763 | |
ONEOK, Inc.(2) | | | | | 67,104 | | | | 4,558,375 | |
Phillips 66(2) | | | | | 409,548 | | | | 38,608,090 | |
Phillips 66 Partners LP(2) | | | | | 650,330 | | | | 32,210,845 | |
Plains All American Pipeline LP(2) | | | | | 2,390,353 | | | | 55,336,672 | |
Shell Midstream Partners LP(2) | | | | | 111,236 | | | | 2,236,956 | |
Tallgrass Energy LP | | | | | 236,192 | | | | 5,701,675 | |
Targa Resources Corp. | | | | | 101,560 | | | | 4,077,634 | |
TC PipeLines LP | | | | | 53,943 | | | | 1,925,765 | |
Western Midstream Partners LP(2) | | | | | 1,227,788 | | | | 38,773,545 | |
Williams Cos., Inc. (The)(2) | | | | | 357,659 | | | | 10,132,479 | |
Total Common Stocks | | | | | | | | | | |
(Cost $639,154,353) | | | | | | | | | 606,446,898 | |
| | | | Notional
Amount
| | Number of
contracts
| | |
Purchased Options — 0.0%(3) | | | | | | | | | | | | | | |
| | | | | | | | | | | | | | | |
Purchased Call Options | | | | | | | | | | | | | | |
Energy Transfer LP, | | | | | | | | | | | | | | |
Expires 05/17/19, | | | | | | | | | | | | | | |
Strike Price $17.50 | | | | | 82,100 | | | | 821 | | | | 0 | |
Enterprise Products Partners LP, | | | | | | | | | | | | | | |
Expires 05/17/19, | | | | | | | | | | | | | | |
Strike Price $30.00 | | | | | 200,000 | | | | 2,000 | | | | 10,000 | |
Enterprise Products Partners LP, | | | | | | | | | | | | | | |
Expires 06/21/19, | | | | | | | | | | | | | | |
Strike Price $32.00 | | | | | 200,000 | | | | 2,000 | | | | 8,000 | |
Enterprise Products Partners LP, | | | | | | | | | | | | | | |
Expires 06/21/19, | | | | | | | | | | | | | | |
Strike Price $33.00 | | | | | 400,000 | | | | 4,000 | | | | 20,000 | |
Marathon Petroleum Corp., | | | | | | | | | | | | | | |
Expires 05/17/19, | | | | | | | | | | | | | | |
Strike Price $67.50 | | | | | 14,000 | | | | 140 | | | | 4,900 | |
Marathon Petroleum Corp., | | | | | | | | | | | | | | |
Expires 05/17/19, | | | | | | | | | | | | | | |
Strike Price $80.00 | | | | | 252,900 | | | | 2,529 | | | | 7,587 | |
Security Description
| | | | Notional
Amount
| | Number of
contracts
| | Value
|
Purchased Options (continued) | | | | | | | | | | | | | | |
| | | | | | | | | | | | | | | |
Purchased Call Options (continued) | | | | | | | | | | | | | | |
MPLX LP, | | | | | | | | | | | | | | |
Expires 06/21/19, | | | | | | | | | | | | | | |
Strike Price $40.00 | | | | | 1,000 | | | | 10 | | | $ | 0 | |
Phillips 66, | | | | | | | | | | | | | | |
Expires 05/17/19, | | | | | | | | | | | | | | |
Strike Price $110.00 | | | | | 53,000 | | | | 530 | | | | 0 | |
Plains All American Pipeline LP, | | | | | | | | | | | | | | |
Expires 05/17/19, | | | | | | | | | | | | | | |
Strike Price $30.00 | | | | | 1,154,000 | | | | 11,540 | | | | 1 | |
Plains All American Pipeline LP, | | | | | | | | | | | | | | |
Expires 05/17/19, | | | | | | | | | | | | | | |
Strike Price $31.00 | | | | | 21,000 | | | | 210 | | | | 0 | |
TOTAL PURCHASED OPTIONS | | | | | | | | | | | | | | |
(Cost $200,131) | | | | | | | | | | | | | 50,488 | |
TOTAL INVESTMENTS — 125.4% | | | | | | | | | | | | | | |
(Cost $639,354,484) | | | | | | | | | | | | | 606,497,386 | |
Liabilities in Excess of Other
Assets — (25.4)% | | | | | | | | | | | | | (122,671,472 | ) |
Net Assets — 100.0% | | | | | | | | | | | | $ | 483,825,914 | |
| | | | | | | | | | | | | | | |
Written Options — (0.4)% | | | | | | | | | | | | | | |
| | | | | | | | | | | | | | | |
Written Call Options | | | | | | | | | | | | | | |
Antero Midstream Corp., | | | | | | | | | | | | | | |
Expires 06/21/19, | | | | | | | | | | | | | | |
Strike Price $30.00 | | | | | (1,000 | ) | | | (10 | ) | | | (90 | ) |
Crestwood Equity Partners LP, | | | | | | | | | | | | | | |
Expires 06/21/19, | | | | | | | | | | | | | | |
Strike Price $40.00 | | | | | (122,000 | ) | | | (1,220 | ) | | | (21,350 | ) |
DCP Midstream LP, | | | | | | | | | | | | | | |
Expires 05/17/19, | | | | | | | | | | | | | | |
Strike Price $35.00 | | | | | (60,000 | ) | | | (600 | ) | | | (1,200 | ) |
DCP Midstream LP, | | | | | | | | | | | | | | |
Expires 07/19/19, | | | | | | | | | | | | | | |
Strike Price $35.00 | | | | | (122,000 | ) | | | (1,220 | ) | | | (24,400 | ) |
Energy Transfer LP, | | | | | | | | | | | | | | |
Expires 05/03/19, | | | | | | | | | | | | | | |
Strike Price $16.00 | | | | | (1,000 | ) | | | (10 | ) | | | 0 | |
Energy Transfer LP, | | | | | | | | | | | | | | |
Expires 05/17/19, | | | | | | | | | | | | | | |
Strike Price $15.50 | | | | | (81,000 | ) | | | (810 | ) | | | (10,530 | ) |
Energy Transfer LP, | | | | | | | | | | | | | | |
Expires 05/17/19, | | | | | | | | | | | | | | |
Strike Price $16.00 | | | | | (107,200 | ) | | | (1,072 | ) | | | (5,360 | ) |
Energy Transfer LP, | | | | | | | | | | | | | | |
Expires 05/24/19, | | | | | | | | | | | | | | |
Strike Price $15.50 | | | | | (50,000 | ) | | | (500 | ) | | | (7,500 | ) |
Energy Transfer LP, | | | | | | | | | | | | | | |
Expires 05/24/19, | | | | | | | | | | | | | | |
Strike Price $16.00 | | | | | (2,000 | ) | | | (20 | ) | | | (140 | ) |
EnLink Midstream LLC, | | | | | | | | | | | | | | |
Expires 05/17/19, | | | | | | | | | | | | | | |
Strike Price $12.50 | | | | | (272,000 | ) | | | (2,720 | ) | | | (16,320 | ) |
EnLink Midstream LLC, | | | | | | | | | | | | | | |
Expires 06/21/19, | | | | | | | | | | | | | | |
Strike Price $12.50 | | | | | (293,000 | ) | | | (2,930 | ) | | | (58,600 | ) |
The accompanying notes are an integral part of these financial statements.
64
Schedule of Investments — InfraCap MLP ETF(continued)
April 30, 2019 (Unaudited)
Security Description
| | | | Notional
Amount
| | Number of
contracts
| | Value
|
Written Options (continued) | | | | | | | | | | | | | | |
| | | | | | | | | | | | | | | |
Written Calls Option (continued) | | | | | | | | | | | | | | |
EnLink Midstream LLC, | | | | | | | | | | | | | | |
Expires 09/20/19, | | | | | | | | | | | | | | |
Strike Price $12.50 | | | | | (264,900 | ) | | | (2,649 | ) | | $ | (105,960 | ) |
Enterprise Products Partners LP, | | | | | | | | | | | | | | |
Expires 05/03/19, | | | | | | | | | | | | | | |
Strike Price $30.00 | | | | | (2,000 | ) | | | (20 | ) | | | (20 | ) |
Enterprise Products Partners LP, | | | | | | | | | | | | | | |
Expires 05/10/19, | | | | | | | | | | | | | | |
Strike Price $29.00 | | | | | (20,000 | ) | | | (200 | ) | | | (4,000 | ) |
Enterprise Products Partners LP, | | | | | | | | | | | | | | |
Expires 05/10/19, | | | | | | | | | | | | | | |
Strike Price $30.00 | | | | | (1,000 | ) | | | (10 | ) | | | (50 | ) |
Enterprise Products Partners LP, | | | | | | | | | | | | | | |
Expires 05/24/19, | | | | | | | | | | | | | | |
Strike Price $29.00 | | | | | (200,000 | ) | | | (2,000 | ) | | | (60,000 | ) |
Enterprise Products Partners LP, | | | | | | | | | | | | | | |
Expires 06/07/19, | | | | | | | | | | | | | | |
Strike Price $30.00 | | | | | (11,000 | ) | | | (110 | ) | | | (1,375 | ) |
Enterprise Products Partners LP, | | | | | | | | | | | | | | |
Expires 06/21/19, | | | | | | | | | | | | | | |
Strike Price $29.00 | | | | | (10,000 | ) | | | (100 | ) | | | (5,500 | ) |
Enterprise Products Partners LP, | | | | | | | | | | | | | | |
Expires 06/21/19, | | | | | | | | | | | | | | |
Strike Price $30.00 | | | | | (280,000 | ) | | | (2,800 | ) | | | (56,000 | ) |
EQM Midstream Partners LP, | | | | | | | | | | | | | | |
Expires 07/19/19, | | | | | | | | | | | | | | |
Strike Price $45.00 | | | | | (1,000 | ) | | | (10 | ) | | | (1,950 | ) |
Genesis Energy LP, | | | | | | | | | | | | | | |
Expires 06/21/19, | | | | | | | | | | | | | | |
Strike Price $22.50 | | | | | (30,000 | ) | | | (300 | ) | | | (22,500 | ) |
Genesis Energy LP, | | | | | | | | | | | | | | |
Expires 06/21/19, | | | | | | | | | | | | | | |
Strike Price $25.00 | | | | | (2,000 | ) | | | (20 | ) | | | (200 | ) |
Kinder Morgan, Inc., | | | | | | | | | | | | | | |
Expires 05/24/19, | | | | | | | | | | | | | | |
Strike Price $20.50 | | | | | (151,000 | ) | | | (1,510 | ) | | | (27,180 | ) |
Magellan Midstream Partners LP, | | | | | | | | | | | | | | |
Expires 05/17/19, | | | | | | | | | | | | | | |
Strike Price $62.50 | | | | | (12,000 | ) | | | (120 | ) | | | (4,800 | ) |
Magellan Midstream Partners LP, | | | | | | | | | | | | | | |
Expires 05/17/19, | | | | | | | | | | | | | | |
Strike Price $65.00 | | | | | (1,000 | ) | | | (10 | ) | | | (30 | ) |
Magellan Midstream Partners LP, | | | | | | | | | | | | | | |
Expires 07/19/19, | | | | | | | | | | | | | | |
Strike Price $65.00 | | | | | (213,000 | ) | | | (2,130 | ) | | | (85,200 | ) |
Magellan Midstream Partners LP, | | | | | | | | | | | | | | |
Expires 07/19/19, | | | | | | | | | | | | | | |
Strike Price $67.50 | | | | | (32,000 | ) | | | (320 | ) | | | (3,200 | ) |
Marathon Petroleum Corp., | | | | | | | | | | | | | | |
Expires 05/03/19, | | | | | | | | | | | | | | |
Strike Price $62.50 | | | | | (80,000 | ) | | | (800 | ) | | | (28,000 | ) |
Marathon Petroleum Corp., | | | | | | | | | | | | | | |
Expires 05/03/19, | | | | | | | | | | | | | | |
Strike Price $63.50 | | | | | (84,000 | ) | | | (840 | ) | | | (6,720 | ) |
Marathon Petroleum Corp., | | | | | | | | | | | | | | |
Expires 05/03/19, | | | | | | | | | | | | | | |
Strike Price $65.00 | | | | | (101,000 | ) | | | (1,010 | ) | | | (3,030 | ) |
| | | | | | | | | | | | | | | |
Security Description
| | | | Notional
Amount
| | Number of
contracts
| | Value
|
Written Options (continued) | | | | | | | | | | | | | | |
| | | | | | | | | | | | | | | |
Written Calls Option (continued) | | | | | | | | | | | | | | |
Marathon Petroleum Corp., | | | | | | | | | | | | | | |
Expires 05/03/19, | | | | | | | | | | | | | | |
Strike Price $67.50 | | | | | (71,000 | ) | | | (710 | ) | | $ | (710 | ) |
Marathon Petroleum Corp., | | | | | | | | | | | | | | |
Expires 05/10/19, | | | | | | | | | | | | | | |
Strike Price $63.50 | | | | | (66,000 | ) | | | (660 | ) | | | (56,100 | ) |
Marathon Petroleum Corp., | | | | | | | | | | | | | | |
Expires 05/10/19, | | | | | | | | | | | | | | |
Strike Price $67.50 | | | | | (56,600 | ) | | | (566 | ) | | | (14,716 | ) |
Marathon Petroleum Corp., | | | | | | | | | | | | | | |
Expires 05/24/19, | | | | | | | | | | | | | | |
Strike Price $66.50 | | | | | (123,000 | ) | | | (1,230 | ) | | | (71,340 | ) |
MPLX LP, | | | | | | | | | | | | | | |
Expires 05/17/19, | | | | | | | | | | | | | | |
Strike Price $33.00 | | | | | (101,000 | ) | | | (1,010 | ) | | | (30,300 | ) |
MPLX LP, | | | | | | | | | | | | | | |
Expires 06/21/19, | | | | | | | | | | | | | | |
Strike Price $34.00 | | | | | (51,000 | ) | | | (510 | ) | | | (15,300 | ) |
MPLX LP, | | | | | | | | | | | | | | |
Expires 06/21/19, | | | | | | | | | | | | | | |
Strike Price $36.00 | | | | | (10,000 | ) | | | (100 | ) | | | (750 | ) |
MPLX LP, | | | | | | | | | | | | | | |
Expires 06/21/19, | | | | | | | | | | | | | | |
Strike Price $37.00 | | | | | (50,000 | ) | | | (500 | ) | | | (2,500 | ) |
Noble Midstream Partners LP, | | | | | | | | | | | | | | |
Expires 05/17/19, | | | | | | | | | | | | | | |
Strike Price $40.00 | | | | | (110,300 | ) | | | (1,103 | ) | | | (7,721 | ) |
ONEOK, Inc., | | | | | | | | | | | | | | |
Expires 05/03/19, | | | | | | | | | | | | | | |
Strike Price $69.50 | | | | | (62,000 | ) | | | (620 | ) | | | (17,360 | ) |
Phillips 66, | | | | | | | | | | | | | | |
Expires 05/03/19, | | | | | | | | | | | | | | |
Strike Price $99.00 | | | | | (60,000 | ) | | | (600 | ) | | | (3,600 | ) |
Phillips 66, | | | | | | | | | | | | | | |
Expires 05/03/19, | | | | | | | | | | | | | | |
Strike Price $102.00 | | | | | (55,000 | ) | | | (550 | ) | | | 0 | |
Phillips 66, | | | | | | | | | | | | | | |
Expires 05/10/19, | | | | | | | | | | | | | | |
Strike Price $102.00 | | | | | (41,000 | ) | | | (410 | ) | | | (1,640 | ) |
Phillips 66, | | | | | | | | | | | | | | |
Expires 05/10/19, | | | | | | | | | | | | | | |
Strike Price $103.00 | | | | | (31,000 | ) | | | (310 | ) | | | (620 | ) |
Phillips 66, | | | | | | | | | | | | | | |
Expires 05/24/19, | | | | | | | | | | | | | | |
Strike Price $100.00 | | | | | (84,000 | ) | | | (840 | ) | | | (33,600 | ) |
Phillips 66 Partners LP, | | | | | | | | | | | | | | |
Expires 05/17/19, | | | | | | | | | | | | | | |
Strike Price $55.00 | | | | | (1,000 | ) | | | (10 | ) | | | 0 | |
Phillips 66 Partners LP, | | | | | | | | | | | | | | |
Expires 06/21/19, | | | | | | | | | | | | | | |
Strike Price $55.00 | | | | | (306,800 | ) | | | (3,068 | ) | | | (46,020 | ) |
Plains All American Pipeline LP, | | | | | | | | | | | | | | |
Expires 05/03/19, | | | | | | | | | | | | | | |
Strike Price $25.50 | | | | | (101,000 | ) | | | (1,010 | ) | | | 0 | |
Plains All American Pipeline LP, | | | | | | | | | | | | | | |
Expires 05/10/19, | | | | | | | | | | | | | | |
Strike Price $25.00 | | | | | (200,000 | ) | | | (2,000 | ) | | | (12,000 | ) |
The accompanying notes are an integral part of these financial statements.
65
Schedule of Investments — InfraCap MLP ETF(continued)
April 30, 2019 (Unaudited)
Security Description
| | | | Notional
Amount
| | Number of
contracts
| | Value
|
Written Options (continued) | | | | | | | | | | | | | | |
| | | | | | | | | | | | | | | |
Written Calls Option (continued) | | | | | | | | | | | | | | |
Plains All American Pipeline LP, | | | | | | | | | | | | | | |
Expires 05/10/19, | | | | | | | | | | | | | | |
Strike Price $25.50 | | | | | (30,000 | ) | | | (300 | ) | | $ | (600 | ) |
Plains All American Pipeline LP, | | | | | | | | | | | | | | |
Expires 05/17/19, | | | | | | | | | | | | | | |
Strike Price $24.50 | | | | | (300,000 | ) | | | (3,000 | ) | | | (45,000 | ) |
Plains All American Pipeline LP, | | | | | | | | | | | | | | |
Expires 05/17/19, | | | | | | | | | | | | | | |
Strike Price $25.00 | | | | | (222,000 | ) | | | (2,220 | ) | | | (22,200 | ) |
Plains All American Pipeline LP, | | | | | | | | | | | | | | |
Expires 05/24/19, | | | | | | | | | | | | | | |
Strike Price $24.50 | | | | | (111,000 | ) | | | (1,110 | ) | | | (27,750 | ) |
Shell Midstream Partners LP, | | | | | | | | | | | | | | |
Expires 07/19/19, | | | | | | | | | | | | | | |
Strike Price $20.00 | | | | | (101,000 | ) | | | (1,010 | ) | | | (85,850 | ) |
Western Gas Partners LP, | | | | | | | | | | | | | | |
Expires 05/17/19, | | | | | | | | | | | | | | |
Strike Price $55.00 | | | | | (20,000 | ) | | | (200 | ) | | | 0 | |
Western Midstream Partners LP, | | | | | | | | | | | | | | |
Expires 05/17/19, | | | | | | | | | | | | | | |
Strike Price $35.00 | | | | | (51,000 | ) | | | (510 | ) | | | (510 | ) |
Western Midstream Partners LP, | | | | | | | | | | | | | | |
Expires 05/17/19, | | | | | | | | | | | | | | |
Strike Price $36.00 | | | | | (53,000 | ) | | | (530 | ) | | | 0 | |
Western Midstream Partners LP, | | | | | | | | | | | | | | |
Expires 05/17/19, | | | | | | | | | | | | | | |
Strike Price $50.00 | | | | | (30,000 | ) | | | (300 | ) | | | (8,700 | ) |
Williams Cos., Inc. (The), | | | | | | | | | | | | | | |
Expires 05/03/19, | | | | | | | | | | | | | | |
Strike Price $29.50 | | | | | (95,200 | ) | | | (952 | ) | | | (7,616 | ) |
Williams Cos., Inc. (The), | | | | | | | | | | | | | | |
Expires 05/10/19, | | | | | | | | | | | | | | |
Strike Price $29.50 | | | | | (2,000 | ) | | | (20 | ) | | | (160 | ) |
| | | | | | | | | | | | | | | |
Security Description
| | | | Notional
Amount
| | Number of
contracts
| | Value
|
Written Options (continued) | | | | | | | | | | | | | | |
| | | | | | | | | | | | | | | |
Written Put Options | | | | | | | | | | | | | | |
Crestwood Equity Partners LP, | | | | | | | | | | | | | | |
Expires 05/17/19, | | | | | | | | | | | | | | |
Strike Price $35.00 | | | | | (81,000 | ) | | | (810 | ) | | $ | (30,375 | ) |
Enterprise Products Partners LP, | | | | | | | | | | | | | | |
Expires 05/03/19, | | | | | | | | | | | | | | |
Strike Price $29.00 | | | | | (470,000 | ) | | | (4,700 | ) | | | (164,500 | ) |
EQM Midstream Partners LP, | | | | | | | | | | | | | | |
Expires 05/17/19, | | | | | | | | | | | | | | |
Strike Price $45.00 | | | | | (192,000 | ) | | | (1,920 | ) | | | (192,000 | ) |
Genesis Energy LP, | | | | | | | | | | | | | | |
Expires 05/17/19, | | | | | | | | | | | | | | |
Strike Price $22.50 | | | | | (102,000 | ) | | | (1,020 | ) | | | (71,400 | ) |
Magellan Midstream Partners LP, | | | | | | | | | | | | | | |
Expires 05/17/19, | | | | | | | | | | | | | | |
Strike Price $60.00 | | | | | (232,000 | ) | | | (2,320 | ) | | | (116,000 | ) |
MPLX LP, | | | | | | | | | | | | | | |
Expires 05/17/19, | | | | | | | | | | | | | | |
Strike Price $32.00 | | | | | (21,000 | ) | | | (210 | ) | | | (16,800 | ) |
ONEOK, Inc., | | | | | | | | | | | | | | |
Expires 05/03/19, | | | | | | | | | | | | | | |
Strike Price $69.00 | | | | | (113,000 | ) | | | (1,130 | ) | | | (183,625 | ) |
Phillips 66 Partners LP, | | | | | | | | | | | | | | |
Expires 05/17/19, | | | | | | | | | | | | | | |
Strike Price $50.00 | | | | | (71,000 | ) | | | (710 | ) | | | (92,300 | ) |
Williams Cos., Inc. (The), | | | | | | | | | | | | | | |
Expires 05/03/19, | | | | | | | | | | | | | | |
Strike Price $28.50 | | | | | (141,000 | ) | | | (1,410 | ) | | | (88,830 | ) |
| | | |
TOTAL WRITTEN OPTIONS — (0.4)% | | |
(Premiums Received $2,555,418) | | | | | | | | | | | | $ | (2,029,698 | ) |
Abbreviations:
LP — Limited Partnership
| (1) | | Substantially all the securities, or a portion thereof, have been pledged as collateral for line of credit borrowings, short sales and open written option contracts. The aggregate market value of the collateral at April 30, 2019 was $458,900,527. |
| (2) | | Subject to written call options. |
| (3) | | Amount rounds to less than 0.05%. |
The following table summarizes valuation of the Fund’s investments under the fair value hierarchy levels as of April 30, 2019 (See Note 2 in the Notes to Financial Statements):
| | | | Level 1
| | Level 2
| | Level 3
| | Total
|
Asset Valuation Inputs | | | | | | | | | | | | | | | | | | |
Common Stocks | | | | $ | 606,446,898 | | | $ | — | | | $ | — | | | $ | 606,446,898 | |
Purchased Options | | | | | 50,487 | | | | 1 | | | $ | — | | | | 50,488 | |
Total | | | | $ | 606,497,385 | | | $ | 1 | | | $ | — | | | $ | 606,497,386 | |
Liability Valuation Inputs | | | | | | | | | | | | | | | | | | |
Written Options | | | | $ | 1,997,211 | | | $ | 32,487 | | | $ | — | | | $ | 2,029,698 | |
Total | | | | $ | 1,997,211 | | | $ | 32,487 | | | $ | — | | | $ | 2,029,698 | |
The accompanying notes are an integral part of these financial statements.
66
Statement of Assets and Liabilities
April 30, 2019 (Unaudited)
| | | | InfraCap MLP
ETF
|
Assets: | | | | | | |
Investments, at cost | | | | $ | 639,354,484 | |
Investments, at value | | | | | 606,497,386 | |
Cash | | | | | 1,696,911 | |
Due from brokers | | | | | 1,342,728 | |
Receivables: | | | | | | |
Investment securities sold | | | | | 5,661,626 | |
Capital shares sold | | | | | 1,734,138 | |
Dividends and interest | | | | | 1,468,167 | |
Tax reclaim | | | | | 9,516 | |
Prepaid taxes | | | | | 8,048,938 | |
Total Assets | | | | | 626,459,410 | |
| | | | | | | |
Liabilities: | | | | | | |
Borrowings | | | | | 136,960,963 | |
Payables: | | | | | | |
Investment securities purchased | | | | | 3,265,943 | |
Sub-advisory fees | | | | | 376,892 | |
Written options, at value(a) | | | | | 2,029,698 | |
Total Liabilities | | | | | 142,633,496 | |
Net Assets | | | | $ | 483,825,914 | |
| | | | | | | |
Net Assets Consist of: | | | | | | |
Paid-in capital | | | | $ | 591,951,086 | |
Total distributable earnings (accumulated deficit), net of income taxes | | | | | (108,125,172 | ) |
Net Assets | | | | $ | 483,825,914 | |
Shares outstanding (unlimited number of shares of beneficial interest authorized, no par value) | | | | | 83,700,004 | |
Net asset value per share | | | | $ | 5.78 | |
(a) Premiums received from written options | | | | $ | 2,555,418 | |
The accompanying notes are an integral part of these financial statements.
67
Statement of Operations
For the Period Ended April 30, 2019 (unaudited)
| | | | InfraCap MLP
ETF
|
Investment Income: | | | | | | |
Distributions from master limited partnerships | | | | $ | 21,519,047 | |
Dividend income | | | | | 3,547,189 | |
Interest income | | | | | 35,215 | |
Less: Return of capital distributions | | | | | (21,519,047 | ) |
Total Investment Income | | | | | 3,582,404 | |
| | | | | | | |
Expenses: | | | | | | |
Dividend and interest expenses | | | | | 3,877,005 | |
Sub-advisory fees | | | | | 2,239,268 | |
Total Expenses | | | | | 6,116,273 | |
Net Investment (Loss), Before Income Taxes | | | | | (2,533,869 | ) |
Income Tax Benefit (Expense) | | | | | (36,933 | ) |
Net Investment Income (Loss), Net of Income Taxes | | | | | (2,570,802 | ) |
Net Realized Gain (Loss) on: | | | | | | |
Investments | | | | | (70,027,851 | ) |
Written options | | | | | (3,096,951 | ) |
Securities sold short | | | | | (6,880,826 | ) |
Total Net Realized Loss | | | | | (80,005,628 | ) |
| | | | | | | |
Change in Net Unrealized Appreciation (Depreciation) on: | | | | | | |
Investments | | | | | 70,677,626 | |
Written options | | | | | (1,263,758 | ) |
Securities sold short | | | | | 4,161,902 | |
Total Change in Net Unrealized Appreciation | | | | | 73,575,770 | |
Net Realized and Change in Unrealized Loss | | | | | (6,429,858 | ) |
Net Decrease in Net Assets Resulting from Operations | | | | $ | (9,000,660 | ) |
The accompanying notes are an integral part of these financial statements.
68
Statement of Changes in Net Assets
| | | | InfraCap MLP ETF
| |
| | | | For the
Six Months Ended
April 30, 2019
(unaudited)
| | For the
Year Ended
October 31, 2018
|
Increase (Decrease) in Net Assets Resulting from Operations: | | | | | | | | | | |
Net investment loss, net of income taxes | | | | $ | (2,570,802 | ) | | $ | (11,937,750 | ) |
Net realized gain (loss) on investments, written options and securities sold short, net of income taxes | | | | | (80,005,628 | ) | | | 16,217,798 | |
Net change in unrealized appreciation (depreciation) on investments, written options and
securities sold short, net of income taxes | | | | | 73,575,770 | | | | (42,308,052 | ) |
Net decrease in net assets resulting from operations | | | | | (9,000,660 | ) | | | (38,028,004 | ) |
Distributions to Shareholders from return of capital | | | | | (43,586,002 | ) | | | (119,404,506 | ) |
Total distributions | | | | | (43,586,002 | ) | | | (119,404,506 | ) |
| | | | | | | | | | | |
Shareholder Transactions: | | | | | | | | | | |
Proceeds from shares sold | | | | | 34,384,761 | | | | 250,592,039 | |
Cost of shares redeemed | | | | | (35,793,637 | ) | | | (60,217,441 | ) |
Net increase (decrease) in net assets resulting from shareholder transactions | | | | | (1,408,876 | ) | | | 190,374,598 | |
Increase (decrease) in net assets | | | | | (53,995,538 | ) | | | 32,942,088 | |
| | | | | | | | | | | |
Net Assets: | | | | | | | | | | |
Beginning of period/year | | | | | 537,821,452 | | | | 504,879,364 | |
End of period/year | | | | $ | 483,825,914 | | | $ | 537,821,452 | |
| | | | | | | | | | | |
Changes in Shares Outstanding: | | | | | | | | | | |
Shares outstanding, beginning of period/year | | | | | 84,200,004 | | | | 60,300,004 | |
Shares sold | | | | | 5,800,000 | | | | 31,550,000 | |
Shares redeemed | | | | | (6,300,000 | ) | | | (7,650,000 | ) |
Shares outstanding, end of period/year | | | | | 83,700,004 | | | | 84,200,004 | |
The accompanying notes are an integral part of these financial statements.
69
Statement of Cash Flows
For the Period Ended April 30, 2019
| | | | InfraCap MLP
ETF
|
Cash Flows From Operating Activities: | | | | | | |
Net decrease in net assets from operations | | | | $ | (9,000,660 | ) |
| | | | | | | |
Adjustments to reconcile net increase in net assets from operations to net cash provided by operating activities: | | | | | | |
Purchases of investment securities | | | | | (466,632,694 | ) |
Proceeds from sales of investment securities | | | | | 581,101,960 | |
Net proceeds from purchased and written options | | | | | 7,219,924 | |
Net proceeds from securities sold short | | | | | 46,320,480 | |
Payments made to cover securities sold short | | | | | (84,431,558 | ) |
Net realized loss on investments | | | | | 70,027,851 | |
Net realized loss on securities sold short | | | | | 6,880,826 | |
Net realized loss on written options | | | | | 3,096,951 | |
Net change in unrealized appreciation on investments | | | | | (70,677,626 | ) |
Net change in unrealized appreciation on securities sold short | | | | | (4,161,902 | ) |
Net change in unrealized depreciation on written options | | | | | 1,263,758 | |
Decrease in deferred tax asset, net of valuation allowance | | | | | 2,256,621 | |
Increase in capital shares receivable | | | | | (1,734,138 | ) |
Increase in dividends receivable | | | | | (1,328,397 | ) |
Increase in prepaid taxes | | | | | (2,481,681 | ) |
Decrease in cash collateral for securities sold short | | | | | 9,468,095 | |
Increase in sub-advisory fees payable | | | | | (109,102 | ) |
Increase in capital shares payable | | | | | (1,575,091 | ) |
Net cash provided by operating activities | | | | | 85,503,617 | |
| | | | | | | |
Cash Flows from Financing Activities: | | | | | | |
Proceeds from borrowings | | | | | (95,550,611 | ) |
Payments for fund shares sold in excess of in-kind creations | | | | | 42,605,884 | |
Distributions paid | | | | | (43,586,002 | ) |
Net cash used in financing activities | | | | | (96,530,729 | ) |
Net decrease in cash | | | | | (11,027,112 | ) |
Cash, beginning of year | | | | | 12,724,023 | |
Cash, end of period | | | | $ | 1,696,911 | |
| | | | | | | |
Supplementary information: | | | | | | |
Interest paid on borrowings | | | | | 3,356,130 | |
| | | | | | | |
Non-cash financing activities: | | | | | | |
In-kind creations—Issued | | | | | (44,014,761 | ) |
In-kind creations—Redeemed | | | | | — | |
The accompanying notes are an integral part of these financial statements.
70
| | | | InfraCap MLP ETF
|
| | | | For the
Six Months Ended
April 30, 2019
(unaudited)
| | For the
Year Ended
October 31, 2018
| | For the
Year Ended
October 31, 2017
| | For the
Year Ended
October 31, 2016
| | For the
Year Ended
October 31, 2015
| | For the Period
October 1, 2014(1)
Through
October 31, 2014
|
Per Share Data for a Share Outstanding throughout each period presented: | | | | | | | | | | | | | | | | | | | | | | | | | | |
| Net asset value, beginning of period | | | | $ | 6.39 | | | $ | 8.37 | | | $ | 10.63 | | | $ | 14.28 | | | $ | 24.21 | | | $ | 25.00 | |
| Investment operations: | | | | | | | | | | | | | | | | | | | | | | | | | | |
Net investment loss(2) | | | | | (0.03 | ) | | | (0.15 | ) | | | (0.17 | ) | | | (0.08 | ) | | | (0.06 | ) | | | (0.01 | ) |
Net realized and
unrealized loss | | | | | (0.04 | ) | | | (0.32 | ) | | | (0.01 | ) | | | (1.49 | )(3) | | | (7.84 | ) | | | (0.78 | )(3) |
| Total from investment operations | | | | | (0.07 | ) | | | (0.47 | ) | | | (0.18 | ) | | | (1.57 | ) | | | (7.90 | ) | | | (0.79 | ) |
Less Distributions from: | | | | | | | | | | | | | | | | | | | | | | | | | | |
| Net Investment income | | | | | (0.54 | ) | | | — | | | | (0.59 | ) | | | — | | | | (0.30 | ) | | | — | |
| Return of capital | | | | | — | | | | (1.51 | ) | | | (1.49 | ) | | | (2.08 | ) | | | (1.73 | ) | | | — | |
| Total distributions | | | | | (0.54 | ) | | | (1.51 | ) | | | (2.08 | ) | | | (2.08 | ) | | | (2.03 | ) | | | — | |
Net Asset Value, End of period | | | | $ | 5.78 | | | $ | 6.39 | | | $ | 8.37 | | | $ | 10.63 | | | $ | 14.28 | | | $ | 24.21 | |
Net Asset Value Total Return(4) | | | | | (0.68 | )% | | | (7.65 | )% | | | (3.44 | )% | | | (8.60 | )% | | | (34.34 | )% | | | (3.17 | )% |
Net assets, end of period
(000’s omitted) | | | | $ | 483,826 | | | $ | 537,821 | | | $ | 504,879 | | | $ | 119,606 | | | $ | 19,989 | | | $ | 6,052 | |
RATIOS/SUPPLEMENTAL DATA: | | | | | | �� | | | | | | | | | | | | | |
Ratios to Average Net Assets: | | | | | | | | | | | | | | | | | | | | | | | | | | |
| Expenses, including deferred income tax expense/benefit | | | | | 2.59 | %(5),(6) | | | 2.40 | %(7) | | | 1.93 | %(8) | | | 1.36 | %(9) | | | 1.11 | %(10) | | | 2.70 | %(5) |
| Expenses, excluding deferred income tax expense/benefit | | | | | 2.59 | %(5),(6) | | | 2.39 | %(7) | | | 1.89 | %(8) | | | 1.58 | %(9) | | | 1.16 | %(10) | | | 0.95 | %(5) |
| Net investment loss | | | | | (1.09 | )%(5) | | | (1.96 | )% | | | (1.73 | )% | | | (0.70 | )% | | | (0.36 | )% | | | (0.35 | )%(5) |
Portfolio turnover rate(11) | | | | | 69 | %(12) | | | 255 | % | | | 104 | % | | | 90 | % | | | 60 | % | | | 0 | %(12),(13) |
(1) | | Commencement of operations. |
(2) | | Based on average shares outstanding. |
(3) | | The per share amount of realized and unrealized gain (loss) on investments does not accord with the amounts reported in the Statements of Changes in Net Assets due to the timing of creation of Fund shares in relation to fluctuating market values. |
(4) | | Net Asset Value Total Return is calculated assuming an initial investment made at the net asset value on the first day of the period, reinvestment of dividends and distributions at net asset value during the period, and redemption at net asset value on the last day of the period. Total return calculated for a period of less than one year is not annualized. |
(6) | | The ratios of expenses to average net assets include interest expense of 1.43% and dividend expense on securities sold short fees of 0.21%. |
(7) | | The ratios of expenses to average net assets include interest expense of 1.32% and dividend expense on securities sold short fees of 0.13%. |
(8) | | The ratios of expenses to average net assets includes interest expense fees of 0.94%. |
(9) | | The ratios of expenses to average net assets includes interest expense fees of 0.63%. |
(10) | | The ratios of expenses to average net assets includes interest expense fees of 0.21%. |
(11) | | Portfolio turnover excludes the value of portfolio securities received or delivered as a result of in-kind creations or redemptions of the Fund’s capital shares. |
(13) | | Amount rounds to less than 1%. |
The accompanying notes are an integral part of these financial statements.
71
Notes to Financial Statements
April 30, 2019 (Unaudited)
1. ORGANIZATION
The ETFis Series Trust I (the “Trust”) was organized as a Delaware statutory trust on September 20, 2012 and is registered with the U.S. Securities and Exchange Commission (the “SEC”) as an open-end management investment company under the Investment Company Act of 1940 (the “1940 Act”).
As of April 30, 2019, 11 funds of the Trust are offered for sale, of which InfraCap MLP ETF (the “Fund”) is reported in this semiannual report. The shares of the InfraCap MLP ETF,are referred to herein as “Fund Shares” or “Shares”. The offering of Shares is registered under the Securities Act of 1933 (the “Securities Act”).
Fund
| | | | Commencement
of Operations |
InfraCap MLP ETF | | | | October 1, 2014 |
The Fund’s investment objective is to seek total return primarily through investments in equity securities of publicly traded master limited partnerships and limited liability companies taxed as partnerships (“MLPs”). There is no guarantee that the Fund will achieve its objective(s).
2. SIGNIFICANT ACCOUNTING POLICIES
The Fund is an investment company and accordingly follows the investment company accounting and reporting guidance of the Financial Accounting Standards Board (FASB) Accounting Standard Codification Topic 946 Financial Services — Investment Companies. The Fund prepares its financial statements in accordance with generally accepted accounting principles (“GAAP”) in the United States of America and follows the significant accounting policies described below.
(a) Use of Estimates
Management makes certain estimates and assumptions that affect the reported amounts of assets and liabilities and disclosure of contingent assets and liabilities at the date of the financial statements and reported amounts of increases and decreases in the net assets from operations during the reporting period. Actual results could differ from those estimates.
(b) Indemnification
In the normal course of business, the Fund may enter into contracts that contain a variety of representations which provide general indemnifications for certain liabilities. The Fund’s maximum exposure under these arrangements is unknown. However, the Fund has not had prior claims or losses pursuant to these contracts and expects the risk of loss to be remote.
(c) Security Valuation
A description of the valuation techniques applied to the Fund’s major categories of assets and liabilities measured at fair value on a recurring basis is as follows:
Equity securities and Exchange-Traded Funds are valued based on their last sale price. Price information on listed securities is taken from the exchange where the security is primarily traded. Securities regularly traded in an over the counter market are valued at the latest quoted sale price in such market or in the case of the New York Stock Exchange (“NYSE”), at the NYSE Official Closing Price. Such valuations are typically categorized as Level 1 in the fair value hierarchy. If market quotations are not readily available, or if it is determined that a quotation of a security does not represent fair value, then the security is valued at fair value as determined in good faith using procedures adopted by the Trust’s Board of Trustees (the “Board”). Such valuations are typically categorized as Level 2 or Level 3 in the fair value hierarchy.
Purchased and written options contracts listed on exchanges are valued at their reported mean of bid and ask quotations; over-the-counter derivative contracts are fair valued using price evaluations provided by a pricing service approved by the Board.
(d) Fair Value Measurement
Accounting Standards Codification, Fair Value Measurements and Disclosures (“ASC 820”) defines fair value, establishes a framework for measuring fair value in accordance with GAAP, and requires disclosure about fair value measurements. It also provides guidance on determining when there has been a significant decrease in the volume and level of activity for an asset or liability, when a transaction is not orderly, and how that information must be incorporated into fair value measurement. Under ASC 820, various inputs are used in determining the value of the Fund’s investments. These inputs are summarized in the following hierarchy:
• | | Level 1 — Unadjusted quoted prices in active markets for identical assets or liabilities that the Fund has the ability to access. |
72
Notes to Financial Statements(continued)
April 30, 2019 (Unaudited)
• | | Level 2 — Observable inputs other than quoted prices included in Level 1 that are observable for the asset or liability, either directly or indirectly. These inputs may include quoted prices for the identical instrument on an inactive market, prices for similar securities, interest rates, prepayment speeds, credit risk, yield curves, default rates and similar data. |
• | | Level 3 — Unobservable inputs for the asset or liability, to the extent relevant observable inputs are not available; representing the Fund’s own assumptions about the assumptions a market participant would use in valuing the asset or liability, and would be based on the best information available. |
The inputs or methodology used for valuing securities are not necessarily an indication of the risk associated with investing in those securities. The hierarchy classification of inputs used to value the Fund’s investments at April 30, 2019, is disclosed at the end of the Fund’s Schedule of Investments.
(e) Security Transactions, Investment Income and Return of Capital Estimates
Security transactions are accounted for on the trade date. Realized gains and losses on sales of investment securities are calculated using specific identification. Dividend income is recognized on the ex-dividend date. Expenses are recognized on the accrual basis. The Fund amortizes premiums and accretes discounts using the effective interest method
The Fund invests in master limited partnerships (“MLPs”) which make distributions that are primarily attributable to return of capital. The Fund records investment income and return of capital in the Statement of Operations using management’s estimate of the percentage of income included in the distributions received from each MLP based on historical information from the MLPs and other industry sources. These estimates may be adjusted based on information received from the MLPs after the tax and fiscal year ends.
The return of capital portion of the MLP distributions is a reduction to investment income and a reduction in the cost basis of each investment which increases net realized gain (loss) and net change in unrealized appreciation (depreciation). If the return of capital distributions exceed its cost basis, the distributions are treated as realized gains. The actual amounts of income and return of capital are only determined by each MLP after its fiscal year-end and may differ from the estimated amounts.
(f) Expenses
The Fund pays all of its expenses not assumed by Infrastructure Capital Advisors, LLC (the “Sub-Adviser”) or Virtus ETF Advisers LLC (the “Adviser”). General Trust expenses that are allocated among and charged to the assets of the Fund and other series of the Trust are done so on a basis that the Board deems fair and equitable, which may be on a basis of relative net assets of the Fund and other series of the Trust or the nature of the services performed and relative applicability to the Fund and other series of the Trust.
(g) Short Sales
The Fund may sell securities short. A short sale is a transaction in which the Fund sells a security it does not own in anticipation of a decline in market price. To sell a security short, the Fund must borrow the security. The Fund’s obligation to replace the security borrowed and sold short will be fully collateralized at all times by the proceeds from the short sale retained by the broker and by cash and securities deposited in a segregated account with the Fund’s custodian. If the price of the security sold short increases between the time of the short sale and the time the Fund replaces the borrowed security, the Fund will realize a loss, and if the price declines during the period, the Fund will realize a gain. Any realized gain will be decreased, and any realized loss increased, by the amount of transaction costs. On the ex-dividend date, dividends on short sales are recorded as an expense to the Fund.
In accordance with the terms of its prime brokerage agreement, the Fund may receive rebate income or be charged a fee on borrowed securities which is reported as “Interest Expense” on the Statement of Operations. Such income or fee is calculated on a daily basis based upon the market value of each borrowed security and a variable rate that is dependent upon the availability of such security.
(h) Distributions to Shareholders
Distributions to shareholders are declared and paid on a monthly basis and are recorded on the ex-dividend date. The Fund uses a cash flow-based distribution approach based on the Fund’s net cash flow received from portfolio investments.
The estimated character of the distributions paid will either be a dividend (ordinary income eligible to be treated as qualified dividend income) or a return of capital. Distributions made from current or accumulated earnings and profits of the Fund will be taxable to shareholders as dividend income. Distributions that are in an amount greater than the Fund’s current and accumulated earnings and profits will represent a return of capital to the extent of a shareholder’s basis in their common shares, and such distributions will correspondingly
73
Notes to Financial Statements(continued)
April 30, 2019 (Unaudited)
increase the realized gain upon the sale of their common shares. Additionally, distributions not paid from current or accumulated earnings and profits that exceed a shareholder’s tax basis in their common shares will generally be taxed as a capital gain. This estimate is based on the Fund’s operating results during the period.
3. INVESTMENT MANAGEMENT RELATED PARTIES AND OTHER AGREEMENTS
Investment Advisory Agreement
The Trust has entered into an Investment Advisory Agreement (the “Advisory Agreement”) with the Adviser, a wholly owned subsidiary of ETFis Holdings LLC, on behalf of the Fund. ETFis Holdings LLC is majority-owned by Virtus Investment Partners, Inc. (Ticker: VRTS) (together with its affiliates, “Virtus”). Pursuant to the Advisory Agreement, the Adviser has overall supervisory responsibility for the general management and investment of the Fund’s securities portfolio. For its services to the Fund, the Adviser is entitled to receive a fee, payable monthly, at an annual rate of 0.075% of the Fund’s average daily net assets, subject to a minimum annual fee of $25,000, paid by the Sub-Adviser as described below.
Sub-Advisory Agreement
The Sub-Adviser provides investment advice and management services to the Fund. Pursuant to an investment sub-advisory agreement among the Trust, the Sub-Adviser and the Adviser, the Sub-Adviser is entitled to receive a fee, payable monthly, at an annual rate of 0.95% of the Fund’s average daily net assets. The Sub-Adviser has agreed to pay all expenses of the Fund, except the Sub-Adviser’s fee, brokerage expenses, taxes, interest, litigation expenses, payments under any 12b-1 plan adopted by the Fund, and other non-routine or extraordinary expenses of the Fund.
Principal Underwriter
Pursuant to the terms of a Distribution Agreement with the Trust, ETF Distributors LLC (the “Distributor”) serves as the Fund’s principal underwriter. The Distributor receives compensation from the Adviser for the statutory underwriting services it provides to the Fund. The Distributor will not distribute shares in less than Creation Units (as hereinafter defined), and does not maintain a secondary market in shares. The shares are traded in the secondary market. The Distributor is a wholly owned subsidiary of Virtus.
Operational Administrator
Virtus ETF Solutions LLC (the “Administrator”) serves as the Fund’s operational administrator. The Administrator supervises the overall administration of the Trust and the Fund including, among other responsibilities, the coordination and day-to-day oversight of the Fund’s operations, the service providers’ communications with the Fund and each other and assistance with Trust, Board and contractual matters related to the Fund. The Administrator also provides persons satisfactory to the Board to serve as officers of the Trust. The Administrator is a wholly owned subsidiary of Virtus.
Accounting Services Administrator, Custodian and Transfer Agent
The Bank of New York Mellon (“BNY Mellon”) provides administrative, accounting, tax and financial reporting for the maintenance and operations of the Trust as the Fund’s accounting services administrator. BNY Mellon also serves as the custodian for the Fund’s assets, and serves as transfer agent and dividend paying agent for the Fund.
Affiliated Shareholders
At April 30, 2019, the Sub-Adviser held shares of the Fund which may be redeemed at any time that aggregated to the following:
Fund
| | Shares | | % of shares
outstanding |
InfraCap MLP ETF | | 519,636 | | 0.6% |
4. CREATION AND REDEMPTION TRANSACTIONS
The Fund issues and redeems shares on a continuous basis at Net Asset Value (“NAV”) in groups of 50,000 shares called “Creation Units.” The Fund’s Creation Units may be issued and redeemed generally for cash or an in-kind deposit of securities held by the Fund. In each instance of cash creations or redemptions, the Trust may impose transaction fees based on transaction expenses related to the particular exchange that will be higher than the transaction fees associated with in-kind purchases or redemptions.
Only “Authorized Participants” who have entered into contractual arrangements with the Distributor may purchase or redeem shares directly from the Fund. An Authorized Participant is either (i) a broker-dealer or other participant in the clearing process through the Continuous Net Settlement System of the National Securities Clearing Corporation or (ii) a DTC participant and, in each case, must
74
Notes to Financial Statements(continued)
April 30, 2019 (Unaudited)
have executed a Participant Agreement with the Distributor. Most retail investors will not qualify as Authorized Participants or have the resources to buy and sell whole Creation Units. Therefore, they will be unable to purchase or redeem the shares directly from the Fund. Rather, most retail investors will purchase shares in the secondary market with the assistance of a broker and will be subject to customary brokerage commissions or fees.
5. FEDERAL INCOME TAX
The Fund is taxed as a regular C-corporation for federal income tax purposes and as such is obligated to pay federal and applicable state and foreign corporate taxes on its taxable income. Currently, the federal income tax rate for a corporation is 21 percent. This treatment differs from most investment companies, which elect to be treated as “regulated investment companies” under the Code in order to avoid paying entity level income taxes. Under current law, the Fund is not eligible to elect treatment as a regulated investment company due to its investments primarily in MLPs invested in energy assets. The Fund expects that substantially all of the distributions it receives from MLPs may be treated as a tax- deferred return of capital, thus reducing the Fund’s current tax liability. However, the amount of taxes paid by the Fund will vary depending on the amount of income and gains derived from investments and/or sales of MLP interests and such taxes will reduce your return from an investment in the Fund.
Cash distributions from MLPs to the Fund that exceed the Fund’s allocable share of such MLP’s net taxable income are considered a tax deferred return of capital that will reduce the Fund’s adjusted tax basis in the equity securities of the MLP. These reductions in the Fund’s adjusted tax basis in the MLP equity securities will increase the amount of any taxable gain (or decrease the amount of any tax loss) recognized by the Fund on a subsequent sale of the securities. The Fund will accrue deferred income taxes for any future tax liability associated with (i) that portion of MLP distributions considered to be a tax-deferred return of capital as well as (ii) capital appreciation of its investments. Upon the sale of an MLP security, the Fund may be liable for previously deferred taxes. The Fund will rely to some extent on information provided by the MLPs, which is not necessarily timely, to estimate the deferred tax liability for purposes of financial statement reporting and determining the Fund’s NAV. From time to time, the Adviser will modify the estimates or assumptions related to the Fund’s deferred tax liability as new information becomes available. The Fund will generally compute deferred income taxes based on the federal income tax rate applicable to corporations and an assumed rate attributable to state taxes.
The Fund’s income tax expense/(benefit) consists of the following:
As of April 30, 2019
| | | | Current
| | Deferred
| | Total
|
Federal | | | | $ | (2,097,493 | ) | | $ | (756,701 | ) | | $ | (2,854,194 | ) |
State | | | | | (122,195 | ) | | | (85,926 | ) | | | (208,121 | ) |
Valuation Allowance | | | | | — | | | | 3,099,248 | | | | 3,099,248 | |
Total Tax Expense/(Benefit) | | | | $ | (2,219,688 | ) | | $ | 2,256,621 | | | $ | 36,933 | |
Components of the Fund’s deferred tax assets and liabilities are as follows:
| | | | As of
April 30, 2019
|
Deferred Tax Assets: | | | | | | |
Net Operating Loss Carryforward | | | | $ | 5,256,063 | |
Capital Loss Carryforward | | | | | 20,742,359 | |
Other | | | | | 165,136 | |
Total Deferred Tax Assets | | | | | 26,163,558 | |
Less Valuation Allowance | | | | | (20,772,136 | ) |
Net Deferred Tax Assets | | | | | 5,391,422 | |
Deferred Tax Liabilities: | | | | | | |
Net Unrealized Gain on Investments | | | | | (5,391,422 | ) |
Total Deferred Tax Liabilites | | | | | (5,391,422 | ) |
Net Deferred Tax Assets/(Liability) | | | | $ | — | |
75
Notes to Financial Statements(continued)
April 30, 2019 (Unaudited)
The Fund reviews the recoverability of its deferred tax assets based upon the weight of available evidence. When assessing the recoverability of its deferred tax assets, significant weight was given to the effects of potential future realized and unrealized gains on investments and the period over which these deferred tax assets can be realized. Currently, any capital losses that may be generated by the Fund in the future are eligible to be carried back up to three years and can be carried forward for five years to offset capital gains recognized by the Fund in those years. The Fund has a current capital loss carryforward of $88,700,935 of which $885,715 expires in 2021, $541,080 of which expires in 2023 and $87,274,140 expires in 2024. The Tax Cuts and Jobs Act (TCJA) eliminated the net operating loss carryback ability and replaced the 20 year carryforward period with an indefinite carryforward period for any net operating losses arising in tax years ending after December 31, 2017. Therefore, net operating losses that may be generated by the Fund this year and in the future are eligible to be carried forward indefinitely to offset income generated by the Fund in those years but are no longer eligible to be carried back. The TCJA also established a limitation for any net operating losses generated in tax years beginning after December 31, 2017 to the lesser of the aggregate of available net operating losses or 80% of taxable income before any net operating loss utilization. The Fund has a current net operating loss carryforward of $22,476,605 of which $987,995 can be carried back 2 years and carried forward until expiration in 2036. $8,822,758 of the net operating loss carryforward cannot be carried back and will be carried forward indefinitely until it is utilized. The remaining $12,665,852 of the net operating loss carryforward cannot be carried back, will be carried forward indefinitely and is subject to the aforementioned 80% limitation.
Based upon the Fund’s assessment, it has determined that it is “more-likely-than-not” that a portion of its deferred tax assets will not be realized through future taxable income of the appropriate character. Accordingly, a valuation allowance has been established for the Fund’s deferred tax assets. The Fund will continue to assess the need for a valuation allowance in the future. Significant changes in the fair value of its portfolio of investments may change the Fund’s assessment of the recoverability of these assets and may result in an adjustment of the valuation allowance against all or a portion of the Fund’s gross deferred tax assets.
Total income tax (benefit)/expense (current and deferred) differs from the amount computed by applying the federal statutory income tax rate of 21% to net investment and realized and unrealized gain/(losses) on investment before taxes as follows for the Fund:
| | | Amount | | Rate |
| Income Tax (Benefit) at Statutory Rate | | $ | (1,882,383 | ) | | | 21.00 | % |
| State Income Taxes (Net of Federal Benefit) | | | (213,749 | ) | | | 2.38 | |
| Permanent Differences, Net | | | (149,052 | ) | | | 1.66 | |
| Provision to Return Adjustment | | | (854,064 | ) | | | 9.53 | |
| Other | | | 36,933 | | | | (0.41 | ) |
| Valuation Allowance | | | 3,099,248 | | | | (34.58 | ) |
| Net Income Tax Expense/(Benefit) | | $ | 36,933 | | | | (0.42 | )% |
The Fund recognizes interest accrued related to unrecognized tax benefits and penalties as income tax expense. For the period from inception to April 30, 2019, the Fund has accrued penalties and interest of $36,933.
The Fund recognizes the tax benefits of uncertain tax positions only where the position is “more-likely-than-not” to be sustained assuming examination by tax authorities. Management has analyzed the Fund’s tax positions, and has concluded that no liability for unrecognized tax benefits should be recorded related to uncertain tax positions taken on U.S. tax returns and state tax returns filed since inception of the Fund. No U.S. federal or state income tax returns are currently under examination. The Fund’s tax years, October 31, 2015, October 31, 2016, October 31, 2017 and October 31, 2018, remain subject to examination by tax authorities in the United States. Due to the nature of the Fund’s investments, the Fund may be required to file income tax returns in several states. The Fund is not aware of any tax positions for which it is reasonably possible that the total amounts of unrecognized tax benefits will change materially in the next 12 months.
The adjusted cost basis of investments and gross unrealized appreciation and depreciation of investments excluding written options and securities sold short, for federal income tax purposes were as follows:
| Fund | | Federal Tax Cost
Of Investments | | Gross
Unrealized
Appreciation | | Gross
Unrealized
Depreciation | | Net Unrealized
Appreciation
(Depreciation) |
| InfraCap MLP ETF | | $ | 585,515,070 | | | $ | 47,731,100 | | | $ | (24,778,994 | ) | | $ | 22,952,106 | |
76
Notes to Financial Statements(continued)
April 30, 2019 (Unaudited)
6. INVESTMENT TRANSACTIONS
Purchases and sales of investments (excluding short-term investments), subscriptions in-kind and redemptions in-kind for the period ended April 30, 2019 were as follows:
| Fund | | Purchases | | Sales | | Subscriptions
In-Kind | | Redemptions
In-Kind |
| InfraCap MLP ETF | | $ | 436,776,069 | | | $ | 598,541,483 | | | $ | 44,014,761 | | | $ | — | |
7. DERIVATIVE FINANCIAL INSTRUMENTS
Options
The Fund may write covered call and put options on portfolio securities and other financial instruments. Premiums received are recorded as liabilities. The liabilities are subsequently adjusted to reflect the current value of the options written. Premiums received from writing options that expire are treated as realized gains. Premiums received from writing options that are exercised or are closed are added to or offset against the proceeds or amount paid on the transactions to determine the net realized gain or loss. By writing a covered call option, the Fund, in exchange for the premium, foregoes the opportunity for capital appreciation above the exercise price should the market price of the underlying security increase. By writing a put option, the Fund, in exchange for the premium, accepts the risk of having to purchase a security at an exercise price that is above the current price. Changes in value of written options are reported as change in unrealized gain (loss) on written options in the Statement of Operations. When the written option expires, is terminated or is sold, the Fund will record a gain or loss, which is reported as realized gain (loss) on written options in the Statement of Operations. Written covered call options limit the upside potential of a security above the strike price. Written put options subject the Fund to risk of loss if the value of the security declines below the exercise price minus the put premium.
The Fund may purchase call and put options on the portfolio securities or other financial instruments. The Fund may purchase call options to protect against an increase in the price of the security or financial instrument it anticipates purchasing. The Fund may purchase put options on securities which it holds or other financial instruments to protect against a decline in the value of the security or financial instrument or to close out covered written positions. Changes in value of purchased options are reported as part of change in unrealized gain (loss) on investments in the Statement of Operations. When the purchased option expires, is terminated or is sold, the Fund will record a gain or loss, which is reported as part of realized gain (loss) on investments in the Statement of Operations. Risks may arise from an imperfect correlation between the change in market value of the securities held by the Fund and the prices of options relating to the securities purchased or sold by the Fund and from the possible lack of liquid secondary market for an option. The maximum exposure to loss for any purchased option is limited to the premium initially paid for the option.
Transactions in derivative instruments reflected on the Statement of Assets and Liabilities at April 30, 2019, are:
| Assets | | Equity Risk |
Investments* | | $50,488 |
| Liabilities | | Equity Risk |
| Written options, at value | | $ | 2,029,698 | |
* | | Purchased option contracts are included in Investments on the Statement of Assets and Liabilities. |
Transactions in derivative instruments reflected on the Statement of Operations during the period were as follows:
| Net Realized Gain (Loss) on: | | Equity Risk |
| Investments** | | $ | 4,406,093 | |
| Written options | | | (3,096,951 | ) |
** | | Purchased option contracts are included in Net Realized Gain (Loss) on Investments on the Statement of Operations. |
| Change in Net Unrealized Appreciation (Depreciation) on: | | Equity Risk |
| Investments*** | | $ | 2,884,639 | |
| Written options | | | (1,263,758 | ) |
*** | | Purchased option contracts are included in Change in Net Unrealized Appreciation (Depreciation) on Investments in the Statement of Operations. |
For the period ended April 30, 2019, the monthly average market value of the purchased options and written options contracts held by the Fund were $247,050 and $(2,505,010), respectively.
77
Notes to Financial Statements(continued)
April 30, 2019 (Unaudited)
8. BORROWINGS
The Fund entered into a Lending Agreement (the “Agreement”) with a commercial bank (the “Bank”) that allows the Fund to borrow cash from the Bank. Borrowings under the Agreement are collateralized by investments of the Fund. If the Fund defaults with respect to any of its obligations under the Agreement, the Bank may foreclose on assets of the Fund and/or the Fund may be required to repay immediately, in part or in full, the loan balance outstanding under the Agreement, necessitating the sale of securities at potentially inopportune times. Interest is charged at the 3 Month LIBOR (London Interbank Offered Rate) plus an additional percentage rate on the amount borrowed. The Agreement has an on-demand commitment term. For the period ended April 30, 2019, the average daily borrowings under the Agreement and the daily average interest rate were $171,694,281 and 3.88%, respectively.
At April 30, 2019, the amount of such outstanding borrowings was as follows:
| Outstanding Borrowings | | Interest Rate |
$ 136,960,963 | | 3.78% |
| | | |
9. INVESTMENT RISKS
As with any investment, an investment in the Fund could result in a loss or the performance of the Fund could be inferior to that of other investments. An investor should consider the Fund’s investment objectives, risks, and charges and expenses carefully before investing. The Fund’s prospectus and statement of additional information contain this and other important information.
MLP Risk
Investments in securities of MLPs involve risks that differ from investments in common stock including risks related to limited control and limited rights to vote on matters affecting the MLP, risks related to potential conflicts of interest between the MLP and the MLP’s general partner and cash flow risks. MLP common units and other equity securities can be affected by macro-economic and other factors affecting the stock market in general, expectations of interest rates, investor sentiment towards MLPs or the energy sector, changes in a particular issuer’s financial condition or unfavorable or unanticipated poor performance of a particular issuer (in the case of MLPs, generally measured in terms of distributable cash flow). Prices of common units of individual MLPs and other equity securities also can be affected by fundamentals unique to the partnership or company, including earnings power and coverage ratios.
10. 10% SHAREHOLDERS
As of April 30, 2019, the Fund had individual shareholder account(s) and/or omnibus shareholder account(s) (comprised of a group of individual shareholders), which individually amounted to more than 10% of the total shares outstanding of the Fund as detailed below:
| Fund | | % of Shares
Outstanding | | Number of
Accounts |
InfraCap MLP ETF | | 48% | | 3 |
11. RECENT ACCOUNTING PRONOUNCEMENT
On November 17, 2016, the FASB issued ASU 2016-18, Statement of Cash Flows (Topic 230): Restricted Cash. This update intends to reduce diversity in the presentation of restricted cash and restricted cash equivalents in the statement. Any restricted cash and restricted cash equivalents will be included as components of cash and cash equivalents as presented on the statement of cash flows. For the Trust, the effective date of this update is for periods beginning after December 15, 2017. The ASU has been adopted for the current reporting period. The adoption had no significant impact to the Statements of Cash Flows.
12. SUBSEQUENT EVENTS
The Fund is required to recognize in the financial statements the effects of all subsequent events that provide additional evidence about conditions that existed as of the date of the Statements of Assets and Liabilities. For non-recognized subsequent events that must be disclosed to keep the financial statements from being misleading, the Fund is required to disclose the nature of the event as well as an estimate of its financial effect, or a statement that such an estimate cannot be made. Management has evaluated subsequent events through the issuance of these financial statements and has determined that there are no material events that would require disclosure.
78
Approval of Advisory Agreements & Board Considerations(unaudited)
February 12, 2019 Annual Consideration of Advisory and Sub-Advisory Agreements for:
InfraCap MLP ETF (“AMZA”)
InfraCap REIT Preferred ETF (“PFFR”)
Virtus Glovista Emerging Markets ETF (“EMEM”)
Virtus LifeSci Biotech Clinical Trials ETF (“BBC”) (no sub-adviser — Advisory Agreement only)
Virtus LifeSci Biotech Products ETF (“BBP”) (no sub-adviser — Advisory Agreement only)
Virtus Newfleet Multi-Sector Bond ETF (“NFLT”)
Virtus WMC Global Factor Opportunities ETF (“VGFO”)
(each, a “Fund” and collectively, the “Funds”)
On February 12, 2019, at an in-person meeting (the “Meeting”) at which all of the Trustees were present, including all of the Trustees who were not “interested persons” (as that term is defined in the Investment Company Act of 1940) of the Trust (the “Independent Trustees”), the Board of Trustees (the “Board”) of ETFis Series Trust I (the “Trust”), including the Independent Trustees voting separately, reviewed and unanimously approved for each of the respective Funds the continuance of an investment advisory agreement between Virtus ETF Advisers LLC (the “Adviser”) and the Trust (each, an “Advisory Agreement” and collectively, the “Advisory Agreements”) and an investment sub-advisory agreement among each Sub-Adviser,(1) the Adviser and the Trust (each, a “Sub-Advisory Agreement” and collectively, the “Sub-Advisory Agreements”).
At the Meeting, the Board received and reviewed information provided by the Adviser and each of the Sub-Advisers in response to requests of the Board and its counsel, including a memorandum from the Adviser that included a description of the Adviser’s business, a copy of the Adviser’s Form ADV, and certain other information about the Adviser to be considered in connection with the Trustees’ review process (the “Adviser Memorandum”), and a memorandum from each Sub-Adviser that included a description of the Sub-Adviser’s business, a copy of the Sub-Adviser’s Form ADV and certain other information about the Sub-Adviser to be considered in connection with the Trustees’ review process (each, a “Sub-Adviser Memorandum”). The Board also met in person with representatives of the Adviser to discuss the Funds.
Advisory Agreements
In deciding on whether to approve the continuance of the Advisory Agreements with the Adviser on behalf of the Funds, the Board considered numerous factors, including:
The nature, extent, and quality of the services provided by the Adviser. The Board considered the responsibilities the Adviser has under the respective Advisory Agreement, and the services provided by the Adviser to the Funds, including, without limitation, the management, oversight, and administrative services that the Adviser and its employees provide to the Funds, the Adviser’s coordination of services for the Funds by the Trust’s service providers, and its compliance procedures and practices, particularly with respect to the Trust’s exemptive order permitting the operation of the Funds as exchange-traded funds. The Board noted that many of the Trust’s executive officers are employees of the Adviser, and serve the Trust without additional compensation from the Funds. The Board also considered the information in the Adviser Memorandum, including descriptions of the Adviser’s investment advisory services and its related non-advisory business. The Board concluded that the quality, extent, and nature of the services provided by the Adviser are satisfactory and adequate for the Funds.
The investment management capabilities and experience of the Adviser. The Board evaluated the management experience of the Adviser, in light of the services it has provided to each Fund. In particular, the Board received information from the Adviser regarding, among other things, the Adviser’s experience in organizing, managing and overseeing the Funds and coordinating their operation and administration, and, with respect to the Virtus LifeSci Biotech Clinical Trials ETF and the Virtus LifeSci Biotech Products ETF, the Board received information regarding the Adviser’s performance (including tracking error) in implementing the strategies. The Board determined that the Adviser possessed adequate capabilities and experience for the management of each Fund.
The costs of the services provided and profits to be realized by the Adviser from its relationship with the Funds. The Board examined and evaluated the arrangements between the Adviser and the Funds under the Advisory Agreements. The Board considered the fact that AMZA, EMEM, PFFR, BBC, BBP and VGFO utilize a “unified fee” structure in which a Fund’s ordinary operating expenses (subject to customary exclusions) are paid from the Adviser’s and/or Sub-Adviser’s management fee. The Board also considered that NFLT is subject to an expense limitation agreement (subject to customary exclusions) to cap the Fund’s total expenses. The Board noted that, under either arrangement, the Adviser or Sub-Adviser would likely supplement a portion of the cost of operating each Fund for some period of time
(1) | | The Sub-Advisers include Infrastructure Capital Advisors, LLC; Glovista Investments LLC; Newfleet Asset Management, LLC; and Wellington Management Company LLP. |
79
Approval of Advisory Agreements & Board Considerations(unaudited)(continued)
and considered the benefits that would accrue to those Funds. In addition, the Board considered that for EMEM, the Adviser has contractually agreed to waive a portion of the Fund’s management fee equal to 0.03% of the Fund’s average daily net assets, which would have the effect of reducing the Acquired Fund Fees and Expenses (the “Fee Waiver Agreement”).
The Board also considered potential benefits for the Adviser in managing the Funds, including promotion of the Adviser’s name and the interests of the Adviser in providing management and oversight services to the Funds. In addition, at the Meeting, the Board compared the management fee and total expense ratio of the Funds to the expense ratios of other funds considered by the Adviser to have similar investment objectives and strategies to the Funds and comparable assets under management (“AUM”). Following these comparisons and upon further consideration and discussion of the foregoing, the Board concluded that the fees to be paid to the Adviser by the Funds (including, where applicable, pursuant to the Sub-Advisory Agreements) are appropriate and representative of arm’s-length negotiations.
The extent to which economies of scale would be realized as the Funds grow and whether management fee levels reflect these economies of scale for the benefit of the Funds’ investors. The Board considered the AUM and operational history of each of the Funds, together with the fees paid to the Adviser (including, where applicable, any capped fees). The Board considered that AMZA, EMEM, PFFR, BBC, BBP and VGFO are subject to a unified fee. The Board considered that the Funds have experienced benefits from the unified fee arrangement, and would continue to do so even after each Fund’s assets grow to a level where the Adviser and/or Sub-Adviser is no longer required to reimburse the Fund’s ordinary operating expenses in excess of the amount received by the Adviser and/or Sub-Adviser under the unified fee. Accordingly, the Board concluded that each Fund’s fee arrangement with the Adviser and Sub-Adviser would provide benefits through the unified fee structure, and that, at each Fund’s current and projected asset levels, each Fund’s arrangement with the Adviser would be appropriate.
The Board considered that NFLT currently experiences benefits from the capped fees pursuant to the expense limitation agreement and that EMEM benefits from a fee waiver agreement. Accordingly, the Board concluded that, in light of the current AUM for each of the Funds, it was not necessary to consider economies of scale at this time.
Other benefits derived by the Adviser from its relationship with the Funds. The Board considered material “fall-out” or ancillary benefits that accrue to the Adviser as a result of its relationship with each Fund (other than the advisory fee). The Board noted that ETF Distributors LLC (the “Distributor”), an affiliate of the Adviser, serves as principal underwriter for the Funds, and that Virtus ETF Solutions LLC (the “Administrator”), also an affiliate of the Adviser, serves as the operational administrator for the Funds. The Board noted that the Adviser is responsible for the payment of any fees to the Distributor and the Administrator. The Board considered that the association of the Distributor and the Administrator with the Funds could result in non-quantifiable reputational benefits for those entities. Based on the foregoing information, the Board concluded that such potential benefits are immaterial to its consideration and approval of the continuance of the Advisory Agreements.
Conclusion. The Board did not identify any single factor as being of paramount importance, and different Trustees may have given different weight to different factors. The Board reviewed with counsel to the Independent Trustees the legal standards applicable to its consideration of the Advisory Agreements. Based on its review, including consideration of each of the factors referenced above, the Board determined, in the exercise of its reasonable business judgment, that the Advisory Agreements were fair and reasonable in light of the services performed or to be performed, expenses incurred or to be incurred and such other matters as the Board considered relevant.
After full consideration of the above factors as well as other factors, the Board, including the Independent Trustees, unanimously approved the continuance of the Advisory Agreements on behalf of the Funds.
Sub-Advisory Agreements
In deciding on whether to approve the continuance of the Sub-Advisory Agreements with each Sub-Adviser on behalf of the respective Funds, the Board considered numerous factors, including:
The nature, extent, and quality of the services provided by the Sub-Advisers. The Board considered the responsibilities the Sub-Advisers have under the Sub-Advisory Agreements and the services provided by the Sub-Advisers including, without limitation, the investment advisory services and each Sub-Adviser’s compliance procedures and practices. After reviewing the foregoing information and further information in the materials, including each Sub-Adviser Memorandum (which included descriptions of each Sub-Adviser’s business and each Sub-Adviser’s Form ADV), the Board concluded that the quality, extent, and nature of the services provided by the Sub-Advisers are satisfactory and adequate for the Funds.
The investment management capabilities and experience of the Sub-Advisers. The Board evaluated the investment management experience of the Sub-Advisers and experience of the Sub-Advisers in carrying out the day-to-day management of the respective Fund’s portfolio. In particular, the Board received information from each Sub-Adviser regarding the performance of its portfolio managers in
80
Approval of Advisory Agreements & Board Considerations(unaudited)(continued)
implementing the investment strategies for the respective Fund. The Board discussed the investment objective and strategies for each Fund and each Sub-Adviser’s performance (including tracking error, if applicable) in implementing the strategies. The Board noted the above-average distribution rate and use of leverage by AMZA. After consideration of these factors, the Board determined that each Sub-Adviser continued to be an appropriate sub-adviser to the respective Fund.
The costs of the services provided and profits to be realized by the Sub-Advisers from their relationship with the respective Funds. The Board examined and evaluated the arrangements between the respective Sub-Adviser and the Adviser under the Sub-Advisory Agreements. The Board considered the fact that AMZA, EMEM, PFFR, and VGFO utilize a “unified fee” structure in which a Fund’s ordinary operating expenses (subject to customary exclusions) are paid from the Adviser’s and/or Sub-Adviser’s management fee. The Board also considered that NFLT is subject to an expense limitation agreement (in each case, subject to customary exclusions) to cap the Fund’s total expenses. The Board considered the extent to which each Sub-Adviser bears a portion of Fund expenses. The Board noted that, under either arrangement, the Sub-Advisers would likely supplement a portion of the cost of operating the Funds for some period of time and considered the benefits that would accrue to those Funds.
The Board considered the Sub-Advisers’ staffing, personnel, and methods of operating; the Sub-Advisers’ compliance policies and procedures; the financial condition of the Sub-Advisers and the level of commitment to the Funds by the Sub-Advisers; the current and projected asset levels of the Funds; the Sub-Advisers’ payment of startup costs for the Funds; and the overall projected expenses of the Funds. The Board also considered potential benefits to the Sub-Advisers in sub-advising the respective Funds, including promotion of the Sub-Advisers’ names.
The Board compared the fees and expenses of the Funds (including the sub-advisory fee) to other funds considered by the Adviser to have investment objectives and strategies similar to the Funds and comparable AUM. Following these comparisons and upon further consideration and discussion of the foregoing, the Board concluded that the fees to be paid to the Sub-Advisers (including, where applicable, pursuant to the Advisory Agreements) are appropriate and representative of arm’s-length negotiations.
The extent to which economies of scale would be realized as the Funds grow and whether sub-advisory fee levels reflect these economies of scale for the benefit of the Funds’ investors. The Board considered the AUM and operational history of each of the Funds, together with the fees paid to the respective Sub-Advisers (including, where applicable, any capped fees). The Board considered that AMZA, EMEM, PFFR, and VGFO are subject to a unified fee. The Board considered that the Funds have experienced benefits from the unified fee arrangement, and that NFLT benefits from any additional capped fees, particularly where Sub-Advisers are paying Fund expenses in excess of their sub-advisory fee. The Board considered that the applicable Fund would continue to experience such benefits even after each Fund’s assets grow to a level where the Sub-Adviser is no longer required to waive its sub-advisory fee or reimburse the Fund’s expenses in excess of the amount received by the Sub-Adviser under its Sub-Advisory Agreement. Accordingly, the Board concluded that, in light of the current AUM for each of the Funds, it was not necessary to consider economies of scale at this time.
Conclusion. The Board did not identify any single factor as being of paramount importance, and different Trustees may have given different weight to different factors. The Board reviewed with counsel to the Independent Trustees the legal standards applicable to its consideration of each Sub-Advisory Agreement. Based on its review, including consideration of each of the factors referenced above, the Board determined, in the exercise of its reasonable business judgment, that the sub-advisory arrangements, as outlined in each Sub-Adviser’s Sub-Advisory Agreement, were fair and reasonable in light of the services performed or to be performed, expenses incurred or to be incurred, and such other matters as the Board considered relevant.
After full consideration of the above factors as well as other factors, the Board, including the Independent Trustees, unanimously approved the continuance of each of the Sub-Advisory Agreements with the respective Sub-Adviser on behalf of each Fund.
81
Approval of Advisory Agreements & Board Considerations(unaudited)(continued)
Approvals with Respect to Virtus Private Credit Strategy ETF and Virtus Real Asset Income ETF
On November 8, 2018, at an in-person meeting (the “Meeting”) at which all of the Trustees who were not “interested persons” (as that term is defined in the Investment Company Act of 1940) of the Trust (the “Independent Trustees”) were present, the Board of Trustees (the “Board”) of ETFis Series Trust I (the “Trust”), including the Independent Trustees voting separately, reviewed and unanimously approved an investment advisory agreement between Virtus ETF Advisers LLC (the “Adviser”) and the Trust (the “Advisory Agreement”) with respect to the Virtus Private Credit Strategy ETF and the Virtus Real Asset Income ETF (each, a “Fund” and, together, the “Funds”).
At the Meeting, the Board received and reviewed a substantial amount of information provided by the Adviser in response to requests of the Board and counsel, including, without limitation, a memorandum from the Adviser that included a description of the Adviser’s business, a copy of the Adviser’s Form ADV and certain other information about the Adviser to be considered in connection with the Trustees’ review process (the “Adviser Memorandum”). The Board also met in person with representatives of the Adviser to discuss the proposed Funds.
Advisory Agreement
In deciding on whether to approve the Advisory Agreement on behalf of the Funds, the Board considered numerous factors, including:
The nature, extent, and quality of the services to be provided by the Adviser. The Board considered the responsibilities the Adviser would have under the Advisory Agreement and the services that would be provided by the Adviser to the Funds including, without limitation, its investment advisory services; the management, oversight and administrative services that the Adviser and its employees would provide to the Funds; the services already provided by the Adviser related to organizing the Funds; the Adviser’s coordination of services for the Funds by the Trust’s service providers; its compliance procedures and practices; and its efforts to promote the Funds. The Board also considered the quality of the services that the Adviser provides to other series in the Virtus fund complex, including other series of the Trust. The Board noted that many of the Trust’s executive officers are employees of the Adviser and serve the Trust without additional compensation from the Funds. After reviewing the foregoing information and further information in the Adviser Memorandum (including descriptions of the Adviser’s investment advisory services and its related non-advisory business), and discussing the Adviser’s proposed services to the Funds, the Board concluded that the quality, extent, and nature of the services proposed to be provided by the Adviser would be satisfactory and adequate for the Funds.
The investment management capabilities and experience of the Adviser. The Board evaluated the management experience of the Adviser in light of the services it will be providing, and the experience of the Adviser in carrying out the day-to-day management of each Fund’s portfolio. In particular, the Board received information from the Adviser regarding the anticipated performance of its portfolio managers in implementing the investment strategies for each Fund, as well as the Adviser’s experience in organizing, managing and overseeing exchange-traded funds and coordinating their operation and administration. After consideration of these factors, the Board determined that the Adviser would be an appropriate manager for the Funds.
The costs of the services to be provided and profits to be realized by the Adviser from its relationship with the Funds. The Board examined and evaluated the arrangement between the Adviser and the Funds under the proposed Advisory Agreement, including the fact that the Adviser will utilize a “unified fee” structure to cap each Fund’s total expenses. The Board considered the Adviser’s staffing, personnel, and methods of operating; the Adviser’s compliance policies and procedures; the financial condition of the Adviser and its parent, and the level of commitment to the Funds by the Adviser; the projected asset levels of each Fund; and the overall projected expenses of each Fund. The Board also considered potential benefits for the Adviser in managing the Funds, including promotion of the Adviser’s name and the interests of the Adviser in providing management and oversight services to the Funds.
In addition, at the Meeting, the Board compared the management fee of each Fund (which also represents the anticipated total expense ratio for the Fund as a result of the unified fee structure) to the expense ratios of other funds considered by the Adviser to have similar investment objectives and strategies to the Fund, and assets under management comparable to the projected asset levels of each Fund. Following these comparisons and upon further consideration and discussion of the foregoing, the Board concluded that the fee to be paid to the Adviser by each Fund would be appropriate and within the range of what would have been negotiated at arm’s length.
82
Approval of Advisory Agreements & Board Considerations(unaudited) (continued)
The extent to which economies of scale would be realized as each Fund grows and whether management fee levels reflect these economies of scale for the benefit of the Fund’s investors. The Board considered that each Fund’s proposed fee arrangement with the Adviser involves a unified fee. The Board considered that each Fund would likely experience benefits from the proposed unified fee arrangement, and would continue to do so even after the Fund’s assets grow to a level where the Adviser is no longer required to reimburse the Fund’s ordinary operating expenses in excess of the amount received by the Adviser under the unified fee. Accordingly, the Board concluded that each Fund’s fee arrangement with the Adviser would provide benefits through the proposed unified fee structure, and that, at each Fund’s projected asset levels, each Fund’s proposed arrangement with the Adviser would be appropriate.
Other benefits derived by the Adviser from its relationship with the Funds. The Board considered material “fall-out” or ancillary benefits that would accrue to the Adviser as a result of its relationship with the Funds (other than the advisory fee). The Board noted that ETF Distributors LLC (the “Distributor”), an affiliate of the Adviser, will serve as principal underwriter for the Funds, and that Virtus ETF Solutions LLC (the “Administrator”), also an affiliate of the Adviser, will serve as the operational administrator for the Funds. The Board noted that the Adviser will be responsible for the payment of any fees to the Distributor and the Administrator. The Board considered that the association of the Distributor and the Administrator with the Funds could result in non-quantifiable reputational benefits for those entities. Based on the foregoing information, the Board concluded that such potential benefits are immaterial to its consideration and approval of the Advisory Agreement.
Conclusion. The Board did not identify any single factor as being of paramount importance, and different Trustees may have given different weight to different factors. The Board reviewed with counsel to the Independent Trustees the legal standards applicable to its consideration of the Advisory Agreement. Based on its review, including consideration of each of the factors referenced above, the Board determined, in the exercise of its reasonable business judgment, that the advisory arrangement with respect to each Fund, as outlined in the Advisory Agreement, was fair and reasonable in light of the services to be performed, expenses to be incurred and such other matters as the Board considered relevant.
After full consideration of the above factors as well as other factors, the Board, including the Independent Trustees, unanimously approved the Advisory Agreement on behalf of the Funds.
83
Supplemental Information(unaudited)
INFORMATION ABOUT PORTFOLIO HOLDINGS
The Funds file their complete schedule of portfolio holdings for their first and third fiscal quarters with the Securities and Exchange Commission (“SEC”) on Form N-PORT. The Funds’ Form N-PORT are available without charge, upon request, by calling toll-free at (888) 383-4184. Furthermore, you may obtain the Form N-PORT on the SEC’s website atwww.sec.gov. The Funds’ portfolio holdings are posted daily on the Funds’ website atwww.virtusetfs.com.
The Funds’ premium/discount information that is current as of the most recent month-end is available by visitingwww.virtusetfs.com or by calling (888) 383-4184.
INFORMATION ABOUT PROXY VOTING
A description of the policies and procedures the Funds use to determine how to vote proxies relating to portfolio securities is provided in the Statement of Additional Information (“SAI”). The SAI is available without charge upon request by calling toll-free at (888) 383- 4184, by accessing the SEC’s website atwww.sec.gov, or by accessing the Funds’ website atwww.virtusetfs.com.
Information regarding how the Fund voted proxies relating to portfolio securities during the most recent twelve-month period ended June 30th is available by calling toll-free at (888) 383-4184 or by accessing the SEC’s website atwww.virtusetfs.com.
IMPORTANT NOTICE TO SHAREHOLDERS
Beginning on January 1, 2021, as permitted by regulations adopted by the Securities and Exchange Commission, paper copies of each Fund’s shareholder reports will no longer be sent by mail, unless you specifically request paper copies of the reports from your financial intermediary, such as a broker-dealer or bank. Instead, the reports will be made available on a website, and you will be notified by mail each time a report is posted and provided with a website link to access the report.
You may elect at any time to receive not only shareholder reports but also other communications such as prospectuses from the Fund electronically, or you alternatively may elect to receive all future shareholder reports in paper free of charge. Please contact your financial intermediary to make your request and to determine whether an election made with the financial intermediary will apply to all funds in which you own shares through that intermediary.
84
c/o ETF Distributors LLC
1540 Broadway, Suite 1610
New York, NY 10036
8572(06/19)
Item 2. Code of Ethics.
Not applicable.
Item 3. Audit Committee Financial Expert.
Not applicable.
Item 4. Principal Accountant Fees and Services.
Not applicable.
Item 5. Audit Committee of Listed Registrants.
Not applicable.
Item 6. Investments.
| (a) | Schedule of Investments in securities of unaffiliated issuers as of the close of the reporting period is included as part of the report to shareholders filed under Item 1 of this form. |
Item 7. Disclosure of Proxy Voting Policies and Procedures for Closed-End Management Investment Companies.
Not applicable.
Item 8. Portfolio Managers of Closed-End Management Investment Companies.
Not applicable.
Item 9. Purchases of Equity Securities by Closed-End Management Investment Company and Affiliated Purchasers.
Not applicable.
Item 10. Submission of Matters to a Vote of Security Holders.
The registrant does not have procedures in place to consider nominees recommended by shareholders. The registrant’s nominating committee generally will not consider nominees recommended by shareholders.
Item 11. Controls and Procedures.
| (a) | The registrant’s principal executive and principal financial officers, or persons performing similar functions, have concluded that the registrant’s disclosure controls and procedures (as defined in Rule 30a-3(c) under the Investment Company Act of 1940, as amended (the “1940 Act”) (17 CFR 270.30a-3(c))) are effective, as of a date within 90 days of the filing date of the report that includes the disclosure required by this paragraph, based on their evaluation of these controls and procedures required by Rule 30a-3(b) under the 1940 Act (17 CFR 270.30a-3(b)) and Rules 13a-15(b) or 15d-15(b) under the Securities Exchange Act of 1934, as amended (17 CFR 240.13a-15(b) or 240.15d-15(b)). |
| (b) | There were no changes in the registrant’s internal control over financial reporting (as defined in Rule 30a-3(d) under the 1940 Act (17 CFR 270.30a-3(d))) that occurred during the registrant’s last fiscal quarter that has materially affected, or is reasonably likely to materially affect, the registrant’s internal control over financial reporting. |
Item 12. Disclosure of Securities Lending Activities for Closed-End Management Investment Companies.
Not applicable.
Item 13. Exhibits.
| (a)(2) | Certifications pursuant to Rule 30a-2(a) under the 1940 Act and Section 302 of the Sarbanes-Oxley Act of 2002 are attached hereto. |
| (b) | Certifications pursuant to Rule 30a-2(b) under the 1940 Act and Section 906 of the Sarbanes-Oxley Act of 2002 are attached hereto. |
SIGNATURES
Pursuant to the requirements of the Securities Exchange Act of 1934 and the Investment Company Act of 1940, the registrant has duly caused this report to be signed on its behalf by the undersigned, thereunto duly authorized.
| (Registrant) | | ETFis Series Trust I |
| By (Signature and Title)* | /s/ | William J. Smalley |
| | | William J. Smalley, President and Principal Executive Officer |
| | | (Principal Executive Officer) |
Pursuant to the requirements of the Securities Exchange Act of 1934 and the Investment Company Act of 1940, this report has been signed below by the following persons on behalf of the registrant and in the capacities and on the dates indicated.
| By (Signature and Title)* | /s/ | William J. Smalley |
| | | William J. Smalley, President and Principal Executive Officer |
| | | (Principal Executive Officer) |
| By (Signature and Title)* | /s/ | Brinton W. Frith |
| | | Brinton W. Frith, Treasurer and Principal Financial Officer |
| | | (Principal Financial Officer) |
* Print the name and title of each signing officer under his or her signature.