UNITED STATES
SECURITIES AND EXCHANGE COMMISSION
Washington, D.C. 20549
FORM N-CSR
CERTIFIED SHAREHOLDER REPORT OF REGISTERED MANAGEMENT INVESTMENT COMPANIES
Investment Company Act file number811-22819
ETFis Series Trust I
(Exact name of registrant as specified in charter)
1540 Broadway, 16th Floor
New York, NY 10036
(Address of principal executive offices) (Zip code)
ETFis Series Trust I
c/o Corporation Service Company
2711 Centerville Road, Suite 400
Wilmington, DE 19808
(Name and address of agent for service)
Registrant’s telephone number, including area code:(212) 593-4383
Date of fiscal year end:October 31
Date of reporting period:October 31, 2019
Form N-CSR is to be used by management investment companies to file reports with the Commission not later than 10 days after the transmission to stockholders of any report that is required to be transmitted to stockholders under Rule 30e-1 under the Investment Company Act of 1940 (17 CFR 270.30e-1). The Commission may use the information provided on Form N-CSR in its regulatory, disclosure review, inspection, and policymaking roles.
A registrant is required to disclose the information specified by Form N-CSR, and the Commission will make this information public. A registrant is not required to respond to the collection of information contained in Form N-CSR unless the Form displays a currently valid Office of Management and Budget ("OMB") control number. Please direct comments concerning the accuracy of the information collection burden estimate and any suggestions for reducing the burden to Secretary, Securities and Exchange Commission, 450 Fifth Street, NW, Washington, DC 20549-0609. The OMB has reviewed this collection of information under the clearance requirements of 44 U.S.C. § 3507.
Item 1. Reports to Stockholders.
The Report to Shareholders is attached herewith.
INFRACAP REIT PREFERRED ETF
VIRTUS GLOVISTA EMERGING MARKETS ETF
VIRTUS INFRACAP U.S. PREFERRED STOCK ETF
VIRTUS LIFESCI BIOTECH CLINICAL TRIALS ETF
VIRTUS LIFESCI BIOTECH PRODUCTS ETF
VIRTUS NEWFLEET MULTI-SECTOR BOND ETF
VIRTUS PRIVATE CREDIT STRATEGY ETF
VIRTUS REAL ASSET INCOME ETF
VIRTUS WMC GLOBAL FACTOR OPPORTUNITIES ETF
INFRACAP MLP ETF
Beginning on January 1, 2021, as permitted by regulations adopted by the Securities and Exchange Commission, paper copies of each Fund’s shareholder reports will no longer be sent by mail, unless you specifically request paper copies of the reports from your financial intermediary, such as a broker-dealer or bank. Instead, the reports will be made available on a website, and you will be notified by mail each time a report is posted and provided with a website link to access the report.
You may elect at any time to receive not only shareholder reports but also other communications such as prospectuses from the Fund electronically, or you alternatively may elect to receive all future shareholder reports in paper free of charge. Please contact your financial intermediary to make your request and to determine whether an election made with the financial intermediary will apply to all funds in which you own shares through that intermediary.
ANNUAL REPORT
October 31, 2019
| | | Page (s)
|
| | | 1 |
| | | 2 |
| | | 26 |
| | | 29 |
InfraCap REIT Preferred ETF
| | | |
Virtus Glovista Emerging Markets ETF
| | | |
Virtus InfraCap U.S. Preferred Stock ETF
| | | |
Virtus LifeSci Biotech Clinical Trials ETF
| | | |
Virtus LifeSci Biotech Products ETF
| | | |
Virtus Newfleet Multi-Sector Bond ETF
| | | |
Virtus Private Credit Strategy ETF
| | | |
Virtus Real Asset Income ETF
| | | |
Virtus WMC Global Factor Opportunities ETF
| | | |
| | | 30 |
| | | 58 |
| | | 60 |
| | | 62 |
| | | 67 |
| | | 68 |
| | | 77 |
InfraCap MLP ETF
| | | |
| | | 88 |
| | | 92 |
| | | 93 |
| | | 94 |
| | | 95 |
| | | 96 |
| | | 97 |
| | | 105 |
| | | 108 |
| | | 110 |
Shareholder Letter (unaudited)
October 31, 2019
Dear Fellow ETFis Funds Shareholder:
I am pleased to present this annual report for ETFis Series Trust I, which reviews the performance of the following funds within the Trust, including two recent additions, for the twelve months ended October 31, 2019:
• | | InfraCap REIT Preferred ETF (PFFR) |
• | | Virtus Glovista Emerging Markets ETF (EMEM) |
• | | Virtus InfraCap U.S. Preferred Stock ETF (PFFA) |
• | | Virtus LifeSci Biotech Clinical Trials ETF (BBC) |
• | | Virtus LifeSci Biotech Products ETF (BBP) |
• | | Virtus Newfleet Multi-Sector Bond ETF (NFLT) |
• | | Virtus Private Credit Strategy ETF (VPC) - Launched on February 7, 2019, this fund seeks investment results that correspond with the price and yield performance of the Indxx Private Credit Index. |
• | | Virtus Real Asset Income ETF (VRAI) - Launched on February 7, 2019, this fund seeks investment results that correspond with the price and yield performance of the Indxx Real Asset Income Index. |
• | | Virtus WMC Global Factor Opportunities ETF (VGFO) |
• | | InfraCap MLP ETF (AMZA) |
The report provides financial statements and portfolio information for the above funds. For the funds with a performance history of more than six months, the report also provides commentary from the portfolio manager on how the fund performed relative to the markets in which it invests.
On behalf of Virtus ETF Advisers LLC (the “Adviser”) and our fund Sub-Advisers, thank you for your investment. If you have questions, please contact your financial adviser, or call 1-888-383-0553. We invite you to visit our website, www.virtusetfs.com, to learn more about the funds.
Sincerely,
William Smalley
President
ETFis Series Trust I
This material must be accompanied or preceded by the prospectus.
1
Management’s Discussion of Fund Performance (unaudited)
October 31, 2019
InfraCap REIT Preferred ETF Management’s Discussion of Operations
Overview
The InfraCap REIT Preferred ETF (the “Fund”) seeks to track the investment results of an index composed of preferred shares listed on U.S. Exchanges and issued by Real Estate Investment Trusts, as represented by the Indxx REIT Preferred Stock Index (the “Index”). The Fund invests in a representative sample of securities included in the Index that collectively has a profile similar to the Index. Due to the use of representative sampling, the Fund may or may not own all of the securities that are included in the Index.
Update
In the fiscal year ended October 31, 2019, the Fund’s market value total return (NYSE price change plus dividends) was 14.31%. The total return on Net Asset Value (NAV) was 13.78%. The Fund’s benchmark index, the Indxx REIT Preferred Stock Index, earned a total return of 15.02% during this period.
Preferred shares are fixed income securities, and prices are influenced by changes in long-term interest rates. During the fiscal year, the yield on the 30-year U.S. Treasury bond fell 122 basis points, from 3.39% to 2.17%. Yields on preferred shares fell in response, with prices rising accordingly. While preferred stock performed well, common stocks and Real Estate Investment Trusts exhibited greater potential for total returns.
Top performing preferred stocks for the fiscal year included Washington Prime Group 7½% Cumulative Preferred Series H, Summit Hotel Properties Cumulative Prf. Registered Series E, and City Office REIT Inc., 6.625% Cumulative Pfd. Registered Series A.
Washington Prime Group is a Real Estate Investment Trust with retail properties located in the Midwest. Investors may have found Washington’s preferred issues to be more compelling and stable than the company’s common shares.
Summit Hotel Properties, Inc. is a Real Estate Investment Trust that owns hotels throughout the U.S. The company’s common stock and preferred issues performed well during the period as investors viewed Summit’s October announcement of a significant acquisition favorably.
City Office REIT Inc. is a Real Estate Investment Trust that owns office properties in the Southern and Western U.S. City’s common stock and investor outlook improved during the year which was highlighted during the company’s capital raising roadshow completed in early October 2019.
Detractors from relative performance included Ashford Hospitality Trust Inc. 7.375% Pref Series G, Pebblebrook Hotel Trust 6.3% Cumulative Pfd. Registered Shares Series F and Colony Capital 8.75% Cumulative Prf. Shares Series E.
Pebblebrook Hotel Trust is a hotel operator that, while it has made progress selling non-core assets and deleveraging its balance sheet, is still challenged by its acquisition of LaSalle Hotel Properties.
Ashford Hospitality Trust, Inc. is a Real Estate Investment Trust that invests in full service hotel properties. Shares of Ashford’s common and preferred issues were under pressure during the period as management addressed concerns of a slowdown in business travel and increased employee costs.
Colony Capital is a diversified Real Estate Investment Trust. The company’s common and preferred shares underperformed similar issuers when some analysts questioned the complexity of the company’s balance sheet during the period.
EXPOSURE BY SECTOR (%) as of 10/31/19
| | | |
Mortgage REITs | | | | | 30.19 | |
Property REITs | | | | | 69.81 | |
Diversified | | | | | 21.02 | |
Storage | | | | | 11.22 | |
Office Property | | | | | 6.30 | |
Shopping Centers | | | | | 10.80 | |
Health Care | | | | | 2.22 | |
Residential | | | | | 7.54 | |
Hotels | | | | | 6.83 | |
Industrial | | | | | 2.18 | |
Data Centers | | | | | 0.75 | |
Farmlands | | | | | 0.94 | |
Total | | | | | 100.00 | |
2
Management’s Discussion of Fund Performance (unaudited) (continued)
October 31, 2019
InfraCap REIT Preferred ETF (continued)
TOP 10 HOLDINGS (%) as of 10/31/19
| | | |
Annaly Capital Management, Inc., Series F | | | | | 4.2 | |
Annaly Capital Management, Inc., Series D | | | | | 2.6 | |
Annaly Capital Management, Inc., Series G | | | | | 2.5 | |
National Retail Properties, Inc., Series F | | | | | 2.3 | |
Arch Capital Group Ltd., Series F | | | | | 2.2 | |
Senior Housing Properties Trust | | | | | 2.2 | |
AGNC Investment Corp., Series C | | | | | 2.2 | |
Monmouth Real Estate Investment Corp., Series C | | | | | 2.2 | |
Vornado Realty Trust, Series M | | | | | 2.2 | |
Colony Capital, Inc., Series I | | | | | 2.1 | |
EXPOSURE BY RATING (%) as of 10/31/19
| | | |
A- | | | | | 10.0 | % |
BBB+ | | | | | 2.8 | % |
BBB | | | | | 12.0 | % |
BBB- | | | | | 9.3 | % |
BB+ | | | | | 5.5 | % |
BB | | | | | 1.9 | % |
B | | | | | 0.6 | % |
B- | | | | | 0.8 | % |
NR | | | | | 57.1 | % |
Credit quality ratings on underlying securities of the Fund are received from S&P, Moody’s, and Fitch and converted to the equivalent S&P major rating category. This breakdown is provided by Infrastructure Capital Advisors and takes the median rating of the three agencies when all three agencies rate a security, the lower of the two ratings if only two agencies rate a security, and one rating if that is all that is provided. Unrated securities do not necessarily indicate low quality. Below investment-grade is represented by a rating of BB and below. Ratings and portfolio credit quality may change over time.
The preceding information is the opinion of the investment adviser and sub-adviser. Any such opinions are subject to change at any time based upon market or other conditions and should not be relied upon as investment advice. Statements of fact are from sources considered reliable, but the investment adviser and sub-adviser make no representation or warranty as to their completeness or accuracy. Past performance is no guarantee of future results, and there is no guarantee that market forecasts will be realized.
Performance as of 10/31/2019
| | | | Average Annual Total Return
|
| | | | Fund
Net Asset Value
| | Fund
Market Price
| | Index REIT
Preferred
Stock Index1
|
1 Year | | | | | 13.78 | % | | | 14.31 | % | | | 15.02 | % |
Since Inception2 | | | | | 6.28 | % | | | 6.46 | % | | | 7.22 | % |
| 1 | | The Indxx REIT Preferred Stock Index is a market cap weighted index designed to provide diversified exposure to high yielding liquid preferred securities issued by Real Estate Investment Trusts listed in the U.S. The index is calculated on a total return basis. The index is unmanaged, its returns do not reflect any fees, expenses, or sales charges, and is not available for direct investment. |
Performance data quoted represents past performance and past performance does not guarantee future results. Investment return and principal value of an investment will fluctuate so that an investor’s shares, when sold or redeemed, may be worth more or less than the original cost. Current performance data may be higher or lower than actual data quoted. Returns do not reflect the deduction of taxes a shareholder would pay on Fund distributions or the redemption of Fund shares. For the most current month-end performance data please visit www.virtusetfs.com or call toll free (800) 243-4361. Market price returns are based on the mid-point of the highest bid and lowest offer for Fund shares as of the scheduled close of regular trading on the New York Stock Exchange Arca (“NYSE”), ordinarily 4:00 p.m. Eastern time, on each day during which the NYSE is open for trading, and do not represent the returns an investor would receive if shares were traded at other times.
Exchange Traded Funds: The value of an ETF may be more volatile than the underlying portfolio of securities the ETF is designed to track. The costs of owning the ETF may exceed the cost of investing directly in the underlying securities.
3
Management’s Discussion of Fund Performance (unaudited) (continued)
October 31, 2019
InfraCap REIT Preferred ETF (continued)
Market Price/NAV: Shares of ETFs often trade at a discount to their net asset value, which may increase investors’ risk of loss. At the time of sale, an investor’s shares may have a market price that is above or below the Fund’s NAV.
Preferred Stocks: Preferred stocks may decline in price, fail to pay dividends, or be illiquid.
Real Estate Investments: The Fund may be negatively affected by factors specific to the real estate market, including interest rates, leverage, property, and management.
Industry/Sector Concentration: A fund that focuses its investments in a particular industry or sector will be more sensitive to conditions that affect that industry or sector than a non-concentrated fund.
Passive Strategy/Index Risk: A passive investment strategy seeking to track the performance of the Underlying Index may result in the fund holding securities regardless of market conditions or their current or projected performance. This could cause the Fund’s returns to be lower than if the Fund employed an active strategy.
Correlation to Index: The performance of the Fund and its index may vary somewhat due to factors such as Fund flows, transaction costs, and timing differences associated with additions to and deletions from its index.
Market Volatility: Securities in the Fund may go up or down in response to the prospects of individual companies and general economic conditions. Price changes may be short or long term.
No Guarantee: There is no guarantee that the Fund will meet its objective.
Non-Diversified: The Fund is non-diversified and may be more susceptible to factors negatively impacting its holdings to the extent that each security represents a larger portion of the Fund’s assets.
Prospectus: For additional information on risks, please see the Fund’s prospectus. The Fund may not be suitable for all investors.
Value of a $10,000 Investment Since Inception at Net Asset Value
The chart above represents historical performance of a hypothetical investment of $10,000 over the life of the Fund, assuming reinvestment of distributions. Past performance does not guarantee future results.
4
Management’s Discussion of Fund Performance (unaudited) (continued)
October 31, 2019
Virtus Glovista Emerging Markets ETF
The Virtus Glovista Emerging Market ETF (the “Fund”) (NYSE: EMEM) is an ETF that seeks to provide passive diversified exposure to stocks in “most favored” Emerging Market countries as identified by a proprietary quantitative methodology. The Fund passively replicates the Solactive Most Favored Nations Emerging Market Index (the “Index”). In the fiscal year ending October 31, 2019, the Index returned 11.18% whereas the Fund’s NAV returned 9.77%.
Emerging Market Equities have underperformed the S&P 500 and International Developed Market Equities during the fiscal year ending October 31, 2019. The performance of equity indices during the first ten months of the fiscal year was mainly driven by two US centered policy developments: (1) a marked dovish turn by the US Federal Reserve, and; (2) the Trump administration’s on-going engagement with China on trade dispute and its resultant impact on global growth and supply chains.
It is important to note the effect of currency movements on the Fund’s performance. In general, if the value of the U.S. dollar goes up compared with foreign currencies then investments traded in that foreign currency will go down in value. For the fiscal year ending October 31, 2019, the U.S. dollar continued a steady rise relative to most currencies relevant to the Fund thereby creating headwinds for most emerging markets and negatively impacting the Fund’s performance.
For the fiscal year ending October 31, 2019, key holdings that contributed to the Fund’s performance included Taiwan Semiconductor Manufacturing Co., Gazprom and Franklin FTSE India ETF. Conversely, SACI Falabella, Empresas COPEC and Sociedad Quimica y Minera de Chile were notable detractors from the Fund’s returns.
At fiscal year end the portfolio was invested in 16 different countries, in line with the Index.
The preceding information is the opinion of the investment adviser and sub-adviser. Any such opinions are subject to change at any time based upon market or other conditions and should not be relied upon as investment advice. Statements of fact are from sources considered reliable, but the investment adviser and sub-adviser make no representation or warranty as to their completeness or accuracy. Past performance is no guarantee of future results, and there is no guarantee that market forecasts will be realized.
Performance as of 10/31/2019
| | | | Average Annual Total Return
|
| | | | Fund
Net Asset Value
| | Fund
Market Price
| | Solactive Most Favored
Nations Emerging
Markets Index (net)1
|
1 Year | | | | | 9.77 | % | | | 8.39 | % | | | 11.18 | % |
Since Inception2 | | | | | (2.63 | )% | | | (3.07 | )% | | | (1.80 | )% |
| 1 | | The Solactive Most Favored Nations Emerging Markets Index (net) is an index of stocks from most favored countries selected from a universe of large liquid Emerging Market countries (currently fifteen). The index is designed to provide diversified exposure to stocks within large liquid countries in Emerging Markets while avoiding exposure to the stocks within weakest countries based on Glovista’s proprietary quantitative methodology. The index is calculated on a total return basis with net dividends reinvested. The index is unmanaged, its returns do not reflect any fees, expenses, or sales charges, and is not available for direct investment. |
Performance data quoted represents past performance and past performance does not guarantee future results. Investment return and principal value of an investment will fluctuate so that an investor’s shares, when sold or redeemed, may be worth more or less than the original cost. Current performance data may be higher or lower than actual data quoted. Returns do not reflect the deduction of taxes a shareholder would pay on Fund distributions or the redemption of Fund shares. For the most current month-end performance data please visit www.virtusetfs.com or call toll free (800) 243-4361. Market price returns are based on the mid-point of the highest bid and lowest offer for Fund shares as of the scheduled close of regular trading on the New York Stock Exchange Arca (“NYSE”), ordinarily 4:00 p.m. Eastern time, on each day during which the NYSE is open for trading, and do not represent the returns an investor would receive if shares were traded at other times.
Exchange Traded Funds: The value of an ETF may be more volatile than the underlying portfolio of securities the ETF is designed to track. The costs of owning the ETF may exceed the cost of investing directly in the underlying securities.
Market Price/NAV: Shares of ETFs often trade at a discount to their net asset value, which may increase investors’ risk of loss. At the time of sale, an investor’s shares may have a market price that is above or below the Fund’s NAV.
Industry/Sector Concentration: A fund that focuses its investments in a particular industry or sector will be more sensitive to conditions that affect that industry or sector than a non-concentrated fund.
5
Management’s Discussion of Fund Performance (unaudited) (continued)
October 31, 2019
Virtus Glovista Emerging Markets ETF (continued)
Equity Securities: The market price of equity securities may be adversely affected by financial market, industry, or issuer-specific events. Focus on a particular style or on small or medium-sized companies may enhance that risk.
Foreign & Emerging Markets: Investing internationally, especially in emerging markets, involves additional risks such as currency, political, accounting, economic, and market risk.
Passive Strategy/Index Risk: A passive investment strategy seeking to track the performance of the Underlying Index may result in the fund holding securities regardless of market conditions or their current or projected performance. This could cause the Fund’s returns to be lower than if the Fund employed an active strategy.
Non-Diversified: The Fund is non-diversified and may be more susceptible to factors negatively impacting its holdings to the extent that each security represents a larger portion of the Fund’s assets.
No Guarantee: There is no guarantee that the Fund will meet its objective.
Prospectus: For additional information on risks, please see the Fund’s prospectus. The Fund may not be suitable for all investors.
Value of a $10,000 Investment Since Inception at Net Asset Value
The chart above represents historical performance of a hypothetical investment of $10,000 over the life of the Fund, assuming reinvestment of distributions. Past performance does not guarantee future results.
6
Management’s Discussion of Fund Performance (unaudited) (continued)
October 31, 2019
Virtus InfraCap U.S. Preferred Stock ETF
Management’s Discussion of Operations
Overview
Virtus InfraCap U.S. Preferred Stock ETF (the “Fund”) seeks current income and, secondarily, capital appreciation through an actively-managed portfolio of high quality, U.S. preferred stocks. Callable preferred securities exhibiting a low or negative yield to call are generally excluded from the portfolio. The Fund utilizes options strategies and modest leverage to enhance income and total return.
Update
The fiscal year ended October 31, 2019 was characterized by extraordinary volatility in interest rates. The Federal Reserve began the period with a rate hike in December 2018 and ended it with three consecutive rate cuts. Rates on 10-year and 30-year U.S. Treasury bonds plunged to historic lows and then rebounded modestly. The yield curve began the period with a modest upward slope, inverted briefly (depending on the measure), and then resumed a modest upward curve by year end.
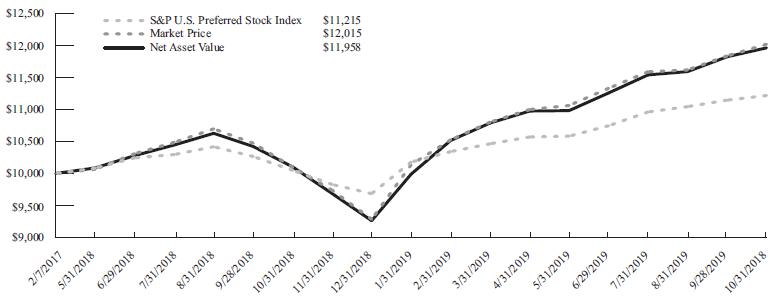
In the twelve months ending October 31, 2019, the Fund’s market value total return (NYSE price change plus dividends) was 18.97%. The total return on Net Asset Value (NAV) was 18.37%. The Fund’s benchmark index, the S&P U.S. Preferred Stock Index, earned a total return of 11.61% during this period.
Top performing preferred stocks for the fiscal year included Washington Prime Group 7½% Cumulative Preferred Series H, National General Holdings Corp. Deposit Shares Non-Cumulative Prf. Series B, and National General Holdings Corp. 7 ½% Deposit Shares Series C.
Washington Prime Group is a Real Estate Investment Trust with retail properties located in the Midwest, and National General Holdings Corporation provides personal and commercial insurance services to its customers. Investors may have found both issuers’ preferred shares to be more compelling and stable than their respective companies’ common shares.
Detractors from relative performance included Ashford Hospitality Trust Inc. 7.375% Pref Series G, Energy Transfer Operating LP, Cumulative Prf. Units Series D and Colony Capital 8.75% Cumulative Prf. Shares Series E.
Ashford Hospitality Trust Inc. is a Real Estate Investment Trust that invests in full service hotel properties. Shares of Ashford’s common and preferred issues were under pressure during the period as management addressed concerns of a slowdown in business travel and increased employee costs.
Energy Transfer Partners is a provider of midstream energy services. The company was under pressure during the period as was most of the energy sector.
Colony Capital is a diversified Real Estate Investment Trust. The company’s common and preferred shares underperformed similar issuers when some analysts questioned the complexity of the company’s balance sheet during the period.
The Fund’s portfolio composition emphasizes issuers that own long-lived assets that generate free cash flow. Preferred stocks issued by real estate investment trusts (REITs) and energy companies (primarily pipelines) comprised about 46% and 18.5% of the Fund’s total assets, respectively, at fiscal year-end. This compares to weightings of approximately 11% and 3% in the benchmark index. The Fund was underweight financial companies relative to the benchmark index (16% vs. 67% of total assets) but overweight mortgage REITs (24% vs. 4% of total assets). The Fund’s manager believes the high level of liquidity in the mortgage-backed securities market presents a more moderate risk profile than that of traditional bank issuers.
Approximately 37% of total assets were fixed-to-floating rate preferred stocks at fiscal year-end. This compares to almost 27% for the benchmark index. These securities have a fixed rate coupon at issue but become a floating rate security after a specified period of time, typically five or ten years after issuance. This structure provides investors with some protection from a rising rate environment while offering a higher current yield than that which is available on securities with coupon rates that float currently.
Dividend Payments
In the fiscal year ended October 31, 2019 the Fund made monthly dividend payments in the amount of $0.19 per share ($2.28 per year). The Fund plans to continue paying monthly dividends but dividends are not guaranteed.
The Fund’s dividend policy will be reviewed on an annual basis with the expectation that the announced dividend rate can be sustained for a period of 12 — 24 months. The Fund’s dividend is expected to be covered by its investment company taxable income (which includes ordinary income and short-term capital gains less expenses). For the purpose of calculating income available for distribution, some cash payments from REITs or MLPs treated as Return of Capital for tax or GAAP purposes may be included. Expenses include an 80 basis point advisory fee, leverage costs and other miscellaneous fees.
7
Management’s Discussion of Fund Performance (unaudited) (continued)
October 31, 2019
Virtus InfraCap U.S. Preferred Stock ETF (continued)
The Fund seeks to maintain relatively stable monthly distributions although the amount of income earned by the Fund varies from period-to-period. To achieve this objective, the Fund may from time-to-time distribute less than the full amount of income earned during a specific period, withholding some income for distribution in future periods. Consequently, the amount of income distributed in any one period may be more or less than the actual amount of income earned in that period.
The Fund’s current indicated yield based on its closing price on the New York Stock Exchange on October 31, 2019 ($26.57) was 8.58%. The Fund’s current indicated yield based on its Net Asset Value (NAV) per share ($26.43) was 8.62%.
Use of Leverage
As described in the Fund’s prospectus, the Fund may use modest leverage to help achieve its current income objective. The leverage ratio is expected to be maintained in a range of 10-35% of total assets over the long term. As of October 31, 2019, borrowing amounted to 17.4% of net asset value.
The Fund’s cost of borrowing fell during the fiscal year, and borrowed funds continued to generate an attractive positive spread. The Fund borrows at a 120 basis point premium to the 3-month LIBOR rate. The 3-month LIBOR rate fell to 1.90% at October 31, 2019 from 2.56% at October 31, 2018, and spreads ended the fiscal year modestly wider.
Use of Options
As described in the prospectus, the Fund utilizes options strategies to seek to boost the amount of income available to distribute to shareholders. The primary activity is covered call writing. The activity is focused on a small number of common stocks and ETFs owned by the Fund. The option strategy as implemented by the Fund’s manager was a net benefit to the Fund’s performance.
Outlook
The Fund’s manager believes the preferred stock asset class is inefficiently priced and offers active managers the opportunity to add to benchmark returns. Over the years, special emphasis will be placed on maximizing the Fund’s yield-to-call. The Fund’s manager believes that avoiding issues that are callable and trading at prices above the call price will help achieve that result. Many preferred stock investors, especially passive funds, ignore the risk of owning issues with a negative yield-to-call.
After collapsing to historic lows, long-term Treasury rates are starting to lift, as confidence in global economic growth builds. The Fund’s manager believes wide interest rate spreads over long-duration U.S. Treasury bonds offer substantial protection from rate rises. The correlation between Treasury bond price moves and price swings in preferred stocks is likely to be moderated by the wide spreads.
The Fund’s manager believes that rates for long-duration fixed income securities are likely capped at a low level by investor demand for yield. Long-term U.S. interest rates remain very attractive to global investors and the Fund’s manager believes U.S. inflation indicators suggest a hands-off approach by the Federal Reserve is likely. In a relatively stable interest rate environment, the Fund’s manager believes preferred stock investors should earn attractive risk-adjusted returns.
The preceding information is the opinion of the investment adviser and sub-adviser. Any such opinions are subject to change at any time based upon market or other conditions and should not be relied upon as investment advice. Statements of fact are from sources considered reliable, but the investment adviser and sub-adviser make no representation or warranty as to their completeness or accuracy. Past performance is no guarantee of future results, and there is no guarantee that market forecasts will be realized.
Performance as of 10/31/2019
| | | | Average Annual Total Return
|
| | | | Fund
Net Asset Value
| | Fund
Market Price
| | S&P U.S.
Preferred Stock
Index1
|
1 Year | | | | | 18.37 | % | | | 18.97 | % | | | 11.61 | % |
Since Inception2 | | | | | 13.00 | % | | | 13.37 | % | | | 8.15 | % |
| 1 | | The S&P U.S. Preferred Stock Index measures performance of the U.S. preferred stock market. Preferred stocks pay dividends at a specified rate and receive preference over common stocks in terms of dividend payments and liquidation of assets. The index is calculated on a total return basis with dividend reinvested. The index is unmanaged, its returns do not reflect any fees, expenses, or sales charges, and is not available for direct investment. |
8
Management’s Discussion of Fund Performance (unaudited) (continued)
October 31, 2019
Virtus InfraCap U.S. Preferred Stock ETF (continued)
Performance data quoted represents past performance and past performance does not guarantee future results. Investment return and principal value of an investment will fluctuate so that an investor’s shares, when sold or redeemed, may be worth more or less than the original cost. Current performance data may be higher or lower than actual data quoted. Returns do not reflect the deduction of taxes a shareholder would pay on Fund distributions or the redemption of Fund shares. For the most current month-end performance data please visit www.virtusetfs.com or call toll free (800) 243-4361. Market price returns are based on the mid-point of the highest bid and lowest offer for Fund shares as of the scheduled close of regular trading on the New York Stock Exchange Arca (“NYSE”), ordinarily 4:00 p.m. Eastern time, on each day during which the NYSE is open for trading, and do not represent the returns an investor would receive if shares were traded at other times.
Exchange Traded Funds: The value of an ETF may be more volatile than the underlying portfolio of securities the ETF is designed to track. The costs of owning the ETF may exceed the cost of investing directly in the underlying securities.
Market Price/NAV: Shares of ETFs often trade at a discount to their net asset value, which may increase investors’ risk of loss. At the time of sale, an investor’s shares may have a market price that is above or below the Fund’s NAV.
Preferred Stocks: Preferred stocks may decline in price, fail to pay dividends, or be illiquid.
Leverage: When a fund leverages its portfolio, the value of its shares may be more volatile and all other risks may be compounded.
Derivatives: Investments in derivatives such as futures, options, forwards, and swaps may increase volatility or cause a loss greater than the principal investment.
Sector Focus: To the extent the Fund has significant exposure to one or more sectors, this may make the Fund particularly susceptible to adverse economic, political or regulatory occurrences and changes affecting companies in those sectors.
Non-Diversified: The Fund is non-diversified and may be more susceptible to factors negatively impacting its holdings to the extent that each security represents a larger portion of the Fund’s assets.
No Guarantee: There is no guarantee that the Fund will meet its objective.
Prospectus: For additional information on risks, please see the Fund’s prospectus. The Fund may not be suitable for all investors.
Value of a $10,000 Investment Since Inception at Net Asset Value
The chart above represents historical performance of a hypothetical investment of $10,000 over the life of the Fund, assuming reinvestment of distributions. Past performance does not guarantee future results.
9
Management’s Discussion of Fund Performance (unaudited) (continued)
October 31, 2019
Virtus LifeSci Biotech Clinical Trials ETF
The Virtus LifeSci Biotech Clinical Trials ETF (the “Fund”) seeks to track the LifeSci Biotechnology Clinical Trials Index (the “Index”), which provides passive exposure to U.S.-listed biotechnology stocks with a lead drug in the clinical trial stage of development.
For the fiscal year ended October 31, 2019, the Fund returned -1.67%, compared with the Index return of -1.25%.
Top performing stocks for the fiscal year included Allakos, Inc., which is involved in the development of therapeutic antibodies. The company’s shares doubled after it successfully completed its Phase 2 study for its eosinophil and mast cell antibody. Other positive contributors included Karyopharm Therapeutics, which focuses on the research and development of medicines to treat cancers, and Alder Biopharmaceuticals which is being acquired for $18 per share in cash by Danish Company Lundbeck LLC. The Fund sold its stock in Alder during the fiscal year. Iovance Biotherapuetics, which is involved in the development and commercialization of cancer immunotherapy products, also benefited relative performance. Rounding out the top contributors for the fiscal year were ArQule Inc., which focuses on the research and development of therapeutics to treat cancers and rare diseases, and Amyris Inc., an industrial biotechnology company.
Detractors from relative performance included Akebia Therapeutics, which engages in the development and commercialization of therapeutics for patients with kidney disease. Savara, Inc., a specialty pharmaceutical company involved in the development of serious respiratory diseases, detracted from relative returns. Novavax Inc., which develops vaccines to prevent viral infections, was a poor contributor to performance. The Fund sold its stock in both Savara, Inc. and Novavax Inc. during the fiscal year. Other negative contributors during the period were Adverum Biotechnologies, Inc., a clinical stage company that develops gene therapies for ophthalmic diseases, and KalVista Pharmaceuticals Inc., which produces small molecule protease inhibitors for hereditary angioedema (HAE) and diabetic macular edema (DME).
The preceding information is the opinion of the investment adviser. Any such opinions are subject to change at any time based upon market or other conditions and should not be relied upon as investment advice. Statements of fact are from sources considered reliable, but the investment adviser makes no representation or warranty as to their completeness or accuracy. Past performance is no guarantee of future results, and there is no guarantee that market forecasts will be realized.
Performance as of 10/31/2019
| | | | Average Annual Total Return
|
| | | | Fund
Net Asset Value
| | Fund
Market Price
| | LifeSci Biotechnology
Clinical Trials Index1
| | S&P 500®Index2
|
1 Year | | | | | (1.67 | )% | | | (1.75 | )% | | | (1.25 | )% | | | 14.33 | % |
Since Inception3 | | | | | 1.47 | % | | | 1.45 | % | | | 1.98 | % | | | 11.51 | % |
| 1 | | The LifeSci Biotechnology Clinical Trials Index is designed to track the performance of U.S.-listed biotechnology stocks with a lead drug in the clinical trial stage of development, typically a Phase 1, Phase 2 or Phase 3 trial, but prior to receiving marketing approval. The index is unmanaged, its returns do not reflect any fees, expenses, or sales charges, and is not available for direct investment. |
| 2 | | The S&P 500®Index is a free-float market capitalization-weighted index of 500 of the largest U.S. companies. The index is calculated on a total return basis with dividends reinvested. The index is unmanaged, its returns do not reflect any fees, expenses, or sales charges, and is not available for direct investment. |
Performance data quoted represents past performance and past performance does not guarantee future results. Investment return and principal value of an investment will fluctuate so that an investor’s shares, when sold or redeemed, may be worth more or less than the original cost. Current performance data may be higher or lower than actual data quoted. Returns do not reflect the deduction of taxes a shareholder would pay on Fund distributions or the redemption of Fund shares. For the most current month-end performance data please visit www.virtusetfs.com or call toll free (800) 243-4361. Market price returns are based on the mid-point of the highest bid and lowest offer for Fund shares as of the scheduled close of regular trading on the New York Stock Exchange Arca (“NYSE”), ordinarily 4:00 p.m. Eastern time, on each day during which the NYSE is open for trading, and do not represent the returns an investor would receive if shares were traded at other times.
Exchange Traded Funds: The value of an ETF may be more volatile than the underlying portfolio of securities the ETF is designed to track. The costs of owning the ETF may exceed the cost of investing directly in the underlying securities.
Market Price/NAV: Shares of ETFs often trade at a discount to their net asset value, which may increase investors’ risk of loss. At the time of sale, an investor’s shares may have a market price that is above or below the Fund’s NAV.
10
Management’s Discussion of Fund Performance (unaudited) (continued)
October 31, 2019
Virtus LifeSci Biotech Clinical Trials ETF (continued)
Biotechnology Industry Risk: The Fund’s assets will be concentrated in investments in the securities of issuers engaged primarily in the biotechnology industry. Companies within the biotechnology industry spend heavily on research and development, which may not necessarily lead to commercially successful products in the near or long term. In order to fund operations, these companies may require financing from the capital markets, which may not always be available on satisfactory terms or at all. The biotechnology industry is also subject to significant governmental regulation, and the need for governmental approvals, including, without limitation, FDA approval. The securities of biotechnology companies, especially those of smaller or newer companies, tend to be more volatile than those of companies with larger capitalizations or markets generally.
Industry/Sector Concentration: A fund that focuses its investments in a particular industry or sector will be more sensitive to conditions that affect that industry or sector than a non-concentrated fund.
Correlation to Index: The performance of the Fund and its index may vary somewhat due to factors such as Fund flows, transaction costs, and timing differences associated with additions to and deletions from its index.
No Guarantee: There is no guarantee that the Fund will meet its objective.
Prospectus: For additional information on risks, please see the Fund’s prospectus. The Fund may not be suitable for all investors.
Value of a $10,000 Investment Since Inception at Net Asset Value
The chart above represents historical performance of a hypothetical investment of $10,000 over the life of the Fund, assuming reinvestment of distributions. Past performance does not guarantee future results.
11
Management’s Discussion of Fund Performance (unaudited) (continued)
October 31, 2019
Virtus LifeSci Biotech Products ETF
The Virtus LifeSci Biotech Products ETF (the “Fund”) seeks to track the LifeSci Biotechnology Products Index (the “Index”), which provides passive exposure to U.S.-listed biotechnology stocks with at least one drug therapy approved by the U.S. Food & Drug Administration (“FDA”) for marketing.
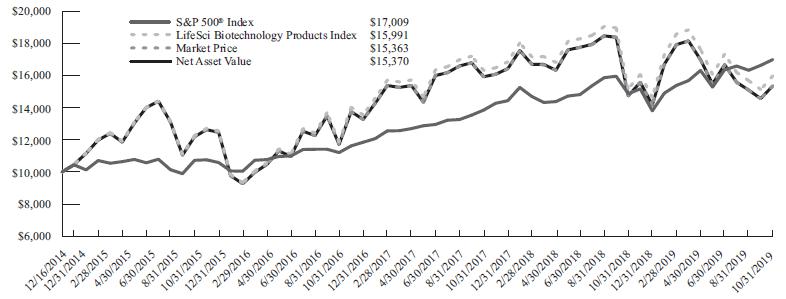
For the fiscal year ended October 31, 2019, the Fund returned 4.22%, compared with the Index return of 5.32%.
The biggest driver of return for the Fund during the fiscal year was mergers & acquisitions (M&A) activity, particularly among firms in the oncology space. The top contributors to performance included Array BioPharma Inc., which was acquired by Pfizer during the fiscal year, and ACADIA Pharmaceuticals, which addresses central nervous system disorders. The Fund sold its stock in Array during the fiscal year. Other leading performers were Seattle Genetics, which develops antibody drugs for lymphoma, and The Medicines Co., which is a biopharmaceutical company focused on combatting atherosclerosis and cardiovascular disease.
Detractors from relative performance included Sarepta Therapeutics, which is involved in the development of ribonucleic acid, gene therapy, and gene editing. Clovis Oncology, which develops medicines to treat cancer and diagnostics tools to enhance development, also performed poorly during the fiscal year. Intercept Pharmaceuticals, Inc., which is involved in nonalcoholic steatohepatitis (NASH) therapies which treat chronic liver diseases, detracted from performance.
The preceding information is the opinion of the investment adviser. Any such opinions are subject to change at any time based upon market or other conditions and should not be relied upon as investment advice. Statements of fact are from sources considered reliable, but the investment adviser makes no representation or warranty as to their completeness or accuracy. Past performance is no guarantee of future results, and there is no guarantee that market forecasts will be realized.
Performance as of 10/31/2019
| | | | Average Annual Total Return
|
| | | | Fund
Net Asset Value
| | Fund
Market Price
| | LifeSci Biotechnology
Products Index1
| | S&P 500®Index2
|
1 Year | | | | | 4.22 | % | | | 4.21 | % | | | 5.32 | % | | | 14.33 | % |
Since Inception3 | | | | | 9.21 | % | | | 9.20 | % | | | 10.10 | % | | | 11.51 | % |
| 1 | | The LifeSci Biotechnology Products Index is designed to track the performance of U.S.-listed biotechnology stocks with at least one drug therapy approved by the FDA for marketing. The index is unmanaged, its returns do not reflect any fees, expenses, or sales charges, and is not available for direct investment. |
| 2 | | The S&P 500®Index is a free-float market capitalization-weighted index of 500 of the largest U.S. companies. The index is calculated on a total return basis with dividends reinvested. The index is unmanaged, its returns do not reflect any fees, expenses, or sales charges, and is not available for direct investment. |
Performance data quoted represents past performance and past performance does not guarantee future results. Investment return and principal value of an investment will fluctuate so that an investor’s shares, when sold or redeemed, may be worth more or less than the original cost. Current performance data may be higher or lower than actual data quoted. Returns do not reflect the deduction of taxes a shareholder would pay on Fund distributions or the redemption of Fund shares. For the most current month-end performance data please visit www.virtusetfs.com or call toll free (800) 243-4361. Market price returns are based on the mid-point of the highest bid and lowest offer for Fund shares as of the scheduled close of regular trading on the New York Stock Exchange Arca (“NYSE”), ordinarily 4:00 p.m. Eastern time, on each day during which the NYSE is open for trading, and do not represent the returns an investor would receive if shares were traded at other times.
Exchange Traded Funds: The value of an ETF may be more volatile than the underlying portfolio of securities the ETF is designed to track. The costs of owning the ETF may exceed the cost of investing directly in the underlying securities.
Market Price/NAV: Shares of ETFs often trade at a discount to their net asset value, which may increase investors’ risk of loss. At the time of sale, an investor’s shares may have a market price that is above or below the Fund’s NAV.
12
Management’s Discussion of Fund Performance (unaudited) (continued)
October 31, 2019
Virtus LifeSci Biotech Products ETF (continued)
Biotechnology Industry Risk: The Fund’s assets will be concentrated in investments in the securities of issuers engaged primarily in the biotechnology industry. Companies within the biotechnology industry spend heavily on research and development, which may not necessarily lead to commercially successful products in the near or long term. In order to fund operations, these companies may require financing from the capital markets, which may not always be available on satisfactory terms or at all. The biotechnology industry is also subject to significant governmental regulation, and the need for governmental approvals, including, without limitation, FDA approval. The securities of biotechnology companies, especially those of smaller or newer companies, tend to be more volatile than those of companies with larger capitalizations or markets generally.
Industry/Sector Concentration: A fund that focuses its investments in a particular industry or sector will be more sensitive to conditions that affect that industry or sector than a non-concentrated fund.
Correlation to Index: The performance of the Fund and its index may vary somewhat due to factors such as Fund flows, transaction costs, and timing differences associated with additions to and deletions from its index.
No Guarantee: There is no guarantee that the Fund will meet its objective.
Prospectus: For additional information on risks, please see the Fund’s prospectus. The Fund may not be suitable for all investors.
Value of a $10,000 Investment Since Inception at Net Asset Value
The chart above represents historical performance of a hypothetical investment of $10,000 over the life of the Fund, assuming reinvestment of distributions. Past performance does not guarantee future results.
13
Management’s Discussion of Fund Performance (unaudited) (continued)
October 31, 2019
Virtus Newfleet Multi-Sector Bond ETF
The Virtus Newfleet Multi-Sector Bond ETF (the “Fund”) seeks to provide a high level of current income and, secondarily, capital appreciation.
How did the markets perform during the Fund’s fiscal year ended October 31, 2019?
The 12-month period included multiple challenges, including bouts of elevated volatility. The final quarter of 2018 witnessed a meaningful mispricing of risk assets. This was especially pronounced in December 2018. Fixed income investors, like all market participants, continued to wrestle with volatility brought on by geopolitical developments, trade rhetoric, mixed global economic signals, and central banks’ attempts to normalize monetary policy via policy rate increases and balance sheet adjustments. U.S. economic data stayed on a positive trend, which contrasted with other global economies. During this time, U.S. Treasuries performed well while spread sector performance was mixed. Sectors within the securitized products universe, such as asset-backed securities and residential mortgage-backed securities, generally outperformed, whereas corporate and emerging markets-related sectors lagged. Within most spread sectors, assets with short and intermediate duration and those with higher credit ratings outperformed on a total return basis. The high yield sector was the largest underperformer during the fourth quarter of 2018.
The year 2019 began in stark contrast to how 2018 ended. While many of the same concerns loomed, major global central banks, including the Federal Reserve (the Fed) and the European Central Bank (ECB), reacted to slowing economic activity and tame inflation by pivoting their tone and policy toward easing. This significant development, combined with improved valuations, led investors to favor risk assets. Most spread sectors outperformed through October 2019, led by investment grade corporates, corporate high yield, and emerging markets. Within spread sectors, the asset classes that were hardest hit in late 2018 outperformed during the first 10 months of 2019. Given the change in U.S. interest rates, longer duration within most asset classes outperformed on a total return basis. Securitized sectors, while still positive, lagged other sectors.
At its December 2018 meeting, the Fed raised its target range to 2.25% to 2.50%, up from 2.00% to 2.25%. The Fed, indicating a pivot toward easing of monetary policy early in 2019, signaled that rates are likely on hold for the balance of 2019. The Fed also announced changes to the management of its balance sheet. However, in early June 2019 the Chairman of the Fed indicated they are monitoring the impact of the tariff issues on the U.S. economic outlook, which was interpreted by the market that the Fed had opened the door to the rate cut discussion. The Fed subsequently lowered its target rate at the July, September, and October 2019 meetings to a range of 1.50-1.75%. The Fed continued through the end of the fiscal year to reinforce its view that current policy is appropriate and that it will continue to act to support the economic expansion.
The Treasury yield curve continued to twist and shift broadly flatter and lower during the 12 months ended October 31, 2019, and some segments of the U.S. yield curve remained inverted.
What factors affected the Fund’s performance during its fiscal year?
The outperformance of most spread sectors relative to U.S. Treasuries and agency mortgage-backed securities was the key driver of the Fund’s performance for the fiscal year ended October 31, 2019. Among fixed income sectors, the Fund’s allocations to and issue selection within the corporate high quality, yankee high quality, and emerging markets high yield sectors had a positive impact on performance for the fiscal year.
The Fund’s overall shorter duration relative to the benchmark hurt performance from a total return perspective. During the fiscal year, the Fund’s allocations to high yield bank loans and corporate high yield were the largest detractors from relative performance. Asset-backed and non-agency residential mortgage-backed securities in which the Fund invested also underperformed, given the shorter duration of these sectors during a period when rates were declining, thus detracting from the Fund’s performance.
The preceding information is the opinion of the investment adviser and sub-adviser. Any such opinions are subject to change at any time based upon market or other conditions and should not be relied upon as investment advice. Statements of fact are from sources considered reliable, but the investment adviser and sub-adviser make no representation or warranty as to their completeness or accuracy. Past performance is no guarantee of future results, and there is no guarantee that market forecasts will be realized.
Performance as of 10/31/2019
| | | | Average Annual Total Return
| |
| | | | Fund
Net Asset Value
| | Fund
Market Price
| | Bloomberg Barclays
U.S. Aggregate
Bond Index1
|
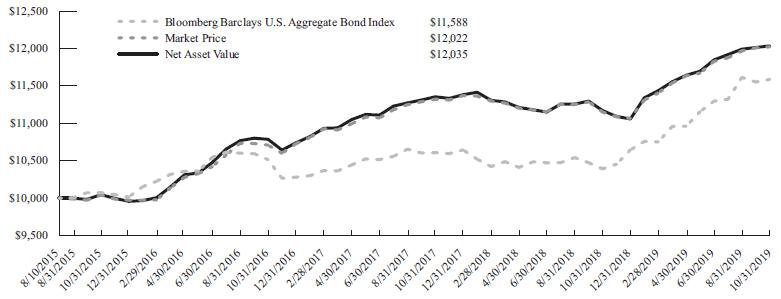
1 Year | | | | | 7.74 | % | | | 7.82 | % | | | 11.51 | % |
Since Inception2 | | | | | 4.48 | % | | | 4.45 | % | | | 3.55 | % |
| 1 | | The Bloomberg Barclays U.S. Aggregate Bond Index measures the U.S. investment grade fixed rate bond market. The index is calculated on a total return basis. The index is unmanaged, its returns do not reflect any fees, expenses, or sales charges, and is not available for direct investment. |
14
Management’s Discussion of Fund Performance (unaudited) (continued)
October 31, 2019
Virtus Newfleet Multi-Sector Bond ETF (continued)
Performance data quoted represents past performance and past performance does not guarantee future results. Investment return and principal value of an investment will fluctuate so that an investor’s shares, when sold or redeemed, may be worth more or less than the original cost. Current performance data may be higher or lower than actual data quoted. Returns do not reflect the deduction of taxes a shareholder would pay on Fund distributions or the redemption of Fund shares. For the most current month-end performance data please visitwww.virtusetfs.comor call toll free (800) 243-4361. Market price returns are based on the mid-point of the highest bid and lowest offer for Fund shares as of the scheduled close of regular trading on the New York Stock Exchange Arca (“NYSE”), ordinarily 4:00 p.m. Eastern time, on each day during which the NYSE is open for trading, and do not represent the returns an investor would receive if shares were traded at other times.
Credit & Interest: Debt securities are subject to various risks, the most prominent of which are credit and interest rate risk. The issuer of a debt security may fail to make interest and/or principal payments. Values of debt securities may rise or fall in response to changes in interest rates, and this risk may be enhanced with longer-term maturities.
High Yield-High Risk Fixed Income Securities: There is a greater level of credit risk and price volatility involved with high yield securities than investment grade securities.
Foreign & Emerging Markets: Investing internationally, especially in emerging markets, involves additional risks such as currency, political, accounting, economic, and market risk.
Bank Loans: Loans may be unsecured or not fully collateralized, may be subject to restrictions on resale and/or trade infrequently on the secondary market. Loans can carry significant credit and call risk, can be difficult to value and have longer settlement times than other investments, which can make loans relatively illiquid at times.
ABS/MBS: Changes in interest rates can cause both extension and prepayment risks for asset- and mortgage-backed securities. These securities are also subject to risks associated with the repayment of underlying collateral.
Market Price/NAV: Shares of ETFs often trade at a discount to their net asset value, which may increase investors’ risk of loss. At the time of sale, an investor’s shares may have a market price that is above or below the Fund’s NAV.
Prospectus: For additional information on risks, please see the Fund’s prospectus. The Fund may not be suitable for all investors.
Value of a $10,000 Investment Since Inception at Net Asset Value
The chart above represents historical performance of a hypothetical investment of $10,000 over the life of the Fund, assuming reinvestment of distributions. Past performance does not guarantee future results.
15
Management’s Discussion of Fund Performance (unaudited) (continued)
October 31, 2019
Virtus Private Credit Strategy ETF
The Virtus Private Credit Strategy ETF (the “Fund”) strives to deliver an alternative source of yield to traditional fixed income by focusing on the private credit market, particularly companies involved in lending to non-investment grade, small- to mid-sized U.S. companies.
The Fund seeks to track the Indxx Private Credit Index (the “Index”), which provides passive exposure to U.S.-listed instruments that emphasize private credit, including business development companies (“BDCs”) and closed-end funds (“CEFs”).
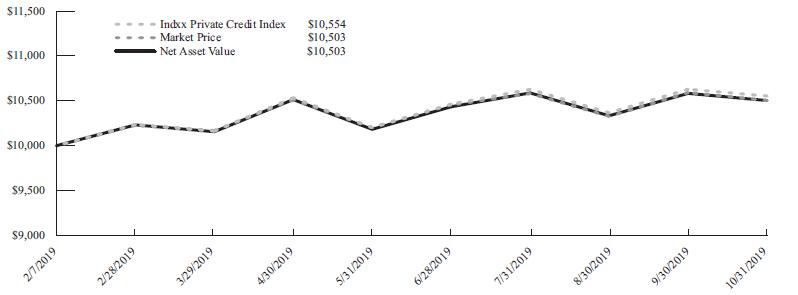
For the fiscal period from the Fund’s inception on February 7, 2019, through October 31, 2019, the Fund returned 5.03%, compared with the Index return of 5.54%. The Fund paid a distribution of $1.38 to shareholders during the period.
The best performing groups for the Fund during the fiscal period were BDCs that are involved in debt and equity financing to lower middle-market companies. These included Main Street Capital Corporation and Gladstone Investment Corp. TriplePoint Venture Growth BDC, which focuses on providing financing to companies at the venture growth stage (typically technology, life sciences, and higher growth industries), was another top contributor.
Detractors from relative performance included BDCs primarily involved in both loans and equity investments to middle market companies. These included Blackrock Capital Investment Corp. and Investcorp Credit Management. MCC Capital Partners was another BDC that detracted from performance due to a long merger period with Sierra Income Corp. The Fund sold its stock in MCC Capital Partners during the fiscal year.
The preceding information is the opinion of the investment adviser. Any such opinions are subject to change at any time based upon market or other conditions and should not be relied upon as investment advice. Statements of fact are from sources considered reliable, but the investment adviser makes no representation or warranty as to their completeness or accuracy. Past performance is no guarantee of future results, and there is no guarantee that market forecasts will be realized.
Performance as of 10/31/2019
| | | | Cumulative Total Return
|
| | | | Fund
Net Asset Value
| | Fund
Market Price
| | Index Private
Credit Index1
|
Since Inception2 | | | | | 5.03 | % | | | 5.03 | % | | | 5.54 | % |
| 1 | | The Indxx Private Credit Index is an index of listed BDCs and CEFs with a private credit focus. The Index is designed to serve as a broad-based benchmark for long-only investments in private credit. The Index is unmanaged, its returns do not reflect any fees, expenses, or sales charges, and is not available for direct investment. |
Performance data quoted represents past performance and past performance does not guarantee future results. Investment return and principal value of an investment will fluctuate so that an investor’s shares, when sold or redeemed, may be worth more or less than the original cost. Current performance data may be higher or lower than actual data quoted. Returns do not reflect the deduction of taxes a shareholder would pay on Fund distributions or the redemption of Fund shares. For the most current month-end performance data please visit www.virtusetfs.com or call toll free (800) 243-4361. Market price returns are based on the mid-point of the highest bid and lowest offer for Fund shares as of the scheduled close of regular trading on the New York Stock Exchange Arca (“NYSE”), ordinarily 4:00 p.m. Eastern time, on each day during which the NYSE is open for trading, and do not represent the returns an investor would receive if shares were traded at other times.
Exchange Traded Funds: The value of an ETF may be more volatile than the underlying portfolio of securities the ETF is designed to track. The costs of owning the ETF may exceed the cost of investing directly in the underlying securities.
Market Price/NAV: Shares of ETFs often trade at a discount to their net asset value, which may increase investors’ risk of loss. At the time of sale, an investor’s shares may have a market price that is above or below the Fund’s NAV.
Private Credit Funds: Private credit funds that invest in closed-end funds and business development companies bear the risk of these underlying assets, including liquidity, industry, currency, valuation and credit risks.
Equity Securities: The market price of equity securities may be adversely affected by financial market, industry, or issuer-specific events. Focus on a particular style or on small or medium-sized companies may enhance that risk.
Non-Diversified: The Fund is non-diversified and may be more susceptible to factors negatively impacting its holdings to the extent that each security represents a larger portion of the Fund’s assets.
16
Management’s Discussion of Fund Performance (unaudited) (continued)
October 31, 2019
Virtus Private Credit Strategy ETF (continued)
Credit & Interest: Debt securities are subject to various risks, the most prominent of which are credit and interest rate risk. The issuer of a debt security may fail to make interest and/or principal payments. Values of debt securities may rise or fall in response to changes in interest rates, and this risk may be enhanced with longer-term maturities.
High Yield-High Risk Fixed Income Securities: There is a greater level of credit risk and price volatility involved with high yield securities than investment grade securities.
Fund of Funds: Because the fund can invest in other funds, it indirectly bears its proportionate share of the operating expenses and management fees of the underlying fund(s).
Passive Strategy/Index Risk: A passive investment strategy seeking to track the performance of the Underlying Index may result in the fund holding securities regardless of market conditions or their current or projected performance. This could cause the Fund’s returns to be lower than if the Fund employed an active strategy.
Correlation to Index: The performance of the Fund and its index may vary somewhat due to factors such as Fund flows, transaction costs, and timing differences associated with additions to and deletions from its index.
Closed-End Funds: Closed-end funds may trade at a discount from their net asset values, which may affect whether the fund will realize gains or losses. They may also employ leverage, which may increase volatility.
Prospectus: For additional information on risks, please see the Fund’s prospectus. The Fund may not be suitable for all investors.
Value of a $10,000 Investment Since Inception at Net Asset Value
The chart above represents historical performance of a hypothetical investment of $10,000 over the life of the Fund, assuming reinvestment of distributions. Past performance does not guarantee future results.
17
Management’s Discussion of Fund Performance (unaudited) (continued)
October 31, 2019
Virtus Real Asset Income ETF
The Virtus Real Asset Income ETF (the “Fund”) aims to provide passive exposure to high income-producing real asset securities. The Fund seeks to track the Indxx Real Asset Income Index (the “Index”), which is comprised of U.S.-listed securities with a history of dividend growth across three real asset categories:
• | | real estate, including real estate development and real estate investment trusts (“REITs”); |
• | | natural resources, including oil, metals, farmland, and forestry companies; and |
• | | infrastructure, including utilities, telecoms, and master limited partnerships (“MLPs”). |
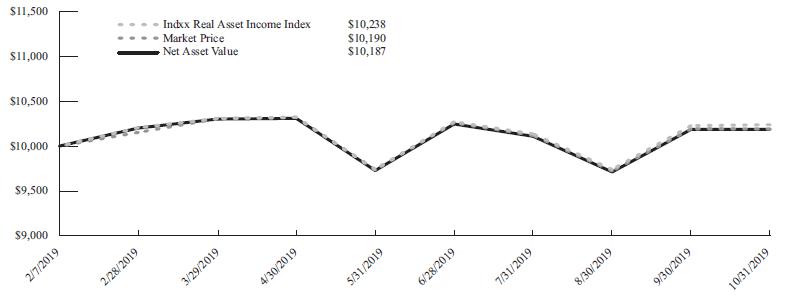
For the fiscal period from the Fund’s inception on February 7, 2019, through October 31, 2019, the Fund returned 1.87%, compared with the Index return of 2.38%. The Fund paid a distribution of $0.53 to shareholders during the period.
The best performing groups for the Fund during the fiscal period included REITs, electric utilities, and oil & gas pipelines. Top stocks included Community Healthcare Trust, which engages in the acquisition of real estate properties that are leased to hospitals and healthcare systems. Reliance Steel & Aluminum Co., the largest metals distributor in North America, was another leading contributor, due to its strong free cash flow and organic growth. Air Products and Chemicals, Inc., a specialty chemical company that manufactures and distributes atmospheric gases, also contributed to the Fund’s relative returns.
Detractors from relative performance included RPC, Inc., which faced pressure in its fracturing business and reduced its dividend. Telecom Argentina, which sold off in sympathy with Argentina and the telecom sector, detracted from returns. Another negative contributor was Sociedad Quimica y Minera de Chile S.A., which engages in the production and distribution of fertilizers, potassium nitrate, iodine, and lithium chemicals.
The preceding information is the opinion of the investment adviser. Any such opinions are subject to change at any time based upon market or other conditions and should not be relied upon as investment advice. Statements of fact are from sources considered reliable, but the investment adviser makes no representation or warranty as to their completeness or accuracy. Past performance is no guarantee of future results, and there is no guarantee that market forecasts will be realized.
Performance as of 10/31/2019
| | | | Cumulative Total Return
|
| | | | Fund
Net Asset Value
| | Fund
Market Price
| | Index Real Asset
Income Index1
|
Since Inception2 | | | | | 1.87 | % | | | 1.90 | % | | | 2.38 | % |
| 1 | | The Indxx Real Asset Income Index tracks the performance of US-listed securities in the Real Asset space (Real Estate, Natural Resources and Infrastructure) emphasizing dividend growth. The Index is unmanaged, its returns do not reflect any fees, expenses, or sales charges, and is not available for direct investment. |
Performance data quoted represents past performance and past performance does not guarantee future results. Investment return and principal value of an investment will fluctuate so that an investor’s shares, when sold or redeemed, may be worth more or less than the original cost. Current performance data may be higher or lower than actual data quoted. Returns do not reflect the deduction of taxes a shareholder would pay on Fund distributions or the redemption of Fund shares. For the most current month-end performance data please visit www.virtusetfs.com or call toll free (800) 243-4361. Market price returns are based on the mid-point of the highest bid and lowest offer for Fund shares as of the scheduled close of regular trading on the New York Stock Exchange Arca (“NYSE”), ordinarily 4:00 p.m. Eastern time, on each day during which the NYSE is open for trading, and do not represent the returns an investor would receive if shares were traded at other times.
Exchange Traded Funds: The value of an ETF may be more volatile than the underlying portfolio of securities the ETF is designed to track. The costs of owning the ETF may exceed the cost of investing directly in the underlying securities.
Market Price/NAV: Shares of ETFs often trade at a discount to their net asset value, which may increase investors’ risk of loss. At the time of sale, an investor’s shares may have a market price that is above or below the Fund’s NAV.
Equity Securities: The market price of equity securities may be adversely affected by financial market, industry, or issuer-specific events. Focus on a particular style or on small or medium-sized companies may enhance that risk.
18
Management’s Discussion of Fund Performance (unaudited) (continued)
October 31, 2019
Virtus Real Asset Income ETF (continued)
Equity REITs: The Fund may be negatively affected by factors specific to the real estate market, including interest rates, leverage, property, and management.
Non-Diversified: The Fund is non-diversified and may be more susceptible to factors negatively impacting its holdings to the extent that each security represents a larger portion of the Fund’s assets.
Infrastructure: A fund that focuses its investments in infrastructure-related companies will be more sensitive to conditions affecting their business or operations.
MLPs: Investments in Master Limited Partnerships may be adversely impacted by tax law changes, regulation, or factors affecting underlying assets.
Passive Strategy/Index Risk: A passive investment strategy seeking to track the performance of the Underlying Index may result in the fund holding securities regardless of market conditions or their current or projected performance. This could cause the Fund’s returns to be lower than if the Fund employed an active strategy.
Correlation to Index: The performance of the Fund and its index may vary somewhat due to factors such as Fund flows, transaction costs, and timing differences associated with additions to and deletions from its index.
Prospectus: For additional information on risks, please see the Fund’s prospectus. The Fund may not be suitable for all investors.
Value of a $10,000 Investment Since Inception at Net Asset Value
The chart above represents historical performance of a hypothetical investment of $10,000 over the life of the Fund, assuming reinvestment of distributions. Past performance does not guarantee future results.
19
Management’s Discussion of Fund Performance (unaudited) (continued)
October 31, 2019
Virtus WMC Global Factor Opportunities ETF
The Virtus WMC Global Factor Opportunities ETF (the “Fund”) (NYSE: VGFO) is an actively managed ETF that employs a dynamic, global multi-factor strategy that combines a quantitative investment approach with active management. Wellington Management’s proprietary value1, momentum2, and quality3 factors are used to drive stock selection generally within four distinct world regions—the U.S., Japan, Europe, and Emerging Markets—to create a diversified portfolio which seeks to adapt to changes in the risk environment.
Global equities rose over the trailing twelve-month period ended October 31, 2019, as measured by the MSCI All Country World Index. While U.S. equities led global markets during the period, Europe, Japan, and Emerging Market equities all posted positive gains. Across developed markets, a risk-off sentiment dominated as risk-aversion factors such as low volatility and expressions of quality outperformed other factor classes. Factor behavior was more varied in Emerging Markets, where trend-following factors such as momentum and growth led markets alongside expressions of quality. This occurred as investors grappled with ongoing macro uncertainties including slowing global growth and ongoing trade disputes between the United States and its trading partners.
During the fiscal year ended October 31, 2019, the Fund’s NAV increased by 11.32%, underperforming its benchmark, the MSCI All Country World Index (Net), which rose by 12.59%. Each of the four regions underperformed their respective benchmarks, however positioning in the United States was the most significant detractor.
Across each of the four regions, the portfolio’s exposure to value names detracted. While this exposure was a headwind across the portfolio, the types of companies that the value factor selected differed by geography. In the United States, for example, the factor allocated to underperforming Consumer Discretionary stocks including Macy’s and Kohl’s, which detracted most. The Fund sold its stock in Macy’s during the fiscal year. In Emerging Markets, the value factor’s Energy exposure was a headwind as it was both overweight the sector and owned underperforming names such as China Petroleum & Chemical Corp. which also detracted from the Fund’s relative performance.
The preceding information is the opinion of the investment adviser and sub-adviser. Any such opinions are subject to change at any time based upon market or other conditions and should not be relied upon as investment advice. Statements of fact are from sources considered reliable, but the investment adviser and sub-adviser make no representation or warranty as to their completeness or accuracy. Past performance is no guarantee of future results, and there is no guarantee that market forecasts will be realized.
| 1 | | Value factor is defined as one that captures the extent to which a stock is priced inexpensively in the market. |
| 2 | | Momentum factor is defined as one that captures sustained relative performance. |
| 3 | | Quality factor is defined as one based on low volatility. |
Performance as of 10/31/2019
| | | | Average Annual Total Return
|
| | | | Fund
Net Asset Value
| | Fund
Market Price
| | MSCI All Country
World Index (net)1
|
1 Year | | | | | 10.60 | % | | | 10.75 | % | | | 12.59 | % |
Since Inception2 | | | | | 5.16 | % | | | 5.33 | % | | | 6.06 | % |
| 1 | | The MSCI All Country World Index (net) is a free float-adjusted market capitalization-weighted index that measures equity performance of developed and emerging markets. The index is calculated on a total return basis with net dividends reinvested. The index is unmanaged, its returns do not reflect any fees, expenses, or sales charges, and is not available for direct investment. |
Performance data quoted represents past performance and past performance does not guarantee future results. Investment return and principal value of an investment will fluctuate so that an investor’s shares, when sold or redeemed, may be worth more or less than the original cost. Current performance data may be higher or lower than actual data quoted. Returns do not reflect the deduction of taxes a shareholder would pay on Fund distributions or the redemption of Fund shares. For the most current month-end performance data please visit www.virtusetfs.com or call toll free (800) 243-4361. Market price returns are based on the mid-point of the highest bid and lowest offer for Fund shares as of the scheduled close of regular trading on the New York Stock Exchange Arca (“NYSE”), ordinarily 4:00 p.m. Eastern time, on each day during which the NYSE is open for trading, and do not represent the returns an investor would receive if shares were traded at other times.
Exchange Traded Funds: The value of an ETF may be more volatile than the underlying portfolio of securities the ETF is designed to track. The costs of owning the ETF may exceed the cost of investing directly in the underlying securities.
Market Price/NAV: Shares of ETFs often trade at a discount to their net asset value, which may increase investors’ risk of loss. At the time of sale, an investor’s shares may have a market price that is above or below the Fund’s NAV.
20
Management’s Discussion of Fund Performance (unaudited) (continued)
October 31, 2019
Virtus WMC Global Factor Opportunities ETF (continued)
Equity Securities: The market price of equity securities may be adversely affected by financial market, industry, or issuer-specific events. Focus on a particular style or on small or medium-sized companies may enhance that risk.
Foreign & Emerging Markets: Investing internationally, especially in emerging markets, involves additional risks such as currency, political, accounting, economic, and market risk.
Geographic Concentration: Events negatively affecting the fiscal stability of a state, country, or region will cause the value of the Fund’s shares to decrease. Because the Fund concentrates its assets in a state, country, or region, the Fund is more vulnerable to those areas’ financial, economic, or other political developments.
Equity REITs: The Fund may be negatively affected by factors specific to the real estate market, including interest rates, leverage, property, and management.
Derivatives: Investments in derivatives such as futures, options, forwards, and swaps may increase volatility or cause a loss greater than the principal investment.
Prospectus: For additional information on risks, please see the Fund’s prospectus. The Fund may not be suitable for all investors.
Value of a $10,000 Investment Since Inception at Net Asset Value
The chart above represents historical performance of a hypothetical investment of $10,000 over the life of the Fund, assuming reinvestment of distributions. Past performance does not guarantee future results.
21
Management’s Discussion of Fund Performance (unaudited) (continued)
October 31, 2019
InfraCap MLP ETF
Management’s Discussion of Operations
Overview
InfraCap MLP ETF (the “Fund”) is an actively-managed portfolio of midstream energy master limited partnerships (“MLPs”) and related general partners. The Fund also utilizes options strategies and leverage to enhance income and total return.
The Fund focuses on the midstream MLP sector because most of these companies have a long-term history of relatively stable and growing cash distributions. These companies are typically involved in the production, gathering, transportation, storage, and processing of oil, natural gas, natural gas liquids, and refined products.
Performance
Fiscal year 2019 began with WTI Crude Oil prices declining from $65 per barrel to $45 per barrel during November and December 2018. Midstream MLP stocks traded down with crude prices and the benchmark, the Alerian MLP Infrastructure Index, nearly broke the low set in February 2016 when crude prices had dipped below $35 per barrel.
MLP stocks then rebounded in early 2019 as crude oil prices rose and the Federal Reserve signaled their intention to cut interest rates. In fact, monetary policies around the globe were implemented to prioritize additional economic growth.
As a result of pressure on MLPs from seasonal weakness and geopolitical forces, including trade wars and discussions of cuts in fossil fuel emissions, the sector experienced downward pricing trends later in the fiscal year. Such pressure caused many MLPs to trade at levels that appear to be below their respective, historic valuations relative to most fundamental metrics.
In the fiscal year ended October 31, 2019, the Fund had a net return of -15.62% at net asset value. The Fund’s benchmark index, the Alerian MLP Infrastructure Index, had a net loss of 4.81% during this fiscal year. During this same period, the total return on the S&P 500 index was 14.33%.
Top performing MLPs in the Fund included Cheniere Energy Partners, LP, TCP Pipelines, LP and NGL Energy Partners, LP which mitigated some of the downward pressure.
While EnLink Midstream LLC, DCP Midstream LP and Enable Midstream Partners LP were the Fund holdings that most contributed the Fund’s poor returns during the fiscal year.
Dividend Payments
In January 2019, the Fund’s annual dividend rate was reduced to $0.96 per share ($0.08 per month) from a rate of $1.32 per year ($0.11 per month). The reset was based on distributable cash flow (“DCF”) projections made in January 2019. Actual DCF fell short of projections. Consequently, the distribution was not fully covered, and the Fund paid out a portion of net capital to cover the shortfall.
The distribution of net capital that was used to meet the targeted dividend rate exacerbated the decline in the Fund’s net asset value already occurring due to the sector’s poor stock performance and volatility.
Use of Leverage
The Fund’s policy is to maintain its leverage ratio in a range of 10-35% over the long term. Leverage fluctuated within the targeted range during the fiscal year, consistent with the Fund’s investment objective to seek total return. Total leverage represented 24.6% of net assets at year-end, which was near the center of the long-term target range.
The Fund’s cost of borrowing fell slightly during the fiscal year while the average yield on midstream MLPs rose, as measured by the Alerian MLP Infrastructure Index, to 9.42% at year-end, as compared to 8.16% one year ago. This higher yield, along with lower borrowing costs gave the Fund managers justification to continue using leverage.
Use of Options
The Fund seeks to generate additional income for distribution to investors by writing call and put options. The primary activity is writing “covered” calls on positions held by the Fund. The Fund has also used options for hedging purposes.
During the fiscal year, the Fund’s emphasis was on writing short-duration covered call options, and the average maturity of the option portfolio was less than 27 days. The Fund used these option strategies to maximize the capture of premium decay and manage short term risks. The option strategy as implemented by the Fund’s manager was a net benefit to the Fund’s performance.
Consolidation within the MLP Stocks enhanced the liquidity in the single-stock options market as larger MLPs typically have more liquid markets for issued options.
22
Management’s Discussion of Fund Performance (unaudited) (continued)
October 31, 2019
InfraCap MLP ETF (continued)
The preceding information is the opinion of the investment adviser and sub-adviser. Any such opinions are subject to change at any time based upon market or other conditions and should not be relied upon as investment advice. Statements of fact are from sources considered reliable, but the investment adviser and sub-adviser make no representation or warranty as to their completeness or accuracy. Past performance is no guarantee of future results, and there is no guarantee that market forecasts will be realized.
Performance as of 10/31/2019
| | | | Average Annual Total Return
|
| | | | Fund
Net Asset Value
| | Fund
Market Price
| | Alerian MLP
Infrastructure Index1
| | S&P 500®Index2
|
1 Year | | | | | (15.62 | )% | | | (16.17 | )% | | | (4.81 | )% | | | 14.33 | % |
5 Years | | | | | (14.70 | )% | | | (14.74 | )% | | | (8.66 | )% | | | 10.78 | % |
Since Inception3 | | | | | (15.02 | )% | | | (15.09 | )% | | | (9.02 | )% | | | 11.40 | % |
| 1 | | The Alerian MLP Infrastructure Index is a composite of energy infrastructure Master Limited Partnerships (MLPs), whose constituents earn the majority of their cash flow from the transportation, storage, and processing of energy commodities. The index is calculated using a float-adjusted, capitalization-weighted methodology on a total-return basis. The index is unmanaged, its returns do not reflect any fees, expenses, or sales charges, and is not available for direct investment. |
| 2 | | The S&P 500®Index is a free-float market capitalization-weighted index of 500 of the largest U.S. companies. The index is calculated on a total return basis with dividends reinvested. The index is unmanaged, its returns do not reflect any fees, expenses, or sales charges, and is not available for direct investment. |
Performance data quoted represents past performance and past performance does not guarantee future results. Investment return and principal value of an investment will fluctuate so that an investor’s shares, when sold or redeemed, may be worth more or less than the original cost. Current performance data may be higher or lower than actual data quoted. Returns do not reflect the deduction of taxes a shareholder would pay on Fund distributions or the redemption of Fund shares. For the most current month-end performance data please visit www.virtusetfs.com or call toll free (800) 243-4361. Market price returns are based on the mid-point of the highest bid and lowest offer for Fund shares as of the scheduled close of regular trading on the New York Stock Exchange Arca (“NYSE”), ordinarily 4:00 p.m. Eastern time, on each day during which the NYSE is open for trading, and do not represent the returns an investor would receive if shares were traded at other times.
Interest Rate Risk: As yield-based investments, MLPs carry interest rate risk and may underperform in rising interest rate environments. Additionally, when investors have heightened fears about the economy, the risk spread between MLPs and competing investment options can widen, which may have an adverse effect on the stock price of MLPs. Rising interest rates may increase the potential cost of MLPs financing projects or cost of operations, and may affect the demand for MLP investments, either of which may result in lower performance by or distributions from the Fund’s MLP investments.
Exchange Traded Funds: The value of an ETF may be more volatile than the underlying portfolio of securities the ETF is designed to track. The costs of owning the ETF may exceed the cost of investing directly in the underlying securities.
Industry/Sector Concentration: A fund that focuses its investments in a particular industry or sector will be more sensitive to conditions that affect that industry or sector than a non-concentrated fund.
Short Sales: The Fund may engage in short sales, and may experience a loss if the price of a borrowed security increases before the date on which the Fund replaces the security.
Leverage: When a fund leverages its portfolio, the value of its shares may be more volatile and all other risks may be compounded.
Derivatives: Investments in derivatives such as futures, options, forwards, and swaps may increase volatility or cause a loss greater than the principal investment.
MLPs: Investments in Master Limited Partnerships may be adversely impacted by tax law changes, regulation, or factors affecting underlying assets.
Non-Diversified: The Fund is non-diversified and may be more susceptible to factors negatively impacting its holdings to the extent that each security represents a larger portion of the Fund’s assets.
Market Price/NAV: Shares of ETFs often trade at a discount to their net asset value, which may increase investors’ risk of loss. At the time of sale, an investor’s shares may have a market price that is above or below the Fund’s NAV.
Prospectus: For additional information on risks, please see the Fund’s prospectus. The Fund may not be suitable for all investors.
23
Management’s Discussion of Fund Performance (unaudited) (continued)
October 31, 2019
InfraCap MLP ETF (continued)
Value of a $10,000 Investment Since Inception at Net Asset Value
The chart above represents historical performance of a hypothetical investment of $10,000 over the life of the Fund, assuming reinvestment of distributions. Past performance does not guarantee future results.
24
Management’s Discussion of Fund Performance (unaudited) (continued)
October 31, 2019
InfraCap MLP ETF (continued)
Supplemental Financial Data
The information presented below regarding Distributable Cash Flow is supplemental non-GAAP financial information, which is meaningful to understanding the operating performance of the Fund. DCF is the functional equivalent of EBITDA for non-investment companies. The Fund manager believes it is an important supplemental measure of performance. This information is supplemental, is not inclusive of required financial disclosures (such as Total Expense Ratio), and should be read in conjunction with our full financial statements.
| | | | Year ended
Oct 31,
2019
| | Year ended
Oct 31,
2018
| | Year ended
Oct 31,
2017
|
Investment Income
| | | | | | | | | | | | | | |
Distributions from master limited partnerships | | | | $ | 40,237,090 | | | $ | 53,597,522 | | | $ | 28,081,000 | |
Dividend income | | | | | 7,454,836 | | | | 2,774,933 | | | | 764,352 | |
Net realized gain (loss) from written and purchased option contracts | | | | | 11,508,877 | | | | 40,949,800 | | | | 24,504,456 | |
Total Investment Income | | | | | 59,200,803 | | | | 97,322,255 | | | | 53,349,808 | |
Operating Expenses
| | | | | | | | | | | | | | |
Sub-Advisory Fees | | | | | 4,223,872 | | | | 5,771,439 | | | | 3,225,917 | |
Franchise Tax Expense | | | | | 27,083 | | | | 12,675 | | | | 5,088 | |
Total | | | | | 4,250,955 | | | | 5,784,114 | | | | 3,231,005 | |
Distributable cash flow before leverage costs | | | | | 54,949,848 | | | | 91,538,141 | | | | 50,118,803 | |
Dividend and interest expenses | | | | | 6,421,097 | | | | 8,734,418 | | | | 3,203,804 | |
Distributable Cash Flow | | | | $ | 48,528,751 | | | $ | 82,803,723 | | | $ | 46,914,999 | |
Distributions to Shareholders | | | | $ | 81,518,004 | | | $ | 119,404,506 | | | | 78,416,009 | |
Dividend Coverage Ratio | | | | | 60 | % | | | 69 | % | | | 60 | % |
| | | | 3 months
ended Oct 31,
2019
| | 3 months
ended Jul 31,
2019
| | 3 months
ended Apr 30,
2019
| | 3 months
ended Jan 31,
2019
|
Investment Income
| | | | | | | | | | | | | | | | | | |
Distributions from master limited partnerships | | | | | 12,830,366 | | | | 8,688,681 | | | | 9,008,538 | | | | 9,709,505 | |
Dividend income | | | | | 1,494,523 | | | | 2,450,322 | | | | 1,586,148 | | | | 1,923,843 | |
Net realized gain (loss) from written and purchased option contracts | | | | | 5,273,934 | | | | 4,925,802 | | | | 4,117,254 | | | | (2,808,113 | ) |
Total Investment Income | | | | | 19,598,823 | | | | 16,064,805 | | | | 14,711,940 | | | | 8,825,235 | |
Operating Expenses
| | | | | | | | | | | | | | | | | | |
Sub-Advisory Fees | | | | | 885,455 | | | | 1,099,149 | | | | 1,091,949 | | | | 1,147,319 | |
Franchise Tax Expense | | | | | 27,083 | | | | — | | | | — | | | | — | |
Total | | | | | 912,538 | | | | 1,099,149 | | | | 1,091,949 | | | | 1,147,319 | |
Distributable cash flow before leverage costs | | | | | 18,686,285 | | | | 14,965,656 | | | | 13,619,991 | | | | 7,677,916 | |
Dividend and interest expenses | | | | | 1,141,824 | | | | 1,474,683 | | | | 1,385,503 | | | | 2,419,087 | |
Distributable Cash Flow | | | | $ | 17,544,461 | | | $ | 13,490,973 | | | $ | 12,234,488 | | | $ | 5,258,829 | |
Distributions to Shareholders | | | | $ | 18,192,001 | | | $ | 19,740,001 | | | $ | 19,136,001 | | | $ | 24,450,001 | |
Dividend Coverage Ratio | | | | | 96 | % | | | 68 | % | | | 64 | % | | | 22 | % |
25
Portfolio Composition
October 31, 2019 (unaudited)
Asset Allocation as of 10/31/2019 (based on net assets)
InfraCap REIT Preferred ETF
| | | | | | | | | | | | | | | | | |
| Real Estate | | | | 64.7 | % | | | | | | | | | | | | |
| Financials | | | | 34.2 | % | | | | | | | | | | | | |
| Other Assets in Excess of Liabilities | | | | 1.1 | % | | | | | | | | | | | | |
| Total | | | | 100.0 | % | | | | | | | | | | | | |
Virtus Glovista Emerging Markets ETF
| | | | | | | | | | | | | | | | | |
| China | | | | 8.9 | % | | | | | | | | | | | | |
| Thailand | | | | 8.1 | % | | | | | | | | | | | | |
| Taiwan | | | | 8.0 | % | | | | | | | | | | | | |
| United States | | | | 7.2 | % | | | | | | | | | | | | |
| Malaysia | | | | 7.2 | % | | | | | | | | | | | | |
| Philippines | | | | 7.1 | % | | | | | | | | | | | | |
| Russia | | | | 7.0 | % | | | | | | | | | | | | |
| Turkey | | | | 7.0 | % | | | | | | | | | | | | |
| South Korea | | | | 6.9 | % | | | | | | | | | | | | |
| Chile | | | | 6.4 | % | | | | | | | | | | | | |
| Brazil | | | | 6.0 | % | | | | | | | | | | | | |
| South Africa | | | | 5.9 | % | | | | | | | | | | | | |
| Mexico | | | | 5.9 | % | | | | | | | | | | | | |
| Poland | | | | 4.9 | % | | | | | | | | | | | | |
| Indonesia | | | | 1.9 | % | | | | | | | | | | | | |
| India | | | | 1.3 | % | | | | | | | | | | | | |
| Spain | | | | 0.1 | % | | | | | | | | | | | | |
| Other Assets in Excess of Liabilities | | | | 0.2 | % | | | | | | | | | | | | |
| Total | | | | 100.0 | % | | | | | | | | | | | | |
Virtus InfraCap U.S. Preferred Stock ETF
| | | | | | | | | | | | | | | | | |
| Real Estate | | | | 46.1 | %* | | | | | | | | | | | | |
| Financials | | | | 40.0 | %* | | | | | | | | | | | | |
| Energy | | | | 18.5 | % | | | | | | | | | | | | |
| Utilities | | | | 7.6 | % | | | | | | | | | | | | |
| Communication Services | | | | 6.2 | % | | | | | | | | | | | | |
| Industrials | | | | 3.4 | % | | | | | | | | | | | | |
| Equity Funds | | | | (4.1 | )% | | | | | | | | | | | | |
| Written Options | | | | (0.3 | )% | | | | | | | | | | | | |
| Liabilities in Excess of Other Assets | | | | (17.4 | )% | | | | | | | | | | | | |
| Total | | | | 100.0 | % | | | | | | | | | | | | |
* | | Amounts represent investments in particular sectors. No industry within these sectors represented more than 25% of the Fund’s total assets at the time of investment. |
26
Portfolio Composition (continued)
October 31, 2019 (unaudited)
Asset Allocation as of 10/31/2019 (based on net assets)
Virtus LifeSci Biotech Clinical Trials ETF
| | | | | | | | | | | | | | | | | |
| Health Care | | | | 98.8 | % | | | | | | | | | | | | |
| Materials | | | | 0.9 | % | | | | | | | | | | | | |
| Money Market Fund | | | | 13.1 | % | | | | | | | | | | | | |
| Liabilities in Excess of Other Assets | | | | (12.8 | )% | | | | | | | | | | | | |
| Total | | | | 100.0 | % | | | | | | | | | | | | |
Virtus LifeSci Biotech Products ETF
| | | | | | | | | | | | | | | | | |
| Health Care | | | | 98.6 | % | | | | | | | | | | | | |
| Money Market Fund | | | | 6.5 | % | | | | | | | | | | | | |
| Liabilities in Excess of Other Assets | | | | (5.1 | )% | | | | | | | | | | | | |
| Total | | | | 100.0 | % | | | | | | | | | | | | |
Virtus Newfleet Multi-Sector Bond ETF
| | | | | | | | | | | | | | | | | |
| Corporate Bonds | | | | 33.9 | % | | | | | | | | | | | | |
| Foreign Bonds | | | | 24.0 | % | | | | | | | | | | | | |
| Mortgage Backed Securities | | | | 12.0 | % | | | | | | | | | | | | |
| U.S. Government Securities | | | | 11.0 | % | | | | | | | | | | | | |
| Term Loans | | | | 9.9 | % | | | | | | | | | | | | |
| Asset Backed Securities | | | | 6.2 | % | | | | | | | | | | | | |
| Warrant | | | | 0.1 | % | | | | | | | | | | | | |
| Common Stock | | | | 0.1 | % | | | | | | | | | | | | |
| Money Market Fund | | | | 1.8 | % | | | | | | | | | | | | |
| Other Assets in Excess of Liabilities | | | | 1.0 | % | | | | | | | | | | | | |
| Total | | | | 100.0 | % | | | | | | | | | | | | |
Virtus Private Credit Strategy ETF
| | | | | | | | | | | | | | | | | |
| Financials | | | | 65.4 | % | | | | | | | | | | | | |
| Closed-End Funds | | | | 33.0 | % | | | | | | | | | | | | |
| Money Market Fund | | | | 4.3 | % | | | | | | | | | | | | |
| Liabilities in Excess of Other Assets | | | | (2.7 | )% | | | | | | | | | | | | |
| Total | | | | 100.0 | % | | | | | | | | | | | | |
Virtus Real Asset Income ETF
| | | | | | | | | | | | | | | | | |
| Real Estate | | | | 32.7 | % | | | | | | | | | | | | |
| Energy | | | | 28.6 | % | | | | | | | | | | | | |
| Materials | | | | 19.8 | % | | | | | | | | | | | | |
| Communication Services | | | | 6.8 | % | | | | | | | | | | | | |
| Utilities | | | | 4.5 | % | | | | | | | | | | | | |
| Financials | | | | 2.4 | % | | | | | | | | | | | | |
| Consumer Staples | | | | 2.2 | % | | | | | | | | | | | | |
| Industrials | | | | 1.2 | % | | | | | | | | | | | | |
| Money Market Fund | | | | 4.0 | % | | | | | | | | | | | | |
| Liabilities in Excess of Other Assets | | | | (2.2 | )% | | | | | | | | | | | | |
| Total | | | | 100.0 | % | | | | | | | | | | | | |
27
Portfolio Composition (continued)
October 31, 2019 (unaudited)
Virtus WMC Global Factor Opportunities ETF
| | | | | | | | | | | | | | | | | |
| Financials | | | | 23.5 | % | | | | | | | | | | | | |
| Information Technology | | | | 14.3 | % | | | | | | | | | | | | |
| Health Care | | | | 11.8 | % | | | | | | | | | | | | |
| Industrials | | | | 10.7 | % | | | | | | | | | | | | |
| Consumer Staples | | | | 9.1 | % | | | | | | | | | | | | |
| Consumer Discretionary | | | | 8.7 | % | | | | | | | | | | | | |
| Real Estate | | | | 4.9 | % | | | | | | | | | | | | |
| Utilities | | | | 4.9 | % | | | | | | | | | | | | |
| Communication Services | | | | 4.6 | % | | | | | | | | | | | | |
| Materials | | | | 3.7 | % | | | | | | | | | | | | |
| Energy | | | | 3.3 | % | | | | | | | | | | | | |
| Other Assets in Excess of Liabilities | | | | 0.5 | % | | | | | | | | | | | | |
| Total | | | | 100.0 | % | | | | | | | | | | | | |
InfraCap MLP ETF
| | | | | | | | | | | | | | | | | |
| Energy | | | | 129.8 | % | | | | | | | | | | | | |
| Purchased Options | | | | 0.1 | % | | | | | | | | | | | | |
| Written Options | | | | (0.3 | )% | | | | | | | | | | | | |
| Liabilities in Excess of Other Assets | | | | (29.6 | )% | | | | | | | | | | | | |
| Total | | | | 100.0 | % | | | | | | | | | | | | |
28
Shareholder Expense Examples (unaudited)
We believe it is important for you to understand the impact of costs on your investment. All funds have operating expenses. As a shareholder of the InfraCap REIT Preferred ETF, Virtus Glovista Emerging Markets ETF, Virtus InfraCap U.S. Preferred Stock ETF, Virtus LifeSci Biotech Clinical Trials ETF, Virtus LifeSci Biotech Products ETF, Virtus Newfleet Multi-Sector Bond ETF, Virtus Private Credit Strategy ETF, Virtus Real Asset Income ETF, Virtus WMC Global Factor Opportunities ETF and InfraCap MLP ETF (each, a “Fund”) you may incur two types of costs: (1) transaction costs, which include brokerage commissions that you pay when purchasing or selling shares of a Fund; and (2) ongoing costs, which include advisory fees and other fund expenses, if any. The following example is intended to help you understand your ongoing costs (in dollars and cents) of investing in a Fund and to compare these costs with the ongoing costs of investing in other funds. The examples are based on an investment of $1,000 invested at the beginning of the period and held throughout the entire period (May 1, 2019 to October 31, 2019), except as noted in footnotes below.
Actual expenses
The first line under each Fund in the table below provides information about actual account values and actual expenses. You may use the information in this line, together with the amount you invested, to estimate the expenses that you paid over the period. Simply divide your account value by $1,000 (for example, an $8,600 account value divided by $1,000 = 8.6), then multiply the result by the number in the first line for your Fund under the heading entitled “Expenses Paid During Period” to estimate the expenses you paid on your account during this period.
Hypothetical example for comparison purposes
The second line under each Fund in the table provides information about hypothetical account values and hypothetical expenses based on each Fund’s actual expense ratio and an assumed rate of return of 5% per year before expenses, which is not each Fund’s actual return. The hypothetical account values and expenses may not be used to estimate the actual ending account balance or expenses you paid for the period. You may use this information to compare the ongoing costs of investing in each Fund and other funds. To do so, compare this 5% hypothetical example with the 5% hypothetical examples that appear in the shareholder reports of the other funds. Please note that the expenses shown in the table are meant to highlight your ongoing costs only and do not reflect any transactional costs, such as brokerage commissions paid on purchases and sales of Fund shares. Therefore, the second line under each Fund in the table is useful in comparing ongoing Fund costs only and will not help you determine the relative total costs of owning different funds.
In addition, if these transactional costs were included, your costs would have been higher.
| | | Beginning
Account Value
5/01/19
| | Ending
Account Value
10/31/19
| | Annualized
Expense Ratios(2)
| | Expenses Paid
During the
Period(3)
|
InfraCap REIT Preferred ETF
| | | | | | | | | | | | | | | | | |
Actual | | | $ | 1,000.00 | | | $ | 1,067.80 | | | | 0.45 | % | | $ | 2.35 | |
Hypothetical(1) | | | $ | 1,000.00 | | | $ | 1,022.94 | | | | 0.45 | % | | $ | 2.29 | |
Virtus Glovista Emerging Markets ETF
| | | | | | | | | | | | | | | | | |
Actual | | | $ | 1,000.00 | | | $ | 993.00 | | | | 0.65 | % | | $ | 3.27 | |
Hypothetical(1) | | | $ | 1,000.00 | | | $ | 1,021.93 | | | | 0.65 | % | | $ | 3.31 | |
Virtus InfraCap U.S. Preferred Stock ETF
| | | | | | | | | | | | | | | | | |
Actual | | | $ | 1,000.00 | | | $ | 1,089.70 | | | | 0.80 | % | | $ | 4.21 | |
Hypothetical(1) | | | $ | 1,000.00 | | | $ | 1,021.17 | | | | 0.80 | % | | $ | 4.08 | |
Virtus LifeSci Biotech Clinical Trials ETF
| | | | | | | | | | | | | | | | | |
Actual | | | $ | 1,000.00 | | | $ | 950.20 | | | | 0.79 | % | | $ | 3.89 | |
Hypothetical(1) | | | $ | 1,000.00 | | | $ | 1,021.22 | | | | 0.79 | % | | $ | 4.03 | |
Virtus LifeSci Biotech Products ETF
| | | | | | | | | | | | | | | | | |
Actual | | | $ | 1,000.00 | | | $ | 903.90 | | | | 0.79 | % | | $ | 3.79 | |
Hypothetical(1) | | | $ | 1,000.00 | | | $ | 1,021.22 | | | | 0.79 | % | | $ | 4.03 | |
Virtus Newfleet Multi-Sector Bond ETF
| | | | | | | | | | | | | | | | | |
Actual | | | $ | 1,000.00 | | | $ | 1,033.60 | | | | 0.80 | % | | $ | 4.10 | |
Hypothetical(1) | | | $ | 1,000.00 | | | $ | 1,021.17 | | | | 0.80 | % | | $ | 4.08 | |
Virtus Private Credit Strategy ETF
| | | | | | | | | | | | | | | | | |
Actual | | | $ | 1,000.00 | | | $ | 998.90 | | | | 0.75 | % | | $ | 3.78 | |
Hypothetical(1) | | | $ | 1,000.00 | | | $ | 1,021.42 | | | | 0.75 | % | | $ | 3.82 | |
Virtus Real Asset Income ETF
| | | | | | | | | | | | | | | | | |
Actual | | | $ | 1,000.00 | | | $ | 988.10 | | | | 0.55 | % | | $ | 2.76 | |
Hypothetical(1) | | | $ | 1,000.00 | | | $ | 1,022.43 | | | | 0.55 | % | | $ | 2.80 | |
Virtus WMC Global Factor Opportunities ETF
| | | | | | | | | | | | | | | | | |
Actual | | | $ | 1,000.00 | | | $ | 1,014.80 | | | | 0.49 | % | | $ | 2.49 | |
Hypothetical(1) | | | $ | 1,000.00 | | | $ | 1,022.74 | | | | 0.49 | % | | $ | 2.50 | |
InfraCap MLP ETF
| | | | | | | | | | | | | | | | | |
Actual | | | $ | 1,000.00 | | | $ | 849.60 | | | | 0.95 | % | | $ | 4.43 | |
Hypothetical(1) | | | $ | 1,000.00 | | | $ | 1,020.42 | | | | 0.95 | % | | $ | 4.84 | |
| 1 | | Assuming 5% return before expenses. |
| 2 | | Annualized expense ratios reflect expenses net of waived fees or reimbursed expenses, if applicable. |
| 3 | | Expenses are calculated using each Fund’s annualized expense ratio, multiplied by the average account value for the period, multiplied by 184/365 (to reflect the six-month period). |
29
Schedule of Investments — InfraCap REIT Preferred ETF
October 31, 2019
Security Description
| | | | Shares
| | Value
|
| |
PREFERRED STOCKS — 98.9%
| | | | | | | | | | |
| |
Financials — 34.2%
| | | | | | | | | | |
AGNC Investment Corp., Series C, 7.00% | | | | | 31,681 | | | $ | 821,488 | |
AGNC Investment Corp., Series D, 6.88% | | | | | 19,701 | | | | 500,011 | |
Annaly Capital Management, Inc.,
Series D, 7.50% | | | | | 38,562 | | | | 990,272 | |
Annaly Capital Management, Inc.,
Series F, 6.95% | | | | | 60,359 | | | | 1,571,748 | |
Annaly Capital Management, Inc.,
Series G, 6.50% | | | | | 35,628 | | | | 920,984 | |
Apollo Global Management, Inc.,
Series B, 6.38% | | | | | 25,149 | | | | 677,263 | |
Arch Capital Group Ltd., Series F, 5.45% | | | | | 32,167 | | | | 834,734 | |
ARMOUR Residential REIT, Inc.,
Series B, 7.88% | | | | | 14,160 | | | | 355,133 | |
Chimera Investment Corp., Series A, 8.00% | | | | | 12,155 | | | | 320,284 | |
Chimera Investment Corp., Series B, 8.00% | | | | | 27,245 | | | | 719,268 | |
Chimera Investment Corp., Series C, 7.75% | | | | | 21,797 | | | | 548,849 | |
Chimera Investment Corp., Series D, 8.00% | | | | | 16,765 | | | | 431,531 | |
Exantas Capital Corp., 8.63% | | | | | 10,060 | | | | 262,868 | |
Invesco Mortgage Capital, Inc., Series B, 7.75% | | | | | 12,994 | | | | 361,753 | |
Invesco Mortgage Capital, Inc., Series C, 7.50% | | | | | 24,101 | | | | 643,015 | |
New York Mortgage Trust, Inc.,
Series D, 8.00% | | | | | 11,667 | | | | 297,275 | |
PennyMac Mortgage Investment Trust,
Series A, 8.13% | | | | | 9,641 | | | | 259,632 | |
PennyMac Mortgage Investment Trust,
Series B, 8.00% | | | | | 16,346 | | | | 428,265 | |
Two Harbors Investment Corp., Series A, 8.13% | | | | | 12,060 | | | | 335,389 | |
Two Harbors Investment Corp., Series B, 7.63% | | | | | 24,116 | | | | 632,080 | |
Two Harbors Investment Corp., Series C, 7.25% | | | | | 24,745 | | | | 634,214 | |
Two Harbors Investment Corp., Series E, 7.50% | | | | | 16,765 | | | | 421,807 | |
Total Financials | | | | | | | | | 12,967,863 | |
Real Estate — 64.7%
| | | | | | | | | | |
American Homes 4 Rent, Series F, 5.88% | | | | | 15,109 | | | | 394,949 | |
American Homes 4 Rent, Series G, 5.88% | | | | | 11,209 | | | | 297,599 | |
American Homes 4 Rent, Series H, 6.25% | | | | | 11,209 | | | | 301,858 | |
Ashford Hospitality Trust, Inc., Series F, 7.38% | | | | | 11,698 | | | | 256,069 | |
Ashford Hospitality Trust, Inc., Series G, 7.38% | | | | | 15,109 | | | | 318,800 | |
Ashford Hospitality Trust, Inc., Series H, 7.50% | | | | | 9,260 | | | | 200,942 | |
Ashford Hospitality Trust, Inc., Series I, 7.50% | | | | | 13,160 | | | | 281,229 | |
Bluerock Residential Growth REIT, Inc.,
Series A, 8.25% | | | | | 13,942 | | | | 369,045 | |
Brookfield Property Partners LP,
Series A-1, 6.50% | | | | | 17,937 | | | | 479,097 | |
Cedar Realty Trust, Inc., Series C, 6.50% | | | | | 12,185 | | | | 284,520 | |
City Office REIT, Inc., Series A, 6.63% | | | | | 10,925 | | | | 287,327 | |
Colony Capital, Inc., Series B, 8.25% | | | | | 14,899 | | | | 378,286 | |
Colony Capital, Inc., Series E, 8.75% | | | | | 24,369 | | | | 621,653 | |
| |
Security Description
| | | | Shares
| | Value
|
PREFERRED STOCKS (continued)
| | | | | | | | | | |
Real Estate (continued)
| | | | | | | | | | |
Colony Capital, Inc., Series H, 7.13% | | | | | 28,041 | | | $ | 669,899 | |
Colony Capital, Inc., Series I, 7.15% | | | | | 33,651 | | | | 800,894 | |
Colony Capital, Inc., Series J, 7.13% | | | | | 30,724 | | | | 730,617 | |
Digital Realty Trust, Inc., Series J, 5.25% | | | | | 19,496 | | | | 509,041 | |
Digital Realty Trust, Inc., Series K, 5.85% | | | | | 20,470 | | | | 559,445 | |
EPR Properties, Series G, 5.75% | | | | | 14,623 | | | | 383,854 | |
Farmland Partners, Inc., Series B, 6.00% | | | | | 14,557 | | | | 352,134 | |
Federal Realty Investment Trust,
Series C, 5.00% | | | | | 14,623 | | | | 375,811 | |
Global Net Lease, Inc., Series A, 7.25% | | | | | 14,554 | | | | 381,460 | |
Hersha Hospitality Trust, Series D, 6.50% | | | | | 18,768 | | | | 463,945 | |
Hersha Hospitality Trust, Series E, 6.50% | | | | | 9,754 | | | | 247,361 | |
Kimco Realty Corp., Series L, 5.13% | | | | | 21,931 | | | | 557,047 | |
Kimco Realty Corp., Series M, 5.25% | | | | | 25,782 | | | | 668,785 | |
Monmouth Real Estate Investment Corp.,
Series C, 6.13% | | | | | 32,715 | | | | 817,875 | |
National Retail Properties, Inc., Series F, 5.20% | | | | | 33,630 | | | | 871,017 | |
National Storage Affiliates Trust,
Series A, 6.00% | | | | | 16,815 | | | | 443,580 | |
Office Properties Income Trust, 5.88% | | | | | 30,219 | | | | 788,112 | |
Pebblebrook Hotel Trust, Series F, 6.30% | | | | | 14,623 | | | | 374,056 | |
Pennsylvania Real Estate Investment Trust,
Series C, 7.20% | | | | | 16,815 | | | | 342,522 | |
Pennsylvania Real Estate Investment Trust,
Series D, 6.88% | | | | | 12,185 | | | | 265,389 | |
PS Business Parks, Inc., Series W, 5.20% | | | | | 18,496 | | | | 473,313 | |
PS Business Parks, Inc., Series X, 5.25% | | | | | 22,420 | | | | 580,678 | |
PS Business Parks, Inc., Series Y, 5.20% | | | | | 19,496 | | | | 505,921 | |
Public Storage, Series C, 5.13% | | | | | 16,586 | | | | 426,426 | |
Public Storage, Series D, 4.95% | | | | | 26,957 | | | | 688,751 | |
Public Storage, Series E, 4.90% | | | | | 29,029 | | | | 737,337 | |
Public Storage, Series F, 5.15% | | | | | 23,225 | | | | 609,424 | |
Public Storage, Series G, 5.05% | | | | | 24,882 | | | | 643,449 | |
Public Storage, Series H, 5.60% | | | | | 23,640 | | | | 654,119 | |
QTS Realty Trust, Inc., Series A, 7.13% | | | | | 10,430 | | | | 280,358 | |
Senior Housing Properties Trust, 5.63% | | | | | 34,132 | | | | 832,821 | |
SITE Centers Corp., Series A, 6.38% | | | | | 17,058 | | | | 460,566 | |
Spirit Realty Capital, Inc., Series A, 6.00% | | | | | 16,815 | | | | 439,376 | |
Summit Hotel Properties, Inc., Series E, 6.25% | | | | | 15,595 | | | | 417,166 | |
UMH Properties, Inc., Series C, 6.75% | | | | | 23,762 | | | | 639,198 | |
Vornado Realty Trust, Series M, 5.25% | | | | | 31,144 | | | | 811,613 | |
Washington Prime Group, Inc., Series H, 7.50% | | | | | 9,747 | | | | 222,232 | |
Total Real Estate | | | | | | | | | 24,496,966 | |
TOTAL INVESTMENTS — 98.9%
| | | | | | | | | | |
(Cost $36,597,205) | | | | | | | | | 37,464,829 | |
Other Assets in Excess of Liabilities — 1.1% | | | | | | | | | 420,505 | |
Net Assets — 100.0% | | | | | | | | $ | 37,885,334 | |
The accompanying notes are an integral part of these financial statements.
30
Schedule of Investments — InfraCap REIT Preferred ETF(continued)
October 31, 2019
The following table summarizes valuation of the Fund’s investments under the fair value hierarchy levels as of October 31, 2019.
| | | | Level 1
| | Level 2
| | Level 3
| | Total
|
Asset Valuation Inputs
| | | | | | | | | | | | | | | | | | |
Preferred Stocks | | | | $ | 37,464,829 | | | $ | — | | | $ | — | | | $ | 37,464,829 | |
Total | | | | $ | 37,464,829 | | | $ | — | | | $ | — | | | $ | 37,464,829 | |
The accompanying notes are an integral part of these financial statements.
31
Schedule of Investments — Virtus Glovista Emerging Markets ETF
October 31, 2019
Security Description
| | | | Shares
| | Value
|
COMMON STOCKS — 91.9%
| | | | | | | | | | |
Brazil — 5.4%
| | | | | | | | | | |
Ambev SA(1) | | | | | 4,268 | | | $ | 18,395 | |
Atacadao SA | | | | | 544 | | | | 2,592 | |
B2W Cia Digital* | | | | | 247 | | | | 3,129 | |
B3 SA—Brasil Bolsa Balcao | | | | | 1,916 | | | | 23,113 | |
Banco Bradesco SA(1) | | | | | 3,508 | | | | 30,730 | |
Banco do Brasil SA | | | | | 1,071 | | | | 12,858 | |
Banco Santander Brasil SA | | | | | 3,012 | | | | 35,343 | |
BB Seguridade Participacoes SA | | | | | 634 | | | | 5,370 | |
BR Malls Participacoes SA | | | | | 809 | | | | 3,096 | |
BRF SA* | | | | | 760 | | | | 6,729 | |
CCR SA | | | | | 1,057 | | | | 4,333 | |
Cia de Saneamento Basico do Estado de
Sao Paulo | | | | | 321 | | | | 4,372 | |
Cogna Educacao | | | | | 1,502 | | | | 3,622 | |
Cosan SA | | | | | 148 | | | | 2,133 | |
Embraer SA(1) | | | | | 178 | | | | 3,092 | |
Engie Brasil Energia SA | | | | | 246 | | | | 2,776 | |
Equatorial Energia SA | | | | | 195 | | | | 4,954 | |
Gerdau SA(1) | | | | | 985 | | | | 3,241 | |
Hapvida Participacoes e Investimentos SA(2) | | | | | 198 | | | | 2,780 | |
Hypera SA | | | | | 348 | | | | 2,978 | |
IRB Brasil Resseguros SA | | | | | 831 | | | | 7,830 | |
Itau Unibanco Holding SA(1) | | | | | 4,427 | | | | 39,976 | |
Localiza Rent a Car SA | | | | | 529 | | | | 5,696 | |
Lojas Renner SA | | | | | 749 | | | | 9,478 | |
Magazine Luiza SA | | | | | 506 | | | | 5,632 | |
Multiplan Empreendimentos Imobiliarios SA | | | | | 384 | | | | 2,797 | |
Natura Cosmeticos SA | | | | | 330 | | | | 2,564 | |
Notre Dame Intermedica Participacoes SA | | | | | 507 | | | | 7,585 | |
Petrobras Distribuidora SA | | | | | 321 | | | | 2,264 | |
Petroleo Brasileiro SA(1) | | | | | 2,065 | | | | 31,161 | |
Raia Drogasil SA | | | | | 183 | | | | 5,019 | |
Rumo SA* | | | | | 991 | | | | 5,634 | |
Sul America SA | | | | | 351 | | | | 4,226 | |
Suzano SA | | | | | 527 | | | | 4,289 | |
TIM Participacoes SA | | | | | 771 | | | | 2,195 | |
TOTVS SA | | | | | 152 | | | | 2,360 | |
Transmissora Alianca de Energia Eletrica SA | | | | | 332 | | | | 2,391 | |
Ultrapar Participacoes SA | | | | | 723 | | | | 3,402 | |
Vale SA*(1) | | | | | 2,965 | | | | 34,809 | |
WEG SA | | | | | 714 | | | | 4,540 | |
YDUQS Part | | | | | 284 | | | | 2,780 | |
Total Brazil | | | | | | | | | 362,264 | |
Chile — 6.3%
| | | | | | | | | | |
Aguas Andinas SA Class A | | | | | 23,519 | | | | 10,783 | |
Banco de Chile | | | | | 242,697 | | | | 31,253 | |
Banco de Credito e Inversiones SA | | | | | 417 | | | | 23,217 | |
Banco Santander Chile | | | | | 574,439 | | | | 35,639 | |
Cencosud SA | | | | | 13,225 | | | | 17,958 | |
Cia Cervecerias Unidas SA | | | | | 1,381 | | | | 13,780 | |
Colbun SA | | | | | 66,538 | | | | 11,480 | |
Empresa Nacional de Telecomunicaciones SA* | | | | | 1,217 | | | | 9,520 | |
Empresas CMPC SA | | | | | 10,434 | | | | 23,778 | |
Empresas COPEC SA | | | | | 3,816 | | | | 34,121 | |
Enel Americas SA | | | | | 220,581 | | | | 41,195 | |
Enel Chile SA | | | | | 253,828 | | | | 20,875 | |
Engie Energia Chile SA | | | | | 4,484 | | | | 6,651 | |
Itau CorpBanca | | | | | 1,355,525 | | | | 8,225 | |
| | | | | | | | | | | |
| | | | | | | | | | | |
Security Description
| | | | Shares
| | Value
|
COMMON STOCKS (continued)
| | | | | | | | | | |
Chile (continued)
| | | | | | | | | | |
Latam Airlines Group SA | | | | | 2,185 | | | $ | 24,160 | |
Parque Arauco SA | | | | | 5,561 | | | | 14,622 | |
SACI Falabella | | | | | 9,737 | | | | 49,565 | |
Sociedad Quimica y Minera de Chile SA(1) | | | | | 1,470 | | | | 39,955 | |
Vina Concha y Toro SA | | | | | 4,081 | | | | 7,512 | |
Total Chile | | | | | | | | | 424,289 | |
China — 8.9%
| | | | | | | | | | |
58.com, Inc.*(1) | | | | | 50 | | | | 2,641 | |
AAC Technologies Holdings, Inc. | | | | | 331 | | | | 2,154 | |
Agricultural Bank of China Ltd. Class H | | | | | 14,174 | | | | 5,843 | |
Alibaba Group Holding Ltd.*(1) | | | | | 660 | | | | 116,602 | |
Anhui Conch Cement Co. Ltd. Class H | | | | | 407 | | | | 2,439 | |
ANTA Sports Products Ltd. | | | | | 367 | | | | 3,597 | |
Autohome, Inc.*(1) | | | | | 55 | | | | 4,651 | |
Baidu, Inc.*(1) | | | | | 123 | | | | 12,528 | |
Bank of China Ltd. Class H | | | | | 38,577 | | | | 15,803 | |
Bank of Communications Co. Ltd. Class H | | | | | 6,533 | | | | 4,469 | |
China CITIC Bank Corp. Ltd. Class H | | | | | 3,165 | | | | 1,838 | |
China Conch Venture Holdings Ltd. | | | | | 762 | | | | 2,985 | |
China Construction Bank Corp. Class H | | | | | 109,204 | | | | 87,938 | |
China Everbright Bank Co. Ltd. Class H | | | | | 5,870 | | | | 2,704 | |
China Life Insurance Co. Ltd. Class H | | | | | 3,498 | | | | 9,107 | |
China Merchants Bank Co. Ltd. Class H | | | | | 1,852 | | | | 8,863 | |
China Minsheng Banking Corp. Ltd. Class H | | | | | 2,850 | | | | 1,997 | |
China Pacific Insurance Group Co. Ltd.
Class H | | | | | 1,331 | | | | 4,841 | |
China Petroleum & Chemical Corp. Class H | | | | | 12,113 | | | | 6,956 | |
China Shenhua Energy Co. Ltd. Class H | | | | | 1,185 | | | | 2,411 | |
China Telecom Corp. Ltd. Class H | | | | | 4,841 | | | | 2,063 | |
China Vanke Co. Ltd. Class H | | | | | 629 | | | | 2,300 | |
CITIC Securities Co. Ltd. Class H | | | | | 635 | | | | 1,170 | |
Country Garden Holdings Co. Ltd. | | | | | 2,506 | | | | 3,492 | |
Ctrip.com International Ltd.*(1) | | | | | 243 | | | | 8,017 | |
ENN Energy Holdings Ltd. | | | | | 266 | | | | 3,048 | |
GDS Holdings Ltd.*(1) | | | | | 65 | | | | 2,709 | |
Huazhu Group Ltd.(1) | | | | | 127 | | | | 4,808 | |
Industrial & Commercial Bank of China Ltd. Class H | | | | | 40,376 | | | | 29,061 | |
iQIYI, Inc.*(1) | | | | | 98 | | | | 1,708 | |
JD.com, Inc.*(1) | | | | | 507 | | | | 15,793 | |
Li Ning Co. Ltd. | | | | | 889 | | | | 3,024 | |
Longfor Group Holdings Ltd.(2) | | | | | 532 | | | | 2,213 | |
Momo, Inc.(1) | | | | | 82 | | | | 2,749 | |
NetEase, Inc.(1) | | | | | 56 | | | | 16,008 | |
New Oriental Education & Technology
Group, Inc.*(1) | | | | | 73 | | | | 8,910 | |
PetroChina Co. Ltd. Class H | | | | | 9,766 | | | | 4,798 | |
PICC Property & Casualty Co. Ltd. Class H | | | | | 3,172 | | | | 4,028 | |
Ping An Insurance Group Co. of China Ltd.
Class H | | | | | 2,588 | | | | 29,972 | |
Postal Savings Bank of China Co. Ltd.
Class H(2) | | | | | 4,557 | | | | 2,925 | |
Sunac China Holdings Ltd. | | | | | 1,120 | | | | 5,103 | |
Sunny Optical Technology Group Co. Ltd. | | | | | 243 | | | | 3,932 | |
TAL Education Group*(1) | | | | | 165 | | | | 7,064 | |
Tencent Holdings Ltd. | | | | | 2,673 | | | | 109,431 | |
Vipshop Holdings Ltd.*(1) | | | | | 236 | | | | 2,723 | |
Want Want China Holdings Ltd. | | | | | 2,601 | | | | 2,197 | |
The accompanying notes are an integral part of these financial statements.
32
Schedule of Investments — Virtus Glovista Emerging Markets ETF(continued)
October 31, 2019
Security Description
| | | | Shares
| | Value
|
COMMON STOCKS (continued)
| | | | | | | | | | |
China (continued)
| | | | | | | | | | |
Weibo Corp.*(1) | | | | | 56 | | | $ | 2,755 | |
Wuxi Biologics Cayman, Inc.*(2) | | | | | 295 | | | | 3,482 | |
Yum China Holdings, Inc. | | | | | 163 | | | | 6,928 | |
ZTO Express Cayman, Inc.(1) | | | | | 243 | | | | 5,346 | |
Total China | | | | | | | | | 598,124 | |
India — 1.3%
| | | | | | | | | | |
Axis Bank Ltd.(3) | | | | | 60 | | | | 3,114 | |
Dr Reddy’s Laboratories Ltd.(1) | | | | | 34 | | | | 1,331 | |
HDFC Bank Ltd.(1) | | | | | 677 | | | | 41,358 | |
ICICI Bank Ltd.(1) | | | | | 1,428 | | | | 18,607 | |
Infosys Ltd.(1) | | | | | 105 | | | | 1,007 | |
Larsen & Toubro Ltd.(3) | | | | | 444 | | | | 9,368 | |
Mahindra & Mahindra Ltd.(3) | | | | | 125 | | | | 1,069 | |
Reliance Industries Ltd.(2)(3) | | | | | 103 | | | | 4,228 | |
State Bank of India*(3) | | | | | 92 | | | | 3,984 | |
Tata Motors Ltd.*(1) | | | | | 53 | | | | 640 | |
Vedanta Ltd.(1) | | | | | 57 | | | | 475 | |
Total India | | | | | | | | | 85,181 | |
Indonesia — 1.9%
| | | | | | | | | | |
Ace Hardware Indonesia Tbk PT | | | | | 8,023 | | | | 966 | |
Adaro Energy Tbk PT | | | | | 16,699 | | | | 1,558 | |
Astra International Tbk PT | | | | | 23,412 | | | | 11,592 | |
Bank Central Asia Tbk PT | | | | | 12,244 | | | | 27,433 | |
Bank Mandiri Persero Tbk PT | | | | | 21,555 | | | | 10,787 | |
Bank Negara Indonesia Persero Tbk PT | | | | | 8,659 | | | | 4,734 | |
Bank Rakyat Indonesia Persero Tbk PT | | | | | 60,535 | | | | 18,156 | |
Barito Pacific Tbk PT | | | | | 28,525 | | | | 1,931 | |
Chandra Asri Petrochemical Tbk PT | | | | | 1,763 | | | | 1,193 | |
Charoen Pokphand Indonesia Tbk PT | | | | | 9,790 | | | | 4,394 | |
Ciputra Development Tbk PT | | | | | 12,026 | | | | 951 | |
Gudang Garam Tbk PT | | | | | 530 | | | | 2,118 | |
Hanjaya Mandala Sampoerna Tbk PT | | | | | 10,253 | | | | 1,556 | |
Indah Kiat Pulp & Paper Corp. Tbk PT | | | | | 2,831 | | | | 1,467 | |
Indocement Tunggal Prakarsa Tbk PT | | | | | 2,095 | | | | 2,985 | |
Indofood CBP Sukses Makmur Tbk PT | | | | | 2,644 | | | | 2,190 | |
Indofood Sukses Makmur Tbk PT | | | | | 5,206 | | | | 2,856 | |
Jasa Marga Persero Tbk PT | | | | | 2,220 | | | | 862 | |
Kalbe Farma Tbk PT | | | | | 22,921 | | | | 2,604 | |
Mitra Keluarga Karyasehat Tbk PT | | | | | 6,459 | | | | 1,196 | |
Pabrik Kertas Tjiwi Kimia Tbk PT | | | | | 1,472 | | | | 1,109 | |
Perusahaan Gas Negara Tbk PT | | | | | 12,097 | | | | 1,818 | |
Semen Indonesia Persero Tbk PT | | | | | 3,306 | | | | 2,979 | |
Telekomunikasi Indonesia Persero Tbk PT | | | | | 55,519 | | | | 16,256 | |
Unilever Indonesia Tbk PT | | | | | 1,355 | | | | 4,221 | |
United Tractors Tbk PT | | | | | 1,806 | | | | 2,789 | |
XL Axiata Tbk PT* | | | | | 4,103 | | | | 1,038 | |
Total Indonesia | | | | | | | | | 131,739 | |
Malaysia — 7.2%
| | | | | | | | | | |
AirAsia Group Bhd | | | | | 8,011 | | | | 3,662 | |
Alliance Bank Malaysia Bhd | | | | | 5,122 | | | | 3,530 | |
AMMB Holdings Bhd | | | | | 5,859 | | | | 5,595 | |
Axiata Group Bhd | | | | | 26,272 | | | | 27,036 | |
Carlsberg Brewery Malaysia Bhd | | | | | 675 | | | | 4,481 | |
CIMB Group Holdings Bhd | | | | | 32,601 | | | | 40,961 | |
Dialog Group Bhd | | | | | 16,571 | | | | 13,801 | |
DiGi.Com Bhd | | | | | 8,359 | | | | 9,402 | |
| | | | | | | | | | | |
| | | | | | | | | | | |
Security Description
| | | | Shares
| | Value
|
COMMON STOCKS (continued)
| | | | | | | | | | |
Malaysia (continued)
| | | | | | | | | | |
Fraser & Neave Holdings Bhd | | | | | 431 | | | $ | 3,567 | |
Gamuda Bhd | | | | | 7,132 | | | | 6,384 | |
Genting Bhd | | | | | 9,410 | | | | 13,084 | |
Genting Malaysia Bhd | | | | | 12,241 | | | | 9,404 | |
HAP Seng Consolidated Bhd | | | | | 1,960 | | | | 4,681 | |
Hartalega Holdings Bhd | | | | | 5,451 | | | | 6,862 | |
Hong Leong Bank Bhd | | | | | 1,750 | | | | 7,212 | |
IHH Healthcare Bhd | | | | | 18,926 | | | | 25,817 | |
IJM Corp. Bhd | | | | | 10,373 | | | | 5,337 | |
Inari Amertron Bhd | | | | | 10,535 | | | | 4,967 | |
IOI Corp. Bhd | | | | | 6,838 | | | | 7,151 | |
Kuala Lumpur Kepong Bhd | | | | | 1,192 | | | | 6,179 | |
Malayan Banking Bhd | | | | | 19,611 | | | | 40,363 | |
Malaysia Airports Holdings Bhd | | | | | 6,255 | | | | 11,856 | |
Maxis Bhd | | | | | 4,923 | | | | 6,350 | |
MISC Bhd | | | | | 3,491 | | | | 6,959 | |
Nestle Malaysia Bhd | | | | | 208 | | | | 7,203 | |
Petronas Chemicals Group Bhd | | | | | 8,416 | | | | 15,046 | |
Petronas Dagangan Bhd | | | | | 797 | | | | 4,494 | |
Petronas Gas Bhd | | | | | 1,745 | | | | 6,949 | |
PPB Group Bhd | | | | | 1,866 | | | | 8,083 | |
Press Metal Aluminium Holdings Bhd | | | | | 5,140 | | | | 5,855 | |
Public Bank Bhd | | | | | 10,469 | | | | 50,861 | |
QL Resources Bhd | | | | | 2,812 | | | | 4,899 | |
RHB Bank Bhd | | | | | 6,561 | | | | 9,029 | |
Sime Darby Bhd | | | | | 12,129 | | | | 6,589 | |
Sime Darby Plantation Bhd | | | | | 8,339 | | | | 9,799 | |
Telekom Malaysia Bhd | | | | | 10,206 | | | | 9,184 | |
Tenaga Nasional Bhd | | | | | 17,386 | | | | 57,669 | |
Top Glove Corp. Bhd | | | | | 6,168 | | | | 6,421 | |
Yinson Holdings Bhd | | | | | 2,809 | | | | 4,645 | |
Total Malaysia | | | | | | | | | 481,367 | |
Mexico — 5.9%
| | | | | | | | | | |
Alfa SAB de CV Class A | | | | | 11,463 | | | | 9,940 | |
Alsea SAB de CV* | | | | | 1,357 | | | | 3,620 | |
America Movil SAB de CV Class L(1) | | | | | 3,391 | | | | 53,612 | |
Arca Continental SAB de CV | | | | | 875 | | | | 4,888 | |
Banco del Bajio SA(2) | | | | | 2,753 | | | | 4,435 | |
Becle SAB de CV | | | | | 1,096 | | | | 1,894 | |
Bolsa Mexicana de Valores SAB de CV | | | | | 1,115 | | | | 2,445 | |
Cemex SAB de CV(1) | | | | | 3,269 | | | | 12,324 | |
Coca-Cola Femsa SAB de CV | | | | | 1,170 | | | | 6,429 | |
Concentradora Fibra Danhos SA de CV | | | | | 3,184 | | | | 4,803 | |
Corp. Inmobiliaria Vesta SAB de CV | | | | | 1,047 | | | | 1,747 | |
El Puerto de Liverpool SAB de CV Class C1 | | | | | 378 | | | | 1,926 | |
Fibra Uno Administracion SA de CV | | | | | 6,879 | | | | 10,449 | |
Fomento Economico Mexicano SAB de CV(1) | | | | | 499 | | | | 44,421 | |
Genomma Lab Internacional SAB de CV
Class B* | | | | | 2,331 | | | | 2,461 | |
Gentera SAB de CV | | | | | 3,072 | | | | 3,044 | |
Gruma SAB de CV Class B | | | | | 482 | | | | 5,058 | |
Grupo Aeroportuario del Centro Norte
SAB de CV | | | | | 710 | | | | 4,923 | |
Grupo Aeroportuario del Pacifico SAB de CV Class B | | | | | 799 | | | | 8,377 | |
Grupo Aeroportuario del Sureste SAB de CV Class B | | | | | 369 | | | | 6,051 | |
Grupo Bimbo SAB de CV, Series A | | | | | 3,028 | | | | 5,626 | |
The accompanying notes are an integral part of these financial statements.
33
Schedule of Investments — Virtus Glovista Emerging Markets ETF(continued)
October 31, 2019
Security Description
| | | | Shares
| | Value
|
COMMON STOCKS (continued)
| | | | �� | | | | | | |
Mexico (continued)
| | | | | | | | | | |
Grupo Carso SAB de CV, Series A1 | | | | | 4,768 | | | $ | 15,962 | |
Grupo Cementos de Chihuahua SAB de CV | | | | | 714 | | | | 3,991 | |
Grupo Elektra SAB de CV | | | | | 132 | | | | 9,593 | |
Grupo Financiero Banorte SAB de CV Class O | | | | | 7,120 | | | | 38,864 | |
Grupo Financiero Inbursa SAB de CV Class O | | | | | 14,070 | | | | 17,481 | |
Grupo Mexico SAB de CV, Series B | | | | | 6,520 | | | | 17,174 | |
Grupo Televisa SAB(1) | | | | | 1,219 | | | | 13,470 | |
Industrias Penoles SAB de CV | | | | | 255 | | | | 3,060 | |
Infraestructura Energetica Nova SAB de CV* | | | | | 1,122 | | | | 4,960 | |
Kimberly-Clark de Mexico SAB de CV
Class A* | | | | | 3,406 | | | | 6,868 | |
Megacable Holdings SAB de CV | | | | | 1,949 | | | | 8,007 | |
Orbia Advance Corp. SAB de CV | | | | | 2,325 | | | | 5,017 | |
PLA Administradora Industrial S de RL de CV | | | | | 1,956 | | | | 3,232 | |
Prologis Property Mexico SA de CV | | | | | 1,572 | | | | 3,355 | |
Promotora y Operadora de Infraestructura
SAB de CV | | | | | 283 | | | | 2,618 | |
Qualitas Controladora SAB de CV | | | | | 874 | | | | 3,769 | |
Regional SAB de CV | | | | | 788 | | | | 4,186 | |
Telesites SAB de CV* | | | | | 7,523 | | | | 4,920 | |
Wal-Mart de Mexico SAB de CV | | | | | 11,532 | | | | 34,608 | |
Total Mexico | | | | | | | | | 399,608 | |
Philippines — 7.1%
| | | | | | | | | | |
Aboitiz Equity Ventures, Inc. | | | | | 12,952 | | | | 14,280 | |
Aboitiz Power Corp. | | | | | 9,655 | | | | 7,601 | |
Alliance Global Group, Inc. | | | | | 25,826 | | | | 5,843 | |
Ayala Corp. | | | | | 1,822 | | | | 30,878 | |
Ayala Land, Inc. | | | | | 51,073 | | | | 48,864 | |
Bank of the Philippine Islands | | | | | 11,348 | | | | 21,692 | |
BDO Unibank, Inc. | | | | | 12,448 | | | | 37,998 | |
Bloomberry Resorts Corp. | | | | | 26,327 | | | | 5,183 | |
Globe Telecom, Inc. | | | | | 199 | | | | 7,153 | |
GT Capital Holdings, Inc. | | | | | 613 | | | | 10,800 | |
International Container Terminal Services, Inc. | | | | | 9,917 | | | | 23,197 | |
JG Summit Holdings, Inc. | | | | | 21,936 | | | | 32,961 | |
Jollibee Foods Corp. | | | | | 2,962 | | | | 13,542 | |
Manila Electric Co. | | | | | 1,604 | | | | 10,696 | |
Megaworld Corp. | | | | | 72,828 | | | | 6,932 | |
Metro Pacific Investments Corp. | | | | | 91,543 | | | | 8,659 | |
Metropolitan Bank & Trust Co. | | | | | 13,951 | | | | 18,585 | |
PLDT, Inc. | | | | | 709 | | | | 15,369 | |
San Miguel Corp. | | | | | 2,424 | | | | 7,977 | |
Security Bank Corp. | | | | | 3,049 | | | | 11,969 | |
SM Investments Corp. | | | | | 3,333 | | | | 67,652 | |
SM Prime Holdings, Inc. | | | | | 61,893 | | | | 47,568 | |
Universal Robina Corp. | | | | | 6,497 | | | | 19,333 | |
Total Philippines | | | | | | | | | 474,732 | |
| |
Poland — 4.9%
| | | | | | | | | | |
Alior Bank SA* | | | | | 686 | | | | 4,841 | |
Asseco Poland SA | | | | | 461 | | | | 6,190 | |
Bank Millennium SA* | | | | | 3,714 | | | | 5,973 | |
Bank Polska Kasa Opieki SA | | | | | 984 | | | | 27,764 | |
CCC SA | | | | | 165 | | | | 4,820 | |
CD Projekt SA | | | | | 402 | | | | 26,525 | |
Cyfrowy Polsat SA | | | | | 1,440 | | | | 10,440 | |
Dino Polska SA*(2) | | | | | 281 | | | | 10,959 | |
Grupa Lotos SA | | | | | 502 | | | | 12,535 | |
| | | | | | | | | | | |
| | | | | | | | | | | |
Security Description
| | | | Shares
| | Value
|
COMMON STOCKS (continued)
| | | | | | | | | | |
Poland (continued)
| | | | | | | | | | |
KGHM Polska Miedz SA* | | | | | 783 | | | $ | 17,141 | |
LPP SA | | | | | 8 | | | | 17,076 | |
mBank SA* | | | | | 80 | | | | 7,994 | |
Orange Polska SA* | | | | | 3,686 | | | | 6,030 | |
PGE Polska Grupa Energetyczna SA* | | | | | 4,927 | | | | 10,561 | |
Polski Koncern Naftowy ORLEN SA | | | | | 1,714 | | | | 46,835 | |
Polskie Gornictwo Naftowe i Gazownictwo SA | | | | | 9,511 | | | | 11,710 | |
Powszechna Kasa Oszczednosci Bank
Polski SA | | | | | 5,221 | | | | 52,092 | |
Powszechny Zaklad Ubezpieczen SA | | | | | 3,545 | | | | 34,284 | |
Santander Bank Polska SA | | | | | 202 | | | | 16,559 | |
Total Poland | | | | | | | | | 330,329 | |
Russia — 6.9%
| | | | | | | | | | |
Aeroflot PJSC | | | | | 892 | | | | 1,487 | |
Alrosa PJSC | | | | | 5,570 | | | | 6,472 | |
Credit Bank of Moscow PJSC | | | | | 26,883 | | | | 2,420 | |
Gazprom Neft PJSC | | | | | 613 | | | | 3,967 | |
Gazprom PJSC | | | | | 18,385 | | | | 74,546 | |
LUKOIL PJSC | | | | | 998 | | | | 92,131 | |
Magnit PJSC | | | | | 137 | | | | 6,905 | |
Magnitogorsk Iron & Steel Works PJSC | | | | | 3,496 | | | | 1,992 | |
MMC Norilsk Nickel PJSC | | | | | 117 | | | | 32,639 | |
Mobile TeleSystems PJSC | | | | | 1,227 | | | | 5,454 | |
Moscow Exchange MICEX-RTS PJSC | | | | | 3,436 | | | | 5,092 | |
Novatek PJSC | | | | | 2,344 | | | | 49,715 | |
Novolipetsk Steel PJSC | | | | | 1,846 | | | | 3,600 | |
PhosAgro PJSC | | | | | 89 | | | | 3,369 | |
Polyus PJSC | | | | | 53 | | | | 6,173 | |
Rosneft Oil Co. PJSC | | | | | 2,152 | | | | 14,297 | |
Rostelecom PJSC | | | | | 1,128 | | | | 1,381 | |
RusHydro PJSC | | | | | 279,940 | | | | 2,226 | |
Sberbank of Russia PJSC | | | | | 18,888 | | | | 69,189 | |
Severstal PJSC | | | | | 342 | | | | 4,705 | |
Surgutneftegas PJSC | | | | | 63,935 | | | | 42,874 | |
Tatneft PJSC | | | | | 2,719 | | | | 31,726 | |
VTB Bank PJSC | | | | | 7,411,757 | | | | 4,981 | |
Total Russia | | | | | | | | | 467,341 | |
| |
South Africa — 5.9%
| | | | | | | | | | |
Absa Group Ltd. | | | | | 1,020 | | | | 10,455 | |
Anglo American Platinum Ltd. | | | | | 93 | | | | 6,941 | |
AngloGold Ashanti Ltd.(1) | | | | | 687 | | | | 15,169 | |
Aspen Pharmacare Holdings Ltd.* | | | | | 614 | | | | 4,287 | |
Assore Ltd. | | | | | 175 | | | | 2,941 | |
AVI Ltd. | | | | | 524 | | | | 3,004 | |
Barloworld Ltd. | | | | | 343 | | | | 2,738 | |
Bid Corp. Ltd. | | | | | 509 | | | | 11,874 | |
Bidvest Group Ltd. (The) | | | | | 499 | | | | 6,805 | |
Capitec Bank Holdings Ltd. | | | | | 86 | | | | 7,814 | |
Clicks Group Ltd. | | | | | 346 | | | | 5,628 | |
Discovery Ltd. | | | | | 654 | | | | 5,205 | |
Exxaro Resources Ltd. | | | | | 414 | | | | 3,379 | |
FirstRand Ltd. | | | | | 4,708 | | | | 20,346 | |
Fortress REIT Ltd. Class A | | | | | 1,878 | | | | 2,611 | |
Foschini Group Ltd. (The) | | | | | 379 | | | | 4,364 | |
Gold Fields Ltd. | | | | | 1,275 | | | | 7,842 | |
Growthpoint Properties Ltd. | | | | | 4,641 | | | | 6,791 | |
Harmony Gold Mining Co. Ltd.* | | | | | 860 | | | | 2,976 | |
The accompanying notes are an integral part of these financial statements.
34
Schedule of Investments — Virtus Glovista Emerging Markets ETF(continued)
October 31, 2019
Security Description
| | | | Shares
| | Value
|
COMMON STOCKS (continued)
| | | | | | | | | | |
South Africa (continued)
| | | | | | | | | | |
Impala Platinum Holdings Ltd.* | | | | | 1,147 | | | $ | 7,883 | |
Investec Ltd. | | | | | 432 | | | | 2,456 | |
Kumba Iron Ore Ltd. | | | | | 150 | | | | 3,653 | |
Life Healthcare Group Holdings Ltd. | | | | | 1,875 | | | | 2,961 | |
Momentum Metropolitan Holdings | | | | | 1,473 | | | | 1,969 | |
Mr Price Group Ltd. | | | | | 385 | | | | 4,072 | |
MTN Group Ltd. | | | | | 1,721 | | | | 10,659 | |
Naspers Ltd. Class N | | | | | 664 | | | | 94,285 | |
Nedbank Group Ltd. | | | | | 546 | | | | 8,281 | |
Netcare Ltd. | | | | | 2,112 | | | | 2,392 | |
Northam Platinum Ltd.* | | | | | 564 | | | | 3,807 | |
Pick n Pay Stores Ltd. | | | | | 562 | | | | 2,458 | |
PSG Group Ltd. | | | | | 266 | | | | 4,157 | |
Rand Merchant Investment Holdings Ltd. | | | | | 1,615 | | | | 3,191 | |
Redefine Properties Ltd. | | | | | 7,942 | | | | 3,963 | |
Remgro Ltd. | | | | | 759 | | | | 8,703 | |
Resilient REIT Ltd. | | | | | 359 | | | | 1,599 | |
RMB Holdings Ltd. | | | | | 1,399 | | | | 7,358 | |
Sanlam Ltd. | | | | | 2,843 | | | | 14,971 | |
Sappi Ltd. | | | | | 819 | | | | 2,103 | |
Sasol Ltd. | | | | | 782 | | | | 14,194 | |
Shoprite Holdings Ltd. | | | | | 677 | | | | 6,067 | |
Sibanye Gold Ltd.* | | | | | 2,237 | | | | 4,315 | |
SPAR Group Ltd. (The) | | | | | 315 | | | | 4,233 | |
Standard Bank Group Ltd. | | | | | 2,298 | | | | 26,381 | |
Telkom SA SOC Ltd. | | | | | 487 | | | | 2,228 | |
Tiger Brands Ltd. | | | | | 267 | | | | 3,792 | |
Truworths International Ltd. | | | | | 679 | | | | 2,407 | |
Vodacom Group Ltd. | | | | | 696 | | | | 6,073 | |
Vukile Property Fund Ltd. | | | | | 1,443 | | | | 1,847 | |
Woolworths Holdings Ltd. | | | | | 1,645 | | | | 6,259 | |
Total South Africa | | | | | | | | | 399,887 | |
South Korea — 6.9%
| | | | | | | | | | |
Amorepacific Corp. | | | | | 23 | | | | 3,796 | |
Celltrion Healthcare Co. Ltd.* | | | | | 54 | | | | 2,557 | |
Celltrion, Inc.* | | | | | 63 | | | | 10,830 | |
Hana Financial Group, Inc. | | | | | 242 | | | | 7,010 | |
HLB, Inc.* | | | | | 29 | | | | 4,188 | |
Hotel Shilla Co. Ltd. | | | | | 28 | | | | 1,865 | |
Hyundai Engineering & Construction Co. Ltd. | | | | | 32 | | | | 1,181 | |
Hyundai Heavy Industries Holdings Co. Ltd. | | | | | 4 | | | | 1,174 | |
Hyundai Mobis Co. Ltd. | | | | | 51 | | | | 10,433 | |
Hyundai Motor Co. | | | | | 108 | | | | 11,325 | |
Hyundai Steel Co. | | | | | 38 | | | | 1,039 | |
Industrial Bank of Korea | | | | | 110 | | | | 1,116 | |
Kakao Corp. | | | | | 39 | | | | 4,743 | |
Kangwon Land, Inc. | | | | | 138 | | | | 3,719 | |
KB Financial Group, Inc. | | | | | 308 | | | | 11,105 | |
Kia Motors Corp. | | | | | 189 | | | | 6,912 | |
Korea Aerospace Industries Ltd. | | | | | 75 | | | | 2,450 | |
Korea Electric Power Corp.* | | | | | 411 | | | | 8,990 | |
Korea Shipbuilding & Offshore
Engineering Co. Ltd.* | | | | | 30 | | | | 3,146 | |
Korea Zinc Co. Ltd. | | | | | 7 | | | | 2,614 | |
KT Corp.(1) | | | | | 363 | | | | 4,076 | |
KT&G Corp. | | | | | 98 | | | | 8,423 | |
LG Chem Ltd. | | | | | 35 | | | | 9,250 | |
LG Corp. | | | | | 70 | | | | 4,176 | |
| | | | | | | | | | | |
| | | | | | | | | | | |
Security Description
| | | | Shares
| | Value
|
COMMON STOCKS (continued)
| | | | | | | | | | |
South Korea (continued)
| | | | | | | | | | |
LG Display Co. Ltd.* | | | | | 99 | | | $ | 1,161 | |
LG Electronics, Inc. | | | | | 83 | | | | 4,773 | |
LG Household & Health Care Ltd. | | | | | 8 | | | | 8,671 | |
LG Uplus Corp. | | | | | 120 | | | | 1,387 | |
Lotte Chemical Corp. | | | | | 8 | | | | 1,561 | |
NAVER Corp. | | | | | 112 | | | | 15,788 | |
NCSoft Corp. | | | | | 13 | | | | 5,766 | |
POSCO | | | | | 64 | | | | 11,634 | |
Samsung Biologics Co. Ltd.*(2) | | | | | 12 | | | | 4,110 | |
Samsung C&T Corp. | | | | | 61 | | | | 5,243 | |
Samsung Card Co. Ltd. | | | | | 48 | | | | 1,384 | |
Samsung Electro-Mechanics Co. Ltd. | | | | | 41 | | | | 3,982 | |
Samsung Electronics Co. Ltd. | | | | | 4,087 | | | | 177,047 | |
Samsung Fire & Marine Insurance Co. Ltd. | | | | | 30 | | | | 5,583 | |
Samsung Heavy Industries Co. Ltd.* | | | | | 191 | | | | 1,190 | |
Samsung Life Insurance Co. Ltd. | | | | | 55 | | | | 3,337 | |
Samsung SDI Co. Ltd. | | | | | 39 | | | | 7,626 | |
Samsung SDS Co. Ltd. | | | | | 24 | | | | 4,157 | |
Shinhan Financial Group Co. Ltd. | | | | | 341 | | | | 12,456 | |
SillaJen, Inc.* | | | | | 28 | | | | 463 | |
SK Holdings Co. Ltd. | | | | | 26 | | | | 5,777 | |
SK Hynix, Inc. | | | | | 402 | | | | 28,333 | |
SK Innovation Co. Ltd. | | | | | 44 | | | | 6,051 | |
SK Telecom Co. Ltd. | | | | | 39 | | | | 7,944 | |
S-Oil Corp. | | | | | 33 | | | | 2,828 | |
Woongjin Coway Co. Ltd. | | | | | 41 | | | | 3,235 | |
Woori Financial Group, Inc. | | | | | 407 | | | | 4,110 | |
Total South Korea | | | | | | | | | 461,715 | |
Spain — 0.1%
| | | | | | | | | | |
AmRest Holdings SE* | | | | | 419 | | | | 5,187 | |
Taiwan — 8.0%
| | | | | | | | | | |
Accton Technology Corp. | | | | | 339 | | | | 2,021 | |
Advantech Co. Ltd. | | | | | 281 | | | | 2,783 | |
ASE Technology Holding Co. Ltd. | | | | | 2,899 | | | | 7,571 | |
Asia Cement Corp. | | | | | 1,961 | | | | 2,773 | |
Asustek Computer, Inc. | | | | | 627 | | | | 4,253 | |
Catcher Technology Co. Ltd. | | | | | 663 | | | | 5,619 | |
Cathay Financial Holding Co. Ltd. | | | | | 7,670 | | | | 10,154 | |
Chailease Holding Co. Ltd. | | | | | 914 | | | | 4,129 | |
Chang Hwa Commercial Bank Ltd. | | | | | 3,568 | | | | 2,784 | |
Cheng Shin Rubber Industry Co. Ltd. | | | | | 1,400 | | | | 2,201 | |
China Development Financial Holding Corp. | | | | | 11,774 | | | | 3,675 | |
China Steel Corp. | | | | | 10,480 | | | | 8,073 | |
Chunghwa Telecom Co. Ltd. | | | | | 3,823 | | | | 14,066 | |
CTBC Financial Holding Co. Ltd. | | | | | 15,335 | | | | 10,680 | |
Delta Electronics, Inc. | | | | | 1,896 | | | | 8,346 | |
E.Sun Financial Holding Co. Ltd. | | | | | 10,122 | | | | 9,161 | |
Far Eastern New Century Corp. | | | | | 2,620 | | | | 2,548 | |
Far EasTone Telecommunications Co. Ltd. | | | | | 1,670 | | | | 4,005 | |
Feng Tay Enterprise Co. Ltd. | | | | | 33 | | | | 223 | |
First Financial Holding Co. Ltd. | | | | | 8,395 | | | | 6,164 | |
Formosa Chemicals & Fibre Corp. | | | | | 3,251 | | | | 9,462 | |
Formosa Petrochemical Corp. | | | | | 721 | | | | 2,295 | |
Formosa Plastics Corp. | | | | | 3,623 | | | | 11,640 | |
Fubon Financial Holding Co. Ltd. | | | | | 5,964 | | | | 8,728 | |
Hon Hai Precision Industry Co. Ltd. | | | | | 11,428 | | | | 30,259 | |
Hotai Motor Co. Ltd. | | | | | 258 | | | | 4,560 | |
The accompanying notes are an integral part of these financial statements.
35
Schedule of Investments — Virtus Glovista Emerging Markets ETF(continued)
October 31, 2019
Security Description
| | | | Shares
| | Value
|
COMMON STOCKS (continued)
| | | | | | | | | | |
Taiwan (continued)
| | | | | | | | | | |
Hua Nan Financial Holdings Co. Ltd. | | | | | 7,248 | | | $ | 5,215 | |
Largan Precision Co. Ltd. | | | | | 95 | | | | 13,950 | |
Lite-On Technology Corp. | | | | | 1,766 | | | | 2,912 | |
MediaTek, Inc. | | | | | 1,304 | | | | 17,478 | |
Mega Financial Holding Co. Ltd. | | | | | 9,068 | | | | 8,907 | |
Nan Ya Plastics Corp. | | | | | 4,696 | | | | 11,107 | |
Novatek Microelectronics Corp. | | | | | 523 | | | | 3,368 | |
Pegatron Corp. | | | | | 1,425 | | | | 2,776 | |
Pou Chen Corp. | | | | | 1,990 | | | | 2,664 | |
President Chain Store Corp. | | | | | 521 | | | | 5,203 | |
Quanta Computer, Inc. | | | | | 2,553 | | | | 4,906 | |
Realtek Semiconductor Corp. | | | | | 342 | | | | 2,545 | |
Shanghai Commercial & Savings
Bank Ltd. (The) | | | | | 3,003 | | | | 5,179 | |
Shin Kong Financial Holding Co. Ltd.* | | | | | 9,146 | | | | 2,890 | |
SinoPac Financial Holdings Co. Ltd. | | | | | 8,523 | | | | 3,500 | |
Taishin Financial Holding Co. Ltd. | | | | | 8,559 | | | | 3,979 | |
Taiwan Cement Corp. | | | | | 4,591 | | | | 6,101 | |
Taiwan Cooperative Financial Holding Co. Ltd. | | | | | 7,835 | | | | 5,392 | |
Taiwan Mobile Co. Ltd. | | | | | 1,453 | | | | 5,418 | |
Taiwan Semiconductor Manufacturing Co. Ltd. | | | | | 22,209 | | | | 217,782 | |
Uni-President Enterprises Corp. | | | | | 4,496 | | | | 11,107 | |
United Microelectronics Corp. | | | | | 10,248 | | | | 4,713 | |
Win Semiconductors Corp. | | | | | 211 | | | | 2,204 | |
Yageo Corp. | | | | | 254 | | | | 2,620 | |
Yuanta Financial Holding Co. Ltd. | | | | | 8,679 | | | | 5,432 | |
Total Taiwan | | | | | | | | | 535,521 | |
Thailand — 8.1%
| | | | | | | | | | |
Advanced Info Service PCL | | | | | 2,659 | | | | 20,166 | |
Airports of Thailand PCL | | | | | 11,227 | | | | 29,095 | |
B Grimm Power PCL | | | | | 2,194 | | | | 3,488 | |
Bangchak Corp. PCL | | | | | 2,657 | | | | 2,173 | |
Bangkok Bank PCL | | | | | 4,788 | | | | 27,591 | |
Bangkok Chain Hospital PCL | | | | | 5,147 | | | | 2,864 | |
Bangkok Dusit Medical Services PCL | | | | | 25,433 | | | | 20,215 | |
Bangkok Expressway & Metro PCL | | | | | 18,880 | | | | 6,753 | |
Banpu PCL | | | | | 10,770 | | | | 4,137 | |
Berli Jucker PCL | | | | | 3,150 | | | | 5,086 | |
BTS Group Holdings PCL | | | | | 22,776 | | | | 10,108 | |
Bumrungrad Hospital PCL | | | | | 1,246 | | | | 4,972 | |
Central Pattana PCL | | | | | 7,114 | | | | 15,078 | |
CH Karnchang PCL | | | | | 2,631 | | | | 1,777 | |
Charoen Pokphand Foods PCL | | | | | 12,751 | | | | 10,663 | |
CP ALL PCL | | | | | 15,597 | | | | 40,290 | |
CPN Retail Growth Leasehold REIT | | | | | 4,022 | | | | 4,695 | |
Delta Electronics Thailand PCL | | | | | 1,423 | | | | 2,074 | |
Electricity Generating PCL | | | | | 680 | | | | 7,815 | |
Energy Absolute PCL | | | | | 5,700 | | | | 7,740 | |
Global Power Synergy PCL | | | | | 4,941 | | | | 13,459 | |
Gulf Energy Development PCL | | | | | 2,367 | | | | 12,699 | |
Home Product Center PCL | | | | | 12,763 | | | | 7,270 | |
Indorama Ventures PCL | | | | | 5,094 | | | | 4,724 | |
Intouch Holdings PCL | | | | | 5,768 | | | | 12,608 | |
IRPC PCL | | | | | 30,718 | | | | 3,459 | |
Kasikornbank PCL | | | | | 6,692 | | | | 30,806 | |
Kiatnakin Bank PCL | | | | | 1,606 | | | | 3,484 | |
Krung Thai Bank PCL | | | | | 38,515 | | | | 21,174 | |
Land & Houses PCL | | | | | 21,138 | | | | 6,790 | |
| | | | | | | | | | | |
| | | | | | | | | | | |
Security Description
| | | | Shares
| | Value
|
COMMON STOCKS (continued)
| | | | | | | | | | |
Thailand (continued)
| | | | | | | | | | |
Minor International PCL | | | | | 8,530 | | | $ | 10,170 | |
Muangthai Capital PCL | | | | | 1,615 | | | | 3,316 | |
PTT Exploration & Production PCL | | | | | 3,594 | | | | 14,343 | |
PTT Global Chemical PCL | | | | | 6,072 | | | | 10,256 | |
PTT PCL | | | | | 36,921 | | | | 55,330 | |
Ratch Group PCL | | | | | 2,028 | | | | 4,936 | |
Robinson PCL | | | | | 997 | | | | 2,154 | |
Siam Cement PCL (The) | | | | | 1,972 | | | | 23,968 | |
Siam Commercial Bank PCL (The) | | | | | 6,586 | | | | 24,429 | |
Srisawad Corp. PCL | | | | | 2,667 | | | | 5,697 | |
Supalai PCL | | | | | 3,329 | | | | 1,786 | |
Thai Oil PCL | | | | | 2,720 | | | | 6,171 | |
Thai Union Group PCL | | | | | 7,347 | | | | 3,552 | |
Thanachart Capital PCL | | | | | 2,667 | | | | 4,681 | |
Tisco Financial Group PCL | | | | | 1,515 | | | | 4,892 | |
TMB Bank PCL | | | | | 142,642 | | | | 6,803 | |
TOA Paint Thailand PCL | | | | | 1,380 | | | | 2,057 | |
Total Access Communication PCL | | | | | 1,922 | | | | 3,946 | |
True Corp. PCL | | | | | 42,459 | | | | 7,031 | |
WHA Corp. PCL | | | | | 18,267 | | | | 2,831 | |
Total Thailand | | | | | | | | | 541,602 | |
Turkey — 7.0%
| | | | | | | | | | |
Akbank T.A.S.* | | | | | 48,813 | | | | 58,997 | |
Arcelik AS* | | | | | 3,973 | | | | 12,314 | |
Aselsan Elektronik Sanayi Ve Ticaret AS | | | | | 4,475 | | | | 14,363 | |
BIM Birlesik Magazalar AS | | | | | 7,091 | | | | 58,690 | |
Enka Insaat ve Sanayi AS | | | | | 22,956 | | | | 23,168 | |
Eregli Demir ve Celik Fabrikalari TAS | | | | | 21,320 | | | | 24,388 | |
Ford Otomotiv Sanayi AS | | | | | 1,125 | | | | 12,692 | |
Haci Omer Sabanci Holding AS | | | | | 20,599 | | | | 29,796 | |
KOC Holding AS | | | | | 17,037 | | | | 55,814 | |
Tupras Turkiye Petrol Rafinerileri AS | | | | | 1,925 | | | | 41,919 | |
Turk Hava Yollari AO* | | | | | 10,941 | | | | 22,275 | |
Turkcell Iletisim Hizmetleri AS | | | | | 16,591 | | | | 36,477 | |
Turkiye Garanti Bankasi AS* | | | | | 33,706 | | | | 54,239 | |
Turkiye Is Bankasi AS Class C* | | | | | 22,727 | | | | 23,056 | |
Total Turkey | | | | | | | | | 468,188 | |
United States — 0.1%
| | | | | | | | | | |
JBS SA | | | | | 861 | | | | 6,074 | |
Total Common Stocks
| | | | | | | | | | |
(Cost $6,038,664) | | | | | | | | | 6,173,148 | |
EXCHANGE TRADED FUNDS — 7.1%
| | | | | | | | | | |
United States — 7.1%
| | | | | | | | | | |
Franklin FTSE India ETF | | | | | 11,119 | | | | 254,247 | |
iShares MSCI Chile ETF | | | | | 6,404 | | | | 221,098 | |
Total United States | | | | | | | | | 475,345 | |
Total Exchange Traded Funds
| | | | | | | | | | |
(Cost $461,013) | | | | | | | | | 475,345 | |
PREFERRED STOCKS — 0.8%
| | | | | | | | | | |
Brazil — 0.6%
| | | | | | | | | | |
Azul SA, 0.00%* | | | | | 253 | | | | 3,313 | |
Centrais Eletricas Brasileiras SA, 3.45% Class B | | | | | 242 | | | | 2,473 | |
Cia Brasileira de Distribuicao, 1.38% | | | | | 156 | | | | 3,228 | |
The accompanying notes are an integral part of these financial statements.
36
Schedule of Investments — Virtus Glovista Emerging Markets ETF(continued)
October 31, 2019
Security Description
| | | | Shares
| | Value
|
PREFERRED STOCKS (continued)
| | | | | | | | | | |
Brazil (continued)
| | | | | | | | | | |
Cia Energetica de Minas Gerais, 4.43% | | | | | 894 | | | $ | 3,043 | |
Gol Linhas Aereas Inteligentes SA, 0.00%
Class Preference* | | | | | 207 | | | | 1,889 | |
Itausa — Investimentos Itau SA, 5.23% | | | | | 4,165 | | | | 14,238 | |
Lojas Americanas SA, 0.37% | | | | | 799 | | | | 3,983 | |
Telefonica Brasil SA, 6.93% | | | | | 393 | | | | 5,202 | |
Total Brazil | | | | | | | | | 37,369 | |
Chile — 0.1%
| | | | | | | | | | |
Embotelladora Andina SA, 4.42% Class B | | | | | 3,052 | | | | 8,807 | |
Russia — 0.1%
| | | | | | | | | | |
Transneft PJSC, 6.59% | | | | | 3 | | | | 7,790 | |
Total Preferred Stocks
| | | | | | | | | | |
(Cost $49,134) | | | | | | | | | 53,966 | |
RIGHTS — 0.0%(4)
| | | | | | | | | | |
Taiwan — 0.0%(4)
| | | | | | | | | | |
Cathay Financial Holding Co. Ltd.,
expiring 11/29/2019* | | | | | 203 | | | | 35 | |
Thailand — 0.0%(4)
| | | | | | | | | | |
TMB Bank PCL Class R, expiring 1/31/2020* | | | | | 33,971 | | | | 45 | |
Total Rights
| | | | | | | | | | |
(Cost $0) | | | | | | | | | 80 | |
WARRANT — 0.0%(4)
| | | | | | | | | | |
Thailand — 0.0%(4)
| | | | | | | | | | |
Minor International PCL, expiring 9/30/2021*
(Cost $0) | | | | | 730 | | | | 73 | |
| | | | | | | | | | | |
| | | | | | | | | | | |
Security Description
| | | | Shares
| | Value
|
TOTAL INVESTMENTS — 99.8%
| | | | | | | | | | |
(Cost $6,548,811) | | | | | | | | $ | 6,702,612 | |
Other Assets in Excess of Liabilities — 0.2% | | | | | | | | | 12,457 | |
Net Assets — 100.0% | | | | | | | | $ | 6,715,069 | |
* | | Non-income producing security. |
(1) | | American Depositary Receipts. |
(2) | | Security was purchased pursuant to Rule 144A under the Securities Act of 1933 and may not be resold subject to that rule except to qualified institutional buyers. Unless otherwise noted, 144A securities are deemed to be liquid. At October 31, 2019, the aggregate value of these securities was $35,132, or 0.5% of net assets. |
(3) | | Global Depositary Receipts. |
(4) | | Amount rounds to less than 0.05%. |
Sector Breakdown
| | | | | | |
As of October 31, 2019 (based on net assets)
| | | | | | |
| |
Financials | | | | | 26.0 | %+ |
Energy | | | | | 9.6 | % |
Information Technology | | | | | 8.7 | % |
Industrials | | | | | 8.3 | % |
Communication Services | | | | | 8.3 | % |
Consumer Discretionary | | | | | 8.3 | % |
Consumer Staples | | | | | 7.5 | % |
Materials | | | | | 7.0 | % |
Utilities | | | | | 4.1 | % |
Real Estate | | | | | 3.1 | % |
Health Care | | | | | 1.8 | % |
Equity Funds | | | | | 7.1 | % |
Other Assets in Excess of Liabilities | | | | | 0.2 | % |
Total | | | | | 100.0 | % |
+ | | Amounts represent investments in particular sectors. No industry within these sectors represented more than 25% of the Fund’s total assets at the time of investment. |
The following table summarizes valuation of the Fund’s investments under the fair value hierarchy levels as of October 31, 2019.
| | | | Level 1
| | Level 2
| | Level 3
| | Total
|
Asset Valuation Inputs
| | | | | | | | | | | | | | | | | | |
Common Stocks | | | | $ | 6,173,148 | | | $ | — | | | $ | — | | | $ | 6,173,148 | |
Exchange Traded Funds | | | | | 475,345 | | | | — | | | | — | | | | 475,345 | |
Preferred Stocks | | | | | 53,966 | | | | — | | | | — | | | | 53,966 | |
Rights | | | | | — | | | | 80 | | | | — | | | | 80 | |
Warrant | | | | | 73 | | | | — | | | | — | | | | 73 | |
Total | | | | $ | 6,702,532 | | | $ | 80 | | | $ | — | | | $ | 6,702,612 | |
The accompanying notes are an integral part of these financial statements.
37
Schedule of Investments — Virtus InfraCap U.S. Preferred Stock ETF
October 31, 2019
Security Description
| | | | Shares
| | Value
|
PREFERRED STOCKS — 115.0%(1)
| | | | | | | | | | |
Communication Services — 6.0%
| | | | | | | | | | |
GCI Liberty, Inc., Series A, 7.00% | | | | | 20,044 | | | $ | 526,556 | |
Qwest Corp., 6.13% | | | | | 73,998 | | | | 1,827,750 | |
Qwest Corp., 6.50% | | | | | 45,453 | | | | 1,158,597 | |
Qwest Corp., 6.75% | | | | | 32,596 | | | | 858,253 | |
Telephone & Data Systems, Inc., 5.88% | | | | | 36,685 | | | | 918,225 | |
Total Communication Services | | | | | | | | | 5,289,381 | |
Energy — 16.6%
| | | | | | | | | | |
DCP Midstream LP, Series B, 7.88% | | | | | 161,068 | | | | 3,957,441 | |
DCP Midstream LP, Series C, 7.95% | | | | | 33,876 | | | | 847,916 | |
Energy Transfer Operating LP, Series C, 7.38% | | | | | 146,885 | | | | 3,557,555 | |
Energy Transfer Operating LP, Series D, 7.63% | | | | | 17,632 | | | | 435,158 | |
Energy Transfer Operating LP, Series E, 7.60% | | | | | 4,754 | | | | 120,181 | |
GasLog Partners LP, Series A, 8.63% (Monaco) | | | | | 16,088 | | | | 417,484 | |
GasLog Partners LP, Series B, 8.20% (Monaco) | | | | | 22,343 | | | | 555,670 | |
Golar LNG Partners LP, Series A, 8.75%
(United Kingdom) | | | | | 4,280 | | | | 109,996 | |
Hoegh LNG Partners LP, Series A, 8.75% (Bermuda) | | | | | 13,730 | | | | 370,023 | |
NuStar Energy LP, Series A, 8.50% | | | | | 51,734 | | | | 1,257,654 | |
NuStar Energy LP, Series B, 7.63% | | | | | 33,894 | | | | 766,343 | |
NuStar Energy LP, Series C, 9.00% | | | | | 92,327 | | | | 2,301,712 | |
Total Energy | | | | | | | | | 14,697,133 | |
Financials — 40.0%
| | | | | | | | | | |
AG Mortgage Investment Trust, Inc.,
Series C, 8.00%* | | | | | 14,700 | | | | 380,730 | |
AGNC Investment Corp., Series D, 6.88% | | | | | 9,808 | | | | 248,927 | |
AGNC Investment Corp., Series E, 6.50%* | | | | | 24,368 | | | | 626,989 | |
Annaly Capital Management, Inc.,
Series F, 6.95% | | | | | 5,476 | | | | 142,595 | |
Annaly Capital Management, Inc.,
Series G, 6.50% | | | | | 144,548 | | | | 3,736,566 | |
Annaly Capital Management, Inc.,
Series I, 6.75% | | | | | 2,152 | | | | 55,887 | |
Apollo Global Management, Inc.,
Series A, 6.38% | | | | | 20,509 | | | | 540,822 | |
Arch Capital Group Ltd., Series E, 5.25% | | | | | 29,538 | | | | 753,219 | |
ARMOUR Residential REIT, Inc.,
Series B, 7.88% | | | | | 96,521 | | | | 2,420,747 | |
Axis Capital Holdings Ltd., Series D, 5.50% | | | | | 9,252 | | | | 233,613 | |
Bank of America Corp., Series KK, 5.38% | | | | | 5,070 | | | | 134,913 | |
Capital One Financial Corp., Series G, 5.20% | | | | | 3,095 | | | | 79,263 | |
Capital One Financial Corp., Series I, 5.00%* | | | | | 27,359 | | | | 687,532 | |
Chimera Investment Corp., Series A, 8.00% | | | | | 66,520 | | | | 1,752,802 | |
Chimera Investment Corp., Series B, 8.00% | | | | | 30,788 | | | | 812,803 | |
Chimera Investment Corp., Series C, 7.75% | | | | | 20,417 | | | | 514,100 | |
Chimera Investment Corp., Series D, 8.00% | | | | | 43,374 | | | | 1,116,447 | |
Compass Diversified Holdings, Series A, 7.25% | | | | | 45,927 | | | | 1,114,648 | |
Compass Diversified Holdings, Series B, 7.88% | | | | | 10,949 | | | | 273,397 | |
Cowen, Inc., 7.35% | | | | | 35,557 | | | | 933,371 | |
Ellington Financial, Inc., 6.75%* | | | | | 61,545 | | | | 1,556,473 | |
Enstar Group Ltd., Series D, 7.00% (Bermuda) | | | | | 23,380 | | | | 639,677 | |
IBERIABANK Corp., Series D, 6.10% | | | | | 753 | | | | 20,022 | |
Invesco Mortgage Capital, Inc., Series B, 7.75% | | | | | 294 | | | | 8,185 | |
Invesco Mortgage Capital, Inc., Series C, 7.50% | | | | | 43,716 | | | | 1,166,343 | |
Legg Mason, Inc., 5.45% | | | | | 3,048 | | | | 79,644 | |
National General Holdings Corp.,
Series B, 7.50% | | | | | 108,071 | | | | 2,661,789 | |
| | | | | | | | | | | |
| | | | | | | | | | | |
Security Description
| | | | Shares
| | Value
|
PREFERRED STOCKS (continued)
| | | | | | | | | | |
Financials (continued)
| | | | | | | | | | |
National General Holdings Corp.,
Series C, 7.50% | | | | | 56,694 | | | $ | 1,402,610 | |
New York Community Capital Trust V, 6.00% | | | | | 4,359 | | | | 221,219 | |
New York Mortgage Trust, Inc.,
Series B, 7.75% | | | | | 23,691 | | | | 597,013 | |
New York Mortgage Trust, Inc.,
Series C, 7.88% | | | | | 4,475 | | | | 113,038 | |
New York Mortgage Trust, Inc.,
Series D, 8.00% | | | | | 87,177 | | | | 2,221,270 | |
New York Mortgage Trust, Inc.,
Series E, 7.88%* | | | | | 62,378 | | | | 1,554,460 | |
Northern Trust Corp., Series E, 4.70%* | | | | | 20,303 | | | | 508,793 | |
Oaktree Capital Group LLC, Series A, 6.63% | | | | | 86,451 | | | | 2,331,583 | |
PennyMac Mortgage Investment Trust,
Series A, 8.13% | | | | | 15,717 | | | | 423,259 | |
PennyMac Mortgage Investment Trust,
Series B, 8.00% | | | | | 34,529 | | | | 904,660 | |
Two Harbors Investment Corp., Series C, 7.25% | | | | | 23,748 | | | | 608,661 | |
Two Harbors Investment Corp., Series E, 7.50% | | | | | 73,276 | | | | 1,843,624 | |
Wells Fargo & Co., Series X, 5.50% | | | | | 1,171 | | | | 30,434 | |
Total Financials | | | | | | | | | 35,452,128 | |
Industrials — 3.4%
| | | | | | | | | | |
Seaspan Corp., Series D, 7.95% (Hong Kong) | | | | | 7,947 | | | | 199,311 | |
Seaspan Corp., Series G, 8.20% (Hong Kong) | | | | | 40,793 | | | | 1,044,301 | |
Seaspan Corp., Series H, 7.88% (Hong Kong) | | | | | 3,735 | | | | 94,906 | |
Seaspan Corp., Series I, 8.00% (Hong Kong) | | | | | 64,348 | | | | 1,646,022 | |
Total Industrials | | | | | | | | | 2,984,540 | |
Real Estate — 42.8%
| | | | | | | | | | |
American Finance Trust, Inc., Series A, 7.50% | | | | | 169,113 | | | | 4,280,250 | |
Ashford Hospitality Trust, Inc., Series F, 7.38% | | | | | 75,753 | | | | 1,658,233 | |
Ashford Hospitality Trust, Inc., Series G, 7.38% | | | | | 62,572 | | | | 1,320,269 | |
Ashford Hospitality Trust, Inc., Series H, 7.50% | | | | | 68,603 | | | | 1,488,685 | |
Ashford Hospitality Trust, Inc., Series I, 7.50% | | | | | 93,110 | | | | 1,989,761 | |
Braemar Hotels & Resorts, Inc.,
Series b, 5.50% | | | | | 165,254 | | | | 3,420,758 | |
Braemar Hotels & Resorts, Inc.,
Series D, 8.25% | | | | | 1,320 | | | | 35,209 | |
Brookfield Property REIT, Inc., Series A, 6.38% | | | | | 1,188 | | | | 29,961 | |
Colony Capital, Inc., Series B, 8.25% | | | | | 12,493 | | | | 317,197 | |
Colony Capital, Inc., Series E, 8.75% | | | | | 12,426 | | | | 316,987 | |
Colony Capital, Inc., Series H, 7.13% | | | | | 36,251 | | | | 866,036 | |
Colony Capital, Inc., Series I, 7.15% | | | | | 122,577 | | | | 2,917,333 | |
Colony Capital, Inc., Series J, 7.13% | | | | | 21,450 | | | | 510,081 | |
Digital Realty Trust, Inc., Series J, 5.25% | | | | | 90 | | | | 2,350 | |
EPR Properties, Series G, 5.75% | | | | | 86,288 | | | | 2,265,060 | |
Equity Commonwealth, Series D, 6.50% | | | | | 80,747 | | | | 2,286,755 | |
Federal Realty Investment Trust,
Series C, 5.00% | | | | | 15,132 | | | | 388,892 | |
Global Net Lease, Inc., Series A, 7.25% | | | | | 40,275 | | | | 1,055,608 | |
Hersha Hospitality Trust, Series D, 6.50% | | | | | 66,764 | | | | 1,650,406 | |
Hersha Hospitality Trust, Series E, 6.50% | | | | | 37,938 | | | | 962,108 | |
Kimco Realty Corp., Series J, 5.50% | | | | | 29,620 | | | | 751,163 | |
Kimco Realty Corp., Series M, 5.25% | | | | | 594 | | | | 15,408 | |
Lexington Realty Trust, Series C, 6.50% | | | | | 2,272 | | | | 129,845 | |
Monmouth Real Estate Investment Corp.,
Series C, 6.13% | | | | | 17,498 | | | | 437,450 | |
National Retail Properties, Inc., Series F, 5.20% | | | | | 4,176 | | | | 108,158 | |
The accompanying notes are an integral part of these financial statements.
38
Schedule of Investments — Virtus InfraCap U.S. Preferred Stock ETF(continued)
October 31, 2019
Security Description
| | | | Shares
| | Value
|
PREFERRED STOCKS (continued)
| | | | | | | | | | |
Real Estate (continued)
| | | | | | | | | | |
National Storage Affiliates Trust,
Series A, 6.00% | | | | | 1,473 | | | $ | 38,858 | |
Pennsylvania Real Estate Investment Trust,
Series C, 7.20% | | | | | 1,999 | | | | 40,720 | |
PS Business Parks, Inc., Series W, 5.20% | | | | | 19,630 | | | | 502,332 | |
PS Business Parks, Inc., Series Z, 4.88%* | | | | | 21,614 | | | | 538,189 | |
Public Storage, Series W, 5.20% | | | | | 56,507 | | | | 1,434,148 | |
Public Storage, Series X, 5.20% | | | | | 27,441 | | | | 696,727 | |
RLJ Lodging Trust, Series A, 1.95% | | | | | 102,562 | | | | 2,796,866 | |
Saul Centers, Inc., Series E, 6.00% | | | | | 46,658 | | | | 1,243,436 | |
Urstadt Biddle Properties, Inc.,
Series K, 5.88%* | | | | | 24,368 | | | | 631,862 | |
Washington Prime Group, Inc., Series H, 7.50% | | | | | 34,054 | | | | 776,431 | |
Total Real Estate | | | | | | | | | 37,903,532 | |
Utilities — 6.2%
| | | | | | | | | | |
Dominion Energy, Inc., Series A, 7.25% | | | | | 90 | | | | 9,649 | |
NextEra Energy Capital Holdings, Inc., 5.00% | | | | | 17,364 | | | | 435,489 | |
SCE Trust II, 5.10% | | | | | 88,734 | | | | 2,017,811 | |
SCE Trust IV, Series J, 5.38% | | | | | 6,838 | | | | 159,189 | |
SCE Trust VI, 5.00% | | | | | 124,755 | | | | 2,789,522 | |
South Jersey Industries, Inc., 5.63%* | | | | | 2,010 | | | | 52,682 | |
Total Utilities | | | | | | | | | 5,464,342 | |
Total Preferred Stocks
| | | | | | | | | | |
(Cost $100,074,415) | | | | | | | | | 101,791,056 | |
| |
COMMON STOCKS — 6.8%(1)
| | | | | | | | | | |
| |
Communication Services — 0.2%
| | | | | | | | | | |
Verizon Communications, Inc.(2) | | | | | 3,517 | | | | 212,673 | |
Energy — 1.9%
| | | | | | | | | | |
Kinder Morgan, Inc.(2) | | | | | 83,623 | | | | 1,670,788 | |
Real Estate — 3.3%
| | | | | | | | | | |
Boston Properties, Inc.(2) | | | | | 21,121 | | | | 2,897,801 | |
Utilities — 1.4%
| | | | | | | | | | |
Dominion Energy, Inc.(2) | | | | | 5,160 | | | | 425,958 | |
Sempra Energy | | | | | 274 | | | | 39,596 | |
Southern Co. (The)(2) | | | | | 12,081 | | | | 756,995 | |
Total Utilities | | | | | | | | | 1,222,549 | |
Total Common Stocks
| | | | | | | | | | |
(Cost $5,951,770) | | | | | | | | | 6,003,811 | |
EXCHANGE TRADED FUNDS — 2.6%(1)
| | | | | | | | | | |
Equity Funds — 2.6%
| | | | | | | | | | |
iShares U.S. Real Estate ETF(2) | | | | | 19,189 | | | | 1,808,755 | |
Utilities Select Sector SPDR Fund(2) | | | | | 8,230 | | | | 528,778 | |
Total Equity Funds | | | | | | | | | 2,337,533 | |
Total Exchange Traded Fund
| | | | | | | | | | |
(Cost $2,322,607) | | | | | | | | | 2,337,533 | |
TOTAL INVESTMENTS — 124.4%
| | | | | | | | | | |
(Cost $108,348,792) | | | | | | | | | 110,132,400 | |
| | | | | | | | | | | |
| | | | | | | | | | | |
Security Description
| | | | Shares
| | Value
|
Securities Sold Short — (6.7)%
| | | | | | | | | | |
EXCHANGE TRADED FUNDS — (6.7)%
| | | | | | | | | | |
Equity Funds — (6.7)%
| | | | | | | | | | |
iShares 20+ Year Treasury Bond ETF | | | | | (41,000 | ) | | $ | (5,790,840 | ) |
iShares 7-10 Year Treasury Bond ETF | | | | | (1,000 | ) | | | (112,510 | ) |
Total Equity Funds | | | | | | | | | (5,903,350 | ) |
Total Exchange Traded Funds
| | | | | | | | | | |
(Proceeds $(5,813,524)) | | | | | | | | | (5,903,350 | ) |
Total Securities Sold Short — (6.7)%
| | | | | | | | | | |
(Proceeds $(5,813,524)) | | | | | | | | | (5,903,350 | ) |
Liabilities in Excess of Other Assets — (17.7)% | | | | | | | | | (15,704,191 | ) |
Net Assets — 100.0% | | | | | | | | $ | 88,524,859 | |
Security Description
| | | | Notional
Amount
| | Number of
contracts
| | Value
|
WRITTEN OPTIONS — (0.3)%
| | | | | | | | | | | | | | |
Written Call Options
| | | | | | | | | | | | | | |
Boston Properties, Inc.,
Expires 11/15/19, Strike Price $135.00 | | | | | (7,000 | ) | | | (70 | ) | | | (21,000 | ) |
Boston Properties, Inc.,
Expires 12/20/19,
Strike Price $135.00 | | | | | (6,000 | ) | | | (60 | ) | | | (28,200 | ) |
Boston Properties, Inc.,
Expires 01/17/20,
Strike Price $135.00 | | | | | (5,000 | ) | | | (50 | ) | | | (26,350 | ) |
Boston Properties, Inc.,
Expires 01/17/20,
Strike Price $140.00 | | | | | (7,000 | ) | | | (70 | ) | | | (18,550 | ) |
Dominion Energy, Inc.,
Expires 11/15/19,
Strike Price $85.00 | | | | | (5,000 | ) | | | (50 | ) | | | (1,100 | ) |
Dominion Energy, Inc.,
Expires 12/20/19,
Strike Price $85.00 | | | | | (3,000 | ) | | | (30 | ) | | | (1,950 | ) |
iShares 20+ Year Treasury Bond ETF,
Expires 11/01/19,
Strike Price $142.00 | | | | | (6,000 | ) | | | (60 | ) | | | (1,320 | ) |
iShares 20+ Year Treasury Bond ETF,
Expires 11/08/19,
Strike Price $148.00 | | | | | (13,000 | ) | | | (130 | ) | | | (650 | ) |
iShares 20+ Year Treasury Bond ETF,
Expires 11/08/19,
Strike Price $150.00 | | | | | (7,000 | ) | | | (70 | ) | | | (140 | ) |
iShares 20+ Year Treasury Bond ETF,
Expires 11/15/19,
Strike Price $147.00 | | | | | (9,600 | ) | | | (96 | ) | | | (1,248 | ) |
iShares 20+ Year Treasury Bond ETF,
Expires 11/22/19,
Strike Price $143.00 | | | | | (6,000 | ) | | | (60 | ) | | | (5,640 | ) |
iShares 20+ Year Treasury Bond ETF,
Expires 11/22/19,
Strike Price $147.00 | | | | | (12,000 | ) | | | (120 | ) | | | (2,640 | ) |
iShares 20+ Year Treasury Bond ETF,
Expires 11/29/19,
Strike Price $147.00 | | | | | (6,000 | ) | | | (60 | ) | | | (1,800 | ) |
The accompanying notes are an integral part of these financial statements.
39
Schedule of Investments — Virtus InfraCap U.S. Preferred Stock ETF(continued)
October 31, 2019
Security Description
| | | | Notional
Amount
| | Number of
contracts
| | Value
|
Written Options (continued)
| | | | | | | | | | | | | | |
Written Call Options (continued)
| | | | | | | | | | | | | | |
iShares 20+ Year Treasury Bond ETF
Expires 12/20/19,
Strike Price $148.00 | | | | | (7,000 | ) | | | (70 | ) | | $ | (3,500 | ) |
iShares U.S. Real Estate ETF
Expires 11/01/19,
Strike Price $94.50 | | | | | (9,000 | ) | | | (90 | ) | | | (1,080 | ) |
iShares U.S. Real Estate ETF
Expires 11/08/19,
Strike Price $95.50 | | | | | (3,000 | ) | | | (30 | ) | | | (315 | ) |
iShares U.S. Real Estate ETF
Expires 11/22/19,
Strike Price $96.00 | | | | | (9,000 | ) | | | (90 | ) | | | (2,385 | ) |
iShares U.S. Real Estate ETF
Expires 11/29/19,
Strike Price $96.00 | | | | | (42,000 | ) | | | (420 | ) | | | (16,170 | ) |
iShares U.S. Real Estate ETF
Expires 12/06/19,
Strike Price $96.50 | | | | | (11,000 | ) | | | (110 | ) | | | (4,400 | ) |
Kinder Morgan, Inc.
Expires 11/01/19,
Strike Price $21.00 | | | | | (11,000 | ) | | | (110 | ) | | | 0 | |
Kinder Morgan, Inc.
Expires 11/08/19,
Strike Price $21.00 | | | | | (15,000 | ) | | | (150 | ) | | | (150 | ) |
Kinder Morgan, Inc.
Expires 11/15/19,
Strike Price $21.00 | | | | | (11,000 | ) | | | (110 | ) | | | (220 | ) |
Kinder Morgan, Inc.
Expires 11/22/19,
Strike Price $21.00 | | | | | (3,000 | ) | | | (30 | ) | | | (120 | ) |
Kinder Morgan, Inc.
Expires 11/29/19,
Strike Price $21.00 | | | | | (11,000 | ) | | | (110 | ) | | | (660 | ) |
Kinder Morgan, Inc.
Expires 12/06/19,
Strike Price $21.00 | | | | | (12,000 | ) | | | (120 | ) | | | (1,080 | ) |
Kinder Morgan, Inc.
Expires 12/13/19,
Strike Price $21.00 | | | | | (21,000 | ) | | | (210 | ) | | | (2,310 | ) |
Kinder Morgan, Inc.
Expires 12/20/19,
Strike Price $21.00 | | | | | (31,000 | ) | | | (310 | ) | | | (4,340 | ) |
Kinder Morgan, Inc.
Expires 01/17/20,
Strike Price $21.00 | | | | | (31,000 | ) | | | (310 | ) | | | (8,680 | ) |
Southern Co. (The)
Expires 11/01/19,
Strike Price $62.50 | | | | | (7,000 | ) | | | (70 | ) | | | (2,100 | ) |
Southern Co. (The)
Expires 11/08/19,
Strike Price $62.50 | | | | | (5,000 | ) | | | (50 | ) | | | (3,000 | ) |
Utilities Select Sector SPDR Fund
Expires 11/01/19,
Strike Price $64.00 | | | | | (7,000 | ) | | | (70 | ) | | | (1,680 | ) |
Utilities Select Sector SPDR Fund
Expires 11/15/19,
Strike Price $65.00 | | | | | (10,000 | ) | | | (100 | ) | | | (1,700 | ) |
| | | | | | | | | | | | | | | |
| | | | | | | | | | | | | | | |
Security Description
| | | | Notional
Amount
| | Number of
contracts
| | Value
|
Written Options (continued)
| | | | | | | | | | | | | | |
Written Call Options (continued)
| | | | | | | | | | | | | | |
Utilities Select Sector SPDR Fund
Expires 11/22/19,
Strike Price $65.00 | | | | | (10,000 | ) | | | (100 | ) | | $ | (2,500 | ) |
Verizon Communications, Inc.
Expires 11/01/19,
Strike Price $62.00 | | | | | (6,000 | ) | | | (60 | ) | | | (60 | ) |
Written Put Options
| | | | | | | | | | | | | | |
Dominion Energy, Inc.
Expires 11/15/19,
Strike Price $75.00 | | | | | (6,000 | ) | | | (60 | ) | | | (780 | ) |
iShares 20+ Year Treasury Bond ETF
Expires 11/01/19,
Strike Price $136.50 | | | | | (1,000 | ) | | | (10 | ) | | | (10 | ) |
iShares 20+ Year Treasury Bond ETF
Expires 11/01/19,
Strike Price $139.00 | | | | | (7,000 | ) | | | (70 | ) | | | (420 | ) |
iShares 20+ Year Treasury Bond ETF
Expires 11/08/19,
Strike Price $137.00 | | | | | (8,000 | ) | | | (80 | ) | | | (800 | ) |
iShares 20+ Year Treasury Bond ETF
Expires 11/15/19,
Strike Price $135.00 | | | | | (6,000 | ) | | | (60 | ) | | | (480 | ) |
iShares 20+ Year Treasury Bond ETF
Expires 11/22/19,
Strike Price $135.00 | | | | | (7,000 | ) | | | (70 | ) | | | (980 | ) |
iShares 20+ Year Treasury Bond ETF
Expires 11/29/19,
Strike Price $135.00 | | | | | (3,000 | ) | | | (30 | ) | | | (570 | ) |
iShares 20+ Year Treasury Bond ETF
Expires 12/06/19,
Strike Price $135.00 | | | | | (8,000 | ) | | | (80 | ) | | | (2,480 | ) |
iShares 20+ Year Treasury Bond ETF
Expires 12/13/19,
Strike Price $136.00 | | | | | (8,000 | ) | | | (80 | ) | | | (4,800 | ) |
iShares 20+ Year Treasury Bond ETF
Expires 12/20/19,
Strike Price $135.00 | | | | | (6,000 | ) | | | (60 | ) | | | (3,540 | ) |
iShares U.S. Real Estate ETF
Expires 11/01/19,
Strike Price $92.00 | | | | | (10,000 | ) | | | (100 | ) | | | (100 | ) |
iShares U.S. Real Estate ETF
Expires 11/08/19,
Strike Price $93.00 | | | | | (11,000 | ) | | | (110 | ) | | | (3,410 | ) |
iShares U.S. Real Estate ETF
Expires 11/15/19,
Strike Price $93.00 | | | | | (1,000 | ) | | | (10 | ) | | | (460 | ) |
Kinder Morgan, Inc.
Expires 11/08/19,
Strike Price $20.00 | | | | | (11,000 | ) | | | (110 | ) | | | (2,530 | ) |
Kinder Morgan, Inc.
Expires 11/15/19,
Strike Price $20.00 | | | | | (9,000 | ) | | | (90 | ) | | | (2,790 | ) |
Public Storage
Expires 11/15/19,
Strike Price $230.00 | | | | | (3,000 | ) | | | (30 | ) | | | (21,000 | ) |
The accompanying notes are an integral part of these financial statements.
40
Schedule of Investments — Virtus InfraCap U.S. Preferred Stock ETF(continued)
October 31, 2019
Security Description
| | | | Notional
Amount
| | Number of
contracts
| | Value
|
Written Options (continued)
| | | | | | | | | | | | | | |
Written Put Options (continued)
| | | | | | | | | | | | | | |
Sempra Energy
Expires 11/15/19,
Strike Price $135.00 | | | | | (6,000 | ) | | | (60 | ) | | $ | (2,100 | ) |
Sempra Energy
Expires 12/20/19,
Strike Price $135.00 | | | | | (5,000 | ) | | | (50 | ) | | | (5,375 | ) |
Southern Co. (The)
Expires 11/01/19,
Strike Price $59.50 | | | | | (6,000 | ) | | | (60 | ) | | | 0 | |
Southern Co. (The)
Expires 11/08/19,
Strike Price $59.00 | | | | | (6,000 | ) | | | (60 | ) | | | (270 | ) |
Utilities Select Sector SPDR Fund
Expires 11/01/19,
Strike Price $62.00 | | | | | (7,000 | ) | | | (70 | ) | | | (140 | ) |
Utilities Select Sector SPDR Fund
Expires 11/08/19,
Strike Price $62.50 | | | | | (8,000 | ) | | | (80 | ) | | | (560 | ) |
Utilities Select Sector SPDR Fund
Expires 11/15/19,
Strike Price $63.00 | | | | | (10,000 | ) | | | (100 | ) | | | (2,100 | ) |
| | | | | | | | | | | | | | | |
| | | | | | | | | | | | | | | |
Security Description
| | | | Notional
Amount
| | Number of
contracts
| | Value
|
Written Options (continued)
| | | | | | | | | | | | | | |
Written Put Options (continued)
| | | | | | | | | | | | | | |
Verizon Communications, Inc.
Expires 11/01/19,
Strike Price $58.00 | | | | | (10,200 | ) | | | (102 | ) | | $ | 0 | |
Verizon Communications, Inc.
Expires 11/08/19,
Strike Price $59.00 | | | | | (11,000 | ) | | | (110 | ) | | | (1,320 | ) |
Verizon Communications, Inc.
Expires 11/15/19,
Strike Price $59.00 | | | | | (11,000 | ) | | | (110 | ) | | | (2,530 | ) |
Verizon Communications, Inc.
Expires 11/22/19,
Strike Price $59.00 | | | | | (6,000 | ) | | | (60 | ) | | | (2,040 | ) |
Total Written Options — (0.3)%
| | | | | | | |
(Premiums Received $239,585) | | | | | | | | | | | | $ | (228,623 | ) |
* | | Non-income producing security. |
(1) | | Substantially all the securities, or a portion thereof, have been pledged as collateral for line of credit borrowings, short sales and open written option contracts. The aggregate market value of the collateral at October 31, 2019 was $89,587,133. |
(2) | | Subject to written call options. |
The following table summarizes valuation of the Fund’s investments under the fair value hierarchy levels as of October 31, 2019.
| | | | Level 1
| | Level 2
| | Level 3
| | Total
|
Asset Valuation Inputs
| | | | | | | | | | | | | | | | | �� | |
Preferred Stocks | | | | $ | 101,791,056 | | | $ | — | | | $ | — | | | $ | 101,791,056 | |
Common Stocks | | | | | 6,003,811 | | | | — | | | | — | | | | 6,003,811 | |
Exchange Traded Funds | | | | | 2,337,533 | | | | — | | | | — | | | | 2,337,533 | |
Total | | | | $ | 110,132,400 | | | $ | — | | | $ | — | | | $ | 110,132,400 | |
Liability Valuation Inputs
| | | | | | | | | | | | | | | | | | |
Exchange Traded Funds | | | | $ | 5,903,350 | | | $ | — | | | $ | — | | | $ | 5,903,350 | |
Written Options | | | | | 227,683 | | | | 940 | | | | — | | | | 228,623 | |
Total | | | | $ | 6,131,033 | | | $ | 940 | | | $ | — | | | $ | 6,131,973 | |
The accompanying notes are an integral part of these financial statements.
41
Schedule of Investments — Virtus LifeSci Biotech Clinical Trials ETF
October 31, 2019
Security Description
| | | | Shares
| | Value
|
Common Stocks — 99.7%
| | | | | | | | | | |
Health Care — 98.8%
| | | | | | | | | | |
Abeona Therapeutics, Inc.* | | | | | 49,657 | | | $ | 117,687 | |
Acceleron Pharma, Inc.*(1) | | | | | 6,823 | | | | 306,148 | |
Achillion Pharmaceuticals, Inc.* | | | | | 92,017 | | | | 589,829 | |
Adverum Biotechnologies, Inc.* | | | | | 23,734 | | | | 172,546 | |
Agenus, Inc.* | | | | | 96,505 | | | | 249,948 | |
Aimmune Therapeutics, Inc.*(1) | | | | | 12,843 | | | | 357,292 | |
Akcea Therapeutics, Inc.* | | | | | 11,292 | | | | 206,982 | |
Akebia Therapeutics, Inc.*(1) | | | | | 62,609 | | | | 233,532 | |
Alector, Inc.*(1) | | | | | 12,734 | | | | 214,441 | |
Allakos, Inc.*(1) | | | | | 6,111 | | | | 419,215 | |
Allogene Therapeutics, Inc.*(1) | | | | | 9,705 | | | | 279,504 | |
AnaptysBio, Inc.*(1) | | | | | 3,685 | | | | 138,998 | |
Apellis Pharmaceuticals, Inc.* | | | | | 12,131 | | | | 356,530 | |
Arena Pharmaceuticals, Inc.* | | | | | 4,634 | | | | 225,745 | |
ArQule, Inc.* | | | | | 31,305 | | | | 316,494 | |
Arrowhead Pharmaceuticals, Inc.*(1) | | | | | 9,942 | | | | 398,177 | |
Arvinas, Inc.* | | | | | 12,405 | | | | 256,287 | |
Ascendis Pharma A/S (Denmark)*(2) | | | | | 2,116 | | | | 233,987 | |
Assembly Biosciences, Inc.* | | | | | 17,677 | | | | 291,847 | |
Atara Biotherapeutics, Inc.*(1) | | | | | 11,748 | | | | 128,288 | |
Athenex, Inc.* | | | | | 14,430 | | | | 159,307 | |
Audentes Therapeutics, Inc.* | | | | | 6,768 | | | | 182,059 | |
Autolus Therapeutics PLC
(United Kingdom)*(1)(2) | | | | | 16,656 | | | | 199,372 | |
Avrobio, Inc.* | | | | | 18,954 | | | | 275,212 | |
Axsome Therapeutics, Inc.*(1) | | | | | 11,238 | | | | 270,611 | |
BeiGene Ltd. (China)*(1)(2) | | | | | 2,189 | | | | 302,826 | |
BioCryst Pharmaceuticals, Inc.* | | | | | 75,726 | | | | 151,452 | |
Biohaven Pharmaceutical Holding Co., Ltd.* | | | | | 4,068 | | | | 186,803 | |
Bluebird Bio, Inc.*(1) | | | | | 2,189 | | | | 177,309 | |
Blueprint Medicines Corp.*(1) | | | | | 2,828 | | | | 194,680 | |
Cara Therapeutics, Inc.* | | | | | 13,263 | | | | 275,340 | |
ChemoCentryx, Inc.* | | | | | 30,776 | | | | 264,674 | |
Corbus Pharmaceuticals Holdings, Inc.*(1) | | | | | 37,471 | | | | 193,725 | |
Cymabay Therapeutics, Inc.* | | | | | 40,882 | | | | 183,560 | |
Cytokinetics, Inc.*(1) | | | | | 26,908 | | | | 313,478 | |
CytomX Therapeutics, Inc.* | | | | | 24,683 | | | | 151,307 | |
Deciphera Pharmaceuticals, Inc.* | | | | | 11,967 | | | | 530,617 | |
Denali Therapeutics, Inc.*(1) | | | | | 13,719 | | | | 214,977 | |
Dicerna Pharmaceuticals, Inc.* | | | | | 17,385 | | | | 286,679 | |
Eidos Therapeutics, Inc.* | | | | | 8,173 | | | | 396,390 | |
Epizyme, Inc.*(1) | | | | | 22,074 | | | | 254,072 | |
Esperion Therapeutics, Inc.*(1) | | | | | 5,217 | | | | 207,480 | |
Fate Therapeutics, Inc.*(1) | | | | | 14,394 | | | | 215,190 | |
| |
| |
Security Description
| | | | Shares
| | Value
|
Common Stocks (continued)
| | | | | | | | | | |
| |
Health Care (continued)
| | | | | | | | | | |
FibroGen, Inc.*(1) | | | | | 6,312 | | | $ | 247,115 | |
Forty Seven, Inc.* | | | | | 24,354 | | | | 168,286 | |
G1 Therapeutics, Inc.*(1) | | | | | 13,810 | | | | 293,048 | |
Geron Corp.*(1) | | | | | 172,304 | | | | 246,395 | |
Global Blood Therapeutics, Inc.*(1) | | | | | 4,761 | | | | 228,290 | |
GlycoMimetics, Inc.*(1) | | | | | 22,950 | | | | 121,176 | |
Gossamer Bio, Inc.*(1) | | | | | 12,679 | | | | 260,870 | |
Gritstone Oncology, Inc.* | | | | | 26,124 | | | | 211,866 | |
ImmunoGen, Inc.* | | | | | 129,652 | | | | 308,572 | |
Immunomedics, Inc.*(1) | | | | | 20,779 | | | | 332,464 | |
Insmed, Inc.*(1) | | | | | 10,782 | | | | 200,437 | |
Intra-Cellular Therapies, Inc.* | | | | | 20,523 | | | | 189,838 | |
Iovance Biotherapeutics, Inc.*(1) | | | | | 13,445 | | | | 284,093 | |
KalVista Pharmaceuticals, Inc.* | | | | | 12,898 | | | | 136,719 | |
Karyopharm Therapeutics, Inc.*(1) | | | | | 44,969 | | | | 526,137 | |
Krystal Biotech, Inc.*(1) | | | | | 9,432 | | | | 387,372 | |
Kura Oncology, Inc.* | | | | | 13,792 | | | | 206,604 | |
La Jolla Pharmaceutical Co.* | | | | | 26,434 | | | | 185,435 | |
MacroGenics, Inc.* | | | | | 16,875 | | | | 143,437 | |
Madrigal Pharmaceuticals, Inc.*(1) | | | | | 2,627 | | | | 242,814 | |
Magenta Therapeutics, Inc.* | | | | | 17,878 | | | | 186,110 | |
MeiraGTx Holdings PLC* | | | | | 12,515 | | | | 180,842 | |
Mirati Therapeutics, Inc.*(1) | | | | | 2,718 | | | | 255,981 | |
Moderna, Inc.*(1) | | | | | 16,674 | | | | 279,290 | |
MyoKardia, Inc.*(1) | | | | | 5,546 | | | | 317,952 | |
Myovant Sciences Ltd.*(1) | | | | | 29,535 | | | | 161,261 | |
Orchard Therapeutics PLC
(United Kingdom)*(2) | | | | | 17,641 | | | | 212,750 | |
PhaseBio Pharmaceuticals, Inc.* | | | | | 22,092 | | | | 90,798 | |
Principia Biopharma, Inc.* | | | | | 7,407 | | | | 261,541 | |
Progenics Pharmaceuticals, Inc.*(1) | | | | | 62,774 | | | | 333,330 | |
ProQR Therapeutics NV (Netherlands)* | | | | | 23,314 | | | | 158,535 | |
Prothena Corp. PLC (Ireland)* | | | | | 27,310 | | | | 248,521 | |
PTC Therapeutics, Inc.* | | | | | 6,421 | | | | 262,555 | |
Ra Pharmaceuticals, Inc.* | | | | | 12,077 | | | | 568,464 | |
Reata Pharmaceuticals, Inc. Class A*(1) | | | | | 3,138 | | | | 646,679 | |
REGENXBIO, Inc.*(1) | | | | | 5,327 | | | | 190,121 | |
Rhythm Pharmaceuticals, Inc.*(1) | | | | | 11,493 | | | | 245,031 | |
Rocket Pharmaceuticals, Inc.*(1) | | | | | 15,908 | | | | 231,302 | |
Sangamo Therapeutics, Inc.* | | | | | 27,583 | | | | 249,626 | |
Sorrento Therapeutics, Inc.*(1) | | | | | 81,491 | | | | 123,866 | |
Synthorx, Inc.* | | | | | 20,049 | | | | 275,473 | |
TG Therapeutics, Inc.*(1) | | | | | 35,355 | | | | 241,475 | |
Tricida, Inc.*(1) | | | | | 7,443 | | | | 278,443 | |
The accompanying notes are an integral part of these financial statements.
42
Schedule of Investments — Virtus LifeSci Biotech Clinical Trials ETF(continued)
October 31, 2019
Security Description
| | | | Shares
| | Value
|
| |
Common Stocks (continued)
| | | | | | | | | | |
| |
Health Care (continued)
| | | | | | | | | | |
uniQure N.V. (Netherlands)* | | | | | 3,539 | | | $ | 177,092 | |
UNITY Biotechnology, Inc.*(1) | | | | | 29,407 | | | | 183,500 | |
Viking Therapeutics, Inc.*(1) | | | | | 32,655 | | | | 211,278 | |
Voyager Therapeutics, Inc.* | | | | | 10,599 | | | | 163,119 | |
WaVe Life Sciences Ltd.*(1) | | | | | 9,997 | | | | 252,824 | |
Xencor, Inc.*(1) | | | | | 8,191 | | | | 280,214 | |
ZIOPHARM Oncology, Inc.*(1) | | | | | 49,183 | | | | 207,552 | |
Total Health Care | | | | | | | | | 23,477,090 | |
Materials — 0.9%
| | | | | | | | | | |
Amyris, Inc.*(1) | | | | | 65,328 | | | | 216,562 | |
Total Common Stocks
| | | | | | | | | | |
(Cost $29,927,611) | | | | | | | | | 23,693,652 | |
SECURITIES LENDING COLLATERAL — 13.1%
| | | |
Money Market Fund — 13.1%
| | | | | | | | | | |
Dreyfus Government Cash Management Fund, Institutional Shares, 1.73%(3)(4)
(Cost $3,114,419) | | | | | 3,114,419 | | | | 3,114,419 | |
| | | | | | | | | | | |
| |
Security Description
| | | | Shares
| | Value
|
TOTAL INVESTMENTS — 112.8%
| | | | | | | | | | |
(Cost $33,042,030) | | | | | | | | $ | 26,808,071 | |
Liabilities in Excess of Other Assets—(12.8)% | | | | | | | | | (3,032,902 | ) |
Net Assets — 100.0% | | | | | | | | $ | 23,775,169 | |
* | | Non-income producing security. |
(1) | | All or a portion of the security was on loan. The aggregate market value of securities on loan was $6,713,301; total market value of collateral held by the Fund was $7,076,713. Market value of the collateral held includes non-cash U.S. Treasury securities having a value of $3,962,294. |
(2) | | American Depositary Receipts. |
(3) | | Represents securities purchased with cash collateral received for securities on loan. |
(4) | | The rate shown reflects the seven-day yield as of October 31, 2019. |
The following table summarizes valuation of the Fund’s investments under the fair value hierarchy levels as of October 31, 2019.
| | | | Level 1
| | Level 2
| | Level 3
| | Total
|
Asset Valuation Inputs
| | | | | | | | | | | | | | | | | | |
Common Stocks | | | | $ | 23,693,652 | | | $ | — | | | $ | — | | | $ | 23,693,652 | |
Money Market Fund | | | | | 3,114,419 | | | | — | | | | — | | | | 3,114,419 | |
Total | | | | $ | 26,808,071 | | | $ | — | | | $ | — | | | $ | 26,808,071 | |
The accompanying notes are an integral part of these financial statements.
43
Schedule of Investments — Virtus LifeSci Biotech Products ETF
October 31, 2019
Security Description
| | | | Shares
| | Value
|
Common Stocks — 98.6%
| | | | | | | | | | |
Health Care — 98.6%
| | | | | | | | | | |
ACADIA Pharmaceuticals, Inc.*(1) | | | | | 28,563 | | | $ | 1,211,357 | |
Agios Pharmaceuticals, Inc.*(1) | | | | | 14,418 | | | | 433,693 | |
Alexion Pharmaceuticals, Inc.* | | | | | 5,881 | | | | 619,857 | |
Alnylam Pharmaceuticals, Inc.*(1) | | | | | 9,888 | | | | 857,685 | |
Amgen, Inc. | | | | | 3,939 | | | | 839,992 | |
Amicus Therapeutics, Inc.*(1) | | | | | 61,053 | | | | 514,677 | |
Biogen, Inc.* | | | | | 3,048 | | | | 910,468 | |
BioMarin Pharmaceutical, Inc.* | | | | | 8,566 | | | | 627,117 | |
Celgene Corp.* | | | | | 7,171 | | | | 774,683 | |
Clovis Oncology, Inc.*(1) | | | | | 53,505 | | | | 169,611 | |
Enanta Pharmaceuticals, Inc.* | | | | | 8,079 | | | | 491,849 | |
Exelixis, Inc.* | | | | | 35,178 | | | | 543,500 | |
Gilead Sciences, Inc. | | | | | 10,436 | | | | 664,878 | |
Halozyme Therapeutics, Inc.* | | | | | 44,046 | | | | 674,785 | |
Incyte Corp.* | | | | | 8,911 | | | | 747,811 | |
Intercept Pharmaceuticals, Inc.*(1) | | | | | 8,711 | | | | 633,987 | |
Ionis Pharmaceuticals, Inc.*(1) | | | | | 11,156 | | | | 621,612 | |
Ironwood Pharmaceuticals, Inc.*(1) | | | | | 66,816 | | | | 670,833 | |
Lexicon Pharmaceuticals, Inc.*(1) | | | | | 122,654 | | | | 455,046 | |
Ligand Pharmaceuticals, Inc.*(1) | | | | | 6,455 | | | | 702,369 | |
Medicines Co. (The)*(1) | | | | | 19,635 | | | | 1,030,641 | |
Momenta Pharmaceuticals, Inc.* | | | | | 57,849 | | | | 895,502 | |
Nektar Therapeutics*(1) | | | | | 20,742 | | | | 355,207 | |
Neurocrine Biosciences, Inc.* | | | | | 8,250 | | | | 820,792 | |
Omeros Corp.*(1) | | | | | 42,784 | | | | 677,699 | |
Portola Pharmaceuticals, Inc.*(1) | | | | | 26,910 | | | | 777,968 | |
Puma Biotechnology, Inc.*(1) | | | | | 54,053 | | | | 367,560 | |
Radius Health, Inc.* | | | | | 31,498 | | | | 895,803 | |
Regeneron Pharmaceuticals, Inc.* | | | | | 2,271 | | | | 695,562 | |
| | | | | | | | | | | |
| |
Security Description
| | | | Shares
| | Value
|
Common Stocks (continued)
| | | | | | | | | | |
Health Care (continued)
| | | | | | | | | | |
Retrophin, Inc.* | | | | | 36,097 | | | $ | 433,164 | |
Sage Therapeutics, Inc.*(1) | | | | | 3,984 | | | | 540,430 | |
Sarepta Therapeutics, Inc.*(1) | | | | | 5,794 | | | | 481,250 | |
Seattle Genetics, Inc.* | | | | | 10,120 | | | | 1,086,888 | |
Stemline Therapeutics, Inc.*(1) | | | | | 48,906 | | | | 489,060 | |
Theravance Biopharma, Inc. (Cayman Islands)* | | | | | 43,442 | | | | 700,285 | |
Ultragenyx Pharmaceutical, Inc.*(1) | | | | | 12,118 | | | | 486,416 | |
United Therapeutics Corp.*(1) | | | | | 8,856 | | | | 795,623 | |
Vanda Pharmaceuticals, Inc.* | | | | | 47,470 | | | | 641,320 | |
Vertex Pharmaceuticals, Inc.* | | | | | 4,068 | | | | 795,213 | |
Total Health Care | | | | | | | | | 26,132,193 | |
Total Common Stocks | | | | | | | | | | |
(Cost $32,394,765) | | | | | | | | | 26,132,193 | |
| | | | |
SECURITIES LENDING COLLATERAL — 6.5%
| | | |
Money Market Fund—6.5% | | | | | | | | | | |
Dreyfus Government Cash Management Fund, Institutional Shares, 1.73%(2)(3) | | | | | | | | | | |
(Cost $1,719,938) | | | | | 1,719,938 | | | | 1,719,938 | |
TOTAL INVESTMENTS — 105.1%
| | | | | | | | | | |
(Cost $34,114,703) | | | | | | | | | 27,852,131 | |
Liabilities in Excess of Other Assets — (5.1)% | | | | | | | | | (1,346,939 | ) |
Net Assets — 100.0% | | | | | | | | $ | 26,505,192 | |
* | | Non-income producing security. |
(1) | | All or a portion of the security was on loan. The aggregate market value of securities on loan was $7,679,255; total market value of collateral held by the Fund was $7,998,030. Market value of the collateral held includes non-cash U.S. Treasury securities having a value of $6,278,092. |
(2) | | Represents securities purchased with cash collateral received for securities on loan. |
(3) | | The rate shown reflects the seven-day yield as of October 31, 2019. |
The following table summarizes valuation of the Fund’s investments under the fair value hierarchy levels as of October 31, 2019.
| | | | Level 1
| | Level 2
| | Level 3
| | Total
|
Asset Valuation Inputs
| | | | | | | | | | | | | | | | | | |
Common Stocks | | | | $ | 26,132,193 | | | $ | — | | | $ | — | | | $ | 26,132,193 | |
Money Market Fund | | | | | 1,719,938 | | | | — | | | | — | | | | 1,719,938 | |
Total | | | | $ | 27,852,131 | | | $ | — | | | $ | — | | | $ | 27,852,131 | |
The accompanying notes are an integral part of these financial statements.
44
Schedule of Investments — Virtus Newfleet Multi-Sector Bond ETF
October 31, 2019
Security Description
| | | | Principal
| | Value
|
CORPORATE BONDS — 33.9%
| | | | | | | | | | |
Communication Services — 2.4%
| | | | | | | | | | |
Cincinnati Bell, Inc., 7.00%, 07/15/24(1) | | | | $ | 64,000 | | | $ | 58,080 | |
Clear Channel Worldwide Holdings, Inc., 9.25%, 02/15/24(1) | | | | | 10,000 | | | | 11,019 | |
Clear Channel Worldwide Holdings, Inc., 5.13%, 08/15/27(1) | | | | | 15,000 | | | | 15,651 | |
Consolidated Communications, Inc., 6.50%,
10/01/22 | | | | | 70,000 | | | | 63,525 | |
Diamond Sports Group LLC / Diamond Sports Finance Co., 5.38%, 08/15/26(1) | | | | | 25,000 | | | | 26,156 | |
Diamond Sports Group LLC / Diamond Sports Finance Co., 6.63%, 08/15/27(1) | | | | | 40,000 | | | | 41,300 | |
Discovery Communications LLC, 3.95%,
03/20/28 | | | | | 112,000 | | | | 118,038 | |
DISH DBS Corp., 5.88%, 07/15/22 | | | | | 40,000 | | | | 41,982 | |
DISH DBS Corp., 7.75%, 07/01/26 | | | | | 13,000 | | | | 13,148 | |
Frontier Communications Corp., 8.50%,
04/15/20 | | | | | 22,000 | | | | 12,760 | |
Frontier Communications Corp., 11.00%,
09/15/25 | | | | | 45,000 | | | | 21,262 | |
Frontier Communications Corp., 8.50%,
04/01/26(1) | | | | | 18,000 | | | | 18,090 | |
GrubHub Holdings, Inc., 5.50%, 07/01/27(1) | | | | | 25,000 | | | | 23,500 | |
iHeartCommunications, Inc., 6.38%, 05/01/26 | | | | | 16,004 | | | | 17,305 | |
iHeartCommunications, Inc., 8.38%, 05/01/27 | | | | | 29,008 | | | | 31,256 | |
iHeartCommunications, Inc. Escrow(2) | | | | | 265,000 | | | | 0 | |
Live Nation Entertainment, Inc., 4.75%,
10/15/27(1) | | | | | 15,000 | | | | 15,677 | |
McGraw-Hill Global Education Holdings LLC / McGraw-Hill Global Education Finance, 7.88%, 05/15/24(1) | | | | | 55,000 | | | | 46,200 | |
Sirius XM Radio, Inc., 5.50%, 07/01/29(1) | | | | | 25,000 | | | | 27,078 | |
Total Communication Services | | | | | | | | | 602,027 | |
Consumer Discretionary — 3.8%
| | | | | | | | | | |
American Axle & Manufacturing, Inc., 6.50%, 04/01/27 | | | | | 40,000 | | | | 38,050 | |
American Builders & Contractors Supply Co., Inc., 4.00%, 01/15/28(1) | | | | | 5,000 | | | | 5,000 | |
Beazer Homes USA, Inc., 5.88%, 10/15/27 | | | | | 30,000 | | | | 29,550 | |
Bunge Ltd. Finance Corp., 4.35%, 03/15/24 | | | | | 77,000 | | | | 81,463 | |
Caesars Resort Collection LLC / CRC Finco, Inc., 5.25%, 10/15/25(1) | | | | | 31,000 | | | | 31,814 | |
Downstream Development Authority of the Quapaw Tribe of Oklahoma Escrow(2) | | | | | 21,000 | | | | 0 | |
Downstream Development Authority of the Quapaw Tribe of Oklahoma, 10.50%, 02/15/23(1) | | | | | 21,000 | | | | 22,207 | |
Eldorado Resorts, Inc., 6.00%, 09/15/26 | | | | | 23,000 | | | | 25,329 | |
Expedia Group, Inc., 3.25%, 02/15/30(1) | | | | | 29,000 | | | | 29,102 | |
GLP Capital LP / GLP Financing II, Inc., 5.25%, 06/01/25 | | | | | 52,000 | | | | 57,149 | |
Golden Nugget, Inc., 8.75%, 10/01/25(1) | | | | | 25,000 | | | | 26,375 | |
Lear Corp., 3.80%, 09/15/27 | | | | | 111,000 | | | | 112,518 | |
Michaels Stores, Inc., 8.00%, 07/15/27(1) | | | | | 25,000 | | | | 24,774 | |
Neiman Marcus Group Ltd. LLC / Neiman Marcus Group LLC / Mariposa Borrower / NMG, 8.00%, 10/25/24(1) | | | | | 88,000 | | | | 23,980 | |
Panther BF Aggregator 2 LP / Panther Finance Co., Inc., 6.25%, 05/15/26(1) | | | | | 5,000 | | | | 5,298 | |
| | | | | | | | | | | |
| |
Security Description
| | | | Shares
| | Value
|
CORPORATE BONDS (continued)
| | | | | | | | | | |
Consumer Discretionary (continued)
| | | | | | | | | | |
Panther BF Aggregator 2 LP / Panther Finance Co., Inc., 8.50%, 05/15/27(1) | | | | $ | 45,000 | | | $ | 45,338 | |
PulteGroup, Inc., 7.88%, 06/15/32 | | | | | 40,000 | | | | 50,700 | |
Scientific Games International, Inc., 8.25%,
03/15/26(1) | | | | | 25,000 | | | | 26,500 | |
Tenneco, Inc., 5.00%, 07/15/26 | | | | | 57,000 | | | | 45,600 | |
Under Armour, Inc., 3.25%, 06/15/26 | | | | | 50,000 | | | | 48,372 | |
Vista Outdoor, Inc., 5.88%, 10/01/23 | | | | | 68,000 | | | | 62,560 | |
Weekley Homes LLC / Weekley Finance Corp., 6.63%, 08/15/25 | | | | | 70,000 | | | | 71,400 | |
William Lyon Homes, Inc., 6.00%, 09/01/23 | | | | | 70,000 | | | | 72,800 | |
Total Consumer Discretionary | | | | | | | | | 935,879 | |
Consumer Staples — 0.7%
| | | | | | | | | | |
Albertsons Cos. Inc / Safeway, Inc. / New Albertsons LP / Albertsons LLC, 5.75%,
03/15/25 | | | | | 30,000 | | | | 31,191 | |
Altria Group, Inc., 4.40%, 02/14/26 | | | | | 12,000 | | | | 12,953 | |
Altria Group, Inc., 4.80%, 02/14/29 | | | | | 117,000 | | | | 128,685 | |
Total Consumer Staples | | | | | | | | | 172,829 | |
Energy — 3.2%
| | | | | | | | | | |
Blue Racer Midstream LLC / Blue Racer Finance Corp., 6.63%, 07/15/26(1) | | | | | 80,000 | | | | 75,200 | |
Callon Petroleum Co., 6.13%, 10/01/24 | | | | | 25,172 | | | | 24,039 | |
Cheniere Energy Partners LP, 5.63%, 10/01/26 | | | | | 30,000 | | | | 31,837 | |
Citgo Holding, Inc., 9.25%, 08/01/24(1) | | | | | 5,000 | | | | 5,231 | |
CrownRock LP / CrownRock Finance, Inc., 5.63%, 10/15/25(1) | | | | | 65,000 | | | | 63,783 | |
Denbury Resources, Inc., 9.25%, 03/31/22(1) | | | | | 26,000 | | | | 21,450 | |
Denbury Resources, Inc., 7.75%, 02/15/24(1) | | | | | 25,000 | | | | 18,500 | |
EP Energy LLC / Everest Acquisition Finance, Inc., 9.38%, 05/01/24(1)(3) | | | | | 25,000 | | | | 610 | |
HollyFrontier Corp., 5.88%, 04/01/26 | | | | | 80,000 | | | | 89,941 | |
Kinder Morgan, Inc., Series G, 7.75%, 01/15/32 | | | | | 98,000 | | | | 134,194 | |
MPLX LP, 4.00%, 03/15/28 | | | | | 60,000 | | | | 62,404 | |
Nabors Industries, Inc., 5.50%, 01/15/23 | | | | | 56,000 | | | | 47,600 | |
Sabine Pass Liquefaction LLC, 4.20%, 03/15/28 | | | | | 70,000 | | | | 74,090 | |
Sanchez Energy Corp., 7.25%, 02/15/23(1)(3) | | | | | 12,000 | | | | 8,280 | |
Transocean, Inc., 9.00%, 07/15/23(1) | | | | | 18,000 | | | | 18,405 | |
USA Compression Partners LP / USA Compression Finance Corp., 6.88%, 04/01/26 | | | | | 53,000 | | | | 53,795 | |
USA Compression Partners LP / USA Compression Finance Corp., 6.88%,
09/01/27(1) | | | | | 15,000 | | | | 15,075 | |
Vine Oil & Gas LP / Vine Oil & Gas Finance Corp., 8.75%, 04/15/23(1) | | | | | 130,000 | | | | 50,700 | |
Total Energy | | | | | | | | | 795,134 | |
Financials — 9.6%
| | | | | | | | | | |
Acrisure, LLC / Acrisure Finance, Inc., 8.13%, 02/15/24(1) | | | | | 30,000 | | | | 32,025 | |
Acrisure, LLC / Acrisure Finance, Inc., 7.00%, 11/15/25(1) | | | | | 70,000 | | | | 64,400 | |
Allstate Corp. (The), Series B, 5.75%, (3-Month USD LIBOR + 2.94%), 08/15/53(4) | | | | | 95,000 | | | | 102,304 | |
Athene Holding Ltd., 4.13%, 01/12/28 | | | | | 102,000 | | | | 106,140 | |
Aviation Capital Group LLC, 3.50%, 11/01/27(1) | | | | | 126,000 | | | | 126,623 | |
Bank of America Corp., 4.20%, 08/26/24 | | | | | 103,000 | | | | 111,056 | |
The accompanying notes are an integral part of these financial statements.
45
Schedule of Investments — Virtus Newfleet Multi-Sector Bond ETF(continued)
October 31, 2019
Security Description
| | | | Principal
| | Value
|
CORPORATE BONDS (continued)
| | | | | | | | | | |
Financial (continued)
| | | | | | | | | | |
Brighthouse Financial, Inc., 3.70%, 06/22/27 | | | | $ | 148,000 | | | $ | 145,433 | |
Brightsphere Investment Group, Inc., 4.80%, 07/27/26 | | | | | 80,000 | | | | 83,466 | |
Capital One Financial Corp., 3.75%, 07/28/26 | | | | | 130,000 | | | | 137,413 | |
Citadel LP, 4.88%, 01/15/27(1) | | | | | 50,000 | | | | 52,375 | |
E*TRADE Financial Corp., 4.50%, 06/20/28 | | | | | 102,000 | | | | 111,290 | |
FS KKR Capital Corp., 4.25%, 01/15/20 | | | | | 78,000 | | | | 78,125 | |
Goldman Sachs Group, Inc. (The), 3.85%,
01/26/27 | | | | | 70,000 | | | | 74,659 | |
Icahn Enterprises LP / Icahn Enterprises Finance Corp., 6.25%, 05/15/26 | | | | | 75,000 | | | | 79,687 | |
Jefferies Group LLC / Jefferies Group Capital Finance, Inc., 4.85%, 01/15/27 | | | | | 50,000 | | | | 53,898 | |
JPMorgan Chase & Co., Series Z, 5.30%,
(3-Month USD LIBOR + 3.80%),
perpetual(4),(5) | | | | | 90,000 | | | | 91,369 | |
M&T Bank Corp., Series F, 5.13%, (3-Month USD LIBOR + 3.52%), perpetual(4),(5) | | | | | 35,000 | | | | 37,394 | |
MetLife, Inc., Series D, 5.88%, (3-Month USD LIBOR + 2.96%), perpetual(4),(5) | | | | | 52,000 | | | | 56,753 | |
Morgan Stanley, 3.13%, 07/27/26 | | | | | 75,000 | | | | 77,825 | |
Nationstar Mortgage Holdings, Inc., 8.13%,
07/15/23(1) | | | | | 55,000 | | | | 58,438 | |
Navient Corp., 6.75%, 06/25/25 | | | | | 54,000 | | | | 57,089 | |
PNC Financial Services Group, Inc. (The), Series S, 5.00%, (3-Month USD LIBOR + 3.30%), perpetual(4),(5) | | | | | 65,000 | | | | 68,881 | |
Prudential Financial, Inc., 5.63%, (3-Month USD LIBOR + 3.92%), 06/15/43(4) | | | | | 90,000 | | | | 97,705 | |
Santander Holdings USA, Inc., 4.40%, 07/13/27 | | | | | 74,000 | | | | 79,575 | |
Springleaf Finance Corp., 7.13%, 03/15/26 | | | | | 22,000 | | | | 25,176 | |
Synchrony Financial, 3.95%, 12/01/27 | | | | | 85,000 | | | | 88,629 | |
Synovus Financial Corp., 5.90%, (USD 5 Year Swap + 3.38%), 02/07/29(4) | | | | | 55,000 | | | | 58,987 | |
Teachers Insurance & Annuity Association of America, 4.38%, (3-Month USD LIBOR + 2.66%), 09/15/54(1)(4) | | | | | 115,000 | | | | 120,256 | |
Tempo Acquisition, LLC / Tempo Acquisition Finance Corp., 6.75%, 06/01/25(1) | | | | | 20,000 | | | | 20,675 | |
Wells Fargo & Co., Series S, 5.90%, (3-Month USD LIBOR + 3.11%), perpetual(4),(5) | | | | | 54,000 | | | | 58,359 | |
Total Financials | | | | | | | | | 2,356,005 | |
Health Care — 2.8%
| | | | | | | | | | |
Anthem, Inc., 2.88%, 09/15/29 | | | | | 75,000 | | | | 74,436 | |
Avantor, Inc., 6.00%, 10/01/24(1) | | | | | 32,000 | | | | 34,284 | |
Avantor, Inc., 9.00%, 10/01/25(1) | | | | | 45,000 | | | | 50,387 | |
Bausch Health Americas, Inc., 9.25%,
04/01/26(1) | | | | | 24,000 | | | | 27,210 | |
Bausch Health Americas, Inc., 8.50%,
01/31/27(1) | | | | | 10,000 | | | | 11,275 | |
Catalent Pharma Solutions, Inc., 5.00%,
07/15/27(1) | | | | | 10,000 | | | | 10,475 | |
Charles River Laboratories International, Inc., 4.25%, 05/01/28(1) | | | | | 15,000 | | | | 15,320 | |
Eagle Holding Co. II LLC, 7.75%, 05/15/22(1)(6) | | | | | 35,000 | | | | 35,613 | |
Eagle Holding Co. II LLC, 7.63%, 05/15/22(1)(6) | | | | | 36,000 | | | | 36,405 | |
HCA, Inc., 5.63%, 09/01/28 | | | | | 37,000 | | | | 41,671 | |
HCA, Inc., 4.13%, 06/15/29 | | | | | 60,000 | | | | 63,720 | |
| | | | | | | | | | | |
| |
Security Description
| | | | Shares
| | Value
|
CORPORATE BONDS (continued)
| | | | | | | | | | |
Health Care (continued)
| | | | | | | | | | |
Mylan NV, 3.95%, 06/15/26 | | | | $ | 85,000 | | | $ | 88,321 | |
Ortho-Clinical Diagnostics, Inc. / Ortho-Clinical Diagnostics SA, 6.63%, 05/15/22(1) | | | | | 43,000 | | | | 41,764 | |
Par Pharmaceutical, Inc., 7.50%, 04/01/27(1) | | | | | 35,000 | | | | 33,338 | |
Select Medical Corp., 6.25%, 08/15/26(1) | | | | | 35,000 | | | | 37,363 | |
Surgery Center Holdings, Inc., 6.75%,
07/01/25(1) | | | | | 12,000 | | | | 11,040 | |
Surgery Center Holdings, Inc., 10.00%,
04/15/27(1) | | | | | 30,000 | | | | 30,450 | |
Tenet Healthcare Corp., 5.13%, 11/01/27(1) | | | | | 18,000 | | | | 18,787 | |
West Street Merger Sub, Inc., 6.38%,
09/01/25(1) | | | | | 39,000 | | | | 37,245 | |
Total Health Care | | | | | | | | | 699,104 | |
Industrials — 2.8%
| | | | | | | | | | |
Allied Universal Holdco LLC / Allied Universal Finance Corp., 6.63%, 07/15/26(1) | | | | | 55,000 | | | | 58,850 | |
General Electric Co., Series D, 5.00%, (3-Month USD LIBOR + 3.33%), 06/15/66,
perpetual(4),(5) | | | | | 65,000 | | | | 62,789 | |
Granite Holdings US Acquisition Co., 11.00%, 10/01/27(1) | | | | | 35,000 | | | | 32,637 | |
Hillenbrand, Inc., 4.50%, 09/15/26 | | | | | 65,000 | | | | 67,119 | |
Hillman Group, Inc. (The), 6.38%, 07/15/22(1) | | | | | 70,000 | | | | 64,750 | |
New Enterprise Stone & Lime Co., Inc., 10.13%, 04/01/22(1) | | | | | 42,000 | | | | 43,680 | |
Oshkosh Corp., 4.60%, 05/15/28 | | | | | 112,000 | | | | 119,840 | |
Owens Corning, 3.95%, 08/15/29 | | | | | 93,000 | | | | 95,814 | |
Patrick Industries, Inc., 7.50%, 10/15/27(1) | | | | | 35,000 | | | | 36,400 | |
Pentair Finance Sarl, 4.50%, 07/01/29 | | | | | 55,000 | | | | 57,407 | |
Vertiv Intermediate Holding Corp., 12.00%,
02/15/22(1)(6) | | | | | 45,000 | | | | 37,406 | |
Total Industrials | | | | | | | | | 676,692 | |
Information Technology — 3.3%
| | | | | | | | | | |
Broadcom Corp. / Broadcom Cayman Finance Ltd., 3.63%, 01/15/24 | | | | | 92,000 | | | | 94,851 | |
Citrix Systems, Inc., 4.50%, 12/01/27 | | | | | 90,000 | | | | 98,535 | |
Dell International LLC / EMC Corp., 4.90%, 10/01/26(1) | | | | | 50,000 | | | | 54,288 | |
Dell International LLC / EMC Corp., 8.10%, 07/15/36(1) | | | | | 19,000 | | | | 24,453 | |
Everi Payments, Inc., 7.50%, 12/15/25(1) | | | | | 15,000 | | | | 15,844 | |
Exela Intermediate LLC / Exela Finance, Inc., 10.00%, 07/15/23(1) | | | | | 30,000 | | | | 14,482 | |
Juniper Networks, Inc., 3.75%, 08/15/29 | | | | | 55,000 | | | | 55,999 | |
Micron Technology, Inc., 4.19%, 02/15/27 | | | | | 70,000 | | | | 73,189 | |
Motorola Solutions, Inc., 4.60%, 02/23/28 | | | | | 57,857 | | | | 63,136 | |
Motorola Solutions, Inc., 4.60%, 05/23/29 | | | | | 45,000 | | | | 49,538 | |
PayPal Holdings, Inc., 2.85%, 10/01/29 | | | | | 60,000 | | | | 60,313 | |
Radiate Holdco LLC / Radiate Finance, Inc., 6.63%, 02/15/25(1) | | | | | 55,000 | | | | 55,825 | |
ViaSat, Inc., 5.63%, 09/15/25(1) | | | | | 70,000 | | | | 71,292 | |
VMware, Inc., 3.90%, 08/21/27 | | | | | 80,000 | | | | 82,649 | |
Total Information Technology | | | | | | | | | 814,394 | |
Materials — 1.5%
| | | | | | | | | | |
Greif, Inc., 6.50%, 03/01/27(1) | | | | | 45,000 | | | | 48,487 | |
Kraton Polymers LLC / Kraton Polymers Capital Corp., 7.00%, 04/15/25(1) | | | | | 60,000 | | | | 61,200 | |
The accompanying notes are an integral part of these financial statements.
46
Schedule of Investments — Virtus Newfleet Multi-Sector Bond ETF(continued)
October 31, 2019
Security Description
| | | | Principal
| | Value
|
CORPORATE BONDS (continued)
| | | | | | | | | | |
Materials (continued)
| | | | | | | | | | |
LSB Industries, Inc., 9.63%, 05/01/23(1) | | | | $ | 35,000 | | | $ | 37,275 | |
Mauser Packaging Solutions Holding Co., 7.25%, 04/15/25(1) | | | | | 25,000 | | | | 24,000 | |
Olin Corp., 5.63%, 08/01/29 | | | | | 55,000 | | | | 57,242 | |
Schweitzer-Mauduit International, Inc., 6.88%, 10/01/26(1) | | | | | 40,000 | | | | 42,800 | |
Scotts Miracle-GRO Co. (The), 4.50%,
10/15/29(1) | | | | | 25,000 | | | | 25,188 | |
Trident TPI Holdings, Inc., 9.25%, 08/01/24(1) | | | | | 30,000 | | | | 29,175 | |
Trident TPI Holdings, Inc., 6.63%, 11/01/25(1) | | | | | 40,000 | | | | 35,900 | |
Total Materials | | | | | | | | | 361,267 | |
Real Estate — 2.2%
| | | | | | | | | | |
EPR Properties, 4.75%, 12/15/26 | | | | | 75,000 | | | | 81,775 | |
ESH Hospitality, Inc., 4.63%, 10/01/27(1) | | | | | 50,000 | | | | 50,255 | |
Healthcare Trust of America Holdings LP, 3.75%, 07/01/27 | | | | | 59,000 | | | | 62,219 | |
Iron Mountain, Inc., 4.88%, 09/15/29(1) | | | | | 50,000 | | | | 51,313 | |
LifeStorage LP, 3.50%, 07/01/26 | | | | | 54,000 | | | | 55,857 | |
LifeStorage LP, 3.88%, 12/15/27 | | | | | 19,000 | | | | 20,172 | |
MPT Operating Partnership LP / MPT Finance Corp., 5.00%, 10/15/27 | | | | | 32,000 | | | | 33,840 | |
MPT Operating Partnership LP / MPT Finance Corp., 4.63%, 08/01/29 | | | | | 10,000 | | | | 10,450 | |
Physicians Realty LP, 4.30%, 03/15/27 | | | | | 66,000 | | | | 70,909 | |
Service Properties Trust, 4.38%, 02/15/30 | | | | | 100,000 | | | | 96,595 | |
Total Real Estate | | | | | | | | | 533,385 | |
Utilities — 1.6%
| | | | | | | | | | |
CenterPoint Energy, Inc., 4.25%, 11/01/28 | | | | | 90,000 | | | | 99,479 | |
DPL, Inc., 4.35%, 04/15/29(1) | | | | | 73,000 | | | | 72,982 | |
Ferrellgas Partners LP / Ferrellgas Partners Finance Corp., 8.63%, 06/15/20 | | | | | 25,000 | | | | 14,375 | |
Talen Energy Supply, LLC, 7.25%, 05/15/27(1) | | | | | 15,000 | | | | 15,037 | |
Talen Energy Supply, LLC, 6.63%, 01/15/28(1) | | | | | 55,000 | | | | 53,350 | |
TerraForm Power Operating LLC, 5.00%,
01/31/28(1) | | | | | 50,000 | | | | 52,985 | |
Vistra Operations Co. LLC, 4.30%, 07/15/29(1) | | | | | 75,000 | | | | 78,024 | |
Total Utilities | | | | | | | | | 386,232 | |
Total Corporate Bonds
| | | | | | | | | | |
(Cost $8,216,229) | | | | | | | | | 8,332,948 | |
FOREIGN BONDS — 24.0%
| | | | | | | | | | |
Communication Services — 1.1%
| | | | | | | | | | |
Telesat Canada / Telesat LLC, 6.50%, 10/15/27 (Canada)(1) | | | | | 45,000 | | | | 47,081 | |
Tencent Holdings Ltd., 3.98%, 04/11/29 (China)(1) | | | | | 200,000 | | | | 215,661 | |
Total Communication Services | | | | | | | | | 262,742 | |
Consumer Discretionary — 0.5%
| | | | | | | | | | |
Brookfield Residential Properties, Inc. / Brookfield Residential US Corp., 6.25%, 09/15/27 (Canada)(1) | | | | | 75,000 | | | | 76,687 | |
Gateway Casinos & Entertainment Ltd., 8.25%, 03/01/24 (Canada)(1) | | | | | 35,000 | | | | 36,138 | |
Total Consumer Discretionary | | | | | | | | | 112,825 | |
Security Description
| | | | | | Principal
| | Value
|
FOREIGN BONDS (continued)
| | | | | | | | | | | | | | |
Consumer Staples — 1.5%
| | | | | | | | | | | | | | |
Bacardi Ltd., 4.70%, 05/15/28 (Bermuda)(1) | | | | | | | | $ | 100,000 | | | $ | 109,547 | |
Kronos Acquisition Holdings, Inc., 9.00%, 08/15/23 (Canada)(1) | | | | | | | | | 61,000 | | | | 53,375 | |
Sigma Finance Netherlands BV, 4.88%, 03/27/28 (Mexico)(1) | | | | | | | | | 200,000 | | | | 216,200 | |
Total Consumer Staples | | | | | | | | | | | | | 379,122 | |
Energy — 5.1%
| | | | | | | | | | | | | | |
Encana Corp., 8.13%, 09/15/30 (Canada) | | | | | | | | | 30,000 | | | | 38,891 | |
Gazprom OAO Via Gaz Capital SA, 7.29%, 08/16/37 (Russia) | | | | | | | | | 100,000 | | | | 135,286 | |
KazMunayGas National Co. JSC,
4.75%, 04/19/27 (Kazakhstan)(1) | | | | | | | | | 300,000 | | | | 328,083 | |
Pertamina Persero PT, 6.45%, 05/30/44 (Indonesia)(1) | | | | | | | | | 255,000 | | | | 325,920 | |
Petrobras Global Finance BV, 7.38%,
01/17/27 (Brazil) | | | | | | | | | 80,000 | | | | 97,040 | |
Petrobras Global Finance BV, 5.75%,
02/01/29 (Brazil) | | | | | | | | | 110,000 | | | | 122,606 | |
Petroleos Mexicanos, 4.63%, 09/21/23 (Mexico) | | | | | | | | | 40,000 | | | | 41,815 | |
Petroleos Mexicanos, 6.50%, 03/13/27 (Mexico) | | | | | | | | | 30,000 | | | | 31,875 | |
Petroleos Mexicanos, 5.35%, 02/12/28 (Mexico) | | | | | | | | | 90,000 | | | | 89,100 | |
Petroleos Mexicanos, 6.50%, 06/02/41 (Mexico) | | | | | | | | | 40,000 | | | | 39,890 | |
Total Energy | | | | | | | | | | | | | 1,250,506 | |
Financials — 5.5%
| | | | | | | | | | | | | | |
AerCap Ireland Capital DAC / AerCap Global Aviation Trust, 3.65%,
07/21/27 (Ireland) | | | | | | | | | 150,000 | | | | 154,698 | |
Australia & New Zealand Banking Group Ltd., 4.40%, 05/19/26 (Australia)(1) | | | | | | | | | 290,000 | | | | 311,886 | |
Bank of China Ltd., 5.00%, 11/13/24 (China)(1) | | | | | | | | | 200,000 | | | | 218,287 | |
Bank of Montreal, 3.80%, (USD 5 Year Swap + 1.43%), 12/15/32
(Canada)(4) | | | | | | | | | 72,000 | | | | 74,765 | |
BBVA Bancomer SA, 5.13%, (US 5 Year CMT T-Note + 2.65%), 01/18/33 (Mexico)(1)(4) | | | | | | | | | 200,000 | | | | 195,610 | |
Development Bank of Kazakhstan JSC, 8.95%, 05/04/23 (Kazakhstan)(1) | | | | | KZT | | | | 70,000,000 | | | | 170,698 | |
Fairfax Financial Holdings Ltd., 4.85%, 04/17/28 (Canada) | | | | | | | | | 105,000 | | | | 114,453 | |
Fairstone Financial, Inc., 7.88%,
07/15/24 (Canada)(1) | | | | | | | | | 10,000 | | | | 10,561 | |
Toronto-Dominion Bank (The), 3.63%, (USD 5 Year Swap + 2.21%),
09/15/31 (Canada)(4) | | | | | | | | | 90,000 | | | | 94,026 | |
Total Financials | | | | | | | | | | | | | 1,344,984 | |
The accompanying notes are an integral part of these financial statements.
47
Schedule of Investments — Virtus Newfleet Multi-Sector Bond ETF(continued)
October 31, 2019
Security Description
| | | | | | Principal
| | Value
|
FOREIGN BONDS (continued)
| | | | | | | | | | | | | | |
Government — 5.8%
| | | | | | | | | | | | | | |
Dominican Republic International Bond, 5.95%, 01/25/27 (Dominican Republic)(1) | | | | | | | | $ | 140,000 | | | $ | 154,176 | |
Egypt Government International Bond, 8.50%, 01/31/47 (Egypt)(1) | | | | | | | | | 200,000 | | | | 211,075 | |
Mexican Bonos, Series M, 6.50%, 06/09/22 (Mexico) | | | | | MXN | | | | 2,200,000 | | | | 114,347 | |
Republic of South Africa Government International Bond, 5.65%, 09/27/47 (South Africa) | | | | | | | | | 200,000 | | | | 196,730 | |
Russian Foreign Bond—Eurobond, 5.63%, 04/04/42 (Russia)(1) | | | | | | | | | 200,000 | | | | 247,515 | |
Saudi Government International Bond, 4.38%, 04/16/29 (Saudi Arabia)(1) | | | �� | | | | | | 200,000 | | | | 223,747 | |
Turkey Government International Bond, 7.38%, 02/05/25 (Turkey) | | | | | | | | | 65,000 | | | | 69,857 | |
Ukraine Government International Bond, 7.75%, 09/01/26 (Ukraine)(1) | | | | | | | | | 185,000 | | | | 199,243 | |
Total Government | | | | | | | | | | | | | 1,416,690 | |
Health Care — 0.2%
| | | | | | | | | | | | | | |
Advanz Pharma Corp., 8.00%, 09/06/24 (Canada) | | | | | | | | | 17,000 | | | | 16,278 | |
Teva Pharmaceutical Finance Netherlands III BV, 3.15%, 10/01/26 (Israel) | | | | | | | | | 45,000 | | | | 33,975 | |
Total Health Care | | | | | | | | | | | | | 50,253 | |
Industrials — 2.6%
| | | | | | | | | | | | | | |
Avolon Holdings Funding Ltd., 4.38%, 05/01/26 (Ireland)(1) | | | | | | | | | 87,000 | | | | 92,150 | |
Bombardier, Inc., 7.50%, 03/15/25 (Canada)(1) | | | | | | | | | 30,000 | | | | 28,800 | |
CNH Industrial NV, 4.50%, 08/15/23 (United Kingdom) | | | | | | | | | 98,000 | | | | 104,418 | |
DP World PLC, 6.85%, 07/02/37 (United Arab Emirates)(1) | | | | | | | | | 100,000 | | | | 131,738 | |
GFL Environmental, Inc., 7.00%, 06/01/26 (Canada)(1) | | | | | | | | | 22,000 | | | | 23,375 | |
GFL Environmental, Inc., 8.50%, 05/01/27 (Canada)(1) | | | | | | | | | 25,000 | | | | 27,562 | |
GW B-CR Security Corp., 9.50%, 11/01/27 (Canada)(1) | | | | | | | | | 15,000 | | | | 15,450 | |
Norwegian Air Shuttle ASA
Pass-Through Trust, Class A, Series
2016-1, 4.88%, 05/10/28 (Norway)(1) | | | | | | | | | 189,504 | | | | 183,016 | |
Titan Acquisition Ltd. / Titan Co.-Borrower LLC, 7.75%, 04/15/26 (Canada)(1) | | | | | | | | | 40,000 | | | | 37,600 | |
Total Industrials | | | | | | | | | | | | | 644,109 | |
Materials — 1.7%
| | | | | | | | | | | | | | |
BHP Billiton Finance USA Ltd., 6.75%, (USD 5 Year Swap + 5.09%),
10/19/75 (Australia)(1)(4) | | | | | | | | | 240,000 | | | | 281,753 | |
Glencore Funding LLC, 4.00%,
03/27/27 (Switzerland)(1) | | | | | | | | | 106,000 | | | | 110,037 | |
NOVA Chemicals Corp., 5.00%,
05/01/25 (Canada)(1) | | | | | | | | | 30,000 | | | | 30,300 | |
Total Materials | | | | | | | | | | | | | 422,090 | |
Total Foreign Bonds
| | | | | | | | | | | | | | |
(Cost $5,652,800) | | | | | | | | | | | | | 5,883,321 | |
Security Description
| | | | Principal
| | Value
|
MORTGAGE BACKED SECURITIES — 12.0%
| | | |
Commercial Mortgage Backed Securities — 0.6%
| | | |
Sutherland Commercial Mortgage Loans, Class A, Series 2017-SBC6, 3.19%, 05/25/37(1)(4)(7) | | | | | $64,523 | | | $ | 64,833 | |
Sutherland Commercial Mortgage Loans, Class A, Series 2018-SBC7, 4.72%, 05/25/39(1)(4)(7) | | | | | 69,858 | | | | 71,039 | |
Total Commercial Mortgage Backed Securities | | | | | | | | | 135,872 | |
Mortgage Backed Security — 2.4%
| | | | | | | | | | |
Federal National Mortgage Association, 3.50%, 05/01/49 | | | | | 235,442 | | | | 241,893 | |
Federal National Mortgage Association,
3.50%, 07/01/49 | | | | | 237,516 | | | | 243,760 | |
Marlette Funding Trust, Class A, Series 2019-4A, 2.39%, 12/17/29(1) | | | | | 100,000 | | | | 100,094 | |
Total Mortgage Backed Security | | | | | | | | | 585,747 | |
Residential Mortgage Backed Securities — 9.0%
| | | |
Ajax Mortgage Loan Trust, Class A1, Series 2019-D, 2.96%, 09/25/65(1)(8) | | | | | 131,973 | | | | 132,029 | |
Angel Oak Mortgage Trust I LLC, Class A1, Series 2019-1, 3.92%, 11/25/48(1)(4)(7) | | | | | 231,347 | | | | 235,390 | |
Arroyo Mortgage Trust, Class A1, Series 2019-2, 3.35%, 04/25/49(1)(4)(7) | | | | | 91,294 | | | | 93,038 | |
Banc of America Funding Trust, Class 5A1, Series 2004-D, 4.48%, 01/25/35(4)(7) | | | | | 316,754 | | | | 321,978 | |
Deephaven Residential Mortgage Trust, Class A2, Series 2017-1A, 2.93%, 12/26/46(1)(4)(7) | | | | | 20,726 | | | | 20,746 | |
Deephaven Residential Mortgage Trust, Class A2, Series 2017-2A, 2.61%, 06/25/47(1)(4)(7) | | | | | 46,761 | | | | 46,839 | |
JPMorgan Mortgage Trust, Class A3, Series 2018-8, 4.00%, 01/25/49(1)(4)(7) | | | | | 81,652 | | | | 83,117 | |
Mill City Mortgage Loan Trust, Class A1B, Series 2018-4, 3.50%, 04/25/66(1)(4)(7) | | | | | 100,000 | | | | 103,962 | |
New Residential Mortgage Loan Trust, Class A1, Series 2016-1A, 3.75%, 03/25/56(1)(4)(7) | | | | | 107,586 | | | | 112,121 | |
Sequoia Mortgage Trust, Class B1, Series 2013-8, 3.53%, 06/25/43(4)(7) | | | | | 257,983 | | | | 264,639 | |
Structured Adjustable Rate Mortgage Loan Trust, Class 3A2, Series 2004-4, 4.39%, 04/25/34(4)(7) | | | | | 100,758 | | | | 105,653 | |
Towd Point Mortgage Trust, Class A2, Series 2016-4, 3.00%, 07/25/56(1)(4)(7) | | | | | 250,000 | | | | 253,853 | |
Towd Point Mortgage Trust, Class A2, Series 2018-6, 3.75%, 03/25/58(1)(4)(7) | | | | | 100,000 | | | | 106,608 | |
Verus Securitization Trust, Class A1, Series 2019-2, 3.21%, 04/25/59(1)(4)(7) | | | | | 142,441 | | | | 143,775 | |
VOLT LXXI LLC, Class A1A, Series 2018-NPL7, 3.97%, 09/25/48(1)(8) | | | | | 66,860 | | | | 67,370 | |
VOLT LXXV LLC, Class A1A, Series 2019-NPL1, 4.34%, 01/25/49(1)(8) | | | | | 124,875 | | | | 126,102 | |
Total Residential Mortgage Backed Securities | | | | | | | | | 2,217,220 | |
Total Mortgage Backed Securities
| | | | | | | | | | |
(Cost $2,869,312) | | | | | | | | | 2,938,839 | |
The accompanying notes are an integral part of these financial statements.
48
Schedule of Investments — Virtus Newfleet Multi-Sector Bond ETF(continued)
October 31, 2019
Security Description
| | | | Principal
| | Value
|
U.S. GOVERNMENT SECURITIES — 11.0%
| | | | | | | | | | |
U.S. Treasury Note | | | | | | | | | | |
2.50%, 12/31/20 | | | | $ | 250,000 | | | $ | 252,578 | |
2.25%, 03/31/21 | | | | | 660,000 | | | | 666,123 | |
1.75%, 06/15/22 | | | | | 870,000 | | | | 875,573 | |
2.38%, 01/31/23 | | | | | 520,000 | | | | 534,016 | |
2.38%, 05/15/29 | | | | | 350,000 | | | | 371,185 | |
Total U.S. Government Securities
| | | | | | | | | | |
(Cost $2,665,843) | | | | | | | | | 2,699,475 | |
TERM LOANS — 9.9%
| | | | | | | | | | |
Aerospace — 0.3%
| | | | | | | | | | |
Dynasty Acquisition Co., Inc. (aka StandardAero Holding Corp.), 6.10%, (3-Month USD LIBOR + 4.00%), 04/06/26(4) | | | | | 22,762 | | | | 22,842 | |
Dynasty Acquisition Co., Inc. (aka StandardAero Holding Corp.), 6.10%, (3-Month USD
LIBOR + 4.00%), 04/06/26(4) | | | | | 12,238 | | | | 12,281 | |
TransDigm, Inc., 4.29%, (1-Month USD
LIBOR + 2.50%), 06/09/23(4) | | | | | 32,956 | | | | 32,850 | |
Total Aerospace | | | | | | | | | 67,973 | |
Consumer Durables — 0.1%
| | | | | | | | | | |
Global Appliance, Inc. (aka SharkNinja Operating LLC), 5.79%, (1-Month USD LIBOR + 4.00%), 09/29/24(4) | | | | | 29,125 | | | | 28,251 | |
Consumer Non-Durables — 0.8%
| | | | | | | | | | |
American Greetings Corp., 6.29%, (1-Month USD LIBOR + 4.50%), 04/06/24(4) | | | | | 82,980 | | | | 80,905 | |
Kronos Acquisition Intermediate, Inc. (aka KIK Custom Products), 5.80%, (1-Month USD LIBOR + 4.00%), 05/15/23 (Canada)(4) | | | | | 26,202 | | | | 24,834 | |
Parfums Holding Co., Inc, 6.37%, (3-Month USD LIBOR + 4.25%), 06/28/24(4) | | | | | 50,205 | | | | 49,788 | |
Rodan & Fields, LLC, 5.92%, (1-Month USD LIBOR + 4.00%), 06/16/25 (Kazakhstan)(4) | | | | | 62,583 | | | | 51,318 | |
Total Consumer Non-Durables | | | | | | | | | 206,845 | |
Energy — 0.3%
| | | | | | | | | | |
CITGO Petroleum Corp., 7.10%, (3-Month USD LIBOR + 5.00%), 03/28/24(4) | | | | | 39,800 | | | | 39,899 | |
Medallion Midland Acquisition, LLC, 5.04%, (1-Month USD LIBOR + 3.25%), 10/30/24(4) | | | | | 41,964 | | | | 39,621 | |
Total Energy | | | | | | | | | 79,520 | |
Financials — 0.7%
| | | | | | | | | | |
Asurion, LLC (fka Asurion Corp.), 8.29%,
(1-Month USD LIBOR + 6.50%), 08/04/25(4) | | | | | 46,228 | | | | 46,546 | |
Blackhawk Network Holdings, Inc., 4.79%,
(1-Month USD LIBOR + 3.00%), 06/15/25(4) | | | | | 43,767 | | | | 43,477 | |
iStar, Inc. (fka iStar Financial, Inc.), 4.75%, (1-Month USD LIBOR + 2.75%), 06/28/23(4) | | | | | 68,168 | | | | 68,339 | |
Total Financials | | | | | | | | | 158,362 | |
Food/Tobacco — 0.2%
| | | | | | | | | | |
Milk Specialties Co., 5.79%, (1-Month USD LIBOR + 4.00%), 08/16/23(4) | | | | | 26,738 | | | | 24,933 | |
Shearer’s Foods LLC, 06/30/22(9) | | | | | 25,000 | | | | 24,813 | |
Total Food/Tobacco | | | | | | | | | 49,746 | |
| | | | | | | | | | | |
| | | | | | | | | | | |
Security Description
| | | | Principal
| | Value
|
TERM LOANS (continued)
| | | | | | | | | | |
Gaming/Leisure — 0.5%
| | | | | | | | | | |
Playa Resorts Holding B.V., 4.54%, (1-Month USD LIBOR + 2.75%), 04/29/24(4) | | | | $ | 26,374 | | | $ | 25,772 | |
Scientific Games International, Inc., 4.54%,
(1-Month USD LIBOR + 2.75%), 08/14/24(4) | | | | | 33,780 | | | | 33,444 | |
Stars Group Holdings B.V., 5.60%, (3-Month USD LIBOR + 3.50%), 07/10/25(4) | | | | | 39,945 | | | | 40,166 | |
UFC HOLDINGS LLC, 5.04%, (1-Month USD LIBOR + 3.25%), 04/29/26(4) | | | | | 17,527 | | | | 17,541 | |
Total Gaming/Leisure | | | | | | | | | 116,923 | |
Health Care — 1.8%
| | | | | | | | | | |
Accelerated Health Systems, LLC, 5.44%,
(1-Month USD LIBOR + 3.50%), 10/31/25(4) | | | | | 39,551 | | | | 39,625 | |
AHP Health Partners, Inc. (aka Ardent Health Partners, LLC), 6.29%, (1-Month USD LIBOR + 4.50%), 06/30/25(4) | | | | | 48,654 | | | | 48,733 | |
Bausch Health Companies, Inc. (fka Valeant Pharmaceuticals International, Inc.), 4.92%, (1-Month USD LIBOR + 3.00%), 06/02/25 (Canada)(4) | | | | | 41,315 | | | | 41,507 | |
CHG Healthcare Services, Inc. (fka CHG Buyer Corp.), 4.79%, (1-Month USD LIBOR + 3.00%), 06/07/23(4) | | | | | 86,315 | | | | 86,323 | |
Concordia Healthcare Corp., 7.25%, (1-Week USD LIBOR + 5.50%), 09/06/24 (Canada)(4) | | | | | 155,820 | | | | 146,916 | |
Envision Health Care Corp., 5.54%, (1-Month USD LIBOR + 3.75%), 10/10/25(4) | | | | | 30,662 | | | | 24,904 | |
Ortho-Clinical Diagnostics, Inc., 5.31%, (3-Month USD LIBOR + 3.25%), 06/30/25(4) | | | | | 51,179 | | | | 49,026 | |
Sotera Health Holdings LLC, 5.43%, (3-Month USD LIBOR + 3.50%), 05/15/22(4) | | | | | 14,963 | | | | 14,944 | |
Total Health Care | | | | | | | | | 451,978 | |
Housing — 0.7%
| | | | | | | | | | |
American Builders & Contractors Supply Co., Inc., 01/15/27(9) | | | | | 40,000 | | | | 39,988 | |
Capital Automotive L.P., 7.79%, (1-Month USD LIBOR + 6.00%), 03/24/25 (Chile)(4) | | | | | 25,466 | | | | 25,593 | |
CPG International LLC (fka CPG International, Inc.), 5.93%, (3-Month USD LIBOR + 3.75%), 05/05/24(4) | | | | | 94,389 | | | | 93,209 | |
Total Housing | | | | | | | | | 158,790 | |
Information Technology — 1.2%
| | | | | | | | | | |
Applied Systems, Inc., 9.10%, (3-Month USD LIBOR + 7.00%), 09/19/25(4) | | | | | 50,000 | | | | 50,729 | |
BMC Software Finance, Inc., 6.04%, (1-Month USD LIBOR + 4.25%), 10/02/25(4) | | | | | 19,501 | | | | 18,129 | |
Dell International LLC, 3.79%, (1-Month USD LIBOR + 2.00%), 09/19/25(4) | | | | | 38,347 | | | | 38,543 | |
Kronos, Inc., 5.25%, (3-Month USD LIBOR + 3.00%), 11/01/23 (Oman)(4) | | | | | 82,445 | | | | 82,387 | |
The accompanying notes are an integral part of these financial statements.
49
Schedule of Investments — Virtus Newfleet Multi-Sector Bond ETF(continued)
October 31, 2019
Security Description
| | | | Principal
| | Value
|
TERM LOANS (continued)
| | | | | | | | | | |
Information Technology (continued)
| | | | | | | | | | |
Kronos, Inc., 10.50%, (3-Month USD LIBOR + 8.25%), 11/01/24(4) | | | | $ | 48,000 | | | $ | 48,531 | |
SS&C Technologies, Inc., 4.04%, (1-Month USD LIBOR + 2.25%), 04/16/25(4) | | | | | 16,599 | | | | 16,664 | |
SS&C Technologies, Inc., 4.04%, (1-Month USD LIBOR + 2.25%), 04/16/25(4) | | | | | 12,327 | | | | 12,375 | |
Vertafore, Inc., 5.04%, (1-Month USD LIBOR + 3.25%), 07/02/25(4) | | | | | 24,127 | | | | 23,463 | |
Total Information Technology | | | | | | | | | 290,821 | |
Manufacturing — 0.3%
| | | | | | | | | | |
CPI Acquisition, Inc., 6.71%, (3-Month USD LIBOR + 4.50%), 08/17/22(4) | | | | | 60,000 | | | | 46,696 | |
Hillman Group, Inc. (The), 5.79%, (1-Month USD LIBOR + 4.00%), 05/30/25(4) | | | | | 34,066 | | | | 32,311 | |
Total Manufacturing | | | | | | | | | 79,007 | |
Media/Telecom—Broadcasting — 0.4%
| | | | | | | | | | |
Diamond Sports Group LLC, 5.08%, (1-Month USD LIBOR + 3.25%), 08/24/26(4) | | | | | 20,000 | | | | 20,122 | |
iHeartCommunications, Inc., 6.03%, (1-Month USD LIBOR + 4.00%), 05/01/26(4) | | | | | 55,206 | | | | 55,465 | |
Nexstar Broadcasting, Inc., 4.55%, (1-Month USD LIBOR + 2.75%), 09/18/26(4) | | | | | 20,000 | | | | 20,099 | |
Total Media/Telecom — Broadcasting | | | | | | | | | 95,686 | |
Media/Telecom—Cable/Wireless Video — 0.2%
| | | |
CSC Holdings, LLC, 4.17%, (1-Month USD LIBOR + 2.25%), 01/15/26(4) | | | | | 59,028 | | | | 58,718 | |
Media/Telecom — Diversified Media — 0.1%
| | | | | | | | | | |
Cineworld Finance US, Inc., 4.04%, (1-Month USD LIBOR + 2.25%), 02/28/25 (Kazakhstan)(4) | | | | | 24,162 | | | | 23,874 | |
Media/Telecom — Telecommunications — 0.6%
| | | |
CenturyLink, Inc., 4.54%, (1-Month USD LIBOR + 2.75%), 01/31/25(4) | | | | | 61,887 | | | | 61,349 | |
Iridium Satellite LLC, 10/17/26(9) | | | | | 5,000 | | | | 5,035 | |
Securus Technologies Holdings, Inc., 10.04%, (1-Month USD LIBOR + 8.25%), 11/01/25(4) | | | | | 140,000 | | | | 73,675 | |
Total Media/Telecom—Telecommunications | | | | | | | | | 140,059 | |
Media/Telecom — Wireless Communications — 0.1%
| | | |
CommScope, Inc., 5.04%, (1-Month USD LIBOR + 3.25%), 04/06/26(4) | | | | | 25,000 | | | | 24,571 | |
Retail — 0.1%
| | | | | | | | | | |
Neiman Marcus Group, Inc. (The), 7.99%,
(1-Month USD LIBOR + 6.00%), 10/25/23(4) | | | | | 38,499 | | | | 28,278 | |
| | | | | | | | | | | |
| | | | | | | | | | | |
| | | | | | | | | | | |
Security Description
| | | | Principal
| | Value
|
TERM LOANS (continued)
| | | | | | | | | | |
Service — 0.9%
| | | | | | | | | | |
Dun & Bradstreet Corporation, The, 6.80%, (1-Month USD LIBOR + 5.00%), 02/06/26(4) | | | | $ | 40,000 | | | $ | 40,162 | |
GFL Environmental, Inc., 4.79%, (1-Month USD LIBOR + 3.00%), 05/30/25(4) | | | | | 83,500 | | | | 83,343 | |
Hoya Midco, LLC, 5.29%, (1-Month USD LIBOR + 3.50%), 06/30/24(4) | | | | | 14,902 | | | | 14,504 | |
PI UK Holdco II Limited, 5.04%, (1-Month USD LIBOR + 3.25%), 01/03/25(4) | | | | | 66,144 | | | | 65,855 | |
TKC Holdings, Inc., 5.54%, (1-Month USD LIBOR + 3.75%), 02/01/23(4) | | | | | 27,842 | | | | 27,047 | |
Total Service | | | | | | | | | 230,911 | |
Utilities — 0.6%
| | | | | | | | | | |
APLP Holdings Limited Partnership, 4.54%, (1-Month USD LIBOR + 2.75%), 04/13/23(4) | | | | | 46,644 | | | | 46,721 | |
Brookfield WEC Holdings, Inc. (aka Westinghouse Electric Co. LLC), 5.29%,
(1-Month USD LIBOR + 3.50%), 08/01/25(4) | | | | | 54,401 | | | | 54,141 | |
Calpine Corp., 4.86%, (3-Month USD LIBOR + 2.75%), 04/05/26(4) | | | | | 34,913 | | | | 34,991 | |
Total Utilities | | | | | | | | | 135,853 | |
Total Term Loans
| | | | | | | | | | |
(Cost $2,534,969) | | | | | | | | | 2,426,166 | |
ASSET BACKED SECURITIES — 6.2%
| | | | | | | | | | |
Arbys Funding LLC, Class A2, Series 2015-1A, 4.97%, 10/30/45(1) | | | | | 326,400 | | | | 337,851 | |
Drug Royalty III LP 1, Class A, Series 2016-1A, 3.98%, 04/15/27(1) | | | | | 97,428 | | | | 97,733 | |
DT Auto Owner Trust, Class C, Series 2019-2A, 3.18%, 02/18/25(1) | | | | | 90,000 | | | | 91,437 | |
Flagship Credit Auto Trust, Class C, Series 2019-2, 3.09%, 05/15/25(1) | | | | | 130,000 | | | | 132,583 | |
Genesis Sales Finance Master Trust, Class A, Series 2019-AA, 4.68%, 08/20/23(1) | | | | | 115,000 | | | | 117,501 | |
MVW Owner Trust, Class A, Series 2019-1A, 2.89%, 11/20/36(1) | | | | | 91,948 | | | | 93,715 | |
Skopos Auto Receivables Trust, Class B, Series 2018-1A, 3.93%, 05/16/22(1) | | | | | 565,000 | | | | 567,175 | |
United Auto Credit Securitization Trust, Class E, Series 2019-1, 4.29%, 08/12/24(1) | | | | | 80,000 | | | | 81,123 | |
Total Asset Backed Securities
| | | | | | | | | | |
(Cost $1,499,551) | | | | | | | | | 1,519,118 | |
The accompanying notes are an integral part of these financial statements.
50
Schedule of Investments — Virtus Newfleet Multi-Sector Bond ETF(continued)
October 31, 2019
Security Description
| | | | Shares
| | Value
| | |
WARRANT — 0.1%
| | | | | | | | | | |
Communication Services—0.1%
| | | | | | | | | | |
iHeart Media, Inc.*
(Cost $49,157) | | | | | 2,830 | | | $ | 39,564 | |
COMMON STOCK — 0.1%
| | | | | | | | | | |
Communication Services — 0.1%
| | | | | | | | | | |
Clear Channel Outdoor Holdings, Inc. *
(Cost $31,607) | | | | | 6,654 | | | | 15,504 | |
MONEY MARKET FUND — 1.8%
| | | | | | | | | | |
JP Morgan U.S. Government Money Market Institutional Shares, 1.67%(10)
(Cost $436,083) | | | | | 436,083 | | | | 436,083 | |
TOTAL INVESTMENTS — 99.0%
| | | | | | | | | | |
(Cost $23,955,551) | | | | | | | | | 24,291,018 | |
Other Assets in Excess of Liabilities—1.0% | | | | | | | | | 244,243 | |
Net Assets — 100.0% | | | | | | | | $ | 24,535,261 | |
* | | Non-income producing security. |
(1) | | Security was purchased pursuant to Rule 144A under the Securities Act of 1933 and may not be resold subject to that rule except to qualified institutional buyers. Unless otherwise noted, 144A securities are deemed to be liquid. At October 31, 2019, the aggregate value of these securities was $10,487,304, or 42.7% of net assets. |
(2) | | Security valued at fair value as determined in good faith by or under the direction of the Trustees. This security is disclosed as a Level 3 security in the Fair Value Hierarchy table located after the Schedule of Investments. |
(3) | | Security in default, no interest payments are being received during the bankruptcy proceedings. |
(4) | | Variable rate instrument. The interest rate shown reflects the rate in effect at October 31, 2019. |
(5) | | Perpetual security with no stated maturity date. |
(6) | | Payment in-kind security.100% of the income was received in cash. |
(7) | | Adjustable rate security with an interest rate that is not based on a published reference index and spread. The rate is based on the structure of the agreement and current market conditions. |
(8) | | Represents step coupon bond. Rate shown reflects the rate in effect as of October 31, 2019. |
(9) | | This loan will settle after October 31, 2019, at which time the interest rate, based on the LIBOR and the agreed upon spread on trade date, will be reflected. |
(10) | | The rate shown reflects the seven-day yield as of October 31, 2019. |
CMT — 1 Year Constant Maturity Treasury Index
LIBOR — London InterBank Offered Rate
USD — United States Dollar
Currency Abbreviations
KZT — Kazakhstani Tenge
MXN — Mexican Peso
The following table summarizes valuation of the Fund’s investments under the fair value hierarchy levels as of October 31, 2019.
| | | | Level 1
| | Level 2
| | Level 3
| | Total
|
Asset Valuation Inputs
| | | | | | | | | | | | | | | | | | |
Corporate Bonds | | | | $ | — | | | $ | 8,332,948 | | | $ | 0 | | | $ | 8,332,948 | |
Foreign Bonds | | | | | — | | | | 5,883,321 | | | | — | | | | 5,883,321 | |
Mortgage Backed Securities | | | | | — | | | | 2,938,839 | | | | — | | | | 2,938,839 | |
U.S. Government Securities | | | | | — | | | | 2,699,475 | | | | — | | | | 2,699,475 | |
Term Loans | | | | | — | | | | 2,426,166 | | | | — | | | | 2,426,166 | |
Asset Backed Securities | | | | | — | | | | 1,519,118 | | | | — | | | | 1,519,118 | |
Warrant | | | | | — | | | | 39,564 | | | | — | | | | 39,564 | |
Common Stock | | | | | 15,504 | | | | — | | | | — | | | | 15,504 | |
Money Market Fund | | | | | 436,083 | | | | — | | | | — | | | | 436,083 | |
Total | | | | $ | 451,587 | | | $ | 23,839,431 | | | $ | 0 | | | $ | 24,291,018 | |
Management has determined that the amount of Level 3 securities compared to total net assets is not material; therefore, the rollforward of Level 3 securities and assumptions are not shown for the year ended October 31, 2019.
The accompanying notes are an integral part of these financial statements.
51
Schedule of Investments — Virtus Private Credit Strategy ETF
October 31, 2019
Security Description
| | | | Shares
| | Value
|
| |
COMMON STOCKS — 65.4%
| | | | | | | | | | |
| |
Financials — 65.4%
| | | | | | | | | | |
Alcentra Capital Corp. | | | | | 236,314 | | | $ | 2,110,284 | |
Apollo Investment Corp.(1) | | | | | 280,189 | | | | 4,440,996 | |
Ares Capital Corp. | | | | | 180,207 | | | | 3,297,788 | |
Bain Capital Specialty Finance, Inc.(1) | | | | | 51,916 | | | | 984,327 | |
Barings BDC, Inc. | | | | | 704,578 | | | | 7,236,016 | |
BlackRock Capital Investment Corp. | | | | | 1,107,366 | | | | 5,127,105 | |
BlackRock TCP Capital Corp. | | | | | 323,741 | | | | 4,480,575 | |
Capital Southwest Corp. | | | | | 124,771 | | | | 2,769,916 | |
Capitala Finance Corp. | | | | | 276,344 | | | | 2,268,784 | |
Fidus Investment Corp. | | | | | 297,605 | | | | 4,389,674 | |
FS KKR Capital Corp. | | | | | 1,046,579 | | | | 5,975,966 | |
Garrison Capital, Inc.(1) | | | | | 293,921 | | | | 1,966,331 | |
Gladstone Capital Corp.(1) | | | | | 395,249 | | | | 3,901,108 | |
Gladstone Investment Corp.(1) | | | | | 277,508 | | | | 3,582,628 | |
Goldman Sachs BDC, Inc.(1) | | | | | 188,412 | | | | 3,924,622 | |
Golub Capital BDC, Inc. | | | | | 185,189 | | | | 3,298,216 | |
Hercules Capital, Inc. | | | | | 305,653 | | | | 4,318,877 | |
Horizon Technology Finance Corp. | | | | | 174,183 | | | | 2,175,546 | |
Investcorp Credit Management BDC, Inc. | | | | | 288,225 | | | | 1,922,461 | |
Main Street Capital Corp.(1) | | | | | 61,795 | | | | 2,660,275 | |
Medley Capital Corp.(1) | | | | | 809,762 | | | | 1,773,379 | |
Monroe Capital Corp.(1) | | | | | 202,986 | | | | 2,291,712 | |
New Mountain Finance Corp. | | | | | 304,815 | | | | 4,139,388 | |
Oaktree Specialty Lending Corp. | | | | | 620,003 | | | | 3,205,415 | |
Oaktree Strategic Income Corp. | | | | | 251,054 | | | | 2,046,090 | |
OFS Capital Corp.(1) | | | | | 182,545 | | | | 2,174,111 | |
Oxford Square Capital Corp.(1) | | | | | 941,062 | | | | 4,808,827 | |
PennantPark Floating Rate Capital Ltd. | | | | | 352,542 | | | | 4,047,182 | |
PennantPark Investment Corp. | | | | | 795,185 | | | | 4,810,869 | |
Portman Ridge Finance Corp. | | | | | 949,609 | | | | 2,098,636 | |
Prospect Capital Corp.(1) | | | | | 761,860 | | | | 4,906,378 | |
Saratoga Investment Corp. | | | | | 84,909 | | | | 2,122,725 | |
Solar Capital Ltd. | | | | | 158,939 | | | | 3,288,448 | |
Solar Senior Capital Ltd. | | | | | 195,280 | | | | 3,434,975 | |
Stellus Capital Investment Corp.(1) | | | | | 320,557 | | | | 4,442,920 | |
TCG BDC, Inc. | | | | | 252,392 | | | | 3,606,682 | |
THL Credit, Inc. | | | | | 311,346 | | | | 2,163,855 | |
TPG Specialty Lending, Inc.(1) | | | | | 164,963 | | | | 3,513,712 | |
TriplePoint Venture Growth BDC Corp.(1) | | | | | 225,928 | | | | 3,777,516 | |
WhiteHorse Finance, Inc.(1) | | | | | 344,167 | | | | 4,801,130 | |
Total Financials | | | | | | | | | 138,285,445 | |
| |
Total Common Stocks
| | | | | | | | | | |
(Cost $144,243,283) | | | | | | | | | 138,285,445 | |
| |
| |
Security Description
| | | | Shares
| | Value
|
CLOSED END FUNDS — 33.0%
| | | | | | | | | | |
Barings Corporate Investors | | | | | 184,730 | | | $ | 3,137,639 | |
BlackRock Debt Strategies Fund, Inc.(1) | | | | | 294,767 | | | | 3,174,641 | |
BlackRock Floating Rate Income Trust(1) | | | | | 207,171 | | | | 2,573,064 | |
BlackRock Limited Duration Income Trust | | | | | 187,243 | | | | 2,992,143 | |
Blackstone / GSO Long-Short Credit
Income Fund | | | | | 230,448 | | | | 3,442,893 | |
Blackstone / GSO Senior Floating Rate
Term Fund | | | | | 191,264 | | | | 3,006,670 | |
Blackstone / GSO Strategic Credit Fund | | | | | 271,986 | | | | 3,720,768 | |
BNY Mellon Alcentra Global Credit
Income 2024 Target Term Fund, Inc.(1) | | | | | 180,881 | | | | 1,662,296 | |
Eaton Vance Floating-Rate Income Trust(1) | | | | | 210,687 | | | | 2,781,068 | |
Eaton Vance Senior Floating-Rate Trust | | | | | 230,619 | | | | 2,977,291 | |
Eaton Vance Senior Income Trust | | | | | 423,889 | | | | 2,623,873 | |
First Trust Senior Floating Rate 2022 Target
Term Fund | | | | | 211,865 | | | | 1,896,192 | |
First Trust Senior Floating Rate Income Fund II | | | | | 228,775 | | | | 2,740,725 | |
Invesco Dynamic Credit Opportunities Fund | | | | | 296,099 | | | | 3,274,855 | |
Invesco Senior Income Trust | | | | | 628,381 | | | | 2,626,633 | |
KKR Income Opportunities Fund | | | | | 273,656 | | | | 4,211,566 | |
Nuveen Credit Strategies Income Fund | | | | | 528,065 | | | | 3,891,839 | |
Nuveen Floating Rate Income Fund | | | | | 344,167 | | | | 3,245,495 | |
Nuveen Floating Rate Income Opportunity Fund(1) | | | | | 356,898 | | | | 3,390,531 | |
Nuveen Senior Income Fund | | | | | 571,773 | | | | 3,241,953 | |
Nuveen Short Duration Credit Opportunities Fund | | | | | 226,598 | | | | 3,287,937 | |
Pioneer Floating Rate Trust | | | | | 285,722 | | | | 2,991,509 | |
Voya Prime Rate Trust | | | | | 575,122 | | | | 2,760,586 | |
Total Closed End Funds
| | | | | | | | | | |
(Cost $71,115,758) | | | | | | | | | 69,652,167 | |
| |
SECURITIES LENDING COLLATERAL — 4.3%
| | | |
Money Market Fund — 4.3%
| | | | | | | | | | |
Dreyfus Government Cash Management Fund, Institutional Shares, 1.73%(2)(3) | | | | | | | | | | |
(Cost $9,173,194) | | | | | 9,173,194 | | | | 9,173,194 | |
TOTAL INVESTMENTS — 102.7%
| | | | | | | | | | |
(Cost $224,532,235) | | | | | | | | | 217,110,806 | |
Liabilities in Excess of Other Assets — (2.7)% | | | | | | | | | (5,766,456 | ) |
Net Assets — 100.0% | | | | | | | | $ | 211,344,350 | |
(1) | | All or a portion of the security was on loan. The aggregate market value of securities on loan was $10,966,263; total market value of collateral held by the Fund was $11,310,724. Market value of the collateral held includes non-cash U.S. Treasury securities having a value of $2,137,530. |
(2) | | Represents securities purchased with cash collateral received for securities on loan. |
(3) | | The rate shown reflects the seven-day yield as of October 31, 2019. |
The following table summarizes valuation of the Fund’s investments under the fair value hierarchy levels as of October 31, 2019.
| | | | Level 1
| | Level 2
| | Level 3
| | Total
|
Asset Valuation Inputs
| | | | | | | | | | | | | | | | | | |
Common Stocks | | | | $ | 138,285,445 | | | $ | — | | | $ | — | | | $ | 138,285,445 | |
Closed End Funds | | | | | 69,652,167 | | | | — | | | | — | | | | 69,652,167 | |
Money Market Fund | | | | | 9,173,194 | | | | — | | | | — | | | | 9,173,194 | |
Total | | | | $ | 217,110,806 | | | $ | — | | | $ | — | | | $ | 217,110,806 | |
The accompanying notes are an integral part of these financial statements.
52
Schedule of Investments — Virtus Real Asset Income ETF
October 31, 2019
Security Description
| | | | Shares
| | Value
|
COMMON STOCKS — 98.2%
| | | | | | | | | | |
Communication Services — 6.8%
| | | | | | | | | | |
BCE, Inc. (Canada) | | | | | 58,050 | | | $ | 2,754,472 | |
China Mobile Ltd. (China)(1) | | | | | 68,455 | | | | 2,764,213 | |
Cogent Communications Holdings, Inc. | | | | | 49,990 | | | | 2,931,414 | |
Telecom Argentina SA (Argentina)(1)(2) | | | | | 281,607 | | | | 2,534,463 | |
Telefonica Brasil SA (Brazil)(1) | | | | | 215,721 | | | | 2,841,046 | |
TELUS Corp. (Canada)(2) | | | | | 75,872 | | | | 2,698,767 | |
Total Communication Services | | | | | | | | | 16,524,375 | |
Consumer Staples — 2.2%
| | | | | | | | | | |
Bunge Ltd. | | | | | 50,082 | | | | 2,704,428 | |
Ingredion, Inc. | | | | | 34,179 | | | | 2,700,141 | |
Total Consumer Staples | | | | | | | | | 5,404,569 | |
Energy — 28.6%
| | | | | | | | | | |
Black Stone Minerals LP | | | | | 196,577 | | | | 2,569,261 | |
Canadian Natural Resources Ltd. (Canada)(2) | | | | | 102,248 | | | | 2,578,695 | |
China Petroleum & Chemical Corp. (China)(1)(2) | | | | | 46,531 | | | | 2,628,536 | |
CNX Midstream Partners LP | | | | | 189,407 | | | | 2,903,609 | |
CONSOL Coal Resources LP(2) | | | | | 218,542 | | | | 2,349,327 | |
CVR Energy, Inc. | | | | | 62,178 | | | | 2,948,481 | |
Delek Logistics Partners LP(2) | | | | | 88,398 | | | | 2,853,487 | |
Delek US Holdings, Inc.(2) | | | | | 75,868 | | | | 3,030,927 | |
Dorchester Minerals LP(2) | | | | | 149,886 | | | | 2,649,984 | |
Enbridge, Inc. (Canada) | | | | | 79,298 | | | | 2,887,240 | |
EQM Midstream Partners LP | | | | | 86,405 | | | | 2,581,781 | |
Green Plains Partners LP(2) | | | | | 213,311 | | | | 2,892,497 | |
Marathon Petroleum Corp. | | | | | 50,794 | | | | 3,248,276 | |
MPLX LP | | | | | 93,305 | | | | 2,460,453 | |
ONEOK, Inc. | | | | | 37,012 | | | | 2,584,548 | |
Pembina Pipeline Corp. (Canada) | | | | | 74,764 | | | | 2,628,702 | |
Permian Basin Royalty Trust(2) | | | | | 591,860 | | | | 2,397,033 | |
Phillips 66 | | | | | 27,089 | | | | 3,164,537 | |
Phillips 66 Partners LP | | | | | 48,127 | | | | 2,689,818 | |
RPC, Inc.(2) | | | | | 492,011 | | | | 2,036,926 | |
Shell Midstream Partners LP(2) | | | | | 136,936 | | | | 2,809,927 | |
Suncor Energy, Inc. (Canada) | | | | | 88,350 | | | | 2,623,112 | |
TC Energy Corp. (Canada) | | | | | 54,237 | | | | 2,729,748 | |
Valero Energy Corp. | | | | | 33,841 | | | | 3,281,900 | |
Viper Energy Partners LP | | | | | 93,840 | | | | 2,258,729 | |
Western Midstream Partners LP | | | | | 106,276 | | | | 2,259,428 | |
Total Energy | | | | | | | | | 70,046,962 | |
Financials — 2.4%
| | | | | | | | | | |
Arbor Realty Trust, Inc.(2) | | | | | 212,585 | | | | 2,903,911 | |
Ashford, Inc.* | | | | | 1,367 | | | | 32,685 | |
New Residential Investment Corp. | | | | | 184,460 | | | | 2,921,846 | |
Total Financials | | | | | | | | | 5,858,442 | |
| |
| |
Security Description
| | | | Shares
| | Value
|
COMMON STOCKS (continued)
| | | | | | | | | | |
Industrials — 1.2%
| | | | | | | | | | |
Grupo Aeroportuario del Pacifico SAB de CV (Mexico)(1) | | | | | 28,701 | | | $ | 2,999,541 | |
Materials — 19.8%
| | | | | | | | | | |
Air Products & Chemicals, Inc. | | | | | 12,668 | | | | 2,701,578 | |
Eastman Chemical Co. | | | | | 38,829 | | | | 2,952,557 | |
Huntsman Corp. | | | | | 124,712 | | | | 2,759,877 | |
LyondellBasell Industries NV Class A | | | | | 31,756 | | | | 2,848,513 | |
Mercer International, Inc. (Germany) | | | | | 219,154 | | | | 2,673,679 | |
Methanex Corp. (Canada) | | | | | 77,445 | | | | 2,937,489 | |
Neenah, Inc. | | | | | 44,633 | | | | 2,878,828 | |
Norbord, Inc. (Canada) | | | | | 117,704 | | | | 3,398,114 | |
PolyOne Corp. | | | | | 88,856 | | | | 2,847,835 | |
Reliance Steel & Aluminum Co. | | | | | 27,988 | | | | 3,247,727 | |
Rio Tinto PLC (Australia)(1) | | | | | 53,263 | | | | 2,770,209 | |
Sensient Technologies Corp. | | | | | 40,660 | | | | 2,543,690 | |
Sociedad Quimica y Minera de Chile SA (Chile)(1) | | | | | 100,691 | | | | 2,736,781 | |
Southern Copper Corp. (Peru)(2) | | | | | 81,363 | | | | 2,894,896 | |
Steel Dynamics, Inc. | | | | | 92,398 | | | | 2,805,203 | |
Vale SA (Brazil)*(1) | | | | | 242,198 | | | | 2,843,404 | |
Vedanta Ltd. (India)(1)(2) | | | | | 313,390 | | | | 2,613,673 | |
Total Materials | | | | | | | | | 48,454,053 | |
Real Estate — 32.7%
| | | | | | | | | | |
Alexander’s, Inc. | | | | | 8,176 | | | | 2,823,990 | |
Apple Hospitality REIT, Inc. | | | | | 171,203 | | | | 2,821,426 | |
Armada Hoffler Properties, Inc. | | | | | 153,246 | | | | 2,871,830 | |
Braemar Hotels & Resorts, Inc. | | | | | 291,034 | | | | 2,686,244 | |
Brandywine Realty Trust | | | | | 188,436 | | | | 2,879,302 | |
Brixmor Property Group, Inc. | | | | | 141,569 | | | | 3,117,349 | |
Community Healthcare Trust, Inc. | | | | | 64,319 | | | | 3,114,326 | |
Easterly Government Properties, Inc. | | | | | 133,717 | | | | 2,984,564 | |
EPR Properties | | | | | 36,494 | | | | 2,838,868 | |
Gaming and Leisure Properties, Inc. | | | | | 72,330 | | | | 2,919,239 | |
GEO Group, Inc. (The) | | | | | 160,770 | | | | 2,446,919 | |
Global Net Lease, Inc. | | | | | 143,904 | | | | 2,803,250 | |
Iron Mountain, Inc.(2) | | | | | 87,660 | | | | 2,875,248 | |
Jernigan Capital, Inc.(2) | | | | | 143,120 | | | | 2,717,849 | |
Kimco Realty Corp. | | | | | 138,367 | | | | 2,983,193 | |
Lamar Advertising Co. Class A | | | | | 35,096 | | | | 2,808,031 | |
Medical Properties Trust, Inc. | | | | | 147,274 | | | | 3,052,990 | |
Monmouth Real Estate Investment Corp. | | | | | 196,988 | | | | 2,970,579 | |
National Health Investors, Inc. | | | | | 33,762 | | | | 2,896,442 | |
Omega Healthcare Investors, Inc.(2) | | | | | 68,578 | | | | 3,020,175 | |
One Liberty Properties, Inc. | | | | | 98,236 | | | | 2,790,885 | |
Pebblebrook Hotel Trust(2) | | | | | 100,162 | | | | 2,575,165 | |
Ryman Hospitality Properties, Inc. | | | | | 34,166 | | | | 2,875,752 | |
The accompanying notes are an integral part of these financial statements.
53
Schedule of Investments — Virtus Real Asset Income ETF(continued)
October 31, 2019
Security Description
| | | | Shares
| | Value
|
| |
COMMON STOCKS (continued)
| | | | | | | | | | |
Real Estate (continued)
| | | | | | | | | | |
Sabra Health Care REIT, Inc. | | | | | 123,575 | | | $ | 3,039,945 | |
Summit Hotel Properties, Inc.(2) | | | | | 239,408 | | | | 2,935,142 | |
Taubman Centers, Inc. | | | | | 66,653 | | | | 2,384,844 | |
Weingarten Realty Investors | | | | | 97,809 | | | | 3,103,480 | |
Xenia Hotels & Resorts, Inc. | | | | | 127,888 | | | | 2,692,042 | |
Total Real Estate | | | | | | | | | 80,029,069 | |
Utilities — 4.5%
| | | | | | | | | | |
Algonquin Power & Utilities Corp. (Canada) | | | | | 206,162 | | | | 2,828,543 | |
Dominion Energy, Inc. | | | | | 34,647 | | | | 2,860,110 | |
Duke Energy Corp. | | | | | 29,525 | | | | 2,783,026 | |
Edison International | | | | | 38,610 | | | | 2,428,569 | |
Total Utilities | | | | | | | | | 10,900,248 | |
Total Common Stocks
| | | | | | | | | | |
(Cost $246,520,703) | | | | | | | | | 240,217,259 | |
| | | | |
| | | | |
| |
Security Description
| | | | Shares
| | Value
|
SECURITIES LENDING COLLATERAL — 4.0%
| | | |
Money Market Fund — 4.0%
| | | | | | | | | | |
Dreyfus Government Cash Management Fund, Institutional Shares, 1.73%(3)(4) | | | | | | | | | | |
(Cost $9,799,466) | | | | | 9,799,466 | | | $ | 9,799,466 | |
TOTAL INVESTMENTS — 102.2%
| | | | | | | | | | |
(Cost $256,320,169) | | | | | | | | | 250,016,725 | |
Liabilities in Excess of Other Assets—(2.2)% | | | | | | | | | (5,265,387 | ) |
Net Assets — 100.0% | | | | | | | | $ | 244,751,338 | |
* | | Non-income producing security. |
(1) | | American Depositary Receipts. |
(2) | | All or a portion of the security was on loan. The aggregate market value of securities on loan was $14,927,010; total market value of collateral held by the Fund was $15,344,760. Market value of the collateral held includes non-cash U.S. Treasury securities having a value of $5,545,294. |
(3) | | Represents securities purchased with cash collateral received for securities on loan. |
(4) | | The rate shown reflects the seven-day yield as of October 31, 2019. |
The following table summarizes valuation of the Fund’s investments under the fair value hierarchy levels as of October 31, 2019.
| | | | Level 1
| | Level 2
| | Level 3
| | Total
|
Asset Valuation Inputs
| | | | | | | | | | | | | | | | | | |
Common Stocks | | | | $ | 240,217,259 | | | $ | — | | | $ | — | | | $ | 240,217,259 | |
Money Market Fund | | | | | 9,799,466 | | | | — | | | | — | | | | 9,799,466 | |
Total | | | | $ | 250,016,725 | | | $ | — | | | $ | — | | | $ | 250,016,725 | |
The accompanying notes are an integral part of these financial statements.
54
Schedule of Investments — Virtus WMC Global Factor Opportunities ETF
October 31, 2019
Security Description
| | | | Shares
| | Value
|
| |
COMMON STOCKS — 99.1%
| | | | | | | | | | |
| |
Communication Services — 4.6%
| | | | | | | | | | |
China Mobile Ltd. (China) | | | | | 1,114 | | | $ | 9,070 | |
Chunghwa Telecom Co. Ltd. (Taiwan) | | | | | 7,150 | | | | 26,307 | |
Comcast Corp. Class A | | | | | 399 | | | | 17,883 | |
Deutsche Telekom AG (Germany) | | | | | 732 | | | | 12,873 | |
Liberty Global PLC Class A
(United Kingdom)* | | | | | 1,003 | | | | 25,226 | |
Omnicom Group, Inc. | | | | | 403 | | | | 31,108 | |
SK Telecom Co. Ltd. (South Korea) | | | | | 80 | | | | 16,296 | |
Snap, Inc. Class A* | | | | | 694 | | | | 10,452 | |
Ubisoft Entertainment SA (France)* | | | | | 122 | | | | 7,203 | |
Verizon Communications, Inc. | | | | | 1,026 | | | | 62,042 | |
Viacom, Inc. Class B | | | | | 407 | | | | 8,775 | |
Vodafone Group PLC (United Kingdom) | | | | | 7,248 | | | | 14,778 | |
Total Communication Services | | | | | | | | | 242,013 | |
| |
Consumer Discretionary — 8.7%
| | | | | | | | | | |
adidas AG (Germany)
| | | | | 51 | | | | 15,747 | |
AutoZone, Inc.* | | | | | 25 | | | | 28,610 | |
Berkeley Group Holdings PLC
(United Kingdom) | | | | | 300 | | | | 17,103 | |
Best Buy Co., Inc. | | | | | 360 | | | | 25,859 | |
Chipotle Mexican Grill, Inc.* | | | | | 23 | | | | 17,898 | |
Darden Restaurants, Inc. | | | | | 108 | | | | 12,125 | |
eBay, Inc. | | | | | 624 | | | | 21,996 | |
Faurecia SE (France) | | | | | 221 | | | | 10,298 | |
Fiat Chrysler Automobiles NV
(United Kingdom) | | | | | 808 | | | | 12,551 | |
H&R Block, Inc. | | | | | 385 | | | | 9,621 | |
Haier Electronics Group Co. Ltd. (Hong Kong) | | | | | 5,938 | | | | 16,975 | |
Home Depot, Inc. (The) | | | | | 73 | | | | 17,124 | |
Home Product Center PCL (Thailand) | | | | | 25,535 | | | | 14,461 | |
Hotai Motor Co. Ltd. (Taiwan) | | | | | 651 | | | | 11,506 | |
JD.com, Inc. (China)*(1) | | | | | 333 | | | | 10,373 | |
Kia Motors Corp. (South Korea) | | | | | 264 | | | | 9,655 | |
Kohl’s Corp. | | | | | 239 | | | | 12,251 | |
Lear Corp. | | | | | 110 | | | | 12,955 | |
NVR, Inc.* | | | | | 5 | | | | 18,183 | |
Panasonic Corp. (Japan) | | | | | 2,408 | | | | 20,445 | |
PulteGroup, Inc. | | | | | 506 | | | | 19,855 | |
Sankyo Co. Ltd. (Japan) | | | | | 326 | | | | 11,456 | |
Starbucks Corp. | | | | | 448 | | | | 37,883 | |
Subaru Corp. (Japan) | | | | | 418 | | | | 12,088 | |
Target Corp. | | | | | 245 | | | | 26,193 | |
Tata Motors Ltd. (India)*(1) | | | | | 1,376 | | | | 16,622 | |
Ulta Beauty, Inc.* | | | | | 43 | | | | 10,026 | |
VF Corp. | | | | | 118 | | | | 9,710 | |
Total Consumer Discretionary | | | | | | | | | 459,569 | |
| |
Consumer Staples — 9.0%
| | | | | | | | | | |
Aeon Co. Ltd. (Japan) | | | | | 1,044 | | | | 21,124 | |
Church & Dwight Co., Inc. | | | | | 302 | | | | 21,122 | |
Coca-Cola Co. (The) | | | | | 351 | | | | 19,105 | |
Danone SA (France) | | | | | 225 | | | | 18,660 | |
Diageo PLC (United Kingdom) | | | | | 776 | | | | 31,809 | |
General Mills, Inc. | | | | | 426 | | | | 21,666 | |
Genting Plantations Bhd (Malaysia) | | | | | 6,761 | | | | 16,083 | |
Heineken NV (Netherlands) | | | | | 146 | | | | 14,893 | |
JBS SA | | | | | 2,222 | | | | 15,674 | |
Kimberly-Clark Corp. | | | | | 118 | | | | 15,680 | |
| |
| |
Security Description
| | | | Shares
| | Value
|
COMMON STOCKS (continued)
| | | | | | | | | | |
Consumer Staples (continued)
| | | | | | | | | | |
Koninklijke Ahold Delhaize NV (Netherlands) | | | | | 603 | | | $ | 15,014 | |
L’Oreal SA (France) | | | | | 126 | | | | 36,790 | |
Nestle SA (Switzerland) | | | | | 442 | | | | 47,189 | |
NH Foods Ltd. (Japan) | | | | | 466 | | | | 19,613 | |
PepsiCo, Inc. | | | | | 154 | | | | 21,124 | |
Pernod Ricard SA (France) | | | | | 131 | | | | 24,180 | |
Philip Morris International, Inc. | | | | | 481 | | | | 39,173 | |
Procter & Gamble Co. (The) | | | | | 181 | | | | 22,536 | |
Unilever NV (United Kingdom) | | | | | 460 | | | | 27,165 | |
Unilever PLC (United Kingdom) | | | | | 459 | | | | 27,484 | |
Total Consumer Staples | | | | | | | | | 476,084 | |
| |
Energy — 3.3%
| | | | | | | | | | |
BP PLC (United Kingdom) | | | | | 4,212 | | | | 26,696 | |
China Petroleum & Chemical Corp.
Class H (China) | | | | | 23,868 | | | | 13,707 | |
Equinor ASA (Norway) | | | | | 728 | | | | 13,466 | |
JXTG Holdings, Inc. (Japan) | | | | | 3,774 | | | | 17,802 | |
LUKOIL PJSC (Russia)(1) | | | | | 303 | | | | 27,894 | |
Marathon Petroleum Corp. | | | | | 330 | | | | 21,104 | |
Suncor Energy, Inc. (Canada) | | | | | 666 | | | | 19,802 | |
Tatneft PJSC (Russia)(1) | | | | | 191 | | | | 13,319 | |
TC Energy Corp. (Canada) | | | | | 408 | | | | 20,566 | |
Total Energy | | | | | | | | | 174,356 | |
| |
Financials — 23.2%
| | | | | | | | | | |
Aflac, Inc. | | | | | 577 | | | | 30,673 | |
AIA Group Ltd. (Hong Kong) | | | | | 2,644 | | | | 26,471 | |
Allianz SE (Germany) | | | | | 159 | | | | 38,836 | |
Allstate Corp. (The) | | | | | 258 | | | | 27,456 | |
American Express Co. | | | | | 385 | | | | 45,153 | |
American Financial Group, Inc. | | | | | 137 | | | | 14,254 | |
Athene Holding Ltd. Class A* | | | | | 333 | | | | 14,436 | |
Australia & New Zealand Banking Group Ltd. (Australia) | | | | | 744 | | | | 13,714 | |
Aviva PLC (United Kingdom) | | | | | 4,290 | | | | 23,073 | |
AXA SA (France) | | | | | 492 | | | | 12,997 | |
Banco Santander SA (Spain) | | | | | 4,554 | | | | 18,254 | |
Bank Central Asia Tbk PT (Indonesia) | | | | | 5,180 | | | | 11,606 | |
Bank of America Corp. | | | | | 2,250 | | | | 70,358 | |
Bank of New York Mellon Corp. (The) | | | | | 495 | | | | 23,141 | |
Brighthouse Financial, Inc.* | | | | | 261 | | | | 9,855 | |
Capital One Financial Corp. | | | | | 304 | | | | 28,348 | |
China Construction Bank Corp. Class H (China) | | | | | 26,041 | | | | 20,970 | |
Cincinnati Financial Corp. | | | | | 280 | | | | 31,699 | |
Commonwealth Bank of Australia (Australia) | | | | | 372 | | | | 20,171 | |
Deutsche Bank AG (Germany) | | | | | 2,061 | | | | 14,927 | |
Discover Financial Services | | | | | 344 | | | | 27,609 | |
E*TRADE Financial Corp. | | | | | 430 | | | | 17,970 | |
Everest Re Group Ltd. | | | | | 72 | | | | 18,511 | |
EXOR NV (Netherlands) | | | | | 170 | | | | 13,029 | |
Franklin Resources, Inc. | | | | | 468 | | | | 12,893 | |
Globe Life, Inc. | | | | | 355 | | | | 34,552 | |
Groupe Bruxelles Lambert SA (Belgium) | | | | | 145 | | | | 14,551 | |
Hanwha Life Insurance Co. Ltd. (South Korea) | | | | | 7,094 | | | | 13,597 | |
Hartford Financial Services Group, Inc. (The) | | | | | 460 | | | | 26,257 | |
Hong Kong Exchanges & Clearing Ltd.
(Hong Kong) | | | | | 647 | | | | 20,229 | |
HSBC Holdings PLC (United Kingdom) | | | | | 3,854 | | | | 29,105 | |
The accompanying notes are an integral part of these financial statements.
55
Schedule of Investments — Virtus WMC Global Factor Opportunities ETF(continued)
October 31, 2019
Security Description
| | | | Shares
| | Value
|
| |
COMMON STOCKS (continued)
| | | | | | | | | | |
Financials (continued)
| | | | | | | | | | |
Industrial & Commercial Bank of China Ltd. Class H (China) | | | | | 23,006 | | | $ | 16,559 | |
Investec PLC (South Africa) | | | | | 1,879 | | | | 10,651 | |
Legal & General Group PLC (United Kingdom) | | | | | 9,333 | | | | 31,880 | |
Lloyds Banking Group PLC (United Kingdom) | | | | | 15,278 | | | | 11,241 | |
MetLife, Inc. | | | | | 520 | | | | 24,331 | |
National Australia Bank Ltd. (Australia) | | | | | 776 | | | | 15,305 | |
Northern Trust Corp. | | | | | 177 | | | | 17,643 | |
Ping An Insurance Group Co. of China Ltd. Class H (China) | | | | | 3,111 | | | | 36,029 | |
Powszechna Kasa Oszczednosci Bank Polski SA (Poland) | | | | | 1,052 | | | | 10,496 | |
Principal Financial Group, Inc. | | | | | 602 | | | | 32,135 | |
Progressive Corp. (The) | | | | | 513 | | | | 35,756 | |
Prudential Financial, Inc. | | | | | 256 | | | | 23,332 | |
Reinsurance Group of America, Inc. | | | | | 111 | | | | 18,034 | |
Royal Bank of Canada (Canada) | | | | | 260 | | | | 20,972 | |
Signature Bank | | | | | 101 | | | | 11,950 | |
State Street Corp. | | | | | 256 | | | | 16,914 | |
Sumitomo Mitsui Financial Group, Inc. (Japan) | | | | | 318 | | | | 11,426 | |
Swiss Life Holding AG (Switzerland) | | | | | 49 | | | | 24,498 | |
Synchrony Financial | | | | | 644 | | | | 22,778 | |
Toronto-Dominion Bank (The) (Canada) | | | | | 468 | | | | 26,724 | |
Travelers Cos., Inc. (The) | | | | | 166 | | | | 21,756 | |
Voya Financial, Inc. | | | | | 348 | | | | 18,778 | |
Westpac Banking Corp. (Australia) | | | | | 764 | | | | 14,857 | |
Zurich Insurance Group AG (Switzerland) | | | | | 67 | | | | 26,182 | |
Total Financials | | | | | | | | | 1,224,922 | |
| |
Health Care — 11.8%
| | | | | | | | | | |
Agilent Technologies, Inc. | | | | | 202 | | | | 15,302 | |
Alexion Pharmaceuticals, Inc.* | | | | | 182 | | | | 19,183 | |
Alfresa Holdings Corp. (Japan) | | | | | 769 | | | | 17,318 | |
Anthem, Inc. | | | | | 175 | | | | 47,089 | |
Astellas Pharma, Inc. (Japan) | | | | | 1,216 | | | | 20,927 | |
Biogen, Inc.* | | | | | 122 | | | | 36,443 | |
Cardinal Health, Inc. | | | | | 358 | | | | 17,703 | |
Cigna Corp. | | | | | 193 | | | | 34,443 | |
CSL Ltd. (Australia) | | | | | 98 | | | | 17,296 | |
Daiichi Sankyo Co. Ltd. (Japan) | | | | | 264 | | | | 17,455 | |
DexCom, Inc.* | | | | | 160 | | | | 24,678 | |
Edwards Lifesciences Corp.* | | | | | 116 | | | | 27,652 | |
Exact Sciences Corp.* | | | | | 153 | | | | 13,311 | |
Gilead Sciences, Inc. | | | | | 596 | | | | 37,971 | |
GlaxoSmithKline PLC (United Kingdom) | | | | | 673 | | | | 15,418 | |
Johnson & Johnson | | | | | 178 | | | | 23,503 | |
McKesson Corp. | | | | | 122 | | | | 16,226 | |
Medtronic PLC | | | | | 172 | | | | 18,731 | |
Merck & Co., Inc. | | | | | 488 | | | | 42,290 | |
Novartis AG (Switzerland) | | | | | 144 | | | | 12,567 | |
Pfizer, Inc. | | | | | 505 | | | | 19,377 | |
Roche Holding AG (Switzerland) | | | | | 59 | | | | 17,751 | |
Suzuken Co. Ltd. (Japan) | | | | | 375 | | | | 20,141 | |
Veeva Systems, Inc. Class A* | | | | | 251 | | | | 35,599 | |
WellCare Health Plans, Inc.* | | | | | 52 | | | | 15,423 | |
Wuxi Biologics Cayman, Inc. (China)*(2) | | | | | 1,183 | | | | 13,965 | |
Zoetis, Inc. | | | | | 195 | | | | 24,944 | |
Total Health Care | | | | | | | | | 622,706 | |
| |
| |
Security Description
| | | | Shares
| | Value
|
COMMON STOCKS (continued)
| | | | | | | | | | |
Industrials — 10.7%
| | | | | | | | | | |
AMETEK, Inc. | | | | | 256 | | | $ | 23,462 | |
Ashtead Group PLC (United Kingdom) | | | | | 531 | | | | 16,150 | |
Canadian National Railway Co. (Canada) | | | | | 175 | | | | 15,652 | |
CoStar Group, Inc.* | | | | | 59 | | | | 32,422 | |
Honeywell International, Inc. | | | | | 195 | | | | 33,682 | |
IDEX Corp. | | | | | 90 | | | | 13,998 | |
Kingspan Group PLC (Ireland) | | | | | 217 | | | | 11,244 | |
Legrand SA (France) | | | | | 287 | | | | 22,400 | |
Lockheed Martin Corp. | | | | | 119 | | | | 44,825 | |
Marubeni Corp. (Japan) | | | | | 1,900 | | | | 13,474 | |
Northrop Grumman Corp. | | | | | 93 | | | | 32,781 | |
Obayashi Corp. (Japan) | | | | | 1,590 | | | | 16,490 | |
PACCAR, Inc. | | | | | 366 | | | | 27,838 | |
Safran SA (France) | | | | | 122 | | | | 19,301 | |
Samsung C&T Corp. (South Korea) | | | | | 185 | | | | 15,901 | |
Schindler Holding AG (Switzerland) | | | | | 87 | | | | 20,566 | |
Sumitomo Corp. (Japan) | | | | | 961 | | | | 15,689 | |
Taisei Corp. (Japan) | | | | | 289 | | | | 11,508 | |
Toppan Printing Co. Ltd. (Japan) | | | | | 1,100 | | | | 20,484 | |
Toshiba Corp. (Japan) | | | | | 549 | | | | 18,836 | |
Transurban Group (Australia) | | | | | 1,944 | | | | 19,887 | |
United Technologies Corp. | | | | | 291 | | | | 41,782 | |
Vinci SA (France) | | | | | 253 | | | | 28,386 | |
Waste Management, Inc. | | | | | 181 | | | | 20,310 | |
Wolters Kluwer NV (Netherlands) | | | | | 380 | | | | 27,980 | |
Total Industrials | | | | | | | | | 565,048 | |
| |
Information Technology — 14.3%
| | | | | | | | | | |
Adobe, Inc.* | | | | | 48 | | | | 13,341 | |
Automatic Data Processing, Inc. | | | | | 133 | | | | 21,577 | |
Cadence Design Systems, Inc.* | | | | | 460 | | | | 30,061 | |
Canon, Inc. (Japan) | | | | | 710 | | | | 19,474 | |
Citrix Systems, Inc. | | | | | 125 | | | | 13,608 | |
Cognizant Technology Solutions Corp. Class A | | | | | 221 | | | | 13,468 | |
Compal Electronics, Inc. (Taiwan) | | | | | 33,887 | | | | 20,261 | |
DXC Technology Co. | | | | | 364 | | | | 10,072 | |
Fidelity National Information Services, Inc. | | | | | 169 | | | | 22,267 | |
Fortinet, Inc.* | | | | | 261 | | | | 21,287 | |
Fujitsu Ltd. (Japan) | | | | | 339 | | | | 30,202 | |
Hon Hai Precision Industry Co. Ltd. (Taiwan) | | | | | 6,154 | | | | 16,294 | |
HP, Inc. | | | | | 1,280 | | | | 22,234 | |
Keysight Technologies, Inc.* | | | | | 354 | | | | 35,722 | |
Lam Research Corp. | | | | | 126 | | | | 34,151 | |
Lenovo Group Ltd. (China) | | | | | 14,091 | | | | 9,854 | |
Mastercard, Inc. Class A | | | | | 65 | | | | 17,993 | |
Micron Technology, Inc.* | | | | | 653 | | | | 31,050 | |
Microsoft Corp. | | | | | 861 | | | | 123,442 | |
NEC Corp. (Japan) | | | | | 587 | | | | 23,373 | |
NXP Semiconductors NV (Netherlands) | | | | | 159 | | | | 18,075 | |
Paycom Software, Inc.* | | | | | 80 | | | | 16,922 | |
PayPal Holdings, Inc.* | | | | | 389 | | | | 40,495 | |
Seagate Technology PLC | | | | | 296 | | | | 17,177 | |
Splunk, Inc.* | | | | | 155 | | | | 18,594 | |
Synopsys, Inc.* | | | | | 301 | | | | 40,861 | |
Taiwan Semiconductor Manufacturing Co. Ltd. (Taiwan) | | | | | 1,546 | | | | 15,160 | |
Telefonaktiebolaget LM Ericsson Class B (Sweden) | | | | | 1,123 | | | | 9,811 | |
Twilio, Inc. Class A* | | | | | 81 | | | | 7,821 | |
Western Digital Corp. | | | | | 273 | | | | 14,100 | |
The accompanying notes are an integral part of these financial statements.
56
Schedule of Investments — Virtus WMC Global Factor Opportunities ETF(continued)
October 31, 2019
Security Description
| | | | Shares
| | Value
|
| |
COMMON STOCKS (continued)
| | | | | | | | | | |
| | | | | | | | | | | |
Information Technology (continued)
| | | | | | | | | | |
WPG Holdings Ltd. (Taiwan) | | | | | 8,599 | | | $ | 10,904 | |
Zebra Technologies Corp. Class A* | | | | | 70 | | | | 16,651 | |
Total Information Technology | | | | | | | | | 756,302 | |
| |
Materials — 3.7%
| | | | | | | | | | |
Air Products & Chemicals, Inc. | | | | | 115 | | | | 24,525 | |
Anglo American Platinum Ltd. (South Africa) | | | | | 168 | | | | 12,538 | |
BHP Group Ltd. (Australia) | | | | | 436 | | | | 10,805 | |
BHP Group PLC (Australia) | | | | | 875 | | | | 18,529 | |
Empresas CMPC SA (Chile) | | | | | 5,829 | | | | 13,283 | |
First Quantum Minerals Ltd. (Zambia) | | | | | 1,314 | | | | 11,104 | |
Freeport-McMoRan, Inc. | | | | | 1,194 | | | | 11,725 | |
Givaudan SA (Switzerland) | | | | | 9 | | | | 26,430 | |
Jiangxi Copper Co. Ltd. Class H (China) | | | | | 10,594 | | | | 12,425 | |
LyondellBasell Industries NV Class A | | | | | 283 | | | | 25,385 | |
POSCO (South Korea) | | | | | 81 | | | | 14,725 | |
Zhaojin Mining Industry Co. Ltd. Class H (China) | | | | | 11,821 | | | | 13,139 | |
Total Materials | | | | | | | | | 194,613 | |
| |
Real Estate — 4.9%
| | | | | | | | | | |
Ascendas Real Estate Investment Trust (Singapore) | | | | | 11,642 | | | | 27,127 | |
Crown Castle International Corp. | | | | | 194 | | | | 26,925 | |
Equity Residential | | | | | 253 | | | | 22,431 | |
Essex Property Trust, Inc. | | | | | 66 | | | | 21,591 | |
Link REIT (Hong Kong) | | | | | 1,124 | | | | 12,257 | |
Prologis, Inc. | | | | | 161 | | | | 14,129 | |
Public Storage | | | | | 80 | | | | 17,829 | |
Realty Income Corp. | | | | | 175 | | | | 14,313 | |
Redefine Properties Ltd. (South Africa) | | | | | 26,902 | | | | 13,424 | |
Simon Property Group, Inc. | | | | | 77 | | | | 11,602 | |
Sun Hung Kai Properties Ltd. (Hong Kong) | | | | | 851 | | | | 12,913 | |
Sunac China Holdings Ltd. (China) | | | | | 2,295 | | | | 10,456 | |
Swiss Prime Site AG (Switzerland)* | | | | | 272 | | | | 28,014 | |
Vonovia SE (Germany) | | | | | 513 | | | | 27,297 | |
Total Real Estate | | | | | | | | | 260,308 | |
| |
| |
Security Description
| | | | Shares
| | Value
|
COMMON STOCKS (continued)
| | | | | | | | | | |
| |
Utilities — 4.9%
| | | | | | | | | | |
Centrais Eletricas Brasileiras SA (Brazil) | | | | | 797 | | | $ | 7,862 | |
Chubu Electric Power Co., Inc. (Japan) | | | | | 987 | | | | 14,857 | |
CMS Energy Corp. | | | | | 214 | | | | 13,679 | |
Consolidated Edison, Inc. | | | | | 147 | | | | 13,556 | |
Dominion Energy, Inc. | | | | | 179 | | | | 14,776 | |
Fortis, Inc. (Canada) | | | | | 619 | | | | 25,717 | |
National Grid PLC (United Kingdom) | | | | | 1,784 | | | | 20,828 | |
NextEra Energy, Inc. | | | | | 113 | | | | 26,932 | |
OGE Energy Corp. | | | | | 415 | | | | 17,870 | |
Sempra Energy | | | | | 98 | | | | 14,162 | |
Southern Co. (The) | | | | | 266 | | | | 16,668 | |
Terna Rete Elettrica Nazionale SpA (Italy) | | | | | 3,038 | | | | 20,072 | |
WEC Energy Group, Inc. | | | | | 240 | | | | 22,656 | |
Xcel Energy, Inc. | | | | | 409 | | | | 25,976 | |
Total Utilities | | | | | | | | | 255,611 | |
| |
Total Common Stocks
| | | | | | | | | | |
(Cost $4,922,071) | | | | | | | | | 5,231,532 | |
| |
PREFERRED STOCKS — 0.4%
| | | | | | | | | | |
| |
Consumer Staples — 0.1%
| | | | | | | | | | |
Cia Brasileira de Distribuicao, 1.40% (Brazil) | | | | | 400 | | | | 8,277 | |
| |
Financials — 0.3%
| | | | | | | | | | |
Banco Bradesco SA, 5.87% (Brazil) | | | | | 1,832 | | | | 16,066 | |
| |
Total Preferred Stocks
| | | | | | | | | | |
(Cost $22,383) | | | | | | | | | 24,343 | |
| |
TOTAL INVESTMENTS — 99.5%
| | | | | | | | | | |
(Cost $4,944,454) | | | | | | | | | 5,255,875 | |
Other Assets in Excess of Liabilities—0.5% | | | | | | | | | 25,246 | |
| |
Net Assets — 100.0% | | | | | | | | $ | 5,281,121 | |
* | | Non-income producing security. |
(1) | | American Depositary Receipts. |
(2) | | Security was purchased pursuant to Rule 144A under the Securities Act of 1933 and may not be resold subject to that rule except to qualified institutional buyers. Unless otherwise noted, 144A securities are deemed to be liquid. At October 31, 2019, the aggregate value of these securities was $13,965, or 0.3% of net assets. |
The following table summarizes valuation of the Fund’s investments under the fair value hierarchy levels as of October 31, 2019.
| | | | Level 1
| | Level 2
| | Level 3
| | Total
|
Asset Valuation Inputs
| | | | | | | | | | | | | | | | | | |
Common Stocks | | | | $ | 5,231,532 | | | $ | — | | | $ | — | | | $ | 5,231,532 | |
Preferred Stocks | | | | | 24,343 | | | | — | | | | — | | | | 24,343 | |
Total | | | | $ | 5,255,875 | | | $ | — | | | $ | — | | | $ | 5,255,875 | |
The accompanying notes are an integral part of these financial statements.
57
Statements of Assets and Liabilities
October 31, 2019
| | | InfraCap REIT
Preferred ETF
| | Virtus
Glovista
Emerging
Markets ETF
| | Virtus
InfraCap U.S.
Preferred
Stock ETF
| | Virtus
LifeSci Biotech
Clinical
Trials ETF
| | Virtus
LifeSci Biotech
Products ETF
|
Assets:
| | | | | | | | | | | | | | | | | | | | | |
Investments, at cost | | | $ | 36,597,205 | | | $ | 6,548,811 | | | $ | 108,348,792 | | | $ | 33,042,030 | | | $ | 34,114,703 | |
Investments, at value (including securities on loan)(a) | | | | 37,464,829 | | | | 6,702,612 | | | | 110,132,400 | | | | 26,808,071 | | | | 27,852,131 | |
Cash | | | | 407,984 | | | | 39,296 | | | | 1,221,008 | | | | 93,347 | | | | 388,105 | |
Foreign currency(b) | | | | — | | | | 492 | | | | — | | | | — | | | | — | |
Due from brokers | | | | — | | | | — | | | | 4,932,645 | | | | — | | | | — | |
Receivables:
| | | | | | | | | | | | | | | | | | | | | |
Capital shares sold | | | | 1,269,219 | | | | — | | | | 1,327,248 | | | | — | | | | — | |
Dividends and interest | | | | 11,833 | | | | 5,347 | | | | 92,818 | | | | 32 | | | | 153 | |
Securities lending | | | | — | | | | — | | | | — | | | | 3,030 | | | | 1,819 | |
Tax reclaim | | | | — | | | | 1,393 | | | | — | | | | — | | | | — | |
Investment securities sold | | | | — | | | | 670,109 | | | | 100,052 | | | | — | | | | — | |
Total Assets | | | | 39,153,865 | | | | 7,419,249 | | | | 117,806,171 | | | | 26,904,480 | | | | 28,242,208 | |
Liabilities:
| | | | | | | | | | | | | | | | | | | | | |
Borrowings | | | | — | | | | — | | | | 19,221,156 | | | | — | | | | — | |
Payables:
| | | | | | | | | | | | | | | | | | | | | |
Investment securities purchased | | | | 1,254,791 | | | | 695,117 | | | | 3,874,234 | | | | — | | | | — | |
Collateral for securities on loan | | | | — | | | | — | | | | — | | | | 3,114,419 | | | | 1,719,938 | |
Deferred foreign tax payable | | | | — | | | | 5,861 | | | | — | | | | — | | | | — | |
Advisory fees | | | | 13,740 | | | | 3,150 | | | | 53,949 | | | | 14,892 | | | | 17,078 | |
Written options, at value(c) | | | | — | | | | — | | | | 228,623 | | | | — | | | | — | |
Securities sold short, at value(d) | | | | — | | | | — | | | | 5,903,350 | | | | — | | | | — | |
Other accrued expenses | | | | — | | | | 52 | | | | — | | | | — | | | | — | |
Total Liabilities | | | | 1,268,531 | | | | 704,180 | | | | 29,281,312 | | | | 3,129,311 | | | | 1,737,016 | |
Net Assets | | | $ | 37,885,334 | | | $ | 6,715,069 | | | $ | 88,524,859 | | | $ | 23,775,169 | | | $ | 26,505,192 | |
Net Assets Consist of:
| | | | | | | | | | | | | | | | | | | | | |
Paid-in capital | | | $ | 37,755,026 | | | $ | 10,105,307 | | | $ | 85,637,638 | | | $ | 57,222,996 | | | $ | 41,446,047 | |
Total distributable earnings (accumulated deficit) | | | | 130,308 | | | | (3,390,238 | ) | | | 2,887,221 | | | | (33,447,827 | ) | | | (14,940,855 | ) |
Net Assets | | | $ | 37,885,334 | | | $ | 6,715,069 | | | $ | 88,524,859 | | | $ | 23,775,169 | | | $ | 26,505,192 | |
Shares outstanding (unlimited number of shares of beneficial interest authorized, no par value) | | | | 1,500,004 | | | | 300,004 | | | | 3,350,004 | | | | 900,004 | | | | 700,004 | |
Net asset value per share | | | $ | 25.26 | | | $ | 22.38 | | | $ | 26.43 | | | $ | 26.42 | | | $ | 37.86 | |
(a) Market value of securities on loan | | | $ | — | | | $ | — | | | $ | — | | | $ | 6,713,301 | | | $ | 7,679,255 | |
(b) Foreign currency, at cost | | | $ | — | | | $ | 489 | | | $ | — | | | $ | — | | | $ | — | |
(c) Premiums received from written options | | | $ | — | | | $ | �� | | | $ | 239,585 | | | $ | — | | | $ | — | |
(d) Proceeds received from securities sold short | | | $ | — | | | $ | — | | | $ | 5,813,524 | | | $ | — | | | $ | — | |
The accompanying notes are an integral part of these financial statements.
58
Statements of Assets and Liabilities (continued)
October 31, 2019
| | | Virtus Newfleet
Multi-Sector
Bond ETF
| | Virtus Private
Credit Strategy ETF
| | Virtus Real
Asset Income ETF
| | Virtus WMC
Global Factor
Opportunities ETF
|
Assets:
| | | | | | | | | | | | | | | | | |
Investments, at cost | | | $ | 23,955,551 | | | $ | 224,532,235 | | | $ | 256,320,169 | | | $ | 4,944,454 | |
Investments, at value (including securities on loan)(a) | | | | 24,291,018 | | | | 217,110,806 | | | | 250,016,725 | | | | 5,255,875 | |
Cash | | | | 59,072 | | | | 3,161,070 | | | | 3,926,497 | | | | 14,780 | |
Foreign currency(b) | | | | 2 | | | | — | | | | — | | | | 3,894 | |
Receivables:
| | | | | | | | | | | | | | | | | |
Investment securities sold | | | | 300,251 | | | | — | | | | 383,875 | | | | — | |
Dividends and interest | | | | 222,501 | | | | 372,922 | | | | 334,389 | | | | 6,859 | |
Due from Adviser | | | | 19,736 | | | | — | | | | — | | | | — | |
Tax reclaim | | | | 854 | | | | — | | | | — | | | | 1,876 | |
Securities lending | | | | — | | | | 4,598 | | | | 1,219 | | | | — | |
Prepaid expenses | | | | 1,250 | | | | — | | | | — | | | | — | |
Total Assets | | | | 24,894,684 | | | | 220,649,396 | | | | 254,662,705 | | | | 5,283,284 | |
| |
Liabilities:
| | | | | | | | | | | | | | | | | |
Payables:
| | | | | | | | | | | | | | | | | |
Investment securities purchased | | | | 292,498 | | | | — | | | | — | | | | — | |
Collateral for securities on loan | | | | — | | | | 9,173,194 | | | | 9,799,466 | | | | — | |
Deferred foreign tax payable | | | | — | | | | — | | | | — | | | | 10 | |
Advisory fees | | | | — | | | | 131,852 | | | | 111,901 | | | | 2,153 | |
Professional fees | | | | 29,618 | | | | — | | | | — | | | | — | |
Trustee fees | | | | 1,146 | | | | — | | | | — | | | | — | |
Other accrued expenses | | | | 36,161 | | | | — | | | | — | | | | — | |
Total Liabilities | | | | 359,423 | | | | 9,305,046 | | | | 9,911,367 | | | | 2,163 | |
Net Assets | | | $ | 24,535,261 | | | $ | 211,344,350 | | | $ | 244,751,338 | | | $ | 5,281,121 | |
Net Assets Consist of:
| | | | | | | | | | | | | | | | �� | |
Paid-in capital | | | $ | 27,688,337 | | | $ | 219,669,628 | | | $ | 252,737,348 | | | $ | 5,000,100 | |
Total distributable earnings (accumulated deficit) | | | | (3,153,076 | ) | | | (8,325,278 | ) | | | (7,986,010 | ) | | | 281,021 | |
Net Assets | | | $ | 24,535,261 | | | $ | 211,344,350 | | | $ | 244,751,338 | | | $ | 5,281,121 | |
Shares outstanding (unlimited number of shares of beneficial interest authorized, no par value) | | | | 1,000,004 | | | | 8,550,004 | | | | 9,900,004 | | | | 200,004 | |
Net asset value per share | | | $ | 24.54 | | | $ | 24.72 | | | $ | 24.72 | | | $ | 26.41 | |
(a) Market value of securities on loan | | | $ | — | | | $ | 10,966,263 | | | $ | 14,927,010 | | | $ | — | |
(b) Foreign currency, at cost | | | $ | 2 | | | $ | — | | | $ | — | | | $ | 3,751 | |
The accompanying notes are an integral part of these financial statements.
59
Statements of Operations
For the Year Ended October 31, 2019
| | | | InfraCap
REIT
Preferred ETF
| | Virtus
Glovista
Emerging
Markets ETF
| | Virtus
InfraCap
U.S. Preferred
Stock ETF
| | Virtus
LifeSci Biotech
Clinical
Trials ETF
| | Virtus LifeSci
Biotech
Products ETF
|
Investment Income:
| | | | | | | | | | | | | | | | | | | | | | |
Dividend income (net of foreign withholding taxes) | | | | $ | 1,478,831 | | | $ | 335,552 | | | $ | 2,446,243 | | | $ | 3 | | | $ | 50,159 | |
Interest income | | | | | 3,081 | | | | 1,378 | | | | 3,504 | | | | 2,293 | | | | 2,414 | |
Securities lending, net of fees | | | | | — | | | | — | | | | — | | | | 79,420 | | | | 32,072 | |
Total Investment Income | | | | | 1,481,912 | | | | 336,930 | | | | 2,449,747 | | | | 81,716 | | | | 84,645 | |
Expenses:
| | | | | | | | | | | | | | | | | | | | | | |
Advisory fees | | | | | 113,673 | | | | 68,406 | | | | 255,921 | | | | 219,123 | | | | 241,490 | |
Tax expense | | | | | 57 | | | | 142 | | | | 30 | | | | 113 | | | | 113 | |
Dividend and interest expenses | | | | | — | | | | — | | | | 383,995 | | | | — | | | | — | |
Total Expenses | | | | | 113,730 | | | | 68,548 | | | | 639,946 | | | | 219,236 | | | | 241,603 | |
Less expense waivers/reimbursements | | | | | — | | | | (3,018 | ) | | | — | | | | — | | | | — | |
Net Expenses | | | | | 113,730 | | | | 65,530 | | | | 639,946 | | | | 219,236 | | | | 241,603 | |
Net Investment Income (Loss) | | | | | 1,368,182 | | | | 271,400 | | | | 1,809,801 | | | | (137,520 | ) | | | (156,958 | ) |
Net Realized Gain (Loss) on:
| | | | | | | | | | | | | | | | | | | | | | |
Investments | | | | | (196,351 | ) | | | (875,572 | )1 | | | 2,110,866 | | | | (10,177,829 | ) | �� | | (4,045,778 | ) |
In-kind redemptions | | | | | 59,666 | | | | 452,915 | | | | — | | | | 2,789,095 | | | | 5,544,958 | |
Written options | | | | | — | | | | — | | | | 461,188 | | | | — | | | | — | |
Securities sold short | | | | | — | | | | — | | | | (290,592 | ) | | | — | | | | | |
Foreign currency transactions | | | | | — | | | | (15,360 | ) | | | — | | | | — | | | | — | |
Total Net Realized Gain (Loss) | | | | | (136,685 | ) | | | (438,017 | ) | | | 2,281,462 | | | | (7,388,734 | ) | | | 1,499,180 | |
Change in Net Unrealized Appreciation (Depreciation) on:
| | | | | | | | | | | | | | | | | | | | | | |
Investments | | | | | 1,993,610 | | | | 1,406,276 | 2 | | | 2,000,643 | | | | 6,791,199 | | | | (1,071,625 | ) |
Written options | | | | | — | | | | — | | | | 11,104 | | | | — | | | | — | |
Securities sold short | | | | | — | | | | — | | | | (87,816 | ) | | | — | | | | — | |
Foreign currency translations | | | | | — | | | | 402 | | | | — | | | | — | | | | — | |
Total Change in Net Unrealized Appreciation (Depreciation) | | | | | 1,993,610 | | | | 1,406,678 | | | | 1,923,931 | | | | 6,791,199 | | | | (1,071,625 | ) |
Net Realized and Change in Unrealized Gain (Loss) | | | | | 1,856,925 | | | | 968,661 | | | | 4,205,393 | | | | (597,535 | ) | | | 427,555 | |
Net Increase (Decrease) in Net Assets Resulting from Operations | | | | $ | 3,225,107 | | | $ | 1,240,061 | | | $ | 6,015,194 | | | $ | (735,055 | ) | | $ | 270,597 | |
Foreign withholding taxes | | | | $ | — | | | $ | 43,443 | | | $ | — | | | $ | — | | | $ | — | |
1 | | Net of foreign taxes of $(1,773). |
2 | | Net of change in deferred taxes of $(1,089). |
The accompanying notes are an integral part of these financial statements.
60
Statements of Operations (continued)
For the Year Ended October 31, 2019
| | | | Virtus
Newfleet
Multi-Sector
Bond ETF
| | Virtus
Private Credit
Strategy ETF1
| | Virtus
Real Asset
Income ETF1
| | Virtus WMC
Global Factor
Opportunities ETF
|
Investment Income:
| | | | | | | | | | | | | | | | | | |
Dividend income (net of foreign withholding taxes) | | | | $ | 52,652 | | | $ | 12,731,932 | | | $ | 5,475,358 | | | $ | 129,063 | |
Interest income | | | | | 2,660,646 | | | | 13,077 | | | | 9,440 | | | | 296 | |
Securities lending, net of fees | | | | | — | | | | 4,598 | | | | 1,219 | | | | — | |
Total Investment Income | | | | | 2,713,298 | | | | 12,749,607 | | | | 5,486,017 | | | | 129,359 | |
Expenses:
| | | | | | | | | | | | | | | | | | |
Advisory fees | | | | | 367,080 | | | | 957,617 | | | | 803,828 | | | | 24,646 | |
Pricing fees | | | | | 46,888 | | | | — | | | | — | | | | — | |
Professional fees | | | | | 35,556 | | | | — | | | | — | | | | — | |
Accounting and administration fees | | | | | 31,367 | | | | — | | | | — | | | | — | |
Report to shareholders fees | | | | | 21,951 | | | | — | | | | — | | | | — | |
Transfer agent fees | | | | | 17,244 | | | | — | | | | — | | | | — | |
Trustee fees | | | | | 10,968 | | | | — | | | | — | | | | — | |
Exchange listing fees | | | | | 7,500 | | | | — | | | | — | | | | — | |
Insurance fees | | | | | 5,658 | | | | — | | | | — | | | | — | |
Custody fees | | | | | 5,641 | | | | — | | | | — | | | | — | |
Tax expense | | | | | — | | | | — | | | | — | | | | 57 | |
Other expenses | | | | | 4,701 | | | | — | | | | — | | | | — | |
Total Expenses | | | | | 554,554 | | | | 957,617 | | | | 803,828 | | | | 24,703 | |
Less expense waivers/reimbursements | | | | | (135,034 | ) | | | — | | | | — | | | | — | |
Net Expenses | | | | | 419,520 | | | | 957,617 | | | | 803,828 | | | | 24,703 | |
Net Investment Income | | | | | 2,293,778 | | | | 11,791,990 | | | | 4,682,189 | | | | 104,656 | |
Net Realized Gain (Loss) on:
| | | | | | | | | | | | | | | | | | |
Investments | | | | | (1,684,450 | )2 | | | (2,359,440 | ) | | | (1,694,658 | ) | | | (118,749 | ) |
In-kind redemptions | | | | | — | | | | 708,188 | | | | 1,484,072 | | | | — | |
Foreign currency transactions | | | | | (7,257 | ) | | | — | | | | 49 | | | | (566 | ) |
Total Net Realized Loss | | | | | (1,691,707 | ) | | | (1,651,252 | ) | | | (210,537 | ) | | | (119,315 | ) |
Change in Net Unrealized Appreciation (Depreciation) on:
| | | | | | | | | | | | | | | | | | |
Investments | | | | | 3,347,297 | | | | (7,421,429 | ) | | | (6,303,444 | ) | | | 505,845 | 3 |
Foreign currency translations | | | | | 1,851 | | | | — | | | | — | | | | 172 | |
Total Change in Net Unrealized Appreciation (Depreciation) | | | | | 3,349,148 | | | | (7,421,429 | ) | | | (6,303,444 | ) | | | 506,017 | |
Net Realized and Change in Unrealized Gain (Loss) | | | | | 1,657,441 | | | | (9,072,681 | ) | | | (6,513,981 | ) | | | 386,702 | |
Net Increase (Decrease) in Net Assets Resulting from Operations | | | | $ | 3,951,219 | | | $ | 2,719,309 | | | $ | (1,831,792 | ) | | $ | 491,358 | |
Foreign withholding taxes | | | | $ | — | | | $ | — | | | $ | 212,679 | | | $ | 9,195 | |
1 | | From February 7, 2019 (commencement of operations) through October 31, 2019. |
2 | | Net of foreign taxes of $(1,717). |
3 | | Net of change in deferred taxes of $(9). |
The accompanying notes are an integral part of these financial statements.
61
Statements of Changes in Net Assets
| | | | InfraCap REIT
Preferred ETF
| | Virtus Glovista
Emerging Markets ETF
|
| | | | For the
Year Ended
October 31, 2019
| | For the
Year Ended
October 31, 2018
| | For the
Year Ended
October 31, 2019
| | For the Period
November 7, 20171
Through
October 31, 2018
|
Increase (Decrease) in Net Assets Resulting from Operations:
| | | | | | | | | | | | | | | | | | |
Net investment income | | | | $ | 1,368,182 | | | $ | 1,107,168 | | | $ | 271,400 | | | $ | 437,830 | |
Net realized loss on investments | | | | | (136,685 | ) | | | (489,779 | ) | | | (438,017 | ) | | | (3,285,966 | ) |
Net change in unrealized appreciation (depreciation) on investments | | | | | 1,993,610 | | | | (1,208,236 | ) | | | 1,406,678 | | | | (1,258,775 | ) |
Net increase (decrease) in net assets resulting from operations | | | | | 3,225,107 | | | | (590,847 | ) | | | 1,240,061 | | | | (4,106,911 | ) |
Distributions to Shareholders | | | | | (1,369,330 | ) | | | (1,137,316 | ) | | | (670,109 | ) | | | (51,696 | ) |
Distributions to Shareholders from return of capital | | | | | (249,926 | ) | | | (218,190 | ) | | | — | | | | — | |
Total distributions | | | | | (1,619,256 | ) | | | (1,355,506 | ) | | | (670,109 | ) | | | (51,696 | ) |
Shareholder Transactions:
| | | | | | | | | | | | | | | | | | |
Proceeds from shares sold | | | | | 15,051,231 | | | | 3,805,481 | | | | — | | | | 28,302,634 | |
Cost of shares redeemed | | | | | (1,240,219 | ) | | | — | | | | (6,747,141 | ) | | | (11,251,769 | ) |
Net increase (decrease) in net assets resulting from shareholder transactions | | | | | 13,811,012 | | | | 3,805,481 | | | | (6,747,141 | ) | | | 17,050,865 | |
Increase (decrease) in net assets | | | | | 15,416,863 | | | | 1,859,128 | | | | (6,177,189 | ) | | | 12,892,258 | |
Net Assets:
| | | | | | | | | | | | | | | | | | |
Beginning of period/year | | | | | 22,468,471 | | | | 20,609,343 | | | | 12,892,258 | | | | — | |
End of period/year | | | | $ | 37,885,334 | | | $ | 22,468,471 | | | $ | 6,715,069 | | | $ | 12,892,258 | |
Changes in Shares Outstanding:
| | | | | | | | | | | | | | | | | | |
Shares outstanding, beginning of period/year | | | | | 950,004 | | | | 800,004 | | | | 600,004 | | | | — | |
Shares sold | | | | | 600,000 | | | | 150,000 | | | | — | | | | 1,100,004 | |
Shares redeemed | | | | | (50,000 | ) | | | — | | | | (300,000 | ) | | | (500,000 | ) |
Shares outstanding, end of period/year | | | | | 1,500,004 | | | | 950,004 | | | | 300,004 | | | | 600,004 | |
1 | | Commencement of operations. |
The accompanying notes are an integral part of these financial statements.
62
Statements of Changes in Net Assets (continued)
| | | | Virtus InfraCap U.S.
Preferred Stock ETF
| | Virtus LifeSci Biotech
Clinical Trials ETF
|
| | | | For the
Year Ended
October 31, 2019
| | For the Period
May 15, 20181
Through
October 31, 2018
| | For the
Year Ended
October 31, 2019
| | For the
Year Ended
October 31, 2018
|
Increase (Decrease) in Net Assets Resulting from Operations:
| | | | | | | | | | | | | | | | | | |
Net investment income (loss) | | | | $ | 1,809,801 | | | $ | 106,736 | | | $ | (137,520 | ) | | $ | (246,528 | ) |
Net realized gain (loss) on investments, written options and securities sold short | | | | | 2,281,462 | | | | 52,990 | | | | (7,388,734 | ) | | | 14,813,371 | |
Net change in unrealized appreciation (depreciation) on investments, written options and securities sold short | | | | | 1,923,931 | | | | (219,187 | ) | | | 6,791,199 | | | | (17,174,895 | ) |
Net increase (decrease) in net assets resulting from operations | | | | | 6,015,194 | | | | (59,461 | ) | | | (735,055 | ) | | | (2,608,052 | ) |
Distributions to Shareholders | | | | | (2,935,509 | ) | | | (133,003 | ) | | | — | | | | (326,965 | ) |
Shareholder Transactions:
| | | | | | | | | | | | | | | | | | |
Proceeds from shares sold | | | | | 79,327,661 | | | | 6,309,977 | | | | 9,050,920 | | | | 72,952,271 | |
Cost of shares redeemed | | | | | — | | | | — | | | | (20,809,840 | ) | | | (64,249,191 | ) |
Net increase (decrease) in net assets resulting from shareholder transactions | | | | | 79,327,661 | | | | 6,309,977 | | | | (11,758,920 | ) | | | 8,703,080 | |
Increase (decrease) in net assets | | | | | 82,407,346 | | | | 6,117,513 | | | | (12,493,975 | ) | | | 5,768,063 | |
Net Assets:
| | | | | | | | | | | | | | | | | | |
Beginning of period/year | | | | | 6,117,513 | | | | — | | | | 36,269,144 | | | | 30,501,081 | |
End of period/year | | | | $ | 88,524,859 | | | $ | 6,117,513 | | | $ | 23,775,169 | | | $ | 36,269,144 | |
Changes in Shares Outstanding:
| | | | | | | | | | | | | | | | | | |
Shares outstanding, beginning of period/year | | | | | 250,004 | | | | — | | | | 1,350,004 | | | | 1,100,004 | |
Shares sold | | | | | 3,100,000 | | | | 250,004 | | | | 350,000 | | | | 2,200,000 | |
Shares redeemed | | | | | — | | | | — | | | | (800,000 | ) | | | (1,950,000 | ) |
Shares outstanding, end of period/year | | | | | 3,350,004 | | | | 250,004 | | | | 900,004 | | | | 1,350,004 | |
1 | | Commencement of operations. |
The accompanying notes are an integral part of these financial statements.
63
Statements of Changes in Net Assets (continued)
| | | | Virtus LifeSci Biotech Products ETF
| | Virtus Newfleet Multi-Sector Bond ETF
|
| | | | For the
Year Ended
October 31, 2019
| | For the
Year Ended
October 31, 2018
| | For the
Year Ended
October 31, 2019
| | For the
Year Ended
October 31, 2018
|
Increase (Decrease) in Net Assets Resulting from Operations:
| | | | | | | | | | | | | | | | | | |
Net investment income (loss) | | | | $ | (156,958 | ) | | $ | (170,625 | ) | | $ | 2,293,778 | | | $ | 6,180,088 | |
Net realized gain (loss) on investments | | | | | 1,499,180 | | | | 7,902,704 | | | | (1,691,707 | ) | | | (2,016,169 | ) |
Net change in unrealized appreciation (depreciation) on investments | | | | | (1,071,625 | ) | | | (9,085,959 | ) | | | 3,349,148 | | | | (6,416,795 | ) |
Net increase (decrease) in net assets resulting from operations | | | | | 270,597 | | | | (1,353,880 | ) | | | 3,951,219 | | | | (2,252,876 | ) |
Distributions to Shareholders | | | | | — | | | | (68,685 | ) | | | (2,153,039 | ) | | | (9,169,422 | ) |
Distributions to Shareholders from return of capital | | | | | — | | | | — | | | | (182,502 | ) | | | — | |
Total distributions | | | | | — | | | | (68,685 | ) | | | (2,335,541 | ) | | | (9,169,422 | ) |
Shareholder Transactions:
| | | | | | | | | | | | | | | | | | |
Proceeds from shares sold | | | | | 18,385,750 | | | | 14,861,049 | | | | 8,370,585 | | | | 10,021,681 | |
Cost of shares redeemed | | | | | (19,398,700 | ) | | | (23,567,951 | ) | | | (84,410,262 | ) | | | (68,923,686 | ) |
Net decrease in net assets resulting from shareholder transactions | | | | | (1,012,950 | ) | | | (8,706,902 | ) | | | (76,039,677 | ) | | | (58,902,005 | ) |
Decrease in net assets | | | | | (742,353 | ) | | | (10,129,467 | ) | | | (74,423,999 | ) | | | (70,324,303 | ) |
Net Assets:
| | | | | | | | | | | | | | | | | | |
Beginning of period/year | | | | | 27,247,545 | | | | 37,377,012 | | | | 98,959,260 | | | | 169,283,563 | |
End of period/year | | | | $ | 26,505,192 | | | $ | 27,247,545 | | | $ | 24,535,261 | | | $ | 98,959,260 | |
Changes in Shares Outstanding:
| | | | | | | | | | | | | | | | | | |
Shares outstanding, beginning of period/year | | | | | 750,004 | | | | 950,004 | | | | 4,150,004 | | | | 6,550,004 | |
Shares sold | | | | | 450,000 | | | | 350,000 | | | | 350,000 | | | | 400,000 | |
Shares redeemed | | | | | (500,000 | ) | | | (550,000 | ) | | | (3,500,000 | ) | | | (2,800,000 | ) |
Shares outstanding, end of period/year | | | | | 700,004 | | | | 750,004 | | | | 1,000,004 | | | | 4,150,004 | |
The accompanying notes are an integral part of these financial statements.
64
Statements of Changes in Net Assets (continued)
| | | | Virtus Private Credit
Strategy ETF
| | Virtus Real Asset
Income ETF
|
| | | | For the Period
February 7, 20191
Through
October 31, 2019
| | For the Period
February 7, 20191
Through
October 31, 2019
|
Increase (Decrease) in Net Assets Resulting from Operations:
| | | | | | | | | | |
Net investment income | | | | $ | 11,791,990 | | | $ | 4,682,189 | |
Net realized loss on investments | | | | | (1,651,252 | ) | | | (210,537 | ) |
Net change in unrealized depreciation on investments | | | | | (7,421,429 | ) | | | (6,303,444 | ) |
Net increase (decrease) in net assets resulting from operations | | | | | 2,719,309 | | | | (1,831,792 | ) |
Distributions to Shareholders | | | | | (10,417,838 | ) | | | (4,789,847 | ) |
Shareholder Transactions:
| | | | | | | | | | |
Proceeds from shares sold | | | | | 233,033,982 | | | | 261,377,230 | |
Cost of shares redeemed | | | | | (13,991,103 | ) | | | (10,004,253 | ) |
Net increase in net assets resulting from shareholder transactions | | | | | 219,042,879 | | | | 251,372,977 | |
Increase in net assets | | | | | 211,344,350 | | | | 244,751,338 | |
Net Assets:
| | | | | | | | | | |
Beginning of period/year | | | | | — | | | | — | |
End of period/year | | | | $ | 211,344,350 | | | $ | 244,751,338 | |
Changes in Shares Outstanding:
| | | | | | | | | | |
Shares outstanding, beginning of period/year | | | | | — | | | | — | |
Shares sold | | | | | 9,100,004 | | | | 10,300,004 | |
Shares redeemed | | | | | (550,000 | ) | | | (400,000 | ) |
Shares outstanding, end of period/year | | | | | 8,550,004 | | | | 9,900,004 | |
1 | | Commencement of operations. |
The accompanying notes are an integral part of these financial statements.
65
Statements of Changes in Net Assets (continued)
| | | | Virtus WMC Global
Factor Opportunities ETF
|
| | | | For the
Year Ended
October 31, 2019
| | For the
Year Ended
October 31, 2018
|
Increase (Decrease) in Net Assets Resulting from Operations:
| | | | | | | | | | |
Net investment income | | | | $ | 104,656 | | | $ | 99,437 | |
Net realized gain (loss) on investments | | | | | (119,315 | ) | | | 109,039 | |
Net change in unrealized appreciation (depreciation) on investments | | | | | 506,017 | | | | (213,407 | ) |
Net increase (decrease) in net assets resulting from operations | | | | | 491,358 | | | | (4,931 | ) |
Distributions to Shareholders | | | | | (205,032 | ) | | | (19,408 | ) |
Increase (decrease) in net assets | | | | | 286,326 | | | | (24,339 | ) |
Net Assets:
| | | | | | | | | | |
Beginning of period/year | | | | | 4,994,795 | | | | 5,019,134 | |
End of period/year | | | | $ | 5,281,121 | | | $ | 4,994,795 | |
Changes in Shares Outstanding:
| | | | | | | | | | |
Shares outstanding, beginning of period/year | | | | | 200,004 | | | | 200,004 | |
Shares outstanding, end of period/year | | | | | 200,004 | | | | 200,004 | |
The accompanying notes are an integral part of these financial statements.
66
Statement of Cash Flows
For the Year ended October 31, 2019
| | | | Virtus InfraCap
U.S. Preferred
Stock ETF
|
Cash Flows From Operating Activities:
| | | | | | |
Net increase in net assets from operations | | | | $ | 6,015,194 | |
Adjustments to reconcile net increase in net assets from operations to net cash provided by operating activities:
| | | | | | |
Purchases of investment securities | | | | | (56,926,756 | ) |
Proceeds from sales of investment securities | | | | | 58,967,793 | |
Net proceeds from purchased and written options | | | | | 786,539 | |
Net proceeds from securities sold short | | | | | 10,833,837 | |
Payments made to cover securities sold short | | | | | (5,394,553 | ) |
Net realized gain on investments | | | | | (2,110,866 | ) |
Net realized loss on securities sold shorts | | | | | 290,592 | |
Net realized gain on written options | | | | | (461,188 | ) |
Net change in unrealized appreciation on investments | | | | | (2,000,643 | ) |
Net change in unrealized depreciation on securities sold short | | | | | 87,816 | |
Net change in unrealized appreciation on written options | | | | | (11,104 | ) |
Increase in dividends and interest receivable | | | | | (82,235 | ) |
Increase in due from brokers | | | | | (4,782,426 | ) |
Increase in advisory fees payable | | | | | 49,399 | |
Net cash provided by operating activities | | | | | 5,261,399 | |
Cash Flows from Financing Activities:
| | | | | | |
Proceeds from borrowings | | | | | 17,342,259 | |
Payments for fund shares sold in excess of in-kind creations | | | | | (18,720,790 | ) |
Distributions paid | | | | | (2,935,509 | ) |
Net cash used in financing activities | | | | | (4,314,040 | ) |
Net increase in cash | | | | | 947,359 | |
Cash, beginning of year | | | | | 273,649 | |
Cash, end of year | | | | $ | 1,221,008 | |
Supplementary information:
| | | | | | |
Interest paid on borrowings | | | | $ | 240,026 | |
Non-cash financing activities:
| | | | | | |
In-kind creations — Issued | | | | | 98,048,237 | |
In-kind creations — Redeemed | | | | | – | |
The accompanying notes are an integral part of these financial statements.
67
| | | | InfraCap REIT Preferred ETF
|
| | | | For the
Year Ended
October 31, 2019
| | For the
Year Ended
October 31, 2018
| | For the Period
February 7, 20171
Through
October 31, 2017
|
Per Share Data for a Share Outstanding throughout each period presented:
| | | | | | | | | | | | | | |
Net asset value, beginning of period | | | | $ | 23.65 | | | $ | 25.76 | | | $ | 25.06 | |
Investment operations:
| | | | | | | | | | | | | | |
Net investment income2 | | | | | 1.32 | | | | 1.21 | | | | 1.03 | |
Net realized and unrealized gain (loss) | | | | | 1.83 | | | | (1.85 | ) | | | 0.60 | |
Total from investment operations | | | | | 3.15 | | | | (0.64 | ) | | | 1.63 | |
| |
Less Distributions from:
| | | | | | | | | | | | | | |
Net investment income | | | | | (1.30 | ) | | | (1.23 | ) | | | (0.93 | ) |
Return of capital | | | | | (0.24 | ) | | | (0.24 | ) | | | — | |
Total distributions | | | | | (1.54 | ) | | | (1.47 | ) | | | (0.93 | ) |
Net Asset Value, End of period | | | | $ | 25.26 | | | $ | 23.65 | | | $ | 25.76 | |
Net Asset Value Total Return3 | | | | | 13.78 | % | | | (2.60 | )% | | | 6.54 | % |
Net assets, end of period (000’s omitted) | | | | $ | 37,885 | | | $ | 22,468 | | | $ | 20,609 | |
| |
RATIOS/SUPPLEMENTAL DATA:
| | | | | | | | | | | | | | |
Ratios to Average Net Assets:
| | | | | | | | | | | | | | |
Expenses | | | | | 0.45 | %4 | | | 0.45 | %4 | | | 0.45 | %5 |
Net investment income | | | | | 5.42 | % | | | 4.93 | % | | | 5.48 | %5 |
Portfolio turnover rate6 | | | | | 66 | % | | | 70 | % | | | 91 | %7 |
1 | | Commencement of operations. |
2 | | Based on average shares outstanding. |
3 | | Net Asset Value Total Return is calculated assuming an initial investment made at the net asset value on the first day of the period, reinvestment of dividends and distributions at net asset value during the period, and redemptions at net asset value on the last day of the period. Total return calculated for a period of less than one year is not annualized. |
4 | | The ratios of expenses to average net assets includes tax expense fees of less than 0.01%. |
6 | | Portfolio turnover excludes the value of portfolio securities received or delivered as a result of in-kind creations or redemptions of the Fund’s capital shares. |
The accompanying notes are an integral part of these financial statements.
68
Financial Highlights (continued)
| | | | Virtus Glovista
Emerging Markets ETF
|
| | | | For the
Year Ended
October 31, 2019
| | For the Period
November 7, 20171
Through
October 31, 2018
|
Per Share Data for a Share Outstanding throughout each period presented:
| | | | | | | | | | |
Net asset value, beginning of period | | | | $ | 21.49 | | | $ | 24.95 | |
Investment operations:
| | | | | | | | | | |
Net investment income2 | | | | | 0.60 | | | | 0.53 | |
Net realized and unrealized gain (loss) | | | | | 1.41 | | | | (3.90 | ) |
Total from investment operations | | | | | 2.01 | | | | (3.37 | ) |
| |
Less Distributions from:
| | | | | | | | | | |
Net investment income | | | | | (1.12 | ) | | | (0.09 | ) |
Total distributions | | | | | (1.12 | ) | | | (0.09 | ) |
Net Asset Value, End of period | | | | $ | 22.38 | | | $ | 21.49 | |
Net Asset Value Total Return3 | | | | | 9.77 | % | | | (13.58 | )% |
Net assets, end of period (000’s omitted) | | | | $ | 6,715 | | | $ | 12,892 | |
| |
RATIOS/SUPPLEMENTAL DATA:
| | | | | | | | | | |
Ratios to Average Net Assets:
| | | | | | | | | | |
Expenses, net of expense waivers | | | | | 0.65 | %4 | | | 0.65 | %5 |
Expenses, prior to expense waivers | | | | | 0.68 | %4 | | | 0.68 | %5 |
Net investment income | | | | | 2.70 | % | | | 2.20 | %5 |
Portfolio turnover rate6 | | | | | 121 | % | | | 162 | %7 |
1 | | Commencement of operations. |
2 | | Based on average shares outstanding. |
3 | | Net Asset Value Total Return is calculated assuming an initial investment made at the net asset value on the first day of the period, reinvestment of dividends and distributions at net asset value during the period, and redemptions at net asset value on the last day of the period. Total return calculated for a period of less than one year is not annualized. |
4 | | The ratios of expenses to average net assets includes tax expense fees of less than 0.01%. |
6 | | Portfolio turnover excludes the value of portfolio securities received or delivered as a result of in-kind creations or redemptions of the Fund’s capital shares. |
The accompanying notes are an integral part of these financial statements.
69
Financial Highlights (continued)
| | | | Virtus InfraCap U.S. Preferred Stock ETF
|
| | | | For the
Year Ended
October 31, 2019
| | For the Period
May 15, 20181
Through
October 31, 2018
|
Per Share Data for a Share Outstanding throughout each period presented:
| | | | | | | | | | |
Net asset value, beginning of period | | | | $ | 24.47 | | | $ | 24.96 | |
Investment operations:
| | | | | | | | | | |
Net investment income2 | | | | | 1.44 | | | | 0.72 | |
Net realized and unrealized gain (loss) | | | | | 2.80 | | | | (0.45 | ) |
Total from investment operations | | | | | 4.24 | | | | 0.27 | |
| |
Less Distributions from:
| | | | | | | | | | |
Net investment income | | | | | (2.28 | ) | | | (0.76 | ) |
Total distributions | | | | | (2.28 | ) | | | (0.76 | ) |
Net Asset Value, End of period | | | | $ | 26.43 | | | $ | 24.47 | |
Net Asset Value Total Return3 | | | | | 18.37 | % | | | 1.02 | % |
Net assets, end of period (000’s omitted) | | | | $ | 88,525 | | | $ | 6,118 | |
| |
RATIOS/SUPPLEMENTAL DATA:
| | | | | | | | | | |
Ratios to Average Net Assets:
| | | | | | | | | | |
Expenses | | | | | 2.00 | %4,5 | | | 2.13 | %6,7 |
Net investment income | | | | | 5.66 | % | | | 6.22 | %6 |
Portfolio turnover rate8 | | | | | 150 | % | | | 55 | %9 |
1 | | Commencement of operations. |
2 | | Based on average shares outstanding. |
3 | | Net Asset Value Total Return is calculated assuming an initial investment made at the net asset value on the first day of the period, reinvestment of dividends and distributions at net asset value during the period, and redemptions at net asset value on the last day of the period. Total return calculated for a period of less than one year is not annualized. |
4 | | The ratios of expenses to average net assets includes tax expense fees of less than 0.01%. |
5 | | The ratios of expenses to average net assets include interest expense of 0.75% and dividend expense on securities sold short fees of 0.45%. |
7 | | The ratios of expenses to average net assets include interest expense of 1.05% and dividend expense on securities sold short fees of 0.28%. |
8 | | Portfolio turnover excludes the value of portfolio securities received or delivered as a result of in-kind creations or redemptions of the Fund’s capital shares. |
The accompanying notes are an integral part of these financial statements.
70
Financial Highlights (continued)
| | | | Virtus LifeSci Biotech Clinical Trials ETF
|
| | | | For the
Year Ended
October 31, 2019
| | For the
Year Ended
October 31, 2018
| | For the
Year Ended
October 31, 2017
| | For the
Year Ended
October 31, 2016
| | For the Period
December 16, 20141
Through
October 31, 2015
|
Per Share Data for a Share Outstanding throughout each period presented:
| | | | | | | | | | | | | | | | | | | | | | |
Net asset value, beginning of period | | | | $ | 26.87 | | | $ | 27.73 | | | $ | 18.05 | | | $ | 27.37 | | | $ | 25.00 | |
Investment operations:
| | | | | | | | | | | | | | | | | | | | | | |
Net investment loss2 | | | | | (0.13 | ) | | | (0.15 | ) | | | (0.12 | ) | | | (0.14 | ) | | | (0.24 | ) |
Net realized and unrealized gain (loss) | | | | | (0.32 | ) | | | (0.41 | ) | | | 9.80 | | | | (9.03 | ) | | | 2.61 | 3 |
Total from investment operations | | | | | (0.45 | ) | | | (0.56 | ) | | | 9.68 | | | | (9.17 | ) | | | 2.37 | |
| |
Less Distributions from:
| | | | | | | | | | | | | | | | | | | | | | |
Net investment income | | | | | — | | | | (0.30 | ) | | | — | | | | — | | | | — | |
Net realized gains | | | | | — | | | | — | | | | — | | | | (0.15 | ) | | | — | |
Total distributions | | | | | — | | | | (0.30 | ) | | | — | | | | (0.15 | ) | | | — | |
Net Asset Value, End of period | | | | $ | 26.42 | | | $ | 26.87 | | | $ | 27.73 | | | $ | 18.05 | | | $ | 27.37 | |
Net Asset Value Total Return4 | | | | | (1.67 | )% | | | (2.05 | )% | | | 53.66 | % | | | (33.73 | )% | | | 9.46 | % |
Net assets, end of period (000’s omitted) | | | | $ | 23,775 | | | $ | 36,269 | | | $ | 30,501 | | | $ | 18,045 | | | $ | 23,261 | |
| |
RATIOS/SUPPLEMENTAL DATA:
| | | | | | | | | | | | | | | | | | | | | | |
Ratios to Average Net Assets:
| | | | | | | | | | | | | | | | | | | | | | |
Expenses | | | | | 0.79 | %5 | | | 0.79 | %5 | | | 0.83 | % | | | 0.85 | %5 | | | 0.85 | %6,7 |
Net investment loss | | | | | (0.50 | )% | | | (0.45 | )% | | | (0.53 | )% | | | (0.67 | )% | | | (0.85 | )%6 |
Portfolio turnover rate8 | | | | | 67 | % | | | 65 | % | | | 45 | % | | | 54 | % | | | 76 | %9 |
1 | | Commencement of operations. |
2 | | Based on average shares outstanding. |
3 | | The per share amount of realized and unrealized gain (loss) on investments does not accord with the amounts reported in the Statements of Changes in Net Assets due to the timing of creation of Fund shares in relation to fluctuating market values. |
4 | | Net Asset Value Total Return is calculated assuming an initial investment made at the net asset value on the first day of the period, reinvestment of dividends and distributions at net asset value during the period, and redemptions at net asset value on the last day of the period. Total return calculated for a period of less than one year is not annualized. |
5 | | The ratios of expenses to average net assets includes tax expense fees of less than 0.01%. |
7 | | The ratios of expenses to average net assets includes interest expense fees of less than 0.01%. |
8 | | Portfolio turnover excludes the value of portfolio securities received or delivered as a result of in-kind creations or redemptions of the Fund’s capital shares. |
The accompanying notes are an integral part of these financial statements.
71
Financial Highlights (continued)
| | | | Virtus LifeSci Biotech Products ETF
|
| | | | For the
Year Ended
October 31, 2019
| | For the
Year Ended
October 31, 2018
| | For the
Year Ended
October 31, 2017
| | For the
Year Ended
October 31, 2016
| | For the Period
December 16, 20141
Through
October 31, 2015
|
Per Share Data for a Share Outstanding throughout each period presented:
| | | | | | | | | | | | | | | | | | | | | | |
Net asset value, beginning of period | | | | $ | 36.33 | | | $ | 39.34 | | | $ | 28.91 | | | $ | 30.50 | | | $ | 25.00 | |
Investment operations:
| | | | | | | | | | | | | | | | | | | | | | |
Net investment income (loss)2 | | | | | (0.20 | ) | | | (0.21 | ) | | | 0.07 | | | | (0.12 | ) | | | (0.17 | ) |
Net realized and unrealized gain (loss) | | | | | 1.73 | | | | (2.73 | ) | | | 10.36 | | | | (1.07 | ) | | | 5.67 | 3 |
Total from investment operations | | | | | 1.53 | | | | (2.94 | ) | | | 10.43 | | | | (1.19 | ) | | | 5.50 | |
| |
Less Distributions from:
| | | | | | | | | | | | | | | | | �� | | | | | |
Net investment income | | | | | — | | | | (0.07 | ) | | | — | | | | — | | | | — | |
Net realized gains | | | | | — | | | | — | | | | — | | | | (0.40 | ) | | | — | |
Total distributions | | | | | — | | | | (0.07 | ) | | | — | | | | (0.40 | ) | | | — | |
Net Asset Value, End of period | | | | $ | 37.86 | | | $ | 36.33 | | | $ | 39.34 | | | $ | 28.91 | | | $ | 30.50 | |
Net Asset Value Total Return4 | | | | | 4.22 | % | | | (7.49 | )% | | | 36.08 | % | | | (3.97 | )% | | | 21.99 | % |
Net assets, end of period (000’s omitted) | | | | $ | 26,505 | | | $ | 27,248 | | | $ | 37,377 | | | $ | 23,130 | | | $ | 22,874 | |
| |
RATIOS/SUPPLEMENTAL DATA:
| | | | | | | | | | | | | | | | | | | | | | |
Ratios to Average Net Assets:
| | | | | | | | | | | | | | | | | | | | | | |
Expenses | | | | | 0.79 | %5 | | | 0.79 | %5 | | | 0.84 | % | | | 0.85 | %5 | | | 0.86 | %6,7 |
Net investment income (loss) | | | | | (0.51 | )% | | | (0.49 | )% | | | 0.19 | % | | | (0.43 | )% | | | (0.58 | )%6 |
Portfolio turnover rate8 | | | | | 41 | % | | | 32 | % | | | 34 | % | | | 35 | % | | | 45 | %9 |
1 | | Commencement of operations. |
2 | | Based on average shares outstanding. |
3 | | The per share amount of realized and unrealized gain (loss) on investments does not accord with the amounts reported in the Statements of Changes in Net Assets due to the timing of creation of Fund shares in relation to fluctuating market values. |
4 | | Net Asset Value Total Return is calculated assuming an initial investment made at the net asset value on the first day of the period, reinvestment of dividends and distributions at net asset value during the period, and redemptions at net asset value on the last day of the period. Total return calculated for a period of less than one year is not annualized. |
5 | | The ratios of expenses to average net assets includes tax expense fees of less than 0.01%. |
7 | | The ratios of expenses to average net assets includes interest expense fees of 0.01%. |
8 | | Portfolio turnover excludes the value of portfolio securities received or delivered as a result of in-kind creations or redemptions of the Fund’s capital shares. |
The accompanying notes are an integral part of these financial statements.
72
Financial Highlights (continued)
| | | | Virtus Newfleet Multi-Sector Bond ETF
|
| | | | For the
Year Ended
October 31, 2019
| | For the
Year Ended
October 31, 2018
| | For the
Year Ended
October 31, 2017
| | For the
Year Ended
October 31, 2016
| | For the Period
August 10, 20151
Through
October 31, 2015
|
Per Share Data for a Share Outstanding throughout each period presented:
| | | | | | | | | | | | | | | | | | | | | | |
Net asset value, beginning of period | | | | $ | 23.85 | | | $ | 25.84 | | | $ | 25.96 | | | $ | 25.09 | | | $ | 25.00 | |
Investment operations:
| | | | | | | | | | | | | | | | | | | | | | |
Net investment income2 | | | | | 1.06 | | | | 1.12 | | | | 1.09 | | | | 0.95 | | | | 0.05 | |
Net realized and unrealized gain (loss) | | | | | 0.74 | | | | (1.51 | ) | | | 0.22 | | | | 0.85 | | | | 0.07 | |
Total from investment operations | | | | | 1.80 | | | | (0.39 | ) | | | 1.31 | | | | 1.80 | | | | 0.12 | |
| |
Less Distributions from:
| | | | | | | | | | | | | | | | | | | | | | |
Net investment income | | | | | (1.02 | ) | | | (1.15 | ) | | | (1.10 | ) | | | (0.93 | ) | | | (0.03 | ) |
Net realized gains | | | | | — | | | | (0.45 | ) | | | (0.33 | ) | | | — | | | | — | |
Return of capital | | | | | (0.09 | ) | | | — | | | | — | | | | — | | | | — | |
Total distributions | | | | | (1.11 | ) | | | (1.60 | ) | | | (1.43 | ) | | | (0.93 | ) | | | (0.03 | ) |
Net Asset Value, End of period | | | | $ | 24.54 | | | $ | 23.85 | | | $ | 25.84 | | | $ | 25.96 | | | $ | 25.09 | |
Net Asset Value Total Return3 | | | | | 7.74 | % | | | (1.62 | )% | | | 5.26 | % | | | 7.37 | % | | | 0.47 | % |
Net assets, end of period (000’s omitted) | | | | $ | 24,535 | | | $ | 98,959 | | | $ | 169,284 | | | $ | 167,474 | | | $ | 153,035 | |
| |
RATIOS/SUPPLEMENTAL DATA:
| | | | | | | | | | | | | | | | | | | | | | |
Ratios to Average Net Assets:
| | | | | | | | | | | | | | | | | | | | | | |
Expenses, net of expense waivers | | | | | 0.80 | % | | | 0.80 | % | | | 0.80 | % | | | 0.80 | %4 | | | 0.80 | %5 |
Expenses, prior to expense waivers | | | | | 1.06 | % | | | 0.86 | % | | | 0.84 | % | | | 0.91 | %4 | | | 0.99 | %5 |
Net investment income | | | | | 4.37 | % | | | 4.51 | % | | | 4.26 | % | | | 3.75 | % | | | 0.88 | %5 |
Portfolio turnover rate6 | | | | | 95 | % | | | 82 | % | | | 113 | % | | | 100 | % | | | 20 | %7 |
1 | | Commencement of operations. |
2 | | Based on average shares outstanding. |
3 | | Net Asset Value Total Return is calculated assuming an initial investment made at the net asset value on the first day of the period, reinvestment of dividends and distributions at net asset value during the period, and redemptions at net asset value on the last day of the period. Total return calculated for a period of less than one year is not annualized. |
4 | | The ratios of expenses to average net assets includes tax expense fees of less than 0.01%. |
6 | | Portfolio turnover excludes the value of portfolio securities received or delivered as a result of in-kind creations or redemptions of the Fund’s capital shares. |
The accompanying notes are an integral part of these financial statements.
73
Financial Highlights (continued)
| | | | Virtus Private
Credit Strategy ETF
|
| | | | For the Period
February 7, 20191
Through
October 31, 2019
|
Per Share Data for a Share Outstanding throughout the period presented:
| | | | | | |
Net asset value, beginning of period | | | | $ | 24.85 | |
Investment operations:
| | | | | | |
Net investment income2 | | | | | 1.70 | |
Net realized and unrealized loss | | | | | (0.45 | ) |
Total from investment operations | | | | | 1.25 | |
| |
Less Distributions from:
| | | | | | |
Net investment income | | | | | (1.38 | ) |
Total distributions | | | | | (1.38 | ) |
Net Asset Value, End of period | | | | $ | 24.72 | |
Net Asset Value Total Return3 | | | | | 5.03 | % |
Net assets, end of period (000’s omitted) | | | | $ | 211,344 | |
| |
RATIOS/SUPPLEMENTAL DATA:
| | | | | | |
Ratios to Average Net Assets:
| | | | | | |
Expenses | | | | | 0.75 | %4 |
Net investment income | | | | | 9.24 | %4 |
Portfolio turnover rate5 | | | | | 22 | %6 |
1 | | Commencement of operations. |
2 | | Based on average shares outstanding. |
3 | | Net Asset Value Total Return is calculated assuming an initial investment made at the net asset value on the first day of the period, reinvestment of dividends and distributions at net asset value during the period, and redemptions at net asset value on the last day of the period. Total return calculated for a period of less than one year is not annualized. |
5 | | Portfolio turnover excludes the value of portfolio securities received or delivered as a result of in-kind creations or redemptions of the Fund’s capital shares. |
The accompanying notes are an integral part of these financial statements.
74
Financial Highlights (continued)
| | | | Virtus Real Asset
Income ETF
|
| | | | For the Period
February 7, 20191
Through
October 31, 2019
|
Per Share Data for a Share Outstanding throughout the period presented:
| | | | | | |
Net asset value, beginning of period | | | | $ | 24.79 | |
Investment operations:
| | | | | | |
Net investment income2 | | | | | 0.58 | |
Net realized and unrealized loss | | | | | (0.12 | ) |
Total from investment operations | | | | | 0.46 | |
| |
Less Distributions from:
| | | | | | |
Net investment income | | | | | (0.53 | ) |
Total distributions | | | | | (0.53 | ) |
Net Asset Value, End of period | | | | $ | 24.72 | |
Net Asset Value Total Return3 | | | | | 1.87 | % |
Net assets, end of period (000’s omitted) | | | | $ | 244,751 | |
| |
RATIOS/SUPPLEMENTAL DATA:
| | | | | | |
Ratios to Average Net Assets:
| | | | | | |
Expenses | | | | | 0.55 | %4 |
Net investment income | | | | | 3.20 | %4 |
Portfolio turnover rate5 | | | | | 15 | %6 |
1 | | Commencement of operations. |
2 | | Based on average shares outstanding. |
3 | | Net Asset Value Total Return is calculated assuming an initial investment made at the net asset value on the first day of the period, reinvestment of dividends and distributions at net asset value during the period, and redemptions at net asset value on the last day of the period. Total return calculated for a period of less than one year is not annualized. |
5 | | Portfolio turnover excludes the value of portfolio securities received or delivered as a result of in-kind creations or redemptions of the Fund’s capital shares. |
The accompanying notes are an integral part of these financial statements.
75
Financial Highlights (continued)
| | | | Virtus WMC Global Factor Opportunities ETF
|
| | | | For the
Year Ended
October 31, 2019
| | For the
Year Ended
October 31, 2018
| | For the Period
October 10, 20171
Through
October 31, 2017
|
Per Share Data for a Share Outstanding throughout each period presented:
| | | | | | | | | | | | | | |
Net asset value, beginning of period | | | | $ | 24.97 | | | $ | 25.10 | | | $ | 25.00 | |
Investment operations:
| | | | | | | | | | | | | | |
Net investment income2 | | | | | 0.52 | | | | 0.50 | | | | 0.01 | |
Net realized and unrealized gain (loss) | | | | | 1.95 | | | | (0.53 | ) | | | 0.09 | |
Total from investment operations | | | | | 2.47 | | | | (0.03 | ) | | | 0.10 | |
| |
Less Distributions from:
| | | | | | | | | | | | | | |
Net investment income | | | | | (0.49 | ) | | | (0.10 | ) | | | — | |
Net realized gains | | | | | (0.54 | ) | | | — | | | | — | |
Total distributions | | | | | (1.03 | ) | | | (0.10 | ) | | | — | |
Net Asset Value, End of period | | | | $ | 26.41 | | | $ | 24.97 | | | $ | 25.10 | |
Net Asset Value Total Return3 | | | | | 10.60 | % | | | (0.11 | )% | | | 0.38 | % |
Net assets, end of period (000’s omitted) | | | | $ | 5,281 | | | $ | 4,995 | | | $ | 5,019 | |
| |
RATIOS/SUPPLEMENTAL DATA:
| | | | | | | | | | | | | | |
Ratios to Average Net Assets:
| | | | | | | | | | | | | | |
Expenses | | | | | 0.49 | %4 | | | 0.49 | %4 | | | 0.49 | %5 |
Net investment income | | | | | 2.08 | % | | | 1.88 | % | | | 0.76 | %5 |
Portfolio turnover rate6 | | | | | 88 | % | | | 80 | % | | | 23 | %7 |
1 | | Commencement of operations. |
2 | | Based on average shares outstanding. |
3 | | Net Asset Value Total Return is calculated assuming an initial investment made at the net asset value on the first day of the period, reinvestment of dividends and distributions at net asset value during the period, and redemptions at net asset value on the last day of the period. Total return calculated for a period of less than one year is not annualized. |
4 | | The ratios of expenses to average net assets includes tax expense fees of less than 0.01%. |
6 | | Portfolio turnover excludes the value of portfolio securities received or delivered as a result of in-kind creations or redemptions of the Fund’s capital shares. |
The accompanying notes are an integral part of these financial statements.
76
Notes to Financial Statements
October 31, 2019
The ETFis Series Trust I (the “Trust”) was organized as a Delaware statutory trust on September 20, 2012 and is registered with the U.S. Securities and Exchange Commission (the “SEC”) as an open-end management investment company under the Investment Company Act of 1940 (the “1940 Act”).
As of October 31, 2019, 11 funds of the Trust are offered for sale. The InfraCap REIT Preferred ETF, Virtus Glovista Emerging Markets ETF, Virtus InfraCap U.S. Preferred Stock ETF, Virtus LifeSci Biotech Clinical Trials ETF, Virtus LifeSci Biotech Products ETF, Virtus Newfleet Multi-Sector Bond ETF, Virtus Private Credit Strategy ETF, Virtus Real Asset Income ETF and Virtus WMC Global Factor Opportunities ETF (each a “Fund” and collectively, the “Funds”), each a separate investment portfolio of the Trust, are presented herein. The offering of each Fund’s shares is registered under the Securities Act of 1933 (the “Securities Act”).
Funds
| | Commencement
of Operations
|
InfraCap REIT Preferred ETF | | February 7, 2017 |
Virtus Glovista Emerging Markets ETF | | November 7, 2017 |
Virtus InfraCap U.S. Preferred Stock ETF | | May 15, 2018 |
Virtus LifeSci Biotech Clinical Trials ETF | | December 16, 2014 |
Virtus LifeSci Biotech Products ETF | | December 16, 2014 |
Virtus Newfleet Multi-Sector Bond ETF | | August 10, 2015 |
Virtus Private Credit Strategy ETF | | February 7, 2019 |
Virtus Real Asset Income ETF | | February 7, 2019 |
Virtus WMC Global Factor Opportunities ETF | | October 10, 2017 |
InfraCap REIT Preferred ETF, Virtus Glovista Emerging Markets ETF, Virtus InfraCap U.S. Preferred Stock ETF, Virtus Private Credit Strategy ETF and Virtus Real Asset Income ETF are “non-diversified” Funds, as defined under the 1940 Act, as of the fiscal year ended October 31, 2019.
The Funds have the following investment objectives:
InfraCap REIT Preferred ETF seeks investment results that correspond, before fees and expenses, to the price and yield performance of the Indxx REIT Preferred Stock Index.
Virtus Glovista Emerging Markets ETF seeks investment results that correspond, before fees and expenses, to the price and yield performance of the Solactive Most Favored Nations Emerging Market Index.
Virtus InfraCap U.S. Preferred Stock ETF seeks current income and, secondarily, capital appreciation.
Virtus LifeSci Biotech Clinical Trials ETF and Virtus LifeSci Biotech Products ETF seek investment results that correspond, before fees and expenses, to the price and yield performance of the LifeSci Biotechnology Clinical Trials Index and LifeSci Biotechnology Products Index, respectively.
Virtus Newfleet Multi-Sector Bond ETF seeks to provide a high level of current income and, secondarily, capital appreciation.
Virtus Private Credit Strategy ETF seeks investment results that correspond, before fees and expenses, to the price and yield performance of the Indxx Private Credit Index.
Virtus Real Asset Income ETF seeks investment results that correspond, before fees and expenses, to the price and yield performance of the Indxx Real Asset Income Index.
Virtus WMC Global Factor Opportunities ETF seeks capital appreciation. There is no guarantee that a Fund will achieve its objective(s).
2. SIGNIFICANT ACCOUNTING POLICIES
Each Fund is an investment company and accordingly follows the investment company accounting and reporting guidance of the Financial Accounting Standards Board (FASB) Accounting Standard Codification Topic 946 Financial Services — Investment Companies. Each Fund prepares its financial statements in accordance with generally accepted accounting principles (“GAAP”) in the United States of America and follows the significant accounting policies described below.
(a) Use of Estimates
Management makes certain estimates and assumptions that affect the reported amounts of assets and liabilities and disclosure of contingent assets and liabilities at the date of the financial statements and reported amounts of increases and decreases in the net assets from operations during the reporting period. Actual results could differ from those estimates.
77
Notes to Financial Statements (continued)
October 31, 2019
(b) Indemnification
In the normal course of business, the Funds may enter into contracts that contain a variety of representations which provide general indemnifications for certain liabilities. The Funds’ maximum exposure under these arrangements is unknown. However, the Funds have not had prior claims or losses pursuant to these contracts and expect the risk of loss to be remote.
(c) Security Valuation
A description of the valuation techniques applied to the Funds’ major categories of assets and liabilities measured at fair value on a recurring basis is as follows:
Equity securities and Exchange-Traded Funds are valued at the official closing price (typically last sale) on the exchange on which the securities are primarily traded. Securities regularly traded in an over the counter market are valued at the latest quoted sale price in such market or in the case of the New York Stock Exchange (“NYSE”), at the NYSE Official Closing Price. Such valuations are typically categorized as Level 1 in the fair value hierarchy. If market quotations are not readily available, or if it is determined that a quotation of a security does not represent fair value, then the security is valued at fair value as determined in good faith using procedures adopted by the Trust’s Board of Trustees (the “Board”). Such valuations are typically categorized as Level 2 or Level 3 in the fair value hierarchy.
Debt securities, including restricted securities, are valued based on evaluated quotations received from independent pricing services or from dealers who make markets in such securities. For most bond types, the pricing service utilizes matrix pricing that considers one or more of the following factors: yield or price of bonds of comparable quality, coupon, maturity, current cash flows, type, and current day trade information, as well as dealer-supplied prices. Such valuations are typically categorized as Level 2 in the fair value hierarchy. Debt securities that are not widely traded, are illiquid, or are internally fair valued using procedures adopted by the Board are generally categorized as Level 3 in the fair value hierarchy.
Listed derivatives, such as options, that are actively traded are valued based on quoted prices from the exchange and are categorized as Level 1 in the hierarchy. Over-the-counter derivative contracts, which include options, do not require material subjectivity as pricing inputs are observed from actively quoted markets and are categorized as Level 2 in the hierarchy.
Investments in other open-end investment companies are valued based on their net asset value each business day. Investments in closed-end funds are valued as of the close of regular trading on the NYSE each business day. Each is categorized as Level 1 in the fair value hierarchy.
(d) Fair Value Measurement
Accounting Standards Codification, Fair Value Measurements and Disclosures (“ASC 820”) defines fair value, establishes a framework for measuring fair value in accordance with GAAP, and requires disclosure about fair value measurements. It also provides guidance on determining when there has been a significant decrease in the volume and level of activity for an asset or liability, when a transaction is not orderly, and how that information must be incorporated into fair value measurement. Under ASC 820, various inputs are used in determining the value of the Funds’ investments. These inputs are summarized in the following hierarchy:
• | | Level 1 — Unadjusted quoted prices in active markets for identical assets or liabilities that the Funds have the ability to access. |
• | | Level 2 — Observable inputs other than quoted prices included in Level 1 that are observable for the asset or liability, either directly or indirectly. These inputs may include quoted prices for the identical instrument on an inactive market, prices for similar securities, interest rates, prepayment speeds, credit risk, yield curves, default rates and similar data. |
• | | Level 3 — Unobservable inputs for the asset or liability, to the extent relevant observable inputs are not available; representing the Funds’ own assumptions about the assumptions a market participant would use in valuing the asset or liability, and would be based on the best information available. |
The inputs or methodology used for valuing securities are not necessarily an indication of the risk associated with investing in those securities. The hierarchy classification of inputs used to value each Fund’s investments at October 31, 2019, is disclosed at the end of each Fund’s Schedule of Investments.
(e) Security Transactions and Investment Income
Security transactions are accounted for on the trade date. Realized gains and losses on sales of investment securities are calculated using specific identification. Dividend income is recognized on the ex-dividend date. Expenses and interest income are recognized on the accrual basis. Amortization of premium and accretion of discount on debt securities are included in interest income. Each Fund amortizes premiums and accretes discounts using the effective interest method.
Dividend income from REIT investments is recorded using management’s estimate of the income included in distributions received from the REIT investments. Distributions received in excess of this estimated amount are recorded as a reduction of the cost of investments
78
Notes to Financial Statements (continued)
October 31, 2019
or reclassified to capital gains. The actual amounts of income, return of capital, and capital gains are only determined by each domestic REIT after its fiscal year-end, and may differ from the estimated amounts.
(f) Foreign Taxes
Certain Funds may be subject to foreign taxes on income, gains on investments or currency repatriation, a portion of which may be recoverable. Each Fund will accrue such taxes and recoveries as applicable based upon current interpretations of the tax rules and regulations that exist in the markets in which it invests.
(g) Expenses
Each Fund pays all of its expenses not assumed by its Sub-Adviser, if any, as defined in Note 3, or the Adviser. General Trust expenses that are allocated among and charged to the assets of the Funds and other series of the Trust are done so on a basis that the Board deems fair and equitable, which may be on a basis of relative net assets of each Fund and other series of the Trust or the nature of the services performed and relative applicability to each Fund and other series of the Trust.
(h) Short Sales
The Virtus InfraCap U.S. Preferred Stock ETF may sell securities short. A short sale is a transaction in which the Fund sells a security it does not own in anticipation of a decline in market price. To sell a security short, the Fund must borrow the security. The Fund’s obligation to replace the security borrowed and sold short will be fully collateralized at all times by the proceeds from the short sale retained by the broker and by cash and securities deposited in a segregated account with the Fund’s custodian. If the price of the security sold short increases between the time of the short sale and the time the Fund replaces the borrowed security, the Fund will realize a loss, and if the price declines during the period, the Fund will realize a gain. Any realized gain will be decreased, and any realized loss increased, by the amount of transaction costs. On the ex-dividend date, dividends on short sales are recorded as an expense to the Fund.
In accordance with the terms of its prime brokerage agreement, the Fund may receive rebate income or be charged a fee on borrowed securities which is reported as “Interest Expense” on the Statement of Operations. Such income or fee is calculated on a daily basis based upon the market value of each borrowed security and a variable rate that is dependent upon the availability of such security.
(i) Distributions to Shareholders
Distributions are recorded by the Funds on the ex-dividend date. Income and capital gain distributions are determined in accordance with income tax regulations that may differ from GAAP in the United States of America.
(j) Foreign Currency Translation
Non-U.S. investment securities and other assets and liabilities denominated in foreign currencies are translated into U.S. dollar amounts at the foreign currency exchange rate effective at the end of the reporting period. Cost of investments is translated at the currency exchange rate effective at the trade date. The gain or loss resulting from a change in currency exchange rates between the trade and settlement date of a portfolio transaction is treated as a gain or loss on foreign currency. Likewise, the gain or loss resulting from a change in currency exchange rates between the date the income is accrued and the date it is paid is treated as a gain or loss on foreign currency. The Funds do not isolate that portion of the results of operations arising from changes in foreign exchange rates on investments from the fluctuations arising from changes in the market prices of securities held. Such fluctuations are included with the net realized and unrealized gain or loss on investments.
(k) Loan Agreements
The Virtus Newfleet Multi-Sector Bond ETF may invest in direct debt instruments which are interests in amounts owed by a corporate, governmental, or other borrower to lenders or lending syndicates. Loan agreements are generally non-investment grade and often involve borrowers that are highly leveraged. The Fund may invest in obligations of borrowers who are in bankruptcy proceedings. Loan agreements are typically senior in the corporate capital structure of the borrower. A loan is often administered by a bank or other financial institution (the “lender”) that acts as agent for all holders. The lender administers the terms of the loan, as specified in the loan agreement. The Fund’s investments in loans may be in the form of participations in loans or assignments of all or a portion of loans from third parties. When investing in loan participations, the Fund has the right to receive payments of principal, interest and any fees to which it is entitled only from the lender selling the loan participation and only upon receipt by the lender of payments from the borrower. The Fund generally has no right to enforce compliance with the terms of the loan agreement with the borrower. As a result, the Fund may be subject to the credit risk of both the borrower and the lender that is selling the loan agreement. When the Fund purchases assignments from lenders, it acquires direct rights against the borrower on the loan.
79
Notes to Financial Statements (continued)
October 31, 2019
The Fund may invest in multiple series or tranches of a loan, which may have varying terms and carry different associated risks. Loan agreements may involve foreign borrowers, and investments may be denominated in foreign currencies. Direct indebtedness of emerging countries involves a risk that the government entities responsible for the repayment of the debt may be unable, or unwilling, to pay the principal and interest when due.
The loan agreements have floating rate loan interests which generally pay interest at rates that are periodically determined by reference to a base lending rate plus a premium. The base lending rates are generally LIBOR (London Interbank Offered Rate), the prime rate offered by one or more U.S. banks or the certificate of deposit rate. When a loan agreement is purchased, the Fund may pay an assignment fee. On an ongoing basis, the Fund may receive a commitment fee based on the undrawn portion of the underlying line of credit portion of a loan agreement. Prepayment penalty fees are received upon the prepayment of a loan agreement by a borrower. Prepayment penalty, facility, commitment, consent and amendment fees are recorded to income as earned or paid.
(l) Securities Lending
Certain Funds may loan securities to qualified brokers through an agreement with The Bank of New York Mellon (“BNY Mellon”), as a third party lending agent. Under the terms of the agreement, a Fund doing so is required to maintain collateral with a market value not less than 102% of the market value of loaned securities. Collateral is adjusted daily in connection with changes in the market value of securities on loan. Collateral may consist of cash and securities issued by the U.S. Government or its agencies. Cash collateral is invested in a short-term money market fund. Dividends earned on the collateral and premiums paid by the broker are recorded as income by a Fund net of fees and rebates charged by BNY Mellon for its services as securities lending agent and in connection with this securities lending program. Lending portfolio securities involves a risk of delay in the recovery of the loaned securities or in the declining value of the collateral.
At October 31, 2019, the following Funds had securities on loan:
Funds
| | Market
Value
| | Cash
Collateral
| | Non Cash
Collateral(a)
| | Net Amount
|
Virtus LifeSci Biotech Clinical Trials ETF | | | $6,713,301 | | | $3,114,419 | | | $3,598,882 | | $0 | |
Virtus LifeSci Biotech Products ETF | | | 7,679,255 | | | 1,719,938 | | | 5,959,317 | | 0 |
Virtus Private Credit Strategy ETF | | | 10,966,263 | | | 9,173,194 | | | 1,793,069 | | 0 |
Virtus Real Asset Income ETF | | | 14,927,010 | | | 9,799,466 | | | 5,127,544 | | 0 |
(a) | | Collateral received in excess of the market value of securities on loan is not presented in this table. The total non cash collateral is disclosed in the Fund’s Schedule of Investments. |
Funds not listed in table above did not have any securities on loan at October 31, 2019.
80
Notes to Financial Statements (continued)
October 31, 2019
The following table presents the contract value of securities lending transactions and the type of collateral provided to counterparties.
Remaining Contractual Maturity of the Agreements, as of October 31, 2019
| | Overnight and | | Between
| | |
| | Continuous
| | <30 Days
| | 30 & 90 days
| | >90 days
| | Total
|
Virtus LifeSci Biotech Clinical Trials ETF
| | | | | | | | | | | | | | | | | | |
Securities Lending Transactions
| | | | | | | | | | | | | | | | | | |
| Common Stocks | | $ | 7,076,713 | | | $ | — | | | $ | — | | | $ | — | | | $ 7,076,713 |
Gross amount of recognized liabilities for securities lending transactions:
| | | | | | | | | | | | | | | | | | $ 7,076,713 |
Virtus LifeSci Biotech Products ETF
| | | | | | | | | | | | | | | | | | |
Securities Lending Transactions
| | �� | | | | | | | | | | | | | | | | |
| Common Stocks | | $ | 7,998,030 | | | $ | — | | | $ | — | | | $ | — | | | $ 7,998,030 |
Gross amount of recognized liabilities for securities lending transactions:
| | | | | | | | | | | | | | | | | | $ 7,998,030 |
Virtus Private Credit Strategy ETF
| | | | | | | | | | | | | | | | | | |
Securities Lending Transactions
| | | | | | | | | | | | | | | | | | |
| Common Stocks | | $ | 11,310,724 | | | $ | — | | | $ | — | | | $ | — | | | $11,310,724 |
Gross amount of recognized liabilities for securities lending transactions:
| | | | | | | | | | | | | | | | | | $11,310,724 |
Virtus Real Asset Income ETF
| | | | | | | | | | | | | | | | | | |
Securities Lending Transactions
| | | | | | | | | | | | | | | | | | |
| Common Stocks | | $ | 15,344,760 | | | $ | — | | | $ | — | | | $ | — | | | $15,344,760 |
Gross amount of recognized liabilities for securities lending transactions:
| | | | | | | | | | | | | | | | | | $15,344,760 |
3. INVESTMENT MANAGEMENT RELATED PARTIES AND OTHER AGREEMENTS
Investment Advisory Agreements
The Trust has entered into Investment Advisory Agreements (collectively, “Advisory Agreement”) with Virtus ETF Advisers LLC (the “Adviser”) an indirect wholly owned subsidiary of Virtus Investment Partners, Inc. (Ticker: VRTS) (together with its affiliates, “Virtus”). Pursuant to the Advisory Agreement, the Adviser has overall supervisory responsibility for the general management and investment of the Funds’ securities portfolios. The Adviser has agreed to pay all of the ordinary operating expenses of the Virtus Glovista Emerging Markets ETF, Virtus LifeSci Biotech Clinical Trials ETF, Virtus LifeSci Biotech Products ETF, Virtus Private Credit Strategy ETF, Virtus Real Asset Income ETF, and Virtus WMC Global Factor Opportunities ETF, except for each Fund’s management fee; payments under any 12b-1 plan; taxes and other governmental fees; brokerage fees, commissions and other transaction expenses; interest and other costs of borrowing; litigation or arbitration expenses; acquired fund fees and expenses; and extraordinary or other non-routine expenses of the Funds. The Adviser is entitled to receive a fee from each Fund (unless otherwise noted below) based on each Fund’s average daily net assets, computed and accrued daily and payable monthly, at an annual rate as follows:
Funds
| | Rate
|
InfraCap REIT Preferred ETF | | 0.45%, subject to a minimum annual fee of $25,000 per year |
Virtus Glovista Emerging Markets ETF | | 0.68% |
Virtus InfraCap U.S. Preferred Stock ETF | | 0.80% |
Virtus LifeSci Biotech Clinical Trials ETF | | 0.79% |
Virtus LifeSci Biotech Products ETF | | 0.79% |
Virtus Newfleet Multi-Sector Bond ETF | | 0.70% |
Virtus Private Credit Strategy ETF | | 0.75% |
Virtus Real Asset Income ETF | | 0.55% |
Virtus WMC Global Factor Opportunities ETF | | 0.49% |
The Advisory Agreement may be terminated by the Trust on behalf of a Fund with the approval of a Fund’s Board or by a vote of the majority of a Fund’s shareholders. The Advisory Agreement may also be terminated by the Adviser by not more than 60 days’ nor less than 30 days’ written notice.
Fee Waiver Agreement
The Adviser has contractually agreed to waive a portion of the Virtus Glovista Emerging Markets ETF’s management fee equal to 0.03% of the Fund’s average daily net assets, which will have the effect of reducing acquired fund fees and expenses (the “Fee Waiver Agreement”). Unless the Adviser continues the Fee Waiver Agreement, it will terminate on February 28, 2020.
81
Notes to Financial Statements (continued)
October 31, 2019
Expense Limitation Agreement
The Adviser has contractually agreed to reduce its fees and reimburse expenses in order to limit Virtus Newfleet Multi-Sector Bond ETF’s total operating expenses (excluding interest, taxes, brokerage fees and commissions, other expenditures that are capitalized in accordance with generally accepted accounting principles, acquired fund fees and expenses, other extraordinary expenses not incurred in the ordinary course of the Funds’ business, and amounts, if any, payable pursuant to a plan adopted in accordance with Rule 12b-1 under the 1940 Act) from exceeding 0.80% of the Fund’s average daily net assets through at least February 28, 2020.
The expense limitation agreement with respect to Virtus Newfleet Multi-Sector Bond ETF will be terminated upon termination of the Advisory Agreement between the Adviser and the Fund. In addition, while the Adviser or the Fund may discontinue the expense limitation agreement after the contractual period, it may only be terminated during its term with the approval of the Fund’s Board of Trustees.
Under certain conditions, the Adviser may recapture operating expenses waived or reimbursed under the expense limitation agreement for a period of three years following the date on which such waiver or reimbursement occurred; provided that such recapture may not cause the Fund’s total operating expenses to exceed 0.80% of the average daily net assets of the Fund (or any lower expense limitation or limitations to which the Fund and the Adviser may otherwise agree). All or a portion of the following expenses reimbursed by the Adviser may be recaptured during the fiscal years indicated:
Funds
| | | | 2020
| | 2021
| | 2022
|
Virtus Glovista Emerging Markets ETF | | | | $ | — | | | $ | 5,983 | | | $ | 3,018 | |
Virtus Newfleet Multi-Sector Bond ETF | | | | | 83,625 | | | | 81,340 | | | | 135,034 | |
Sub-Advisory Agreement
Each Sub-Adviser provides investment advice and management services to its respective Fund. Pursuant to an investment sub-advisory agreement among the Trust, the respective Sub-Adviser and the Adviser, the Adviser pays each Fund’s Sub-Adviser a sub-advisory fee calculated as shown below. The Adviser has delegated to the InfraCap REIT Preferred ETF and Virtus InfraCap U.S. Preferred Stock ETF’s sub-adviser the obligation to pay all of the ordinary operating expenses of each of those Funds, except for the management fee paid to the Adviser; payments under any 12b-1 plan adopted by the Fund; taxes and other governmental fees; brokerage fees, commissions and other transaction expenses; interest and other costs of borrowing; litigation or arbitration expenses; acquired fund fees and expenses; and extraordinary or other non-routine expenses of the Fund. The Sub-Advisers and sub-advisory fees for each Fund are listed below.
Funds
| | Sub-Advisers
| | Sub-Advisory Fees
|
InfraCap REIT Preferred ETF | | Infrastructure Capital Advisors, LLC | | 0.375%* |
Virtus Glovista Emerging Markets ETF | | Glovista Investments LLC | | 60% of the net advisory fee*+ |
Virtus InfraCap U.S. Preferred Stock ETF | | Infrastructure Capital Advisors, LLC | | 0.66%* |
Virtus Newfleet Multi-Sector Bond ETF | | Newfleet Asset Management, LLC(1) | | 50% of the net advisory fee*++ |
Virtus WMC Global Factor Opportunities ETF | | Wellington Management Company LLP | | 0.21%* |
(1) | | An indirect wholly owned subsidiary of Virtus. |
* | | InfraCap REIT Preferred ETF, Virtus Glovista Emerging Markets ETF, Virtus InfraCap U.S. Preferred Stock ETF, Virtus Newfleet Multi-Sector Bond ETF and Virtus WMC Global Factor Opportunities ETF’s sub-advisory fees are paid for by the Adviser, not the Funds. |
+ | | Net advisory fee: The advisory fee paid by the Fund to the Adviser for investment advisory services under the Adviser’s investment advisory agreement with the Fund, after deducting the payment of all of the ordinary operating expenses of the Fund under the Adviser’s unified fee arrangement. In the event that the Adviser waives all or a portion of its fee pursuant to an applicable waiver agreement, then the Sub-Adviser will waive its fee in the same proportion as the Adviser. |
++ | | Net advisory fee: In the event the Adviser waives its entire fee and also assumes expenses of the Trust pursuant to an applicable expense limitation agreement, the Sub-Adviser will similarly waive its entire fee and will share in the expense assumption by promptly paying to the Adviser (or its designee) 50% of the assumed amount. If during the term of the Sub-Advisory Agreement the Adviser later recaptures some or all of fees waived or expenses reimbursed by the Adviser and the Sub-Adviser together, then the Adviser will pay to the Sub-Adviser 50% of the amount recaptured. |
Principal Underwriter
Pursuant to the terms of a Distribution Agreement with the Trust, VP Distributors, LLC (the “Distributor”) serves as the Funds’ principal underwriter. The Distributor receives compensation from the Adviser for the statutory underwriting services it provides to the Funds. The Distributor will not distribute shares in less than Creation Units (as hereinafter defined), and does not maintain a secondary market in shares. The shares are traded in the secondary market. The Distributor is an indirect wholly-owned subsidiary of Virtus.
Distribution and Service (12b-1 Plan)
The Board of Trustees has adopted a distribution and service plan, under which InfraCap REIT Preferred ETF, Virtus Glovista Emerging Markets ETF, Virtus InfraCap U.S. Preferred Stock ETF, Virtus LifeSci Biotech Clinical Trials ETF, Virtus LifeSci Biotech Products ETF, Virtus Private Credit Strategy ETF, Virtus Real Asset Income ETF, and Virtus WMC Global Factor Opportunities ETF (collectively, the “12b-1 Funds”) are authorized to pay an amount up to 0.25% of their average daily net assets each year to finance activities primarily intended to
82
Notes to Financial Statements (continued)
October 31, 2019
result in the sale of Creation Units of the 12b-1 Funds or the provision of investor services. No 12b-1 fees are currently paid by the 12b-1 Funds and there are no current plans to impose these fees.
Operational Administrator
Virtus ETF Solutions LLC (the “Administrator”) serves as the Funds’ operational administrator. The Administrator supervises the overall administration of the Trust and the Funds including, among other responsibilities, the coordination and day-to-day oversight of the Funds’ operations, the service providers’ communications with the Funds and each other and assistance with Trust, Board and contractual matters related to the Funds and other series of the Trust. The Administrator also provides persons satisfactory to the Board to serve as officers of the Trust. The Administrator is an indirect wholly-owned subsidiary of Virtus.
Accounting Services Administrator, Custodian and Transfer Agent
The Bank of New York Mellon (“BNY Mellon”) provides administrative, accounting, tax and financial reporting for the maintenance and operations of the Trust as the Funds’ accounting services administrator. BNY Mellon also serves as the custodian for the Funds’ assets, and serves as transfer agent and dividend paying agent for the Funds.
Affiliated Shareholders
At October 31, 2019, Virtus Partners, Inc. held shares of Virtus WMC Global Factor Opportunities ETF which may be sold at any time that aggregated to the following:
| | | | Shares
| | % of shares
outstanding
|
Virtus WMC Global Factor Opportunities ETF | | | | | 184,503 | | | | 92.3 | % |
At October 31, 2019, the respective sub-adviser of the below Funds held shares of such Fund which may be redeemed at any time that aggregated to the following:
| | | | Shares
| | % of shares
outstanding
|
InfraCap REIT Preferred ETF | | | | | 101,525 | | | | 6.8 | % |
Virtus InfraCap U.S. Preferred Stock ETF | | | | | 198,084 | | | | 5.9 | % |
4. CREATION AND REDEMPTION TRANSACTIONS
The Funds issue and redeem shares on a continuous basis at Net Asset Value (“NAV”) in groups of 50,000 shares called “Creation Units.” The Funds’ Creation Units may be issued and redeemed generally for cash or an in-kind deposit of securities held by the Funds. In each instance of cash creations or redemptions, the Trust may impose transaction fees based on transaction expenses related to the particular exchange that will be higher than the transaction fees associated with in-kind purchases or redemptions. Only “Authorized Participants” who have entered into contractual arrangements with the Distributor may purchase or redeem shares directly from the Funds. An Authorized Participant is either (i) a broker-dealer or other participant in the clearing process through the Continuous Net Settlement System of the National Securities Clearing Corporation or (ii) a DTC participant and, in each case, must have executed a Participant Agreement with the Distributor. Most retail investors will not qualify as Authorized Participants or have the resources to buy and sell whole Creation Units. Therefore, they will be unable to purchase or redeem the shares directly from the Funds. Rather, most retail investors will purchase shares in the secondary market with the assistance of a broker and will be subject to customary brokerage commissions or fees.
5. FEDERAL INCOME TAX
Each Fund intends to qualify as a “regulated investment company” under Sub-chapter M of the Internal Revenue Code of 1986 (the “Code”), as amended. Each Fund intends to distribute substantially all of its net investment income and net capital gains to shareholders. Therefore, no federal income or excise tax provision is required.Accounting for Uncertainty in Income Taxes as issued by the Financial Accounting Standards Board provides guidance for how uncertain tax positions should be recognized, measured, presented and disclosed in the financial statements, and requires the evaluation of tax positions taken or expected to be taken in the course of preparing a Fund’s tax returns to determine whether the tax positions are “more-likely-than-not” of being sustained by the applicable tax authority. Tax positions not deemed to meet the more-likely-than-not threshold would be recorded as a tax benefit or expense in the current year. Interest and penalties related to income taxes would be recorded as income tax expense. Management of the Funds is required to analyze all open tax years (2016, 2017 and 2018), as defined by IRS statute of limitations, for all major jurisdictions, including federal tax authorities and certain state tax authorities. As of October 31, 2019, the Funds did not have a liability for any unrecognized tax benefits. The Funds have no examination in progress and are not aware of any tax positions for which it is reasonably possible that the amounts of unrecognized tax benefits will significantly change in the next twelve months.
83
Notes to Financial Statements (continued)
October 31, 2019
The Funds recognize interest accrued related to unrecognized tax benefits and penalties as income tax expense. For the year ended October 31, 2019, the Funds had no accrued penalties or interest.
At October 31, 2019, the adjusted cost basis of investments and gross unrealized appreciation and depreciation of investments for federal income tax purposes were as follows:
| | Federal Tax Cost
Of Investments
| | Gross
Unrealized
Appreciation
| | Gross
Unrealized
Depreciation
| | Net Unrealized
Appreciation
(Depreciation)
|
InfraCap REIT Preferred ETF | | $ | 36,616,672 | | | $ | 1,059,573 | | | $ | (211,416 | ) | | $ | 848,157 | |
Virtus Glovista Emerging Markets ETF | | | 6,960,538 | | | | 579,865 | | | | (837,791 | ) | | | (257,926 | ) |
Virtus InfraCap U.S. Preferred Stock ETF | | | 108,717,740 | | | | 2,285,413 | | | | (870,753 | ) | | | 1,414,660 | |
Virtus LifeSci Biotech Clinical Trials ETF | | | 34,180,833 | | | | 3,256,098 | | | | (10,628,860 | ) | | | (7,372,762 | ) |
Virtus LifeSci Biotech Products ETF | | | 35,680,088 | | | | 2,517,302 | | | | (10,345,259 | ) | | | (7,827,957 | ) |
Virtus Newfleet Multi-Sector Bond ETF | | | 23,967,862 | | | | 807,943 | | | | (484,787 | ) | | | 323,156 | |
Virtus Private Credit Strategy ETF | | | 225,399,244 | | | | 3,459,927 | | | | (11,748,365 | ) | | | (8,288,438 | ) |
Virtus Real Asset Income ETF | | | 257,100,060 | | | | 13,531,221 | | | | (20,614,556 | ) | | | (7,083,335 | ) |
Virtus WMC Global Factor Opportunities ETF | | | 4,963,777 | | | | 563,037 | | | | (270,939 | ) | | | 292,098 | |
At October 31, 2019, the components of accumulated earnings/loss on a tax-basis were as follows:
| | Undistributed
Ordinary
Income
| | Accumulated
Capital
and Other
Gain (Loss)
| | Net Unrealized
Appreciation
(Depreciation)
| | Total
Accumulated
Earnings (Loss)
|
InfraCap REIT Preferred ETF | | $ | — | | | $ | (717,849 | ) | | $ | 848,157 | | | $ | 130,308 | |
Virtus Glovista Emerging Markets ETF | | | 1,869 | | | | (3,128,283 | ) | | | (263,824 | ) | | | (3,390,238 | ) |
Virtus InfraCap U.S. Preferred Stock ETF | | | 1,383,424 | | | | 168,001 | | | | 1,335,796 | | | | 2,887,221 | |
Virtus LifeSci Biotech Clinical Trials ETF | | | — | | | | (26,075,065 | ) | | | (7,372,762 | ) | | | (33,447,827 | ) |
Virtus LifeSci Biotech Products ETF | | | — | | | | (7,112,898 | ) | | | (7,827,957 | ) | | | (14,940,855 | ) |
Virtus Newfleet Multi-Sector Bond ETF | | | — | | | | (3,476,181 | ) | | | 323,105 | | | | (3,153,076 | ) |
Virtus Private Credit Strategy ETF | | | 1,374,152 | | | | (1,410,992 | ) | | | (8,288,438 | ) | | | (8,325,278 | ) |
Virtus Real Asset Income ETF | | | — | | | | (902,675 | ) | | | (7,083,335 | ) | | | (7,986,010 | ) |
Virtus WMC Global Factor Opportunities ETF | | | 95,379 | | | | (106,552 | ) | | | 292,194 | | | | 281,021 | |
Ordinary losses incurred after December 31 (“Late Year Ordinary Losses”) within the taxable year are deemed to arise on the first business day of the Funds’ next taxable year. During the fiscal year ended October 31, 2019, the following Funds incurred and elected to defer Late Year Ordinary Losses as follows:
Virtus LifeSci Biotech Clinical Trials ETF | $ | 105,350 | |
Virtus LifeSci Biotech Products ETF | | 136,985 | |
The tax character of distributions paid during the periods ended October 31, 2019 and October 31, 2018 were as follows:
| | | 2019
| | 2018
|
| | | Distributions
Paid From
Ordinary
Income
| | Return
of Capital
| | Distributions
Paid From
Long-Term
Capital Gains
| | Distributions
Paid From
Ordinary
Income
| | Return
of Capital
| | Distributions
Paid From
Long-Term
Capital Gains
|
InfraCap REIT Preferred ETF | | | $ | 1,369,330 | | | $ | 249,926 | | | $ | — | | | $ | 1,137,316 | | | $ | 218,190 | | | $ | — | |
Virtus Glovista Emerging Markets ETF | | | | 670,109 | | | | — | | | | — | | | �� | 51,696 | | | | — | | | | — | |
Virtus InfraCap U.S. Preferred Stock ETF | | | | 2,935,509 | | | | — | | | | — | | | | 125,816 | | | | — | | | | 7,187 | |
Virtus LifeSci Biotech Clinical Trials ETF | | | | — | | | | — | | | | — | | | | 326,965 | | | | — | | | | — | |
Virtus LifeSci Biotech Products ETF | | | | — | | | | — | | | | — | | | | 68,685 | | | | — | | | | — | |
Virtus Newfleet Multi-Sector Bond ETF | | | | 2,153,039 | | | | 182,502 | | | | — | | | | 7,305,641 | | | | — | | | | 1,863,781 | |
Virtus Private Credit Strategy ETF | | | | 10,417,838 | | | | — | | | | — | | | | — | | | | — | | | | — | |
Virtus Real Asset Income ETF | | | | 4,789,847 | | | | — | | | | — | | | | — | | | | — | | | | — | |
Virtus WMC Global Factor Opportunities ETF | | | | 157,016 | | | | — | | | | 48,016 | | | | 19,408 | | | | — | | | | — | |
84
Notes to Financial Statements (continued)
October 31, 2019
At October 31, 2019, for Federal income tax purposes, the following Funds have capital loss carryforwards available to offset future capital gains for an unlimited period. To the extent that these loss carryforwards are utilized, capital gains so offset will not be distributed to shareholders:
| | | | Short-Term
No Expiration
| | Long-Term
No Expiration
| | Total
|
InfraCap REIT Preferred ETF | | | | $ | 543,978 | | | $ | 173,871 | | | $ | 717,849 | |
Virtus Glovista Emerging Markets ETF | | | | | 2,558,859 | | | | 569,424 | | | | 3,128,283 | |
Virtus InfraCap U.S. Preferred Stock ETF | | | | | — | | | | — | | | | — | |
Virtus LifeSci Biotech Clinical Trials ETF | | | | | 15,489,516 | | | | 10,480,199 | | | | 25,969,715 | |
Virtus LifeSci Biotech Products ETF | | | | | 3,215,227 | | | | 3,760,686 | | | | 6,975,913 | |
Virtus Newfleet Multi-Sector Bond ETF | | | | | 1,052,658 | | | | 2,423,523 | | | | 3,476,181 | |
Virtus Private Credit Strategy ETF | | | | | 1,410,992 | | | | — | | | | 1,410,992 | |
Virtus Real Asset Income ETF | | | | | 902,675 | | | | — | | | | 902,675 | |
Virtus WMC Global Factor Opportunities ETF | | | | | 106,552 | | | | — | | | | 106,552 | |
For financial reporting purposes, capital accounts are adjusted to reflect the tax character of permanent book/tax differences. Results of operations and net assets were not affected by these reclassifications. Reclassifications are primarily due to tax treatment of redemptions in kind. At October 31, 2019, the effect of permanent book/tax reclassifications resulted in increases (decreases) to the components of net assets as follows:
| | | | Distributable
Earnings
(Accumulated
Deficit)
| | Paid-In-Capital
|
InfraCap REIT Preferred ETF | | | | $ | (51,960 | ) | | $ | 51,960 | |
Virtus Glovista Emerging Markets ETF | | | | | (94,615 | ) | | | 94,615 | |
Virtus InfraCap U.S. Preferred Stock ETF | | | | | — | | | | — | |
Virtus LifeSci Biotech Clinical Trials ETF | | | | | (620,124 | ) | | | 620,124 | |
Virtus LifeSci Biotech Products ETF | | | | | (4,547,724 | ) | | | 4,547,724 | |
Virtus Newfleet Multi-Sector Bond ETF | | | | | (740 | ) | | | 740 | |
Virtus Private Credit Strategy ETF | | | | | (626,749 | ) | | | 626,749 | |
Virtus Real Asset Income ETF | | | | | (1,364,371 | ) | | | 1,364,371 | |
Virtus WMC Global Factor Opportunities ETF | | | | | — | | | | — | |
6. INVESTMENT TRANSACTIONS
Purchases and sales of investments (excluding short-term investments), subscription in-kind and redemption in-kind for the year ended October 31, 2019 were as follows:
| | | | Purchases
| | Sales
| | Subscriptions
In-Kind
| Redemptions
In-Kind
| |
InfraCap REIT Preferred ETF | | | | $ | 16,378,523 | | | $ | 16,423,929 | | | $ | 14,987,491 | | $ 1,257,775 | |
Virtus Glovista Emerging Markets ETF | | | | | 11,820,874 | | | | 13,680,283 | | | | — | | 4,879,934 | |
Virtus InfraCap U.S. Preferred Stock ETF | | | | | 64,868,507 | | | | 69,566,540 | | | | 98,048,237 | | — | |
Virtus LifeSci Biotech Clinical Trials ETF | | | | | 19,270,105 | | | | 18,219,983 | | | | 9,048,421 | | 21,032,802 | |
Virtus LifeSci Biotech Products ETF | | | | | 12,636,763 | | | | 12,260,084 | | | | 18,383,797 | | 19,884,460 | |
Virtus Newfleet Multi-Sector Bond ETF | | | | | 45,516,186 | | | | 119,154,758 | | | | — | | — | |
Virtus Private Credit Strategy ETF | | | | | 36,623,374 | | | | 38,812,832 | | | | 233,136,690 | | 13,936,940 | |
Virtus Real Asset Income ETF | | | | | 28,292,308 | | | | 29,294,712 | | | | 261,313,494 | | 10,262,980 | |
Virtus WMC Global Factor Opportunities ETF | | | | | 4,416,894 | | | | 4,517,896 | | | | — | | — | |
7. DERIVATIVE FINANCIAL INSTRUMENTS
Options
The Virtus InfraCap U.S. Preferred Stock ETF may write covered call and put options on portfolio securities and other financial instruments. Premiums received are recorded as liabilities. The liabilities are subsequently adjusted to reflect the current value of the options written. Premiums received from writing options that expire are treated as realized gains. Premiums received from writing options that are exercised or are closed are added to or offset against the proceeds or amount paid on the transactions to determine the net realized gain or loss. By writing a covered call option, the Fund, in exchange for the premium, foregoes the opportunity for capital appreciation
85
Notes to Financial Statements (continued)
October 31, 2019
above the exercise price should the market price of the underlying security increase. By writing a put option, the Fund, in exchange for the premium, accepts the risk of having to purchase a security at an exercise price that is above the current price. Changes in value of written options are reported as change in unrealized gain (loss) on written options in the Statement of Operations. When the written option expires, is terminated or is sold, the Fund will record a gain or loss, which is reported as realized gain (loss) on written options in the Statement of Operations. Written covered call options limit the upside potential of a security above the strike price. Written put options subject the Fund to risk of loss if the value of the security declines below the exercise price minus the put premium.
The Virtus InfraCap U.S. Preferred Stock may purchase call and put options on the portfolio securities or other financial instruments. The Fund may purchase call options to protect against an increase in the price of the security or financial instrument it anticipates purchasing. The Fund may purchase put options on securities which it holds or other financial instruments to protect against a decline in the value of the security or financial instrument or to close out covered written positions. Changes in value of purchased options are reported as part of change in unrealized gain (loss) on investments in the Statement of Operations. When the purchased option expires, is terminated or is sold, the Fund will record a gain or loss, which is reported as part of realized gain (loss) on investments in the Statement of Operations. Risks may arise from an imperfect correlation between the change in market value of the securities held by the Fund and the prices of options relating to the securities purchased or sold by the Fund and from the possible lack of liquid secondary market for an option. The maximum exposure to loss for any purchased option is limited to the premium initially paid for the option.
Transactions in derivative instruments reflected on the Statement of Assets and Liabilities at October 31, 2019, are:
Liabilities
| | | | Equity Risk |
Written options, at value | | | | $228,623 |
Transactions in derivative instruments reflected on the Statement of Operations during the year were as follows:
Net Realized Gain (Loss) on:
| | | | Equity Risk |
Investments* | | | | $ (1,546) |
Written options | | | | 461,188 |
* | | Purchased option contracts are included in Net Realized Gain (Loss) on Investments on the Statement of Operations. |
Change in Net Unrealized Appreciation (Depreciation) on:
| | | | Equity Risk |
Investments** | | | | $989 |
Written options | | | | 11,104 |
** | | Purchased option contracts are included in Change in Net Unrealized Appreciation (Depreciation) on Investments in the Statement of Operations. |
For the year ended October 31, 2019, the monthly average market value of the purchased options and written options contracts held by the Fund were $7,242 and $(81,863), respectively.
8. BORROWINGS
The Virtus InfraCap U.S. Preferred Stock ETF entered into a Lending Agreement (the “Agreement”) with a commercial bank (the “Bank”) that allows the Fund to borrow cash from the Bank. Borrowings under the Agreement are collateralized by investments of the Fund. If the Fund defaults with respect to any of its obligations under the Agreement, the Bank may foreclose on assets of the Fund and/or the Fund may be required to repay immediately, in part or in full, the loan balance outstanding under the Agreement, necessitating the sale of securities at potentially inopportune times. Interest is charged at the 3 Month LIBOR (London Interbank Offered Rate) plus an additional percentage rate on the amount borrowed. The Agreement has an on-demand commitment term. For the year ended October 31, 2019, the average daily borrowings under the Agreement and the daily average interest rate were $6,803,682 and 3.66%, respectively.
At October 31, 2019, the amount of such outstanding borrowings was as follows:
Outstanding Borrowings
| | | | Interest Rate
|
$19,221,156
| | | | 3.10% |
9. INVESTMENT RISKS
As with any investment, an investment in the Funds could result in a loss or the performance of the Funds could be inferior to that of other investments. An investor should consider each Fund’s investment objectives, risks, and charges and expenses carefully before investing. Each Fund’s prospectus and statement of additional information contain this and other important information.
86
Notes to Financial Statements (continued)
October 31, 2019
10. CREDIT RISK
Junk Bonds or High Yield Securities: High yield securities are generally subject to greater levels of credit quality risk than investment grade securities. The retail secondary market for these “junk bonds” may be less liquid than that of higher-rated fixed income securities, and adverse conditions could make it difficult at times to sell these securities or could result in lower prices than higher-rated fixed income securities. These risks can reduce the value of the Fund’s shares and the income it earns.
11. CASH CONCENTRATION RISK
At various times, the Funds may have cash and cash collateral balances that exceed federally insured limits.
12. 10% SHAREHOLDERS
As of October 31, 2019, certain Funds had individual shareholder account(s) and/or omnibus shareholder account(s) (comprised of a group of individual shareholders), which individually amounted to more than 10% of the total shares outstanding of the Fund as detailed below:
Funds
| | | | % of Shares
Outstanding
| | Number of
Accounts
|
InfraCap REIT Preferred ETF | | | | | 49 | % | | | 2 | |
Virtus Glovista Emerging Markets ETF | | | | | 92 | % | | | 5 | |
Virtus InfraCap U.S. Preferred Stock ETF | | | | | 64 | % | | | 3 | |
Virtus LifeSci Biotech Clinical Trials ETF | | | | | 54 | % | | | 3 | |
Virtus LifeSci Biotech Products ETF | | | | | 69 | % | | | 4 | |
Virtus Newfleet Multi-Sector Bond ETF | | | | | 41 | % | | | 2 | |
Virtus Private Credit Strategy ETF | | | | | 99 | % | | | 1 | |
Virtus Real Asset Income ETF | | | | | 100 | % | | | 1 | |
Virtus WMC Global Factor Opportunities ETF | | | | | 92 | % | | | 1 | * |
* | | Shareholder account is affiliated. |
13. SUBSEQUENT EVENTS
Effective January 1, 2020, the Adviser has contractually agreed to reduce its management fee for Virtus Newfleet Multi-Sector Bond ETF (the “Fund”) from the annual rate of 0.70% to the annual rate of 0.45% of the Fund’s average daily net assets.
Effective January 1, 2020, the Adviser has also contractually agreed to change the expense limitation agreement with the Fund so that the Fund’s total operating expenses (excluding certain items discussed in the Fund’s prospectus) do not exceed 0.49% of the Fund’s average daily net assets.
Management has evaluated subsequent events through the issuance of these financial statements and has determined that, except as set forth above, there are no material events that would require disclosure.
87
Schedule of Investments — InfraCap MLP ETF
October 31, 2019
Security Description
| | | | Shares
| | Value
|
Common Stocks—129.8%(1)
| | | | | | | | | | |
Energy—129.8%
| | | | | | | | | | |
BP Midstream Partners LP | | | | | 1,346,366 | | | $ | 19,858,898 | |
BP PLC (United Kingdom)(2)(3) | | | | | 97,154 | | | | 3,683,108 | |
Cheniere Energy Partners LP | | | | | 4,319 | | | | 194,053 | |
Crestwood Equity Partners LP(3) | | | | | 98,469 | | | | 3,558,670 | |
DCP Midstream LP(3) | | | | | 585,506 | | | | 13,402,232 | |
Enable Midstream Partners LP | | | | | 89,788 | | | | 905,961 | |
Energy Transfer LP(3) | | | | | 4,045,886 | | | | 50,937,705 | |
EnLink Midstream LLC* | | | | | 962,841 | | | | 6,017,756 | |
Enterprise Products Partners LP(3) | | | | | 1,537,020 | | | | 40,008,630 | |
EQM Midstream Partners LP(3) | | | | | 539,777 | | | | 16,128,537 | |
Genesis Energy LP | | | | | 639,110 | | | | 12,890,849 | |
Kinder Morgan, Inc.(3) | | | | | 191,218 | | | | 3,820,536 | |
Magellan Midstream Partners LP(3) | | | | | 248,822 | | | | 15,506,587 | |
Marathon Petroleum Corp.(3) | | | | | 227,578 | | | | 14,553,613 | |
MPLX LP(3) | | | | | 1,873,765 | | | | 49,411,183 | |
NGL Energy Partners LP | | | | | 863,210 | | | | 9,711,112 | |
Noble Midstream Partners LP | | | | | 829,022 | | | | 19,996,011 | |
NuStar Energy LP(3) | | | | | 575,003 | | | | 16,019,583 | |
ONEOK, Inc.(3) | | | | | 57,036 | | | | 3,982,824 | |
Phillips 66(3) | | | | | 15,880 | | | | 1,855,102 | |
Phillips 66 Partners LP(3) | | | | | 162,511 | | | | 9,082,740 | |
Plains All American Pipeline LP(3) | | | | | 2,043,711 | | | | 37,052,481 | |
Royal Dutch Shell PLC Class A (Netherlands)(2)(3) | | | | | 96,180 | | | | 5,575,555 | |
Shell Midstream Partners LP(3) | | | | | 569,933 | | | | 11,695,025 | |
Tallgrass Energy LP | | | | | 1,205,295 | | | | 22,490,805 | |
Targa Resources Corp.(3) | | | | | 108,983 | | | | 4,237,259 | |
TC PipeLines LP | | | | | 231,258 | | | | 9,162,442 | |
Western Midstream Partners LP(3) | | | | | 1,334,558 | | | | 28,372,703 | |
Williams Cos., Inc. (The)(3) | | | | | 28,343 | | | | 632,332 | |
Total Energy | | | | | | | | | 430,744,292 | |
Total Common Stocks
| | | | | | | | | | |
(Cost $510,858,530) | | | | | | | | | 430,744,292 | |
| | | | Notional
Amount
| | Number of
contracts
| | |
Purchased Options — 0.1%
| | | | | | | | | | | | | | |
Purchased Call Options
| | | | | | | | | | | | | | |
Enterprise Products Partners LP,
| | | | | | | | | | | | | | |
Expires 12/20/19,
| | | | | | | | | | | | | | |
Strike Price $31.00 | | | | | 102,000 | | | | 1,020 | | | | 2,040 | |
Kinder Morgan, Inc.,
| | | | | | | | | | | | | | |
Expires 11/08/19,
| | | | | | | | | | | | | | |
Strike Price $21.00 | | | | | 1,000 | | | | 10 | | | | 10 | |
Kinder Morgan, Inc.,
| | | | | | | | | | | | | | |
Expires 11/15/19,
| | | | | | | | | | | | | | |
Strike Price $23.00 | | | | | 171,200 | | | | 1,712 | | | | 0 | |
Kinder Morgan, Inc.,
| | | | | | | | | | | | | | |
Expires 12/20/19,
| | | | | | | | | | | | | | |
Strike Price $23.00 | | | | | 82,000 | | | | 820 | | | | 1,640 | |
Kinder Morgan, Inc.,
| | | | | | | | | | | | | | |
Expires 12/20/19,
| | | | | | | | | | | | | | |
Strike Price $24.00 | | | | | 96,700 | | | | 967 | | | | 0 | |
Marathon Petroleum Corp.,
| | | | | | | | | | | | | | |
Expires 11/15/19,
| | | | | | | | | | | | | | |
Strike Price $62.50 | | | | | 97,800 | | | | 978 | | | | 236,676 | |
Security Description
| | | | Notional
Amount
| | Number of
contracts
| | Value
|
Purchased Options (continued)
| | | | | | | | | | | | | | |
Purchased Call Options (continued)
| | | | | | | | | | | | | | |
Marathon Petroleum Corp.,
| | | | | | | | | | | | | | |
Expires 12/20/19,
| | | | | | | | | | | | | | |
Strike Price $70.00 | | | | | 136,800 | | | | 1,368 | | | $ | 134,064 | |
Purchased Put Options | | | | | | | | | | | | | | |
Marathon Petroleum Corp.,
| | | | | | | | | | | | | | |
Expires 11/08/19,
| | | | | | | | | | | | | | |
Strike Price $57.50 | | | | | 3,300 | | | | 33 | | | | 165 | |
Marathon Petroleum Corp.,
| | | | | | | | | | | | | | |
Expires 11/15/19,
| | | | | | | | | | | | | | |
Strike Price $55.00 | | | | | 81,000 | | | | 810 | | | | 4,050 | |
ONEOK, Inc.,
| | | | | | | | | | | | | | |
Expires 11/15/19,
| | | | | | | | | | | | | | |
Strike Price $60.00 | | | | | 32,000 | | | | 320 | | | �� | 960 | |
Phillips 66,
| | | | | | | | | | | | | | |
Expires 11/15/19,
| | | | | | | | | | | | | | |
Strike Price $100.00 | | | | | 51,000 | | | | 510 | | | | 3,570 | |
TOTAL PURCHASED OPTIONS
| | | | | | | | | | | | | | |
(Cost $762,643) | | | | | | | | | | | | | 383,175 | |
TOTAL INVESTMENTS — 129.9%
| | | | | | | | | | | | | | |
(Cost $511,621,173) | | | | | | | | | | | | | 431,127,467 | |
Liabilities in Excess of Other
Assets—(29.9)% | | | | | | | | | | | | | (99,191,304 | ) |
Net Assets — 100.0%
| | | | | | | | | | | | $ | 331,936,163 | |
Written Options — (0.3)%
| | | | | | | | | | | | | | |
Written Call Options
| | | | | | | | | | | | | | |
BP PLC,
| | | | | | | | | | | | | | |
Expires 11/01/19,
| | | | | | | | | | | | | | |
Strike Price $38.00 | | | | | (48,000 | ) | | | (480 | ) | | | (4,800 | ) |
BP PLC,
| | | | | | | | | | | | | | |
Expires 11/01/19,
| | | | | | | | | | | | | | |
Strike Price $39.00 | | | | | (51,000 | ) | | | (510 | ) | | | (510 | ) |
BP PLC,
| | | | | | | | | | | | | | |
Expires 11/15/19,
| | | | | | | | | | | | | | |
Strike Price $38.50 | | | | | (71,000 | ) | | | (710 | ) | | | (12,780 | ) |
BP PLC,
| | | | | | | | | | | | | | |
Expires 11/22/19,
| | | | | | | | | | | | | | |
Strike Price $38.50 | | | | | (51,000 | ) | | | (510 | ) | | | (12,750 | ) |
BP PLC,
| | | | | | | | | | | | | | |
Expires 12/06/19,
| | | | | | | | | | | | | | |
Strike Price $39.00 | | | | | (51,000 | ) | | | (510 | ) | | | (13,260 | ) |
Crestwood Equity Partners LP,
| | | | | | | | | | | | | | |
Expires 11/15/19,
| | | | | | | | | | | | | | |
Strike Price $35.00 | | | | | (41,000 | ) | | | (410 | ) | | | (34,850 | ) |
Crestwood Equity Partners LP,
| | | | | | | | | | | | | | |
Expires 01/17/20,
| | | | | | | | | | | | | | |
Strike Price $40.00 | | | | | (31,000 | ) | | | (310 | ) | | | (7,750 | ) |
DCP Midstream LP,
| | | | | | | | | | | | | | |
Expires 11/15/19,
| | | | | | | | | | | | | | |
Strike Price $30.00 | | | | | (1,000 | ) | | | (10 | ) | | | 0 | |
DCP Midstream LP,
| | | | | | | | | | | | | | |
Expires 01/17/20,
| | | | | | | | | | | | | | |
Strike Price $30.00 | | | | | (50,000 | ) | | | (500 | ) | | | (5,000 | ) |
Energy Transfer LP,
| | | | | | | | | | | | | | |
Expires 11/01/19,
| | | | | | | | | | | | | | |
Strike Price $13.50 | | | | | (40,900 | ) | | | (409 | ) | | | 0 | |
The accompanying notes are an integral part of these financial statements.
88
Schedule of Investments — InfraCap MLP ETF (continued)
October 31, 2019
Security Description
| | | | Notional
Amount
| | Number of
contracts
| | Value
|
Written Options (continued)
| | | | | | | | | | | | | | |
Written Calls Option (continued)
| | | | | | | | | | | | | | |
Energy Transfer LP,
| | | | | | | | | | | | | | |
Expires 11/08/19,
| | | | | | | | | | | | | | |
Strike Price $13.50 | | | | | (1,000 | ) | | | (10 | ) | | $ | (20 | ) |
Energy Transfer LP,
| | | | | | | | | | | | | | |
Expires 11/08/19,
| | | | | | | | | | | | | | |
Strike Price $14.00 | | | | | (4,000 | ) | | | (40 | ) | | | (40 | ) |
Energy Transfer LP,
| | | | | | | | | | | | | | |
Expires 11/15/19,
| | | | | | | | | | | | | | |
Strike Price $14.00 | | | | | (89,500 | ) | | | (895 | ) | | | (1,790 | ) |
Energy Transfer LP,
| | | | | | | | | | | | | | |
Expires 11/22/19,
| | | | | | | | | | | | | | |
Strike Price $13.50 | | | | | (9,200 | ) | | | (92 | ) | | | (276 | ) |
Energy Transfer LP,
| | | | | | | | | | | | | | |
Expires 11/29/19,
| | | | | | | | | | | | | | |
Strike Price $13.00 | | | | | (104,000 | ) | | | (1,040 | ) | | | (13,520 | ) |
Energy Transfer LP,
| | | | | | | | | | | | | | |
Expires 11/29/19,
| | | | | | | | | | | | | | |
Strike Price $13.50 | | | | | (103,000 | ) | | | (1,030 | ) | | | (6,180 | ) |
Enterprise Products Partners LP,
| | | | | | | | | | | | | | |
Expires 11/15/19,
| | | | | | | | | | | | | | |
Strike Price $28.00 | | | | | (50,000 | ) | | | (500 | ) | | | (2,500 | ) |
Enterprise Products Partners LP,
| | | | | | | | | | | | | | |
Expires 11/22/19,
| | | | | | | | | | | | | | |
Strike Price $28.00 | | | | | (100,000 | ) | | | (1,000 | ) | | | (4,000 | ) |
Enterprise Products Partners LP,
| | | | | | | | | | | | | | |
Expires 12/13/19,
| | | | | | | | | | | | | | |
Strike Price $27.50 | | | | | (1,000 | ) | | | (10 | ) | | | (100 | ) |
Enterprise Products Partners LP,
| | | | | | | | | | | | | | |
Expires 12/20/19,
| | | | | | | | | | | | | | |
Strike Price $28.00 | | | | | (112,000 | ) | | | (1,120 | ) | | | (11,200 | ) |
Enterprise Products Partners LP,
| | | | | | | | | | | | | | |
Expires 12/20/19,
| | | | | | | | | | | | | | |
Strike Price $30.00 | | | | | (11,000 | ) | | | (110 | ) | | | (550 | ) |
Enterprise Products Partners LP,
| | | | | | | | | | | | | | |
Expires 01/17/20,
| | | | | | | | | | | | | | |
Strike Price $28.00 | | | | | (1,000 | ) | | | (10 | ) | | | (160 | ) |
EQM Midstream Partners LP,
| | | | | | | | | | | | | | |
Expires 11/15/19,
| | | | | | | | | | | | | | |
Strike Price $35.00 | | | | | (12,000 | ) | | | (120 | ) | | | (240 | ) |
EQM Midstream Partners LP,
| | | | | | | | | | | | | | |
Expires 01/17/20,
| | | | | | | | | | | | | | |
Strike Price $35.00 | | | | | (2,000 | ) | | | (20 | ) | | | (600 | ) |
Kinder Morgan, Inc.,
| | | | | | | | | | | | | | |
Expires 11/01/19,
| | | | | | | | | | | | | | |
Strike Price $21.50 | | | | | (10,000 | ) | | | (100 | ) | | | 0 | |
Kinder Morgan, Inc.,
| | | | | | | | | | | | | | |
Expires 11/22/19,
| | | | | | | | | | | | | | |
Strike Price $21.00 | | | | | (62,700 | ) | | | (627 | ) | | | (2,508 | ) |
Kinder Morgan, Inc.,
| | | | | | | | | | | | | | |
Expires 11/22/19,
| | | | | | | | | | | | | | |
Strike Price $21.50 | | | | | (111,000 | ) | | | (1,110 | ) | | | (1,110 | ) |
Kinder Morgan, Inc.,
| | | | | | | | | | | | | | |
Expires 11/29/19,
| | | | | | | | | | | | | | |
Strike Price $20.50 | | | | | (100,000 | ) | | | (1,000 | ) | | | (16,000 | ) |
Kinder Morgan, Inc.,
| | | | | | | | | | | | | | |
Expires 11/29/19,
| | | | | | | | | | | | | | |
Strike Price $21.00 | | | | | (59,900 | ) | | | (599 | ) | | | (3,594 | ) |
| | | | | | | | | | | | | | | |
| | | | | | | | | | | | | | | |
Security Description
| | | | Notional
Amount
| | Number of
contracts
| | Value
|
Written Options (continued)
| | | | | | | | | | | | | | |
Written Calls Option (continued)
| | | | | | | | | | | | | | |
Kinder Morgan, Inc.,
| | | | | | | | | | | | | | |
Expires 12/06/19,
| | | | | | | | | | | | | | |
Strike Price $21.00 | | | | | (113,000 | ) | | | (1,130 | ) | | $ | (10,170 | ) |
Kinder Morgan, Inc.,
| | | | | | | | | | | | | | |
Expires 12/13/19,
| | | | | | | | | | | | | | |
Strike Price $21.00 | | | | | (101,000 | ) | | | (1,010 | ) | | | (11,110 | ) |
Kinder Morgan, Inc.,
| | | | | | | | | | | | | | |
Expires 12/20/19,
| | | | | | | | | | | | | | |
Strike Price $21.00 | | | | | (209,700 | ) | | | (2,097 | ) | | | (29,358 | ) |
Magellan Midstream Partners LP,
| | | | | | | | | | | | | | |
Expires 11/15/19,
| | | | | | | | | | | | | | |
Strike Price $67.50 | | | | | (104,000 | ) | | | (1,040 | ) | | | 0 | |
Magellan Midstream Partners LP,
| | | | | | | | | | | | | | |
Expires 11/15/19,
| | | | | | | | | | | | | | |
Strike Price $70.00 | | | | | (1,000 | ) | | | (10 | ) | | | 0 | |
Magellan Midstream Partners LP,
| | | | | | | | | | | | | | |
Expires 01/17/20,
| | | | | | | | | | | | | | |
Strike Price $67.50 | | | | | (72,300 | ) | | | (723 | ) | | | (10,122 | ) |
Marathon Petroleum Corp.,
| | | | | | | | | | | | | | |
Expires 11/01/19,
| | | | | | | | | | | | | | |
Strike Price $70.00 | | | | | (31,000 | ) | | | (310 | ) | | | (310 | ) |
Marathon Petroleum Corp.,
| | | | | | | | | | | | | | |
Expires 11/22/19,
| | | | | | | | | | | | | | |
Strike Price $69.00 | | | | | (25,000 | ) | | | (250 | ) | | | (15,500 | ) |
MPLX LP,
| | | | | | | | | | | | | | |
Expires 11/15/19,
| | | | | | | | | | | | | | |
Strike Price $28.00 | | | | | (101,000 | ) | | | (1,010 | ) | | | (4,040 | ) |
MPLX LP,
| | | | | | | | | | | | | | |
Expires 11/15/19,
| | | | | | | | | | | | | | |
Strike Price $29.00 | | | | | (21,000 | ) | | | (210 | ) | | | (210 | ) |
MPLX LP,
| | | | | | | | | | | | | | |
Expires 11/15/19,
| | | | | | | | | | | | | | |
Strike Price $30.00 | | | | | (91,000 | ) | | | (910 | ) | | | 0 | |
MPLX LP,
| | | | | | | | | | | | | | |
Expires 12/20/19,
| | | | | | | | | | | | | | |
Strike Price $28.00 | | | | | (113,000 | ) | | | (1,130 | ) | | | (15,820 | ) |
MPLX LP,
| | | | | | | | | | | | | | |
Expires 12/20/19,
| | | | | | | | | | | | | | |
Strike Price $30.00 | | | | | (43,000 | ) | | | (430 | ) | | | (1,720 | ) |
MPLX LP,
| | | | | | | | | | | | | | |
Expires 01/17/20,
| | | | | | | | | | | | | | |
Strike Price $29.00 | | | | | (50,000 | ) | | | (500 | ) | | | (5,000 | ) |
NuStar Energy LP,
| | | | | | | | | | | | | | |
Expires 11/15/19,
| | | | | | | | | | | | | | |
Strike Price $30.00 | | | | | (12,000 | ) | | | (120 | ) | | | (480 | ) |
NuStar Energy LP,
| | | | | | | | | | | | | | |
Expires 12/20/19,
| | | | | | | | | | | | | | |
Strike Price $30.00 | | | | | (25,400 | ) | | | (254 | ) | | | (3,810 | ) |
ONEOK, Inc.,
| | | | | | | | | | | | | | |
Expires 11/08/19,
| | | | | | | | | | | | | | |
Strike Price $71.00 | | | | | (57,000 | ) | | | (570 | ) | | | (7,125 | ) |
Phillips 66,
| | | | | | | | | | | | | | |
Expires 11/01/19,
| | | | | | | | | | | | | | |
Strike Price $110.00 | | | | | (16,000 | ) | | | (160 | ) | | | (108,800 | ) |
Phillips 66 Partners LP,
| | | | | | | | | | | | | | |
Expires 11/15/19,
| | | | | | | | | | | | | | |
Strike Price $60.00 | | | | | (2,000 | ) | | | (20 | ) | | | (40 | ) |
The accompanying notes are an integral part of these financial statements.
89
Schedule of Investments — InfraCap MLP ETF (continued)
October 31, 2019
Security Description
| | | | Notional
Amount
| | Number of
contracts
| | Value
|
Written Options (continued)
| | | | | | | | | | | | | | |
Written Calls Option (continued)
| | | | | | | | | | | | | | |
Phillips 66 Partners LP,
| | | | | | | | | | | | | | |
Expires 12/20/19,
| | | | | | | | | | | | | | |
Strike Price $60.00 | | | | | (93,000 | ) | | | (930 | ) | | $ | (20,460 | ) |
Plains All American Pipeline LP,
| | | | | | | | | | | | | | |
Expires 11/01/19,
| | | | | | | | | | | | | | |
Strike Price $22.00 | | | | | (98,000 | ) | | | (980 | ) | | | 0 | |
Royal Dutch Shell PLC,
| | | | | | | | | | | | | | |
Expires 11/01/19,
| | | | | | | | | | | | | | |
Strike Price $58.50 | | | | | (39,000 | ) | | | (390 | ) | | | (1,950 | ) |
Royal Dutch Shell PLC,
| | | | | | | | | | | | | | |
Expires 11/01/19,
| | | | | | | | | | | | | | |
Strike Price $59.00 | | | | | (9,000 | ) | | | (90 | ) | | | (720 | ) |
Royal Dutch Shell PLC,
| | | | | | | | | | | | | | |
Expires 11/08/19,
| | | | | | | | | | | | | | |
Strike Price $59.00 | | | | | (38,000 | ) | | | (380 | ) | | | (6,650 | ) |
Royal Dutch Shell PLC,
| | | | | | | | | | | | | | |
Expires 11/22/19,
| | | | | | | | | | | | | | |
Strike Price $59.00 | | | | | (61,000 | ) | | | (610 | ) | | | (15,250 | ) |
Shell Midstream Partners LP,
| | | | | | | | | | | | | | |
Expires 11/15/19,
| | | | | | | | | | | | | | |
Strike Price $22.00 | | | | | (3,000 | ) | | | (30 | ) | | | (180 | ) |
Targa Resources Corp.,
| | | | | | | | | | | | | | |
Expires 11/15/19,
| | | | | | | | | | | | | | |
Strike Price $43.00 | | | | | (51,000 | ) | | | (510 | ) | | | (8,670 | ) |
Targa Resources Corp.,
| | | | | | | | | | | | | | |
Expires 12/20/19,
| | | | | | | | | | | | | | |
Strike Price $44.00 | | | | | (62,000 | ) | | | (620 | ) | | | (20,460 | ) |
Targa Resources Corp.,
| | | | | | | | | | | | | | |
Expires 12/20/19,
| | | | | | | | | | | | | | |
Strike Price $45.00 | | | | | (6,000 | ) | | | (60 | ) | | | (1,350 | ) |
Western Midstream Partners LP,
| | | | | | | | | | | | | | |
Expires 11/15/19,
| | | | | | | | | | | | | | |
Strike Price $25.00 | | | | | (51,000 | ) | | | (510 | ) | | | (1,530 | ) |
Williams Cos., Inc. (The),
| | | | | | | | | | | | | | |
Expires 11/01/19,
| | | | | | | | | | | | | | |
Strike Price $24.00 | | | | | (52,000 | ) | | | (520 | ) | | | (520 | ) |
Williams Cos., Inc. (The),
| | | | | | | | | | | | | | |
Expires 11/08/19,
| | | | | | | | | | | | | | |
Strike Price $24.00 | | | | | (51,000 | ) | | | (510 | ) | | | (1,020 | ) |
Williams Cos., Inc. (The),
| | | | | | | | | | | | | | |
Expires 11/15/19,
| | | | | | | | | | | | | | |
Strike Price $24.00 | | | | | (50,000 | ) | | | (500 | ) | | | (1,500 | ) |
Written Put Options
| | | | | | | | | | | | | | |
Kinder Morgan, Inc.,
| | | | | | | | | | | | | | |
Expires 11/08/19,
| | | | | | | | | | | | | | |
Strike Price $20.00 | | | | | (200,000 | ) | | | (2,000 | ) | | | (46,000 | ) |
| | | | | | | | | | | | | | | |
| | | | | | | | | | | | | | | |
Security Description
| | | | Notional
Amount
| | Number of
contracts
| | Value
|
Written Options (continued)
| | | | | | | | | | | | | | |
Written Put Options (continued)
| | | | | | | | | | | | | | |
Kinder Morgan, Inc.,
| | | | | | | | | | | | | | |
Expires 11/15/19,
| | | | | | | | | | | | | | |
Strike Price $20.00 | | | | | (100,000 | ) | | | (1,000 | ) | | $ | (31,000 | ) |
Magellan Midstream Partners LP,
| | | | | | | | | | | | | | |
Expires 11/15/19,
| | | | | | | | | | | | | | |
Strike Price $62.50 | | | | | (22,000 | ) | | | (220 | ) | | | (33,000 | ) |
Magellan Midstream Partners LP,
| | | | | | | | | | | | | | |
Expires 11/15/19,
| | | | | | | | | | | | | | |
Strike Price $65.00 | | | | | (52,500 | ) | | | (525 | ) | | | (196,875 | ) |
Marathon Petroleum Corp.,
| | | | | | | | | | | | | | |
Expires 11/01/19,
| | | | | | | | | | | | | | |
Strike Price $66.00 | | | | | (11,000 | ) | | | (110 | ) | | | (17,820 | ) |
Marathon Petroleum Corp.,
| | | | | | | | | | | | | | |
Expires 11/08/19,
| | | | | | | | | | | | | | |
Strike Price $62.50 | | | | | (42,000 | ) | | | (420 | ) | | | (28,140 | ) |
ONEOK, Inc.,
| | | | | | | | | | | | | | |
Expires 11/08/19,
| | | | | | | | | | | | | | |
Strike Price $67.50 | | | | | (51,000 | ) | | | (510 | ) | | | (19,125 | ) |
ONEOK, Inc.,
| | | | | | | | | | | | | | |
Expires 11/15/19,
| | | | | | | | | | | | | | |
Strike Price $68.00 | | | | | (40,000 | ) | | | (400 | ) | | | (37,200 | ) |
Phillips 66,
| | | | | | | | | | | | | | |
Expires 11/08/19,
| | | | | | | | | | | | | | |
Strike Price $105.00 | | | | | (5,400 | ) | | | (54 | ) | | | (216 | ) |
Phillips 66,
| | | | | | | | | | | | | | |
Expires 11/08/19,
| | | | | | | | | | | | | | |
Strike Price $111.00 | | | | | (41,000 | ) | | | (410 | ) | | | (18,450 | ) |
Phillips 66,
| | | | | | | | | | | | | | |
Expires 11/15/19,
| | | | | | | | | | | | | | |
Strike Price $112.00 | | | | | (52,000 | ) | | | (520 | ) | | | (49,400 | ) |
Phillips 66 Partners LP,
| | | | | | | | | | | | | | |
Expires 11/15/19,
| | | | | | | | | | | | | | |
Strike Price $55.00 | | | | | (52,000 | ) | | | (520 | ) | | | (26,000 | ) |
Plains All American Pipeline LP,
| | | | | | | | | | | | | | |
Expires 11/01/19,
| | | | | | | | | | | | | | |
Strike Price $19.00 | | | | | (33,000 | ) | | | (330 | ) | | | (31,350 | ) |
TOTAL WRITTEN OPTIONS — (0.3)%
| | | | | | | |
(Premiums Received $1,239,803) | | | | | | | | | | | | $ | (994,539 | ) |
Abbreviations:
LP — Limited Partnership
* | | Non-income producing security. |
(1) | | Substantially all the securities, or a portion thereof, have been pledged as collateral for line of credit borrowings, short sales and open written option contracts. The aggregate market value of the collateral at October 31, 2019 was $418,718,971. |
(2) | | American Depositary Receipts. |
(3) | | Subject to written call options. |
The accompanying notes are an integral part of these financial statements.
90
Schedule of Investments — InfraCap MLP ETF (continued)
October 31, 2019
The following table summarizes valuation of the Fund’s investments under the fair value hierarchy levels as of October 31, 2019.
| | | | Level 1
| | Level 2
| | Level 3
| | Total
|
Asset Valuation Inputs
| | | | | | | | | | | | | | | | | | |
Common Stocks | | | | $ | 430,744,292 | | | $ | — | | | $ | — | | | $ | 430,744,292 | |
Purchased Options | | | | | 378,635 | | | | 4,540 | | | | — | | | | 383,175 | |
Total | | | | $ | 431,122,927 | | | $ | 4,540 | | | $ | — | | | $ | 431,127,467 | |
Liability Valuation Inputs
| | | | | | | | | | | | | | | | | | |
Written Options | | | | $ | 971,103 | | | $ | 23,436 | | | $ | — | | | $ | 994,539 | |
Total | | | | $ | 971,103 | | | $ | 23,436 | | | $ | — | | | $ | 994,539 | |
The accompanying notes are an integral part of these financial statements.
91
Statement of Assets and Liabilities
October 31, 2019
| | | | InfraCap MLP
ETF
|
Assets:
| | | | | | |
Investments, at cost | | | | $ | 511,621,173 | |
Investments, at value | | | | | 431,127,467 | |
Cash | | | | | 4,712,238 | |
Due from brokers | | | | | 2,230,855 | |
Receivables:
| | | | | | |
Investment securities sold | | | | | 8,806,785 | |
Dividends and interest | | | | | 851,680 | |
Tax reclaim | | | | | 9,516 | |
Income tax | | | | | 7,948,717 | |
Total Assets | | | | | 455,687,258 | |
Liabilities:
| | | | | | |
Borrowings | | | | | 119,386,608 | |
Payables:
| | | | | | |
Investment securities purchased | | | | | 381,413 | |
Capital shares payable | | | | | 2,699,073 | |
Sub-Advisory fees | | | | | 282,600 | |
Written options, at value(a) | | | | | 994,539 | |
Other accrued expenses | | | | | 6,862 | |
Total Liabilities | | | | | 123,751,095 | |
Net Assets | | | | $ | 331,936,163 | |
Net Assets Consist of:
| | | | | | |
Paid-in capital | | | | $ | 505,550,636 | |
Total distributable earnings (accumulated deficit), net of income taxes | | | | | (173,614,473 | ) |
Net Assets | | | | $ | 331,936,163 | |
Shares outstanding (unlimited number of shares of beneficial interest authorized, no par value) | | | | | 74,100,004 | |
Net asset value per share | | | | $ | 4.48 | |
(a) Premiums received from written options | | | | $ | 1,239,803 | |
The accompanying notes are an integral part of these financial statements.
92
Statement of Operations
For the Year Ended October 31, 2019
| | | | InfraCap MLP
ETF
|
Investment Income:
| | | | | | |
Distributions from master limited partnerships | | | | $ | 40,237,090 | |
Dividend income | | | | | 7,454,836 | |
Interest income | | | | | 50,674 | |
Less: Return of capital distributions | | | | | (44,666,569 | ) |
Total Investment Income | | | | | 3,076,031 | |
Expenses:
| | | | | | |
Dividend and interest expenses | | | | | 6,421,097 | |
Sub-Advisory fees | | | | | 4,223,872 | |
Franchise tax expense | | | | | 27,083 | |
Total Expenses | | | | | 10,672,052 | |
Net Investment (Loss), Before Income Taxes | | | | | (7,596,021 | ) |
Income Tax Benefit (Expense) | | | | | (36,933 | ) |
Net Investment Income (Loss), Net of Income Taxes | | | | | (7,632,954 | ) |
Net Realized Gain (Loss) on:
| | | | | | |
Investments | | | | | (88,807,721 | ) |
Written options | | | | | 3,156,010 | |
Securities sold short | | | | | (6,864,002 | ) |
Total Net Realized Loss | | | | | (92,515,713 | ) |
Change in Net Unrealized Appreciation (Depreciation) on:
| | | | | | |
Investments | | | | | 23,041,018 | |
Written options | | | | | (1,544,214 | ) |
Securities sold short | | | | | 4,161,902 | |
Total Change in Net Unrealized Appreciation | | | | | 25,658,706 | |
Net Realized and Change in Unrealized Loss | | | | | (66,857,007 | ) |
Net Decrease in Net Assets Resulting from Operations | | | | $ | (74,489,961 | ) |
The accompanying notes are an integral part of these financial statements.
93
Statements of Changes in Net Assets
| | | | InfraCap MLP ETF
| |
| | | | For the
Year Ended
October 31, 2019
| | For the
Year Ended
October 31, 2018
|
Increase (Decrease) in Net Assets Resulting from Operations:
| | | | | | | | | | |
Net investment loss, net of income taxes | | | | $ | (7,632,954 | ) | | $ | (11,937,750 | ) |
Net realized gain (loss) on investments, written options and securities sold short, net of income taxes | | | | | (92,515,713 | ) | | | 16,217,798 | |
Net change in unrealized appreciation (depreciation) on investments, written options and securities sold short, net of income taxes | | | | | 25,658,706 | | | | (42,308,052 | ) |
Net decrease in net assets resulting from operations | | | | | (74,489,961 | ) | | | (38,028,004 | ) |
Distributions to Shareholders | | | | | — | | | | — | |
Distributions to Shareholders from return of capital | | | | | (81,518,004 | ) | | | (119,404,506 | ) |
Total distributions | | | | | (81,518,004 | ) | | | (119,404,506 | ) |
Shareholder Transactions:
| | | | | | | | | | |
Proceeds from shares sold | | | | | 37,768,962 | | | | 250,592,039 | |
Cost of shares redeemed | | | | | (87,646,286 | ) | | | (60,217,441 | ) |
Net increase (decrease) in net assets resulting from shareholder transactions | | | | | (49,877,324 | ) | | | 190,374,598 | |
Increase (decrease) in net assets | | | | | (205,885,289 | ) | | | 32,942,088 | |
Net Assets:
| | | | | | | | | | |
Beginning of year | | | | | 537,821,452 | | | | 504,879,364 | |
End of year | | | | $ | 331,936,163 | | | $ | 537,821,452 | |
Changes in Shares Outstanding:
| | | | | | | | | | |
Shares outstanding, beginning of year | | | | | 84,200,004 | | | | 60,300,004 | |
Shares sold | | | | | 6,400,000 | | | | 31,550,000 | |
Shares redeemed | | | | | (16,500,000 | ) | | | (7,650,000 | ) |
Shares outstanding, end of year | | | | | 74,100,004 | | | | 84,200,004 | |
The accompanying notes are an integral part of these financial statements.
94
Statement of Cash Flows
For the Year Ended October 31, 2019
| | | | InfraCap MLP
ETF
|
Cash Flows From Operating Activities:
| | | | | | |
Net decrease in net assets from operations | | | | $ | (74,489,961 | ) |
Adjustments to reconcile net decrease in net assets from operations to net cash used in operating activities:
| | | | | | |
Purchases of investment securities | | | | | (727,865,532 | ) |
Proceeds from sales of investment securities | | | | | 1,030,247,586 | |
Net proceeds from purchased and written options | | | | | 19,469,672 | |
Net proceeds from securities sold short | | | | | 47,087,737 | |
Payments made to cover securities sold short | | | | | (85,181,990 | ) |
Net realized loss on investments | | | | | 88,807,721 | |
Net realized loss on securities sold shorts | | | | | 6,864,002 | |
Net realized gain on written options | | | | | (3,156,010 | ) |
Net change in unrealized appreciation on investments | | | | | (23,041,018 | ) |
Net change in unrealized appreciation on securities sold short | | | | | (4,161,902 | ) |
Net change in unrealized depreciation on written options | | | | | 1,544,214 | |
Decrease in deferred tax asset, net of valuation allowance | | | | | 2,256,621 | |
Increase in dividends receivable | | | | | (711,910 | ) |
Increase in income tax receivable | | | | | (2,381,460 | ) |
Decrease in Due from broker | | | | | 8,579,968 | |
Decrease in other accrued expenses | | | | | 6,862 | |
Decrease in sub-advisory fees payable | | | | | (203,394 | ) |
Net cash provided by operating activities | | | | | 283,671,206 | |
Cash Flows from Financing Activities:
| | | | | | |
Proceeds from borrowings | | | | | (113,124,966 | ) |
Payments for fund shares sold in excess of in-kind creations | | | | | (97,040,021 | ) |
Distributions paid | | | | | (81,518,004 | ) |
Net cash used in financing activities
| | | | | (291,682,991 | ) |
Net decrease in cash | | | | | (8,011,785 | ) |
Cash, beginning of year | | | | | 12,724,023 | |
Cash, end of year | | | | $ | 4,712,238 | |
Supplementary information:
| | | | | | |
Interest paid on borrowings | | | | $ | 5,666,634 | |
Taxes paid | | | | | 261,994 | |
Non-cash financing activities:
| | | | | | |
In-kind creations — Issued | | | | | 48,286,679 | |
In-kind creations — Redeemed | | | | | — | |
The accompanying notes are an integral part of these financial statements.
95
| | | | InfraCap MLP ETF
| |
| | | | For the
Year Ended
October 31, 2019
| | For the
Year Ended
October 31, 2018
| | For the
Year Ended
October 31, 2017
| | For the
Year Ended
October 31, 2016
| For the
Year Ended
October 31, 2015
| |
Per Share Data for a Share Outstanding throughout each year presented:
| | | | | | | | | | | | | | | | | | |
Net asset value, beginning of year | | | | $ | 6.39 | | | $ | 8.37 | | | $ | 10.63 | | | $ | 14.28 | | $24.21 | |
Investment operations:
| | | | | | | | | | | | | | | | | | |
Net investment loss(1) | | | | | (0.10 | ) | | | (0.15 | ) | | | (0.17 | ) | | | (0.08 | ) | (0.06 | ) |
Net realized and unrealized loss | | | | | (0.79 | ) | | | (0.32 | ) | | | (0.01 | ) | | | (1.49 | )(2) | (7.84 | ) |
Total from investment operations | | | | | (0.89 | ) | | | (0.47 | ) | | | (0.18 | ) | | | (1.57 | ) | (7.90 | ) |
Less Distributions from:
| | | | | | | | | | | | | | | | | | |
Net investment income | | | | | (1.02 | ) | | | — | | | | (0.59 | ) | | | — | | (0.30 | ) |
Return of capital | | | | | — | | | | (1.51 | ) | | | (1.49 | ) | | | (2.08 | ) | (1.73 | ) |
Total distributions | | | | | (1.02 | ) | | | (1.51 | ) | | | (2.08 | ) | | | (2.08 | ) | (2.03 | ) |
Net Asset Value, End of year | | | | $ | 4.48 | | | $ | 6.39 | | | $ | 8.37 | | | $ | 10.63 | | $14.28 | |
Net Asset Value Total Return(3) | | | | | (15.62 | )% | | | (7.65 | )% | | | (3.44 | )% | | | (8.60 | )% | (34.34 | )% |
Net assets, end of year (000’s omitted) | | | | $ | 331,936 | | | $ | 537,821 | | | $ | 504,879 | | | $ | 119,606 | | $19,989 | |
RATIOS/SUPPLEMENTAL DATA:
| | | | | | | | | | | | | | | | | | |
Ratios to Average Net Assets:
| | | | | | | | | | | | | | | | | | |
Expenses, including deferred income tax expense/benefit | | | | | 2.41 | %(4) | | | 2.40 | %(5) | | | 1.93 | %(6) | | | 1.36 | %(7) | 1.11 | %(8) |
Expenses, excluding deferred income tax expense/benefit | | | | | 2.40 | %(4) | | | 2.39 | %(5) | | | 1.89 | %(6) | | | 1.58 | %(7) | 1.16 | %(8) |
Net investment loss | | | | | (1.72 | )% | | | (1.96 | )% | | | (1.73 | )% | | | (0.70 | )% | (0.36 | )% |
Portfolio turnover rate(9) | | | | | 136 | % | | | 255 | % | | | 104 | % | | | 90 | % | 60 | % |
(1) | | Based on average shares outstanding. |
(2) | | The per share amount of realized and unrealized gain (loss) on investments does not accord with the amounts reported in the Statements of Changes in Net Assets due to the timing of creation of Fund shares in relation to fluctuating market values. |
(3) | | Net Asset Value Total Return is calculated assuming an initial investment made at the net asset value on the first day of the year, reinvestment of dividends and distributions at net asset value during the year, and redemptions at net asset value on the last day of the year. Total return calculated for a period of less than one year is not annualized. |
(4) | | The ratios of expenses to average net assets include interest expense of 1.28% and dividend expense on securities sold short fees of 0.17%. |
(5) | | The ratios of expenses to average net assets include interest expense of 1.32% and dividend expense on securities sold short fees of 0.13%. |
(6) | | The ratios of expenses to average net assets includes interest expense fees of 0.94%. |
(7) | | The ratios of expenses to average net assets includes interest expense fees of 0.63%. |
(8) | | The ratios of expenses to average net assets includes interest expense fees of 0.21%. |
(9) | | Portfolio turnover excludes the value of portfolio securities received or delivered as a result of in-kind creations or redemptions of the Fund’s capital shares. |
The accompanying notes are an integral part of these financial statements.
96
Notes to Financial Statements
October 31, 2019
1. ORGANIZATION
The ETFis Series Trust I (the “Trust”) was organized as a Delaware statutory trust on September 20, 2012 and is registered with the U.S. Securities and Exchange Commission (the “SEC”) as an open-end management investment company under the Investment Company Act of 1940 (the “1940 Act”).
As of October 31, 2019, 11 funds of the Trust are offered for sale, of which InfraCap MLP ETF (the “Fund”) is reported in this annual report. The shares of the InfraCap MLP ETF are referred to herein as “Fund Shares” or “Shares”. The offering of Shares is registered under the Securities Act of 1933 (the “Securities Act”).
Fund
| | | | Commencement
of Operations |
InfraCap MLP ETF | | | | October 1, 2014 |
The Fund’s investment objective is to seek total return primarily through investments in equity securities of publicly traded master limited partnerships and limited liability companies taxed as partnerships (“MLPs”). There is no guarantee that the Fund will achieve its objective(s).
2. SIGNIFICANT ACCOUNTING POLICIES
The Fund is an investment company and accordingly follows the investment company accounting and reporting guidance of the Financial Accounting Standards Board (FASB) Accounting Standard Codification Topic 946 Financial Services — Investment Companies. The Fund prepares its financial statements in accordance with generally accepted accounting principles (“GAAP”) in the United States of America and follows the significant accounting policies described below.
(a) Use of Estimates
Management makes certain estimates and assumptions that affect the reported amounts of assets and liabilities and disclosure of contingent assets and liabilities at the date of the financial statements and reported amounts of increases and decreases in the net assets from operations during the reporting period. Actual results could differ from those estimates.
(b) Indemnification
In the normal course of business, the Fund may enter into contracts that contain a variety of representations which provide general indemnifications for certain liabilities. The Fund’s maximum exposure under these arrangements is unknown. However, the Fund has not had prior claims or losses pursuant to these contracts and expects the risk of loss to be remote.
(c) Security Valuation
A description of the valuation techniques applied to the Fund’s major categories of assets and liabilities measured at fair value on a recurring basis is as follows:
Equity securities and Exchange-Traded Funds are valued at the official closing price (typically last sale) on the exchange on which the securities are primarily traded. Securities regularly traded in an over the counter market are valued at the latest quoted sale price in such market or in the case of the New York Stock Exchange (“NYSE”), at the NYSE Official Closing Price. Such valuations are typically categorized as Level 1 in the fair value hierarchy. If market quotations are not readily available, or if it is determined that a quotation of a security does not represent fair value, then the security is valued at fair value as determined in good faith using procedures adopted by the Trust’s Board of Trustees (the “Board”). Such valuations are typically categorized as Level 2 or Level 3 in the fair value hierarchy.
Listed derivatives, such as options, that are actively traded are valued based on quoted prices from the exchange and are categorized as Level 1 in the hierarchy. Over-the-counter derivative contracts, which include options, do not require material subjectivity as pricing inputs are observed from actively quoted markets and are categorized as Level 2 in the hierarchy.
97
Notes to Financial Statements (continued)
October 31, 2019
(d) Fair Value Measurement
Accounting Standards Codification, Fair Value Measurements and Disclosures (“ASC 820”) defines fair value, establishes a framework for measuring fair value in accordance with GAAP, and requires disclosure about fair value measurements. It also provides guidance on determining when there has been a significant decrease in the volume and level of activity for an asset or liability, when a transaction is not orderly, and how that information must be incorporated into fair value measurement. Under ASC 820, various inputs are used in determining the value of the Fund’s investments. These inputs are summarized in the following hierarchy:
• | | Level 1 — Unadjusted quoted prices in active markets for identical assets or liabilities that the Fund has the ability to access. |
• | | Level 2 — Observable inputs other than quoted prices included in Level 1 that are observable for the asset or liability, either directly or indirectly. These inputs may include quoted prices for the identical instrument on an inactive market, prices for similar securities, interest rates, prepayment speeds, credit risk, yield curves, default rates and similar data. |
• | | Level 3 — Unobservable inputs for the asset or liability, to the extent relevant observable inputs are not available; representing the Fund’s own assumptions about the assumptions a market participant would use in valuing the asset or liability, and would be based on the best information available. |
The inputs or methodology used for valuing securities are not necessarily an indication of the risk associated with investing in those securities. The hierarchy classification of inputs used to value the Fund’s investments at October 31, 2019, is disclosed at the end of the Fund’s Schedule of Investments.
(e) Security Transactions, Investment Income and Return of Capital Estimates
Security transactions are accounted for on the trade date. Realized gains and losses on sales of investment securities are calculated using specific identification. Dividend income is recognized on the ex-dividend date. Expenses are recognized on the accrual basis. The Fund amortizes premiums and accretes discounts using the effective interest method.
The Fund invests in master limited partnerships (“MLPs”) which make distributions that are primarily attributable to return of capital. The Fund records investment income and return of capital in the Statement of Operations using management’s estimate of the percentage of income included in the distributions received from each MLP based on historical information from the MLPs and other industry sources. These estimates may be adjusted based on information received from the MLPs after the tax and fiscal year ends.
The return of capital portion of the MLP distributions is a reduction to investment income and a reduction in the cost basis of each investment which increases net realized gain (loss) and net change in unrealized appreciation (depreciation). If the return of capital distributions exceed its cost basis, the distributions are treated as realized gains. The actual amounts of income and return of capital are only determined by each MLP after its fiscal year-end and may differ from the estimated amounts.
(f) Expenses
The Fund pays all of its expenses not assumed by Infrastructure Capital Advisors, LLC (the “Sub-Adviser”) or Virtus ETF Advisers LLC (the “Adviser”). General Trust expenses that are allocated among and charged to the assets of the Fund and other series of the Trust are done so on a basis that the Board deems fair and equitable, which may be on a basis of relative net assets of the Fund and other series of the Trust or the nature of the services performed and relative applicability to the Fund and other series of the Trust.
(g) Short Sales
The Fund may sell securities short. A short sale is a transaction in which the Fund sells a security it does not own in anticipation of a decline in market price. To sell a security short, the Fund must borrow the security. The Fund’s obligation to replace the security borrowed and sold short will be fully collateralized at all times by the proceeds from the short sale retained by the broker and by cash and securities deposited in a segregated account with the Fund’s custodian. If the price of the security sold short increases between the time of the short sale and the time the Fund replaces the borrowed security, the Fund will realize a loss, and if the price declines during the period, the Fund will realize a gain. Any realized gain will be decreased, and any realized loss increased, by the amount of transaction costs. On the ex-dividend date, dividends on short sales are recorded as an expense to the Fund.
In accordance with the terms of its prime brokerage agreement, the Fund may receive rebate income or be charged a fee on borrowed securities which is reported as “Interest Expense” on the Statement of Operations. Such income or fee is calculated on a daily basis based upon the market value of each borrowed security and a variable rate that is dependent upon the availability of such security.
98
Notes to Financial Statements (continued)
October 31, 2019
(h) Distributions to Shareholders
Distributions to shareholders are declared and paid on a monthly basis and are recorded on the ex-dividend date. The Fund uses a cash flow-based distribution approach based on the Fund’s net cash flow received from portfolio investments.
The estimated character of the distributions paid will either be a dividend (ordinary income eligible to be treated as qualified dividend income) or a return of capital. Distributions made from current or accumulated earnings and profits of the Fund will be taxable to shareholders as dividend income. Distributions that are in an amount greater than the Fund’s current and accumulated earnings and profits will represent a return of capital to the extent of a shareholder’s basis in their common shares, and such distributions will correspondingly increase the realized gain upon the sale of their common shares. Additionally, distributions not paid from current or accumulated earnings and profits that exceed a shareholder’s tax basis in their common shares will generally be taxed as a capital gain. This estimate is based on the Fund’s operating results during the period.
3. INVESTMENT MANAGEMENT RELATED PARTIES AND OTHER AGREEMENTS
Investment Advisory Agreement
The Trust has entered into an Investment Advisory Agreement (the “Advisory Agreement”) with the Virtus ETF Advisers, LLC (the “Adviser”) an indirect wholly owned subsidiary of Virtus Investment Partners, Inc. (Ticker: VRTS) (together with its affiliates, “Virtus”). Pursuant to the Advisory Agreement, the Adviser has overall supervisory responsibility for the general management and investment of the Fund’s securities portfolio. For its services to the Fund, the Adviser is entitled to receive a fee, payable monthly, at an annual rate of 0.075% of the Fund’s average daily net assets, subject to a minimum annual fee of $25,000, paid by the Sub-Adviser as described below.
Sub-Advisory Agreement
Infrastructure Capital Advisors, LLC (the “Sub-Adviser”) provides investment advice and management services to the Fund. Pursuant to an investment sub-advisory agreement among the Trust, the Sub-Adviser and the Adviser, the Sub-Adviser is entitled to receive a fee, payable monthly, at an annual rate of 0.95% of the Fund’s average daily net assets. The Sub-Adviser has agreed to pay all expenses of the Fund, except the Sub-Adviser’s fee, brokerage expenses, taxes, interest, litigation expenses, payments under any 12b-1 plan adopted by the Fund, and other non-routine or extraordinary expenses of the Fund.
Principal Underwriter
Pursuant to the terms of a Distribution Agreement with the Trust, VP Distributors, LLC (the “Distributor”) serves as the Fund’s principal underwriter. The Distributor receives compensation from the Adviser for the statutory underwriting services it provides to the Fund. The Distributor will not distribute shares in less than Creation Units (as hereinafter defined), and does not maintain a secondary market in shares. The shares are traded in the secondary market. The Distributor is an indirect wholly owned subsidiary of Virtus.
Operational Administrator
Virtus ETF Solutions LLC (the “Administrator”) serves as the Fund’s operational administrator. The Administrator supervises the overall administration of the Trust and the Fund including, among other responsibilities, the coordination and day-to-day oversight of the Fund’s operations, the service providers’ communications with the Fund and each other and assistance with Trust, Board and contractual matters related to the Fund. The Administrator also provides persons satisfactory to the Board to serve as officers of the Trust. The Administrator is an indirect wholly owned subsidiary of Virtus.
Accounting Services Administrator, Custodian and Transfer Agent
The Bank of New York Mellon (“BNY Mellon”) provides administrative, accounting, tax and financial reporting for the maintenance and operations of the Trust as the Fund’s accounting services administrator. BNY Mellon also serves as the custodian for the Fund’s assets, and serves as transfer agent and dividend paying agent for the Fund.
Affiliated Shareholders
At October 31, 2019, the Sub-Adviser held shares of the Fund which may be redeemed at any time that aggregated to the following:
Fund
| | | | | Shares
| | % of shares
outstanding
|
InfraCap MLP ETF | | | | | 647,816 | | 0.9% |
99
Notes to Financial Statements (continued)
October 31, 2019
4. CREATION AND REDEMPTION TRANSACTIONS
The Fund issues and redeems shares on a continuous basis at Net Asset Value (“NAV”) in groups of 50,000 shares called “Creation Units.” The Fund’s Creation Units may be issued and redeemed generally for cash or an in-kind deposit of securities held by the Fund. In each instance of cash creations or redemptions, the Trust may impose transaction fees based on transaction expenses related to the particular exchange that will be higher than the transaction fees associated with in-kind purchases or redemptions.
Only “Authorized Participants” who have entered into contractual arrangements with the Distributor may purchase or redeem shares directly from the Fund. An Authorized Participant is either (i) a broker-dealer or other participant in the clearing process through the Continuous Net Settlement System of the National Securities Clearing Corporation or (ii) a DTC participant and, in each case, must have executed a Participant Agreement with the Distributor. Most retail investors will not qualify as Authorized Participants or have the resources to buy and sell whole Creation Units. Therefore, they will be unable to purchase or redeem the shares directly from the Fund. Rather, most retail investors will purchase shares in the secondary market with the assistance of a broker and will be subject to customary brokerage commissions or fees.
5. FEDERAL INCOME TAX
The Fund is taxed as a regular C-corporation for federal income tax purposes and as such is obligated to pay federal and applicable state and foreign corporate taxes on its taxable income. Currently, the federal income tax rate for a corporation is 21 percent. This treatment differs from most investment companies, which elect to be treated as “regulated investment companies” under the Code in order to avoid paying entity level income taxes. Under current law, the Fund is not eligible to elect treatment as a regulated investment company due to its investments primarily in MLPs invested in energy assets. The Fund expects that substantially all of the distributions it receives from MLPs may be treated as a tax-deferred return of capital, thus reducing the Fund’s current tax liability. However, the amount of taxes paid by the Fund will vary depending on the amount of income and gains derived from investments and/or sales of MLP interests and such taxes will reduce your return from an investment in the Fund.
Cash distributions from MLPs to the Fund that exceed the Fund’s allocable share of such MLP’s net taxable income are considered a tax deferred return of capital that will reduce the Fund’s adjusted tax basis in the equity securities of the MLP. These reductions in the Fund’s adjusted tax basis in the MLP equity securities will increase the amount of any taxable gain (or decrease the amount of any tax loss) recognized by the Fund on a subsequent sale of the securities. The Fund will accrue deferred income taxes for any future tax liability associated with (i) that portion of MLP distributions considered to be a tax-deferred return of capital as well as (ii) capital appreciation of its investments. Upon the sale of an MLP security, the Fund may be liable for previously deferred taxes. The Fund will rely to some extent on information provided by the MLPs, which is not necessarily timely, to estimate the deferred tax liability for purposes of financial statement reporting and determining the Fund’s NAV. From time to time, the Adviser will modify the estimates or assumptions related to the Fund’s deferred tax liability as new information becomes available. The Fund will generally compute deferred income taxes based on the federal income tax rate applicable to corporations and an assumed rate attributable to state taxes.
The Fund’s income tax expense/(benefit) consists of the following:
As of October 31, 2019
| | | | Current
| | Deferred
| | Total
|
Federal | | | | $ | (2,097,493 | ) | | $ | (14,498,466 | ) | | $ | (16,595,959 | ) |
State | | | | | (122,195 | ) | | | (840,146 | ) | | | (962,341 | ) |
Valuation Allowance | | | | | — | | | | 17,595,233 | | | | 17,595,233 | |
Total Tax Expense/(Benefit) | | | | $ | (2,219,688 | ) | | $ | 2,256,621 | | | $ | 36,933 | |
100
Notes to Financial Statements (continued)
October 31, 2019
Components of the Fund’s deferred tax assets and liabilities are as follows:
| | | | As of
October 31, 2019
| |
Deferred Tax Assets:
| | | | | | | | | | |
Net Operating Loss Carryforward | | | | $ | 3,591,028 | | | | | |
Capital Loss Carryforward | | | | | 21,510,738 | | | | | |
Net Unrealized Loss on Investment | | | | | 10,004,910 | | | | | |
Other | | | | | 161,445 | | | | | |
Total Deferred Tax Assets | | | | | 35,268,121 | | | | | |
Less Valuation Allowance | | | | | (35,268,121 | ) | | | | |
Net Deferred Tax Assets | | | | | — | | | | | |
The Fund reviews the recoverability of its deferred tax assets based upon the weight of available evidence. When assessing the recoverability of its deferred tax assets, significant weight was given to the effects of potential future realized and unrealized gains on investments and the period over which these deferred tax assets can be realized. Currently, any capital losses that may be generated by the Fund in the future are eligible to be carried back up to three years and can be carried forward for five years to offset capital gains recognized by the Fund in those years. The Fund has a current capital loss carryforward of $94,089,487 of which $1,077,957 expires in 2021, $1,089,837 of which expires in 2023 and $91,921,693 expires in 2024. The Tax Cuts and Jobs Act (TCJA) eliminated the net operating loss carryback ability and replaced the 20 year carryforward period with an indefinite carryforward period for any net operating losses arising in tax years ending after December 31, 2017. Therefore, net operating losses that may be generated by the Fund this year and in the future are eligible to be carried forward indefinitely to offset income generated by the Fund in those years but are no longer eligible to be carried back. The TCJA also established a limitation for any net operating losses generated in tax years beginning after December 31, 2017 to the lesser of the aggregate of available net operating losses or 80% of taxable income before any net operating loss utilization. The Fund has a current net operating loss carryforward of $15,707,409 of which $987,995 can be carried back 2 years and carried forward until expiration in 2036. $7,801,883 cannot be carried back and will be carried forward indefinitely until it is utilized. The remaining $6,917,531 of the net operating loss carryforward cannot be carried back and will be carried forward indefinitely subject to the aforementioned 80% limitation.
Based upon the Fund’s assessment, it has determined that it is “more-likely-than-not” that a portion of its deferred tax assets will not be realized through future taxable income of the appropriate character. Accordingly, a valuation allowance has been established for the Fund’s deferred tax assets. The Fund will continue to assess the need for a valuation allowance in the future. Significant changes in the fair value of its portfolio of investments may change the Fund’s assessment of the recoverability of these assets and may result in an adjustment of the valuation allowance against all or a portion of the Fund’s gross deferred tax assets.
Total income tax (benefit)/expense (current and deferred) differs from the amount computed by applying the federal statutory income tax rate of 21% to net investment and realized and unrealized gain/(losses) on investment before taxes as follows for the Fund:
| | | | Amount
| Rate
|
Income Tax (Benefit) at Statutory Rate | | | | $ | (15,635,136 | ) | 21.00% | |
State Income Taxes (Net of Federal Benefit) | | | | | (1,386,315 | ) | 1.86% | |
Permanent Differences, Net | | | | | (197,744 | ) | 0.27% | |
Effect of State Tax Rate Change | | | | | 412,578 | | (0.55)% | |
Provision to Return Adjustment | | | | | (788,616 | ) | 1.06% | |
Federal Income Tax Penalties | | | | | 36,933 | | (0.05)% | |
Valuation Allowance | | | | | 17,595,233 | | (23.63)% | |
Net Income Tax Expense/(Benefit) | | | | $ | 36,933 | | (0.04)% | |
The Fund recognizes interest accrued related to unrecognized tax benefits and penalties as income tax expense. For the year from inception to October 31, 2019, the Fund has accrued penalties and interest of $36,933.
101
Notes to Financial Statements (continued)
October 31, 2019
The Fund recognizes the tax benefits of uncertain tax positions only where the position is “more-likely-than-not” to be sustained assuming examination by tax authorities. Management has analyzed the Fund’s tax positions, and has concluded that no liability for unrecognized tax benefits should be recorded related to uncertain tax positions taken on U.S. tax returns and state tax returns filed since inception of the Fund. No U.S. federal or state income tax returns are currently under examination. The Fund’s tax years, October 31, 2016, October 31, 2017 and October 31, 2018, remain subject to examination by tax authorities in the United States. Due to the nature of the Fund’s investments, the Fund may be required to file income tax returns in several states. The Fund is not aware of any tax positions for which it is reasonably possible that the total amounts of unrecognized tax benefits will change materially in the next 12 months.
The adjusted cost basis of investments and gross unrealized appreciation and depreciation of investments excluding written options and securities sold short, for federal income tax purposes were as follows:
Fund
| | | | Federal Tax Cost
Of Investments
| | Gross
Unrealized
Appreciation
| | Gross
Unrealized
Depreciation
| | Net Unrealized
Appreciation
(Depreciation)
|
InfraCap MLP ETF | | | | $ | 478,694,561 | | | $ | 9,688,263 | | | $ | (52,957,256 | ) | | $(43,268,993) |
6. INVESTMENT TRANSACTIONS
Purchases and sales of investments (excluding short-term investments), subscriptions in-kind and redemptions in-kind for the year ended October 31, 2019 were as follows:
Fund
| | | | Purchases
| | Sales
| | Subscriptions
In-Kind
| | Redemptions
In-Kind
|
InfraCap MLP ETF | | | | $ | 783,904,330 | | | $ | 1,029,039,486 | | | $ | 48,286,679 | | | $ — |
7. DERIVATIVE FINANCIAL INSTRUMENTS
Options
The Fund may write covered call and put options on portfolio securities and other financial instruments. Premiums received are recorded as liabilities. The liabilities are subsequently adjusted to reflect the current value of the options written. Premiums received from writing options that expire are treated as realized gains. Premiums received from writing options that are exercised or are closed are added to or offset against the proceeds or amount paid on the transactions to determine the net realized gain or loss. By writing a covered call option, the Fund, in exchange for the premium, foregoes the opportunity for capital appreciation above the exercise price should the market price of the underlying security increase. By writing a put option, the Fund, in exchange for the premium, accepts the risk of having to purchase a security at an exercise price that is above the current price. Changes in value of written options are reported as change in unrealized gain (loss) on written options in the Statement of Operations. When the written option expires, is terminated or is sold, the Fund will record a gain or loss, which is reported as realized gain (loss) on written options in the Statement of Operations. Written covered call options limit the upside potential of a security above the strike price. Written put options subject the Fund to risk of loss if the value of the security declines below the exercise price minus the put premium.
The Fund may purchase call and put options on the portfolio securities or other financial instruments. The Fund may purchase call options to protect against an increase in the price of the security or financial instrument it anticipates purchasing. The Fund may purchase put options on securities which it holds or other financial instruments to protect against a decline in the value of the security or financial instrument or to close out covered written positions. Changes in value of purchased options are reported as part of change in unrealized gain (loss) on investments in the Statement of Operations. When the purchased option expires, is terminated or is sold, the Fund will record a gain or loss, which is reported as part of realized gain (loss) on investments in the Statement of Operations. Risks may arise from an imperfect correlation between the change in market value of the securities held by the Fund and the prices of options relating to the securities purchased or sold by the Fund and from the possible lack of liquid secondary market for an option. The maximum exposure to loss for any purchased option is limited to the premium initially paid for the option.
102
Notes to Financial Statements (continued)
October 31, 2019
Transactions in derivative instruments reflected on the Statement of Assets and Liabilities at October 31, 2019, are:
Assets
| | | | Equity Risk
| |
Investments* | | | | $ | 383,175 | | | | | |
Liabilities
| | | | Equity Risk
| |
Written options, at value | | | | $ | 994,539 | | | | | |
* | | Purchased option contracts are included in Investments on the Statement of Assets and Liabilities. |
Transactions in derivative instruments reflected on the Statement of Operations during the year were as follows:
Net Realized Gain (Loss) on:
| | | | Equity Risk
| |
Investments** | | | | $ | 8,352,867 | | | | | |
Written options | | | | | 3,156,010 | | | | | |
** | | Purchased option contracts are included in Net Realized Gain (Loss) on Investments on the Statement of Operations. |
Change in Net Unrealized Appreciation (Depreciation) on:
| | | | Equity Risk
| |
Investments*** | | | | $ | 2,654,814 | | | | | |
Written options | | | | | (1,544,214 | ) | | | | |
*** | | Purchased option contracts are included in Change in Net Unrealized Appreciation (Depreciation) on Investments in the Statement of Operations. |
For the year ended October 31, 2019, the monthly average market value of the purchased options and written options contracts held by the Fund were $608,248 and $(2,219,363), respectively.
8. BORROWINGS
The Fund entered into a Lending Agreement (the “Agreement”) with a commercial bank (the “Bank”) that allows the Fund to borrow cash from the Bank. Borrowings under the Agreement are collateralized by investments of the Fund. If the Fund defaults with respect to any of its obligations under the Agreement, the Bank may foreclose on assets of the Fund and/or the Fund may be required to repay immediately, in part or in full, the loan balance outstanding under the Agreement, necessitating the sale of securities at potentially inopportune times. Interest is charged at the 3 Month LIBOR (London Interbank Offered Rate) plus an additional percentage rate on the amount borrowed. The Agreement has an on-demand commitment term. For the year ended October 31, 2019, the average daily borrowings under the Agreement and the daily average interest rate were $150,827,806 and 3.66%, respectively.
At October 31, 2019, the amount of such outstanding borrowings was as follows:
Outstanding Borrowings
| | | | Interest Rate
|
$ 119,386,608
| | | | 3.10% |
9. INVESTMENT RISKS
As with any investment, an investment in the Fund could result in a loss or the performance of the Fund could be inferior to that of other investments. An investor should consider the Fund’s investment objectives, risks, and charges and expenses carefully before investing. The Fund’s prospectus and statement of additional information contain this and other important information.
MLP Risk
Investments in securities of MLPs involve risks that differ from investments in common stock including risks related to limited control and limited rights to vote on matters affecting the MLP, risks related to potential conflicts of interest between the MLP and the MLP’s general partner and cash flow risks. MLP common units and other equity securities can be affected by macro-economic and other factors affecting the stock market in general, expectations of interest rates, investor sentiment towards MLPs or the energy sector, changes in a particular issuer’s financial condition or unfavorable or unanticipated poor performance of a particular issuer (in the case of MLPs, generally measured in terms of distributable cash flow). Prices of common units of individual MLPs and other equity securities also can be affected by fundamentals unique to the partnership or company, including earnings power and coverage ratios.
103
Notes to Financial Statements (continued)
October 31, 2019
10. 10% SHAREHOLDERS
As of October 31, 2019, the Fund had individual shareholder account(s) and/or omnibus shareholder account(s) (comprised of a group of individual shareholders), which individually amounted to more than 10% of the total shares outstanding of the Fund as detailed below:
Fund
| | | | | % of Shares
Outstanding
| | Number of
Accounts
| |
InfraCap MLP ETF | | | | | 52% | | 3 | |
11. SUBSEQUENT EVENTS
Management has evaluated subsequent events through the issuance of these financial statements and has determined that there are no material events that would require disclosure.
104
Report of Independent Registered Public Accounting Firm
October 31, 2019
To the Board of Trustees of ETFis Series Trust I and Shareholders of InfraCap REIT Preferred ETF, Virtus Glovista Emerging Markets ETF, Virtus InfraCap U.S. Preferred Stock ETF, Virtus LifeSci Biotech Clinical Trials ETF, Virtus LifeSci Biotech Products ETF, Virtus Newfleet Multi-Sector Bond ETF, Virtus Private Credit Strategy ETF, Virtus Real Asset Income ETF and Virtus WMC Global Factor Opportunities ETF
Opinions on the Financial Statements
We have audited the accompanying statements of assets and liabilities, including the schedules of investments, of each of the funds indicated in the table below (nine of the funds constituting ETFis Series Trust I, hereafter collectively referred to as the “Funds”) as of October 31, 2019, the related statements of operations, the statement of cash flows for Virtus InfraCap U.S. Preferred Stock ETF, the statements of changes in net assets, including the related notes, and the financial highlights for each of the periods indicated in the table below (collectively referred to as the “financial statements”). In our opinion, the financial statements present fairly, in all material respects, the financial position of each of the Funds as of October 31, 2019, the results of each of their operations, the cash flows for Virtus InfraCap U.S. Preferred Stock ETF, the changes in each of their net assets, and each of the financial highlights for each of the periods indicated in the table below, in conformity with accounting principles generally accepted in the United States of America.
Fund Name
|
|
|
| Statements of Operations
|
| Statements of
Changes in Net Assets
|
| Statement of
Cash Flows
|
| Financial Highlights
|
InfraCap REIT Preferred ETF | | | | For the year ended October 31, 2019 | | For the years ended October 31, 2019 and 2018 | | Not applicable | | For the years ended October 31, 2019 and 2018, and the period from February 7, 2017 (commencement of operations) through October 31, 2017 |
Virtus Glovista Emerging Markets ETF | | | | For the year ended October 31, 2019 | | For the year ended October 31, 2019 and the period from November 7, 2017 (commencement of operations) through October 31, 2018 | | Not applicable | | For the year ended October 31, 2019 and the period from November 7, 2017 (commencement of operations) through October 31, 2018 |
Virtus InfraCap U.S. Preferred Stock ETF | | | | For the year ended October 31, 2019 | | For the year ended October 31, 2019 and the period from May 15, 2018 (commencement of operations) through October 31, 2018 | | For the year ended October 31, 2019 | | For the year ended October 31, 2019 and the period from May 15, 2018 (commencement of operations) through October 31, 2018 |
| | | | | | | | | | | |
Virtus LifeSci Biotech Clinical Trials ETF
Virtus LifeSci Biotech Products ETF
Virtus Newfleet
Multi-Sector Bond ETF | | | | For the year ended October 31, 2019 | | For the years ended October 31, 2019 and 2018 | | Not applicable | | For the years ended October 31, 2019, 2018 and 2017 |
| | | | | | | | | | | |
Virtus Private Credit Strategy ETF
Virtus Real Asset Income ETF | | | | For the period from February 7, 2019 (commencement of operations) through October 31, 2019 | | For the period from February 7, 2019 (commencement of operations) through October 31, 2019 | | Not applicable | | For the period from February 7, 2019 (commencement of operations) through October 31, 2019 |
Virtus WMC Global Factor Opportunities ETF | | | | For the year ended October 31, 2019 | | For the years ended October 31, 2019 and 2018 | | Not applicable | | For the year ended October 31, 2019 and 2018, and the period from October 10, 2017 (commencement of operations) through October 31, 2017 |
105
Report of Independent Registered Public Accounting Firm (continued)
October 31, 2019
The financial statements of Virtus LifeSci Biotech Clinical Trials ETF, Virtus LifeSci Biotech Products ETF and Virtus Newfleet Multi-Sector Bond ETF as of and for the year ended October 31, 2016 and the financial highlights for each of the periods ended on or prior to October 31, 2016 (not presented herein, other than the financial highlights) were audited by other auditors whose report dated December 29, 2016 expressed an unqualified opinion on those financial statements and financial highlights.
Basis for Opinions
These financial statements are the responsibility of the Funds’ management. Our responsibility is to express an opinion on the Funds’ financial statements based on our audits. We are a public accounting firm registered with the Public Company Accounting Oversight Board (United States) (“PCAOB”) and are required to be independent with respect to the Funds in accordance with the U.S. federal securities laws and the applicable rules and regulations of the Securities and Exchange Commission and the PCAOB.
We conducted our audits of these financial statements in accordance with the standards of the PCAOB. Those standards require that we plan and perform the audit to obtain reasonable assurance about whether the financial statements are free of material misstatement, whether due to error or fraud.
Our audits included performing procedures to assess the risks of material misstatement of the financial statements, whether due to error or fraud, and performing procedures that respond to those risks. Such procedures included examining, on a test basis, evidence regarding the amounts and disclosures in the financial statements. Our audits also included evaluating the accounting principles used and significant estimates made by management, as well as evaluating the overall presentation of the financial statements. Our procedures included confirmation of securities owned as of October 31, 2019 by correspondence with the custodian, transfer agent and brokers; when replies were not received from brokers, we performed other auditing procedures. We believe that our audits provide a reasonable basis for our opinions.
/s/ PricewaterhouseCoopers LLP
Philadelphia, Pennsylvania
December 20, 2019
We have served as the auditor of one or more investment companies in Virtus ETF Solutions since 2017.
106
Report of Independent Registered Public Accounting Firm (continued)
October 31, 2019
To the Board of Trustees of ETFis Series Trust I and Shareholders of InfraCap MLP ETF
Opinion on the Financial Statements
We have audited the accompanying statement of assets and liabilities, including the schedule of investments, of InfraCap MLP ETF (one of the funds constituting ETFis Series Trust I, hereafter referred to as the “Fund”) as of October 31, 2019, the related statement of operations and cash flows for the year ended October 31, 2019, the statement of changes in net assets for each of the two years in the period ended October 31, 2019, including the related notes, and the financial highlights for each of the three years in the period ended October 31, 2019 (collectively referred to as the “financial statements”). In our opinion, the financial statements present fairly, in all material respects, the financial position of the Fund as of October 31, 2019, the results of its operations and its cash flows for the year then ended, the changes in its net assets for each of the two years in the period ended October 31, 2019 and the financial highlights for each of the three years in the period ended October 31, 2019 in conformity with accounting principles generally accepted in the United States of America.
The financial statements of the Fund as of and for the year ended October 31, 2016 and the financial highlights for each of the periods ended on or prior to October 31, 2016 (not presented herein, other than the financial highlights) were audited by other auditors whose report dated December 29, 2016 expressed an unqualified opinion on those financial statements and financial highlights.
Basis for Opinion
These financial statements are the responsibility of the Fund’s management. Our responsibility is to express an opinion on the Fund’s financial statements based on our audits. We are a public accounting firm registered with the Public Company Accounting Oversight Board (United States) (“PCAOB”) and are required to be independent with respect to the Fund in accordance with the U.S. federal securities laws and the applicable rules and regulations of the Securities and Exchange Commission and the PCAOB.
We conducted our audits of these financial statements in accordance with the standards of the PCAOB. Those standards require that we plan and perform the audit to obtain reasonable assurance about whether the financial statements are free of material misstatement, whether due to error or fraud.
Our audits included performing procedures to assess the risks of material misstatement of the financial statements, whether due to error or fraud, and performing procedures that respond to those risks. Such procedures included examining, on a test basis, evidence regarding the amounts and disclosures in the financial statements. Our audits also included evaluating the accounting principles used and significant estimates made by management, as well as evaluating the overall presentation of the financial statements. Our procedures included confirmation of securities owned as of October 31, 2019 by correspondence with the custodian and brokers; when replies were not received from brokers, we performed other auditing procedures. We believe that our audits provide a reasonable basis for our opinion.
/s/ PricewaterhouseCoopers LLP
Philadelphia, Pennsylvania
December 20, 2019
We have served as the auditor of one or more investment companies in Virtus ETF Solutions since 2017.
107
Trustees and Officers of the Trust (unaudited)
TRUSTEES AND OFFICERS OF THE TRUST The Trustees of the Trust, their addresses, positions with the Trust, years of birth, length of time served, principal occupations during the past five years, the number of portfolios in the Fund Complex overseen by each Trustee and other directorships, if any, held by the Trustees are set forth below. The SAI includes additional information about the Fund’s Trustees and is available, without charge, upon request, by calling the Adviser (toll-free) at (888)-383-4184.
Name and
Year of Birth | Position(s) Held
with Trust | Length of
Time Served | Principal Occupation(s)
During Past Five Years | Number of
Portfolios in
Fund Complex*
Overseen by
Trustee | Other
Directorships
Held by Trustee
During Past
Five Years |
INDEPENDENT TRUSTEES
|
James Simpson
Year of Birth: 1970 | Trustee | Since Inception | President (since 2009), ETP Resources, LLC (a financial services consulting company). | 13 | Trustee (since 2018), Asset Management Fund (5 portfolios); Trustee (since 2015), Virtus ETF Trust II (2 portfolios) |
Robert S. Tull
Year of Birth: 1952 | Trustee | Since Inception | Independent Consultant (since 2013); President (since 2017), ProcureAM, LLC. | 13 | Trustee (since 2015), Virtus ETF Trust II (2 portfolios); Trustee (since 2018), Procure ETF Trust II |
Stephen O’Grady
Year of Birth: 1946 | Trustee | Since 2014 | Lead Market Maker (2011-2012), GFI Group; Partner (2004-2011), Kellogg Capital Markets. | 13 | Trustee (since 2015), Virtus ETF Trust II (2 portfolios);
Trustee (2013-2015),
Greenhaven LLC; Trustee (since 2014), Acacia Group LLC; Trustee (since 2014), ETFS Trust (5 portfolios) |
Myles J. Edwards
Year of Birth: 1961 | Trustee | Since 2016 | Chief Executive Officer (since 2018), Final Compliance; Chief Compliance Officer (since 2018), Knight Vinke; General Counsel, CCO and COO (2014-2018), Shufro, Rose & Co., LLC; General Counsel and CCO (2011-2014), Constellation Wealth Advisers, LLC. | 13 | Trustee (since 2015), Virtus ETF Trust II (2 portfolios) |
INTERESTED TRUSTEE**
|
William J. Smalley
Year of Birth: 1983 | Trustee, President and Chief Executive Officer | Since Inception | President (since 2012), Virtus ETF Solutions LLC; Managing Principal (2012-2019), ETF Distributors LLC; Managing Director (since 2012), Virtus ETF Advisers LLC; President and Chief Executive Officer (since 2012), ETFis Series Trust I; and President and Chief Executive Officer (since 2015), Virtus ETF Trust II. | 11 | None |
108
Trustees and Officers of the Trust (unaudited) (continued)
Name and
Year of Birth | Position(s) Held
with Trust | Length of
Time Served | Principal Occupation(s)
During Past Five Years | Number of
Portfolios in
Fund Complex*
Overseen by
Trustee | Other
Directorships
Held by Trustee
During Past
Five Years |
OTHER EXECUTIVE OFFICERS
|
Kevin J. Carr
Year of Birth: 1954 | Secretary | Since 2015 | Vice President and Senior Counsel (2017 to present); Senior Vice President (2009 to 2017), Vice President, Counsel and Secretary (2008 to 2009), Virtus Investment Partners, Inc. and/or certain of its subsidiaries; various senior officer positions (since 2005) with Virtus affiliates; Senior Vice President (since 2013), Vice President (2005 to 2013), Chief Legal Officer, Counsel and Secretary (since 2005), Virtus Mutual Fund Family; Senior Vice President (2013 to 2014), Vice President (2012 to 2013), Secretary and Chief Legal Officer (2005 to 2013), and Assistant Secretary (2013 to 2014 and since 2017), Virtus Total Return Fund Inc.; Senior Vice President (since 2017), Assistant Secretary (since 2013), Vice President, Chief Legal Officer, Counsel and Secretary (2010 to 2013), Virtus Variable Insurance Trust; Senior Vice President (2013 to 2014), Vice President (2011 to 2013), and Assistant Secretary (since 2011), Virtus Global Multi- Sector Income Fund; Assistant Secretary (since 2015), Duff & Phelps Select MLP and Midstream Energy Fund Inc.; Senior Vice President (since 2017), Assistant Secretary (since 2013), Virtus Alternative Solutions Trust; and Secretary (since 2015), ETFis Series Trust I and Virtus ETF Trust II. | N/A | N/A |
Brinton W. Frith Year of Birth: 1969 | Treasurer and Chief Financial Officer | Since Inception | President (since 2013), Virtus ETF Advisers LLC; Managing Director (since 2013), Virtus ETF Solutions LLC; Treasurer and Chief Financial Officer (since 2013), ETFis Series Trust I; and Treasurer and Chief Financial Officer (since 2015), Virtus ETF Trust II. | N/A | N/A |
Nancy J. Engberg Year of Birth: 1956 | Chief Compliance Officer | Since 2015 | Senior Vice President (since 2017); Vice President (2008 to 2017) and Chief Compliance Officer (2008 to 2011 and since 2016), Virtus Investment Partners, Inc. and/or certain of its subsidiaries; various officer positions (since 2003) with Virtus affiliates; Senior Vice President (since 2017), Vice President (2011 to 2017) and Chief Compliance Officer (since 2011), Virtus Mutual Fund Family; Senior Vice President (since 2017), Vice President (2010 to 2017) and Chief Compliance Officer (since 2011), Virtus Variable Insurance Trust; Senior Vice President (since 2017), Vice President (2011 to 2017) and Chief Compliance Officer (since 2011), Virtus Global Multi-Sector Income Fund; Senior Vice President (since 2017), Vice President (2012 to 2017) and Chief Compliance Officer (since 2012), Virtus Total Return Fund Inc.; Senior Vice President (since 2017), Vice President (2013 to 2017) and Chief Compliance Officer (since 2013), Virtus Alternative Solutions Trust; Senior Vice President (since 2017), Vice President (2014 to 2017) and Chief Compliance Officer (since 2014), Duff & Phelps Select MLP and Midstream Energy Fund Inc.; Chief Compliance Officer (since 2015), ETFis Series Trust I and Virtus ETF Trust II. | N/A | N/A |
The address for each Trustee and officer is 1540 Broadway, 16th Floor, New York, NY 10036. Each Trustee serves until resignation, death, retirement or removal. Officers are elected yearly by the Trustees.
* | | As of October 31, 2019, the Fund Complex consisted of the Trust, which consisted of eleven portfolios—InfraCap REIT Preferred ETF, Virtus Glovista Emerging Markets ETF, Virtus InfraCap U.S. Preferred Stock ETF, Virtus LifeSci Biotech Clinical Trials ETF, Virtus LifeSci Biotech Products ETF, Virtus Newfleet Multi- Sector Bond ETF, Virtus Private Credit Strategy ETF, Virtus Real Asset Income ETF, Virtus Reaves Utilities ETF, Virtus WMC Global Factor Opportunities ETF and InfraCap MLP ETF, and Virtus ETF Trust II, which consisted of two portfolios—Virtus Newfleet Dynamic Credit ETF and Virtus Seix Senior Loan ETF. |
** | | William J. Smalley is an “interested person” as defined in the Investment Company Act of 1940, because he is an employee of the Adviser. |
109
Supplemental Information (unaudited)
INFORMATION ABOUT PORTFOLIO HOLDINGS
The Funds file their complete schedule of portfolio holdings for their first and third fiscal quarters with the Securities and Exchange Commission (“SEC”) on Form N-PORT. The Funds’ Form N-PORT are available without charge, upon request, by calling toll-free at (888) 383-0553. Furthermore, you may obtain the Form N-PORT on the SEC’s website atwww.sec.gov. The Funds’ portfolio holdings are posted daily on the Funds’ website atwww.virtusetfs.com.
The Funds’ premium/discount information for the most recently completed calendar year, and the most recently completed calendar quarters since that year is available by visitingwww.virtusetfs.com or by calling (888) 383-4184.
INFORMATION ABOUT PROXY VOTING
A description of the policies and procedures the Funds use to determine how to vote proxies relating to portfolio securities is provided in the Statement of Additional Information (“SAI”). The SAI is available without charge upon request by calling toll-free at (888) 383-0553, by accessing the SEC’s website atwww.sec.gov, or by accessing the Funds’ website atwww.virtusetfs.com.
Information regarding how the Funds voted proxies relating to portfolio securities during the most recent twelve-month period ended June 30th is available by calling toll-free at (888) 383-0553 or by accessing the SEC’s website atwww.sec.gov.
TAX INFORMATION
For the fiscal year ended October 31, 2019, the Funds make the following disclosures for federal income tax purposes. Below is listed the percentages, or the maximum amount allowable, of its ordinary income dividends (“QDI”) to qualify for the lower tax rates applicable to individual shareholders, and the percentage of ordinary income dividends earned by each Fund which qualifies for the dividends received deduction (“DRD”) for corporate shareholders. The actual percentage of QDI and DRD for the calendar year will be designated in year-end tax statements.
Funds
| | | | QDI
| | DRD
|
InfraCap REIT Preferred ETF | | | | | 1.83 | % | | | 0.05 | % |
Virtus Glovista Emerging Markets ETF | | | | | 77.36 | % | | | 2.95 | % |
Virtus InfraCap U.S. Preferred Stock ETF | | | | | 16.69 | % | | | 14.47 | % |
Virtus LifeSci Biotech Clinical Trials ETF | | | | | 0.00 | % | | | 0.00 | % |
Virtus LifeSci Biotech Products ETF | | | | | 0.00 | % | | | 0.00 | % |
Virtus Newfleet Multi-Sector Bond ETF | | | | | 0.00 | % | | | 0.00 | % |
Virtus Private Credit Strategy ETF | | | | | 0.46 | % | | | 2.40 | % |
Virtus Real Asset Income ETF | | | | | 74.81 | % | | | 31.77 | % |
Virtus WMC Global Factor Opportunities ETF | | | | | 77.95 | % | | | 31.57 | % |
For the fiscal year ended October 31, 2019, certain Funds are disclosing the following information pursuant to notice requirements of Section 853(a) and 855(d) of the Internal Revenue Code, as amended, and the Treasury Regulations thereunder.
Funds
| | | | Foreign Source
Income Recognized
| Foreign Tax
Credit Pass-Through
|
InfraCap REIT Preferred ETF | | | | | — | | — |
Virtus Glovista Emerging Markets ETF | | | | | $374,418 | | $45,176 |
Virtus InfraCap U.S. Preferred Stock ETF | | | | | — | | — |
Virtus LifeSci Biotech Clinical Trials ETF | | | | | — | | — |
Virtus LifeSci Biotech Products ETF | | | | | — | | — |
Virtus Newfleet Multi-Sector Bond ETF | | | | | — | | — |
Virtus Private Credit Strategy ETF | | | | | — | | — |
Virtus Real Asset Income ETF | | | | | — | | — |
Virtus WMC Global Factor Opportunities ETF | | | | | — | | — |
110
c/o VP Distributors, LLC
One Financial Plaza
Hartford, Connecticut 06103
8572(12/19)
Item 2. Code of Ethics.
As of the end of the period covered by this report, the registrant has adopted a code of ethics that applies to the registrant’s principal executive officer, principal financial officer, principal accounting officer or controller, or persons performing similar functions, regardless of whether these individuals are employed by the registrant or a third party. Other than certain non-substantive changes, there have been no amendments, during the period covered by this report, to a provision of the code of ethics that applies to the registrant’s principal executive officer, principal financial officer, principal accounting officer or controller, or persons performing similar functions, regardless of whether these individuals are employed by the registrant or a third party, and that relates to any element of the code of ethics described in Item 2(b) of the instructions for completion of Form N-CSR. Pursuant to Item 13(a)(1), a copy of registrant’s amended code of ethics has been filed with the Commission. During the period covered by this report, the registrant has not granted any waivers, including implicit waivers, from the provisions of the code of ethics.
Item 3. Audit Committee Financial Expert.
The registrant's board of trustees has determined that the registrant does not have an audit committee financial expert serving on its audit committee. At this time, the registrant's board of trustees believes that the collective experience provided by the members of the audit committee together offer the registrant adequate oversight for the registrant's level of financial complexity.
Item 4. Principal Accountant Fees and Services.
Audit Fees
| (a) | The aggregate fees billed for professional services rendered by the principal accountant for the audit of the registrant’s annual financial statements or for services that are normally provided by the accountant in connection with statutory and regulatory filings or engagements were $183,800 and $161,100 respectively, for the registrant’s fiscal years ended October 31, 2018 and October 31, 2019. |
Audit-Related Fees
| (b) | No fees were billed in the registrant’s fiscal years ended October 31, 2018 and October 31, 2019 for assurance and related services rendered by the principal accountant to the registrant that are |
reasonably related to the performance of the audit of the registrant’s financial statements and are not reported under paragraph (a) of this Item.
The aggregate fees billed for assurance and related services rendered by the principal accountant to the registered investment company’s investment adviser (not including a sub-adviser whose role is primarily portfolio management and is sub-contracted or overseen by another investment adviser) and any entity controlling, controlled by, or under common control with the investment adviser that provides ongoing services to the registered investment company, that are reasonably related to the performance of the audit of the registrant’s financial statements were $250,413 and $58,000, respectively, for the registrant’s fiscal years ended October 31, 2018 and October 31, 2019.
Tax Fees
| (c) | The aggregate fees billed for professional services rendered by the principal accountant to the registrant for tax compliance, tax advice, and tax planning were $131,150 and $148,750 respectively, for the registrant’s fiscal years ended October 31, 2018 and October 31, 2019. |
The aggregate fees billed for professional services rendered by the principal accountant to the registered investment company’s investment adviser (not including a sub-adviser whose role is primarily portfolio management and is sub-contracted or overseen by another investment adviser) and any entity controlling, controlled by, or under common control with the investment adviser that provides ongoing services to the registered investment company, for tax compliance, tax advice, and tax planning were $545,065 and $600,175, respectively, for the registrant’s fiscal years ended October 31, 2018 and October 31, 2019.
“Tax Fees” are those primarily associated with review of the Trust’s tax provision and qualification as a regulated investment company (RIC) in connection with audits of the Trust’s financial statements, review of year-end distributions by the Funds to avoid excise tax for the Trust, periodic discussion with management on tax issues affecting the Trust, and reviewing and signing the Funds’ federal income tax returns.
All Other Fees.
| (d) | The aggregate fees billed for products and services rendered by the principal accountant to the registrant, other than the services reported in paragraphs (a) through (c) of this Item, were $10,423 and $15,435, respectively, for the registrant’s fiscal years ended October 31, 2018 and October 31, 2019. |
The aggregate fees billed for products and services rendered by the principal accountant to the registered investment company’s investment adviser (not including a sub-adviser whose role is primarily portfolio management and is sub-contracted or overseen by another investment adviser) and any entity controlling, controlled by, or under common control with the investment adviser that provides ongoing services to the registered investment company, other than the services reported in paragraphs (a) through (c) of this Item, were $413,519 and 103,294, respectively for the registrant’s fiscal years ended October 31, 2018 and October 31, 2019.
| (e)(1) | The audit committee has not adopted pre-approval policies and procedures described in paragraph (c)(7) of Rule 2-01 of Regulation S-X. |
| (e)(2) | None of the services described in paragraph (b) through (d) of this Item were approved by the audit committee pursuant to paragraph (c)(7)(i)(C) of Rule 2-01 of Regulation S-X. |
| (f) | Less than 50% of hours expended on the principal accountant’s engagement to audit the registrant’s financial statements for the most recent fiscal year were attributed to work performed by persons other than the principal accountant’s full-time, permanent employees. |
| (g) | During the fiscal years ended October 31, 2018 and October 31, 2019, aggregate non-audit fees of $1,100,157 and $867,654, respectively, were billed by the registrant’s accountant for services rendered to the registrant and the registrant’s investment adviser (not including any sub-adviser whose role is primarily portfolio management and is subcontracted with or overseen by another investment adviser), and any entity controlling, controlled by, or under common control with the adviser that provides ongoing services to the registrant. |
Item 5. Audit Committee of Listed registrants.
| (a) | The registrant has a separately designated audit committee consisting of all the independent directors of the registrant. The members of the audit committee are: Stephen G. O’Grady, James A. Simpson, Robert S. Tull, Jr. and Myles Edwards. |
| (b) | If applicable, provide the disclosure required by Rule 10A-3(d) under the Exchange Act (17 CFR 240.10A-3(d)) regarding an exemption from the listing standards for audit committees. |
Item 6. Investments.
| (a) | Schedule of Investments in securities of unaffiliated issuers as of the close of the reporting period is included as part of the report to shareholders filed under Item 1 of this Form. |
| Item 7. | Disclosure of Proxy Voting Policies and Procedures for Closed-End Management Investment Companies. |
Not applicable.
Item 8. Portfolio Managers of Closed-End Management Investment Companies.
Not applicable.
| Item 9. | Purchases of Equity Securities by Closed-End Management Investment Company and Affiliated Purchasers. |
Not applicable.
Item 10. Submission of Matters to a Vote of Security Holders.
None.
Item 11. Controls and Procedures.
| (a) | The registrant’s principal executive and principal financial officers, or persons performing similar functions, have concluded that the registrant’s disclosure controls and procedures (as defined in Rule 30a-3(c) under the Investment Company Act of 1940, as amended (the “1940 Act”) (17 CFR 270.30a-3(c))) are effective, as of a date within 90 days of the filing date of the report that includes the disclosure required by this paragraph, based on their evaluation of these controls and procedures required by Rule 30a-3(b) under the 1940 Act (17 CFR 270.30a-3(b)) and Rules 13a-15(b) or 15d-15(b) under the Securities Exchange Act of 1934, as amended (17 CFR 240.13a-15(b) or 240.15d-15(b)). |
| (b) | There were no changes in the registrant’s internal control over financial reporting (as defined in Rule 30a-3(d) under the 1940 Act (17 CFR 270.30a-3(d)) that occurred during the period covered by this report that has materially affected, or is reasonably likely to materially affect, the registrant’s internal control over financial reporting. |
| Item 12. | Disclosure of Securities Lending Activities for Closed-End Management Investment Companies. |
Not applicable.
Item 13. Exhibits.
(a)(1) Code of ethics, or any amendment thereto, that is the subject of disclosure required by Item 2 is incorporated by reference to registrant’s Form N-CSR, filed January 8, 2018 (https://www.sec.gov/Archives/edgar/data/1559109/000089109218000125/e76565ex99code-eth.htm).
| (a)(2) | Certifications pursuant to Rule 30a-2(a) under the 1940 Act and Section 302 of the Sarbanes-Oxley Act of 2002 are attached hereto. |
| | |
| (a)(3) | Not applicable. |
| | |
| | |
| (a)(4) | Not applicable. |
| | |
| | |
| (b) | Certifications pursuant to Rule 30a-2(b) under the 1940 Act and Section 906 of the Sarbanes-Oxley Act of 2002 are attached hereto. |
SIGNATURES
Pursuant to the requirements of the Securities Exchange Act of 1934 and the Investment Company Act of 1940, the registrant has duly caused this report to be signed on its behalf by the undersigned, thereunto duly authorized.
| (Registrant) | ETFis Series Trust I |
| By (Signature and Title)* | /s/ William J. Smalley |
| | William J. Smalley, President and Principal Executive Officer |
| | (principal executive officer) |
Pursuant to the requirements of the Securities Exchange Act of 1934 and the Investment Company Act of 1940, this report has been signed below by the following persons on behalf of the registrant and in the capacities and on the dates indicated.
| By (Signature and Title)* | /s/ William J. Smalley |
| | William J. Smalley, President and Principal Executive Officer |
| | (principal executive officer) |
| By (Signature and Title)* | /s/ Brinton W. Frith |
| | Brinton W. Frith, Treasurer and Principal Financial Officer |
| | (principal financial officer) |
* Print the name and title of each signing officer under his or her signature.