UNITED STATES
SECURITIES AND EXCHANGE COMMISSION
Washington, D.C. 20549
FORM N-CSR
CERTIFIED SHAREHOLDER REPORT OF REGISTERED MANAGEMENT INVESTMENT COMPANIES
Investment Company Act file number 811-22819
ETFis Series Trust I
(Exact name of registrant as specified in charter)
1540 Broadway, 16th Floor
New York, NY 10036
(Address of principal executive offices) (Zip code)
ETFis Series Trust I
c/o Corporation Service Company
2711 Centerville Road, Suite 400
Wilmington, DE 19808
(Name and address of agent for service)
Registrant’s telephone number, including area code: (212) 593-4383
Date of fiscal year end: October 31
Date of reporting period: October 31 , 2018
Form N-CSR is to be used by management investment companies to file reports with the Commission not later than 10 days after the transmission to stockholders of any report that is required to be transmitted to stockholders under Rule 30e-1 under the Investment Company Act of 1940 (17 CFR 270.30e-1). The Commission may use the information provided on Form N-CSR in its regulatory, disclosure review, inspection, and policymaking roles.
A registrant is required to disclose the information specified by Form N-CSR, and the Commission will make this information public. A registrant is not required to respond to the collection of information contained in Form N-CSR unless the Form displays a currently valid Office of Management and Budget ("OMB") control number. Please direct comments concerning the accuracy of the information collection burden estimate and any suggestions for reducing the burden to Secretary, Securities and Exchange Commission, 100 F Street, NE, Washington, DC 20549. The OMB has reviewed this collection of information under the clearance requirements of 44 U.S.C. § 3507.
Item 1. Reports to Stockholders.
The Report to Shareholders is attached herewith.
ETFis Series Trust I
INFRACAP REIT PREFERRED ETF
VIRTUS CUMBERLAND MUNICIPAL BOND ETF
VIRTUS GLOVISTA EMERGING MARKETS ETF
VIRTUS INFRACAP U.S. PREFERRED STOCK ETF
VIRTUS LIFESCI BIOTECH CLINICAL TRIALS ETF
VIRTUS LIFESCI BIOTECH PRODUCTS ETF
VIRTUS NEWFLEET MULTI-SECTOR BOND ETF
VIRTUS WMC GLOBAL FACTOR OPPORTUNITIES ETF
INFRACAP MLP ETF
ANNUAL REPORT
October 31, 2018
Table of Contents
October 31, 2018
| | | | Page (s)
|
| | | | | 3 | |
| | | | | 4 | |
| | | | | 27 | |
| | | | | 30 | |
InfraCap REIT Preferred ETF
| | | | | | |
Virtus Cumberland Municipal Bond ETF
| | | | | | |
Virtus Glovista Emerging Markets ETF
| | | | | | |
Virtus InfraCap U.S. Preferred Stock ETF
| | | | | | |
Virtus LifeSci Biotech Clinical Trials ETF
| | | | | | |
Virtus LifeSci Biotech Products ETF
| | | | | | |
Virtus Newfleet Multi-Sector Bond ETF
| | | | | | |
Virtus WMC Global Factor Opportunities ETF
| | | | | | |
| | | | | 31 | |
| | | | | 61 | |
| | | | | 63 | |
| | | | | 65 | |
| | | | | 69 | |
| | | | | 70 | |
| | | | | 78 | |
InfraCap MLP ETF
| | | | | | |
| | | | | 89 | |
| | | | | 93 | |
| | | | | 94 | |
| | | | | 95 | |
| | | | | 96 | |
| | | | | 97 | |
| | | | | 98 | |
| | | | | 106 | |
| | | | | 109 | |
| | | | | 114 | |
| | | | | 116 | |
2
Shareholder Letter (unaudited)
October 31, 2018
Dear Fellow ETFis Funds Shareholder:
I am pleased to present this annual report for ETFis Series Trust I, which reviews the performance of the following funds within the Trust, including a recent addition, for the twelve months ended October 31, 2018:
• | | InfraCap REIT Preferred ETF (PFFR) |
• | | Virtus Cumberland Municipal Bond ETF (CUMB) |
• | | Virtus Glovista Emerging Markets ETF (EMEM) - Commenced operations on November 7, 2017. |
• | | Virtus InfraCap U.S. Preferred Stock ETF (PFFA) - Commenced operations on May 15, 2018. |
• | | Virtus LifeSci Biotech Clinical Trials Fund (BBC) |
• | | Virtus LifeSci Biotech Products Fund (BBP) |
• | | Virtus Newfleet Multi-Sector Bond ETF (NFLT) |
• | | Virtus WMC Global Factor Opportunities ETF (VGFO) |
• | | InfraCap MLP ETF (AMZA) |
The report provides financial statements and portfolio information for the above funds. For the funds with a performance history of more than six months, the report also provides commentary from the portfolio manager on how the fund performed relative to the markets in which it invests.
On behalf of Virtus ETF Advisers LLC (the “Adviser”) and our fund Sub-Advisers, thank you for your investment. If you have questions, please contact your financial adviser, or call 1-888-383-0553. We invite you to visit our website, www.virtusetfs.com, to learn more about the funds.
Sincerely,
William Smalley
President
ETFis Series Trust I
This material must be accompanies or preceded by the prospectus.
3
Management’s Discussion of Fund Performance (unaudited)
October 31, 2018
InfraCap REIT Preferred ETF Management’s Discussion of Operations
Overview
The InfraCap REIT Preferred ETF (“the Fund”) seeks to track the investment results of an index composed of preferred shares listed on U.S. Exchanges and issued by Real Estate Investment Trusts, as represented by the Indxx REIT Preferred Stock Index (“the Index”). The Fund invests in a representative sample of securities included in the Index that collectively has a profile similar to the Index. Due to the use of representative sampling, the Fund may or may not own all of the securities that are included in the Index.
Update
In the fiscal year ended October 31, 2018, the Fund had a net loss of 2.72% on a market value basis (NYSE price change plus dividends). On a Net Asset Value (NAV) basis, the net loss was 2.60%.
Preferred shares tend to behave fixed income securities, and prices are influenced by changes in long-term interest rates. During the year, the yield on the 30-year U.S. Treasury bond rose 51 basis points, from 2.88% to 3.39%. Yields on preferred shares rose in response, with prices slipping accordingly.
The Fund was further influenced by relatively strong performance in the following three holdings: Chimera Investment Corp Cumulative Pfd. Registered Series B; Armour Residential Reit Inc. 7.875% Cumulative Pfd. Series B; and Invesco Mortgage Capital Inc. Cumulative Pfd. Series A.
The Fund’s total returns were negatively impacted by relatively weak performance in the following three holdings: CBL & Associates Properties Inc. 65⁄8% Perpetual; Farmland Partners Inc 6% Pfd. Registered Series B; and Hersha Hospitality Trust 61⁄2% Cumulated Pfd. Series D.
EXPOSURE BY SECTOR (%) as of 10/31/18
| | | |
Mortgage REITs | | | | | 30.60 | |
Property REITs | | | | | 69.40 | |
Diversified | | | | | 19.08 | |
Storage | | | | | 10.79 | |
Office Property | | | | | 1.08 | |
Regional Malls | | | | | 6.67 | |
Shopping Centers | | | | | 9.83 | |
Health Care | | | | | 4.91 | |
Apartments | | | | | 3.96 | |
Hotels | | | | | 6.25 | |
Single Tenant | | | | | 4.03 | |
Warehouse/Industrial | | | | | 2.07 | |
Farmlands | | | | | 0.73 | |
Total | | | | | 100.00 | |
TOP 10 HOLDINGS (%) as of 10/31/18
| | | |
Welltower Inc | | | | | 4.9 | |
Annaly Capital Management | | | | | 4.0 | |
Annaly Capital Management | | | | | 2.2 | |
Kimco Realty Corporation | | | | | 2.2 | |
KKR & Co Inc | | | | | 2.0 | |
Chimera Investment Corp | | | | | 1.9 | |
AGNC Investment Corp | | | | | 1.8 | |
Colony Capital Inc | | | | | 1.7 | |
National Realty Properties Inc | | | | | 1.7 | |
Arch Capital Group Ltd | | | | | 1.7 | |
4
Management’s Discussion of Fund Performance (unaudited) (continued)
October 31, 2018
InfraCap REIT Preferred ETF (continued)
EXPOSURE BY RATING (%) as of 10/31/18
| | | |
A- | | | | | 9.9 | % |
BBB+ | | | | | 5.3 | % |
BBB | | | | | 23.6 | % |
BBB- | | | | | 6.7 | % |
BB+ | | | | | 4.0 | % |
BB | | | | | 1.3 | % |
BB- | | | | | 2.1 | % |
NR | | | | | 47.0 | % |
Credit quality ratings on underlying securities of the Fund are received from S&P, Moody’s, and Fitch and converted to the equivalent S&P major rating category. This breakdown is provided by Infrastructure Capital Advisors and takes the median rating of the three agencies when all three agencies rate a security, the lower of the two ratings if only two agencies rate a security, and one rating if that is all that is provided. Unrated securities do not necessarily indicate low quality. Below investment-grade is represented by a rating of BB and below. Ratings and portfolio credit quality may change over time.
Performance as of 10/31/2018
| | | | Average Annual Total Return
|
| | | | Fund
Net Asset Value
| | Fund
Market Price
| | Index REIT
Preferred
Stock Index1
|
1 Year | | | | | (2.60 | )% | | | (2.72 | )% | | | (1.69 | )% |
Since Inception2 | | | | | 2.16 | % | | | 2.16 | % | | | 2.96 | % |
| 1 | | The Indxx REIT Preferred Stock Index is a market cap weighted index designed to provide diversified exposure to high yielding liquid preferred securities issued by Real Estate Investment Trusts listed in the U.S. The index is calculated on a total return basis. The index is unmanaged, its returns do not reflect any fees, expenses, or sales charges, and is not available for direct investment. |
Performance data quoted represents past performance and past performance does not guarantee future results. Investment return and principal value of an investment will fluctuate so that an investor’s shares, when sold or redeemed, may be worth more or less than the original cost. Current performance data may be higher or lower than actual data quoted. Returns do not reflect the deduction of taxes a shareholder would pay on Fund distributions or the redemption of Fund shares. For the most current month-end performance data please visit www.virtusetfs.com or call toll free (800) 243-4361. Market price returns are based on the mid-point of the highest bid and lowest offer for Fund shares as of the scheduled close of regular trading on the New York Stock Exchange Arca (“NYSE”), ordinarily 4:00 p.m. Eastern time, on each day during which the NYSE is open for trading, and do not represent the returns an investor would receive if shares were traded at other times.
Exchange Traded Funds: The value of an ETF may be more volatile than the underlying portfolio of securities the ETF is designed to track. The costs of owning the ETF may exceed the cost of investing directly in the underlying securities.
Market Price/NAV: Shares of ETFs often trade at a discount to their net asset value, which may increase investors’ risk of loss. At the time of sale, an investor’s shares may have a market price that is above or below the Fund’s NAV.
Preferred Stocks: Preferred stocks may decline in price, fail to pay dividends, or be illiquid.
Real Estate Investments: The Fund may be negatively affected by factors specific to the real estate market, including interest rates, leverage, property, and management.
Industry/Sector Concentration: A fund that focuses its investments in a particular industry or sector will be more sensitive to conditions that affect that industry or sector than a non-concentrated fund.
Passive Strategy/Index Risk: A passive investment strategy seeking to track the performance of the Underlying Index may result in the fund holding securities regardless of market conditions or their current or projected performance. This could cause the Fund’s returns to be lower than if the Fund employed an active strategy.
5
Management’s Discussion of Fund Performance (unaudited) (continued)
October 31, 2018
InfraCap REIT Preferred ETF (continued)
Correlation to Index: The performance of the Fund and its index may vary somewhat due to factors such as Fund flows, transaction costs, and timing differences associated with additions to and deletions from its index.
Market Volatility: Securities in the Fund may go up or down in response to the prospects of individual companies and general economic conditions. Price changes may be short or long term.
No Guarantee: There is no guarantee that the Fund will meet its objective.
Non-Diversified: The Fund is non-diversified and may be more susceptible to factors negatively impacting its holdings to the extent that each security represents a larger portion of the Fund’s assets.
Prospectus: For additional information on risks, please see the Fund’s prospectus. The Fund may not be suitable for all investors.
Value of a $10,000 Investment Since Inception at Net Asset Value
The chart above represents historical performance of a hypothetical investment of $10,000 over the life of the Fund, assuming reinvestment of distributions. Past performance does not guarantee future results.
6
Management’s Discussion of Fund Performance (unaudited) (continued)
October 31, 2018
Virtus Cumberland Municipal Bond ETF
Management’s Discussion of Operations
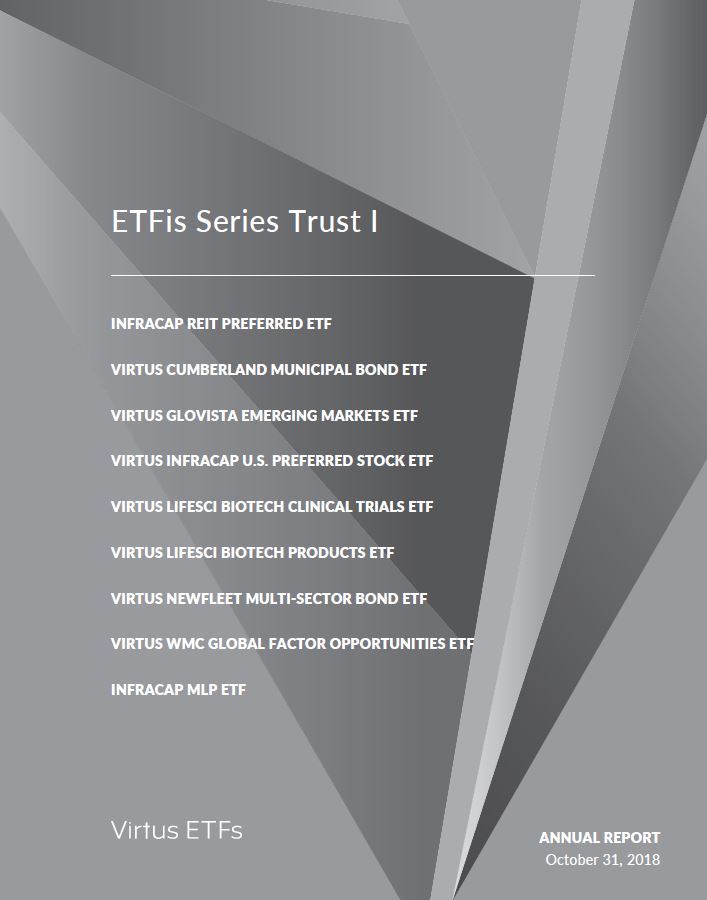
For the fiscal year ended October 31, 2018, the Virtus Cumberland Municipal Bond ETF (the “Fund”) produced a negative 1% total return while the Fund’s benchmark index, the Bloomberg Barclays Municipal Bond Index (the “Index”), produced a negative 0.51% return. The Index is a market value-weighted index designed to represent the long-term investment-grade (bonds rated BBB/Baa and above) tax-exempt bond market.
For the fiscal year, the Fund paid quarterly dividends totaling 91.274 cents per share.
The Fund’s managers continued to invest with a “barbell” approach concentrating positions in tax-exempt bonds with both longer and shorter durations. This approach tends to struggle during periods when the yield curve flattens somewhat and was the primary detractor from Fund performance relative to the Index during the fiscal year.
At the close of the fiscal year, the Fund’s portfolio was well diversified across municipal issuers, the highest concentration by state was Massachusetts at 10.6% followed by New York at 8.6%. Kansas was represented by a single issuer and was the smallest concentration at 0.9%.
Performance as of 10/31/2018
| | | | Average Annual Total Return
|
| | | | Fund
Net Asset Value
| | Fund
Market Price
| | Bloomberg Barclays
Municipal Bond Index1
|
1 Year | | | | | (1.00 | )% | | | (0.32 | )% | | | (0.51 | )% |
Since Inception2 | | | | | 1.60 | % | | | 1.83 | % | | | 1.67 | % |
| 1 | | The Bloomberg Barclays Municipal Bond Index is a market capitalization-weighted index that measures the long-term tax-exempt bond market. The index is calculated on a total return basis. The index is unmanaged, its returns do not reflect any fees, expenses, or sales charges, and is not available for direct investment. |
Performance data quoted represents past performance and past performance does not guarantee future results. Investment return and principal value of an investment will fluctuate so that an investor’s shares, when sold or redeemed, may be worth more or less than the original cost. Current performance data may be higher or lower than actual data quoted. Returns do not reflect the deduction of taxes a shareholder would pay on Fund distributions or the redemption of Fund shares. For the most current month-end performance data please visit www.virtusetfs.com or call toll free (800) 243-4361. Market price returns are based on the mid-point of the highest bid and lowest offer for Fund shares as of the scheduled close of regular trading on the New York Stock Exchange Arca (“NYSE”), ordinarily 4:00 p.m. Eastern time, on each day during which the NYSE is open for trading, and do not represent the returns an investor would receive if shares were traded at other times.
Exchange Traded Funds: The value of an ETF may be more volatile than the underlying portfolio of securities the ETF is designed to track. The costs of owning the ETF may exceed the cost of investing directly in the underlying securities.
Market Price/NAV: Shares of ETFs often trade at a discount to their net asset value, which may increase investors’ risk of loss. At the time of sale, an investor’s shares may have a market price that is above or below the Fund’s NAV.
Credit & Interest: Debt securities are subject to various risks, the most prominent of which are credit and interest rate risk. The issuer of a debt security may fail to make interest and/or principal payments. Values of debt securities may rise or fall in response to changes in interest rates, and this risk may be enhanced with longer-term maturities.
Municipal Market: Events negatively impacting a municipal security, or the municipal bond market in general, may cause the Fund to decrease in value.
State & AMT Tax: A portion of income may be subject to some state and/or local taxes and, for certain investors, a portion may be subject to the federal alternative minimum tax.
Tax Liability Risk: Noncompliant conduct by a municipal bond issuer, or adverse interpretations, could cause interest from a security to become taxable, subjecting shareholders to increased tax liability.
7
Management’s Discussion of Fund Performance (unaudited) (continued)
October 31, 2018
Virtus Cumberland Municipal Bond ETF (continued)
Non-Diversified: The Fund is non-diversified and may be more susceptible to factors negatively impacting its holdings to the extent that each security represents a larger portion of the Fund’s assets.
No Guarantee: There is no guarantee that the Fund will meet its objective.
Prospectus: For additional information on risks, please see the Fund’s prospectus. The Fund may not be suitable for all investors.
Value of a $10,000 Investment Since Inception at Net Asset Value
The chart above represents historical performance of a hypothetical investment of $10,000 over the life of the Fund, assuming reinvestment of distributions. Past performance does not guarantee future results.
8
Management’s Discussion of Fund Performance (unaudited) (continued)
October 31, 2018
Virtus Glovista Emerging Markets ETF
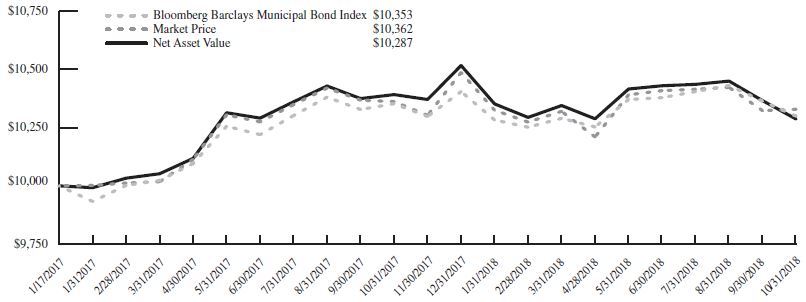
The Virtus Glovista Emerging Markets ETF (the “Fund”) (NYSE: EMEM) is an ETF that seeks to provide passive diversified exposure to stocks in “most favored” Emerging Market countries as identified by a proprietary quantitative methodology. The Fund passively replicates the Solactive Most Favored Nations Emerging Market Index (the “Index”). For the period covering from inception on November 7, 2017 and ended October 31, 2018 the Fund posted a negative 13.58% return compared with the Index’s return of negative 13.24%.
Emerging Market Equities in general have underperformed the S&P 500 and international developed market equities during the fiscal year ended October 31, 2018. After a strong performance in 2017 and January 2018, Emerging Market equities as an asset class encountered a challenging environment owing to: a deterioration in investor sentiment following adverse macroeconomic developments in Argentina and Turkey; an escalation in trade conflict between the United States and China; and a strengthening of the US Dollar on the back of a strong performance by the US economy.
It is important to note the effect of currency movements on the Fund’s performance. In general, if the value of the U.S. dollar goes up compared with foreign currencies then investments traded in that foreign currency will go down in value. This can have a negative effect on Fund performance. Conversely, if the U.S. dollar weakens in relation to a foreign currency then investments traded in that foreign currency will tend to increase in value, which can contribute to Fund performance. From the Fund’s inception through October 31, 2018, the U.S. dollar rose in value relative to most of the currencies relevant to the Fund. As a result, the Fund’s performance was negatively affected.
Key holdings that contributed to the Fund’s performance included American Movil, Taiwan Semiconductor Manufacturing Co. and Samsung Electronics. Conversely, HonHai Precision Industry, Naspers LTD. and Cia Hering were notable detractors from the Fund’s returns.
At fiscal year end the Fund’s portfolio was invested in 16 different countries, in line with the Index.
Performance as of 10/31/2018
| | | | Cumulative Total Return
|
| | | | Fund
Net Asset Value
| | Fund
Market Price
| | Solactive Most Favored
Nations Emerging
Markets Index (net)1
|
Since Inception2 | | | | | (13.58 | )% | | | (13.27 | )% | | | (13.24 | )% |
| 1 | | The Solactive Most Favored Nations Emerging Markets Index (net) is an index of stocks from most favored countries selected from a universe of large liquid Emerging Market countries (currently fifteen). The index is designed to provide diversified exposure to stocks within large liquid countries in Emerging Markets while avoiding exposure to the stocks within weakest countries based on Glovista’s proprietary quantitative methodology. The index is calculated on a total return basis with net dividends reinvested. The index is unmanaged, its returns do not reflect any fees, expenses, or sales charges, and is not available for direct investment. |
Performance data quoted represents past performance and past performance does not guarantee future results. Investment return and principal value of an investment will fluctuate so that an investor’s shares, when sold or redeemed, may be worth more or less than the original cost. Current performance data may be higher or lower than actual data quoted. Returns do not reflect the deduction of taxes a shareholder would pay on Fund distributions or the redemption of Fund shares. For the most current month-end performance data please visit www.virtusetfs.com or call toll free (800) 243-4361. Market price returns are based on the mid-point of the highest bid and lowest offer for Fund shares as of the scheduled close of regular trading on the New York Stock Exchange Arca (“NYSE”), ordinarily 4:00 p.m. Eastern time, on each day during which the NYSE is open for trading, and do not represent the returns an investor would receive if shares were traded at other times.
Exchange Traded Funds: The value of an ETF may be more volatile than the underlying portfolio of securities the ETF is designed to track. The costs of owning the ETF may exceed the cost of investing directly in the underlying securities.
Market Price/NAV: Shares of ETFs often trade at a discount to their net asset value, which may increase investors’ risk of loss. At the time of sale, an investor’s shares may have a market price that is above or below the Fund’s NAV.
Industry/Sector Concentration: A fund that focuses its investments in a particular industry or sector will be more sensitive to conditions that affect that industry or sector than a non-concentrated fund.
9
Management’s Discussion of Fund Performance (unaudited) (continued)
October 31, 2018
Virtus Glovista Emerging Markets ETF (continued)
Equity Securities: The market price of equity securities may be adversely affected by financial market, industry, or issuer-specific events. Focus on a particular style or on small or medium-sized companies may enhance that risk.
Foreign & Emerging Markets: Investing internationally, especially in emerging markets, involves additional risks such as currency, political, accounting, economic, and market risk.
Non-Diversified: The Fund is non-diversified and may be more susceptible to factors negatively impacting its holdings to the extent that each security represents a larger portion of the Fund’s assets.
No Guarantee: There is no guarantee that the Fund will meet its objective.
Prospectus: For additional information on risks, please see the Fund’s prospectus. The Fund may not be suitable for all investors.
Value of a $10,000 Investment Since Inception at Net Asset Value
The chart above represents historical performance of a hypothetical investment of $10,000 over the life of the Fund, assuming reinvestment of distributions. Past performance does not guarantee future results.
10
Management’s Discussion of Fund Performance (unaudited) (continued)
October 31, 2018
Virtus InfraCap U.S. Preferred Stock ETF
Management’s Discussion of Operations
Overview
Virtus InfraCap U.S. Preferred Stock ETF (“the Fund”) seeks current income and, secondarily, capital appreciation through an actively managed portfolio of high quality, U.S. preferred stocks. Callable preferred securities exhibiting a low or negative yield to call are generally excluded from the portfolio. The Fund utilizes options strategies and modest leverage to enhance income and total return.
Update
The Fund commenced operations on May 15, 2018, entering an environment of rising interest rates and stock market volatility. Since launch, the Federal Reserve has raised its benchmark interest rate twice for a total of 0.50%, and the stock market has had a wild ride, rising more than 8% and then falling more than 10%, before settling almost unchanged as of October 31, 2018. Rates on 10-year and 30-year U.S. Treasury bonds have risen modestly, as the yield curve flattens.
In the period from May 15, 2018 to October 31, 2018, the Fund’s market value total return (NYSE price change plus dividends) was 0.99%. The total return on Net Asset Value (NAV) was 1.02%. The Fund’s benchmark index, the S&P U.S. Preferred Stock Index, earned a total return of 0.49% during this period.
The portfolio composition emphasizes issuers that own long-lived assets that generate free cash flow. Preferred stocks issued by real estate investment trusts (REITs) and energy companies (primarily pipelines) comprised about 31% and 13% of total assets, respectively, at fiscal year-end. This compares to weightings of approximately 14% and 3% in the benchmark index. The Fund was underweight financial companies relative to the benchmark index (25% vs. 65% of total assets) but overweight mortgage REITs (20% vs. almost 4% of total assets). The Fund’s portfolio composition had limited impact on Fund returns relative to the Index during the period. The Fund manager believes the high level of liquidity in the mortgage-backed securities market presents a more moderate risk profile than that of traditional bank issuers.
Approximately 34% of total assets were fixed-to-floating rate preferred stocks at fiscal year-end. These securities have a fixed rate coupon at issue but become a floating rate security after a specified period of time, typically five or ten years after issuance. This structure provides investors with some protection from a rising rate environment while offering a higher current yield than that which is available on securities with coupon rates that float currently.
Dividend Payments
In the period ending October 31, the Fund initiated monthly dividend payments in the amount of $0.19 per share ($2.28 per year). Four payments, totaling $0.76 per share, were made. The Fund plans to continue paying monthly dividends but dividends are not guaranteed.
The Fund’s dividend policy will be reviewed on an annual basis with the expectation that the announced dividend rate can be sustained for a period of 12 – 24 months. The Fund’s dividend is expected to be covered by its investment company taxable income (which includes ordinary income and short-term capital gains less expenses). For the purpose of calculating income available for distribution, some cash payments from REITs or MLPs that are subsequently treated as Return of Capital for tax or GAAP purposes may be included. Expenses include an 80 basis point advisory fee, other miscellaneous fees and leverage costs.
The Fund seeks to maintain relatively stable monthly distributions although the amount of income earned by the Fund varies from period-to-period. To achieve this objective, the Fund may from time-to-time distribute less than the full amount of income earned during a specific period, withholding some income for distribution in future periods. Consequently, the amount of income distributed in any one period may be more or less than the actual amount of income earned in that period.
The Fund’s current indicated yield based on its closing price on the New York Stock Exchange on October 31, 2018 ($24.34) was 9.36%. The Fund’s current indicated yield based on its Net Asset Value (NAV) per share ($24.47) was 9.31%.
11
Management’s Discussion of Fund Performance (unaudited) (continued)
October 31, 2018
Virtus InfraCap U.S. Preferred Stock ETF (continued)
Use of Leverage
As described in the Fund’s prospectus, the Fund may use modest leverage to help achieve its current income objective. The leverage ratio is expected to be maintained in a range of 10-35% of total assets over the long term. As of October 31, 2018, borrowing amounted to 20.1% of total assets.
During the period, the Fund’s leverage was a small but noticeable contributor to total returns.
The Fund’s cost of borrowing is rising, but borrowed funds still generate an attractive positive spread. The Fund borrows at a 120 basis point premium to the 3-month LIBOR rate. The 3-month LIBOR rate rose from 2.33% at launch to 2.54% at fiscal year-end.
Use of Options
As described in the prospectus, the Fund utilizes options strategies to boost the amount of income available to distribute to shareholders. The primary activity is covered call writing. The activity is focused on a small number of common stocks and ETFs owned by the Fund.
The Fund’s use of options provided a slight enhancement to total returns from inception to fiscal year end.
Outlook
The Fund manager believes the preferred stock asset class is inefficiently priced and offers active managers the opportunity to add to benchmark returns. Over the years, special emphasis will be placed on maximizing the Fund’s yield-to-call. Avoiding issues that are callable and trading at prices above the call price are intended to help assure that result. Many preferred stock investors, especially passive funds, ignore the risk of owning issues with a negative yield-to-call.
Fears of rising long-term interest rates are dominating fixed income investors’ market outlook today, but the Fund manager believes wide interest rate spreads over long-duration U.S. Treasury bonds offer substantial protection from rate rises. The Fund manager believes that the correlation between Treasury bond price moves and price swings in preferred stocks is likely to be moderated by the wide spreads.
Moreover, the Fund manager anticipates a better environment for long-duration fixed income securities than the current market consensus. U.S. inflation indicators suggest aggressive action by the Federal Reserve is unnecessary, and the Fund manager believes long-term U.S. interest rates remain very attractive to global investors. In a stable interest rate environment, preferred stock investors should earn very attractive risk-adjusted returns.
Performance as of 10/31/2018
| | | | Cumulative Total Return
|
| | | | Fund
Net Asset Value
| | Fund
Market Price
| | | S&P U.S.
Preferred Stock
Index1
|
Since Inception2 | | | | | 1.02 | % | | | 0.99 | % | | | | 0.49% | |
1 | | The S&P U.S. Preferred Stock Index measures performance of the U.S. preferred stock market. Preferred stocks pay dividends at a specified rate and receive preference over common stocks in terms of dividend payments and liquidation of assets. The index is calculated on a total return basis with dividend reinvested. The index is unmanaged, its returns do not reflect any fees, expenses, or sales charges, and is not available for direct investment. |
Performance data quoted represents past performance and past performance does not guarantee future results. Investment return and principal value of an investment will fluctuate so that an investor’s shares, when sold or redeemed, may be worth more or less than the original cost. Current performance data may be higher or lower than actual data quoted. Returns do not reflect the deduction of taxes a shareholder would pay on Fund distributions or the redemption of Fund shares. For the most current month-end performance data please visit www.virtusetfs.com or call toll free (800) 243-4361. Market price returns are based on the mid-point of the highest bid and lowest offer for Fund shares as of the scheduled close of regular trading on the New York Stock Exchange Arca (“NYSE”), ordinarily 4:00 p.m. Eastern time, on each day during which the NYSE is open for trading, and do not represent the returns an investor would receive if shares were traded at other times.
Exchange Traded Funds: The value of an ETF may be more volatile than the underlying portfolio of securities the ETF is designed to track. The costs of owning the ETF may exceed the cost of investing directly in the underlying securities.
12
Management’s Discussion of Fund Performance (unaudited) (continued)
October 31, 2018
Virtus InfraCap U.S. Preferred Stock ETF (continued)
Market Price/NAV: Shares of ETFs often trade at a discount to their net asset value, which may increase investors’ risk of loss. At the time of sale, an investor’s shares may have a market price that is above or below the fund’s NAV.
Preferred Stocks: Preferred stocks may decline in price, fail to pay dividends, or be illiquid.
Leverage: When a fund leverages its portfolio, the value of its shares may be more volatile and all other risks may be compounded.
Derivatives: Investments in derivatives such as futures, options, forwards, and swaps may increase volatility or cause a loss greater than the principal investment.
Sector Focus: To the extent the Fund has significant exposure to one or more sectors, this may make the Fund particularly susceptible to adverse economic, political or regulatory occurrences and changes affecting companies in those sectors.
Non-Diversified: The Fund is non-diversified and may be more susceptible to factors negatively impacting its holdings to the extent that each security represents a larger portion of the Fund’s assets.
Prospectus: For additional information on risks, please see the Fund’s prospectus.
For the fiscal period ended October 31, 2018, the Fund did not have six months of performance and therefore graph lines are not presented.
13
Management’s Discussion of Fund Performance (unaudited) (continued)
October 31, 2018
Virtus LifeSci Biotech Clinical Trials ETF
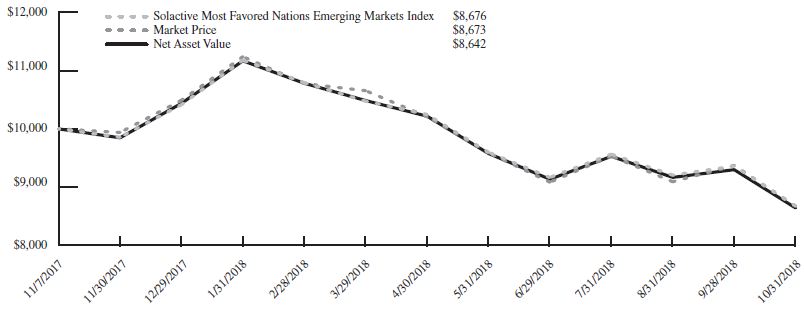
For the fiscal year 2018 from 11/1/2017 through 10/31/18, the LifeSci Biotechnology Clinical Trials Index was down 1.81% compared to down 2.05% for the Virtus LifeSci Biotech Clinical Trials ETF (the “Fund”). There was also a .2972 cent dividend made to shareholders. Fund performance has significantly been influenced by exposure to biomedical gene therapies including ECYT and VKTX on the upside (Endocyte is being acquired by Swiss drug maker Novartis AG). Other positive contributors to performance included companies involved in NASH or Non-alcoholic Steatohepatitis. This progressive liver disease can destroy the organ and is projected to become the leading cause of all liver transplant needs in the near future. The Fund’s position in Madrigal Pharmaceuticals with its lead product, MGL-3196, exhibited positive results in early clinical trials and was a significant contributor to the Fund’s performance.
Immuno-Oncology, while a promising approach to treating cancer by exploiting the body’s own immune system to attach tumors, has proven to detract from the Fund’s performance. Companies such as GERN, which terminated a collaboration and license agreement with Janssen Biotech and Jounce Therapeutics, failed to produce positive stock performance. Other detractors of performance include, SGYP, PRTA, MLNT and Selecta Biosciences, SELB, which engages in the research and development of nanoparticle immunomodulatory drugs for the treatment and prevention of human diseases.
Some headwinds that were unexpected this year was the slowing of consolidation (M&A activity) in Biotech, as Healthcare companies need to grow and are sitting on historically large positions of cash. Going forward constituents of the LifeSci Biotechnology Clinical Trials Index are expected to exhibit compelling industry valuations vs. the broader market and strong corporate buybacks.
Performance as of 10/31/2018
| | | | Average Annual Total Return
|
| | | | Fund
Net Asset Value
| | Fund
Market Price
| | LifeSci Biotechnology
Clinical Trials Index1
| | S&P 500® Index2
|
1 Year | | | | | (2.05 | )% | | | (2.08 | )% | | | (1.81 | )% | | | 7.35 | % |
Since Inception3 | | | | | 2.29 | % | | | 2.29 | % | | | 2.83 | % | | | 10.79 | % |
| 1 | | The LifeSci Biotechnology Clinical Trials Index is designed to track the performance of U.S. listed biotechnology stocks with a lead drug in the clinical trial stage of development, typically a Phase 1, Phase 2 or Phase 3 trial, but prior to receiving marketing approval. The index is unmanaged, its returns do not reflect any fees, expenses, or sales charges, and is not available for direct investment. |
2 | | The S&P 500® Index is a free-float market capitalization-weighted index of 500 of the largest U.S. companies. The index is calculated on a total return basis with dividends reinvested. The index is unmanaged, its returns do not reflect any fees, expenses, or sales charges, and is not available for direct investment. |
Performance data quoted represents past performance and past performance does not guarantee future results. Investment return and principal value of an investment will fluctuate so that an investor’s shares, when sold or redeemed, may be worth more or less than the original cost. Current performance data may be higher or lower than actual data quoted. Returns do not reflect the deduction of taxes a shareholder would pay on Fund distributions or the redemption of Fund shares. For the most current month-end performance data please visit www.virtusetfs.com or call toll free (800) 243-4361. Market price returns are based on the mid-point of the highest bid and lowest offer for Fund shares as of the scheduled close of regular trading on the New York Stock Exchange Arca (“NYSE”), ordinarily 4:00 p.m. Eastern time, on each day during which the NYSE is open for trading, and do not represent the returns an investor would receive if shares were traded at other times.
Exchange Traded Funds: The value of an ETF may be more volatile than the underlying portfolio of securities the ETF is designed to track. The costs of owning the ETF may exceed the cost of investing directly in the underlying securities.
14
Management’s Discussion of Fund Performance (unaudited) (continued)
October 31, 2018
Virtus LifeSci Biotech Clinical Trials ETF (continued)
Biotechnology Industry Risk: The Fund’s assets will be concentrated in investments in the securities of issuers engaged primarily in the biotechnology industry. Companies within the biotechnology industry spend heavily on research and development, which may not necessarily lead to commercially successful products in the near or long term. In order to fund operations, these companies may require financing from the capital markets, which may not always be available on satisfactory terms or at all. The biotechnology industry is also subject to significant governmental regulation, and the need for governmental approvals, including, without limitation, FDA approval. The securities of biotechnology companies, especially those of smaller or newer companies, tend to be more volatile than those of companies with larger capitalizations or markets generally.
Industry/Sector Concentration: A fund that focuses its investments in a particular industry or sector will be more sensitive to conditions that affect that industry or sector than a non-concentrated fund.
Market Price/NAV: Shares of ETFs often trade at a discount to their net asset value, which may increase investors’ risk of loss. At the time of sale, an investor’s shares may have a market price that is above or below the Fund’s NAV.
Correlation to Index: The performance of the Fund and its index may vary somewhat due to factors such as Fund flows, transaction costs, and timing differences associated with additions to and deletions from its index.
No Guarantee: There is no guarantee that the Fund will meet its objective.
Prospectus: For additional information on risks, please see the Fund’s prospectus. The Fund may not be suitable for all investors.
Value of a $10,000 Investment Since Inception at Net Asset Value
The chart above represents historical performance of a hypothetical investment of $10,000 over the life of the Fund, assuming reinvestment of distributions. Past performance does not guarantee future results.
15
Management’s Discussion of Fund Performance (unaudited) (continued)
October 31, 2018
Virtus LifeSci Biotech Products ETF
For the fiscal year 2018 from 11/1/2017 through 10/31/18, the LifeSci Biotechnology Products Index was down 7.04% compared to down 7.49% for the Virtus LifeSci Biotech Products ETF (the “Fund”). There was a .0723 distribution made to shareholders.
Much of the focus in Biotech this year has benefited from strong drug discovery, compelling valuations after a poor performance last year and positive advancement in gene therapy.
The Fund underperformed some of its peers due to its relatively high weight in biomedical technologies in the gene editing space. Another negative contribution to performance was exposure to therapeutics, including cancer treatment drugs that target against tumor metabolism and immunity. Lastly, the Fund had solid performance via the major biotech averages due to its exposure to companies involved in immunology, strong drug pipelines and promising clinical trials data.
While the political climate in 2018 was just as volatile as last year, it did contribute to a more business friendly outlook for biotechnology companies. Large Capitalization and big pharmaceutical companies are still looking for less mature companies and technologies to invigorate their slowing drug pipelines. Stock buybacks put in some technical support for a number of stocks in the Biotech space as they look attractive due to their lower valuation than sector peers and the S&P 500 Index.
Positions that contributed to significant positive performance during the fiscal year include Sarepta Therapeutics, Inc. (SRPT), Neurocrine Biosciences, Inc. (NBIX), Nektar Therapeutics, Inc. (NKTR) and Enanta Pharmaceuticals, Inc. (ENTA). Positions that detracted from performance during the fiscal year include Clovis Oncology, Inc. (CLVS), Tesaro, Inc. (TSRO), Puma Biotechnology, Inc. (PBYI) and Portola Pharmaceuticals, Inc. (PTLA).
Performance as of 10/31/2018
| | | | Average Annual Total Return
|
| | | | Fund
Net Asset Value
| | Fund
Market Price
| | LifeSci Biotechnology
Products Index1
| | S&P 500® Index2
|
1 Year | | | | | (7.49 | )% | | | (7.53 | )% | | | (7.04 | )% | | | 7.35 | % |
Since Inception3 | | | | | 10.54 | % | | | 10.53 | % | | | 11.37 | % | | | 10.79 | % |
| 1 | | The LifeSci Biotechnology Products Index is designed to track the performance of U.S. listed biotechnology stocks with at least one drug therapy approved by the U.S. Food and Drug Administration for marketing. The index is unmanaged, its returns do not reflect any fees, expenses, or sales charges, and is not available for direct investment. |
2 | | The S&P 500® Index is a free-float market capitalization-weighted index of 500 of the largest U.S. companies. The index is calculated on a total return basis with dividends reinvested. The index is unmanaged, its returns do not reflect any fees, expenses, or sales charges, and is not available for direct investment. |
Performance data quoted represents past performance and past performance does not guarantee future results. Investment return and principal value of an investment will fluctuate so that an investor’s shares, when sold or redeemed, may be worth more or less than the original cost. Current performance data may be higher or lower than actual data quoted. Returns do not reflect the deduction of taxes a shareholder would pay on Fund distributions or the redemption of Fund shares. For the most current month-end performance data please visit www.virtusetfs.com or call toll free (800) 243-4361. Market price returns are based on the mid-point of the highest bid and lowest offer for Fund shares as of the scheduled close of regular trading on the New York Stock Exchange Arca (“NYSE”), ordinarily 4:00 p.m. Eastern time, on each day during which the NYSE is open for trading, and do not represent the returns an investor would receive if shares were traded at other times.
Exchange Traded Funds: The value of an ETF may be more volatile than the underlying portfolio of securities the ETF is designed to track. The costs of owning the ETF may exceed the cost of investing directly in the underlying securities.
16
Management’s Discussion of Fund Performance (unaudited) (continued)
October 31, 2018
Virtus LifeSci Biotech Products ETF (continued)
Biotechnology Industry Risk: The Fund’s assets will be concentrated in investments in the securities of issuers engaged primarily in the biotechnology industry. Companies within the biotechnology industry spend heavily on research and development, which may not necessarily lead to commercially successful products in the near or long term. In order to fund operations, these companies may require financing from the capital markets, which may not always be available on satisfactory terms or at all. The biotechnology industry is also subject to significant governmental regulation, and the need for governmental approvals, including, without limitation, FDA approval. The securities of biotechnology companies, especially those of smaller or newer companies, tend to be more volatile than those of companies with larger capitalizations or markets generally.
Industry/Sector Concentration: A fund that focuses its investments in a particular industry or sector will be more sensitive to conditions that affect that industry or sector than a non-concentrated fund.
Market Price/NAV: Shares of ETFs often trade at a discount to their net asset value, which may increase investors’ risk of loss. At the time of sale, an investor’s shares may have a market price that is above or below the Fund’s NAV.
Correlation to Index: The performance of the Fund and its index may vary somewhat due to factors such as Fund flows, transaction costs, and timing differences associated with additions to and deletions from its index.
No Guarantee: There is no guarantee that the Fund will meet its objective.
Prospectus: For additional information on risks, please see the Fund’s prospectus. The Fund may not be suitable for all investors.
Value of a $10,000 Investment Since Inception at Net Asset Value
The chart above represents historical performance of a hypothetical investment of $10,000 over the life of the Fund, assuming reinvestment of distributions. Past performance does not guarantee future results.
17
Management’s Discussion of Fund Performance (unaudited) (continued)
October 31, 2018
Virtus Newfleet Multi-Sector Bond ETF
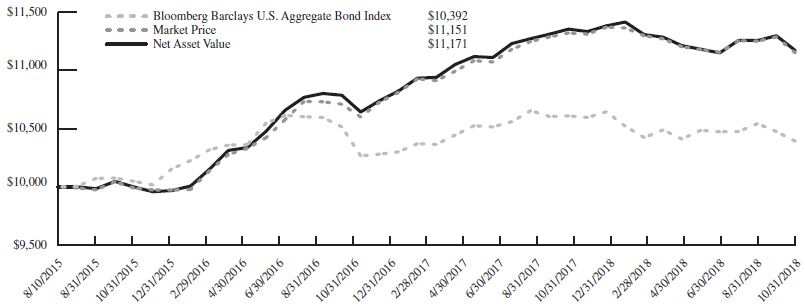
How did the markets perform during the Fund’s fiscal year ended October 31, 2018?
Performance of spread sectors was mixed during the fiscal year, with shorter duration sectors, led by corporate high yield and high yield bank loans, outperforming their longer duration counterparts. Within spread sectors, assets with longer duration underperformed on a total return basis, as yields rose and bond prices fell. Non-U.S. dollar-denominated securities and emerging markets high yield were the largest underperformers during the period.
The 12-month period presented multiple challenges, including several bouts of elevated volatility. Market participants continued to wrestle with periods of instability caused by geopolitical developments, trade rhetoric, mixed global economic signals, and the evolution of the various quantitative easing (QE) programs that began after the now decade-old financial crisis. During the period, oil prices continued their ascent, driven higher by the outlook for supply/demand dynamics. U.S. economic data stayed on a positive trend, which contrasted with other global economies.
As anticipated, the Federal Reserve (the Fed) raised its target rate 0.25% on four separate occasions during the 12 months to a range of 2.00% to 2.25%. Over the last 12 months, yields increased overall, but more so for shorter maturity bonds than for longer term securities.
What factors affected the Fund’s performance during its fiscal year?
The outperformance of shorter duration asset classes relative to most fixed income spread sectors was the key driver of the Fund’s outperformance for the fiscal year ended October 31, 2018.
Among fixed income sectors, the Fund’s allocations to corporate high yield, bank loans, and asset-backed securities were the largest positive contributors to performance for the fiscal year.
During the fiscal year, the Fund’s allocations to emerging market high yield and non-U.S. dollar-denominated securities were the largest detractors from performance.
Performance as of 10/31/2018
| | | | Average Annual Total Return
|
| | | | Fund
Net Asset Value
| | Fund
Market Price
| | | Bloomberg Barclays
U.S. Aggregate
Bond Index1
|
1 Year | | | | | (1.62 | )% | | | (1.51 | )% | | | | (2.05)% | |
Since Inception2 | | | | �� | 3.49 | % | | | 3.43 | % | | | | 1.20% | |
| 1 | | The Bloomberg Barclays U.S. Aggregate Bond Index measures the U.S. investment grade fixed rate bond market. The index is calculated on a total return basis .The index is unmanaged, its returns do not reflect any fees, expenses, or sales charges, and is not available for direct investment. |
Performance data quoted represents past performance and past performance does not guarantee future results. Investment return and principal value of an investment will fluctuate so that an investor’s shares, when sold or redeemed, may be worth more or less than the original cost. Current performance data may be higher or lower than actual data quoted. Returns do not reflect the deduction of taxes a shareholder would pay on Fund distributions or the redemption of Fund shares. For the most current month-end performance data please visit www.virtusetfs.com or call toll free (800) 243-4361. Market price returns are based on the mid-point of the highest bid and lowest offer for Fund shares as of the scheduled close of regular trading on the New York Stock Exchange Arca (“NYSE”), ordinarily 4:00 p.m. Eastern time, on each day during which the NYSE is open for trading, and do not represent the returns an investor would receive if shares were traded at other times.
Credit & Interest: Debt securities are subject to various risks, the most prominent of which are credit and interest rate risk. The issuer of a debt security may fail to make interest and/or principal payments. Values of debt securities may rise or fall in response to changes in interest rates, and this risk may be enhanced with longer-term maturities.
18
Management’s Discussion of Fund Performance (unaudited) (continued)
October 31, 2018
Virtus Newfleet Multi-Sector Bond ETF (continued)
High Yield-High Risk Fixed Income Securities: There is a greater level of credit risk and price volatility involved with high yield securities than investment grade securities.
Foreign & Emerging Markets: Investing internationally, especially in emerging markets, involves additional risks such as currency, political, accounting, economic, and market risk.
Bank Loans: Loans may be unsecured or not fully collateralized, may be subject to restrictions on resale and/or trade infrequently on the secondary market. Loans can carry significant credit and call risk, can be difficult to value and have longer settlement times than other investments, which can make loans relatively illiquid at times.
ABS/MBS: Changes in interest rates can cause both extension and prepayment risks for asset- and mortgage-backed securities. These securities are also subject to risks associated with the repayment of underlying collateral.
Market Price/NAV: Shares of ETFs often trade at a discount to their net asset value, which may increase investors’ risk of loss. At the time of sale, an investor’s shares may have a market price that is above or below the Fund’s NAV.
Prospectus: For additional information on risks, please see the Fund’s prospectus. The Fund may not be suitable for all investors.
Value of a $10,000 Investment Since Inception at Net Asset Value
The chart above represents historical performance of a hypothetical investment of $10,000 over the life of the Fund, assuming reinvestment of distributions. Past performance does not guarantee future results.
19
Management’s Discussion of Fund Performance (unaudited) (continued)
October 31, 2018
Virtus WMC Global Factor Opportunities ETF
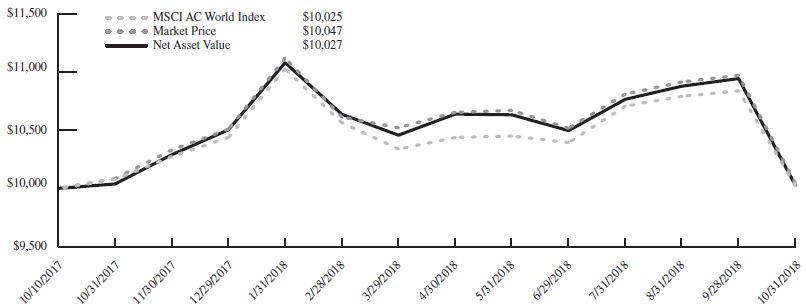
The Virtus WMC Global Factor Opportunities ETF (“the Fund”) (NYSE: VGFO) is an actively managed ETF that employs a dynamic, global multi-factor strategy that combines a quantitative investment approach with active management. Wellington Management’s proprietary factors are used to drive stock selection within four distinct world regions — the U.S., Japan, Europe, and Emerging Markets — to create a diversified portfolio which seeks to adapt to changes in the risk environment.
While global equity returns were flat over the trailing twelve month period ended October 31, 2018, as measured by the MSCI All Country World Index, there was a large divide between the performances of underlying equity markets. U.S. equities significantly outperformed, while Japanese, European, and Emerging Market equities posted negative returns. Equity markets globally experienced a resurgence of volatility during the period. Strong equity fundamentals and continued economic growth encouraged optimism. However, rising global trade tensions, political risk in Europe and expected monetary policy tightening provoked concerns that the recent “bull run” in equities might be nearing its end.
During the fiscal year ended October 31, 2018, the Fund’s net asset value declined by 0.11%, outperforming its benchmark, the MSCI All Country World Index (Net), which declined by 0.52%. The most significant contributor to Fund relative outperformance was positioning within Emerging Markets, while positioning in the United States was the most significant relative detractor.
Within Emerging Markets, exposure to quality names, such as Infosys Limited (Information Technology) contributed to outperformance. The Fund also benefited from being underweight underperforming Emerging Market momentum names such as Tencent (Communication Services) and Alibaba (Consumer Discretionary). In the United States, underweight exposure to outperforming momentum names, such as Microsoft (Information Technology) and Amazon.com (Consumer Discretionary) detracted from performance. Not owning Apple (Information Technology) also detracted on a relative basis. Positions in Tencent and Alibaba were eliminated prior to the end of the period.
Performance as of 10/31/2018
| | | | Average Annual Total Return
|
| | | | Fund
Net Asset Value
| | Fund
Market Price
| | | MSCI AC
World Index (net)1
|
1 Year | | | | | (0.11 | )% | | | (0.36 | )% | | | | (0.52)% | |
Since Inception2 | | | | | 0.26 | % | | | 0.45 | % | | | | 0.24% | |
| 1 | | The MSCI AC World Index (net) is a free float-adjusted market capitalization-weighted index that measures equity performance of developed and emerging markets. The index is calculated on a total return basis with net dividends reinvested. The index is unmanaged, its returns do not reflect any fees, expenses, or sales charges, and is not available for direct investment. |
Performance data quoted represents past performance and past performance does not guarantee future results. Investment return and principal value of an investment will fluctuate so that an investor’s shares, when sold or redeemed, may be worth more or less than the original cost. Current performance data may be higher or lower than actual data quoted. Returns do not reflect the deduction of taxes a shareholder would pay on Fund distributions or the redemption of Fund shares. For the most current month-end performance data please visit www.virtusetfs.com or call toll free (800) 243-4361. Market price returns are based on the mid-point of the highest bid and lowest offer for Fund shares as of the scheduled close of regular trading on the New York Stock Exchange Arca (“NYSE”), ordinarily 4:00 p.m. Eastern time, on each day during which the NYSE is open for trading, and do not represent the returns an investor would receive if shares were traded at other times.
Exchange Traded Funds: The value of an ETF may be more volatile than the underlying portfolio of securities the ETF is designed to track. The costs of owning the ETF may exceed the cost of investing directly in the underlying securities.
Market Price/NAV: Shares of ETFs often trade at a discount to their net asset value, which may increase investors’ risk of loss. At the time of sale, an investor’s shares may have a market price that is above or below the fund’s NAV.
Equity Securities: The market price of equity securities may be adversely affected by financial market, industry, or issuer-specific events. Focus on a particular style or on small or medium-sized companies may enhance that risk.
Foreign & Emerging Markets: Investing internationally, especially in emerging markets, involves additional risks such as currency, political, accounting, economic, and market risk.
20
Management’s Discussion of Fund Performance (unaudited) (continued)
October 31, 2018
Virtus WMC Global Factor Opportunities ETF (continued)
Geographic Concentration: Events negatively affecting the fiscal stability of a state, country, or region will cause the value of the Fund’s shares to decrease. Because the Fund concentrates its assets in a state, country, or region, the Fund is more vulnerable to those areas’ financial, economic, or other political developments.
Equity REITs: The Fund may be negatively affected by factors specific to the real estate market, including interest rates, leverage, property, and management.
Derivatives: Investments in derivatives such as futures, options, forwards, and swaps may increase volatility or cause a loss greater than the principal investment.
Prospectus: For additional information on risks, please see the Fund’s prospectus.
Value of a $10,000 Investment Since Inception at Net Asset Value
The chart above represents historical performance of a hypothetical investment of $10,000 over the life of the Fund, assuming reinvestment of distributions. Past performance does not guarantee future results.
21
Management’s Discussion of Fund Performance (unaudited) (continued)
October 31, 2018
InfraCap MLP ETF
Management’s Discussion of Operations
Overview
InfraCap MLP ETF (“the Fund”) seeks total return. The Fund is an actively managed portfolio of high quality, midstream energy master limited partnerships (MLPs) and related general partners. The Fund also utilizes options strategies and modest leverage to enhance income and total return. As a result, some of the Fund’s performance, both positive and negative, can be attributed to these strategies.
The Fund focuses on the midstream MLP sector because most of these companies have a long-term history of relatively stable and growing cash distributions. These companies are typically involved in the production, gathering, transportation, storage, and processing of oil, natural gas, natural gas liquids and refined products.
Update
In the twelve months ended October 31, 2018, there were many signs of improving fundamentals for the U.S. energy infrastructure industry. Global economic growth accelerated, driving strong demand for crude oil, natural gas and related products. Crude oil prices showed strength, leading to a brisk level of activity in U.S. oil fields. U.S. domestic crude oil production rose from 10 million to more than 11 million barrels per day. A shortage of crude oil pipeline transportation capacity plagued producers, and a shortage of natural gas pipeline capacity led to a surge in gas prices. Export activity became a significant contributor to growth in the U.S. energy industry. As the year ended, the industry was gathering momentum for an extended phase of expansion.
Despite improving fundamentals, the industry continued the trend toward simplification, with nine companies consolidating the general partners with the limited partners and extinguishing the incentive distribution rights (IDRs). The outcome was an improvement in the industry’s financial position, with reduced leverage, better coverage of distributions, the elimination of the IDRs, and a backlash from selling shareholders that did not like the resulting distribution cuts.
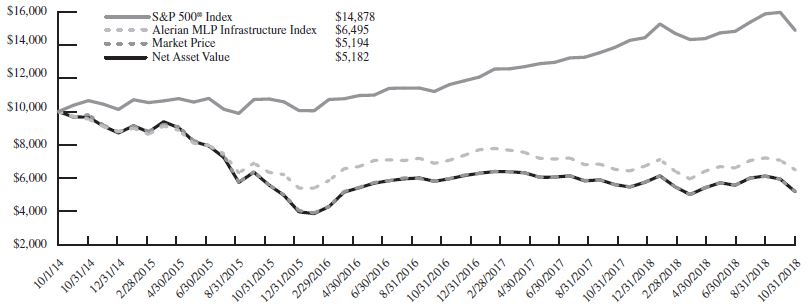
In the fiscal year ended October 31, 2018, the Fund had a net loss of 7.30% on a market value basis (NYSE price change plus dividends). On a net asset value (NAV) basis, the net loss was 7.65%. The Fund’s benchmark index, the Alerian MLP Infrastructure Index, had a net loss of 5.13% during this period. During this same period, the total return on the S&P 500 index was 7.35%.
The Fund’s holdings in Marathon Petroleum Corporation and Phillips 66 were both additive to total returns. Although the Fund was slightly underweight Enbridge Energy Partners, the Fund’s total return was still negatively impacted by that holding’s relatively sizable exposure to an adverse ruling by the Federal Energy Regulatory Commission (FERC).
The Fund manager believes the industry is at an inflection point, ending a period of widespread distribution cuts resulting from restructurings and entering a period of growth for the industry’s distributions to investors. Importantly, the Fund manager believes that elimination of IDR payments is likely to create an environment of improved governance, where the interests of the limited partners is paramount. The Fund manager also believes that the weighted-average distribution for the companies owned by the Fund is expected to increase by over 7% in 2019.
Dividend Payments
In January 2018, the Fund’s annual dividend rate was reduced to $1.32 per share ($0.11 per month) from a rate of $2.08 per year ($0.52 per quarter). The reset was based on distributable cash flow (DCF) projections made at the time, and the dividend was expected to be covered by DCF. Actual results fell short of projections, as widespread distribution cuts in the sector had a negative impact on the Fund’s investment income. Consequently, the distribution was not fully covered in subsequent periods, and the Fund paid out a return of capital to cover the shortfall.
The distribution of return of capital to meet the targeted dividend rate exacerbated the decline in the Fund’s NAV related to the sector’s poor stock performance. In an environment of positive stock returns, NAV per share may be sustained despite the distribution of net capital. But during three of the Fund’s four years of existence, the midstream stock sector has had negative returns.
The dividend rate is reviewed on an annual basis, with the expectation that the dividend rate can be sustained for 12 – 24 months. An important consideration in determining the level of dividend payments is the estimated amount of DCF, which is investment income less expenses. Investment income includes cash distributions from master limited partnerships, dividends received from stocks, and net realized gains (losses) from written and purchased options contracts. Expenses include advisory fees, other miscellaneous fees and leverage costs. Capital gains and losses on securities positions are not included in the DCF calculation regardless of whether the position was the result of an open market purchase or through the exercise of options in the Fund.
22
Management’s Discussion of Fund Performance (unaudited) (continued)
October 31, 2018
InfraCap MLP ETF (continued)
The Supplemental Financial Data table includes the calculation of DCF and should be reviewed as part of this discussion. It should be noted that this calculation differs from the Statement of Operations because of the following factors: 1) GAAP does not include MLP distributions in investment income because these distributions are typically treated as return of capital; and 2) GAAP does not include net realized gains (losses) on written and purchased options contracts as investment income but reports them separately as realized and unrealized gains (losses). The Supplemental Financial Data table also includes a calculation of the dividend coverage ratio. It indicates the portion of the dividend that was covered by cash income and option premium income. The coverage ratio is calculated by dividing DCF by total distributions paid.
Use of Leverage
The Fund’s policy is to maintain its leverage ratio in a range of 10-331⁄3% of total assets over the long term. Additional leverage may be used when attractive investment opportunities arise but such leverage would be reduced over time. This leverage policy is consistent with the Fund’s investment objective to seek total return. Total leverage represented 32.7% of net assets at year-end, which was near the high-end of the long-term target range.
The Fund’s use of leverage was a significant detractor from the Fund’s total returns as the industry, and many of the Fund’s holdings, delivered weak performance during the period.
During the Fund’s fiscal year, the Federal Reserve hiked the Federal funds rate four times for a total increase of 100 basis points. The Fund’s borrowing cost moved commensurately higher with the effective rate, averaging 3.31% as compared to 2.37% in the prior year. The borrowing rate at the end of the fiscal year was 3.74%. In comparison, the average yield on midstream stocks, as measured by the Alerian MLP Infrastructure Index, was 8.16% at the end of the fiscal year. The Fund manager believes the spread over the cost of funds justifies continued borrowing.
Use of Options
The Fund writes call and put option premium on securities to generate additional income for distribution to investors. The primary activity is writing “covered” calls on positions held by the Fund. It may also use options for hedging purposes.
During the year, the Fund manager modified its option strategies in response to changing market conditions. A high level of volatility in the stock sector, in combination with a decreased level of correlation between the stock sector and commodity markets, added risk to market hedges. At the same time, consolidation activity in the midstream sector led to increased liquidity in the single-stock options market, with new opportunities being created.
The primary change in strategy was an increased emphasis on writing short-duration, covered call options. This change was made possible by the increased availability of weekly option issues on midstream stocks, which was one of the consequences of the high level of merger and acquisition activity in the sector. Larger companies typically have more liquid markets for issued options. Positions in ETFs tied to commodity prices, and their related options, were phased out over the second half of the fiscal year.
The Fund has a weighting of almost 55% in stocks with liquid options names and weekly calls. During the fiscal year, the average maturity of the option portfolio was reduced from about 40 days to 20 or fewer days. The Fund manager’s objective is to use options to reduce risk while adding income, and the increased liquidity in midstream options makes it easier to accomplish this objective. Activity involving the commodity-related ETFs became risk additive and was eliminated.
During the period, the Fund’s use of options was substantially beneficial to the Fund’s total return.
Outlook
The U.S. energy industry has entered a golden age of surging crude oil and natural gas production, earning a leadership role in the global economy. The backlog of demand for pipeline capacity, storage and processing facilities is building, and midstream MLPs are the beneficiaries. The Fund manager believes that strong cash flow growth and increasing distributions to investors are likely over the next several years.
The Fund was in a taxable loss position at the end of the year, so taxable income in future periods may be sheltered by these realized and unrealized losses. Moreover, as a C-corporation, the Fund is a beneficiary of the tax reform act of 2017, which lowered the corporate tax rate from 35% to 21%.
23
Management’s Discussion of Fund Performance (unaudited) (continued)
October 31, 2018
InfraCap MLP ETF (continued)
Performance as of 10/31/2018
| | | | Average Annual Total Return
|
| | | | Fund
Net Asset Value
| | Fund
Market Price
| | Alerian MLP
Infrastructure Index1
| | S&P 500® Index2
|
1 Year | | | | | (7.65 | )% | | | (7.32 | )% | | | (0.54 | )% | | | 7.35 | % |
Since Inception3 | | | | | (14.87 | )% | | | (14.82 | )% | | | (10.03 | )% | | | 10.70 | % |
| 1 | | The Alerian MLP Infrastructure Index is a composite of energy infrastructure Master Limited Partnerships (MLPs), whose constituents earn the majority of their cash flow from the transportation, storage, and processing of energy commodities. The index is calculated using a float-adjusted, capitalization-weighted methodology on a total-return basis. The index is unmanaged, its returns do not reflect any fees, expenses, or sales charges, and is not available for direct investment. |
2 | | The S&P 500® Index is a free-float market capitalization-weighted index of 500 of the largest U.S. companies. The index is calculated on a total return basis with dividends reinvested. The index is unmanaged, its returns do not reflect any fees, expenses, or sales charges, and is not available for direct investment. |
Performance data quoted represents past performance and past performance does not guarantee future results. Investment return and principal value of an investment will fluctuate so that an investor’s shares, when sold or redeemed, may be worth more or less than the original cost. Current performance data may be higher or lower than actual data quoted. Returns do not reflect the deduction of taxes a shareholder would pay on Fund distributions or the redemption of Fund shares. For the most current month-end performance data please visit www.virtusetfs.com or call toll free (800) 243-4361. Market price returns are based on the mid-point of the highest bid and lowest offer for Fund shares as of the scheduled close of regular trading on the New York Stock Exchange Arca (“NYSE”), ordinarily 4:00 p.m. Eastern time, on each day during which the NYSE is open for trading, and do not represent the returns an investor would receive if shares were traded at other times.
Interest Rate Risk: As yield-based investments, MLPs carry interest rate risk and may underperform in rising interest rate environments. Additionally, when investors have heightened fears about the economy, the risk spread between MLPs and competing investment options can widen, which may have an adverse effect on the stock price of MLPs. Rising interest rates may increase the potential cost of MLPs financing projects or cost of operations, and may affect the demand for MLP investments, either of which may result in lower performance by or distributions from the Fund’s MLP investments.
Exchange Traded Funds: The value of an ETF may be more volatile than the underlying portfolio of securities the ETF is designed to track. The costs of owning the ETF may exceed the cost of investing directly in the underlying securities.
Industry/Sector Concentration: A fund that focuses its investments in a particular industry or sector will be more sensitive to conditions that affect that industry or sector than a non-concentrated fund.
Short Sales: The Fund may engage in short sales, and may experience a loss if the price of a borrowed security increases before the date on which the Fund replaces the security.
Leverage: When a fund leverages its portfolio, the value of its shares may be more volatile and all other risks may be compounded.
Derivatives: Investments in derivatives such as futures, options, forwards, and swaps may increase volatility or cause a loss greater than the principal investment.
MLPs: Investments in Master Limited Partnerships may be adversely impacted by tax law changes, regulation, or factors affecting underlying assets.
Market Price/NAV: Shares of ETFs often trade at a discount to their net asset value, which may increase investors’ risk of loss. At the time of sale, an investor’s shares may have a market price that is above or below the Fund’s NAV.
Prospectus: For additional information on risks, please see the Fund’s prospectus. The Fund may not be suitable for all investors.
24
Management’s Discussion of Fund Performance (unaudited) (continued)
October 31, 2018
InfraCap MLP ETF (continued)
Value of a $10,000 Investment Since Inception at Net Asset Value
The chart above represents historical performance of a hypothetical investment of $10,000 over the life of the Fund, assuming reinvestment of distributions. Past performance does not guarantee future results.
25
Management’s Discussion of Fund Performance (unaudited) (continued)
October 31, 2018
InfraCap MLP ETF (continued)
Supplemental Financial Data
The information presented below regarding Distributable Cash Flow is supplemental non — GAAP financial information, which is meaningful to understanding the operating performance of the Fund. DCF is the functional equivalent of EBITDA for non — investment companies. The Fund manager believes it is an important supplemental measure of performance. This information is supplemental, is not inclusive of required financial disclosures (such as Total Expense Ratio), and should be read in conjunction with our full financial statements.
| | | | Year ended
Oct 31,
2018
| | Year ended
Oct 31,
2017
| | Year ended
Oct 31,
2016
|
Investment Income | | | | | | | | | | | | | | |
Distributions from master limited partnerships | | | | $ | 53,597,522 | | | $ | 28,081,000 | | | $ | 4,391,084 | |
Dividend income (net of foreign withholding taxes) | | | | | 2,774,933 | | | | 764,352 | | | | 354,815 | |
Net realized gain (loss) from written and purchased option contracts | | | | | 40,949,800 | | | | 24,504,456 | | | | 3,057,069 | |
Total Investment Income | | | | | 97,322,255 | | | | 53,349,808 | | | | 7,802,968 | |
Operating Expenses | | | | | | | | | | | | | | |
Sub-Advisory Fees | | | | | 5,771,439 | | | | 3,225,917 | | | | 515,252 | |
Franchise Tax Expense | | | | | 12,675 | | | | 5,088 | | | | — | |
Total | | | | | 5,784,114 | | | | 3,231,005 | | | | 515,252 | |
Distributable cash flow before leverage costs | | | | | 91,538,141 | | | | 50,118,803 | | | | 7,287,716 | |
Dividend and interest expenses | | | | | 8,734,418 | | | | 3,203,804 | | | | 339,703 | |
Distributable Cash Flow | | | | $ | 82,803,723 | | | $ | 46,914,999 | | | $ | 6,948,013 | |
Distributions to Shareholders | | | | $ | 119,404,506 | | | $ | 78,416,009 | | | | 11,752,009 | |
Dividend Coverage Ratio | | | | | 69 | % | | | 60 | % | | | 60 | % |
| | | | 3 months
ended Oct 31,
2018
| | 3 months
ended Jul 31,
2018
| | 3 months
ended Apr 30,
2018
| | 3 months
ended Jan 31,
2018
|
Investment Income | | | | | | | | | | | | | | | | | | |
Distributions from master limited partnerships | | | | $ | 13,976,449 | | | $ | 12,705,022 | | | $ | 13,465,490 | | | $ | 13,450,561 | |
Dividend income (net of foreign withholding taxes) | | | | | 1,525,333 | | | | 582,968 | | | | 422,372 | | | | 244,260 | |
Net realized gain (loss) from written and purchased option contracts | | | | | 8,394,080 | | | | 10,619,883 | | | | 10,836,979 | | | | 11,098,858 | |
Total Investment Income | | | | | 23,895,862 | | | | 23,907,873 | | | | 24,724,841 | | | | 24,793,679 | |
Operating Expenses | | | | | | | | | | | | | | | | | | |
Sub-Advisory Fees | | | | | 1,534,826 | | | | 1,510,183 | | | | 1,352,869 | | | | 1,373,561 | |
Franchise Tax Expense | | | | | 12,675 | | | | — | | | | — | | | | — | |
Total | | | | | 1,547,501 | | | | 1,510,183 | | | | 1,352,869 | | | | 1,373,561 | |
Distributable cash flow before leverage costs | | | | | 22,348,361 | | | | 22,397,690 | | | | 23,371,972 | | | | 23,420,118 | |
Dividend and interest expenses | | | | | 3,649,138 | | | | 1,963,119 | | | | 1,426,153 | | | | 1,696,008 | |
Distributable Cash Flow | | | | $ | 18,699,223 | | | $ | 20,434,571 | | | $ | 21,945,819 | | | $ | 21,724,110 | |
Distributions to Shareholders | | | | $ | 27,284,506 | | | $ | 27,945,500 | | | $ | 25,954,500 | | | $ | 38,220,000 | |
Dividend Coverage Ratio | | | | | 69 | % | | | 73 | % | | | 85 | % | | | 57 | % |
26
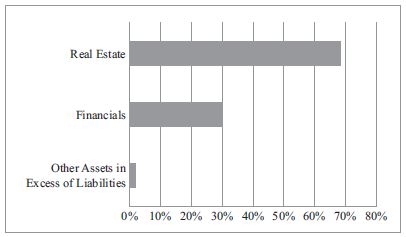
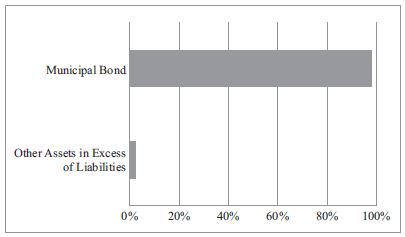
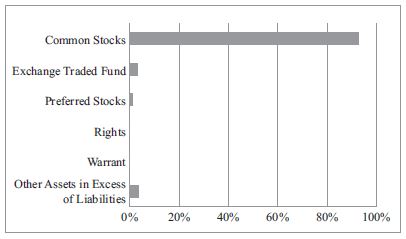
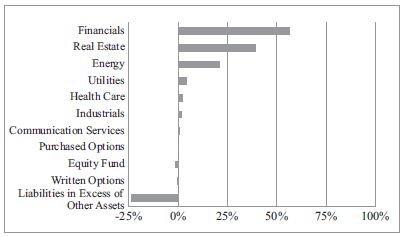
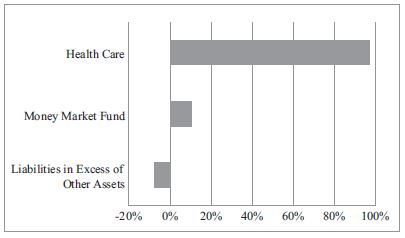
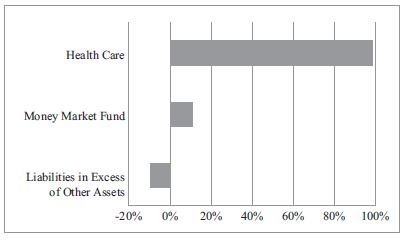
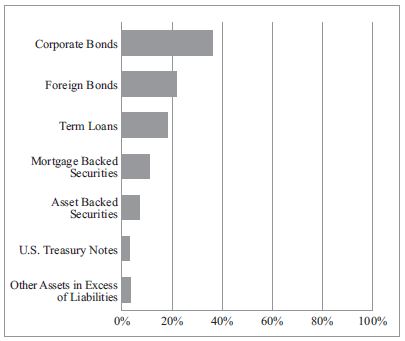
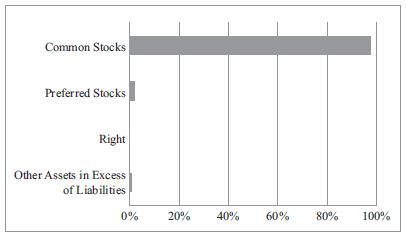
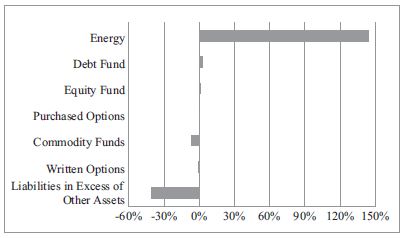
Portfolio Composition
October 31, 2018 (unaudited)
Asset Allocation as of 10/31/2018 (based on net assets)
InfraCap REIT Preferred ETF
| | | |
| Real Estate | | 68.2 | % |
| Financials | | 30.1 | % |
| Other Assets in Excess of Liabilities | | 1.7 | % |
| Total | | 100.0 | % |
| | | | |
Virtus Cumberland Municipal Bond ETF
| | | |
| Municipal Bonds | | 97.9 | % |
| Other Assets in Excess of Liabilities | | 2.1 | % |
| Total | | 100.0 | % |
| | | | |
Virtus Glovista Emerging Markets ETF
| | | |
| Common Stocks | | 92.6 | % |
| Exchange Traded Fund | | 3.1 | % |
| Preferred Stocks | | 0.9 | % |
| Rights | | 0.0 | %* |
| Warrant | | 0.0 | %* |
| Other Assets in Excess of Liabilities | | 3.4 | % |
| Total | | 100.0 | % |
| | | | |
| * | | Amount rounds to less than 0.05%. |
27
Portfolio Composition (continued)
October 31, 2018 (unaudited)
Asset Allocation as of 10/31/2018 (based on net assets)
Virtus InfraCap U.S. Preferred Stock ETF
| | | |
| Financials | | 56.6 | %* |
| Real Estate | | 39.0 | %* |
| Energy | | 20.9 | % |
| Utilities | | 4.1 | % |
| Health Care | | 2.2 | % |
| Industrials | | 1.9 | % |
| Communication Services | | 0.5 | % |
| Purchased Options | | 0.0 | %** |
| Equity Fund | | (1.3 | )% |
| Written Options | | (0.2 | )% |
| Liabilities in Excess of Other Assets | | (23.7 | )% |
| Total | | 100.0 | % |
| | | | |
| * | | Amounts represent investments in particular sectors. No industry within these sectors represented more than 25% of the Fund’s total assets at the time of investment. |
| ** | | Amount rounds to less than 0.05%.
|
Virtus LifeSci Biotech Clinical Trials ETF
| | | | | | |
| Health Care | | | | | 97.1 | % |
| Money Market Fund | | | | | 10.4 | % |
| Liabilities in Excess of Other Assets | | | | | (7.5 | )% |
| Total | | | | | 100.0 | % |
| | | | | | | |
Virtus LifeSci Biotech Products ETF
| | | | | | |
| Health Care | | | | | 98.5 | % |
| Money Market Fund | | | | | 11.1 | % |
| Liabilities in Excess of Other Assets | | | | | (9.6 | )% |
| Total | | | | | 100.0 | % |
| | | | | | | |
28
Portfolio Composition (continued)
October 31, 2018 (unaudited)
Virtus Newfleet Multi-Sector Bond ETF
| | | |
| Corporate Bonds | | 35.9 | % |
| Foreign Bonds | | 21.8 | % |
| Term Loans | | 18.0 | % |
| Mortgage Backed Securities | | 11.1 | % |
| Asset Backed Securities | | 6.9 | % |
| U.S. Treasury Notes | | 3.0 | % |
| Other Assets in Excess of Liabilities | | 3.3 | % |
| Total | | 100.0 | % |
| | | | |
Virtus WMC Global Factor Opportunities ETF
| | | |
| Common Stocks | | 97.6 | % |
| Preferred Stocks | | 1.9 | % |
| Right | | 0.0 | %* |
| Other Assets in Excess of Liabilities | | 0.5 | % |
| Total | | 100.0 | % |
| | | | |
* Amount rounds to less than 0.05%.
InfraCap MLP ETF
| | | | | | |
| Energy | | | | | 143.8 | % |
| Debt Fund | | | | | 3.1 | % |
| Equity Fund | | | | | 0.9 | % |
| Purchased Options | | | | | 0.8 | % |
| Commodity Funds | | | | | (6.6 | )% |
| Written Options | | | | | (1.1 | )% |
| Liabilities in Excess of Other Assets | | | | | (40.9 | )% |
| Total | | | | | 100.0 | % |
| | | | | | | |
29
Shareholder Expense Examples (unaudited)
As a shareholder of a Fund, you incur ongoing costs, including advisory fees and other fund expenses, if any. The following example is intended to help you understand your ongoing costs (in dollars and cents) of investing in a Fund and to compare these costs with the ongoing costs of investing in other funds. The examples are based on an investment of $1,000 invested at the beginning of the period and held throughout the entire period (May 1, 2018 to October 31, 2018), except as noted in footnotes below.
Actual expenses
The first line under each Fund in the table below provides information about actual account values and actual expenses. You may use the information in this line, together with the amount you invested, to estimate the expenses that you paid over the period. Simply divide your account value by $1,000 (for example, an $8,600 account value divided by $1,000 = 8.6), then multiply the result by the number in the first line for your Fund under the heading entitled “Expenses Paid During Period” to estimate the expenses you paid on your account during this period.
Hypothetical example for comparison purposes
The second line under each Fund in the table provides information about hypothetical account values and hypothetical expenses based on each Fund’s actual expense ratio and an assumed rate of return of 5% per year before expenses, which is not each Fund’s actual return. The hypothetical account values and expenses may not be used to estimate the actual ending account balance or expenses you paid for the period. You may use this information to compare the ongoing costs of investing in each Fund and other funds. To do so, compare this 5% hypothetical example with the 5% hypothetical examples that appear in the shareholder reports of the other funds. Please note that the expenses shown in the table are meant to highlight your ongoing costs only and do not reflect any transactional costs, such as brokerage commissions paid on purchases and sales of Fund shares. Therefore, the second line under each Fund in the table is useful in comparing ongoing Fund costs only and will not help you determine the relative total costs of owning different funds.
In addition, if these transactional costs were included, your costs would have been higher.
| | | | Beginning
Account
Value
5/01/18
| | Ending
Account
Value
10/31/18
| | Annualized
Expense Ratios(2)
| | Expenses Paid
During the
Period
|
InfraCap REIT Preferred ETF | | | | | | | | | | | | | | | | | | |
Actual | | | | $ | 1000.00 | | | $ | 1,017.18 | | | | 0.45 | % | | $ | 2.29(3) | |
Hypothetical(1) | | | | $ | 1000.00 | | | $ | 1,022.94 | | | | 0.45 | % | | $ | 2.29(4) | |
Virtus Cumberland Municipal Bond ETF | | | | | | | | | | | | | | | | | | |
Actual | | | | $ | 1000.00 | | | $ | 999.96 | | | | 0.59 | % | | $ | 2.97(3) | |
Hypothetical(1) | | | | $ | 1000.00 | | | $ | 1,022.23 | | | | 0.59 | % | | $ | 3.01(4) | |
Virtus Glovista Emerging Markets ETF | | | | | | | | | | | | | | | | | | |
Actual | | | | $ | 1000.00 | | | $ | 845.77 | | | | 0.65 | % | | $ | 3.02(3) | |
Hypothetical(1) | | | | $ | 1000.00 | | | $ | 1,021.93 | | | | 0.65 | % | | $ | 3.31(4) | |
Virtus InfraCap U.S. Preferred Stock ETF | | | | | | | | | | | | | | | | | | |
Actual | | | | $ | 1000.00 | | | $ | 1,010.23 | | | | 0.80 | % | | $ | 3.72(5) | |
Hypothetical(1) | | | | $ | 1000.00 | | | $ | 1,021.17 | | | | 0.80 | % | | $ | 4.08(4) | |
Virtus LifeSci Biotech Clinical Trials ETF | | | | | | | | | | | | | | | | | | |
Actual | | | | $ | 1000.00 | | | $ | 867.39 | | | | 0.79 | % | | $ | 3.72(3) | |
Hypothetical(1) | | | | $ | 1000.00 | | | $ | 1,021.22 | | | | 0.79 | % | | $ | 4.02(4) | |
Virtus LifeSci Biotech Products ETF | | | | | | | | | | | | | | | | | | |
Actual | | | | $ | 1000.00 | | | $ | 902.26 | | | | 0.79 | % | | $ | 3.79(3) | |
Hypothetical(1) | | | | $ | 1000.00 | | | $ | 1,021.22 | | | | 0.79 | % | | $ | 4.02(4) | |
Virtus Newfleet Multi-Sector Bond ETF | | | | | | | | | | | | | | | | | | |
Actual | | | | $ | 1000.00 | | | $ | 996.25 | | | | 0.80 | % | | $ | 4.03(3) | |
Hypothetical(1) | | | | $ | 1000.00 | | | $ | 1,021.17 | | | | 0.80 | % | | $ | 4.08(4) | |
Virtus WMC Global Factor Opportunities ETF | | | | | | | | | | | | | | | | | | |
Actual | | | | $ | 1000.00 | | | $ | 942.62 | | | | 0.49 | % | | $ | 2.40(3) | |
Hypothetical(1) | | | | $ | 1000.00 | | | $ | 1,022.74 | | | | 0.49 | % | | $ | 2.50(4) | |
InfraCap MLP ETF | | | | | | | | | | | | | | | | | | |
Actual | | | | $ | 1000.00 | | | $ | 956.34 | | | | 0.95 | % | | $ | 4.68(3) | |
Hypothetical(1) | | | | $ | 1000.00 | | | $ | 1,020.42 | | | | 0.95 | % | | $ | 4.84(4) | |
| 1 | | Assuming 5% return before expenses. |
| 2 | | Annualized expense ratios reflect expenses net of waived fees or reimbursed expenses, if applicable. |
| 3 | | Expenses are calculated using each Fund’s annualized expense ratio, multiplied by the average account value for the period, multiplied by 184/365 (to reflect the six-month period). |
| 4 | | Hypothetical expenses are calculated using the Fund’s annualized expense ratio, multiplied by the average account value for the period, multiplied by 184/365 (to reflect the six-month period). |
| 5 | | Actual expenses are calculated using the Fund’s annualized expense ratio, multiplied by the average account value for the period, multiplied by 169/365 (to reflect the period May 16, 2018 to October 31, 2018). |
30
Schedule of Investments — InfraCap REIT Preferred ETF
October 31, 2018
Security Description
| | | | Shares
| | Value
|
PREFERRED STOCKS — 98.3% | | | | | | | | | | |
Financials — 30.1% | | | | | | | | | | |
AGNC Investment Corp., Series B, 7.75% | | | | | 8,577 | | | $ | 217,942 | |
AGNC Investment Corp., Series C, 7.00% | | | | | 15,929 | | | | 403,004 | |
Annaly Capital Management, Inc.,
Series F, 6.95% | | | | | 35,288 | | | | 886,787 | |
Annaly Capital Management, Inc.,
Series G, 6.50% | | | | | 20,830 | | | | 496,171 | |
Apollo Global Management LLC,
Series B, 6.38% | | | | | 14,703 | | | | 363,017 | |
Arch Capital Group Ltd., Series F, 5.45% | | | | | 16,174 | | | | 364,562 | |
ARMOUR Residential REIT, Inc.,
Series B, 7.88% | | | | | 7,804 | | | | 195,100 | |
Capstead Mortgage Corp., Series E, 7.50% | | | | | 12,656 | | | | 313,236 | |
Chimera Investment Corp., Series A, 8.00% | | | | | 7,107 | | | | 180,660 | |
Chimera Investment Corp., Series B, 8.00% | | | | | 15,929 | | | | 412,083 | |
Invesco Mortgage Capital, Inc., Series A, 7.75% | | | | | 6,862 | | | | 171,824 | |
Invesco Mortgage Capital, Inc., Series C, 7.50% | | | | | 14,091 | | | | 350,020 | |
KKR & Co., Inc., Series A, 6.75% | | | | | 16,909 | | | | 446,228 | |
KKR & Co., Inc., Series B, 6.50% | | | | | 7,597 | | | | 198,054 | |
New York Mortgage Trust, Inc., Series D, 8.00% | | | | | 7,045 | | | | 161,683 | |
PennyMac Mortgage Investment Trust,
Series A, 8.13% | | | | | 5,636 | | | | 139,773 | |
PennyMac Mortgage Investment Trust,
Series B, 8.00% | | | | | 9,557 | | | | 234,825 | |
Two Harbors Investment Corp., Series A, 8.13% | | | | | 7,045 | | | | 181,831 | |
Two Harbors Investment Corp., Series B, 7.63% | | | | | 14,091 | | | | 347,766 | |
Two Harbors Investment Corp., Series C, 7.25% | | | | | 14,458 | | | | 350,751 | |
Wells Fargo Real Estate Investment Corp.,
Series A, 6.38% | | | | | 13,478 | | | | 343,285 | |
Total Financials | | | | | | | | | 6,758,602 | |
Real Estate — 68.2% | | | | | | | | | | |
American Homes 4 Rent, Series D, 6.50% | | | | | 13,172 | | | | 315,074 | |
American Homes 4 Rent, Series E, 6.35% | | | | | 11,273 | | | | 266,381 | |
American Homes 4 Rent, Series F, 5.88% | | | | | 7,597 | | | | 169,413 | |
American Homes 4 Rent, Series G, 5.88% | | | | | 5,636 | | | | 124,668 | |
Ashford Hospitality Trust, Inc., Series F, 7.38% | | | | | 5,881 | | | | 136,086 | |
Ashford Hospitality Trust, Inc., Series G, 7.38% | | | | | 7,597 | | | | 173,971 | |
Ashford Hospitality Trust, Inc., Series H, 7.50% | | | | | 4,656 | | | | 108,950 | |
Ashford Hospitality Trust, Inc., Series I, 7.50% | | | | | 6,616 | | | | 153,822 | |
Boston Properties, Inc., Series B, 5.25% | | | | | 9,802 | | | | 237,699 | |
Brookfield Property REIT, Inc., Series A, 6.38% | | | | | 12,253 | | | | 293,459 | |
CBL & Associates Properties, Inc.,
Series D, 7.38% | | | | | 22,239 | | | | 341,369 | |
CBL & Associates Properties, Inc.,
Series E, 6.63% | | | | | 8,454 | | | | 121,653 | |
Cedar Realty Trust, Inc., Series C, 6.50% | | | | | 6,126 | | | | 130,729 | |
Colony Capital, Inc., Series E, 8.75% | | | | | 12,253 | | | | 316,373 | |
Colony Capital, Inc., Series H, 7.13% | | | | | 14,091 | | | | 318,034 | |
Colony Capital, Inc., Series I, 7.15% | | | | | 16,909 | | | | 373,689 | |
Colony Capital, Inc., Series J, 7.13% | | | | | 15,500 | | | | 342,550 | |
Digital Realty Trust, Inc., Series C, 6.63% | | | | | 9,863 | | | | 258,805 | |
Digital Realty Trust, Inc., Series I, 6.35% | | | | | 12,253 | | | | 315,760 | |
Digital Realty Trust, Inc., Series J, 5.25% | | | | | 9,802 | | | | 216,232 | |
EPR Properties, Series G, 5.75% | | | | | 7,352 | | | | 168,728 | |
Farmland Partners, Inc., Series B, 6.00% | | | | | 7,398 | | | | 162,016 | |
Federal Realty Investment Trust, Series C, 5.00% | | | | | 7,352 | | | | 174,095 | |
Security Description
| | | | Shares
| | Value
|
PREFERRED STOCKS (continued) | | | | | | | | | | |
Real Estate (continued) | | | | | | | | | | |
Global Net Lease, Inc., Series A, 7.25% | | | | | 6,630 | | | $ | 165,021 | |
Hersha Hospitality Trust, Series D, 6.50% | | | | | 9,437 | | | | 199,121 | |
Hersha Hospitality Trust, Series E, 6.50% | | | | | 4,904 | | | | 104,504 | |
Kimco Realty Corp., Series I, 6.00% | | | | | 19,604 | | | | 488,532 | |
Kimco Realty Corp., Series J, 5.50% | | | | | 11,027 | | | | 248,659 | |
Kimco Realty Corp., Series K, 5.63% | | | | | 8,577 | | | | 196,671 | |
Kimco Realty Corp., Series L, 5.13% | | | | | 11,027 | | | | 231,567 | |
Kimco Realty Corp., Series M, 5.25% | | | | | 12,963 | | | | 270,149 | |
LaSalle Hotel Properties, Series J, 6.30% | | | | | 7,352 | | | | 175,345 | |
Monmouth Real Estate Investment Corp.,
Series C, 6.13% | | | | | 13,599 | | | | 326,376 | |
National Retail Properties, Inc., Series E, 5.70% | | | | | 14,091 | | | | 335,507 | |
National Retail Properties, Inc., Series F, 5.20% | | | | | 16,909 | | | | 366,249 | |
National Storage Affiliates Trust, Series A, 6.00% | | | | | 8,454 | | | | 205,010 | |
Pebblebrook Hotel Trust, Series D, 6.38% | | | | | 6,126 | | | | 148,628 | |
Pennsylvania Real Estate Investment Trust, Series B, 7.38% | | | | | 4,227 | | | | 97,855 | |
Pennsylvania Real Estate Investment Trust, Series C, 7.20% | | | | | 8,454 | | | | 189,708 | |
Pennsylvania Real Estate Investment Trust, Series D, 6.88% | | | | | 5,881 | | | | 128,941 | |
PS Business Parks, Inc., Series U, 5.75% | | | | | 11,273 | | | | 268,185 | |
PS Business Parks, Inc., Series V, 5.70% | | | | | 5,391 | | | | 126,473 | |
PS Business Parks, Inc., Series W, 5.20% | | | | | 9,300 | | | | 201,531 | |
PS Business Parks, Inc., Series X, 5.25% | | | | | 11,273 | | | | 245,413 | |
PS Business Parks, Inc., Series Y, 5.20% | | | | | 9,802 | | | | 211,037 | |
Public Storage, Series A, 5.88% | | | | | 5,682 | | | | 144,096 | |
Public Storage, Series B, 5.40% | | | | | 8,972 | | | | 212,726 | |
Public Storage, Series C, 5.13% | | | | | 5,981 | | | | 137,443 | |
Public Storage, Series D, 4.95% | | | | | 9,719 | | | | 214,984 | |
Public Storage, Series E, 4.90% | | | | | 10,467 | | | | 229,646 | |
Public Storage, Series F, 5.15% | | | | | 8,374 | | | | 190,843 | |
Public Storage, Series G, 5.05% | | | | | 8,972 | | | | 206,356 | |
Public Storage, Series V, 5.38% | | | | | 14,803 | | | | 346,242 | |
Public Storage, Series W, 5.20% | | | | | 14,953 | | | | 341,676 | |
Public Storage, Series X, 5.20% | | | | | 6,729 | | | | 153,219 | |
QTS Realty Trust, Inc., Series A, 7.13% | | | | | 5,244 | | | | 131,100 | |
SITE Centers Corp., Series A, 6.38% | | | | | 8,577 | | | | 201,817 | |
SITE Centers Corp., Series J, 6.50% | | | | | 9,802 | | | | 228,877 | |
Spirit Realty Capital, Inc., Series A, 6.00% | | | | | 8,454 | | | | 188,440 | |
Summit Hotel Properties, Inc., Series E, 6.25% | | | | | 7,842 | | | | 179,974 | |
Taubman Centers, Inc., Series K, 6.25% | | | | | 8,332 | | | | 197,052 | |
Vornado Realty Trust, Series L, 5.40% | | | | | 14,703 | | | | 342,580 | |
Vornado Realty Trust, Series M, 5.25% | | | | | 15,659 | | | | 343,245 | |
Washington Prime Group, Inc., Series H, 7.50% | | | | | 4,901 | | | | 102,774 | |
Welltower, Inc., Series I, 6.50% | | | | | 17,607 | | | | 1,084,591 | |
Total Real Estate | | | | | | | | | 15,327,719 | |
TOTAL INVESTMENTS — 98.3% | | | | | | | | | | |
(Cost $23,212,307) | | | | | | | | | 22,086,321 | |
Other Assets in Excess of Liabilities — 1.7% | | | | | | | | | 382,150 | |
Net Assets — 100.0% | | | | | | | | $ | 22,468,471 | |
The accompanying notes are an integral part of these financial statements.
31
Schedule of Investments — InfraCap REIT Preferred ETF (continued)
October 31, 2018
The following table summarizes valuation of the Fund’s investments under the fair value hierarchy levels as of October 31, 2018:
| | | | Level 1
| | Level 2
| | Level 3
| | Total
|
Asset Valuation Inputs | | | | | | | | | | | | | | | | | | |
Preferred Stocks | | | | $ | 22,086,321 | | | $ | — | | | $ | — | | | $ | 22,086,321 | |
Total | | | | $ | 22,086,321 | | | $ | — | | | $ | — | | | $ | 22,086,321 | |
There were no Level 3 securities as of October 31, 2018.
The accompanying notes are an integral part of these financial statements.
32
Schedule of Investments — Virtus Cumberland Municipal Bond ETF
October 31, 2018
Security Description
| | | | Principal
| | Value
|
MUNICIPAL BONDS — 97.9% | | | | | | | | | | |
ALABAMA — 1.0% | | | | | | | | | | |
Auburn University, Series A, 5.00%, 06/01/26 (Call 6/01/21) | | | | $ | 100,000 | | | $ | 107,167 | |
ARIZONA — 5.2% | | | | | | | | | | |
Arizona Department of Transportation State Highway Fund Revenue, Series A, 5.25%, 07/01/29 (Call 7/01/21) | | | | | 200,000 | | | | 215,800 | |
City of Phoenix Civic Improvement Corp., Series A, 5.00%, 07/01/22 (Call 7/01/20) | | | | | 130,000 | | | | 136,085 | |
Salt River Project Agricultural Improvement & Power District, Series A, 5.00%, 01/01/38
(Call 1/01/27) | | | | | 200,000 | | | | 223,544 | |
Total Arizona | | | | | | | | | 575,429 | |
ARKANSAS — 1.9% | | | | | | | | | | |
State of Arkansas, 5.00%, 04/01/20 | | | | | 200,000 | | | | 208,092 | |
CALIFORNIA — 5.7% | | | | | | | | | | |
Beverly Hills Unified School District CA, 4.00%, 08/01/40 (Call 8/01/26) | | | | | 150,000 | | | | 153,610 | |
California Health Facilities Financing Authority, Series A, 5.00%, 08/15/52 (Call 8/15/23) | | | | | 100,000 | | | | 106,688 | |
County of Sacramento CA Airport System Revenue, 5.00%, 07/01/40 (Call 7/01/20) | | | | | 200,000 | | | | 208,894 | |
State of California, 5.00%, 10/01/41
(Call 10/01/21) | | | | | 150,000 | | | | 161,129 | |
Total California | | | | | | | | | 630,321 | |
COLORADO — 4.1% | | | | | | | | | | |
City & County of Denver Co. Airport System Revenue, Series A, 5.00%, 11/15/31
(Call 11/15/26) | | | | | 175,000 | | | | 197,031 | |
Regional Transportation District, Series A, 4.50%, 06/01/44 (Call 6/01/23) | | | | | 250,000 | | | | 259,630 | |
Total Colorado | | | | | | | | | 456,661 | |
CONNECTICUT — 2.1% | | | | | | | | | | |
State of Connecticut Clean Water Fund — State Revolving Fund, Series A, 5.00%, 05/01/27 | | | | | 200,000 | | | | 235,884 | |
DISTRICT OF COLUMBIA — 2.1% | | | | | | | | | | |
District of Columbia, Series G, 5.00%, 12/01/36 (Call 12/01/21) | | | | | 100,000 | | | | 106,783 | |
District of Columbia Water & Sewer Authority, Series A, 5.00%, 10/01/52 (Call 4/01/27) | | | | | 110,000 | | | | 121,090 | |
Total District of Columbia | | | | | | | | | 227,873 | |
FLORIDA — 5.9% | | | | | | | | | | |
Central Florida Expressway Authority, Series B, 4.00%, 07/01/38 (Call 7/01/26) | | | | | 200,000 | | | | 200,910 | |
City of Tampa FL, Series A, 4.00%, 11/15/46 (Call 5/15/26) | | | | | 100,000 | | | | 97,689 | |
Florida Housing Finance Corp., Series 1, (GNMA/FNMA/FHLMC), 3.80%, 07/01/47
(Call 1/01/27) | | | | | 145,000 | | | | 137,699 | |
Orange County School Board, Series A, (AGC Insured), 5.50%, 08/01/34 (Call 8/01/19) | | | | | 100,000 | | | | 102,663 | |
Sarasota County Public Hospital District, 5.00%, 07/01/37 (Call 7/01/28) | | | | | 100,000 | | | | 109,965 | |
Total Florida | | | | | | | | | 648,926 | |
Security Description
| | | | Shares
| | Value
|
MUNICIPAL BONDS (continued) | | | | | | | | | | |
GEORGIA — 2.0% | | | | | | | | | | |
State of Georgia, Series C-1, 4.00%, 07/01/25 | | | | $ | 200,000 | | | $ | 218,820 | |
HAWAII — 4.7% | | | | | | | | | | |
City & County Honolulu HI Wastewater System Revenue, Series A, 5.00%, 07/01/45
(Call 7/01/25) | | | | | 150,000 | | | | 164,948 | |
State of Hawaii Department of Budget & Finance, Series A, 5.50%, 07/01/43 (Call 7/01/23) | | | | | 200,000 | | | | 218,414 | |
State of Hawaii State Highway Fund, Series A, 5.00%, 01/01/28 (Call 7/01/24) | | | | | 115,000 | | | | 129,186 | |
Total Hawaii | | | | | | | | | 512,548 | |
INDIANA — 2.2% | | | | | | | | | | |
Ball State University, Series R, 5.00%, 07/01/36 (Call 7/01/27) | | | | | 220,000 | | | | 245,516 | |
KANSAS — 0.9% | | | | | | | | | | |
Geary County Unified School District No 475, Series A, 4.00%, 09/01/43 (Call 9/01/25) | | | | | 100,000 | | | | 100,233 | |
LOUISIANA — 1.4% | | | | | | | | | | |
State of Louisiana Gasoline & Fuels Tax Revenue, Series A, 4.50%, 05/01/39 (Call 5/01/25) | | | | | 150,000 | | | | 155,470 | |
MAINE — 1.0% | | | | | | | | | | |
Maine Turnpike Authority, 5.00%, 07/01/47
(Call 7/01/28) | | | | | 100,000 | | | | 111,078 | |
MARYLAND — 3.1% | | | | | | | | | | |
City of Baltimore MD, Series C, 3.00%, 07/01/19 | | | | | 185,000 | | | | 186,138 | |
University System of Maryland, Series A, 4.00%, 04/01/37 (Call 4/01/27) | | | | | 150,000 | | | | 154,428 | |
Total Maryland | | | | | | | | | 340,566 | |
MASSACHUSETTS — 10.6% | | | | | | | | | | |
Commonwealth of Massachusetts, (NATL Insured), 5.25%, 01/01/21 | | | | | 160,000 | | | | 170,218 | |
Commonwealth of Massachusetts, Series A, 4.50%, 12/01/43 (Call 12/01/21) | | | | | 185,000 | | | | 191,832 | |
Commonwealth of Massachusetts, Series B, 5.00%, 08/01/25 (Call 8/01/20) | | | | | 200,000 | | | | 209,964 | |
Massachusetts Development Finance Agency, Series M-4, 5.00%, 07/01/44 (Call 7/01/23) | | | | | 105,000 | | | | 111,858 | |
Massachusetts Health & Educational Facilities Authority, Series I, 5.75%, 07/01/36
(Call 7/01/19) | | | | | 150,000 | | | | 153,817 | |
Massachusetts School Building Authority, Series B, 5.00%, 10/15/41 (Call 10/15/21) | | | | | 200,000 | | | | 212,326 | |
Massachusetts School Building Authority, Series B, 5.25%, 02/15/48 (Call 2/15/28) | | | | | 100,000 | | | | 113,089 | |
Total Massachusetts | | | | | | | | | 1,163,104 | |
MICHIGAN — 2.5% | | | | | | | | | | |
Michigan Finance Authority, 4.00%, 12/01/46 (Call 6/01/27) | | | | | 75,000 | | | | 72,538 | |
Michigan State Housing Development Authority, Series A, 3.63%, 10/01/52 (Call 10/01/25) | | | | | 120,000 | | | | 107,581 | |
Michigan State Housing Development Authority, Series A, 4.15%, 10/01/53 (Call 10/01/27) | | | | | 100,000 | | | | 98,007 | |
Total Michigan | | | | | | | | | 278,126 | |
The accompanying notes are an integral part of these financial statements.
33
Schedule of Investments — Virtus Cumberland Municipal Bond ETF (continued)
October 31, 2018
Security Description
| | | | Principal
| | Value
|
MUNICIPAL BONDS (continued) | | | | | | | | | | |
MISSOURI — 1.1% | | | | | | | | | | |
Missouri Highway & Transportation Commission, Series A, 5.00%, 05/01/26 | | | | $ | 100,000 | | | $ | 116,475 | |
NEBRASKA — 2.7% | | | | | | | | | | |
Omaha Public Power District, Series A, 4.00%, 02/01/42 (Call 12/01/27) | | | | | 100,000 | | | | 100,985 | |
Omaha Public Power District, Series B, 4.00%, 02/01/39 (Call 8/01/24) | | | | | 190,000 | | | | 191,740 | |
Total Nebraska | | | | | | | | | 292,725 | |
NEVADA — 2.9% | | | | | | | | | | |
County of Clark NV, 5.00%, 11/01/24 | | | | | 150,000 | | | | 170,496 | |
Las Vegas Valley Water District, Series A, 4.00%, 02/01/38 (Call 2/01/27) | | | | | 150,000 | | | | 151,675 | |
Total Nevada | | | | | | | | | 322,171 | |
NEW JERSEY — 2.4% | | | | | | | | | | |
New Jersey Economic Development Authority, 5.00%, 06/15/46 (Call 6/15/23) | | | | | 150,000 | | | | 163,658 | |
New Jersey Housing & Mortgage Finance Agency, Series D, 4.45%, 11/01/48 (Call 5/01/26) | | | | | 100,000 | | | | 96,312 | |
Total New Jersey | | | | | | | | | 259,970 | |
NEW YORK — 8.6% | | | | | | | | | | |
Metropolitan Transportation Authority, Series D, 5.00%, 11/15/43 (Call 11/15/23) | | | | | 100,000 | | | | 106,395 | |
New York City Water & Sewer System, Series BB, 5.00%, 06/15/46 (Call 6/15/23) | | | | | 150,000 | | | | 160,971 | |
New York City Water & Sewer System, Series DD, 5.00%, 06/15/39 (Call 6/15/24) | | | | | 150,000 | | | | 164,103 | |
New York State Dormitory Authority, Series A, 5.00%, 07/01/43 (Call 7/01/23) | | | | | 200,000 | | | | 218,008 | |
New York State Environmental Facilities Corp., Series A, 5.00%, 06/15/30 (Call 6/15/23) | | | | | 100,000 | | | | 109,741 | |
New York State Housing Finance Agency, Series D, (SONYMA FNMA), 4.20%, 11/01/49
(Call 5/01/26) | | | | | 75,000 | | | | 75,335 | |
Port Authority of New York & New Jersey, 6.13%, 06/01/94 (Call 6/01/24) | | | | | 100,000 | | | | 116,056 | |
Total New York | | | | | | | | | 950,609 | |
OHIO — 2.1% | | | | | | | | | | |
Ohio Housing Finance Agency, Series A,
(GNMA/ FNMA/FHLMC), 4.10%, 03/01/42
(Call 9/01/26) | | | | | 135,000 | | | | 137,377 | |
Ohio Housing Finance Agency, Series A,
(GNMA/ FNMA/FHLMC), 4.00%, 09/01/48
(Call 9/01/27) | | | | | 100,000 | | | | 97,778 | |
Total Ohio | | | | | | | | | 235,155 | |
OKLAHOMA — 0.9% | | | | | | | | | | |
Oklahoma Development Finance Authority, (AGM Insured), 4.13%, 08/15/57 (Call 8/15/28) | | | | | 100,000 | | | | 97,815 | |
PENNSYLVANIA — 3.4% | | | | | | | | | | |
Berks County Municipal Authority, Series A-3, 5.50%, 11/01/31 (Call 11/01/19) | | | | | 125,000 | | | | 128,996 | |
Security Description
| | | | Shares
| | Value
|
MUNICIPAL BONDS (continued) | | | | | | | | | | |
PENNSYLVANIA — (continued) | | | | | | | | | | |
City of Philadelphia PA, (AGM Insured), 4.00%, 08/01/39 (Call 8/01/27) | | | | $ | 75,000 | | | $ | 74,473 | |
Commonwealth Financing Authority, (AGM), 4.00%, 06/01/39 (Call 6/01/28) | | | | | 100,000 | | | | 98,479 | |
Delaware River Joint Toll Bridge Commission, 4.00%, 07/01/47 (Call 7/01/27) | | | | | 75,000 | | | | 75,106 | |
Total Pennsylvania | | | | | | | | | 377,054 | |
PUERTO RICO — 1.1% | | | | | | | | | | |
Commonwealth of Puerto Rico, Series A, (AGM Insured), 5.00%, 07/01/35 (Call 7/01/22) | | | | | 120,000 | | | | 126,895 | |
TENNESSEE — 1.9% | | | | | | | | | | |
Metropolitan Government of Nashville & Davidson County TN, 4.00%, 07/01/30
(Call 7/01/27) | | | | | 100,000 | | | | 105,853 | |
Rutherford County Health & Educational Facilities Board, Series C, 5.00%, 11/15/47
(Call 11/15/21) | | | | | 100,000 | | | | 106,090 | |
Total Tennessee | | | | | | | | | 211,943 | |
TEXAS — 5.9% | | | | | | | | | | |
City of Houston TX Combined Utility System Revenue, Series D, 5.00%, 11/15/19 | | | | | 150,000 | | | | 154,606 | |
Grand Parkway Transportation Corp., Series B, 5.00%, 04/01/53 (Call 10/01/23) | | | | | 100,000 | | | | 107,463 | |
Lower Colorado River Authority, 5.00%, 05/15/39 (Call 5/15/23) | | | | | 150,000 | | | | 161,840 | |
Red River Education Finance Corp., 5.00%, 03/15/43 (Call 3/15/23) | | | | | 205,000 | | | | 221,144 | |
Total Texas | | | | | | | | | 645,053 | |
UTAH — 1.0% | | | | | | | | | | |
Salt Lake City Corp. Airport Revenue, Series B, 5.00%, 07/01/42 (Call 7/01/27) | | | | | 100,000 | | | | 109,479 | |
VIRGINIA — 2.8% | | | | | | | | | | |
County of Fairfax VA, Series A, (ST AID WITHHLDG), 4.00%, 10/01/36 (Call 4/01/27) | | | | | 100,000 | | | | 103,836 | |
University of Virginia, Series A, 4.00%, 04/01/42 (Call 4/01/27) | | | | | 200,000 | | | | 203,286 | |
Total Virginia | | | | | | | | | 307,122 | |
WASHINGTON — 3.1% | | | | | | | | | | |
City of Seattle WA Water System Revenue, 4.00%, 08/01/35 (Call 2/01/27) | | | | | 100,000 | | | | 102,684 | |
State of Washington, Series 2010-A, 5.00%, 08/01/28 (Call 8/01/19) | | | | | 140,000 | | | | 143,212 | |
Washington State Convention Center Public Facilities District, 4.00%, 07/01/58
(Call 7/01/28) | | | | | 100,000 | | | | 92,875 | |
Total Washington | | | | | | | | | 338,771 | |
The accompanying notes are an integral part of these financial statements.
34
Schedule of Investments — Virtus Cumberland Municipal Bond ETF (continued)
October 31, 2018
Security Description
| | | | Principal
| | Value
|
MUNICIPAL BONDS (continued) | | | | | | | | | | |
WISCONSIN — 1.6% | | | | | | | | | | |
State of Wisconsin, Series A, (ST APPROP), 6.00%, 05/01/36 (Call 5/01/19) | | | | $ | 100,000 | | | $ | 102,055 | |
Wisconsin Health & Educational Facilities Authority, 4.00%, 12/01/46 (Call 11/01/26) | | | | | 75,000 | | | | 72,179 | |
Total Wisconsin | | | | | | | | | 174,234 | |
Total Municipal Bonds | | | | | | | | | | |
(Cost $10,945,168) | | | | | | | | | 10,781,285 | |
Security Description
| | | | Principal
| | Value
|
TOTAL INVESTMENTS — 97.9% | | | | | | | | | | |
(Cost $10,945,168) | | | | | | | | $ | 10,781,285 | |
Other Assets in Excess of Liabilities — 2.1% | | | | | | | | | 228,492 | |
Net Assets — 100.0% | | | | | | | | $ | 11,009,777 | |
Abbreviations:
AGC — Assured Guaranty Corp.
AGM — Assured Guaranty Municipal Corp.
FHLMC — Federal Home Loan Mortgage Corp.
FNMA — Federal National Mortgage Association.
GNMA — Government National Mortgage Association.
NATL — National Public Finance Guarantee Corp.
SONYMA — State of New York Mortgage Agency.
ST AID WITHHLDG — State Aid Withholding.
ST APPROP — State Appropriation.
The following table summarizes valuation of the Fund’s investments under the fair value hierarchy levels as of October 31, 2018:
| | | | Level 1
| | Level 2
| | Level 3
| | Total
|
Asset Valuation Inputs | | | | | | | | | | | | | | | | | | |
Municipal Bonds | | | | $ | — | | | $ | 10,781,285 | | | $ | — | | | $ | 10,781,285 | |
Total | | | | $ | — | | | $ | 10,781,285 | | | $ | — | | | $ | 10,781,285 | |
There were no Level 3 securities as of October 31, 2018.
The accompanying notes are an integral part of these financial statements.
35
Schedule of Investments — Virtus Glovista Emerging Markets ETF
October 31, 2018
Security Description
| | | | Shares
| | Value
|
Common Stocks — 92.6% | | | | | | | | | | |
Brazil — 7.5% | | | | | | | | | | |
Ambev SA(1) | | | | | 13,585 | | | $ | 58,823 | |
Atacadao Distribuicao Comercio e Industria Ltda | | | | | 1,153 | | | | 4,722 | |
B2W Cia Digital* | | | | | 537 | | | | 4,978 | |
B3 SA-Brasil Bolsa Balcao | | | | | 5,923 | | | | 42,240 | |
Banco Bradesco SA(1) | | | | | 9,552 | | | | 87,592 | |
Banco do Brasil SA | | | | | 3,119 | | | | 35,829 | |
Banco Santander Brasil SA | | | | | 9,416 | | | | 106,773 | |
BB Seguridade Participacoes SA | | | | | 2,022 | | | | 14,387 | |
BR Malls Participacoes SA* | | | | | 1,789 | | | | 6,105 | |
BRF SA* | | | | | 1,607 | | | | 9,457 | |
CCR SA | | | | | 2,410 | | | | 7,104 | |
Cia de Saneamento Basico do Estado de Sao Paulo | | | | | 711 | | | | 5,340 | |
Cielo SA | | | | | 2,358 | | | | 8,364 | |
CVC Brasil Operadora e Agencia de Viagens SA | | | | | 305 | | | | 4,639 | |
Embraer SA(1) | | | | | 350 | | | | 7,794 | |
Engie Brasil Energia SA | | | | | 427 | | | | 4,567 | |
Equatorial Energia SA | | | | | 415 | | | | 7,582 | |
Fibria Celulose SA | | | | | 738 | | | | 14,248 | |
Gerdau SA(1) | | | | | 2,161 | | | | 9,400 | |
Hapvida Participacoes e Investimentos SA*(2) | | | | | 2,076 | | | | 14,214 | |
Hypera SA | | | | | 829 | | | | 6,634 | |
IRB Brasil Resseguros SA | | | | | 389 | | | | 7,574 | |
Itau Unibanco Holding SA(1) | | | | | 9,478 | | | | 124,825 | |
Kroton Educacional SA | | | | | 4,806 | | | | 14,748 | |
Localiza Rent a Car SA | | | | | 1,083 | | | | 8,367 | |
Lojas Renner SA | | | | | 2,047 | | | | 20,682 | |
Magazine Luiza SA | | | | | 140 | | | | 6,350 | |
Multiplan Empreendimentos Imobiliarios SA | | | | | 1,126 | | | | 6,959 | |
Petrobras Distribuidora SA | | | | | 684 | | | | 4,407 | |
Petroleo Brasileiro SA(1) | | | | | 6,554 | | | | 97,130 | |
Raia Drogasil SA | | | | | 465 | | | | 7,849 | |
Rumo SA* | | | | | 3,037 | | | | 13,588 | |
Sul America SA | | | | | 811 | | | | 5,404 | |
Suzano Papel e Celulose SA | | | | | 1,421 | | | | 14,452 | |
TIM Participacoes SA | | | | | 1,678 | | | | 5,226 | |
Transmissora Alianca de Energia Eletrica SA | | | | | 714 | | | | 4,271 | |
Ultrapar Participacoes SA | | | | | 759 | | | | 9,025 | |
Vale SA(1) | | | | | 9,625 | | | | 145,338 | |
Via Varejo SA | | | | | 875 | | | | 3,966 | |
WEG SA | | | | | 2,474 | | | | 11,966 | |
Total Brazil | | | | | | | | | 972,919 | |
Chile — 6.0% | | | | | | | | | | |
Aguas Andinas SA Class A | | | | | 34,601 | | | | 17,997 | |
AntarChile SA | | | | | 1,038 | | | | 15,480 | |
Banco de Chile | | | | | 291,926 | | | | 40,437 | |
Banco de Credito e Inversiones | | | | | 520 | | | | 32,694 | |
Banco Santander Chile | | | | | 760,887 | | | | 55,842 | |
Cencosud SA | | | | | 17,463 | | | | 36,348 | |
Cia Cervecerias Unidas SA | | | | | 2,001 | | | | 24,875 | |
Colbun SA | | | | | 90,905 | | | | 17,055 | |
Empresa Nacional de Telecomunicaciones SA | | | | | 1,557 | | | | 11,313 | |
Empresas CMPC SA | | | | | 16,290 | | | | 55,767 | |
Empresas COPEC SA | | | | | 4,653 | | | | 65,221 | |
Enel Americas SA | | | | | 364,599 | | | | 57,461 | |
Enel Chile SA | | | | | 380,402 | | | | 33,110 | |
Engie Energia Chile SA | | | | | 6,815 | | | | 11,337 | |
Itau CorpBanca | | | | | 1,922,522 | | | | 17,816 | |
Security Description
| | | | Shares
| | Value
|
Common Stocks (continued) | | | | | | | | | | |
Chile (continued) | | | | | | | | | | |
Latam Airlines Group SA | | | | | 3,960 | | | $ | 36,014 | |
Parque Arauco SA | | | | | 8,457 | | | | 19,185 | |
SACI Falabella | | | | | 12,834 | | | | 96,809 | |
Sociedad Matriz del Banco de Chile SA Class B | | | | | 150,418 | | | | 66,054 | |
Sociedad Quimica y Minera de Chile SA(1) | | | | | 1,420 | | | | 62,210 | |
Total Chile | | | | | | | | | 773,025 | |
China — 4.9% | | | | | | | | | | |
AAC Technologies Holdings, Inc. | | | | | 411 | | | | 3,126 | |
Agricultural Bank of China Ltd. Class H | | | | | 16,865 | | | | 7,398 | |
Alibaba Group Holding Ltd.*(1) | | | | | 467 | | | | 66,445 | |
Anhui Conch Cement Co. Ltd. Class H | | | | | 681 | | | | 3,517 | |
ANTA Sports Products Ltd. | | | | | 575 | | | | 2,361 | |
Autohome, Inc.(1) | | | | | 67 | | | | 4,849 | |
Baidu, Inc.*(1) | | | | | 153 | | | | 29,079 | |
Bank of China Ltd. Class H | | | | | 49,280 | | | | 20,989 | |
Bank of Communications Co. Ltd. Class H | | | | | 9,278 | | | | 6,957 | |
BeiGene Ltd.*(1) | | | | | 35 | | | | 4,408 | |
BYD Co. Ltd. Class H | | | | | 477 | | | | 3,090 | |
China CITIC Bank Corp. Ltd. Class H | | | | | 5,077 | | | | 3,140 | |
China Communications Construction Co. Ltd. Class H | | | | | 2,547 | | | | 2,329 | |
China Conch Venture Holdings Ltd. | | | | | 924 | | | | 2,592 | |
China Construction Bank Corp. Class H | | | | | 142,172 | | | | 112,766 | |
China Evergrande Group | | | | | 1,071 | | | | 2,554 | |
China Life Insurance Co. Ltd. Class H | | | | | 4,356 | | | | 8,676 | |
China Merchants Bank Co. Ltd. Class H | | | | | 2,117 | | | | 8,153 | |
China Minsheng Banking Corp. Ltd. Class H | | | | | 3,618 | | | | 2,667 | |
China Pacific Insurance Group Co. Ltd. Class H | | | | | 1,619 | | | | 6,028 | |
China Petroleum & Chemical Corp. Class H | | | | | 14,709 | | | | 11,929 | |
China Shenhua Energy Co. Ltd. Class H | | | | | 1,926 | | | | 4,362 | |
China Telecom Corp. Ltd. Class H | | | | | 8,193 | | | | 3,866 | |
Country Garden Holdings Co. Ltd. | | | | | 3,362 | | | | 3,597 | |
Ctrip.com International Ltd.*(1) | | | | | 165 | | | | 5,491 | |
Dali Foods Group Co. Ltd.(2) | | | | | 8,000 | | | | 5,713 | |
ENN Energy Holdings Ltd. | | | | | 443 | | | | 3,765 | |
Hengan International Group Co. Ltd. | | | | | 376 | | | | 2,977 | |
Huazhu Group Ltd.(1) | | | | | 569 | | | | 14,885 | |
Industrial & Commercial Bank of China Ltd. Class H | | | | | 51,527 | | | | 34,825 | |
JD.com, Inc.*(1) | | | | | 700 | | | | 16,464 | |
Momo, Inc.*(1) | | | | | 93 | | | | 3,122 | |
NetEase, Inc.(1) | | | | | 75 | | | | 15,589 | |
New China Life Insurance Co. Ltd. Class H | | | | | 603 | | | | 2,818 | |
New Oriental Education & Technology Group, Inc.*(1) | | | | | 64 | | | | 3,745 | |
PetroChina Co. Ltd. Class H | | | | | 13,218 | | | | 9,675 | |
PICC Property & Casualty Co. Ltd. Class H | | | | | 2,716 | | | | 2,632 | |
Ping An Insurance Group Co. of China Ltd. Class H | | | | | 3,323 | | | | 31,294 | |
Shenzhou International Group Holdings Ltd. | | | | | 390 | | | | 4,307 | |
Sinopharm Group Co. Ltd. Class H | | | | | 663 | | | | 3,196 | |
Sunac China Holdings Ltd. | | | | | 1,279 | | | | 3,474 | |
Sunny Optical Technology Group Co. Ltd. | | | | | 360 | | | | 3,122 | |
TAL Education Group*(1) | | | | | 105 | | | | 3,043 | |
Tencent Holdings Ltd. | | | | | 3,734 | | | | 127,134 | |
Want Want China Holdings Ltd. | | | | | 3,086 | | | | 2,204 | |
Wuxi Biologics Cayman, Inc.*(2) | | | | | 281 | | | | 2,001 | |
Total China | | | | | | | | | 626,354 | |
The accompanying notes are an integral part of these financial statements.
36
Schedule of Investments — Virtus Glovista Emerging Markets ETF (continued)
October 31, 2018
Security Description
| | | | Shares
| | Value
|
Common Stocks (continued) | | | | | | | | | | |
India — 0.9% | | | | | | | | | | |
Axis Bank Ltd.*(3) | | | | | 136 | | | $ | 5,358 | |
Dr Reddy’s Laboratories Ltd.(1) | | | | | 5 | | | | 170 | |
HDFC Bank Ltd.(1) | | | | | 591 | | | | 52,546 | |
ICICI Bank Ltd.(1) | | | | | 2,764 | | | | 26,230 | |
Larsen & Toubro Ltd.(3) | | | | | 802 | | | | 14,083 | |
Mahindra & Mahindra Ltd.(3) | | | | | 202 | | | | 2,091 | |
Reliance Industries Ltd.(2)(3) | | | | | 246 | | | | 7,023 | |
State Bank of India*(3) | | | | | 183 | | | | 6,927 | |
Tata Motors Ltd.*(1) | | | | | 110 | | | | 1,343 | |
Vedanta Ltd.(1) | | | | | 5 | | | | 56 | |
Total India | | | | | | | | | 115,827 | |
Indonesia — 6.8% | | | | | | | | | | |
Adaro Energy Tbk PT | | | | | 104,833 | | | | 11,378 | |
Astra International Tbk PT | | | | | 163,581 | | | | 85,005 | |
Bank Central Asia Tbk PT | | | | | 85,517 | | | | 133,036 | |
Bank Danamon Indonesia Tbk PT | | | | | 79,025 | | | | 38,596 | |
Bank Mandiri Persero Tbk PT | | | | | 154,784 | | | | 69,743 | |
Bank Negara Indonesia Persero Tbk PT | | | | | 55,174 | | | | 26,584 | |
Bank Rakyat Indonesia Persero Tbk PT | | | | | 1,008,482 | | | | 208,960 | |
Barito Pacific Tbk PT | | | | | 59,094 | | | | 7,288 | |
Charoen Pokphand Indonesia Tbk PT | | | | | 28,024 | | | | 10,139 | |
Gudang Garam Tbk PT | | | | | 3,336 | | | | 15,865 | |
Hanjaya Mandala Sampoerna Tbk PT | | | | | 64,582 | | | | 15,846 | |
Indah Kiat Pulp & Paper Corp Tbk PT | | | | | 20,056 | | | | 16,788 | |
Indocement Tunggal Prakarsa Tbk PT | | | | | 12,448 | | | | 14,166 | |
Indofood CBP Sukses Makmur Tbk PT | | | | | 16,782 | | | | 9,852 | |
Indofood Sukses Makmur Tbk PT | | | | | 32,483 | | | | 12,767 | |
Jasa Marga Persero Tbk PT | | | | | 50,969 | | | | 13,914 | |
Kalbe Farma Tbk PT | | | | | 140,262 | | | | 12,640 | |
Pabrik Kertas Tjiwi Kimia Tbk PT | | | | | 8,237 | | | | 5,581 | |
Perusahaan Gas Negara Persero Tbk | | | | | 70,790 | | | | 10,337 | |
Semen Indonesia Persero Tbk PT | | | | | 20,902 | | | | 12,374 | |
Telekomunikasi Indonesia Persero Tbk PT | | | | | 360,596 | | | | 91,320 | |
Unilever Indonesia Tbk PT | | | | | 8,334 | | | | 23,696 | |
United Tractors Tbk PT | | | | | 11,393 | | | | 25,105 | |
Total Indonesia | | | | | | | | | 870,980 | |
Malaysia — 7.6% | | | | | | | | | | |
AirAsia Group Bhd | | | | | 12,725 | | | | 7,998 | |
Alliance Bank Malaysia Bhd | | | | | 8,008 | | | | 7,578 | |
AMMB Holdings Bhd | | | | | 9,133 | | | | 8,294 | |
Axiata Group Bhd | | | | | 49,210 | | | | 40,102 | |
British American Tobacco Malaysia Bhd | | | | | 971 | | | | 7,217 | |
Bursa Malaysia Bhd | | | | | 3,069 | | | | 5,369 | |
CIMB Group Holdings Bhd | | | | | 57,958 | | | | 79,226 | |
Dialog Group Bhd | | | | | 28,678 | | | | 23,233 | |
DiGi.Com Bhd | | | | | 19,934 | | | | 20,532 | |
Fraser & Neave Holdings Bhd | | | | | 805 | | | | 6,483 | |
Gamuda Bhd | | | | | 11,592 | | | | 6,621 | |
Genting Bhd | | | | | 14,387 | | | | 25,236 | |
Genting Malaysia Bhd | | | | | 20,938 | | | | 22,467 | |
Genting Plantations Bhd | | | | | 2,145 | | | | 4,947 | |
HAP Seng Consolidated Bhd | | | | | 2,662 | | | | 6,266 | |
Hartalega Holdings Bhd | | | | | 9,333 | | | | 13,962 | |
Hong Leong Bank Bhd | | | | | 4,055 | | | | 20,059 | |
Hong Leong Financial Group Bhd | | | | | 897 | | | | 3,940 | |
IHH Healthcare Bhd | | | | | 41,352 | | | | 49,411 | |
IJM Corp. Bhd | | | | | 18,817 | | | | 7,330 | |
Security Description
| | | | Shares
| | Value
|
Common Stocks (continued) | | | | | | | | | | |
Malaysia (continued) | | | | | | | | | | |
Inari Amertron Bhd | | | | | 14,437 | | | $ | 6,762 | |
IOI Corp. Bhd | | | | | 15,067 | | | | 16,203 | |
Kuala Lumpur Kepong Bhd | | | | | 2,558 | | | | 15,234 | |
Malayan Banking Bhd | | | | | 40,272 | | | | 91,333 | |
Malaysia Airports Holdings Bhd | | | | | 11,049 | | | | 21,916 | |
Malaysia Building Society Bhd | | | | | 32,227 | | | | 7,239 | |
Maxis Bhd | | | | | 12,794 | | | | 15,991 | |
MISC Bhd | | | | | 6,283 | | | | 9,159 | |
Nestle Malaysia Bhd | | | | | 373 | | | | 12,818 | |
Petronas Chemicals Group Bhd | | | | | 15,902 | | | | 35,532 | |
Petronas Dagangan Bhd | | | | | 1,324 | | | | 8,226 | |
Petronas Gas Bhd | | | | | 3,809 | | | | 16,640 | |
PPB Group Bhd | | | | | 3,683 | | | | 14,751 | |
Press Metal Aluminium Holdings Bhd | | | | | 9,177 | | | | 10,614 | |
Public Bank Bhd | | | | | 20,613 | | | | 121,180 | |
QL Resources Bhd | | | | | 3,656 | | | | 6,160 | |
RHB Bank Bhd | | | | | 21,264 | | | | 26,577 | |
Sime Darby Bhd | | | | | 18,975 | | | | 9,976 | |
Sime Darby Plantation Bhd | | | | | 24,216 | | | | 30,440 | |
SP Setia Bhd Group | | | | | 10,303 | | | | 5,170 | |
Telekom Malaysia Bhd | | | | | 17,714 | | | | 10,075 | |
Tenaga Nasional Bhd | | | | | 31,804 | | | | 111,726 | |
Top Glove Corp. Bhd | | | | | 5,279 | | | | 7,494 | |
YTL Corp. Bhd | | | | | 18,141 | | | | 4,595 | |
Total Malaysia | | | | | | | | | 982,082 | |
Mexico — 6.7% | | | | | | | | | | |
Alfa SAB de CV Class A | | | | | 21,151 | | | | 22,293 | |
Alpek SAB de CV* | | | | | 9,046 | | | | 11,908 | |
Alsea SAB de CV | | | | | 2,163 | | | | 5,531 | |
America Movil SAB de CV Class L(1) | | | | | 8,420 | | | | 121,164 | |
Arca Continental SAB de CV | | | | | 3,900 | | | | 19,612 | |
Banco del Bajio SA(2) | | | | | 4,785 | | | | 9,406 | |
Banco Santander Mexico SA Institucion de Banca Multiple Grupo Financiero Santand Class B | | | | | 13,939 | | | | 17,382 | |
Becle SAB de CV | | | | | 2,267 | | | | 2,785 | |
Bolsa Mexicana de Valores SAB de CV | | | | | 2,458 | | | | 3,704 | |
Cemex SAB de CV*(1) | | | | | 4,931 | | | | 24,852 | |
Coca-Cola Femsa SAB de CV, Series L | | | | | 2,069 | | | | 11,801 | |
Concentradora Fibra Danhos SA de CV | | | | | 5,751 | | | | 7,573 | |
Corp. Inmobiliaria Vesta SAB de CV | | | | | 2,436 | | | | 2,974 | |
El Puerto de Liverpool SAB de CV | | | | | 778 | | | | 4,930 | |
Fibra Uno Administracion SA de CV | | | | | 12,434 | | | | 13,363 | |
Fomento Economico Mexicano SAB de CV(1) | | | | | 884 | | | | 75,202 | |
Gentera SAB de CV | | | | | 6,552 | | | | 5,309 | |
GMexico Transportes SAB de CV(2) | | | | | 16,279 | | | | 22,287 | |
Gruma SAB de CV Class B | | | | | 837 | | | | 8,735 | |
Grupo Aeroportuario del Centro Norte
SAB de CV | | | | | 1,253 | | | | 6,556 | |
Grupo Aeroportuario del Pacifico SAB de CV Class B | | | | | 1,386 | | | | 11,466 | |
Grupo Aeroportuario del Sureste SAB de CV Class B | | | | | 809 | | | | 13,447 | |
Grupo Bimbo SAB de CV, Series A | | | | | 5,803 | | | | 10,870 | |
Grupo Carso SAB de CV, Series A1 | | | | | 8,747 | | | | 25,742 | |
Grupo Cementos de Chihuahua SAB de CV | | | | | 519 | | | | 2,797 | |
Grupo Comercial Chedraui SA de CV | | | | | 3,687 | | | | 6,518 | |
Grupo Elektra SAB DE CV | | | | | 847 | | | | 35,849 | |
Grupo Financiero Banorte SAB de CV Class O | | | | | 12,843 | | | | 70,660 | |
The accompanying notes are an integral part of these financial statements.
37
Schedule of Investments — Virtus Glovista Emerging Markets ETF (continued)
October 31, 2018
Security Description
| | | | Shares
| | Value
|
Common Stocks (continued) | | | | | | | | | | |
Mexico (continued) | | | | | | | | | | |
Grupo Financiero Inbursa SAB de CV Class O | | | | | 26,223 | | | $ | 33,990 | |
Grupo Lala SAB de CV | | | | | 9,561 | | | | 8,355 | |
Grupo Mexico SAB de CV, Series B | | | | | 14,454 | | | | 33,351 | |
Grupo Televisa SAB(1) | | | | | 2,406 | | | | 34,598 | |
Industrias Bachoco SAB de CV, Series B | | | | | 2,448 | | | | 8,979 | |
Industrias Penoles SAB de CV | | | | | 1,667 | | | | 23,495 | |
Infraestructura Energetica Nova SAB de CV | | | | | 2,102 | | | | 8,240 | |
Kimberly-Clark de Mexico SAB de CV Class A | | | | | 6,310 | | | | 9,095 | |
Macquarie Mexico Real Estate Management SA de CV* | | | | | 2,967 | | | | 2,889 | |
Megacable Holdings SAB de CV | | | | | 3,518 | | | | 15,599 | |
Mexichem SAB de CV | | | | | 4,206 | | | | 11,111 | |
Nemak SAB de CV(2) | | | | | 11,794 | | | | 8,587 | |
PLA Administradora Industrial S de RL de CV* | | | | | 3,222 | | | | 3,918 | |
Prologis Property Mexico SA de CV | | | | | 2,502 | | | | 4,411 | |
Promotora y Operadora de Infraestructura SAB de CV | | | | | 1,555 | | | | 14,151 | |
Qualitas Controladora SAB de CV | | | | | 1,694 | | | | 3,413 | |
Regional SAB de CV | | | | | 1,341 | | | | 6,531 | |
Telesites SAB de CV* | | | | | 13,251 | | | | 8,174 | |
Wal-Mart de Mexico SAB de CV | | | | | 21,358 | | | | 54,548 | |
Total Mexico | | | | | | | | | 868,151 | |
Philippines — 3.0% | | | | | | | | | | |
Aboitiz Equity Ventures, Inc. | | | | | 11,540 | | | | 10,137 | |
Aboitiz Power Corp. | | | | | 8,354 | | | | 5,262 | |
Alliance Global Group, Inc.* | | | | | 23,602 | | | | 5,011 | |
Ayala Corp. | | | | | 1,462 | | | | 25,139 | |
Ayala Land, Inc. | | | | | 44,271 | | | | 32,807 | |
Bank of the Philippine Islands | | | | | 12,030 | | | | 18,471 | |
BDO Unibank, Inc. | | | | | 12,124 | | | | 27,735 | |
Bloomberry Resorts Corp. | | | | | 62,817 | | | | 9,862 | |
DMCI Holdings, Inc. | | | | | 21,007 | | | | 5,041 | |
Globe Telecom, Inc. | | | | | 750 | | | | 29,296 | |
GT Capital Holdings, Inc. | | | | | 511 | | | | 7,258 | |
International Container Terminal Services, Inc. | | | | | 8,778 | | | | 14,847 | |
JG Summit Holdings, Inc. | | | | | 19,864 | | | | 17,560 | |
Jollibee Foods Corp. | | | | | 2,496 | | | | 12,875 | |
Manila Electric Co. | | | | | 1,313 | | | | 9,026 | |
Megaworld Corp. | | | | | 61,698 | | | | 5,085 | |
Metro Pacific Investments Corp. | | | | | 64,112 | | | | 5,752 | |
Metropolitan Bank & Trust Co. | | | | | 13,679 | | | | 16,758 | |
PLDT, Inc. | | | | | 615 | | | | 15,977 | |
San Miguel Corp. | | | | | 2,003 | | | | 6,402 | |
Security Bank Corp. | | | | | 2,636 | | | | 7,114 | |
SM Investments Corp. | | | | | 2,815 | | | | 47,351 | |
SM Prime Holdings, Inc. | | | | | 53,913 | | | | 34,058 | |
Universal Robina Corp. | | | | | 5,953 | | | | 14,464 | |
Wilcon Depot, Inc. | | | | | 23,423 | | | | 4,947 | |
Total Philippines | | | | | | | | | 388,235 | |
Poland — 8.8% | | | | | | | | | | |
Alior Bank SA* | | | | | 1,774 | | | | 26,699 | |
Asseco Poland SA | | | | | 1,467 | | | | 18,466 | |
Bank Millennium SA* | | | | | 11,861 | | | | 27,294 | |
Bank Polska Kasa Opieki SA | | | | | 3,235 | | | | 88,270 | |
CCC SA | | | | | 719 | | | | 31,292 | |
CD Projekt SA* | | | | | 1,315 | | | | 54,250 | |
Cyfrowy Polsat SA* | | | | | 4,910 | | | | 28,279 | |
Security Description
| | | | Shares
| | Value
|
Common Stocks (continued) | | | | | | | | | | |
Poland (continued) | | | | | | | | | | |
Dino Polska SA*(2) | | | | | 924 | | | $ | 20,348 | |
Grupa Lotos SA | | | | | 1,703 | | | | 30,748 | |
Jastrzebska Spolka Weglowa SA* | | | | | 1,068 | | | | 20,597 | |
KGHM Polska Miedz SA* | | | | | 2,738 | | | | 61,993 | |
KRUK SA | | | | | 342 | | | | 16,453 | |
LPP SA | | | | | 26 | | | | 53,191 | |
mBank SA | | | | | 241 | | | | 23,490 | |
Orange Polska SA* | | | | | 12,548 | | | | 14,192 | |
PGE Polska Grupa Energetyczna SA* | | | | | 17,082 | | | | 46,788 | |
Polski Koncern Naftowy ORLEN SA | | | | | 6,043 | | | | 145,266 | |
Polskie Gornictwo Naftowe i Gazownictwo SA* | | | | | 33,954 | | | | 55,393 | |
Powszechna Kasa Oszczednosci Bank Polski SA | | | | | 17,854 | | | | 185,792 | |
Powszechny Zaklad Ubezpieczen SA | | | �� | | 12,152 | | | | 124,080 | |
Santander Bank Polska SA | | | | | 634 | | | | 56,243 | |
Total Poland | | | | | | | | | 1,129,124 | |
Russia — 8.9% | | | | | | | | | | |
Aeroflot PJSC | | | | | 2,837 | | | | 4,188 | |
Alrosa PJSC | | | | | 16,247 | | | | 24,639 | |
Gazprom Neft PJSC | | | | | 1,798 | | | | 10,508 | |
Gazprom PJSC | | | | | 58,963 | | | | 139,160 | |
Lenta Ltd.*(3) | | | | | 2,626 | | | | 9,401 | |
LUKOIL PJSC | | | | | 3,511 | | | | 263,563 | |
Magnit PJSC | | | | | 303 | | | | 16,513 | |
Magnitogorsk Iron & Steel Works PJSC | | | | | 9,649 | | | | 7,023 | |
MegaFon PJSC* | | | | | 705 | | | | 6,272 | |
MMC Norilsk Nickel PJSC | | | | | 534 | | | | 89,171 | |
Mobile TeleSystems PJSC | | | | | 5,678 | | | | 22,204 | |
Moscow Exchange MICEX-RTS PJSC | | | | | 9,814 | | | | 13,095 | |
Novatek PJSC | | | | | 4,697 | | | | 74,854 | |
Novolipetsk Steel PJSC | | | | | 5,252 | | | | 12,790 | |
PhosAgro PJSC | | | | | 188 | | | | 7,049 | |
Polyus PJSC | | | | | 125 | | | | 7,879 | |
Rosneft Oil Co PJSC | | | | | 6,660 | | | | 46,553 | |
RusHydro PJSC | | | | | 971,468 | | | | 8,108 | |
Sberbank of Russia PJSC | | | | | 57,572 | | | | 165,880 | |
Severstal PJSC | | | | | 923 | | | | 14,432 | |
Surgutneftegas PJSC | | | | | 201,303 | | | | 81,195 | |
Tatneft PJSC | | | | | 8,510 | | | | 101,334 | |
VTB Bank PJSC | | | | | 28,007,843 | | | | 15,553 | |
Total Russia | | | | | | | | | 1,141,364 | |
South Africa — 7.3% | | | | | | | | | | |
Anglo American Platinum Ltd. | | | | | 149 | | | | 4,867 | |
AngloGold Ashanti Ltd.(1) | | | | | 1,312 | | | | 12,346 | |
Aspen Pharmacare Holdings Ltd. | | | | | 1,172 | | | | 12,393 | |
AVI Ltd. | | | | | 825 | | | | 5,592 | |
Barloworld Ltd. | | | | | 528 | | | | 4,295 | |
Bid Corp. Ltd. | | | | | 1,285 | | | | 24,101 | |
Bidvest Group Ltd. (The) | | | | | 1,070 | | | | 13,329 | |
Capitec Bank Holdings Ltd. | | | | | 117 | | | | 7,857 | |
Clicks Group Ltd. | | | | | 625 | | | | 7,965 | |
Discovery Ltd. | | | | | 1,238 | | | | 13,253 | |
Exxaro Resources Ltd. | | | | | 623 | | | | 6,373 | |
FirstRand Ltd. | | | | | 11,436 | | | | 49,853 | |
Fortress REIT Ltd. Class A | | | | | 2,710 | | | | 3,106 | |
Foschini Group Ltd. (The) | | | | | 558 | | | | 6,098 | |
Gold Fields Ltd. | | | | | 2,050 | | | | 5,446 | |
Growthpoint Properties Ltd. | | | | | 8,703 | | | | 13,362 | |
The accompanying notes are an integral part of these financial statements.
38
Schedule of Investments — Virtus Glovista Emerging Markets ETF (continued)
October 31, 2018
Security Description
| | | | Shares
| | Value
|
Common Stocks (continued) | | | | | | | | | | |
South Africa (continued) | | | | | | | | | | |
Hyprop Investments Ltd. | | | | | 624 | | | $ | 3,818 | |
Impala Platinum Holdings Ltd.* | | | | | 2,229 | | | | 4,110 | |
Imperial Holdings Ltd. | | | | | 379 | | | | 4,185 | |
Investec Ltd. | | | | | 648 | | | | 4,031 | |
KAP Industrial Holdings Ltd. | | | | | 5,054 | | | | 2,672 | |
Kumba Iron Ore Ltd. | | | | | 248 | | | | 4,858 | |
Life Healthcare Group Holdings Ltd. | | | | | 3,563 | | | | 5,917 | |
MMI Holdings Ltd.* | | | | | 2,532 | | | | 3,064 | |
Mr Price Group Ltd. | | | | | 964 | | | | 15,093 | |
MTN Group Ltd. | | | | | 6,170 | | | | 35,759 | |
Naspers Ltd. Class N | | | | | 1,757 | | | | 308,784 | |
Nedbank Group Ltd. | | | | | 1,381 | | | | 23,302 | |
Netcare Ltd. | | | | | 4,627 | | | | 7,788 | |
Pick n Pay Stores Ltd. | | | | | 865 | | | | 3,995 | |
PSG Group Ltd. | | | | | 372 | | | | 5,547 | |
Rand Merchant Investment Holdings Ltd. | | | | | 2,476 | | | | 5,763 | |
Redefine Properties Ltd. | | | | | 12,577 | | | | 8,176 | |
Remgro Ltd. | | | | | 1,649 | | | | 21,258 | |
RMB Holdings Ltd. | | | | | 2,754 | | | | 13,900 | |
Sanlam Ltd. | | | | | 6,722 | | | | 33,837 | |
Sappi Ltd. | | | | | 1,607 | | | | 9,035 | |
Sasol Ltd. | | | | | 2,291 | | | | 75,163 | |
Shoprite Holdings Ltd. | | | | | 1,870 | �� | | | 22,854 | |
Sibanye Gold Ltd.* | | | | | 5,941 | | | | 4,124 | |
SPAR Group Ltd. (The) | | | | | 486 | | | | 5,792 | |
Standard Bank Group Ltd. | | | | | 5,933 | | | | 65,686 | |
Super Group Ltd./South Africa* | | | | | 1,106 | | | | 2,999 | |
Telkom SA SOC Ltd. | | | | | 1,107 | | | | 4,026 | |
Tiger Brands Ltd. | | | | | 557 | | | | 9,952 | |
Truworths International Ltd. | | | | | 1,089 | | | | 5,973 | |
Vodacom Group Ltd. | | | | | 2,179 | | | | 18,374 | |
Vukile Property Fund Ltd. | | | | | 2,507 | | | | 3,450 | |
Woolworths Holdings Ltd. | | | | | 3,270 | | | | 11,289 | |
Total South Africa | | | | | | | | | 944,810 | |
South Korea — 7.9% | | | | | | | | | | |
Amorepacific Corp. | | | | | 56 | | | | 7,519 | |
Celltrion Healthcare Co. Ltd.* | | | | | 105 | | | | 5,869 | |
Celltrion, Inc.* | | | | | 138 | | | | 26,339 | |
CJ ENM Co. Ltd. | | | | | 34 | | | | 6,743 | |
Coway Co. Ltd. | | | | | 91 | | | | 5,614 | |
DB Insurance Co. Ltd. | | | | | 87 | | | | 5,482 | |
E-MART, Inc. | | | | | 32 | | | | 5,743 | |
Hana Financial Group, Inc. | | | | | 577 | | | | 19,393 | |
Hyundai Engineering & Construction Co. Ltd. | | | | | 130 | | | | 5,219 | |
Hyundai Heavy Industries Co. Ltd.* | | | | | 62 | | | | 6,774 | |
Hyundai Heavy Industries Holdings Co. Ltd.* | | | | | 16 | | | | 5,005 | |
Hyundai Mobis Co. Ltd. | | | | | 113 | | | | 18,841 | |
Hyundai Motor Co. | | | | | 256 | | | | 23,925 | |
Hyundai Steel Co. | | | | | 137 | | | | 5,019 | |
Industrial Bank of Korea | | | | | 435 | | | | 5,669 | |
Kakao Corp. | | | | | 101 | | | | 8,119 | |
Kangwon Land, Inc. | | | | | 207 | | | | 5,213 | |
KB Financial Group, Inc. | | | | | 728 | | | | 30,281 | |
Kia Motors Corp. | | | | | 447 | | | | 11,140 | |
Korea Electric Power Corp. | | | | | 948 | | | | 22,545 | |
Korea Zinc Co. Ltd. | | | | | 14 | | | | 4,656 | |
KT Corp.(1) | | | | | 738 | | | | 10,214 | |
KT&G Corp. | | | | | 212 | | | | 18,883 | |
Security Description
| | | �� | Shares
| | Value
|
Common Stocks (continued) | | | | | | | | | | |
South Korea (continued) | | | | | | | | | | |
LG Chem Ltd. | | | | | 77 | | | $ | 23,447 | |
LG Corp. | | | | | 162 | | | | 9,425 | |
LG Display Co. Ltd. | | | | | 384 | | | | 5,560 | |
LG Electronics, Inc. | | | | | 196 | | | | 10,887 | |
LG Household & Health Care Ltd. | | | | | 17 | | | | 15,575 | |
LG Uplus Corp. | | | | | 489 | | | | 6,930 | |
Lotte Chemical Corp. | | | | | 29 | | | | 6,680 | |
NAVER Corp. | | | | | 278 | | | | 27,933 | |
NCSoft Corp. | | | | | 31 | | | | 11,684 | |
POSCO | | | | | 142 | | | | 32,149 | |
Samsung Biologics Co. Ltd.*(2) | | | | | 29 | | | | 9,861 | |
Samsung C&T Corp. | | | | | 148 | | | | 14,092 | |
Samsung Card Co. Ltd. | | | | | 190 | | | | 5,611 | |
Samsung Electro-Mechanics Co. Ltd. | | | | | 95 | | | | 9,837 | |
Samsung Electronics Co. Ltd. | | | | | 9,235 | | | | 343,613 | |
Samsung Fire & Marine Insurance Co. Ltd. | | | | | 55 | | | | 13,442 | |
Samsung Life Insurance Co. Ltd. | | | | | 128 | | | | 10,334 | |
Samsung SDI Co. Ltd. | | | | | 84 | | | | 17,359 | |
Samsung SDS Co. Ltd. | | | | | 64 | | | | 10,811 | |
Shinhan Financial Group Co. Ltd. | | | | | 833 | | | | 31,104 | |
SillaJen, Inc.* | | | | | 119 | | | | 7,195 | |
SK Holdings Co. Ltd. | | | | | 56 | | | | 12,851 | |
SK Hynix, Inc. | | | | | 885 | | | | 52,966 | |
SK Innovation Co. Ltd. | | | | | 99 | | | | 18,548 | |
SK Telecom Co. Ltd. | | | | | 90 | | | | 21,166 | |
S-Oil Corp. | | | | | 72 | | | | 7,835 | |
Woori Bank | | | | | 868 | | | | 11,997 | |
Total South Korea | | | | | | | | | 1,013,097 | |
Taiwan — 3.0% | | | | | | | | | | |
Advantech Co. Ltd. | | | | | 252 | | | | 1,735 | |
ASE Technology Holding Co. Ltd.* | | | | | 2,308 | | | | 4,654 | |
Asia Cement Corp. | | | | | 1,784 | | | | 1,888 | |
Asustek Computer, Inc. | | | | | 508 | | | | 3,759 | |
AU Optronics Corp. | | | | | 5,885 | | | | 2,320 | |
Catcher Technology Co. Ltd. | | | | | 520 | | | | 5,235 | |
Cathay Financial Holding Co. Ltd. | | | | | 6,224 | | | | 9,856 | |
Chailease Holding Co. Ltd. | | | | | 676 | | | | 1,927 | |
Chang Hwa Commercial Bank Ltd. | | | | | 3,688 | | | | 2,092 | |
Cheng Shin Rubber Industry Co. Ltd. | | | | | 1,504 | | | | 2,117 | |
China Development Financial Holding Corp. | | | | | 8,800 | | | | 2,824 | |
China Life Insurance Co. Ltd. | | | | | 2,136 | | | | 2,029 | |
China Steel Corp. | | | | | 8,301 | | | | 6,546 | |
Chunghwa Telecom Co. Ltd. | | | | | 3,456 | | | | 12,230 | |
Compal Electronics, Inc. | | | | | 3,212 | | | | 1,770 | |
CTBC Financial Holding Co. Ltd. | | | | | 14,136 | | | | 9,434 | |
Delta Electronics, Inc. | | | | | 1,415 | | | | 5,945 | |
E.Sun Financial Holding Co. Ltd. | | | | | 7,454 | | | | 4,938 | |
Far Eastern New Century Corp. | | | | | 2,453 | | | | 2,461 | |
Far EasTone Telecommunications Co. Ltd. | | | | | 1,384 | | | | 3,296 | |
First Financial Holding Co. Ltd. | | | | | 7,276 | | | | 4,597 | |
Formosa Chemicals & Fibre Corp. | | | | | 2,779 | | | | 10,059 | |
Formosa Petrochemical Corp. | | | | | 894 | | | | 3,525 | |
Formosa Plastics Corp. | | | | | 3,022 | | | | 9,864 | |
Fubon Financial Holding Co. Ltd. | | | | | 4,883 | | | | 7,646 | |
Hon Hai Precision Industry Co. Ltd. | | | | | 13,027 | | | | 33,175 | |
Hua Nan Financial Holdings Co. Ltd. | | | | | 5,609 | | | | 3,163 | |
Innolux Corp. | | | | | 6,482 | | | | 1,963 | |
Largan Precision Co. Ltd. | | | | | 79 | | | | 8,553 | |
The accompanying notes are an integral part of these financial statements.
39
Schedule of Investments — Virtus Glovista Emerging Markets ETF (continued)
October 31, 2018
Security Description
| | | | Shares
| | Value
|
Common Stocks (continued) | | | | | | | | | | |
Taiwan (continued) | | | | | | | | | | |
Lite-On Technology Corp. | | | | | 1,498 | | | $ | 1,719 | |
MediaTek, Inc. | | | | | 1,128 | | | | 8,293 | |
Mega Financial Holding Co. Ltd. | | | | | 8,447 | | | | 7,139 | |
Nan Ya Plastics Corp. | | | | | 3,697 | | | | 9,188 | |
Novatek Microelectronics Corp. | | | | | 464 | | | | 2,047 | |
Pegatron Corp. | | | | | 1,448 | | | | 2,635 | |
President Chain Store Corp. | | | | | 401 | | | | 4,523 | |
Quanta Computer, Inc. | | | | | 2,004 | | | | 3,164 | |
Shanghai Commercial & Savings
Bank Ltd. (The) | | | | | 3,014 | | | | 3,745 | |
Shin Kong Financial Holding Co. Ltd. | | | | | 7,557 | | | | 2,479 | |
SinoPac Financial Holdings Co. Ltd. | | | | | 7,420 | | | | 2,518 | |
Taishin Financial Holding Co. Ltd. | | | | | 6,609 | | | | 2,937 | |
Taiwan Cement Corp. | | | | | 3,393 | | | | 3,805 | |
Taiwan Cooperative Financial Holding Co. Ltd. | | | | | 6,426 | | | | 3,613 | |
Taiwan Mobile Co. Ltd. | | | | | 1,188 | | | | 4,242 | |
Taiwan Semiconductor Manufacturing Co. Ltd. | | | | | 18,930 | | | | 143,154 | |
Uni-President Enterprises Corp. | | | | | 3,676 | | | | 8,898 | |
United Microelectronics Corp. | | | | | 8,467 | | | | 3,229 | |
Yageo Corp. | | | | | 170 | | | | 1,733 | |
Yuanta Financial Holding Co. Ltd. | | | | | 7,478 | | | | 3,625 | |
Total Taiwan | | | | | | | | | 392,287 | |
Thailand — 7.5% | | | | | | | | | | |
Advanced Info Service PCL | | | | | 5,740 | | | | 33,938 | |
Airports of Thailand PCL | | | | | 23,317 | | | | 45,016 | |
Bangchak Corp. PCL | | | | | 4,886 | | | | 4,864 | |
Bangkok Bank PCL | | | | | 10,403 | | | | 64,960 | |
Bangkok Dusit Medical Services PCL | | | | | 49,800 | | | | 36,805 | |
Bangkok Expressway & Metro PCL | | | | | 34,483 | | | | 8,842 | |
Bangkok Life Assurance PCL | | | | | 4,344 | | | | 4,161 | |
Banpu PCL | | | | | 19,274 | | | | 10,117 | |
Berli Jucker PCL | | | | | 4,110 | | | | 6,912 | |
BTS Group Holdings PCL | | | | | 34,310 | | | | 9,470 | |
Bumrungrad Hospital PCL | | | | | 2,428 | | | | 14,136 | |
Central Pattana PCL | | | | | 14,665 | | | | 34,948 | |
CH Karnchang PCL | | | | | 5,458 | | | | 4,198 | |
Charoen Pokphand Foods PCL | | | | | 17,173 | | | | 13,080 | |
CP ALL PCL | | | | | 30,172 | | | | 61,209 | |
CPN Retail Growth Leasehold REIT | | | | | 6,653 | | | | 5,268 | |
Delta Electronics Thailand PCL | | | | | 5,636 | | | | 11,731 | |
Electricity Generating PCL | | | | | 1,120 | | | | 7,805 | |
Energy Absolute PCL | | | | | 9,691 | | | | 14,471 | |
Glow Energy PCL | | | | | 1,700 | | | | 4,295 | |
Gulf Energy Development PCL | | | | | 2,907 | | | | 6,840 | |
Home Product Center PCL | | | | | 22,387 | | | | 10,062 | |
Indorama Ventures PCL | | | | | 11,980 | | | | 19,605 | |
Intouch Holdings PCL | | | | | 11,231 | | | | 17,956 | |
IRPC PCL | | | | | 49,023 | | | | 9,021 | |
Kasikornbank PCL | | | | | 13,997 | | | | 84,235 | |
KCE Electronics PCL | | | | | 3,175 | | | | 3,568 | |
Kiatnakin Bank PCL | | | | | 3,139 | | | | 6,747 | |
Krung Thai Bank PCL | | | | | 27,628 | | | | 16,752 | |
Land & Houses PCL | | | | | 35,101 | | | | 10,906 | |
Minor International PCL | | | | | 18,529 | | | | 20,401 | |
Muangthai Capital PCL | | | | | 2,866 | | | | 4,517 | |
PTT Exploration & Production PCL | | | | | 7,677 | | | | 32,306 | |
PTT Global Chemical PCL | | | | | 12,243 | | | | 28,530 | |
PTT PCL | | | | | 77,941 | | | | 119,909 | |
Security Description
| | | | Shares
| | Value
|
Common Stocks (continued) | | | | | | | | | | |
Thailand (continued) | | | | | | | | | | |
Ratchaburi Electricity Generating Holding PCL | | | | | 3,024 | | | $ | 4,470 | |
Robinson PCL | | | | | 2,104 | | | | 4,141 | |
Siam Cement PCL (The) | | | | | 4,136 | | | | 52,152 | |
Siam Commercial Bank PCL (The) | | | | | 14,741 | | | | 61,143 | |
Srisawad Corp. PCL | | | | | 3,253 | | | | 4,367 | |
Supalai PCL | | | | | 5,684 | | | | 3,755 | |
Thai Oil PCL | | | | | 4,878 | | | | 12,471 | |
Thai Union Group PCL | | | | | 13,014 | | | | 6,517 | |
Tisco Financial Group PCL | | | | | 2,915 | | | | 6,925 | |
TMB Bank PCL | | | | | 94,475 | | | | 6,498 | |
Total Access Communication PCL | | | | | 2,926 | | | | 4,193 | |
True Corp. PCL | | | | | 71,776 | | | | 12,775 | |
WHA Corp. PCL | | | | | 36,095 | | | | 4,486 | |
Total Thailand | | | | | | | | | 971,474 | |
Turkey — 5.7% | | | | | | | | | | |
Akbank T.A.S. | | | | | 66,297 | | | | 78,400 | |
Aselsan Elektronik Sanayi Ve Ticaret AS | | | | | 7,710 | | | | 34,842 | |
BIM Birlesik Magazalar AS | | | | | 5,942 | | | | 84,406 | |
Eregli Demir ve Celik Fabrikalari TAS | | | | | 37,306 | | | | 60,468 | |
Ford Otomotiv Sanayi AS | | | | | 2,286 | | | | 24,538 | |
Haci Omer Sabanci Holding AS | | | | | 34,393 | | | | 43,810 | |
KOC Holding AS | | | | | 29,764 | | | | 82,962 | |
TAV Havalimanlari Holding AS | | | | | 4,679 | | | | 19,471 | |
Tekfen Holding AS | | | | | 5,678 | | | | 21,576 | |
Tupras Turkiye Petrol Rafinerileri AS | | | | | 3,345 | | | | 78,814 | |
Turk Hava Yollari AO* | | | | | 20,261 | | | | 50,928 | |
Turkcell Iletisim Hizmetleri AS | | | | | 27,798 | | | | 56,445 | |
Turkiye Garanti Bankasi AS | | | | | 56,865 | | | | 71,112 | |
Turkiye Is Bankasi AS Class C | | | | | 36,110 | | | | 25,776 | |
Total Turkey | | | | | | | | | 733,548 | |
United Kingdom — 0.1% | | | | | | | | | | |
Mondi Ltd. | | | | | 373 | | | | 8,922 | |
United States — 0.0%(4) | | | | | | | | | | |
JBS SA | | | | | 2,013 | | | | 5,544 | |
Total Common Stocks | | | | | | | | | | |
(Cost $13,127,805) | | | | | | | | | 11,937,743 | |
Exchange Traded Fund — 3.1% | | | | | | | | | | |
United States — 3.1% | | | | | | | | | | |
Franklin FTSE India ETF | | | | | 19,986 | | | | 401,883 | |
Total Exchange Traded Fund | | | | | | | | | | |
(Cost $470,605) | | | | | | | | | 401,883 | |
PREFERRED STOCKS — 0.9% | | | | | | | | | | |
Brazil — 0.7% | | | | | | | | | | |
Azul SA, 0.00%* | | | | | 693 | | | | 5,696 | |
Bradespar SA, 6.36% | | | | | 460 | | | | 4,272 | |
Braskem SA, 5.90% Class A | | | | | 392 | | | | 5,493 | |
Centrais Eletricas Brasileiras SA, 0.00% Class B* | | | | | 722 | | | | 5,161 | |
Cia Brasileira de Distribuicao, 1.70% | | | | | 309 | | | | 6,495 | |
Cia Energetica de Minas Gerais, 4.34% | | | | | 2,763 | | | | 8,189 | |
Itausa-Investimentos Itau SA, 4.87% | | | | | 12,857 | | | | 38,832 | |
Lojas Americanas SA, 0.41% | | | | | 1,545 | | | | 7,805 | |
Telefonica Brasil SA, 9.39% | | | | | 845 | | | | 9,813 | |
Total Brazil | | | | | | | | | 91,756 | |
The accompanying notes are an integral part of these financial statements.
40
Schedule of Investments — Virtus Glovista Emerging Markets ETF (continued)
October 31, 2018
Security Description
| | | | Shares
| | Value
|
PREFERRED STOCKS (continued) | | | | | | | | | | |
Russia — 0.2% | | | | | | | | | | |
Transneft PJSC, 4.41% | | | | | 9 | | | $ | 23,349 | |
Total Preferred Stocks | | | | | | | | | | |
(Cost $110,013) | | | | | | | | | 115,105 | |
Rights — 0.0%(4) | | | | | | | | | | |
Chile — 0.0%(4) | | | | | | | | | | |
Banco de Credito e Inversiones SA, expiring 12/3/2018* | | | | | 25 | | | | 72 | |
SACI Falabella, expiring 11/21/2018* | | | | | 289 | | | | 29 | |
Total Chile | | | | | | | | | 101 | |
Taiwan — 0.0%(4) | | | | | | | | | | |
Taishin Financial Holding Co. Ltd., expiring 11/28/2018* | | | | | 282 | | | | 27 | |
Total Rights | | | | | | | | | | |
(Cost $0) | | | | | | | | | 128 | |
Warrant — 0.0%(4) | | | | | | | | | | |
Thailand — 0.0%(4) | | | | | | | | | | |
BTS Group Holdings PCL, expiring 12/31/2019*
(Cost $0) | | | | | 5,645 | | | | 0 | |
Security Description
| | | | Shares
| | Value
|
TOTAL INVESTMENTS — 96.6% | | | | | | | | | | |
(Cost $13,708,423) | | | | | | | | $ | 12,454,859 | |
Other Assets in Excess of Liabilities — 3.4% | | | | | | | | | 437,399 | |
Net Assets — 100.0% | | | | | | | | $ | 12,892,258 | |
* | | Non-income producing security. |
(1) | | American Depositary Receipts. |
(2) | | Security was purchased pursuant to Rule 144A under the Securities Act of 1933 and may not be resold subject to that rule except to qualified institutional buyers. Unless otherwise noted, 144A securities are deemed to be liquid. At October 31, 2018, the aggregate value of these securities was $99,440, or 0.8% of net assets. |
(3) | | Global Depositary Receipts. |
(4) | | Amount rounds to less than 0.05%. |
Industry Breakdown | | | | | | |
As of October 31, 2018 (based on net assets) | | | | | | |
Financials | | | | | 29.7 | % |
Energy | | | | | 12.1 | % |
Communication Services | | | | | 10.4 | % |
Materials | | | | | 9.1 | % |
Consumer Staples | | | | | 7.4 | % |
Industrials | | | | | 6.1 | % |
Consumer Discretionary | | | | | 5.8 | % |
Information Technology | | | | | 5.7 | % |
Utilities | | | | | 3.4 | % |
Real Estate | | | | | 1.9 | % |
Health Care | | | | | 1.9 | % |
Equity Fund | | | | | 3.1 | % |
Other Assets in Excess of Liabilities | | | | | 3.4 | % |
Total | | | | | 100.0 | % |
The following table summarizes valuation of the Fund’s investments under the fair value hierarchy levels as of October 31, 2018:
| | | | Level 1
| | Level 2
| | Level 3
| | Total
|
Asset Valuation Inputs | | | | | | | | | | | | | | | | | | |
Common Stocks | | | | $ | 11,937,743 | | | $ | — | | | $ | — | | | $ | 11,937,743 | |
Exchange Traded Fund | | | | | 401,883 | | | | — | | | | — | | | | 401,883 | |
Preferred Stocks | | | | | 115,105 | | | | — | | | | — | | | | 115,105 | |
Rights | | | | | 101 | | | | 27 | | | | — | | | | 128 | |
Warrant | | | | | 0 | | | | — | | | | — | | | | — | |
Total | | | | $ | 12,454,832 | | | $ | 27 | | | $ | — | | | $ | 12,454,859 | |
There were no Level 3 securities as of October 31, 2018.
The accompanying notes are an integral part of these financial statements.
41
Schedule of Investments — Virtus InfraCap U.S. Preferred Stock ETF
October 31, 2018
Security Description
| | | | Shares
| | Value
|
PREFERRED STOCKS — 123.0%(1) | | | | | | | | | | |
Communication Services — 0.5% | | | | | | | | | | |
Telephone & Data Systems, Inc., 5.88% | | | | | 1,276 | | | $ | 28,608 | |
Energy — 20.1% | | | | | | | | | | |
DCP Midstream LP, Series B, 7.88% | | | | | 15,363 | | | | 376,393 | |
Energy Transfer Operating LP, Series C, 7.38% | | | | | 16,716 | | | | 413,554 | |
GasLog Partners LP, Series A, 8.63% (Monaco) | | | | | 1,196 | | | | 30,558 | |
GasLog Partners LP, Series B, 8.20% (Monaco) | | | | | 1,206 | | | | 30,439 | |
Golar LNG Partners LP, Series A, 8.75% (United Kingdom) | | | | | 1,236 | | | | 31,543 | |
Hoegh LNG Partners LP, Series A, 8.75% (Bermuda) | | | | | 1,241 | | | | 31,670 | |
NuStar Energy LP, Series A, 8.50% | | | | | 2,719 | | | | 62,755 | |
NuStar Energy LP, Series B, 7.63% | | | | | 2,844 | | | | 59,610 | |
NuStar Energy LP, Series C, 9.00% | | | | | 6,855 | | | | 163,286 | |
Targa Resources Partners LP, Series A, 9.00% | | | | | 1,176 | | | | 31,470 | |
Total Energy | | | | | | | | | 1,231,278 | |
Financials — 56.6% | | | | | | | | | | |
AGNC Investment Corp., Series B, 7.75% | | | | | 4,171 | | | | 105,985 | |
AGNC Investment Corp., Series C, 7.00% | | | | | 2,964 | | | | 74,989 | |
Annaly Capital Management, Inc.,
Series F, 6.95% | | | | | 15,771 | | | | 396,325 | |
Annaly Capital Management, Inc., Series G, 6.50% | | | | | 1,316 | | | | 31,347 | |
Apollo Global Management LLC,
Series A, 6.38% | | | | | 1,256 | | | | 31,199 | |
Arch Capital Group Ltd., Series E, 5.25% | | | | | 1,321 | | | | 29,339 | |
Ares Management LP, Series A, 7.00% | | | | | 1,181 | | | | 30,694 | |
ARMOUR Residential REIT, Inc.,
Series B, 7.88% | | | | | 5,053 | | | | 126,325 | |
Axis Capital Holdings Ltd., Series E, 5.50% | | | | | 1,281 | | | | 29,591 | |
Banc of California, Inc., Series D, 7.38% | | | | | 1,211 | | | | 31,014 | |
Banc of California, Inc., Series E, 7.00% | | | | | 1,221 | | | | 31,258 | |
Bank of America Corp., Series CC, 6.20% | | | | | 1,216 | | | | 31,458 | |
Bank of America Corp., Series EE, 6.00% | | | | | 1,236 | | | | 31,370 | |
Capital One Financial Corp., Series G, 5.20% | | | | | 1,276 | | | | 29,488 | |
Capital One Financial Corp., Series H, 6.00% | | | | | 1,211 | | | | 30,941 | |
Carlyle Group LP, Series A, 5.88% | | | | | 2,004 | | | | 44,168 | |
Charles Schwab Corp., Series D, 5.95% | | | | | 1,201 | | | | 31,046 | |
Chimera Investment Corp., Series A, 8.00% | | | | | 4,938 | | | | 125,524 | |
Chimera Investment Corp., Series B, 8.00% | | | | | 4,923 | | | | 127,358 | |
Citigroup, Inc., Series K, 6.88% | | | | | 2,659 | | | | 72,670 | |
Citigroup, Inc., Series S, 6.30% | | | | | 1,206 | | | | 31,404 | |
Compass Diversified Holdings, Series A, 7.25% | | | | | 1,448 | | | | 32,305 | |
Exantas Capital Corp., 8.63% | | | | | 1,221 | | | | 30,952 | |
First Republic Bank, Series F, 5.70% | | | | | 1,226 | | | | 30,074 | |
First Republic Bank, Series G, 5.50% | | | | | 1,251 | | | | 29,674 | |
Goldman Sachs Group, Inc., Series K, 6.38% | | | | | 1,156 | | | | 30,356 | |
Goldman Sachs Group, Inc., Series N, 6.30% | | | | | 1,201 | | | | 30,685 | |
Invesco Mortgage Capital, Inc., Series B, 7.75% | | | | | 2,469 | | | | 63,577 | |
Invesco Mortgage Capital, Inc., Series C, 7.50% | | | | | 2,619 | | | | 65,056 | |
KeyCorp, Series E, 6.13% | | | | | 1,156 | | | | 30,403 | |
KKR & Co., Inc., Series B, 6.50% | | | | | 810 | | | | 21,117 | |
Maiden Holdings Ltd., Series C, 7.13% | | | | | 1,689 | | | | 28,375 | |
Maiden Holdings Ltd., Series D, 6.70% | | | | | 5,904 | | | | 93,815 | |
Morgan Stanley, Series E, 7.13% | | | | | 1,096 | | | | 29,888 | |
Morgan Stanley, Series F, 6.88% | | | | | 1,141 | | | | 30,590 | |
Morgan Stanley, Series I, 6.38% | | | | | 1,176 | | | | 30,788 | |
Morgan Stanley, Series K, 5.85% | | | | | 2,214 | | | | 55,793 | |
Security Description
| | | | Shares
| | Value
|
PREFERRED STOCKS (continued) | | | | | | | | | | |
Financials (continue) | | | | | | | | | | |
National General Holdings Corp.,
Series B, 7.50% | | | | | 14,047 | | | $ | 335,723 | |
National General Holdings Corp.,
Series C, 7.50% | | | | | 3,630 | | | | 86,902 | |
Navient Corp., 6.00% | | | | | 1,396 | | | | 28,269 | |
New York Community Bancorp, Inc., Series A, 6.38% | | | | | 1,161 | | | | 29,443 | |
New York Mortgage Trust, Inc.,
Series D, 8.00% | | | | | 2,714 | | | | 62,286 | |
Oaktree Capital Group LLC, Series A, 6.63% | | | | | 2,629 | | | | 66,014 | |
PennyMac Mortgage Investment Trust,
Series A, 8.13% | | | | | 2,444 | | | | 60,611 | |
PennyMac Mortgage Investment Trust,
Series B, 8.00% | | | | | 2,494 | | | | 61,280 | |
People’s United Financial, Inc., Series A, 5.63% | | | | | 1,226 | | | | 30,687 | |
Regions Financial Corp., Series B, 6.38% | | | | | 1,146 | | | | 30,529 | |
State Street Corp., Series G, 5.35% | | | | | 1,221 | | | | 30,940 | |
Stifel Financial Corp., Series A, 6.25% | | | | | 1,196 | | | | 29,996 | |
Two Harbors Investment Corp., Series B, 7.63% | | | | | 1,498 | | | | 36,971 | |
Two Harbors Investment Corp., Series C, 7.25% | | | | | 1,306 | | | | 31,684 | |
Two Harbors Investment Corp., Series E, 7.50% | | | | | 5,143 | | | | 123,278 | |
Wells Fargo & Co., 5.20% | | | | | 1,271 | | | | 29,589 | |
Wells Fargo & Co., Series P, 5.25% | | | | | 1,271 | | | | 30,034 | |
Wells Fargo & Co., Series W, 5.70% | | | | | 8,649 | | | | 216,571 | |
Wells Fargo & Co., Series X, 5.50% | | | | | 1,261 | | | | 30,920 | |
Total Financials | | | | | | | | | 3,458,668 | |
Health Care — 2.2% | | | | | | | | | | |
Becton Dickinson and Co., Series A, 6.13% | | | | | 2,309 | | | | 135,469 | |
Industrials — 1.9% | | | | | | | | | | |
Pitney Bowes, Inc., 6.70% | | | | | 5,054 | | | | 114,726 | |
Real Estate — 39.0% | | | | | | | | | | |
American Homes 4 Rent, Series D, 6.50% | | | | | 7,732 | | | | 184,950 | |
American Homes 4 Rent, Series E, 6.35% | | | | | 1,246 | | | | 29,443 | |
American Homes 4 Rent, Series F, 5.88% | | | | | 1,341 | | | | 29,904 | |
American Homes 4 Rent, Series G, 5.88% | | | | | 1,366 | | | | 30,216 | |
Ashford Hospitality Trust, Inc., Series F, 7.38% | | | | | 1,336 | | | | 30,915 | |
Ashford Hospitality Trust, Inc., Series G, 7.38% | | | | | 1,331 | | | | 30,480 | |
Ashford Hospitality Trust, Inc., Series I, 7.50% | | | | | 4,463 | | | | 103,765 | |
Boston Properties, Inc., Series B, 5.25% | | | | | 1,281 | | | | 31,064 | |
CBL & Associates Properties, Inc.,
Series D, 7.38% | | | | | 1,714 | | | | 26,310 | |
CBL & Associates Properties, Inc.,
Series E, 6.63% | | | | | 1,924 | | | | 27,686 | |
City Office REIT, Inc., Series A, 6.63% | | | | | 1,306 | | | | 31,684 | |
Colony Capital, Inc., Series E, 8.75% | | | | | 1,231 | | | | 31,784 | |
Colony Capital, Inc., Series I, 7.15% | | | | | 5,123 | | | | 113,218 | |
CorEnergy Infrastructure Trust, Inc.,
Series A, 7.38% | | | | | 10,973 | | | | 265,327 | |
Digital Realty Trust, Inc., Series J, 5.25% | | | | | 1,351 | | | | 29,803 | |
EPR Properties, Series G, 5.75% | | | | | 7,077 | | | | 162,417 | |
Federal Realty Investment Trust,
Series C, 5.00% | | | | | 1,423 | | | | 33,697 | |
Global Net Lease, Inc., Series A, 7.25% | | | | | 9,426 | | | | 234,613 | |
Hersha Hospitality Trust, Series D, 6.50% | | | | | 1,341 | | | | 28,295 | |
Hersha Hospitality Trust, Series E, 6.50% | | | | | 1,351 | | | | 28,790 | |
Kimco Realty Corp., Series J, 5.50% | | | | | 1,458 | | | | 32,878 | |
Kimco Realty Corp., Series K, 5.63% | | | | | 1,428 | | | | 32,744 | |
The accompanying notes are an integral part of these financial statements.
42
Schedule of Investments — Virtus InfraCap U.S. Preferred Stock ETF (continued)
October 31, 2018
Security Description
| | | | Shares
| | Value
|
PREFERRED STOCKS (continued) | | | | | | | | | | |
Real Estate (continued) | | | | | | | | | | |
Kimco Realty Corp., Series M, 5.25% | | | | | 1,508 | | | $ | 31,427 | |
LaSalle Hotel Properties, Series J, 6.30% | | | | | 1,291 | | | | 30,790 | |
Monmouth Real Estate Investment Corp., Series C, 6.13% | | | | | 1,301 | | | | 31,224 | |
National Retail Properties, Inc., Series F, 5.20% | | | | | 1,361 | | | | 29,479 | |
Pebblebrook Hotel Trust, Series D, 6.38% | | | | | 1,286 | | | | 31,201 | |
Pennsylvania Real Estate Investment Trust, Series C, 7.20% | | | | | 2,089 | | | | 46,877 | |
Pennsylvania Real Estate Investment Trust, Series D, 6.88% | | | | | 1,518 | | | | 33,282 | |
PS Business Parks, Inc., Series W, 5.20% | | | | | 3,835 | | | | 83,105 | |
Public Storage, Series W, 5.20% | | | | | 1,316 | | | | 30,071 | |
Public Storage, Series X, 5.20% | | | | | 1,321 | | | | 30,079 | |
QTS Realty Trust, Inc., Series A, 7.13% | | | | | 1,246 | | | | 31,150 | |
RLJ Lodging Trust, Series A, 1.95% | | | | | 1,236 | | | | 31,518 | |
SITE Centers Corp., Series A, 6.38% | | | | | 1,341 | | | | 31,554 | |
Summit Hotel Properties, Inc., Series E, 6.25% | | | | | 8,772 | | | | 201,317 | |
Urstadt Biddle Properties, Inc., Series H, 6.25% | | | | | 2,959 | | | | 68,501 | |
Vornado Realty Trust, Series L, 5.40% | | | | | 1,361 | | | | 31,711 | |
Washington Prime Group, Inc., Series H, 7.50% | | | | | 1,443 | | | | 30,260 | |
Welltower, Inc., Series I, 6.50% | | | | | 545 | | | | 33,572 | |
Total Real Estate | | | | | | | | | 2,387,101 | |
Utilities — 2.7% | | | | | | | | | | |
NextEra Energy Capital Holdings, Inc., 5.00% | | | | | 1,291 | | | | 28,467 | |
NextEra Energy Capital Holdings, Inc.,
Series I, 5.13% | | | | | 1,281 | | | | 29,232 | |
SCE Trust II, 5.10% | | | | | 1,356 | | | | 29,086 | |
SCE Trust VI, 5.00% | | | | | 1,386 | | | | 29,272 | |
Sempra Energy, Series A, 6.00% | | | | | 492 | | | | 48,787 | |
Total Utilities | | | | | | | | | 164,844 | |
Total Preferred Stocks | | | | | | | | | | |
(Cost $7,730,840) | | | | | | | | | 7,520,694 | |
Common Stocks — 2.2%(1) | | | | | | | | | | |
Energy — 0.8% | | | | | | | | | | |
Kinder Morgan, Inc.(2) | | | | | 3,000 | | | | 51,060 | |
Utilities — 1.4% | | | | | | | | | | |
Sempra Energy(2) | | | | | 750 | | | | 82,590 | |
Total Common Stocks | | | | | | | | | | |
(Cost $139,550) | | | | | | | | | 133,650 | |
Security Description
| | | | Notional
Amount
| | Number of
contracts
| | Value
|
Purchased Options — 0.0%(3) | | | | | | | | | | | | | | |
Purchased Call Options | | | | | | | | | | | | | | |
iShares 20+ Year Treasury Bond ETF, | | | | | | | | | | | | | | |
Expires 11/30/18, | | | | | | | | | | | | | | |
Strike Price $120.00 | | | | | 4,000 | | | | 40 | | | $ | 320 | |
iShares 20+ Year Treasury Bond ETF, | | | | | | | | | | | | | | |
Expires 01/18/19, | | | | | | | | | | | | | | |
Strike Price $130.00 | | | | | 8,000 | | | | 80 | | | | 320 | |
Total Purchased Options | | | | | | | | | | | | | | |
(Cost $1,629) | | | | | | | | | | | | | 640 | |
TOTAL INVESTMENTS — 125.2% | | | | | | | | | | | | | | |
(Cost $7,872,019) | | | | | | | | | | | | | 7,654,984 | |
| | | | | | | | Shares | | | | |
Securities Sold Short — (1.3)% | | | | | | | | | | | | | | |
Exchange Traded Fund — (1.3)% | | | | | | | | | | | | | | |
Equity Fund — (1.3)% | | | | | | | | | | | | | | |
iShares U.S. Real Estate ETF | | | | | | | | | (1,000 | ) | | $ | (78,110 | ) |
Total Exchange Traded Fund | | | | | | | | | | | | | | |
(Proceeds $(76,100)) | | | | | | | | | | | | | (78,110 | ) |
Total Securities Sold Short — (1.3)% | | | | | | | | | | | | | | |
(Proceeds $ (76,100)) | | | | | | | | | | | | | (78,110 | ) |
Liabilities in Excess of
Other Assets — (23.9)% | | | | | | | | | | | | | (1,459,361 | ) |
Net Assets — 100.0% | | | | | | | | | | | | $ | 6,117,513 | |
| | | | | | Number of
contracts
| | |
Written Options — (0.2)% | | | | | | | | | | | | | | |
Written Call Options | | | | | | | | | | | | | | |
iShares 20+ Year Treasury Bond ETF, | | | | | | | | | | | | | | |
Expires 11/02/18, | | | | | | | | | | | | | | |
Strike Price $117.00 | | | | | (1,000 | ) | | | (10 | ) | | | (10 | ) |
iShares 20+ Year Treasury Bond ETF, | | | | | | | | | | | | | | |
Expires 11/16/18, | | | | | | | | | | | | | | |
Strike Price $118.00 | | | | | (1,000 | ) | | | (10 | ) | | | (80 | ) |
iShares 20+ Year Treasury Bond ETF, | | | | | | | | | | | | | | |
Expires 11/23/18, | | | | | | | | | | | | | | |
Strike Price $119.00 | | | | | (1,000 | ) | | | (10 | ) | | | (70 | ) |
The accompanying notes are an integral part of these financial statements.
43
Schedule of Investments — Virtus InfraCap U.S. Preferred Stock ETF (continued)
October 31, 2018
Security Description
| | | | Notional
Amount
| | Number of
contracts
| | Value
|
Written Options (continued) | | | | | | | | | | | | | | |
Written Call Options (continued) | | | | | | | | | | | | | | |
iShares 20+ Year Treasury Bond ETF, | | | | | | | | | | | | | | |
Expires 11/30/18, | | | | | | | | | | | | | | |
Strike Price $119.00 | | | | | (7,000 | ) | | | (70 | ) | | $ | (700 | ) |
iShares 20+ Year Treasury Bond ETF, | | | | | | | | | | | | | | |
Expires 01/18/19, | | | | | | | | | | | | | | |
Strike Price $121.00 | | | | | (1,000 | ) | | | (10 | ) | | | (300 | ) |
iShares 7-10 Year Treasury Bond ETF, | | | | | | | | | | | | | | |
Expires 11/16/18, | | | | | | | | | | | | | | |
Strike Price $101.00 | | | | | (2,000 | ) | | | (20 | ) | | | (540 | ) |
iShares 7-10 Year Treasury Bond ETF, | | | | | | | | | | | | | | |
Expires 11/16/18, | | | | | | | | | | | | | | |
Strike Price $102.00 | | | | | (3,000 | ) | | | (30 | ) | | | (210 | ) |
iShares 7-10 Year Treasury Bond ETF, | | | | | | | | | | | | | | |
Expires 11/16/18, | | | | | | | | | | | | | | |
Strike Price $103.00 | | | | | (1,000 | ) | | | (10 | ) | | | (50 | ) |
iShares 7-10 Year Treasury Bond ETF, | | | | | | | | | | | | | | |
Expires 12/21/18, | | | | | | | | | | | | | | |
Strike Price $102.00 | | | | | (2,000 | ) | | | (20 | ) | | | (660 | ) |
iShares U.S. Real Estate ETF, | | | | | | | | | | | | | | |
Expires 11/02/18, | | | | | | | | | | | | | | |
Strike Price $81.00 | | | | | (1,000 | ) | | | (10 | ) | | | (10 | ) |
iShares U.S. Real Estate ETF, | | | | | | | | | | | | | | |
Expires 11/09/18, | | | | | | | | | | | | | | |
Strike Price $81.50 | | | | | (1,000 | ) | | | (10 | ) | | | (95 | ) |
iShares U.S. Real Estate ETF, | | | | | | | | | | | | | | |
Expires 11/16/18, | | | | | | | | | | | | | | |
Strike Price $81.00 | | | | | (1,000 | ) | �� | | (10 | ) | | | (290 | ) |
iShares U.S. Real Estate ETF, | | | | | | | | | | | | | | |
Expires 11/23/18, | | | | | | | | | | | | | | |
Strike Price $81.00 | | | | | (1,000 | ) | | | (10 | ) | | | (345 | ) |
Kinder Morgan, Inc., | | | | | | | | | | | | | | |
Expires 12/07/18, | | | | | | | | | | | | | | |
Strike Price $18.00 | | | | | (1,000 | ) | | | (10 | ) | | | (230 | ) |
Kinder Morgan, Inc., | | | | | | | | | | | | | | |
Expires 12/21/18, | | | | | | | | | | | | | | |
Strike Price $18.00 | | | | | (1,000 | ) | | | (10 | ) | | | (320 | ) |
Security Description
| | | | Notional
Amount
| | Number of
contracts
| | Value
|
Written Options (continued) | | | | | | | | | | | | | | |
Written Call Options (continued) | | | | | | | | | | | | | | |
Sempra Energy, | | | | | | | | | | | | | | |
Expires 11/16/18, | | | | | | | | | | | | | | |
Strike Price $120.00 | | | | | (500 | ) | | | (5 | ) | | $ | (50 | ) |
Sempra Energy, | | | | | | | | | | | | | | |
Expires 12/21/18, | | | | | | | | | | | | | | |
Strike Price $120.00 | | | | | (200 | ) | | | (2 | ) | | | (75 | ) |
Written Put Options | | | | | | | | | | | | | | |
iShares U.S. Real Estate ETF, | | | | | | | | | | | | | | |
Expires 11/02/18, | | | | | | | | | | | | | | |
Strike Price $77.00 | | | | | (1,000 | ) | | | (10 | ) | | | (190 | ) |
iShares U.S. Real Estate ETF, | | | | | | | | | | | | | | |
Expires 11/02/18, | | | | | | | | | | | | | | |
Strike Price $79.50 | | | | | (1,000 | ) | | | (10 | ) | | | (1,100 | ) |
iShares U.S. Real Estate ETF, | | | | | | | | | | | | | | |
Expires 11/09/18, | | | | | | | | | | | | | | |
Strike Price $76.00 | | | | | (1,000 | ) | | | (10 | ) | | | (425 | ) |
Kinder Morgan, Inc., | | | | | | | | | | | | | | |
Expires 11/02/18, | | | | | | | | | | | | | | |
Strike Price $17.50 | | | | | (2,000 | ) | | | (20 | ) | | | (1,000 | ) |
Kinder Morgan, Inc., | | | | | | | | | | | | | | |
Expires 11/09/18, | | | | | | | | | | | | | | |
Strike Price $18.00 | | | | | (2,000 | ) | | | (20 | ) | | | (2,080 | ) |
Kinder Morgan, Inc., | | | | | | | | | | | | | | |
Expires 11/16/18, | | | | | | | | | | | | | | |
Strike Price $17.00 | | | | | (3,000 | ) | | | (30 | ) | | | (1,110 | ) |
Kinder Morgan, Inc., | | | | | | | | | | | | | | |
Expires 11/23/18, | | | | | | | | | | | | | | |
Strike Price $17.00 | | | | | (1,000 | ) | | | (10 | ) | | | (425 | ) |
TOTAL WRITTEN OPTIONS — (0.2)% | | | | | | | |
(Premiums Received $10,223) | | | | | | | | | | | | $ | (10,365 | ) |
(1) | | Substantially all the securities, or a portion thereof, have been pledged as collateral for line of credit borrowings, short sales and open written option contracts. The aggregate market value of the collateral at October 31, 2018 was $7,109,756. |
(2) | | Subject to written call options. |
(3) | | Amount rounds to less than 0.05%. |
The following table summarizes valuation of the Fund’s investments under the fair value hierarchy levels as of October 31, 2018:
| | | | Level 1
| | Level 2
| | Level 3
| | Total
|
Asset Valuation Inputs | | | | | | | | | | | | | | | | | | |
Preferred Stocks | | | | $ | 7,520,694 | | | $ | — | | | $ | — | | | $ | 7,520,694 | |
Common Stocks | | | | | 133,650 | | | | — | | | | — | | | | 133,650 | |
Purchased Options | | | | | 640 | | | | — | | | | — | | | | 640 | |
Total | | | | $ | 7,654,984 | | | $ | — | | | $ | — | | | $ | 7,654,984 | |
Liability Valuation Inputs | | | | | | | | | | | | | | | | | | |
Exchange Traded Fund | | | | $ | 78,110 | | | $ | — | | | $ | — | | | $ | 78,110 | |
Written Options | | | | | 10,355 | | | | 10 | | | | — | | | | 10,365 | |
Total | | | | $ | 88,465 | | | $ | 10 | | | $ | — | | | $ | 88,475 | |
There were no Level 3 securities as of October 31, 2018.
The accompanying notes are an integral part of these financial statements.
44
Schedule of Investments — Virtus LifeSci Biotech Clinical Trials ETF
October 31, 2018
Security Description
| | | | Shares
| | Value
|
Common Stocks — 97.1% | | | | | | | | | | |
Health Care — 97.1% | | | | | | | | | | |
Abeona Therapeutics, Inc.*(1) | | | | | 29,767 | | | $ | 255,996 | |
Acceleron Pharma, Inc.*(1) | | | | | 13,104 | | | | 665,290 | |
Achaogen, Inc.*(1) | | | | | 39,040 | | | | 150,304 | |
Achillion Pharmaceuticals, Inc.* | | | | | 158,277 | | | | 452,672 | |
Adaptimmune Therapeutics PLC*(2) | | | | | 37,603 | | | | 233,139 | |
Aduro Biotech, Inc.* | | | | | 61,463 | | | | 260,603 | |
Adverum Biotechnologies, Inc.* | | | | | 82,998 | | | | 348,592 | |
Agenus, Inc.*(1) | | | | | 168,009 | | | | 267,134 | |
Aimmune Therapeutics, Inc.*(1) | | | | | 15,893 | | | | 422,436 | |
Akcea Therapeutics, Inc.* | | | | | 19,429 | | | | 433,655 | |
Akebia Therapeutics, Inc.*(1) | | | | | 42,037 | | | | 314,857 | |
Albireo Pharma, Inc.*(1) | | | | | 14,240 | | | | 380,350 | |
Alder Biopharmaceuticals, Inc.*(1) | | | | | 28,599 | | | | 363,207 | |
Alnylam Pharmaceuticals, Inc.*(1) | | | | | 4,427 | | | | 356,064 | |
Amicus Therapeutics, Inc.*(1) | | | | | 28,845 | | | | 322,487 | |
AnaptysBio, Inc.*(1) | | | | | 6,314 | | | | 471,782 | |
Apellis Pharmaceuticals, Inc.* | | | | | 20,895 | | | | 292,321 | |
Arcus Biosciences, Inc.* | | | | | 28,669 | | | | 288,124 | |
Arena Pharmaceuticals, Inc.*(1) | | | | | 9,533 | | | | 339,947 | |
ArQule, Inc.*(1) | | | | | 86,753 | | | | 335,734 | |
Array BioPharma, Inc.* | | | | | 26,284 | | | | 425,801 | |
Arrowhead Pharmaceuticals, Inc.*(1) | | | | | 39,546 | | | | 503,025 | |
Assembly Biosciences, Inc.* | | | | | 10,261 | | | | 234,772 | |
Atara Biotherapeutics, Inc.*(1) | | | | | 10,370 | | | | 354,343 | |
Athenex, Inc.* | | | | | 26,416 | | | | 318,841 | |
Audentes Therapeutics, Inc.*(1) | | | | | 12,131 | | | | 342,094 | |
AVEO Pharmaceuticals, Inc.*(1) | | | | | 212,917 | | | | 521,647 | |
Axovant Sciences Ltd.*(1) | | | | | 124,456 | | | | 232,733 | |
BeiGene Ltd. (China)*(2) | | | | | 2,649 | | | | 333,615 | |
Bellicum Pharmaceuticals, Inc.*(1) | | | | | 48,283 | | | | 196,512 | |
BioCryst Pharmaceuticals, Inc.*(1) | | | | | 83,470 | | | | 611,000 | |
Biohaven Pharmaceutical Holding Co., Ltd.*(1) | | | | | 11,625 | | | | 419,081 | |
Bluebird Bio, Inc.*(1) | | | | | 2,410 | | | | 276,427 | |
Blueprint Medicines Corp.* | | | | | 6,320 | | | | 384,066 | |
Cara Therapeutics, Inc.* | | | | | 28,233 | | | | 529,086 | |
Catalyst Biosciences, Inc.*(1) | | | | | 17,917 | | | | 159,461 | |
ChemoCentryx, Inc.* | | | | | 36,802 | | | | 398,198 | |
Clearside Biomedical, Inc.* | | | | | 43,920 | | | | 238,046 | |
Corbus Pharmaceuticals Holdings, Inc.*(1) | | | | | 77,428 | | | | 515,671 | |
Cymabay Therapeutics, Inc.* | | | | | 36,120 | | | | 381,066 | |
Cytokinetics, Inc.*(1) | | | | | 50,077 | | | | 335,015 | |
CytomX Therapeutics, Inc.* | | | | | 18,850 | | | | 268,801 | |
Deciphera Pharmaceuticals, Inc.*(1) | | | | | 11,418 | | | | 230,529 | |
Denali Therapeutics, Inc.*(1) | | | | | 25,718 | | | | 372,140 | |
Endocyte, Inc.* | | | | | 31,923 | | | | 754,979 | |
Epizyme, Inc.*(1) | | | | | 29,855 | | | | 240,333 | |
Security Description
| | | | Shares
| | Value
|
Common Stocks (continued) | | | | | | | | | | |
Health Care (continued) | | | | | | | | | | |
Esperion Therapeutics, Inc.*(1) | | | | | 11,297 | | | $ | 513,223 | |
Fate Therapeutics, Inc.*(1) | | | | | 38,094 | | | | 474,651 | |
FibroGen, Inc.*(1) | | | | | 8,014 | | | �� | 343,560 | |
Five Prime Therapeutics, Inc.*(1) | | | | | 26,824 | | | | 325,643 | |
G1 Therapeutics, Inc.*(1) | | | | | 10,561 | | | | 422,546 | |
Geron Corp.* | | | | | 121,346 | | | | 185,659 | |
Global Blood Therapeutics, Inc.*(1) | | | | | 10,053 | | | | 352,760 | |
GlycoMimetics, Inc.*(1) | | | | | 28,805 | | | | 362,367 | |
Idera Pharmaceuticals, Inc.*(1) | | | | | 34,596 | | | | 230,755 | |
ImmunoGen, Inc.* | | | | | 45,112 | | | | 244,958 | |
Immunomedics, Inc.*(1) | | | | | 19,666 | | | | 443,075 | |
Inovio Pharmaceuticals, Inc.*(1) | | | | | 104,004 | | | | 512,740 | |
Insmed, Inc.*(1) | | | | | 16,751 | | | | 244,565 | |
Intra-Cellular Therapies, Inc.*(1) | | | | | 22,258 | | | | 377,941 | |
Iovance Biotherapeutics, Inc.*(1) | | | | | 36,120 | | | | 327,970 | |
Karyopharm Therapeutics, Inc.* | | | | | 26,238 | | | | 276,549 | |
Kura Oncology, Inc.*(1) | | | | | 25,438 | | | | 276,511 | |
La Jolla Pharmaceutical Co.*(1) | | | | | 15,261 | | | | 248,754 | |
Loxo Oncology, Inc.*(1) | | | | | 2,638 | | | | 402,717 | |
MacroGenics, Inc.*(1) | | | | | 21,029 | | | | 346,137 | |
Madrigal Pharmaceuticals, Inc.*(1) | | | | | 1,578 | | | | 301,177 | |
Marinus Pharmaceuticals, Inc.*(1) | | | | | 63,966 | | | | 299,361 | |
MediciNova, Inc.*(1) | | | | | 54,054 | | | | 527,567 | |
Melinta Therapeutics, Inc.*(1) | | | | | 55,858 | | | | 146,907 | |
Mirati Therapeutics, Inc.*(1) | | | | | 9,575 | | | | 357,818 | |
MyoKardia, Inc.* | | | | | 9,666 | | | | 511,718 | |
Novavax, Inc.* | | | | | 292,125 | | | | 514,140 | |
Paratek Pharmaceuticals, Inc.*(1) | | | | | 42,584 | | | | 317,251 | |
Pieris Pharmaceuticals, Inc.*(1) | | | | | 88,958 | | | | 366,507 | |
Progenics Pharmaceuticals, Inc.*(1) | | | | | 51,998 | | | | 260,510 | |
Prothena Corp. PLC (Ireland)*(1) | | | | | 31,339 | | | | 388,604 | |
PTC Therapeutics, Inc.* | | | | | 12,326 | | | | 474,798 | |
Reata Pharmaceuticals, Inc. Class A* | | | | | 11,939 | | | | 703,565 | |
REGENXBIO, Inc.* | | | | | 8,452 | | | | 563,495 | |
resTORbio, Inc.*(1) | | | | | 42,419 | | | | 469,154 | |
Rhythm Pharmaceuticals, Inc.*(1) | | | | | 14,044 | | | | 393,372 | |
Rocket Pharmaceuticals, Inc.* | | | | | 21,774 | | | | 344,900 | |
Sage Therapeutics, Inc.*(1) | | | | | 2,871 | | | | 369,440 | |
Sangamo Therapeutics, Inc.*(1) | | | | | 30,135 | | | | 381,810 | |
Selecta Biosciences, Inc.*(1) | | | | | 38,458 | | | | 197,674 | |
Solid Biosciences, Inc.* | | | | | 18,668 | | | | 597,376 | |
Sorrento Therapeutics, Inc.*(1) | | | | | 62,691 | | | | 199,984 | |
Stemline Therapeutics, Inc.*(1) | | | | | 26,741 | | | | 400,580 | |
Synergy Pharmaceuticals, Inc.*(1) | | | | | 254,541 | | | | 106,067 | |
Syros Pharmaceuticals, Inc.*(1) | | | | | 35,601 | | | | 234,255 | |
TG Therapeutics, Inc.*(1) | | | | | 34,423 | | | | 156,625 | |
The accompanying notes are an integral part of these financial statements.
45
Schedule of Investments — Virtus LifeSci Biotech Clinical Trials ETF (continued)
October 31, 2018
Security Description
| | | | Shares
| | Value
|
Common Stocks (continued) | | | | | | | | | | |
Health Care (continued) | | | | | | | | | | |
uniQure N.V. (Netherlands)* | | | | | 13,451 | | | $ | 346,094 | |
Verastem, Inc.*(1) | | | | | 82,558 | | | | 418,569 | |
Viking Therapeutics, Inc.*(1) | | | | | 39,960 | | | | 543,456 | |
Voyager Therapeutics, Inc.* | | | | | 21,869 | | | | 296,762 | |
Xencor, Inc.*(1) | | | | | 11,509 | | | | 376,575 | |
ZIOPHARM Oncology, Inc.*(1) | | | | | 110,837 | | | | 219,457 | |
Total Health Care | | | | | | | | | 35,230,625 | |
Total Common Stocks | | | | | | | | | | |
(Cost $48,255,783) | | | | | | | | | 35,230,625 | |
SECURITIES LENDING COLLATERAL — 10.4% | | | |
Money Market Fund — 10.4% | | | | | | | | | | |
Dreyfus Government Cash Management Fund, 2.05%(3)(4) | | | | | | | | | | |
(Cost $3,750,281) | | | | | 3,750,281 | | | | 3,750,281 | |
Security Description
| | | | Shares
| | Value
|
TOTAL INVESTMENTS — 107.5% | | | | | | | | | | |
(Cost $52,006,064) | | | | | | | | $ | 38,980,906 | |
Liabilities in Excess of Other Assets — (7.5)% | | | | | | | | | (2,711,762 | ) |
Net Assets — 100.0% | | | | | | | | $ | 36,269,144 | |
* | | Non-income producing security. |
(1) | | All or a portion of the security was on loan. The aggregate market value of securities on loan was $10,360,445; total market value of collateral held by the Fund was $10,442,084. Market value of the collateral held includes non-cash U.S. Treasury securities having a value of $6,691,803. |
(2) | | American Depositary Receipts. |
(3) | | Represents securities purchased with cash collateral received for securities on loan. |
(4) | | The rate shown reflects the seven-day yield as of October 31, 2018. |
The following table summarizes valuation of the Fund’s investments under the fair value hierarchy levels as of October 31, 2018:
| | | | Level 1
| | Level 2
| | Level 3
| | Total
|
Asset Valuation Inputs | | | | | | | | | | | | | | | | | | |
Common Stocks | | | | $ | 35,230,625 | | | $ | — | | | $ | — | | | $ | 35,230,625 | |
Money Market Fund | | | | | 3,750,281 | | | | — | | | | — | | | | 3,750,281 | |
Total | | | | $ | 38,980,906 | | | $ | — | | | $ | — | | | $ | 38,980,906 | |
There were no Level 3 securities as of October 31, 2018.
The accompanying notes are an integral part of these financial statements.
46
Schedule of Investments — Virtus LifeSci Biotech Products ETF
October 31, 2018
Security Description
| | | | Shares
| | Value
|
Common Stocks — 98.5% | | | | | | | | | | |
Health Care — 98.5% | | | | | | | | | | |
ACADIA Pharmaceuticals, Inc.*(1) | | | | | 50,150 | | | $ | 976,922 | |
Acorda Therapeutics, Inc.*(1) | | | | | 24,849 | | | | 474,864 | |
Agios Pharmaceuticals, Inc.*(1) | | | | | 8,215 | | | | 518,038 | |
Alexion Pharmaceuticals, Inc.* | | | | | 6,515 | | | | 730,136 | |
Amgen, Inc. | | | | | 4,213 | | | | 812,224 | |
Biogen, Inc.* | | | | | 2,561 | | | | 779,236 | |
BioMarin Pharmaceutical, Inc.* | | | | | 8,700 | | | | 801,879 | |
Celgene Corp.* | | | | | 9,832 | | | | 703,971 | |
Clovis Oncology, Inc.*(1) | | | | | 17,101 | | | | 198,885 | |
Dova Pharmaceuticals, Inc.*(1) | | | | | 25,375 | | | | 470,960 | |
Dynavax Technologies Corp.*(1) | | | | | 49,231 | | | | 486,895 | |
Enanta Pharmaceuticals, Inc.* | | | | | 7,052 | | | | 544,132 | |
Exelixis, Inc.*(1) | | | | | 39,851 | | | | 552,733 | |
Gilead Sciences, Inc. | | | | | 11,002 | | | | 750,116 | |
Halozyme Therapeutics, Inc.*(1) | | | | | 41,199 | | | | 639,821 | |
Incyte Corp.* | | | | | 10,559 | | | | 684,434 | |
Intercept Pharmaceuticals, Inc.*(1) | | | | | 9,618 | | | | 923,424 | |
Ionis Pharmaceuticals, Inc.*(1) | | | | | 16,532 | | | | 819,161 | |
Ironwood Pharmaceuticals, Inc.* | | | | | 42,130 | | | | 551,903 | |
Keryx Biopharmaceuticals, Inc.*(1) | | | | | 155,009 | | | | 430,925 | |
Lexicon Pharmaceuticals, Inc.*(1) | | | | | 60,728 | | | | 475,500 | |
Ligand Pharmaceuticals, Inc.*(1) | | | | | 4,075 | | | | 671,601 | |
Medicines Co. (The)*(1) | | | | | 21,335 | | | | 496,252 | |
Momenta Pharmaceuticals, Inc.* | | | | | 34,033 | | | | 425,753 | |
Nektar Therapeutics* | | | | | 13,877 | | | | 536,762 | |
Neurocrine Biosciences, Inc.*(1) | | | | | 7,823 | | | | 838,235 | |
Omeros Corp.*(1) | | | | | 39,755 | | | | 607,059 | |
Portola Pharmaceuticals, Inc.*(1) | | | | | 18,861 | | | | 371,373 | |
Puma Biotechnology, Inc.*(1) | | | | | 14,227 | | | | 527,110 | |
Radius Health, Inc.*(1) | | | | | 25,465 | | | | 403,111 | |
Regeneron Pharmaceuticals, Inc.* | | | | | 2,480 | | | | 841,315 | |
Retrophin, Inc.*(1) | | | | | 28,067 | | | | 720,199 | |
Rigel Pharmaceuticals, Inc.*(1) | | | | | 234,017 | | | | 671,629 | |
Security Description
| | | | Shares
| | Value
|
Common Stocks (continued) | | | | | | | | | | |
Health Care (continued) | | | | | | | | | | |
Sarepta Therapeutics, Inc.*(1) | | | | | 7,925 | | | $ | 1,060,048 | |
Seattle Genetics, Inc.* | | | | | 11,953 | | | | 670,922 | |
Spark Therapeutics, Inc.*(1) | | | | | 10,162 | | | | 457,188 | |
TESARO, Inc.*(1) | | | | | 18,590 | | | | 536,879 | |
Theravance Biopharma, Inc.
(Cayman Islands)*(1) | | | | | 32,226 | | | | 782,125 | |
Ultragenyx Pharmaceutical, Inc.*(1) | | | | | 9,441 | | | | 457,417 | |
United Therapeutics Corp.* | | | | | 6,856 | | | | 760,056 | |
Vanda Pharmaceuticals, Inc.* | | | | | 42,777 | | | | 811,480 | |
Vertex Pharmaceuticals, Inc.* | | | | | 5,051 | | | | 855,943 | |
Total Health Care | | | | | | | | | 26,828,616 | |
Total Common Stocks | | | | | | | | | | |
(Cost $32,019,563) | | | | | | | | | 26,828,616 | |
SECURITIES LENDING COLLATERAL — 11.1% | | | |
Money Market Fund — 11.1% | | | | | | | | | | |
Dreyfus Government Cash Management Fund, 2.05%(2)(3) | | | | | | | | | | |
(Cost $3,038,226) | | | | | 3,038,226 | | | | 3,038,226 | |
TOTAL INVESTMENTS — 109.6% | | | | | | | | | | |
(Cost $35,057,789) | | | | | | | | | 29,866,842 | |
Liabilities in Excess of Other Assets — (9.6)% | | | | | | | | | (2,619,297 | ) |
Net Assets — 100.0% | | | | | | | | $ | 27,247,545 | |
* | | Non-income producing security. |
(1) | | All or a portion of the security was on loan. The aggregate market value of securities on loan was $7,867,787; total market value of collateral held by the Fund was $8,133,066. Market value of the collateral held includes non-cash U.S. Treasury securities having a value of $5,094,840. |
(2) | | Represents securities purchased with cash collateral received for securities on loan. |
(3) | | The rate shown reflects the seven-day yield as of October 31, 2018. |
The following table summarizes valuation of the Fund’s investments under the fair value hierarchy levels as of October 31, 2018:
| | | | Level 1
| | Level 2
| | Level 3
| | Total
|
Asset Valuation Inputs | | | | | | | | | | | | | | | | | | |
Common Stocks | | | | $ | 26,828,616 | | | $ | — | | | $ | — | | | $ | 26,828,616 | |
Money Market Fund | | | | | 3,038,226 | | | | — | | | | — | | | | 3,038,226 | |
Total | | | | $ | 29,866,842 | | | $ | — | | | $ | — | | | $ | 29,866,842 | |
There were no Level 3 securities as of October 31, 2018.
The accompanying notes are an integral part of these financial statements.
47
Schedule of Investments — Virtus Newfleet Multi-Sector Bond ETF
October 31, 2018
Security Description
| | | | Principal
| | Value
|
CORPORATE BONDS — 35.9% | | | | | | | | | | |
Communication Services — 4.3% | | | | | | | | | | |
AT&T, Inc., 3.51%, (3-Month USD LIBOR + 1.18%), 06/12/24(1) | | | | $ | 225,000 | | | $ | 225,795 | |
AT&T, Inc., 4.25%, 03/01/27 | | | | | 195,000 | | | | 189,456 | |
AT&T, Inc., 5.25%, 03/01/37 | | | | | 95,000 | | | | 91,134 | |
Cequel Communications Holdings I LLC / Cequel Capital Corp., 7.50%, 04/01/28(2) | | | | | 275,000 | | | | 286,060 | |
Charter Communications Operating, LLC /
Charter Communications Operating Capital, 4.91%, 07/23/25 | | | | | 435,000 | | | | 438,683 | |
Cincinnati Bell, Inc., 7.00%, 07/15/24(2) | | | | | 320,000 | | | | 289,600 | |
Clear Channel Worldwide Holdings, Inc., Series B, 7.63%, 03/15/20 | | | | | 335,000 | | | | 335,837 | |
Comcast Corp., 3.95%, 10/15/25 | | | | | 147,000 | | | | 146,721 | |
Comcast Corp., 4.15%, 10/15/28 | | | | | 70,000 | | | | 69,514 | |
Discovery Communications LLC, 3.95%,
03/20/28 | | | | | 405,000 | | | | 377,894 | |
DISH DBS Corp., 5.88%, 07/15/22 | | | | | 175,000 | | | | 166,031 | |
DISH DBS Corp., 7.75%, 07/01/26 | | | | | 150,000 | | | | 134,812 | |
Frontier Communications Corp., 8.50%, 04/15/20 | | | | | 90,000 | | | | 90,675 | |
Frontier Communications Corp., 7.63%, 04/15/24 | | | | | 240,000 | | | | 145,200 | |
Frontier Communications Corp., 8.50%,
04/01/26(2) | | | | | 85,000 | | | | 79,263 | |
iHeartCommunications, Inc., 9.00%, 12/15/19(3) | | | | | 265,000 | | | | 192,125 | |
McGraw-Hill Global Education Holdings LLC / McGraw-Hill Global Education Finance, 7.88%, 05/15/24(2) | | | | | 245,000 | | | | 209,475 | |
Meredith Corp., 6.88%, 02/01/26(2) | | | | | 155,000 | | | | 155,388 | |
Sprint Spectrum Co. LLC / Sprint Spectrum Co. II LLC / Sprint Spectrum Co. III LLC, 5.15%, 03/20/28(2) | | | | | 435,000 | | | | 436,088 | |
West Corp., 8.50%, 10/15/25(2) | | | | | 100,000 | | | | 90,750 | |
Windstream Services LLC / Windstream Finance Corp., 10.50%, 06/30/24(2) | | | | | 125,000 | | | | 101,875 | |
Total Communication Services | | | | | | | | | 4,252,376 | |
Consumer Discretionary — 5.4% | | | | | | | | | | |
American Axle & Manufacturing, Inc., 6.25%, 03/15/26 | | | | | 15,000 | | | | 14,212 | |
Beazer Homes USA, Inc., 6.75%, 03/15/25 | | | | | 210,000 | | | | 185,062 | |
Beazer Homes USA, Inc., 5.88%, 10/15/27 | | | | | 135,000 | | | | 109,688 | |
Boyd Gaming Corp., 6.00%, 08/15/26 | | | | | 65,000 | | | | 63,050 | |
Bunge Ltd. Finance Corp., 4.35%, 03/15/24 | | | | | 285,000 | | | | 280,053 | |
Caesars Resort Collection LLC / CRC Finco, Inc., 5.25%, 10/15/25(2) | | | | | 135,000 | | | | 125,972 | |
Dollar Tree, Inc., 4.00%, 05/15/25 | | | | | 198,000 | | | | 190,530 | |
Downstream Development Authority of the Quapaw Tribe of Oklahoma, 10.50%, 02/15/23(2) | | | | | 100,000 | | | | 102,250 | |
Eldorado Resorts, Inc., 6.00%, 09/15/26(2) | | | | | 85,000 | | | | 83,619 | |
frontdoor, Inc., 6.75%, 08/15/26(2) | | | | | 205,000 | | | | 209,613 | |
GLP Capital LP / GLP Financing II, Inc., 5.25%, 06/01/25 | | | | | 195,000 | | | | 196,464 | |
Graham Holdings Co., 5.75%, 06/01/26(2) | | | | | 295,000 | | | | 297,950 | |
Hilton Domestic Operating Co., Inc., 5.13%, 05/01/26(2) | | | | | 250,000 | | | | 245,000 | |
Lear Corp., 3.80%, 09/15/27 | | | | | 510,000 | | | | 463,222 | |
Lennar Corp., 5.25%, 06/01/26 | | | | | 245,000 | | | | 234,908 | |
M/I Homes, Inc., 5.63%, 08/01/25 | | | | | 245,000 | | | | 226,625 | |
Marriott Ownership Resorts, Inc. / ILG LLC, 6.50%, 09/15/26(2) | | | | | 155,000 | | | | 156,938 | |
Security Description
| | | | Shares
| | Value
|
CORPORATE BONDS (continued) | | | | | | | | | | |
Consumer Discretionary (continued) | | | | | | | | | | |
MDC Holdings, Inc., 5.50%, 01/15/24 | | | | $ | 270,000 | | | $ | 264,600 | |
MGM Resorts International, 5.75%, 06/15/25 | | | | | 300,000 | | | | 294,000 | |
Neiman Marcus Group Ltd. LLC, 8.00%,
10/15/21(2) | | | | | 170,000 | | | | 102,850 | |
Scientific Games International, Inc., 6.63%,
05/15/21 | | | | | 110,000 | | | | 106,975 | |
Tenneco, Inc., 5.00%, 07/15/26 | | | | | 340,000 | | | | 283,900 | |
Viking Cruises Ltd., 5.88%, 09/15/27(2) | | | | | 285,000 | | | | 272,175 | |
Vista Outdoor, Inc., 5.88%, 10/01/23 | | | | | 295,000 | | | | 284,675 | |
Weekley Homes LLC / Weekley Finance Corp., 6.63%, 08/15/25 | | | | | 315,000 | | | | 299,250 | |
William Lyon Homes, Inc., 6.00%, 09/01/23 | | | | | 315,000 | | | | 289,013 | |
Total Consumer Discretionary | | | | | | | | | 5,382,594 | |
Consumer Staples — 0.7% | | | | | | | | | | |
Albertsons Cos. LLC / Safeway, Inc. / New Albertsons LP / Albertson’s LLC, 5.75%,
03/15/25 | | | | | 140,000 | | | | 123,900 | |
CVS Health Corp., 4.30%, 03/25/28 | | | | | 410,000 | | | | 400,693 | |
Safeway, Inc., 7.25%, 02/01/31 | | | | | 190,000 | | | | 188,575 | |
Total Consumer Staples | | | | | | | | | 713,168 | |
Energy — 5.3% | | | | | | | | | | |
Alta Mesa Holdings LP / Alta Mesa Finance Services Corp., 7.88%, 12/15/24 | | | | | 165,000 | | | | 148,500 | |
Blue Racer Midstream LLC / Blue Racer Finance Corp., 6.63%, 07/15/26(2) | | | | | 345,000 | | | | 351,900 | |
Bristow Group, Inc., 8.75%, 03/01/23(2) | | | | | 100,000 | | | | 94,500 | |
Callon Petroleum Co., 6.13%, 10/01/24 | | | | | 275,000 | | | | 269,500 | |
Cheniere Corpus Christi Holdings LLC, 5.88%, 03/31/25 | | | | | 210,000 | | | | 216,300 | |
Cheniere Energy Partners LP, 5.63%, 10/01/26(2) | | | | | 140,000 | | | | 138,250 | |
Chesapeake Energy Corp., 8.00%, 06/15/27 | | | | | 310,000 | | | | 308,838 | |
Citgo Holding, Inc., 10.75%, 02/15/20(2) | | | | | 205,000 | | | | 214,225 | |
Denbury Resources, Inc., 9.25%, 03/31/22(2) | | | | | 211,000 | | | | 220,759 | |
Denbury Resources, Inc., 7.50%, 02/15/24(2) | | | | | 115,000 | | | | 112,988 | |
Energy Transfer LP, 5.88%, 01/15/24 | | | | | 130,000 | | | | 136,825 | |
EP Energy LLC / Everest Acquisition Finance, Inc., 9.38%, 05/01/24(2) | | | | | 120,000 | | | | 91,800 | |
EP Energy LLC / Everest Acquisition Finance, Inc., 8.00%, 11/29/24(2) | | | | | 210,000 | | | | 203,700 | |
Jagged Peak Energy LLC, 5.88%, 05/01/26(2) | | | | | 260,000 | | | | 254,150 | |
Kinder Morgan, Inc., Series G, 7.75%, 01/15/32 | | | | | 235,000 | | | | 289,013 | |
MPLX LP, 4.00%, 03/15/28 | | | | | 160,000 | | | | 150,567 | |
Nabors Industries, Inc., 5.50%, 01/15/23 | | | | | 240,000 | | | | 226,779 | |
Nabors Industries, Inc., 5.75%, 02/01/25 | | | | | 70,000 | | | | 64,784 | |
Range Resources Corp., 4.88%, 05/15/25 | | | | | 210,000 | | | | 195,300 | |
Rowan Cos., Inc., 5.40%, 12/01/42 | | | | | 270,000 | | | | 193,725 | |
Sanchez Energy Corp., 7.25%, 02/15/23(2) | | | | | 125,000 | | | | 114,531 | |
Targa Resources Partners LP / Targa Resources Partners Finance Corp., 5.88%, 04/15/26(2) | | | | | 255,000 | | | | 257,709 | |
Transocean, Inc., 9.00%, 07/15/23(2) | | | | | 85,000 | | | | 89,356 | |
Transocean, Inc., 6.80%, 03/15/38 | | | | | 395,000 | | | | 319,456 | |
USA Compression Partners LP / USA Compression Finance Corp., 6.88%, 04/01/26(2) | | | | | 230,000 | | | | 234,888 | |
Vine Oil & Gas LP / Vine Oil & Gas Finance Corp., 8.75%, 04/15/23(2) | | | | | 210,000 | | | | 196,350 | |
Weatherford International Ltd., 9.88%, 02/15/24 | | | | | 160,000 | | | | 124,800 | |
Total Energy | | | | | | | | | 5,219,493 | |
The accompanying notes are an integral part of these financial statements.
48
Schedule of Investments — Virtus Newfleet Multi-Sector Bond ETF (continued)
October 31, 2018
Security Description
| | | | Principal
| | Value
|
CORPORATE BONDS (continued) | | | | | | | | | | |
Financials — 9.2% | | | | | | | | | | |
Acrisure, LLC / Acrisure Finance, Inc., 7.00%, 11/15/25(2) | | | | $ | 310,000 | | | $ | 278,225 | |
Ares Capital Corp., 3.50%, 02/10/23 | | | | | 200,000 | | | | 191,092 | |
Athene Holding Ltd., 4.13%, 01/12/28 | | | | | 370,000 | | | | 340,024 | |
Aviation Capital Group LLC, 3.50%, 11/01/27(2) | | | | | 335,000 | | | | 301,686 | |
Bank of America Corp., 4.20%, 08/26/24 | | | | | 255,000 | | | | 253,431 | |
Bank of New York Mellon Corp. (The), Series E, 4.95%, (3–Month USD LIBOR + 3.42%), perpetual(1)(4) | | | | | 495,000 | | | | 498,713 | |
Brighthouse Financial, Inc., 3.70%, 06/22/27 | | | | | 540,000 | | | | 466,202 | |
BrightSphere Investment Group PLC, 4.80%, 07/27/26 | | | | | 625,000 | | | | 602,424 | |
Discover Bank, 4.68%, (USD 5 Year Swap + 1.73%), 08/09/28(1) | | | | | 315,000 | | | | 311,639 | |
E*TRADE Financial Corp., 4.50%, 06/20/28 | | | | | 385,000 | | | | 379,165 | |
FS Investment Corp., 4.25%, 01/15/20 | | | | | 490,000 | | | | 491,612 | |
Goldman Sachs Group, Inc. (The), 3.78%,
(3-Month USD LIBOR + 1.17%), 05/15/26(1) | | | | | 310,000 | | | | 309,283 | |
Huntington Bancshares, Inc., Series E, 5.70%,
(3-Month USD LIBOR + 2.88%), perpetual(1)(4) | | | | | 200,000 | | | | 196,375 | |
Icahn Enterprises LP / Icahn Enterprises Finance Corp., 6.38%, 12/15/25 | | | | | 335,000 | | | | 333,744 | |
iStar, Inc., 5.25%, 09/15/22 | | | | | 110,000 | | | | 106,700 | |
JPMorgan Chase & Co., Series V, 5.00%,
(3-Month USD LIBOR + 3.32%), perpetual(1)(4) | | | | | 285,000 | | | | 285,356 | |
KeyCorp, Series D, 5.00%, (3-Month USD LIBOR + 3.61%), perpetual(1)(4) | | | | | 485,000 | | | | 462,266 | |
M&T Bank Corp., Series F, 5.13%, (3-Month USD LIBOR + 3.52%), perpetual(1)(4) | | | | | 190,000 | | | | 186,675 | |
MetLife, Inc., Series D, 5.88%, (3-Month USD LIBOR + 2.96%), perpetual(1)(4) | | | | | 186,000 | | | | 185,768 | |
Navient Corp., 6.75%, 06/25/25 | | | | | 250,000 | | | | 244,375 | |
Prudential Financial, Inc., 5.63%, (3-Month USD LIBOR + 3.92%), 06/15/43(1) | | | | | 425,000 | | | | 433,011 | |
Santander Holdings USA, Inc., 4.40%, 07/13/27 | | | | | 265,000 | | | | 247,810 | |
Springleaf Finance Corp., 6.88%, 03/15/25 | | | | | 115,000 | | | | 110,400 | |
Springleaf Finance Corp., 7.13%, 03/15/26 | | | | | 90,000 | | | | 85,444 | |
Synchrony Financial, 3.95%, 12/01/27 | | | | | 635,000 | | | | 560,951 | |
Teachers Insurance & Annuity Association of America, 4.38%, (3-Month USD LIBOR + 2.66%), 09/15/54(1)(2) | | | | | 550,000 | | | | 548,717 | |
Tempo Acquisition, LLC / Tempo Acquisition Finance Corp., 6.75%, 06/01/25(2) | | | | | 180,000 | | | | 171,846 | |
Wells Fargo & Co., Series S, 5.90%, (3-Month USD LIBOR + 3.11%), perpetual(1)(4) | | | | | 520,000 | | | | 521,934 | |
Total Financials | | | | | | | | | 9,104,868 | |
Health Care — 3.0% | | | | | | | | | | |
Anthem, Inc., 3.65%, 12/01/27 | | | | | 82,000 | | | | 76,808 | |
Avantor, Inc., 6.00%, 10/01/24(2) | | | | | 130,000 | | | | 130,000 | |
Avantor, Inc., 9.00%, 10/01/25(2) | | | | | 210,000 | | | | 212,625 | |
Bausch Health Cos., Inc., 6.50%, 03/15/22(2) | | | | | 40,000 | | | | 41,500 | |
Bausch Health Cos., Inc., 7.00%, 03/15/24(2) | | | | | 40,000 | | | | 41,988 | |
Bausch Health Cos., Inc., 5.50%, 11/01/25(2) | | | | | 205,000 | | | | 201,669 | |
Bausch Health Cos., Inc., 9.25%, 04/01/26(2) | | | | | 110,000 | | | | 115,638 | |
Centene Corp., 5.38%, 06/01/26(2) | | | | | 80,000 | | | | 81,400 | |
Security Description
| | | | Shares
| | Value
|
CORPORATE BONDS (continued) | | | | | | | | | | |
Health Care (continued) | | | | | | | | | | |
DJO Finance LLC / DJO Finance Corp., 8.13%, 06/15/21(2) | | | | $ | 115,000 | | | $ | 116,437 | |
Eagle Holding Co. II LLC, 7.63%, 05/15/22(2)(5) | | | | | 165,000 | | | | 166,237 | |
Endo Dac / Endo Finance LLC / Endo Finco,
Inc., 6.00%, 07/15/23(2) | | | | | 250,000 | | | | 216,800 | |
Halfmoon Parent, Inc., 4.13%, 11/15/25(2) | | | | | 240,000 | | | | 237,610 | |
Halfmoon Parent, Inc., 4.38%, 10/15/28(2) | | | | | 24,000 | | | | 23,484 | |
HCA, Inc., 5.63%, 09/01/28 | | | | | 165,000 | | | | 163,762 | |
HLF Financing S.a r.l. LLC / Herbalife International, Inc., 7.25%, 08/15/26(2) | | | | | 295,000 | | | | 299,056 | |
MPH Acquisition Holdings LLC, 7.13%,
06/01/24(2) | | | | | 90,000 | | | | 91,649 | |
Ortho–Clinical Diagnostics, Inc. / Ortho–Clinical Diagnostics SA, 6.63%, 05/15/22(2) | | | | | 120,000 | | | | 115,200 | |
Surgery Center Holdings, Inc., 8.88%, 04/15/21(2) | | | | | 170,000 | | | | 175,525 | |
Surgery Center Holdings, Inc., 6.75%, 07/01/25(2) | | | | | 55,000 | | | | 51,838 | |
Tenet Healthcare Corp., 5.13%, 05/01/25 | | | | | 65,000 | | | | 62,725 | |
Tenet Healthcare Corp., 7.00%, 08/01/25 | | | | | 215,000 | | | | 211,693 | |
West Street Merger Sub, Inc., 6.38%, 09/01/25(2) | | | | | 180,000 | | | | 169,650 | |
Total Health Care | | | | | | | | | 3,003,294 | |
Industrials — 1.9% | | | | | | | | | | |
Hillman Group, Inc. (The), 6.38%, 07/15/22(2) | | | | | 195,000 | | | | 172,575 | |
New Enterprise Stone & Lime Co., Inc., 10.13%, 04/01/22(2) | | | | | 130,000 | | | | 136,500 | |
Oshkosh Corp., 4.60%, 05/15/28 | | | | | 410,000 | | | | 402,103 | |
Pitney Bowes, Inc., 4.38%, 05/15/22 | | | | | 448,000 | | | | 408,800 | |
United Rentals North America, Inc., 6.50%, 12/15/26 | | | | | 45,000 | | | | 45,619 | |
US Airways 2012–1 Class B Pass–Through Trust, 8.00%, 10/01/19 | | | | | 409,695 | | | | 423,584 | |
Wrangler Buyer Corp., 6.00%, 10/01/25(2) | | | | | 257,000 | | | | 276,275 | |
Total Industrials | | | | | | | | | 1,865,456 | |
Information Technology — 2.1% | | | | | | | | | | |
Banff Merger Sub, Inc., 9.75%, 09/01/26(2) | | | | | 35,000 | | | | 33,906 | |
Broadcom Corp. / Broadcom Cayman Finance Ltd., 3.63%, 01/15/24 | | | | | 285,000 | | | | 273,198 | |
CDK Global, Inc., 5.88%, 06/15/26 | | | | | 270,000 | | | | 272,363 | |
Citrix Systems, Inc., 4.50%, 12/01/27 | | | | | 375,000 | | | | 356,155 | |
Dell International LLC / EMC Corp., 5.45%, 06/15/23(2) | | | | | 145,000 | | | | 150,327 | |
Dell International LLC / EMC Corp., 8.10%, 07/15/36(2) | | | | | 160,000 | | | | 181,260 | |
Everi Payments, Inc., 7.50%, 12/15/25(2) | | | | | 70,000 | | | | 69,825 | |
Exela Intermediate LLC / Exela Finance, Inc., 10.00%, 07/15/23(2) | | | | | 205,000 | | | | 214,164 | |
Radiate Holdco LLC / Radiate Finance, Inc., 6.63%, 02/15/25(2) | | | | | 290,000 | | | | 271,875 | |
VMware, Inc., 3.90%, 08/21/27 | | | | | 290,000 | | | | 265,648 | |
Total Information Technology | | | | | | | | | 2,088,721 | |
Materials — 1.1% | | | | | | | | | | |
Hexion, Inc., 10.38%, 02/01/22(2) | | | | | 225,000 | | | | 203,344 | |
Kraton Polymers LLC / Kraton Polymers Capital Corp., 7.00%, 04/15/25(2) | | | | | 105,000 | | | | 98,962 | |
PQ Corp., 5.75%, 12/15/25(2) | | | | | 95,000 | | | | 91,794 | |
The accompanying notes are an integral part of these financial statements.
49
Schedule of Investments — Virtus Newfleet Multi-Sector Bond ETF (continued)
October 31, 2018
Security Description
| | | | Principal
| | Value
|
CORPORATE BONDS (continued) | | | | | | | | | | |
Materials (continued) | | | | | | | | | | |
Reynolds Group Issuer, Inc. / Reynolds Group Issuer LLC / Reynolds Group Issuer Lu, 7.00%, 07/15/24(2) | | | | $ | 265,000 | | | $ | 266,159 | |
Trident Merger Sub, Inc., 6.63%, 11/01/25(2) | | | | | 175,000 | | | | 164,063 | |
U.S. Steel Corp., 6.25%, 03/15/26 | | | | | 245,000 | | | | 231,525 | |
Total Materials | | | | | | | | | 1,055,847 | |
Real Estate — 2.2% | | | | | | | | | | |
EPR Properties, 4.75%, 12/15/26 | | | | | 505,000 | | | | 488,240 | |
ESH Hospitality, Inc., 5.25%, 05/01/25(2) | | | | | 240,000 | | | | 227,700 | |
Healthcare Trust of America Holdings LP, 3.75%, 07/01/27 | | | | | 220,000 | | | | 205,612 | |
Hospitality Properties Trust, 4.38%, 02/15/30 | | | | | 365,000 | | | | 332,678 | |
Life Storage LP, 3.88%, 12/15/27 | | | | | 75,000 | | | | 69,788 | |
LifeStorage LP, 3.50%, 07/01/26 | | | | | 205,000 | | | | 188,849 | |
MPT Operating Partnership LP / MPT Finance Corp., 6.38%, 03/01/24 | | | | | 110,000 | | | | 114,400 | |
MPT Operating Partnership LP / MPT Finance Corp., 5.00%, 10/15/27 | | | | | 130,000 | | | | 122,486 | |
Physicians Realty LP, 4.30%, 03/15/27 | | | | | 465,000 | | | | 443,622 | |
Total Real Estate | | | | | | | | | 2,193,375 | |
Utilities — 0.7% | | | | | | | | | | |
Calpine Corp., 5.38%, 01/15/23 | | | | | 245,000 | | | | 233,056 | |
Ferrellgas Partners LP / Ferrellgas Partners Finance Corp., 8.63%, 06/15/20 | | | | | 255,000 | | | | 231,731 | |
TerraForm Power Operating LLC,
5.00%, 01/31/28(2) | | | | | 225,000 | | | | 201,938 | |
Total Utilities | | | | | | | | | 666,725 | |
Total Corporate Bonds | | | | | | | | | | |
(Cost $36,744,018) | | | | | | | | | 35,545,917 | |
FOREIGN BONDS — 21.8% | | | | | | | | | | |
Communication Services — 0.9% | | | | | | | | | | |
Altice France SA, 7.38%, 05/01/26 (France)(2) | | | | | 220,000 | | | | 212,025 | |
Altice Luxembourg SA, 7.63%, 02/15/25 (Luxembourg)(2) | | | | | 400,000 | | | | 342,500 | |
Digicel Ltd., 6.75%, 03/01/23 (Jamaica)(2) | | | | | 235,000 | | | | 189,762 | |
Telenet Finance Luxembourg Notes S.a.r.l., 5.50%, 03/01/28 (Belgium)(2) | | | | | 200,000 | | | | 186,500 | |
Total Communication Services | | | | | | | | | 930,787 | |
Consumer Discretionary — 0.3% | | | | | | | | | | |
Gateway Casinos & Entertainment Ltd., 8.25%, 03/01/24 (Canada)(2) | | | | | 245,000 | | | | 257,863 | |
Consumer Staples — 1.1% | | | | | | | | | | |
Bacardi Ltd., 4.70%, 05/15/28 (Bermuda)(2) | | | | | 260,000 | | | | 251,743 | |
BAT Capital Corp., 3.56%, 08/15/27 (United Kingdom)(2) | | | | | 350,000 | | | | 321,524 | |
Kronos Acquisition Holdings, Inc., 9.00%, 08/15/23 (Canada)(2) | | | | | 275,000 | | | | 241,312 | |
Sigma Finance Netherlands BV, 4.88%, 03/27/28 (Mexico)(2) | | | | | 330,000 | | | | 311,850 | |
Total Consumer Staples | | | | | | | | | 1,126,429 | |
Security Description
| | | | | | Principal
| | Value
|
FOREIGN BONDS (continued) | | | | | | | | | | | | | | |
Energy — 2.6% | | | | | | | | | | | | | | |
Ecopetrol SA, 5.88%, 09/18/23 (Colombia) | | | | | | | | $ | 100,000 | | | $ | 104,800 | |
Ecopetrol SA, 5.38%, 06/26/26 (Colombia) | | | | | | | | | 160,000 | | | | 161,952 | |
Encana Corp., 8.13%, 09/15/30 (Canada) | | | | | | | | | 305,000 | | | | 388,136 | |
Geopark Ltd., 6.50%, 09/21/24 (Colombia)(2) | | | | | | | | | 245,000 | | | | 244,694 | |
KazMunayGas National Co. JSC, 4.75%, 04/19/27 (Kazakhstan)(2) | | | | | | | | | 300,000 | | | | 294,372 | |
Petrobras Global Finance BV, 7.38%, 01/17/27 (Brazil) | | | | | | | | | 565,000 | | | | 587,515 | |
Petroleos Mexicanos, 4.88%, 01/24/22 (Mexico) | | | | | | | | | 205,000 | | | | 203,387 | |
Petroleos Mexicanos, 6.50%, 03/13/27 (Mexico) | | | | | | | | | 200,000 | | | | 194,300 | |
Petroleos Mexicanos, 6.50%, 06/02/41 (Mexico) | | | | | | | | | 195,000 | | | | 167,466 | |
Seven Generations Energy Ltd., 5.38%, 09/30/25 (Canada)(2) | | | | | | | | | 270,000 | | | | 252,787 | |
Total Energy | | | | | | | | | | | | | 2,599,409 | |
Financials — 3.9% | | | | | | | | | | | | | | |
AerCap Ireland Capital DAC / AerCap Global Aviation Trust, 3.65%, 07/21/27 (Ireland) | | | | | | | | | 495,000 | | | | 445,001 | |
Australia & New Zealand Banking Group Ltd., 4.40%, 05/19/26 (Australia)(2) | | | | | | | | | 290,000 | | | | 282,298 | |
Bank of Montreal, 3.80%, (USD 5 Year Swap + 1.43%), 12/15/32 (Canada)(1) | | | | | | | | | 263,000 | | | | 241,387 | |
BBVA Bancomer SA, 5.13%, (US 5 Year CMT T-Note + 2.65%), 01/18/33 (Mexico)(1)(2) | | | | | | | | | 200,000 | | | | 177,202 | |
Development Bank of Kazakhstan JSC, 8.95%, 05/04/23 (Kazakhstan)(2) | | | | | KZT | | | | 70,000,000 | | | | 164,042 | |
Fairfax Financial Holdings Ltd., 4.85%, 04/17/28 (Canada)(2) | | | | | | | | | 380,000 | | | | 370,914 | |
Grupo de Inversiones Suramericana SA, 5.50%, 04/29/26 (Colombia)(2) | | | | | | | | | 450,000 | | | | 454,500 | |
Guanay Finance Ltd., 6.00%, 12/15/20 (Chile)(2) | | | | | | | | | 611,483 | | | | 617,598 | |
Societe Generale SA, 4.75%, 11/24/25 (France)(2) | | | | | | | | | 765,000 | | | | 750,669 | |
Toronto-Dominion Bank (The), 3.63%, (USD 5 Year Swap + 2.21%), 09/15/31 (Canada)(1) | | | | | | | | | 335,000 | | | | 312,261 | |
Total Financials | | | | | | | | | | | | | 3,815,872 | |
Government — 7.4% | | | | | | | | | | | | | | |
Angolan Government International Bond, 9.38%, 05/08/48 (Angola)(2) | | | | | | | | | 200,000 | | | | 201,606 | |
Argentine Republic Government International Bond, 6.88%, 01/26/27 (Argentina) | | | | | | | | | 380,000 | | | | 319,057 | |
Brazil Notas Do Tesouro Nacional, Series NTNF, 10.00%, 01/01/25 (Brazil) | | | | | BRL | | | | 430,000 | | | | 117,348 | |
The accompanying notes are an integral part of these financial statements.
50
Schedule of Investments — Virtus Newfleet Multi-Sector Bond ETF (continued)
October 31, 2018
Security Description
| | | | | | Principal
| | Value
|
FOREIGN BONDS (continued) | | | | | | | | | | | | | | |
Government (continued) | | | | | | | | | | | | | | |
Brazilian Government International Bond, 10.25%, 01/10/28 (Brazil) | | | | | BRL | | | | 270,000 | | | $ | 80,259 | |
Colombia Government International Bond, 4.38%, 03/21/23 (Colombia) | | | | | COP | | | | 1,195,000,000 | | | | 356,422 | |
Costa Rica Government International Bond, 4.38%, 04/30/25
(Costa Rica)(2) | | | | | | | | $ | 375,000 | | | | 309,877 | |
Dominican Republic International Bond, 6.88%, 01/29/26 (Dominican Republic)(2) | | | | | | | | | 190,000 | | | | 199,975 | |
Dominican Republic International Bond, 6.00%, 07/19/28 (Dominican Republic)(2) | | | | | | | | | 150,000 | | | | 149,062 | |
Ecuador Government International Bond, 8.88%, 10/23/27 (Ecuador)(2) | | | | | | | | | 315,000 | | | | 278,066 | |
Indonesia Government International Bond, 8.50%, 10/12/35 (Indonesia)(2) | | | | | | | | | 495,000 | | | | 649,679 | |
Indonesia Treasury Bond, Series FR70, 8.38%, 03/15/24 (Indonesia) | | | | | IDR | | | | 4,780,000,000 | | | | 312,064 | |
Jordan Government International Bond, 5.75%, 01/31/27 (Jordan)(2) | | | | | | | | | 275,000 | | | | 253,409 | |
Mexican Bonos, Series M, 6.50%, 06/09/22 (Mexico) | | | | | MXN | | | | 7,000,000 | | | | 322,066 | |
Mexico Government International Bond, 4.15%, 03/28/27 (Mexico) | | | | | | | | | 480,000 | | | | 457,620 | |
Nigeria Government International Bond, 6.50%, 11/28/27 (Nigeria)(2) | | | | | | | | | 355,000 | | | | 326,829 | |
Oman Government International Bond, 5.38%, 03/08/27 (Oman)(2) | | | | | | | | | 650,000 | | | | 613,639 | |
Philippine Government International Bond, 9.50%, 02/02/30 (Philippines) | | | | | | | | | 310,000 | | | | 447,376 | |
Provincia De Buenos Aire, 9.13%, 03/16/24 (Argentina)(2) | | | | | | | | | 450,000 | | | | 403,879 | |
Republic of South Africa Government Bond, Series 2023, 7.75%, 02/28/23 (South Africa) | | | | | ZAR | | | | 3,500,000 | | | | 229,632 | |
Republic of South Africa Government International Bond, 5.65%, 09/27/47 (South Africa) | | | | | | | | | 200,000 | | | | 169,000 | |
Russian Federal Bond — OFZ, Series 6216, 6.70%,
05/15/19 (Russia) | | | | | RUB | | | | 9,145,000 | | | | 138,382 | |
Russian Federal Bond — OFZ, Series 6215, 7.00%,
08/16/23 (Russia) | | | | | RUB | | | | 6,795,000 | | | | 98,457 | |
Turkey Government International Bond, 5.63%, 03/30/21 (Turkey) | | | | | | | | | 200,000 | | | | 195,432 | |
Turkey Government International Bond, 4.88%, 10/09/26 (Turkey) | | | | | | | | | 305,000 | | | | 258,700 | |
Ukraine Government International Bond, 7.75%, 09/01/23 (Ukraine)(2) | | | | | | | | | 100,000 | | | | 95,409 | |
Ukraine Government International Bond, 7.75%, 09/01/26 (Ukraine)(2) | | | | | | | | | 355,000 | | | | 321,838 | |
Total Government | | | | | | | | | | | | | 7,305,083 | |
Health Care — 0.2% | | | | | | | | | | | | | | |
Concordia International Corp., 8.00%, 09/06/24 (Canada) | | | | | | | | | 67,000 | | | | 65,828 | |
Security Description
| | | | | | Principal
| | Value
|
FOREIGN BONDS (continued) | | | | | | | | | | | | | | |
Health Care (continued) | | | | | | | | | | | | | | |
Teva Pharmaceutical Finance Netherlands III BV, 3.15%, 10/01/26 (Israel) | | | | | | | | $ | 160,000 | | | $ | 130,571 | |
Total Health Care | | | | | | | | | | | | | 196,399 | |
Industrials — 1.9% | | | | | | | | | | | | | | |
Ashtead Capital, Inc., 4.38%, 08/15/27 (United Kingdom)(2) | | | | | | | | | 380,000 | | | | 350,436 | |
Bombardier, Inc., 6.13%, 01/15/23 (Canada)(2) | | | | | | | | | 235,000 | | | | 233,238 | |
British Airways Pass-Through Trust, Class B, Series 2013-1, 5.63%, 06/20/20 (United Kingdom)(2) | | | | | | | | | 113,452 | | | | 115,154 | |
CNH Industrial NV, 4.50%, 08/15/23 (United Kingdom) | | | | | | | | | 362,000 | | | | 365,620 | |
Garda World Security Corp., 8.75%, 05/15/25 (Canada)(2) | | | | | | | | | 280,000 | | | | 264,600 | |
Hulk Finance Corp., 7.00%, 06/01/26 (Canada)(2) | | | | | | | | | 190,000 | | | | 175,275 | |
Titan Acquisition Ltd. / Titan Co. — Borrower LLC, 7.75%, 04/15/26 (Canada)(2) | | | | | | | | | 175,000 | | | | 146,125 | |
Topaz Marine SA, 9.13%, 07/26/22 (United Arab Emirates)(2) | | | | | | | | | 255,000 | | | | 264,774 | |
Total Industrials | | | | | | | | | | | | | 1,915,222 | |
Materials — 2.6% | | | | | | | | | | | | | | |
Anglo American Capital PLC, 4.00%, 09/11/27 (South Africa)(2) | | | | | | | | | 355,000 | | | | 323,841 | |
BHP Billiton Finance USA Ltd., 6.75%, (USD 5 Year Swap + 5.09%), 10/19/75 (Australia)(1)(2) | | | | | | | | | 440,000 | | | | 477,400 | |
Equate Petrochemical BV, 4.25%, 11/03/26 (Kuwait)(2) | | | | | | | | | 300,000 | | | | 291,585 | |
Glencore Funding LLC, 4.00%, 03/27/27 (Switzerland)(2) | | | | | | | | | 380,000 | | | | 350,089 | |
NOVA Chemicals Corp., 4.88%, 06/01/24 (Canada)(2) | | | | | | | | | 105,000 | | | | 96,863 | |
NOVA Chemicals Corp., 5.00%, 05/01/25 (Canada)(2) | | | | | | | | | 250,000 | | | | 228,125 | |
Rusal Capital DAC, 5.13%, 02/02/22 (Russia)(2) | | | | | | | | | 695,000 | | | | 493,450 | |
SABIC Capital II BV, 4.50%, 10/10/28 (Saudi Arabia)(2) | | | | | | | | | 290,000 | | | | 284,751 | |
Total Materials | | | | | | | | | | | | | 2,546,104 | |
Utilities — 0.9% | | | | | | | | | | | | | | |
ENEL Finance International NV, 4.63%, 09/14/25 (Italy)(2) | | | | | | | | | 250,000 | | | | 236,699 | |
Perusahaan Listrik Negara PT, 4.13%, 05/15/27 (Indonesia)(2) | | | | | | | | | 360,000 | | | | 324,911 | |
Transportadora de Gas Internacional SA ESP, 5.55%, 11/01/28 (Colombia)(2) | | | | | | | | | 280,000 | | | | 282,128 | |
Total Utilities | | | | | | | | | | | | | 843,738 | |
Total Foreign Bonds | | | | | | | | | | | | | | |
(Cost $23,053,220) | | | | | | | | | | | | | 21,536,906 | |
The accompanying notes are an integral part of these financial statements.
51
Schedule of Investments — Virtus Newfleet Multi-Sector Bond ETF (continued)
October 31, 2018
| | Security Description
| | | | Principal
| | Value
|
TERM LOANS — 18.0% | | | | | | | | | | |
Aerospace — 0.4% | | | | | | | | | | |
TransDigm, Inc., 4.80%, (1-Month USD LIBOR + 2.50%), 06/09/23(1) | | | | $ | 369,389 | | | $ | 368,218 | |
TransDigm, Inc., 4.80%, (1-Month USD LIBOR + 2.50%), 05/30/25(1) | | | | | 59,700 | | | | 59,500 | |
Total Aerospace | | | | | | | | | 427,718 | |
Chemicals — 0.2% | | | | | | | | | | |
New Arclin U.S. Holding Corp., 5.89%, (3-Month USD LIBOR + 3.50%), 02/14/24(1) | | | | | 233,571 | | | | 233,279 | |
Consumer Durables — 0.3% | | | | | | | | | | |
Global Appliance, Inc. (aka SharkNinja Operating LLC), 6.31%, (1-Month USD LIBOR + 4.00%), 09/29/24(1) | | | | | 297,000 | | | | 295,329 | |
Consumer Non-Durables — 1.0% | | | | | | | | | | |
American Greetings Corp., 6.80%, (1-Month USD LIBOR + 4.50%), 04/06/24(1) | | | | | 324,475 | | | | 325,489 | |
Herbalife Nutrition Ltd., 5.49%, (1-Month USD LIBOR + 3.25%), 08/18/25(1) | | | | | 50,000 | | | | 50,292 | |
Kronos Acquisition Intermediate, Inc. (aka KIK Custom Products), 6.30%, (1-Month USD LIBOR + 4.00%), 05/15/23 (Nigeria)(1) | | | | | 121,202 | | | | 119,763 | |
Parfums Holding Co., Inc., 6.53%, (3-Month USD LIBOR + 4.25%), 06/30/24(1) | | | | | 192,592 | | | | 192,833 | |
Rodan & Fields, LLC, 6.28%, (PRIME + 3.00%), 06/16/25 (Kazakhstan)(1) | | | | | 279,300 | | | | 281,220 | |
Total Consumer Non-Durables | | | | | | | | | 969,597 | |
Energy — 0.6% | | | | | | | | | | |
Medallion Midland Acquisition, LLC, 5.55%, (1-Month USD LIBOR + 3.25%), 10/30/24(1) | | | | | 253,088 | | | | 251,980 | |
Moda Ingleside Energy Center, LLC, 5.54%, (1-Month USD LIBOR + 3.25%), 09/29/25(1) | | | | | 20,000 | | | | 20,183 | |
Traverse Midstream Partners LLC, 6.60%, (3-Month USD LIBOR + 4.00%), 09/27/24 (Turkey)(1) | | | | | 275,000 | | | | 277,192 | |
Total Energy | | | | | | | | | 549,355 | |
Financials — 2.2% | | | | | | | | | | |
Asurion, LLC (fka Asurion Corp.), 8.80%, (1-Month USD LIBOR + 6.50%), 08/04/25(1) | | | | | 326,228 | | | | 335,403 | |
Blackhawk Network Holdings, Inc., 5.39%, (3-Month USD LIBOR + 3.00%), 06/15/25(1) | | | | | 174,563 | | | | 175,136 | |
Ditech Holding Corp., 8.30%, (1-Month USD LIBOR + 6.00%), 06/30/22(1) | | | | | 517,627 | | | | 482,687 | |
Financial & Risk US Holdings, Inc. (aka Refinitiv), 0.00%, 10/01/25(1)(6) | | | | | 335,000 | | | | 332,069 | |
FinCo I, LLC (aka Fortress Investment Group), 4.30%, (1-Month USD LIBOR + 2.00%), 12/27/22(1) | | | | | 133,435 | | | | 133,539 | |
Genworth Holdings, Inc., 6.83%, (2-Month USD LIBOR + 4.50%), 03/07/23(1) | | | | | 24,875 | | | | 25,435 | |
iStar, Inc. (fka iStar Financial, Inc.), 5.03%, (1-Month USD LIBOR + 2.75%), 06/28/23(1) | | | | | 254,363 | | | | 254,839 | |
PI UK Holdco II Limited, 5.80%, (1-Month USD LIBOR + 3.50%), 01/03/25(1) | | | | | 412,925 | | | | 412,281 | |
Total Financials | | | | | | | | | 2,151,389 | |
Security Description
| | | | Principal
| | Value
|
TERM LOANS (continued) | | | | | | | | | | |
Food and Drug — 0.2% | | | | | | | | | | |
Albertson’s LLC, 5.38%, (3-Month USD LIBOR + 3.00%), 12/21/22(1) | | | | $ | 219,545 | | | $ | 219,331 | |
Food/Tobacco — 0.2% | | | | | | | | | | |
H-Food Holdings, LLC (aka Hearthside Food Solutions, LLC), 5.30%, (1-Month USD LIBOR + 3.00%), 05/23/25(1) | | | | | 44,888 | | | | 44,186 | |
Milk Specialties Co., 6.24%, (1-Month USD LIBOR + 4.00%), 08/16/23(1) | | | | | 207,855 | | | | 207,985 | |
Total Food/Tobacco | | | | | | | | | 252,171 | |
Gaming/Leisure — 0.6% | | | | | | | | | | |
Playa Resorts Holding B.V., 5.05%, (1-Month USD LIBOR + 2.75%), 04/29/24(1) | | | | | 226,986 | | | | 224,148 | |
Scientific Games International, Inc., 5.05%, (2-Month USD LIBOR + 2.75%), 08/14/24(1) | | | | | 129,350 | | | | 128,276 | |
UFC Holdings, LLC, 5.56%, (1-Month USD LIBOR + 3.25%), 08/18/23(1) | | | | | 273,529 | | | | 275,467 | |
Total Gaming/Leisure | | | | | | | | | 627,891 | |
Health Care — 1.9% | | | | | | | | | | |
Accelerated Health Systems LLC, 0.00%, 10/31/25(1)(6) | | | | | 150,000 | | | | 150,750 | |
AHP Health Partners, Inc. (aka Ardent Health Partners, LLC), 6.80%, (1-Month USD LIBOR + 4.50%), 06/30/25(1) | | | | | 189,525 | | | | 190,680 | |
Auris Lux Co. (aka Sivantos Group), 0.00%, 07/24/25 (Luxembourg)(1)(6) | | | | | 30,000 | | | | 30,256 | |
Bausch Health Companies, Inc. (fka Valeant Pharmaceuticals International, Inc.), 5.27%, (1-Month USD LIBOR + 3.00%), 06/02/25 (Canada)(1) | | | | | 175,283 | | | | 175,591 | |
CCS-CMGC Holdings, Inc., 7.80%, (1-Month USD LIBOR + 5.50%), 10/01/25(1) | | | | | 160,000 | | | | 159,400 | |
CHG Healthcare Services, Inc. (fka CHG Buyer Corp.), 5.30%, (1-Month USD LIBOR + 3.00%), 06/07/23(1) | | | | | 322,533 | | | | 324,002 | |
Concordia Healthcare Corp., 7.78%, (1-Month USD LIBOR + 5.50%), 09/06/24 (Canada)(1) | | | | | 159,000 | | | | 156,218 | |
Envision Health Care Corp., 6.05%, (1-Month USD LIBOR + 3.75%), 10/10/25(1) | | | | | 236,145 | | | | 231,662 | |
Ortho-Clinical Diagnostics, Inc., 5.54%, (1-Month USD LIBOR + 3.25%), 06/30/25(1) | | | | | 198,000 | | | | 197,604 | |
Prospect Medical Holdings, Inc., 7.81%, (1-Month USD LIBOR + 5.50%), 02/22/24(1) | | | | | 144,275 | | | | 145,537 | |
U.S. Renal Care, Inc., 6.64%, (3-Month USD LIBOR + 4.25%), 12/30/22(1) | | | | | 134,654 | | | | 130,838 | |
Universal Health Services, Inc., 0.00%, 10/31/25(1)(6) | | | | | 25,000 | | | | 25,094 | |
Total Health Care | | | | | | | | | 1,917,632 | |
Housing — 1.0% | | | | | | | | | | |
84 Lumber Co., 7.53%, (1-Month USD LIBOR + 5.25%), 10/25/23 (South Africa)(1) | | | | | 215,625 | | | | 217,422 | |
American Builders & Contractors Supply Co., Inc., 4.30%, (1-Month USD LIBOR + 2.00%), 10/31/23 (Mexico)(1) | | | | | 213,448 | | | | 211,714 | |
Capital Automotive L.P., 8.31%, (1-Month USD LIBOR + 6.00%), 03/24/25 (Chile)(1) | | | | | 243,153 | | | | 247,712 | |
The accompanying notes are an integral part of these financial statements.
52
Schedule of Investments — Virtus Newfleet Multi-Sector Bond ETF (continued)
October 31, 2018
Security Description
| | | | Principal
| | Value
|
TERM LOANS (continued) | | | | | | | | | | |
Housing (continued) | | | | | | | | | | |
CPG International LLC (fka CPG International, Inc.), 6.25%, (3-Month USD LIBOR + 3.75%), 05/05/24(1) | | | | $ | 300,867 | | | $ | 302,122 | |
Total Housing | | | | | | | | | 978,970 | |
Information Technology — 2.0% | | | | | | | | | | |
Applied Systems, Inc., 9.39%, (3-Month USD LIBOR + 7.00%), 09/19/25(1) | | | | | 50,000 | | | | 51,000 | |
BMC Software Finance, Inc., 6.65%, (3-Month USD LIBOR + 4.25%), 10/02/25(1) | | | | | 310,000 | | | | 311,454 | |
Intralinks, Inc., 6.31%, (1-Month USD LIBOR + 4.00%), 11/14/24(1) | | | | | 118,322 | | | | 118,692 | |
Kronos, Inc., 5.34%, (3-Month USD LIBOR + 3.00%), 11/01/23 (Oman)(1) | | | | | 194,025 | | | | 194,586 | |
Kronos, Inc., 10.59%, (3-Month USD LIBOR + 8.25%), 11/01/24(1) | | | | | 178,000 | | | | 181,189 | |
Renaissance Holding Corp., 5.55%, (1-Month USD LIBOR + 3.25%), 05/30/25 (Canada)(1) | | | | | 334,163 | | | | 333,327 | |
SS&C Technologies, Inc., 4.55%, (1-Month USD LIBOR + 2.25%), 04/16/25(1) | | | | | 389,144 | | | | 387,657 | |
SS&C Technologies, Inc., 4.55%, (1-Month USD LIBOR + 2.25%), 04/16/25(1) | | | | | 150,833 | | | | 150,257 | |
Vertafore, Inc., 5.55%, (1-Month USD LIBOR + 3.25%), 07/02/25(1) | | | | | 300,000 | | | | 299,437 | |
Total Information Technology | | | | | | | | | 2,027,599 | |
Manufacturing — 1.0% | | | | | | | | | | |
Accudyne Industries Borrower SCA, 5.30%, (1-Month USD LIBOR + 3.00%), 08/18/24(1) | | | | | 237,981 | | | | 237,429 | |
CPI Acquisition, Inc., 7.02%, (3-Month USD LIBOR + 4.50%), 08/17/22(1) | | | | | 535,000 | | | | 354,055 | |
Deliver Buyer, Inc. (aka MHS Holdings, Inc.), 7.31%, (3-Month USD LIBOR + 5.00%), 05/01/24(1) | | | | | 169,144 | | | | 169,989 | |
Filtration Group Corp., 5.30%, (1-Month USD LIBOR + 3.00%), 03/29/25 (Israel)(1) | | | | | 74,625 | | | | 75,031 | |
Hillman Group, Inc. (The), 6.30%, (1-Month USD LIBOR + 4.00%), 05/30/25(1) | | | | | 134,663 | | | | 132,508 | |
Total Manufacturing | | | | | | | | | 969,012 | |
Media/Telecom – Cable/Wireless Video — 0.7% | | | |
Altice US Finance I Corp., 4.55%, (1-Month USD LIBOR + 2.25%), 07/28/25(1) | | | | | 198,992 | | | | 198,931 | |
CSC Holdings, LLC, 0.00%, 01/15/26(1)(6) | | | | | 270,000 | | | | 269,874 | |
Telenet Financing USD LLC, 4.53%, (1-Month USD LIBOR + 2.25%), 08/15/26(1) | | | | | 200,000 | | | | 199,602 | |
Total Media/Telecom – Cable/Wireless Video | | | | | | | | | 668,407 | |
Media/Telecom – Diversified Media — 0.4% | | | | | | | | | | |
Cineworld Finance US, Inc., 4.80%, (1-Month USD LIBOR + 2.50%), 02/28/25 (Kazakhstan)(1) | | | | | 373,125 | | | | 372,056 | |
Media/Telecom – Telecommunications — 0.7% | | | | | | | | | | |
CenturyLink, Inc., 5.05%, (1-Month USD LIBOR + 2.75%), 01/31/25(1) | | | | | 203,112 | | | | 201,208 | |
Securus Technologies Holdings, Inc., 6.80%, (1-Month USD LIBOR + 4.50%), 11/01/24(1) | | | | | 111,113 | | | | 111,577 | |
Securus Technologies Holdings, Inc., 0.00%, 11/01/24(1)(6) | | | | | 52,000 | | | | 52,130 | |
Security Description
| | | | Principal
| | Value
|
TERM LOANS (continued) | | | | | | | | | | |
Media/Telecom – Telecommunications (continued) | | | |
Securus Technologies Holdings, Inc., 10.55%, (1-Month USD LIBOR + 8.25%), 11/01/25 (Turkey)(1) | | | | $ | 210,000 | | | $ | 210,699 | |
West Corp., 6.03%, (1-Month USD LIBOR + 3.50%), 10/10/24 (Ukraine)(1) | | | | | 129,675 | | | | 128,405 | |
Total Media/Telecom – Telecommunications | | | | | | | | | 704,019 | |
Media/Telecom – Wireless Communications — 0.1% | | | |
Digicel International Finance Ltd., 5.57%, (3-Month USD LIBOR + 3.25%), 05/27/24(1) | | | | | 74,250 | | | | 71,373 | |
Metals/Minerals — 0.7% | | | | | | | | | | |
Contura Energy, Inc., 7.30%, (2-Month USD LIBOR + 5.00%), 03/18/24(1) | | | | | 266,474 | | | | 266,474 | |
Covia Holdings Corp. (fka Unimin Corp.), 6.14%, (1-Month USD LIBOR + 3.75%), 06/01/25(1) | | | | | 264,338 | | | | 222,787 | |
GrafTech Finance, Inc., 5.80%, (1-Month USD LIBOR + 3.50%), 02/12/25(1) | | | | | 227,125 | | | | 227,693 | |
Total Metals/Minerals | | | | | | | | | 716,954 | |
Retail — 0.3% | | | | | | | | | | |
Neiman Marcus Group, Inc. (The), 5.53%, (1-Month USD LIBOR + 3.25%), 10/25/20(1) | | | | | 301,831 | | | | 275,629 | |
Service — 2.4% | | | | | | | | | | |
Advantage Sales & Marketing, Inc., 5.55%, (1-Month USD LIBOR + 3.25%), 07/23/21(1) | | | | | 257,023 | | | | 234,320 | |
GFL Environmental, Inc., 0.00%, 05/30/25(1)(6) | | | | | 215,000 | | | | 212,044 | |
Hoya Midco, LLC, 0.00%, 06/30/24(1)(6) | | | | | 348,021 | | | | 347,005 | |
Laureate Education, Inc., 6.03%, (3-Month USD LIBOR + 3.50%), 04/26/24(1) | | | | | 222,186 | | | | 222,908 | |
NAB Holdings, LLC, 5.39%, (3-Month USD LIBOR + 3.00%), 07/01/24(1) | | | | | 287,754 | | | | 284,757 | |
One Call Corp., 7.53%, (1-Month USD LIBOR + 5.25%), 11/27/22(1) | | | | | 114,386 | | | | 107,972 | |
Red Ventures, LLC, 0.00%, 11/08/24(1)(6) | | | | | 15,000 | | | | 15,094 | |
Red Ventures, LLC, 6.30%, (1-Month USD LIBOR + 3.75%), 11/08/24 (Mexico)(1) | | | | | 323,097 | | | | 325,117 | |
Sedgwick Claims Management Services, Inc., 8.06%, (3-Month USD LIBOR + 5.75%), 02/28/22(1) | | | | | 330,000 | | | | 330,929 | |
Spin Holdco, Inc., 5.69%, (3-Month USD LIBOR + 3.25%), 11/14/22(1) | | | | | 55,000 | | | | 55,120 | |
TKC Holdings, Inc., 6.06%, (1-Month USD LIBOR + 3.75%), 02/01/23(1) | | | | | 220,431 | | | | 220,864 | |
Total Service | | | | | | | | | 2,356,130 | |
Utilities — 1.1% | | | | | | | | | | |
APLP Holdings Limited Partnership, 5.24%, (1-Month USD LIBOR + 3.00%), 04/13/23 (Canada)(1) | | | | | 195,438 | | | | 196,074 | |
Brookfield WEC Holdings, Inc. (aka Westinghouse Electric Co. LLC), 6.05%, (1-Month USD LIBOR + 3.75%), 08/01/25(1) | | | | | 200,000 | | | | 201,514 | |
Brookfield WEC Holdings, Inc. (aka Westinghouse Electric Co. LLC), 9.05%, (1-Month USD LIBOR + 6.75%), 08/03/26(1) | | | | | 115,000 | | | | 117,099 | |
Talen Energy Supply, LLC, 6.30%, (1-Month USD LIBOR + 4.00%), 04/15/24(1) | | | | | 234,010 | | | | 234,924 | |
The accompanying notes are an integral part of these financial statements.
53
Schedule of Investments — Virtus Newfleet Multi-Sector Bond ETF (continued)
October 31, 2018
Security Description
| | | | Principal
| | Value
|
TERM LOANS (continued) | | | | | | | | | | |
Utilities (continued) | | | | | | | | | | |
Vistra Operations Company LLC (fka Tex Operations Company LLC), 4.30%, (1-Month USD LIBOR + 2.00%), 08/04/23(1) | | | | $ | 318,811 | | | $ | 318,478 | |
Total Utilities | | | | | | | | | 1,068,089 | |
Total Term Loans | | | | | | | | | | |
(Cost $18,011,295) | | | | | | | | | 17,851,930 | |
MORTGAGE BACKED SECURITIES — 11.1% | | | |
Commercial Mortgage Backed Securities — 0.4% | | | |
Caesars Palace Las Vegas Trust, Class C, Series 2017-VICI, 4.14%, 10/15/34(2) | | | | | 285,000 | | | | 284,886 | |
Sutherland Commercial Mortgage Loans, Class A, Series 2017-SBC6, 3.19%, 05/25/37(1)(2)(7)(8) | | | | | 106,882 | | | | 107,185 | |
Total Commercial Mortgage Backed Securities | | | | | | | | | 392,071 | |
Mortgage Securities — 1.1% | | | | | | | | | | |
Fannie Mae Pool, 4.00%, 09/01/47 | | | | | 1,095,918 | | | | 1,097,051 | |
Residential Mortgage Backed Securities — 9.6% | | | |
American Homes 4 Rent Trust, Class C, Series 2015-SFR2, 4.69%, 10/17/45(2) | | | | | 510,000 | | | | 521,240 | |
Ameriquest Mortgage Securities, Inc. Asset-Backed Pass-Through Certificates, Class M4, Series 2003-AR3, 3.66%, (1-Month USD LIBOR + 5.85%), 06/25/33(1) | | | | | 456,911 | | | | 453,621 | |
Banc of America Funding Trust, Class 5A1, Series 2004-D, 3.64%, 01/25/35(1)(7) | | | | | 383,710 | | | | 384,522 | |
Bayview Opportunity Master Fund IVa Trust, Class B1, Series 2016-SPL1, 4.25%, 04/28/55(2) | | | | | 350,000 | | | | 353,687 | |
Bayview Opportunity Master Fund IVb Trust, Class B1, Series 2016-SPL2, 4.25%, 06/28/53(1)(2)(7) | | | | | 290,000 | | | | 292,988 | |
Bear Stearns ARM Trust, Class 22A1, Series 2004-9, 4.73%, 11/25/34(1)(7) | | | | | 284,190 | | | | 289,253 | |
Chase Mortgage Trust, Class M2, Series 2016-1, 3.69%, 04/25/45(1)(2)(7) | | | | | 365,642 | | | | 358,569 | |
Chase Mortgage Trust, Class M2, Series 2016-2, 3.65%, 12/25/45(1)(2)(7) | | | | | 437,270 | | | | 428,158 | |
Colony Starwood Homes Trust, Class C, Series 2016-2A, 4.43%, (1-Month USD LIBOR + 2.15%), 12/17/33(1)(2) | | | | | 430,000 | | | | 431,357 | |
COLT Mortgage Loan Trust, Class A3, Series 2017-1, 3.07%, 05/27/47(1)(2)(7) | | | | | 103,376 | | | | 102,575 | |
CSMC Mortgage-Backed Trust, Class 3A1, Series 2006-8, 6.00%, 10/25/21 | | | | | 65,133 | | | | 59,196 | |
Deephaven Residential Mortgage Trust, Class A2, Series 2017-1A, 2.93%, 12/26/46(1)(2)(7) | | | | | 47,916 | | | | 47,536 | |
Deephaven Residential Mortgage Trust, Class A2, Series 2017-2A, 2.61%, 06/25/47(1)(2)(7) | | | | | 85,874 | | | | 84,575 | |
Galton Funding Mortgage Trust, Class A21, Series 2017-1, 3.50%, 07/25/56(1)(2)(7) | | | | | 237,847 | | | | 234,510 | |
Home Equity Mortgage Trust, Class M7, Series 2005-2, 3.96%, (1-Month USD LIBOR + 1.68%), 07/25/35(1) | | | | | 77,536 | | | | 77,635 | |
JPMorgan Mortgage Trust, Class A3, Series 2018-8, 4.00%, 01/25/49(1)(2)(7) | | | | | 108,491 | | | | 107,362 | |
New Residential Mortgage Loan Trust, Class A1, Series 2016-1A, 3.75%, 03/25/56(1)(2)(7) | | | | | 134,731 | | | | 134,601 | |
Security Description
| | | | Principal
| | Value
|
MORTGAGE BACKED SECURITIES (continued) | | | |
Residential Mortgage Backed Securities (continued) | | | |
New Residential Mortgage Loan Trust, Class B1A, Series 2016-4A, 4.50%, 11/25/56(1)(2)(7) | | | | $ | 607,370 | | | $ | 614,533 | |
Pretium Mortgage Credit Partners I LLC, Class A1, Series 2017-NPL5, 3.33%, 12/30/32(1)(2)(7) | | | | | 115,819 | | | | 115,288 | |
Pretium Mortgage Credit Partners I LLC, Class A1, Series 2017-NPL2, 3.25%, 03/28/57(2)(9) | | | | | 186,339 | | | | 185,499 | |
Progress Residential Trust, Class B,
Series 2017-SFR1, 3.02%, 08/17/34(2) | | | | | 275,000 | | | | 264,242 | |
Progress Residential Trust, Class B,
Series 2018-SFR1, 3.48%, 03/17/35(2) | | | | | 400,000 | | | | 392,825 | |
Resecuritization Pass-Through Trust, Class A5, Series 2005-8R, 6.00%, 10/25/34 | | | | | 94,007 | | | | 94,391 | |
Sequoia Mortgage Trust, Class B1, Series 2013-8, 3.53%, 06/25/43(1)(7) | | | | | 275,429 | | | | 267,049 | |
Structured Adjustable Rate Mortgage Loan Trust, Class 3A2, Series 2004-4, 4.38%, 04/25/34(1)(7) | | | | | 133,893 | | | | 136,261 | |
Towd Point Mortgage Trust, Class A2, Series 2014-1, 3.25%, 10/25/53(1)(2)(7) | | | | | 340,000 | | | | 335,377 | |
Towd Point Mortgage Trust, Class M1, Series 2015-6, 3.75%, 04/25/55(1)(2)(7) | | | | | 500,000 | | | | 493,054 | |
Towd Point Mortgage Trust, Class A2, Series 2015-5, 3.50%, 05/25/55(1)(2)(7) | | | | | 425,000 | | | | 419,741 | |
Towd Point Mortgage Trust, Class 1M1, Series 2015-2, 3.25%, 11/25/60(1)(2)(7) | | | | | 1,195,000 | | | | 1,149,474 | |
Towd Point Mortgage Trust 2016-4, Class A2, Series 2016-4, 3.00%, 07/25/56(1)(2)(7) | | | | | 250,000 | | | | 240,017 | |
Tricon American Homes Trust, Class A, Series 2017-SFR1, 2.72%, 09/17/34(2) | | | | | 125,000 | | | | 119,541 | |
VOLT LX LLC, Class A1, Series 2017-NPL7, 3.25%, 06/25/47(2)(9) | | | | | 161,228 | | | | 160,338 | |
VOLT LXXI LLC, Class A1A,
Series 2018-NPL7, 3.97%, 09/25/48(2)(8)(9) | | | | | 164,762 | | | | 164,920 | |
Total Residential Mortgage Backed Securities | | | | | | | | | 9,513,935 | |
Total Mortgage Backed Securities | | | | | | | | | | |
(Cost $11,087,534) | | | | | | | | | 11,003,057 | |
ASSET BACKED SECURITIES — 6.9% | | | | | | | | | | |
Aqua Finance Trust, Class A, Series 2017-A, 3.72%, 11/15/35(2) | | | | | 377,430 | | | | 368,546 | |
Arbys Funding LLC, Class A2, Series 2015-1A, 4.97%, 10/30/45(2) | | | | | 329,800 | | | | 332,027 | |
Carnow Auto Receivables Trust, Class D, Series 2016-1A, 7.34%, 11/15/21(2) | | | | | 430,000 | | | | 431,978 | |
CONSUMER INSTALLMENT LOAN TRUST, Class A, Series 2016-LD1, 3.96%, 07/15/22(2) | | | | | 9,353 | | | | 9,351 | |
CPS Auto Trust, Class D, Series 2018-C, 4.40%, 06/17/24(2) | | | | | 290,000 | | | | 291,320 | |
Drug Royalty III LP 1, Class A, Series 2016-1A, 3.98%, 04/15/27(2) | | | | | 285,405 | | | | 285,333 | |
DT Auto Owner Trust, Class C, Series 2018-1A, 3.47%, 12/15/23(2) | | | | | 375,000 | | | | 374,442 | |
Flagship Credit Auto Trust, Class D,
Series 2015-1, 5.26%, 07/15/21(2) | | | | | 435,000 | | | | 440,998 | |
Flagship Credit Auto Trust, Class D,
Series 2016-3, 3.89%, 11/15/22(2) | | | | | 525,000 | | | | 524,935 | |
The accompanying notes are an integral part of these financial statements.
54
Schedule of Investments — Virtus Newfleet Multi-Sector Bond ETF (continued)
October 31, 2018
Security Description
| | | | Principal
| | Value
|
ASSET BACKED SECURITIES (continued) | | | | | | | | | | |
Foursight Capital Automobile Receivables Trust, Class B, Series 2017-1, 3.05%, 12/15/22(2) | | | | $ | 440,000 | | | $ | 433,547 | |
GLS Auto Receivables Trust, Class B, Series 2018-1A, 3.52%, 08/15/23(2) | | | | | 470,000 | | | | 466,382 | |
GLS Auto Receivables Trust, Class C, Series 2018-3A, 4.18%, 07/15/24(2) | | | | | 335,000 | | | | 334,742 | |
Mariner Finance Issuance Trust, Class A, Series 2017-AA, 3.62%, 02/20/29(2) | | | | | 500,000 | | | | 500,014 | |
OnDeck Asset Securitization Trust LLC, Class A, Series 2018-1A, 3.50%, 04/18/22(2) | | | | | 370,000 | | | | 368,590 | |
Skopos Auto Receivables Trust, Class B, Series 2018-1A, 3.93%, 05/16/22(2) | | | | | 565,000 | | | | 562,441 | |
TCF Auto Receivables Owner Trust, Class C, Series 2016-PT1A, 3.21%, 01/17/23(2) | | | | | 430,000 | | | | 425,955 | |
TGIF Funding LLC, Class A2, Series 2017-1A, 6.20%, 04/30/47(2) | | | | | 388,000 | | | | 385,876 | |
Upstart Securitization Trust, Class B, Series 2018-1, 3.89%, 08/20/25(2) | | | | | 295,000 | | | | 293,876 | |
Total Asset Backed Securities | | | | | | | | | | |
(Cost $6,857,270) | | | | | | | | | 6,830,353 | |
U.S. TREASURY NOTES — 3.0% | | | | | | | | | | |
U.S. Treasury Note 2.00%, 02/15/25 | | | | | 565,000 | | | | 531,100 | |
U.S. Treasury Note 2.38%, 01/31/23 | | | | | 2,500,000 | | | | 2,440,967 | |
Total U.S. Treasury Notes | | | | | | | | | | |
(Cost $2,998,723) | | | | | | | | | 2,972,067 | |
Security Description
| | | | Principal
| | Value
|
TOTAL INVESTMENTS — 96.7% | | | | | | | | | | |
(Cost $98,752,060) | | | | | | | | $ | 95,740,230 | |
Other Assets in Excess of Liabilities — 3.3% | | | | | | | | | 3,219,030 | |
Net Assets — 100.0% | | | | | | | | $ | 98,959,260 | |
(1) | | Variable rate instrument. The interest rate shown reflects the rate in effect at October 31, 2018. |
(2) | | Security was purchased pursuant to Rule 144A under the Securities Act of 1933 and may not be resold subject to that rule except to qualified institutional buyers. Unless otherwise noted, 144A securities are deemed to be liquid. At October 31, 2018, the aggregate value of these securities was $42,010,717, or 42.5% of net assets. |
(3) | | Security in default, no interest payments are being received during the bankruptcy proceedings. |
(4) | | Perpetual security with no stated maturity date. |
(5) | | Payment in-kind security. 100% of the income was received in cash. |
(6) | | The loan will settle after October 31, 2018 at which the interest will be determined. |
(7) | | Adjustable rate security with an interest rate that is not based on a published reference index and spread. The rate is based on the structure of the agreement and current market conditions. |
(8) | | Security valued at fair value as determined in good faith by or under the direction of the Trustees. This security is disclosed as a Level 3 security in the Fair Value Hierarchy table located at the end of the Schedule of Investments. |
(9) | | Represents step coupon bond. Rate shown reflects the rate in effect as of October 31, 2018. |
Abbreviations:
CMT — 1 Year Constant Maturity Treasury Index
LIBOR — London InterBank Offered Rate
LP — Limited Partnership
NTNF — National Treasury Note Fixed
PLC — Public Limited Company
Currency Abbreviations
BRL — Brazilian Real
COP — Colombian Peso
IDR — Indonesian Rupiah
KZT — Kazakhstani Tenge
MXN — Mexican Peso
RUB — Russian Ruble
ZAR — South African Rand
The following table summarizes valuation of the Fund’s investments under the fair value hierarchy levels as of October 31, 2018:
| | | | Level 1
| | Level 2
| | Level 3
| | Total
|
Asset Valuation Inputs | | | | | | | | | | | | | | | | | | |
Corporate Bonds | | | | $ | — | | | $ | 35,545,917 | | | $ | — | | | $ | 35,545,917 | |
Foreign Bonds | | | | | — | | | | 21,536,906 | | | | — | | | | 21,536,906 | |
Term Loans | | | | | — | | | | 17,851,930 | | | | — | | | | 17,851,930 | |
Mortgage Backed Securities | | | | | — | | | | 10,730,952 | | | | 272,105 | | | | 11,003,057 | |
Asset Backed Securities | | | | | — | | | | 6,830,353 | | | | — | | | | 6,830,353 | |
U.S. Treasury Notes | | | | | — | | | | 2,972,067 | | | | — | | | | 2,972,067 | |
Total | | | | $ | — | | | $ | 95,468,125 | | | $ | 272,105 | | | $ | 95,740,230 | |
Some of the Fund’s investments that were categorized as Level 3 were valued utilizing third party pricing information without adjustment. Such valuations are based on unobservable inputs. A significant change in third party information could result in a significantly lower or higher value of Level 3 investments.
The accompanying notes are an integral part of these financial statements.
55
Schedule of Investments — Virtus Newfleet Multi-Sector Bond ETF (continued)
October 31, 2018
A reconciliation of assets in which Level 3 inputs are used in determining fair value is presented when there are significant Level 3 investments at the end of the reporting year. The following summarizes inputs (level 3) used as of October 31, 2018:
| | | | Mortgage Backed
Securities
|
Balance as of October 31, 2017 | | | | $ | — | |
Realized gain (loss) | | | | | — | |
Change in unrealized appreciation (depreciation) | | | | | 158 | |
Purchases | | | | | 165,000 | |
Sales | | | | | (238 | ) |
Amortization (accretion) | | | | | — | |
Transfers into Level 3 | | | | | 107,185 | |
Transfers out of Level 3 | | | | | — | |
Balance as of October 31, 2018 | | | | | 272,105 | |
Net change in unrealized appreciation (depreciation) from investments still held as of October 31, 2018 | | | | $ | 158 | |
The accompanying notes are an integral part of these financial statements.
56
Schedule of Investments — Virtus WMC Global Factor Opportunities ETF
October 31, 2018
Security Description
| | | | Shares
| | Value
|
Common Stocks — 97.6% | | | | | | | | | | |
Communication Services — 4.8% | | | | | | | | | | |
China Mobile Ltd. (China) | | | | | 2,456 | | | $ | 22,957 | |
DISH Network Corp. Class A* | | | | | 378 | | | | 11,620 | |
Facebook, Inc. Class A* | | | | | 307 | | | | 46,599 | |
Liberty Global PLC Class A
(United Kingdom)* | | | | | 798 | | | | 20,453 | |
Modern Times Group MTG AB Class B (Sweden) | | | | | 142 | | | | 5,248 | |
Nintendo Co. Ltd. (Japan) | | | | | 56 | | | | 17,450 | |
Omnicom Group, Inc. | | | | | 218 | | | | 16,202 | |
SK Telecom Co. Ltd. (South Korea) | | | | | 51 | | | | 11,994 | |
SoftBank Group Corp. (Japan) | | | | | 159 | | | | 12,750 | |
Take-Two Interactive Software, Inc.* | | | | | 114 | | | | 14,691 | |
Vodafone Group PLC (United Kingdom) | | | | | 11,346 | | | | 21,437 | |
Walt Disney Co. (The) | | | | | 321 | | | | 36,860 | |
Total Communication Services | | | | | | | | | 238,261 | |
Consumer Discretionary — 9.6% | | | | | | | | | | |
Best Buy Co., Inc. | | | | | 400 | | | | 28,064 | |
Carnival Corp. | | | | | 273 | | | | 15,299 | |
Compass Group PLC (United Kingdom) | | | | | 988 | | | | 19,448 | |
Daimler AG (Germany) | | | | | 380 | | | | 22,536 | |
Darden Restaurants, Inc. | | | | | 125 | | | | 13,319 | |
Dollar General Corp. | | | | | 220 | | | | 24,504 | |
Fiat Chrysler Automobiles NV
(United Kingdom)* | | | | | 1,121 | | | | 17,077 | |
Home Depot, Inc. (The) | | | | | 232 | | | | 40,804 | |
Kering (France) | | | | | 52 | | | | 23,182 | |
Kohl’s Corp. | | | | | 354 | | | | 26,808 | |
Lear Corp. | | | | | 181 | | | | 24,055 | |
Lululemon Athletica, Inc.* | | | | | 110 | | | | 15,480 | |
Macy’s, Inc. | | | | | 452 | | | | 15,499 | |
Michael Kors Holdings Ltd.* | | | | | 272 | | | | 15,072 | |
Mohawk Industries, Inc.* | | | | | 77 | | | | 9,604 | |
O’Reilly Automotive, Inc.* | | | | | 56 | | | | 17,962 | |
Panasonic Corp. (Japan) | | | | | 1,830 | | | | 20,265 | |
Peugeot SA (France) | | | | | 643 | | | | 15,316 | |
Renault SA (France) | | | | | 156 | | | | 11,674 | |
Ross Stores, Inc. | | | | | 210 | | | | 20,790 | |
Sony Corp. (Japan) | | | | | 355 | | | | 19,318 | |
Subaru Corp. (Japan) | | | | | 471 | | | | 12,744 | |
Takashimaya Co. Ltd. (Japan) | | | | | 943 | | | | 14,876 | |
TJX Cos., Inc. (The) | | | | | 210 | | | | 23,075 | |
Tractor Supply Co. | | | | | 153 | | | | 14,059 | |
Total Consumer Discretionary | | | | | | | | | 480,830 | |
Consumer Staples — 5.5% | | | | | | | | | | |
Aeon Co. Ltd. (Japan) | | | | | 1,044 | | | | 23,964 | |
Archer-Daniels – Midland Co. | | | | | 306 | | | | 14,458 | |
Chocoladefabriken Lindt & Spruengli AG (Switzerland) | | | | | 4 | | | | 27,603 | |
Costco Wholesale Corp. | | | | | 114 | | | | 26,064 | |
Danone SA (France) | | | | | 225 | | | | 15,948 | |
L’Oreal SA (France) | | | | | 61 | | | | 13,742 | |
Nestle SA (Switzerland) | | | | | 350 | | | | 29,581 | |
NH Foods Ltd. (Japan) | | | | | 466 | | | | 16,107 | |
Pernod Ricard SA (France) | | | | | 160 | | | | 24,429 | |
Pick n Pay Stores Ltd. (South Africa) | | | | | 3,864 | | | | 17,845 | |
SPAR Group Ltd. (The) (South Africa) | | | | | 1,336 | | | | 15,923 | |
Tesco PLC (United Kingdom) | | | | | 5,178 | | | | 14,117 | |
Security Description
| | | | Principal
| | Value
|
Common Stocks (continued) | | | | | | | | | | |
Consumer Staples (continued) | | | | | | | | | | |
Unilever NV (United Kingdom) | | | | | 342 | | | $ | 18,409 | |
Unilever PLC (United Kingdom) | | | | | 273 | | | | 14,469 | |
Total Consumer Staples | | | | | | �� | | | 272,659 | |
Energy — 7.1% | | | | | | | | | | |
Anadarko Petroleum Corp. | | | | | 229 | | | | 12,183 | |
BP PLC (United Kingdom) | | | | | 4,504 | | | | 32,660 | |
China Petroleum & Chemical Corp. Class H (China) | | | | | 23,868 | | | | 19,357 | |
CNOOC Ltd. (China) | | | | | 10,662 | | | | 18,300 | |
Eni SpA (Italy) | | | | | 859 | | | | 15,281 | |
EOG Resources, Inc. | | | | | 151 | | | | 15,906 | |
Equinor ASA (Norway) | | | | | 695 | | | | 18,080 | |
LUKOIL PJSC (Russia)(1) | | | | | 379 | | | | 28,289 | |
Marathon Petroleum Corp. | | | | | 251 | | | | 17,683 | |
OMV AG (Austria) | | | | | 255 | | | | 14,190 | |
PetroChina Co. Ltd. Class H (China) | | | | | 20,000 | | | | 14,639 | |
Petronas Dagangan Bhd (Malaysia) | | | | | 2,285 | | | | 14,198 | |
Reliance Industries Ltd. (India)(2)(3) | | | | | 522 | | | | 14,903 | |
Royal Dutch Shell PLC Class A (Netherlands) | | | | | 806 | | | | 25,761 | |
Royal Dutch Shell PLC Class B (Netherlands) | | | | | 1,093 | | | | 35,835 | |
Suncor Energy, Inc. (Canada) | | | | | 443 | | | | 14,860 | |
TOTAL SA (France) | | | | | 374 | | | | 22,011 | |
TransCanada Corp. (Canada) | | | | | 530 | | | | 19,985 | |
Total Energy | | | | | | | | | 354,121 | |
Financials — 22.0% | | | | | | | | | | |
3i Group PLC (United Kingdom) | | | | | 1,852 | | | | 20,789 | |
Affiliated Managers Group, Inc. | | | | | 115 | | | | 13,071 | |
Aflac, Inc. | | | | | 484 | | | | 20,846 | |
AIA Group Ltd. (Hong Kong) | | | | | 2,644 | | | | 20,011 | |
Allstate Corp. (The) | | | | | 204 | | | | 19,527 | |
American Express Co. | | | | | 243 | | | | 24,963 | |
Athene Holding Ltd. Class A* | | | | | 324 | | | | 14,813 | |
Australia & New Zealand Banking Group Ltd. (Australia) | | | | | 744 | | | | 13,662 | |
Aviva PLC (United Kingdom) | | | | | 4,290 | | | | 23,497 | |
AXA SA (France) | | | | | 712 | | | | 17,855 | |
Banco Bilbao Vizcaya Argentaria SA (Spain) | | | | | 2,380 | | | | 13,168 | |
Banco Santander SA (Spain) | | | | | 3,442 | | | | 16,354 | |
Bank Central Asia Tbk PT (Indonesia) | | | | | 9,795 | | | | 15,238 | |
Bank of America Corp. | | | | | 1,612 | | | | 44,330 | |
Bank of New York Mellon Corp. (The) | | | | | 394 | | | | 18,648 | |
Barclays PLC (United Kingdom) | | | | | 7,132 | | | | 15,725 | |
BlackRock, Inc. | | | | | 40 | | | | 16,457 | |
BNP Paribas SA (France) | | | | | 308 | | | | 16,093 | |
Capital One Financial Corp. | | | | | 304 | | | | 27,147 | |
Chailease Holding Co. Ltd. (Taiwan) | | | | | 4,662 | | | | 13,289 | |
Charles Schwab Corp. (The) | | | | | 484 | | | | 22,380 | |
China Life Insurance Co. Ltd. Class H (China) | | | | | 8,280 | | | | 16,493 | |
Cincinnati Financial Corp. | | | | | 280 | | | | 22,019 | |
CME Group, Inc. | | | | | 127 | | | | 23,272 | |
Commonwealth Bank of Australia (Australia) | | | | | 372 | | | | 18,237 | |
Dai-ichi Life Holdings, Inc. (Japan) | | | | | 901 | | | | 17,056 | |
Discover Financial Services | | | | | 344 | | | | 23,966 | |
E*TRADE Financial Corp. | | | | | 430 | | | | 21,251 | |
East West Bancorp, Inc. | | | | | 339 | | | | 17,777 | |
Everest Re Group Ltd. | | | | | 72 | | | | 15,686 | |
The accompanying notes are an integral part of these financial statements.
57
Schedule of Investments — Virtus WMC Global Factor Opportunities ETF (continued)
October 31, 2018
Security Description
| | | | Shares
| | Value
|
Common Stocks (continued) | | | | | | | | | | |
Financials (continued) | | | | | | | | | | |
Franklin Resources, Inc. | | | | | 468 | | | $ | 14,274 | |
Hanwha Life Insurance Co. Ltd. (South Korea) | | | | | 4,133 | | | | 16,267 | |
Hartford Financial Services Group, Inc. (The) | | | | | 460 | | | | 20,893 | |
Hong Kong Exchanges & Clearing Ltd. (Hong Kong) | | | | | 640 | | | | 16,975 | |
Intercontinental Exchange, Inc. | | | | | 205 | | | | 15,793 | |
Kinnevik AB Class B (Sweden) | | | | | 513 | | | | 14,233 | |
Lloyds Banking Group PLC (United Kingdom) | | | | | 28,800 | | | | 21,064 | |
MetLife, Inc. | | | | | 520 | | | | 21,419 | |
National Australia Bank Ltd. (Australia) | | | | | 776 | | | | 13,854 | |
NN Group NV (Netherlands) | | | | | 432 | | | | 18,593 | |
Ping An Insurance Group Co. of China Ltd. Class H (China) | | | | | 1,866 | | | | 17,573 | |
Principal Financial Group, Inc. | | | | | 348 | | | | 16,380 | |
Progressive Corp. (The) | | | | | 553 | | | | 38,544 | |
Prudential Financial, Inc. | | | | | 256 | | | | 24,008 | |
Reinsurance Group of America, Inc. | | | | | 111 | | | | 15,803 | |
Royal Bank of Canada (Canada) | | | | | 260 | | | | 18,944 | |
Samsung Fire & Marine Insurance Co. Ltd. (South Korea) | | | | | 61 | | | | 14,908 | |
Societe Generale SA (France) | | | | | 316 | | | | 11,625 | |
Sumitomo Mitsui Financial Group, Inc. (Japan) | | | | | 318 | | | | 12,440 | |
SVB Financial Group* | | | | | 52 | | | | 12,336 | |
Synchrony Financial | | | | | 644 | | | | 18,599 | |
T Rowe Price Group, Inc. | | | | | 185 | | | | 17,943 | |
TD Ameritrade Holding Corp. | | | | | 404 | | | | 20,895 | |
Torchmark Corp. | | | | | 293 | | | | 24,805 | |
Toronto-Dominion Bank (The) (Canada) | | | | | 468 | | | | 25,962 | |
Travelers Cos., Inc. (The) | | | | | 166 | | | | 20,772 | |
Voya Financial, Inc. | | | | | 348 | | | | 15,228 | |
Westpac Banking Corp. (Australia) | | | | | 764 | | | | 14,527 | |
Total Financials | | | | | | | | | 1,098,277 | |
Health Care — 8.8% | | | | | | | | | | |
Abbott Laboratories | | | | | 228 | | | | 15,718 | |
Agilent Technologies, Inc. | | | | | 231 | | | | 14,967 | |
Anthem, Inc. | | | | | 86 | | | | 23,699 | |
Cardinal Health, Inc. | | | | | 243 | | | | 12,296 | |
Centene Corp.* | | | | | 331 | | | | 43,136 | |
Cerner Corp.* | | | | | 260 | | | | 14,893 | |
Cigna Corp. | | | | | 103 | | | | 22,022 | |
CSL Ltd. (Australia) | | | | | 98 | | | | 13,047 | |
Express Scripts Holding Co.* | | | | | 318 | | | | 30,837 | |
Gilead Sciences, Inc. | | | | | 483 | | | | 32,931 | |
HCA Healthcare, Inc. | | | | | 148 | | | | 19,762 | |
Henry Schein, Inc.* | | | | | 153 | | | | 12,699 | |
Humana, Inc. | | | | | 84 | | | | 26,914 | |
IDEXX Laboratories, Inc.* | | | | | 69 | | | | 14,636 | |
Illumina, Inc.* | | | | | 76 | | | | 23,647 | |
Lonza Group AG (Switzerland)* | | | | | 76 | | | | 23,898 | |
Mettler-Toledo International, Inc.* | | | | | 27 | | | | 14,764 | |
Nektar Therapeutics* | | | | | 200 | | | | 7,736 | |
Straumann Holding AG (Switzerland) | | | | | 25 | | | | 17,066 | |
UnitedHealth Group, Inc. | | | | | 167 | | | | 43,646 | |
Veeva Systems, Inc. Class A* | | | | | 134 | | | | 12,241 | |
Total Health Care | | | | | | | | | 440,555 | |
Security Description
| | | | Principal
| | Value
|
Common Stocks (continued) | | | | | | | | | | |
Industrials — 12.6% | | | | | | | | | | |
Canadian National Railway Co. (Canada) | | | | | 296 | | | $ | 25,304 | |
Caterpillar, Inc. | | | | | 217 | | | | 26,327 | |
CH Robinson Worldwide, Inc. | | | | | 148 | | | | 13,177 | |
CNH Industrial NV (United Kingdom) | | | | | 1,132 | | | | 11,778 | |
Copart, Inc.* | | | | | 254 | | | | 12,423 | |
CoStar Group, Inc.* | | | | | 68 | | | | 24,577 | |
CSX Corp. | | | | | 343 | | | | 23,619 | |
Cummins, Inc. | | | | | 102 | | | | 13,942 | |
Daelim Industrial Co. Ltd. (South Korea) | | | | | 241 | | | | 16,073 | |
Dai Nippon Printing Co. Ltd. (Japan) | | | | | 800 | | | | 17,973 | |
Daikin Industries Ltd. (Japan) | | | | | 140 | | | | 16,285 | |
Deutsche Lufthansa AG (Germany) | | | | | 621 | | | | 12,492 | |
General Dynamics Corp. | | | | | 104 | | | | 17,948 | |
Hanwha Corp. (South Korea) | | | | | 524 | | | | 12,921 | |
IDEX Corp. | | | | | 165 | | | | 20,925 | |
IHS Markit Ltd.* | | | | | 263 | | | | 13,815 | |
Ingersoll-Rand PLC | | | | | 168 | | | | 16,118 | |
JB Hunt Transport Services, Inc. | | | | | 109 | | | | 12,057 | |
Legrand SA (France) | | | | | 195 | | | | 12,753 | |
Lockheed Martin Corp. | | | | | 87 | | | | 25,565 | |
Marubeni Corp. (Japan) | | | | | 1,900 | | | | 15,429 | |
Mitsubishi Electric Corp. (Japan) | | | | | 1,150 | | | | 14,610 | |
Old Dominion Freight Line, Inc. | | | | | 150 | | | | 19,563 | |
PACCAR, Inc. | | | | | 283 | | | | 16,190 | |
RELX PLC (United Kingdom)* | | | | | 1,188 | | | | 23,507 | |
Robert Half International, Inc. | | | | | 195 | | | | 11,803 | |
Roper Technologies, Inc. | | | | | 116 | | | | 32,816 | |
Schindler Holding AG (Switzerland) | | | | | 87 | | | | 18,071 | |
Stanley Black & Decker, Inc. | | | | | 116 | | | | 13,516 | |
Sumitomo Corp. (Japan) | | | | | 961 | | | | 14,594 | |
Taisei Corp. (Japan) | | | | | 289 | | | | 12,384 | |
Toppan Printing Co. Ltd. (Japan) | | | | | 1,100 | | | | 15,588 | |
Toshiba Corp. (Japan)* | | | | | 549 | | | | 16,446 | |
Transurban Group (Australia) | | | | | 1,944 | | | | 15,611 | |
Volvo AB Class B (Sweden) | | | | | 1,048 | | | | 15,667 | |
Wabtec Corp. | | | | | 122 | | | | 10,007 | |
Waste Management, Inc. | | | | | 181 | | | | 16,194 | |
Total Industrials | | | | | | | | | 628,068 | |
Information Technology — 18.8% | | | | | | | | | | |
Adobe, Inc.* | | | | | 273 | | | | 67,093 | |
Amphenol Corp. Class A | | | | | 164 | | | | 14,678 | |
ASML Holding NV (Netherlands) | | | | | 96 | | | | 16,410 | |
Automatic Data Processing, Inc. | | | | | 152 | | | | 21,900 | |
CA, Inc. | | | | | 532 | | | | 23,600 | |
Canon, Inc. (Japan) | | | | | 710 | | | | 20,274 | |
CDW Corp. | | | | | 169 | | | | 15,212 | |
Citrix Systems, Inc.* | | | | | 125 | | | | 12,809 | |
Cognizant Technology Solutions Corp. Class A | | | | | 227 | | | | 15,670 | |
Compal Electronics, Inc. (Taiwan) | | | | | 21,524 | | | | 11,860 | |
Corning, Inc. | | | | | 528 | | | | 16,870 | |
F5 Networks, Inc.* | | | | | 148 | | | | 25,941 | |
Fortinet, Inc.* | | | | | 196 | | | | 16,107 | |
Fujitsu Ltd. (Japan) | | | | | 200 | | | | 12,163 | |
Hewlett Packard Enterprise Co. | | | | | 1,101 | | | | 16,790 | |
Hon Hai Precision Industry Co. Ltd. (Taiwan) | | | | | 4,006 | | | | 10,202 | |
HP, Inc. | | | | | 1,601 | | | | 38,648 | |
The accompanying notes are an integral part of these financial statements.
58
Schedule of Investments — Virtus WMC Global Factor Opportunities ETF (continued)
October 31, 2018
Security Description
| | | | Shares
| | Value
|
Common Stocks (continued) | | | | | | | | | | |
Information Technology (continued) | | | | | | | | | | |
Infosys Ltd. (India)(1) | | | | | 1,558 | | | $ | 14,754 | |
Keysight Technologies, Inc.* | | | | | 215 | | | | 12,272 | |
Lam Research Corp. | | | | | 108 | | | | 15,307 | |
Mastercard, Inc. Class A | | | | | 172 | | | | 33,999 | |
Micron Technology, Inc.* | | | | | 653 | | | | 24,631 | |
Microsoft Corp. | | | | | 783 | | | | 83,632 | |
NEC Corp. (Japan) | | | | | 587 | | | | 16,855 | |
NetApp, Inc. | | | | | 326 | | | | 25,588 | |
Paychex, Inc. | | | | | 177 | | | | 11,592 | |
PayPal Holdings, Inc.* | | | | | 335 | | | | 28,204 | |
salesforce.com, Inc.* | | | | | 277 | | | | 38,016 | |
SAP SE (Germany) | | | | | 195 | | | | 20,907 | |
Seagate Technology PLC | | | | | 296 | | | | 11,908 | |
ServiceNow, Inc.* | | | | | 89 | | | | 16,113 | |
Skyworks Solutions, Inc. | | | | | 140 | | | | 12,146 | |
Synopsys, Inc.* | | | | | 263 | | | | 23,546 | |
Taiwan Semiconductor Manufacturing Co. Ltd. (Taiwan) | | | | | 3,164 | | | | 23,927 | |
TE Connectivity Ltd. | | | | | 151 | | | | 11,388 | |
Telefonaktiebolaget LM Ericsson Class B (Sweden) | | | | | 1,712 | | | | 14,925 | |
Texas Instruments, Inc. | | | | | 217 | | | | 20,144 | |
Visa, Inc. Class A | | | | | 428 | | | | 59,000 | |
Western Digital Corp. | | | | | 273 | | | | 11,758 | |
Wirecard AG (Germany) | | | | | 117 | | | | 21,919 | |
Worldpay, Inc. Class A* | | | | | 191 | | | | 17,541 | |
WPG Holdings Ltd. (Taiwan) | | | | | 12,541 | | | | 14,895 | |
Total Information Technology | | | | | | | | | 941,194 | |
Materials — 4.0% | | | | | | | | | | |
Air Liquide SA (France) | | | | | 104 | | | | 12,604 | |
Air Products & Chemicals, Inc. | | | | | 124 | | | | 19,139 | |
Albemarle Corp. | | | | | 134 | | | | 13,296 | |
ArcelorMittal (Luxembourg) | | | | | 794 | | | | 19,821 | |
BHP Billiton Ltd. (Australia) | | | | | 927 | | | | 21,144 | |
Covestro AG (Germany)(2) | | | | | 204 | | | | 13,198 | |
Empresas CMPC SA (Chile) | | | | | 4,318 | | | | 14,782 | |
Glencore PLC (Switzerland)* | | | | | 6,269 | | | | 25,550 | |
Jiangxi Copper Co. Ltd. Class H (China) | | | | | 11,921 | | | | 13,134 | |
LyondellBasell Industries NV Class A | | | | | 202 | | | | 18,033 | |
Mosaic Co. (The) | | | | | 418 | | | | 12,933 | |
Vale SA (Brazil) | | | | | 951 | | | | 14,492 | |
Total Materials | | | | | | | | | 198,126 | |
Real Estate — 2.6% | | | | | | | | | | |
Ascendas Real Estate Investment Trust (Singapore) | | | | | 14,000 | | �� | | 25,470 | |
Link REIT (Hong Kong) | | | | | 2,688 | | | | 23,823 | |
Public Storage | | | | | 102 | | | | 20,958 | |
Redefine Properties Ltd. (South Africa) | | | | | 23,507 | | | | 15,281 | |
Swiss Prime Site AG (Switzerland)* | | | | | 272 | | | | 22,091 | |
Vonovia SE (Germany) | | | | | 513 | | | | 23,486 | |
Total Real Estate | | | | | | | | | 131,109 | |
Security Description
| | | | Principal
| | Value
|
Common Stocks (continued) | | | | | | | | | | |
Utilities — 1.8% | | | | | | | | | | |
Chubu Electric Power Co., Inc. (Japan) | | | | | 1,314 | | | $ | 18,964 | |
Fortis, Inc./Canada (Canada) | | | | | 944 | | | | 31,193 | |
NextEra Energy, Inc. | | | | | 141 | | | | 24,322 | |
Xcel Energy, Inc. | | | | | 359 | | | | 17,595 | |
Total Utilities | | | | | | | | | 92,074 | |
Total Common Stocks | | | | | | | | | | |
(Cost $5,068,777) | | | | | | | | | 4,875,274 | |
PREFERRED STOCKS — 1.9% | | | | | | | | | | |
Consumer Discretionary — 0.5% | | | | | | | | | | |
Volkswagen AG, 2.57% (Germany) | | | | | 135 | | | | 22,747 | |
Consumer Staples — 0.3% | | | | | | | | | | |
Henkel AG & Co. KGaA, 1.84% (Germany) | | | | | 138 | | | | 15,096 | |
Energy — 0.3% | | | | | | | | | | |
Petroleo Brasileiro SA, 0.37% (Brazil) | | | | | 2,388 | | | | 17,723 | |
Financials — 0.8% | | | | | | | | | | |
Banco Bradesco SA, 3.21% (Brazil) | | | | | 2,300 | | | | 21,198 | |
Itau Unibanco Holding SA, 6.61% (Brazil) | | | | | 1,372 | | | | 18,157 | |
Total Financials | | | | | | | | | 39,355 | |
Total Preferred Stocks | | | | | | | | | | |
(Cost $95,847) | | | | | | | | | 94,921 | |
Right — 0.0%(4) | | | | | | | | | | |
Financials — 0.0%(4) | | | | | | | | | | |
Banco Santander SA (Spain), expiring 11/6/2018*
(Cost $138) | | | | | 3,442 | | | | 134 | |
TOTAL INVESTMENTS — 99.5% | | | | | | | | | | |
(Cost $5,164,762) | | | | | | | | | 4,970,329 | |
Other Assets in Excess of Liabilities — 0.5% | | | | | | | | | 24,466 | |
Net Assets — 100.0% | | | | | | | | $ | 4,994,795 | |
* | | Non-income producing security. |
(1) | | American Depositary Receipts. |
(2) | | Security was purchased pursuant to Rule 144A under the Securities Act of 1933 and may not be resold subject to that rule except to qualified institutional buyers. Unless otherwise noted, 144A securities are deemed to be liquid. At October 31, 2018, the aggregate value of these securities was $28,101, or 0.6% of net assets. |
(3) | | Global Depositary Receipts. |
(4) | | Amount rounds to less than 0.05%. |
The accompanying notes are an integral part of these financial statements.
59
Schedule of Investments — Virtus WMC Global Factor Opportunities ETF (continued)
October 31, 2018
The following table summarizes valuation of the Fund’s investments under the fair value hierarchy levels as of October 31, 2018:
| | | | Level 1
| | Level 2
| | Level 3
| | Total
|
Asset Valuation Inputs | | | | | | | | | | | | | | | | | | |
Common Stocks | | | | $ | 4,875,274 | | | $ | — | | | $ | — | | | $ | 4,875,274 | |
Preferred Stocks | | | | | 94,921 | | | | — | | | | — | | | | 94,921 | |
Right | | | | | 134 | | | | — | | | | — | | | | 134 | |
Total | | | | $ | 4,970,329 | | | $ | — | | | $ | — | | | $ | 4,970,329 | |
There were no Level 3 securities as of October 31, 2018.
The accompanying notes are an integral part of these financial statements.
60
Statements of Assets and Liabilities
October 31, 2018
| | | | InfraCap REIT
Preferred ETF
| | Virtus
Cumberland
Municipal
Bond ETF
| | Virtus
Glovista
Emerging
Markets ETF
| | Virtus
InfraCap U.S.
Preferred
Stock ETF
| | Virtus
LifeSci Biotech
Clinical
Trials ETF
|
Assets: | | | | | | | | | | | | | | | | | | | | | | |
Investments, at cost | | | | $ | 23,212,307 | | | $ | 10,945,168 | | | $ | 13,708,423 | | | $ | 7,872,019 | | | $ | 52,006,064 | |
Investments, at value (including securities on loan)(a) | | | | | 22,086,321 | | | | 10,781,285 | | | | 12,454,859 | | | | 7,654,984 | | | | 38,980,906 | |
Cash | | | | | 390,030 | | | | 114,950 | | | | 381,101 | | | | 273,649 | | | | 1,056,897 | |
Due from brokers | | | | | — | | | | — | | | | — | | | | 150,219 | | | | — | |
Foreign currency(b) | | | | | — | | | | — | | | | 7,625 | | | | — | | | | — | |
Receivables: | | | | | | | | | | | | | | | | | | | | | | |
Dividends and interest | | | | | 328 | | | | 152,783 | | | | 9,035 | | | | 10,583 | | | | 631 | |
Due from Adviser | | | | | — | | | | 9,641 | | | | — | | | | — | | | | — | |
Securities lending | | | | | — | | | | — | | | | — | | | | — | | | | 7,684 | |
Tax reclaim | | | | | — | | | | — | | | | 5,096 | | | | — | | | | — | |
Investment securities sold | | | | | — | | | | — | | | | 1,816,224 | | | | — | | | | — | |
Prepaid expenses | | | | | — | | | | — | | | | 85 | | | | — | | | | 56 | |
Total Assets | | | | | 22,476,679 | | | | 11,058,659 | | | | 14,674,025 | | | | 8,089,435 | | | | 40,046,174 | |
Liabilities: | | | | | | | | | | | | | | | | | | | | | | |
Borrowings | | | | | — | | | | — | | | | — | | | | 1,878,897 | | | | — | |
Payables: | | | | | | | | | | | | | | | | | | | | | | |
Investment securities purchased | | | | | — | | | | — | | | | 1,769,299 | | | | — | | | | — | |
Collateral for securities on loan | | | | | — | | | | — | | | | — | | | | — | | | | 3,750,281 | |
Deferred foreign tax payable | | | | | — | | | | — | | | | 4,301 | | | | — | | | | — | |
Advisory fees | | | | | 8,208 | | | | — | | | | 8,088 | | | | 4,550 | | | | 26,749 | |
Professional fees | | | | | — | | | | 35,987 | | | | — | | | | — | | | | — | |
Trustee fees | | | | | — | | | | 37 | | | | — | | | | — | | | | — | |
Written options, at value(c) | | | | | — | | | | — | | | | — | | | | 10,365 | | | | — | |
Securities sold short, at value(d) | | | | | — | | | | — | | | | — | | | | 78,110 | | | | — | |
Other accrued expenses | | | | | — | | | | 12,858 | | | | 79 | | | | — | | | | — | |
Total Liabilities | | | | | 8,208 | | | | 48,882 | | | | 1,781,767 | | | | 1,971,922 | | | | 3,777,030 | |
Net Assets | | | | $ | 22,468,471 | | | $ | 11,009,777 | | | $ | 12,892,258 | | | $ | 6,117,513 | | | $ | 36,269,144 | |
Net Assets Consist of: | | | | | | | | | | | | | | | | | | | | | | |
Paid-in capital | | | | $ | 24,141,980 | | | $ | 11,071,947 | | | $ | 16,757,833 | | | $ | 6,309,977 | | | $ | 68,361,792 | |
Total distributable earnings (accumulated deficit) | | | | | (1,673,509 | ) | | | (62,170 | ) | | | (3,865,575 | )(e) | | | (192,464 | ) | | | (32,092,648 | ) |
Net Assets | | | | $ | 22,468,471 | | | $ | 11,009,777 | | | $ | 12,892,258 | | | $ | 6,117,513 | | | $ | 36,269,144 | |
Shares outstanding (unlimited number of shares of beneficial interest authorized, no par value) | | | | | 950,004 | | | | 450,004 | | | | 600,004 | | | | 250,004 | | | | 1,350,004 | |
Net asset value per share | | | | $ | 23.65 | | | $ | 24.47 | | | $ | 21.49 | | | $ | 24.47 | | | $ | 26.87 | |
(a) Market value of securities on loan | | | | $ | — | | | $ | — | | | $ | — | | | $ | — | | | $ | 10,360,445 | |
(b) Foreign currency, at cost | | | | $ | — | | | $ | — | | | $ | 7,626 | | | $ | — | | | $ | — | |
(c) Premiums received from written options | | | | $ | — | | | $ | — | | | $ | — | | | $ | 10,223 | | | $ | — | |
(d) Proceeds received from securities sold short | | | | $ | — | | | $ | — | | | $ | — | | | $ | 76,100 | | | $ | — | |
(e) Net of foreign taxes of $(4,301) | | | | | | | | | | | | | | | | | | | | | | |
The accompanying notes are an integral part of these financial statements.
61
Statements of Assets and Liabilities (continued)
October 31, 2018
| | | | Virtus
LifeSci Biotech
Products ETF
| | Virtus
Newfleet
Multi-Sector
Bond ETF
| | Virtus
WMC Global
Factor
Opportunities ETF
|
Assets: | | | | | | | | | | | | | | |
Investments, at cost | | | | $ | 35,057,789 | | | $ | 98,752,060 | | | $ | 5,164,762 | |
Investments, at value (including securities on loan)(a) | | | | | 29,866,842 | | | | 95,740,230 | | | | 4,970,329 | |
Cash | | | | | 436,874 | | | | — | | | | 19,725 | |
Foreign currency(b) | | | | | — | | | | 1 | | | | 1,515 | |
Receivables: | | | | | | | | | | | | | | |
Securities lending | | | | | 1,858 | | | | — | | | | — | |
Dividends and interest | | | | | 267 | | | | 928,204 | | | | 5,575 | |
Tax reclaim | | | | | — | | | | 2,318 | | | | 1,224 | |
Investment securities sold | | | | | — | | | | 3,996,744 | | | | 443 | |
Prepaid expenses | | | | | 56 | | | | 3,063 | | | | — | |
Total Assets | | | | | 30,305,897 | | | | 100,670,560 | | | | 4,998,811 | |
Liabilities: | | | | | | | | | | | | | | |
Due to custodian | | | | | — | | | | 259,624 | | | | — | |
Payables: | | | | | | | | | | | | | | |
Investment securities purchased | | | | | — | | | | 1,359,341 | | | | 442 | |
Collateral for securities on loan | | | | | 3,038,226 | | | | — | | | | — | |
Advisory fees | | | | | 20,126 | | | | 11,240 | | | | 3,574 | |
Professional fees | | | | | — | | | | 35,547 | | | | — | |
Trustee fees | | | | | — | | | | 934 | | | | — | |
Other accrued expenses | | | | | — | | | | 44,614 | | | | — | |
Total Liabilities | | | | | 3,058,352 | | | | 1,711,300 | | | | 4,016 | |
Net Assets | | | | $ | 27,247,545 | | | $ | 98,959,260 | | | $ | 4,994,795 | |
Net Assets Consist of: | | | | | | | | | | | | | | |
Paid-in capital | | | | $ | 37,911,273 | | | $ | 103,909,776 | | | $ | 5,000,100 | |
Total distributable earnings (accumulated deficit) | | | | | (10,663,728 | ) | | | (4,950,516 | ) | | | (5,305 | ) |
Net Assets | | | | $ | 27,247,545 | | | $ | 98,959,260 | | | $ | 4,994,795 | |
Shares outstanding (unlimited number of shares of beneficial interest authorized, no par value) | | | | | 750,004 | | | | 4,150,004 | | | | 200,004 | |
Net asset value per share | | | | $ | 36.33 | | | $ | 23.85 | | | $ | 24.97 | |
(a) Market value of securities on loan | | | | $ | 7,867,787 | | | $ | — | | | $ | — | |
(b) Foreign currency, at cost | | | | $ | — | | | $ | 1 | | | $ | 1,521 | |
The accompanying notes are an integral part of these financial statements.
62
Statements of Operations
For the Year Ended October 31, 2018
| | | | InfraCap REIT
Preferred ETF
| | Virtus
Cumberland
Municipal
Bond ETF
| | Virtus
Glovista
Emerging
Markets ETF1
| | Virtus
InfraCap
U.S. Preferred
Stock ETF2
| | Virtus
LifeSci Biotech
Clinical
Trials ETF
|
Investment Income: | | | | | | | | | | | | | | | | | | | | | | |
Dividend income (net of foreign withholding taxes) | | | | $ | 1,208,319 | | | $ | 2,209 | | | $ | 566,484 | | | $ | 143,047 | | | $ | 2,707 | |
Interest income | | | | | — | | | | 390,249 | | | | 972 | | | | 285 | | | | — | |
Securities lending, net of fees | | | | | — | | | | — | | | | — | | | | — | | | | 183,849 | |
Total Investment Income | | | | | 1,208,319 | | | | 392,458 | | | | 567,456 | | | | 143,332 | | | | 186,556 | |
Expenses: | | | | | | | | | | | | | | | | | | | | | | |
Dividend and interest expenses | | | | | — | | | | — | | | | — | | | | 22,876 | | | | — | |
Advisory fees | | | | | 101,108 | | | | 35,037 | | | | 135,609 | | | | 13,720 | | | | 433,027 | |
Tax expense | | | | | 43 | | | | — | | | | — | | | | — | | | | 57 | |
Custody fees | | | | | — | | | | 533 | | | | — | | | | — | | | | — | |
Sub-Advisory fees | | | | | — | | | | 35,037 | | | | — | | | | — | | | | — | |
Exchange listing fees | | | | | — | | | | 11,129 | | | | — | | | | — | | | | — | |
Professional fees | | | | | — | | | | 43,835 | | | | — | | | | — | | | | — | |
Insurance fees | | | | | — | | | | 4,978 | | | | — | | | | — | | | | — | |
Accounting and administration fees | | | | | — | | | | 4,496 | | | | — | | | | — | | | | — | |
Transfer agent fees | | | | | — | | | | 4,882 | | | | — | | | | — | | | | — | |
Trustee fees | | | | | — | | | | 9,413 | | | | — | | | | — | | | | — | |
Report to shareholders fees | | | | | — | | | | 6,745 | | | | — | | | | — | | | | — | |
Offering costs | | | | | — | | | | 1,674 | | | | — | | | | — | | | | — | |
Pricing fees | | | | | — | | | | 21,988 | | | | — | | | | — | | | | — | |
Other expenses | | | | | — | | | | 2,221 | | | | — | | | | — | | | | — | |
Total Expenses | | | | | 101,151 | | | | 181,968 | | | | 135,609 | | | | 36,596 | | | | 433,084 | |
Less expense waivers/reimbursements | | | | | — | | | | (97,593 | ) | | | (5,983 | ) | | | — | | | | — | |
Net Expenses | | | | | 101,151 | | | | 84,375 | | | | 129,626 | | | | 36,596 | | | | 433,084 | |
Net Investment Income (Loss) | | | | | 1,107,168 | | | | 308,083 | | | | 437,830 | | | | 106,736 | | | | (246,528 | ) |
Net Realized Gain (Loss) on: | | | | | | | | | | | | | | | | | | | | | | |
Investments | | | | | (489,779 | ) | | | 72,226 | | | | (3,265,433 | )3 | | | 21,819 | | | | (5,791,722 | ) |
Written options | | | | | — | | | | — | | | | — | | | | 31,996 | | | | — | |
In-kind transactions | | | | | — | | | | — | | | | (33,532 | ) | | | — | | | | 20,605,093 | |
Securities sold short | | | | | — | | | | — | | | | — | | | | (825 | ) | | | — | |
Foreign currency transactions | | | | | — | | | | — | | | | 12,999 | | | | — | | | | — | |
Total Net Realized Gain (Loss) | | | | | (489,779 | ) | | | 72,226 | | | | (3,285,966 | ) | | | 52,990 | | | | 14,813,371 | |
Change in Net Unrealized Appreciation (Depreciation) on: | | | | | | | | | | | | | | | | | | | | | | |
Investments | | | | | (1,208,236 | ) | | | (494,957 | ) | | | (1,257,865 | )4 | | | (217,035 | ) | | | (17,174,895 | ) |
Written options | | | | | — | | | | — | | | | — | | | | (142 | ) | | | — | |
Securities sold short | | | | | — | | | | — | | | | — | | | | (2,010 | ) | | | — | |
Foreign currency translations | | | | | — | | | | — | | | | (910 | ) | | | — | | | | — | |
Total Change in Net Unrealized Depreciation | | | | | (1,208,236 | ) | | | (494,957 | ) | | | (1,258,775 | ) | | | (219,187 | ) | | | (17,174,895 | ) |
Net Realized and Change in Unrealized Gain (Loss) | | | | | (1,698,015 | ) | | | (422,731 | ) | | | (4,544,741 | ) | | | (166,197 | ) | | | (2,361,524 | ) |
Net Decrease in Net Assets Resulting from Operations | | | | $ | (590,847 | ) | | $ | (114,648 | ) | | $ | (4,106,911 | ) | | $ | (59,461 | ) | | $ | (2,608,052 | ) |
Foreign withholding taxes | | | | $ | — | | | $ | — | | | $ | 83,243 | | | $ | — | | | $ | — | |
1 | | From November 7, 2017 (commencement of operations) through October 31, 2018. |
2 | | From May 15, 2018 (commencement of operations) through October 31, 2018. |
3 | | Net of foreign taxes of $(10,951). |
4 | | Net of change in deferred taxes of $(4,301). |
The accompanying notes are an integral part of these financial statements.
63
Statements of Operations (continued)
For the Year Ended October 31, 2018
| | | | Virtus
LifeSci Biotech
Products ETF
| | Virtus
Newfleet
Multi-Sector
Bond ETF
| | Virtus
WMC Global
Factor
Opportunities ETF
|
Investment Income: | | | | | | | | | | | | | | |
Dividend income (net of foreign withholding taxes) | | | | $ | 54,614 | | | $ | 62,754 | | | $ | 125,174 | |
Interest income | | | | | — | | | | 7,214,159 | | | | 202 | |
Securities lending, net of fees | | | | | 50,167 | | | | — | | | | — | |
Total Investment Income | | | | | 104,781 | | | | 7,276,913 | | | | 125,376 | |
Expenses: | | | | | | | | | | | | | | |
Advisory fees | | | | | 275,349 | | | | 959,722 | | | | 25,909 | |
Tax expense | | | | | 57 | | | | — | | | | 30 | |
Custody fees | | | | | — | | | | 8,352 | | | | — | |
Exchange listing fees | | | | | — | | | | 10,000 | | | | — | |
Professional fees | | | | | — | | | | 44,428 | | | | — | |
Insurance fees | | | | | — | | | | 12,222 | | | | — | |
Accounting and administration fees | | | | | — | | | | 39,731 | | | | — | |
Transfer agent fees | | | | | — | | | | 25,725 | | | | — | |
Trustee fees | | | | | — | | | | 10,310 | | | | — | |
Report to shareholders fees | | | | | — | | | | 9,500 | | | | — | |
Pricing fees | | | | | — | | | | 56,620 | | | | — | |
Other expenses | | | | | — | | | | 1,555 | | | | — | |
Total Expenses | | | | | 275,406 | | | | 1,178,165 | | | | 25,939 | |
Less expense waivers/reimbursements | | | | | — | | | | (81,340 | ) | | | — | |
Net Expenses | | | | | 275,406 | | | | 1,096,825 | | | | 25,939 | |
Net Investment Income (Loss) | | | | | (170,625 | ) | | | 6,180,088 | | | | 99,437 | |
Net Realized Gain (Loss) on: | | | | | | | | | | | | | | |
Investments | | | | | (1,344,866 | ) | | | (2,006,670 | ) | | | 109,092 | |
In-kind transactions | | | | | 9,247,570 | | | | — | | | | — | |
Foreign currency transactions | | | | | — | | | | (9,499 | ) | | | (53 | ) |
Total Net Realized Gain (Loss) | | | | | 7,902,704 | | | | (2,016,169 | ) | | | 109,039 | |
Change in Net Unrealized Appreciation (Depreciation) on: | | | | | | | | | | | | | | |
Investments | | | | | (9,085,959 | ) | | | (6,416,850 | ) | | | (213,334 | ) |
Foreign currency translations | | | | | — | | | | 55 | | | | (73 | ) |
Total Change in Net Unrealized Depreciation | | | | | (9,085,959 | ) | | | (6,416,795 | ) | | | (213,407 | ) |
Net Realized and Change in Unrealized Gain (Loss) | | | | | (1,183,255 | ) | | | (8,432,964 | ) | | | (104,368 | ) |
Net Decrease in Net Assets Resulting from Operations | | | | $ | (1,353,880 | ) | | $ | (2,252,876 | ) | | $ | (4,931 | ) |
Foreign withholding taxes | | | | $ | — | | | $ | 5,254 | | | $ | 9,692 | |
The accompanying notes are an integral part of these financial statements.
64
Statements of Changes in Net Assets
| | | | InfraCap REIT
Preferred ETF
| | Virtus Cumberland
Municipal Bond ETF
|
| | | | For the
Year Ended
October 31, 2018
| | For the Period
February 7, 20171
Through
October 31, 2017
| | For the
Year Ended
October 31, 2018
| | For the Period
January 17, 20171
Through
October 31, 2017
|
Increase (Decrease) in Net Assets Resulting from Operations: | | | | | | | | | | | | | | | | | | |
Net investment income | | | | $ | 1,107,168 | | | $ | 506,827 | | | $ | 308,083 | | | $ | 378,358 | |
Net realized gain (loss) on investments, written options and securities sold short | | | | | (489,779 | ) | | | 10,405 | | | | 72,226 | | | | 223,262 | |
Net change in unrealized appreciation (depreciation) on investments, written options and securities sold short | | | | | (1,208,236 | ) | | | 82,250 | | | | (494,957 | ) | | | 331,074 | |
Net increase (decrease) in net assets resulting from operations | | | | | (590,847 | ) | | | 599,482 | | | | (114,648 | ) | | | 932,694 | |
Distributions to Shareholders2 | | | | | (1,137,316 | ) | | | (554,337 | ) | | | (561,410 | ) | | | (318,806 | ) |
Distributions to Shareholders from return of capital | | | | | (218,190 | ) | | | — | | | | — | | | | — | |
Total distributions | | | | | (1,355,506 | ) | | | (554,337 | ) | | | (561,410 | ) | | | (318,806 | ) |
Shareholder Transactions: | | | | | | | | | | | | | | | | | | |
Proceeds from shares sold | | | | | 3,805,481 | | | | 20,564,198 | | | | 1,299,481 | | | | 24,998,500 | |
Cost of shares redeemed | | | | | — | | | | — | | | | (6,275,291 | ) | | | (8,950,743 | ) |
Net increase (decrease) in net assets resulting from shareholder transactions | | | | | 3,805,481 | | | | 20,564,198 | | | | (4,975,810 | ) | | | 16,047,757 | |
Increase (decrease) in net assets | | | | | 1,859,128 | | | | 20,609,343 | | | | (5,651,868 | ) | | | 16,661,645 | |
Net Assets: | | | | | | | | | | | | | | | | | | |
Beginning of period/year | | | | | 20,609,343 | | | | — | | | | 16,661,645 | | | | — | |
End of period/year2 | | | | $ | 22,468,471 | | | $ | 20,609,343 | | | $ | 11,009,777 | | | $ | 16,661,645 | |
Changes in Shares Outstanding: | | | | | | | | | | | | | | | | | | |
Shares outstanding, beginning of period/year | | | | | 800,004 | | | | — | | | | 650,004 | | | | — | |
Shares sold | | | | | 150,000 | | | | 800,004 | | | | 50,000 | | | | 1,000,004 | |
Shares redeemed | | | | | — | | | | — | | | | (250,000 | ) | | | (350,000 | ) |
Shares outstanding, end of period/year | | | | | 950,004 | | | | 800,004 | | | | 450,004 | | | | 650,004 | |
1 | | Commencement of operations. |
The accompanying notes are an integral part of these financial statements.
65
Statements of Changes in Net Assets (continued)
| | | | Virtus Glovista
Emerging
Markets ETF
| | Virtus InfraCap
U.S. Preferred
Stock ETF
|
| | | | For the Period
November 7, 20171
Through
October 31, 2018
| | For the Period
May 15, 20181
Through
October 31, 2018
|
Increase (Decrease) in Net Assets Resulting from Operations: | | | | | | | | | | |
Net investment income | | | | $ | 437,830 | | | $ | 106,736 | |
Net realized gain (loss) on investments, written options and securities sold short | | | | | (3,285,966 | ) | | | 52,990 | |
Net change in unrealized depreciation on investments, written options and securities sold short | | | | | (1,258,775 | ) | | | (219,187 | ) |
Net decrease in net assets resulting from operations | | | | | (4,106,911 | ) | | | (59,461 | ) |
Distributions to Shareholders2 | | | | | (51,696 | ) | | | (133,003 | ) |
Shareholder Transactions: | | | | | | | | | | |
Proceeds from shares sold | | | | | 28,302,634 | | | | 6,309,977 | |
Cost of shares redeemed | | | | | (11,251,769 | ) | | | — | |
Net increase in net assets resulting from shareholder transactions | | | | | 17,050,865 | | | | 6,309,977 | |
Increase in net assets | | | | | 12,892,258 | | | | 6,117,513 | |
Net Assets: | | | | | | | | | | |
Beginning of period/year | | | | | — | | | | — | |
End of period/year2 | | | | $ | 12,892,258 | | | $ | 6,117,513 | |
Changes in Shares Outstanding: | | | | | | | | | | |
Shares outstanding, beginning of period/year | | | | | — | | | | — | |
Shares sold | | | | | 1,100,004 | | | | 250,004 | |
Shares redeemed | | | | | (500,000 | ) | | | — | |
Shares outstanding, end of period/year | | | | | 600,004 | | | | 250,004 | |
1 | | Commencement of operations. |
The accompanying notes are an integral part of these financial statements.
66
Statements of Changes in Net Assets (continued)
| | | | Virtus
LifeSci Biotech
Clinical Trials ETF
| | Virtus
LifeSci Biotech
Products ETF
|
| | | | For the
Year Ended
October 31, 2018
| | For the
Year Ended
October 31, 2017
| | For the
Year Ended
October 31, 2018
| | For the
Year Ended
October 31, 2017
|
Increase (Decrease) in Net Assets Resulting from Operations: | | | | | | | | | | | | | | | | | | |
Net investment income (loss) | | | | $ | (246,528 | ) | | $ | (125,271 | ) | | $ | (170,625 | ) | | $ | 68,690 | |
Net realized gain (loss) on investments, written options and securities sold short | | | | | 14,813,371 | | | | (3,329,315 | ) | | | 7,902,704 | | | | 1,814,779 | |
Net change in unrealized appreciation (depreciation) on investments, written options and securities sold short | | | | | (17,174,895 | ) | | | 12,951,955 | | | | (9,085,959 | ) | | | 7,433,275 | |
Net increase (decrease) in net assets resulting from operations | | | | | (2,608,052 | ) | | | 9,497,369 | | | | (1,353,880 | ) | | | 9,316,744 | |
Distributions to Shareholders1 | | | | | (326,965 | ) | | | — | | | | (68,685 | ) | | | — | |
Shareholder Transactions: | | | | | | | | | | | | | | | | | | |
Proceeds from shares sold | | | | | 72,952,271 | | | | 14,913,738 | | | | 14,861,049 | | | | 15,741,453 | |
Cost of shares redeemed | | | | | (64,249,191 | ) | | | (11,955,467 | ) | | | (23,567,951 | ) | | | (10,811,233 | ) |
Net increase (decrease) in net assets resulting from shareholder transactions | | | | | 8,703,080 | | | | 2,958,271 | | | | (8,706,902 | ) | | | 4,930,220 | |
Increase (decrease) in net assets | | | | | 5,768,063 | | | | 12,455,640 | | | | (10,129,467 | ) | | | 14,246,964 | |
Net Assets: | | | | | | | | | | | | | | | | | | |
Beginning of period/year | | | | | 30,501,081 | | | | 18,045,441 | | | | 37,377,012 | | | | 23,130,048 | |
End of period/year1 | | | | $ | 36,269,144 | | | $ | 30,501,081 | | | $ | 27,247,545 | | | $ | 37,377,012 | |
Changes in Shares Outstanding: | | | | | | | | | | | | | | | | | | |
Shares outstanding, beginning of period/year | | | | | 1,100,004 | | | | 1,000,004 | | | | 950,004 | | | | 800,004 | |
Shares sold | | | | | 2,200,000 | | | | 650,000 | | | | 350,000 | | | | 450,000 | |
Shares redeemed | | | | | (1,950,000 | ) | | | (550,000 | ) | | | (550,000 | ) | | | (300,000 | ) |
Shares outstanding, end of period/year | | | | | 1,350,004 | | | | 1,100,004 | | | | 750,004 | | | | 950,004 | |
The accompanying notes are an integral part of these financial statements.
67
Statements of Changes in Net Assets (continued)
| | | | Virtus Newfleet
Multi-Sector Bond ETF
| | Virtus WMC
Global Factor
Opportunities ETF
|
| | | | For the
Year Ended
October 31, 2018
| | For the
Year Ended
October 31, 2017
| | For the
Year Ended
October 31, 2018
| | For the Period
October 10, 20171
Through
October 31, 2017
|
Increase (Decrease) in Net Assets Resulting from Operations: | | | | | | | | | | | | | | | | | | |
Net investment income | | | | $ | 6,180,088 | | | $ | 7,948,778 | | | $ | 99,437 | | | $ | 2,084 | |
Net realized gain (loss) on investments, written options and securities sold short | | | | | (2,016,169 | ) | | | 2,853,526 | | | | 109,039 | | | | (1,957 | ) |
Net change in unrealized appreciation (depreciation) on investments, written options and securities sold short | | | | | (6,416,795 | ) | | | (734,753 | ) | | | (213,407 | ) | | | 18,907 | |
Net increase (decrease) in net assets resulting from operations | | | | | (2,252,876 | ) | | | 10,067,551 | | | | (4,931 | ) | | | 19,034 | |
Distributions to Shareholders2 | | | | | (9,169,422 | ) | | | (10,570,087 | ) | | | (19,408 | ) | | | — | |
Shareholder Transactions: | | | | | | | | | | | | | | | | | | |
Proceeds from shares sold | | | | | 10,021,681 | | | | 48,492,343 | | | | — | | | | 5,000,100 | |
Cost of shares redeemed | | | | | (68,923,686 | ) | | | (46,179,993 | ) | | | — | | | | — | |
Net increase (decrease) in net assets resulting from shareholder transactions | | | | | (58,902,005 | ) | | | 2,312,350 | | | | — | | | | 5,000,100 | |
Increase (decrease) in net assets | | | | | (70,324,303 | ) | | | 1,809,814 | | | | (24,339 | ) | | | 5,019,134 | |
Net Assets: | | | | | | | | | | | | | | | | | | |
Beginning of period/year | | | | | 169,283,563 | | | | 167,473,749 | | | | 5,019,134 | | | | — | |
End of period/year2 | | | | $ | 98,959,260 | | | $ | 169,283,563 | | | $ | 4,994,795 | | | $ | 5,019,134 | |
Changes in Shares Outstanding: | | | | | | | | | | | | | | | | | | |
Shares outstanding, beginning of period/year | | | | | 6,550,004 | | | | 6,450,004 | | | | 200,004 | | | | — | |
Shares sold | | | | | 400,000 | | | | 1,900,000 | | | | — | | | | 200,004 | |
Shares redeemed | | | | | (2,800,000 | ) | | | (1,800,000 | ) | | | — | | | | — | |
Shares outstanding, end of period/year | | | | | 4,150,004 | | | | 6,550,004 | | | | 200,004 | | | | 200,004 | |
1 | | Commencement of operations. |
The accompanying notes are an integral part of these financial statements.
68
Statement of Cash Flows
For the period ended October 31, 2018
| | | | Virtus
InfraCap
U.S. Preferred
Stock ETF
|
Cash Flows From Operating Activities:
| | | | |
Net decrease in net assets from operations | | | | $ | (59,461 | ) |
Adjustments to reconcile net decrease in net assets from operations to net cash used in operating activities: | | | | | | |
Purchases of investment securities | | | | | (2,107,052 | ) |
Proceeds from sales of investment securities | | | | | 1,556,418 | |
Net proceeds from purchased and written options | | | | | 45,726 | |
Net proceeds from securities sold short | | | | | 1,086,954 | |
Payments made to cover securities sold short | | | | | (1,014,958 | ) |
Net realized gain on investments | | | | | (21,819 | ) |
Net realized loss on securities sold shorts | | | | | 825 | |
Net realized gain on written options | | | | | (31,996 | ) |
Net change in unrealized depreciation on investments | | | | | 217,035 | |
Net change in unrealized depreciation on securities sold short | | | | | 2,010 | |
Net change in unrealized depreciation on written options | | | | | 142 | |
Increase in dividends and interest receivable | | | | | (10,583 | ) |
Increase in due from brokers | | | | | (150,219 | ) |
Increase in advisory fees payable | | | | | 4,550 | |
Net cash used in operating activities | | | | | (482,428 | ) |
Cash Flows from Financing Activities: | | | | | | |
Proceeds from borrowings | | | | | 1,878,897 | |
Payments for fund shares sold in excess of in-kind creations | | | | | (989,817 | ) |
Distributions paid | | | | | (133,003 | ) |
Net cash provided by financing activities | | | | | 756,077 | |
Net increase in cash | | | | | 273,649 | |
Cash, beginning of period | | | | | — | |
Cash, end of period | | | | $ | 273,649 | |
Supplementary information: | | | | | | |
Interest paid on borrowings | | | | $ | 14,289 | |
Non-cash financing activities: | | | | | | |
In-kind creations — Issued | | | | | 7,299,794 | |
In-kind creations — Redeemed | | | | | — | |
The accompanying notes are an integral part of these financial statements.
69
| | | | InfraCap REIT Preferred ETF
| |
| | | | For the
Year Ended
October 31, 2018
| | For the Period
February 7, 20171
Through
October 31, 2017
|
Per Share Data for a Share Outstanding throughout each period presented: | | | | | | | | | | |
Net asset value, beginning of period | | | | $ | 25.76 | | | $ | 25.06 | |
Investment operations: | | | | | | | | | | |
Net investment income2 | | | | | 1.21 | | | | 1.03 | |
Net realized and unrealized gain (loss) | | | | | (1.85 | ) | | | 0.60 | |
Total from investment operations | | | | | (0.64 | ) | | | 1.63 | |
Less Distributions from: | | | | | | | | | | |
Net investment income | | | | | (1.23 | ) | | | (0.93 | ) |
Return of capital | | | | | (0.24 | ) | | | — | |
Total distributions | | | | | (1.47 | ) | | | (0.93 | ) |
Net Asset Value, End of period | | | | $ | 23.65 | | | $ | 25.76 | |
Net Asset Value Total Return3 | | | | | (2.60 | )% | | | 6.54 | % |
Net assets, end of period (000’s omitted) | | | | $ | 22,468 | | | $ | 20,609 | |
RATIOS/SUPPLEMENTAL DATA: | | | | | | | | | | |
Ratios to Average Net Assets: | | | | | | | | | | |
Expenses | | | | | 0.45 | %4 | | | 0.45 | %5 |
Net investment income | | | | | 4.93 | % | | | 5.48 | %5 |
Portfolio turnover rate6 | | | | | 70 | % | | | 91 | %7 |
1 | | Commencement of operations. |
2 | | Based on average shares outstanding. |
3 | | Net Asset Value Total Return is calculated assuming an initial investment made at the net asset value on the first day of the period, reinvestment of dividends and distributions at net asset value during the period, and redemption at net asset value on the last day of the period. Total return calculated for a period of less than one year is not annualized. |
4 | | The ratio of expenses to average net assets includes tax expense fees of less than 0.01%. |
6 | | Portfolio turnover excludes the value of portfolio securities received or delivered as a result of in-kind creations or redemptions of the Fund’s capital shares. |
The accompanying notes are an integral part of these financial statements.
70
Financial Highlights (continued)
| | | | Virtus Cumberland
Municipal Bond ETF
| |
| | | | For the
Year Ended
October 31, 2018
| | For the Period
January 17, 20171
Through
October 31, 2017
|
Per Share Data for a Share Outstanding throughout each period presented: | | | | | | | | | | |
Net asset value, beginning of period | | | | $ | 25.63 | | | $ | 25.00 | |
Investment operations: | | | | | | | | | | |
Net investment income2 | | | | | 0.54 | | | | 0.41 | |
Net realized and unrealized gain (loss) | | | | | (0.78 | ) | | | 0.56 | |
Total from investment operations | | | | | (0.24 | ) | | | 0.97 | |
Less Distributions from: | | | | | | | | | | |
Net investment income | | | | | (0.60 | ) | | | (0.34 | ) |
Net realized gains | | | | | (0.32 | ) | | | — | |
Total distributions | | | | | (0.92 | ) | | | (0.34 | ) |
Net Asset Value, End of period | | | | $ | 24.47 | | | $ | 25.63 | |
Net Asset Value Total Return3 | | | | | (1.00 | )% | | | 3.92 | % |
Net assets, end of period (000’s omitted) | | | | $ | 11,010 | | | $ | 16,662 | |
RATIOS/SUPPLEMENTAL DATA: | | | | | | | | | | |
Ratios to Average Net Assets: | | | | | | | | | | |
Expenses, net of expense waivers | | | | | 0.59 | % | | | 0.59 | %4 |
Expenses, prior to expense waivers | | | | | 1.27 | % | | | 1.07 | %4 |
Net investment income | | | | | 2.15 | % | | | 2.05 | %4 |
Portfolio turnover rate5 | | | | | 15 | % | | | 60 | %6 |
1 | | Commencement of operations. |
2 | | Based on average shares outstanding. |
3 | | Net Asset Value Total Return is calculated assuming an initial investment made at the net asset value on the first day of the period, reinvestment of dividends and distributions at net asset value during the period, and redemption at net asset value on the last day of the period. Total return calculated for a period of less than one year is not annualized. |
5 | | Portfolio turnover excludes the value of portfolio securities received or delivered as a result of in-kind creations or redemptions of the Fund’s capital shares. |
The accompanying notes are an integral part of these financial statements.
71
Financial Highlights (continued)
| | | | Virtus Glovista
Emerging
Markets ETF
|
| | | | For the Period
November 7, 20171
Through
October 31, 2018
|
Per Share Data for a Share Outstanding throughout the period presented: | | | | | | |
Net asset value, beginning of period | | | | $ | 24.95 | |
Investment operations: | | | | | | |
Net investment income2 | | | | | 0.53 | |
Net realized and unrealized loss | | | | | (3.90 | ) |
Total from investment operations | | | | | (3.37 | ) |
Less Distributions from: | | | | | | |
Net investment income | | | | | (0.09 | ) |
Total distributions | | | | | (0.09 | ) |
Net Asset Value, End of period | | | | $ | 21.49 | |
Net Asset Value Total Return3 | | | | | (13.58 | )% |
Net assets, end of period (000’s omitted) | | | | $ | 12,892 | |
RATIOS/SUPPLEMENTAL DATA: | | | | | | |
Ratios to Average Net Assets: | | | | | | |
Expenses, net of expense waivers | | | | | 0.65 | %4 |
Expenses, prior to expense waivers | | | | | 0.68 | %4 |
Net investment income | | | | | 2.20 | %4 |
Portfolio turnover rate5 | | | | | 162 | %6 |
1 | | Commencement of operations. |
2 | | Based on average shares outstanding. |
3 | | Net Asset Value Total Return is calculated assuming an initial investment made at the net asset value on the first day of the period, reinvestment of dividends and distributions at net asset value during the period, and redemption at net asset value on the last day of the period. Total return calculated for a period of less than one year is not annualized. |
5 | | Portfolio turnover excludes the value of portfolio securities received or delivered as a result of in-kind creations or redemptions of the Fund’s capital shares. |
The accompanying notes are an integral part of these financial statements.
72
Financial Highlights (continued)
| | | | Virtus InfraCap
U.S. Preferred
Stock ETF
|
| | | | For the Period
May 15, 20181
Through
October 31, 2018
|
Per Share Data for a Share Outstanding throughout the period presented: | | | | | | |
Net asset value, beginning of period | | | | $ | 24.96 | |
Investment operations: | | | | | | |
Net investment income2 | | | | | 0.72 | |
Net realized and unrealized loss | | | | | (0.45 | ) |
Total from investment operations | | | | | 0.27 | |
Less Distributions from: | | | | | | |
Net investment income | | | | | (0.76 | ) |
Total distributions | | | | | (0.76 | ) |
Net Asset Value, End of period | | | | $ | 24.47 | |
Net Asset Value Total Return3 | | | | | 1.02 | % |
Net assets, end of period (000’s omitted) | | | | $ | 6,118 | |
RATIOS/SUPPLEMENTAL DATA: | | | | | | |
Ratios to Average Net Assets: | | | | | | |
Expenses | | | | | 2.13 | %4,5 |
Net investment income | | | | | 6.22 | %4 |
Portfolio turnover rate6 | | | | | 55 | %7 |
1 | | Commencement of operations. |
2 | | Based on average shares outstanding. |
3 | | Net Asset Value Total Return is calculated assuming an initial investment made at the net asset value on the first day of the period, reinvestment of dividends and distributions at net asset value during the period, and redemption at net asset value on the last day of the period. Total return calculated for a period of less than one year is not annualized. |
5 | | The ratios of expenses to average net assets include interest expense of 1.05% and dividend expense on securities sold short of 0.28%. |
6 | | Portfolio turnover excludes the value of portfolio securities received or delivered as a result of in-kind creations or redemptions of the Fund’s capital shares. |
The accompanying notes are an integral part of these financial statements.
73
Financial Highlights (continued)
| | | | Virtus LifeSci Biotech Clinical Trials ETF
| |
| | | | For the
Year Ended
October 31, 2018
| | For the
Year Ended
October 31, 2017
| | For the
Year Ended
October 31, 2016
| | For the Period
December 16, 20141
Through
October 31, 2015
|
Per Share Data for a Share Outstanding throughout each period presented: | | | | | | | | | | | | | | | | | | |
Net asset value, beginning of period | | | | $ | 27.73 | | | $ | 18.05 | | | $ | 27.37 | | | $ | 25.00 | |
Investment operations: | | | | | | | | | | | | | | | | | | |
Net investment loss2 | | | | | (0.15 | ) | | | (0.12 | ) | | | (0.14 | ) | | | (0.24 | ) |
Net realized and unrealized gain (loss) | | | | | (0.41 | ) | | �� | 9.80 | | | | (9.03 | ) | | | 2.61 | 3 |
Total from investment operations | | | | | (0.56 | ) | | | 9.68 | | | | (9.17 | ) | | | 2.37 | |
Less Distributions from: | | | | | | | | | | | | | | | | | | |
Net investment income | | | | | (0.30 | ) | | | — | | | | — | | | | — | |
Net realized gains | | | | | — | | | | — | | | | (0.15 | ) | | | — | |
Total distributions | | | | | (0.30 | ) | | | — | | | | (0.15 | ) | | | — | |
Net Asset Value, End of period | | | | $ | 26.87 | | | $ | 27.73 | | | $ | 18.05 | | | $ | 27.37 | |
Net Asset Value Total Return4 | | | | | (2.05 | )% | | | 53.66 | % | | | (33.73 | )% | | | 9.46 | % |
Net assets, end of period (000’s omitted) | | | | $ | 36,269 | | | $ | 30,501 | | | $ | 18,045 | | | $ | 23,261 | |
RATIOS/SUPPLEMENTAL DATA: | | | | | | | | | | | | | | | | | | |
Ratios to Average Net Assets: | | | | | | | | | | | | | | | | | | |
Expenses | | | | | 0.79 | %5 | | | 0.83 | % | | | 0.85 | %5 | | | 0.85 | %6,7 |
Net investment loss | | | | | (0.45 | )% | | | (0.53 | )% | | | (0.67 | )% | | | (0.85 | )%6 |
Portfolio turnover rate8 | | | | | 65 | % | | | 45 | % | | | 54 | % | | | 76 | %9 |
1 | | Commencement of operations. |
2 | | Based on average shares outstanding. |
3 | | The per share amount of realized and unrealized gain (loss) on investments does not accord with the amounts reported in the Statements of Changes in Net Assets due to the timing of creation of Fund shares in relation to fluctuating market values. |
4 | | Net Asset Value Total Return is calculated assuming an initial investment made at the net asset value on the first day of the period, reinvestment of dividends and distributions at net asset value during the period, and redemption at net asset value on the last day of the period. Total return calculated for a period of less than one year is not annualized. |
5 | | The ratio of expenses to average net assets includes tax expense fees of less than 0.01%. |
7 | | The ratio of expenses to average net assets includes interest expense fees of less than 0.01%. |
8 | | Portfolio turnover excludes the value of portfolio securities received or delivered as a result of in-kind creations or redemptions of the Fund’s capital shares. |
The accompanying notes are an integral part of these financial statements.
74
Financial Highlights (continued)
| | | | Virtus LifeSci Biotech Products ETF
| |
| | | | For the
Year Ended
October 31, 2018
| | For the
Year Ended
October 31, 2017
| | For the
Year Ended
October 31, 2016
| | For the Period
December 16, 20141
Through
October 31, 2015
|
Per Share Data for a Share Outstanding throughout each period presented: | | | | | | | | | | | | | | | | | | |
Net asset value, beginning of period | | | | $ | 39.34 | | | $ | 28.91 | | | $ | 30.50 | | | $ | 25.00 | |
Investment operations: | | | | | | | | | | | | �� | | | | | | |
Net investment income (loss)2 | | | | | (0.21 | ) | | | 0.07 | | | | (0.12 | ) | | | (0.17 | ) |
Net realized and unrealized gain (loss) | | | | | (2.73 | ) | | | 10.36 | | | | (1.07 | ) | | | 5.67 | 3 |
Total from investment operations | | | | | (2.94 | ) | | | 10.43 | | | | (1.19 | ) | | | 5.50 | |
Less Distributions from: | | | | | | | | | | | | | | | | | | |
Net investment income | | | | | (0.07 | ) | | | — | | | | — | | | | — | |
Net realized gains | | | | | — | | | | — | | | | (0.40 | ) | | | — | |
Total distributions | | | | | (0.07 | ) | | | — | | | | (0.40 | ) | | | — | |
Net Asset Value, End of period | | | | $ | 36.33 | | | $ | 39.34 | | | $ | 28.91 | | | $ | 30.50 | |
Net Asset Value Total Return4 | | | | | (7.49 | )% | | | 36.08 | % | | | (3.97 | )% | | | 21.99 | % |
Net assets, end of period (000’s omitted) | | | | $ | 27,248 | | | $ | 37,377 | | | $ | 23,130 | | | $ | 22,874 | |
RATIOS/SUPPLEMENTAL DATA: | | | | | | | | | | | | | | | | | | |
Ratios to Average Net Assets: | | | | | | | | | | | | | | | | | | |
Expenses | | | | | 0.79 | %5 | | | 0.84 | % | | | 0.85 | %5 | | | 0.86 | %6,7 |
Net investment income (loss) | | | | | (0.49 | )% | | | 0.19 | % | | | (0.43 | )% | | | (0.58 | )%6 |
Portfolio turnover rate8 | | | | | 32 | % | | | 34 | % | | | 35 | % | | | 45 | %9 |
1 | | Commencement of operations. |
2 | | Based on average shares outstanding. |
3 | | The per share amount of realized and unrealized gain (loss) on investments does not accord with the amounts reported in the Statements of Changes in Net Assets due to the timing of creation of Fund shares in relation to fluctuating market values. |
4 | | Net Asset Value Total Return is calculated assuming an initial investment made at the net asset value on the first day of the period, reinvestment of dividends and distributions at net asset value during the period, and redemption at net asset value on the last day of the period. Total return calculated for a period of less than one year is not annualized. |
5 | | The ratio of expenses to average net assets includes tax expense fees of less than 0.01%. |
7 | | The ratio of expenses to average net assets includes interest expense fees of less than 0.01%. |
8 | | Portfolio turnover excludes the value of portfolio securities received or delivered as a result of in-kind creations or redemptions of the Fund’s capital shares. |
The accompanying notes are an integral part of these financial statements.
75
Financial Highlights (continued)
| | | | Virtus Newfleet Multi-Sector Bond ETF
| |
| | | | For the
Year Ended
October 31, 2018
| | For the
Year Ended
October 31, 2017
| | For the
Year Ended
October 31, 2016
| | For the Period
August 10, 20151
Through
October 31, 2015
|
Per Share Data for a Share Outstanding throughout each period presented: | | | | | | | | | | | | | | | | | | |
Net asset value, beginning of period | | | | $ | 25.84 | | | $ | 25.96 | | | $ | 25.09 | | | $ | 25.00 | |
Investment operations: | | | | | | | | | | | | | | | | | | |
Net investment income2 | | | | | 1.12 | | | | 1.09 | | | | 0.95 | | | | 0.05 | |
Net realized and unrealized gain (loss) | | | | | (1.51 | ) | | | 0.22 | | | | 0.85 | | | | 0.07 | |
Total from investment operations | | | | | (0.39 | ) | | | 1.31 | | | | 1.80 | | | | 0.12 | |
Less Distributions from: | | | | | | | | | | | | | | | | | | |
Net investment income | | | | | (1.15 | ) | | | (1.10 | ) | | | (0.93 | ) | | | (0.03 | ) |
Net realized gains | | | | | (0.45 | ) | | | (0.33 | ) | | | — | | | | — | |
Total distributions | | | | | (1.60 | ) | | | (1.43 | ) | | | (0.93 | ) | | | (0.03 | ) |
Net Asset Value, End of period | | | | $ | 23.85 | | | $ | 25.84 | | | $ | 25.96 | | | $ | 25.09 | |
Net Asset Value Total Return3 | | | | | (1.62 | )% | | | 5.26 | % | | | 7.37 | % | | | 0.47 | % |
Net assets, end of period (000’s omitted) | | | | $ | 98,959 | | | $ | 169,284 | | | $ | 167,474 | | | $ | 153,035 | |
RATIOS/SUPPLEMENTAL DATA: | | | | | | | | | | | | | | | | | | |
Ratios to Average Net Assets: | | | | | | | | | | | | | | | | | | |
Expenses, net of expense waivers | | | | | 0.80 | % | | | 0.80 | % | | | 0.80 | %4 | | | 0.80 | %5 |
Expenses, prior to expense waivers | | | | | 0.86 | % | | | 0.84 | % | | | 0.91 | %4 | | | 0.99 | %5 |
Net investment income | | | | | 4.51 | % | | | 4.26 | % | | | 3.75 | % | | | 0.88 | %5 |
Portfolio turnover rate6 | | | | | 82 | % | | | 113 | % | | | 100 | % | | | 20 | %7 |
1 | | Commencement of operations. |
2 | | Based on average shares outstanding. |
3 | | Net Asset Value Total Return is calculated assuming an initial investment made at the net asset value on the first day of the period, reinvestment of dividends and distributions at net asset value during the period, and redemption at net asset value on the last day of the period. Total return calculated for a period of less than one year is not annualized. |
4 | | The ratio of expenses to average net assets includes tax expense fees of less than 0.01%. |
6 | | Portfolio turnover excludes the value of portfolio securities received or delivered as a result of in-kind creations or redemptions of the Fund’s capital shares. |
The accompanying notes are an integral part of these financial statements.
76
Financial Highlights (continued)
| | | | Virtus WMC Global
Factor Opportunities ETF
| |
| | | | For the
Year Ended
October 31, 2018
| | For the Period
October 10, 20171
Through
October 31, 2017
|
Per Share Data for a Share Outstanding throughout each period presented: | | | | | | | | | | |
Net asset value, beginning of period | | | | $ | 25.10 | | | $ | 25.00 | |
Investment operations: | | | | | | | | | | |
Net investment income2 | | | | | 0.50 | | | | 0.01 | |
Net realized and unrealized gain (loss) | | | | | (0.53 | ) | | | 0.09 | |
Total from investment operations | | | | | (0.03 | ) | | | 0.10 | |
Less Distributions from: | | | | | | | | | | |
Net investment income | | | | | (0.10 | ) | | | — | |
Total distributions | | | | | (0.10 | ) | | | — | |
Net Asset Value, End of period | | | | $ | 24.97 | | | $ | 25.10 | |
Net Asset Value Total Return3 | | | | | (0.11 | )% | | | 0.38 | % |
Net assets, end of period (000’s omitted) | | | | $ | 4,995 | | | $ | 5,019 | |
RATIOS/SUPPLEMENTAL DATA: | | | | | | | | | | |
Ratios to Average Net Assets: | | | | | | | | | | |
Expenses | | | | | 0.49 | %4 | | | 0.49 | %5 |
Net investment income | | | | | 1.88 | % | | | 0.76 | %5 |
Portfolio turnover rate6 | | | | | 80 | % | | | 23 | %7 |
1 | | Commencement of operations. |
2 | | Based on average shares outstanding. |
3 | | Net Asset Value Total Return is calculated assuming an initial investment made at the net asset value on the first day of the period, reinvestment of dividends and distributions at net asset value during the period, and redemption at net asset value on the last day of the period. Total return calculated for a period of less than one year is not annualized. |
4 | | The ratio of expenses to average net assets includes tax expense fees of less than 0.01%. |
6 | | Portfolio turnover excludes the value of portfolio securities received or delivered as a result of in-kind creations or redemptions of the Fund’s capital shares. |
The accompanying notes are an integral part of these financial statements.
77
Notes to Financial Statements
October 31, 2018
The ETFis Series Trust I (the “Trust”) was organized as a Delaware statutory trust on September 20, 2012 and is registered with the U.S. Securities and Exchange Commission (the “SEC”) as an open-end management investment company under the Investment Company Act of 1940 (the “1940 Act”). InfraCap REIT Preferred ETF, Virtus Cumberland Municipal Bond ETF, Virtus Glovista Emerging Markets ETF, Virtus InfraCap U.S. Preferred Stock ETF, Virtus LifeSci Biotech Clinical Trials ETF, Virtus LifeSci Biotech Products ETF, Virtus Newfleet Multi-Sector Bond ETF, and Virtus WMC Global Factor Opportunities ETF (each, a “Fund”, and collectively, the “Funds”), each a separate investment portfolio of the Trust, are presented herein. The offering of shares of each Fund is registered under the Securities Act of 1933 (the “Securities Act”).
Funds
| | | | Commencement
of Operations
|
InfraCap REIT Preferred ETF | | | | February 7, 2017 |
Virtus Cumberland Municipal Bond ETF | | | | January 17, 2017 |
Virtus Glovista Emerging Markets ETF | | | | November 7, 2017 |
Virtus InfraCap U.S. Preferred Stock ETF | | | | May 15, 2018 |
Virtus LifeSci Biotech Clinical Trials ETF | | | | December 16, 2014 |
Virtus LifeSci Biotech Products ETF | | | | December 16, 2014 |
Virtus Newfleet Multi-Sector Bond ETF | | | | August 10, 2015 |
Virtus WMC Global Factor Opportunities ETF | | | | October 10, 2017 |
InfraCap REIT Preferred ETF and Virtus Cumberland Municipal Bond ETF, Virtus Glovista Emerging Markets ETF and Virtus InfraCap U.S. Preferred Stock ETF are “non-diversified” Funds, as defined under the 1940 Act, as of the fiscal year ended October 31, 2018.
InfraCap REIT Preferred ETF seeks investment results that correspond, before fees and expenses, to the price and yield performance of the Indxx REIT Preferred Stock Index.
The Virtus Cumberland Municipal Bond ETF seeks to provide a competitive level of current income exempt from federal income tax, while preserving capital.
The Virtus Glovista Emerging Markets ETF seeks investment results that correspond, before fees and expenses, to the price and yield performance of the Solactive Most Favored Nations Emerging Market Index.
Virtus InfraCap U.S. Preferred Stock ETF seeks current income and, secondarily, capital appreciation.
The Virtus LifeSci Biotech Clinical Trials ETF and Virtus LifeSci Biotech Products ETF seek investment results that correspond, before fees and expenses, to the price and yield performance of the LifeSci Biotechnology Clinical Trials Index and LifeSci Biotechnology Products Index, respectively.
The Virtus Newfleet Multi-Sector Bond ETF seeks to provide a high level of current income and, secondarily, capital appreciation.
The Virtus WMC Global Factor Opportunities ETF seeks capital appreciation.
2. SIGNIFICANT ACCOUNTING POLICIES
Each Fund is an investment company and accordingly follows the investment company accounting and reporting guidance of the Financial Accounting Standards Board (FASB) Accounting Standard Codification Topic 946 Financial Services — Investment Companies. Each Fund prepares its financial statements in accordance with generally accepted accounting principles (“GAAP”) in the United States of America and follows the significant accounting policies described below.
(a) Use of Estimates
Management makes certain estimates and assumptions that affect the reported amounts of assets and liabilities and disclosure of contingent assets and liabilities at the date of the financial statements and reported amounts of increases and decreases in the net assets from operations during the reporting period. Actual results could differ from those estimates.
(b) Indemnification
In the normal course of business, the Funds may enter into contracts that contain a variety of representations which provide general indemnifications for certain liabilities. The Funds’ maximum exposure under these arrangements is unknown. However, the Funds have not had prior claims or losses pursuant to these contracts and expect the risk of loss to be remote.
78
Notes to Financial Statements (continued)
October 31, 2018
(c) Organization and Offering Costs
During the period, Virtus ETF Advisers LLC, the Funds’ investment adviser (the “Adviser”), has assumed organization costs for the Trust relating to the organization of the Virtus Cumberland Municipal Bond ETF. Offering costs, consisting primarily of legal fees related to preparing the initial registration statement, were deferred and amortized over a 12 month period beginning with the commencement of operations of the Fund.
(d) Security Valuation
Equity securities and Exchange-Traded Funds are valued based on their last sale price. Price information on listed securities is taken from the exchange where the security is primarily traded. Securities regularly traded in an over the counter market are valued at the latest quoted sale price in such market or in the case of the New York Stock Exchange (“NYSE”) or NASDAQ, at the NYSE or NASDAQ Official Closing Price. Such valuations are typically categorized as Level 1 in the fair value hierarchy described below.
If market quotations are not readily available, or if it is determined that a quotation of a security does not represent fair value, then the security is valued at fair value as determined in good faith using procedures adopted by the Trust’s Board of Trustees (the “Board”). Such valuations are typically categorized as Level 2 or Level 3 in the fair value hierarchy described below.
Debt securities, including restricted securities, are valued based on evaluated quotations received from independent pricing services or from dealers who make markets in such securities. For most bond types, the pricing service utilizes matrix pricing that considers one or more of the following factors: yield or price of bonds of comparable quality, coupon, maturity, current cash flows, type, and current day trade information, as well as dealer-supplied prices. Such valuations are typically categorized as Level 2 in the fair value hierarchy described below. Debt securities that are not widely traded, are illiquid, or are internally fair valued using procedures adopted by the Board are generally categorized as Level 3 in the hierarchy.
Investments in other open-end investment companies are valued based on their net asset value each business day and are typically categorized as Level 1 in the fair value hierarchy described below.
(e) Fair Value Measurement
Accounting Standards Codification, Fair Value Measurements and Disclosures (“ASC 820”) defines fair value, establishes a framework for measuring fair value in accordance with GAAP, and requires disclosure about fair value measurements. It also provides guidance on determining when there has been a significant decrease in the volume and level of activity for an asset or liability, when a transaction is not orderly, and how that information must be incorporated into fair value measurement. Under ASC 820, various inputs are used in determining the value of the Funds’ investments. These inputs are summarized in the following hierarchy:
• | | Level 1 — Unadjusted quoted prices in active markets for identical assets or liabilities that the Funds have the ability to access. |
• | | Level 2 — Observable inputs other than quoted prices included in Level 1 that are observable for the asset or liability, either directly or indirectly. These inputs may include quoted prices for the identical instrument on an inactive market, prices for similar securities, interest rates, prepayment speeds, credit risk, yield curves, default rates and similar data. |
• | | Level 3 — Unobservable inputs for the asset or liability, to the extent relevant observable inputs are not available; representing the Funds’ own assumptions about the assumptions a market participant would use in valuing the asset or liability, and would be based on the best information available. |
The inputs or methodology used for valuing securities are not necessarily an indication of the risk associated with investing in those securities. The hierarchy classification of inputs used to value each Fund’s investments at October 31, 2018, is disclosed at the end of each Fund’s Schedule of Investments.
(f) Security Transactions
Security transactions are accounted for on the trade date. Realized gains and losses on sales of investment securities are calculated using specific identification.
(g) Foreign Taxes
Certain Funds may be subject to foreign taxes on income, gains on investments or currency repatriation, a portion of which may be recoverable. Each Fund will accrue such taxes and recoveries as applicable based upon current interpretations of the tax rules and regulations that exist in the markets in which it invests.
79
Notes to Financial Statements (continued)
October 31, 2018
(h) Investment Income and Expenses
Dividend income is recognized on the ex-dividend date. Expenses and interest income are recognized on the accrual basis. Amortization of premium and accretion of discount on debt securities are included in interest income. Each Fund amortizes premiums and accretes discounts using the effective interest method.
Each Fund pays all of its expenses not assumed by its Sub-Adviser, if any, as defined in Note 3, or the Adviser. General Trust expenses that are allocated among and charged to the assets of the Funds and other series of the Trust are done so on a basis that the Board deems fair and equitable, which may be on a basis of relative net assets of each Fund and other series of the Trust or the nature of the services performed and relative applicability to each Fund and other series of the Trust.
(i) Short Sales
The Virtus InfraCap U.S. Preferred Stock ETF Fund may sell securities short. A short sale is a transaction in which the Fund sells a security it does not own in anticipation of a decline in market price. To sell a security short, the Fund must borrow the security. The Fund’s obligation to replace the security borrowed and sold short will be fully collateralized at all times by the proceeds from the short sale retained by the broker and by cash and securities deposited in a segregated account with the Fund’s custodian. If the price of the security sold short increases between the time of the short sale and the time the Fund replaces the borrowed security, the Fund will realize a loss, and if the price declines during the period, the Fund will realize a gain. Any realized gain will be decreased, and any realized loss increased, by the amount of transaction costs. On the ex-dividend date, dividends on short sales are recorded as an expense to the Fund.
In accordance with the terms of its prime brokerage agreement, the Fund may receive rebate income or be charged a fee on borrowed securities which is reported as “Interest Expense” on the Statement of Operations. Such income or fee is calculated on a daily basis based upon the market value of each borrowed security and a variable rate that is dependent upon the availability of such security.
(j) Distributions to Shareholders
Distributions are recorded by the Funds on the ex-dividend date. Income and capital gain distributions are determined in accordance with income tax regulations that may differ from GAAP in the United States of America.
Dividend income from REIT investments is recorded using management’s estimate of the income included in distributions received from the REIT investments. Distributions received in excess of this estimated amount are recorded as a reduction of the cost of investments or reclassified to capital gains. The actual amounts of income, return of capital, and capital gains are only determined by each domestic REIT after its fiscal year-end, and may differ from the estimated amounts.
Effective with the current reporting period, it is no longer required to present certain line items on the Statements of Changes in Net Assets. Such disclosure changes were not permitted retrospectively, therefore prior period amounts are presented below. For the year ended October 31, 2017, distributions to shareholders were as follows:
Distributions from net investment income:
InfraCap REIT Preferred ETF | | | | | (554,337 | ) |
Virtus Cumberland Municipal Bond ETF | | | | | (318,806 | ) |
Virtus Newfleet Multi-Sector Bond ETF | | | | | (7,931,960 | ) |
Distributions from net realized gains:
Virtus Newfleet Multi-Sector Bond ETF | | | | | (2,638,127 | ) |
For the year ended October 31, 2017, undistributed net investment income/(distributions in excess of net investment income) included in net assets were as follows:
InfraCap REIT Preferred ETF | | | | | (3,540 | ) |
Virtus Cumberland Municipal Bond ETF | | | | | 59,552 | |
Virtus LifeSci Biotech Clinical Trials ETF | | | | | (220,290 | ) |
Virtus Newfleet Multi-Sector Bond ETF | | | | | 274,666 | |
Virtus WMC Global Factor Opportunities ETF | | | | | 1,869 | |
80
Notes to Financial Statements (continued)
October 31, 2018
(k) Foreign Currency Translation
Non-U.S. investment securities and other assets and liabilities denominated in foreign currencies are translated into U.S. dollar amounts at the foreign currency exchange rate effective at the end of the reporting period. Cost of investments is translated at the currency exchange rate effective at the trade date. The gain or loss resulting from a change in currency exchange rates between the trade and settlement date of a portfolio transaction is treated as a gain or loss on foreign currency. Likewise, the gain or loss resulting from a change in currency exchange rates between the date the income is accrued and the date it is paid is treated as a gain or loss on foreign currency. The Funds do not isolate that portion of the results of operations arising from changes in foreign exchange rates on investments from the fluctuations arising from changes in the market prices of securities held. Such fluctuations are included with the net realized and unrealized gain or loss on investments.
(l) Loan Agreements
The Virtus Newfleet Multi-Sector Bond ETF may invest in direct debt instruments which are interests in amounts owed by a corporate, governmental, or other borrower to lenders or lending syndicates. Loan agreements are generally non-investment grade and often involve borrowers that are highly leveraged. The Fund may invest in obligations of borrowers who are in bankruptcy proceedings. Loan agreements are typically senior in the corporate capital structure of the borrower. A loan is often administered by a bank or other financial institution (the “lender”) that acts as agent for all holders. The lender administers the terms of the loan, as specified in the loan agreement. The Fund’s investments in loans may be in the form of participations in loans or assignments of all or a portion of loans from third parties. When investing in loan participations, the Fund has the right to receive payments of principal, interest and any fees to which it is entitled only from the lender selling the loan participation and only upon receipt by the lender of payments from the borrower. The Fund generally has no right to enforce compliance with the terms of the loan agreement with the borrower. As a result, the Fund may be subject to the credit risk of both the borrower and the lender that is selling the loan agreement. When the Fund purchases assignments from lenders, it acquires direct rights against the borrower on the loan.
The Fund may invest in multiple series or tranches of a loan, which may have varying terms and carry different associated risks. Loan agreements may involve foreign borrowers, and investments may be denominated in foreign currencies. Direct indebtedness of emerging countries involves a risk that the government entities responsible for the repayment of the debt may be unable, or unwilling, to pay the principal and interest when due.
The loan agreements have floating rate loan interests which generally pay interest at rates that are periodically determined by reference to a base lending rate plus a premium. The base lending rates are generally LIBOR (London Interbank Offered Rate), the prime rate offered by one or more U.S. banks or the certificate of deposit rate. When a loan agreement is purchased, the Fund may pay an assignment fee. On an ongoing basis, the Fund may receive a commitment fee based on the undrawn portion of the underlying line of credit portion of a loan agreement. Prepayment penalty fees are received upon the prepayment of a loan agreement by a borrower. Prepayment penalty, facility, commitment, consent and amendment fees are recorded to income as earned or paid.
(m) Securities Lending
Certain Funds may loan securities to qualified brokers through an agreement with The Bank of New York Mellon (“BNY Mellon”), as a third party lending agent. Under the terms of the agreement, a Fund doing so is required to maintain collateral with a market value not less than 102% of the market value of loaned securities. Collateral is adjusted daily in connection with changes in the market value of securities on loan. Collateral may consist of cash and securities issued by the U.S. Government or its agencies. Cash collateral is invested in a short-term money market fund. Dividends earned on the collateral and premiums paid by the broker are recorded as income by a Fund net of fees and rebates charged by BNY Mellon for its services as securities lending agent and in connection with this securities lending program. Lending portfolio securities involves a risk of delay in the recovery of the loaned securities or in the declining value of the collateral.
At October 31, 2018, the following Funds had securities on loan:
Funds
| | | | Market
Value
| | Cash
Collateral
| | Non Cash
Collateral(a)
|
Virtus LifeSci Biotech Clinical Trials ETF | | | | $ | 10,360,445 | | | $ | 3,750,281 | | | $ | 6,691,803 | |
Virtus LifeSci Biotech Products ETF | | | | | 7,867,787 | | | | 3,038,226 | | | | 5,094,840 | |
a | | Collateral received in excess of the market value of securities on loan is not presented in this table. The total cash collateral received by each Fund is disclosed in the Fund’s statement of assets and liabilities. |
Funds not listed in table above did not have any securities on loan at October 31, 2018.
81
Notes to Financial Statements (continued)
October 31, 2018
The following table presents the contract value of securities lending transactions and the type of collateral provided to counterparties.
Remaining Contractual Maturity of the Agreements, as of October 31, 2018
| | Overnight and | | Between
| | |
| | Continuous
| | <30 Days
| | 30 & 90 Days
| | >90 Days
| | Total
|
| Virtus LifeSci Biotech Clinical Trials ETF | | | | | | | | | | | | | | | | |
| Securities Lending Transactions | | | | | | | | | | | | | | | | |
| Common Stocks | $ | 10,442,084 | | | $ | — | | | $ | — | | | $ | — | | | $10,442,084 |
| Gross amount of recognized liabilities for securities lending transactions: | | $10,442,084 |
| Virtus LifeSci Biotech Products ETF | | | | | | | | | | | | | | | | |
| Securities Lending Transactions | | | | | | | | | | | | | | | | |
| Common Stocks | $ | 8,133,066 | | | $ | — | | | $ | — | | | $ | — | | | $8,133,066 |
| Gross amount of recognized liabilities for securities lending transactions: | | $8,133,066 |
3. INVESTMENT MANAGEMENT RELATED PARTIES AND OTHER AGREEMENTS
Investment Advisory Agreements
The Trust has entered into Investment Advisory Agreements (collectively, “Advisory Agreement”) with the Adviser, a wholly owned subsidiary of ETFis Holdings LLC, on behalf of each Fund. ETFis Holdings LLC is majority-owned by Virtus Investment Partners, Inc. (Ticker: VRTS) (together with its affiliates, “Virtus”). Pursuant to the Advisory Agreement, the Adviser has overall supervisory responsibility for the general management and investment of the Funds’ securities portfolios. The Adviser pays all of the ordinary operating expenses of the Virtus Glovista Emerging Markets ETF, Virtus LifeSci Biotech Clinical Trials ETF, Virtus LifeSci Biotech Products ETF and Virtus WMC Global Factor Opportunities ETF, except for each Fund’s management fee; payments under any 12b-1 plan; taxes and other governmental fees; brokerage fees, commissions and other transaction expenses; interest and other costs of borrowing; litigation or arbitration expenses; acquired fund fees and expenses; and extraordinary or other non-routine expenses of the Funds. The Adviser is entitled to receive a fee from each Fund (unless otherwise noted below) based on each Fund’s average daily net assets, computed and accrued daily and payable monthly, at an annual rate as follows:
Funds
| | Rate
|
InfraCap REIT Preferred ETF | | 0.45%, subject to a minimum annual fee of $25,000 per year |
Virtus Cumberland Municipal Bond ETF | | 0.245% |
Virtus Glovista Emerging Markets ETF | | 0.68% |
Virtus InfraCap U.S. Preferred Stock ETF | | 0.80% |
Virtus LifeSci Biotech Products ETF | | 0.79% |
Virtus LifeSci Biotech Clinical Trials ETF | | 0.79% |
Virtus Newfleet Multi-Sector Bond ETF | | 0.70% |
Virtus WMC Global Factor Opportunities ETF | | 0.49% |
The Advisory Agreement may be terminated by the Trust on behalf of a Fund with the approval of a Fund’s Board or by a vote of the majority of a Fund’s shareholders. The Advisory Agreement may also be terminated by the Adviser by not more than 60 days’ nor less than 30 days’ written notice.
Fee Waiver Agreement
The Adviser has contractually agreed to waive a portion of the Virtus Glovista Emerging Markets ETF’s management fee equal to 0.03% of the Fund’s average daily net assets, which will have the effect of reducing acquired fund fees and expenses (the “Fee Waiver Agreement”). Unless the Adviser continues the Fee Waiver Agreement, it will terminate on February 28, 2019.
Expense Limitation Agreement
The Adviser has contractually agreed to reduce its fees and reimburse expenses in order to keep net expenses (excluding interest, taxes, brokerage fees and commissions, other expenditures that are capitalized in accordance with generally accepted accounting principles, acquired fund fees and expenses, other extraordinary expenses not incurred in the ordinary course of the Funds’ business, and amounts,
82
Notes to Financial Statements (continued)
October 31, 2018
if any, payable pursuant to a plan adopted in accordance with Rule 12b-1 under the 1940 Act) from exceeding a specified amount. The expense cap in effect for the Funds during the year ended October 31, 2018 are as follows:
Funds
| | | | Expense
Limit
| | Expense Limit
Effective Through
| |
| Virtus Cumberland Municipal Bond ETF | | | | | 0.59 | % | | February 28, 2019 | |
| Virtus Newfleet Multi-Sector Bond ETF | | | | | 0.80 | % | | February 28, 2019 | |
Funds not listed in the table above do not have an expense limitation agreement.
The expense limitation agreement with respect to a Fund will be terminated upon termination of the Advisory Agreement between the Adviser and the Fund. In addition, while the Adviser or the Fund may discontinue the expense limitation agreement after the contractual period, it may only be terminated during its term with the approval of the Fund’s Board of Trustees.
Under certain conditions, the Adviser may recapture operating expenses reimbursed within three years after the date on which such waiver or reimbursement occurred. The Fund must pay its ordinary operating expenses before the Adviser is entitled to any reimbursement and must remain in compliance with any applicable expense limitation, or if none, the expense limitation in effect at the time of the waiver or reimbursement. All or a portion of the following Adviser reimbursed expenses may be recaptured during the fiscal years indicated:
Funds
| | | | 2019
| | 2020
| | 2021
|
Virtus Cumberland Municipal Bond ETF | | | | $ | — | | | $ | 88,591 | | | $ | 97,593 | |
Virtus Glovista Emerging Markets ETF | | | | | — | | | | — | | | | 5,983 | |
Virtus Newfleet Multi-Sector Bond ETF | | | | | 183,990 | | | | 83,625 | | | | 81,340 | |
Sub-Advisory Agreement
Each Sub-Adviser provides investment advice and management services to its respective Fund. Pursuant to an investment sub-advisory agreement among the Trust, the Sub-Adviser and the Adviser, the sub-advisory fee is based on a Fund’s average daily net assets as specified below. The Adviser has delegated to the InfraCap U.S. Preferred Stock ETF and InfraCap REIT Preferred ETF’s sub-adviser the obligation to pay all of the ordinary operating expenses of each of those Funds, except for the management fee paid to the Adviser; payments under any 12b-1 plan adopted by the Fund; taxes and other governmental fees; brokerage fees, commissions and other transaction expenses; interest and other costs of borrowing; litigation or arbitration expenses; acquired fund fees and expenses; and extraordinary or other non-routine expenses of the Fund. The Sub-Advisers and sub-advisory fees for each Fund are listed below.
Funds
| | | | Sub-Advisers
| | Sub-Advisory Fees
|
InfraCap REIT Preferred ETF. | | | | Infrastructure Capital Advisors, LLC | | 0.375%* |
Virtus Cumberland Municipal Bond ETF | | | | Cumberland Advisors Inc. | | 0.245% |
Virtus Glovista Emerging Markets ETF | | | | Glovista Investments LLC | | 60% of the Net Advisory Fee*+ |
Virtus InfraCap U.S. Preferred Stock ETF | | | | Infrastructure Capital Advisors, LLC | | 0.66%* |
Virtus Newfleet Multi-Sector Bond ETF | | | | Newfleet Asset Management, LLC1 | | 50% of the Net Advisory Fee*++ |
Virtus WMC Global Factor Opportunities ETF | | | | Wellington Management Company LLP | | 0.21%* |
1 | | An indirect wholly owned subsidiary of Virtus. |
* | | InfraCap REIT Preferred ETF, Virtus Glovista Emerging Markets ETF, Virtus InfraCap U.S. Preferred Stock ETF, Virtus Newfleet Multi-Sector Bond ETF, and Virtus WMC Global Factor Opportunities ETF’s sub-advisory fees are paid for by the Adviser, not the Funds. |
+ | | Net advisory fee: The advisory fee paid by the Fund to the Adviser for investment advisory services under the Adviser’s investment advisory agreement with the Fund, after deducting the payment of all of the ordinary operating expenses of the Fund under the Adviser’s unified fee arrangement. In the event that the Adviser waives all or a portion of its fee pursuant to an applicable waiver agreement, then the Sub-Adviser will waive its fee in the same proportion as the Adviser. |
++ | | Net Advisory Fee: In the event the Adviser waives its entire fee and also assumes expenses of the Trust pursuant to an applicable expense limitation agreement, the Sub-Adviser will similarly waive its entire fee and will share in the expense assumption by promptly paying to the Adviser (or its designee) 50% of the assumed amount. If during the term of the Sub-Advisory Agreement the Adviser later recaptures some or all of fees waived or expenses reimbursed by the Adviser and the Sub-Adviser together, then the Adviser will pay to the Sub-Adviser 50% of the amount recaptured. |
Principal Underwriter
Pursuant to the terms of a Distribution Agreement with the Trust, ETF Distributors LLC (the “Distributor”) serves as the Funds’ principal underwriter. The Distributor receives compensation from the Adviser for the statutory underwriting services it provides to the Funds. The Distributor will not distribute shares in less than Creation Units (as hereinafter defined), and does not maintain a secondary market in shares. The shares are traded in the secondary market. The Distributor is a wholly owned subsidiary of Virtus.
83
Notes to Financial Statements (continued)
October 31, 2018
Distribution and Service (12b-1 Plan)
The Board of Trustees has adopted a distribution and service plan, under which InfraCap REIT Preferred ETF, Virtus Glovista Emerging Markets ETF, Virtus InfraCap U.S. Preferred Stock ETF, Virtus LifeSci Biotech Clinical Trials ETF, Virtus LifeSci Biotech Products ETF and Virtus WMC Global Factor Opportunities ETF (collectively, the “12b-1 Funds”) are authorized to pay an amount up to 0.25% of their average daily net assets each year to finance activities primarily intended to result in the sale of Creation Units of the 12b-1 Funds or the provision of investor services. No 12b-1 fees are currently paid by the 12b-1 Funds and there are no current plans to impose these fees.
Operational Administrator
Virtus ETF Solutions LLC (the “Administrator”) serves as the Funds’ operational administrator. The Administrator supervises the overall administration of the Trust and the Funds including, among other responsibilities, the coordination and day-to-day oversight of the Funds’ operations, the service providers’ communications with the Funds and each other and assistance with Trust, Board and contractual matters related to the Funds and other series of the Trust. The Administrator also provides persons satisfactory to the Board to serve as officers of the Trust. The Administrator is a wholly owned subsidiary of Virtus.
Accounting Services Administrator, Custodian and Transfer Agent
The Bank of New York Mellon (“BNY Mellon”) provides administrative, accounting, tax and financial reporting for the maintenance and operations of the Trust as the Funds’ accounting services administrator. BNY Mellon also serves as the custodian for the Funds’ assets, and serves as transfer agent and dividend paying agent for the Funds.
Affiliated Shareholders
At October 31, 2018, the Sub-Adviser held shares of certain Funds which may be redeemed at any time that aggregated to the following:
| | | | Shares
| | % of shares
outstanding
|
InfraCap REIT Preferred ETF | | | | | 160,939 | | | | 16.9 | % |
Virtus InfraCap U.S. Preferred Stock ETF | | | | | 112,784 | | | | 45.1 | % |
4. CREATION AND REDEMPTION TRANSACTIONS
The Funds issue and redeem shares on a continuous basis at Net Asset Value (“NAV”) in groups of 50,000 shares called “Creation Units.” The Funds’ Creation Units may be issued and redeemed generally for cash or an in-kind deposit of securities held by the Funds. In each instance of cash creations or redemptions, the Trust may impose transaction fees based on transaction expenses related to the particular exchange that will be higher than the transaction fees associated with in-kind purchases or redemptions. Only “Authorized Participants” who have entered into contractual arrangements with the Distributor may purchase or redeem shares directly from the Funds. An Authorized Participant is either (i) a broker-dealer or other participant in the clearing process through the Continuous Net Settlement System of the National Securities Clearing Corporation or (ii) a DTC participant and, in each case, must have executed a Participant Agreement with the Distributor. Most retail investors will not qualify as Authorized Participants or have the resources to buy and sell whole Creation Units. Therefore, they will be unable to purchase or redeem the shares directly from the Funds. Rather, most retail investors will purchase shares in the secondary market with the assistance of a broker and will be subject to customary brokerage commissions or fees.
5. FEDERAL INCOME TAX
Each Fund intends to qualify as a “regulated investment company” under Sub-chapter M of the Internal Revenue Code of 1986 (the “Code”), as amended. Each Fund intends to distribute substantially all of its net investment income and net capital gains to shareholders. Therefore, no federal income or excise tax provision is required. Accounting for Uncertainty in Income Taxes as issued by the Financial Accounting Standards Board provides guidance for how uncertain tax positions should be recognized, measured, presented and disclosed in the financial statements, and requires the evaluation of tax positions taken or expected to be taken in the course of preparing a Fund’s tax returns to determine whether the tax positions are “more-likely-than-not” of being sustained by the applicable tax authority. Tax positions not deemed to meet the more-likely-than-not threshold would be recorded as a tax benefit or expense in the current year. Interest and penalties related to income taxes would be recorded as income tax expense. Management of the Funds is required to analyze all open tax years (2015, 2016 and 2017), as defined by IRS statute of limitations, for all major jurisdictions, including federal tax authorities and certain state tax authorities. As of October 31, 2018, the Funds did not have a liability for any unrecognized tax benefits. The Funds have no examination in progress and are not aware of any tax positions for which it is reasonably possible that the amounts of unrecognized tax benefits will significantly change in the next twelve months.
84
Notes to Financial Statements (continued)
October 31, 2018
The Funds recognize interest accrued related to unrecognized tax benefits and penalties as income tax expense. For the year ended October 31, 2018, the Funds had no accrued penalties or interest.
The adjusted cost basis of investments and gross unrealized appreciation and depreciation of investments for federal income tax purposes were as follows:
Funds
| | | | Federal Tax Cost
Of Investments
| | Gross
Unrealized
Appreciation
| | Gross
Unrealized
Depreciation
| Net Unrealized
Appreciation
(Depreciation)
| |
InfraCap REIT Preferred ETF | | | | $ | 23,251,928 | | | $ | 60,259 | | | $ | (1,225,866 | ) | $(1,165,607) | |
Virtus Cumberland Municipal Bond ETF | | | | | 10,945,168 | | | | 8,974 | | | | (172,857 | ) | (163,883) | |
Virtus Glovista Emerging Markets ETF | | | | | 14,450,215 | | | | 367,524 | | | | (2,362,880 | ) | (1,995,356) | |
Virtus InfraCap U.S. Preferred Stock ETF | | | | | 7,872,539 | | | | 27,009 | | | | (244,564 | ) | (217,555) | |
Virtus LifeSci Biotech Clinical Trials ETF | | | | | 54,055,249 | | | | 1,979,488 | | | | (17,053,831 | ) | (15,074,343) | |
Virtus LifeSci Biotech Products ETF | | | | | 36,404,662 | | | | 2,616,305 | | | | (9,154,125 | ) | (6,537,820) | |
Virtus Newfleet Multi-Sector Bond ETF | | | | | 98,798,857 | | | | 601,337 | | | | (3,659,964 | ) | (3,058,627) | |
Virtus WMC Global Factor Opportunities ETF | | | | | 5,164,844 | | | | 231,235 | | | | (425,750 | ) | (194,515) | |
The differences between book basis and tax basis components of net assets are primarily attributable to tax deferral of losses on wash sales and undistributed short-term capital gains treated as ordinary income for tax purposes. At October 31, 2018, the components of accumulated earnings/loss on a tax-basis were as follows:
Funds
| | | | Undistributed
Ordinary
Income
| | Accumulated
Capital
and Other
Gain (Loss)
| | Net Unrealized
Appreciation
(Depreciation)
| | Total
Accumulated
Earnings (Loss)
| |
InfraCap REIT Preferred ETF | | | | $ | — | | | $ | (507,902 | ) | | $ | (1,165,607 | ) | | $(1,673,509) | |
Virtus Cumberland Municipal Bond ETF | | | | | 76,312 | | | | 25,401 | | | | (163,883 | ) | | (62,170) | |
Virtus Glovista Emerging Markets ETF | | | | | 400,837 | | | | (2,265,845 | ) | | | (2,000,567 | ) | | (3,865,575) | |
Virtus InfraCap U.S. Preferred Stock ETF | | | | | 27,243 | | | | — | | | | (219,707 | ) | | (192,464) | |
Virtus LifeSci Biotech Clinical Trials ETF | | | | | — | | | | (17,018,305 | ) | | | (15,074,343 | ) | | (32,092,648) | |
Virtus LifeSci Biotech Products ETF | | | | | — | | | | (4,125,908 | ) | | | (6,537,820 | ) | | (10,663,728) | |
Virtus Newfleet Multi-Sector Bond ETF | | | | | 94,880 | | | | (1,984,867 | ) | | | (3,060,529 | ) | | (4,950,516) | |
Virtus WMC Global Factor Opportunities ETF | | | | | 141,261 | | | | 48,016 | | | | (194,582 | ) | | (5,305) | |
Ordinary losses incurred after December 31 (“Late Year Ordinary Losses”) within the taxable year are deemed to arise on the first business day of the Fund’s next taxable year. During the fiscal year ended October 31, 2018, the following Funds incurred and elected to defer Late Year Ordinary Losses as follows:
Virtus LifeSci Biotech Clinical Trials ETF | | | | | 213,799 | |
Virtus LifeSci Biotech Products ETF | | | | | 146,172 | |
The tax character of distributions paid by the following Funds during the periods ended October 31, 2018 and October 31, 2017 were as follows:
| | | | 2018
| | 2017
|
| | | | Distributions
Paid From
Ordinary
Income
| | Return
of Capital
| | Tax
Exempt
Income
| | Distributions
Paid From
Long-Term
Capital Gains
| | Distributions
Paid From
Ordinary
Income
| | Tax
Exempt
Income
| | Distributions
Paid From
Long-Term
Capital Gains
|
InfraCap REIT Preferred ETF | | | | $ | 1,137,316 | | | $ | 218,190 | | | $ | — | | | $ | — | | | $ | 518,041 | | | $ | — | | | $ | 36,296 | |
Virtus Cumberland Municipal Bond ETF | | | | | 224,207 | | | | — | | | | 337,203 | | | | — | | | | — | | | | 318,806 | | | | — | |
Virtus Glovista Emerging Markets ETF | | | | | 51,696 | | | | — | | | | — | | | | — | | | | — | | | | — | | | | — | |
Virtus InfraCap U.S. Preferred Stock ETF | | | | | 125,816 | | | | — | | | | — | | | | 7,187 | | | | — | | | | — | | | | — | |
Virtus LifeSci Biotech Clinical Trials ETF | | | | | 326,965 | | | | — | | | | — | | | | — | | | | — | | | | — | | | | — | |
Virtus LifeSci Biotech Products ETF | | | | | 68,685 | | | | — | | | | — | | | | — | | | | — | | | | — | | | | — | |
Virtus Newfleet Multi-Sector Bond ETF | | | | | 7,305,641 | | | | — | | | | — | | | | 1,863,781 | | | | 10,383,963 | | | | — | | | | 186,124 | |
Virtus WMC Global Factor Opportunities ETF | | | | | 19,408 | | | | — | | | | — | | | | — | | | | — | | | | — | | | | — | |
85
Notes to Financial Statements (continued)
October 31, 2018
At October 31, 2018, for Federal income tax purposes, the following Funds have capital loss carryforwards available to offset future capital gains for an unlimited period. To the extent that these loss carryforwards are utilized, capital gains so offset will not be distributed to shareholders:
| | | | Short-Term
No Expiration
| | Long-Term
No Expiration
| | Total
|
InfraCap REIT Preferred ETF | | | | $ | 507,902 | | | $ | — | | | $ | 507,902 | |
Virtus Glovista Emerging Markets ETF | | | | | 2,256,112 | | | | 9,733 | | | | 2,265,845 | |
Virtus LifeSci Biotech Clinical Trials ETF | | | | | 9,151,704 | | | | 7,652,802 | | | | 16,804,506 | |
Virtus LifeSci Biotech Products ETF | | | | | 2,964,974 | | | | 1,014,762 | | | | 3,979,736 | |
Virtus Newfleet Multi-Sector Bond ETF | | | | | 1,170,437 | | | | 814,430 | | | | 1,984,867 | |
For financial reporting purposes, capital accounts are adjusted to reflect the tax character of permanent book/tax differences. Results of operations and net assets were not affected by these reclassifications. Reclassifications are primarily due to tax treatment of redemptions in kind. At October 31, 2018, the effect of permanent book/tax reclassifications resulted in increases (decreases) to the components of net assets of the following Funds as follows:
Funds
| | | | Distributable
Earnings
(Accumulated
Deficit)
| | Paid-In-Capital
|
InfraCap REIT Preferred ETF | | | | $ | 3,044 | | | $ | (3,044 | ) |
Virtus Glovista Emerging Markets ETF | | | | | 293,032 | | | | (293,032 | ) |
Virtus LifeSci Biotech Clinical Trials ETF | | | | | (17,588,345 | ) | | | 17,588,345 | |
Virtus LifeSci Biotech Products ETF | | | | | (8,298,200 | ) | | | 8,298,200 | |
Virtus Newfleet Multi-Sector Bond ETF | | | | | (740 | ) | | | 740 | |
6. INVESTMENT TRANSACTIONS
Purchases and sales of investments (excluding short-term investments), subscription in-kind and redemption in-kind for the year ended October 31, 2018 were as follows:
Funds
| | | | Purchases
| | Sales
| | Subscriptions
In-Kind
| | Redemptions
In-Kind
| |
InfraCap REIT Preferred ETF | | | | $ | 15,486,566 | | | $ | 15,714,161 | | | $ | 3,805,589 | | | $ — | |
Virtus Cumberland Municipal Bond ETF | | | | | 2,089,451 | | | | 6,709,008 | | | | — | | | — | |
Virtus Glovista Emerging Markets ETF | | | | | 38,678,412 | | | | 31,613,293 | | | | 17,577,541 | | | 7,646,308 | |
Virtus InfraCap U.S. Preferred Stock ETF | | | | | 3,122,011 | | | | 2,633,710 | | | | 7,299,794 | | | — | |
Virtus LifeSci Biotech Clinical Trials ETF | | | | | 33,416,824 | | | | 33,796,750 | | | | 72,955,325 | | | 65,320,409 | |
Virtus LifeSci Biotech Products ETF | | | | | 10,863,166 | | | | 10,998,005 | | | | 14,861,234 | | | 23,891,248 | |
Virtus Newfleet Multi-Sector Bond ETF | | | | | 109,424,940 | | | | 170,909,197 | | | | — | | | — | |
Virtus WMC Global Factor Opportunities ETF | | | | | 4,267,642 | | | | 4,178,495 | | | | — | | | — | |
7. DERIVATIVE FINANCIAL INSTRUMENTS
Options
The Virtus InfraCap U.S. Preferred Stock ETF may write covered call and put options on portfolio securities and other financial instruments. Premiums received are recorded as liabilities. The liabilities are subsequently adjusted to reflect the current value of the options written. Premiums received from writing options that expire are treated as realized gains. Premiums received from writing options that are exercised or are closed are added to or offset against the proceeds or amount paid on the transactions to determine the net realized gain or loss. By writing a covered call option, the Fund, in exchange for the premium, foregoes the opportunity for capital appreciation above the exercise price should the market price of the underlying security increase. By writing a put option, the Fund, in exchange for the premium, accepts the risk of having to purchase a security at an exercise price that is above the current price. Changes in value of written options are reported as change in unrealized gain (loss) on written options in the Statement of Operations. When the written option expires, is terminated or is sold, the Fund will record a gain or loss, which is reported as realized gain (loss) on written options in the Statement of Operations. Written covered call options limit the upside potential of a security above the strike price. Written put options subject the Fund to risk of loss if the value of the security declines below the exercise price minus the put premium.
86
Notes to Financial Statements (continued)
October 31, 2018
The Virtus InfraCap U.S. Preferred Stock may purchase call and put options on the portfolio securities or other financial instruments. The Fund may purchase call options to protect against an increase in the price of the security or financial instrument it anticipates purchasing. The Fund may purchase put options on securities which it holds or other financial instruments to protect against a decline in the value of the security or financial instrument or to close out covered written positions. Changes in value of purchased options are reported as part of change in unrealized gain (loss) on investments in the Statement of Operations. When the purchased option expires, is terminated or is sold, the Fund will record a gain or loss, which is reported as part of realized gain (loss) on investments in the Statement of Operations. Risks may arise from an imperfect correlation between the change in market value of the securities held by the Fund and the prices of options relating to the securities purchased or sold by the Fund and from the possible lack of liquid secondary market for an option. The maximum exposure to loss for any purchased option is limited to the premium initially paid for the option.
Transactions in derivative instruments reflected on the Statement of Assets and Liabilities at October 31, 2018, are:
Assets
| | | | Equity Risk
|
Investments* | | | | $640 |
Liabilities
| | | | Equity Risk
|
Written options, at value | | | | $10,365 |
* | | Purchased option contracts are included in Investments on the Statement of Assets and Liabilities. |
Transactions in derivative instruments reflected on the Statement of Operations during the period were as follows:
Net Realized Gain (Loss) on:
| | | | Equity Risk
|
Investments* | | | | $ (1,865) |
Written options | | | | 31,996 |
* | | Purchased option contracts are included in Net Realized Gain (Loss) on Investments on the Statement of Operations. |
Change in Net Unrealized Appreciation (Depreciation) on:
| | | | Equity Risk
|
Investments** | | | | $(989) |
Written options | | | | (142) |
** | | Purchased option contracts are included in Change in Net Unrealized Appreciation (Depreciation) on Investments in the Statement of Operations. |
For the period ended October 31, 2018, the monthly average market value of the purchased options and written options contracts held by the Fund were $210 and $(8,617), respectively.
8. BORROWINGS
The Virtus InfraCap U.S. Preferred Stock ETF entered into a Lending Agreement (the “Agreement”) with a commercial bank (the “Bank”) that allows the Fund to borrow cash from the Bank. Borrowings under the Agreement are collateralized by investments of the Fund. If the Fund defaults with respect to any of its obligations under the Agreement, the Bank may foreclose on assets of the Fund and/or the Fund may be required to repay immediately, in part or in full, the loan balance outstanding under the Agreement, necessitating the sale of securities at potentially inopportune times. Interest is charged at the 3 Month LIBOR (London Interbank Offered Rate) plus an additional percentage rate on the amount borrowed. The Agreement has an on-demand commitment term. For the period ended October 31, 2018, the average daily borrowings under the Agreement and the daily average interest rate were $971,723 and 3.56%, respectively.
At October 31, 2018, the amount of such outstanding borrowings was as follows:
Outstanding Borrowings
| | | | Interest Rate
|
$1,878,897 | | | | 3.76% |
9. INVESTMENT RISKS
As with any investment, an investment in the Funds could result in a loss or the performance of the Funds could be inferior to that of other investments. An investor should consider each Fund’s investment objectives, risks, and charges and expenses carefully before investing. Each Fund’s prospectus and statement of additional information contain this and other important information.
87
Notes to Financial Statements (continued)
October 31, 2018
10. CREDIT RISK
Junk Bonds or High Yield Securities: High yield securities are generally subject to greater levels of credit quality risk than investment grade securities. The retail secondary market for these “junk bonds” may be less liquid than that of higher-rated fixed income securities, and adverse conditions could make it difficult at times to sell these securities or could result in lower prices than higher-rated fixed income securities. These risks can reduce the value of the Fund’s shares and the income it earns.
11. CASH CONCENTRATION RISK
At various times, the Funds may have cash and cash collateral balances that exceed federally insured limits.
12. 10% SHAREHOLDERS
As of October 31, 2018, certain Funds had individual shareholder account(s) and/or omnibus shareholder account(s) (comprised of a group of individual shareholders), which individually amounted to more than 10% of the total shares outstanding of each such Fund as detailed below:
Funds
| | | | % of Shares
Outstanding
| | Number of
Accounts
|
InfraCap REIT Preferred ETF | | | | | 57 | % | | | 3 | |
Virtus Cumberland Municipal Bond ETF | | | | | 75 | % | | | 1 | |
Virtus Glovista Emerging Markets ETF | | | | | 87 | % | | | 5 | |
Virtus InfraCap U.S. Preferred Stock ETF | | | | | 89 | % | | | 5 | |
Virtus LifeSci Biotech Clinical Trials ETF | | | | | 45 | % | | | 2 | |
Virtus LifeSci Biotech Products ETF | | | | | 59 | % | | | 4 | |
Virtus Newfleet Multi-Sector Bond ETF | | | | | 81 | % | | | 1 | |
Virtus WMC Global Factor Opportunities ETF | | | | | 96 | % | | | 2 | |
13. NEW ACCOUNTING PRONOUNCEMENT
In August 2018, the Financial Accounting Standards Board issued Accounting Standards Update (“ASU”), ASU No. 2018-13, which changes certain fair value measurement disclosure requirements. The new ASU, in addition to other modifications and additions, removes the requirement to disclose the amount and reasons for transfers between Level 1 and Level 2 of the fair value hierarchy, the policy for the timing of transfers between levels and the valuation process for Level 3 fair value measurements. For public companies, the amendments are effective for financial statements issued for fiscal years beginning after December 15, 2019, and interim periods within those fiscal years. Management has evaluated the implications of certain provisions of ASU No. 2018-13 and has determined to early adopt all aspects related to the removal and modification of certain fair value measurement disclosures under the ASU effective immediately.
In August 2018, the SEC adopted amendments to Regulation S-X which are intended to facilitate the disclosure of information to investors and simplify compliance without significantly altering the information provided to investors. The amendments include eliminating the requirement to: separately state book basis components of net assets on the Statement of Assets & Liabilities; separately state the sources of distributions paid (except tax return of capital distributions must still be separately disclosed) on the Statement of Changes in Net Assets; and state the book basis amount of undistributed net investment income on the Statement of Changes in Net Assets. The compliance date for the amendments to Regulation S-X is for filings made with the SEC after November 5, 2018. The adoption has not had an effect on the Funds’ net assets or results of operations.
On November 17, 2016, the FASB issued ASU 2016-18, Statement of Cash Flows (Topic 230): Restricted Cash. This update intends to reduce diversity in the presentation of restricted cash and restricted cash equivalents in the statement. Any restricted cash and restricted cash equivalents will be included as components of cash and cash equivalents as presented on the statement of cash flows. For the Trust, the effective date of this update is for periods beginning after December 15, 2017. At this time, management is evaluating the implications of this ASU and believes it will not have a material impact on the financial statements.
14. SUBSEQUENT EVENTS
The Funds are required to recognize in the financial statements the effects of all subsequent events that provide additional evidence about conditions that existed as of the date of the Statements of Assets and Liabilities. For non-recognized subsequent events that must be disclosed to keep the financial statements from being misleading, the Funds are required to disclose the nature of the event as well as an estimate of its financial effect, or a statement that such an estimate cannot be made. Management has evaluated subsequent events through the issuance of these financial statements and has determined that there are no material events that would require disclosure.
88
Schedule of Investments — InfraCap MLP ETF
October 31, 2018
Security Description
| | | | Shares
| | Value
|
Common Stocks—143.8%(1) | | | | | | | | | | |
| | | | | | | | | | | |
Energy—143.8% | | | | | | | | | | |
Andeavor Logistics LP | | | | | 698,409 | | | $ | 27,978,265 | |
Antero Midstream Partners LP(2) | | | | | 203,334 | | | | 6,130,520 | |
BP Midstream Partners LP | | | | | 1,494,643 | | | | 27,277,235 | |
BP PLC (United Kingdom)(2)(3) | | | | | 120,964 | | | | 5,246,209 | |
Buckeye Partners LP(2) | | | | | 80,293 | | | | 2,634,413 | |
Crestwood Equity Partners LP | | | | | 154,344 | | | | 5,202,936 | |
DCP Midstream LP | | | | | 33,495 | | | | 1,205,485 | |
Dominion Energy Midstream Partners LP | | | | | 69,766 | | | | 1,264,160 | |
Enable Midstream Partners LP | | | | | 100,430 | | | | 1,483,351 | |
Enbridge Energy Partners LP | | | | | 2,142,827 | | | | 22,628,253 | |
Enbridge, Inc. (Canada) | | | | | 608 | | | | 18,915 | |
Energy Transfer LP(2) | | | | | 4,893,987 | | | | 76,052,558 | |
EnLink Midstream LLC(2) | | | | | 42,210 | | | | 548,730 | |
EnLink Midstream Partners LP(2) | | | | | 2,315,336 | | | | 35,100,494 | |
Enterprise Products Partners LP | | | | | 2,156,859 | | | | 57,846,958 | |
EQGP Holdings LP | | | | | 191,114 | | | | 3,000,490 | |
EQM Midstream Partners LP | | | | | 1,631,083 | | | | 74,883,020 | |
Genesis Energy LP(2) | | | | | 696,869 | | | | 15,407,774 | |
Holly Energy Partners LP | | | | | 12,693 | | | | 369,620 | |
HollyFrontier Corp.(2) | | | | | 57,028 | | | | 3,845,968 | |
Kinder Morgan, Inc.(2) | | | | | 266,691 | | | | 4,539,081 | |
Magellan Midstream Partners LP | | | | | 642,656 | | | | 39,639,022 | |
Marathon Petroleum Corp.(2) | | | | | 813,896 | | | | 57,338,955 | |
MPLX LP | | | | | 2,094,262 | | | | 70,388,146 | |
NGL Energy Partners LP | | | | | 965,007 | | | | 9,128,966 | |
Noble Midstream Partners LP | | | | | 639,877 | | | | 21,845,401 | |
NuStar Energy LP | | | | | 328,341 | | | | 7,778,398 | |
ONEOK, Inc.(2) | | | | | 255,193 | | | | 16,740,661 | |
Phillips 66(2) | | | | | 409,541 | | | | 42,109,006 | |
Phillips 66 Partners LP | | | | | 475,016 | | | | 23,233,033 | |
Plains All American Pipeline LP(2) | | | | | 1,399,360 | | | | 30,464,067 | |
Royal Dutch Shell PLC Class A (Netherlands)(2)(3) | | | | | 95,713 | | | | 6,048,104 | |
Shell Midstream Partners LP | | | | | 136,318 | | | | 2,786,340 | |
Spectra Energy Partners LP | | | | | 115,811 | | | | 3,995,479 | |
Tallgrass Energy LP | | | | | 235,978 | | | | 5,134,881 | |
Targa Resources Corp. | | | | | 1,154 | | | | 59,627 | |
Valero Energy Partners LP | | | | | 86,070 | | | | 3,613,219 | |
Western Gas Equity Partners LP | | | | | 218,817 | | | | 6,293,177 | |
Western Gas Partners LP | | | | | 514,775 | | | | 20,364,499 | |
Williams Cos., Inc. (The)(2) | | | | | 1,393,669 | | | | 33,907,967 | |
| | | | | | | | | | | |
Total Common Stocks | | | | | | | | | | |
(Cost $872,840,454) | | | | | | | | | 773,533,383 | |
| | | | | | | | | | | |
Exchange Traded Funds — 3.1%(1) | | | | | | | | | | |
| | | | | | | | | | | |
Debt Fund — 3.1% | | | | | | | | | | |
iShares 20+ Year Treasury Bond ETF(2) | | | | | 147,957 | | | | 16,804,956 | |
| | | | | | | | | | | |
Commodity Fund — 0.0%(4) | | | | | | | | | | |
United States Oil Fund LP* | | | | | 9,166 | | | | 126,399 | |
| | | | | | | | | | | |
Total Exchange Traded Funds | | | | | | | | | | |
(Cost $17,629,726) | | | | | | | | | 16,931,355 | |
| | | | | | | | | | | |
Exchange Traded Note — 0.9%(1) | | | | | | | | | | |
| | | | | | | | | | | |
Equity Fund — 0.9% | | | | | | | | | | |
JPMorgan Alerian MLP Index ETN(2) | | | | | 184,207 | | | | 4,603,333 | |
Total Exchange Traded Note | | | | | | | | | | |
(Cost $5,098,333) | | | | | | | | | 4,603,333 | |
Security Description
| | | | Notional
Amount
| | Number of
contracts
| | Value
|
Purchased Options — 0.8% | | | | | | | | | | | | | | |
| | | | | | | | | | | | | | | |
Purchased Put Options | | | | | | | | | | | | | | |
SPDR S&P 500 ETF Trust, | | | | | | | | | | | | | | |
Expires 11/16/18, | | | | | | | | | | | | | | |
Strike Price $262.50 | | | | | 500,000 | | | | 5,000 | | | $ | 1,095,000 | |
SPDR S&P 500 ETF Trust, | | | | | | | | | | | | | | |
Expires 12/21/18, | | | | | | | | | | | | | | |
Strike Price $260.00 | | | | | 500,000 | | | | 5,000 | | | | 2,125,000 | |
| | | | | | | | | | | | | | | |
Purchased Call Options | | | | | | | | | | | | | | |
Enterprise Products Partners LP, | | | | | | | | | | | | | | |
Expires 11/16/18, | | | | | | | | | | | | | | |
Strike Price $29.00 | | | | | 110,000 | | | | 1,100 | | | | 1,100 | |
iShares 20+ Year Treasury Bond ETF, | | | | | | | | | | | | | | |
Expires 11/16/18, | | | | | | | | | | | | | | |
Strike Price $127.00 | | | | | 30,000 | | | | 300 | | | | 300 | |
iShares 20+ Year Treasury Bond ETF, | | | | | | | | | | | | | | |
Expires 11/16/18, | | | | | | | | | | | | | | |
Strike Price $130.00 | | | | | 217,600 | | | | 2,176 | | | | 0 | |
iShares 20+ Year Treasury Bond ETF, | | | | | | | | | | | | | | |
Expires 12/21/18, | | | | | | | | | | | | | | |
Strike Price $130.00 | | | | | 241,700 | | | | 2,417 | | | | 9,668 | |
SPDR S&P 500 ETF Trust, | | | | | | | | | | | | | | |
Expires 12/21/18, | | | | | | | | | | | | | | |
Strike Price $309.00 | | | | | 50,000 | | | | 500 | | | | 2,250 | |
SPDR S&P 500 ETF Trust, | | | | | | | | | | | | | | |
Expires 12/21/18, | | | | | | | | | | | | | | |
Strike Price $310.00 | | | | | 50,000 | | | | 500 | | | | 3,000 | |
United States Natural Gas Fund LP, | | | | | | | | | | | | | | |
Expires 01/18/19, | | | | | | | | | | | | | | |
Strike Price $28.00 | | | | | 458,600 | | | | 4,586 | | | | 825,480 | |
United States Natural Gas Fund LP, | | | | | | | | | | | | | | |
Expires 01/18/19, | | | | | | | | | | | | | | |
Strike Price $29.00 | | | | | 210,000 | | | | 2,100 | | | | 311,850 | |
| | | | | | | | | | | | | | | |
TOTAL PURCHASED OPTIONS | | | | | | | | | | | | | | |
(Cost $7,407,930) | | | | | | | | | | | | | 4,373,648 | |
| | | | | | | | | | | | | | | |
TOTAL INVESTMENTS — 148.6% | | | | | | | | | | | | | | |
(Cost $902,976,443) | | | | | | | | | | | | | 799,441,719 | |
| | | | Shares
| | | | |
Securities Sold Short — (6.6)% | | | | | | | | | | |
| | | | | | | | | | | |
Exchange Traded Funds — (6.6)% | | | | | | | | | | |
| | | | | | | | | | | |
Commodity Fund — (6.6)% | | | | | | | | | | |
United States Natural Gas Fund LP* | | | | | (1,339,297 | ) | | | (35,759,230 | ) |
| | | | | | | | | | | |
Total Exchange Traded Funds | | | | | | | | | | |
(Proceeds $(31,597,328)) | | | | | | | | | (35,759,230 | ) |
| | | | | | | | | | | |
Total Securities Sold Short — (6.6)% | | | | | | | | | | |
(Proceeds $(31,597,328)) | | | | | | | | | (35,759,230 | ) |
Liabilities in Excess of Other Assets — (42.0)% | | | | | | | | | (225,861,037 | ) |
| | | | | | | | | | | |
Net Assets — 100.0% | | | | | | | | $ | 537,821,452 | |
The accompanying notes are an integral part of these financial statements.
89
Schedule of Investments — InfraCap MLP ETF (continued)
October 31, 2018
Security Description
| | | | Notional
Amount
| | Number of
contracts
| | Value
|
Written Options — (1.1)% | | | | | | | | | | | | | | |
| | | | | | | | | | | | | | | |
Written Calls Option | | | | | | | | | | | | | | |
Antero Midstream Partners LP, | | | | | | | | | | | | | | |
Expires 12/21/18, | | | | | | | | | | | | | | |
Strike Price $35.00 | | | | | (272,600 | ) | | | (2,726 | ) | | $ | (81,780 | ) |
BP PLC, | | | | | | | | | | | | | | |
Expires 11/16/18, | | | | | | | | | | | | | | |
Strike Price $46.00 | | | | | (40,000 | ) | | | (400 | ) | | | (4,000 | ) |
Buckeye Partners LP, | | | | | | | | | | | | | | |
Expires 11/16/18, | | | | | | | | | | | | | | |
Strike Price $40.00 | | | | | (20,000 | ) | | | (200 | ) | | | (1,000 | ) |
Energy Transfer LP, | | | | | | | | | | | | | | |
Expires 11/02/18, | | | | | | | | | | | | | | |
Strike Price $18.00 | | | | | (1,000 | ) | | | (10 | ) | | | 0 | |
Energy Transfer LP, | | | | | | | | | | | | | | |
Expires 11/09/18, | | | | | | | | | | | | | | |
Strike Price $18.00 | | | | | (11,000 | ) | | | (110 | ) | | | (110 | ) |
Energy Transfer LP, | | | | | | | | | | | | | | |
Expires 11/16/18, | | | | | | | | | | | | | | |
Strike Price $18.00 | | | | | (90,000 | ) | | | (900 | ) | | | (1,800 | ) |
Energy Transfer LP, | | | | | | | | | | | | | | |
Expires 11/23/18, | | | | | | | | | | | | | | |
Strike Price $18.00 | | | | | (210,000 | ) | | | (2,100 | ) | | | (8,400 | ) |
Energy Transfer LP, | | | | | | | | | | | | | | |
Expires 11/30/18, | | | | | | | | | | | | | | |
Strike Price $18.00 | | | | | (80,000 | ) | | | (800 | ) | | | (3,600 | ) |
Energy Transfer LP, | | | | | | | | | | | | | | |
Expires 12/21/18, | | | | | | | | | | | | | | |
Strike Price $18.00 | | | | | (350,000 | ) | | | (3,500 | ) | | | (42,000 | ) |
Energy Transfer LP, | | | | | | | | | | | | | | |
Expires 01/18/19, | | | | | | | | | | | | | | |
Strike Price $18.00 | | | | | (101,000 | ) | | | (1,010 | ) | | | (21,210 | ) |
EnLink Midstream LLC, | | | | | | | | | | | | | | |
Expires 12/21/18, | | | | | | | | | | | | | | |
Strike Price $17.50 | | | | | (2,000 | ) | | | (20 | ) | | | (160 | ) |
EnLink Midstream LLC, | | | | | | | | | | | | | | |
Expires 03/15/19, | | | | | | | | | | | | | | |
Strike Price $17.50 | | | | | (1,000 | ) | | | (10 | ) | | | (200 | ) |
EnLink Midstream Partners LP, | | | | | | | | | | | | | | |
Expires 11/16/18, | | | | | | | | | | | | | | |
Strike Price $16.00 | | | | | (20,000 | ) | | | (200 | ) | | | (5,500 | ) |
EnLink Midstream Partners LP, | | | | | | | | | | | | | | |
Expires 11/16/18, | | | | | | | | | | | | | | |
Strike Price $17.00 | | | | | (200,000 | ) | | | (2,000 | ) | | | (20,000 | ) |
EnLink Midstream Partners LP, | | | | | | | | | | | | | | |
Expires 11/16/18, | | | | | | | | | | | | | | |
Strike Price $19.00 | | | | | (101,000 | ) | | | (1,010 | ) | | | (2,020 | ) |
EnLink Midstream Partners LP, | | | | | | | | | | | | | | |
Expires 12/21/18, | | | | | | | | | | | | | | |
Strike Price $19.00 | | | | | (30,000 | ) | | | (300 | ) | | | (2,700 | ) |
Genesis Energy LP, | | | | | | | | | | | | | | |
Expires 12/21/18, | | | | | | | | | | | | | | |
Strike Price $25.00 | | | | | (220,000 | ) | | | (2,200 | ) | | | (44,000 | ) |
Genesis Energy LP, | | | | | | | | | | | | | | |
Expires 12/21/18, | | | | | | | | | | | | | | |
Strike Price $27.50 | | | | | (10,000 | ) | | | (100 | ) | | | (500 | ) |
HollyFrontier Corp, | | | | | | | | | | | | | | |
Expires 11/16/18, | | | | | | | | | | | | | | |
Strike Price $73.00 | | | | | (60,000 | ) | | | (600 | ) | | | (60,000 | ) |
| | | | | | | | | | | | | | | |
Security Description
| | | | Notional
Amount
| | Number of
contracts
| | Value
|
Written Options (continued) | | | | | | | | | | | | | | |
| | | | | | | | | | | | | | | |
Written Calls Option (continued) | | | | | | | | | | | | | | |
iShares 20+ Year Treasury Bond ETF, | | | | | | | | | | | | | | |
Expires 11/02/18, | | | | | | | | | | | | | | |
Strike Price $120.00 | | | | | (10,000 | ) | | | (100 | ) | | $ | 0 | |
iShares 20+ Year Treasury Bond ETF, | | | | | | | | | | | | | | |
Expires 11/09/18, | | | | | | | | | | | | | | |
Strike Price $119.00 | | | | | (100,000 | ) | | | (1,000 | ) | | | (2,000 | ) |
iShares 20+ Year Treasury Bond ETF, | | | | | | | | | | | | | | |
Expires 11/16/18, | | | | | | | | | | | | | | |
Strike Price $117.00 | | | | | (110,000 | ) | | | (1,100 | ) | | | (15,400 | ) |
iShares 20+ Year Treasury Bond ETF, | | | | | | | | | | | | | | |
Expires 11/16/18, | | | | | | | | | | | | | | |
Strike Price $118.00 | | | | | (30,000 | ) | | | (300 | ) | | | (2,400 | ) |
iShares 20+ Year Treasury Bond ETF, | | | | | | | | | | | | | | |
Expires 11/16/18, | | | | | | | | | | | | | | |
Strike Price $119.00 | | | | | (10,000 | ) | | | (100 | ) | | | (500 | ) |
iShares 20+ Year Treasury Bond ETF, | | | | | | | | | | | | | | |
Expires 11/23/18, | | | | | | | | | | | | | | |
Strike Price $119.00 | | | | | (120,000 | ) | | | (1,200 | ) | | | (8,400 | ) |
iShares 20+ Year Treasury Bond ETF, | | | | | | | | | | | | | | |
Expires 11/30/18, | | | | | | | | | | | | | | |
Strike Price $119.00 | | | | | (110,000 | ) | | | (1,100 | ) | | | (11,000 | ) |
iShares 20+ Year Treasury Bond ETF, | | | | | | | | | | | | | | |
Expires 12/07/18, | | | | | | | | | | | | | | |
Strike Price $119.00 | | | | | (121,000 | ) | | | (1,210 | ) | | | (22,990 | ) |
iShares 20+ Year Treasury Bond ETF, | | | | | | | | | | | | | | |
Expires 12/21/18, | | | | | | | | | | | | | | |
Strike Price $119.00 | | | | | (110,000 | ) | | | (1,100 | ) | | | (24,200 | ) |
iShares 20+ Year Treasury Bond ETF, | | | | | | | | | | | | | | |
Expires 12/21/18, | | | | | | | | | | | | | | |
Strike Price $120.00 | | | | | (120,000 | ) | | | (1,200 | ) | | | (20,400 | ) |
JPMorgan Alerian MLP Index ETN, | | | | | | | | | | | | | | |
Expires 11/02/18, | | | | | | | | | | | | | | |
Strike Price $28.00 | | | | | (220,000 | ) | | | (2,200 | ) | | | (1 | ) |
JPMorgan Alerian MLP Index ETN, | | | | | | | | | | | | | | |
Expires 11/02/18, | | | | | | | | | | | | | | |
Strike Price $28.50 | | | | | (100,000 | ) | | | (1,000 | ) | | | 0 | |
Kinder Morgan Inc, | | | | | | | | | | | | | | |
Expires 11/09/18, | | | | | | | | | | | | | | |
Strike Price $18.50 | | | | | (201,000 | ) | | | (2,010 | ) | | | (6,030 | ) |
Kinder Morgan Inc, | | | | | | | | | | | | | | |
Expires 11/23/18, | | | | | | | | | | | | | | |
Strike Price $18.50 | | | | | (60,000 | ) | | | (600 | ) | | | (3,000 | ) |
Marathon Petroleum Corp, | | | | | | | | | | | | | | |
Expires 11/02/18, | | | | | | | | | | | | | | |
Strike Price $89.50 | | | | | (80,000 | ) | | | (800 | ) | | | 0 | |
Marathon Petroleum Corp, | | | | | | | | | | | | | | |
Expires 11/09/18, | | | | | | | | | | | | | | |
Strike Price $88.00 | | | | | (141,000 | ) | | | (1,410 | ) | | | 0 | |
Marathon Petroleum Corp, | | | | | | | | | | | | | | |
Expires 11/16/18, | | | | | | | | | | | | | | |
Strike Price $80.00 | | | | | (111,000 | ) | | | (1,110 | ) | | | (33,300 | ) |
ONEOK Inc, | | | | | | | | | | | | | | |
Expires 11/30/18, | | | | | | | | | | | | | | |
Strike Price $67.00 | | | | | (150,000 | ) | | | (1,500 | ) | | | (142,500 | ) |
Phillips 66, | | | | | | | | | | | | | | |
Expires 11/02/18, | | | | | | | | | | | | | | |
Strike Price $125.00 | | | | | (20,000 | ) | | | (200 | ) | | | 0 | |
The accompanying notes are an integral part of these financial statements.
90
Schedule of Investments — InfraCap MLP ETF (continued)
October 31, 2018
Security Description
| | | | Notional
Amount
| | Number of
contracts
| | Value
|
Written Options (continued) | | | | | | | | | | | | | | |
| | | | | | | | | | | | | | | |
Written Calls Option (continued) | | | | | | | | | | | | | | |
Phillips 66, | | | | | | | | | | | | | | |
Expires 11/16/18, | | | | | | | | | | | | | | |
Strike Price $109.00 | | | | | (120,000 | ) | | | (1,200 | ) | | $ | (78,000 | ) |
Phillips 66, | | | | | | | | | | | | | | |
Expires 11/16/18, | | | | | | | | | | | | | | |
Strike Price $110.00 | | | | | (20,000 | ) | | | (200 | ) | | | (10,000 | ) |
Plains All American Pipeline LP, | | | | | | | | | | | | | | |
Expires 11/16/18, | | | | | | | | | | | | | | |
Strike Price $25.00 | | | | | (20,000 | ) | | | (200 | ) | | | (1,600 | ) |
Royal Dutch Shell PLC, | | | | | | | | | | | | | | |
Expires 11/23/18, | | | | | | | | | | | | | | |
Strike Price $70.00 | | | | | (20,000 | ) | | | (200 | ) | | | (3,000 | ) |
Royal Dutch Shell PLC, | | | | | | | | | | | | | | |
Expires 12/21/18, | | | | | | | | | | | | | | |
Strike Price $70.00 | | | | | (20,000 | ) | | | (200 | ) | | | (6,000 | ) |
SPDR S&P 500 ETF Trust, | | | | | | | | | | | | | | |
Expires 11/02/18, | | | | | | | | | | | | | | |
Strike Price $275.00 | | | | | (50,000 | ) | | | (500 | ) | | | (17,500 | ) |
SPDR S&P 500 ETF Trust, | | | | | | | | | | | | | | |
Expires 12/21/18, | | | | | | | | | | | | | | |
Strike Price $283.00 | | | | | (50,000 | ) | | | (500 | ) | | | (105,000 | ) |
SPDR S&P 500 ETF Trust, | | | | | | | | | | | | | | |
Expires 12/21/18, | | | | | | | | | | | | | | |
Strike Price $284.00 | | | | | (50,000 | ) | | | (500 | ) | | | (92,500 | ) |
Williams Cos., Inc. (The), | | | | | | | | | | | | | | |
Expires 11/02/18, | | | | | | | | | | | | | | |
Strike Price $29.00 | | | | | (90,400 | ) | | | (904 | ) | | | 0 | |
| | | | | | | | | | | | | | | |
Written Put Option | | | | | | | | | | | | | | |
Cheniere Energy Partners LP, | | | | | | | | | | | | | | |
Expires 12/21/18, | | | | | | | | | | | | | | |
Strike Price $35.00 | | | | | (17,400 | ) | | | (174 | ) | | | (43,500 | ) |
SPDR S&P 500 ETF Trust, | | | | | | | | | | | | | | |
Expires 11/16/18, | | | | | | | | | | | | | | |
Strike Price $267.00 | | | | | (500,000 | ) | | | (5,000 | ) | | | (1,730,000 | ) |
SPDR S&P 500 ETF Trust, | | | | | | | | | | | | | | |
Expires 12/21/18, | | | | | | | | | | | | | | |
Strike Price $264.00 | | | | | (500,000 | ) | | | (5,000 | ) | | | (2,620,000 | ) |
United States Natural Gas Fund LP, | | | | | | | | | | | | | | |
Expires 11/02/18, | | | | | | | | | | | | | | |
Strike Price $23.00 | | | | | (60,000 | ) | | | (600 | ) | | | 0 | |
| | | | | | | | | | | | | | | |
Security Description
| | | | Notional
Amount
| | Number of
contracts
| | Value
|
Written Options (continued) | | | | | | | | | | | | | | |
| | | | | | | | | | | | | | | |
Written Put Option (continued) | | | | | | | | | | | | | | |
United States Natural Gas Fund LP, | | | | | | | | | | | | | | |
Expires 11/09/18, | | | | | | | | | | | | | | |
Strike Price $24.00 | | | | | (140,000 | ) | | | (1,400 | ) | | $ | (5,600 | ) |
United States Natural Gas Fund LP, | | | | | | | | | | | | | | |
Expires 11/16/18, | | | | | | | | | | | | | | |
Strike Price $24.00 | | | | | (100,000 | ) | | | (1,000 | ) | | | (6,000 | ) |
United States Natural Gas Fund LP, | | | | | | | | | | | | | | |
Expires 11/23/18, | | | | | | | | | | | | | | |
Strike Price $23.50 | | | | | (120,000 | ) | | | (1,200 | ) | | | (12,000 | ) |
United States Natural Gas Fund LP, | | | | | | | | | | | | | | |
Expires 11/23/18, | | | | | | | | | | | | | | |
Strike Price $24.00 | | | | | (200,000 | ) | | | (2,000 | ) | | | (38,000 | ) |
United States Natural Gas Fund LP, | | | | | | | | | | | | | | |
Expires 11/30/18, | | | | | | | | | | | | | | |
Strike Price $23.50 | | | | | (300,000 | ) | | | (3,000 | ) | | | (93,000 | ) |
United States Natural Gas Fund LP, | | | | | | | | | | | | | | |
Expires 12/07/18, | | | | | | | | | | | | | | |
Strike Price $23.50 | | | | | (141,000 | ) | | | (1,410 | ) | | | (46,530 | ) |
United States Natural Gas Fund LP, | | | | | | | | | | | | | | |
Expires 12/21/18, | | | | | | | | | | | | | | |
Strike Price $23.00 | | | | | (140,000 | ) | | | (1,400 | ) | | | (50,400 | ) |
United States Natural Gas Fund LP, | | | | | | | | | | | | | | |
Expires 01/18/19, | | | | | | | | | | | | | | |
Strike Price $23.00 | | | | | (210,000 | ) | | | (2,100 | ) | | | (163,800 | ) |
| | | | | | | | | | | | | | | |
TOTAL WRITTEN OPTIONS — (1.1)% |
(Premiums Received $7,503,009) | | | | | | | | | | | | | (5,713,531 | ) |
Abbreviations:
ADR — American Depositary Receipt
ETF — Exchange Traded Fund
ETN — Exchange Traded Note
LP — Limited Partnership
PLC — Public Limited Company
* | | Non-income producing security. |
(1) | | Substantially all the securities, or a portion thereof, have been pledged as collateral for line of credit borrowings, short sales and open written option contracts. The aggregate market value of the collateral at October 31, 2018 was $764,554,933. |
(2) | | Subject to written call options. |
(3) | | American Depositary Receipts. |
(4) | | Amount rounds to less than 0.05%. |
The accompanying notes are an integral part of these financial statements.
91
Schedule of Investments — InfraCap MLP ETF (continued)
October 31, 2018
The following table summarizes valuation of the Fund’s investments under the fair value hierarchy levels as of October 31, 2018:
| | | | Level 1
| | Level 2
| | Level 3
| | Total
|
Asset Valuation Inputs | | | | | | | | | | | | | | | | | | |
Common Stocks | | | | $ | 773,533,383 | | | $ | — | | | $ | — | | | $ | 773,533,383 | |
Exchange Traded Funds | | | | | 16,931,355 | | | | — | | | | — | | | | 16,931,355 | |
Exchange Traded Note | | | | | 4,603,333 | | | | — | | | | — | | | | 4,603,333 | |
Purchased Options | | | | | 4,373,648 | | | | — | | | | — | | | | 4,373,648 | |
Total | | | | $ | 799,441,719 | | | $ | — | | | $ | — | | | $ | 799,441,719 | |
Liability Valuation Inputs | | | | | | | | | | | | | | | | | | |
Exchange Traded Fund | | | | $ | 35,759,230 | | | $ | — | | | $ | — | | | $ | 35,759,230 | |
Written Options | | | | | 5,617,230 | | | | 96,301 | | | | — | | | | 5,713,531 | |
Total | | | | $ | 41,376,460 | | | $ | 96,301 | | | $ | — | | | $ | 41,472,761 | |
There were no Level 3 securities as of October 31, 2018.
The accompanying notes are an integral part of these financial statements.
92
Statement of Assets and Liabilities
October 31, 2018
| | | | InfraCap MLP
ETF
|
Assets: | | | | | | |
Investments, at cost | | | | $ | 902,976,443 | |
Investments, at value | | | | | 799,441,719 | |
Cash | | | | | 12,724,023 | |
Due from brokers | | | | | 10,810,823 | |
Receivables: | | | | | | |
Investment securities sold | | | | | 12,441,748 | |
Dividends and interest receivable | | | | | 139,770 | |
Tax reclaim | | | | | 9,516 | |
Prepaid taxes | | | | | 5,567,257 | |
Deferred Tax Asset, Net of Valuation Allowance | | | | | 2,256,621 | |
Total Assets | | | | | 843,391,477 | |
Liabilities: | | | | | | |
Borrowings | | | | | 232,511,574 | |
Payables: | | | | | | |
Investment securities purchased | | | | | 29,524,605 | |
Capital shares payable | | | | | 1,575,091 | |
Sub-Advisory fees | | | | | 485,994 | |
Written options, at value (a) | | | | | 5,713,531 | |
Security sold short, at value (b) | | | | | 35,759,230 | |
Total Liabilities | | | | | 305,570,025 | |
Net Assets | | | | $ | 537,821,452 | |
Net Assets Consist of: | | | | | | |
Paid-in capital | | | | $ | 636,945,964 | |
Total distributable earnings (accumulated deficit), net of income taxes | | | | | (99,124,512 | ) |
Net Assets | | | | $ | 537,821,452 | |
Shares outstanding (unlimited number of shares of beneficial interest authorized, no par value) | | | | | 84,200,004 | |
Net asset value per share | | | | $ | 6.39 | |
(a) Premiums received | | | | $ | 7,503,009 | |
(b) Proceeds received from securities sold short | | | | $ | 31,597,328 | |
The accompanying notes are an integral part of these financial statements.
93
Statement of Operations
For the Year Ended October 31, 2018
| | | | InfraCap MLP
ETF
|
Investment Income: | | | | | | |
Distributions from master limited partnerships | | | | $ | 53,597,522 | |
Dividend income (net of foreign withholding taxes) | | | | | 2,774,933 | |
Interest income | | | | | 7,960 | |
Less: Return of capital distributions | | | | | (53,722,441 | ) |
Total Investment Income | | | | | 2,657,974 | |
Expenses: | | | | | | |
Dividend and interest expenses | | | | | 8,734,418 | |
Sub-Advisory fees | | | | | 5,771,439 | |
Franchise tax expense | | | | | 12,675 | |
Total Expenses | | | | | 14,518,532 | |
Net Investment Loss Before Income Taxes | | | | | (11,860,558 | ) |
Income tax benefit (expense) | | | | | (77,192 | ) |
Net Investment Loss, net of taxes | | | | | (11,937,750 | ) |
Net Realized Gain (Loss) on: | | | | | | |
Investments | | | | | (9,800,918 | ) |
In-kind redemptions | | | | | 1,206,233 | |
Written Options | | | | | 45,171,637 | |
Securities sold short | | | | | (20,359,154 | ) |
Total Net Realized Gain | | | | | 16,217,798 | |
Change in Net Unrealized Appreciation (Depreciation) on: | | | | | | |
Investments | | | | | (40,657,119 | ) |
Written Options | | | | | (275,983 | ) |
Securities sold short | | | | | (1,374,950 | ) |
Total Change in Net Unrealized Appreciation (Depreciation) | | | | | (42,308,052 | ) |
Net Realized and Change in Unrealized Loss | | | | | (26,090,254 | ) |
Net Decrease in Net Assets Resulting from Operations | | | | $ | (38,028,004 | ) |
Foreign withholding taxes | | | | $ | 6,701 | |
The accompanying notes are an integral part of these financial statements.
94
Statement of Changes in Net Assets
| | | | InfraCap MLP ETF
|
| | | | For the
Year Ended
October 31, 2018
| | For the
Year Ended
October 31, 2017
|
Increase (Decrease) in Net Assets Resulting from Operations: | | | | | | | | | | |
Net investment loss, net of income taxes | | | | $ | (11,937,750 | ) | | $ | (5,888,340 | ) |
Net realized gain on investments, written options and securities sold short, net of income taxes | | | | | 16,217,798 | | | | 31,422,159 | |
Net change in unrealized depreciation on investments, written options and securities sold short,
net of income taxes | | | | | (42,308,052 | ) | | | (64,713,427 | ) |
Net decrease in net assets resulting from operations | | | | | (38,028,004 | ) | | | (39,179,608 | ) |
Distributions to Shareholders1 | | | | | — | | | | (22,241,012 | ) |
Distributions to Shareholders from return of capital | | | | | (119,404,506 | ) | | | (56,174,997 | ) |
Total distributions | | | | | (119,404,506 | ) | | | (78,416,009 | ) |
Shareholder Transactions: | | | | | | | | | | |
Proceeds from shares sold | | | | | 250,592,039 | | | | 507,687,243 | |
Cost of shares redeemed | | | | | (60,217,441 | ) | | | (4,818,432 | ) |
Net increase in net assets resulting from shareholder transactions | | | | | 190,374,598 | | | | 502,868,811 | |
Increase in net assets | | | | | 32,942,088 | | | | 385,273,194 | |
Net Assets: | | | | | | | | | | |
Beginning of year | | | | | 504,879,364 | | | | 119,606,170 | |
End of year1 | | | | $ | 537,821,452 | | | $ | 504,879,364 | |
Changes in Shares Outstanding: | | | | | | | | | | |
Shares outstanding, beginning of year | | | | | 60,300,004 | | | | 11,250,004 | |
Shares sold | | | | | 31,550,000 | | | | 49,500,000 | |
Shares redeemed | | | | | (7,650,000 | ) | | | (450,000 | ) |
Shares outstanding, end of year | | | | | 84,200,004 | | | | 60,300,004 | |
The accompanying notes are an integral part of these financial statements.
95
Statement of Cash Flows
For the year ended October 31, 2018
| | | | InfraCap MLP
ETF
|
Cash Flows From Operating Activities: | | | | | | |
Net decrease in net assets from operations | | | | $ | (38,028,004 | ) |
Adjustments to reconcile net increase in net assets from operations to net cash provided by operating activities: | | | | | | |
Purchases of investment securities | | | | | (1,244,806,333 | ) |
Proceeds from sales of investment securities | | | | | 1,344,970,987 | |
Net proceeds from purchased and written options | | | | | 52,834,959 | |
Proceeds from securities sold short | | | | | 713,088,083 | |
Payments made to cover securities sold short | | | | | (757,997,416 | ) |
Net realized loss on investments | | | | | 9,800,918 | |
Net realized loss on securities sold short | | | | | 20,359,154 | |
Net realized gain on written options | | | | | (45,171,637 | ) |
Net realized gain on in-kind redemptions | | | | | (1,206,233 | ) |
Net change in unrealized depreciation on investments | | | | | 40,657,119 | |
Net change in unrealized depreciation on securities sold short | | | | | 1,374,950 | |
Net change in unrealized depreciation on written options | | | | | 275,983 | |
Decrease in deferred tax asset, net of valuation allowance | | | | | 5,077,723 | |
Increase in dividends and interest receivable | | | | | 48,073 | |
Decrease in income tax receivable | | | | | 62,493 | |
Increase in current tax payable | | | | | (7,334,344 | ) |
Decrease in prepaid expenses | | | | | 2,173 | |
Increase in prepaid taxes | | | | | (5,567,257 | ) |
Increase in tax reclaim receivable | | | | | (6,928 | ) |
Decrease in due from brokers | | | | | 39,782,990 | |
Increase in sub-advisory fees payable | | | | | (310,553 | ) |
Decrease in capital shares payable | | | | | 1,575,091 | |
Net cash provided by operating activities | | | | | 129,481,991 | |
| | | | | | | |
Cash Flows from Financing Activities: | | | | | | |
Proceeds from borrowings | | | | | 89,828,561 | |
Payments for fund shares sold in excess of in-kind creations | | | | | (116,454,426 | ) |
Distributions paid | | | | | (119,404,506 | ) |
Net cash used in financing activities | | | | | (146,030,371 | ) |
Net decrease in cash | | | | | (16,548,380 | ) |
Cash, beginning of year | | | | | 29,272,403 | |
Cash, end of year | | | | $ | 12,724,023 | |
Supplementary information: | | | | | | |
Interest paid on borrowings | | | | $ | 4,756,554 | |
Taxes paid | | | | | 7,850,030 | |
Non-cash financing activities: | | | | | | |
In-kind creations — Issued | | | | | 310,385,825 | |
In-kind creations — Redeemed | | | | | 3,556,801 | |
The accompanying notes are an integral part of these financial statements.
96
| | InfraCap MLP ETF
|
| | For the
Year Ended
October 31, 2018
| | For the
Year Ended
October 31, 2017
| | For the
Year Ended
October 31, 2016
| | For the
Year Ended
October 31, 2015
| | For the Period
October 1, 20141
Through
October 31, 2014
|
Per Share Data for a Share Outstanding throughout each period presented: | | | | | | | | | | | | | | | | | | | |
Net asset value, beginning of period | | $ | 8.37 | | | $ | 10.63 | | | $ | 14.28 | | | $ | 24.21 | | | $25.00 | |
Investment operations: | | | | | | | | | | | | | | | | | | | |
Net investment loss2 | | | (0.15 | ) | | | (0.17 | ) | | | (0.08 | ) | | | (0.06 | ) | | (0.01 | ) |
Net realized and unrealized loss | | | (0.32 | ) | | | (0.01 | ) | | | (1.49 | )3 | | | (7.84 | ) | | (0.78 | )3 |
Total from investment operations | | | (0.47 | ) | | | (0.18 | ) | | | (1.57 | ) | | | (7.90 | ) | | (0.79 | ) |
Less Distributions from: | | | | | | | | | | | | | | | | | | | |
Net Investment income | | | — | | | | (0.59 | ) | | | — | | | | (0.30 | ) | | — | |
Return of capital | | | (1.51 | ) | | | (1.49 | ) | | | (2.08 | ) | | | (1.73 | ) | | — | |
Total distributions | | | (1.51 | ) | | | (2.08 | ) | | | (2.08 | ) | | | (2.03 | ) | | — | |
Net Asset Value, End of period | | $ | 6.39 | | | $ | 8.37 | | | $ | 10.63 | | | $ | 14.28 | | | $24.21 | |
Net Asset Value Total Return4 | | | (7.65 | )% | | | (3.44 | )% | | | (8.60 | )% | | | (34.34 | )% | | (3.17 | )% |
Net assets, end of period (000’s omitted) | | $ | 537,821 | | | $ | 504,879 | | | $ | 119,606 | | | $ | 19,989 | | | $6,052 | |
RATIOS/SUPPLEMENTAL DATA: | | | | | | | | | | | | | | | | | | | |
Ratios to Average Net Assets: | | | | | | | | | | | | | | | | | | | |
Expenses, including deferred income tax expense/benefit | | | 2.40 | %5 | | | 1.93 | %6 | | | 1.36 | %7 | | | 1.11 | %8 | | 2.70 | %9 |
Expenses, excluding deferred income tax expense/benefit | | | 2.39 | %5 | | | 1.89 | %6 | | | 1.58 | %7 | | | 1.16 | %8 | | 0.95 | %9 |
Net investment loss | | | (1.96 | )% | | | (1.73 | )% | | | (0.70 | )% | | | (0.36 | )% | | (0.35 | )%9 |
Portfolio turnover rate10 | | | 255 | % | | | 104 | % | | | 90 | % | | | 60 | % | | 0 | %11,12 |
1 | | Commencement of operations. |
2 | | Based on average shares outstanding. |
3 | | The per share amount of realized and unrealized loss on investments does not accord with the amounts reported in the Statements of Operations due to the timing of creation of fund shares in relation to fluctuating market values. |
4 | | Net Asset Value Total Return is calculated assuming an initial investment made at the net asset value on the first day of the period, reinvestment of dividends and distributions at net asset value during the period, and redemption at net asset value on the last day of the period. Total return calculated for a period of less than one year is not annualized. |
5 | | The ratios of expenses to average net assets include interest expense of 1.32% and dividend expense on securities sold short fees of 0.13%. |
6 | | The ratios of expenses to average net assets include interest expense fees of 0.94%. |
7 | | The ratios of expenses to average net assets include interest expense fees of 0.63%. |
8 | | The ratios of expenses to average net assets include interest expense fees of 0.21%. |
10 | | Portfolio turnover excludes the value of portfolio securities received or delivered as a result of in-kind creations or redemptions of the Fund’s capital shares. |
12 | | Amount rounds to less than 1%. |
The accompanying notes are an integral part of these financial statements.
97
Notes to Financial Statements
October 31, 2018
1. ORGANIZATION
The ETFis Series Trust I (the “Trust”) was organized as a Delaware statutory trust on September 20, 2012 and is registered with the U.S. Securities and Exchange Commission (the “SEC”) as an open-end management investment company under the Investment Company Act of 1940 (the “1940 Act”). The shares of the InfraCap MLP ETF, a separate series of the Trust, are presented and referred to herein as “Fund Shares” or “Shares”. The offering of Shares is registered under the Securities Act of 1933 (the “Securities Act”).
Fund
| | | | Commencement
of Operations
|
InfraCap MLP ETF | | | | October 1, 2014 |
The Fund’s investment objective is to seek total return primarily through investments in equity securities of publicly traded master limited partnerships and limited liability companies taxed as partnerships (“MLPs”).
2. SIGNIFICANT ACCOUNTING POLICIES
The Fund is an investment company and accordingly follows the investment company accounting and reporting guidance of the Financial Accounting Standards Board (FASB) Accounting Standard Codification Topic 946 Financial Services — Investment Companies. The Fund prepares its financial statements in accordance with generally accepted accounting principles (“GAAP”) in the United States of America and follows the significant accounting policies described below.
(a) Use of Estimates
Management makes certain estimates and assumptions that affect the reported amounts of assets and liabilities and disclosure of contingent assets and liabilities at the date of the financial statements and reported amounts of increases and decreases in the net assets from operations during the reporting period. Actual results could differ from those estimates.
(b) Indemnification
In the normal course of business, the Fund may enter into contracts that contain a variety of representations which provide general indemnifications for certain liabilities. The Fund’s maximum exposure under these arrangements is unknown. However, the Fund has not had prior claims or losses pursuant to these contracts and expects the risk of loss to be remote.
(c) Security Valuation
Equity securities and Exchange-Traded Funds are valued based on their last sale price. Price information on listed securities is taken from the exchange where the security is primarily traded. Securities regularly traded in an over the counter market are valued at the latest quoted sale price in such market or in the case of the New York Stock Exchange (“NYSE”) or NASDAQ, at the NYSE or NASDAQ Official Closing Price. If market quotations are not readily available, or if it is determined that a quotation of a security does not represent fair value, then the security is valued at fair value as determined in good faith using procedures adopted by the Trust’s Board of Trustees (the “Board”).
Purchased and written options contracts listed on exchanges are valued at their reported mean of bid and ask quotations; over-the-counter derivative contracts are fair valued using price evaluations provided by a pricing service approved by the Board.
(d) Fair Value Measurement
Accounting Standards Codification, Fair Value Measurements and Disclosures (“ASC 820”) defines fair value, establishes a framework for measuring fair value in accordance with GAAP, and requires disclosure about fair value measurements. It also provides guidance on determining when there has been a significant decrease in the volume and level of activity for an asset or liability, when a transaction is not orderly, and how that information must be incorporated into fair value measurement. Under ASC 820, various inputs are used in determining the value of the Fund’s investments. These inputs are summarized in the following hierarchy:
• | | Level 1 — Unadjusted quoted prices in active markets for identical assets or liabilities that the Fund has the ability to access. |
• | | Level 2 — Observable inputs other than quoted prices included in Level 1 that are observable for the asset or liability, either directly or indirectly. These inputs may include quoted prices for the identical instrument on an inactive market, prices for similar securities, interest rates, prepayment speeds, credit risk, yield curves, default rates and similar data. |
• | | Level 3 — Unobservable inputs for the asset or liability, to the extent relevant observable inputs are not available; representing the Fund’s own assumptions about the assumptions a market participant would use in valuing the asset or liability, and would be based on the best information available. |
98
Notes to Financial Statements (continued)
October 31, 2018
The inputs or methodology used for valuing securities are not necessarily an indication of the risk associated with investing in those securities. The hierarchy classification of inputs used to value the Fund’s investments at October 31, 2018, is disclosed at the end of the Fund’s Schedule of Investments.
(e) Security Transactions
Security transactions are accounted for on the trade date. Realized gains and losses on sales of investment securities are calculated using specific identification.
(f) Investment Income and Return of Capital Estimates
The Fund invests in master limited partnerships (“MLPs”) which make distributions that are primarily attributable to return of capital. The Fund records investment income and return of capital in the Statement of Operations using management’s estimate of the percentage of income included in the distributions received from each MLP based on historical information from the MLPs and other industry sources. These estimates may be adjusted based on information received from the MLPs after the tax and fiscal year ends.
The return of capital portion of the MLP distributions is a reduction to investment income and a reduction in the cost basis of each investment which increases net realized gain (loss) and net change in unrealized appreciation (depreciation). If the return of capital distributions exceed its cost basis, the distributions are treated as realized gains. The actual amounts of income and return of capital are only determined by each MLP after its fiscal year-end and may differ from the estimated amounts.
(g) Investment Income and Expenses
Dividend income is recognized on the ex-dividend date. Expenses are recognized on the accrual basis. The Fund amortizes premiums and accretes discounts using the effective interest method.
The Fund pays all of its expenses not assumed by Infrastructure Capital Advisors, LLC (the “Sub-Adviser”) or Virtus ETF Advisers LLC (the “Adviser”). General Trust expenses that are allocated among and charged to the assets of the Fund and other series of the Trust are done so on a basis that the Board deems fair and equitable, which may be on a basis of relative net assets of the Fund and other series of the Trust or the nature of the services performed and relative applicability to the Fund and other series of the Trust.
(h) Short Sales
The Fund may sell securities short. A short sale is a transaction in which the Fund sells a security it does not own in anticipation of a decline in market price. To sell a security short, the Fund must borrow the security. The Fund’s obligation to replace the security borrowed and sold short will be fully collateralized at all times by the proceeds from the short sale retained by the broker and by cash and securities deposited in a segregated account with the Fund’s custodian. If the price of the security sold short increases between the time of the short sale and the time the Fund replaces the borrowed security, the Fund will realize a loss, and if the price declines during the period, the Fund will realize a gain. Any realized gain will be decreased, and any realized loss increased, by the amount of transaction costs. On the ex-dividend date, dividends on short sales are recorded as an expense to the Fund.
In accordance with the terms of its prime brokerage agreement, the Fund may receive rebate income or be charged a fee on borrowed securities which is reported as “Interest Expense” on the Statement of Operations. Such income or fee is calculated on a daily basis based upon the market value of each borrowed security and a variable rate that is dependent upon the availability of such security.
(i) Distributions to Shareholders
Distributions to shareholders are declared and paid on a monthly basis and are recorded on the ex-dividend date. The Fund uses a cash flow-based distribution approach based on the Fund’s net cash flow received from portfolio investments.
The estimated character of the distributions paid will either be a dividend (ordinary income eligible to be treated as qualified dividend income) or a return of capital. Distributions made from current or accumulated earnings and profits of the Fund will be taxable to shareholders as dividend income. Distributions that are in an amount greater than the Fund’s current and accumulated earnings and profits will represent a return of capital to the extent of a shareholder’s basis in their common shares, and such distributions will correspondingly increase the realized gain upon the sale of their common shares. Additionally, distributions not paid from current or accumulated earnings and profits that exceed a shareholder’s tax basis in their common shares will generally be taxed as a capital gain. This estimate is based on the Fund’s operating results during the period.
99
Notes to Financial Statements (continued)
October 31, 2018
Effective with the current reporting period, it is no longer required to present certain line items on the Statement of Changes in Net Assets. Such disclosure changes were not permitted retrospectively, therefore prior period amounts are presented below. For the year ended October 31, 2017, distributions to shareholders were as follows:
Distributions from net investment income:
InfraCap MLP ETF | | | | | (22,241,012 | ) |
For the year ended October 31, 2017, undistributed net investment income/(distributions in excess of net investment income) included in net assets were as follows:
InfraCap MLP ETF | | | | | (28,780,267 | ) |
3. INVESTMENT MANAGEMENT RELATED PARTIES AND OTHER AGREEMENTS
Investment Advisory Agreement
The Trust has entered into an Investment Advisory Agreement (the “Advisory Agreement”) with the Adviser, a wholly owned subsidiary of ETFis Holdings LLC, on behalf of the Fund. ETFis Holdings LLC is majority-owned by Virtus Investment Partners, Inc. (Ticker: VRTS) (together with its affiliates, “Virtus”). Pursuant to the Advisory Agreement, the Adviser has overall supervisory responsibility for the general management and investment of the Fund’s securities portfolio. For its services to the Fund, the Adviser is entitled to receive a fee, payable monthly, at an annual rate of 0.075% of the Fund’s average daily net assets, subject to a minimum annual fee of $25,000, paid by the Sub-Adviser as described below.
Sub-Advisory Agreement
The Sub-Adviser provides investment advice and management services to the Fund. Pursuant to an investment sub-advisory agreement among the Trust, the Sub-Adviser and the Adviser, the Sub-Adviser is entitled to receive a fee, payable monthly, at an annual rate of 0.95% of the Fund’s average daily net assets. The Sub-Adviser has agreed to pay all expenses of the Fund, except the Sub-Adviser’s fee, brokerage expenses, taxes, interest, litigation expenses, payments under any 12b-1 plan adopted by the Fund, and other non-routine or extraordinary expenses of the Fund.
Principal Underwriter
Pursuant to the terms of a Distribution Agreement with the Trust, ETF Distributors LLC (the “Distributor”) serves as the Fund’s principal underwriter. The Distributor receives compensation from the Adviser for the statutory underwriting services it provides to the Fund. The Distributor will not distribute shares in less than Creation Units (as hereinafter defined), and does not maintain a secondary market in shares. The shares are traded in the secondary market. The Distributor is a wholly owned subsidiary of Virtus.
Operational Administrator
Virtus ETF Solutions LLC (the “Administrator”) serves as the Fund’s operational administrator. The Administrator supervises the overall administration of the Trust and the Fund including, among other responsibilities, the coordination and day-to-day oversight of the Fund’s operations, the service providers’ communications with the Fund and each other and assistance with Trust, Board and contractual matters related to the Fund. The Administrator also provides persons satisfactory to the Board to serve as officers of the Trust. The Administrator is a wholly owned subsidiary of Virtus.
Accounting Services Administrator, Custodian and Transfer Agent
The Bank of New York Mellon (“BNY Mellon”) provides administrative, accounting, tax and financial reporting for the maintenance and operations of the Trust as the Fund’s accounting services administrator. BNY Mellon also serves as the custodian for the Fund’s assets, and serves as transfer agent and dividend paying agent for the Fund.
Affiliated Shareholders
At October 31, 2018, the Sub-Adviser held shares of the Fund which may be redeemed at any time that aggregated to the following:
| | | | Shares
| | | % of shares
outstanding
|
InfraCap MLP ETF | | | | 511,996 | | | 0.6% |
100
Notes to Financial Statements (continued)
October 31, 2018
4. CREATION AND REDEMPTION TRANSACTIONS
The Fund issues and redeems shares on a continuous basis at Net Asset Value (“NAV”) in groups of 50,000 shares called “Creation Units.” Creation Units of the Fund are issued and redeemed generally in exchange for specified securities held by the Fund and a specified cash payment. Redemptions of Creation Units are effected principally for cash. In each instance of such cash creations or redemptions, the Trust may impose transaction fees based on transaction expenses related to the particular exchange that will be higher than the transaction fees associated with in-kind purchases or redemptions.
Only “Authorized Participants” who have entered into contractual arrangements with the Distributor may purchase or redeem shares directly from the Fund. An Authorized Participant is either (i) a broker-dealer or other participant in the clearing process through the Continuous Net Settlement System of the National Securities Clearing Corporation or (ii) a DTC participant and, in each case, must have executed a Participant Agreement with the Distributor. Most retail investors will not qualify as Authorized Participants or have the resources to buy and sell whole Creation Units. Therefore, they will be unable to purchase or redeem the shares directly from the Fund. Rather, most retail investors will purchase shares in the secondary market with the assistance of a broker and will be subject to customary brokerage commissions or fees.
5. FEDERAL INCOME TAX
The Fund is taxed as a regular C-corporation for federal income tax purposes and as such is obligated to pay federal and applicable state and foreign corporate taxes on its taxable income. Currently, the federal income tax rate for a corporation is 21 percent. This treatment differs from most investment companies, which elect to be treated as “regulated investment companies” under the Code in order to avoid paying entity level income taxes. Under current law, the Fund is not eligible to elect treatment as a regulated investment company due to its investments primarily in MLPs invested in energy assets. The Fund expects that substantially all of the distributions it receives from MLPs may be treated as a tax- deferred return of capital, thus reducing the Fund’s current tax liability. However, the amount of taxes paid by the Fund will vary depending on the amount of income and gains derived from investments and/or sales of MLP interests and such taxes will reduce your return from an investment in the Fund.
Cash distributions from MLPs to the Fund that exceed the Fund’s allocable share of such MLP’s net taxable income are considered a tax deferred return of capital that will reduce the Fund’s adjusted tax basis in the equity securities of the MLP. These reductions in the Fund’s adjusted tax basis in the MLP equity securities will increase the amount of any taxable gain (or decrease the amount of any tax loss) recognized by the Fund on a subsequent sale of the securities. The Fund will accrue deferred income taxes for any future tax liability associated with (i) that portion of MLP distributions considered to be a tax-deferred return of capital as well as (ii) capital appreciation of its investments. Upon the sale of an MLP security, the Fund may be liable for previously deferred taxes. The Fund will rely to some extent on information provided by the MLPs, which is not necessarily timely, to estimate the deferred tax liability for purposes of financial statement reporting and determining the Fund’s NAV. From time to time, the Adviser will modify the estimates or assumptions related to the Fund’s deferred tax liability as new information becomes available. The Fund will generally compute deferred income taxes based on the federal income tax rate applicable to corporations and an assumed rate attributable to state taxes.
The Fund’s income tax expense/(benefit) consists of the following:
As of October 31, 2018
| | | | Current
| | Deferred
| | Total
|
Federal | | | | $ | (4,720,654 | ) | | $ | 2,856,457 | | | $ | (1,864,197 | ) |
State | | | | | (279,877 | ) | | | (828,559 | ) | | | (1,108,436 | ) |
Valuation Allowance | | | | | — | | | | 3,049,825 | | | | 3,049,825 | |
Total Tax Expense/(Benefit) | | | | $ | (5,000,531 | ) | | $ | 5,077,723 | | | $ | 77,192 | |
Components of the Fund’s deferred tax assets and liabilities are as follows:
| | As of
October 31, 2018
|
Deferred Tax Assets: | | | | |
Net Operating Loss Carryforward | | $ | 2,463,007 | |
Capital Loss Carryforward | | | 271,714 | |
Net Unrealized Loss on Investments | | | 17,184,887 | |
Other | | | 9,901 | |
Valuation Allowance | | | (17,672,888 | ) |
Net Deferred Tax Assets | | $ | 2,256,621 | |
101
Notes to Financial Statements (continued)
October 31, 2018
The Fund reviews the recoverability of its deferred tax assets based upon the weight of available evidence. When assessing the recoverability of its deferred tax assets, significant weight was given to the effects of potential future realized and unrealized gains on investments and the period over which these deferred tax assets can be realized. Currently, any capital losses that may be generated by the Fund in the future are eligible to be carried back up to three years and can be carried forward for five years to offset capital gains recognized by the Fund in those years. The Fund has a current capital loss carryforward of $1,161,934 of which $855,715 expires in 2021 and $276,219 of which expires in 2023. The Tax Cuts and Jobs Act (TCJA) eliminated the net operating loss carryback ability and replaced the 20 year carryforward period with an indefinite carryforward period for any net operating losses arising in tax years ending after December 31, 2017. Therefore, net operating losses that may be generated by the Fund this year and in the future are eligible to be carried forward indefinitely to offset income generated by the Fund in those years but are no longer eligible to be carried back. The TCJA also established a limitation for any net operating losses generated in tax years beginning after December 31, 2017 to the lesser of the aggregate of available net operating losses or 80% of taxable income before any net operating loss utilization. The Fund has a current net operating loss carryforward of $10,532,604 of which $246,998 can be carried back 2 years and carried forward until expiration in 2036. The remaining $10,285,606 cannot be carried back and will be carried forward indefinitely until it is utilized. None of the $10,532,604 of net operating loss carryforward is subject to the aforementioned 80% limitation.
Based upon the Fund’s assessment, it has determined that it is “more-likely-than-not” that a portion of its deferred tax assets will not be realized through future taxable income of the appropriate character. Accordingly, a partial valuation allowance has been established for the Fund’s deferred tax assets. The Fund will continue to assess the need for a valuation allowance in the future. Significant changes in the fair value of its portfolio of investments may change the Fund’s assessment of the recoverability of these assets and may result in an adjustment of the valuation allowance against all or a portion of the Fund’s gross deferred tax assets.
Total income tax (benefit)/expense (current and deferred) differs from the amount computed by applying the federal statutory income tax rate of 21% to net investment and realized and unrealized gain/(losses) on investment before taxes as follows for the Fund:
| | Amount
| | Rate
|
Income Tax (Benefit) at Statutory Rate | | $ | (7,969,671 | ) | | 21.00 | % |
State Income Taxes (Net of Federal Benefit) | | | ⟨904,975 | ) | | 2.38 | |
Permanent Differences, Net | | | (353,069 | ) | | 0.93 | |
Effect of Tax Rate Change* | | | 8,225,896 | | | (21.68 | ) |
Provision to Return Adjustment | | | (70,646 | ⟩ | | 0.19 | |
Impact of Capital Loss Carryback | | | (1,977,361 | ) | | 5.21 | |
Other | | | 77,192 | | | (0.20 | ) |
Valuation Allowance | | | 3,049,826 | | | (8.04 | ) |
Net Income Tax Expense/(Benefit) | | $ | 77,192 | | | (0.21 | )% |
* | | The tax rate change listed in the table above is reflective of the change in deferred tax assets and liabilities due to the federal corporate tax rate change enacted by the TCJA as of December 22, 2017 (date of enactment). For tax years beginning after December 31, 2017, corporations will be taxed at a flat rate of 21% and no longer subject to the alternative minimum tax. |
The Fund recognizes interest accrued related to unrecognized tax benefits and penalties as income tax expense. For the period from inception to October 31, 2018, the Fund accrued penalties and interest of $77,192.
The Fund recognizes the tax benefits of uncertain tax positions only where the position is “more-likely-than-not” to be sustained assuming examination by tax authorities. Management has analyzed the Fund’s tax positions, and has concluded that no liability for unrecognized tax benefits should be recorded related to uncertain tax positions taken on U.S. tax returns and state tax returns filed since inception of the Fund. No U.S. federal or state income tax returns are currently under examination. The Fund’s tax years, October 31, 2015, October 31, 2016 and October 31, 2017, remain subject to examination by tax authorities in the United States. Due to the nature of the Fund’s investments, the Fund may be required to file income tax returns in several states. The Fund is not aware of any tax positions for which it is reasonably possible that the total amounts of unrecognized tax benefits will change materially in the next 12 months.
The adjusted cost basis of investments and gross unrealized appreciation and depreciation of investments excluding written options and securities sold short, for federal income tax purposes were as follows:
Fund
| | Federal Tax Cost
Of Investments
| | Gross
Unrealized
Appreciation
| | Gross
Unrealized
Depreciation
| | Net Unrealized
Appreciation
(Depreciation)
|
InfraCap MLP ETF | | $864,381,253 | | $18,552,006 | | $(87,865,188) | | $(69,313,182) |
102
Notes to Financial Statements (continued)
October 31, 2018
6. INVESTMENT TRANSACTIONS
Purchases and sales of investments (excluding short-term investments), subscriptions in-kind and redemptions in-kind for the period ended October 31, 2018 were as follows:
| | Purchases
| | Sales
| | Subscriptions
In-Kind
| | Redemptions
In-Kind
|
InfraCap MLP ETF | | $2,024,926,682 | | $2,013,403,131 | | $310,385,825 | | $3,556,801 |
7. DERIVATIVE FINANCIAL INSTRUMENTS
Options
The Fund may write covered call and put options on portfolio securities and other financial instruments. Premiums received are recorded as liabilities. The liabilities are subsequently adjusted to reflect the current value of the options written. Premiums received from writing options that expire are treated as realized gains. Premiums received from writing options that are exercised or are closed are added to or offset against the proceeds or amount paid on the transactions to determine the net realized gain or loss. By writing a covered call option, the Fund, in exchange for the premium, foregoes the opportunity for capital appreciation above the exercise price should the market price of the underlying security increase. By writing a put option, the Fund, in exchange for the premium, accepts the risk of having to purchase a security at an exercise price that is above the current price. Changes in value of written options are reported as change in unrealized gain (loss) on written options in the Statement of Operations. When the written option expires, is terminated or is sold, the Fund will record a gain or loss, which is reported as realized gain (loss) on written options in the Statement of Operations. Written covered call options limit the upside potential of a security above the strike price. Written put options subject the Fund to risk of loss if the value of the security declines below the exercise price minus the put premium.
The Fund may purchase call and put options on the portfolio securities or other financial instruments. The Fund may purchase call options to protect against an increase in the price of the security or financial instrument it anticipates purchasing. The Fund may purchase put options on securities which it holds or other financial instruments to protect against a decline in the value of the security or financial instrument or to close out covered written positions. Changes in value of purchased options are reported as part of change in unrealized gain (loss) on investments in the Statement of Operations. When the purchased option expires, is terminated or is sold, the Fund will record a gain or loss, which is reported as part of realized gain (loss) on investments in the Statement of Operations. Risks may arise from an imperfect correlation between the change in market value of the securities held by the Fund and the prices of options relating to the securities purchased or sold by the Fund and from the possible lack of liquid secondary market for an option. The maximum exposure to loss for any purchased option is limited to the premium initially paid for the option.
Transactions in derivative instruments reflected on the Statement of Assets and Liabilities at October 31, 2018, are:
Assets
| | Equity Risk
|
Investments* | | $ | 4,373,648 | |
Liabilities
| | Equity Risk
|
Written options, at value | | $ | 5,713,531 | |
* | | Purchased option contracts are included in Investments on the Statement of Assets and Liabilities. |
Transactions in derivative instruments reflected on the Statement of Operations during the year were as follows:
Net Realized Gain (Loss) on:
| | Equity Risk
|
Investments** | | $ | (4,221,838 | ) |
Written options | | | 45,171,637 | |
** | | Purchased option contracts are included in Net Realized Gain (Loss) on Investments on the Statement of Operations. |
Change in Net Unrealized Appreciation (Depreciation) on:
| | Equity Risk
|
Investments*** | | $ | (2,694,140 | ) |
Written options | | | (275,983 | ) |
*** | | Purchased option contracts are included in Change in Net Unrealized Appreciation (Depreciation) on Investments in the Statement of Operations. |
For the year ended October 31, 2018, the monthly average market value of the purchased options and written options contracts held by the Fund were $733,618 and $(10,332,981), respectively.
103
Notes to Financial Statements (continued)
October 31, 2018
8. BORROWINGS
The Fund entered into a Lending Agreement (the “Agreement”) with a commercial bank (the “Bank”) that allows the Fund to borrow cash from the Bank. Borrowings under the Agreement are collateralized by investments of the Fund. If the Fund defaults with respect to any of its obligations under the Agreement, the Bank may foreclose on assets of the Fund and/or the Fund may be required to repay immediately, in part or in full, the loan balance outstanding under the Agreement, necessitating the sale of securities at potentially inopportune times. Interest is charged at the 3 Month LIBOR (London Interbank Offered Rate) plus an additional percentage rate on the amount borrowed. The Agreement has an on-demand commitment term. For the year ended October 31, 2018, the average daily borrowings under the Agreement and the daily average interest rate were $140,621,436 and 3.31%, respectively.
At October 31, 2018, the amount of such outstanding borrowings was as follows:
Outstanding Borrowings
| | Interest Rate
|
$232,511,574 | | 3.76% |
9. INVESTMENT RISKS
As with any investment, an investment in the Fund could result in a loss or the performance of the Fund could be inferior to that of other investments. An investor should consider the Fund’s investment objectives, risks, and charges and expenses carefully before investing. The Fund’s prospectus and statement of additional information contain this and other important information.
MLP Risk
Investments in securities of MLPs involve risks that differ from investments in common stock including risks related to limited control and limited rights to vote on matters affecting the MLP, risks related to potential conflicts of interest between the MLP and the MLP’s general partner and cash flow risks. MLP common units and other equity securities can be affected by macro-economic and other factors affecting the stock market in general, expectations of interest rates, investor sentiment towards MLPs or the energy sector, changes in a particular issuer’s financial condition or unfavorable or unanticipated poor performance of a particular issuer (in the case of MLPs, generally measured in terms of distributable cash flow). Prices of common units of individual MLPs and other equity securities also can be affected by fundamentals unique to the partnership or company, including earnings power and coverage ratios.
10. 10% SHAREHOLDERS
As of October 31, 2018, the Fund had individual shareholder account(s) and/or omnibus shareholder account(s) (comprised of a group of individual shareholders), which individually amounted to more than 10% of the total shares outstanding of the Fund as detailed below:
Fund
| | % of Shares
Outstanding
| | Number of
Accounts
|
InfraCap MLP ETF | | 51% | | 3 |
11. NEW ACCOUNTING PRONOUNCEMENT
In August 2018, the Financial Accounting Standards Board issued Accounting Standards Update (“ASU”), ASU No. 2018-13, which changes certain fair value measurement disclosure requirements. The new ASU, in addition to other modifications and additions, removes the requirement to disclose the amount and reasons for transfers between Level 1 and Level 2 of the fair value hierarchy, the policy for the timing of transfers between levels and the valuation process for Level 3 fair value measurements. For public companies, the amendments are effective for financial statements issued for fiscal years beginning after December 15, 2019, and interim periods within those fiscal years. Management has evaluated the implications of certain provisions of ASU No. 2018-13 and has determined to early adopt all aspects related to the removal and modification of certain fair value measurement disclosures under the ASU effective immediately.
In August 2018, the SEC adopted amendments to Regulation S-X which are intended to facilitate the disclosure of information to investors and simplify compliance without significantly altering the information provided to investors. The amendments include eliminating the requirement to: separately state book basis components of net assets on the Statement of Assets & Liabilities; separately state the sources of distributions paid (except tax return of capital distributions must still be separately disclosed) on the Statement of Changes in Net Assets; and state the book basis amount of undistributed net investment income on the Statement of Changes in Net Assets. The compliance date for the amendments to Regulation S-X is for filings made with the SEC after November 5, 2018. The adoption has not had an effect on the Fund’s net assets or results of operations.
104
Notes to Financial Statements (continued)
October 31, 2018
On November 17, 2016, the FASB issued ASU 2016-18, Statement of Cash Flows (Topic 230): Restricted Cash. This update intends to reduce diversity in the presentation of restricted cash and restricted cash equivalents in the statement. Any restricted cash and restricted cash equivalents will be included as components of cash and cash equivalents as presented on the statement of cash flows. For the Trust, the effective date of this update is for periods beginning after December 15, 2017. At this time, management is evaluating the implications of this ASU and believes it will not have a material impact on the financial statements.
12. SUBSEQUENT EVENTS
The Fund is required to recognize in the financial statements the effects of all subsequent events that provide additional evidence about conditions that existed as of the date of the Statement of Assets and Liabilities. For non-recognized subsequent events that must be disclosed to keep the financial statements from being misleading, the Fund is required to disclose the nature of the event as well as an estimate of its financial effect, or a statement that such an estimate cannot be made. Management has evaluated subsequent events through the issuance of these financial statements and has determined that there are no material events that would require disclosure.
105
Report of Independent Registered Public Accounting Firm
October 31, 2018
To the Board of Trustees of ETFis Series Trust I and Shareholders of InfraCap REIT Preferred ETF, Virtus Cumberland Municipal Bond ETF, Virtus Glovista Emerging Markets ETF, Virtus InfraCap U.S. Preferred Stock ETF, Virtus LifeSci Biotech Clinical Trials ETF, Virtus LifeSci Biotech Products ETF, Virtus Newfleet Multi-Sector Bond ETF and Virtus WMC Global Factor Opportunities ETF
Opinions on the Financial Statements
We have audited the accompanying statements of assets and liabilities, including the schedules of investments, of each of the funds indicated in the table below (eight of the funds constituting ETFis Series Trust I, hereafter collectively referred to as the “Funds”) as of October 31, 2018, the related statements of operations, the statement of cash flows for Virtus InfraCap U.S. Preferred Stock ETF, statements of changes in net assets, including the related notes, and the financial highlights for each of the periods indicated in the table below (collectively referred to as the “financial statements”). In our opinion, the financial statements present fairly, in all material respects, the financial position of each of the Funds as of October 31, 2018, the results of each of their operations, the cash flows for Virtus InfraCap U.S. Preferred Stock ETF, the changes in each of their net assets, and each of the financial highlights for each of the periods indicated in the table below, in conformity with accounting principles generally accepted in the United States of America.
InfraCap REIT Preferred ETF | | Statement of operations for the year ended October 31, 2018, statements of changes in net assets and the financial highlights for the year ended October 31, 2018, and the period February 7, 2017 (inception) through October 31, 2017 |
| | | |
Virtus Cumberland Municipal Bond ETF | | Statement of operations for the year ended October 31, 2018, statements of changes in net assets and the financial highlights for the year ended October 31, 2018, and the period January 17, 2017 (inception) through October 31, 2017 |
| | | |
Virtus Glovista Emerging Markets ETF | | Statements of operations and of changes in net assets and the financial highlights for the period November 7, 2017 (inception) through October 31, 2018 |
| | | |
Virtus InfraCap U.S. Preferred Stock ETF | | Statements of operations, cash flows and of changes in net assets and the financial highlights for the period May 15, 2018 (inception) through October 31, 2018 |
| | | |
Virtus LifeSci Biotech Clinical Trials ETF
Virtus LifeSci Biotech Products ETF
Virtus Newfleet Multi-Sector Bond ETF | | Statements of operations for the year ended October 31, 2018, statements of changes in net assets and the financial highlights for each of the two years in the period ended October 31, 2018 |
| | | |
Virtus WMC Global Factor Opportunities ETF | | Statement of operations for the year ended October 31, 2018, statements of changes in net assets and the financial highlights for the year ended October 31, 2018, and the period October 10, 2017 (inception) through October 31, 2017 |
The financial statements of Virtus LifeSci Biotech Clinical Trials ETF, Virtus LifeSci Biotech Products ETF and Virtus Newfleet Multi-Sector Bond ETF as of and for the year ended October 31, 2016 and the financial highlights for each of the periods ended on or prior to October 31, 2016 (not presented herein, other than the financial highlights) were audited by other auditors whose report dated December 29, 2016 expressed unqualified opinions on those financial statements and financial highlights.
106
Report of Independent Registered Public Accounting Firm (continued)
October 31, 2018
Basis for Opinions
These financial statements are the responsibility of the Funds’ management. Our responsibility is to express an opinion on the Funds’ financial statements based on our audits. We are a public accounting firm registered with the Public Company Accounting Oversight Board (United States) (“PCAOB”) and are required to be independent with respect to the Funds in accordance with the U.S. federal securities laws and the applicable rules and regulations of the Securities and Exchange Commission and the PCAOB.
We conducted our audits of these financial statements in accordance with the standards of the PCAOB. Those standards require that we plan and perform the audit to obtain reasonable assurance about whether the financial statements are free of material misstatement, whether due to error or fraud.
Our audits included performing procedures to assess the risks of material misstatement of the financial statements, whether due to error or fraud, and performing procedures that respond to those risks. Such procedures included examining, on a test basis, evidence regarding the amounts and disclosures in the financial statements. Our audits also included evaluating the accounting principles used and significant estimates made by management, as well as evaluating the overall presentation of the financial statements. Our procedures included confirmation of securities owned as of October 31, 2018 by correspondence with the custodian, transfer agent and brokers; when replies were not received from brokers, we performed other auditing procedures. We believe that our audits provide a reasonable basis for our opinions.
/s/ PricewaterhouseCoopers LLP
Philadelphia, Pennsylvania
December 20, 2018
We have served as the auditor of one or more investment companies in Virtus ETF Solutions since 2017.
107
Report of Independent Registered Public Accounting Firm
October 31, 2018
To the Board of Trustees of ETFis Series Trust I and Shareholders of the InfraCap MLP ETF
Opinion on the Financial Statements
We have audited the accompanying statement of assets and liabilities, including the schedule of investments, of InfraCap MLP ETF (one of the funds constituting ETFis Series Trust I, hereafter referred to as the “Fund”) as of October 31, 2018, the related statements of operations and cash flows for the year ended October 31, 2018, the statements of changes in net assets, including the related notes, and the financial highlights for each of the two years in the period ended October 31, 2018 (collectively referred to as the “financial statements”). In our opinion, the financial statements present fairly, in all material respects, the financial position of the Fund as of October 31, 2018, the results of its operations and its cash flows for the year then ended, the changes in its net assets and the financial highlights for each of the two years in the period ended October 31, 2018 in conformity with accounting principles generally accepted in the United States of America.
The financial statements of the Fund as of and for the year ended October 31, 2016 and the financial highlights for each of the periods ended on or prior to October 31, 2016 (not presented herein, other than the financial highlights) were audited by other auditors whose report dated December 29, 2016 expressed an unqualified opinion on those financial statements and financial highlights.
Basis for Opinion
These financial statements are the responsibility of the Fund’s management. Our responsibility is to express an opinion on the Fund’s financial statements based on our audits. We are a public accounting firm registered with the Public Company Accounting Oversight Board (United States) (“PCAOB”) and are required to be independent with respect to the Fund in accordance with the U.S. federal securities laws and the applicable rules and regulations of the Securities and Exchange Commission and the PCAOB.
We conducted our audits of these financial statements in accordance with the standards of the PCAOB. Those standards require that we plan and perform the audit to obtain reasonable assurance about whether the financial statements are free of material misstatement, whether due to error or fraud.
Our audits included performing procedures to assess the risks of material misstatement of the financial statements, whether due to error or fraud, and performing procedures that respond to those risks. Such procedures included examining, on a test basis, evidence regarding the amounts and disclosures in the financial statements. Our audits also included evaluating the accounting principles used and significant estimates made by management, as well as evaluating the overall presentation of the financial statements. Our procedures included confirmation of securities owned as of October 31, 2018 by correspondence with the custodian and brokers; when replies were not received from brokers, we performed other auditing procedures. We believe that our audits provide a reasonable basis for our opinion.
/s/ PricewaterhouseCoopers LLP
Philadelphia, Pennsylvania
December 20, 2018
We have served as the auditor of one or more investment companies in Virtus ETF Solutions since 2017.
108
Approval of Advisory Agreements & Board Considerations (unaudited)
October 31, 2018
Approvals with Respect to Virtus Glovista Emerging Markets ETF
The Board noted that, on May 17, 2017, at an in-person meeting (the “Meeting”) at which all of the Trustees who were not “interested persons” (as that term is defined in the Investment Company Act of 1940) of the Trust (the “Independent Trustees”) were present, the Board of Trustees (the “Board”) of ETFis Series Trust I (the “Trust”), including the Independent Trustees voting separately, reviewed and unanimously approved an investment advisory agreement between Virtus ETF Advisers LLC (the “Adviser”) and the Trust (the “Advisory Agreement”), and an investment sub-advisory agreement among Glovista Investments LLC (“Glovista”), the Adviser and the Trust (the “Glovista Sub-Advisory Agreement”), each with respect to the Virtus Glovista Emerging Markets ETF (the “Glovista Fund”).
At the Meeting, the Board received and reviewed a substantial amount of information provided by the Adviser and Glovista in response to requests of the Board and counsel, including, without limitation, a memorandum from the Adviser that included a description of the Adviser’s business, a copy of the Adviser’s Form ADV and certain other information about the Adviser to be considered in connection with the Trustees’ review process (the “Adviser Memorandum”), and a memorandum from Glovista that included a description of Glovista’s business, a copy of Glovista’s Form ADV and certain other information about Glovista to be considered in connection with the Trustees’ review process (the “Glovista Memorandum”). The Board also met in person with representatives of the Adviser and Glovista to discuss the proposed Glovista Fund.
Advisory Agreement
In deciding on whether to approve the Advisory Agreement on behalf of the Glovista Fund, the Board considered numerous factors, including:
The nature, extent, and quality of the services to be provided by the Adviser. The Board considered the responsibilities the Adviser would have under the Advisory Agreement and the services that would be provided by the Adviser to the Glovista Fund including, without limitation, the management, oversight and administrative services that the Adviser and its employees would provide to the Glovista Fund, the services already provided by the Adviser related to organizing the Glovista Fund, the Adviser’s coordination of services for the Glovista Fund by the Trust’s service providers, its compliance procedures and practices, and its efforts to promote the Glovista Fund. The Board also considered the quality of the services that the Adviser provides to other series in the Virtus fund complex, including other series of the Trust. The Board noted that many of the Trust’s executive officers are employees of the Adviser and serve the Trust without additional compensation from the Glovista Fund. After reviewing the foregoing information and further information in the Adviser Memorandum (including descriptions of the Adviser’s investment advisory services and its related non-advisory business), and discussing the Adviser’s proposed services to the Glovista Fund with the Adviser, the Board concluded that the quality, extent, and nature of the services proposed to be provided by the Adviser would be satisfactory and adequate for the Glovista Fund.
The investment management capabilities and experience of the Adviser. The Board evaluated the management experience of the Adviser in light of the services it will be providing. In particular, the Board received information from the Adviser regarding, among other things, the Adviser’s experience in organizing, managing and overseeing exchange-traded funds and coordinating their operation and administration. After consideration of these factors, the Board determined that the Adviser would be an appropriate manager for the Glovista Fund.
The costs of the services to be provided and profits to be realized by the Adviser from its relationship with the Glovista Fund. The Board examined and evaluated the arrangement between the Adviser and the Glovista Fund under the proposed Advisory Agreement, including the fact that the Adviser will utilize a “unified fee” structure to cap the Glovista Fund’s total expenses. The Board also considered potential benefits for the Adviser in managing the Glovista Fund, including promotion of the Adviser’s name and the interests of the Adviser in providing management and oversight services to the Glovista Fund. In addition, at the Meeting, the Board compared the management fee of the Glovista Fund (which also represents the anticipated total expense ratio for the Glovista Fund as a result of the unified fee structure) to the expense ratios of other funds considered by the Adviser to have similar investment objectives and strategies to the Glovista Fund. Following these comparisons and upon further consideration and discussion of the foregoing, the Board concluded that the fee to be paid to the Adviser by the Glovista Fund would be appropriate and within the range of what would have been negotiated at arm’s length.
The extent to which economies of scale would be realized as the Glovista Fund grows and whether management fee levels reflect these economies of scale for the benefit of the Glovista Fund’s investors. The Board considered that the Glovista Fund’s proposed fee arrangement with the Adviser involves a unified fee. The Board considered that the Glovista Fund would likely experience benefits from the proposed unified fee arrangement, and would continue to do so even after the Glovista Fund’s assets grow to a level where the Adviser is no longer required to reimburse the Glovista Fund’s ordinary operating expenses in excess of the amount received by the Adviser
109
Approval of Advisory Agreements & Board Considerations (unaudited) (continued)
October 31, 2018
under the unified fee. Accordingly, the Board concluded that the Glovista Fund’s fee arrangement with the Adviser would provide benefits through the proposed unified fee structure, and that, at the Glovista Fund’s projected asset levels, the Glovista Fund’s proposed arrangement with the Adviser would be appropriate.
Other benefits derived by the Adviser from its relationship with the Glovista Fund. The Board considered material “fall-out” or ancillary benefits that would accrue to the Adviser as a result of its relationship with the Glovista Fund (other than the advisory fee). The Board noted that ETF Distributors LLC (the “Distributor”), an affiliate of the Adviser, will serve as principal underwriter for the Glovista Fund, and that Virtus ETF Solutions LLC (the “Administrator”), also an affiliate of the Adviser, will serve as the operational administrator for the Glovista Fund. The Board noted that the Adviser will be responsible for the payment of any fees to the Distributor and the Administrator. The Board considered that the association of the Distributor and the Administrator with the Glovista Fund could result in non-quantifiable reputational benefits for those entities. Based on the foregoing information, the Board concluded that such potential benefits are immaterial to its consideration and approval of the Advisory Agreement.
Conclusion. The Board did not identify any single factor as being of paramount importance, and different Trustees may have given different weight to different factors. The Board reviewed with counsel to the Independent Trustees the legal standards applicable to its consideration of the Advisory Agreement. Based on its review, including consideration of each of the factors referenced above, the Board determined, in the exercise of its reasonable business judgment, that the advisory arrangement, as outlined in the Advisory Agreement, was fair and reasonable in light of the services to be performed, expenses to be incurred and such other matters as the Board considered relevant. After full consideration of the above factors as well as other factors, the Board, including the Independent Trustees, unanimously approved the Advisory Agreement on behalf of the Glovista Fund.
Sub-Advisory Agreement
In deciding on whether to approve the Glovista Sub-Advisory Agreement on behalf of the Glovista Fund, the Board considered numerous factors, including:
The nature, extent, and quality of the services to be provided by Glovista. The Board considered the responsibilities Glovista would have under the Glovista Sub-Advisory Agreement and the services that would be provided by Glovista including, without limitation, its investment advisory services, its compliance procedures and practices, and its efforts to promote the Glovista Fund. After reviewing the foregoing information and further information in the materials, including the Glovista Memorandum (which included descriptions of Glovista business and Glovista’s Form ADV), the Board concluded that the quality, extent, and nature of the services to be provided by Glovista would be satisfactory and adequate for the Glovista Fund.
The investment management capabilities and experience of Glovista. The Board evaluated the investment management experience of Glovista. In particular, the Board considered Glovista’s experience, including the experience of its portfolio managers, in implementing strategies similar to the one proposed for the Glovista Fund, and Glovista’s work on the underlying index that the Glovista Fund would seek to track. The Board discussed with Glovista the investment objective and strategies for the Glovista Fund and Glovista’s plans for implementing the strategies. The Board also considered the ability of Glovista to manage the Glovista Fund. After consideration of these factors, the Board determined that Glovista would be an appropriate manager for the Glovista Fund.
The costs of the services to be provided and profits to be realized by Glovista from its relationship with the Glovista Fund. The Board examined and evaluated the proposed arrangements between Glovista and the Adviser under the proposed Glovista Sub-Advisory Agreement. The Board noted that, under such arrangement, Glovista would contribute a portion of the costs of operating the Fund, insofar as Glovista would not begin to receive its sub-advisory fee under the Glovista Sub-Advisory Agreement until the Adviser is no longer required to reimburse the Glovista Fund’s ordinary operating expenses in excess of the amount received by the Adviser under the unified fee. The Board considered Glovista’s staffing, personnel, and methods of operating; Glovista’s compliance policies and procedures; the financial condition of Glovista and the level of commitment to the Glovista Fund by Glovista; the projected asset levels of the Glovista Fund; Glovista’s payment of a portion of the startup costs for the Glovista Fund; and the overall projected expenses of the Glovista Fund.
The Board also considered potential benefits to Glovista in managing the Glovista Fund, including promotion of Glovista’s name. The Board compared the sub-advisory fee of the Glovista Fund (which will be paid to Glovista by the Adviser from the unified fee) to the expense ratios of other funds considered by the Adviser to have similar investment objectives and strategies to the Glovista Fund. Following these comparisons and upon further consideration and discussion of the foregoing, the Board concluded that the fee to be paid to Glovista would be appropriate and representative of an arm’s length negotiation.
110
Approval of Advisory Agreements & Board Considerations (unaudited) (continued)
October 31, 2018
The extent to which economies of scale would be realized as the Glovista Fund grows and whether management fee levels reflect these economies of scale for the benefit of the Glovista Fund’s investors. The Board considered that the Glovista Fund’s proposed fee arrangement with the Adviser involves a unified fee, and that the Adviser is responsible for the payment of sub-advisory fees to Glovista. The Board considered that the Glovista Fund would likely experience benefits from the proposed unified fee arrangement, and would continue to do so even after the Glovista Fund’s assets grow to a level where the Adviser is no longer required to reimburse the Glovista Fund’s ordinary operating expenses in excess of the amount received by the Adviser under the unified fee. Accordingly, the Board concluded that the Glovista Fund’s fee arrangements with the Adviser and Glovista would provide benefits through the proposed unified fee structure, and that, at the Glovista Fund’s projected asset levels, the Glovista Fund’s proposed arrangement with Glovista would be appropriate.
Conclusion. The Board did not identify any single factor as being of paramount importance, and different Trustees may have given different weight to different factors. The Board reviewed with counsel to the Independent Trustees the legal standards applicable to its consideration of the Glovista Sub-Advisory Agreement. Based on its review, including consideration of each of the factors referenced above, the Board determined, in the exercise of its reasonable business judgment, that the sub-advisory arrangement, as outlined in the Glovista Sub-Advisory Agreement, was fair and reasonable in light of the services to be performed, expenses to be incurred and such other matters as the Board considered relevant.
After full consideration of the above factors as well as other factors, the Board, including the Independent Trustees, unanimously approved the Glovista Sub-Advisory Agreement on behalf of the Glovista Fund.
Approvals with Respect to Virtus InfraCap U.S. Preferred Stock ETF
On November 9, 2017, at an in-person meeting (the “Meeting”) at which all of the Trustees who were not “interested persons” (as that term is defined in the Investment Company Act of 1940) of the Trust (the “Independent Trustees”) were present, the Board of Trustees (the “Board”) of ETFis Series Trust I (the “Trust”), including the Independent Trustees voting separately, reviewed and unanimously approved an investment advisory agreement between Virtus ETF Advisers LLC (the “Adviser”) and the Trust (the “Advisory Agreement”), and an investment sub-advisory agreement among Infrastructure Capital Advisors, LLC (the “Sub-Adviser”), the Adviser and the Trust (the “Sub-Advisory Agreement”), each with respect to the Virtus InfraCap U.S. Preferred Stock ETF (the “Fund”).
At the Meeting, the Board received and reviewed a substantial amount of information provided by the Adviser and the Sub-Adviser in response to requests of the Board and counsel, including, without limitation, a memorandum from the Adviser that included a description of the Adviser’s business, a copy of the Adviser’s Form ADV and certain other information about the Adviser to be considered in connection with the Trustees’ review process (the “Adviser Memorandum”), and a memorandum from the Sub-Adviser that included a description of the Sub-Adviser’s business, a copy of the Sub-Adviser’s Form ADV and certain other information about the Sub-Adviser to be considered in connection with the Trustees’ review process (the “Sub-Adviser Memorandum”). The Board also met in person with representatives of the Adviser and the Sub-Adviser to discuss the proposed Fund.
Advisory Agreement
In deciding on whether to approve the Advisory Agreement on behalf of the Fund, the Board considered numerous factors, including:
The nature, extent, and quality of the services to be provided by the Adviser. The Board considered the responsibilities the Adviser would have under the Advisory Agreement and the services that would be provided by the Adviser to the Fund including, without limitation, the management, oversight and administrative services that the Adviser and its employees would provide to the Fund, the services already provided by the Adviser related to organizing the Fund, the Adviser’s coordination of services for the Fund by the Trust’s service providers, its compliance procedures and practices, and its efforts to promote the Fund. The Board also considered the quality of the services that the Adviser provides to other series in the Virtus fund complex, including other series of the Trust. The Board noted that many of the Trust’s executive officers are employees of the Adviser and serve the Trust without additional compensation from the Fund. After reviewing the foregoing information and further information in the Adviser Memorandum (including descriptions of the Adviser’s investment advisory services and its related non-advisory business), and discussing the Adviser’s proposed services to the Fund, the Board concluded that the quality, extent, and nature of the services proposed to be provided by the Adviser would be satisfactory and adequate for the Fund.
The investment management capabilities and experience of the Adviser. The Board evaluated the management experience of the Adviser in light of the services it will be providing. In particular, the Board received information from the Adviser regarding, among other things, the Adviser’s experience in organizing, managing and overseeing exchange-traded funds and coordinating their operation and administration. After consideration of these factors, the Board determined that the Adviser would be an appropriate manager for the Fund.
111
Approval of Advisory Agreements & Board Considerations (unaudited) (continued)
October 31, 2018
The costs of the services to be provided and profits to be realized by the Adviser from its relationship with the Fund. The Board examined and evaluated the arrangement between the Adviser and the Fund under the proposed Advisory Agreement, including the fact that the Adviser will utilize a “unified fee” structure to cap the Fund’s total expenses. The Board also considered potential benefits for the Adviser in managing the Fund, including promotion of the Adviser’s name and the interests of the Adviser in providing management and oversight services to the Fund. In addition, at the Meeting, the Board compared the management fee of the Fund to the expense ratios of other funds with a unified fee considered by the Adviser to have similar investment objectives and strategies to the Fund. Following these comparisons and upon further consideration and discussion of the foregoing, the Board concluded that the fee to be paid to the Adviser by the Fund would be appropriate and within the range of what would have been negotiated at arm’s length.
The extent to which economies of scale would be realized as the Fund grows and whether management fee levels reflect these economies of scale for the benefit of the Fund’s investors. The Board considered that the Fund’s proposed fee arrangement with the Adviser involves a unified fee. The Board considered that the Fund would likely experience benefits from the proposed unified fee arrangement, and would continue to do so even after the Fund’s assets grow to a level where the Adviser is no longer required to reimburse the Fund’s ordinary operating expenses in excess of the amount received by the Adviser under the unified fee. Accordingly, the Board concluded that the Fund’s fee arrangement with the Adviser would provide benefits through the proposed unified fee structure, and that, at the Fund’s projected asset levels, the Fund’s proposed arrangement with the Adviser would be appropriate.
Other benefits derived by the Adviser from its relationship with the Fund. The Board considered material “fall-out” or ancillary benefits that would accrue to the Adviser as a result of its relationship with the Fund (other than the advisory fee). The Board noted that ETF Distributors LLC (the “Distributor”), an affiliate of the Adviser, will serve as principal underwriter for the Fund, and that Virtus ETF Solutions LLC (the “Administrator”), also an affiliate of the Adviser, will serve as the operational administrator for the Fund. The Board noted that the Adviser will be responsible for the payment of any fees to the Distributor and the Administrator. The Board considered that the association of the Distributor and the Administrator with the Fund could result in non-quantifiable reputational benefits for those entities. Based on the foregoing information, the Board concluded that such potential benefits are immaterial to its consideration and approval of the Advisory Agreement.
Conclusion. The Board did not identify any single factor as being of paramount importance, and different Trustees may have given different weight to different factors. The Board reviewed with counsel to the Independent Trustees the legal standards applicable to its consideration of the Advisory Agreement. Based on its review, including consideration of each of the factors referenced above, the Board determined, in the exercise of its reasonable business judgment, that the advisory arrangement, as outlined in the Advisory Agreement, was fair and reasonable in light of the services to be performed, expenses to be incurred and such other matters as the Board considered relevant.
After full consideration of the above factors as well as other factors, the Board, including the Independent Trustees, unanimously approved the Advisory Agreement on behalf of the Fund.
Sub-Advisory Agreement
In deciding on whether to approve the Sub-Advisory Agreement on behalf of the Fund, the Board considered numerous factors, including:
The nature, extent, and quality of the services to be provided by the Sub-Adviser. The Board considered the responsibilities the Sub-Adviser would have under the Sub-Advisory Agreement and the services that would be provided by the Sub-Adviser including, without limitation, its investment advisory services, its compliance procedures and practices, and its efforts to promote the Fund. After reviewing the foregoing information and further information in the materials, including the Sub-Adviser Memorandum (which included descriptions of the Sub-Adviser’s business and Form ADV), the Board concluded that the quality, extent, and nature of the services to be provided by the Sub-Adviser would be satisfactory and adequate for the Fund.
The investment management capabilities and experience of the Sub-Adviser. The Board evaluated the investment management experience of the Sub-Adviser. In particular, the Board considered the Sub-Adviser’s experience, including the experience of its portfolio managers, in implementing strategies similar to the one proposed for the Fund. The Board discussed with the Sub-Adviser the investment objective and strategies for the Fund and the Sub-Adviser’s plans for implementing the strategies. The Board also considered the ability of the Sub-Adviser to manage the Fund’s portfolio. After consideration of these factors, the Board determined that the Sub-Adviser would be an appropriate sub-adviser to the Fund.
The costs of the services to be provided and profits to be realized by the Sub-Adviser from its relationship with the Fund. The Board examined and evaluated the proposed arrangement between the Sub-Adviser and the Adviser under the proposed Sub-Advisory Agreement. The Board noted that, under such arrangement, the Sub-Adviser would contribute a portion of the costs of operating the Fund, insofar as the Sub-Adviser would not begin to receive its sub-advisory fee under the Sub-Advisory Agreement until the Adviser
112
Approval of Advisory Agreements & Board Considerations (unaudited) (continued)
October 31, 2018
is no longer required to reimburse the Fund’s ordinary operating expenses in excess of the amount received by the Adviser under the unified fee. The Board considered the Sub-Adviser’s staffing, personnel, and methods of operating; the Sub-Adviser’s compliance policies and procedures; the financial condition of the Sub-Adviser and the level of commitment to the Fund by the Sub-Adviser; and the projected asset levels of the Fund.
The Board also considered potential benefits to the Sub-Adviser in sub-advising the Fund, including promotion of the Sub-Adviser’s name. The Board compared the sub-advisory fee of the Fund (which will be paid to the Sub-Adviser by the Adviser from the unified fee) to the expense ratios of other funds considered by the Sub-Adviser to have similar investment objectives and strategies to the Fund. Following these comparisons and upon further consideration and discussion of the foregoing, the Board concluded that the fee to be paid to the Sub-Adviser would be appropriate and representative of an arm’s length negotiation.
The extent to which economies of scale would be realized as the Fund grows and whether management fee levels reflect these economies of scale for the benefit of the Fund’s investors. The Board considered that the Fund’s proposed fee arrangement with the Adviser involves a unified fee, and that the Adviser is responsible for the payment of sub-advisory fees to the Sub-Adviser. The Board considered that the Fund would likely experience benefits from the proposed unified fee arrangement, and would continue to do so even after the Fund’s assets grow to a level where the Adviser is no longer required to reimburse the Fund’s ordinary operating expenses in excess of the amount received by the Adviser under the unified fee. Accordingly, the Board concluded that the Fund’s fee arrangements with the Adviser and the Sub-Adviser would provide benefits through the proposed unified fee structure, and that, at the Fund’s projected asset levels, the Fund’s proposed arrangement with the Sub-Adviser would be appropriate.
Conclusion. The Board did not identify any single factor as being of paramount importance, and different Trustees may have given different weight to different factors. The Board reviewed with counsel to the Independent Trustees the legal standards applicable to its consideration of the Sub-Advisory Agreement. Based on its review, including consideration of each of the factors referenced above, the Board determined, in the exercise of its reasonable business judgment, that the sub-advisory arrangement, as outlined in the Sub-Advisory Agreement, was fair and reasonable in light of the services to be performed, expenses to be incurred and such other matters as the Board considered relevant.
After full consideration of the above factors as well as other factors, the Board, including the Independent Trustees, unanimously approved the Sub-Advisory Agreement on behalf of the Fund.
113
Trustees and Officers of the Trust (unaudited)
TRUSTEES AND OFFICERS OF THE TRUST
The Trustees of the Trust, their addresses, positions with the Trust, years of birth, length of time served, principal occupations during the past five years, the number of portfolios in the Fund Complex overseen by each Trustee and other directorships, if any, held by the Trustees are set forth below. The SAI includes additional information about the Fund’s Trustees and is available, without charge, upon request, by calling the Adviser (toll-free) at (888)-383-4184.
Name and
Year of Birth | Position(s) Held
with Trust | Length of
Time Served | Principal Occupation(s)
During Past Five Years | Number of
Portfolios in
Fund Complex*
Overseen by
Trustee | Other
Directorships
Held by Trustee
During Past
Five Years |
INDEPENDENT TRUSTEES
|
James Simpson
Year of Birth: 1970 | Trustee | Since Inception | President, ETP Resources, LLC (since 2009) (a financial services consulting company). | 13 | Trustee (since 2018), Asset Management Fund (5 portfolios); Trustee (since 2015), Virtus ETF Trust II (3 portfolios) |
Robert S. Tull
Year of Birth: 1952 | Trustee | Since Inception | Independent Consultant (since 2013); Chief Operating Officer, Factor Advisors, LLC (2010-2013). | 13 | Trustee (since 2015), Virtus ETF Trust II (3 portfolios) |
Stephen O’Grady
Year of Birth: 1946 | Trustee | Since 2014 | Lead Market Maker, GFI Group (2011-2012); Partner, Kellogg Capital Markets (2004-2011). | 13 | Trustee (since 2015), Virtus ETF Trust II (3 portfolios);
Trustee (2013-2015),
Greenhaven LLC; Trustee (since 2014), Acacia Group LLC; Trustee (since 2014), ETFS Trust (5 portfolios) |
Myles J. Edwards
Year of Birth: 1961 | Trustee | Since 2016 | Chief Executive Officer (since 2018), Final Compliance; Chief Compliance Officer (since 2018), Knight Vinke; General Counsel, CCO and COO, Shufro, Rose & Co., LLC (2014-2018); General Counsel and CCO, Constellation Wealth Advisers, LLC (2011-2014). | 13 | Trustee (since 2015), Virtus ETF Trust II (3 portfolios) |
INTERESTED TRUSTEE** |
William J. Smalley
Year of Birth: 1983 | Trustee, President and Chief Executive Officer | Since Inception | President, Virtus ETF Solutions LLC (since 2012); Managing Principal, ETF Distributors LLC (since 2012); Managing Director, Virtus ETF Advisers LLC (since 2012); President and Chief Executive Officer, Virtus ETF Trust II (since 2015); Vice President, Factor Advisors, LLC (2010-2012). | 10 | None |
114
Trustees and Officers of the Trust (unaudited) (continued)
Name and
Year of Birth | Position(s) Held
with Trust | Length of
Time Served | Principal Occupation(s)
During Past Five Years | Number of
Portfolios in
Fund Complex*
Overseen by
Trustee | Other
Directorships
Held by Trustee
During Past
Five Years |
OTHER EXECUTIVE OFFICERS
|
Kevin J. Carr
Year of Birth: 1954 | Secretary | Since 2015 | Vice President and Senior Counsel (2017 to present); Senior Vice President (2009 to 2017), Vice President, Counsel and Secretary (2008 to 2009), Virtus Investment Partners, Inc. and/or certain of its subsidiaries; various senior officer positions (since 2005) with Virtus affiliates; Senior Vice President (since 2013), Vice President (2005 to 2013), Chief Legal Officer, Counsel and Secretary (since 2005), Virtus Mutual Fund Family; Senior Vice President (2013 to 2014), Vice President (2012 to 2013), Secretary and Chief Legal Officer (2005 to 2013), and Assistant Secretary (2013 to 2014 and since 2017), Virtus Total Return Fund Inc. and Virtus Global Dividend & Income Fund Inc.; Senior Vice President (since 2017), Assistant Secretary (since 2013), Vice President, Chief Legal Officer, Counsel and Secretary (2010 to 2013), Virtus Variable Insurance Trust; Senior Vice President (2013 to 2014), Vice President (2011 to 2013), and Assistant Secretary (since 2011), Virtus Global Multi-Sector Income Fund; Assistant Secretary (since 2015), Duff & Phelps Select Energy MLP Fund Inc.; Senior Vice President (since 2017), Assistant Secretary (since 2013), Virtus Alternative Solutions Trust; and Secretary (since 2015), Virtus ETF Trust II. | N/A | N/A |
Brinton W. Frith
Year of Birth: 1969 | Treasurer and Chief Financial Officer | Since Inception | President, Virtus ETF Advisers LLC (since 2013); Managing Director, Virtus ETF Solutions LLC (since 2013); Treasurer and Chief Financial Officer (since 2015), Virtus ETF Trust II; President, Javelin Investment Management, LLC (2008-2013). | N/A | N/A |
Nancy J. Engberg
Year of Birth: 1956 | Chief Compliance Officer | Since 2015 | Senior Vice President (since 2017); Vice President (2008 to 2017) and Chief Compliance Officer (2008 to 2011 and since 2016), Virtus Investment Partners, Inc. and/or certain of its subsidiaries; various officer positions (since 2003) with Virtus affiliates; Senior Vice President (since 2017), Vice President (2011 to 2017) and Chief Compliance Officer (since 2011), Virtus Mutual Fund Family; Senior Vice President (since 2017), Vice President (2010 to 2017) and Chief Compliance Officer (since 2011), Virtus Variable Insurance Trust; Senior Vice President (since 2017), Vice President (2011 to 2017) and Chief Compliance Officer (since 2011), Virtus Global Multi-Sector Income Fund; Senior Vice President (since 2017), Vice President (2012 to 2017) and Chief Compliance Officer (since 2012), Virtus Total Return Fund Inc. and Virtus Global Dividend & Income Fund Inc.; Senior Vice President (since 2017), Vice President (2013 to 2017) and Chief Compliance Officer (since 2013), Virtus Alternative Solutions Trust; Senior Vice President (since 2017), Vice President (2014 to 2017) and Chief Compliance Officer (since 2014), Duff & Phelps Select Energy MLP Fund Inc.; Chief Compliance Officer (since 2015), Virtus ETF Trust II. | N/A | N/A |
The address for each Trustee and officer is 1540 Broadway, 16th Floor, New York, NY 10036. Each Trustee serves until resignation, death, retirement or removal. Officers are elected yearly by the Trustees.
* | | As of October 31, 2018, the Fund Complex consisted of the Trust, which consisted of ten portfolios — InfraCap REIT Preferred ETF, ETF, Reaves Utilities ETF, Virtus Cumberland Municipal Bond ETF, Virtus Glovista Emerging Markets ETF, Virtus InfraCap U.S. Preferred Stock ETF, Virtus LifeSci Biotech Clinical Trials ETF, Virtus LifeSci Biotech Products ETF, Virtus Newfleet Multi-Sector Bond ETF, Virtus WMC Global Factor Opportunities ETF and InfraCap MLP ETF, and Virtus ETF Trust II, which consisted of three portfolios — Virtus Newfleet Dynamic Credit ETF, Virtus Enhanced U.S. Equity ETF and Virtus Enhanced Short U.S. Equity ETF. |
** | | William J. Smalley is an “interested person” as defined in the Investment Company Act of 1940, because he is an employee of the Adviser. |
115
Supplemental Information (unaudited)
INFORMATION ABOUT PORTFOLIO HOLDINGS
The Funds file their complete schedule of portfolio holdings for their first and third fiscal quarters with the Securities and Exchange Commission (“SEC”) on Form N-Q (or any successor Form). The Funds Form N-Q (or any successor Form) are available without charge, upon request, by calling toll-free at (888) 383-4184. Furthermore, you may obtain the Form N-Q (or any successor Form) on the SEC’s website at www.sec.gov. The Funds’ portfolio holdings are posted daily on the Funds’ website at www.virtusetfs.com.
The Funds’ premium/discount information that is current as of the most recent month-end is available by visiting www.virtusetfs.com or by calling (888) 383-4184.
INFORMATION ABOUT PROXY VOTING
A description of the policies and procedures the Funds use to determine how to vote proxies relating to portfolio securities is provided in the Statement of Additional Information (“SAI”). The SAI is available without charge upon request by calling toll-free at (888) 383-4184, by accessing the SEC’s website at www.sec.gov, or by accessing the Funds’ website at www.virtusetfs.com.
Information regarding how the Funds voted proxies relating to portfolio securities during the most recent twelve-month period ended June 30th is available by calling toll-free at (888)383-4184 or by accessing the SEC’s website at www.sec.gov.
TAX INFORMATION
For the fiscal year ended October 31, 2018, the Funds make the following disclosures for federal income tax purposes. Below is listed the percentages, or the maximum amount allowable, of its ordinary income dividends (“QDI”) to qualify for the lower tax rates applicable to individual shareholders, and the percentage of ordinary income dividends earned by each Fund which qualifies for the dividends received deduction (“DRD”) for corporate shareholders. The actual percentage of QDI and DRD for the calendar year will be designated in year-end tax statements.
Funds
| | QDI
| | DRD
|
InfraCap REIT Preferred ETF | | — | | | — | |
Virtus Cumberland Municipal Bond ETF | | — | | | — | |
Virtus Glovista Emerging Markets ETF | | 74.41 | % | | 3.70 | % |
Virtus InfraCap U.S. Preferred Stock ETF | | 48.39 | % | | 43.51 | % |
Virtus LifeSci Biotech Clinical Trials ETF | | — | | | — | |
Virtus LifeSci Biotech Products ETF | | — | | | — | |
Virtus Newfleet Multi-Sector Bond ETF | | — | | | — | |
Virtus WMC Global Factor Opportunities ETF | | 58.43 | % | | 23.32 | % |
For federal income tax purposes, 60.06% of the income dividends paid by the Virtus Cumberland Municipal Bond ETF qualify as exempt-interest dividends.
For the fiscal year ended October 31, 2018, certain Funds are disclosing the following information pursuant to notice requirements of Section 853(a) and 855(d) of the Internal Revenue Code, as amended, and the Treasury Regulations thereunder.
Funds
| | Foreign Source
Income Recognized
| | Foreign Tax
Credit Pass-Through
|
InfraCap REIT Preferred ETF | | — | | | — | |
Virtus Cumberland Municipal Bond ETF | | — | | | — | |
Virtus Glovista Emerging Markets ETF | | $639,830 | | | $93,847 | |
Virtus InfraCap U.S. Preferred Stock ETF | | — | | | — | |
Virtus LifeSci Biotech Clinical Trials ETF | | — | | | — | |
Virtus LifeSci Biotech Products ETF | | — | | | — | |
Virtus Newfleet Multi-Sector Bond ETF | | — | | | — | |
Virtus WMC Global Factor Opportunities ETF | | — | | | — | |
116
c/o ETF Distributors LLC
1540 Broadway, Suite 1610
New York, NY 10036
 | 8572(12/18) |
Item 2. Code of Ethics.
As of the end of the period covered by this report, the registrant has adopted a code of ethics that applies to the registrant’s principal executive officer, principal financial officer, principal accounting officer or controller, or persons performing similar functions, regardless of whether these individuals are employed by the registrant or a third party. Other than certain non-substantive changes, there have been no amendments, during the period covered by this report, to a provision of the code of ethics that applies to the registrant’s principal executive officer, principal financial officer, principal accounting officer or controller, or persons performing similar functions, regardless of whether these individuals are employed by the registrant or a third party, and that relates to any element of the code of ethics described in Item 2(b) of the instructions for completion of Form N-CSR. Pursuant to Item 13(a)(1), a copy of registrant’s amended code of ethics has been filed with the Commission. During the period covered by this report, the registrant has not granted any waivers, including implicit waivers, from the provisions of the code of ethics.
Item 3. Audit Committee Financial Expert.
The registrant's board of trustees has determined that the registrant does not have an audit committee financial expert serving on its audit committee. At this time, the registrant's board of trustees believes that the collective experience provided by the members of the audit committee together offer the registrant adequate oversight for the registrant's level of financial complexity.
Item 4. Principal Accountant Fees and Services.
The aggregate fees billed for each of the last two fiscal years for professional services rendered by the principal accountant for the audit of the registrant's annual financial statements or services that are normally provided by the accountant in connection with statutory and regulatory filings or engagements for those fiscal years were $183,800 for 2018 and $228,100 for 2017.
The aggregate fees billed in each of the last two fiscal years for assurance and related services by the principal accountant to the registrant that are reasonably related to the performance of the audit of the registrant's financial statements and are not reported under paragraph (a) of this Item were $0.00 for 2018 and $9,000 for 2017.
The aggregate fees billed in each of the last two fiscal years for assurance and related services that are reasonably related to the performance of the audit of the registrant’s financial statements
by the principal accountant to the registered investment company’s investment adviser (not including a sub-adviser whose role is primarily portfolio management and is sub-contracted or overseen by another investment adviser) and any entity controlling, controlled by, or under common control with the investment adviser that provides ongoing services to the registered investment company were $250,413 for 2018 and $188,500 for 2017
The aggregate fees billed in each of the last two fiscal years for professional services rendered by the principal accountant to the registrant for tax compliance, tax advice, and tax planning were $131,150 for 2018 and $148,550 for 2017.
The aggregate fees billed in each of the last two fiscal years for professional services rendered by the principal accountant for tax compliance, tax advice, and tax planning to the registered investment company’s investment adviser (not including a sub-adviser whose role is primarily portfolio management and is sub-contracted or overseen by another investment adviser) and any entity controlling, controlled by, or under common control with the investment adviser that provides ongoing services to the registered investment company were $545,065 for 2018 and $528,565 for 2017.
The aggregate fees billed in each of the last two fiscal years for products and services provided by the principal accountant to the registrant, other than the services reported in paragraphs (a) through (c) of this Item were $13,897 for 2018 and $9,000 2017.
The aggregate fees billed in each of the last two fiscal years for products and services provided by the principal accountant to the registered investment company’s investment adviser (not including a sub-adviser whose role is primarily portfolio management and is sub-contracted or overseen by another investment adviser) and any entity controlling, controlled by, or under common control with the investment adviser that provides ongoing services to the registered investment company, other than the services reported in paragraphs (a) through (c) of this Item were $413,519 for 2018 and $617,992 for 2017.
| (e)(1) | The audit committee has not adopted pre-approval policies and procedures described in paragraph (c)(7) of Rule 2-01 of Regulation S-X. |
| (e)(2) | None of the services described in paragraphs (b) through (d) of this Item were approved by the audit committee pursuant to paragraph (c)(7)(i)(C) of Rule 2-01 of Regulation S-X. |
| (f) | The percentage of hours expended on the principal accountant's engagement to audit the registrant's financial statements for the most recent fiscal year that were attributed to work performed by persons other than the principal accountant's full-time, permanent employees was less than fifty percent. |
| | (g) | The aggregate non-audit fees billed by the registrant's accountant for services rendered to the registrant, and rendered to the registrant's investment adviser (not including any sub-adviser whose role is primarily portfolio management and is subcontracted with or overseen by another investment adviser), and any entity controlling, controlled by, or under common control with the adviser that provides ongoing services to the registrant for each of the last two fiscal years of the registrant were $145,397 for 2018 and $157,550 for 2017. |
Item 5. Audit Committee of Listed registrants.
The registrant has established a separately-designated standing audit committee comprised of all the independent directors of the registrant. The members of the audit committee are Stephen G. O’Grady, James Simpson, Myles Edwards and Robert S. Tull.
Item 6. Investments.
| (a) | Schedule of Investments in securities of unaffiliated issuers as of the close of the reporting period is included as part of the report to shareholders filed under Item 1 of this form. |
Item 7. Disclosure of Proxy Voting Policies and Procedures for Closed-End Management Investment Companies.
Not applicable.
Item 8. Portfolio Managers of Closed-End Management Investment Companies.
Not applicable.
Item 9. Purchases of Equity Securities by Closed-End Management Investment Company and Affiliated Purchasers.
Not applicable.
Item 10. Submission of Matters to a Vote of Security Holders.
None.
Item 11. Controls and Procedures.
| (a) | The registrant’s principal executive and principal financial officers, or persons performing similar functions, have concluded that the registrant’s disclosure controls and procedures (as defined in Rule 30a-3(c) under the Investment Company Act of 1940, as amended (the “1940 Act”) (17 CFR 270.30a-3(c))) are effective, as of a date within 90 days of the filing date of the report that includes the disclosure required by this paragraph, based on their evaluation of these controls and procedures required by Rule 30a-3(b) under the 1940 Act (17 CFR 270.30a-3(b)) and Rules 13a-15(b) or 15d-15(b) under the Securities Exchange Act of 1934, as amended (17 CFR 240.13a-15(b) or 240.15d-15(b)). |
| (b) | There were no changes in the registrant’s internal control over financial reporting (as defined in Rule 30a-3(d) under the 1940 Act (17 CFR 270.30a-3(d)) that occurred during the registrant’s last fiscal quarter that has materially affected, or is reasonably likely to materially affect, the registrant’s internal control over financial reporting. |
Item 12. Disclosure of Securities Lending Activities for Closed-End Management Investment Companies.
Not applicable.
Item 13. Exhibits.
| | (a)(1) | Code of ethics, or any amendment thereto, that is the subject of disclosure required by Item 2 is incorporated by reference to registrant’s Form N-CSR, filed January 8, 2018. |
| | (a)(2) | Certifications pursuant to Rule 30a-2(a) under the 1940 Act and Section 302 of the Sarbanes-Oxley Act of 2002 are attached hereto. |
| | (b) | Certifications pursuant to Rule 30a-2(b) under the 1940 Act and Section 906 of the Sarbanes-Oxley Act of 2002 are attached hereto. |
SIGNATURES
Pursuant to the requirements of the Securities Exchange Act of 1934 and the Investment Company Act of 1940, the registrant has duly caused this report to be signed on its behalf by the undersigned, thereunto duly authorized.
| (Registrant) | ETFis Series Trust I |
| By (Signature and Title)* | /s/ William J. Smalley |
| | William J. Smalley, President and Principal Executive Officer |
| | (principal executive officer) |
Pursuant to the requirements of the Securities Exchange Act of 1934 and the Investment Company Act of 1940, this report has been signed below by the following persons on behalf of the registrant and in the capacities and on the dates indicated.
| By (Signature and Title)* | /s/ William J. Smalley |
| | William J. Smalley, President and Principal Executive Officer |
| | (principal executive officer) |
| By (Signature and Title)* | /s/ Brinton W. Frith |
| | Brinton W. Frith, Treasurer and Principal Financial Officer |
| | (principal financial officer) |
* Print the name and title of each signing officer under his or her signature.