As filed with the U.S. Securities and Exchange Commission on 1/8/2018
UNITED STATES
SECURITIES AND EXCHANGE COMMISSION
Washington, D.C. 20549
FORM N-CSR
CERTIFIED SHAREHOLDER REPORT OF REGISTERED
MANAGEMENT INVESTMENT COMPANIES
Investment Company Act file number 811-22761
Stone Ridge Trust
(Exact name of registrant as specified in charter)
510 Madison Avenue, 21st Floor
New York, NY 10022
(Address of principal executive offices) (Zip code)
Stone Ridge Asset Management LLC
510 Madison Avenue, 21st Floor
New York, NY 10022
(Name and address of agent for service)
(855) 609-3680
Registrant’s telephone number, including area code
Date of fiscal year end: October 31, 2017
Date of reporting period: October 31, 2017
Item 1. Reports to Stockholders.
Annual Report
October 31, 2017

Stone Ridge High Yield Reinsurance Risk Premium Fund
Stone Ridge U.S. Large Cap Variance Risk Premium Fund
Stone Ridge U.S. Small Cap Variance Risk Premium Fund
Stone Ridge U.S. Variance Risk Premium Master Fund
Stone Ridge International Developed Markets Variance Risk Premium Fund
Stone Ridge Emerging Markets Variance Risk Premium Fund
Stone Ridge International Variance Risk Premium Master Fund
Stone Ridge Global Equity Variance Risk Premium Master Fund
Table of Contents
Shareholder Letter
The training of an instinct, of a truly fresh way of looking at the world, demands a kind of calm.
- Joshua Ramo, The Seventh Sense
December 2017
Dear Fellow Shareholder:
Stone Ridge launched its first funds five years ago. In the interim, we’ve become a global firm providing efficient access to a wide variety of uncorrelated risks, with responsibility for $14 billion of our investors’ life savings. One particularly wonderful aspect of the journey thus far: our footprints are indistinguishable from your footprints. We’re traveling together.
Together, we have explored Reinsurance, the Variance Risk Premium (VRP), and Alternative Lending. Together, we have changed the breadth of tools available for constructing portfolios and created a home for those seeking to innovate in finance. Together, we have breathed new life into certain investment structures originally conceived of by US regulators decades ago – and barely used until we dusted them off in 2013. Together, we have formed the Stone Ridge network of forward-thinking RIAs. Together, we are just getting started.
THE REAL POWER OF COMPOUNDING
If a high-priced management consultant analyzed our firm, I’m sure he’d tell us that we’re doing it all wrong. Looking externally, he’d tell us we should have a far more diversified client base, our products should be on every possible distribution platform, and we should do lots of press and advertising. Looking internally, he’d tell us we should have co-heads for every department, we should cull the bottom 5% of staff every year, and we should have a written succession plan for every employee. I count six too many “should’s”. We do none of those things. What the consultant would be missing is that when it comes to relationships, the power of compounding is far more potent than the power of diversification.
Think about the most important relationships in your life. They are almost certainly the ones that are the longest. Your parents, your spouse, your children, perhaps a couple of very old friends? Those relationships have benefitted the most from the power of compounding. The best shot Stone Ridge has to really matter to you – to be a true partner, not a vendor – is by practicing an extreme form of continuity. That’s why our RIA investors always see the same folks from Stone Ridge showing up in their offices, that’s why they see us a lot, and that’s why we don’t seek more diversification in our investor relationships. I’ll take compounding every time.
Viewed through that lens, perhaps it’s obvious why a key design principle of Stone Ridge since inception has been to have a smaller number of large relationships. This principle applies internally – let’s have a smaller number of phenomenally talented people, with virtually zero turnover. And it applies externally – let’s have a smaller number of large, forward thinking investors, who invest across the spectrum of Stone Ridge strategies. Indeed, 86% of the RIA firms we work with invest in multiple Stone Ridge funds, and in our last two product launches – $1.3 billion (18 months ago) and $2 billion (8 months ago), respectively – 100% of the firms at launch were existing Stone Ridge investors. We didn’t share those opportunities with any firm that wasn’t already an investor, and the trading profit for those products combined has been $610 million.
This compounding principle also applies to our partnerships with reinsurers. Many cynical industry participants assumed that in a hard market, reinsurers would share less risk with us and keep more of the
| | | | | | | | | | | | | | | | |
| | Stone Ridge Funds | | | | | | Annual Report | | | | | | October 31, 2017 | | |
| | | | | | | | | | |
2
Shareholder Letter
higher-yielding business for themselves. Exactly the opposite has occurred. After a $100+ billion loss year for the industry, globally leading reinsurers – our core partners that we have been working with for years – made Stone Ridge their first post-event call.
While we hoped for and expected this behavior, post-event reactions were untested. That’s no longer true. Most important, our ecosystem of investors, reinsurers, and Stone Ridge funds proved to be Antifragile – the ultimate hedge against disasters. The bottom line is that the best of the reinsurance industry continues to grow with Stone Ridge, strategically leveraging our capital to extend their own lead in the market.
INTIMACY, INNOVATION, AND SERVICE
Given the extreme version of relationship continuity we practice, the resulting level of intimacy inside our firm gives us the freedom to innovate. Stone Ridge is comprised of makers and inventors. We’re ceaseless tinkerers, infected with ceaseless optimism. Our view of the world is unconcerned with things as they are – we focus on things as they might be, as they ought to be. Though each of our product launches have been “first of its kind” in the ’40 Act, we take no satisfaction in our firm being admired as creative. We just want to be left alone to actually be creative.
Our moat is our simplicity, dug deeper by our insight that charisma is as overrated as patience is underrated. I like things that take a long time.
Stone Ridge is also powered differently. We don’t build products just to sell them. Instead, we sell so we can build. The creative process is its own reward. The purity in our “sell to build, don’t build to sell” ethos inspires and untethers us. It’s extraordinarily attractive to be around. In many ways, it’s addictive.
We point our creativity towards product development, in service of our investors and our communities. In doing so, we serve our country and the broader world, the ultimate in socially responsible investing. Our Reinsurance funds enabled $1 billion to flow to the victims of the California wildfires, and Hurricanes Harvey/Irma/Maria, in their darkest hour. And every day, our Alternative Lending fund, LENDX, provides a nudge to economic growth in local neighborhoods across the United States. Finance is a powerful force for good.
AMERICA AND LENDX
Our country is blessed with limitless natural resources, giant oceans protecting us on the left and right, and friendly neighbors to the north and south. We’ve got a military that any other country would trade for theirs, a political class constrained by an ingenious system of checks and balances, and a built-in self-correcting mechanism of free elections.
Two hundred forty years later, it is easy to forget how uniquely successful the American experiment has been. One powerful cause of this success: America allows people to bet on themselves. No one is guaranteed success, but in America we can all try. And try again. And try again.
Credit represents a powerful accelerant for those who want to bet on themselves. However, our current credit system is easily accessible and efficient only for subprime borrowers and very large borrowers. In contrast, small loans to prime and super-prime consumers, and especially to small businesses, are highly inefficient, too expensive, and often simply unavailable. This aspect of the credit formation process is largely broken, an unnecessary limiter to our country’s economic potential.
| | | | | | | | | | | | | | | | |
| | Stone Ridge Funds | | | | | | Annual Report | | | | | | October 31, 2017 | | |
| | | | | | | | | | |
3
Shareholder Letter
A recent Federal Reserve study1 of more than 10,000 small businesses across all 50 states revealed that “credit available for expansion” is the top financial challenge for business owners, and a staggering 59% use a credit card as their only source of borrowing. A related study by Paynet2 showed that a typical small business underwriting process requires 28 separate tasks, 100 hours of work, and takes four to eight weeks, at an average cost of $6,555 per application. What if the small business only wants to borrow $5,000? Or $10,000?
LENDX is part of the solution. Since its inception in June 2016, LENDX has purchased 410,009 loans, $7 billion in all, and supported 77,749 small businesses. An incredible 92% of our small business loans have been under $10,000. These are loans to your local ice cream parlor, your local barber shop, your local gas station. Given the $6,555 average cost of loan origination via banks, it’s clear that these loans would simply not have been possible without you and LENDX.
Imagine if each of those 77,749 small businesses hired just one extra person? Maybe you even know that person. Maybe you are that person. How much does that add to your local economy, to your local neighborhood, to the fabric of your daily life?
In the context of asset allocation, the vast majority of our investors use LENDX as a substitute for traditional fixed income, which today suffers from a potentially toxic combination of low yield and high duration. LENDX is the opposite: high yield and low duration. Since inception, LENDX has materially outperformed the Barclays Aggregate benchmark, with no correlation.
And while LENDX has delivered, we’re just warming up. In this asset class, unlike most, size is not the enemy of performance. Towards the end of 2017, the fund’s size allowed us to significantly lower our already market leading borrowing costs and further reduce servicing fees from certain platforms we selected. We’ve also started accepting material investments into LENDX from some of the largest (re)insurance companies in the world – all partners in our reinsurance franchise – because as one (re)insurance CEO remarked to me, “We’re not built for zero interest rates.” No one is.
A NEW 60/40?
Since the financial crisis low in March 2009, the 60/40 portfolio has been remarkably, at times preposterously, and certainly unsustainably, good. To be precise, during this time period of almost 8 years, 60/40 has delivered annualized excess returns of 12.7%, annualized volatility of 6.9%, and a Sharpe Ratio of 1.8. To put this in perspective, the 90-year average for 60/40 is 5.0% annualized excess returns, with 12.0% annualized volatility, and a Sharpe Ratio of 0.4. So compared to the long-term average, post-crisis 60/40 has enjoyed 2.5x the annualized excess return, about 40% less volatility, and more than 4.5x the Sharpe Ratio. Wow. It’s not supposed to be this easy to make money.
Try the following thought experiment: holding volatility constant at the long-term average, what would annualized excess returns have to be over the next 10 and 20 years, for the post-crisis Sharpe Ratio to be equal to the long term average?
The answer: negative 2.6% annualized return for the next 10 years, and positive 1.2% annualized return for the next 20 years. Another “Wow.” Imagine making essentially no money on your investments for the next 10 or 20 years. No, really, stop and think about it for a moment. What would that mean for you?
Virtually no one today is thinking that a “lost decade or two” of returns is possible. Let’s be clear: it may not occur, but it certainly is possible. Just like the (re)insurance industry is not built for zero interest rates,
| | | | | | | | | | | | | | | | |
| | Stone Ridge Funds | | | | | | Annual Report | | | | | | October 31, 2017 | | |
| | | | | | | | | | |
4
Shareholder Letter
today the world at large is not prepared for no returns to 60/40 for the next 10-20 years. Whether it’s pension funds, 401ks, or any individual investor’s retirement goals, extended periods of no returns are blissfully ignored in most everyone’s underwriting model.
So what to do? The good news is that markets have anticipated this challenge and a second wave of financial innovation is underway. The first wave “democratized investments” by making it possible for large numbers of investors to access the equity and bond markets via lower cost mutual funds and Exchange Traded Funds (ETFs). The second wave involves “democratizing balance sheets”, uncovering a much broader array of risks arising from financial intermediation – by banks, (re)insurance companies, and market makers – and making them available in cost-efficient structures.
In this second wave, we shift risk holding from a tiny number of gigantic balance sheets to a gigantic number of tiny balance sheets. We unlock profitable business lines historically buried within financial institutions. We de-risk the financial system. And we empower investors to access valuable P&L streams that can diversify 60/40. The alternative risk premiums Stone Ridge currently provides are just the start.
PRINCIPALS VS. AGENTS
To actually break free from 60/40, investors will need to find new managers that can provide both sufficient diversification to protect their wealth and sufficient return potential to grow their wealth. As part of new manager diligence, investors will need to ask different questions. Better questions. In fact, the quality of investor questions will determine the quality of investor performance.
Again, good news. Here is a necessary and sufficient set of diligence questions for managers:
Are the Portfolio Managers (PMs) and all employees required to invest in the funds? Do they pay full fees? Do the Independent Trustees of the Fund Board take all of their compensation in fund shares? Does the manager strictly limit when investors can purchase shares? Has the manager ever returned capital to investors?
If investors ask these questions, they never even have to meet with managers. If the answers are all yes, you are aligned. If not, be careful. The advice I have for manager selection is the same advice I have for my teenage daughter about teenage boy selection: ignore everything they say and only pay attention to what they do.
At Stone Ridge, we are principals, not agents. All PMs, indeed all employees, are required to invest in all strategies at full fees. Our Board elects to take 100% of their compensation in fund shares, not cash. We strictly limit when investors can give us money. All of this has been true since the firm began. And at the end of 2016, we returned $300 million of capital to investors when we determined that one of our funds was about to get too big, relative to the opportunity set.
Health warning: what we do is very risky. Do not get lulled into a false sense of security when looking at the consistency of our past results. In future years, there will be tragic earthquakes and hurricanes causing industry losses far worse than those this year. There will be market crashes and credit crises.
However, we’re unafraid to lead by example. The firm and employees together have over $400 million directly invested in our own funds. We’re proud of this alignment with our investors. It’s possible to go forward with no 60/40 at all. It may even be necessary.
| | | | | | | | | | | | | | | | |
| | Stone Ridge Funds | | | | | | Annual Report | | | | | | October 31, 2017 | | |
| | | | | | | | | | |
5
Shareholder Letter
OUR PARTNERSHIP
Stone Ridge is most proud of the 50/50 partnership we have with you, our clients. We are on the path together. You contribute the capital necessary to sustain and propel groundbreaking product development. We contribute our collective careers’ worth of experience in sourcing, structuring, execution, and risk management. Together, it works. In that spirit, I offer my deepest gratitude to you for sharing responsibility for your wealth with us this year. We look forward to serving you again in 2018.
Sincerely,
Ross Stevens
Founder, CEO
| | | | | | | | | | | | | | | | |
| | Stone Ridge Funds | | | | | | Annual Report | | | | | | October 31, 2017 | | |
| | | | | | | | | | |
6
Shareholder Letter
| 1 | Federal Reserve Bank of New York, 2016 Small Business Credit Survey (April 2017). |
| 2 | Paynet, “Rediscovering C&I Lending in 2017”. |
Return on Equity (ROE): a measure of a corporations profitability.
Sharpe Ratio: a portfolio’s excess return divided by its volatility.
RIA: stands for “Registered Investment Advisor”
60/40: stands for a portfolio comprised of 60% stocks and 40% bonds
P&L: stands for “profit and loss”
The Barclays Aggregate Bond Index is a broad-based flagship benchmark that measures the investment grade, US dollar-denominated, fixed-rate taxable bond market. It is not possible to invest in an index.
RISK DISCLOSURES
The Stone Ridge Funds consist of the Stone Ridge High Yield Reinsurance Risk Premium Fund (the “High Yield Reinsurance Fund”), the Stone Ridge Reinsurance Risk Premium Interval Fund (“SRRIX”), the Stone Ridge Post-Event Reinsurance Fund (“SRPEX” and, together with the High Yield Reinsurance Fund and SRRIX, the “Reinsurance Funds”), the Stone Ridge U.S. Large Cap Variance Risk Premium Fund (the “U.S. Large Cap VRP Fund”), the Stone Ridge U.S. Small Cap Variance Risk Premium Fund (the “U.S. Small Cap VRP Fund”), the Stone Ridge U.S. Variance Risk Premium Master Fund (the “U.S. VRP Master Fund” and, together with the U.S. Large Cap VRP Fund and the U.S. Small Cap VRP Fund, the “U.S. VRP Funds”), the Stone Ridge International Developed Markets Variance Risk Premium Fund (the “Developed Markets VRP Fund”), the Stone Ridge Emerging Markets Variance Risk Premium Fund (the “Emerging Markets VRP Fund”), the Stone Ridge International Variance Risk Premium Master Fund (the “International VRP Master Fund”), the Stone Ridge Global Equity Variance Risk Premium Master Fund (the “Global VRP Master Fund” and, together with the Developed Markets VRP Fund, the Emerging Markets VRP Fund, and the International VRP Master Fund, the “International VRP Funds”), the Stone Ridge All Asset Variance Risk Premium Fund (“AVRPX” and, together with the U.S. VRP Funds and the International VRP Funds, the “VRP Funds”) and the Stone Ridge Alternative Lending Risk Premium Fund (“LENDX” and, together with the Reinsurance Funds and the VRP Funds, the “Funds”).
The Portfolios consist of the Elements U.S. Portfolio, Elements U.S. Small Cap Portfolio, Elements International Portfolio, Elements International Small Cap Portfolio, and Elements Emerging Markets Portfolio (collectively, the “Portfolios”, and each a “Portfolio”).
The Funds and the Portfolios are generally sold to (i) institutional investors, including registered investment advisers (“RIAs”), that meet certain qualifications and have completed an educational program provided by Stone Ridge Asset Management LLC (the “Adviser”); (ii) clients of such institutional investors; and (iii) certain other eligible investors (as described in the relevant prospectus). Investors should carefully consider the Funds’ and the Portfolios’ risks and investment objectives, as an investment in the Funds and/or the Portfolios may not be appropriate for all investors and the Funds and the Portfolios are not designed to be a complete investment program. There can be no assurance that the Funds and/or the Portfolios will achieve their investment objectives. An investment in the Funds and/or the Portfolios involves a high degree of risk. It is possible that investing in a Fund and/or a Portfolio may result in a loss of some or all of the amount invested. Before making an investment/allocation decision, investors should (i) consider the suitability of this investment with respect to an investor’s or a client’s investment objectives and individual situation and (ii) consider factors such as an investor’s or a client’s net worth, income, age and risk tolerance. Investment should be avoided where an investor/client has a short-term investing horizon and/or cannot bear the loss of some or all of the investment. Before investing in a Fund and/or a Portfolio, an investor should read the discussion of the risks of investing in the Fund and/or the Portfolio in the relevant prospectus.
Holdings and sector allocations are subject to change and are not a recommendation to buy or sell any security.
Investing in funds involves risks, as does all investing. Principal loss is possible.
Derivatives are financial contracts the value of which depends on, or is derived from, the underlying security or other reference asset. Derivatives involve the risk that changes in their value may not move as expected relative to changes in the value of the underlying reference they are designed to track. A Fund may invest in derivatives to generate income from premiums, for investment purposes and for hedging and risk management purposes. Derivatives risk may be more significant when derivatives are used to enhance return or as a substitute for a cash investment option, rather than solely to hedge the risk of a position held by a Fund. A Fund’s use of derivatives as part of its principal investment strategy to sell protection against the volatility of various underlying investments involves the risk that, if the volatility of the underlying investments is greater than expected, the Fund will bear losses to the extent of its obligations under the relevant derivative contracts, which may not be outweighed by the amount of any premiums received for the sale of such derivative instruments. The use of derivatives involves risks that are in addition to, and potentially greater than, the risks of investing directly in securities and other more traditional assets. Derivatives also present other risks, including market risk, illiquidity risk, currency risk, and credit risk. A decision as to whether, when and how to use options involves the exercise of skill and judgment, and even a well-conceived and well-executed options program may be adversely affected by market behavior or unexpected events.
| | | | | | | | | | | | | | | | |
| | Stone Ridge Funds | | | | | | Annual Report | | | | | | October 31, 2017 | | |
| | | | | | | | | | |
7
Shareholder Letter
The use of derivatives can lead to losses because of adverse movements in the price or value of the reference instrument, due to failure of a counterparty or due to tax or regulatory constraints. Derivatives may create economic leverage in a Fund, which magnifies the Fund’s exposure to the reference instrument and magnifies potential losses. When derivatives are used to gain or limit exposure to a particular market or market segment, their performance may not correlate as expected to the performance of such market, thereby causing a Fund to fail to achieve its original purpose for using such derivatives. A decision as to whether, when and how to use derivatives involves the exercise of specialized skill and judgment, and a transaction may be unsuccessful in whole or in part because of market behavior, unexpected events or the Adviser’s failure to use derivatives effectively. Derivative instruments may be difficult to value, may be illiquid and may be subject to wide swings in valuation caused by changes in the value of the reference instrument. Commodities interest trading involves substantial risk of loss.
Successful options strategies may require the anticipation of future movements in securities prices or other economic factors of the underlying investments. No assurances can be given that the Adviser’s judgment in this respect will be correct. When a call option is exercised, potential losses on written covered call options can be equal to the appreciation of the underlying security in excess of the option exercise price. When a put option is exercised, a Fund may be required to take delivery of an underlying instrument that it does not want to have in its portfolio, while paying a price for that security in excess of its current market price, or to make a cash payment equal to any depreciation in the value of the underlying instrument below the strike price of the put option. Accordingly, the potential losses from writing options can be substantial.
The value of equity instruments to which a Fund is exposed may fall due to general market or economic conditions; overall market changes; local, regional or global political, social or economic instability; currency, interest rate and commodity price fluctuations; perceptions regarding the industries in which the issuers participate, and the particular circumstances and performance of the issuers. Market conditions may affect certain types of equity securities to a greater extent than other types. The equity securities of smaller, less seasoned companies are generally subject to greater price fluctuations, limited liquidity, higher transaction costs and higher investment risk. Smaller companies may have limited product lines, markets or financial resources, may be dependent on a limited management group, and may lack substantial capital reserves or an established performance record. There may be generally less publicly available information about such companies than for larger, more established companies.
The equity securities of large-capitalization companies can perform differently from other segments of the equity market or the equity market as a whole. Companies with large capitalization tend to go in and out of favor based on market and economic conditions and, while they can be less volatile than companies with smaller market capitalizations, they may also be less flexible in evolving markets or unable to implement change as quickly as their smaller counterparts. Accordingly the value of equity securities issued by large-capitalization companies may not rise to the same extent as the value of equity securities issued by small or mid-cap companies under certain market conditions or during certain periods.
Direct or indirect investments in securities of foreign issuers involve risks not ordinarily associated with exposure to securities and instruments of U.S. issuers, including differences in accounting, auditing and financial standards; less government supervision and regulation; currency risk; risks of expropriation, confiscatory taxation, political or social instability or diplomatic developments; less publicly available information; less volume in foreign markets; increased costs of transacting in foreign markets. These risks are heightened in emerging markets.
Event-linked bonds, catastrophe bonds and other reinsurance-related securities carry large uncertainties and major risk exposures to adverse conditions. If a trigger event, as defined within the terms of the bond, involves losses or other metrics exceeding a specific magnitude in the geographic region and time period specified therein, a Fund may lose a portion or all of its investment in such security, including accrued interest and/or principal invested in such security. Such losses may be substantial. The reinsurance-related securities in which the Funds invest are considered “high yield” or “junk bonds.”
The reinsurance industry relies on risk modeling to analyze potential risks in a single transaction and in a portfolio of transactions. The industry uses the models of two independent risk modeling firms, RMS and AIR. Some firms may use their own internal, proprietary risk models in addition to RMS and AIR models. The models are based on probabilistic simulations that generate thousands or millions of potential events based on historical data, scientific and meteorological principles and extensive data on current insured properties. Every cat bond and quota share trade comes with a set of risk analytics and statistics. Cat bonds are all modeled by either RMS or AIR and the full set of risk statistics are provided in the offering circular. Quota shares are all modeled by RMS, AIR and/or the sponsor, and all the risk statistics are also provided.
Expected loss refers to the estimated annual loss as a percentage of the principal. This is calculated by the risk modeling firms using the results of thousands or millions of simulations. Median loss is a related term that refers to the estimated median loss in the thousands or millions of simulations that the risk modeling firms run for an asset or portfolio.
The value of LENDX’s investments in whole loans and other alternative lending-related securities, such as shares, certificates, notes or other securities representing an interest in and the right to receive principal and interest payments due on whole loans or fractions of whole loans, is entirely dependent on the borrowers’ continued and timely payments. If a borrower is unable or fails to make payments on a loan for any reason, LENDX may be greatly limited in its ability to recover any outstanding principal or interest due, as (among other reasons) LENDX may not have direct recourse against the borrower or may otherwise be limited in its ability to directly enforce its rights under the loan, whether through the borrower or the platform through which such loan was originated, the loan may be unsecured or under-collateralized and/or it may be impracticable to commence a legal proceeding against the defaulting
| | | | | | | | | | | | | | | | |
| | Stone Ridge Funds | | | | | | Annual Report | | | | | | October 31, 2017 | | |
| | | | | | | | | | |
8
Shareholder Letter
borrower. If LENDX were unable to recover unpaid principal or interest due, this would cause LENDX’s net asset value to decrease. Many of LENDX’s investments are associated with loans that are unsecured obligations of borrowers. This means that they are not secured by any collateral, not insured by any third party, not backed by any governmental authority in any way and, except in the case of certain loans to businesses, not guaranteed by any third party. LENDX generally will need to rely on the efforts of the platforms, servicers or their designated collection agencies to collect on defaulted loans and there is no guarantee that such parties will be successful in their efforts to collect on loans. Even if a loan in which LENDX has investment exposure is secured, there can be no assurance that the collateral will, when recovered and liquidated, generate sufficient (or any) funds to offset any losses associated with the defaulting loan. It is possible that the same collateral could secure multiple loans, in which case the liquidation proceeds of the collateral may be insufficient to cover the payments due on all the loans secured by that collateral. LENDX may have limited knowledge about the underlying loans and will be dependent upon the platform for information regarding underlying loans. Although LENDX conducts diligence on the platforms, the Fund generally does not have the ability to independently verify the information provided by the platforms, other than payment information regarding loans and other alternative lending-related securities owned by LENDX, which the Fund will observe directly as payments are received. Platforms may not have an obligation to update borrower information, and, therefore, the Fund may not be aware of any impairment in a borrower’s creditworthiness subsequent to the making of a particular loan. Although LENDX conducts diligence on the credit scoring methodology used by platforms from which the Fund purchases alternative lending-related securities, the Fund typically will not have access to all of the data that platforms utilize to assign credit scores to particular loans purchased directly or indirectly by the Fund, and will not independently diligence or confirm the truthfulness of such information or otherwise evaluate the basis for the platform’s credit score of those loans. The default history for alternative lending borrowing arrangements is limited and future defaults may be higher than historical defaults.
In general, the value of a debt security is likely to fall as interest rates rise. Below-investment grade securities, which are often referred to as “junk,” have predominantly speculative characteristics with respect to the issuer’s capacity to pay interest and repay principal. They may also be difficult to value and illiquid. LENDX’s investments in securitization vehicles or other special purpose entities that hold alternative lending-related securities (asset-backed securities) may involve risks that differ from or are greater than risks associated with other types of investments.
LENDX may invest directly or indirectly in the alternative lending-related securities of foreign issuers. Such investments may involve risks not ordinarily associated with exposure to alternative lending-related securities of U.S. issuers. The foreign alternative lending industry may be subject to less governmental supervision and regulation than exists in the U.S.; conversely, foreign regulatory regimes applicable to the alternative lending industry may be more complex and more restrictive than those in the U.S., resulting in higher costs associated with such investments, and such regulatory regimes may be subject to interpretation or change without prior notice to investors, such as LENDX. Foreign platforms may not be subject to accounting, auditing, and financial reporting standards and practices comparable to those in the U.S. Due to difference in legal systems, there may be difficulty in obtaining or enforcing a court judgment outside the U.S. For example, bankruptcy laws may differ across the jurisdictions in which the Fund may invest and it may be difficult for the servicer to pursue borrowers who borrow through non-U.S. platforms. In addition, to the extent that investments are made in a limited number of countries, events in those countries will have a more significant impact on LENDX. LENDX’s investments in foreign securities may be subject to risks of increased transaction costs, potential delays in settlement or unfavorable differences between the U.S. economy and foreign economies. LENDX’s exposure to alternative lending-related securities issued by foreign issuers may be subject to withholding and other foreign taxes, which may adversely affect the net return on such investments. As described further under “Currency Risk,” fluctuations in foreign currency exchange rates and exchange controls may adversely affect the market value of LENDX’s investments in alternative lending-related securities of foreign issuers. LENDX is unlikely to be able to pass through to its shareholders foreign income tax credits in respect of any foreign income taxes it pays.
Some Funds may obtain financing to make investments and may obtain leverage through derivative instruments or asset-backed securities that afford the Fund economic leverage. Therefore, such Funds are subject to leverage risk. Leverage magnifies a Fund’s exposure to declines in the value of one or more underlying investments or creates investment risk with respect to a larger pool of assets than the Fund would otherwise have and may be considered a speculative technique. The value of an investment in a Fund will be more volatile and other risks tend to be compounded if and to the extent the Fund borrows or uses derivatives or other investments that have embedded leverage. Engaging in such transactions may cause a Fund to liquidate positions when it may not be advantageous to do so to satisfy its obligations or to meet segregation requirements.
Economic, political, and issuer-specific events will cause the value of securities, and the Portfolio that owns them, to rise or fall. Because the value of your investment in the Portfolio will fluctuate, you may lose money, even over the long term. Securities of smaller companies are often less liquid than those of larger companies. This could make it difficult to sell a smaller company security at a desired time or price. In general, smaller companies are also more vulnerable than larger companies to adverse business or economic developments, and they may have more limited resources. As a result, prices of smaller company securities may fluctuate more than those of larger companies. Foreign securities prices may decline or fluctuate because of economic or political actions of foreign governments and/or less regulated or liquid securities markets and may give rise to foreign currency risk. In addition to smaller company risk, securities of companies that exhibit other factors such as value, momentum or quality may be riskier than securities of companies that do not exhibit those factors, and may perform differently from the market as a whole. If the Portfolio uses derivatives, the Portfolio will be directly exposed to the risks of that derivative, including the risk that the counterparty to the derivative is unable or unwilling to perform its obligations. Derivatives are subject to a number of additional risks including risks
| | | | | | | | | | | | | | | | |
| | Stone Ridge Funds | | | | | | Annual Report | | | | | | October 31, 2017 | | |
| | | | | | | | | | |
9
Shareholder Letter
associated with the potential illiquidity of the derivative, changes in interest rates, market movements, and the possibility of improper valuation. Changes in the value of a derivative may not correlate perfectly with the underlying asset, and the Portfolio could lose more than the amount invested in a derivative. Securities lending and similar transactions involve the risk that the counterparty may fail to return the securities in a timely manner or at all and that the value of collateral securing a securities loan or similar transaction falls.
The Funds and the Portfolios may invest in illiquid or restricted securities, which may be difficult or impossible to sell at a time that a Fund or a Portfolio would like or at the price that a Fund or a Portfolio believes the security is currently worth.
Each Fund and each Portfolio intends to qualify for treatment as a regulated investment company (“RIC”) under the Internal Revenue Code. In order to qualify for such treatment, a Fund must derive at least 90% of its gross income each taxable year from qualifying income, meet certain asset diversification tests at the end of each fiscal quarter, and distribute at least 90% of its investment company taxable income. A Fund’s and a Portfolio’s investment strategy will potentially be limited by its intention to qualify for treatment as a RIC. The tax treatment of certain of the Funds’ and certain of the Portfolios’ investments under one or more of the qualification or distribution tests applicable to RICs is not certain. An adverse determination or future guidance by the IRS might affect a Fund’s and a Portfolio’s ability to qualify for such treatment.
If, in any year, a Fund or a Portfolio were to fail to qualify for treatment as a RIC under the Internal Revenue Code for any reason, and were unable to cure such failure, the Fund and the Portfolio would be subject to tax on its taxable income at corporate rates, and all distributions from earnings and profits, including any distributions of net tax-exempt income and net long-term capital gains, would be taxable to shareholders as ordinary income.
For additional risks, please refer to the prospectus.
The Reinsurance Funds, the International VRP Funds, AVRPX, LENDX, and the Portfolios are classified as non-diversified under the 1940 Act. Accordingly, these Funds and the Portfolios may invest a greater portion of their assets in the securities of a single issuer than if they were “diversified” funds. To the extent that these Funds and the Portfolios invest a higher percentage of their assets in the securities of a single issuer, they are subject to a higher degree of risk associated with and developments affecting that issuer than a fund that invests more widely.
Diversification does not assure a profit or protect against a loss in a declining market.
The Reinsurance Interval Fund, AVRPX and LENDX have an interval fund structure pursuant to which each Fund, subject to applicable law, conducts quarterly repurchase offers of the Fund’s outstanding shares at net asset value (“NAV”), subject to approval of the Board of Trustees. In all cases, such repurchases will be for at least 5% and not more than 25% of the relevant Fund’s outstanding shares. Repurchase offers are currently expected to be 5% for SRRIX and LENDX and 10% for AVRPX. In connection with any given repurchase offer, it is possible that a Fund may offer to repurchase only the minimum amount of 5% of its outstanding shares. It is possible that a repurchase offer may be oversubscribed, with the result that shareholders may only be able to have a portion of their shares repurchased. There is no assurance that you will be able to tender your Shares when or in the amount that you desire. The Funds’ shares are not listed and the Funds do not currently intend to list their shares for trading on any national securities exchange. There is not expected to be any secondary trading market in these shares. The shares are, therefore, not marketable. Even though the Funds will make quarterly repurchase offers to repurchase a portion of the shares to try to provide liquidity to shareholders, you should consider the shares to be illiquid.
Performance data quoted represents past performance; past performance does not guarantee future results. The investment return and principal value of an investment will fluctuate so that an investor’s shares, when redeemed, may be worth more or less than their original cost. Current performance of a Fund may be lower or higher than the performance quoted. Performance data current to the most recent month end may be obtained by calling 855-609-3680.
Standardized returns as of most recent quarter-end (09/30/17): for VRLIX 1Yr=12.37%, since inception(5/1/2013)=8.25%; for VRSIX 1Yr=9.23%, since inception(5/1/2013)=6.42%; for VRFIX 1Yr=12.03%, since inception(2/12/14)=3.59%; for VRMIX 1Yr=11.25%, since inception (2/12/2014)=1.22%; for VRGIX 1Yr=11.18%, since inception (11/17/2014)=4.35%; for VRPIX 1Yr=11.25%, since inception (5/22/2013)=7.28%; for VRIIX 1Yr=11.38%, since inception (2/12/2014)=2.47%; for SHRIX 1Yr=-5.86%, since inception (2/4/2013)=4.26%; for SRRIX 1Yr=-10.42%, since inception (12/10/2013)=3.31%; for AVRPX 1Yr=13.75%, since inception (4/13/2015)=8.25%; for LENDX 1Yr=6.5%, since inception (6/1/2016)=10.08%; for ELUSX since inception (4/3/17)=5.9%; for ELSMX since inception (4/3/17)=5.6%; for ELINX since inception (5/1/17)=9.4%; for ELISX since inception (5/1/17)=12.4%; for ELMMX since inception (6/1/17)=6.7%; As of 09/30/17, 30-day SEC yield: SHRIX 10.92%; SRRIX 0.80%; LENDX 10.54% (net), 10.62% (gross of subsidized expenses). Results for the Funds are annualized; all Fund returns reflect the reinvestment of dividends and other earnings and are net of fees and expenses. As a result of economic incentives received from platforms that may not be repeated, early LENDX performance was unusually strong for the period shown and should not be extrapolated to future periods. Results for the Portfolios reflect the reinvestment of all dividends, and are net of fees and expenses, and reflect voluntary waivers and reimbursement of all of the Portfolios’ fees and expenses by Elements Portfolios. Returns shown do not reflect the deduction of taxes that a shareholder would pay on fund distributions or the redemption of fund shares. In the absence of fee waivers and reimbursements, returns for the Portfolios would have been lower. Voluntary expense reimbursement has been discontinued in part, and voluntary fee waiver and expense reimbursement may be discontinued in part or in whole at any time.
| | | | | | | | | | | | | | | | |
| | Stone Ridge Funds | | | | | | Annual Report | | | | | | October 31, 2017 | | |
| | | | | | | | | | |
10
Shareholder Letter
Gross expense ratios as stated in the relevant prospectus: SRRIX 2.42%, SHRIX 1.83%, AVRPX 2.81%, VRLIX 1.46%, VRSIX 1.56%, VRFIX 2.00%, VRMIX 1.80%, VRPIX 1.60%, VRIIX 2.16%, VRGIX 1.95%, LENDX 4.18%. Please see the financial highlights section of each Fund’s shareholder report for more recent expense ratios.
Information developed internally or furnished by others, upon which all or portions of the information contained herein are based, are from sources believed to be reliable. Stone Ridge makes no representation as to the accuracy, adequacy or completeness of such information and it has accepted the information without further verification.
The information provided herein should not be construed in any way as tax, capital, accounting, legal or regulatory advice. Investors should seek independent legal and financial advice, including advice as to tax consequences, before making any investment decision.
Opinions expressed are subject to change at any time, and are not guaranteed and should not be considered investment advice.
The Funds’ and Portfolios’ investment objectives, risks, charges and expenses must be considered carefully before investing. The relevant prospectus contains this and other important information about the investment company. You can obtain an additional copy of the Funds’ and the Portfolios’ most recent periodic reports and certain other regulatory filings by calling 855-609-3860 or visiting www.stoneridgefunds.com for the Funds and www.elementsfunds.com for the Portfolios. The Funds’ and the Portfolios’ prospectuses, which include a statement of additional information, can be found by visiting:
Stone Ridge High Yield Reinsurance Risk Premium Fund1: Supplement, Prospectus and SAI
Stone Ridge Reinsurance Risk Premium Interval Fund2: Supplement, Prospectus and SAI
Stone Ridge Post-Event Reinsurance Fund2: Supplement, Prospectus and SAI
Stone Ridge U.S. Large Cap Variance Risk Premium Fund, Stone Ridge U.S. Small Cap Variance Risk Premium Fund, Stone Ridge U.S. Variance Risk Premium Master Fund, Stone Ridge International Developed Markets Variance Risk Premium Fund, Stone Ridge Emerging Markets Variance Risk Premium Fund, Stone Ridge International Variance Risk Premium Master Fund and Stone Ridge Global Equity Variance Risk Premium Master Fund1: Supplement2, Supplement, Prospectus and SAI
Stone Ridge All Asset Variance Risk Premium Fund2: Supplement, Prospectus and SAI
Stone Ridge Alternative Lending Risk Premium Fund2: Supplement, Prospectus and SAI
1Open-end fund, 2Closed-end interval fund
The prospectuses should be read carefully before investing.
The Stone Ridge Funds and the Portfolios are distributed by ALPS Distributors, Inc. SRG000341. Exp 12/28/18.
| | | | | | | | | | | | | | | | |
| | Stone Ridge Funds | | | | | | Annual Report | | | | | | October 31, 2017 | | |
| | | | | | | | | | |
11
| | | | |
| STONE RIDGE HIGH YIELD REINSURANCE RISK PREMIUM FUND | | | | |
|
| PERFORMANCE DATA (Unaudited) |
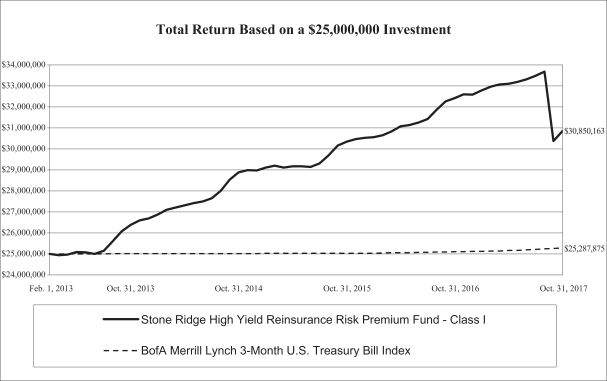
This chart assumes an initial gross investment of $25,000,000 made on February 1, 2013 (commencement of operations). Returns shown include the reinvestment of all dividends. Returns shown do not reflect the deduction of taxes that a shareholder would pay on fund distributions or the redemption of fund shares. In the absence of fee waivers and reimbursements, returns for the Fund would have been lower. Past performance is not predictive of future performance. Investment return and principal value will fluctuate, so that your shares, when redeemed, may be worth more or less than the original cost.
The Bank of America (BofA) Merrill Lynch 3-Month U.S. Treasury Bill Index is an index of short-term U.S. Government securities with a remaining term to final maturity of less than three months. Index figures do not reflect any deduction of fees, taxes or expenses, and are not available for investment.
| | | | | | | | |
| AVERAGE ANNUAL TOTAL RETURNS (FOR PERIODS ENDED OCTOBER 31, 2017) | | | | |
| | | 1-year
period
ended
10/31/2017 | | | Since
Inception
(02/01/13) | |
Stone Ridge High Yield Reinsurance Risk Premium Fund — Class I | | | -4.85% | | | | 4.52% | |
Stone Ridge High Yield Reinsurance Risk Premium Fund — Class M | | | -5.01% | | | | 4.36% | |
BofA Merrill Lynch 3-Month U.S. Treasury Bill Index | | | 0.72% | | | | 0.24% | |
| | | | | | | | | | | | | | | | |
| | Stone Ridge Funds | | | | | | Annual Report | | | | | | October 31, 2017 | | |
| | | | | | | | | | |
12
| | | | |
| STONE RIDGE U.S. LARGE CAP VARIANCE RISK PREMIUM FUND | | | | |
|
| PERFORMANCE DATA (Unaudited) |

This chart assumes an initial gross investment of $25,000,000 made on May 1, 2013 (commencement of operations). Returns shown include the reinvestment of all dividends. Returns shown do not reflect the deduction of taxes that a shareholder would pay on fund distributions or the redemption of fund shares. In the absence of fee waivers and reimbursements, returns for the Fund would have been lower. Past performance is not predictive of future performance. Investment return and principal value will fluctuate, so that your shares, when redeemed, may be worth more or less than the original cost.
The Bank of America (BofA) Merrill Lynch 3-Month U.S. Treasury Bill Index is an index of short-term U.S. Government securities with a remaining term to final maturity of less than three months. Index figures do not reflect any deduction of fees, taxes or expenses, and are not available for investment.
| | | | | | | | |
| AVERAGE ANNUAL TOTAL RETURNS (FOR PERIODS ENDED OCTOBER 31, 2017) | | | | |
| | | 1-year
period
ended
10/31/2017 | | | Since
Inception
(05/01/13) | |
Stone Ridge U.S. Large Cap Variance Risk Premium Fund — Class I | | | 13.34% | | | | 8.34% | |
Stone Ridge U.S. Large Cap Variance Risk Premium Fund — Class M | | | 13.13% | | | | 8.17% | |
BofA Merrill Lynch 3-Month U.S. Treasury Bill Index | | | 0.72% | | | | 0.25% | |
| | | | | | | | | | | | | | | | |
| | Stone Ridge Funds | | | | | | Annual Report | | | | | | October 31, 2017 | | |
| | | | | | | | | | |
13
| | | | |
| STONE RIDGE U.S. SMALL CAP VARIANCE RISK PREMIUM FUND | | | | |
|
| PERFORMANCE DATA (Unaudited) |
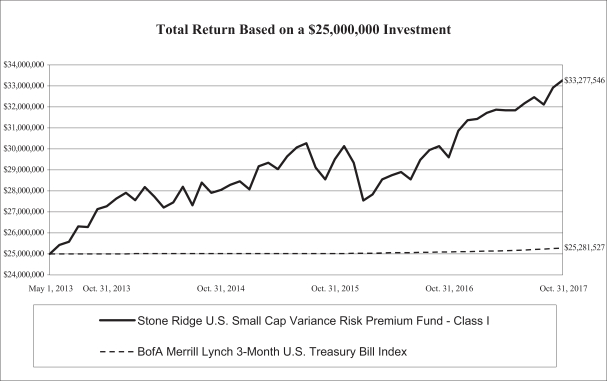
This chart assumes an initial gross investment of $25,000,000 made on May 1, 2013 (commencement of operations). Returns shown include the reinvestment of all dividends. Returns shown do not reflect the deduction of taxes that a shareholder would pay on fund distributions or the redemption of fund shares. In the absence of fee waivers and reimbursements, returns for the Fund would have been lower. Past performance is not predictive of future performance. Investment return and principal value will fluctuate, so that your shares, when redeemed, may be worth more or less than the original cost.
The Bank of America (BofA) Merrill Lynch 3-Month U.S. Treasury Bill Index is an index of short-term U.S. Government securities with a remaining term to final maturity of less than three months. Index figures do not reflect any deduction of fees, taxes or expenses, and are not available for investment.
| | | | | | | | |
| AVERAGE ANNUAL TOTAL RETURNS (FOR PERIODS ENDED OCTOBER 31, 2017) | | | | | | |
| | | 1-year
period
ended
10/31/2017 | | | Since
Inception
(05/01/13) | |
Stone Ridge U.S. Small Cap Variance Risk Premium Fund — Class I | | | 12.39% | | | | 6.55% | |
Stone Ridge U.S. Small Cap Variance Risk Premium Fund — Class M | | | 12.26% | | | | 6.39% | |
BofA Merrill Lynch 3-Month U.S. Treasury Bill Index | | | 0.72% | | | | 0.25% | |
| | | | | | | | | | | | | | | | |
| | Stone Ridge Funds | | | | | | Annual Report | | | | | | October 31, 2017 | | |
| | | | | | | | | | |
14
| | | | |
| STONE RIDGE U.S. VARIANCE RISK PREMIUM MASTER FUND | | | | |
|
| PERFORMANCE DATA (Unaudited) |

This chart assumes an initial gross investment of $25,000,000 made on May 22, 2013 (commencement of operations). Returns shown include the reinvestment of all dividends. Returns shown do not reflect the deduction of taxes that a shareholder would pay on fund distributions or the redemption of fund shares. Past performance is not predictive of future performance. Investment return and principal value will fluctuate, so that your shares, when redeemed, may be worth more or less than the original cost.
The Bank of America (BofA) Merrill Lynch 3-Month U.S. Treasury Bill Index is an index of short-term U.S. Government securities with a remaining term to final maturity of less than three months. Index figures do not reflect any deduction of fees, taxes or expenses, and are not available for investment.
| | | | | | | | |
| AVERAGE ANNUAL TOTAL RETURNS (FOR PERIODS ENDED OCTOBER 31, 2017) | | | | | | |
| | | 1-year
period
ended
10/31/2017 | | | Since
Inception
(05/22/13) | |
Stone Ridge U.S. Variance Risk Premium Master Fund — Class I | | | 12.94% | | | | 7.38% | |
Stone Ridge U.S. Variance Risk Premium Master Fund — Class M | | | 12.69% | | | | 7.21% | |
BofA Merrill Lynch 3-Month U.S. Treasury Bill Index | | | 0.72% | | | | 0.25% | |
| | | | | | | | | | | | | | | | |
| | Stone Ridge Funds | | | | | | Annual Report | | | | | | October 31, 2017 | | |
| | | | | | | | | | |
15
| | | | |
| STONE RIDGE INTERNATIONAL DEVELOPED MARKETS VARIANCE RISK PREMIUM FUND | | | | |
|
| PERFORMANCE DATA (Unaudited) |
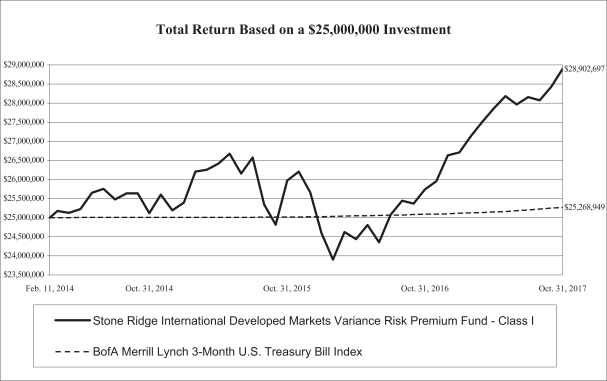
This chart assumes an initial gross investment of $25,000,000 made on February 11, 2014 (commencement of operations). Returns shown include the reinvestment of all dividends. Returns shown do not reflect the deduction of taxes that a shareholder would pay on fund distributions or the redemption of fund shares. In the absence of fee waivers and reimbursements, returns for the Fund would have been lower. Past performance is not predictive of future performance. Investment return and principal value will fluctuate, so that your shares, when redeemed, may be worth more or less than the original cost.
The Bank of America (BofA) Merrill Lynch 3-Month U.S. Treasury Bill Index is an index of short-term U.S. Government securities with a remaining term to final maturity of less than three months. Index figures do not reflect any deduction of fees, taxes or expenses, and are not available for investment.
| | | | | | | | |
| AVERAGE ANNUAL TOTAL RETURNS (FOR PERIODS ENDED OCTOBER 31, 2017) | | | | | | |
| | | 1-year
period
ended
10/31/2017 | | | Since
Inception
(02/11/14) | |
Stone Ridge International Developed Markets Variance Risk Premium Fund — Class I | | | 12.28% | | | | 3.97% | |
Stone Ridge International Developed Markets Variance Risk Premium Fund — Class M | | | 12.01% | | | | 3.82% | |
BofA Merrill Lynch 3-Month U.S. Treasury Bill Index | | | 0.72% | | | | 0.29% | |
| | | | | | | | | | | | | | | | |
| | Stone Ridge Funds | | | | | | Annual Report | | | | | | October 31, 2017 | | |
| | | | | | | | | | |
16
| | | | |
| STONE RIDGE EMERGING MARKETS VARIANCE RISK PREMIUM FUND | | | | |
|
| PERFORMANCE DATA (Unaudited) |
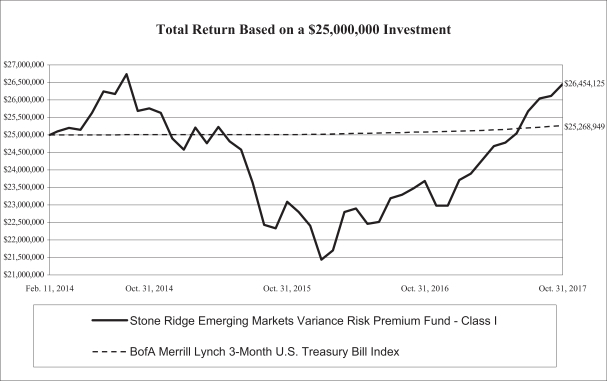
This chart assumes an initial gross investment of $25,000,000 made on February 11, 2014 (commencement of operations). Returns shown include the reinvestment of all dividends. Returns shown do not reflect the deduction of taxes that a shareholder would pay on fund distributions or the redemption of fund shares. In the absence of fee waivers and reimbursements, returns for the Fund would have been lower. Past performance is not predictive of future performance. Investment return and principal value will fluctuate, so that your shares, when redeemed, may be worth more or less than the original cost.
The Bank of America (BofA) Merrill Lynch 3-Month U.S. Treasury Bill Index is an index of short-term U.S. Government securities with a remaining term to final maturity of less than three months. Index figures do not reflect any deduction of fees, taxes or expenses, and are not available for investment.
| | | | | | | | |
| AVERAGE ANNUAL TOTAL RETURNS (FOR PERIODS ENDED OCTOBER 31, 2017) | | | | |
| | | 1-year
period
ended
10/31/2017 | | | Since
Inception
(02/11/14) | |
Stone Ridge Emerging Markets Variance Risk Premium Fund — Class I | | | 11.67% | | | | 1.54% | |
Stone Ridge Emerging Markets Variance Risk Premium Fund — Class M | | | 11.50% | | | | 1.37% | |
BofA Merrill Lynch 3-Month U.S. Treasury Bill Index | | | 0.72% | | | | 0.29% | |
| | | | | | | | | | | | | | | | |
| | Stone Ridge Funds | | | | | | Annual Report | | | | | | October 31, 2017 | | |
| | | | | | | | | | |
17
| | | | |
| STONE RIDGE INTERNATIONAL VARIANCE RISK PREMIUM MASTER FUND | | | | |
|
| PERFORMANCE DATA (Unaudited) |
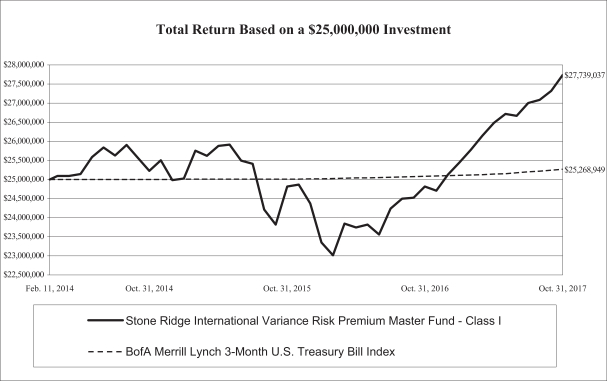
This chart assumes an initial gross investment of $25,000,000 made on February 11, 2014 (commencement of operations). Returns shown include the reinvestment of all dividends. Returns shown do not reflect the deduction of taxes that a shareholder would pay on fund distributions or the redemption of fund shares. In the absence of fee waivers and reimbursements, returns for the Fund would have been lower. Past performance is not predictive of future performance. Investment return and principal value will fluctuate, so that your shares, when redeemed, may be worth more or less than the original cost.
The Bank of America (BofA) Merrill Lynch 3-Month U.S. Treasury Bill Index is an index of short-term U.S. Government securities with a remaining term to final maturity of less than three months. Index figures do not reflect any deduction of fees, taxes or expenses, and are not available for investment.
| | | | | | | | |
| AVERAGE ANNUAL TOTAL RETURNS (FOR PERIODS ENDED OCTOBER 31, 2017) | | | | |
| | | 1-year
period
ended
10/31/2017 | | | Since
Inception
(02/11/14) | |
Stone Ridge International Variance Risk Premium Master Fund — Class I | | | 11.77% | | | | 2.83% | |
Stone Ridge International Variance Risk Premium Master Fund — Class M | | | 11.63% | | | | 2.70% | |
BofA Merrill Lynch 3-Month U.S. Treasury Bill Index | | | 0.72% | | | | 0.29% | |
| | | | | | | | | | | | | | | | |
| | Stone Ridge Funds | | | | | | Annual Report | | | | | | October 31, 2017 | | |
| | | | | | | | | | |
18
| | | | |
| STONE RIDGE GLOBAL EQUITY VARIANCE RISK PREMIUM MASTER FUND | | | | |
|
| PERFORMANCE DATA (Unaudited) |
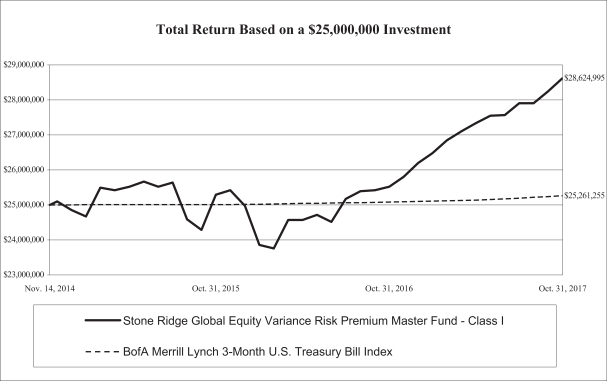
This chart assumes an initial gross investment of $25,000,000 made on November 14, 2014 (commencement of operations). Returns shown include the reinvestment of all dividends. Returns shown do not reflect the deduction of taxes that a shareholder would pay on fund distributions or the redemption of fund shares. In the absence of fee waivers and reimbursements, returns for the Fund would have been lower. Past performance is not predictive of future performance. Investment return and principal value will fluctuate, so that your shares, when redeemed, may be worth more or less than the original cost.
The Bank of America (BofA) Merrill Lynch 3-Month U.S. Treasury Bill Index is an index of short-term U.S. Government securities with a remaining term to final maturity of less than three months. Index figures do not reflect any deduction of fees, taxes or expenses, and are not available for investment.
| | | | | | | | |
| AVERAGE ANNUAL TOTAL RETURNS (FOR PERIODS ENDED OCTOBER 31, 2017) | | | | |
| | | 1-year
period
ended
10/31/2017 | | | Since
Inception
(11/14/14) | |
Stone Ridge Global Equity Variance Risk Premium Master Fund — Class I | | | 12.17% | | | | 4.68% | |
Stone Ridge Global Equity Variance Risk Premium Master Fund — Class M | | | 12.10% | | | | 4.55% | |
BofA Merrill Lynch 3-Month U.S. Treasury Bill Index | | | 0.72% | | | | 0.35% | |
| | | | | | | | | | | | | | | | |
| | Stone Ridge Funds | | | | | | Annual Report | | | | | | October 31, 2017 | | |
| | | | | | | | | | |
19
| | |
| Management’s Discussion of Fund Performance | | |
Stone Ridge High Yield Reinsurance Risk Premium Fund is designed to capture the reinsurance risk premium by investing in a broad set of reinsurance-related securities, primarily focused on higher yielding catastrophe bonds. For the twelve months ended October 31, 2017, the Fund’s total return was -4.85%. The Fund’s performance is largely based on the occurrence or non-occurrence of natural or non-natural catastrophe events or other loss events around the world, which impact the performance of reinsurance-related securities. The Fund’s exposures span many different regions and types of events covered. There were a number of natural and non-natural catastrophes around the world (most significantly Hurricanes Harvey, Irma, and Maria and California wildfires) that negatively impacted many of the Fund’s risk exposures, and, therefore, negatively impacted Fund performance.
Stone Ridge U.S. Large Cap Variance Risk Premium Fund is designed to capture the returns of the variance risk premium in U.S. large company stocks. For the 12 months ended October 31, 2017, the Fund’s total return was 13.34%. The Fund’s performance is almost entirely based on derivatives. Performance is materially affected by two primary factors: exposure to the equity securities or equity indices underlying derivatives used by the Fund and exposure to the variance risk premium, which exists when the net premiums received by a seller of options and other derivatives, such as the Fund, exceed the net losses suffered on the resulting portfolio of derivative positions. The Fund’s performance is positively impacted by positive performance of the underlying equity securities or equity indices and by a positive variance risk premium. The variance risk premium is generally more likely to be positive during periods in which the “realized volatility” – the volatility actually experienced – of equity and equity index options is lower than the “implied volatility” – the expected level of volatility implied by an option’s price. Periods of positive performance for the Fund, such as the most recently completed fiscal year, correspond to periods when the combination of underlying exposure and variance risk premium exposure is positive. Periods of negative performance correspond to periods when the combination of underlying exposure and variance risk premium exposure is negative.
Stone Ridge U.S. Small Cap Variance Risk Premium Fund is designed to capture the returns of the variance risk premium in U.S. small company stocks. For the 12 months ended October 31, 2017, the Fund’s total return was 12.39%. The Fund’s performance is almost entirely based on derivatives. Performance is materially affected by two primary factors: exposure to the equity securities or equity indices underlying derivatives used by the Fund and exposure to the variance risk premium, which exists when the net premiums received by a seller of options and other derivatives, such as the Fund, exceed the net losses suffered on the resulting portfolio of derivative positions. The Fund’s performance is positively impacted by positive performance of the underlying equity securities or equity indices and by a positive variance risk premium. The variance risk premium is generally more likely to be positive during periods in which the “realized volatility” – the volatility actually experienced – of equity and equity index options is lower than the “implied volatility” – the expected level of volatility implied by an option’s price. Periods of positive performance for the Fund, such as the most recently completed fiscal year, correspond to periods when the combination of underlying exposure and variance risk premium exposure is positive. Periods of negative performance correspond to periods when the combination of underlying exposure and variance risk premium exposure is negative.
Stone Ridge U.S. Variance Risk Premium Master Fund is designed to capture the returns of the variance risk premium in U.S. stocks by purchasing shares of the Stone Ridge U.S. Large Cap Variance Risk Premium Fund and the Stone Ridge U.S. Small Cap Variance Risk Premium Fund (the “Underlying U.S. Funds”). For the 12 months ended October 31, 2017, the Fund’s total return was 12.94%. A discussion of the factors that materially affected the performance of the Fund during the most recently completed fiscal year appears above under the discussion of the Underlying U.S. Funds’ performance.
Stone Ridge International Developed Markets Variance Risk Premium Fund is designed to capture the returns of the variance risk premium in developed market company stocks. For the 12 months ended October 31, 2017, the Fund’s total return was 12.28%. The Fund’s performance is almost entirely based on derivatives. Performance is materially affected by two primary factors: exposure to the equity securities or equity indices underlying derivatives used by the Fund and exposure to the variance risk premium, which exists when the net premiums received by a seller of options and other derivatives, such as the Fund, exceed the net losses suffered on the resulting portfolio of derivative positions. The Fund’s performance is positively impacted by positive performance of the underlying equity securities or equity indices and by a positive variance risk premium. The variance risk premium is generally more likely to be positive during periods in which the “realized volatility” – the volatility actually experienced – of equity and equity index options is lower than the “implied volatility” – the expected level of volatility implied by an option’s price. Periods of positive performance
| | | | | | | | | | | | | | | | |
| | Stone Ridge Funds | | | | | | Annual Report | | | | | | October 31, 2017 | | |
| | | | | | | | | | |
20
| | |
| Management’s Discussion of Fund Performance | | |
for the Fund, such as the most recently completed fiscal year, correspond to periods when the combination of underlying exposure and variance risk premium exposure is positive. Periods of negative performance correspond to periods when the combination of underlying exposure and variance risk premium exposure is negative.
Stone Ridge Emerging Markets Variance Risk Premium Fund is designed to capture the returns of the variance risk premium in emerging market company stocks. For the 12 months ended October 31, 2017, the Fund’s total return was 11.67%. The Fund’s performance is almost entirely based on derivatives. Performance is materially affected by two primary factors: exposure to the equity securities or equity indices underlying derivatives used by the Fund and exposure to the variance risk premium, which exists when the net premiums received by a seller of options and other derivatives, such as the Fund, exceed the net losses suffered on the resulting portfolio of derivative positions. The Fund’s performance is positively impacted by positive performance of the underlying equity securities or equity indices and by a positive variance risk premium. The variance risk premium is generally more likely to be positive during periods in which the “realized volatility” – the volatility actually experienced – of equity and equity index options is lower than the “implied volatility” – the expected level of volatility implied by an option’s price. Periods of positive performance for the Fund, such as the most recently completed fiscal year, correspond to periods when the combination of underlying exposure and variance risk premium exposure is positive. Periods of negative performance correspond to periods when the combination of underlying exposure and variance risk premium exposure is negative.
Stone Ridge International Variance Risk Premium Master Fund is designed to capture the returns of the variance risk premium in international stocks by purchasing shares of the Stone Ridge International Developed Markets Variance Risk Premium Fund and the Stone Ridge International Emerging Markets Variance Risk Premium Fund (the “Underlying International Funds”). For the 12 months ended October 31, 2017, the Fund’s total return was 11.77%. A discussion of the factors that materially affected the performance of the Fund during the most recently completed fiscal year appears above under the discussion of the Underlying International Funds’ performance.
Stone Ridge Global Equity Variance Risk Premium Master Fund is designed to capture the returns of the variance risk premium in U.S. and international stocks by purchasing shares of each of the Underlying U.S. Funds and the Underlying International Funds. For the 12 months ended October 31, 2017, the Fund’s total return was 12.17%. A discussion of the factors that materially affected the performance of the Fund during the most recently completed fiscal year appears above under the discussion of the performance of the Underlying U.S. Funds and the Underlying International Funds.
| | | | | | | | | | | | | | | | |
| | Stone Ridge Funds | | | | | | Annual Report | | | | | | October 31, 2017 | | |
| | | | | | | | | | |
21
| | | | |
| ALLOCATION OF PORTFOLIO HOLDINGS AT OCTOBER 31, 2017 (Unaudited) | | | | |
| | | | | | | | |
| STONE RIDGE HIGH YIELD REINSURANCE RISK PREMIUM FUND PORTFOLIO ALLOCATION BY YEAR OF SCHEDULED MATURITY | |
| | |
| 2017 | | | $48,707,240 | | | | 4.4% | |
| | |
| 2018 | | | 368,656,602 | | | | 33.6% | |
| | |
| 2019 | | | 238,369,447 | | | | 21.7% | |
| | |
| 2020 | | | 160,549,715 | | | | 14.6% | |
| | |
| 2021 | | | 94,924,614 | | | | 8.7% | |
| | |
| 2022 | | | 37,575,480 | | | | 3.4% | |
| | |
| 2023 | | | 25,341,854 | | | | 2.3% | |
| | |
| 2024 | | | 3,854,698 | | | | 0.4% | |
| | |
| 2025 | | | 623,623 | | | | 0.1% | |
| | |
| 2034 | | | 17,663,214 | | | | 1.6% | |
| | |
| Not Applicable(1) | | | 101,348,800 | | | | 9.2% | |
| | |
| Other(2) | | | (342,024 | ) | | | 0.0% | |
| | | $1,097,273,263 | | | | | |
| | | | | | | | |
STONE RIDGE U.S. SMALL CAP VARIANCE RISK
PREMIUM FUND PORTFOLIO ALLOCATION BY ASSET TYPE | |
| | |
| Short-Term Investments | | | $127,359,223 | | | | 100.6% | |
| | |
| Liabilities in Excess of Other Assets(3) | | | (818,306 | ) | | | (0.6% | ) |
| | | $126,540,917 | | | | | |
| | | | | | | | |
| STONE RIDGE INTERNATIONAL DEVELOPED MARKETS VARIANCE RISK PREMIUM FUND PORTFOLIO ALLOCATION BY ASSET TYPE | |
| | |
| Short-Term Investments | | | $97,027,612 | | | | 100.4% | |
| | |
| Liabilities in Excess of Other Assets(3) | | | (363,551 | ) | | | (0.4% | ) |
| | | $96,664,061 | | | | | |
| | | | | | | | |
| STONE RIDGE U.S. LARGE CAP VARIANCE RISK PREMIUM FUND PORTFOLIO ALLOCATION BY ASSET TYPE | |
| | |
| Contingent Value Rights | | | $5,744 | | | | 0.0% | |
| | |
| Short-Term Investments | | | 354,176,534 | | | | 100.4% | |
| | |
| Liabilities in Excess of Other Assets(3) | | | (1,394,235 | ) | | | (0.4% | ) |
| | | $352,788,043 | | | | | |
| | | | | | | | |
| STONE RIDGE U.S. VARIANCE RISK PREMIUM MASTER FUND PORTFOLIO ALLOCATION BY HOLDINGS | |
| | |
| Stone Ridge U.S. Large Cap Variance Risk Premium Fund - Class I | | | $152,614,181 | | | | 66.5% | |
| | |
| Stone Ridge U.S. Small Cap Variance Risk Premium Fund - Class I | | | 76,592,568 | | | | 33.5% | |
| | |
| Short-Term Investments | | | 329,687 | | | | 0.1% | |
| | |
| Liabilities in Excess of Other Assets(3) | | | (120,558 | ) | | | (0.1% | ) |
| | | $229,415,878 | | | | | |
| | | | | | | | |
| STONE RIDGE EMERGING MARKETS VARIANCE RISK PREMIUM FUND PORTFOLIO ALLOCATION BY ASSET TYPE | |
| | |
| Short-Term Investments | | | $15,633,639 | | | | 112.0% | |
| | |
| Liabilities in Excess of Other Assets(3) | | | (1,679,231 | ) | | | (12.0% | ) |
| | | $13,954,408 | | | | | |
| | | | |
| | The accompanying Notes to the Financial Statements are an integral part of these Financial Statements. | | (Continued) |
| | | | | | | | | | | | | | | | |
| | Stone Ridge Funds | | | | | | Annual Report | | | | | | October 31, 2017 | | |
| | | | | | | | | | |
22
| | | | |
| ALLOCATION OF PORTFOLIO HOLDINGS AT OCTOBER 31, 2017 (Unaudited) | | | | |
| | | | | | | | |
STONE RIDGE INTERNATIONAL VARIANCE RISK
PREMIUM MASTER FUND PORTFOLIO ALLOCATION BY HOLDINGS | |
| | |
| Stone Ridge International Developed Markets Variance Risk Premium Fund - Class I | | | $8,060,687 | | | | 69.3% | |
| | |
| Stone Ridge Emerging Markets Variance Risk Premium Fund - Class I | | | 3,576,914 | | | | 30.8% | |
| | |
| Short-Term Investments | | | 130,388 | | | | 1.1% | |
| | |
| Liabilities in Excess of Other Assets(3) | | | (141,127 | ) | | | (1.2% | ) |
| | | $11,626,862 | | | | | |
| | | | | | | | |
STONE RIDGE GLOBAL EQUITY VARIANCE RISK
PREMIUM MASTER FUND PORTFOLIO ALLOCATION BY HOLDINGS | |
| | |
| Stone Ridge International Developed Markets Variance Risk Premium Fund - Class I | | | $13,284,333 | | | | 33.5% | |
| | |
| Stone Ridge U.S. Large Cap Variance Risk Premium Fund - Class I | | | 13,155,184 | | | | 33.1% | |
| | |
| Stone Ridge U.S. Small Cap Variance Risk Premium Fund - Class I | | | 6,565,744 | | | | 16.5% | |
| | |
| Stone Ridge Emerging Markets Variance Risk Premium Fund - Class I | | | 5,887,486 | | | | 14.8% | |
| | |
| Short-Term Investments | | | 188,976 | | | | 0.5% | |
| | |
| Other Assets in Excess of Liabilities(4) | | | 618,218 | | | | 1.6% | |
| | | $39,699,941 | | | | | |
| (1) | Preference shares do not have maturity dates. |
| (2) | Cash, cash equivalents, short-term investments and liabilities in excess of other assets. |
| (3) | Cash, cash equivalents and liabilities in excess of other assets. |
| (4) | Cash, cash equivalents and other assets less liabilities. |
| | | | |
| | The accompanying Notes to the Financial Statements are an integral part of these Financial Statements. | | |
| | | | | | | | | | | | | | | | |
| | Stone Ridge Funds | | | | | | Annual Report | | | | | | October 31, 2017 | | |
| | | | | | | | | | |
23
| | |
| Schedule of Investments | | as of October 31, 2017 |
| | | | |
| STONE RIDGE HIGH YIELD REINSURANCE RISK PREMIUM FUND | | | | |
| | | | | | | | |
| | | PRINCIPAL
AMOUNT | | | VALUE | |
| EVENT LINKED BONDS - 87.2% | | | | | | |
| | | | | | | | |
| China - 0.2% | | | | | | |
| | | | | | | | |
| Earthquake - 0.2% | | | | | | |
Panda Re 2015-1
(T-BILL 3MO + 4.050%), 06/30/2018 (a)(b)(c)(d)(e) (Cost: $2,065,000; Acquisition Date: 06/26/2015) | | $ | 2,065,000 | | | $ | 2,062,081 | |
| | | | | | | | |
| Europe - 0.3% | | | | | | |
| | | | | | | | |
| Windstorm - 0.3% | | | | | | |
Calypso Capital II Class B
(3 Month EURIBOR + 3.660%), 01/08/2018 (a)(b)(c)(e)(f) (Cost: $3,733,927; Acquisition Date: 10/07/2013) | | EUR | 2,750,000 | | | | 3,197,410 | |
| | | | | | | | |
| | | | | | | | |
| Global - 34.3% | | | | | | |
| | | | | | | | |
| Earthquake - 0.5% | | | | | | |
Acorn Re 2015-1
(6 Month LIBOR USD + 3.400%), 07/17/2018 (a)(b)(c)(e)(f) (Cost: $5,250,000; Acquisition Date: 07/02/2015) | | $ | 5,250,000 | | | | 5,285,700 | |
IBRD CAR 113-Class A
(6 Month LIBOR USD + 4.500%), 08/11/2020 (a)(b)(c)(e) (Cost: $4,614,000; Acquisition Date: 07/24/2017) | | | 4,614,000 | | | | 62,520 | |
| | | | | | | | |
| | | | | | | 5,348,220 | |
| | | | | | | | |
| Mortality/Longevity - 4.1% | | | | | | |
Benu Capital Class B
(3 Month EURIBOR + 3.350%), 01/08/2020 (a)(b)(c)(e)(f) (Cost: $12,884,938; Acquisition Date: 04/21/2015) | | EUR | 12,000,000 | | | | 14,157,115 | |
Chesterfield 2014-1
4.500%, 12/15/2034 (c)(d)(e) (Cost: $17,736,376; Acquisition Date: 12/11/2014) | | $ | 17,736,376 | | | | 17,663,214 | |
IBRD CAR 111-Class A
(6 Month LIBOR USD + 6.900%), 07/15/2020 (a)(b)(c)(d)(e) (Cost: $8,708,000; Acquisition Date: 06/28/2017) | | | 8,708,000 | | | | 8,719,320 | |
IBRD CAR 112-Class B
(6 Month LIBOR USD + 11.500%), 07/15/2020 (a)(b)(c)(d)(e) (Cost: $871,000; Acquisition Date: 06/28/2017) | | | 871,000 | | | | 872,829 | |
Vita Capital VI
(6 Month LIBOR USD + 2.900%), 01/08/2021 (a)(b)(c)(e)(f)
(Cost: $3,000,000; Acquisition Date: 12/15/2015) | | | 3,000,000 | | | | 3,067,800 | |
| | | | | | | | |
| | | PRINCIPAL
AMOUNT | | | VALUE | |
| Mortality/Longevity - 4.1% (continued) | |
Vitality Re VI Class B
(T-BILL 3MO + 2.100%), 01/08/2018 (a)(b)(c)(e) (Cost: $1,000,000; Acquisition Date: 01/21/2015) | | $ | 1,000,000 | | | $ | 999,250 | |
| | | | | | | | |
| | | | | | | 45,479,528 | |
| | | | | | | | |
| Multiperil - 28.1% | | | | | | |
Atlas IX 2015-1
(3 Month LIBOR USD + 7.830%), 01/07/2019 (a)(b)(c)(e) (Cost: $9,197,075; Original Acquisition Date: 02/05/2015) | | | 9,169,000 | | | | 2,896,946 | |
Atlas IX 2016-1
(3 Month LIBOR USD + 7.370%), 01/08/2020 (a)(b)(c)(e) (Cost: $25,979,950; Original Acquisition Date: 12/23/2015) | | | 25,948,000 | | | | 21,722,368 | |
Galileo Re 2015-1 Class A
(T-BILL 3MO + 13.500%), 01/08/2018 (a)(b)(c)(e) (Cost: $19,151,877; Original Acquisition Date: 01/29/2015) | | | 19,127,000 | | | | 14,302,214 | |
Galileo Re 2016-1 Class A
(T-BILL 3MO + 13.240%), 01/08/2019 (a)(b)(c)(e) (Cost: $13,618,000; Acquisition Date: 01/20/2016) | | | 13,618,000 | | | | 9,839,005 | |
Galileo Re 2016-1 Class B
(T-BILL 3MO + 8.720%), 01/08/2019 (a)(b)(c)(e)(f) (Cost: $13,618,000; Acquisition Date: 01/20/2016) | | | 13,618,000 | | | | 12,454,342 | |
Galileo Re 2016-1 Class C
(T-BILL 3MO + 6.720%), 01/08/2019 (a)(b)(c)(e) (Cost: $13,617,000; Acquisition Date: 01/20/2016) | | | 13,617,000 | | | | 13,093,426 | |
Galileo Re 2017-1 Class B
(6 Month LIBOR USD + 17.500%) 11/06/2020 (a)(b)(c)(d)(e) (Cost: $2,074,000; Acquisition Date: 10/30/2017) | | | 2,074,000 | | | | 2,074,000 | |
Kilimanjaro Re 2014-1 Class B
(T-BILL 3MO + 4.500%), 04/30/2018 (a)(b)(c)(e) (Cost: $19,346,603; Original Acquisition Date: 04/17/2014) | | | 19,542,000 | | | | 18,234,640 | |
Kilimanjaro Re 2014-2 Class C
(T-BILL 3MO + 3.750%), 11/25/2019 (a)(b)(c)(e)(f) (Cost: $42,935,998; Original Acquisition Date: 11/07/2014) | | | 42,886,000 | | | | 43,587,186 | |
Kilimanjaro Re 2015-1 Class D
(T-BILL 3MO + 9.250%), 12/06/2019 (a)(b)(c)(e)(f) (Cost: $10,000,000; Acquisition Date: 11/10/2015) | | | 10,000,000 | | | | 9,847,000 | |
| | | | |
| | The accompanying Notes to the Financial Statements are an integral part of these Financial Statements. | | (Continued) |
| | | | | | | | | | | | | | | | |
| | Stone Ridge Funds | | | | | | Annual Report | | | | | | October 31, 2017 | | |
| | | | | | | | | | |
24
| | |
| Schedule of Investments | | as of October 31, 2017 |
| | | | |
| STONE RIDGE HIGH YIELD REINSURANCE RISK PREMIUM FUND | | | | |
| | | | | | | | |
| | | PRINCIPAL
AMOUNT | | | VALUE | |
| Multiperil - 28.1% (continued) | | | | | | |
Kilimanjaro Re 2015-1 Class E
(T-BILL 3MO + 6.750%), 12/06/2019 (a)(b)(c)(e) (Cost: $15,797,882; Original Acquisition Date: 11/10/2015) | | $ | 15,784,000 | | | $ | 15,823,460 | |
Kilimanjaro Re II 2017-1 Class A-1
(6 Month LIBOR USD + 10.000%), 04/20/2021 (a)(b)(c)(e) (Cost: $3,666,000; Acquisition Date: 04/06/2017) | | | 3,666,000 | | | | 2,233,144 | |
Kilimanjaro Re II 2017-1 Class B-1
(6 Month LIBOR USD + 7.500%), 04/20/2021 (a)(b)(c)(e) (Cost: $12,771,654; Original Acquisition Date: 04/06/2017) | | | 12,659,000 | | | | 11,800,087 | |
Kilimanjaro Re II 2017-1 Class C-1
(6 Month LIBOR USD + 6.000%), 04/20/2021 (a)(b)(c)(e) (Cost: $18,194,621; Original Acquisition Date: 04/06/2017) | | | 18,046,000 | | | | 17,438,752 | |
Kilimanjaro Re II 2017-2 Class A-2
(6 Month LIBOR USD + 10.000%), 04/21/2022 (a)(b)(c)(e) (Cost: $1,571,000; Acquisition Date: 04/06/2017) | | | 1,571,000 | | | | 951,869 | |
Kilimanjaro Re II 2017-2 Class B-2
(6 Month LIBOR USD + 7.500%), 04/21/2022 (a)(b)(c)(e) (Cost: $2,357,000; Acquisition Date: 04/06/2017) | | | 2,357,000 | | | | 2,161,723 | |
Kilimanjaro Re II 2017-2 Class C-2
(6 Month LIBOR USD + 6.000%), 04/21/2022 (a)(b)(c)(e)(f) (Cost: $1,760,000; Acquisition Date: 04/06/2017) | | | 1,760,000 | | | | 1,700,424 | |
Loma Re 2013-1 Class A
(T-BILL 3MO + 8.240%), 01/08/2018 (a)(b)(c)(e) (Cost: $3,665,000; Acquisition Date: 12/20/2013) | | | 3,665,000 | | | | 3,411,565 | |
Loma Re 2013-1 Class B
(T-BILL 3MO + 12.320%), 01/08/2018 (a)(b)(c)(e) (Cost: $9,995,000; Acquisition Date: 12/20/2013) | | | 9,995,000 | | | | 4,368,315 | |
Loma Re 2013-1 Class C
(T-BILL 3MO + 17.290%), 01/08/2018 (a)(b)(c)(e) (Cost: $19,011,000; Acquisition Date: 12/20/2013) | | | 19,011,000 | | | | 104,561 | |
Queen Street XII
(6 Month LIBOR USD + 5.250%), 04/08/2020 (a)(b)(c)(e)(f) (Cost: $3,463,000; Acquisition Date: 05/13/2016) | | | 3,463,000 | | | | 3,462,134 | |
Riverfront Re 2017-1 Class A
(T-BILL 3MO + 4.500%), 01/15/2021 (a)(b)(c)(e) (Cost: $1,397,000; Acquisition Date: 05/23/2017) | | | 1,397,000 | | | | 1,399,934 | |
| | | | | | | | |
| | | PRINCIPAL
AMOUNT | | | VALUE | |
| Multiperil - 28.1% (continued) | | | | | | |
Tradewynd Re 2013-1 Class 1
(T-BILL 3MO + 8.660%), 07/09/2018 (a)(b)(c)(e) (Cost: $14,500,000; Acquisition Date: 07/02/2013) | | $ | 14,500,000 | | | $ | 14,692,125 | |
Tradewynd Re 2014-1 Class 3-A
(T-BILL 3MO + 5.400%), 01/08/2018 (a)(b)(c)(e) (Cost: $15,000,000; Acquisition Date: 12/05/2014) | | | 15,000,000 | | | | 14,969,250 | |
Tradewynd Re 2014-1 Class 3-B
(T-BILL 3MO + 7.430%), 01/08/2018 (a)(b)(c)(e) (Cost: $40,000,000; Acquisition Date: 12/05/2014) | | | 40,000,000 | | | | 39,606,000 | |
Tramline Re II 2014-1 Class A
(T-BILL 3MO + 8.250%), 01/04/2019 (a)(b)(c)(e) (Cost: $25,750,000; Acquisition Date: 12/04/2014) | | | 25,750,000 | | | | 25,643,138 | |
| | | | | | | | |
| | | | | | | 307,817,608 | |
| | | | | | | | |
| Other - 0.5% | | | | | | |
Operational Re
5.500%, 04/08/2021 (a)(c)(d)(e) (Cost: $5,093,092; Acquisition Date: 05/19/2016) | | CHF | 5,047,000 | | | | 5,127,430 | |
| | | | | | | | |
| | | | | | | | |
| Windstorm - 1.1% | | | | | | |
IBRD CAR 114-Class B
(6 Month LIBOR USD + 9.300%), 12/20/2019 (a)(b)(c)(e) (Cost: $2,884,000; Acquisition Date: 07/24/2017) | | $ | 2,884,000 | | | | 2,882,990 | |
IBRD CAR 115-Class C
(6 Month LIBOR USD + 5.900%), 05/19/2020 (a)(b)(c)(e) (Cost: $2,019,000; Acquisition Date: 07/24/2017) | | | 2,019,000 | | | | 2,043,329 | |
Queen Street X
(T-BILL 3MO + 5.750%), 06/08/2018 (a)(b)(c)(e)(f) (Cost: $1,279,000; Acquisition Date: 03/25/2015) | | | 1,279,000 | | | | 1,281,558 | |
Queen Street XI
(T-BILL 3MO + 6.150%), 06/07/2019 (a)(b)(c)(e)(f) (Cost: $6,000,000; Acquisition Date: 12/15/2015) | | | 6,000,000 | | | | 6,048,300 | |
| | | | | | | | |
| | | | | | | 12,256,177 | |
| | | | | | | | |
| | | | | | | 376,028,963 | |
| | | | | | | | |
| Japan - 3.8% | | | | | | |
| | | | | | | | |
| Earthquake - 3.7% | | | | | | |
Kizuna Re II 2014-1 Class A
(T-BILL 3MO + 2.250%), 04/06/2018 (a)(b)(c)(e)(f) (Cost: $6,750,000; Acquisition Date: 02/28/2014) | | | 6,750,000 | | | | 6,746,625 | |
| | | | |
| | The accompanying Notes to the Financial Statements are an integral part of these Financial Statements. | | (Continued) |
| | | | | | | | | | | | | | | | |
| | Stone Ridge Funds | | | | | | Annual Report | | | | | | October 31, 2017 | | |
| | | | | | | | | | |
25
| | |
| Schedule of Investments | | as of October 31, 2017 |
| | | | |
| STONE RIDGE HIGH YIELD REINSURANCE RISK PREMIUM FUND | | | | |
| | | | | | | | |
| | | PRINCIPAL
AMOUNT | | | VALUE | |
| Earthquake - 3.7% (continued) | | | | | | |
Kizuna Re II 2014-1 Class B
(T-BILL 3MO + 2.500%), 04/06/2018 (a)(b)(c)(e) (Cost: $4,500,000; Acquisition Date: 02/28/2014) | | $ | 4,500,000 | | | $ | 4,503,375 | |
Nakama Re 2014-1 Class 2
(T-BILL 3MO + 2.500%), 04/13/2018 (a)(b)(c)(e)(f) (Cost: $4,250,000; Acquisition Date: 05/23/2014) | | | 4,250,000 | | | | 4,245,537 | |
Nakama Re 2014-2 Class 2
(T-BILL 3MO + 2.880%), 01/16/2020 (a)(b)(c)(e)(f) (Cost: $6,827,756; Original Acquisition Date: 12/12/2014) | | | 6,806,000 | | | | 6,894,478 | |
Nakama Re 2015-1 Class 2
(T-BILL 3MO + 3.250%), 01/14/2021 (a)(b)(c)(e)(f) (Cost: $6,000,000; Acquisition Date: 12/14/2015) | | | 6,000,000 | | | | 6,158,700 | |
Nakama Re 2016-1 Class 1
(6 Month LIBOR USD + 2.200%), 10/13/2021 (a)(b)(c)(e)(f) (Cost: $7,500,000; Acquisition Date: 09/21/2016) | | | 7,500,000 | | | | 7,627,125 | |
Nakama Re 2016-1 Class 2
(6 Month LIBOR USD + 3.250%), 10/13/2021 (a)(b)(c)(e)(f) (Cost: $4,830,000; Acquisition Date: 09/21/2016) | | | 4,830,000 | | | | 4,919,597 | |
| | | | | | | | |
| | | | | | | 41,095,437 | |
| | | | | | | | |
| Windstorm - 0.1% | | | | | | |
Aozora Re 2016-1 A
(6 Month LIBOR USD + 2.200%), 04/07/2020 (a)(b)(c)(e)(f) (Cost: $1,149,000; Acquisition Date: 03/23/2016) | | | 1,149,000 | | | | 1,162,558 | |
| | | | | | | | |
| | | | | | | 42,257,995 | |
| | | | | | | | |
| Turkey - 0.3% | | | | | | |
| | | | | | | | |
| Earthquake - 0.3% | | | | | | |
Bosphorus 2015-1 Class A
(6 Month LIBOR USD + 3.250%), 08/17/2018 (a)(b)(c)(e)(f) (Cost: $3,250,000; Acquisition Date: 08/11/2015) | | | 3,250,000 | | | | 3,278,763 | |
| | | | | | | | |
| | | | | | | | |
| United States - 48.3% | | | | | | |
| | | | | | | | |
| Earthquake - 13.5% | | | | | | |
Golden State Re II 2014-1 Class A
(T-BILL 3MO + 2.200%), 01/08/2019 (a)(b)(c)(e)(f) (Cost: $12,095,000; Original Acquisition Date: 09/10/2014) | | | 12,100,000 | | | | 12,109,680 | |
Merna Re 2015-1 Class A
(T-BILL 3MO + 2.000%), 04/09/2018 (a)(b)(c)(e) (Cost: $1,478,000; Acquisition Date: 03/16/2015) | | | 1,478,000 | | | | 1,473,345 | |
| | | | | | | | |
| | | PRINCIPAL
AMOUNT | | | VALUE | |
| Earthquake - 13.5% (continued) | | | | | | |
Merna Re 2016-1 Class A
(T-BILL 3MO + 2.250%), 04/08/2019 (a)(b)(c)(e) (Cost: $1,131,000; Acquisition Date: 03/24/2016) | | $ | 1,131,000 | | | $ | 1,132,979 | |
Ursa Re 2014-1 Class B
(T-BILL 3MO + 5.000%), 12/07/2017 (a)(b)(c)(e) (Cost: $28,750,000; Acquisition Date: 11/14/2014) | | | 28,750,000 | | | | 28,747,125 | |
Ursa Re 2015-1 Class B
(T-BILL 3MO + 5.000%), 09/21/2018 (a)(b)(c)(e) (Cost: $31,303,283; Original Acquisition Date: 09/10/2015) | | | 31,250,000 | | | | 31,503,125 | |
Ursa Re 2016-1 Class A
(T-BILL 3MO + 4.000%), 12/10/2019 (a)(b)(c)(e)(f) (Cost: $19,027,072; Original Acquisition Date: 11/21/2016) | | | 18,944,000 | | | | 19,110,707 | |
Ursa Re 2017-1 Class B
(T-BILL 3MO + 3.500%), 05/27/2020 (a)(b)(c)(e)(f) (Cost: $25,803,495; Acquisition Date: 05/10/2017) | | | 25,777,000 | | | | 25,916,196 | |
Ursa Re 2017-1 Class E
(T-BILL 3MO + 6.000%), 06/27/2020 (a)(b)(c)(e) (Cost: $28,087,000; Acquisition Date: 05/10/2017) | | | 28,087,000 | | | | 28,211,987 | |
| | | | | | | | |
| | | | | | | 148,205,144 | |
| | | | | | | | |
| Multiperil - 22.0% | | | | | | |
Blue Halo Re 2016-1 Class A
(T-BILL 3MO + 14.000%), 06/21/2019 (a)(b)(c)(e) (Cost: $4,750,000; Acquisition Date: 06/10/2016) | | | 4,750,000 | | | | 3,112,675 | |
Blue Halo Re 2016-1 Class B
(T-BILL 3MO + 19.750%), 06/21/2019 (a)(b)(c)(e) (Cost: $2,600,000; Acquisition Date: 06/10/2016) | | | 2,600,000 | | | | 711,490 | |
Blue Halo Re 2016-2 Class C
(T-BILL 3MO + 8.250%), 07/26/2019 (a)(b)(c)(e)(f) (Cost: $9,235,029; Original Acquisition Date: 07/18/2016) | | | 9,186,000 | | | | 8,600,852 | |
Buffalo Re 2017-1 Class A
(6 Month LIBOR USD + 3.250%), 04/07/2020 (a)(b)(c)(e) (Cost: $867,962; Original Acquisition Date: 08/15/2017) | | | 864,000 | | | | 855,490 | |
Caelus Re IV 2016-1 Class A
(T-BILL 3MO + 5.490%), 03/06/2020 (a)(b)(c)(e) (Cost: $5,417,384; Original Acquisition Date: 02/23/2016) | | | 5,395,000 | | | | 5,626,985 | |
| | | | |
| | The accompanying Notes to the Financial Statements are an integral part of these Financial Statements. | | (Continued) |
| | | | | | | | | | | | | | | | |
| | Stone Ridge Funds | | | | | | Annual Report | | | | | | October 31, 2017 | | |
| | | | | | | | | | |
26
| | |
| Schedule of Investments | | as of October 31, 2017 |
| | | | |
| STONE RIDGE HIGH YIELD REINSURANCE RISK PREMIUM FUND | | | | |
| | | | | | | �� | |
| | | PRINCIPAL
AMOUNT | | | VALUE | |
| Multiperil - 22.0% (continued) | | | | | | |
Caelus Re V 2017-1 Class B
(T-BILL 3MO + 4.500%), 06/05/2024 (a)(b)(c)(e) (Cost: $1,297,000; Acquisition Date: 04/27/2017) | | $ | 1,297,000 | | | $ | 1,236,819 | |
Caelus Re V 2017-1 Class C
(T-BILL 3MO + 6.500%), 06/05/2024 (a)(b)(c)(e) (Cost: $830,000; Acquisition Date: 04/27/2017) | | | 830,000 | | | | 686,700 | |
Caelus Re V 2017-1 Class D
(T-BILL 3MO + 9.250%), 06/05/2024 (a)(b)(c)(e) (Cost: $830,000; Acquisition Date: 04/27/2017) | | | 830,000 | | | | 445,004 | |
East Lane Re VI 2014-1 Class A
(T-BILL 3MO + 2.650%), 03/14/2018 (a)(b)(c)(e) (Cost: $13,807,000; Acquisition Date: 03/03/2014) | | | 13,807,000 | | | | 13,831,162 | |
East Lane Re VI 2015-1 Class A
(T-BILL 3MO + 3.390%), 03/13/2020 (a)(b)(c)(e) (Cost: $10,787,000; Acquisition Date: 03/02/2015) | | | 10,787,000 | | | | 10,907,814 | |
Espada Re 2016-1 Class 20
(T-BILL 3MO + 5.490%), 06/06/2020 (a)(b)(c)(e) (Cost: $1,785,000; Acquisition Date: 02/12/2016) | | | 1,785,000 | | | | 1,762,509 | |
First Coast Re 2016-1 Class A
(T-BILL 3MO + 3.910%), 06/07/2019 (a)(b)(c)(e) (Cost: $7,000,000; Acquisition Date: 05/25/2016) | | | 7,000,000 | | | | 6,904,450 | |
Fortius Re 2017-1
(6 Month LIBOR USD + 3.750%), 07/07/2024 (a)(b)(c)(e) (Cost: $1,010,000; Acquisition Date: 07/14/2017) | | | 1,010,000 | | | | 1,015,252 | |
Long Point Re III 2015-1 Class A
(T-BILL 3MO + 3.500%), 05/23/2018 (a)(b)(c)(e) (Cost: $15,000,000; Acquisition Date: 05/07/2015) | | | 15,000,000 | | | | 15,132,750 | |
Northshore Re II 2017-1 Class A
(T-BILL 3MO + 7.250%), 07/06/2020 (a)(b)(c)(e) (Cost: $19,462,000; Acquisition Date: 06/26/2017) | | | 19,462,000 | | | | 19,723,764 | |
PennUnion Re 2015-1
(T-BILL 3MO + 4.500%), 12/07/2018 (a)(b)(c)(e)(f) (Cost: $8,745,142; Original Acquisition Date: 10/05/2015) | | | 8,729,000 | | | | 8,826,765 | |
| | | | | | | | |
| | | PRINCIPAL
AMOUNT | | | VALUE | |
| Multiperil - 22.0% (continued) | | | | | | |
Residential Re 2013-I Class 11
(T-BILL 3MO + 5.250%), 12/06/2017 (a)(b)(c)(e) (Cost: $5,500,000; Acquisition Date: 11/18/2013) | | $ | 5,500,000 | | | $ | 5,506,050 | |
Residential Re 2013-II Class 4
(T-BILL 3MO + 20.000%), 12/06/2017 (a)(b)(c)(e) (Cost: $12,627,314; Original Acquisition Date: 11/18/2013) | | | 12,623,000 | | | | 11,045,125 | |
Residential Re 2014-I Class 10
(T-BILL 3MO + 14.980%), 06/06/2018 (a)(b)(c)(e) (Cost: $13,162,000; Acquisition Date: 05/22/2014) | | | 13,162,000 | | | | 4,074,297 | |
Residential Re 2014-I Class 13
(T-BILL 3MO + 3.560%), 06/06/2018 (a)(b)(c)(e) (Cost: $141,000; Acquisition Date: 05/22/2014) | | | 141,000 | | | | 141,071 | |
Residential Re 2014-II Class 4
(T-BILL 3MO + 5.130%), 12/06/2018 (a)(b)(c)(e) (Cost: $8,000,000; Acquisition Date: 11/20/2014) | | | 8,000,000 | | | | 8,079,200 | |
Residential Re 2015-I Class 10
(T-BILL 3MO + 10.970%), 06/06/2019 (a)(b)(c)(e) (Cost: $6,053,000; Acquisition Date: 05/21/2015) | | | 6,053,000 | | | | 4,502,524 | |
Residential Re 2015-I Class 11
(T-BILL 3MO + 5.940%), 06/06/2019 (a)(b)(c)(e) (Cost: $6,585,000; Acquisition Date: 05/21/2015) | | | 6,585,000 | | | | 6,537,259 | |
Residential Re 2015-II Class 3 (T-BILL 3MO + 6.950%), 12/06/2019 (a)(b)(c)(e) (Cost: $12,500,000; Acquisition Date: 11/20/2015) | | | 12,500,000 | | | | 12,664,375 | |
Residential Re 2016-I Class 10
(T-BILL 3MO + 11.550%), 06/06/2023 (a)(b)(c)(e) (Cost: $2,391,000; Acquisition Date: 04/28/2016) | | | 2,391,000 | | | | 1,388,215 | |
Residential Re 2016-I Class 11
(T-BILL 3MO + 4.730%), 06/06/2023 (a)(b)(c)(e) (Cost: $3,074,000; Acquisition Date: 04/28/2016) | | | 3,074,000 | | | | 3,009,446 | |
Residential Re 2016-I Class 13
(T-BILL 3MO + 3.250%), 06/06/2023 (a)(b)(c)(e) (Cost: $6,000,000; Acquisition Date: 04/28/2016) | | | 6,000,000 | | | | 6,000,600 | |
| | | | |
| | The accompanying Notes to the Financial Statements are an integral part of these Financial Statements. | | (Continued) |
| | | | | | | | | | | | | | | | |
| | Stone Ridge Funds | | | | | | Annual Report | | | | | | October 31, 2017 | | |
| | | | | | | | | | |
27
| | |
| Schedule of Investments | | as of October 31, 2017 |
| | | | |
| STONE RIDGE HIGH YIELD REINSURANCE RISK PREMIUM FUND | | | | |
| | | | | | | | |
| | | PRINCIPAL
AMOUNT | | | VALUE | |
| Multiperil - 22.0% (continued) | | | | | | |
Residential Re 2017-I Class 11
(T-BILL 3MO + 4.750%), 06/06/2021 (a)(b)(c)(e) (Cost: $1,769,000; Acquisition Date: 04/19/2017) | | $ | 1,769,000 | | | $ | 1,724,952 | |
Sanders Re 2014-1 Class B
(T-BILL 3MO + 2.960%), 05/25/2018 (a)(b)(c)(e) (Cost: $18,750,000; Acquisition Date: 05/07/2014) | | | 18,750,000 | | | | 18,796,875 | |
Sanders Re 2014-1 Class C
(T-BILL 3MO + 3.250%), 05/25/2018 (a)(b)(c)(e) (Cost: $19,000,000; Acquisition Date: 05/07/2014) | | | 19,000,000 | | | | 19,069,350 | |
Sanders Re 2014-1 Class D
(T-BILL 3MO + 3.780%), 05/28/2019 (a)(b)(c)(e) (Cost: $6,705,000; Acquisition Date: 05/07/2014) | | | 6,705,000 | | | | 6,785,460 | |
Sanders Re 2017-2 Class A
(6 Month LIBOR USD + 3.250%), 06/05/2020 (a)(b)(c)(e)(f) (Cost: $3,142,000; Acquisition Date: 05/24/2017) | | | 3,142,000 | | | | 3,149,070 | |
Spectrum Capital Ltd. 2017-1 A
(6 Month LIBOR USD + 5.750%), 06/08/2021 (a)(b)(c)(e) (Cost: $11,657,000; Acquisition Date: 06/13/2017) | | | 11,657,000 | | | | 11,367,906 | |
Spectrum Capital Ltd. 2017-1 B
(6 Month LIBOR USD + 3.500%), 06/08/2021 (a)(b)(c)(e)(f) (Cost: $16,903,000; Acquisition Date: 06/13/2017) | | | 16,903,000 | | | | 16,958,780 | |
Torrey Pines Re 2017-1 Class B
(6 Month LIBOR USD + 3.750%), 06/09/2025 (a)(b)(c)(e) (Cost: $623,000; Acquisition Date: 04/27/2017) | | | 623,000 | | | | 623,623 | |
Torrey Pines Re 2017-1 Class C
(6 Month LIBOR USD + 6.250%), 06/09/2024 (a)(b)(c)(e) (Cost: $467,000; Acquisition Date: 04/27/2017) | | | 467,000 | | | | 470,923 | |
| | | | | | | | |
| | | | | | | 241,275,582 | |
| | | | | | | | |
| Windstorm - 12.8% | | | | | | |
Alamo Re 2015-1 Class A
(T-BILL 3MO + 4.810%), 06/07/2018 (a)(b)(c)(e)(f) (Cost: $34,751,422; Original Acquisition Date: 05/06/2015) | | | 34,732,000 | | | | 35,259,926 | |
Alamo Re 2015-1 Class B
(T-BILL 3MO + 4.400%), 06/07/2018 (a)(b)(c)(e)(f) (Cost: $16,947,199; Original Acquisition Date: 05/06/2015) | | | 16,941,000 | | | | 17,403,489 | |
| | | | | | | | |
| | | PRINCIPAL
AMOUNT | | | VALUE | |
| Windstorm - 12.8% (continued) | | | | | | |
Alamo Re 2017-1 Class A
(T-BILL 3MO + 3.750%), 06/08/2020 (a)(b)(c)(e)(f) (Cost: $3,193,000; Acquisition Date: 05/23/2017) | | $ | 3,193,000 | | | $ | 3,225,249 | |
Bonanza Re 2016-1 Class A
(6 Month LIBOR USD + 3.750%), 12/31/2019 (a)(b)(c)(e) (Cost: $478,000; Original Acquisition Date: 11/28/2016) | | | 478,000 | | | | 456,872 | |
Bonanza Re 2016-1 Class B
(6 Month LIBOR USD + 5.000%), 12/31/2019 (a)(b)(c)(e) (Cost: $946,000; Original Acquisition Date: 11/28/2016) | | | 946,000 | | | | 891,605 | |
Citrus Re 2015-1 Class A
(T-BILL 3MO + 5.140%), 04/09/2018 (a)(b)(c)(e) (Cost: $8,499,000; Acquisition Date: 04/01/2015) | | | 8,499,000 | | | | 8,547,019 | |
Citrus Re 2015-1 Class B
(T-BILL 3MO + 6.960%), 04/09/2018 (a)(b)(c)(e) (Cost: $12,747,000; Acquisition Date: 04/01/2015) | | | 12,747,000 | | | | 12,355,030 | |
Citrus Re 2015-1 Class C
(T-BILL 3MO + 9.030%), 04/09/2018 (a)(b)(c)(e) (Cost: $3,931,000; Acquisition Date: 04/01/2015) | | | 3,931,000 | | | | 2,828,355 | |
Citrus Re 2016-1 Class D-50
(T-BILL 3MO + 7.500%), 02/25/2019 (a)(b)(c)(e) (Cost: $4,743,000; Acquisition Date: 02/19/2016) | | | 4,743,000 | | | | 4,260,637 | |
Citrus Re 2016-1 Class E-50
(T-BILL 3MO + 10.500%), 02/25/2019 (a)(b)(c)(e) (Cost: $3,952,000; Acquisition Date: 02/19/2016) | | | 3,952,000 | | | | 2,534,615 | |
Cranberry Re 2015-1 Class A
(T-BILL 3MO + 3.900%), 07/06/2018 (a)(b)(c)(e) (Cost: $3,706,000; Acquisition Date: 04/23/2015) | | | 3,706,000 | | | | 3,748,804 | |
Cranberry Re 2017-1 Class A
(6 Month LIBOR USD + 2.000%), 07/13/2023 (a)(b)(c)(e) (Cost: $13,000,000; Acquisition Date: 06/05/2017) | | | 13,000,000 | | | | 13,018,200 | |
Everglades Re II 2017-1 Class A
(T-BILL 3MO + 5.000%), 05/08/2023 (a)(b)(c)(e)(f) (Cost: $2,075,000; Acquisition Date: 04/27/2017) | | | 2,075,000 | | | | 1,925,393 | |
| | | | |
| | The accompanying Notes to the Financial Statements are an integral part of these Financial Statements. | | (Continued) |
| | | | | | | | | | | | | | | | |
| | Stone Ridge Funds | | | | | | Annual Report | | | | | | October 31, 2017 | | |
| | | | | | | | | | |
28
| | |
| Schedule of Investments | | as of October 31, 2017 |
| | | | |
| STONE RIDGE HIGH YIELD REINSURANCE RISK PREMIUM FUND | | | | |
| | | | | | | | |
| | | PRINCIPAL
AMOUNT | | | VALUE | |
| Windstorm - 12.8% (continued) | | | | | | |
Kilimanjaro Re 2014-1 Class A
(T-BILL 3MO + 4.750%), 04/30/2018 (a)(b)(c)(e)(f) (Cost: $13,260,000; Acquisition Date: 04/17/2014) | | $ | 13,260,000 | | | $ | 13,399,230 | |
Manatee Re 2015-1 Class A
(T-BILL 3MO + 5.300%), 12/22/2017 (a)(b)(c)(e) (Cost: $3,429,000; Acquisition Date: 03/23/2015) | | | 3,429,000 | | | | 3,408,940 | |
Manatee Re 2016-1 Class A
(T-BILL 3MO + 5.750%), 03/13/2019 (a)(b)(c)(e) (Cost: $556,000; Acquisition Date: 03/02/2016) | | | 556,000 | | | | 550,774 | |
Manatee Re 2016-1 Class C
(T-BILL 3MO + 17.260%), 03/14/2022 (a)(b)(c)(e) (Cost: $835,000; Acquisition Date: 03/02/2016) | | | 835,000 | | | | — | |
Market Re 2016-3 Class A
3.000%, 07/08/2019 (a)(c)(d)(e) (Cost: $4,000,000; Acquisition Date: 06/21/2016) | | | 4,000,000 | | | | 4,042,048 | |
Market Re 2017-1 Class A
6.445%, 06/08/2018 (a)(b)(c)(d)(e)(g) (Cost: $9,300,000; Acquisition Date: 06/05/2017) | | | 9,300,000 | | | | 9,777,090 | |
Oak Leaf Re Ltd. 2017-1 A
5.216%, 06/09/2018 (a)(b)(c)(d)(e)(g) (Cost: $3,000,000; Acquisition Date: 06/06/2017) | | | 3,000,000 | | | | 3,120,750 | |
| | | | | | | | |
| | | | | | | 140,754,026 | |
| | | | | | | | |
| | | | | | | 530,234,752 | |
| | | | | | | | |
TOTAL EVENT LINKED BONDS
(Cost $1,030,129,051) | | | | | | | 957,059,964 | |
| | | | | | | | |
| | | | | | | | |
PARTICIPATION NOTES - 3.6% | | | | | | | | |
| | | | | | | | |
| Global - 3.6% | | | | | | |
| | | | | | | | |
| Multiperil - 3.6% | | | | | | |
Eden Re II 2016-1 Class B
04/23/2019 (a)(c)(d)(e)(h) (Cost: $19,248; Acquisition Date: 03/24/2016) | | | 19,247 | | | | 1,344,652 | |
Sector Re V Series 6 Class B
03/01/2021 (a)(c)(d) (Cost: $86,667; Acquisition Date: 04/28/2016) | | | 86,667 | | | | 1,262,868 | |
Sector Re V Series 6 Class F
03/01/2021 (a)(c)(d) (Cost: $33,295; Acquisition Date: 04/25/2016) | | | 33,295 | | | | 372,564 | |
Sector Re V Series 6 Class G
03/01/2021 (a)(c)(d) (Cost: $66,659; Acquisition Date: 04/28/2016) | | | 66,659 | | | | 3,464,975 | |
| | | | | | | | |
| | | PRINCIPAL
AMOUNT | | | VALUE | |
| Multiperil - 3.6% (continued) | | | | | | |
Sector Re V Series 7 Class B
03/01/2022 (a)(c)(d)(i) (Cost: $13,874,487; Acquisition Date: 04/27/2017) | | $ | 13,874,487 | | | $ | 12,025,018 | |
Sector Re V Series 7 Class G
03/01/2022 (a)(c)(d)(i) (Cost: $25,371,890; Acquisition Date: 04/27/2017) | | | 25,371,890 | | | | 20,736,446 | |
| | | | | | | | |
TOTAL PARTICIPATION NOTES
(Cost $39,452,246) | | | | | | | 39,206,523 | |
| | | | | | | | |
| | |
| | | SHARES | | | FAIR
VALUE | |
PREFERENCE SHARES - 9.2% | | | | | | | | |
| | | | | | | | |
| Global - 9.2% | | | | | | |
| | | | | | | | |
| Multiperil - 9.2% | | | | | | |
Arenal (Artex Segregated Account Company) (a)(c)(d)(h) (Cost: $18,973,976; Original Acquisition Date: 05/07/2015) | | | 18,011 | | | | 14,264,247 | |
Biscayne (Artex Segregated Account Company) (a)(c)(d)(h)(i) (Cost: $28,289,717; Original Acquisition Date: 04/30/2014) | | | 28,192 | | | | 34,141,964 | |
Hatteras (Artex Segregated Account Company) (a)(c)(d)(h) (Cost: $6,300,000; Acquisition Date: 12/30/2014) | | | 6,300 | | | | 6,662,889 | |
Hudson Charles 2 (Mt. Logan Re) (a)(c)(d) (Cost: $11,534,500; Acquisition Date: 04/02/2014) | | | 11,535 | | | | 10,803,721 | |
Hudson Charles 3 (Mt. Logan Re) (a)(c)(d) (Cost: $15,350,000; Acquisition Date: 06/19/2014) | | | 15,350 | | | | 14,067,288 | |
Kona (Artex Segregated Account Company) (a)(c)(d)(h) (Cost: $0; Acquisition Date: 07/23/2015) | | | 2,862 | | | | 101,205 | |
LRe 2015 (Lorenz Re Ltd.) (a)(c)(d)(h) (Cost: $0; Acquisition Date: 03/31/2015) | | | 367 | | | | — | |
LRe 2016 (Lorenz Re Ltd.) (a)(c)(d)(h) (Cost: $0; Acquisition Date: 04/01/2016) | | | 51,070 | | | | 491,610 | |
Rondout (Artex Segregated Account Company) (a)(c)(d)(h) (Cost: $13,261,839; Original Acquisition Date: 05/29/2015) | | | 11,118 | | | | 12,304,706 | |
Yoho (Artex Segregated Account Company) (a)(c)(d)(h) (Cost: $10,171,254; Acquisition Date: 05/17/2016) | | | 12,496 | | | | 8,511,170 | |
| | | | | | | | |
TOTAL PREFERENCE SHARES
(Cost $103,881,286) | | | | | | | 101,348,800 | |
| | | | | | | | |
| | | | |
| | The accompanying Notes to the Financial Statements are an integral part of these Financial Statements. | | (Continued) |
| | | | | | | | | | | | | | | | |
| | Stone Ridge Funds | | | | | | Annual Report | | | | | | October 31, 2017 | | |
| | | | | | | | | | |
29
| | |
| Schedule of Investments | | as of October 31, 2017 |
| | | | |
| STONE RIDGE HIGH YIELD REINSURANCE RISK PREMIUM FUND | | | | |
| | | | | | | | |
| | |
| | | SHARES | | | FAIR
VALUE | |
SHORT-TERM INVESTMENTS - 0.3% | | | | | | | | |
| | | | | | | | |
| Money Market Fund - 0.3% | | | | | | |
Fidelity Institutional Money Market Funds - Government Portfolio - Institutional Class - 0.92% (j) | | | 566,658 | | | | 566,658 | |
First American Government Obligations Fund - Class Z - 0.90% (j) | | | 570,040 | | | | 570,040 | |
First American Treasury Obligations Fund - Class Z - 0.92% (j) | | | 570,040 | | | | 570,040 | |
Morgan Stanley Institutional Liquidity Funds - Government Portfolio - Institutional Class - 0.92% (j) | | | 566,657 | | | | 566,657 | |
Short-Term Investments Trust - Treasury Portfolio - Institutional Class - 0.94% (j) | | | 566,658 | | | | 566,658 | |
| | | | | | | | |
TOTAL SHORT-TERM INVESTMENTS (Cost $2,840,053) | | | | | | | 2,840,053 | |
| | | | | | | | |
TOTAL INVESTMENTS
(Cost $1,176,302,636) - 100.3% | | | | | | | 1,100,455,340 | |
| | | | | | | | |
LIABILITIES IN EXCESS OF OTHER ASSETS - (0.3)% | | | | | | | (3,182,077) | |
| | | | | | | | |
TOTAL NET ASSETS - 100.0% | | | | | | $ | 1,097,273,263 | |
| | | | | | | | |
Principal amounts stated in U.S. dollars unless otherwise stated.
Country shown is geographic area of peril risk.
Percentages are stated as a percent of net assets.
| (a) | Foreign issued security. Total foreign securities by country of domicile are $1,079,952,073. Foreign exposure is as follows: Bermuda: 81.5%, Cayman Islands: 10.8%, Ireland: 4.8% and Supranational: 1.3%. |
| (b) | Variable rate security. Reference rates as of October 31, 2017 are as follows: T-BILL 3MO 1.13%, 3 Month EURIBOR -0.33%, 6 Month LIBOR 1.58%, and 3 Month LIBOR 1.38%. Actual reference rates may vary based on the reset date of the security. |
| (c) | Security is restricted as to resale. |
| (d) | Value is determined using significant unobservable inputs. |
| (e) | Although security is restricted as to resale, the Fund’s Adviser has determined this security to be liquid based upon procedures approved by the Board of Trustees. The aggregate value of these securities at October 31, 2017 was $958,404,616, which represented 87.3% of net assets. |
| (f) | All or a portion of the security is pledged as collateral for the Fund’s financing facility. |
| (g) | Zero-coupon bond. The rate shown is the yield to maturity. |
| (h) | Security is fair valued by the Adviser pursuant to procedures approved by the Board of Trustees. The aggregate value of these securities is $77,822,443, which represents 7.1% of net assets. |
| (i) | Non-income producing security. |
| (j) | Rate shown is the 7-day effective yield. |
Open Futures Contracts
| | | | | | | | | | | | |
| DESCRIPTION | | NUMBER OF
CONTRACTS
SOLD | | | NOTIONAL
VALUE | | | VALUE/
UNREALIZED
APPRECIATION | |
| | | |
| FUTURES CONTRACTS SOLD | | | | | | | | | |
Euro Fx, December 2017 Settlement | | | 119 | | | $ | 17,375,487 | | | $ | 491,338 | |
Swiss Franc, December 2017 Settlement | | | 41 | | | | 5,151,138 | | | | 240,265 | |
U.S. Treasury 5-Year Note, December 2017 Settlement | | | 64 | | | | 7,500,000 | | | | 67,910 | |
| | | | | | | | | | | | |
TOTAL FUTURES CONTRACTS SOLD | | | | | | $ | 30,026,625 | | | $ | 799,513 | |
| | | | | | | | | | | | |
| | | | |
| | The accompanying Notes to the Financial Statements are an integral part of these Financial Statements. | | |
| | | | | | | | | | | | | | | | |
| | Stone Ridge Funds | | | | | | Annual Report | | | | | | October 31, 2017 | | |
| | | | | | | | | | |
30
| | |
| Schedule of Investments | | October 31, 2017 |
| | | | |
| STONE RIDGE U.S. LARGE CAP VARIANCE RISK PREMIUM FUND | | | | |
| | | | | | | | |
| | | SHARES | | | FAIR
VALUE | |
CONTINGENT VALUE RIGHTS (a) - 0.0% | |
| | | | | | | | |
Food Staples Retailing (a) - 0.0% | | | | | |
Safeway Casa Ley (b)(c)(d) (Cost: $0; Original Acquisition Date: 05/14/2013) | | | 5,400 | | | $ | 5,480 | |
Safeway PDC (b)(c)(d) (Cost: $0; Original Acquisition Date: 05/14/2013) | | | 5,400 | | | | 264 | |
| | | | | | | | |
TOTAL CONTINGENT VALUE RIGHTS
(Cost $0) | | | | | | | 5,744 | |
| | | | | | | | |
| | | | | | | | |
SHORT-TERM INVESTMENTS - 100.4% | | | | | |
| | | | | | | | |
| Money Market Funds - 0.1% | | | | | | |
Fidelity Institutional Money Market Funds - Government Portfolio - Institutional Class - 0.92% (e) | | | 52,620 | | | | 52,620 | |
First American Government Obligations Fund - Class Z - 0.90% (e) | | | 52,621 | | | | 52,621 | |
First American Treasury Obligations Fund - Class Z - 0.92% (e) | | | 52,621 | | | | 52,621 | |
Morgan Stanley Institutional Liquidity Funds - Government Portfolio - Institutional Class - 0.92% (e) | | | 52,621 | | | | 52,621 | |
Short-Term Investments Trust - Treasury Portfolio - Institutional Class - 0.94% (e) | | | 52,621 | | | | 52,621 | |
| | | | | | | | |
| | | | | | | 263,104 | |
| | | | | | | | |
| | |
| | | PRINCIPAL
AMOUNT | | | FAIR
VALUE | |
| U.S. Treasury Bills - 100.3% | |
0.513%, 11/09/2017 (f)(g) | | $ | 62,000,000 | | | | 61,990,191 | |
1.052%, 11/24/2017 (f)(g) | | | 1,800,000 | | | | 1,798,806 | |
1.560%, 12/07/2017 (f)(g) | | | 29,400,000 | | | | 29,375,255 | |
0.446%, 12/21/2017 (f)(g) | | | 31,300,000 | | | | 31,253,376 | |
0.797%, 01/04/2018 (f)(g) | | | 50,900,000 | | | | 50,806,231 | |
1.102%, 01/11/2018 (f)(g) | | | 1,000,000 | | | | 997,954 | |
0.849%, 02/01/2018 (f)(g) | | | 40,800,000 | | | | 40,682,178 | |
1.112%, 02/22/2018 (f)(g) | | | 20,600,000 | | | | 20,527,822 | |
| | | | | | | | |
| | |
| | | PRINCIPAL
AMOUNT | | | FAIR
VALUE | |
| U.S. Treasury Bills - 100.3% (continued) | |
1.090%, 03/01/2018 (f)(g) | | $ | 32,300,000 | | | $ | 32,174,906 | |
1.151%, 03/08/2018 (f)(g) | | | 800,000 | | | | 796,668 | |
1.152%, 03/15/2018 (f)(g) | | | 46,700,000 | | | | 46,494,497 | |
1.197%, 07/19/2018 (f)(g) | | | 14,800,000.00 | | | | 14,659,174 | |
1.242%, 08/16/2018 (f)(g) | | | 22,600,000 | | | | 22,356,372 | |
| | | | | | | | |
| | | | | | | 353,913,430 | |
| | | | | | | | |
TOTAL SHORT-TERM INVESTMENTS (Cost $354,290,418) | | | | | | | 354,176,534 | |
| | | | | | | | |
TOTAL INVESTMENTS
(Cost $354,290,418) - 100.4% | | | | | | | 354,182,278 | |
| | | | | | | | |
LIABILITIES IN EXCESS OF OTHER ASSETS - (0.4)% | | | | | | | (1,394,235) | |
| | | | | | | | |
TOTAL NET ASSETS - 100.0% | | | | | | $ | 352,788,043 | |
| | | | | | | | |
Percentages are stated as a percent of net assets.
| (b) | Non-income producing security. |
| (c) | Security is restricted as to resale. |
| (d) | Security is fair valued by the Adviser pursuant to procedures approved by the Board of Trustees. Value is determined using significant unobservable inputs. The aggregate value of these securities is $5,744, which represents less than 0.01% of net assets. |
| (e) | Rate shown is the 7-day effective yield. |
| (f) | Rate shown is the effective yield based on purchase price. The calculation assumes the security is held to maturity. |
| (g) | All or a portion of this security is held as collateral for written put options. |
The Global Industry Classification Standard (GICS®) was developed by and/or is the exclusive property of MSCI, Inc. (“MSCI”) and Standard
& Poor’s Financial Services LLC (“S&P”). GICS is a service mark of MSCI and S&P and has been licensed for use by U.S. Bancorp Fund Services, LLC.
Written Options
| | | | | | | | | | | | |
| DESCRIPTION | | NUMBER OF
CONTRACTS | | | NOTIONAL
AMOUNT | | | FAIR
VALUE | |
| | | |
| PUT OPTIONS | | | | | | | | | |
CBOE S&P 500 Index, Expires 11/01/2017, Strike Price $2,580.00 | | | 195 | | | $ | 50,217,570 | | | $ | 129,675 | |
CBOE S&P 500 Index, Expires 11/03/2017, Strike Price $2,565.00 | | | 285 | | | | 73,394,910 | | | | 109,725 | |
CBOE S&P 500 Index, Expires 11/03/2017, Strike Price $2,570.00 | | | 77 | | | | 19,829,502 | | | | 39,655 | |
CBOE S&P 500 Index, Expires 11/03/2017, Strike Price $2,575.00 | | | 175 | | | | 45,067,050 | | | | 121,625 | |
CBOE S&P 500 Index, Expires 11/03/2017, Strike Price $2,580.00 | | | 442 | | | | 113,826,492 | | | | 413,270 | |
CBOE S&P 500 Index, Expires 11/06/2017, Strike Price $2,575.00 | | | 200 | | | | 51,505,200 | | | | 162,000 | |
| | | | | | | | | | | | |
TOTAL PUT OPTIONS
(Premiums Received $1,033,417) | | | | | | | | | | | 975,950 | |
| | | | | | | | | | | | |
TOTAL WRITTEN OPTIONS
(Premiums Received $1,033,417) | | | | | | | | | | $ | 975,950 | |
| | | | | | | | | | | | |
| | | | |
| | The accompanying Notes to the Financial Statements are an integral part of these Financial Statements. | | |
| | | | | | | | | | | | | | | | |
| | Stone Ridge Funds | | | | | | Annual Report | | | | | | October 31, 2017 | | |
| | | | | | | | | | |
31
| | |
| Schedule of Investments | | October 31, 2017 |
| | | | |
| STONE RIDGE U.S. SMALL CAP VARIANCE RISK PREMIUM FUND | | | | |
| | | | | | | | |
| | | SHARES | | | FAIR
VALUE | |
SHORT-TERM INVESTMENTS - 100.6% | |
| | | | | | | | |
| Money Market Funds - 0.1% | |
Fidelity Institutional Money Market Funds - Government Portfolio - Institutional Class - 0.92% (a) | | | 31,288 | | | $ | 31,288 | |
First American Government Obligations Fund - Class Z - 0.90% (a) | | | 31,287 | | | | 31,287 | |
First American Treasury Obligations Fund - Class Z - 0.92% (a) | | | 31,287 | | | | 31,287 | |
Morgan Stanley Institutional Liquidity Funds - Government Portfolio - Institutional Class - 0.92% (a) | | | 31,287 | | | | 31,287 | |
Short-Term Investments Trust - Treasury Portfolio - Institutional Class - 0.94% (a) | | | 31,287 | | | | 31,287 | |
| | | | | | | | |
| | | | | | | 156,436 | |
| | | | | | | | |
| | |
| | | PRINCIPAL
AMOUNT | | | FAIR
VALUE | |
| U.S. Treasury Bills - 100.5% | |
0.737%, 11/09/2017 (b)(c) | | $ | 16,350,000 | | | | 16,347,370 | |
1.051%, 11/24/2017 (b)(c) | | | 1,700,000 | | | | 1,698,871 | |
0.859%, 12/07/2017 (b)(c) | | | 10,700,000 | | | | 10,690,974 | |
0.830%, 01/04/2018 (b)(c) | | | 10,300,000 | | | | 10,281,025 | |
1.103%, 01/11/2018 (b)(c) | | | 300,000 | | | | 299,386 | |
| | | | | | | | |
| | |
| | | PRINCIPAL
AMOUNT | | | FAIR
VALUE | |
| U.S. Treasury Bills - 100.5% (continued) | |
0.891%, 02/01/2018 (b)(c) | | $ | 34,100,000 | | | $ | 34,001,527 | |
1.112%, 02/22/2018 (b)(c) | | | 13,000,000 | | | | 12,954,451 | |
1.090%, 03/01/2018 (b)(c) | | | 1,750,000 | | | | 1,743,223 | |
1.151%, 03/08/2018 (b)(c) | | | 1,000,000 | | | | 995,835 | |
1.152%, 03/15/2018 (b)(c) | | | 14,600,000 | | | | 14,535,752 | |
1.196%, 07/19/2018 (b)(c) | | | 9,500,000 | | | | 9,409,605 | |
1.237%, 08/16/2018 (b)(c) | | | 14,400,000 | | | | 14,244,768 | |
| | | | | | | | |
| | | | | | | 127,202,787 | |
| | | | | | | | |
TOTAL SHORT-TERM INVESTMENTS
(Cost $127,415,675) | | | | | | | 127,359,223 | |
| | | | | | | | |
TOTAL INVESTMENTS
(Cost $127,415,675) - 100.6% | | | | | | | 127,359,223 | |
| | | | | | | | |
LIABILITIES IN EXCESS OF OTHER
ASSETS - (0.6)% | | | | | | | (818,306) | |
| | | | | | | | |
TOTAL NET ASSETS - 100.0% | | | | | | $ | 126,540,917 | |
| | | | | | | | |
Percentages are stated as a percent of net assets.
| (a) | Rate shown is the 7-day effective yield. |
| (b) | Rate shown is the effective yield based on purchased price. The calculation assumes the security is held to maturity. |
| (c) | All or a portion of this security is held as collateral for written put options. |
Written Options
| | | | | | | | | | | | |
| DESCRIPTION | | NUMBER OF
CONTRACTS | | | NOTIONAL
AMOUNT | | | FAIR
VALUE | |
| | | |
| PUT OPTIONS | | | | | | | | | |
CBOE Russell 2000 Index, Expires 11/03/2017, Strike Price $1,485.00 | | | 202 | | | $ | 30,356,015 | | | $ | 61,105 | |
CBOE Russell 2000 Index, Expires 11/03/2017, Strike Price $1,490.00 | | | 4 | | | | 601,109 | | | | 1,620 | |
CBOE Russell 2000 Index, Expires 11/03/2017, Strike Price $1,495.00 | | | 50 | | | | 7,513,865 | | | | 27,250 | |
CBOE Russell 2000 Index, Expires 11/03/2017, Strike Price $1,500.00 | | | 150 | | | | 22,541,595 | | | | 109,500 | |
CBOE Russell 2000 Index, Expires 11/03/2017, Strike Price $1,505.00 | | | 341 | | | | 51,244,559 | | | | 329,065 | |
CBOE Russell 2000 Index, Expires 11/03/2017, Strike Price $1,510.00 | | | 100 | | | | 15,027,730 | | | | 125,000 | |
| | | | | | | | | | | | |
TOTAL PUT OPTIONS
(Premiums Received $816,083) | | | | | | | | | | | 653,540 | |
| | | | | | | | | | | | |
TOTAL WRITTEN OPTIONS
(Premiums Received $816,083) | | | | | | | | | | $ | 653,540 | |
| | | | | | | | | | | | |
| | | | |
| | The accompanying Notes to the Financial Statements are an integral part of these Financial Statements. | | |
| | | | | | | | | | | | | | | | |
| | Stone Ridge Funds | | | | | | Annual Report | | | | | | October 31, 2017 | | |
| | | | | | | | | | |
32
| | |
| Schedule of Investments | | October 31, 2017 |
| | | | |
| STONE RIDGE U.S. VARIANCE RISK PREMIUM MASTER FUND | | | | |
| | | | | | | | |
| | | SHARES | | | FAIR
VALUE | |
INVESTMENT COMPANIES - 100.0% | |
| | | | | | | | |
| Open-End Mutual Funds - 100.0% | |
Stone Ridge U.S. Large Cap Variance Risk Premium Fund - Class I (a) | | | 13,282,348 | | | $ | 152,614,181 | |
Stone Ridge U.S. Small Cap Variance Risk Premium Fund - Class I (a) | | | 6,863,133 | | | | 76,592,568 | |
| | | | | | | | |
TOTAL INVESTMENT COMPANIES
(Cost $203,773,000) | | | | 229,206,749 | |
| | | | | | | | |
| | | | | | | | |
SHORT-TERM INVESTMENTS - 0.1% | |
| | | | | | | | |
| Money Market Funds - 0.1% | | | | | | |
Fidelity Institutional Money Market Funds - Government Portfolio - Institutional Class - 0.92% (b) | | | 65,938 | | | | 65,938 | |
First American Government Obligations Fund - Class Z - 0.90% (b) | | | 65,938 | | | | 65,938 | |
First American Treasury Obligations Fund - Class Z - 0.92% (b) | | | 65,937 | | | | 65,937 | |
Morgan Stanley Institutional Liquidity Funds - Government Portfolio - Institutional Class - 0.92% (b) | | | 65,937 | | | | 65,937 | |
Short Term Investments Trust - Treasury Portfolio - Institutional Class - 0.94% (b) | | | 65,937 | | | | 65,937 | |
| | | | | | | | |
TOTAL SHORT-TERM INVESTMENTS
(Cost $329,687) | | | | | | | 329,687 | |
| | | | | | | | |
TOTAL INVESTMENTS
(Cost $204,102,687) - 100.1% | | | | | | | 229,536,436 | |
| | | | | | | | |
LIABILITIES IN EXCESS OF OTHER ASSETS - (0.1)% | | | | | | | (120,558) | |
| | | | | | | | |
TOTAL NET ASSETS - 100.0% | | | | | | $ | 229,415,878 | |
| | | | | | | | |
Percentages are stated as a percent of net assets.
| (a) | Affiliated company. See Note 9. |
| (b) | Rate shown is the 7-day effective yield. |
| | | | |
| | The accompanying Notes to the Financial Statements are an integral part of these Financial Statements. | | |
| | | | | | | | | | | | | | | | |
| | Stone Ridge Funds | | | | | | Annual Report | | | | | | October 31, 2017 | | |
| | | | | | | | | | |
33
| | |
| Schedule of Investments | | October 31, 2017 |
| | | | |
| STONE RIDGE INTERNATIONAL DEVELOPED MARKETS VARIANCE RISK PREMIUM FUND | | | | |
| | | | | | | | |
| | | SHARES | | | FAIR
VALUE | |
SHORT-TERM INVESTMENTS - 100.4% | | | | | | | | |
| | | | | | | | |
Money Market Funds - 7.6% | | | | | | | | |
Fidelity Institutional Money Market Funds - Government Portfolio - Institutional Class - 0.92% (a) | | | 1,468,002 | | | $ | 1,468,002 | |
First American Government Obligations Fund - Class Z - 0.90% (a) | | | 1,468,003 | | | | 1,468,003 | |
First American Treasury Obligations Fund - Class Z - 0.92% (a) | | | 1,468,003 | | | | 1,468,003 | |
Morgan Stanley Institutional Liquidity Funds - Government Portfolio - Institutional Class - 0.92% (a) | | | 1,468,003 | | | | 1,468,003 | |
Short-Term Investments Trust - Treasury Portfolio - Institutional Class - 0.94% (a) | | | 1,468,003 | | | | 1,468,003 | |
| | | | | | | | |
| | | | | | | 7,340,014 | |
| | | | | | | | |
| | |
| | | PRINCIPAL
AMOUNT | | | FAIR
VALUE | |
| U.S. Treasury Bills - 92.8% | | | | | | |
0.713%, 11/09/2017 (b)(c) | | $ | 13,100,000 | | | | 13,097,962 | |
1.065%, 11/24/2017 (b)(c) | | | 11,000,000 | | | | 10,992,638 | |
0.831%, 12/07/2017 (b)(c) | | | 6,250,000 | | | | 6,244,906 | |
1.113%, 12/21/2017 (b)(c) | | | 10,000,000 | | | | 9,984,792 | |
0.799%, 01/04/2018 (b)(c) | | | 9,250,000 | | | | 9,232,960 | |
| | | | | | | | |
| | | PRINCIPAL
AMOUNT | | | FAIR
VALUE | |
| U.S. Treasury Bills - 92.8% (continued) | | | | | | |
0.821%, 02/01/2018 (b)(c) | | $ | 2,100,000 | | | $ | 2,093,936 | |
1.113%, 02/22/2018 (b)(c) | | | 8,000,000 | | | | 7,971,969 | |
1.152%, 03/15/2018 (b)(c) | | | 4,200,000 | | | | 4,181,518 | |
1.116%, 03/29/2018 (b)(c) | | | 10,000,000 | | | | 9,950,357 | |
1.196%, 07/19/2018 (b)(c) | | | 8,000,000 | | | | 7,923,878 | |
1.217%, 08/16/2018 (b)(c) | | | 8,100,000 | | | | 8,012,682 | |
| | | | | | | | |
| | | | | | 89,687,598 | |
| | | | | | | | |
TOTAL SHORT-TERM INVESTMENTS
(Cost $97,058,229) | | | | | | | 97,027,612 | |
| | | | | | | | |
TOTAL INVESTMENTS
(Cost $97,058,229) - 100.4% | | | | | | | 97,027,612 | |
| | | | | | | | |
LIABILITIES IN EXCESS OF OTHER ASSETS - (0.4)% | | | | | | | (363,551) | |
| | | | | | | | |
TOTAL NET ASSETS - 100.0% | | | | | | $ | 96,664,061 | |
| | | | | | | | |
Percentages are stated as a percent of net assets.
| (a) | Rate shown is the 7-day effective yield |
| (b) | Rate shown is the effective yield based on purchase price. The calculation assumes the security is held to maturity. |
| (c) | All or a portion of this security is held as collateral for written put options. |
Written Options
| | | | | | | | | | | | |
| DESCRIPTION | | NUMBER OF
CONTRACTS | | | NOTIONAL
AMOUNT | | | FAIR
VALUE | |
| PUT OPTIONS | | | | | | | | | |
CAC 40 Index, Expires 11/17/2017, Strike Price EUR 5,475.00 | | | 10 | | | $ | 641,050 | | | $ | 3,684 | |
CAC 40 Index, Expires 11/17/2017, Strike Price EUR 5,500.00 | | | 65 | | | | 4,166,828 | | | | 30,968 | |
DAX Index, Expires 11/03/2017, Strike Price EUR 13,200.00 | | | 125 | | | | 9,631,536 | | | | 28,612 | |
Euro Stoxx 50 Index, Expires 11/03/2017, Strike Price EUR 3,650.00 | | | 203 | | | | 8,687,586 | | | | 8,749 | |
Euro Stoxx 50 Index, Expires 11/03/2017, Strike Price EUR 3,675.00 | | | 250 | | | | 10,698,997 | | | | 28,620 | |
FTSE 100 Index, Expires 11/17/2017, Strike Price GBP 7,400.00 | | | 75 | | | | 7,463,921 | | | | 26,397 | |
FTSE 100 Index, Expires 11/17/2017, Strike Price GBP 7,500.00 | | | 120 | | | | 11,942,274 | | | | 101,205 | |
Hang Seng Index, Expires 11/29/2017, Strike Price HKD 28,600.00 | | | 14 | | | | 2,534,401 | | | | 56,169 | |
Nikkei 225 Index, Expires 11/10/2017, Strike Price JPY 21,750.00 | | | 30 | | | | 5,807,557 | | | | 23,746 | |
Nikkei 225 Index, Expires 11/10/2017, Strike Price JPY 21,875.00 | | | 96 | | | | 18,584,183 | | | | 109,758 | |
S&P/ASX 200 Index, Expires 11/16/2017, Strike Price AUD 5,875.00 | | | 94 | | | | 4,251,124 | | | | 28,705 | |
S&P/ASX 200 Index, Expires 11/16/2017, Strike Price AUD 5,900.00 | | | 65 | | | | 2,939,607 | | | | 25,819 | |
Swiss Market Index, Expires 11/17/2017, Strike Price CHF 9,200.00 | | | 92 | | | | 8,522,834 | | | | 42,051 | |
Swiss Market Index, Expires 11/17/2017, Strike Price CHF 9,250.00 | | | 12 | | | | 1,111,674 | | | | 8,519 | |
| | | | | | | | | | | | |
TOTAL PUT OPTIONS
(Premiums Received $673,026) | | | | | | | | | | | 523,002 | |
| | | | | | | | | | | | |
TOTAL WRITTEN OPTIONS
(Premiums Received $673,026) | | | | | | | | | | $ | 523,002 | |
| | | | | | | | | | | | |
| | | | |
| | The accompanying Notes to the Financial Statements are an integral part of these Financial Statements. | | |
| | | | | | | | | | | | | | | | |
| | Stone Ridge Funds | | | | | | Annual Report | | | | | | October 31, 2017 | | |
| | | | | | | | | | |
34
| | |
| Schedule of Investments | | October 31, 2017 |
| | | | |
| STONE RIDGE EMERGING MARKETS VARIANCE RISK PREMIUM FUND | | | | |
| | | | | | | | |
| | | SHARES | | | FAIR
VALUE | |
SHORT-TERM INVESTMENTS - 112.0% | | | | | | | | |
| | | | | | | | |
| Money Market Funds - 0.5% | | | | | | |
Fidelity Institutional Money Market Funds - Government Portfolio - Institutional Class - 0.92% (a) | | | 14,024 | | | $ | 14,024 | |
First American Government Obligations Fund - Class Z - 0.90% (a) | | | 14,024 | | | | 14,024 | |
First American Treasury Obligations Fund - Class Z - 0.92% (a) | | | 14,024 | | | | 14,024 | |
Morgan Stanley Institutional Liquidity Funds - Government Portfolio - Institutional Class - 0.92% (a) | | | 14,024 | | | | 14,024 | |
Short-Term Investments Trust - Treasury Portfolio - Institutional Class - 0.94% (a) | | | 14,024 | | | | 14,024 | |
| | | | | | | | |
| | | | | | | 70,120 | |
| | | | | | | | |
| | |
| | | PRINCIPAL
AMOUNT | | | FAIR
VALUE | |
| U.S. Treasury Bills - 111.5% | | | | | | |
1.066%, 11/24/2017 (b)(c) | | $ | 200,000 | | | | 199,866 | |
1.110%, 02/22/2018 (b)(c) | | | 6,800,000 | | | | 6,776,174 | |
| | | | | | | | |
| | |
| | | PRINCIPAL
AMOUNT | | | FAIR
VALUE | |
| U.S. Treasury Bills - 111.5% (continued) | | | | | | |
1.152%, 03/15/2018 (b)(c) | | $ | 4,400,000 | | | $ | 4,380,638 | |
1.197%, 07/19/2018 (b)(c) | | | 2,100,000 | | | | 2,080,018 | |
1.226%, 08/16/2018 (b)(c) | | | 2,150,000 | | | | 2,126,823 | |
| | | | | | | | |
| | | | | | | 15,563,519 | |
| | | | | | | | |
TOTAL SHORT-TERM INVESTMENTS
(Cost $15,639,761) | | | | | | | 15,633,639 | |
| | | | | | | | |
TOTAL INVESTMENTS
(Cost $15,639,761) - 112.0% | | | | | | | 15,633,639 | |
| | | | | | | | |
LIABILITIES IN EXCESS OF OTHER
ASSETS - (12.0)% | | | | | | | (1,679,231) | |
| | | | | | | | |
TOTAL NET ASSETS - 100.0% | | | | | | $ | 13,954,408 | |
| | | | | | | | |
Percentages are stated as a percent of net assets.
| (a) | Rate shown is the 7-day effective yield. |
| (b) | Rate shown is the effective yield based on purchased price. The calculation assumes the security is held to maturity. |
| (c) | All or a portion of this security is held as collateral for written put options. |
Written Options
| | | | | | | | | | | | |
| DESCRIPTION | | NUMBER OF
CONTRACTS | | | NOTIONAL
AMOUNT | | | FAIR
VALUE | |
| | | |
| PUT OPTIONS | | | | | | | | | |
iShares MSCI Brazil Capped ETF, Expires 11/17/2017, Strike Price $41.00 | | | 150 | | | $ | 602,550 | | | $ | 22,650 | |
iShares MSCI Emerging Markets ETF, Expires 11/03/2017, Strike Price $45.50 | | | 237 | | | | 1,096,836 | | | | 1,659 | |
iShares MSCI Emerging Markets ETF, Expires 11/03/2017, Strike Price $46.00 | | | 1,628 | | | | 7,534,384 | | | | 27,676 | |
iShares MSCI Emerging Markets ETF, Expires 11/10/2017, Strike Price $46.00 | | | 1,202 | | | | 5,562,856 | | | | 38,464 | |
iShares MSCI Mexico Capped ETF, Expires 11/17/2017, Strike Price $50.00 | | | 75 | | | | 377,475 | | | | 4,800 | |
iShares MSCI South Korea ETF, Expires 11/17/2017, Strike Price $73.50 | | | 50 | | | | 373,800 | | | | 3,325 | |
Market Vectors Russia ETF, Expires 11/17/2017, Strike Price $22.00 | | | 30 | | | | 65,370 | | | | 1,230 | |
| | | | | | | | | | | | |
TOTAL PUT OPTIONS
(Premiums Received $135,743) | | | | | | | | | | | 99,804 | |
| | | | | | | | | | | | |
TOTAL WRITTEN OPTIONS
(Premiums Received $135,743) | | | | | | | | | | $ | 99,804 | |
| | | | | | | | | | | | |
| | | | |
| | The accompanying Notes to the Financial Statements are an integral part of these Financial Statements. | | |
| | | | | | | | | | | | | | | | |
| | Stone Ridge Funds | | | | | | Annual Report | | | | | | October 31, 2017 | | |
| | | | | | | | | | |
35
| | |
| Schedule of Investments | | October 31, 2017 |
| | | | |
| STONE RIDGE INTERNATIONAL VARIANCE RISK PREMIUM MASTER FUND | | | | |
| | | | | | | | |
| | | SHARES | | | FAIR
VALUE | |
INVESTMENT COMPANIES - 100.1% | | | | | | | | |
| | | | | | | | |
| Open-End Mutual Funds - 100.1% | | | | | | |
Stone Ridge Emerging Markets Variance Risk Premium Fund - Class I (a) | | | 393,067 | | | $ | 3,576,914 | |
Stone Ridge International Developed Markets Variance Risk Premium Fund - Class I (a) | | | 744,292 | | | | 8,060,687 | |
| | | | | | | | |
TOTAL INVESTMENT COMPANIES
(Cost $10,656,450) | | | | | | | 11,637,601 | |
| | | | | | | | |
| | | | | | | | |
SHORT-TERM INVESTMENTS - 1.1% | | | | | | | | |
| | | | | | | | |
| Money Market Funds - 1.1% | | | | | | |
Fidelity Institutional Money Market Funds - Government Portfolio - Institutional Class - 0.92% (b) | | | 26,077 | | | | 26,077 | |
First American Government Obligations Fund - Class Z - 0.90% (b) | | | 26,077 | | | | 26,077 | |
First American Treasury Obligations Fund - Class Z - 0.92% (b) | | | 26,078 | | | | 26,078 | |
Morgan Stanley Institutional Liquidity Funds - Government Portfolio - Institutional Class - 0.92% (b) | | | 26,078 | | | | 26,078 | |
Short-Term Investments Trust - Treasury Portfolio - Institutional Class - 0.94% (b) | | | 26,078 | | | | 26,078 | |
| | | | | | | | |
TOTAL SHORT-TERM INVESTMENTS
(Cost $130,388) | | | | | | | 130,388 | |
| | | | | | | | |
TOTAL INVESTMENTS
(Cost $10,786,838) - 101.2% | | | | | | | 11,767,989 | |
| | | | | | | | |
LIABILITIES IN EXCESS OF OTHER ASSETS - (1.2)% | | | | | | | (141,127) | |
| | | | | | | | |
TOTAL NET ASSETS - 100.0% | | | | | | $ | 11,626,862 | |
| | | | | | | | |
Percentages are stated as a percent of net assets.
| (a) | Affiliated company. See Note 9. |
| (b) | Rate shown is the 7-day effective yield. |
| | | | |
| | The accompanying Notes to the Financial Statements are an integral part of these Financial Statements. | | |
| | | | | | | | | | | | | | | | |
| | Stone Ridge Funds | | | | | | Annual Report | | | | | | October 31, 2017 | | |
| | | | | | | | | | |
36
| | |
| Schedule of Investments | | October 31, 2017 |
| | | | |
| STONE RIDGE GLOBAL EQUITY VARIANCE RISK PREMIUM MASTER FUND | | | | |
| | | | | | | | |
| | | SHARES | | | FAIR
VALUE | |
INVESTMENT COMPANIES - 97.9% | | | | | |
| | | | | | | | |
| Open-End Mutual Funds - 97.9% | | | | | | |
Stone Ridge Emerging Markets Variance Risk Premium Fund - Class I (a) | | | 646,976 | | | $ | 5,887,486 | |
Stone Ridge International Developed Markets Variance Risk Premium Fund - Class I (a) | | | 1,226,624 | | | | 13,284,333 | |
Stone Ridge U.S. Large Cap Variance Risk Premium Fund - Class I (a) | | | 1,144,925 | | | | 13,155,184 | |
Stone Ridge U.S. Small Cap Variance Risk Premium Fund - Class I (a) | | | 588,328 | | | | 6,565,744 | |
| | | | | | | | |
TOTAL INVESTMENT COMPANIES
(Cost $35,423,581) | | | | | | | 38,892,747 | |
| | | | | | | | |
| | | | | | | | |
SHORT-TERM INVESTMENTS - 0.5% | | | | | |
| | | | | | | | |
| Money Market Funds - 0.5% | | | | |
Fidelity Institutional Money Market Funds - Government Portfolio - Institutional Class - 0.92% (b) | | | 37,796 | | | | 37,796 | |
First American Government Obligations Fund - Class Z - 0.90% (b) | | | 37,795 | | | | 37,795 | |
First American Treasury Obligations Fund - Class Z - 0.92% (b) | | | 37,795 | | | | 37,795 | |
Morgan Stanley Institutional Liquidity Funds - Government Portfolio - Institutional Class - 0.92% (b) | | | 37,795 | | | | 37,795 | |
Short-Term Investments Trust - Treasury Portfolio - Institutional Class - 0.94% (b) | | | 37,795 | | | | 37,795 | |
| | | | | | | | |
TOTAL SHORT-TERM INVESTMENTS
(Cost $188,976) | | | | | | | 188,976 | |
| | | | | | | | |
TOTAL INVESTMENTS
(Cost $35,612,557) - 98.4% | | | | | | | 39,081,723 | |
| | | | | | | | |
OTHER ASSETS IN EXCESS OF LIABILITIES - 1.6% | | | | | | | 618,218 | |
| | | | | | | | |
TOTAL NET ASSETS - 100.0% | | | | | | $ | 39,699,941 | |
| | | | | | | | |
Percentages are stated as a percent of net assets.
| (a) | Affiliated company. See Note 9. |
| (b) | Rate shown is the 7-day effective yield. |
| | | | |
| | The accompanying Notes to the Financial Statements are an integral part of these Financial Statements. | | |
| | | | | | | | | | | | | | | | |
| | Stone Ridge Funds | | | | | | Annual Report | | | | | | October 31, 2017 | | |
| | | | | | | | | | |
37
| | |
| Statement of Assets and Liabilities | | October 31, 2017 |
| | | | |
| | | STONE RIDGE
HIGH YIELD
REINSURANCE
RISK PREMIUM
FUND | |
| ASSETS: | | | | |
Investments, at fair value(1) | | $ | 1,100,455,340 | |
Interest receivable | | | 6,854,077 | |
Receivable for fund shares sold | | | 596,894 | |
Foreign currencies at broker, at value(2) | | | 655,215 | |
Collateral held at broker for futures | | | 402,625 | |
Other assets | | | 3,587 | |
| Total assets | | | 1,108,967,738 | |
| LIABILITIES: | | | | |
Payable for investment securities purchased | | | 2,074,000 | |
Loan payable (See Note 11) | | | 7,500,000 | |
Payable to Adviser | | | 1,237,187 | |
Payable for Chief Compliance Officer compensation | | | 5,987 | |
Payable to Trustees | | | 15,844 | |
Payable for fund shares redeemed | | | 344,177 | |
Payable to Custodian | | | 13,290 | |
Accrued distribution fees | | | 24,585 | |
Payable for interest fees | | | 10,845 | |
Other accrued expenses | | | 468,560 | |
| Total liabilities | | | 11,694,475 | |
| Total net assets | | $ | 1,097,273,263 | |
| | | | | |
| NET ASSETS CONSIST OF: | | | | |
Capital stock | | $ | 1,220,631,215 | |
Accumulated net investment loss | | | (13,304,595 | ) |
Accumulated net realized loss | | | (35,015,168 | ) |
| Unrealized appreciation (depreciation) on: | | | | |
Investments | | | (76,375,758 | ) |
Foreign currency translation | | | 538,056 | |
Futures contracts | | | 799,513 | |
| Total net assets | | $ | 1,097,273,263 | |
| | | | | |
| Class I | | | | |
Net assets | | $ | 910,525,384 | |
Shares outstanding | | | 99,670,024 | |
Class I Net asset value, offering and redemption price per share | | $ | 9.14 | |
| Class M | | | | |
Net assets | | $ | 186,747,879 | |
Shares outstanding | | | 20,451,769 | |
Class M Net asset value, offering and redemption price per share. | | $ | 9.13 | |
| | | | | |
(1) Cost of Investments | | $ | 1,176,302,636 | |
(2) Cost of foreign currencies | | | 644,841 | |
| | | | |
| | The accompanying Notes to the Financial Statements are an integral part of these Financial Statements. | | (Continued) |
| | | | | | | | | | | | | | | | |
| | Stone Ridge Funds | | | | | | Annual Report | | | | | | October 31, 2017 | | |
| | | | | | | | | | |
38
| | |
| Statement of Assets and Liabilities | | October 31, 2017 |
| | | | | | | | | | | | |
| | | STONE RIDGE
U.S. LARGE CAP
VARIANCE
RISK PREMIUM
FUND | | | STONE RIDGE
U.S. SMALL CAP
VARIANCE
RISK PREMIUM
FUND | | | STONE RIDGE
U.S. VARIANCE
RISK PREMIUM
MASTER
FUND | |
| ASSETS: | | | | | | | | | | | | |
| Investments, at fair value(1) | | | | | | | | | | | | |
Unaffiliated issuers | | $ | 354,182,278 | | | $ | 127,359,223 | | | $ | 329,687 | |
Affiliated issuers | | | — | | | | — | | | | 229,206,749 | |
Interest receivable | | | — | | | | 163 | | | | 185 | |
Receivable for fund shares sold | | | 113,000 | | | | 62,480 | | | | 132,169 | |
Receivable for investments sold | | | 230,970 | | | | — | | | | — | |
Other assets | | | 13,165 | | | | 13,870 | | | | 18,106 | |
| Total assets | | | 354,539,413 | | | | 127,435,736 | | | | 229,686,896 | |
| LIABILITIES: | | | | | | | | | | | | |
Written options, at fair value(2) | | | 975,950 | | | | 653,540 | | | | — | |
Payable for investment securities purchased | | | 78,211 | | | | — | | | | 150,000 | |
Payable to Adviser | | | 312,618 | | | | 61,045 | | | | — | |
Payable for Chief Compliance Officer compensation | | | 4,803 | | | | 4,876 | | | | 1,206 | |
Payable to Trustees | | | 4,886 | | | | 1,676 | | | | — | |
Payable for fund shares redeemed | | | 7,500 | | | | — | | | | 22,153 | |
Payable to Custodian | | | 20,014 | | | | 9,681 | | | | 535 | |
Accrued distribution fees | | | 6,527 | | | | 1,827 | | | | 4,864 | |
Accrued legal fees | | | 182,873 | | | | 70,839 | | | | 36,477 | |
Accrued audit expense | | | 63,487 | | | | 63,488 | | | | 38,290 | |
Other accrued expenses | | | 94,501 | | | | 27,847 | | | | 17,493 | |
| Total liabilities | | | 1,751,370 | | | | 894,819 | | | | 271,018 | |
| Total net assets | | $ | 352,788,043 | | | $ | 126,540,917 | | | $ | 229,415,878 | |
| | | | | | | | | | | | | |
| NET ASSETS CONSIST OF: | | | | | | | | | | | | |
Capital stock | | $ | 307,688,537 | | | $ | 112,798,595 | | | $ | 196,001,555 | |
Accumulated net investment income | | | — | | | | — | | | | 441,161 | |
Accumulated net realized gain | | | 45,150,179 | | | | 13,636,230 | | | | 7,539,412 | |
| Unrealized appreciation (depreciation) on: | | | | | | | | | | | | |
Investments | | | (108,140 | ) | | | (56,452 | ) | | | 25,433,750 | |
Written options | | | 57,467 | | | | 162,544 | | | | — | |
| Total net assets | | $ | 352,788,043 | | | $ | 126,540,917 | | | $ | 229,415,878 | |
| | | | | | | | | | | | | |
| Class I | | | | | | | | | | | | |
Net assets | | $ | 301,447,149 | | | $ | 112,063,315 | | | $ | 191,062,806 | |
Shares outstanding | | | 26,232,874 | | | | 10,041,885 | | | | 16,471,663 | |
Class I Net asset value, offering and redemption price per share | | $ | 11.49 | | | $ | 11.16 | | | $ | 11.60 | |
| Class M | | | | | | | | | | | | |
Net assets | | $ | 51,340,894 | | | $ | 14,477,602 | | | $ | 38,353,072 | |
Shares outstanding | | | 4,502,009 | | | | 1,307,074 | | | | 3,322,291 | |
Class M Net asset value, offering and redemption price per share.. | | $ | 11.40 | | | $ | 11.08 | | | $ | 11.54 | |
| | | | | | | | | | | | | |
| (1) Cost of Investments | | | | | | | | | | | | |
Unaffiliated issuers | | $ | 354,290,418 | | | $ | 127,415,675 | | | $ | 329,687 | |
Affiliated issuers (See Note 9) | | | — | | | | — | | | | 203,773,000 | |
(2) Premiums received | | | 1,033,417 | | | | 816,083 | | | | — | |
| | | | |
| | The accompanying Notes to the Financial Statements are an integral part of these Financial Statements. | | (Continued) |
| | | | | | | | | | | | | | | | |
| | Stone Ridge Funds | | | | | | Annual Report | | | | | | October 31, 2017 | | |
| | | | | | | | | | |
39
| | |
| Statement of Assets and Liabilities | | October 31, 2017 |
| | | | | | | | | | | | | | | | |
| | | STONE RIDGE
INTERNATIONAL
DEVELOPED
MARKETS VARIANCE
RISK PREMIUM FUND | | | STONE RIDGE
EMERGING MARKETS
VARIANCE RISK
PREMIUM FUND | | | STONE RIDGE
INTERNATIONAL
VARIANCE RISK
PREMIUM MASTER
FUND | | | STONE RIDGE
GLOBAL EQUITY
VARIANCE RISK
PREMIUM MASTER
FUND | |
| ASSETS: | | | | | | | | | | | | | | | | |
| Investments, at fair value(1) | | | | | | | | | | | | | | | | |
Unaffiliated issuers | | $ | 97,027,612 | | | $ | 15,633,639 | | | $ | 130,388 | | | $ | 188,976 | |
Affiliated issuers | | | — | | | | — | | | | 11,637,601 | | | | 38,892,747 | |
Interest receivable | | | — | | | | 106 | | | | 100 | | | | 157 | |
Dividends receivable | | | 156 | | | | — | | | | — | | | | — | |
Funds distribution receivable | | | — | | | | — | | | | 399,982 | | | | 658,357 | |
Receivable from Adviser | | | — | | | | 98,345 | | | | 7,531 | | | | 3,899 | |
Receivable for fund shares sold | | | 5,900 | | | | — | | | | — | | | | 7,990 | |
Receivable for investments sold | | | 40,030 | | | | 35,639 | | | | — | | | | — | |
Foreign currencies at broker, at value(2) | | | 3,290,167 | | | | — | | | | — | | | | — | |
Other assets | | | 13,292 | | | | 21,857 | | | | 12,234 | | | | 23,465 | |
| Total assets | | | 100,377,157 | | | | 15,789,586 | | | | 12,187,836 | | | | 39,775,591 | |
| LIABILITIES: | | | | | | | | | | | | | | | | |
Written options, at fair value(3) | | | 523,002 | | | | 99,804 | | | | — | | | | — | |
Payable for investment securities purchased | | | — | | | | 21,666 | | | | — | | | | — | |
Due to broker | | | 2,993,581 | | | | — | | | | — | | | | — | |
Payable for distribution | | | — | | | | 1,562,394 | | | | 506,614 | | | | — | |
Payable for fund shares redeemed | | | — | | | | — | | | | — | | | | 14,162 | |
Payable for investment interest | | | 14,754 | | | | — | | | | — | | | | — | |
Payable to Adviser | | | 28,188 | | | | — | | | | — | | | | — | |
Payable for Chief Compliance Officer compensation | | | 4,872 | | | | 4,872 | | | | 1,232 | | | | 1,205 | |
Payable to Trustees | | | 1,315 | | | | 655 | | | | — | | | | — | |
Accrued audit expense | | | 66,583 | | | | 66,584 | | | | 38,274 | | | | 38,286 | |
Accrued legal fees | | | 48,976 | | | | 35,794 | | | | 7,059 | | | | 8,960 | |
Accrued transfer agent fees and expenses | | | 5,441 | | | | 6,018 | | | | 6,159 | | | | 7,209 | |
Payable to Custodian | | | 3,808 | | | | 32,422 | | | | 9 | | | | 86 | |
Accrued distribution fees | | | 2,527 | | | | 429 | | | | 542 | | | | 952 | |
Other accrued expenses | | | 20,049 | | | | 4,540 | | | | 1,085 | | | | 4,790 | |
| Total liabilities | | | 3,713,096 | | | | 1,835,178 | | | | 560,974 | | | | 75,650 | |
| Total net assets | | $ | 96,664,061 | | | $ | 13,954,408 | | | $ | 11,626,862 | | | $ | 39,699,941 | |
| | | | | | | | | | | | | | | | | |
| NET ASSETS CONSIST OF: | | | | | | | | | | | | | | | | |
Capital stock | | $ | 87,035,243 | | | $ | 14,328,102 | | | $ | 12,508,326 | | | $ | 35,564,156 | |
Accumulated net investment income (loss) | | | — | | | | — | | | | (174,746 | ) | | | 465,325 | |
Accumulated net realized gain (loss) | | | 9,544,016 | | | | (403,511 | ) | | | (1,687,869 | ) | | | 201,294 | |
Unrealized appreciation (depreciation) on: | | | | | | | | | | | | | | | | |
Investments | | | (30,617 | ) | | | (6,122 | ) | | | 981,151 | | | | 3,469,166 | |
Foreign currency translation | | | (32,292 | ) | | | — | | | | — | | | | — | |
Written options | | | 147,711 | | | | 35,939 | | | | — | | | | — | |
| Total net assets | | $ | 96,664,061 | | | $ | 13,954,408 | | | $ | 11,626,862 | | | $ | 39,699,941 | |
| | | | | | | | | | | | | | | | | |
| Class I | | | | | | | | | | | | | | | | |
Net assets | | $ | 76,773,565 | | | $ | 10,938,225 | | | $ | 7,534,313 | | | $ | 32,230,063 | |
Shares outstanding | | | 7,088,933 | | | | 1,201,795 | | | | 739,825 | | | | 2,943,280 | |
Class I Net asset value, offering and redemption price per share | | $ | 10.83 | | | $ | 9.10 | | | $ | 10.18 | | | $ | 10.95 | |
| Class M | | | | | | | | | | | | | | | | |
Net assets | | $ | 19,890,496 | | | $ | 3,016,183 | | | $ | 4,092,549 | | | $ | 7,469,878 | |
Shares outstanding | | | 1,846,205 | | | | 333,591 | | | | 402,741 | | | | 684,870 | |
Class M Net asset value, offering and redemption price per share | | $ | 10.77 | | | $ | 9.04 | | | $ | 10.16 | | | $ | 10.91 | |
| | | | | | | | | | | | | | | | | |
| (1) Cost of Investments | | | | | | | | | | | | | | | | |
Unaffiliated issuers | | $ | 97,058,229 | | | $ | 15,639,761 | | | $ | 130,388 | | | $ | 188,976 | |
Affiliated issuers (See Note 9) | | | — | | | | — | | | | 10,656,450 | | | | 35,423,581 | |
(2) Cost of foreign currencies | | | 3,324,816 | | | | — | | | | — | | | | — | |
(3) Premiums received | | | 673,026 | | | | 135,743 | | | | — | | | | — | |
| | | | |
| | The accompanying Notes to the Financial Statements are an integral part of these Financial Statements. | | |
| | | | | | | | | | | | | | | | |
| | Stone Ridge Funds | | | | | | Annual Report | | | | | | October 31, 2017 | | |
| | | | | | | | | | |
40
| | |
| Statement of Operations | | For the Year Ended October 31, 2017 |
| | | | |
| | | STONE RIDGE
HIGH YIELD
REINSURANCE
RISK PREMIUM
FUND | |
| INVESTMENT INCOME: | | | | |
Dividend income | | $ | 12,820,310 | |
Interest income | | | 84,601,154 | |
| Total investment income | | | 97,421,464 | |
| EXPENSES | | | | |
Advisory fees (See Note 4) | | | 17,022,107 | |
Interest expense | | | 1,216,881 | |
Fund accounting and administration fees | | | 763,553 | |
Legal fees | | | 603,804 | |
Distribution (12b-1) fees — Class M Only | | | 287,018 | |
Transfer agency fees and expenses | | | 232,500 | |
Audit and tax related fees | | | 93,126 | |
Federal and state registration fees | | | 81,401 | |
Custody fees | | | 77,994 | |
Trustees fees and expenses | | | 67,850 | |
Chief Compliance Officer compensation | | | 48,766 | |
Other expenses | | | 319,871 | |
| Total expenses before Adviser waiver | | | 20,814,871 | |
Expenses waived by Adviser (See Note 4) | | | (487,916 | ) |
| Total net expenses | | | 20,326,955 | |
| Net investment income | | | 77,094,509 | |
| NET REALIZED AND UNREALIZED GAIN (LOSS): | | | | |
| Net realized gain (loss) on: | | | | |
Investments | | | (809,346 | ) |
Foreign currency translation | | | 28,815 | |
Futures contracts | | | (553,034 | ) |
| Net change in unrealized appreciation (depreciation) on: | | | | |
Investments | | | (137,243,537 | ) |
Foreign currency translation | | | 1,484,138 | |
Futures contracts | | | (469,638 | ) |
| Net realized and unrealized loss | | | (137,562,602 | ) |
| Net decrease in net assets resulting from operations | | $ | (60,468,093 | ) |
| | | | | |
| | | | |
| | The accompanying Notes to the Financial Statements are an integral part of these Financial Statements. | | (Continued) |
| | | | | | | | | | | | | | | | |
| | Stone Ridge Funds | | | | | | Annual Report | | | | | | October 31, 2017 | | |
| | | | | | | | | | |
41
| | |
| Statement of Operations | | For the Year Ended October 31, 2017 |
| | | | | | | | | | | | |
| | | STONE RIDGE
U.S. LARGE CAP
VARIANCE
RISK PREMIUM
FUND | | | STONE RIDGE
U.S. SMALL CAP
VARIANCE
RISK PREMIUM
FUND | | | STONE RIDGE
U.S. VARIANCE
RISK PREMIUM
MASTER
FUND | |
| INVESTMENT INCOME: | | | | | | | | | | | | |
| Dividend income | | | | | | | | | | | | |
Affiliated issuers | | $ | — | | | $ | — | | | $ | 84,960 | |
Interest income | | | 2,524,536 | | | | 922,224 | | | | 1,338 | |
| Total investment income | | | 2,524,536 | | | | 922,224 | | | | 86,298 | |
| EXPENSES | | | | | | | | | | | | |
Advisory fees (See Note 4) | | | 4,440,472 | | | | 1,604,408 | | | | — | |
Fund accounting and administration fees | | | 408,628 | | | | 302,616 | | | | 2,027 | |
Legal fees | | | 173,962 | | | | 71,652 | | | | 9,108 | |
Distribution (12b-1) fees — Class M Only | | | 90,478 | | | | 21,095 | | | | 54,503 | |
Audit and tax related fees | | | 70,905 | | | | 70,905 | | | | 42,203 | |
Transfer agency fees and expenses | | | 59,499 | | | | 34,975 | | | | 59,658 | |
Chief Compliance Officer compensation | | | 48,678 | | | | 48,766 | | | | 12,201 | |
Federal and state registration fees | | | 46,097 | | | | 40,278 | | | | 35,274 | |
Printing and mailing expenses | | | 30,643 | | | | 10,722 | | | | 16,121 | |
Trustees fees and expenses | | | 21,935 | | | | 7,783 | | | | — | |
Custody fees | | | 18,945 | | | | 11,818 | | | | 276 | |
Other expenses | | | 172,947 | | | | 71,251 | | | | 11,516 | |
| Total expenses before Adviser waiver | | | 5,583,189 | | | | 2,296,269 | | | | 242,887 | |
Expenses waived by Adviser (See Note 4) | | | (60,860 | ) | | | (163,897 | ) | | | — | |
| Total net expenses | | | 5,522,329 | | | | 2,132,372 | | | | 242,887 | |
| Net investment loss | | | (2,997,793 | ) | | | (1,210,148 | ) | | | (156,589 | ) |
| NET REALIZED AND UNREALIZED GAIN (LOSS): | | | | | | | | | | | | |
| Net realized gain (loss) on: | | | | | | | | | | | | |
Investments | | | | | | | | | | | | |
Affiliated issuers (See Note 9) | | | — | | | | — | | | | 1,449,814 | |
Unaffiliated issuers | | | (82,320 | ) | | | (29,917 | ) | | | — | |
Capital gain distributions from affiliated mutual funds | | | — | | | | — | | | | 7,269,248 | |
Futures contracts | | | 30,963 | | | | — | | | | — | |
Written options | | | 48,587,406 | | | | 16,763,556 | | | | — | |
| Net change in unrealized appreciation (depreciation) on: | | | | | | | | | | | | |
Investments | | | (149,303 | ) | | | (61,626 | ) | | | 18,483,464 | |
Written options | | | (202,996 | ) | | | (311,706 | ) | | | — | |
| Net realized and unrealized gain | | | 48,183,750 | | | | 16,360,307 | | | | 27,202,526 | |
| Net increase in net assets resulting from operations | | $ | 45,185,957 | | | $ | 15,150,159 | | | $ | 27,045,937 | |
| | | | | | | | | | | | | |
| | | | |
| | The accompanying Notes to the Financial Statements are an integral part of these Financial Statements. | | (Continued) |
| | | | | | | | | | | | | | | | |
| | Stone Ridge Funds | | | | | | Annual Report | | | | | | October 31, 2017 | | |
| | | | | | | | | | |
42
| | |
| Statement of Operations | | For the Year Ended October 31, 2017 |
| | | | | | | | | | | | | | | | |
| | | STONE RIDGE
INTERNATIONAL
DEVELOPED MARKETS
VARIANCE RISK
PREMIUM FUND | | | STONE RIDGE
EMERGING
MARKETS VARIANCE
RISK PREMIUM
FUND | | | STONE RIDGE
INTERNATIONAL
VARIANCE RISK
PREMIUM MASTER
FUND | | | STONE RIDGE
GLOBAL EQUITY
VARIANCE RISK
PREMIUM MASTER
FUND | |
| INVESTMENT INCOME: | | | | | | | | | | | | | | | | |
| Dividend income | | | | | | | | | | | | | | | | |
Affiliated issuers | | $ | — | | | $ | — | | | $ | 399,982 | | | $ | 666,234 | |
Unaffiliated issuers | | | 6 | | | | — | | | | — | | | | — | |
Interest income | | | 679,103 | | | | 283,279 | | | | 638 | | | | 1,560 | |
Exchange rebates | | | — | | | | 49,963 | | | | — | | | | — | |
| Total investment income | | | 679,109 | | | | 333,242 | | | | 400,620 | | | | 667,794 | |
| EXPENSES | | | | | | | | | | | | | | | | |
Advisory fees (See Note 4) | | | 1,191,719 | | | | 511,167 | | | | — | | | | — | |
Fund accounting and administration fees | | | 290,517 | | | | 265,761 | | | | 2,006 | | | | 2,006 | |
Broker and investment interest expenses | | | 179,472 | | | | — | | | | — | | | | — | |
Audit and tax related fees | | | 74,392 | | | | 74,392 | | | | 42,183 | | | | 42,203 | |
Legal fees | | | 58,291 | | | | 37,928 | | | | 1,288 | | | | 1,932 | |
Chief Compliance Officer compensation | | | 48,766 | | | | 48,766 | | | | 12,201 | | | | 12,201 | |
Federal and state registration fees | | | 35,684 | | | | 31,224 | | | | 30,672 | | | | 35,215 | |
Transfer agency fees and expenses | | | 32,378 | | | | 29,553 | | | | 31,138 | | | | 42,476 | |
Distribution (12b-1) fees — Class M Only | | | 30,274 | | | | 5,167 | | | | 6,270 | | | | 11,013 | |
Custody fees | | | 22,583 | | | | 10,491 | | | | — | | | | — | |
Trustees fees and expenses | | | 5,896 | | | | 3,008 | | | | — | | | | — | |
Other expenses | | | 20,556 | | | | 28,251 | | | | 2,582 | | | | 7,196 | |
| Total expenses before Adviser waiver | | | 1,990,528 | | | | 1,045,708 | | | | 128,340 | | | | 154,242 | |
Expenses waived by Adviser (See Note 4) | | | (190,217 | ) | | | (321,063 | ) | | | (92,598 | ) | | | (41,939 | ) |
| Net expenses before Adviser recoupment | | | 1,800,311 | | | | 724,645 | | | | 35,742 | | | | 112,303 | |
Expenses recouped by Adviser (See Note 4) | | | — | | | | 16,602 | | | | — | | | | — | |
| Total net expenses | | | 1,800,311 | | | | 741,247 | | | | 35,742 | | | | 112,303 | |
| Net investment gain (loss) | | | (1,121,202 | ) | | | (408,005 | ) | | | 364,878 | | | | 555,491 | |
| NET REALIZED AND UNREALIZED GAIN (LOSS): | | | | | | | | | | | | | | | | |
| Net realized gain (loss) on: | | | | | | | | | | | | | | | | |
Investments | | | | | | | | | | | | | | | | |
Affiliated issuers (See Note 9) | | | — | | | | — | | | | (15,147 | ) | | | 201,600 | |
Unaffiliated issuers | | | (6,272 | ) | | | (82,022 | ) | | | — | | | | — | |
Capital gain distributions from affiliated mutual funds | | | — | �� | | | — | | | | 27,190 | | | | 723,353 | |
Foreign currency translation | | | 35,447 | | | | — | | | | — | | | | — | |
Futures contracts | | | 23,151 | | | | — | | | | — | | | | — | |
Written options | | | 11,960,666 | | | | 4,888,515 | | | | — | | | | — | |
| Net change in unrealized appreciation (depreciation) on: | | | | | | | | | | | | | | | | |
Investments | | | (23,995 | ) | | | (8,822 | ) | | | 926,645 | | | | 3,210,240 | |
Foreign currency translation | | | (30,954 | ) | | | — | | | | — | | | | — | |
Written options | | | 193,550 | | | | 45,372 | | | | — | | | | — | |
| Net realized and unrealized gain | | | 12,151,593 | | | | 4,843,043 | | | | 938,688 | | | | 4,135,193 | |
| Net increase in net assets resulting from operations | | $ | 11,030,391 | | | $ | 4,435,038 | | | $ | 1,303,566 | | | $ | 4,690,684 | |
| | | | | | | | | | | | | | | | | |
| | | | |
| | The accompanying Notes to the Financial Statements are an integral part of these Financial Statements. | | |
| | | | | | | | | | | | | | | | |
| | Stone Ridge Funds | | | | | | Annual Report | | | | | | October 31, 2017 | | |
| | | | | | | | | | |
43
| | |
| Statement of Changes in Net Assets | | |
| | | | | | | | |
| | | STONE RIDGE HIGH YIELD REINSURANCE
RISK PREMIUM FUND | |
| | | Year Ended
October 31, 2017 | | | Year Ended
October 31, 2016 | |
| OPERATIONS: | | | | | | | | |
Net investment income | | $ | 77,094,509 | | | $ | 28,508,767 | |
| Net realized gain (loss) on: | | | | | | | | |
Investments | | | (809,346 | ) | | | (148,756 | ) |
Foreign currency translation | | | 28,815 | | | | 608 | |
Futures contracts | | | (553,034 | ) | | | (194,917 | ) |
Net increase from payments by affiliates | | | — | | | | 916 | |
| Net change in unrealized appreciation (depreciation) on: | | | | | | | | |
Investments | | | (137,243,537 | ) | | | 4,224,946 | |
Foreign currency translation | | | 1,484,138 | | | | 1,616 | |
Futures contracts | | | (469,638 | ) | | | 50,804 | |
Net increase (decrease) in net assets resulting from operations | | | (60,468,093 | ) | | | 32,443,984 | |
| | |
| DISTRIBUTIONS TO SHAREHOLDERS: | | | | | | | | |
From net investment income — Class I | | | (58,047,604 | ) | | | (23,323,990 | ) |
From net investment income — Class M | | | (9,933,495 | ) | | | (3,201,477 | ) |
From return of capital — Class I | | | (465,511 | ) | | | — | |
From return of capital — Class M | | | (94,533 | ) | | | — | |
Total distributions | | | (68,541,143 | ) | | | (26,525,467 | ) |
| | |
| CAPITAL SHARE TRANSACTIONS: | | | | | | | | |
Proceeds from shares sold — Class I | | | 150,479,799 | | | | 77,810,435 | |
Proceeds from shares sold — Class M | | | 77,925,919 | | | | 20,983,385 | |
Proceeds from shares issued in connection with acquisition — Class I(1) | | | 840,282,373 | | | | — | |
Proceeds from shares issued in connection with acquisition — Class M(1) | | | 191,342,870 | | | | — | |
Proceeds from shares issued to holders in reinvestment of dividends — Class I | | | 49,730,670 | | | | 21,153,305 | |
Proceeds from shares issued to holders in reinvestment of dividends — Class M | | | 7,868,999 | | | | 2,725,406 | |
Cost of shares redeemed — Class I | | | (455,848,475 | ) | | | (106,165,918 | ) |
Cost of shares redeemed — Class M | | | (133,480,039 | ) | | | (20,106,465 | ) |
Net increase (decrease) in net assets from capital share transactions | | | 728,302,116 | | | | (3,599,852 | ) |
| Total increase in net assets | | | 599,292,880 | | | | 2,318,665 | |
| | |
| NET ASSETS: | | | | | | | | |
Beginning of year | | | 497,980,383 | | | | 495,661,718 | |
| End of year | | $ | 1,097,273,263 | | | $ | 497,980,383 | |
| | | | | | | | | |
Accumulated net investment income (loss) | | $ | (13,304,595 | ) | | $ | 6,867,145 | |
| | (1) | | On December 5, 2016, the Stone Ridge High Yield Reinsurance Risk Premium Fund acquired the Stone Ridge Reinsurance Risk Premium Fund. (see Note 1 of the Notes to the Financial Statements). |
| | | | |
| | The accompanying Notes to the Financial Statements are an integral part of these Financial Statements. | | (Continued) |
| | | | | | | | | | | | | | | | |
| | Stone Ridge Funds | | | | | | Annual Report | | | | | | October 31, 2017 | | |
| | | | | | | | | | |
44
| | |
| Statement of Changes in Net Assets | | |
| | | | | | | | | | | | | | | | | | | | | | | | |
| | | STONE RIDGE U.S. LARGE CAP
VARIANCE RISK PREMIUM FUND | | | STONE RIDGE U.S. SMALL CAP
VARIANCE RISK PREMIUM FUND | | | STONE RIDGE U.S. VARIANCE RISK
PREMIUM MASTER FUND | |
| | | Year Ended
October 31, 2017 | | | Year Ended
October 31, 2016 | | | Year Ended
October 31, 2017 | | | Year Ended
October 31, 2016 | | | Year Ended
October 31, 2017 | | | Year Ended
October 31, 2016 | |
| OPERATIONS: | | | | | | | | | | | | | | | | | | | | | | | | |
Net investment loss | | $ | (2,997,793 | ) | | $ | (4,340,142 | ) | | $ | (1,210,148 | ) | | $ | (1,724,762 | ) | | $ | (156,589 | ) | | $ | (292,333 | ) |
| Net realized gain (loss) on: | | | | | | | | | | | | | | | | | | | | | | | | |
Investments | | | | | | | | | | | | | | | | | | | | | | | | |
Affiliated issuers | | | — | | | | — | | | | — | | | | — | | | | 1,449,814 | | | | (744,082 | ) |
Unaffiliated issuers | | | (82,320 | ) | | | 6,454,374 | | | | (29,917 | ) | | | 294,475 | | | | — | | | | — | |
Capital gain distributions from affiliated mutual funds | | | — | | | | — | | | | — | | | | — | | | | 7,269,248 | | | | 9,729,771 | |
Futures contracts | | | 30,963 | | | | (971,480 | ) | | | — | | | | 621,427 | | | | — | | | | — | |
Written options | | | 48,587,406 | | | | 17,292,983 | | | | 16,763,556 | | | | 1,743,245 | | | | — | | | | — | |
| Net change in unrealized appreciation (depreciation) on: | | | | | | | | | | | | | | | | | | | | | | | | |
Investments | | | (149,303 | ) | | | (8,426,075 | ) | | | (61,626 | ) | | | (511,777 | ) | | | 18,483,464 | | | | (3,715,638 | ) |
Written options | | | (202,996 | ) | | | 782,244 | | | | (311,706 | ) | | | 540,851 | | | | — | | | | — | |
Net increase in net assets resulting from operations | | | 45,185,957 | | | | 10,791,904 | | | | 15,150,159 | | | | 963,459 | | | | 27,045,937 | | | | 4,977,718 | |
| | | | | |
| DISTRIBUTIONS TO SHAREHOLDERS: | | | | | | | | | | | | | | | | | | | | | |
From net realized gain — Class I | | | (13,168,998 | ) | | | (15,614,510 | ) | | | (1,917,755 | ) | | | (4,348,340 | ) | | | (8,199,573 | ) | | | (2,007,627 | ) |
From net realized gain — Class M | | | (2,964,813 | ) | | | (4,927,839 | ) | | | (239,501 | ) | | | (660,816 | ) | | | (1,517,138 | ) | | | (568,167 | ) |
Total distributions | | | (16,133,811 | ) | | | (20,542,349 | ) | | | (2,157,256 | ) | | | (5,009,156 | ) | | | (9,716,711 | ) | | | (2,575,794 | ) |
| | | | | |
| CAPITAL SHARE TRANSACTIONS: | | | | | | | | | | | | | | | | | | | | | |
Proceeds from shares sold — Class I | | | 57,909,083 | | | | 81,097,278 | | | | 9,890,019 | | | | 31,870,861 | | | | 22,200,014 | | | | 51,898,948 | |
Proceeds from shares sold — Class M | | | 8,950,793 | | | | 9,996,933 | | | | 2,898,181 | | | | 1,726,539 | | | | 6,080,251 | | | | 8,400,547 | |
Proceeds from shares issued to holders in reinvestment of dividends — Class I | | | 5,164,323 | | | | 6,026,413 | | | | 608,714 | | | | 1,486,034 | | | | 3,909,409 | | | | 929,028 | |
Proceeds from shares issued to holders in reinvestment of dividends — Class M | | | 2,720,682 | | | | 4,579,685 | | | | 219,428 | | | | 590,198 | | | | 1,372,784 | | | | 535,172 | |
Cost of shares redeemed — Class I | | | (97,251,743 | ) | | | (54,493,249 | ) | | | (25,025,715 | ) | | | (28,363,904 | ) | | | (30,471,282 | ) | | | (19,652,871 | ) |
Cost of shares redeemed — Class M | | | (32,982,450 | ) | | | (36,981,475 | ) | | | (3,329,890 | ) | | | (5,269,841 | ) | | | (4,570,557 | ) | | | (29,540,300 | ) |
Net increase (decrease) in net assets from capital share transactions | | | (55,489,312 | ) | | | 10,225,585 | | | | (14,739,263 | ) | | | 2,039,887 | | | | (1,479,381 | ) | | | 12,570,524 | |
| Total increase (decrease) in net assets | | | (26,437,166 | ) | | | 475,140 | | | | (1,746,360 | ) | | | (2,005,810 | ) | | | 15,849,845 | | | | 14,972,448 | |
| | | | | | |
| NET ASSETS: | | | | | | | | | | | | | | | | | | | | | | | | |
Beginning of year | | | 379,225,209 | | | | 378,750,069 | | | | 128,287,277 | | | | 130,293,087 | | | | 213,566,033 | | | | 198,593,585 | |
| End of year | | $ | 352,788,043 | | | $ | 379,225,209 | | | $ | 126,540,917 | | | $ | 128,287,277 | | | $ | 229,415,878 | | | $ | 213,566,033 | |
| | | | | | | | | | | | | | | | | | | | | | | | | |
Accumulated net investment income (loss) | | $ | — | | | $ | — | | | $ | — | | | $ | (1,397,509 | ) | | $ | 441,161 | | | $ | 663,366 | |
| | | | |
| | The accompanying Notes to the Financial Statements are an integral part of these Financial Statements. | | (Continued) |
| | | | | | | | | | | | | | | | |
| | Stone Ridge Funds | | | | | | Annual Report | | | | | | October 31, 2017 | | |
| | | | | | | | | | |
45
| | |
| Statement of Changes in Net Assets | | |
| | | | | | | | | | | | | | | | |
| | | STONE RIDGE INTERNATIONAL DEVELOPED
MARKETS VARIANCE RISK PREMIUM FUND | | | STONE RIDGE EMERGING MARKETS
VARIANCE RISK PREMIUM FUND | |
| | | Year Ended
October 31, 2017 | | | Year Ended October 31, 2016 | | | Year Ended October 31, 2017 | | | Year Ended October 31, 2016 | |
| OPERATIONS: | | | | | | | | | | | | | | | | |
Net investment loss | | $ | (1,121,202 | ) | | $ | (1,739,715 | ) | | $ | (408,005 | ) | | $ | (573,037 | ) |
| Net realized gain (loss) on: | | | | | | | | | | | | | | | | |
Investments | | | | | | | | | | | | | | | | |
Unaffiliated issuers | | | (6,272 | ) | | | (160,725 | ) | | | (82,022 | ) | | | (107,090 | ) |
Foreign currency translation | | | 35,447 | | | | (64,447 | ) | | | — | | | | — | |
Futures contracts | | | 23,151 | | | | 600,202 | | | | — | | | | 219,569 | |
Written options | | | 11,960,666 | | | | 263,232 | | | | 4,888,515 | | | | 1,581,651 | |
| Net change in unrealized appreciation (depreciation) on: | | | | | | | | | | | | | | | | |
Investments | | | (23,995 | ) | | | 86,314 | | | | (8,822 | ) | | | 40,941 | |
Foreign currency translation | | | (30,954 | ) | | | (7,911 | ) | | | — | | | | — | |
Written options | | | 193,550 | | | | (282,028 | ) | | | 45,372 | | | | 76,330 | |
Net increase (decrease) in net assets resulting from operations | | | 11,030,391 | | | | (1,305,078 | ) | | | 4,435,038 | | | | 1,238,364 | |
| | | | |
| DISTRIBUTIONS TO SHAREHOLDERS: | | | | | | | | | | | | | | | | |
From net realized gain — Class I | | | (278,188 | ) | | | (1,462,737 | ) | | | (1,222,935 | ) | | | — | |
From net realized gain — Class M | | | (69,955 | ) | | | (340,903 | ) | | | (339,458 | ) | | | — | |
Total distributions | | | (348,143 | ) | | | (1,803,640 | ) | | | (1,562,393 | ) | | | — | |
| | | | |
| CAPITAL SHARE TRANSACTIONS: | | | | | | | | | | | | | | | | |
Proceeds from shares sold — Class I | | | 5,729,365 | | | | 16,481,026 | | | | 3,411,243 | | | | 8,273,369 | |
Proceeds from shares sold — Class M | | | 1,013,969 | | | | 4,146,014 | | | | — | | | | 506,326 | |
Proceeds from shares issued to holders in reinvestment of dividends — Class I | | | 229,089 | | | | 1,200,937 | | | | — | | | | — | |
Proceeds from shares issued to holders in reinvestment of dividends — Class M | | | 68,082 | | | | 330,808 | | | | — | | | | — | |
Cost of shares redeemed — Class I | | | (14,929,636 | ) | | | (28,362,623 | ) | | | (40,474,288 | ) | | | (11,595,332 | ) |
Cost of shares redeemed — Class M | | | (2,942,784 | ) | | | (5,404,734 | ) | | | (559,583 | ) | | | (134,847 | ) |
Net decrease in net assets from capital share transactions | | | (10,831,915 | ) | | | (11,608,572 | ) | | | (37,622,628 | ) | | | (2,950,484 | ) |
| Total decrease in net assets | | | (149,667 | ) | | | (14,717,290 | ) | | | (34,749,983 | ) | | | (1,712,120 | ) |
| | | | |
| NET ASSETS: | | | | | | | | | | | | | | | | |
Beginning of year | | | 96,813,728 | | | | 111,531,018 | | | | 48,704,391 | | | | 50,416,511 | |
| End of year | | $ | 96,664,061 | | | $ | 96,813,728 | | | $ | 13,954,408 | | | $ | 48,704,391 | |
| | | | | | | | | | | | | | | | | |
Accumulated net investment loss | | $ | — | | | $ | (1,378,511 | ) | | $ | — | | | $ | (478,377 | ) |
| | | | |
| | The accompanying Notes to the Financial Statements are an integral part of these Financial Statements. | | (Continued) |
| | | | | | | | | | | | | | | | |
| | Stone Ridge Funds | | | | | | Annual Report | | | | | | October 31, 2017 | | |
| | | | | | | | | | |
46
| | |
| Statement of Changes in Net Assets | | |
| | | | | | | | | | | | | | | | |
| | | STONE RIDGE INTERNATIONAL VARIANCE
RISK PREMIUM MASTER FUND | | | STONE RIDGE GLOBAL EQUITY VARIANCE
RISK PREMIUM MASTER FUND | |
| | | Year Ended
October 31, 2017 | | | Year Ended October 31, 2016 | | | Year Ended
October 31, 2017 | | | Year Ended
October 31, 2016 | |
| OPERATIONS: | | | | | | | | | | | | | | | | |
Net investment gain (loss) | | $ | 364,878 | | | $ | (73,716 | ) | | $ | 555,491 | | | $ | (114,798 | ) |
| Net realized gain (loss) on: | | | | | | | | | | | | | | | | |
Investments | | | | | | | | | | | | | | | | |
Affiliated issuers | | | (15,147 | ) | | | (2,127,816 | ) | | | 201,600 | | | | (1,045,944 | ) |
Capital gain distributions from affiliated mutual funds | | | 27,190 | | | | 313,592 | | | | 723,353 | | | | 1,437,957 | |
| Net change in unrealized appreciation (depreciation) on: | | | | | | | | | | | | | | | | |
Investments | | | 926,645 | | | | 1,095,012 | | | | 3,210,240 | | | | (77,172 | ) |
Net increase (decrease) in net assets resulting from operations | | | 1,303,566 | | | | (792,928 | ) | | | 4,690,684 | | | | 200,043 | |
| | | | |
| DISTRIBUTIONS TO SHAREHOLDERS: | | | | | | | | | | | | | | | | |
From net investment income — Class I | | | (332,087 | ) | | | — | | | | — | | | | — | |
From net investment income — Class M | | | (174,527 | ) | | | — | | | | — | | | | — | |
From net realized gain — Class I | | | — | | | | — | | | | (838,883 | ) | | | (561,171 | ) |
From net realized gain — Class M | | | — | | | | — | | | | (177,433 | ) | | | (138,208 | ) |
Total distributions | | | (506,614 | ) | | | — | | | | (1,016,316 | ) | | | (699,379 | ) |
| | | | |
| CAPITAL SHARE TRANSACTIONS: | | | | | | | | | | | | | | | | |
Proceeds from shares sold — Class I | | | 677,544 | | | | 6,940,582 | | | | 6,302,390 | | | | 7,190,034 | |
Proceeds from shares sold — Class M | | | — | | | | 318,715 | | | | 360,200 | | | | 1,494,980 | |
Proceeds from shares issued to holders in reinvestment of dividends — Class I | | | — | | | | — | | | | 808,878 | | | | 542,148 | |
Proceeds from shares issued to holders in reinvestment of dividends — Class M | | | — | | | | — | | | | 158,092 | | | | 128,956 | |
Cost of shares redeemed — Class I | | | (1,177,779 | ) | | | (8,523,579 | ) | | | (11,316,724 | ) | | | (12,839,782 | ) |
Cost of shares redeemed — Class M | | | (456,995 | ) | | | (15,585,784 | ) | | | (1,052,174 | ) | | | (3,615,053 | ) |
Net decrease in net assets from capital share transactions | | | (957,230 | ) | | | (16,850,066 | ) | | | (4,739,338 | ) | | | (7,098,717 | ) |
| Total decrease in net assets | | | (160,278 | ) | | | (17,642,994 | ) | | | (1,064,970 | ) | | | (7,598,053 | ) |
| | | | |
| NET ASSETS: | | | | | | | | | | | | | | | | |
Beginning of year | | | 11,787,140 | | | | 29,430,134 | | | | 40,764,911 | | | | 48,362,964 | |
| End of year | | $ | 11,626,862 | | | $ | 11,787,140 | | | $ | 39,699,941 | | | $ | 40,764,911 | |
| | | | | | | | | | | | | | | | | |
Accumulated net investment income (loss) | | $ | (174,746 | ) | | $ | (18,741 | ) | | $ | 465,325 | | | $ | (86,052 | ) |
| | | | |
| | The accompanying Notes to the Financial Statements are an integral part of these Financial Statements. | | |
| | | | | | | | | | | | | | | | |
| | Stone Ridge Funds | | | | | | Annual Report | | | | | | October 31, 2017 | | |
| | | | | | | | | | |
47
| | |
| Statement of Cash Flows | | For the Year Ended October 31, 2017 |
| | | | |
| | | STONE RIDGE
HIGH YIELD
REINSURANCE
RISK PREMIUM
FUND | |
| CASH FLOWS FROM OPERATING ACTIVITIES | | | | |
Net decrease in net assets resulting from operations | | $ | (60,468,093 | ) |
Adjustments to reconcile net decrease in net assets resulting from operations to net cash provided by operating activities: | | | | |
Net realized and unrealized loss: | | | 136,570,847 | |
Amortization and accretion of premium and discount | | | (501,024 | ) |
| Changes in assets and liabilities: | | | | |
Payable for investment securities purchased | | | 2,074,000 | |
Payable to Adviser | | | 1,997,208 | |
Other accrued expenses | | | 597,012 | |
Accrued distribution fees | | | 52,657 | |
Payable to Custodian | | | 19,650 | |
Payable to Trustees | | | 12,417 | |
Payable for Chief Compliance Officer compensation | | | 5,712 | |
Receivable from affiliates | | | 916 | |
Interest payable | | | (34 | ) |
Foreign currency | | | (624,545 | ) |
Dividends receivable | | | (14,833 | ) |
Other assets | | | 6,162 | |
Collateral held at broker | | | (319,946 | ) |
Interest receivable | | | (12,154,794 | ) |
Receivable for investments sold | | | 3,281,468 | |
Purchases of investments | | | (325,031,010 | ) |
Proceeds from sale of investments | | | 607,818,170 | |
Net purchases and sales of short-term investments | | | 16,846,538 | |
Net cash provided by operating activities | | | 370,168,479 | |
| CASH FLOWS FROM FINANCING ACTIVITIES: | | | | |
Proceeds from shares issued | | | 227,947,433 | |
Payment on shares redeemed | | | (589,174,438 | ) |
Cash distributions to shareholders | | | (10,941,474 | ) |
Loan withdrawals | | | 270,000,000 | |
Loan paydowns | | | (268,000,000 | ) |
Net cash used in financing activities | | | (370,168,479 | ) |
Net increase in cash | | | — | |
Cash, beginning of year | | | — | |
Cash, end of year | | $ | — | |
| | | | | |
| SUPPLEMENTAL DISCLOSURES OF CASH FLOW AND NON-CASH INFORMATION: | | | | |
Reinvested distributions | | $ | 57,599,669 | |
Assets received in acquisition(1) | | $ | 1,031,625,243 | |
Cash paid for interest on loans outstanding | | $ | 1,216,881 | |
| | (1) | | On December 5, 2016, the Stone Ridge High Yield Reinsurance Risk Premium Fund acquired the Stone Ridge Reinsurance Risk Premium Fund. (see Note 1 of the Notes to the Financial Statements). |
| | | | |
| | The accompanying Notes to the Financial Statements are an integral part of these Financial Statements. | | |
| | | | | | | | | | | | | | | | |
| | Stone Ridge Funds | | | | | | Annual Report | | | | | | October 31, 2017 | | |
| | | | | | | | | | |
48
[Intentionally Left Blank]
| | |
| Financial Highlights | | October 31, 2017 |
| | | | | | | | | | | | | | | | |
| | | PER SHARE DATA: | |
| | | Income (loss) from Investment Operations | |
| | |
Net Asset
Value,
Beginning
of Period | | | Net
Investment
Income(2) | | | Net Realized
and
Unrealized Gains
(Losses) | | | Total from
Investment
Operations | |
| STONE RIDGE HIGH YIELD REINSURANCE RISK PREMIUM FUND—CLASS I | | | | | | | | | | | | | | | | |
| Year Ended October 31, 2017 | | $ | 10.50 | | | | 0.67 | | | | (1.13 | ) | | | (0.46 | ) |
| Year Ended October 31, 2016 | | $ | 10.38 | | | | 0.58 | | | | 0.09 | | | | 0.67 | |
| Year Ended October 31, 2015 | | $ | 10.75 | | | | 0.59 | | | | (0.08 | ) | | | 0.51 | |
| Year Ended October 31, 2014 | | $ | 10.41 | | | | 0.58 | | | | 0.37 | | | | 0.95 | |
Period Ended October 31, 2013(1) | | $ | 10.00 | | | | 0.20 | | | | 0.35 | | | | 0.55 | |
| STONE RIDGE HIGH YIELD REINSURANCE RISK PREMIUM FUND—CLASS M | | | | | | | | | | | | | | | | |
| Year Ended October 31, 2017 | | $ | 10.49 | | | | 0.66 | | | | (1.13 | ) | | | (0.47 | ) |
| Year Ended October 31, 2016 | | $ | 10.38 | | | | 0.57 | | | | 0.08 | | | | 0.65 | |
| Year Ended October 31, 2015 | | $ | 10.75 | | | | 0.55 | | | | (0.06 | ) | | | 0.49 | |
| Year Ended October 31, 2014 | | $ | 10.41 | | | | 0.56 | | | | 0.37 | | | | 0.93 | |
Period Ended October 31, 2013(1) | | $ | 10.00 | | | | 0.18 | | | | 0.36 | | | | 0.54 | |
| | (1) | | The Fund commenced operations on February 1, 2013. |
| | (2) | | Net investment income per share has been calculated based on average shares outstanding during the period. |
| | (5) | | Total return represents the rate that an investor would have earned (or lost) on an investment in the Fund (assuming the reinvestment of all dividends and distributions). |
| | (6) | | Includes borrowing and investment-related expenses not covered by the Funds’ expense limitation agreement. See Note 4. |
| | (7) | | Includes less than $0.01 per share of return of capital. |
| | | | |
| | The accompanying Notes to the Financial Statements are an integral part of these Financial Statements. | | |
| | | | | | | | | | | | | | | | |
| | Stone Ridge Funds | | | | | | Annual Report | | | | | | October 31, 2017 | | |
| | | | | | | | | | |
50
| | |
| Financial Highlights | | October 31, 2017 |
| | | | | | | | | | | | | | | | | | | | | | | | | | | | | | | | | | | | | | | | | | | | | | |
| | | SUPPLEMENT DATA AND RATIOS: | |
| Distributions to Shareholders | | | | | | | | | | | | | | | | | | | | | | | | | | | | |
Net
Investment
Income | | | Net
Realized
Gains | | | Total
Distributions | | | Net
Asset
Value,
End of
Period | | | Total
Return(5) | | | Net
Assets,
End of
Period
(000’s) | | | Ratio of
Expenses to
Average
Net Assets
(Before Expense
Reimbursement/
Recoupment) | | | Ratio of
Expenses to
Average
Net Assets
(After Expense
Reimbursement/
Recoupment) | | | Ratio of Net
Investment Income
to Average
Net Assets
(Before Expense
Reimbursement/
Recoupment) | | | Ratio of Net
Investment Income
to Average Net
Assets
(After Expense
Reimbursement/
Recoupment) | | | Portfolio
Turnover Rate | | | | |
| | | | | | | | | | | | | | | | | | | | | | | | | | | | | | | | | | | | | | | | | | | | | | |
| | (0.90 | ) | | | — | | | | (0.90 | )(7) | | $ | 9.14 | | | | (4.85 | %) | | $ | 910,525 | | | | 1.81 | %(6) | | | 1.77 | %(6) | | | 6.78 | %(6) | | | 6.82 | %(6) | | | 29.74 | % | | | | |
| | (0.55 | ) | | | — | | | | (0.55 | ) | | $ | 10.50 | | | | 6.82 | % | | $ | 434,269 | | | | 1.68 | %(6) | | | N/A | | | | 5.70 | %(6) | | | N/A | | | | 20.32 | % | | | | |
| | (0.88 | ) | | | — | | | | (0.88 | ) | | $ | 10.38 | | | | 5.06 | % | | $ | 436,523 | | | | 1.69 | % | | | N/A | | | | 5.76 | % | | | N/A | | | | 11.64 | % | | | | |
| | (0.61 | ) | | | — | | | | (0.61 | ) | | $ | 10.75 | | | | 9.44 | % | | $ | 259,515 | | | | 1.78 | % | | | 1.80 | % | | | 5.58 | % | | | 5.56 | % | | | 15.79 | % | | | | |
| | (0.14 | ) | | | — | | | | (0.14 | ) | | $ | 10.41 | | | | 5.58 | %(3) | | $ | 145,995 | | | | 1.95 | %(4) | | | 1.94 | %(4) | | | 2.66 | %(4) | | | 2.67 | %(4) | | | 12.82 | %(3) | | | | |
| | | | | | | | | | | | | | | | | | | | | | | | | | | | | | | | | | | | | | | | | | | | | | |
| | (0.89 | ) | | | — | | | | (0.89 | )(7) | | $ | 9.13 | | | | (5.01 | %) | | $ | 186,748 | | | | 1.96 | %(6) | | | 1.91 | %(6) | | | 6.60 | %(6) | | | 6.65 | %(6) | | | 29.74 | % | | | | |
| | (0.54 | ) | | | — | | | | (0.54 | ) | | $ | 10.49 | | | | 6.60 | % | | $ | 63,712 | | | | 1.83 | %(6) | | | N/A | | | | 5.60 | %(6) | | | N/A | | | | 20.32 | % | | | | |
| | (0.86 | ) | | | — | | | | (0.86 | ) | | $ | 10.38 | | | | 4.90 | % | | $ | 59,139 | | | | 1.84 | % | | | N/A | | | | 5.46 | % | | | N/A | | | | 11.64 | % | | | | |
| | (0.59 | ) | | | — | | | | (0.59 | ) | | $ | 10.75 | | | | 9.33 | % | | $ | 72,995 | | | | 1.93 | % | | | 1.95 | % | | | 5.42 | % | | | 5.40 | % | | | 15.79 | % | | | | |
| | (0.13 | ) | | | — | | | | (0.13 | ) | | $ | 10.41 | | | | 5.43 | %(3) | | $ | 61,234 | | | | 2.11 | %(4) | | | 2.10 | %(4) | | | 2.47 | %(4) | | | 2.48 | %(4) | | | 12.82 | %(3) | | | | |
| | | | |
| | The accompanying Notes to the Financial Statements are an integral part of these Financial Statements. | | (Continued) |
| | | | | | | | | | | | | | | | |
| | Stone Ridge Funds | | | | | | Annual Report | | | | | | October 31, 2017 | | |
| | | | | | | | | | |
51
| | |
| Financial Highlights | | October 31, 2017 |
| | | | | | | | | | | | | | | | |
| | | PER SHARE DATA: | |
| | | Income (loss) from Investment Operations | |
| | |
Net Asset
Value,
Beginning
of Period | | | Net
Investment
Income
(Loss)(3) | | | Net Realized
and
Unrealized Gains | | | Total from
Investment
Operations | |
| STONE RIDGE U.S. LARGE CAP VARIANCE RISK PREMIUM FUND—CLASS I | | | | | | | | | | | | | | | | |
| Year Ended October 31, 2017 | | $ | 10.58 | | | | (0.08 | ) | | | 1.45 | | | | 1.37 | |
| Year Ended October 31, 2016 | | $ | 10.89 | | | | (0.12 | ) | | | 0.40 | | | | 0.28 | |
| Year Ended October 31, 2015 | | $ | 10.50 | | | | (0.14 | ) | | | 0.79 | | | | 0.65 | |
| Year Ended October 31, 2014 | | $ | 10.48 | | | | (0.14 | ) | | | 0.94 | | | | 0.80 | |
Period Ended October 31, 2013(1) | | $ | 10.00 | | | | (0.07 | ) | | | 0.80 | | | | 0.73 | |
| STONE RIDGE U.S. LARGE CAP VARIANCE RISK PREMIUM FUND—CLASS M | | | | | | | | | | | | | | | | |
| Year Ended October 31, 2017 | | $ | 10.52 | | | | (0.10 | ) | | | 1.44 | | | | 1.34 | |
| Year Ended October 31, 2016 | | $ | 10.84 | | | | (0.13 | ) | | | 0.40 | | | | 0.27 | |
| Year Ended October 31, 2015 | | $ | 10.47 | | | | (0.15 | ) | | | 0.78 | | | | 0.63 | |
| Year Ended October 31, 2014 | | $ | 10.47 | | | | (0.15 | ) | | | 0.93 | | | | 0.78 | |
Period Ended October 31, 2013(1) | | $ | 10.00 | | | | (0.07 | ) | | | 0.79 | | | | 0.72 | |
| STONE RIDGE U.S. SMALL CAP VARIANCE RISK PREMIUM FUND—CLASS I | | | | | | | | | | | | | | | | |
| Year Ended October 31, 2017 | | $ | 10.09 | | | | (0.10 | ) | | | 1.34 | | | | 1.24 | |
| Year Ended October 31, 2016 | | $ | 10.46 | | | | (0.13 | ) | | | 0.16 | | | | 0.03 | |
| Year Ended October 31, 2015 | | $ | 10.04 | | | | (0.15 | ) | | | 0.67 | | | | 0.52 | |
| Year Ended October 31, 2014 | | $ | 10.65 | | | | (0.16 | ) | | | 0.45 | | | | 0.29 | |
Period Ended October 31, 2013(1) | | $ | 10.00 | | | | (0.09 | ) | | | 0.99 | | | | 0.90 | |
| STONE RIDGE U.S. SMALL CAP VARIANCE RISK PREMIUM FUND—CLASS M | | | | | | | | | | | | | | | | |
| Year Ended October 31, 2017 | | $ | 10.03 | | | | (0.12 | ) | | | 1.34 | | | | 1.22 | |
| Year Ended October 31, 2016 | | $ | 10.42 | | | | (0.14 | ) | | | 0.15 | | | | 0.01 | |
| Year Ended October 31, 2015 | | $ | 10.01 | | | | (0.17 | ) | | | 0.68 | | | | 0.51 | |
| Year Ended October 31, 2014 | | $ | 10.64 | | | | (0.17 | ) | | | 0.44 | | | | 0.27 | |
Period Ended October 31, 2013(1) | | $ | 10.00 | | | | (0.10 | ) | | | 0.99 | | | | 0.89 | |
| STONE RIDGE U.S. VARIANCE RISK PREMIUM MASTER FUND—CLASS I | | | | | | | | | | | | | | | | |
| Year Ended October 31, 2017 | | $ | 10.74 | | | | (0.00 | )(4) | | | 1.35 | (4) | | | 1.35 | (4) |
| Year Ended October 31, 2016 | | $ | 10.69 | | | | (0.01 | )(4) | | | 0.20 | (4) | | | 0.19 | (4) |
| Year Ended October 31, 2015 | | $ | 10.50 | | | | 0.10 | (4) | | | 0.48 | (4) | | | 0.58 | (4) |
| Year Ended October 31, 2014 | | $ | 10.40 | | | | 0.51 | (4) | | | 0.10 | (4) | | | 0.61 | (4) |
Period Ended October 31, 2013(2) | | $ | 10.00 | | | | 0.24 | (4) | | | 0.39 | (4) | | | 0.63 | (4) |
| STONE RIDGE U.S. VARIANCE RISK PREMIUM MASTER FUND—CLASS M | | | | | | | | | | | | | | | | |
| Year Ended October 31, 2017 | | $ | 10.71 | | | | (0.02 | )(4) | | | 1.34 | (4) | | | 1.32 | (4) |
| Year Ended October 31, 2016 | | $ | 10.67 | | | | (0.03 | )(4) | | | 0.21 | (4) | | | 0.18 | (4) |
| Year Ended October 31, 2015 | | $ | 10.50 | | | | 0.10 | (4) | | | 0.46 | (4) | | | 0.56 | (4) |
| Year Ended October 31, 2014 | | $ | 10.40 | | | | 0.51 | (4) | | | 0.09 | (4) | | | 0.60 | (4) |
Period Ended October 31, 2013(2) | | $ | 10.00 | | | | 0.24 | (4) | | | 0.39 | (4) | | | 0.63 | (4) |
| | (1) | | The Fund commenced operations on May 1, 2013. |
| | (2) | | The Fund commenced operations on May 22, 2013. |
| | (3) | | Net investment income (loss) per share has been calculated based on average shares outstanding during the period. |
| | (4) | | Per share amounts only include income and expenses of the Stone Ridge U.S. Variance Risk Premium Master Fund which are shown on the Fund’s Statement of Operations. Amounts do not include the Fund’s proportionate share of the income and expenses of the underlying investor funds. |
| | (7) | | Total return represents the rate that an investor would have earned (or lost) on an investment in the Fund (assuming the reinvestment of all dividends and distributions). |
| | (8) | | Includes borrowing and investment-related expenses not covered by the Funds’ expense limitation agreement. See Note 4. |
| | | | |
| | The accompanying Notes to the Financial Statements are an integral part of these Financial Statements. | | |
| | | | | | | | | | | | | | | | |
| | Stone Ridge Funds | | | | | | Annual Report | | | | | | October 31, 2017 | | |
| | | | | | | | | | |
52
| | |
| Financial Highlights | | October 31, 2017 |
| | | | | | | | | | | | | | | | | | | | | | | | | | | | | | | | | | | | | | | | | | | | | | | | | | |
| | | SUPPLEMENT DATA AND RATIOS: | |
| Distributions to Shareholders | | | | | | | | | | | | | | | | | | | | | | | | | | | | |
Net
Investment
Income | | | Net
Realized
Gains | | | Return
of Capital | | | Total
Distributions | | | Net
Asset
Value,
End of
Period | | | Total
Return(7) | | | Net
Assets, End of
Period
(000’s) | | | Ratio of
Expenses to
Average
Net Assets
(Before Expense
Reimbursement/ Recoupment) | | | Ratio of
Expenses to
Average
Net Assets
(After Expense
Reimbursement/
Recoupment) | | | Ratio of Net
Investment Income
(Loss) to Average
Net Assets
(Before Expense
Reimbursement/
Recoupment) | | | Ratio of Net
Investment Income
(Loss) to Average
Net Assets
(After Expense
Reimbursement/
Recoupment) | | | Portfolio
Turnover Rate | | | | |
| | | | | | | | | | | | | | | | | | | | | | | | | | | | | | | | | | | | | | | | | | | | | | | | | | |
| | — | | | | (0.46 | ) | | | — | | | | (0.46 | ) | | $ | 11.49 | | | | 13.34 | % | | $ | 301,447 | | | | 1.55 | % | | | 1.53 | % | | | (0.84 | %) | | | (0.82 | %) | | | 0.00 | % | | | | |
| | — | | | | (0.59 | ) | | | — | | | | (0.59 | ) | | $ | 10.58 | | | | 2.75 | % | | $ | 311,317 | | | | 1.46 | %(8) | | | N/A | | | | (1.12 | %)(8) | | | N/A | | | | 6.12 | % | | | | |
| | — | | | | (0.26 | ) | | | — | | | | (0.26 | ) | | $ | 10.89 | | | | 6.33 | % | | $ | 285,403 | | | | 1.54 | % | | | N/A | | | | (1.28 | %) | | | N/A | | | | 10.14 | % | | | | |
| | — | | | | (0.78 | ) | | | — | | | | (0.78 | ) | | $ | 10.50 | | | | 7.95 | % | | $ | 305,504 | | | | 1.62 | % | | | 1.64 | % | | | (1.27 | %) | | | (1.29 | %) | | | 97.63 | % | | | | |
| | — | | | | (0.25 | ) | | | — | | | | (0.25 | ) | | $ | 10.48 | | | | 7.35 | %(5) | | $ | 264,883 | | | | 1.65 | %(6) | | | 1.59 | %(6) | | | (1.42 | %)(6) | | | (1.36 | %)(6) | | | 56.76 | %(5) | | | | |
| | | | | | | | | | | | | | | | | | | | | | | | | | | | | | | | | | | | | | | | | | | | | | | | | | |
| | — | | | | (0.46 | ) | | | — | | | | (0.46 | ) | | $ | 11.40 | | | | 13.13 | % | | $ | 51,341 | | | | 1.68 | % | | | 1.67 | % | | | (0.98 | %) | | | (0.97 | %) | | | 0.00 | % | | | | |
| | — | | | | (0.59 | ) | | | — | | | | (0.59 | ) | | $ | 10.52 | | | | 2.67 | % | | $ | 67,909 | | | | 1.61 | %(8) | | | N/A | | | | (1.27 | %)(8) | | | N/A | | | | 6.12 | % | | | | |
| | — | | | | (0.26 | ) | | | — | | | | (0.26 | ) | | $ | 10.84 | | | | 6.15 | % | | $ | 93,347 | | | | 1.69 | % | | | N/A | | | | (1.43 | %) | | | N/A | | | | 10.14 | % | | | | |
| | — | | | | (0.78 | ) | | | — | | | | (0.78 | ) | | $ | 10.47 | | | | 7.76 | % | | $ | 113,345 | | | | 1.77 | % | | | 1.79 | % | | | (1.42 | %) | | | (1.44 | %) | | | 97.63 | % | | | | |
| | — | | | | (0.25 | ) | | | — | | | | (0.25 | ) | | $ | 10.47 | | | | 7.25 | %(5) | | $ | 97,381 | | | | 1.80 | %(6) | | | 1.74 | %(6) | | | (1.57 | %)(6) | | | (1.51 | %)(6) | | | 56.76 | %(5) | | | | |
| | | | | | | | | | | | | | | | | | | | | | | | | | | | | | | | | | | | | | | | | | | | | | | | | | |
| | — | | | | (0.17 | ) | | | — | | | | (0.17 | ) | | $ | 11.16 | | | | 12.39 | % | | $ | 112,063 | | | | 1.77 | % | | | 1.64 | % | | | (1.05 | %) | | | (0.92 | %) | | | 0.00 | % | | | | |
| | — | | | | (0.40 | ) | | | — | | | | (0.40 | ) | | $ | 10.09 | | | | 0.31 | % | | $ | 114,980 | | | | 1.55 | %(8) | | | 1.56 | %(8) | | | (1.28 | %)(8) | | | (1.29 | %)(8) | | | 0.00 | % | | | | |
| | — | | | | (0.10 | ) | | | — | | | | (0.10 | ) | | $ | 10.46 | | | | 5.23 | % | | $ | 113,269 | | | | 1.56 | % | | | 1.55 | % | | | (1.50 | %) | | | (1.49 | %) | | | 0.00 | % | | | | |
| | — | | | | (0.75 | ) | | | (0.15 | ) | | | (0.90 | ) | | $ | 10.04 | | | | 2.85 | % | | $ | 115,717 | | | | 1.60 | % | | | 1.62 | % | | | (1.54 | %) | | | (1.56 | %) | | | 34.92 | % | | | | |
| | — | | | | (0.25 | ) | | | — | | | | (0.25 | ) | | $ | 10.65 | | | | 9.09 | %(5) | | $ | 100,579 | | | | 1.80 | %(6) | | | 1.75 | %(6) | | | (1.76 | %)(6) | | | (1.71 | %)(6) | | | 33.66 | %(5) | | | | |
| | | | | | | | | | | | | | | | | | | | | | | | | | | | | | | | | | | | | | | | | | | | | | | | | | |
| | — | | | | (0.17 | ) | | | — | | | | (0.17 | ) | | $ | 11.08 | | | | 12.26 | % | | $ | 14,478 | | | | 1.93 | % | | | 1.81 | % | | | (1.21 | %) | | | (1.09 | %) | | | 0.00 | % | | | | |
| | — | | | | (0.40 | ) | | | — | | | | (0.40 | ) | | $ | 10.03 | | | | 0.11 | % | | $ | 13,307 | | | | 1.70 | %(8) | | | 1.71 | %(8) | | | (1.44 | %)(8) | | | (1.45 | %)(8) | | | 0.00 | % | | | | |
| | — | | | | (0.10 | ) | | | — | | | | (0.10 | ) | | $ | 10.42 | | | | 5.15 | % | | $ | 17,024 | | | | 1.71 | % | | | 1.70 | % | | | (1.65 | %) | | | (1.64 | %) | | | 0.00 | % | | | | |
| | — | | | | (0.75 | ) | | | (0.15 | ) | | | (0.90 | ) | | $ | 10.01 | | | | 2.65 | % | | $ | 13,925 | | | | 1.75 | % | | | 1.77 | % | | | (1.69 | %) | | | (1.71 | %) | | | 34.92 | % | | | | |
| | — | | | | (0.25 | ) | | | — | | | | (0.25 | ) | | $ | 10.64 | | | | 8.99 | %(5) | | $ | 13,246 | | | | 1.95 | %(6) | | | 1.90 | %(6) | | | (1.91 | %)(6) | | | (1.86 | %)(6) | | | 33.66 | %(5) | | | | |
| | | | | | | | | | | | | | | | | | | | | | | | | | | | | | | | | | | | | | | | | | | | | | | | | | |
| | — | | | | (0.49 | ) | | | — | | | | (0.49 | ) | | $ | 11.60 | | | | 12.94 | % | | $ | 191,063 | | | | 0.08 | % | | | N/A | | | | (0.05 | %) | | | N/A | | | | 11.30 | % | | | | |
| | — | | | | (0.14 | ) | | | — | | | | (0.14 | ) | | $ | 10.74 | | | | 1.81 | % | | $ | 180,870 | | | | 0.11 | % | | | N/A | | | | (0.11 | %) | | | N/A | | | | 16.43 | % | | | | |
| | (0.10 | ) | | | (0.29 | ) | | | — | | | | (0.39 | ) | | $ | 10.69 | | | | 5.81 | % | | $ | 145,606 | | | | 0.13 | % | | | N/A | | | | 0.98 | % | | | N/A | | | | 16.83 | % | | | | |
| | (0.51 | ) | | | — | | | | — | | | | (0.51 | ) | | $ | 10.50 | | | | 6.02 | % | | $ | 164,687 | | | | 0.13 | % | | | N/A | | | | 4.91 | % | | | N/A | | | | 6.46 | % | | | | |
| | (0.23 | ) | | | — | | | | — | | | | (0.23 | ) | | $ | 10.40 | | | | 6.42 | %(5) | | $ | 146,296 | | | | 0.26 | %(6) | | | N/A | | | | 5.29 | %(6) | | | N/A | | | | 0.62 | %(5) | | | | |
| | | | | | | | | | | | | | | | | | | | | | | | | | | | | | | | | | | | | | | | | | | | | | | | | | |
| | — | | | | (0.49 | ) | | | — | | | | (0.49 | ) | | $ | 11.54 | | | | 12.69 | % | | $ | 38,353 | | | | 0.23 | % | | | N/A | | | | (0.20 | %) | | | N/A | | | | 11.30 | % | | | | |
| | — | | | | (0.14 | ) | | | — | | | | (0.14 | ) | | $ | 10.71 | | | | 1.72 | % | | $ | 32,696 | | | | 0.26 | % | | | N/A | | | | (0.26 | %) | | | N/A | | | | 16.43 | % | | | | |
| | (0.10 | ) | | | (0.29 | ) | | | — | | | | (0.39 | ) | | $ | 10.67 | | | | 5.57 | % | | $ | 52,988 | | | | 0.27 | % | | | N/A | | | | 1.02 | % | | | N/A | | | | 16.83 | % | | | | |
| | (0.50 | ) | | | — | | | | — | | | | (0.50 | ) | | $ | 10.50 | | | | 5.88 | % | | $ | 108,003 | | | | 0.28 | % | | | N/A | | | | 4.82 | % | | | N/A | | | | 6.46 | % | | | | |
| | (0.23 | ) | | | — | | | | — | | | | (0.23 | ) | | $ | 10.40 | | | | 6.36 | %(5) | | $ | 80,018 | | | | 0.41 | %(6) | | | N/A | | | | 5.37 | %(6) | | | N/A | | | | 0.62 | %(5) | | | | |
| | | | |
| | The accompanying Notes to the Financial Statements are an integral part of these Financial Statements. | | (Continued) |
| | | | | | | | | | | | | | | | |
| | Stone Ridge Funds | | | | | | Annual Report | | | | | | October 31, 2017 | | |
| | | | | | | | | | |
53
| | |
| Financial Highlights | | October 31, 2017 |
| | | | | | | | | | | | | | | | |
| | | PER SHARE DATA: | |
| | | Income (Loss) from Investment Operations | |
| | |
Net Asset
Value,
Beginning
of Period | | | Net
Investment
Income
(Loss)(3) | | | Net Realized
and
Unrealized Gains
(Losses) | | | Total from
Investment
Operations | |
| STONE RIDGE INTERNATIONAL DEVELOPED MARKETS VARIANCE RISK PREMIUM FUND—CLASS I | | | | | | | | | | | | | | | | |
| Year Ended October 31, 2017 | | $ | 9.68 | | | | (0.11 | ) | | | 1.30 | | | | 1.19 | |
| Year Ended October 31, 2016 | | $ | 9.93 | | | | (0.16 | ) | | | 0.07 | | | | (0.09 | ) |
| Year Ended October 31, 2015 | | $ | 9.70 | | | | (0.19 | ) | | | 0.52 | | | | 0.33 | |
Period Ended October 31, 2014(1) | | $ | 10.00 | | | | (0.12 | ) | | | 0.17 | | | | 0.05 | (6) |
| STONE RIDGE INTERNATIONAL DEVELOPED MARKETS VARIANCE RISK PREMIUM FUND—CLASS M | | | | | | | | | | | | | | | | |
| Year Ended October 31, 2017 | | $ | 9.65 | | | | (0.13 | ) | | | 1.29 | | | | 1.16 | |
| Year Ended October 31, 2016 | | $ | 9.91 | | | | (0.17 | ) | | | 0.07 | | | | (0.10 | ) |
| Year Ended October 31, 2015 | | $ | 9.69 | | | | (0.20 | ) | | | 0.52 | | | | 0.32 | |
Period Ended October 31, 2014(1) | | $ | 10.00 | | | | (0.13 | ) | | | 0.17 | | | | 0.04 | (6) |
| STONE RIDGE EMERGING MARKETS VARIANCE RISK PREMIUM FUND—CLASS I | | | | | | | | | | | | | | | | |
| Year Ended October 31, 2017 | | $ | 9.06 | | | | (0.09 | ) | | | 1.15 | | | | 1.06 | |
| Year Ended October 31, 2016 | | $ | 8.83 | | | | (0.10 | ) | | | 0.33 | | | | 0.23 | |
| Year Ended October 31, 2015 | | $ | 9.95 | | | | (0.15 | ) | | | (0.87 | ) | | | (1.02 | ) |
Period Ended October 31, 2014(1) | | $ | 10.00 | | | | (0.11 | ) | | | 0.40 | | | | 0.29 | (6) |
| STONE RIDGE EMERGING MARKETS VARIANCE RISK PREMIUM FUND—CLASS M | | | | | | | | | | | | | | | | |
| Year Ended October 31, 2017 | | $ | 9.02 | | | | (0.09 | ) | | | 1.13 | | | | 1.04 | |
| Year Ended October 31, 2016 | | $ | 8.81 | | | | (0.11 | ) | | | 0.32 | | | | 0.21 | |
| Year Ended October 31, 2015 | | $ | 9.94 | | | | (0.16 | ) | | | (0.87 | ) | | | (1.03 | ) |
Period Ended October 31, 2014(1) | | $ | 10.00 | | | | (0.12 | ) | | | 0.41 | | | | 0.29 | |
| STONE RIDGE INTERNATIONAL VARIANCE RISK PREMIUM MASTER FUND—CLASS I | | | | | | | | | | | | | |
| Year Ended October 31, 2017 | | $ | 9.51 | | | | 0.32 | (4) | | | 0.80 | (4) | | | 1.12 | (4) |
| Year Ended October 31, 2016 | | $ | 9.51 | | | | (0.02 | )(4) | | | 0.02 | (4) | | | 0.00 | (4) |
| Year Ended October 31, 2015 | | $ | 9.76 | | | | 0.05 | (4) | | | (0.21 | )(4) | | | (0.16 | )(4) |
Period Ended October 31, 2014(1) | | $ | 10.00 | | | | 0.34 | (4) | | | (0.24 | )(4) | | | 0.09 | (4) |
| STONE RIDGE INTERNATIONAL VARIANCE RISK PREMIUM MASTER FUND—CLASS M | | | | | | | | | | | | | |
| Year Ended October 31, 2017 | | $ | 9.49 | | | | 0.30 | (4) | | | 0.80 | (4) | | | 1.10 | (4) |
| Year Ended October 31, 2016 | | $ | 9.50 | | | | (0.04 | )(4) | | | 0.03 | (4) | | | (0.01 | )(4) |
| Year Ended October 31, 2015 | | $ | 9.76 | | | | 0.06 | (4) | | | (0.23 | )(4) | | | (0.17 | )(4)(6) |
Period Ended October 31, 2014(1) | | $ | 10.00 | | | | 0.32 | (4) | | | (0.24 | )(4) | | | 0.07 | (4)(6) |
| STONE RIDGE GLOBAL EQUITY VARIANCE RISK PREMIUM MASTER FUND—CLASS I | | | | | | | | | | | | | |
| Year Ended October 31, 2017 | | $ | 10.01 | | | | 0.14 | (5) | | | 1.05 | (5) | | | 1.19 | (5) |
| Year Ended October 31, 2016 | | $ | 10.07 | | | | (0.02 | )(5) | | | 0.11 | (5) | | | 0.09 | (5) |
Period Ended October 31, 2015(2) | | $ | 10.00 | | | | 0.04 | (5) | | | 0.08 | (5) | | | 0.12 | (5)(6) |
| STONE RIDGE GLOBAL EQUITY VARIANCE RISK PREMIUM MASTER FUND—CLASS M | | | | | | | | | | | | | |
| Year Ended October 31, 2017 | | $ | 9.98 | | | | 0.13 | (5) | | | 1.05 | (5) | | | 1.18 | (5) |
| Year Ended October 31, 2016 | | $ | 10.06 | | | | (0.04 | )(5) | | | 0.11 | (5) | | | 0.07 | (5) |
Period Ended October 31, 2015(2) | | $ | 10.00 | | | | (0.01 | )(5) | | | 0.11 | (5) | | | 0.10 | (5) |
| | (1) | | The Fund commenced operations on February 11, 2014. |
| | (2) | | The Fund commenced operations on November 14, 2014. |
| | (3) | | Net investment income (loss) per share has been calculated based on average shares outstanding during the period. |
| | (4) | | Per share amounts only include income and expenses of the Stone Ridge International Variance Risk Premium Master Fund which are shown on the Fund’s Statement of Operations. Amounts do not include the Fund’s proportionate share of the income and expenses of the underlying investor funds. |
| | (5) | | Per share amounts only include income and expenses of the Stone Ridge Global Equity Variance Risk Premium Master Fund which are shown on the Fund’s Statement of Operations. Amounts do not include the Fund’s proportionate share of the income and expenses of the underlying investor funds. |
| | (6) | | Includes redemption fees of less than $0.01 per share. |
| | (9) | | Total Return represents the rate that an investor would have earned (or lost) on an investment in the Fund (assuming reinvestment of all dividends and distributions). |
| | (10) | | Includes borrowing and investment-related expenses not covered by the Funds’ expense limitation agreement. See Note 4. |
| | | | |
| | The accompanying Notes to the Financial Statements are an integral part of these Financial Statements. | | |
| | | | | | | | | | | | | | | | |
| | Stone Ridge Funds | | | | | | Annual Report | | | | | | October 31, 2017 | | |
| | | | | | | | | | |
54
| | |
| Financial Highlights | | October 31, 2017 |
| | | | | | | | | | | | | | | | | | | | | | | | | | | | | | | | | | | | | | | | | | | | | | | | | | |
| | | SUPPLEMENT DATA AND RATIOS: | |
| Distributions to Shareholders | | | | | | | | | | | | | | | | | | | | | | | | | | | | |
Net
Investment
Income | | | Net
Realized
Gains | | | Return
of Capital | | | Total
Distributions | | | Net
Asset
Value,
End of
Period | | | Total
Return(9) | | | Net
Assets,
End of
Period
(000’s) | | | Ratio of
Expenses to
Average
Net Assets
(Before Expense
Reimbursement/ Recoupment) | | | Ratio of
Expenses to
Average Net
Assets (After
Expense
Reimbursement/ Recoupment) | | | Ratio of Net
Investment Income
(Loss) to Average
Net Assets
(Before Expense
Reimbursement/
Recoupment ) | | | Ratio of Net
Investment Income
(Loss) to Average
Net Assets
(After Expense Reimbursement/ Recoupment) | | | Portfolio
Turnover Rate | | | | |
| | | | | | | | | | | | | | | | | | | | | | | | | | | | | | | | | | | | | | | | | | | | | | | | | | |
| | — | | | | (0.04 | ) | | | — | | | | (0.04 | ) | | $ | 10.83 | | | | 12.28 | % | | $ | 76,774 | | | | 2.06 | %(10) | | | 1.86 | %(10) | | | (1.34 | %)(10) | | | (1.14 | %)(10) | | | 0.00 | % | | | | |
| | — | | | | (0.16 | ) | | | — | | | | (0.16 | ) | | $ | 9.68 | | | | (0.89 | %) | | $ | 77,284 | | | | 1.81 | %(10) | | | 1.90 | %(10) | | | (1.57 | %)(10) | | | (1.66 | %)(10) | | | 115.09 | % | | | | |
| | — | | | | (0.10 | ) | | | — | | | | (0.10 | ) | | $ | 9.93 | | | | 3.40 | % | | $ | 90,449 | | | | 1.83 | %(10) | | | 1.96 | %(10) | | | (1.77 | %)(10) | | | (1.90 | %)(10) | | | 107.43 | % | | | | |
| | — | | | | (0.19 | ) | | | (0.16 | ) | | | (0.35 | ) | | $ | 9.70 | | | | 0.47 | %(7) | | $ | 59,551 | | | | 2.16 | %(8) | | | 1.75 | %(8) | | | (2.12 | %)(8) | | | (1.71 | %)(8) | | | 70.35 | %(7) | | | | |
| | | | | | | | | | | | | | | | | | | | | | | | | | | | | | | | | | | | | | | | | | | | | | | | | | |
| | — | | | | (0.04 | ) | | | — | | | | (0.04 | ) | | $ | 10.77 | | | | 12.01 | % | | $ | 19,890 | | | | 2.21 | %(10) | | | 2.01 | %(10) | | | (1.49 | %)(10) | | | (1.29 | %)(10) | | | 0.00 | % | | | | |
| | — | | | | (0.16 | ) | | | — | | | | (0.16 | ) | | $ | 9.65 | | | | (0.99 | %) | | $ | 19,530 | | | | 1.96 | %(10) | | | 2.05 | %(10) | | | (1.72 | %)(10) | | | (1.81 | %)(10) | | | 115.09 | % | | | | |
| | — | | | | (0.10 | ) | | | — | | | | (0.10 | ) | | $ | 9.91 | | | | 3.30 | % | | $ | 21,082 | | | | 1.98 | %(10) | | | 2.11 | %(10) | | | (1.92 | %)(10) | | | (2.05 | %)(10) | | | 107.43 | % | | | | |
| | — | | | | (0.19 | ) | | | (0.16 | ) | | | (0.35 | ) | | $ | 9.69 | | | | 0.36 | %(7) | | $ | 18,795 | | | | 2.35 | %(8) | | | 1.90 | %(8) | | | (2.31 | %)(8) | | | (1.86 | %)(8) | | | 70.35 | %(7) | | | | |
| | | | | | | | | | | | | | | | | | | | | | | | | | | | | | | | | | | | | | | | | | | | | | | | | | |
| | — | | | | (1.02 | ) | | | — | | | | (1.02 | ) | | $ | 9.10 | | | | 11.67 | % | | $ | 10,938 | | | | 2.46 | % | | | 1.80 | % | | | (1.66 | %) | | | (1.00 | %) | | | 0.00 | % | | | | |
| | — | | | | — | | | | — | | | | — | | | $ | 9.06 | | | | 2.60 | % | | $ | 45,164 | | | | 1.79 | %(10) | | | 1.80 | %(10) | | | (1.15 | %)(10) | | | (1.16 | %)(10) | | | 160.98 | % | | | | |
| | — | | | | — | | | | (0.10 | ) | | | (0.10 | ) | | $ | 8.83 | | | | (10.37 | %) | | $ | 47,338 | | | | 2.09 | % | | | 1.80 | % | | | (1.92 | %) | | | (1.63 | %) | | | 485.70 | % | | | | |
| | — | | | | (0.34 | ) | | | (0.01 | ) | | | (0.35 | ) | | $ | 9.95 | | | | 3.05 | %(7) | | $ | 36,142 | | | | 2.41 | %(8) | | | 1.80 | %(8) | | | (2.07 | %)(8) | | | (1.46 | %)(8) | | | 229.94 | %(7) | | | | |
| | | | | | | | | | | | | | | | | | | | | | | | | | | | | | | | | | | | | | | | | | | | | | | | | | |
| | — | | | | (1.02 | ) | | | — | | | | (1.02 | ) | | $ | 9.04 | | | | 11.50 | % | | $ | 3,016 | | | | 3.60 | % | | | 1.95 | % | | | (2.63 | %) | | | (0.98 | %) | | | 0.00 | % | | | | |
| | — | | | | — | | | | — | | | | — | | | $ | 9.02 | | | | 2.38 | % | | $ | 3,541 | | | | 1.92 | %(10) | | | 1.95 | %(10) | | | (1.30 | %)(10) | | | (1.31 | %)(10) | | | 160.98 | % | | | | |
| | — | | | | — | | | | (0.10 | ) | | | (0.10 | ) | | $ | 8.81 | | | | (10.48 | %) | | $ | 3,079 | | | | 2.22 | % | | | 1.95 | % | | | (2.07 | %) | | | (1.80 | %) | | | 485.70 | % | | | | |
| | — | | | | (0.34 | ) | | | (0.01 | ) | | | (0.35 | ) | | $ | 9.94 | | | | 2.95 | %(7) | | $ | 3,702 | | | | 2.84 | %(8) | | | 1.95 | %(8) | | | (2.50 | %)(8) | | | (1.61 | %)(8) | | | 229.94 | %(7) | | | | |
| | | | | | | | | | | | | | | | | | | | | | | | | | | | | | | | | | | | | | | | | | | | | | | | | | |
| | (0.45 | ) | | | — | | | | — | | | | (0.45 | ) | | $ | 10.18 | | | | 11.77 | % | | $ | 7,534 | | | | 1.04 | % | | | 0.25 | % | | | 2.37 | % | | | 3.16 | % | | | 3.66 | % | | | | |
| | — | | | | — | | | | — | | | | — | | | $ | 9.51 | | | | 0.00 | % | | $ | 7,518 | | | | 0.58 | % | | | 0.25 | % | | | (0.58 | %) | | | (0.25 | %) | | | 11.65 | % | | | | |
| | (0.05 | ) | | | — | | | | (0.04 | ) | | | (0.09 | ) | | $ | 9.51 | | | | (1.63 | %) | | $ | 9,536 | | | | 0.47 | % | | | 0.25 | % | | | 0.33 | % | | | 0.55 | % | | | 13.94 | % | | | | |
| | (0.24 | ) | | | — | | | | (0.10 | ) | | | (0.34 | ) | | $ | 9.76 | | | | 0.92 | %(7) | | $ | 5,971 | | | | 0.82 | %(8) | | | 0.25 | %(8) | | | 4.20 | %(8) | | | 4.77 | %(8) | | | 21.41 | %(7) | | | | |
| | | | | | | | | | | | | | | | | | | | | | | | | | | | | | | | | | | | | | | | | | | | | | | | | | |
| | (0.43 | ) | | | — | | | | — | | | | (0.43 | ) | | $ | 10.16 | | | | 11.63 | % | | $ | 4,093 | | | | 1.19 | % | | | 0.40 | % | | | 2.18 | % | | | 2.97 | % | | | 3.66 | % | | | | |
| | — | | | | — | | | | — | | | | — | | | $ | 9.49 | | | | (0.11 | %) | | $ | 4,269 | | | | 0.69 | % | | | 0.40 | % | | | (0.69 | %) | | | (0.40 | %) | | | 11.65 | % | | | | |
| | (0.05 | ) | | | — | | | | (0.04 | ) | | | (0.09 | ) | | $ | 9.50 | | | | (1.77 | %) | | $ | 19,894 | | | | 0.62 | % | | | 0.40 | % | | | 0.36 | % | | | 0.58 | % | | | 13.94 | % | | | | |
| | (0.22 | ) | | | — | | | | (0.10 | ) | | | (0.32 | ) | | $ | 9.76 | | | | 0.82 | %(7) | | $ | 19,533 | | | | 0.98 | %(8) | | | 0.40 | %(8) | | | 3.93 | %(8) | | | 4.51 | %(8) | | | 21.41 | %(7) | | | | |
| | | | | | | | | | | | | | | | | | | | | | | | | | | | | | | | | | | | | | | | | | | | | | | | | | |
| | — | | | | (0.25 | ) | | | — | | | | (0.25 | ) | | $ | 10.95 | | | | 12.17 | % | | $ | 32,230 | | | | 0.35 | % | | | 0.25 | % | | | 1.28 | % | | | 1.38 | % | | | 9.10 | % | | | | |
| | — | | | | (0.15 | ) | | | — | | | | (0.15 | ) | | $ | 10.01 | | | | 0.92 | % | | $ | 33,414 | | | | 0.39 | % | | | 0.25 | % | | | (0.39 | %) | | | (0.25 | %) | | | 21.71 | % | | | | |
| | (0.05 | ) | | | — | | | | — | | | | (0.05 | ) | | $ | 10.07 | | | | 1.17 | %(7) | | $ | 38,899 | | | | 0.47 | %(8) | | | 0.25 | %(8) | | | 0.21 | %(8) | | | 0.43 | %(8) | | | 62.45 | %(7) | | | | |
| | | | | | | | | | | | | | | | | | | | | | | | | | | | | | | | | | | | | | | | | | | | | | | | | | |
| | — | | | | (0.25 | ) | | | — | | | | (0.25 | ) | | $ | 10.91 | | | | 12.10 | % | | $ | 7,470 | | | | 0.50 | % | | | 0.40 | % | | | 1.21 | % | | | 1.31 | % | | | 9.10 | % | | | | |
| | — | | | | (0.15 | ) | | | — | | | | (0.15 | ) | | $ | 9.98 | | | | 0.71 | % | | $ | 7,351 | | | | 0.53 | % | | | 0.40 | % | | | (0.53 | %) | | | (0.40 | %) | | | 21.71 | % | | | | |
| | (0.04 | ) | | | — | | | | — | | | | (0.04 | ) | | $ | 10.06 | | | | 1.05 | %(7) | | $ | 9,464 | | | | 0.72 | %(8) | | | 0.40 | %(8) | | | (0.42 | %)(8) | | | (0.10 | %)(8) | | | 62.45 | %(7) | | | | |
| | | | |
| | The accompanying Notes to the Financial Statements are an integral part of these Financial Statements. | | |
| | | | | | | | | | | | | | | | |
| | Stone Ridge Funds | | | | | | Annual Report | | | | | | October 31, 2017 | | |
| | | | | | | | | | |
55
| | |
| Notes to Financial Statements | | October 31, 2017 |
1. Organization
Stone Ridge Trust (the “Trust”) was organized as a Delaware statutory trust on September 28, 2012, and is registered under the Investment Company Act of 1940 (the “1940 Act”), as amended, as an open-end management investment company issuing shares in multiple series, each series representing a distinct portfolio with its own investment objectives and policies. As of October 31, 2017, Stone Ridge High Yield Reinsurance Risk Premium Fund (the “High Yield Fund”), the Stone Ridge U.S. Large Cap Variance Risk Premium Fund (the “U.S. Large Cap VRP Fund”), the Stone Ridge U.S. Small Cap Variance Risk Premium Fund (the “U.S. Small Cap VRP Fund”, together with the U.S. Large Cap VRP Fund, the “U.S. VRP Funds”), the Stone Ridge U.S. Variance Risk Premium Master Fund (the “U.S. VRP Master Fund”, together with the U.S. VRP Funds, the “U.S. VRP Portfolio of Funds”), the Stone Ridge International Developed Markets Variance Risk Premium Fund (the “International Developed Markets VRP Fund”), the Stone Ridge Emerging Markets Variance Risk Premium Fund (the “Emerging Markets VRP Fund”, together with the International Developed Markets VRP Fund, the “International VRP Funds”), the Stone Ridge International Variance Risk Premium Master Fund (the “International VRP Master Fund”) and the Stone Ridge Global Equity Variance Risk Premium Master Fund (the “Global Equity VRP Master Fund”, together with the International VRP Funds and the International VRP Master Fund, the “International VRP Portfolio of Funds”) (collectively, the “Funds”) were each series of the Trust. Each of the Funds except the High Yield Fund and the Global Equity VRP Master Fund is diversified. The High Yield Fund and the Global Equity VRP Master Fund are non-diversified. The High Yield Fund commenced operations on February 1, 2013. The U.S. VRP Funds commenced operations on May 1, 2013. The U.S. VRP Master Fund commenced operations on May 22, 2013. The International Developed Markets VRP Fund, Emerging Markets VRP Fund and International VRP Master Fund commenced operations on February 11, 2014. The Global Equity VRP Master Fund commenced operations on November 14, 2014. Each Fund offers two classes of shares to investors: Class I shares, with no front-end or back-end sales charges, and no 12b-1 fees; and Class M Shares, with no front-end or back-end sales charges, and a 0.15% 12b-1 fee. The High Yield Fund, the U.S. VRP Funds, and the U.S. VRP Master Fund do not charge redemption fees. The International VRP Portfolio of Funds did charge redemption fees, but the redemption fees were discontinued effective February 28, 2015. There are an unlimited number of authorized shares.
On December 5, 2016, the High Yield Fund Class M and Class I acquired all the net assets of the Stone Ridge Reinsurance Risk Premium Fund (the “Reinsurance Fund”) Class M and Class I, respectively, pursuant to a Plan of Reorganization approved by the Board of Trustees. The acquisition was accomplished by a tax-free exchange of 19,117,178 and 83,958,774 shares of Class M and Class I, respectively of the High Yield Fund (valued at $191,342,870 and $840,282,373 for Class M and Class I, respectively) for all (19,341,143 and 84,937,288 shares, respectively) of Class M and Class I of the Reinsurance Fund on December 5, 2016.
For financial reporting purposes, assets received and shares issued by the High Yield Fund were recorded at fair value; however, the cost basis of the investments received from the Reinsurance Fund was carried forward to align ongoing reporting of the High Yield Fund’s realized and unrealized gains and losses with amounts distributable to shareholders for tax purposes. The Reinsurance Fund’s net assets at that date ($1,031,625,243), including $39,229,487 of unrealized appreciation, were combined with those of the High Yield Fund. The aggregate net assets of the High Yield Fund immediately after the acquisition were $1,519,782,667. Assuming the acquisition had been completed on November 1, 2016, the beginning of the Funds’ fiscal year, pro forma results of operations for the High Yield Fund for the year ended October 31, 2017, would have been $81,907,160 of net investment income, $135,427,065 of net realized and unrealized losses on investments, and $53,519,905 of net decrease in net assets resulting from operations. Because the combined investment portfolios have been managed as a single integrated portfolio since the acquisition was completed, it is not practicable to separate the amounts of revenue and earnings of the Reinsurance Fund that have been included in High Yield Fund’s statement of operations since December 5, 2016.
The investment objective of the High Yield Fund is to seek a high level of total return consisting of income and capital appreciation. The High Yield Fund pursues its investment objective by investing primarily in reinsurance-related securities, including event-linked bonds, preference shares or participation notes issued in connection with quota shares (“Quota Share Notes”), preference shares or participation notes issued in connection with excess-of-loss, stop-loss or other non-proportional reinsurance (“Excess of Loss Notes”), preference shares or participation notes issued in connection with industry loss warranties (“ILW Notes”) and, to a lesser extent, event-linked swaps, equity securities (publicly or privately offered) and the derivatives of equity securities of companies in the reinsurance and insurance industry (collectively, “reinsurance-related securities”). The investment objective of each of the U.S. VRP Portfolio of
| | | | | | | | | | | | | | | | |
| | Stone Ridge Funds | | | | | | Annual Report | | | | | | October 31, 2017 | | |
| | | | | | | | | | |
56
| | |
| Notes to Financial Statements | | October 31, 2017 |
Funds is to seek capital appreciation. The U.S. Large Cap VRP Fund typically pursues its investment objective by writing (selling) call and put options related to U.S. large-cap securities. The U.S. Small Cap VRP Fund typically pursues its investment objective by writing (selling) call and put options related to U.S. small-cap securities. The U.S. VRP Master Fund seeks to achieve its investment objective by investing in the U.S. VRP Funds. The investment objective of each of the International VRP Portfolio of Funds is to seek capital appreciation. The International Developed Markets VRP Fund typically pursues its objective by writing (selling) call and put options related to developed markets securities. The Emerging Markets VRP Fund typically pursues its objective by writing (selling) call and put options related to emerging markets securities. The International VRP Master Fund seeks to achieve its investment objective by investing in the International VRP Funds. The Global Equity VRP Master Fund seeks to achieve its investment objective by investing in the International VRP Funds and the U.S. VRP Funds.
2. Summary of Significant Accounting Policies
The following is a summary of significant accounting policies consistently followed by the Funds in the preparation of their financial statements. The financial statements have been prepared in conformity with accounting principles generally accepted in the United States of America (“GAAP”). The Funds are investment companies and apply specific accounting and financial reporting requirements under Financial Accounting Standards Board (“FASB”) Accounting Standards Topic 946, Financial Services – Investment Companies.
Effective October 13, 2016, the U.S. Securities and Exchange Commission (“SEC”) approved a final rule, Investment Company Reporting Modernization. The SEC adopted new rules and forms as well as amendments to its rules and forms to modernize the reporting and disclosure of information by registered investment companies. As of October 31, 2017, the Funds have adopted the new rules, forms and amendments.
a) Investment Valuation and Fair Value Measurement
The Board of Trustees (“Board”) has approved procedures pursuant to which each Fund values its investments (the “Valuation Procedures”). The Board has established an Adviser Valuation Committee comprised of employees of Stone Ridge Asset Management LLC (the “Adviser”) to which the Board has delegated responsibility for overseeing the implementation of the Valuation Procedures and fair value determinations made on behalf of the Board.
Listed below is a summary of certain of the methods generally used currently to value investments of each Fund under the Valuation Procedures:
With respect to pricing of certain reinsurance-related event-linked or similar restricted securities (including participation notes and preference shares) for which at least one independent market-maker or two independent brokers regularly provide firm bids, the Funds will utilize an independent data delivery vendor to aggregate and provide an average bid price, if applicable, and the independent data delivery vendor will provide this pricing data to the Funds’ administrator. If the independent data delivery vendor cannot obtain independent firm bids for such securities, but there is an independent market maker or two independent brokers who will supply firm bids for such securities, then the Adviser may supply the Funds’ administrator with a contact from whom to obtain such bids, and the Funds’ administrator will contact such independent brokers, and use the bid or average bid, as applicable, as the value of the security. If, with respect to such securities, such independent firm bids are not available, but at least one independent firm or indicative bid is available, then the Adviser Valuation Committee may use that bid (or the average of those bids if more than one) as the value of the security if the Adviser Valuation Committee determines that such value is reasonable; the Adviser Valuation Committee may consider internal and/or independent external models in making that determination.
Short-term debt instruments, such as commercial paper, bankers’ acceptances and U.S. Treasury Bills, having a maturity of 60 days or less, are generally valued at amortized cost which approximates fair value.
Other debt securities, including corporate and government debt securities (of U.S. or foreign issuers) and municipal debt securities in each case having a remaining maturity in excess of 60 days, loans, mortgage-backed securities, collateralized mortgage obligations and other asset-backed securities (except event-linked bonds) are valued by an independent pricing service at an evaluated (or estimated) mean between the closing bid and asked prices.
| | | | | | | | | | | | | | | | |
| | Stone Ridge Funds | | | | | | Annual Report | | | | | | October 31, 2017 | | |
| | | | | | | | | | |
57
| | |
| Notes to Financial Statements | | October 31, 2017 |
For investments in open-end management companies that are registered under the 1940 Act the value of the shares of such funds is calculated based upon the net asset value (“NAV”) per share of such funds. The prospectuses for such funds explain the circumstances under which they will use fair value pricing and its effects.
Equity securities (other than reinsurance-related securities that are valued pursuant to the valuation methods described above) are valued at the last sale, official close or if there are no reported sales at the mean between the bid and asked price on the primary exchange on which they are traded. The values of the Funds’ investments in publicly-traded foreign equity securities generally will be the closing or final trading prices in the local trading markets but may be adjusted based on values determined by a pricing service using pricing models designed to estimate changes in the values of those securities between the times in which the trading in those securities is substantially completed and the close of the New York Stock Exchange (“NYSE”).
Exchange-traded derivatives, such as options and futures contracts, are valued at the settlement price on the exchange or mean of the bid and asked prices.
Non-exchange traded derivatives, including over-the-counter (“OTC”) options, are generally valued on the basis of valuations provided by a pricing service or using quotes provided by a broker/dealer (typically the counterparty).
If market quotations are not readily available or available market quotations or other information are deemed to be unreliable by the Adviser Valuation Committee, and if the valuation of the applicable instrument is not covered by the valuation methods described above or if the valuation methods are described above, but such methods are deemed unreliable by the Adviser Valuation Committee, then such instruments will be valued as determined in good faith by the Adviser Valuation Committee. In these circumstances, the Fund determines fair value in a manner that seeks to reflect the market value of the security on the valuation date based on consideration by the Adviser Valuation Committee of any information or factors it deems appropriate. For purposes of determining the fair value of securities, the Adviser Valuation Committee may generally consider, without limitation: (i) indications or quotes from brokers, insurance companies, reinsurance companies or other third-party sources; (ii) valuations provided by a third-party pricing agent; (iii) internal models that take into consideration different factors determined to be relevant by the Adviser; or (iv) any combination of the above.
Fair value pricing may require subjective determinations about the value of a portfolio instrument. Fair values may differ from quoted or published prices, or from prices that are used by others, for the same investments. Also, the use of fair value pricing may not always result in adjustments to the prices of securities or other assets or liabilities held by a Fund. It is possible that the fair value determined for a security may be materially different than the value that could be realized upon the sale of such security. Thus, fair valuation may have an unintended dilutive or accretive effect on the value of shareholders’ investments in a Fund. Information that becomes known to the Funds or their agents after the NAV has been calculated on a particular day will not be used to retroactively adjust the price of a security or the NAV determined earlier that day.
A substantial portion of the Funds’ investments are U.S. dollar denominated investments. Investments initially valued in currencies other than the U.S. dollar are converted to U.S. dollars using exchange rates obtained from pricing services. As a result, the NAV of a Fund’s shares may be affected by changes in the value of currencies in relation to the U.S. dollar. International markets are sometimes open on days when U.S. markets are closed, which means that the value of foreign securities owned by a Fund could change on days when Fund shares cannot be bought or sold. The value of investments traded in markets outside the U.S. or denominated in currencies other than the U.S. dollar may be affected significantly on a day that the NYSE is closed, and the NAV of a Fund’s shares may change on days when an investor is not able to purchase, redeem or exchange shares. The calculation of a Fund’s NAV may not take place contemporaneously with the determination of the prices of foreign securities used in NAV calculations.
The Funds adhere to authoritative fair valuation accounting standards that set out a hierarchy for measuring fair valuation inputs. These standards require additional disclosures about the various inputs and valuation techniques used to develop the measurements of fair value and a discussion of changes in valuation techniques and related inputs during the period. The hierarchy gives the highest priority to unadjusted quoted prices in active markets for identical assets or liabilities (Level 1 measurements) and the lowest priority to unobservable inputs (Level 3 measurements). The three levels of the fair value hierarchy are as follows:
Level 1 Inputs: quoted prices (unadjusted) in active markets for identical assets or liabilities that the Fund can access at the measurement date;
| | | | | | | | | | | | | | | | |
| | Stone Ridge Funds | | | | | | Annual Report | | | | | | October 31, 2017 | | |
| | | | | | | | | | |
58
| | |
| Notes to Financial Statements | | October 31, 2017 |
Level 2 Inputs: inputs other than quoted prices included within Level 1 that are observable for the asset or liability, either directly or indirectly including inputs in markets that are not considered to be active or in active markets for similar assets or liabilities, observable inputs other than quoted prices and inputs that are not directly observable but are corroborated by observable market data;
Level 3 Inputs: unobservable inputs for the asset or liability.
Inputs are used in applying the various valuation techniques and broadly refer to the assumptions that market participants use to make valuation decisions, including assumptions about risk. A financial instrument’s level within the fair value hierarchy is based on the lowest level of any input that is significant to the fair value measurement. However, the determination of what constitutes “observable” requires significant judgment by the Adviser. The Adviser considers observable data to be that market data which is readily available, regularly distributed or updated, reliable and verifiable, not proprietary, and provided by independent sources that are actively involved in the relevant market. The categorization of a financial instrument within the hierarchy is based upon the pricing transparency of the instrument and does not necessarily correspond to the Adviser’s perceived risk of that instrument.
Transfers between levels are recognized at the end of the reporting period. There were no transfers between levels during the reporting period. The following tables summarize the inputs used to value the Funds’ investments as of October 31, 2017.
| | | | | | | | | | | | | | | | |
| DESCRIPTION | | LEVEL 1 | | | LEVEL 2 | | | LEVEL 3 | | | TOTAL | |
| High Yield Fund | |
Assets | | | | | | | | | | | | | | | | |
| Event-Linked Bonds | | | | | | | | | | | | | | | | |
China | | $ | — | | | $ | — | | | $ | 2,062,081 | | | $ | 2,062,081 | |
Europe | | | — | | | | 3,197,410 | | | | — | | | | 3,197,410 | |
Global | | | — | | | | 341,572,170 | | | | 34,456,793 | | | | 376,028,963 | |
Japan | | | — | | | | 42,257,995 | | | | — | | | | 42,257,995 | |
Turkey | | | — | | | | 3,278,763 | | | | — | | | | 3,278,763 | |
United States | | | — | | | | 513,294,864 | | | | 16,939,888 | | | | 530,234,752 | |
Total Event-Linked Bonds | | | — | | | | 903,601,202 | | | | 53,458,762 | | | | 957,059,964 | |
Participation Notes (1) | | | — | | | | — | | | | 39,206,523 | | | | 39,206,523 | |
Preference Shares (1) | | | — | | | | — | | | | 101,348,800 | | | | 101,348,800 | |
Money Market Funds | | | 2,840,053 | | | | — | | | | — | | | | 2,840,053 | |
| | | | |
Total Assets | | $ | 2,840,053 | | | $ | 903,601,202 | | | $ | 194,014,085 | | | $ | 1,100,455,340 | |
Other Financial Instruments* | | | | | | | | | | | | | | | | |
Unrealized appreciation on futures | | $ | 799,513 | | | $ | — | | | $ | — | | | $ | 799,513 | |
| | | | |
Total | | $ | 799,513 | | | $ | — | | | $ | — | | | $ | 799,513 | |
| | | | | | | | | | | | | | | | |
| U.S. Large Cap VRP Fund | |
Assets | | | | | | | | | | | | | | | | |
Contingent Value Rights (1) | | $ | — | | | $ | — | | | $ | 5,744 | | | $ | 5,744 | |
Money Market Funds | | | 263,104 | | | | — | | | | — | | | | 263,104 | |
U.S. Treasury Bills | | | — | | | | 353,913,430 | | | | — | | | | 353,913,430 | |
| | | | |
Total Assets | | $ | 263,104 | | | $ | 353,913,430 | | | $ | 5,744 | | | $ | 354,182,278 | |
Liabilities | | | | | | | | | | | | | | | | |
Written Options | | $ | (162,000 | ) | | $ | (813,950 | ) | | $ | — | | | $ | (975,950 | ) |
| | | | |
Total Liabilities | | $ | (162,000 | ) | | $ | (813,950 | ) | | $ | — | | | $ | (975,950 | ) |
| | | | | | | | | | | | | | | | |
| | | | | | | | | | | | | | | | |
| | Stone Ridge Funds | | | | | | Annual Report | | | | | | October 31, 2017 | | |
| | | | | | | | | | |
59
| | |
| Notes to Financial Statements | | October 31, 2017 |
| | | | | | | | | | | | | | | | |
| DESCRIPTION | | LEVEL 1 | | | LEVEL 2 | | | LEVEL 3 | | | TOTAL | |
| U.S. Small Cap VRP Fund (2) | |
Assets | | | | | | | | | | | | | | | | |
Money Market Funds | | $ | 156,436 | | | $ | — | | | $ | — | | | $ | 156,436 | |
U.S. Treasury Bills | | | | | | | 127,202,787 | | | | — | | | | 127,202,787 | |
| | | | |
Total Assets | | $ | 156,436 | | | $ | 127,202,787 | | | $ | — | | | $ | 127,359,223 | |
Liabilities | | | | | | | | | | | | | | | | |
Written Options | | $ | — | | | $ | (653,540 | ) | | $ | — | | | $ | (653,540 | ) |
| | | | |
Total Liabilities | | $ | — | | | $ | (653,540 | ) | | $ | — | | | $ | (653,540 | ) |
| | | | | | | | | | | | | | | | |
| U.S. VRP Master Fund (2) | |
Assets | | | | | | | | | | | | | | | | |
Investment Companies—Open End | | $ | 229,206,749 | | | $ | — | | | $ | — | | | $ | 229,206,749 | |
Money Market Funds | | | 329,687 | | | | — | | | | — | | | | 329,687 | |
| | | | |
Total Assets | | $ | 229,536,436 | | | $ | — | | | $ | — | | | $ | 229,536,436 | |
| | | | | | | | | | | | | | | | |
| International Developed Markets VRP Fund (2) | |
Assets | | | | | | | | | | | | | | | | |
Money Market Funds | | $ | 7,340,014 | | | $ | — | | | $ | — | | | $ | 7,340,014 | |
U.S. Treasury Bills | | | — | | | | 89,687,598 | | | | — | | | | 89,687,598 | |
| | | | |
Total Assets | | $ | 7,340,014 | | | $ | 89,687,598 | | | $ | — | | | $ | 97,027,612 | |
Liabilities | | | | | | | | | | | | | | | | |
Written Options | | $ | (485,862 | ) | | $ | (37,139 | ) | | $ | — | | | $ | (523,002 | ) |
| | | | |
Total Liabilities | | $ | (485,862 | ) | | $ | (37,139 | ) | | $ | — | | | $ | (523,002 | ) |
| | | | | | | | | | | | | | | | |
| Emerging Markets VRP Fund (2) | |
Assets | | | | | | | | | | | | | | | | |
Money Market Funds | | $ | 70,120 | | | $ | — | | | $ | — | | | $ | 70,120 | |
U.S. Treasury Bills | | | — | | | | 15,563,519 | | | | — | | | | 15,563,519 | |
| | | | |
Total Assets | | $ | 70,120 | | | $ | 15,563,519 | | | $ | — | | | $ | 15,633,639 | |
Liabilities | | | | | | | | | | | | | | | | |
Written Options | | $ | (4,800 | ) | | $ | (95,004 | ) | | $ | — | | | $ | (99,804 | ) |
| | | | |
Total Liabilities | | $ | (4,800 | ) | | $ | (95,004 | ) | | $ | — | | | $ | (99,804 | ) |
| | | | | | | | | | | | | | | | |
| International VRP Master Fund (2) | |
Assets | | | | | | | | | | | | | | | | |
Investment Companies—Open End | | $ | 11,637,601 | | | $ | — | | | $ | — | | | $ | 11,637,601 | |
Money Market Funds | | | 130,388 | | | | — | | | | — | | | | 130,388 | |
| | | | |
Total Assets | | $ | 11,767,989 | | | $ | — | | | $ | — | | | $ | 11,767,989 | |
| | | | | | | | | | | | | | | | |
| Global Equity VRP Master Fund (2) | |
Assets | | | | | | | | | | | | | | | | |
Investment Companies—Open End | | $ | 38,892,747 | | | $ | — | | | $ | — | | | $ | 38,892,747 | |
Money Market Funds | | | 188,976 | | | | — | | | | — | | | | 188,976 | |
| | | | |
Total Assets | | $ | 39,081,723 | | | $ | — | | | $ | — | | | $ | 39,081,723 | |
| * | Other financial instruments are derivatives, such as futures. These instruments are reflected at the unrealized appreciation (depreciation) on the instrument. |
| (1) | For further security characteristics, see the Funds’ Schedules of Investments. |
| (2) | The Funds measure Level 3 activity as of the beginning and end of each financial reporting period. For the year ended October 31, 2017, the Funds did not have unobservable inputs (Level 3 securities) used in determining fair value. Therefore, reconciliations of assets and liabilities in which significant inputs (Level 3 securities) were used in determining fair value are not applicable. |
| | | | | | | | | | | | | | | | |
| | Stone Ridge Funds | | | | | | Annual Report | | | | | | October 31, 2017 | | |
| | | | | | | | | | |
60
| | |
| Notes to Financial Statements | | October 31, 2017 |
Below is a reconciliation that details the activity of securities in Level 3 during the year ended October 31, 2017:
| | | | | | | | | | | | | | | | | | | | |
| | | HIGH YIELD FUND | | | U.S. LARGE
CAP VRP
FUND | | | U.S. SMALL
CAP VRP
FUND | |
| | | EVENT-
LINKED
BONDS | | | PARTICIPATION
NOTES | | | PREFERENCE
SHARES | | | CONTINGENT
VALUE
RIGHTS | | | CONTINGENT
VALUE
RIGHTS | |
Beginning Balance—November 1, 2016 | | $ | 20,772,422 | | | $ | 41,943,248 | | | $ | 51,105,574 | | | $ | 5,744 | | | $ | 6,804 | |
Acquisitions | | | 63,096,846 | | | | 133,801,672 | | | | 90,325,635 | | | | — | | | | — | |
Dispositions | | | (17,330,545 | ) | | | (132,384,311 | ) | | | (20,723,401 | ) | | | — | | | | (9,175 | ) |
Realized gains | | | 797,460 | | | | 397,750 | | | | — | | | | — | | | | 2,779 | |
Return of capital | | | (13,868,236 | ) | | | — | | | | (9,992,737 | ) | | | — | | | | — | |
Change in unrealized depreciation | | | (9,185 | ) | | | (4,551,836 | ) | | | (9,366,271 | ) | | | — | | | | (408 | ) |
Transfers in/(out) of Level 3 | | | — | | | | — | | | | — | | | | — | | | | — | |
Ending Balance—October 31, 2017 | | $ | 53,458,762 | | | $ | 39,206,523 | | | $ | 101,348,800 | | | $ | 5,744 | | | $ | — | |
As of October 31, 2017, the change in unrealized appreciation (depreciation) on positions still held in the High Yield Fund was $567,555 for Event-Linked Bonds, $(1,851,729) for Participation Notes, and $(8,353,959) for Preference Shares. For the U.S. Large Cap VRP Fund, the change in unrealized appreciation on Contingent Value Rights still held was $0.
Unobservable inputs included original transaction price, losses from severe weather events, other natural and non-natural catastrophes and insurance and reinsurance premiums. Significant decreases in premiums or increases in losses related to severe weather or other natural and non-natural catastrophes in isolation would result in a significantly lower fair value measurement. Participation notes and preference shares are monitored daily for significant events that could affect the value of the instruments.
The following table summarizes the quantitative inputs used for investments categorized as Level 3 of the fair value hierarchy as of October 31, 2017.
High Yield Fund
| | | | | | | | | | | | | | |
| TYPE OF SECURITY | | INDUSTRY | | FAIR VALUE
AT 10/31/17 | | | VALUATION
TECHNIQUES | | UNOBSERVABLE
INPUTS | | RANGE | | WEIGHTED
AVERAGE |
Participation Notes | | Financial Services | | | $ 1,344,652 | | | Insurance
industry loss
model | | Estimated losses: Estimated premium earned: | | $0.00MM-$0.00MM
$0.03MM-$0.03MM | | $0.00MM
$0.03MM |
| | | | | | | | | | | | | | |
Preference Shares | | Financial Services | | | $76,477,791 | | | Insurance
industry loss
model | | Estimated losses: Estimated premium earned: | | $0.00MM-$3.95MM
$0.00MM-$4.53MM | | $1.27MM
$1.83MM |
The Level 3 securities listed above were fair valued by the Adviser Valuation Committee. Other Level 3 securities not listed above were priced using an indicative bid and have a value equal to $53,458,762 for Event-Linked Bonds, $37,861,871 for Participation Notes and $24,871,009 for Preference Shares.
Derivative Transactions — The High Yield Fund, U.S. Large Cap VRP Fund, U.S. Small Cap VRP Fund, International Developed Markets VRP Fund and the Emerging Markets VRP Fund engaged in derivatives for hedging and speculative purposes during the year ended October 31, 2017. The U.S. Large Cap VRP Fund, U.S. Small Cap VRP Fund, International Developed Markets VRP Fund and the Emerging Markets VRP Fund also engaged in derivatives to generate income from premiums. The use of derivatives included options and futures.
Futures Contracts — The High Yield Fund, U.S. Large Cap VRP Fund, U.S. Small Cap VRP Fund, International Developed Markets VRP Fund and the Emerging Markets VRP Fund may purchase and sell futures contracts. The High Yield Fund, U.S. Large Cap VRP Fund and the International Developed Markets VRP Fund held futures contracts during the year ended October 31, 2017. The U.S. Large Cap VRP Fund, U.S. Small Cap VRP Fund, International Developed
| | | | | | | | | | | | | | | | |
| | Stone Ridge Funds | | | | | | Annual Report | | | | | | October 31, 2017 | | |
| | | | | | | | | | |
61
| | |
| Notes to Financial Statements | | October 31, 2017 |
Markets VRP Fund and Emerging Markets VRP Fund use futures contracts to maintain appropriate equity market exposure. The High Yield Fund uses futures contracts to hedge interest rate and foreign exchange rate exposure. With futures, there is minimal counterparty credit risk to the Funds since futures are exchange-traded and the exchange’s clearinghouse, as counterparty to all exchange-traded futures, guarantees the futures against default. Upon entering into a contract, a Fund deposits and maintains as collateral, an initial margin as required by the exchange on which the transaction is effected. Pursuant to the contract, a Fund agrees to receive from or pay to the broker, an amount of cash equal to the daily fluctuation in value of the contract. Such receipts or payments are known as variation margin and are recorded by a Fund as unrealized gains and losses. Variation margin is settled daily. When the contract is closed, a Fund records a realized gain or loss equal to the difference between the value of the contract at the time it was opened and the value at the time it was closed. In connection with physically-settled futures contracts, a Fund is required under the 1940 Act to maintain assets consisting of cash, cash equivalents or liquid securities. The amount of the segregated assets is required to be adjusted daily to reflect the market value of the purchase obligation for long futures contracts or the market value of the instrument underlying the contract, but not less than the market price at which the futures contract was established, for short futures contracts.
The average notional amount of futures contracts during the year ended October 31, 2017, was as follows:
| | | | |
| | | HIGH YIELD
FUND | |
| Total long futures contracts | | $ | 68,783 | |
| Total short futures contracts | | $ | 27,144,443 | |
Options — The Funds may purchase and write call or put options on securities and indices and enter into related closing transactions. The U.S. Large Cap VRP Fund, U.S. Small Cap VRP Fund, International Developed Markets VRP Fund and the Emerging Markets VRP Fund wrote call or put options during the year ended October 31, 2017. The Funds write put and call options to earn premium income. With options, there is minimal counterparty credit risk to the Funds since options are exchange-traded and the exchange’s clearinghouse, as counterparty to all exchange-traded options, guarantees the options against default. As the writer of a call option, the Funds have the obligation to sell the security at the exercise price during the exercise period. As a writer of a put option, the Funds have the obligation to buy the underlying security at the exercise price during the exercise period. The premium that the Funds pay when purchasing a call option or receive when writing a call option will reflect, among other things, the market price of the security, the relationship of the exercise price to the market price of the security, the relationship of the exercise price to the volatility of the security, the length of the option period and supply and demand factors. The premium is the market value of the option.
A purchaser (holder) of a put option pays a non-refundable premium to the seller (writer) of a put option to obtain the right to sell a specified amount of a security at a fixed price (the exercise price) during a specified period (exercise period). Conversely, the seller (writer) of a put option, upon payment by the holder of the premium, has the obligation to buy the security from the holder of the put option at the exercise price during the exercise period. When an option is exercised, the premium originally received decreases the cost basis of the underlying security (or increases the proceeds on the security sold short) and the Funds realize a gain or loss from the sale of the security (or closing of the short sale).
Options on indices are similar to options on securities, except that upon exercise index options require cash payments and do not involve the actual purchase or sale of securities.
The average market values of written options for the year ended October 31, 2017, were as follows:
| | | | | | | | | | | | | | | | |
| | | U.S. LARGE CAP
VRP FUND | | | U.S. SMALL CAP
VRP FUND | | | INTERNATIONAL
DEVELOPED
MARKETS
VRP FUND | | | EMERGING
MARKETS
VRP FUND | |
Written Options | | $ | 1,066,396 | | | $ | 870,984 | | | $ | 933,636 | | | $ | 454,320 | |
| | | | | | | | | | | | | | | | |
| | Stone Ridge Funds | | | | | | Annual Report | | | | | | October 31, 2017 | | |
| | | | | | | | | | |
62
| | |
| Notes to Financial Statements | | October 31, 2017 |
The tables below reflect the values of derivative assets and liabilities as reflected in the Statement of Assets and Liabilities.
| | | | | | |
| |
| | | ASSET DERIVATIVES | |
| | | STATEMENT OF ASSETS AND
LIABILITIES LOCATION | | FAIR VALUE | |
High Yield Fund | | | | | | |
Futures | | | | | | |
Foreign exchange contracts | | Net assets—Unrealized appreciation* | | $ | 731,603 | |
Interest rate contracts | | Net assets—Unrealized appreciation* | | | 67,910 | |
| * | Reflects cumulative unrealized appreciation of futures contracts as reported in the Schedule of Investments. |
| | | | | | |
| | | LIABILITY DERIVATIVES | |
| | | STATEMENT OF ASSETS AND
LIABILITIES LOCATION | | FAIR VALUE | |
| | |
U.S. Large Cap VRP Fund | | | | | | |
Options | | | | | | |
Equity contracts | | Written options, at fair value | | $ | 975,950 | |
| | |
U.S. Small Cap VRP Fund | | | | | | |
Options | | | | | | |
Equity contracts | | Written options, at fair value | | | 653,540 | |
| | |
International Developed Markets VRP Fund | | | | | | |
Options | | | | | | |
Equity contracts | | Written options, at fair value | | | 523,002 | |
| | |
Emerging Markets VRP Fund | | | | | | |
Options | | | | | | |
Equity contracts | | Written options, at fair value | | | 99,804 | |
| * | Reflects cumulative unrealized depreciation of futures contracts as reported in the Schedule of Investments. |
The tables below reflect the effect of derivative instruments on the Statement of Operations for the year ended October 31, 2017.
| | | | | | | | | | | | |
| AMOUNT OF REALIZED GAIN OR (LOSS) ON DERIVATIVES TRANSACTIONS | |
| | | FUTURES
CONTRACTS | | | WRITTEN
OPTIONS | | | TOTAL | |
High Yield Fund | | | | | | | | | | | | |
Foreign exchange contracts | | $ | (587,417 | ) | | $ | — | | | $ | (587,417 | ) |
Interest rate contracts | | | 34,383 | | | | — | | | | 34,383 | |
U.S. Large Cap VRP Fund | | | | | | | | | | | | |
Equity contracts | | | 30,963 | | | | 48,587,406 | | | | 48,618,369 | |
U.S. Small Cap VRP Fund | | | | | | | | | | | | |
Equity contracts | | | — | | | | 16,763,556 | | | | 16,763,556 | |
International Developed Markets VRP Fund | | | | | | | | | | | | |
Equity contracts | | | 23,151 | | | | 11,960,666 | | | | 11,983,817 | |
Emerging Markets VRP Fund | | | | | | | | | | | | |
Equity contracts | | | — | | | | 4,888,515 | | | | 4,888,515 | |
| | | | | | | | | | | | | | | | |
| | Stone Ridge Funds | | | | | | Annual Report | | | | | | October 31, 2017 | | |
| | | | | | | | | | |
63
| | |
| Notes to Financial Statements | | October 31, 2017 |
| | | | | | | | | | | | |
| CHANGE IN UNREALIZED APPRECIATION OR (DEPRECIATION) ON DERIVATIVES TRANSACTIONS | |
| | | FUTURES
CONTRACTS | | | WRITTEN
OPTIONS | | | TOTAL | |
High Yield Fund | | | | | | | | | | | | |
Foreign exchange contracts | | $ | (503,256 | ) | | $ | — | | | $ | (503,256 | ) |
Interest rate contracts | | | 33,618 | | | | — | | | | 33,618 | |
U.S. Large Cap VRP Fund | | | | | | | | | | | | |
Equity contracts | | | — | | | | (202,996 | ) | | | (202,996 | ) |
U.S. Small Cap VRP Fund | | | | | | | | | | | | |
Equity contracts | | | — | | | | (311,706 | ) | | | (311,706 | ) |
International Developed Markets VRP Fund | | | | | | | | | | | | |
Equity contracts | | | — | | | | 193,550 | | | | 193,550 | |
Emerging Markets VRP Fund | | | | | | | | | | | | |
Equity contracts | | | — | | | | 45,372 | | | | 45,372 | |
b) Offsetting on the Statement of Assets and Liabilities Accounting Standards Update No. 2011-11 “Disclosures about Offsetting Assets and Liabilities” (“ASU 2011-11”) intended to help investors and other financial statement users better assess the effect or potential effect of offsetting arrangements on a fund’s financial position. ASU 2011-11 requires entities to disclose both gross and net information about both instruments and transactions eligible for offset on the Statement of Assets and Liabilities, and disclose instruments and transactions subject to master netting or similar agreements. In addition, in January 2013, the FASB issued Accounting Standards Update No. 2013-1 “Clarifying the Scope of Offsetting Assets and Liabilities” (“ASU 2013-1”), specifying exactly which transactions are subject to offsetting disclosures. The scope of the disclosure requirement is limited to derivative instruments, repurchase agreements and reverse repurchase agreements, and securities lending transactions. The International Swap and Derivative Association (“ISDA”) agreements specify collateral posting arrangements. Under the agreements, collateral is routinely transferred if the total net exposure to certain transactions (net of existing collateral already in place) governed under an agreement with a counterparty in a given account exceeds a specified threshold.
As of October 31, 2017 the Funds were not subject to any Master Netting Arrangements.
(c) Use of Estimates The preparation of the financial statements in conformity with GAAP requires management to make estimates and assumptions that affect the reported amounts of assets and liabilities and disclosure of contingent assets and liabilities at the date of the financial statements and the reported amounts of increases and decreases in net assets from operations during the reporting period. Actual results could differ from those estimates.
(d) Indemnifications In the normal course of business, the Funds enter into contracts that contain a variety of representations which provide general indemnifications. The Funds’ maximum exposure under these arrangements cannot be known; however, the Funds expect any risk of loss to be remote.
(e) Federal Income Taxes The Funds intend to qualify as “regulated investment companies” under Subchapter M of the Internal Revenue Code of 1986, as amended. If so qualified, the Funds will not be subject to federal income tax to the extent they distribute substantially all of their net investment income and capital gains to shareholders. Therefore, no federal income tax provision is required.
(f) Event-Linked Bonds Event-linked bonds are variable rate debt securities for which the return of principal and payment of interest are contingent on the non-occurrence of a specified trigger event(s) that leads to economic and/or human loss, such as an earthquake of a particular magnitude or a hurricane of a specific category. The most common type of event-linked bonds is known as “catastrophe” or “CAT” bonds. In most cases, the trigger event(s) will not be deemed to have occurred unless the event(s) happened in a particular geographic area and was of a certain magnitude (based on independent scientific readings) and/or caused a certain amount of actual or modeled loss. If the trigger event(s) occurs prior to a bond’s maturity, the High Yield Fund may lose all or a portion of its principal and forgo additional interest. In this regard, event-linked bonds typically have a special condition that states that if the sponsor suffers a loss from a particular pre-defined catastrophe or other event that results in physical and/or economic loss, then
| | | | | | | | | | | | | | | | |
| | Stone Ridge Funds | | | | | | Annual Report | | | | | | October 31, 2017 | | |
| | | | | | | | | | |
64
| | |
| Notes to Financial Statements | | October 31, 2017 |
the issuer’s obligation to pay interest and/or repay the principal is either deferred or completely forgiven. For example, if the High Yield Fund holds a bond that covers a sponsor’s losses due to a hurricane with a “trigger” at $1 billion and a hurricane hits causing $1 billion or more in losses to such sponsor, then the Fund will lose all or a portion of its principal invested in the bond and forgo any future interest payments. If the trigger event(s) does not occur, the High Yield Fund will recover its principal plus interest. Interest typically accrues and is paid on a quarterly basis for the specified duration of the bond, as long as the trigger event(s) does not occur. Although principal typically is repaid only on the maturity date, it may be repaid in installments, depending on the terms of the bond, as long as the trigger event(s) does not occur. The High Yield Fund may invest in event-linked bonds directly or indirectly through certain derivative instruments. The High Yield Fund may pursue other types of event-linked derivative strategies using derivative instruments that are typically contingent, or formulaically related to defined trigger events. Trigger events may include hurricanes, earthquakes and weather-related phenomena, non-natural catastrophes, such as plane crashes, or other events resulting in a specified level of physical or economic loss, such as mortality or longevity.
(g) Quota Share Notes Investments in Quota Share Notes provide exposure to a form of proportional reinsurance in which an investor participates in the premiums and losses of a reinsurer’s portfolio according to a pre-defined percentage. For example, under a 20% quota-share agreement, a special purpose vehicle (“SPV”) would obtain 20% of all premiums of the subject portfolio while being responsible for 20% of all claims, and the High Yield Fund, as a holder of a Quota Share Note issued by the SPV, would be entitled to its pro rata share of the premiums received by the SPV and would be responsible for its pro rata share of the claims up to the total amount invested.
(h) Excess of Loss Notes Excess of Loss Notes provide exposure to a form of reinsurance pursuant to which one party (typically an insurer or reinsurer) purchases protection against losses that exceed a specified threshold up to a set limit. For example, under such an arrangement, an insurer may have a book of business with $6 billion of total risk in respect of large, catastrophic losses. The insurer can purchase per-occurrence excess-of-loss reinsurance protection from an SPV for 40% of single-event losses the insurer suffers between $4 billion and $5 billion by paying the SPV a fixed premium. In this example, if the insurer suffered a loss of $5 billion due to one event, it would cover the first $4 billion itself (the amount it retained) and file a reinsurance claim with the SPV to pay 40% of the further $1 billion in losses (i.e., $400 million) and pay the remaining $600 million itself. If the insurer had losses of $6 billion, it would cover the first $4 billion itself, look to the SPV to pay 40% of $1 billion (again paying the $600 million itself) and would further retain the obligation to pay the additional $1 billion that exceeds the reinsurance coverage. The “trigger” for this type of reinsurance contract would be losses in excess of the specified amount.
(i) ILW Notes ILW Notes provide exposure to a transaction through which one party (typically, an insurance company or reinsurance company, or a reinsurance-related asset manager) purchases protection based on the total loss arising from a catastrophic event to the entire insurance industry rather than the losses of any particular insurer. For example, the buyer of a “$100 million limit U.S. Wind ILW attaching at $20 billion” will pay an upfront premium to a protection writer (i.e., the reinsurer or an SPV) and in return will receive $100 million if total losses to the insurance industry from a single U.S. hurricane exceed $20 billion. The industry loss ($20 billion in this case) is often referred to as the “trigger” and is reported by an independent third party after an event has occurred. The amount of protection offered by the contract ($100 million in this case) is referred to as the “limit.” ILW Notes could also provide exposure to transactions linked to an index not linked to insurance industry losses, such as wind speed or earthquake magnitude and location. The High Yield Fund, as a holder of an ILW Note, would be entitled to a return linked to the premium paid by the sponsor and the occurrence or non-occurrence of the trigger event.
(j) Distributions to Shareholders The Funds intend to distribute to their shareholders any net investment income and any net realized long- or short-term capital gains, if any, at least annually. Distributions are recorded on ex-dividend date. The Funds each may periodically make reclassifications among certain of their capital accounts as a result of the characterization of certain income and realized gains determined annually in accordance with federal tax regulations that may differ from GAAP.
(k) Foreign Securities and Currency Transactions The Funds’ books and records are maintained in U.S. dollars. Foreign currency denominated transactions (i.e. market value of investment securities, assets and liabilities, purchases and sales of investment securities, and income and expenses) are translated into U.S. dollars at the current rate of exchange. The Funds isolate that portion of results of operations resulting from changes in foreign exchange rates on
| | | | | | | | | | | | | | | | |
| | Stone Ridge Funds | | | | | | Annual Report | | | | | | October 31, 2017 | | |
| | | | | | | | | | |
65
| | |
| Notes to Financial Statements | | October 31, 2017 |
investments from the fluctuations arising from changes in market prices of securities held and it is reported as realized gains (losses) on foreign currency translation and change in unrealized appreciation (depreciation) on foreign currency related items on the Funds’ statement of operations.
The High Yield Fund may invest in reinsurance-related securities issued by foreign sovereigns and foreign entities that are corporations, partnerships, trusts or other types of business entities. Because the majority of reinsurance-related security issuers are domiciled outside the United States, the High Yield Fund will normally invest a significant amount of its assets in non-U.S. entities. Accordingly, the High Yield Fund may invest without limitation in securities issued by non-U.S. entities, including those in emerging market countries. Certain SPVs in which the High Yield Fund invests may be sponsored by non-U.S. insurers that are not subject to the same regulation as that to which U.S. ceding insurers are subject. Such SPVs may pose a greater risk of loss, for example due to less stringent underwriting and/or risk-retention requirements. The High Yield Fund’s investments will consist primarily of event-linked bonds, Quota Share Notes, Excess of Loss Notes and ILW Notes that provide the High Yield Fund with contractual rights under the terms of the bond issuance. While the contractual rights of such instruments are similar whether they are issued by a U.S. issuer or a non-U.S. issuer, there may be certain additional risks associated with non-U.S. issuers. For example, foreign issuers could be affected by factors not present in the United States, including expropriation, confiscatory taxation, lack of uniform accounting and auditing standards, less publicly available financial and other information, potential difficulties in enforcing contractual obligations, and increased costs to enforce applicable contractual obligations outside the United States. Fluctuations in foreign currency exchange rates and exchange controls may adversely affect the market value of the High Yield Fund’s investments in foreign securities. Settlements of securities transactions in foreign countries are subject to risk of loss, may be delayed and are generally less frequent than in the United States, which could affect the liquidity of the High Yield Fund’s assets.
The International VRP Funds invest primarily in foreign issued securities. Investments in foreign (non-U.S.) issuers involve risks not ordinarily associated with exposure to securities and instruments of U.S. issuers, including risks relating to political, social and economic developments affecting issuers located in foreign countries and differences between U.S. and foreign regulatory requirements and market practices, including fluctuations in foreign currency exchange rates and regulations, or foreign withholding taxes. Investing directly or indirectly in foreign securities may result in the Fund experiencing more rapid and extreme changes in value than a fund that obtains exposure exclusively in securities of U.S. issuers.
If the Funds invest in foreign issuers by purchasing American Depositary Receipts (“ADRs”) (U.S. dollar-denominated depositary receipts issued generally by banks and representing the deposit with the bank of a security of a non-U.S. issuer; ADRs are publicly traded on exchanges or over-the counter in the United States), the Funds are exposed to credit risk with respect to the issuer of the ADR, in addition to the risks of the underlying foreign securities.
(l) Allocation of Income, Expenses, Gains/Losses Income, expenses (other than those deemed attributable to a specific share class), and gains and losses of each fund are allocated daily to each share class based upon the ratio of net assets represented by each class as a percentage of the net assets of each fund. Expenses deemed directly attributable to a class of shares are recorded by the specific class. Most expenses are allocated based on average net assets, with the exception of 12b-1 fees, which are expensed at 0.15% of average daily net assets of the Class M shares.
(m) Other Investment transactions are recorded on the trade date. Dividend income, less any foreign tax withheld, is recognized on the ex-dividend date and interest income is recognized on an accrual basis, including amortization/accretion of premiums or discounts. Discounts and premiums on securities purchased are amortized over the lives of the respective securities using the constant yield method.
(n) Restricted Securities The Funds may invest a substantial portion of their assets in securities that are restricted, but eligible for purchase and sale by certain qualified institutional buyers, as defined in Rule 144A under the Securities Act of 1933, as amended, as well as other restricted securities. Restricted securities may be resold in transactions that are exempt from registration under Federal securities laws or if the securities are publicly registered. Restricted securities may be deemed illiquid.
| | | | | | | | | | | | | | | | |
| | Stone Ridge Funds | | | | | | Annual Report | | | | | | October 31, 2017 | | |
| | | | | | | | | | |
66
| | |
| Notes to Financial Statements | | October 31, 2017 |
(o) REIT Distributions The character of distributions received from real estate investment trusts (“REITs”) held by the Funds is generally comprised of net investment income, capital gains, and return of capital. It is the policy of the Funds to estimate the character of distributions received from underlying REITs based on historical data provided by the REITs. After each calendar year end, REITs report the actual tax character of these distributions. Differences between the estimated and actual amounts reported by the REITs are reflected in the Funds’ records in the year in which they are reported by the REITs by adjusting related investment cost basis, capital gains and income, as necessary.
3. Federal Tax Matters
Provisions for federal income taxes or excise taxes have not been made since the Funds intend to be taxed as Regulated Investment Companies and intend to distribute substantially all taxable income to shareholders and otherwise comply with the provisions of the Internal Revenue Code applicable to Regulated Investment Companies. Distributions from net realized gains for book purposes may include short-term capital gains which are included as ordinary income to shareholders for tax purposes. Additionally, GAAP requires that certain components of net assets relating to permanent differences be reclassified between financial and tax reporting. The reclassifications have no effect on net assets or NAV per share.
For the year ended October 31, 2017, the effect of permanent “book/tax” reclassifications resulted in increases and decreases to components of the Funds’ net assets as follows:
| | | | | | | | | | | | |
| | | UNDISTRIBUTED
NET INVESTMENT
INCOME/(LOSS) | | | ACCUMULATED
NET REALIZED
GAIN/(LOSS) | | | PAID IN
CAPITAL | |
High Yield Fund | | $ | (29,285,150 | ) | | $ | (25,560,669 | ) | | $ | 54,845,819 | |
U.S. Large Cap VRP Fund | | | 2,997,793 | | | | (2,997,792 | ) | | | (1 | ) |
U.S. Small Cap VRP Fund | | | 2,607,657 | | | | (2,607,657 | ) | | | — | |
U.S. VRP Master Fund | | | (65,617 | ) | | | 65,617 | | | | — | |
International Developed Markets VRP Fund | | | 2,499,713 | | | | (2,499,713 | ) | | | — | |
Emerging Markets VRP Fund | | | 886,382 | | | | (886,382 | ) | | | — | |
International VRP Master Fund | | | (14,269 | ) | | | 14,270 | | | | (1 | ) |
Global Equity VRP Master Fund | | | (4,114 | ) | | | 4,114 | | | | — | |
These differences primarily relate to treatment of foreign currency gains/(losses), investments in passive foreign investments (“PFICs”), investments in real estate investment trusts (“REITs”), net operating losses and tax-exempt mergers.
As of October 31, 2017, the components of accumulated earnings (losses) for income tax purposes were as follows:
| | | | | | | | | | | | | | | | | | | | | | | | | | | | | | | | |
| | | HIGH YIELD
FUND | | | U.S. LARGE
CAP VRP
FUND | | | U.S. SMALL
CAP VRP
FUND | | | U.S. VRP
MASTER
FUND | | | INTERNATIONAL
DEVELOPED
MARKETS VRP
FUND | | | EMERGING
MARKETS
VRP FUND | | | INTERNATIONAL
VRP MASTER
FUND | | | GLOBAL EQUITY
VRP MASTER
FUND | |
Tax cost of investments | | $ | 1,196,330,440 | | | $ | 354,290,418 | | | $ | 127,415,675 | | | $ | 204,702,899 | | | $ | 97,058,229 | | | $ | 15,639,765 | | | $ | 11,191,452 | | | $ | 36,362,328 | |
Unrealized appreciation | | | 19,727,806 | | | | 5,852 | | | | 35 | | | | 24,833,537 | | | | 136,577 | | | | 44,447 | | | | 576,537 | | | | 2,719,395 | |
Unrealized depreciation | | | (115,593,312 | ) | | | (113,992 | ) | | | (56,487 | ) | | | — | | | | (91,691 | ) | | | (14,634 | ) | | | — | | | | — | |
Net unrealized appreciation (depreciation) | | | (95,865,506 | ) | | | (108,140 | ) | | | (56,452 | ) | | | 24,833,537 | | | | 44,886 | | | | 29,813 | | | | 576,537 | | | | 2,719,395 | |
Undistributed ordinary income | | | — | | | | 16,157,247 | | | | 3,909,254 | | | | — | | | | 7,947,541 | | | | 1,158,886 | | | | 307,187 | | | | 493,756 | |
Undistributed long-term gains/(capital loss carryover) | | | (34,215,655 | ) | | | 29,050,399 | | | | 9,889,520 | | | | 8,745,269 | | | | 1,636,391 | | | | — | | | | (1,258,574 | ) | | | 922,634 | |
Total distributable earnings | | | (34,215,655 | ) | | | 45,207,646 | | | | 13,798,774 | | | | 8,745,269 | | | | 9,583,932 | | | | 1,158,886 | | | | (951,387 | ) | | | 1,416,390 | |
Other temporary differences | | | (6,723,209 | ) | | | — | | | | — | | | | (164,483 | ) | | | — | | | | (1,562,393 | ) | | | (506,614 | ) | | | — | |
Total accumulated earnings (loss) | | $ | (123,357,952 | ) | | $ | 45,099,506 | | | $ | 13,742,322 | | | $ | 33,414,323 | | | $ | 9,628,818 | | | $ | (373,694 | ) | | $ | (881,464 | ) | | $ | 4,135,785 | |
| | | | | | | | | | | | | | | | |
| | Stone Ridge Funds | | | | | | Annual Report | | | | | | October 31, 2017 | | |
| | | | | | | | | | |
67
| | |
| Notes to Financial Statements | | October 31, 2017 |
The difference between book-basis and tax-basis unrealized appreciation (depreciation) is attributable primarily to mark-to-market adjustments on PFICs, wash sales, and return of capital from underlying investments.
The tax character of distributions paid during the period ended October 31, 2017 was as follows:
| | | | | | | | | | | | | | | | |
| | | ORDINARY
INCOME | | | LONG-TERM
CAPITAL GAIN | | | RETURN OF
CAPITAL | | | TOTAL | |
High Yield Fund | | $ | 67,981,099 | | | $ | — | | | $ | 560,044 | | | $ | 68,541,143 | |
U.S. Large Cap VRP Fund | | | 218,283 | | | | 15,915,528 | | | | — | | | | 16,133,811 | |
U.S. Small Cap VRP Fund | | | — | | | | 2,157,256 | | | | — | | | | 2,157,256 | |
U.S. VRP Master Fund | | | — | | | | 9,716,711 | | | | — | | | | 9,716,711 | |
International Developed Markets VRP Fund | | | — | | | | 348,143 | | | | — | | | | 348,143 | |
Emerging Markets VRP Fund | | | 1,562,393 | | | | — | | | | — | | | | 1,562,393 | |
International VRP Master Fund | | | 506,614 | | | | — | | | | — | | | | 506,614 | |
Global Equity VRP Master Fund | | | — | | | | 1,016,316 | | | | — | | | | 1,016,316 | |
Each of the Funds designate as long-term capital gain dividend, pursuant to Internal Revenue Code Section 852(b)(3), the amount necessary to reduce the earnings and profits of the fund related to net capital gain to zero for the tax year ended October 31, 2017.
The tax character of distributions paid during the period ended October 31, 2016 was as follows:
| | | | | | | | | | | | | | | | |
| | | ORDINARY
INCOME | | | LONG-TERM
CAPITAL GAIN | | | RETURN OF
CAPITAL | | | TOTAL | |
High Yield Fund | | $ | 26,525,467 | | | $ | — | | | $ | — | | | $ | 26,525,467 | |
U.S. Large Cap VRP Fund | | | — | | | | 20,542,349 | | | | — | | | | 20,542,349 | |
U.S. Small Cap VRP Fund | | | — | | | | 5,009,156 | | | | — | | | | 5,009,156 | |
U.S. VRP Master Fund | | | — | | | | 2,575,794 | | | | — | | | | 2,575,794 | |
International Developed Markets VRP Fund | | | — | | | | 1,803,640 | | | | — | | | | 1,803,640 | |
Emerging Markets VRP Fund | | | — | | | | — | | | | — | | | | — | |
International VRP Master Fund | | | — | | | | — | | | | — | | | | — | |
Global Equity VRP Master Fund | | | 368,786 | | | | 330,592 | | | | — | | | | 699,378 | |
At October 31, 2017 certain Funds have tax basis capital losses which may be carried forward indefinitely to offset future capital gains as shown below:
| | | | | | | | | | | | |
| | | SHORT-TERM | | | LONG-TERM | | | TOTAL | |
High Yield Fund | | $ | (2,570,866 | ) | | $ | (31,644,789 | ) | | $ | (34,215,655 | ) |
U.S. Large Cap VRP Fund | | | — | | | | — | | | | — | |
U.S. Small Cap VRP Fund | | | — | | | | — | | | | — | |
U.S. VRP Master Fund | | | — | | | | — | | | | — | |
International Developed Markets VRP Fund | | | — | | | | — | | | | — | |
Emerging Markets VRP Fund | | | — | | | | — | | | | — | |
International VRP Master Fund | | | — | | | | (1,258,574 | ) | | | (1,258,574 | ) |
Global Equity VRP Master Fund | | | — | | | | — | | | | — | |
To the extent that the Funds listed above may realize future net capital gains, those gains will be offset by any of their unused respective capital loss carryforwards.
| | | | | | | | | | | | | | | | |
| | Stone Ridge Funds | | | | | | Annual Report | | | | | | October 31, 2017 | | |
| | | | | | | | | | |
68
| | |
| Notes to Financial Statements | | October 31, 2017 |
Pursuant to Federal income tax regulations applicable to Regulated Investment Companies, on October 31, 2017 the Funds elected to defer, on a tax basis, ordinary late-year losses incurred between January 1, 2017 and October 31, 2017. Consequently, these losses are deemed to arise on November 1, 2017 as follows:
| | | | |
| | | | |
High Yield Fund | | $ | — | |
U.S. Large Cap VRP Fund | | | — | |
U.S. Small Cap VRP Fund | | | — | |
U.S. VRP Master Fund | | | 164,484 | |
International Developed Markets VRP Fund | | | — | |
Emerging Markets VRP Fund | | | — | |
International VRP Master Fund | | | — | |
Global Equity VRP Master Fund | | | — | |
There is no tax liability resulting from unrecognized tax benefits relating to uncertain income tax positions taken or expected to be taken on the tax return for the fiscal year-ended October 31, 2017, or for any other tax years which are open for exam. As of October 31, 2017 open tax years include the periods ended October 31, 2015, 2016 and 2017. The Funds recognize interest and penalties, if any, related to unrecognized tax benefits as income tax expense in the Statement of Operations. During the year, the Funds did not incur any interest or penalties.
4. Agreements
(a) Investment Management Agreement The Adviser is the Funds’ investment adviser and was organized as a Delaware limited liability company in 2012. The Adviser’s primary business is to provide a variety of investment management services, including an investment program for the Funds.
As compensation for its services, the Adviser is paid by the High Yield Fund a fee, computed daily and paid monthly in arrears, at the annual rate of 1.50% of the Fund’s average daily net assets. As compensation for its services, the Adviser is paid by each of the U.S. VRP Funds and International VRP Funds a fee, computed daily and paid monthly in arrears, at the annual rate of 1.25% of that Fund’s average daily net assets. The U.S. VRP Master Fund, International VRP Master Fund and the Global Equity VRP Master Fund do not pay an advisory fee to the Adviser.
Through February 28, 2018 for the High Yield Fund, U.S. VRP Funds, and the International VRP Portfolio of Funds, the Adviser has agreed to waive its management fee and/or pay or otherwise bear operating and other expenses of certain funds or classes thereof (excluding brokerage and transactional expenses, borrowing and other investment-related costs and fees including interest and commitment fees, short dividend expense, acquired fund fees and expenses, taxes, litigation and indemnification expenses, judgments and extraordinary expenses not incurred in the ordinary course of the Funds’ business) solely to the extent necessary to limit the Funds’ total annual fund operating expenses to 1.65% for Class I shares and 1.80% for Class M shares of the High Yield Fund, 1.75% for the Class I shares and 1.90% for the Class M shares of each of the U.S. VRP Funds and the International Developed Markets VRP Fund, 1.80% for the Class I shares and 1.95% for the Class M shares of the Emerging Markets VRP Fund, and 0.25% for the Class I shares and 0.40% for the Class M shares of the International VRP Master Fund and the Global Equity VRP Master Fund. With respect to each Fund, the Adviser is permitted to recoup in later periods expenses attributable to a Class that the Adviser has paid or otherwise borne (whether through reduction of its management fee or otherwise) to the extent that the expenses for the Class of shares fall below the annual limitation rate in effect at the time of the actual waiver/reimbursement and to the extent that they do not cause the Class to exceed the annual rate in effect at the time of the recoupment; provided, however, that the Adviser shall not be permitted to recoup any such fees or expenses beyond three years from the month end in which the Adviser reduced a fee or reimbursed an expense. During the year ended, October 31, 2017, the Adviser has waived amounts as disclosed in the Fund’s Statement of Operations. The Adviser may recoup the below fees:
| | | | | | | | | | | | | | | | |
| | Stone Ridge Funds | | | | | | Annual Report | | | | | | October 31, 2017 | | |
| | | | | | | | | | |
69
| | |
| Notes to Financial Statements | | October 31, 2017 |
| | | | | | | | | | | | |
| FUND | | REMAINING AMOUNT
TO BE RECOUPED
(EXPIRING BY
OCTOBER 31, 2018) | | | REMAINING AMOUNT
TO BE RECOUPED
(EXPIRING BY
OCTOBER 31, 2019) | | | REMAINING AMOUNT
TO BE RECOUPED
(EXPIRING BY
OCTOBER 31, 2020) | |
High Yield Fund | | $ | — | | | $ | — | | | $ | 487,916 | |
U.S. Large Cap VRP Fund | | | — | | | | — | | | | 60,860 | |
U.S. Small Cap VRP Fund | | | — | | | | — | | | | 163,897 | |
International Developed Markets VRP Fund | | | — | | | | — | | | | 190,217 | |
Emerging Markets VRP Fund | | | 147,055 | | | | 15,364 | | | | 321,063 | |
International VRP Master Fund | | | 61,235 | | | | 71,499 | | | | 92,598 | |
Global Equity VRP Master Fund | | | 125,491 | | | | 54,253 | | | | 41,939 | |
(b) Custodian, Administrator and Transfer Agent The custodian to the Trust is U.S. Bank, N.A. The administrator and transfer agent to the Trust is U.S. Bancorp Fund Services, LLC, an affiliate of U.S. Bank, N.A.
(c) Distributor ALPS Distributors, Inc. (the “Distributor”) serves as the Funds’ distributor. Prior to August 14, 2017, Quasar Distributors, LLC served as the Funds’ distributor.
5. Distribution Plan
Class M Shares of the Funds pay Rule 12b-1 fees to compensate such financial intermediaries in connection with (i) personal and account maintenance services rendered to Class M shareholders (fees for such services, “servicing fees”) and/or (ii) activities or expenses primarily intended to result in the sale of Class M shares (fees for such services, if any, “distribution fees”). Servicing fees and distribution fees may be paid pursuant to a Distribution Plan (“12b-1 Plan”) adopted by each Fund at the maximum annual rate of 0.15% of such Fund’s average daily net assets attributable to Class M. These fees are paid out of each Fund’s Class M shares’ assets on an ongoing basis and may be administered or facilitated by the Distributor. Because Rule 12b-1 fees are paid out of a Fund’s assets on an ongoing basis, over time these fees will increase the cost of your investment and may cost you more than other types of sales changes. The Distributor does not retain any portion of the distribution fees.
6. Related Parties
Certain officers of the Trust are also employees of the Adviser. The Officers, with the exception of a portion of the Chief Compliance Officer’s salary, are not compensated by the Trust.
7. Investment Transactions
For the year ended October 31, 2017, aggregate purchases and sales of securities (excluding short-term securities) by the Funds were as follows:
| | | | | | | | | | | | | | | | | | | | | | | | | | | | | | | | |
| | | HIGH
YIELD
FUND | | | U.S. LARGE
CAP VRP
FUND | | | U.S. SMALL
CAP VRP
FUND | | | U.S. VRP
MASTER
FUND | | | INTERNATIONAL
DEVELOPED
MARKETS VRP
FUND | | | EMERGING
MARKETS
VRP FUND | | | INTERNATIONAL
VRP MASTER
FUND | | | GLOBAL EQUITY
VRP MASTER
FUND | |
Purchases | | $ | 325,031,010 | | | $ | — | | | $ | — | | | $ | 25,300,000 | | | $ | 4,491 | | | $ | — | | | $ | 427,190 | | | $ | 3,650,000 | |
Sales | | | 583,957,197 | | | | — | | | | 9,176 | | | | 29,700,000 | | | | — | | | | 7,854,110 | | | | 1,450,000 | | | | 8,800,000 | |
U.S. Government Security Purchases | | | — | | | | — | | | | — | | | | — | | | | — | | | | — | | | | — | | | | — | |
U.S. Government Security Sales | | | — | | | | — | | | | — | | | | — | | | | — | | | | — | | | | — | | | | — | |
| | | | | | | | | | | | | | | | |
| | Stone Ridge Funds | | | | | | Annual Report | | | | | | October 31, 2017 | | |
| | | | | | | | | | |
70
| | |
| Notes to Financial Statements | | October 31, 2017 |
8. Capital Share Transactions
| | | | | | | | |
| HIGH YIELD FUND - CLASS I | | YEAR ENDED
OCTOBER 31, 2017 | | | YEAR ENDED
OCTOBER 31, 2016 | |
Shares sold | | | 15,250,613 | | | | 7,730,567 | |
Shares sold in connection with acquisition(1) | | | 83,958,774 | | | | | |
Shares issued to holders in reinvestment of dividends | | | 4,998,356 | | | | 2,114,105 | |
Shares redeemed | | | (45,909,267 | ) | | | (10,510,679 | ) |
Net increase (decrease) in shares | | | 58,298,476 | | | | (666,007 | ) |
Shares outstanding: | | | | | | | | |
Beginning of year | | | 41,371,548 | | | | 42,037,555 | |
End of year | | | 99,670,024 | | | | 41,371,548 | |
| | | | | | | | |
| HIGH YIELD FUND - CLASS M | | | | | | |
Shares sold | | | 8,035,968 | | | | 2,086,393 | |
Shares sold in connection with acquisition(1) | | | 19,117,178 | | | | | |
Shares issued to holders in reinvestment of dividends | | | 791,160 | | | | 272,346 | |
Shares redeemed | | | (13,564,849 | ) | | | (1,982,056 | ) |
Net increase in shares | | | 14,379,457 | | | | 376,683 | |
Shares outstanding: | | | | | | | | |
Beginning of year | | | 6,072,312 | | | | 5,695,629 | |
End of year | | | 20,451,769 | | | | 6,072,312 | |
| | | | | | | | |
| U.S. LARGE CAP VRP FUND - CLASS I | | | | | | |
Shares sold | | | 5,287,944 | | | | 7,900,168 | |
Shares issued to holders in reinvestment of dividends | | | 495,141 | | | | 586,798 | |
Shares redeemed | | | (8,980,504 | ) | | | (5,268,632 | ) |
Net increase (decrease) in shares | | | (3,197,419 | ) | | | 3,218,334 | |
Shares outstanding: | | | | | | | | |
Beginning of year | | | 29,430,293 | | | | 26,211,959 | |
End of year | | | 26,232,874 | | | | 29,430,293 | |
| | | | | | | | |
| U.S. LARGE CAP VRP FUND - CLASS M | | | | | | |
Shares sold | | | 833,402 | | | | 992,059 | |
Shares issued to holders in reinvestment of dividends | | | 262,614 | | | | 448,110 | |
Shares redeemed | | | (3,051,519 | ) | | | (3,591,462 | ) |
Net decrease in shares | | | (1,955,503 | ) | | | (2,151,293 | ) |
Shares outstanding: | | | | | | | | |
Beginning of year | | | 6,457,512 | | | | 8,608,805 | |
End of year | | | 4,502,009 | | | | 6,457,512 | |
| | | | | | | | |
| U.S. SMALL CAP VRP FUND - CLASS I | | | | | | |
Shares sold | | | 930,764 | | | | 3,271,493 | |
Shares issued to holders in reinvestment of dividends | | | 57,918 | | | | 147,717 | |
Shares redeemed | | | (2,344,514 | ) | | | (2,845,362 | ) |
Net increase (decrease) in shares | | | (1,355,832 | ) | | | 573,848 | |
Shares outstanding: | | | | | | | | |
Beginning of year | | | 11,397,717 | | | | 10,823,869 | |
End of year | | | 10,041,885 | | | | 11,397,717 | |
| | | | | | | | | | | | | | | | |
| | Stone Ridge Funds | | | | | | Annual Report | | | | | | October 31, 2017 | | |
| | | | | | | | | | |
71
| | |
| Notes to Financial Statements | | October 31, 2017 |
| | | | | | | | |
| U.S. SMALL CAP VRP FUND - CLASS M | | YEAR ENDED
OCTOBER 31, 2017 | | | YEAR ENDED
OCTOBER 31, 2016 | |
Shares sold | | | 275,897 | | | | 175,450 | |
Shares issued to holders in reinvestment of dividends | | | 20,998 | | | | 58,961 | |
Shares redeemed | | | (316,542 | ) | | | (541,182 | ) |
Net decrease in shares | | | (19,647 | ) | | | (306,771 | ) |
Shares outstanding: | | | | | | | | |
Beginning of year | | | 1,326,721 | | | | 1,633,492 | |
End of year | | | 1,307,074 | | | | 1,326,721 | |
| | | | | | | | |
| U.S. VRP MASTER FUND - CLASS I | | | | | | |
Shares sold | | | 2,002,402 | | | | 5,014,796 | |
Shares issued to holders in reinvestment of dividends | | | 366,049 | | | | 89,501 | |
Shares redeemed | | | (2,737,478 | ) | | | (1,883,545 | ) |
Net increase (decrease) in shares | | | (369,027 | ) | | | 3,220,752 | |
Shares outstanding: | | | | | | | | |
Beginning of year | | | 16,840,690 | | | | 13,619,938 | |
End of year | | | 16,471,663 | | | | 16,840,690 | |
| | | | | | | | |
| U.S. VRP MASTER FUND - CLASS M | | | | | | |
Shares sold | | | 554,310 | | | | 809,234 | |
Shares issued to holders in reinvestment of dividends | | | 129,021 | | | | 51,658 | |
Shares redeemed | | | (414,944 | ) | | | (2,771,034 | ) |
Net increase (decrease) in shares | | | 268,387 | | | | (1,910,142 | ) |
Shares outstanding: | | | | | | | | |
Beginning of year | | | 3,053,904 | | | | 4,964,046 | |
End of year | | | 3,322,291 | | | | 3,053,904 | |
| | | | | | | | |
| INTERNATIONAL DEVELOPED MARKETS VRP FUND - CLASS I | | | | | | |
Shares sold | | | 559,779 | | | | 1,795,333 | |
Shares issued to holders in reinvestment of dividends | | | 23,305 | | | | 125,097 | |
Shares redeemed | | | (1,474,553 | ) | | | (3,047,388 | ) |
Net decrease in shares | | | (891,469 | ) | | | (1,126,958 | ) |
Shares outstanding: | | | | | | | | |
Beginning of year | | | 7,980,402 | | | | 9,107,360 | |
End of year | | | 7,088,933 | | | | 7,980,402 | |
| | | | | | | | |
| INTERNATIONAL DEVELOPED MARKETS VRP FUND - CLASS M | | | | | | |
Shares sold | | | 99,486 | | | | 447,008 | |
Shares issued to holders in reinvestment of dividends | | | 6,954 | | | | 34,531 | |
Shares redeemed | | | (284,376 | ) | | | (584,773 | ) |
Net decrease in shares | | | (177,936 | ) | | | (103,234 | ) |
Shares outstanding: | | | | | | | | |
Beginning of year | | | 2,024,141 | | | | 2,127,375 | |
End of year | | | 1,846,205 | | | | 2,024,141 | |
| | | | | | | | |
| | | | | | | | | | | | | | | | |
| | Stone Ridge Funds | | | | | | Annual Report | | | | | | October 31, 2017 | | |
| | | | | | | | | | |
72
| | |
| Notes to Financial Statements | | October 31, 2017 |
| | | | | | | | |
| EMERGING MARKETS VRP FUND - CLASS I | | YEAR ENDED
OCTOBER 31, 2017 | | | YEAR ENDED
OCTOBER 31, 2016 | |
Shares sold | | | 375,011 | | | | 978,394 | |
Shares issued to holders in reinvestment of dividends | | | — | | | | — | |
Shares redeemed | | | (4,160,919 | ) | | | (1,351,568 | ) |
Net decrease in shares | | | (3,785,908 | ) | | | (373,174 | ) |
Shares outstanding: | | | | | | | | |
Beginning of year | | | 4,987,703 | | | | 5,360,877 | |
End of year | | | 1,201,795 | | | | 4,987,703 | |
| | | | | | | | |
| EMERGING MARKETS VRP FUND - CLASS M | | | | | | |
Shares sold | | | — | | | | 58,818 | |
Shares issued to holders in reinvestment of dividends | | | — | | | | — | |
Shares redeemed | | | (58,914 | ) | | | (15,796 | ) |
Net increase (decrease) in shares | | | (58,914 | ) | | | 43,022 | |
Shares outstanding: | | | | | | | | |
Beginning of year | | | 392,505 | | | | 349,483 | |
End of year | | | 333,591 | | | | 392,505 | |
| | | | | | | | |
| INTERNATIONAL VRP MASTER FUND - CLASS I | | | | | | |
Shares sold | | | 67,543 | | | | 741,368 | |
Shares issued to holders in reinvestment of dividends | | | — | | | | — | |
Shares redeemed | | | (118,082 | ) | | | (953,525 | ) |
Net decrease in shares | | | (50,539 | ) | | | (212,157 | ) |
Shares outstanding: | | | | | | | | |
Beginning of year | | | 790,364 | | | | 1,002,521 | |
End of year | | | 739,825 | | | | 790,364 | |
| | | | | | | | |
| INTERNATIONAL VRP MASTER FUND - CLASS M | | | | | | |
Shares sold | | | — | | | | 35,225 | |
Shares issued to holders in reinvestment of dividends | | | — | | | | — | |
Shares redeemed | | | (47,006 | ) | | | (1,679,137 | ) |
Net decrease in shares | | | (47,006 | ) | | | (1,643,912 | ) |
Shares outstanding: | | | | | | | | |
Beginning of year | | | 449,747 | | | | 2,093,659 | |
End of year | | | 402,741 | | | | 449,747 | |
| | | | | | | | |
| GLOBAL EQUITY VRP MASTER FUND - CLASS I | | | | | | |
Shares sold | | | 604,147 | | | | 745,120 | |
Shares issued to holders in reinvestment of dividends | | | 80,968 | | | | 56,080 | |
Shares redeemed | | | (1,081,217 | ) | | | (1,326,025 | ) |
Net decrease in shares | | | (396,102 | ) | | | (524,825 | ) |
Shares outstanding: | | | | | | | | |
Beginning of year | | | 3,339,382 | | | | 3,864,207 | |
End of year | | | 2,943,280 | | | | 3,339,382 | |
| | | | | | | | |
| | | | | | | | | | | | | | | | |
| | Stone Ridge Funds | | | | | | Annual Report | | | | | | October 31, 2017 | | |
| | | | | | | | | | |
73
| | |
| Notes to Financial Statements | | October 31, 2017 |
| | | | | | | | |
| GLOBAL EQUITY VRP MASTER FUND - CLASS M | | YEAR ENDED
OCTOBER 31, 2017 | | | YEAR ENDED
OCTOBER 31, 2016 | |
Shares sold | | | 34,707 | | | | 157,902 | |
Shares issued to holders in reinvestment of dividends | | | 15,872 | | | | 13,354 | |
Shares redeemed | | | (102,180 | ) | | | (375,860 | ) |
Net decrease in shares | | | (51,601 | ) | | | (204,604 | ) |
Shares outstanding: | | | | | | | | |
Beginning of year | | | 736,471 | | | | 941,075 | |
End of year | | | 684,870 | | | | 736,471 | |
| (1) | On December 5, 2016, the High Yield Fund acquired the Reinsurance Fund. (see Note 1 of the Notes to the Financial Statements). |
9. Transactions with Affiliates
The following issuers may be deemed to be affiliated with the Funds during the year ended October 31, 2017. As defined in Section (2)(a)(3) of the 1940 Act; such issuers are:
| | | | | | | | | | | | | | | | | | | | | | | | | | | | |
| | | U.S. VRP MASTER FUND | | | | | | INTERNATIONAL VRP MASTER FUND | |
| | | U.S. LARGE
CAP VRP
FUND—CLASS I | | | U.S. SMALL
CAP VRP
FUND—CLASS I | | | TOTAL | | | | | | INTERNATIONAL
DEVELOPED
MARKETS VRP
FUND—CLASS I | | | EMERGING
MARKETS VRP
FUND—CLASS I | | | TOTAL | |
| November 1, 2016 Balance | | | | | | | | | | | | | | | | | | | | | | | | | |
Shares | | | 13,510,250 | | | | 7,010,409 | | | | | | | | | | | | 806,654 | | | | 434,934 | | | | | |
Cost | | $ | 136,580,934 | | | $ | 70,142,253 | | | $ | 206,723,187 | | | | | | | $ | 7,786,213 | | | $ | 3,908,194 | | | $ | 11,694,407 | |
| Additions | | | | | | | | | | | | | | | | | | | | | | | | | |
Shares | | | 1,632,230 | | | | 734,886 | | | | | | | | | | | | 22,186 | | | | 22,187 | | | | | |
Cost | | $ | 17,500,000 | | | $ | 7,800,000 | | | | | | | | | | | $ | 227,190 | | | $ | 200,000 | | | | | |
| Reductions | | | | | | | | | | | | | | | | | | | | | | | | | |
Shares | | | 1,860,132 | | | | 882,162 | | | | | | | | | | | | 84,548 | | | | 64,054 | | | | | |
Cost | | $ | 19,204,398 | | | $ | 9,045,789 | | | | | | | | | | | $ | 844,937 | | | $ | 620,210 | | | | | |
| October 31, 2017 Balance | | | | | | | | | | | | | | | | | | | | | | | | | |
Shares | | | 13,282,348 | | | | 6,863,133 | | | | | | | | | | | | 744,292 | | | | 393,067 | | | | | |
Cost | | $ | 134,876,536 | | | $ | 68,896,464 | | | $ | 203,773,000 | | | | | | | $ | 7,168,466 | | | $ | 3,487,984 | | | $ | 10,656,450 | |
Value | | $ | 152,614,181 | | | $ | 76,592,568 | | | $ | 229,206,749 | | | | | | | $ | 8,060,687 | | | $ | 3,576,914 | | | $ | 11,637,601 | |
| Dividend Income | | $ | 84,960 | | | $ | — | | | $ | 84,960 | | | | | | | $ | — | | | $ | 399,982 | | | $ | 399,982 | |
| Realized Gain/(Loss) | | $ | 7,128,158 | (1) | | $ | 1,590,904 | (2) | | $ | 8,719,062 | | | | | | | $ | 32,253 | (3) | | $ | (20,210 | ) | | $ | 12,043 | |
| Change in Unrealized Appreciation | | $ | 11,380,134 | | | $ | 7,103,330 | | | $ | 18,483,464 | | | | | | | $ | 870,020 | | | $ | 56,625 | | | $ | 926,645 | |
| | | | | | | | | | | | | | | | | | | | |
| | | GLOBAL EQUITY VRP MASTER FUND | |
| | | U.S. LARGE
CAP VRP
FUND—CLASS I | | | U.S. SMALL
CAP VRP
FUND—CLASS I | | | INTERNATIONAL
DEVELOPED
MARKETS VRP
FUND—CLASS I | | | EMERGING
MARKETS VRP
FUND—CLASS I | | | TOTAL | |
| November 1, 2016 Balance | | | | | | | | | | | | | | | | | | | | |
Shares | | | 1,284,355 | | | | 662,390 | | | | 1,405,771 | | | | 745,149 | | | | | |
Cost | | $ | 13,456,056 | | | $ | 6,611,685 | | | $ | 13,545,620 | | | $ | 6,758,620 | | | $ | 40,371,981 | |
| Additions | | | | | | | | | | | | | | | | | | | | |
Shares | | | 125,076 | | | | 46,948 | | | | 101,592 | | | | 81,413 | | | | | |
Cost | | $ | 1,350,000 | | | $ | 500,000 | | | $ | 1,050,000 | | | $ | 750,000 | | | | | |
| Reductions | | | | | | | | | | | | | | | | | | | | |
Shares | | | 264,506 | | | | 121,010 | | | | 280,739 | | | | 179,586 | | | | | |
Cost | | $ | 2,822,092 | | | $ | 1,246,596 | | | $ | 2,780,430 | | | $ | 1,749,282 | | | | | |
| October 31, 2017 Balance | | | | | | | | | | | | | | | | | | | | |
Shares | | | 1,144,925 | | | | 588,328 | | | | 1,226,624 | | | | 646,976 | | | | | |
Cost | | $ | 11,983,964 | | | $ | 5,865,089 | | | $ | 11,815,190 | | | $ | 5,759,338 | | | $ | 35,423,581 | |
Value | | $ | 13,155,184 | | | $ | 6,565,744 | | | $ | 13,284,333 | | | $ | 5,887,486 | | | $ | 38,892,747 | |
| Dividend Income | | $ | 7,877 | | | $ | — | | | $ | — | | | $ | 658,357 | | | $ | 666,234 | |
| Realized Gain/(Loss) | | $ | 641,844 | (4) | | $ | 164,272 | (5) | | $ | 168,119 | (6) | | $ | (49,282 | ) | | $ | 924,953 | |
| Change in Unrealized Appreciation | | $ | 1,038,800 | | | $ | 628,825 | | | $ | 1,406,897 | | | $ | 135,718 | | | $ | 3,210,240 | |
| (1) | Includes $6,082,555 of long-term capital gain distributions. |
| (2) | Includes $1,186,693 of long-term capital gain distributions. |
| | | | | | | | | | | | | | | | |
| | Stone Ridge Funds | | | | | | Annual Report | | | | | | October 31, 2017 | | |
| | | | | | | | | | |
74
| | |
| Notes to Financial Statements | | October 31, 2017 |
| (3) | Includes $27,190 of long-term capital gain distributions. |
| (4) | Includes $563,937 of long-term capital gain distributions. |
| (5) | Includes $110,868 of long-term capital gain distributions. |
| (6) | Includes $48,548 of long-term capital gain distributions. |
10. Beneficial Ownership
The beneficial ownership, either directly or indirectly, of more than 25% of the voting securities of a fund creates a presumption of control of the fund, under Section 2(a)(9) of the 1940 Act. At October 31, 2017, U.S. VRP Master Fund held, for the benefit of its shareholders, 43% of the U.S. Large Cap VRP Fund and 61% of the U.S. Small Cap VRP Fund. The International VRP Master Fund held, for the benefit of its shareholders, 8% of the International Developed Markets VRP Fund and 26% of the Emerging Markets VRP Fund. The Global Equity VRP Master Fund held, for the benefit of its shareholders, 4% of the U.S. Large Cap VRP Fund, 5% of the U.S. Small Cap VRP Fund, 14% of the International Developed Markets VRP Fund and 42% of the Emerging Markets VRP Fund.
11. Financing Facility
The High Yield Fund obtains leverage through a 29-day rolling facility (the “Facility”). The Facility, when drawn, is secured by the Fund’s assets, particularly catastrophe bonds which are posted as collateral. The Facility’s maximum withdrawal capacity was temporarily increased from $5,500,000 to $55,000,000 on December 1, 2016 then combined with the Reinsurance Fund’s Facility as part of the acquisition (see Note 1) for $200,000,000 on December 5, 2016. On April 28, 2017, the maximum withdrawal capacity was reduced to $100,000,000.
Through the year ended, October 31, 2017 the High Yield Fund’s maximum borrowing was $200,000,000 and average borrowing was $51,434,247. This borrowing resulted in interest expenses of $1,216,881 at a weighted average interest rate of 2.47% and is included in Interest Expense on the High Yield Fund’s Statement of Operations. As of October 31, 2017, the High Yield Fund had an outstanding loan balance of $7,500,000.
12. Subsequent Events Evaluation
In preparing these financial statements, the Funds have evaluated events and transactions for potential recognition or disclosure resulting from subsequent events through the date the financial statements were available to be issued. Other than the events discussed below, this evaluation did not result in any subsequent events that necessitated disclosures and/or adjustments.
On October 30, 2017, the Board of Trustees approved plans of liquidation for the Emerging Markets VRP Fund and the International VRP Master Fund. The liquidations took place on December 21, 2017 and December 22, 2017, respectively.
As a result of the liquidation, the Global Equity VRP Master Fund’s strategy was modified to change its weightings in the underlying funds in which it invests. The Global Equity VRP Master Fund is still expected to have approximately one-half (1/2) of its assets with exposure to U.S. markets and one-half (1/2) of its assets with exposure to international markets. The Global Equity VRP Master Fund will invest approximately one-third (1/3) of its assets in the U.S. Large Cap VRP Fund, one-sixth (1/6) of its assets in the U.S. Small Cap VRP Fund and one-half (1/2) of its assets in the International Developed Markets VRP Fund. The Global Equity VRP Master Fund does not expect to have exposure to investments in emerging markets securities.
Effective November 28, 2017, the Funds within the Trust established an uncommitted line of credit (the “Line”) with U.S. Bank N.A. The Line runs through November 1, 2018 and may be used for short term liquidity in connection with shareholder redemptions. The Line is secured by Fund assets and has a maximum Fund-level withdrawal capacity of the lesser of 33.33% of net market value of such Fund’s collateral posted or $50,000,000 (the “Maximum Line”) in aggregate across the Funds.
| | | | | | | | | | | | | | | | |
| | Stone Ridge Funds | | | | | | Annual Report | | | | | | October 31, 2017 | | |
| | | | | | | | | | |
75
| | |
| Report of Independent Registered Public Accounting Firm |
The Board of Trustees and Shareholders of Stone Ridge Trust
We have audited the accompanying statements of assets and liabilities, including the schedules of investments, of Stone Ridge High Yield Reinsurance Risk Premium Fund, Stone Ridge U.S. Large Cap Variance Risk Premium Fund, Stone Ridge U.S. Small Cap Variance Risk Premium Fund, Stone Ridge U.S. Variance Risk Premium Master Fund, Stone Ridge International Developed Markets Variance Risk Premium Fund, Stone Ridge Emerging Markets Variance Risk Premium Fund, Stone Ridge International Variance Risk Premium Master Fund, and Stone Ridge Global Equity Variance Risk Premium Master Fund (eight of the portfolios constituting Stone Ridge Trust) (collectively the Funds) as of October 31, 2017, and the related statements of operations for the Funds and the statement of cash flows for the Stone Ridge High Yield Reinsurance Risk Premium Fund for the year then ended, and the statements of changes in net assets for each of the two years in the period then ended, and the financial highlights for each of the periods indicated therein. These financial statements and financial highlights are the responsibility of the Funds’ management. Our responsibility is to express an opinion on these financial statements and financial highlights based on our audits.
We conducted our audits in accordance with the standards of the Public Company Accounting Oversight Board (United States). Those standards require that we plan and perform the audit to obtain reasonable assurance about whether the financial statements and financial highlights are free of material misstatement. We were not engaged to perform an audit of the Funds’ internal control over financial reporting. Our audits included consideration of internal control over financial reporting as a basis for designing audit procedures that are appropriate in the circumstances, but not for the purpose of expressing an opinion on the effectiveness of the Funds’ internal control over financial reporting. Accordingly, we express no such opinion. An audit also includes examining, on a test basis, evidence supporting the amounts and disclosures in the financial statements and financial highlights, assessing the accounting principles used and significant estimates made by management, and evaluating the overall financial statement presentation. Our procedures included confirmation of securities owned as of October 31, 2017, by correspondence with the custodian and brokers or by other appropriate auditing procedures where replies from brokers were not received. We believe that our audits provide a reasonable basis for our opinion.
In our opinion, the financial statements and financial highlights referred to above present fairly, in all material respects, the financial position of each of the respective Funds constituting Stone Ridge Trust at October 31, 2017, the results of their operations and their cash flows for the year then ended, and the changes in their net assets for each of the two years in the period then ended, and the financial highlights for each of the periods indicated therein, in conformity with U.S. generally accepted accounting principles.

Minneapolis, MN
December 29, 2017
| | | | | | | | | | | | | | | | |
| | Stone Ridge Funds | | | | | | Annual Report | | | | | | October 31, 2017 | | |
| | | | | | | | | | |
76
| | |
| Expense Examples (Unaudited) | | |
As a shareholder of the Stone Ridge Funds (each a “Fund”, together the “Funds”), you incur ongoing costs, including investment advisory fees, distribution and/or shareholder servicing fees, and other Fund expenses, which are indirectly paid by shareholders. This example is intended to help you understand your ongoing costs (in U.S. dollars) of investing in a Fund and to compare these costs with the ongoing costs of investing in other mutual funds.
The example is based on an investment of $1,000 invested at the beginning of the period and held for the entire period from May 1, 2017 through October 31, 2017.
Actual Expenses
The first line on each table below provides information about actual account values and actual expenses. However, the table does not include shareholder specific fees, such as the $15.00 fee charged for wire redemptions by the Funds’ transfer agent. The table also does not include portfolio trading commissions and related trading costs. You may use the information in this line, together with the amount you invested, to estimate the expenses that you paid over the period. Simply divide your account value by $1,000 (for example, an $8,600 account value divided by $1,000 = 8.6), then multiply the result by the number in the first line under the heading entitled “Expenses Paid During Period” to estimate the expenses you paid on your account during the period.
Hypothetical Example For Comparison Purposes
The second line on each table below provides information about hypothetical account values and hypothetical expenses based on the actual expense ratios for each share class of the Funds and an assumed rate of return of 5% per year before expenses, which is not the Funds’ actual return. The hypothetical account values and expenses may not be used to estimate the actual ending account balance or expenses you paid for the period. You may use this information to compare the ongoing costs of investing in the Funds and other funds. To do so, compare this 5% hypothetical example with the 5% hypothetical examples that appear in the shareholder reports of the other fund. Please note that the expenses shown in the table are meant to highlight your ongoing costs only and do not reflect any transactional costs, such as sales charges (loads), redemption fees, or exchange fees. Therefore, the second line of the table is useful in comparing ongoing costs only, and will not help you determine the relevant total cost of owning different funds.
Stone Ridge High Yield Reinsurance Risk Premium Fund — Class I
| | | | | | | | | | | | |
| | | BEGINNING
ACCOUNT
VALUE
MAY 1, 2017 | | | ENDING
ACCOUNT
VALUE
OCTOBER 31, 2017 | | | EXPENSES
PAID DURING
PERIOD*
MAY 1, 2017 –
OCTOBER 31, 2017 | |
Actual | | $ | 1,000.00 | | | $ | 931.80 | | | $ | 8.13 | |
Hypothetical (5% annual return before expenses) | | $ | 1,000.00 | | | $ | 1,016.79 | | | $ | 8.49 | |
| * | Expenses are equal to the share class’s annualized six-month expense ratio of 1.67%, multiplied by the average account value over the period, multiplied by 184/365 to reflect the partial year period. |
Stone Ridge High Yield Reinsurance Risk Premium Fund — Class M
| | | | | | | | | | | | |
| | | BEGINNING
ACCOUNT
VALUE
MAY 1, 2017 | | | ENDING
ACCOUNT
VALUE
OCTOBER 31, 2017 | | | EXPENSES
PAID DURING
PERIOD*
MAY 1, 2017 –
OCTOBER 31, 2017 | |
Actual | | $ | 1,000.00 | | | $ | 930.50 | | | $ | 8.86 | |
Hypothetical (5% annual return before expenses) | | $ | 1,000.00 | | | $ | 1,016.03 | | | $ | 9.25 | |
| * | Expenses are equal to the share class’s annualized six-month expense ratio of 1.82%, multiplied by the average account value over the period, multiplied by 184/365 to reflect the partial year period. |
| | | | | | | | | | | | | | | | |
| | Stone Ridge Funds | | | | | | Annual Report | | | | | | October 31, 2017 | | |
| | | | | | | | | | |
77
| | |
| Expense Examples (Unaudited) | | |
Stone Ridge U.S. Large Cap Variance Risk Premium Fund — Class I
| | | | | | | | | | | | |
| | | BEGINNING
ACCOUNT
VALUE
MAY 1, 2017 | | | ENDING
ACCOUNT
VALUE
OCTOBER 31, 2017 | | | EXPENSES
PAID DURING
PERIOD*
MAY 1, 2017 –
OCTOBER 31, 2017 | |
Actual | | $ | 1,000.00 | | | $ | 1,050.30 | | | $ | 8.37 | |
Hypothetical (5% annual return before expenses) | | $ | 1,000.00 | | | $ | 1,017.04 | | | $ | 8.24 | |
| * | Expenses are equal to the share class’s annualized six-month expense ratio of 1.62%, multiplied by the average account value over the period, multiplied by 184/365 to reflect the partial year period. |
Stone Ridge U.S. Large Cap Variance Risk Premium Fund — Class M
| | | | | | | | | | | | |
| | | BEGINNING
ACCOUNT
VALUE
MAY 1, 2017 | | | ENDING
ACCOUNT
VALUE
OCTOBER 31, 2017 | | | EXPENSES
PAID DURING
PERIOD*
MAY 1, 2017 –
OCTOBER 31, 2017 | |
Actual | | $ | 1,000.00 | | | $ | 1,048.80 | | | $ | 9.09 | |
Hypothetical (5% annual return before expenses) | | $ | 1,000.00 | | | $ | 1,016.33 | | | $ | 8.94 | |
| * | Expenses are equal to the share class’s annualized six-month expense ratio of 1.76%, multiplied by the average account value over the period, multiplied by 184/365 to reflect the partial year period. |
Stone Ridge U.S. Small Cap Variance Risk Premium Fund — Class I
| | | | | | | | | | | | |
| | | BEGINNING
ACCOUNT
VALUE
MAY 1, 2017 | | | ENDING
ACCOUNT
VALUE
OCTOBER 31, 2017 | | | EXPENSES
PAID DURING
PERIOD*
MAY 1, 2017 –
OCTOBER 31, 2017 | |
Actual | | $ | 1,000.00 | | | $ | 1,044.00 | | | $ | 9.02 | |
Hypothetical (5% annual return before expenses) | | $ | 1,000.00 | | | $ | 1,016.38 | | | $ | 8.89 | |
| * | Expenses are equal to the share class’s annualized six-month expense ratio of 1.75%, multiplied by the average account value over the period, multiplied by 184/365 to reflect the partial year period. |
Stone Ridge U.S. Small Cap Variance Risk Premium Fund — Class M
| | | | | | | | | | | | |
| | | BEGINNING
ACCOUNT
VALUE
MAY 1, 2017 | | | ENDING
ACCOUNT
VALUE
OCTOBER 31, 2017 | | | EXPENSES
PAID DURING
PERIOD*
MAY 1, 2017 –
OCTOBER 31, 2017 | |
Actual | | $ | 1,000.00 | | | $ | 1,043.30 | | | $ | 9.89 | |
Hypothetical (5% annual return before expenses) | | $ | 1,000.00 | | | $ | 1,015.53 | | | $ | 9.75 | |
| * | Expenses are equal to the share class’s annualized six-month expense ratio of 1.92%, multiplied by the average account value over the period, multiplied by 184/365 to reflect the partial year period. |
| | | | | | | | | | | | | | | | |
| | Stone Ridge Funds | | | | | | Annual Report | | | | | | October 31, 2017 | | |
| | | | | | | | | | |
78
| | |
| Expense Examples (Unaudited) | | |
Stone Ridge U.S. Variance Risk Premium Master Fund — Class I
| | | | | | | | | | | | |
| | | BEGINNING
ACCOUNT
VALUE
MAY 1, 2017 | | | ENDING
ACCOUNT
VALUE
OCTOBER 31, 2017 | | | EXPENSES
PAID DURING
PERIOD*
MAY 1, 2017 –
OCTOBER 31, 2017 | |
Actual | | $ | 1,000.00 | | | $ | 1,047.90 | | | $ | 0.41 | |
Hypothetical (5% annual return before expenses) | | $ | 1,000.00 | | | $ | 1,024.80 | | | $ | 0.41 | |
| * | Expenses are equal to the share class’s annualized six-month expense ratio of 0.08%, multiplied by the average account value over the period, multiplied by 184/365 to reflect the partial year period. |
Stone Ridge U.S. Variance Risk Premium Master Fund — Class M
| | | | | | | | | | | | |
| | | BEGINNING
ACCOUNT
VALUE
MAY 1, 2017 | | | ENDING
ACCOUNT
VALUE
OCTOBER 31, 2017 | | | EXPENSES
PAID DURING
PERIOD*
MAY 1, 2017 –
OCTOBER 31, 2017 | |
Actual | | $ | 1,000.00 | | | $ | 1,046.20 | | | $ | 1.19 | |
Hypothetical (5% annual return before expenses) | | $ | 1,000.00 | | | $ | 1,024.05 | | | $ | 1.17 | |
| * | Expenses are equal to the share class’s annualized six-month expense ratio of 0.23%, multiplied by the average account value over the period, multiplied by 184/365 to reflect the partial year period. |
Stone Ridge International Developed Markets Variance Risk Premium Fund — Class I
| | | | | | | | | | | | |
| | | BEGINNING
ACCOUNT
VALUE
MAY 1, 2017 | | | ENDING
ACCOUNT
VALUE
OCTOBER 31, 2017 | | | EXPENSES
PAID DURING
PERIOD* MAY 1, 2017 –
OCTOBER 31, 2017 | |
Actual | | $ | 1,000.00 | | | $ | 1,037.40 | | | $ | 9.81 | |
Hypothetical (5% annual return before expenses) | | $ | 1,000.00 | | | $ | 1,015.58 | | | $ | 9.70 | |
| * | Expenses are equal to the share class’s annualized six-month expense ratio of 1.91%, multiplied by the average account value over the period, multiplied by 184/365 to reflect the partial year period. |
Stone Ridge International Developed Markets Variance Risk Premium Fund — Class M
| | | | | | | | | | | | |
| | | BEGINNING
ACCOUNT
VALUE
MAY 1, 2017 | | | ENDING
ACCOUNT
VALUE
OCTOBER 31, 2017 | | | EXPENSES
PAID DURING
PERIOD*
MAY 1, 2017 –
OCTOBER 31, 2017 | |
Actual | | $ | 1,000.00 | | | $ | 1,035.60 | | | $ | 10.62 | |
Hypothetical (5% annual return before expenses) | | $ | 1,000.00 | | | $ | 1,014.77 | | | $ | 10.51 | |
| * | Expenses are equal to the share class’s annualized six-month expense ratio of 2.07%, multiplied by the average account value over the period, multiplied by 184/365 to reflect the partial year period. |
| | | | | | | | | | | | | | | | |
| | Stone Ridge Funds | | | | | | Annual Report | | | | | | October 31, 2017 | | |
| | | | | | | | | | |
79
| | |
| Expense Examples (Unaudited) | | |
Stone Ridge Emerging Markets Variance Risk Premium Fund — Class I
| | | | | | | | | | | | |
| | | BEGINNING
ACCOUNT
VALUE
MAY 1, 2017 | | | ENDING
ACCOUNT
VALUE
OCTOBER 31, 2017 | | | EXPENSES
PAID DURING
PERIOD*
MAY 1, 2017 –
OCTOBER 31, 2017 | |
Actual | | $ | 1,000.00 | | | $ | 1,071.80 | | | $ | 9.40 | |
Hypothetical (5% annual return before expenses) | | $ | 1,000.00 | | | $ | 1,016.13 | | | $ | 9.15 | |
| * | Expenses are equal to the share class’s annualized six-month expense ratio of 1.80%, multiplied by the average account value over the period, multiplied by 184/365 to reflect the partial year period. |
Stone Ridge Emerging Markets Variance Risk Premium Fund — Class M
| | | | | | | | | | | | |
| | | BEGINNING
ACCOUNT
VALUE
MAY 1, 2017 | | | ENDING ACCOUNT VALUE
OCTOBER 31, 2017 | | | EXPENSES
PAID DURING
PERIOD*
MAY 1, 2017 –
OCTOBER 31, 2017 | |
Actual | | $ | 1,000.00 | | | $ | 1,070.00 | | | $ | 10.17 | |
Hypothetical (5% annual return before expenses) | | $ | 1,000.00 | | | $ | 1,051.38 | | | $ | 9.91 | |
| * | Expenses are equal to the share class’s annualized six-month expense ratio of 1.95%, multiplied by the average account value over the period, multiplied by 184/365 to reflect the partial year period. |
Stone Ridge International Variance Risk Premium Master Fund — Class I
| | | | | | | | | | | | |
| | | BEGINNING
ACCOUNT
VALUE
MAY 1, 2017 | | | ENDING ACCOUNT VALUE
OCTOBER 31, 2017 | | | EXPENSES
PAID DURING
PERIOD*
MAY 1, 2017 –
OCTOBER 31, 2017 | |
Actual | | $ | 1,000.00 | | | $ | 1,047.20 | | | $ | 1.29 | |
Hypothetical (5% annual return before expenses) | | $ | 1,000.00 | | | $ | 1,023.95 | | | $ | 1.28 | |
| * | Expenses are equal to the share class’s annualized six-month expense ratio of 0.25%, multiplied by the average account value over the period, multiplied by 184/365 to reflect the partial year period. |
Stone Ridge International Variance Risk Premium Master Fund — Class M
| | | | | | | | | | | | |
| | | BEGINNING
ACCOUNT
VALUE
MAY 1, 2017 | | | ENDING ACCOUNT VALUE
OCTOBER 31, 2017 | | | EXPENSES
PAID DURING
PERIOD*
MAY 1, 2017 –
OCTOBER 31, 2017 | |
Actual | | $ | 1,000.00 | | | $ | 1,046.80 | | | $ | 2.06 | |
Hypothetical (5% annual return before expenses) | | $ | 1,000.00 | | | $ | 1,023.19 | | | $ | 2.04 | |
| * | Expenses are equal to the share class’s annualized six-month expense ratio of 0.40%, multiplied by the average account value over the period, multiplied by 184/365 to reflect the partial year period. |
| | | | | | | | | | | | | | | | |
| | Stone Ridge Funds | | | | | | Annual Report | | | | | | October 31, 2017 | | |
| | | | | | | | | | |
80
| | |
| Expense Examples (Unaudited) | | |
Stone Ridge Global Equity Variance Risk Premium Master Fund — Class I
| | | | | | | | | | | | |
| | | BEGINNING
ACCOUNT
VALUE
MAY 1, 2017 | | | ENDING ACCOUNT VALUE
OCTOBER 31, 2017 | | | EXPENSES
PAID DURING
PERIOD*
MAY 1, 2017 –
OCTOBER 31, 2017 | |
Actual | | $ | 1,000.00 | | | $ | 1,046.80 | | | $ | 1.29 | |
Hypothetical (5% annual return before expenses) | | $ | 1,000.00 | | | $ | 1,023.95 | | | $ | 1.28 | |
| * | Expenses are equal to the share class’s annualized six-month expense ratio of 0.25%, multiplied by the average account value over the period, multiplied by 184/365 to reflect the partial year period. |
Stone Ridge Global Equity Variance Risk Premium Master Fund — Class M
| | | | | | | | | | | | |
| | | BEGINNING
ACCOUNT
VALUE
MAY 1, 2017 | | | ENDING ACCOUNT VALUE OCTOBER 31, 2017 | | | EXPENSES
PAID DURING
PERIOD*
MAY 1, 2017 –
OCTOBER 31, 2017 | |
Actual | | $ | 1,000.00 | | | $ | 1,046.00 | | | $ | 2.06 | |
Hypothetical (5% annual return before expenses) | | $ | 1,000.00 | | | $ | 1,023.19 | | | $ | 2.04 | |
| * | Expenses are equal to the share class’s annualized six-month expense ratio of 0.40%, multiplied by the average account value over the period, multiplied by 184/365 to reflect the partial year period. |
| | | | | | | | | | | | | | | | |
| | Stone Ridge Funds | | | | | | Annual Report | | | | | | October 31, 2017 | | |
| | | | | | | | | | |
81
| | |
| Additional Information (Unaudited) | | |
1. Board Approval of the Continuation of Certain Investment Management Agreements
Throughout the year, the Board of Trustees (the “Board”) of Stone Ridge Trust (the “Trust”), including the members of the Board who are not “interested persons” of the Trust (as that term is defined in the Investment Company Act of 1940, as amended) (the “Independent Trustees”), considers matters bearing on the investment management agreements between Stone Ridge Asset Management LLC (the “Adviser”) and the Trust, on behalf of each series of the Trust. On an annual basis, the Board, including the Independent Trustees, holds an in-person meeting to determine whether to approve the continuation, ordinarily for an additional one-year period, of any investment management agreements that are proposed to be renewed.
At an in-person meeting held on October 30, 2017, the Board, including a majority of the Independent Trustees, considered and approved the continuation for a one-year period of each of the investment management agreements (the “Existing Agreements”) between the Adviser and the Trust on behalf of Stone Ridge High Yield Reinsurance Risk Premium Fund (the “High Yield Reinsurance Fund”), Stone Ridge U.S. Small Cap Variance Risk Premium Fund (the “U.S. Small Cap VRP Fund”), Stone Ridge U.S. Large Cap Variance Risk Premium Fund (the “U.S. Large Cap VRP Fund”), and Stone Ridge U.S. Variance Risk Premium Master Fund (the “U.S. VRP Master Fund” and, collectively with the U.S. Small Cap VRP Fund and the U.S. Large Cap VRP Fund, the “U.S. VRP Funds”), Stone Ridge International Developed Markets Variance Risk Premium Fund, Stone Ridge Emerging Markets Variance Risk Premium Fund, Stone Ridge International Variance Risk Premium Master Fund, and Stone Ridge Global Equity Variance Risk Premium Master Fund (together, the “International VRP Funds”). In evaluating each Existing Agreement, the Board considered information and materials furnished by the Adviser in advance of and at the meeting and was afforded the opportunity to request additional information and to ask questions of the Adviser to obtain information that it believed to be reasonably necessary to evaluate the terms of the Existing Agreements. The Board noted that the U.S. VRP Master Fund pursues its investment objective and principal investment strategies by investing in a combination of the U.S. Large Cap VRP Fund and the U.S. Small Cap VRP Fund (the “Underlying U.S. VRP Funds”), the International Variance Risk Premium Master Fund (the “International VRP Master Fund”) pursues its investment objective and principal investment strategies by investing in a combination of the Stone Ridge International Developed Markets Variance Risk Premium Fund and the Stone Ridge Emerging Markets Variance Risk Premium Fund (the “Underlying International VRP Funds”), and the Global Equity Variance Risk Premium Master Fund (the “Global VRP Master Fund”) pursues its investment objective and principal investment strategies by investing in a combination of the Underlying U.S. VRP Funds and the Underlying International VRP Funds (the Underlying International VRP Funds together with the Underlying U.S. VRP Funds, the “Underlying Funds”). As a result, some of the information the Board took into consideration as part of its review of the Existing Agreements for the U.S. VRP Master Fund, the International VRP Master Fund and the Global VRP Master Fund (collectively, the “VRP Master Funds”) related to the Underlying Funds. The Board considered that Stone Ridge Emerging Markets Variance Risk Premium Fund, an Underlying Fund, and International VRP Master Fund, a VRP Master Fund, would be liquidated in December 2017.
The Board’s consideration of each Existing Agreement included but was not limited to: (1) the nature, extent and quality of the services provided by the Adviser; (2) the investment performance of the Funds and the Adviser; (3) the cost of the services provided and the profits and other benefits realized by the Adviser from its relationship with each Fund; and (4) the extent to which economies of scale may be realized as the Funds grow and whether fee levels reflect such economies of scale for the benefit of shareholders of the Funds. In determining whether to approve the continuation of the Existing Agreements, the Board, including the Independent Trustees, did not identify any single factor as determinative; individual trustees may have evaluated the information presented differently from one another, giving different weights to various factors.
In considering the nature, extent and quality of the services provided by the Adviser, the Board considered the investment management services provided by the Adviser, including management of each Fund’s portfolio in accordance with its investment objective, investment policies, investment restrictions and applicable law; the unique and complex nature of the Funds’ investment programs in the registered fund space; investment selection and monitoring; selection of trading counterparties and order management; the creation and implementation of ongoing analytical and risk management strategies; the Adviser’s investment in infrastructure, proprietary software, technology and personnel needed to implement each Fund’s investment program; and the oversight and/or implementation of policies and procedures necessary to fulfill these responsibilities. For each of the U.S. VRP Master Fund, the International VRP Master Fund and the Global VRP Master Fund, the Board considered the Adviser’s responsibilities in selecting and weighting such Funds’ investments in the appropriate Underlying Funds and the ongoing monitoring of such selection.
| | | | | | | | | | | | | | | | |
| | Stone Ridge Funds | | | | | | Annual Report | | | | | | October 31, 2017 | | |
| | | | | | | | | | |
82
| | |
| Additional Information (Unaudited) | | |
The Board also considered other services provided by the Adviser, including proxy voting (to the extent applicable), monitoring potential conflicts of interest and maintaining regulatory compliance programs for the Funds. In addition, the Board considered the qualifications and professional backgrounds of the Adviser’s personnel who provide significant advisory or other services to each Fund under the applicable Existing Agreement and analyzed the Adviser’s ongoing ability to service the Funds through such personnel. Based on this and related information, the Board, including the Independent Trustees, concluded that the nature, extent and quality of services supported the continuation of the Existing Agreements.
In considering the investment performance of the Funds and the Adviser, the Board reviewed information provided by the Adviser relating to each Fund’s performance together with the performance of each Fund’s corresponding index or indexes (where applicable). For the High Yield Reinsurance Fund, the Board considered the performance information for the 1 month, 3 month, 6 month, 1 year and 3 year periods ended September 30, 2017 as well as for the period ended September 30, 2017 since the Fund’s inception on February 1, 2013. For the U.S. VRP Funds, the Board considered the performance information for the 1 month, 3 month, 6 month, 1 year and 3 year periods ended September 30, 2017 as well as for the period ended September 30, 2017 since each Fund’s inception: May 1, 2013 (for the U.S. Large Cap VRP Fund and the U.S. Small Cap VRP Fund) and May 22, 2013 for the U.S. Master VRP Fund. For each International VRP Fund, except the Global VRP Master Fund, the Board considered the performance information for the 1 month, 3 month, 6 month, 1 year and 3 year periods ended September 30, 2017 as well as for the period ended September 30, 2017 since each Fund’s inception on February 11, 2014. For the Global VRP Master Fund, the Board considered the performance information for the 1 month, 3 month, 6 month, and 1 year period ended September 30, 2017 as well as for the period ended September 30, 2017 since the Fund’s inception on November 14, 2014. The Board also reviewed performance information for funds within Morningstar categories that include multi-alternative and managed futures (for the U.S. VRP Funds, except the U.S. VRP Master Fund), alternative investment focus funds that invest greater than 15% their assets in foreign securities (for the International VRP Funds, except the International VRP Master Fund), non-traditional bond funds (for the High Yield Reinsurance Fund) and alternative strategies funds, limited to funds-of-funds that invest in affiliated underlying funds (for the VRP Master Funds), in each case, within a specified size range relative to the Funds, as determined by the Adviser in consultation with the Funds’ third-party administrator (the “peer groups”). The Board considered the performance information for any comparable registered investment funds managed by the Adviser. The Board also considered the Adviser’s explanation that there are very few, if any, funds that follow investment strategies similar to those of the Funds due to the unique nature of the Funds’ investment strategies among registered funds, thus making it difficult to identify appropriate peer groups for the Funds and that the peer groups identified were based on an assessment of how the Adviser and the Funds’ third-party administrator believed Morningstar would likely categorize the Funds. The Board, including the Independent Trustees, concluded that each Fund’s performance and/or other relevant factors supported the renewal of the Existing Agreement relating to that Fund.
In considering the cost of services provided and the benefits realized by the Adviser from its relationship with each Fund, the Board considered the fees paid under each Existing Agreement, the expense ratio for each Fund and any contractual expense limitation undertaken by the Adviser. The Board took into consideration that the VRP Master Funds are not charged a management fee under the applicable Existing Agreement. They noted that, because each of the VRP Master Funds invests in the applicable Underlying Funds, each of which pays the Adviser a management fee, the Adviser receives additional fees from the Underlying Funds as a result of each VRP Master Fund’s investments in the applicable Underlying Funds. In considering the appropriateness of the management fees, expense ratios and expense limitations applicable to the Funds, the Board also compared this data against the corresponding information for the funds in the peer group. The Board took into consideration information provided by the Adviser relating to the Adviser’s financial health, profitability and the benefits that the Adviser derives from the Existing Agreements. The Board also noted that the Adviser may receive reputational benefits from its relationships with the Funds. Based on the foregoing information and other factors deemed relevant, the Board, including the Independent Trustees, concluded that the management fee arrangements applicable to each of the Funds pursuant to the Existing Agreements were fair and reasonable and that the costs of the services the Adviser provided and the related benefits to the Adviser in respect of its relationships with the Funds supported the continuation of the Existing Agreements.
Finally, the Board considered the extent to which economies of scale in the provision of services by the Adviser would be realized as the Funds grow and whether the Funds’ fee levels reflect such economies of scale, such as through breakpoints in their investment management fees or through expense waiver and/or limitation agreements. The Board noted the Adviser’s views regarding its ability to achieve economies of scale in respect of the different asset classes represented by the Funds’ investment programs. In addition, the Board noted that each of the Funds, other than the U.S.
| | | | | | | | | | | | | | | | |
| | Stone Ridge Funds | | | | | | Annual Report | | | | | | October 31, 2017 | | |
| | | | | | | | | | |
83
| | |
| Additional Information (Unaudited) | | |
VRP Master Fund, was subject to a contractual expense limitation agreement. The Board noted that the Adviser generally sets the expense limitations for the Funds, if any, at levels that it believes reflect market levels for the services provided to, and expenses borne by, the Funds. After reviewing this and related information, the Board, including the Independent Trustees, concluded that the extent to which economies of scale currently are shared with the Funds supported the continuation of the Existing Agreements.
Based on a consideration and evaluation of all factors deemed to be relevant, including the foregoing matters and the Board’s determination that the continuation of each of the Existing Agreements was in the best interests of the shareholders, the Board, including the Independent Trustees, concluded that each of the Existing Agreements should be continued for a one-year period.
2. Disclosure Regarding Trustees and Officers
| | | | | | | | | | |
| Independent Trustees(1) |
NAME
(YEAR OF BIRTH
AND ADDRESS)(2) | | POSITION(S)
HELD WITH
THE TRUST | | TERM OF
OFFICE AND
LENGTH OF
TIME SERVED(3) | | PRINCIPAL OCCUPATION(S)
DURING THE PAST 5 YEARS | | NUMBER OF
PORTFOLIOS
IN THE FUND
COMPLEX
OVERSEEN BY
TRUSTEE(4)(5) | | OTHER
DIRECTORSHIPS /
TRUSTEESHIPS
HELD BY TRUSTEE
DURING THE
PAST 5 YEARS |
Jeffery Ekberg (1965) | | Trustee | | since 2012 | | Self-employed since 2011; Principal, TPG Capital, L.P (private equity firm), until 2011; Chief Financial Officer, Newbridge Capital, LLC (private equity firm) until 2011 | | 17 | | None. |
| | | | | |
Daniel Charney (1970) | | Trustee | | since 2012 | | Head of Equities, Cowen Group (financial services firm), since 2012; Jefferies & Co. (investment bank) until 2011 | | 17 | | None. |
| | | | | | | | | | |
| Interested Trustee |
NAME
(YEAR OF BIRTH
AND ADDRESS)(2) | | POSITION(S)
HELD WITH
THE TRUST | | TERM OF
OFFICE AND
LENGTH OF
TIME SERVED(3) | | PRINCIPAL OCCUPATION(S)
DURING THE PAST 5 YEARS | | NUMBER OF
PORTFOLIOS
IN THE FUND
COMPLEX
OVERSEEN BY
TRUSTEE(4)(5) | | OTHER
DIRECTORSHIPS /
TRUSTEESHIPS
HELD BY TRUSTEE
DURING THE
PAST 5 YEARS |
Ross Stevens(6) (1969) | | Trustee, Chairman | | since 2012 | | Founder, Chief Executive Officer and President of Stone Ridge Asset Management LLC since 2012; Investment Committee and Co-Head of Portfolio Managers Committee; Magnetar Capital (investment advisory firm) until 2012 | | 17 | | None. |
| (1) | Trustees who are not deemed to be “interested persons” of the Trust as defined in the 1940 Act. |
| (2) | Each Trustee’s mailing address is c/o Stone Ridge Asset Management LLC, 510 Madison Avenue, 21st Floor, New York, NY 10022. |
| (3) | Each Trustee serves until resignation or removal from the Board. |
| (4) | Fund complex includes the Trust and Stone Ridge Trust II, Stone Ridge Trust III, Stone Ridge Trust IV and Stone Ridge Trust V, other investment companies managed by the Adviser. |
| (5) | On December 21, 2017 and December 22, respectively, the Emerging Markets VRP Fund and the International VRP Master Fund, each a series of Stone Ridge Trust, were liquidated. |
| (6) | Mr. Stevens is an “interested person” of the Trust, as defined in Section 2(a)(19) of the 1940 Act, due to his position with the Adviser. |
The Statement of Additional Information includes additional information about the Fund’s Trustees and is available free of charge upon request by calling the Fund’s toll free at 1.855.609.3680.
| | | | | | | | | | | | | | | | |
| | Stone Ridge Funds | | | | | | Annual Report | | | | | | October 31, 2017 | | |
| | | | | | | | | | |
84
| | |
| Additional Information (Unaudited) | | |
| | | | | | |
| Officers of the Trust |
NAME (YEAR OF
BIRTH) AND ADDRESS(1) | | POSITION(S)
HELD
WITH THE TRUST | | TERM OF
OFFICE AND
LENGTH OF
TIME SERVED(2) | | PRINCIPAL OCCUPATION(S) DURING PAST 5 YEARS |
Ross Stevens (1969) | | President, Chief Executive Officer and Principal Executive Officer | | since 2012 | | Founder of Stone Ridge Asset Management LLC, Chief Executive Officer and President of the Adviser, since 2012; prior to that Magnetar Capital (investment advisory firm) (Investment Committee and Co-Head of Portfolio Managers Committee). |
| | | |
Lauren D. Macioce (1978) | | Chief Compliance Officer, Secretary and Chief Legal Officer | | since 2016 | | General Counsel and Chief Compliance Officer of the Adviser, since 2016; prior to that Associate at Ropes & Gray LLP (law firm). |
| | | |
Patrick Kelly (1978) | | Treasurer, Principal Financial Officer, Chief Financial Officer and Chief Accounting Officer | | since 2012 | | Chief Operating Officer of the Adviser, since 2012; prior to that Chief Operating Officer of Quantitative Strategies at Magnetar Capital (investment advisory firm). |
| | | |
Robert Gutmann (1982) | | Vice President | | since 2012 | | Head of Product Development & Execution of the Adviser, since 2012; prior to that Head of Delta- One Synthetic Solutions Group at RBC Capital Markets. |
| | | |
Yan Zhao (1985) | | Assistant Secretary | | since 2012 | | Head of Reinsurance of the Adviser, since 2012; prior to that Consultant at Boston Consulting Group (consulting firm). |
| | | |
Richard Taylor (1980) | | Assistant Treasurer | | since 2015 | | Head of Operations of the Adviser, since 2013; prior to that Budget Analyst at Integrated Rehabilitation and Recovery Care Service (construction firm) and Head of Operations at Ruby Capital Partners LLP (investment advisory firm). |
| (1) | Each Officer’s mailing address is c/o Stone Ridge Asset Management LLC, 510 Madison Avenue, 21st Floor, New York, NY 10022. |
| (2) | The term of office of each officer is indefinite. |
3. Shareholder Notification of Federal Tax Status
For the fiscal year ended October 31, 2017, certain dividends paid by the Funds may be subject to a maximum tax rate of 15%, as provided for by the Jobs and Growth Tax Relief Reconciliation Act of 2003. The percentage of dividends declared from ordinary income designated as qualified dividend income was as follows:
| | | | |
| | | PERCENTAGES |
High Yield Fund | | | 0.00 | % |
U.S. Large Cap VRP Fund | | | 98.98 | % |
U.S. Small Cap VRP Fund | | | 0.00 | % |
U.S. VRP Master Fund | | | 0.00 | % |
International Developed Markets VRP Fund | | | 0.00 | % |
Emerging Markets VRP Fund | | | 0.00 | % |
International VRP Master Fund | | | 0.00 | % |
Global Equity VRP Master Fund | | | 0.00 | % |
| | | | | | | | | | | | | | | | |
| | Stone Ridge Funds | | | | | | Annual Report | | | | | | October 31, 2017 | | |
| | | | | | | | | | |
85
| | |
| Additional Information (Unaudited) | | |
For corporate shareholders, the percent of ordinary income distributions qualifying for the corporate dividends received
deduction for the fiscal year October 31, 2017 was as follows:
| | | | |
| | | PERCENTAGES |
High Yield Fund | | | 0.00 | % |
U.S. Large Cap VRP Fund | | | 98.98 | % |
U.S. Small Cap VRP Fund | | | 0.00 | % |
U.S. VRP Master Fund | | | 0.00 | % |
International Developed Markets VRP Fund | | | 0.00 | % |
Emerging Markets VRP Fund | | | 0.00 | % |
International VRP Master Fund | | | 0.00 | % |
Global Equity VRP Master Fund | | | 0.00 | % |
The percentage of taxable ordinary income distributions that are designated as interest related dividends
under Internal Revenue Section 871(k)(1)(C) for each Fund were as follows (unaudited):
| | | | |
| | | PERCENTAGES |
High Yield Fund | | | 0.00 | % |
U.S. Large Cap VRP Fund | | | 15.86 | % |
U.S. Small Cap VRP Fund | | | 0.00 | % |
U.S. VRP Master Fund | | | 0.00 | % |
International Developed Markets VRP Fund | | | 0.00 | % |
Emerging Markets VRP Fund | | | 14.91 | % |
International VRP Master Fund | | | 0.00 | % |
Global Equity VRP Master Fund | | | 0.00 | % |
The percentage of taxable ordinary income distributions that are designated as short-term capital gain distributions
under Internal Revenue Section 871(k)(2)(C) for each Fund were as follows (unaudited):
| | | | |
| | | PERCENTAGES |
High Yield Fund | | | 0.00 | % |
U.S. Large Cap VRP Fund | | | 100.00 | % |
U.S. Small Cap VRP Fund | | | 0.00 | % |
U.S. VRP Master Fund | | | 0.00 | % |
International Developed Markets VRP Fund | | | 0.00 | % |
Emerging Markets VRP Fund | | | 100.00 | % |
International VRP Master Fund | | | 0.00 | % |
Global Equity VRP Master Fund | | | 0.00 | % |
Shareholders should not use the above information to prepare their tax returns. Since each Fund’s fiscal year is not the calendar year, another notification will be made available with respect to calendar year 2016. Such notification, which will reflect the amount to be used by calendar year taxpayers on their Federal income tax returns, will be made in conjunction with Form 1099-DIV and will be made available in February on the Funds’ website, www.stoneridgefunds.com. Shareholders are advised to consult their own tax advisors with respect to the tax consequences of their investment in each of the Funds.
4. Availability of Quarterly Portfolio Holdings Schedules
The Funds are required to file their complete schedule of portfolio holdings with the SEC for the first and third quarters of each fiscal year on Form N-Q. The Funds’ Form N-Q is available without charge on the SEC’s website www.sec.gov and may be available by calling 1.855.609.3680. You may also obtain copies at the SEC’s Public Reference Room in Washington, D.C. Information on the operation of the Public Reference Room may be obtained by calling 1.800.SEC.0330.
5. Proxy Voting Policies and Procedures and Proxy Voting Record
A description of the policies and procedures that the Funds use to determine how to vote proxies relating to portfolio securities is available without charge by calling 1.855.609.3680 and on the SEC’s website, www.sec.gov. The Funds are required to file how they voted proxies related to portfolio securities during the most recent 12-month period ended June 30. The information is available without charge, upon request by calling 1.855.609.3680 and on the SEC’s website, www.sec.gov.
| | | | | | | | | | | | | | | | |
| | Stone Ridge Funds | | | | | | Annual Report | | | | | | October 31, 2017 | | |
| | | | | | | | | | |
86
Investment Adviser
Stone Ridge Asset Management LLC
510 Madison Avenue, 21st Floor
New York, NY 10022
Independent Registered Public Accounting Firm
Ernst & Young LLP
220 South 6th Street
Minneapolis, MN 55402
Legal Counsel
Ropes & Gray LLP
Prudential Tower
800 Boylston Street
Boston, MA 02199
Custodian
U.S. Bank, N.A.
1555 North RiverCenter Drive, Suite 302
Milwaukee, WI 53212
Distributor
ALPS Distributors, Inc.
1290 Broadway Street
Suite 1100
Denver, CO 80203
Administrator, Transfer Agent and Dividend Disbursing Agent
U.S. Bancorp Fund Services, LLC
615 East Michigan Street
Milwaukee, WI 53202
| | | | | | |
 | | Stone Ridge Funds P.O. Box 701 Milwaukee, WI 53201-0701 855-609-3680 www.stoneridgefunds.com | | | SQANNU | |
Item 2. Code of Ethics.
The registrant has adopted a code of ethics that applies to the registrant’s principal executive officer and principal financial officer. The registrant has not made any substantive amendments to its code of ethics during the period covered by this report. The registrant has not granted any waivers from any provisions of the code of ethics during the period covered by this report.
A copy of the registrant’s Code of Ethics is filed herewith.
Item 3. Audit Committee Financial Expert.
The registrant’s board of trustees has determined that there is at least one audit committee financial expert serving on its audit committee. Jeffery Ekberg is the “audit committee financial expert” and is considered to be “independent” as each term is defined in Item 3 of Form N-CSR.
Item 4. Principal Accountant Fees and Services.
The registrant has engaged its principal accountant to perform audit services, audit-related services, tax services and other services during the past two fiscal years. “Audit services” refer to performing an audit of the registrant’s annual financial statements or services that are normally provided by the accountant in connection with statutory and regulatory filings or engagements for those fiscal years. “Audit-related services” refer to the assurance and related services by the principal accountant that are reasonably related to the performance of the audit of the registrant’s annual financial statements and are not included as “audit services”. “Tax services” refer to professional services rendered by the principal accountant for tax compliance, tax advice, and tax planning, including review of the Funds’ tax returns, asset diversification and income testing, excise taxes, and fiscal year end income calculations. “All other fees” refer to the aggregate fees for products and services provided by the principal accountant, other than the services reported in the foregoing three categories. The following table details the aggregate fees billed or expected to be billed for each of the last two fiscal years for audit fees, audit-related fees, tax fees and other fees by the principal accountant.
| | | | | | | | |
| | | | FYE 10/31/2017 | | | | FYE 10/31/2016 | |
Audit Fees | | | $417,664 | | | | $424,250 | |
Audit-Related Fees | | | $0 | | | | $0 | |
Tax Fees | | | $148,000 | | | | $159,500 | |
All Other Fees | | | $0 | | | | $0 | |
To the extent required by applicable law, pre-approval by the audit committee is needed for all audit and permissible non-audit services rendered to the registrant and all permissible non-audit services rendered to Stone Ridge Asset Management LLC (the “Adviser”) or to various entities either controlling, controlled by, or under common control with the Adviser that provide ongoing services to the registrant if the services relate directly to the operations and financial reporting of the registrant. Pre-approval is currently on an engagement-by-engagement basis.
1
The percentage of fees billed by Ernst & Young, LLP applicable to non-audit services that were approved by the audit committee pursuant to paragraph (c)(7)(i)(C) of Rule 2-01 of Regulation S-X (which permits waiver of pre-approval, if certain conditions are satisfied) were as follows:
| | | | | | | | |
| | | | FYE 10/31/2017 | | | | FYE 10/31/2016 | |
Audit-Related Fees | | | 0% | | | | 0% | |
Tax Fees | | | 0% | | | | 0% | |
All Other Fees | | | 0% | | | | 0% | |
All of the principal accountant’s hours spent on auditing the registrant’s financial statements were attributed to work performed by full-time permanent employees of the principal accountant.
The following table indicates the non-audit fees billed or expected to be billed by the registrant’s accountant for services to the registrant and to the registrant’s investment adviser and any entity controlling, controlled by, or under common control with the registrant’s investment adviser that provides ongoing services to the registrant for the last two fiscal years of the registrant. The audit committee of the board of trustees has considered whether the provision of any non-audit services that were rendered to the registrant’s investment adviser and any entity controlling, controlled by, or under common control with the registrant’s investment adviser that provides ongoing services to the registrant that were not pre-approved pursuant to paragraph (c)(7)(ii) of Rule 2-01 of Regulation S-X is compatible with maintaining the principal accountant’s independence.
| | | | | | | | |
Non-Audit Related Fees | | | FYE 10/31/2017 | | | | FYE 10/31/2016 | |
Registrant | | | $148,000 | | | | $159,500 | |
Registrant’s Investment Adviser | | | $432,989 | | | | $96,392 | |
Item 5. Audit Committee of Listed Registrants.
Not applicable to registrants who are not listed issuers (as defined in Rule 10A-3 under the Securities Exchange Act of 1934).
Item 6. Investments.
| (a) | Schedule of Investments is included as part of the report to shareholders filed under Item 1 of this Form. |
Item 7. Disclosure of Proxy Voting Policies and Procedures for Closed-End Management Investment Companies.
Not applicable to open-end investment companies.
Item 8. Portfolio Managers of Closed-End Management Investment Companies.
Not applicable to open-end investment companies.
2
Item 9. Purchases of Equity Securities by Closed-End Management Investment Company and Affiliated Purchasers.
Not applicable to open-end investment companies.
Item 10. Submission of Matters to a Vote of Security Holders.
Not applicable.
Item 11. Controls and Procedures.
| (a) | The Registrant’s Principal Executive Officer and Principal Financial Officer have reviewed the Registrant’s disclosure controls and procedures (as defined in Rule 30a-3(c) under the Investment Company Act of 1940 (the “Act”)) as of a date within 90 days of the filing of this report, as required by Rule 30a-3(b) under the Act and Rules 13a-15(b) or 15d-15(b) under the Securities Exchange Act of 1934. Based on their review, such officers have concluded that the disclosure controls and procedures are effective in ensuring that information required to be disclosed in this report is appropriately recorded, processed, summarized and reported and made known to them by others within the Registrant and by the Registrant’s service provider. |
| (b) | There were no changes in the Registrant’s internal control over financial reporting (as defined in Rule 30a-3(d) under the Act) that occurred during the second fiscal quarter of the period covered by this report that have materially affected, or are reasonably likely to materially affect, the Registrant’s internal control over financial reporting. |
Item 12. Disclosure of Securities Lending Activities for Closed-End Management Investment Companies
Not applicable to open-end investment companies.
Item 13. Exhibits.
| (a) | (1) Any code of ethics or amendment thereto, that is the subject of the disclosure required by Item 2, to the extent that the registrant intends to satisfy Item 2 requirements through filing an exhibit. Filed herewith. |
(2) A separate certification for each principal executive officer and principal financial officer pursuant to Section 302 of the Sarbanes-Oxley Act of 2002. Filed herewith.
(3) Any written solicitation to purchase securities under Rule 23c-1 under the Act sent or given during the period covered by the report by or on behalf of the registrant to 10 or more persons. Not applicable.
| (b) | Certifications pursuant to Section 906 of the Sarbanes-Oxley Act of 2002. Furnished herewith. |
3
SIGNATURES
Pursuant to the requirements of the Securities Exchange Act of 1934 and the Investment Company Act of 1940, the registrant has duly caused this report to be signed on its behalf by the undersigned, thereunto duly authorized.
| | | | |
| (Registrant) Stone Ridge Trust | | |
| | | | |
|
| By (Signature and Title)* /s/ Ross Stevens |
| | Ross Stevens, President, Chief Executive Officer and Principal Executive Officer |
|
| Date 1/8/18 |
Pursuant to the requirements of the Securities Exchange Act of 1934 and the Investment Company Act of 1940, this report has been signed below by the following persons on behalf of the registrant and in the capacities and on the dates indicated.
| | | | |
|
| By (Signature and Title)* /s/ Ross Stevens |
| | Ross Stevens, President, Chief Executive Officer and Principal Executive Officer |
|
| Date 1/8/18 |
|
| By (Signature and Title)* /s/ Patrick Kelly |
| | Patrick Kelly, Treasurer, Principal Financial Officer, Chief Financial Officer and Chief Accounting Officer |
|
| Date 1/8/18 |
* Print the name and title of each signing officer under his or her signature.
4