|
Exhibit 99.2 
|
SECURITY DATA & ANALYTICS
Company Overview
AUGUST 18, 2015 CONFIDENTIAL AND PROPRIETARY
Disclaimers
This presentation includes forward-looking statements. All statements contained in this presentation other than statements of historical facts, including statements regarding future results of operations and the financial position of Rapid7, Inc. (“Rapid7,” “we,” “us” or “our”) our business strategy and plans and our objectives for future operations, are forward-looking statements. The words “anticipate,” believe,” “continue,” “estimate,” “expect,” “intend,” “may,” “will” and similar expressions are intended to identify forward-looking statements. We have based these forward-looking statements largely on our current expectations and projections about future events and financial trends that we believe may affect our financial condition, results of operations, business strategy, short-term and long-term business operations and objectives, and financial needs. These forward-looking statements are subject to a number of risks and uncertainties, including, without limitation, those set forth in the “Risk Factors” section of our prospectus filed pursuant to Rule 424(b)(4) under the Securities Act of 1933, as amended, on July 17, 2015. Moreover, we operate in a very competitive and rapidly changing environment. New risks emerge from time to time. It is not possible for our management to predict all risks, nor can we assess the impact of all factors on our business or the extent to which any factor, or combination of factors, may cause actual results to differ materially from those contained in any forward-looking statements we may make. In light of these risks, uncertainties and assumptions, the future events and trends discussed in this presentation may not occur and actual results could differ materially and adversely from those anticipated or implied in the forward-looking statements.
Although we believe that the expectations reflected in the forward-looking statements are reasonable, we cannot guarantee future results, levels of activity, performance, achievements or events and circumstances reflected in the forward-looking statements will occur. We are under no duty to update any of these forward-looking statements after the date of this presentation to conform these statements to actual results or revised expectations, except as required by law. You should, therefore, not rely on these forward-looking statements as representing our views as of any date subsequent to the date of this presentation. Moreover, except as required by law, neither we nor any other person assumes responsibility for the accuracy and completeness of the forward-looking statements contained in this presentation.
This presentation also contains estimates and other statistical data made by independent parties and by us relating to market size and growth and other data about our industry. This data involves a number of assumptions and limitations, and you are cautioned not to give undue weight to such estimates. Neither we nor any other person makes any representation as to the accuracy or completeness of such data or undertakes any obligation to update such data after the date of this presentation. In addition, projections, assumptions and estimates of our future performance and the future performance of the markets in which we operate are necessarily subject to a high degree of uncertainty and risk.
Confidential and Proprietary 2
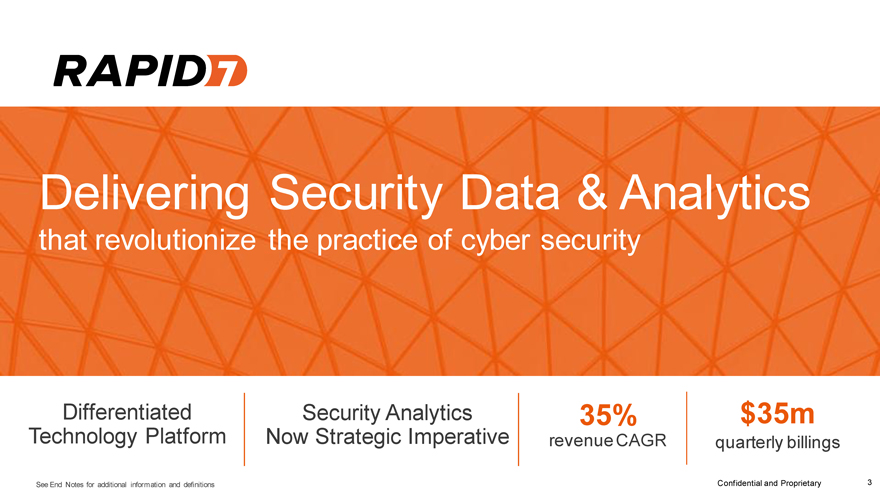
Delivering Security Data & Analytics
that revolutionize the practice of cyber security
Differentiated Security Analytics 35% $35m
Technology Platform Now Strategic Imperative revenue CAGR quarterly billings
See End Notes for additional information and definitions Confidential and Proprietary 3
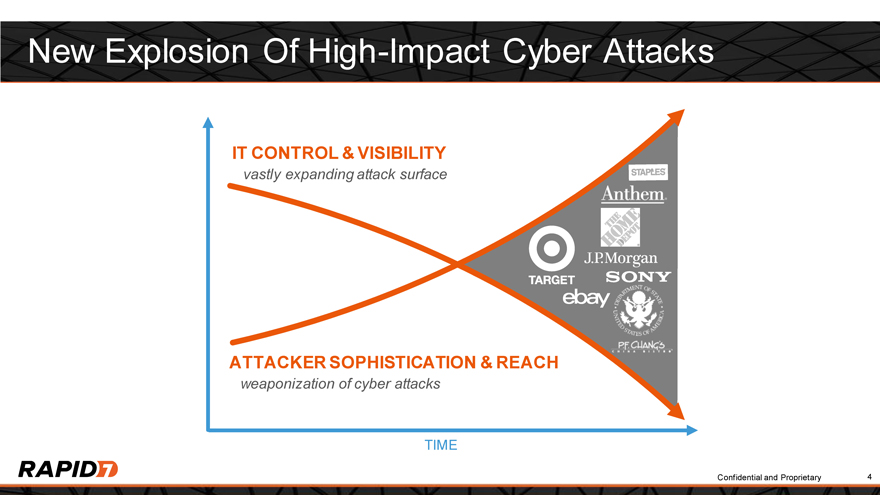
New Explosion Of High-Impact Cyber Attacks
IT CONTROL & VISIBILITY
vastly expanding attack surface
ATTACKER SOPHISTICATION & REACH
weaponization of cyber attacks
TIME
Confidential and Proprietary 4
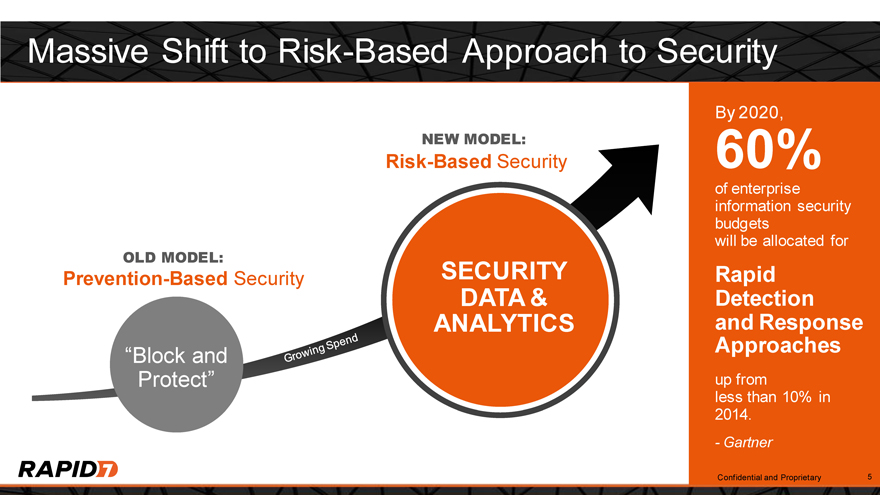
Massive Shift to Risk-Based Approach to Security
NEW MODEL:
Risk-Based Security
OLD MODEL: SECURITY
Prevention-Based Security
DATA & ANALYTICS
“Block and Protect”
Growing Spend
By 2020,
60%
of enterprise information security budgets will be allocated for
Rapid Detection and Response Approaches
up from less than 10% in 2014.
- Gartner
Confidential and Proprietary 5
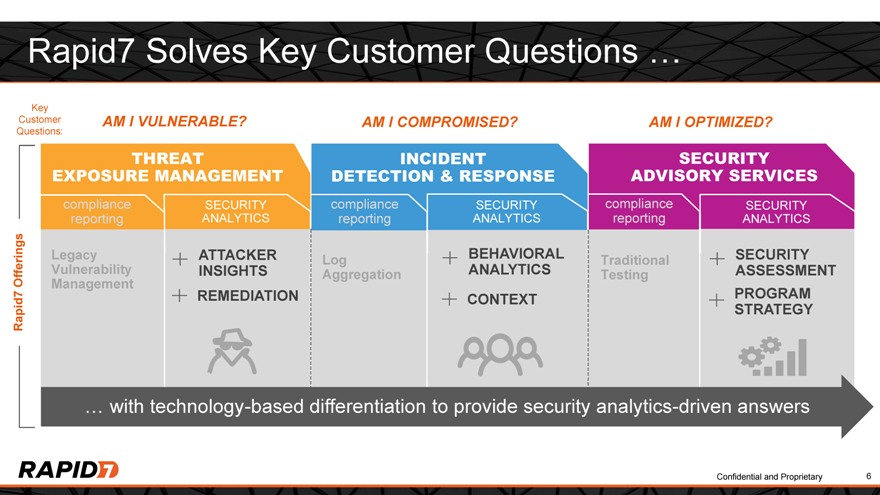
Rapid7 Solves Key Customer Questions …
Key
Customer AM I VULNERABLE? AM I COMPROMISED? AM I OPTIMIZED?
Questions:
THREAT INCIDENT SECURITY
EXPOSURE MANAGEMENT DETECTION & RESPONSE ADVISORY SERVICES
compliance SECURITY compliance SECURITY compliance SECURITY
reporting ANALYTICS reporting ANALYTICS reporting ANALYTICS
Legacy ATTACKER Log BEHAVIORAL Traditional SECURITY
Offerings Vulnerability INSIGHTS Aggregation ANALYTICS Testing ASSESSMENT
Management
REMEDIATION CONTEXT PROGRAM
Rapid7 STRATEGY
… with technology-based differentiation to provide security analytics-driven answers
Confidential and Proprietary 6
Technology Platform & Products
Confidential and Proprietary 7
Rapid7 Security Data & Analytics Technology Platform
Threat Exposure Incident Detection Security Advisory 3rd Party Apps
Management & Response Services
CONTEXT & ANALYTICS
User Behavior Exposure Attack Behavior
Analysis Analysis Analysis
DATA COLLECTION
Asset User Behavioral Mobile Cloud Controls 3rd Party
Info Data Data Info Activity Info Data
Rapid7 Data & Analytics Platform
extensive
DATA COLLECTION
… from the Endpoint to the Cloud
AGENTLESS
Architecture
PACKAGED ANALYTICS
Confidential and Proprietary 8
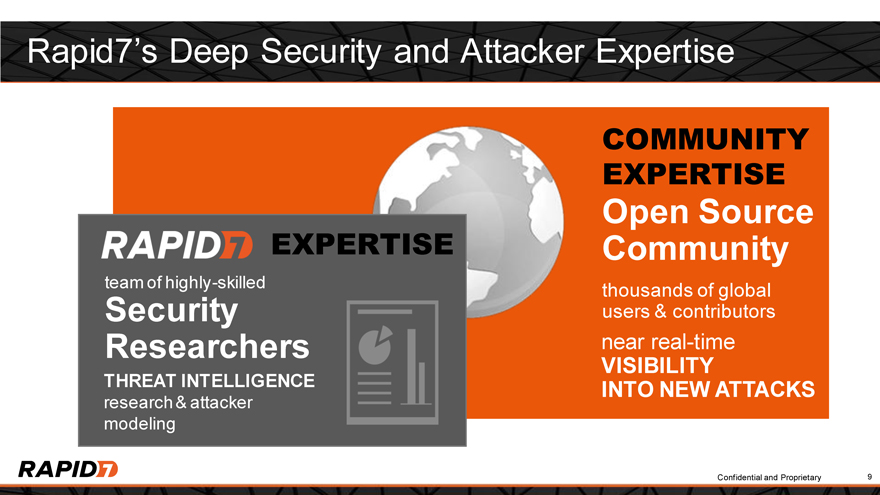
Rapid7’s Deep Security and Attacker Expertise
EXPERTISE
team of highly-skilled
Security Researchers
THREAT INTELLIGENCE research & attacker modeling
COMMUNITY EXPERTISE
Open Source Community
thousands of global users & contributors
near real-time
VISIBILITY
INTO NEW ATTACKS
Confidential and Proprietary 9
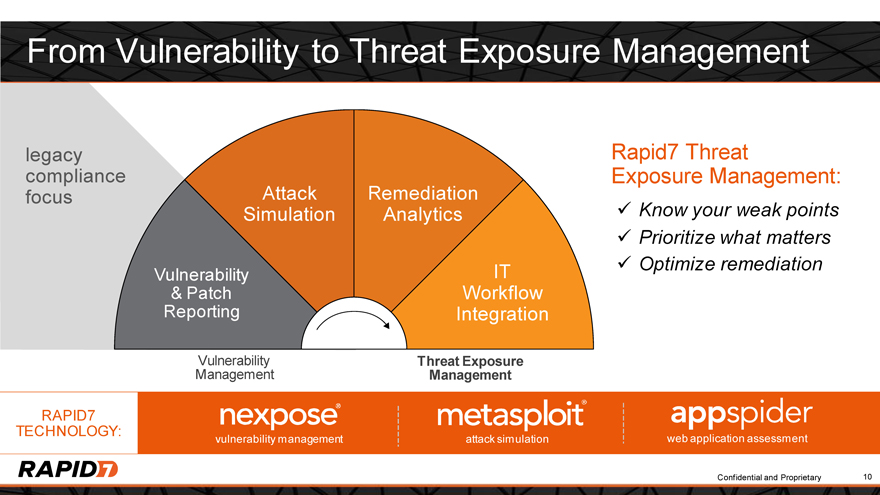
From Vulnerability to Threat Exposure Management
legacy compliance focus
Attack Remediation Simulation Analytics
Vulnerability IT
& Patch Workflow Reporting Integration
Vulnerability Threat Exposure
Management Management
Rapid7 Threat
Exposure Management:
Know your weak points Prioritize what matters Optimize remediation
RAPID7 TECHNOLOGY:
vulnerability management attack simulation web application assessment
Confidential and Proprietary 10
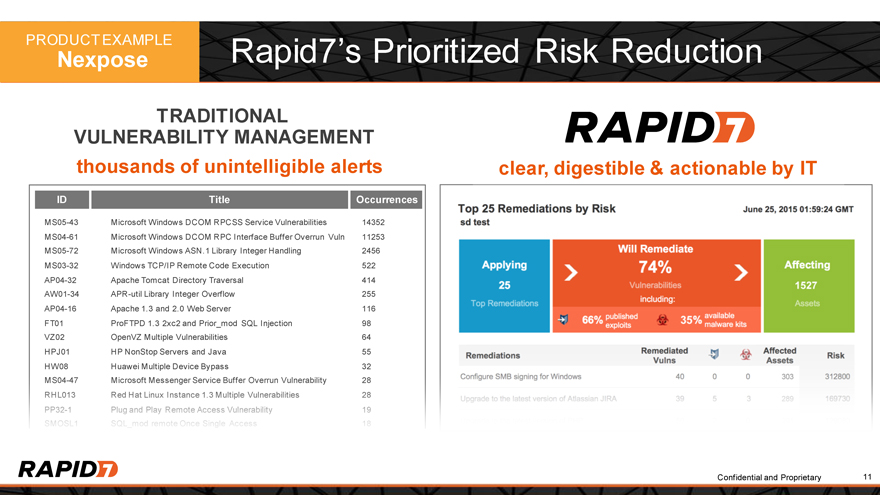
PRODUCT Nexpose EXAMPLE Rapid7’s Prioritized Risk Reduction
TRADITIONAL
VULNERABILITY MANAGEMENT
thousands of unintelligible alerts
ID Title Occurrences
MS05-43 Microsoft Windows DCOM RPCSS Service Vulnerabilities 14352
MS04-61 Microsoft Windows DCOM RPC Interface Buffer Overrun Vuln 11253
MS05-72 Microsoft Windows ASN.1 Library Integer Handling 2456
MS03-32 Windows TCP/IP Remote Code Execution 522
AP04-32 Apache Tomcat Directory Traversal 414
AW01-34 APR-util Library Integer Overflow 255
AP04-16 Apache 1.3 and 2.0 Web Server 116
FT01 ProFTPD 1.3 2xc2 and Prior_mod SQL Injection 98
VZ02 OpenVZ Multiple Vulnerabilities 64
HPJ01 HP NonStop Servers and Java 55
HW08 Huawei Multiple Device Bypass 32
MS04-47 Microsoft Messenger Service Buffer Overrun Vulnerability 28
RHL013 Red Hat Linux Instance 1.3 Multiple Vulnerabilities 28
PP32-1 Plug and Play Remote Access Vulnerability 19
SMOSL1 SQL_mod remote Once Single Access 18
Top 25 Remediations by Risk sd test June 25, 2015 01:59:24 GMT
Applying 25 Top Remediations Will Remediate 74% Vulnerabilities including:
66% published exploits 35% available malware kits
Affecting 1527 Assets
Remediations Remediated Vulns Affected Assets Risk
Configure SMB Signing for Windows 40 0 0 303 312800
Upgrade to the latest version of Atlassian JIRA 39 5 3 289 169730
clear, digestible & actionable by IT
Confidential and Proprietary 11
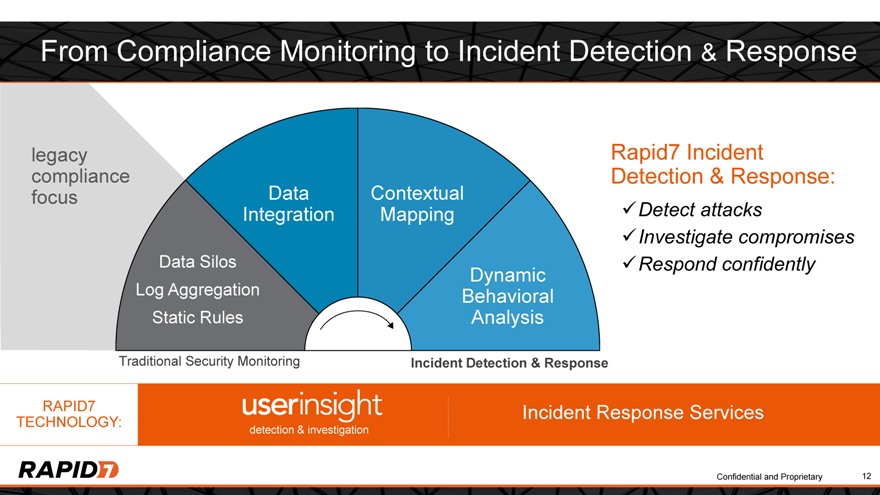
From Compliance Monitoring to Incident Detection & Response
legacy compliance
focus
Data
Integration
Contextual Mapping
Dynamic Behavioral Analysis
Data Silos Log Aggregation Static Rules
Traditional Security Monitoring Incident Detection & Response
RAPID7 Incident Response Services
TECHNOLOGY: detection & investigation
Confidential and Proprietary 12
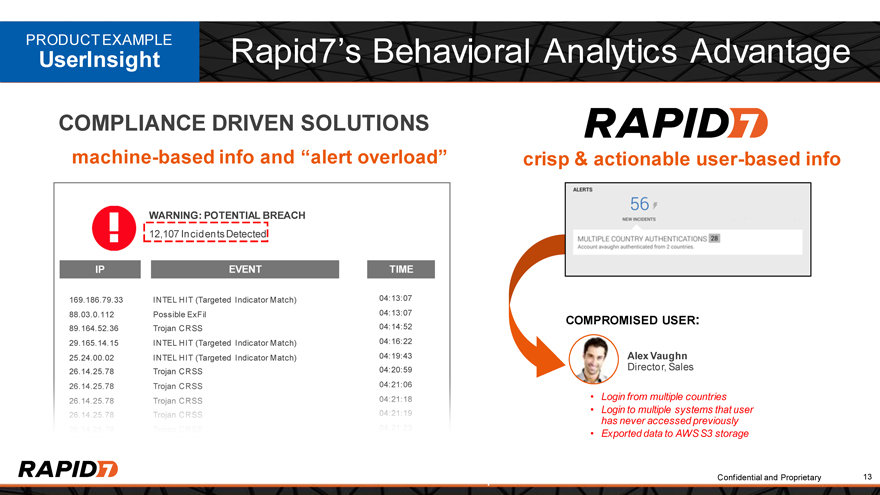
PRODUCT EXAMPLE Rapid7’s Behavioral Analytics Advantage
UserInsight
COMPLIANCE DRIVEN SOLUTIONS
machine-based info and “alert overload”
WARNING: POTENTIAL BREACH
12,107 Incidents Detected
IP EVENT TIME
169.186.79.33 INTEL HIT (Targeted Indicator Match) 04:13:07
88.03.0.112 Possible ExFil 04:13:07
89.164.52.36 Trojan CRSS 04:14:52
29.165.14.15 INTEL HIT (Targeted Indicator Match) 04:16:22
25.24.00.02 INTEL HIT (Targeted Indicator Match) 04:19:43
26.14.25.78 Trojan CRSS 04:20:59
26.14.25.78 Trojan CRSS 04:21:06
26.14.25.78 Trojan CRSS 04:21:18
26.14.25.78 Trojan CRSS 04:21:19
26.14.25.78 Trojan CRSS 04:21:23
crisp & actionable user-based info
COMPROMISED USER:
Alex Vaughn
Director, Sales
Login from multiple countries
Login to multiple systems that user has never accessed previously
Exported data to AWS S3 storage
Confidential and Proprietary 13
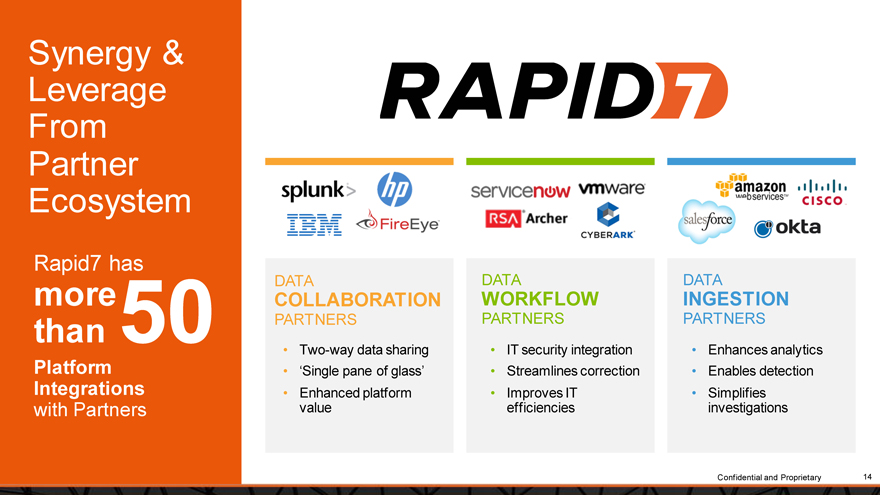
Synergy & Leverage From Partner Ecosystem
Rapid7 has
more50 than
Platform Integrations with Partners
DATA
COLLABORATION
PARTNERS
Two-way data sharing ‘Single pane of glass’ Enhanced platform value
DATA WORKFLOW
PARTNERS
IT security integration Streamlines correction Improves IT efficiencies
DATA
INGESTION
PARTNERS
Enhances analytics
Enables detection
Simplifies
investigations
Confidential and Proprietary 14
Market & Customers
Confidential and Proprietary 15
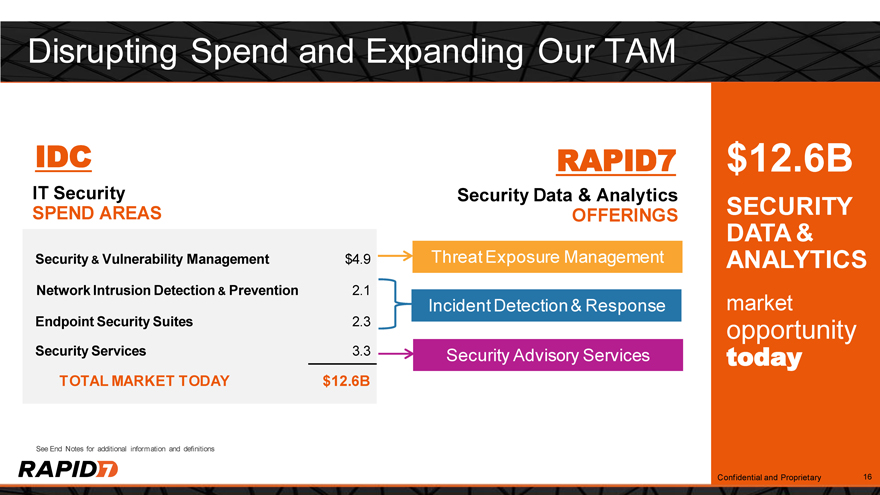
Disrupting Spend and Expanding Our TAM
IDC
IT Security
SPEND AREAS
Security & Vulnerability Management $4.9
Network Intrusion Detection & Prevention 2.1
Endpoint Security Suites 2.3
Security Services 3.3
TOTAL MARKET TODAY $12.6B
See End Notes for additional information and definitions
RAPID7
Security Data & Analytics
OFFERINGS
Threat Exposure Management
Incident Detection & Response
Security Advisory Services
$12.6B
SECURITY
DATA &
ANALYTICS
market
opportunity
today
Confidential and Proprietary 16
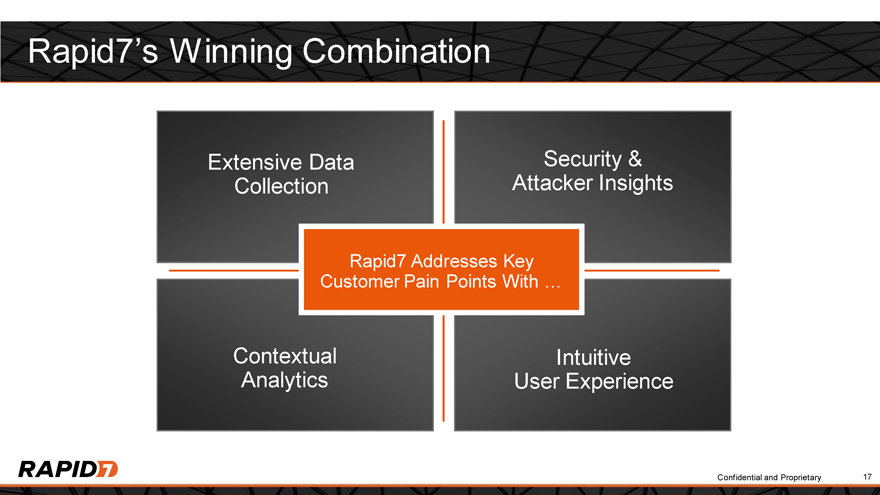
Rapid7’s Winning Combination
Extensive Data Security & Collection Attacker Insights
Rapid7 Addresses Key Customer Pain Points With …
Contextual Intuitive Analytics User Experience
Confidential and Proprietary 17
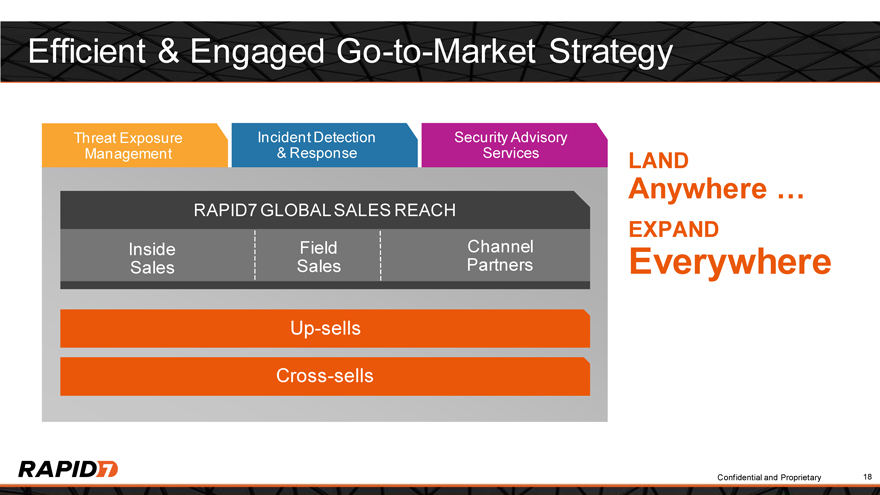
Efficient & Engaged Go-to-Market Strategy
Threat Exposure Incident Detection Security Advisory Management & Response Services
RAPID7 GLOBAL SALES REACH
Inside Field Channel Sales Sales Partners
Up-sells
Cross-sells
Anywhere LAND …
EXPAND
Everywhere
Confidential and Proprietary 18
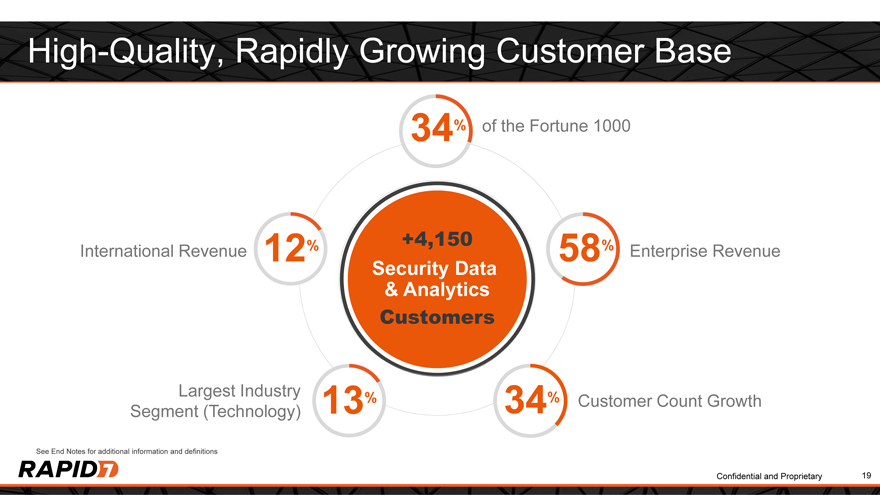
High-Quality, Rapidly Growing Customer Base
34% of the Fortune 1000
% +4,150 %
International Revenue 12 58 Enterprise Revenue
Security Data
& Analytics
Customers
Largest Industry % %
13 34 Customer Count Growth Segment (Technology)
See End Notes for additional information and definitions
Confidential and Proprietary 19
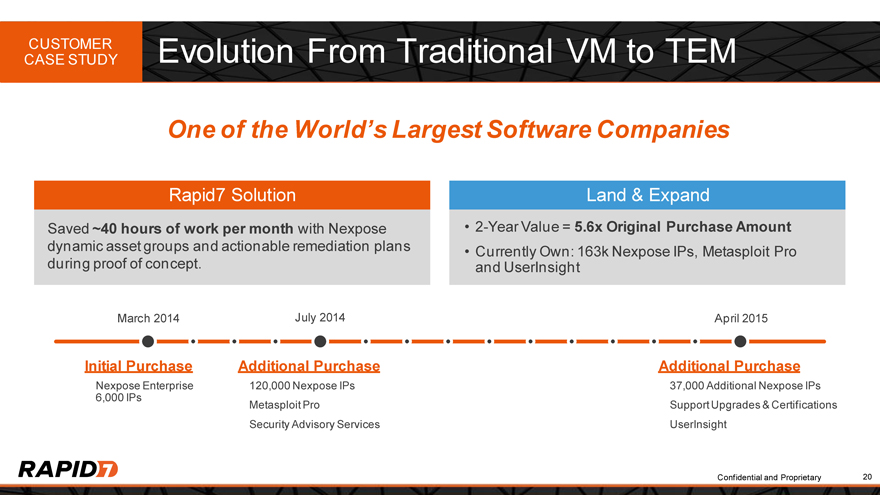
CUSTOMER Evolution From Traditional VM to TEM
CASE STUDY
One of the World’s Largest Software Companies
Rapid7 Solution
Saved ~40 hours of work per month with Nexpose dynamic asset groups and actionable remediation plans during proof of concept.
March 2014 July 2014
Land & Expand
2-Year Value = 5.6x Original Purchase Amount
Currently Own: 163k Nexpose IPs, Metasploit Pro and UserInsight
April 2015
Initial Purchase Additional Purchase
Nexpose Enterprise 120,000 Nexpose IPs 6,000 IPs Metasploit Pro Security Advisory Services
Additional Purchase
37,000 Additional Nexpose IPs Support Upgrades & Certifications UserInsight
Confidential and Proprietary 20
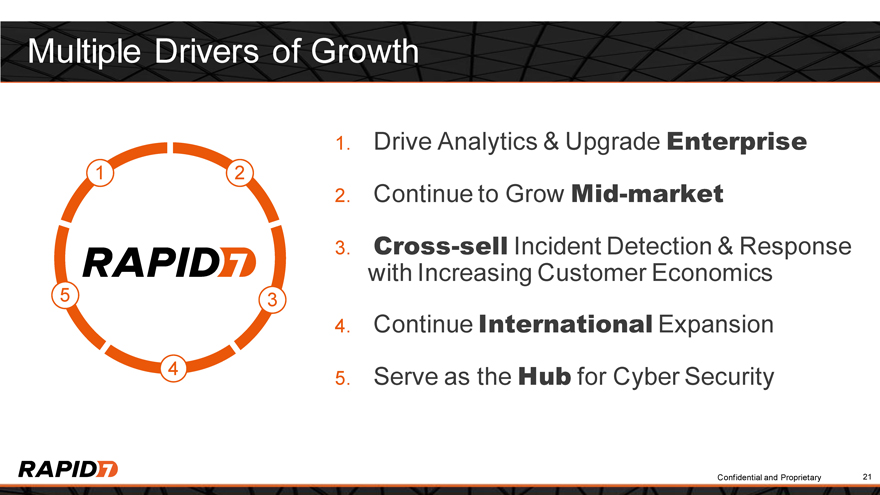
Multiple Drivers of Growth
1 2
5 3 4
1. Drive Analytics & Upgrade Enterprise
2. Continue to Grow Mid-market
3. Cross-sell Incident Detection & Response
with Increasing Customer Economics
4. Continue International Expansion
5. Serve as the Hub for Cyber Security
Confidential and Proprietary 21
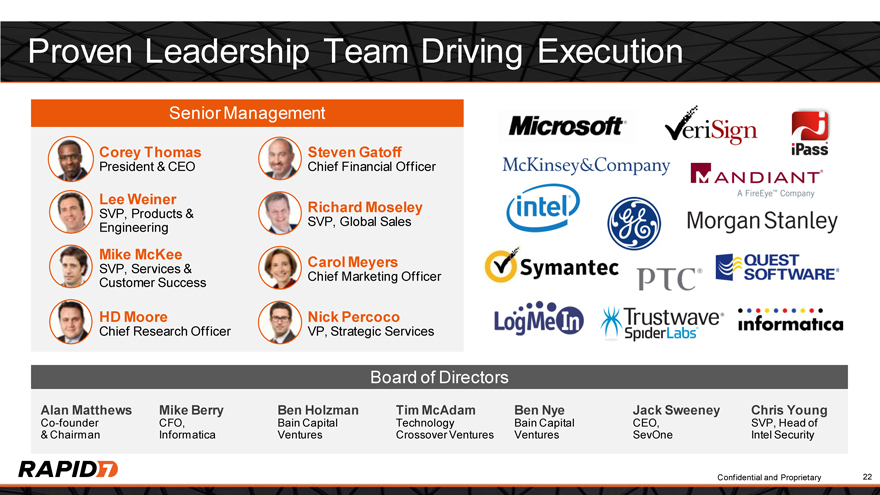
Proven Leadership Team Driving Execution
Senior Management
Corey Thomas
President & CEO
Lee Weiner
SVP, Products & Engineering
Mike McKee
SVP, Services & Customer Success
HD Moore
Chief Research Officer
Steven Gatoff
Chief Financial Officer
Richard Moseley
SVP, Global Sales
Carol Meyers
Chief Marketing Officer
Nick Percoco
VP, Strategic Services
Board of Directors
Alan Matthews Mike Berry Ben Holzman Tim McAdam Ben Nye Jack Sweeney Chris Young
Co-founder CFO, Bain Capital Technology Bain Capital CEO, SVP, Head of
& Chairman Informatica Ventures Crossover Ventures Ventures SevOne Intel Security
Confidential and Proprietary 22
Financial Overview
Confidential and Proprietary 23
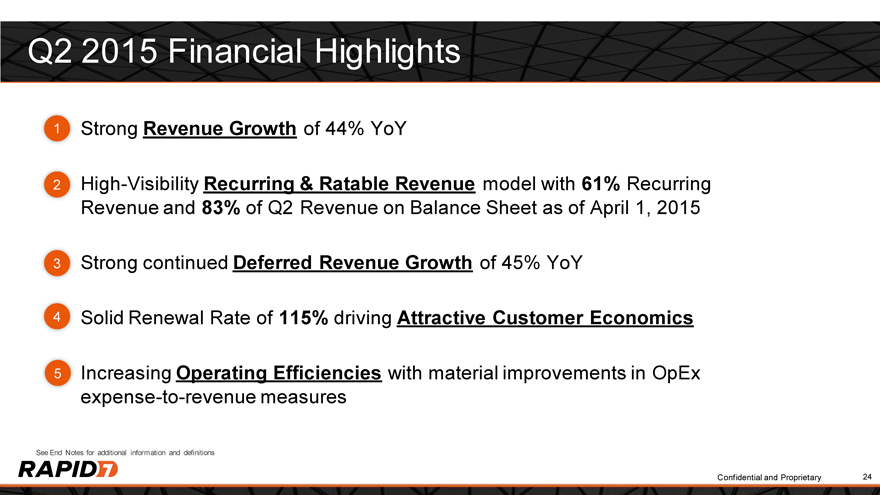
Q2 2015 Financial Highlights
1 Strong Revenue Growth of 44% YoY
2 High-Visibility Recurring & Ratable Revenue model with 61% Recurring Revenue and 83% of Q2 Revenue on Balance Sheet as of April 1, 2015
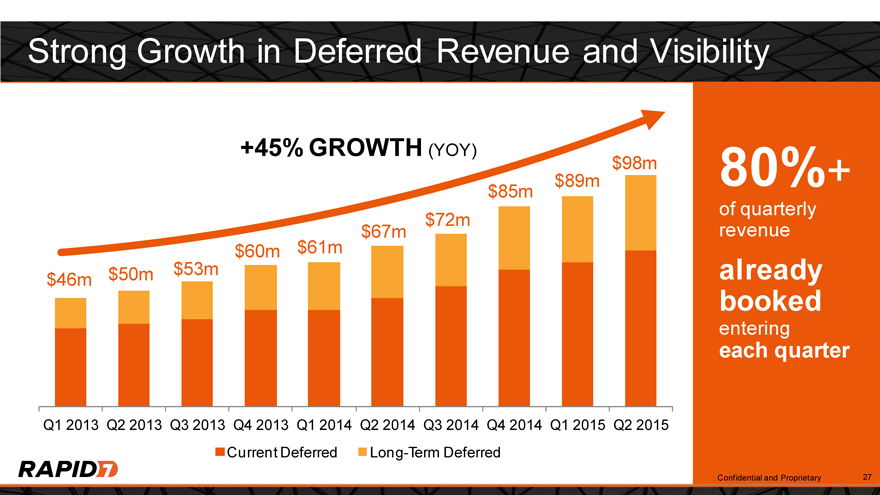
3 Strong continued Deferred Revenue Growth of 45% YoY
4 Solid Renewal Rate of 115% driving Attractive Customer Economics
5 Increasing Operating Efficiencies with material improvements in OpEx expense-to-revenue measures
See End Notes for additional information and definitions
Confidential and Proprietary 24
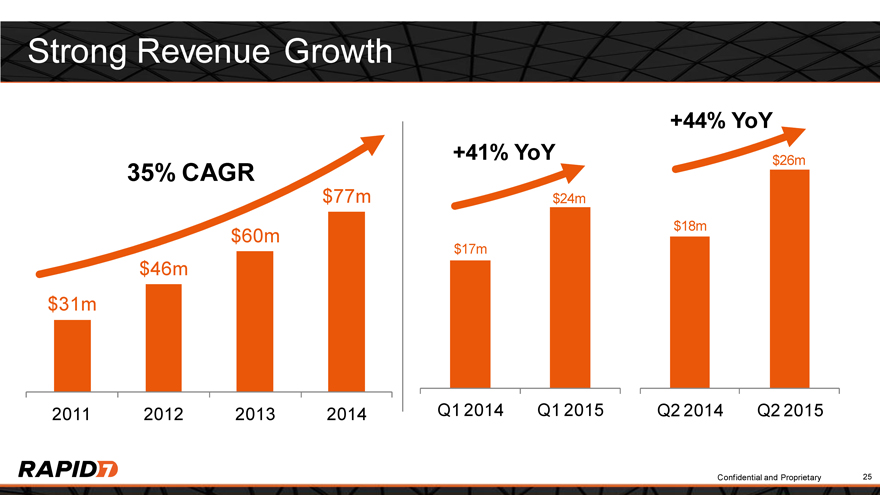
Strong Revenue Growth
35% CAGR
$77m $60m $46m $31m
2011 2012 2013 2014
+44% YoY +41% YoY $26m
$24m $18m $17m
Q1 2014 Q1 2015 Q2 2014 Q2 2015
Confidential and Proprietary 25
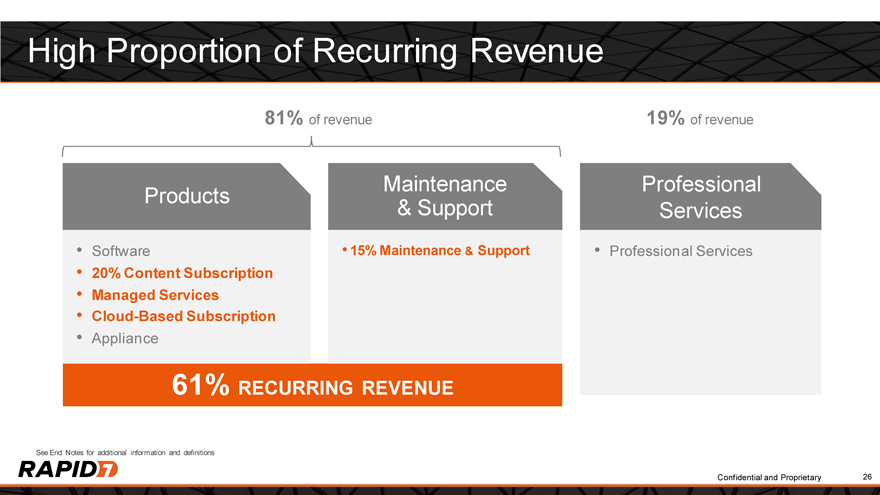
High Proportion of Recurring Revenue
81% of revenue
Products
Software
20% Content Subscription Managed Services Cloud-Based Subscription
Appliance
Maintenance
& Support
15% Maintenance & Support
19% of revenue
Professional Services
Professional Services
61% RECURRING REVENUE
See End Notes for additional information and definitions
Confidential and Proprietary 26
Strong Growth in Deferred Revenue and Visibility
+45% GROWTH (YOY)
$98m
$85m $89m
$67m $72m
$60m $61m
$46m $50m $53m
Q1 2013 Q2 2013 Q3 2013 Q4 2013 Q1 2014 Q2 2014 Q3 2014 Q4 2014 Q1 2015 Q2 2015
Current Deferred Long-Term Deferred
80%+
of quarterly revenue
already booked
entering quarter
each
Confidential and Proprietary 27
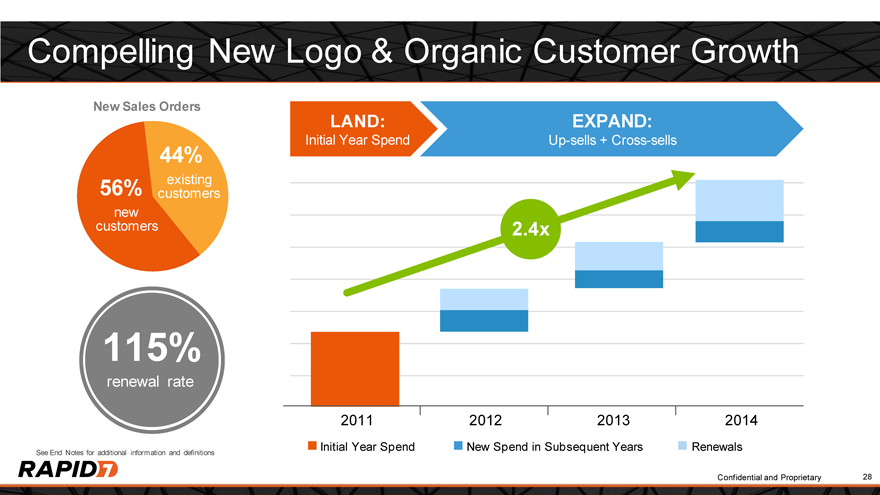
Compelling New Logo & Organic Customer Growth
New Sales Orders
44%
56% existing customers new customers
115%
renewal rate
See End Notes for additional information and definitions
LAND: EXPAND:
Initial Year Spend Up-sells + Cross-sells
2.4x
2011 2012 2013 2014
Initial Year Spend New Spend in Subsequent Years Renewals
Confidential and Proprietary 28
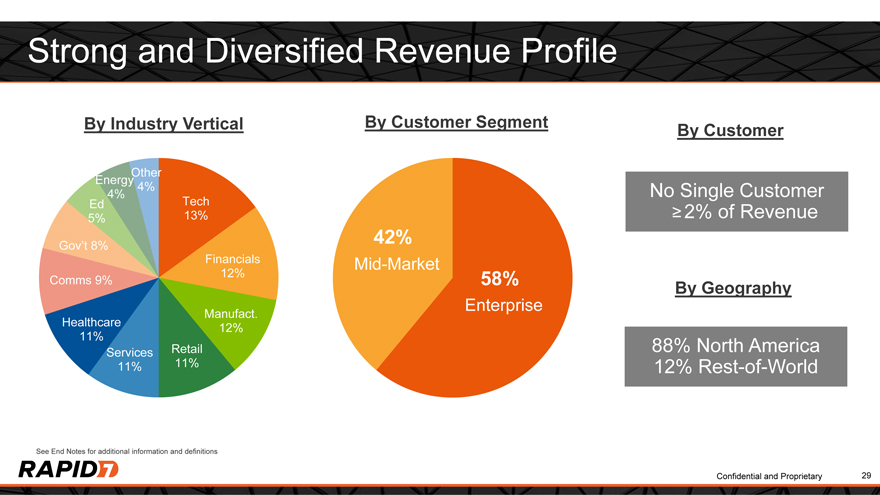
Strong and Diversified Revenue Profile
By Industry Vertical
Other Energy 4% 4%
Ed Tech
5% 13% Gov’t 8%
Financials 12% Comms 9%
Manufact. Healthcare 12% 11% Service Retail 11% 11%
See End Notes for additional information and definitions
By Customer Segment
42%
Mid-Market
58%
Enterprise
By Customer
No Single Customer e 2% of Revenue
By Geography
88% North America 12% Rest-of-World
Confidential and Proprietary 29
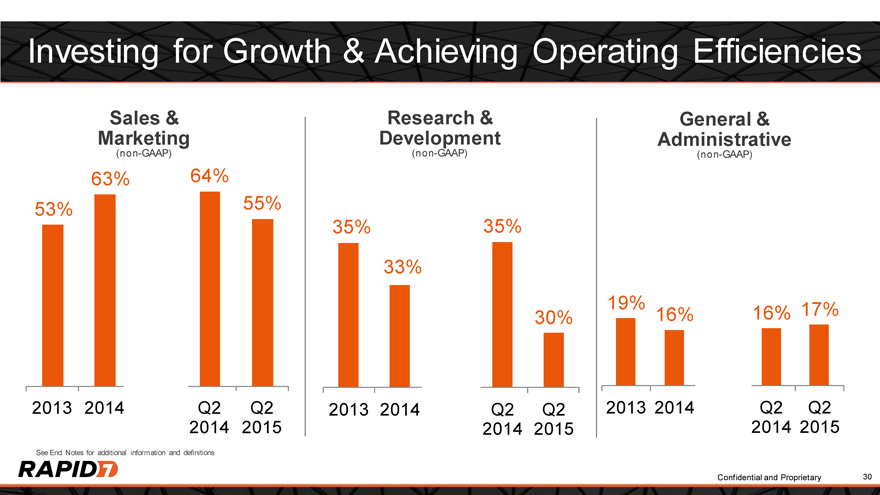
Investing for Growth & Achieving Operating Efficiencies
Marketing Sales &
(non-GAAP)
63% 64% 53% 55%
2013 2014 Q2 Q2 2014 2015
See End Notes for additional information and definitions
Development Research &
(non-GAAP)
35% 35% 33%
30%
2013 2014 Q2 Q2 2014 2015
Administrative General &
(non-GAAP)
19% 17% 16% 16%
2013 2014 Q2 Q2 2014 2015
Confidential and Proprietary 30
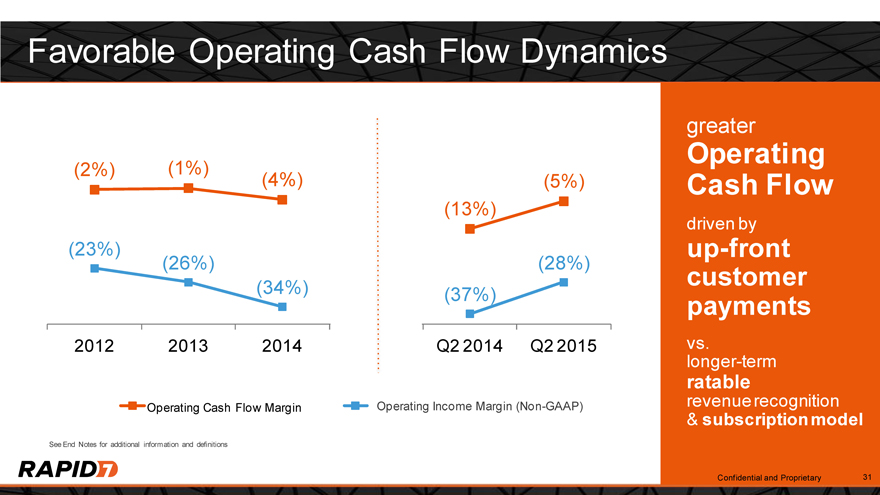
Favorable Operating Cash Flow Dynamics
(2%) (1%) (4%) (5%)
(13%)
(23%)
(26%) (28%)
(34%) (37%)
2012 2013 2014 Q2 2014 Q2 2015
Operating Cash Flow Margin Operating Income Margin (Non-GAAP)
See End Notes for additional information and definitions
greater Operating Cash Flow
up-front driven by customer payments
vs. longer-term ratable revenue recognition
& subscription model
Confidential and Proprietary 31
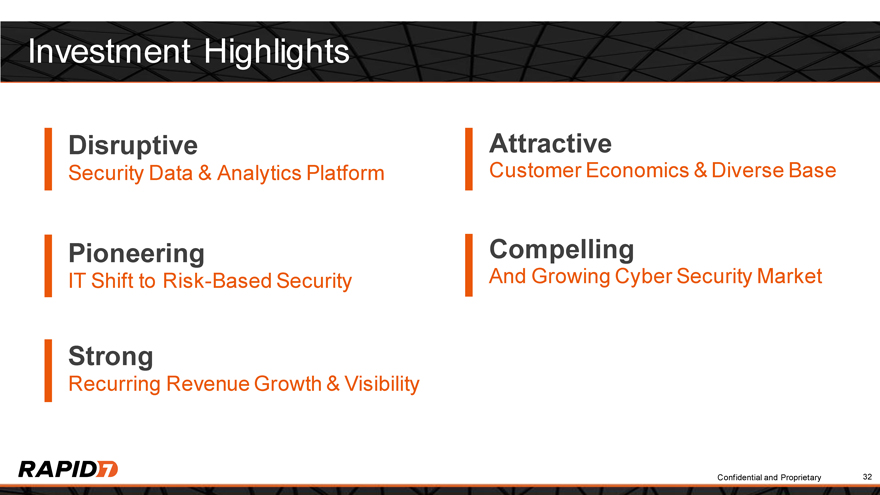
Investment Highlights
Disruptive
Security Data & Analytics Platform
Pioneering
IT Shift to Risk-Based Security
Strong
Recurring Revenue Growth & Visibility
Attractive
Customer Economics & Diverse Base
Compelling
And Growing Cyber Security Market
Confidential and Proprietary 32
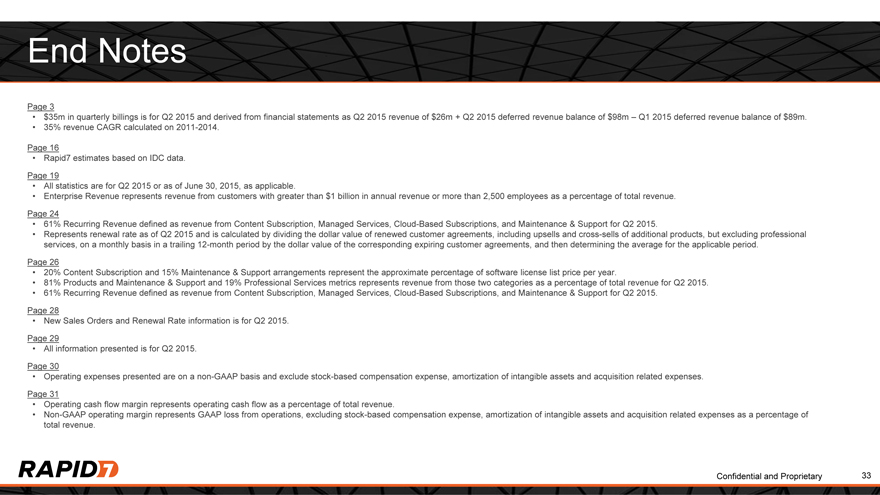
End Notes
Page 3
$35m in quarterly billings is for Q2 2015 and derived from financial statements as Q2 2015 revenue of $26m + Q2 2015 deferred revenue balance of $98m – Q1 2015 deferred revenue balance of $89m.
35% revenue CAGR calculated on 2011-2014.
Page 16
Rapid7 estimates based on IDC data.
Page 19
All statistics are for Q2 2015 or as of June 30, 2015, as applicable.
Enterprise Revenue represents revenue from customers with greater than $1 billion in annual revenue or more than 2,500 employees as a percentage of total revenue.
Page 24
61% Recurring Revenue defined as revenue from Content Subscription, Managed Services, Cloud-Based Subscriptions, and Maintenance & Support for Q2 2015.
Represents renewal rate as of Q2 2015 and is calculated by dividing the dollar value of renewed customer agreements, including upsells and cross-sells of additional products, but excluding professional services, on a monthly basis in a trailing 12-month period by the dollar value of the corresponding expiring customer agreements, and then determining the average for the applicable period.
Page 26
20% Content Subscription and 15% Maintenance & Support arrangements represent the approximate percentage of software license list price per year.
81% Products and Maintenance & Support and 19% Professional Services metrics represents revenue from those two categories as a percentage of total revenue for Q2 2015.
61% Recurring Revenue defined as revenue from Content Subscription, Managed Services, Cloud-Based Subscriptions, and Maintenance & Support for Q2 2015.
Page 28
New Sales Orders and Renewal Rate information is for Q2 2015.
Page 29
All information presented is for Q2 2015.
Page 30
Operating expenses presented are on a non-GAAP basis and exclude stock-based compensation expense, amortization of intangible assets and acquisition related expenses.
Page 31
Operating cash flow margin represents operating cash flow as a percentage of total revenue.
Non-GAAP operating margin represents GAAP loss from operations, excluding stock-based compensation expense, amortization of intangible assets and acquisition related expenses as a percentage of total revenue.
Confidential and Proprietary 33
Rapid7, Inc.
100 Summer Street Boston, MA 02110
Confidential and Proprietary

