|
Exhibit 99.3 
|
SECURITY
DATA &
ANALYTICS
Q2 2015 Financial Results
AUGUST 18, 2015 RAPID7 PROPRIETARY
Disclaimers
This presentation includes forward-looking statements. All statements contained in this presentation other than statements of historical facts, including statements regarding future results of operations and the financial position of Rapid7, Inc. (“Rapid7,” “we,” “us” or “our”) our business strategy and plans and our objectives for future operations, are forward-looking statements. The words “anticipate,” believe,” “continue,” “estimate,” “expect,” “intend,” “may,” “will” and similar expressions are intended to identify forward-looking statements. We have based these forward-looking statements largely on our current expectations and projections about future events and financial trends that we believe may affect our financial condition, results of operations, business strategy, short-term and long-term business operations and objectives, and financial needs. These forward-looking statements are subject to a number of risks and uncertainties, including, without limitation, those set forth in the “Risk Factors” section of our prospectus filed pursuant to Rule 424(b)(4) under the Securities Act of 1933, as amended, on July 17, 2015. Moreover, we operate in a very competitive and rapidly changing environment. New risks emerge from time to time. It is not possible for our management to predict all risks, nor can we assess the impact of all factors on our business or the extent to which any factor, or combination of factors, may cause actual results to differ materially from those contained in any forward-looking statements we may make. In light of these risks, uncertainties and assumptions, the future events and trends discussed in this presentation may not occur and actual results could differ materially and adversely from those anticipated or implied in the forward-looking statements.
Although we believe that the expectations reflected in the forward-looking statements are reasonable, we cannot guarantee future results, levels of activity, performance, achievements or events and circumstances reflected in the forward-looking statements will occur. We are under no duty to update any of these forward-looking statements after the date of this presentation to conform these statements to actual results or revised expectations, except as required by law. You should, therefore, not rely on these forward-looking statements as representing our views as of any date subsequent to the date of this presentation. Moreover, except as required by law, neither we nor any other person assumes responsibility for the accuracy and completeness of the forward-looking statements contained in this presentation.
This presentation also contains estimates and other statistical data made by independent parties and by us relating to market size and growth and other data about our industry. This data involves a number of assumptions and limitations, and you are cautioned not to give undue weight to such estimates. Neither we nor any other person makes any representation as to the accuracy or completeness of such data or undertakes any obligation to update such data after the date of this presentation. In addition, projections, assumptions and estimates of our future performance and the future performance of the markets in which we operate are necessarily subject to a high degree of uncertainty and risk.
Rapid7 Proprietary 2
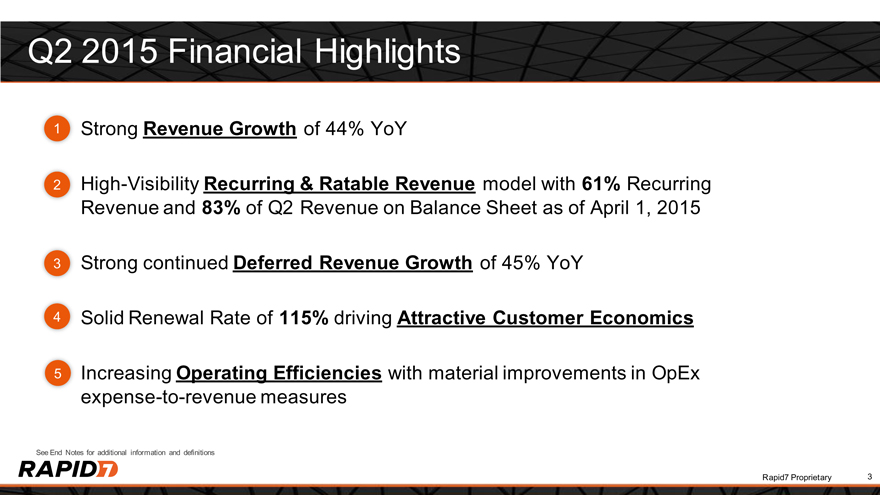
Q2 2015 Financial Highlights
1 Strong Revenue Growth of 44% YoY
2 High-Visibility Recurring & Ratable Revenue model with 61% Recurring
Revenue and 83% of Q2 Revenue on Balance Sheet as of April 1, 2015
3 Strong continued Deferred Revenue Growth of 45% YoY
4 Solid Renewal Rate of 115% driving Attractive Customer Economics
5 Increasing Operating Efficiencies with material improvements in OpEx
expense-to-revenue measures
See End Notes for additional information and definitions
Rapid7 Proprietary 3
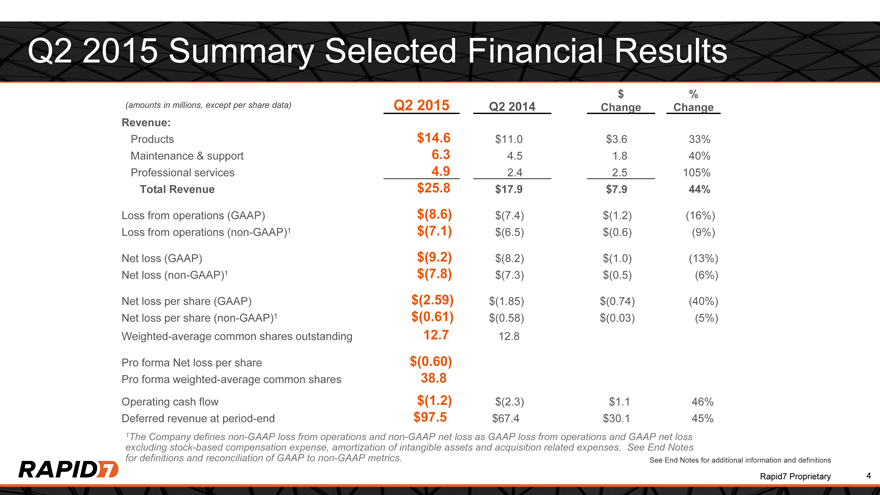
Q2 2015 Summary Selected Financial Results
$ %
(amounts in millions, except per share data) Q2 2015 Q2 2014 Change Change
Revenue:
Products $14.6 $11.0 $3.6 33% Maintenance & support 6.3 4.5 1.8 40% Professional services 4.9 2.4 2.5 105%
Total Revenue $25.8 $17.9 $7.9 44%
Loss from operations (GAAP) $(8.6) $(7.4) $(1.2) (16%) Loss from operations (non-GAAP)1 $(7.1) $(6.5) $(0.6) (9%) Net loss (GAAP) $(9.2) $(8.2) $(1.0) (13%) Net loss (non-GAAP)1 $(7.8) $(7.3) $(0.5) (6%) Net loss per share (GAAP) $(2.59) $(1.85) $(0.74) (40%) Net loss per share (non-GAAP)1 $(0.61) $(0.58) $(0.03) (5%) Weighted-average common shares outstanding 12.7 12.8
Pro forma Net loss per share $(0.60) Pro forma weighted-average common shares 38.8
Operating cash flow $(1.2) $(2.3) $1.1 46% Deferred revenue at period-end $97.5 $67.4 $30.1 45%
1The Company defines non-GAAP loss from operations and non-GAAP net loss as GAAP loss from operations and GAAP net loss excluding stock-based compensation expense, amortization of intangible assets and acquisition related expenses. See End Notes for definitions and reconciliation of GAAP to non-GAAP metrics.
Rapid7 Proprietary 4
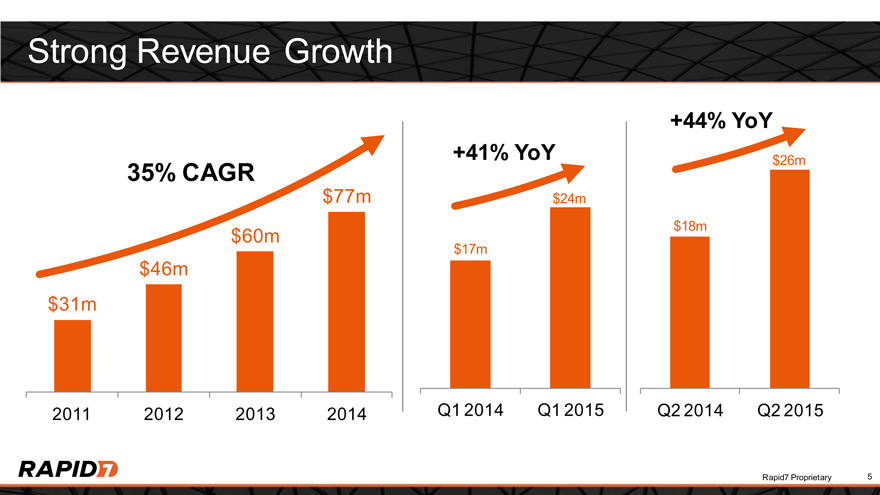
Strong Revenue Growth
+44% YoY
+41% YoY $26m
35% CAGR
$77m $24m
$18m
$60m
$17m
$46m
$31m
2011 2012 2013 2014 Q1 2014 Q1 2015 Q2 2014 Q2 2015
Rapid7 Proprietary 5
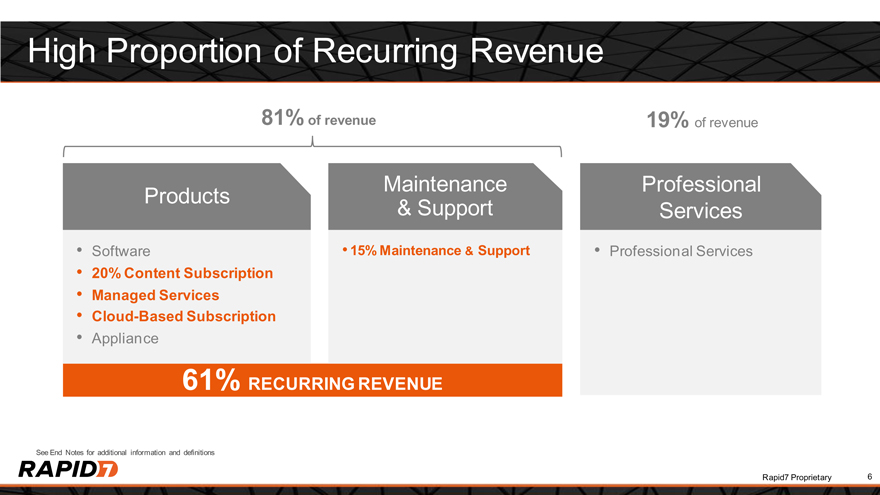
High Proportion of Recurring Revenue
81% of revenue 19% of revenue
Maintenance Professional
Products
& Support Services
Software 15% Maintenance & Support Professional Services
20% Content Subscription
Managed Services
Cloud-Based Subscription
Appliance
61% RECURRING REVENUE
See End Notes for additional information and definitions
Rapid7 Proprietary 6
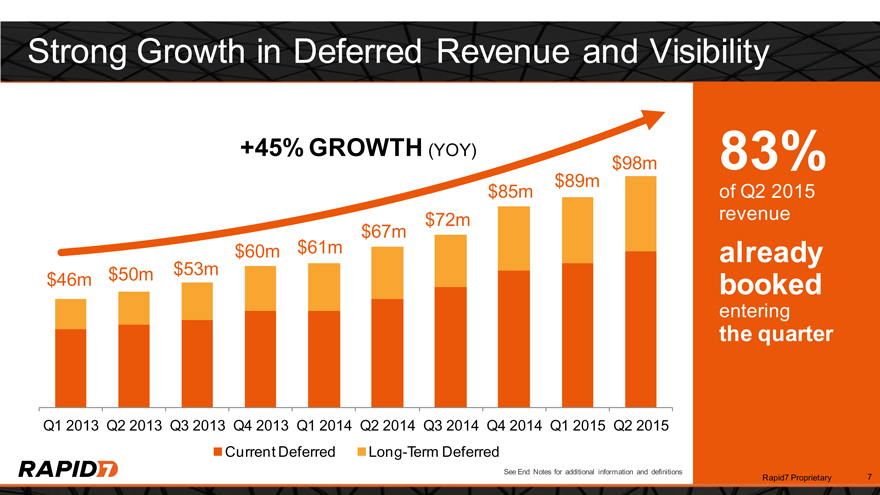
Strong Growth in Deferred Revenue and Visibility
+45% GROWTH (YOY) 83%
$98m
$89m
$85m of Q2 2015
$72m revenue
$67m
$60m $61m already
$50m $53m
$46m booked
entering the quarter
Q1 2013 Q2 2013 Q3 2013 Q4 2013 Q1 2014 Q2 2014 Q3 2014 Q4 2014 Q1 2015 Q2 2015
Current Deferred Long-Term Deferred
See End Notes for additional information and definitions
Rapid7 Proprietary 7
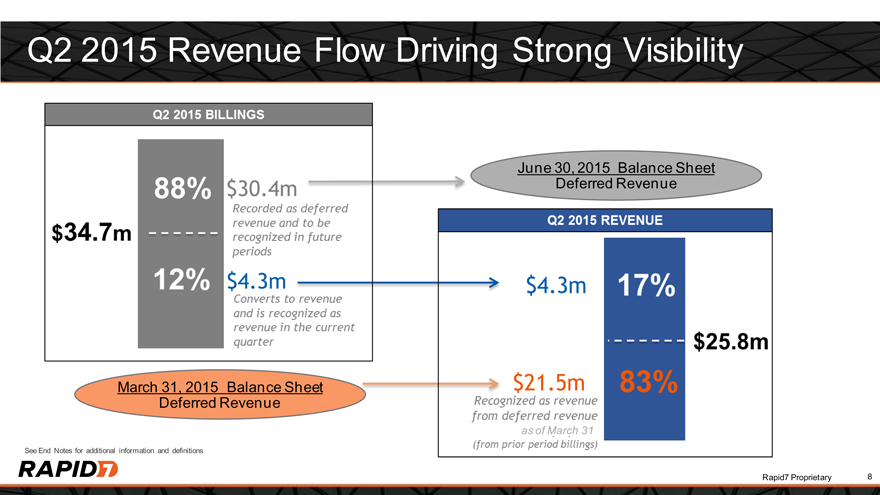
Q2 2015 Revenue Flow Driving Strong Visibility
Q2 2015 billings
88%
12%
$30.4m Recorded as deferred revenue and ton be recognized in future periods.
$4.3 m Converts to revenue and is recognized as revenue in the current quarter
Q2 2015 REVENUE $4.3M 17% 83% $25.8M
$21.5m Recognized as revenue from deferred revenue (frpm prior period billings)
June 30, 2015 Balance Sheet
Deferred Revenue
March 31, 2015 Balance Sheet
Deferred Revenue
as of March 31
See End Notes for additional information and definitions
Rapid7 Proprietary 8
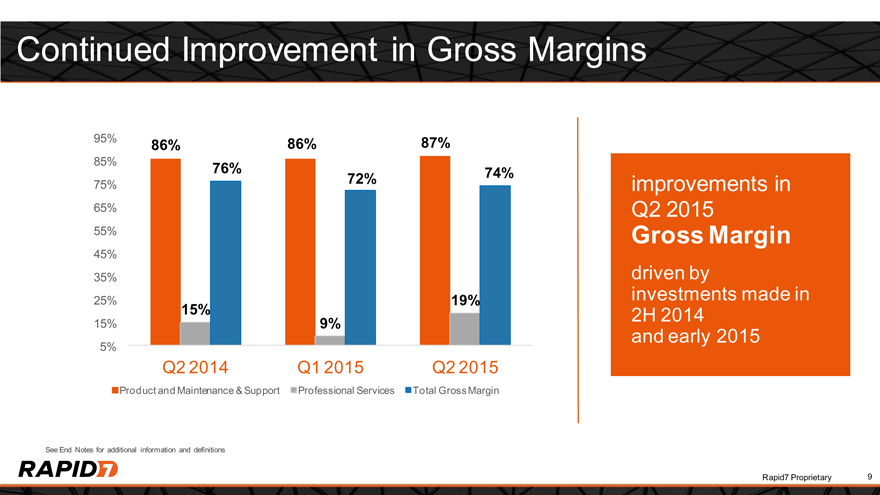
Continued Improvement in Gross Margins
95% 86% 86% 87%
85% 76%
72% 74%
75% improvements in
65% Q2 2015
55% Gross Margin
45%
35% driven by
25% 19% investments made in
15% 2H 2014
15% 9%
and early 2015
5%
Q2 2014 Q1 2015 Q2 2015
Product and Maintenance & Support Professional Services Total Gross Margin
See End Notes for additional information and definitions
Rapid7 Proprietary 9
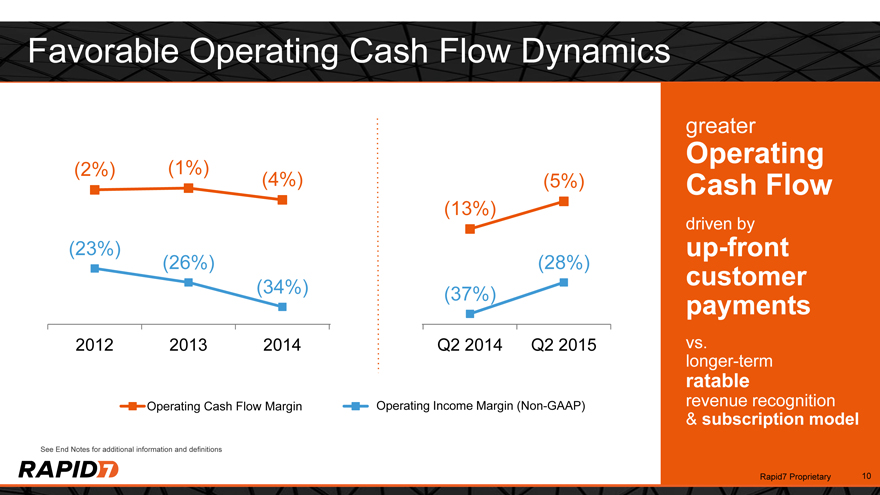
Favorable Operating Cash Flow Dynamics
greater Operating
(2%) (1%)
(4%) (5%) Cash Flow
(13%)
driven by
(23%) (37%) up-front
(26%) (28%) customer
(34%)
payments
2012 2013 2014 Q1 2015 Q2 2015 vs.
longer-term
ratable
Operating Cash Flow Margin Operating Income Margin (Non-GAAP) revenue recognition
& subscription model
See End Notes for additional information and definitions
Rapid7 Proprietary 10
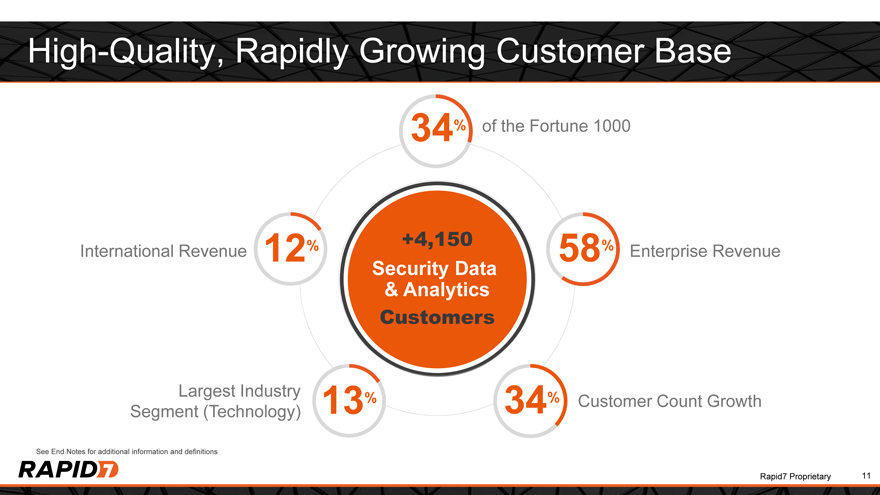
High-Quality, Rapidly Growing Customer Base
34% of the Fortune 1000
% +4,150 %
International Revenue 12 58 Enterprise Revenue
Security Data
& Analytics
Customers
Largest Industry % %
13 34 Customer Count Growth
Segment (Technology)
See End Notes for additional information and definitions
Rapid7 Proprietary 11
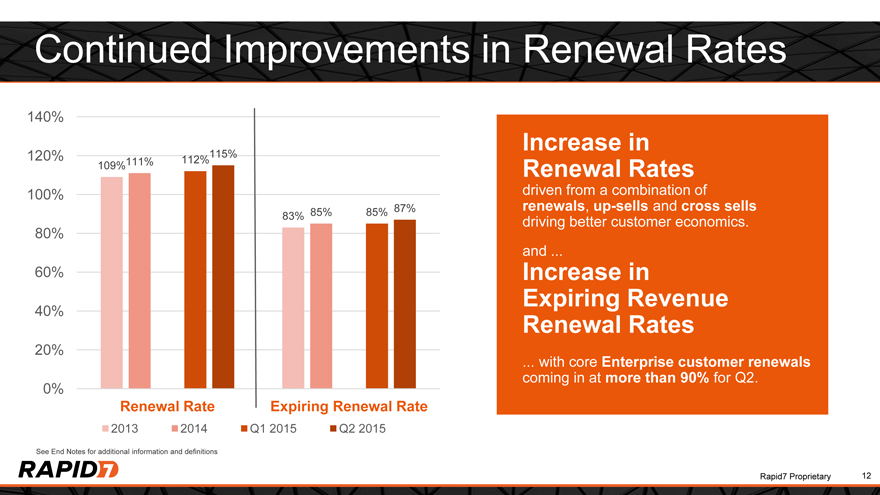
Continued Improvements in Renewal Rates
140%
Increase in
120% 115%
111% 112%
109% Renewal Rates
100% driven from a combination of
87% renewals, up-sells and cross sells
83% 85% 85%
driving better customer economics.
80%
and
60% Increase in
Expiring Revenue
40% Renewal Rates
20%
. with core Enterprise customer renewals
coming in at more than 90% for Q2.
0%
Renewal Rate Expiring Renewal Rate
2013 2014 Q1 2015 Q2 2015
See End Notes for additional information and definitions
Rapid7 Proprietary 12
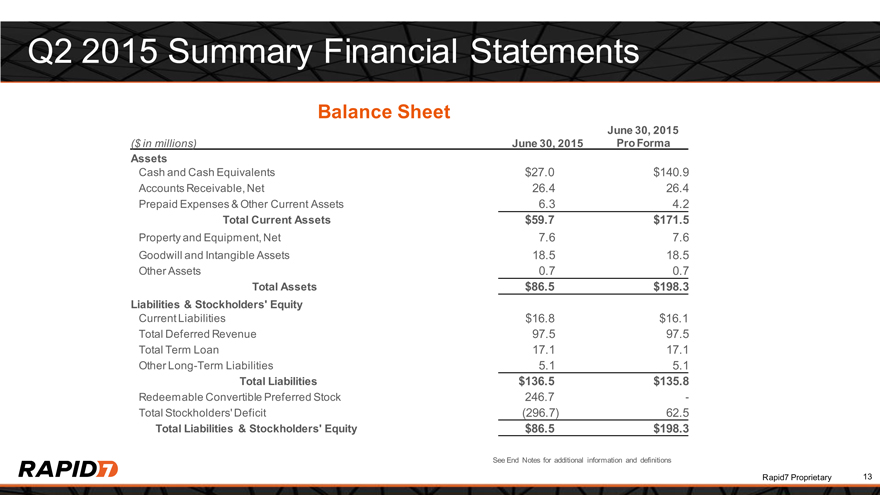
Q2 2015 Summary Financial Statements
Balance Sheet
June 30, 2015
($ in millions) June 30, 2015 Pro Forma
Assets
Cash and Cash Equivalents $27.0 $140.9
Accounts Receivable, Net 26.4 26.4
Prepaid Expenses & Other Current Assets 6.3 4.2
Total Current Assets $59.7 $171.5
Property and Equipment, Net 7.6 7.6
Goodwill and Intangible Assets 18.5 18.5
Other Assets 0.7 0.7
Total Assets $86.5 $198.3
Liabilities & Stockholders’ Equity
Current Liabilities $16.8 $16.1
Total Deferred Revenue 97.5 97.5
Total Term Loan 17.1 17.1
Other Long-Term Liabilities 5.1 5.1
Total Liabilities $136.5 $135.8
Redeemable Convertible Preferred Stock 246.7 -
Total Stockholders’ Deficit (296.7) 62.5
Total Liabilities & Stockholders’ Equity $86.5 $198.3
See End Notes for additional information and definitions
Rapid7 Proprietary 13
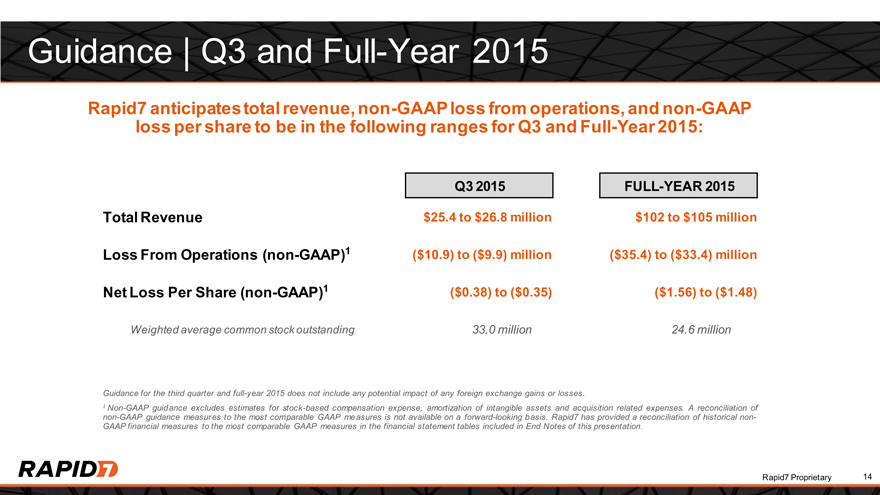
Guidance | Q3 and Full-Year 2015
Rapid7 anticipates total revenue, non-GAAP loss from operations, and non-GAAP
loss per share to be in the following ranges for Q3 and Full-Year 2015:
Q3 2015 FULL-YEAR 2015
Total Revenue $25.4 to $26.8 million $102 to $105 million
Loss From Operations (non-GAAP)1 ($10.9) to ($9.9) million ($35.4) to ($33.4) million
Net Loss Per Share (non-GAAP)1 ($0.38) to ($0.35) ($1.56) to ($1.48)
Weighted average common stock outstanding 33.0 million 24.6 million
Guidance for the third quarter and full-year 2015 does not include any potential impact of any foreign exchange gains or losses.
1 Non-GAAP guidance excludes estimates for stock-based compensation expense, amortization of intangible assets and acquisition related expenses. A reconciliation of
non-GAAP guidance measures to the most comparable GAAP measures is not available on a forward-looking basis. Rapid7 has provided a reconciliation of historical non-
GAAP financial measures to the most comparable GAAP measures in the financial statement tables included in End Notes of this presentation.
Rapid7 Proprietary 14
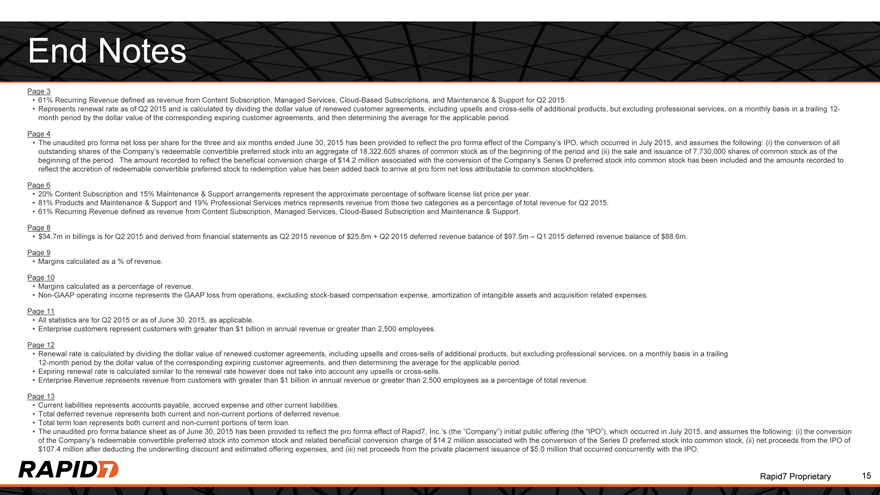
End Notes
Page 3
61% Recurring Revenue defined as revenue from Content Subscription, Managed Services, Cloud-Based Subscriptions, and Maintenance & Support for Q2 2015.
Represents renewal rate as of Q2 2015 and is calculated by dividing the dollar value of renewed customer agreements, including upsells and cross-sells of additional products, but excluding professional services, on a monthly basis in a trailing 12-month period by the dollar value of the corresponding expiring customer agreements, and then determining the average for the applicable period.
Page 4
The unaudited pro forma net loss per share for the three and six months ended June 30, 2015 has been provided to reflect the pro forma effect of the Company’s IPO, which occurred in July 2015, and assumes the following: (i) the conversion of all outstanding shares of the Company’s redeemable convertible preferred stock into an aggregate of 18,322,605 shares of common stock as of the beginning of the period and (ii) the sale and issuance of 7,730,000 shares of common stock as of the beginning of the period. The amount recorded to reflect the beneficial conversion charge of $14.2 million associated with the conversion of the Company’s Series D preferred stock into common stock has been included and the amounts recorded to reflect the accretion of redeemable convertible preferred stock to redemption value has been added back to arrive at pro form net loss attributable to common stockholders.
Page 6
20% Content Subscription and 15% Maintenance & Support arrangements represent the approximate percentage of software license list price per year.
81% Products and Maintenance & Support and 19% Professional Services metrics represents revenue from those two categories as a percentage of total revenue for Q2 2015.
61% Recurring Revenue defined as revenue from Content Subscription, Managed Services, Cloud-Based Subscription and Maintenance & Support.
Page 8
$34.7m in billings is for Q2 2015 and derived from financial statements as Q2 2015 revenue of $25.8m + Q2 2015 deferred revenue balance of $97.5m – Q1 2015 deferred revenue balance of $88.6m.
Page 9
Margins calculated as a % of revenue.
Page 10
Margins calculated as a percentage of revenue.
Non-GAAP operating income represents the GAAP loss from operations, excluding stock-based compensation expense, amortization of intangible assets and acquisition related expenses.
Page 11
All statistics are for Q2 2015 or as of June 30, 2015, as applicable.
Enterprise customers represent customers with greater than $1 billion in annual revenue or greater than 2,500 employees.
Page 12
Renewal rate is calculated by dividing the dollar value of renewed customer agreements, including upsells and cross-sells of additional products, but excluding professional services, on a monthly basis in a trailing 12-month period by the dollar value of the corresponding expiring customer agreements, and then determining the average for the applicable period.
Expiring renewal rate is calculated similar to the renewal rate however does not take into account any upsells or cross-sells.
Enterprise Revenue represents revenue from customers with greater than $1 billion in annual revenue or greater than 2,500 employees as a percentage of total revenue.
Page 13
Current liabilities represents accounts payable, accrued expense and other current liabilities.
Total deferred revenue represents both current and non-current portions of deferred revenue.
Total term loan represents both current and non-current portions of term loan.
The unaudited pro forma balance sheet as of June 30, 2015 has been provided to reflect the pro forma effect of Rapid7, Inc.’s (the “Company”) initial public offering (the “IPO”), which occurred in July 2015, and assumes the following: (i) the conversion of the Company’s redeemable convertible preferred stock into common stock and related beneficial conversion charge of $14.2 million associated with the conversion of the Series D preferred stock into common stock, (ii) net proceeds from the IPO of $107.4 million after deducting the underwriting discount and estimated offering expenses, and (iii) net proceeds from the private placement issuance of $5.0 million that occurred concurrently with the IPO.
Rapid7 Proprietary 15
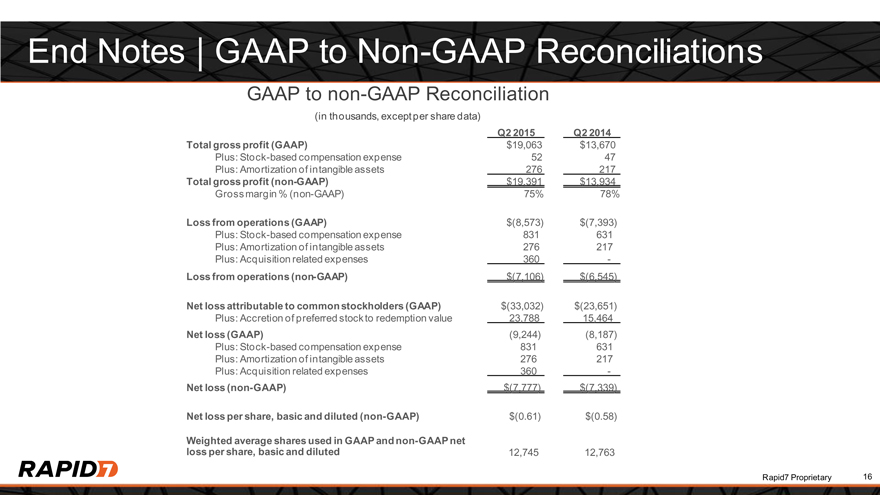
End Notes | GAAP to Non-GAAP Reconciliations
GAAP to non-GAAP Reconciliation
(in thousands, except per share data)
Q2 2015 Q2 2014
Total gross profit (GAAP) $19,063 $13,670
Plus: Stock-based compensation expense 52 47
Plus: Amortization of intangible assets 276 217
Total gross profit (non-GAAP) $19,391 $13,934
Gross margin % (non-GAAP) 75% 78%
Loss from operations (GAAP) $(8,573) $(7,393)
Plus: Stock-based compensation expense 831 631
Plus: Amortization of intangible assets 276 217
Plus: Acquisition related expenses 360 —
Loss from operations (non-GAAP) $(7,106) $(6,545)
Net loss attributable to common stockholders (GAAP) $(33,032) $(23,651)
Plus: Accretion of preferred stock to redemption value 23,788 15,464
Net loss (GAAP) (9,244) (8,187)
Plus: Stock-based compensation expense 831 631
Plus: Amortization of intangible assets 276 217
Plus: Acquisition related expenses 360 —
Net loss (non-GAAP) $(7,777) $(7,339)
Net loss per share, basic and diluted (non-GAAP) $(0.61) $(0.58)
Weighted average shares used in GAAP and non-GAAP net
loss per share, basic and diluted 12,745 12,763
Rapid7 Proprietary 16
Rapid7, Inc.
100 Summer Street
Boston, MA 02110
Rapid7 Proprietary