Sound Point Floating Rate Income Fund Inactive
Filed: 9 May 14, 12:00am
| Shareholder Letter | 3 |
| Allocation of Portfolio Holdings | 5 |
| Schedule of Investments | 6 |
| Statement of Assets & Liabilities | 13 |
| Statement of Operations | 14 |
| Statement of Changes in Net Assets | 15 |
| Statement of Cash Flows | 16 |
| Financial Highlights | 17 |
| Notes to the Financial Statements | 18 |
| Additional Information | 24 |
| Privacy Notice | 25 |
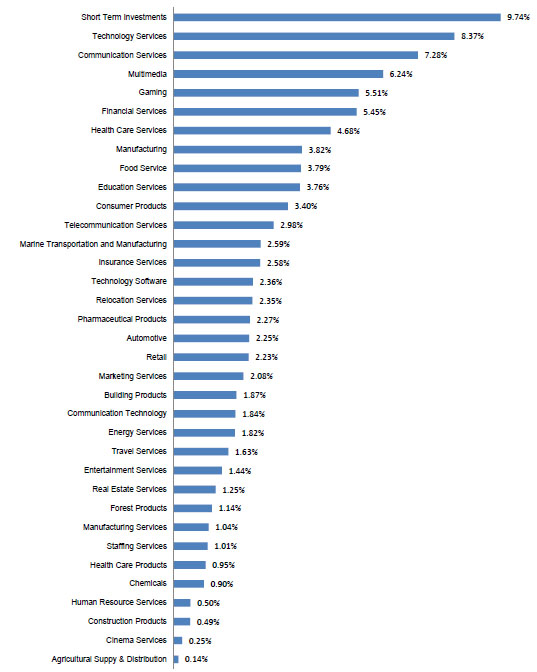
| Sound Point Floating Rate Income Fund | ||
| ALLOCATION OF PORTFOLIO HOLDINGS (Unaudited) | ||
| (Calculated as a percentage of Total Investments) | ||
| February 28, 2014 | ||
| Sound Point Floating Rate Income Fund | ||||||||||||||
| SCHEDULE OF INVESTMENTS (Unaudited) | ||||||||||||||
| February 28, 2014 | ||||||||||||||
Effective interest rate1 | Due date | Cost | Fair value | |||||||||||
Bank Loans2 — 100.70%3 | ||||||||||||||
Agricultural Suppy & Distribution — 0.16%3 | ||||||||||||||
| Pinnacle Operating Corporation | 4.750 | % | 11/15/2018 | $ | 29,832 | $ | 30,018 | |||||||
Automotive — 2.53%3 | ||||||||||||||
| August U.S. Holding Company, Inc. | 10.500 | 4/26/2019 | 381,355 | 385,312 | ||||||||||
| Chrysler Group LLC | 3.250 | 12/5/2018 | 103,482 | 103,731 | ||||||||||
| Total Automotive | 484,837 | 489,043 | ||||||||||||
Building Products — 2.09%3 | ||||||||||||||
| C.H.I. Overhead Doors | 5.500 | 3/18/2019 | 167,640 | 169,463 | ||||||||||
| Quality Home Brands Holdings LLC | 7.750 | 12/17/2018 | 236,483 | 235,135 | ||||||||||
| Total Building Products | 404,123 | 404,598 | ||||||||||||
Chemicals — 1.01%3 | ||||||||||||||
| Kronos Worldwide, Inc. | 4.750 | 2/12/2020 | 30,845 | 31,310 | ||||||||||
| PeroxyChem | 7.500 | 2/13/2020 | 75,460 | 76,230 | ||||||||||
| Royal Adhesives & Sealants, LLC | 9.750 | 1/31/2019 | 84,398 | 88,365 | ||||||||||
| Total Chemicals | 190,703 | 195,905 | ||||||||||||
Cinema Services — 0.28%3 | ||||||||||||||
| AUFINCO PTY Limited | 8.250 | 11/30/2020 | 52,514 | 53,795 | ||||||||||
Communication Services — 8.18%3 | ||||||||||||||
| Asurion | 3.750 | 2/27/2017 | 97,510 | 98,245 | ||||||||||
| Asurion | 4.250 | 5/24/2019 | 138,268 | 138,493 | ||||||||||
| Asurion | 4.250 | 7/8/2020 | 93,412 | 93,371 | ||||||||||
| Asurion | 8.500 | 2/19/2021 | 449,160 | 471,249 | ||||||||||
| ConvergeOne | 9.250 | 5/8/2019 | 338,475 | 343,081 | ||||||||||
| FairPoint Communications, Inc. | 7.500 | 2/14/2019 | 362,451 | 376,698 | ||||||||||
| Hemisphere Media Group, Inc. | 6.250 | 7/30/2020 | 58,157 | 59,145 | ||||||||||
| Total Communication Services | 1,537,433 | 1,580,282 | ||||||||||||
Communication Technology — 2.07%3 | ||||||||||||||
| Sorenson Communications | 9.500 | 10/31/2014 | 399,664 | 400,062 | ||||||||||
Construction Products — 0.55%3 | ||||||||||||||
| Brand Energy & Infrastructure Services, Inc. | 4.750 | 11/26/2020 | 105,153 | 106,364 | ||||||||||
| Sound Point Floating Rate Income Fund | ||||||||||||||
| SCHEDULE OF INVESTMENTS (Unaudited) | ||||||||||||||
| February 28, 2014 | ||||||||||||||
Effective interest rate1 | Due date | Cost | Fair value | |||||||||||
Consumer Products — 3.81%3 | ||||||||||||||
| Hunter Fan Company | 6.500 | % | 12/20/2017 | $ | 221,204 | $ | 223,568 | |||||||
| Norcraft Companies | 5.250 | 11/13/2020 | 124,393 | 125,937 | ||||||||||
| Steinway & Sons | 9.250 | 9/18/2020 | 141,625 | 148,005 | ||||||||||
| Sun Products Corporation | 5.500 | 3/23/2020 | 82,990 | 82,452 | ||||||||||
| Vogue International | 5.250 | 2/7/2020 | 154,440 | 156,975 | ||||||||||
| Total Consumer Products | 724,652 | 736,937 | ||||||||||||
Education Services — 4.22%3 | ||||||||||||||
| Ascend Learning | 6.000 | 5/23/2017 | 112,342 | 113,750 | ||||||||||
| McGraw-Hill Education | 9.000 | 3/22/2019 | 150,529 | 157,539 | ||||||||||
| Renaissance Learning | 5.000 | 11/16/2020 | 177,796 | 181,010 | ||||||||||
| Renaissance Learning | 8.750 | 5/14/2021 | 165,291 | 169,819 | ||||||||||
| Springer Science+Busines Media | 5.000 | 8/14/2020 | 184,960 | 192,624 | ||||||||||
| Total Education Services | 790,918 | 814,742 | ||||||||||||
Energy Services — 2.05%3 | ||||||||||||||
| Alinta Energy | 6.375 | 8/7/2019 | 68,561 | 73,259 | ||||||||||
| Bowie Resources, LLC | 11.750 | 2/9/2021 | 33,653 | 35,262 | ||||||||||
| Fairmount Minerals | 5.000 | 9/5/2019 | 71,461 | 72,736 | ||||||||||
| Stallion Oilfield Services Ltd. | 8.000 | 6/19/2018 | 207,103 | 214,435 | ||||||||||
| Total Energy Services | 380,778 | �� | 395,692 | |||||||||||
Entertainment Services — 1.62%3 | ||||||||||||||
| AMF Bowling Worldwide, Inc. | 8.750 | 6/28/2018 | 162,376 | 170,330 | ||||||||||
| CEC Entertainment, Inc. | 4.250 | 2/12/2021 | 66,665 | 66,888 | ||||||||||
| LuxuryOnly | 5.250 | 7/2/2020 | 75,000 | 75,937 | ||||||||||
| Total Entertainment Services | 304,041 | 313,155 | ||||||||||||
Financial Services — 6.12%3 | ||||||||||||||
| AlixPartners | 9.000 | 7/10/2021 | 48,534 | 50,194 | ||||||||||
| Ascensus, Inc. | 9.000 | 12/2/2020 | 92,630 | 96,232 | ||||||||||
| Liquidnet Holdings, Inc. | 9.250 | 5/8/2017 | 218,514 | 220,964 | ||||||||||
| Mergemarket | 4.500 | 1/29/2021 | 184,537 | 185,694 | ||||||||||
| Mergemarket | 7.500 | 1/28/2022 | 61,690 | 62,465 | ||||||||||
| NXT Capital, LLC | 6.250 | 9/4/2018 | 99,796 | 100,244 | ||||||||||
| Orchard Acquisition Company, LLC | 9.000 | 2/8/2019 | 189,919 | 199,832 | ||||||||||
| Walter Investment Management Corp. | 4.750 | 12/18/2020 | 265,342 | 266,429 | ||||||||||
| Total Financial Services | 1,160,962 | 1,182,054 |
| Sound Point Floating Rate Income Fund | ||||||||||||||
| SCHEDULE OF INVESTMENTS (Unaudited) | ||||||||||||||
| February 28, 2014 | ||||||||||||||
Effective interest rate1 | Due date | Cost | Fair value | |||||||||||
Food Service — 4.26%3 | ||||||||||||||
| CTI Foods Holding Co., LLC | 8.250 | % | 6/28/2021 | $ | 88,771 | $ | 90,900 | |||||||
| Del Monte Foods | 8.250 | 5/26/2021 | 240,570 | 245,430 | ||||||||||
| Ferrara Candy Company | 7.500 | 6/18/2018 | 189,074 | 188,655 | ||||||||||
| Fairway Market | 5.000 | 8/17/2018 | 1,277 | 1,266 | ||||||||||
| Gelson's Markets | 5.250 | 2/14/2020 | 170,280 | 171,570 | ||||||||||
| Phillips Pet Food & Supplies | 8.250 | 1/28/2022 | 123,380 | 125,318 | ||||||||||
| Total Food Service | 813,352 | 823,139 | ||||||||||||
Forest Products — 1.28%3 | ||||||||||||||
| Vestcom International, Inc. | 7.000 | 12/26/2018 | 244,290 | 248,273 | ||||||||||
Gaming — 6.19%3 | ||||||||||||||
| Caesar's Entertainment Operating Company Inc. | 7.000 | 10/11/2020 | 430,550 | 446,235 | ||||||||||
| Caesar's Entertainment Operating Company Inc. | 4.488 | 1/28/2018 | 51,296 | 53,901 | ||||||||||
| Caesar's Entertainment Operating Company Inc. | 5.488 | 1/28/2018 | 307,488 | 322,026 | ||||||||||
| Caesar's Entertainment Operating Company Inc. | 9.500 | 10/31/2016 | 174,494 | 175,973 | ||||||||||
| CBAC Borrower, LLC | 8.250 | 7/2/2020 | 45,578 | 47,667 | ||||||||||
| The Mohegan Tribe | 5.500 | 11/19/2019 | 145,567 | 150,216 | ||||||||||
| Total Gaming | 1,154,973 | 1,196,018 | ||||||||||||
Health Care Products — 1.06%3 | ||||||||||||||
| Atrium Innovations Inc. | 4.250 | 1/29/2021 | 77,610 | 78,195 | ||||||||||
| Water Pik, Inc. | 5.750 | 7/8/2020 | 124,317 | 127,158 | ||||||||||
| Total Health Care Profucts | 201,927 | 205,353 | ||||||||||||
Health Care Services — 5.26%3 | ||||||||||||||
| Aegis Sciences Corporation | 5.500 | 2/19/2021 | 184,140 | 186,930 | ||||||||||
| Carestream Health, Inc. | 9.500 | 12/7/2019 | 134,296 | 140,254 | ||||||||||
| DSI Renal, Inc. | 5.250 | 8/16/2020 | 78,064 | 79,000 | ||||||||||
| Genex Services, Inc. | 5.250 | 7/26/2018 | 78,446 | 79,689 | ||||||||||
| Ikaria, Inc. | 8.750 | 2/4/2022 | 22,828 | 23,431 | ||||||||||
| Therakos, Inc. | 7.500 | 12/27/2017 | 241,117 | 249,873 | ||||||||||
| Therakos, Inc. | 11.250 | 6/27/2018 | 243,526 | 256,719 | ||||||||||
| Total Health Care Services | 982,417 | 1,015,896 | ||||||||||||
Human Resource Services — 0.56%3 | ||||||||||||||
| TriNet Group, Inc. | 5.000 | 8/20/2020 | 105,730 | 107,800 |
| Sound Point Floating Rate Income Fund | ||||||||||||||
| SCHEDULE OF INVESTMENTS (Unaudited) | ||||||||||||||
| February 28, 2014 | ||||||||||||||
Effective interest rate1 | Due date | Cost | Fair value | |||||||||||
Insurance Services — 2.90%3 | ||||||||||||||
| Confie Seguros | 5.750 | % | 11/9/2018 | $ | 107,187 | $ | 108,157 | |||||||
| Cooper Gay Swett & Crawford Ltd. | 8.250 | 10/16/2020 | 91,735 | 90,036 | ||||||||||
| Cunningham Lindsey | 5.000 | 12/10/2019 | 76,432 | 76,517 | ||||||||||
| Mitchell International, Inc. | 4.500 | 10/12/2020 | 75,640 | 76,404 | ||||||||||
| Sedgwick Claims Management Services, Inc. | 3.750 | 2/11/2021 | 77,805 | 77,708 | ||||||||||
| StoneRiver, Inc. | 8.500 | 5/14/2020 | 129,383 | 131,773 | ||||||||||
| Total Insurance Services | 558,182 | 560,595 | ||||||||||||
Manufacturing — 3.66%3 | ||||||||||||||
| Ascend Performance Materials | 6.750 | 4/10/2018 | 86,973 | 88,500 | ||||||||||
| Direct ChassisLink, Inc | 8.500 | 11/12/2019 | 107,365 | 107,365 | ||||||||||
| Grede Holdings LLC | 4.500 | 5/2/2018 | 234,544 | 236,546 | ||||||||||
| Tomkins Air Distributions Technologies, Inc. | 9.250 | 5/11/2020 | 139,030 | 138,890 | ||||||||||
| WP CPP Holdings, LLC | 4.750 | 12/28/2019 | 134,651 | 135,830 | ||||||||||
| Total Manufacturing | 702,563 | 707,131 | ||||||||||||
Manufacturing Services — 1.16%3 | ||||||||||||||
| Distribution International, Inc. | 7.500 | 7/16/2019 | 128,057 | 129,673 | ||||||||||
| TMS International Corp. | 4.500 | 10/16/2020 | 93,547 | 95,175 | ||||||||||
| Total Manufacturing Services | 221,604 | 224,848 | ||||||||||||
Marine Transportation and Manufacturing — 2.91%3 | ||||||||||||||
| Commercial Barge Line Company | 7.500 | 9/22/2019 | 102,351 | 104,799 | ||||||||||
| Navios Maritime Partners L.P. | 5.250 | 6/27/2018 | 213,908 | 221,356 | ||||||||||
| SeaStar Solutions | 5.250 | 1/30/2021 | 232,830 | 236,340 | ||||||||||
| Total Marine Transportation and Manufacturing | 549,089 | 562,495 | ||||||||||||
Marketing Services — 2.33%3 | ||||||||||||||
| Advanstar Communications Inc. | 9.500 | 6/5/2020 | 89,750 | 91,758 | ||||||||||
| Deluxe | 6.500 | 2/25/2020 | 43,780 | 44,202 | ||||||||||
| Merrill Corporation | 7.250 | 3/8/2018 | 220,981 | 226,317 | ||||||||||
| Penton | 9.000 | 10/1/2020 | 60,167 | 61,763 | ||||||||||
| YP | 8.000 | 6/4/2018 | 26,000 | 26,244 | ||||||||||
| Total Marketing Services | 440,678 | 450,284 |
| Sound Point Floating Rate Income Fund | ||||||||||||||
| SCHEDULE OF INVESTMENTS (Unaudited) | ||||||||||||||
| February 28, 2014 | ||||||||||||||
Effective interest rate1 | Due date | Cost | Fair value | |||||||||||
Multimedia — 7.01%3 | ||||||||||||||
| Encompass | 6.750 | % | 8/10/2017 | $ | 304,331 | $ | 306,936 | |||||||
| Extreme Reach, Inc. | 6.750 | 1/24/2020 | 76,838 | 79,072 | ||||||||||
| Extreme Reach, Inc. | 10.500 | 1/22/2021 | 333,200 | 341,700 | ||||||||||
| Ion Media Networks, Inc. | 5.000 | 12/17/2020 | 35,823 | 36,427 | ||||||||||
| Learfield Communications, Inc. | 5.000 | 10/8/2020 | 46,228 | 46,402 | ||||||||||
| Learfield Communications, Inc. | 8.750 | 10/8/2021 | 8,160 | 8,200 | ||||||||||
| NEP Broadcasting, LLC | 9.500 | 7/22/2020 | 141,542 | 146,741 | ||||||||||
| Playboy Enterprises, Inc. | 7.250 | 3/6/2017 | 382,721 | 388,333 | ||||||||||
| Total Multimedia | 1,328,843 | 1,353,811 | ||||||||||||
Pharmaceutical Products — 2.55%3 | ||||||||||||||
| Alvogen | 7.000 | 5/23/2018 | 176,935 | 180,927 | ||||||||||
| Covis Pharmaceuticals, Inc. | 6.000 | 4/4/2019 | 311,656 | 310,877 | ||||||||||
| Total Pharmaceutical Products | 488,591 | 491,804 | ||||||||||||
Real Estate Services — 1.40%3 | ||||||||||||||
| RentPath, Inc. | 6.250 | 5/29/2020 | 272,864 | 271,359 | ||||||||||
Relocation Services — 2.64%3 | ||||||||||||||
| SIRVA, Inc. | 7.500 | 3/27/2019 | 487,319 | 509,277 | ||||||||||
Retail — 2.50%3 | ||||||||||||||
| Bob's Discount Furniture | 5.250 | 2/5/2021 | 106,920 | 108,135 | ||||||||||
| Bob's Discount Furniture | 9.000 | 2/7/2022 | 60,760 | 61,768 | ||||||||||
| Collective Brands, Inc. | 7.250 | 10/9/2019 | 247,500 | 248,272 | ||||||||||
| Vince Intermediate Holding, LLC | 6.000 | 11/27/2019 | 63,491 | 65,236 | ||||||||||
| Total Retail | 478,671 | 483,411 | ||||||||||||
Staffing Services — 1.13%3 | ||||||||||||||
| AlliedBarton Security Services | 4.250 | 2/12/2021 | 90,545 | 91,250 | ||||||||||
| AlliedBarton Security Services | 8.000 | 8/12/2021 | 25,805 | 26,282 | ||||||||||
| NES Global Talent | 6.500 | 10/2/2019 | 98,467 | 100,620 | ||||||||||
| Total Staffing Services | 214,817 | 218,152 |
| Sound Point Floating Rate Income Fund | ||||||||||||||
| SCHEDULE OF INVESTMENTS (Unaudited) | ||||||||||||||
| February 28, 2014 | ||||||||||||||
Effective interest rate1 | Due date | Cost | Fair value | |||||||||||
Technology Services — 9.39%3 | ||||||||||||||
| Dell | 4.500 | % | 4/29/2020 | $ | 131,385 | $ | 132,602 | |||||||
| Eastman Kodak Company | 7.250 | 7/31/2019 | 218,778 | 224,761 | ||||||||||
| Global Logic | 6.250 | 5/31/2019 | 154,470 | 156,780 | ||||||||||
| Inmar | 4.250 | 1/27/2021 | 77,223 | 77,902 | ||||||||||
| Internap Network Services Corporation | 6.000 | 11/26/2019 | 185,181 | 188,402 | ||||||||||
| iQor Holdings Inc. | 6.000 | 2/19/2021 | 194,040 | 194,535 | ||||||||||
| iQor Holdings Inc. | 9.750 | 2/18/2022 | 234,975 | 235,577 | ||||||||||
| Latisys | 6.500 | 3/6/2019 | 453,685 | 454,147 | ||||||||||
| LTS Buyer, LLC | 8.000 | 4/12/2021 | 80,777 | 82,953 | ||||||||||
| Systems Maintenance Services, Inc. | 9.250 | 10/16/2020 | 67,320 | 67,660 | ||||||||||
| Total Technology Services | 1,797,834 | 1,815,319 | ||||||||||||
Technology Software — 2.65%3 | ||||||||||||||
| Aderant Holdings, Inc. | 6.250 | 12/20/2018 | 492,075 | 499,972 | ||||||||||
| Sophos | 5.000 | 1/27/2021 | 11,940 | 12,135 | ||||||||||
| Total Technology Software | 504,015 | 512,107 | ||||||||||||
Telecommunication Services — 3.34%3 | ||||||||||||||
| Global Tel*Link Corporation | 9.000 | 11/23/2020 | 468,839 | 472,025 | ||||||||||
| Securus Technologies, Inc. | �� | 9.000 | 4/30/2021 | 95,040 | 96,100 | |||||||||
| Ziggo | 3.500 | 1/15/2022 | 77,902 | 77,853 | ||||||||||
| Total Telecommunication Services | 641,781 | 645,978 | ||||||||||||
Travel Services — 1.83%3 | ||||||||||||||
| Apple Leisure Group | 7.000 | 2/28/2019 | 245,959 | 249,366 | ||||||||||
| Travelport | 6.250 | 6/26/2019 | 99,123 | 103,275 | ||||||||||
| Total Travel Services | 345,082 | 352,641 | ||||||||||||
| Total Bank Loans | 19,100,232 | 19,458,338 | ||||||||||||
Bonds — United States — 0.63%3 | ||||||||||||||
Manufacturing — 0.633 | ||||||||||||||
| Huntco Site Furnishings, LLC | 9.625 | 3/1/2021 | 117,517 | 121,677 | ||||||||||
Short Term Investments — 10.93%3 | ||||||||||||||
US Bank Money Market 5, 0.03%4 | 2,113,158 | 2,113,158 | ||||||||||||
| Sound Point Floating Rate Income Fund | ||||||||||||||
| SCHEDULE OF INVESTMENTS (Unaudited) | ||||||||||||||
| February 28, 2014 | ||||||||||||||
Effective interest rate1 | Due date | Cost | Fair value | |||||||||||
Total Investments — 112.26%3 | $ | 21,213,390 | $ | 21,693,173 | ||||||||||
Other liabilities and assets — (12.26)%3 | (2,369,232 | ) | ||||||||||||
Net Assets — 100%3 | $ | 19,323,941 | ||||||||||||
1 | The effective interest rates are based on settled commitment amount. | |||||||||||||
2 | Bank loans are exempt from registration under the Securities Act of 1933, as amended, but contain certain restrictions on resale and cannot be sold publicly. These loans pay interest at rates which adjust periodically. The interest rates shown for the bank loans are the current interest rates as of February 28, 2014. Bank loans are also subject to mandatory and/or optional prepayment which cannot be predicted. As a result, the remaining maturity may be substantially less than the stated maturity shown. | |||||||||||||
| 3 | Calculated as a percentage of net assets. | |||||||||||||
| 4 | Rate reported is the current yield as of February 28, 2014. | |||||||||||||
| Sound Point Floating Rate Income Fund | ||||
| STATEMENT OF ASSETS & LIABILITIES (Unaudited) | ||||
| February 28, 2014 | ||||
| Assets | ||||
| Investments, at fair value (cost $21,330,907) | $ | 21,693,173 | ||
| Receivable for investments sold | 3,086,097 | |||
Interest receivable | 150,324 | |||
| Total assets | 24,929,594 | |||
| Liabilities | ||||
| Payable for investments purchased | 5,066,883 | |||
| Payable to Adviser, net | 47,301 | |||
| Accrued expenses and other liabilities | 191,469 | |||
| Subscriptions received in advance | 300,000 | |||
| Total liabilities | 5,605,653 | |||
| Total net assets | $ | 19,323,941 | ||
| Net Assets: | ||||
| Common stock, $0.01 par value; 1,843,877 shares issued and outstanding | ||||
| (unlimited shares authorized) | $ | 18,439 | ||
| Additional paid-in capital | 18,686,288 | |||
| Undistributed net investment income | 115,063 | |||
| Accumulated net realized gain | 141,885 | |||
| Net unrealized appreciation | 362,266 | |||
| Total net assets | $ | 19,323,941 | ||
| Net asset value per share | $ | 10.48 | ||
| Sound Point Floating Rate Income Fund | ||||
| STATEMENT OF OPERATIONS (Unaudited) | ||||
Period from September 1, 2013 through February 28, 2014 | ||||
| Investment Income | ||||
Interest income | $ | 723,741 | ||
| Operating Expenses | ||||
| Advisory fees | 119,190 | |||
| Professional fees | 45,000 | |||
| Administrator fees | 41,180 | |||
| Offering costs | 15,837 | |||
| Directors' fees | 11,250 | |||
| Transfer agent fees and expenses | 9,455 | |||
| Custodian fees and expenses | 5,083 | |||
| Other operating expenses | 1,283 | |||
| Total operating expenses | 248,278 | |||
| Less fees waived by Adviser | (70,379) | |||
| Net Expenses | 177,899 | |||
| Net investment income | 545,842 | |||
| Realized and Unrealized Gains on Investments | ||||
| Net realized gain on investments | 179,832 | |||
| Net unrealized appreciation of investments | 89,278 | |||
| Net realized and unrealized gains on investments | 269,110 | |||
| Net increase in net assets resulting from operations | $ | 814,952 | ||
| STATEMENT OF CHANGES IN NET ASSETS | |||||||||||
Period from September 1, 2013 through February 28, 2014 | Period from December 1, 2012 (1) through August 31, 2013 | ||||||
| (Unaudited) | |||||||
| Operations | |||||||
| Net investment income | $ | 545,842 | $ | 243,548 | |||
| Net realized gain on investments | 179,832 | 355,644 | |||||
| Net unrealized appreciation on investments | 89,278 | 272,988 | |||||
| Net increase in net assets resulting from operations | 814,952 | 872,180 | |||||
| Dividends to Common Stockholders | |||||||
| Net investment income | (569,565) | (104,762) | |||||
| Net realized gain | (393,591) | - | |||||
| Total dividends to common stockholders | (963,156) | (104,762) | |||||
| Capital Stock Transactions | |||||||
| Proceeds from shares sold | 2,010,000 | 16,971,000 | |||||
| Payments for shares redeemed | (714,406) | - | |||||
Issuance of 38,471 and 3,905 common shares from reinvestment | |||||||
| of distributions to shareholders, respectively | 397,404 | 40,729 | |||||
| Net increase in net assets capital stock transactions | 1,692,998 | 17,011,729 | |||||
| Total increase in net assets | 1,544,794 | 17,779,147 | |||||
| Net Assets | |||||||
| Beginning of period | 17,779,147 | - | |||||
| End of period | $ | 19,323,941 | $ | 17,779,147 | |||
| Undistributed net investment income, end of period | $ | 115,063 | $ | 138,786 | |||
(1) Commencement of operations. | |||||||
| Sound Point Floating Rate Income Fund | ||||
| STATEMENT OF CASH FLOWS (Unaudited) | ||||
Period from September 1, 2013 through February 28, 2014 | ||||
| Reconciliation of net increase in net assets applicable to | ||||
| common stockholders resulting from operations to | ||||
| net cash used in operating activities | ||||
| Net increase in net assets applicable to common stockholders | ||||
| resulting from operations | $ | 814,952 | ||
| Adjustments to reconcile net increase in net assets applicable to | ||||
| common stockholders resulting from operations to net cash | ||||
| used in operating activities: | ||||
| Purchases of long-term investments | (22,809,301 | ) | ||
| Proceeds from sales of long-term investments | 21,075,437 | |||
| Purchases of short-term investments, net | (974,729 | ) | ||
| Amortization and accretion | (17,819 | ) | ||
| Net unrealized appreciation | (89,278 | ) | ||
| Net realized gain | (179,832 | ) | ||
| Changes in operating assets and liabilities: | ||||
| Increase in receivable for investments sold | (1,147,710 | ) | ||
| Increase in interest receivable | (15,926 | ) | ||
| Decrease in receivable from Adviser, net | 1,511 | |||
| Decrease in prepaid expenses and other assets | 146 | |||
| Increase in payable for investments purchased | 2,228,380 | |||
| Increase in payable to Adviser | 47,301 | |||
| Decrease in payable to Trustees | (11,250 | ) | ||
| Increase in accrued expenses and other liabilities | 48,276 | |||
| Net cash used in operating activities | (1,029,842 | ) | ||
| Cash Flows From Financing Activities | ||||
| Issuance of common stock | 2,310,000 | |||
| Redemption of common stock | (714,406 | ) | ||
| Distributions paid to common stockholders | (565,752 | ) | ||
| Net cash provided by financing activities | 1,029,842 | |||
| Net change in cash | - | |||
| Cash--beginning of period | - | |||
| Cash--end of period | $ | - | ||
| Non-Cash Financing Activities | ||||
| Reinvestment of distributions by common stockholders | $ | 397,404 | ||
| Sound Point Floating Rate Income Fund | |||||||||
| FINANCIAL HIGHLIGHTS | |||||||||
Period From September 1, 2013 through February 28, 2014 | Period From December 1, 2012 (1) through August 31, 2013 | ||||||||
| Per Common Share Data | (Unaudited) | ||||||||
| Net asset value, beginning of period | $ | 10.58 | $ | 10.00 | |||||
| Income from investment operations: | |||||||||
| Net investment income | 0.30 | 0.14 | |||||||
| Net realized and unrealized gains on investments | 0.14 | 0.50 | |||||||
| Total increase from investment operations | 0.44 | 0.64 | |||||||
| Less distributions to common stockholders: | |||||||||
| Net investment income | (0.32 | ) | (0.06 | ) | |||||
| Net realized gain | (0.22 | ) | - | ||||||
| Total distributions to common stockholders | (0.54 | ) | (0.06 | ) | |||||
| Net asset value, end of period | $ | 10.48 | $ | 10.58 | |||||
Total investment return based on net asset value (2) | 4.16 | % | 6.40 | % | |||||
| Supplemental Data and Ratios | |||||||||
| Net assets, end of period (000's) | $ | 19,324 | $ | 17,779 | |||||
Ratio of expenses to average net assets before waiver (3) | 2.58 | % | 3.33 | % | |||||
Ratio of expenses to average net assets after waiver (3) | 1.85 | % | 2.08 | % | |||||
Ratio of net investment income to average net assets before waiver (3) | 4.95 | % | 0.86 | % | |||||
Ratio of net investment income to average net assets after waiver (3) | 5.68 | % | 2.11 | % | |||||
Portfolio turnover rate (2) | 108.92 | % | 197.14 | % | |||||
| (1) | Commencement of operations. | ||||||||
| (2) | Not annualized. | ||||||||
| (3) | Annualized for periods less than one full year. | ||||||||
| Description | Level 1 | Level 2 | Level 3 | Total Investments | ||||||||||||
Assets: Fixed Income: | ||||||||||||||||
Bank Loans(a) | $ | - | $ | 19,458,338 | $ | - | $ | 19,458,338 | ||||||||
Bonds(a) | - | 121,677 | - | 121,677 | ||||||||||||
| Other: | ||||||||||||||||
Short-Term Investments(b) | 2,113,158 | - | - | 2,113,158 | ||||||||||||
| Total Assets | $ | 2,113,158 | $ | 19,580,015 | $ | - | $ | 21,693,173 | ||||||||
| (a) | All other industry classifications are identified in the Schedule of Investments. |
| (b) | Short-term investment is a sweep investment for cash balances in the Fund at February 28, 2014. |
Ordinary Income | Net Long Term Capital Gains | Total Distributions Paid | ||
| $104,762 | $ - | $104,762 |
| Tax cost of investments | $ | 18,467,663 | ||
| Unrealized appreciation | 273,362 | |||
| Unrealized depreciation | - | |||
| Net unrealized appreciation (depreciation) | 273,362 | |||
| Undistributed ordinary income | 494,430 | |||
| Undistributed long term gains | - | |||
| Distributable earnings | 494,430 | |||
| Other accumulated gain/(loss) | - | |||
| Total accumulated gain/(loss) | $ | 767,792 |
| · | Information we receive in subscription agreements, investor questionnaires and other forms which Shareholders complete and submit to us, such as names, addresses, phone numbers, social security numbers, and employment, asset, income and other household information; |
| · | Information we receive and maintain relating to the net asset value of a Shareholder’s shares, such as profit and loss allocations and capital withdrawals and additions; |
| · | Information about your investment in and other transactions with us and our affiliates, including information we receive and maintain relating to new issue and other securities transactions with and through the Fund and its affiliates; and |
| · | Information we receive about a Shareholder from the Shareholder’s purchaser representative, financial advisor, investment consultant or other financial institution with whom the Fund has a relationship and/or whom the Shareholder may have authorized to provide such information to the Fund. |
| · | Financial service providers such as the Fund’s prime broker who assists the Fund as part of the ordinary course of servicing your investments in the Fund; |
| · | Legal representatives of the Fund, such as our counsel, accountants and auditors; |
| · | Cergain non-affiliated parties who perform marketing services for the Fund or with whom we have entered into joint marketing agreements; and |
| · | Persons acting in a fiduciary or representative capacity on behalf of an individual Shareholder, such as an IRA custodian or Trustee of a grantor trust. |
| Period | (a) Total Number of Shares (or Units) Purchased | (b) Average Price Paid per Share (or Unit) | (c) Total Number of Shares (or Units) Purchased as Part of Publicly Announced Plans or Programs | (d) Maximum Number (or Approximate Dollar Value) of Shares (or Units) that May Yet Be Purchased Under the Plans or Programs |
Month #1 9/01/13-9/30/13 | 0 | 0 | 0 | 0 |
Month #2 10/01/13-10/31/13 | 0 | 0 | 0 | 0 |
Month #3 11/01/13-11/30/13* | 66,087 | 10.81 | 66,087 | 91,988 |
Month #4 12/01/13-12/31/13 | 0 | 0 | 0 | 0 |
Month #5 1/01/14-1/31/13 | 0 | 0 | 0 | 0 |
Month #6 2/01/14-2/28/14^ | 0 | 0 | 0 | 92,193 |
| Total | 66,087 | 10.81 | 66,087 | 184,181 |
| (a) | The Registrant’s President and Treasurer have reviewed the Registrant's disclosure controls and procedures (as defined in Rule 30a-3(c) under the Investment Company Act of 1940 (the “Act”)) as of a date within 90 days of the filing of this report, as required by Rule 30a-3(b) under the Act and Rules 13a-15(b) or 15d-15(b) under the Securities Exchange Act of 1934. Based on their review, such officers have concluded that the disclosure controls and procedures are effective in ensuring that information required to be disclosed in this report is appropriately recorded, processed, summarized and reported and made known to them by others within the Registrant and by the Registrant’s service provider. |
| (b) | There were no changes in the Registrant's internal control over financial reporting (as defined in Rule 30a-3(d) under the Act) that occurred during the second fiscal quarter of the period covered by this report that has materially affected, or is reasonably likely to materially affect, the Registrant's internal control over financial reporting. |