UNITED STATES
SECURITIES AND EXCHANGE COMMISSION
Washington, D.C. 20549
FORM N-CSR
CERTIFIED SHAREHOLDER REPORT OF REGISTERED MANAGEMENT INVESTMENT COMPANIES
Investment Company Act file number 811-22767
First Trust Exchange-Traded Fund VII
(Exact name of registrant as specified in charter)
120 East Liberty Drive, Suite 400
Wheaton, IL 60187
(Address of principal executive offices) (Zip code)
W. Scott Jardine, Esq.
First Trust Portfolios L.P.
120 East Liberty Drive, Suite 400
Wheaton, IL 60187
(Name and address of agent for service)
Registrant’s telephone number, including area code: (630) 765-8000
Date of fiscal year end: December 31
Date of reporting period: December 31, 2023
Form N-CSR is to be used by management investment companies to file reports with the Commission not later than 10 days after the transmission to stockholders of any report that is required to be transmitted to stockholders under Rule 30e-1 under the Investment Company Act of 1940 (17 CFR 270.30e-1). The Commission may use the information provided on Form N-CSR in its regulatory, disclosure review, inspection, and policymaking roles.
A registrant is required to disclose the information specified by Form N-CSR, and the Commission will make this information public. A registrant is not required to respond to the collection of information contained in Form N-CSR unless the Form displays a currently valid Office of Management and Budget (“OMB”) control number. Please direct comments concerning the accuracy of the information collection burden estimate and any suggestions for reducing the burden to Secretary, Securities and Exchange Commission, 450 Fifth Street, NW, Washington, DC 20549-0609. The OMB has reviewed this collection of information under the clearance requirements of 44 U.S.C. § 3507.
Item 1. Report to Stockholders.
(a) The registrant’s annual report transmitted to shareholders pursuant to Rule 30e-1 under the Investment Company Act of 1940 is as follows:
|
For the Year Ended
December 31, 2023 |
First Trust Exchange-Traded Fund VII
First Trust Global Tactical Commodity Strategy Fund (FTGC) |
First Trust Global Tactical Commodity Strategy Fund (FTGC)
Annual Report
December 31, 2023
Caution Regarding Forward-Looking Statements
This report contains certain forward-looking statements within the meaning of the Securities Act of 1933, as amended, and the Securities Exchange Act of 1934, as amended. Forward-looking statements include statements regarding the goals, beliefs, plans or current expectations of First Trust Advisors L.P. (“First Trust” or the “Advisor”) and its representatives, taking into account the information currently available to them. Forward-looking statements include all statements that do not relate solely to current or historical fact. For example, forward-looking statements include the use of words such as “anticipate,” “estimate,” “intend,” “expect,” “believe,” “plan,” “may,” “should,” “would” or other words that convey uncertainty of future events or outcomes.
Forward-looking statements involve known and unknown risks, uncertainties and other factors that may cause the actual results, performance or achievements of the series of First Trust Exchange-Traded Fund VII (the “Trust”) described in this report (First Trust Global Tactical Commodity Strategy Fund; hereinafter referred to as the “Fund”) to be materially different from any future results, performance or achievements expressed or implied by the forward-looking statements. When evaluating the information included in this report, you are cautioned not to place undue reliance on these forward-looking statements, which reflect the judgment of the Advisor and its representatives only as of the date hereof. We undertake no obligation to publicly revise or update these forward-looking statements to reflect events and circumstances that arise after the date hereof.
Performance and Risk Disclosure
There is no assurance that the Fund will achieve its investment objective. The Fund is subject to market risk, which is the possibility that the market values of securities owned by the Fund will decline and that the value of the Fund’s shares may therefore be less than what you paid for them. Accordingly, you can lose money investing in the Fund. See “Risk Considerations” in the Additional Information section of this report for a discussion of certain other risks of investing in the Fund.
Performance data quoted represents past performance, which is no guarantee of future results, and current performance may be lower or higher than the figures shown. For the most recent month-end performance figures, please visit www.ftportfolios.com or speak with your financial advisor. Investment returns, net asset value and share price will fluctuate and Fund shares, when sold, may be worth more or less than their original cost.
The Advisor may also periodically provide additional information on Fund performance on the Fund’s webpage at www.ftportfolios.com.
How to Read This Report
This report contains information that may help you evaluate your investment in the Fund. It includes details about the Fund and presents data and analysis that provide insight into the Fund’s performance and investment approach.
By reading the portfolio commentary from the portfolio management team of the Fund, you may obtain an understanding of how the market environment affected the Fund’s performance. The statistical information that follows may help you understand the Fund’s performance compared to that of relevant market benchmarks.
It is important to keep in mind that the opinions expressed by personnel of the Advisor are just that: informed opinions. They should not be considered to be promises or advice. The opinions, like the statistics, cover the period through the date on the cover of this report. The material risks of investing in the Fund are spelled out in the prospectus, the statement of additional information, and other Fund regulatory filings.
First Trust Global Tactical Commodity Strategy Fund (FTGC)
Annual Letter from the Chairman and CEO
December 31, 2023
Dear Shareholders:
First Trust is pleased to provide you with the annual report for the First Trust Global Tactical Commodity Strategy Fund (the “Fund”), which contains detailed information about the Fund for the twelve months ended December 31, 2023.
As 2023 comes to a close, it strikes me that many of the critical themes investors have been navigating over the past year remain unresolved. High inflation, the direction of central bank policy, and the risk of an economic recession in the U.S. are just a few examples, but another is war. The war between Russia and Ukraine rages on and will enter its third full year in just a few short months. In addition, geopolitical tensions across the Middle East are rising. Israel is at war with Hamas, and the Houthi rebels have been attacking global shipping lanes in the Red Sea, threatening the global supply chain, and prompting a military response from the U.S. and Britain.
Despite these headwinds, the broader U.S. equity and fixed income markets surged during the year. In the U.S., the S&P 500® Index rose by 26.29% on a total return basis between December 31, 2022, and December 31, 2023, according to data from Bloomberg. The Bloomberg U.S. Aggregate Bond Index also enjoyed a positive total return, rising by 5.53% over the same period. These returns can be explained, in part, by expectations that the Federal Reserve (the “Fed”) could cut interest rates in 2024. In its December 2023 statement, the Fed indicated that it expects to reduce the Federal Funds target rate by as much as 75 basis points (“bps”) over three cuts throughout 2024. It appears investors expect even steeper cuts than the Fed announced. As of December 31, 2023, the Fed Funds Futures market was pricing in nearly six rate cuts totaling more than 150 bps by the end of 2024.
In some regards, the past year serves as a stark warning against taking an overly myopic view when it comes to investing. Data from the Investment Company Institute revealed that total net assets in money market accounts stood at a record $5.9 trillion on December 6, 2023, up from $4.8 trillion at the start of the year. While the figure may be sizable, it is not surprising, in my view, especially considering the impediments to growth mentioned above. While money market assets likely earned higher interest payments than they would have before the Fed began interest rate hikes, they certainly underperformed the S&P 500® Index’s staggering total return for the year.
Thank you for giving First Trust the opportunity to play a role in your financial future. We value our relationship with you and will report on the Fund again in six months.
Sincerely,
James A. Bowen
Chairman of the Board of Trustees
Chief Executive Officer of First Trust Advisors L.P.
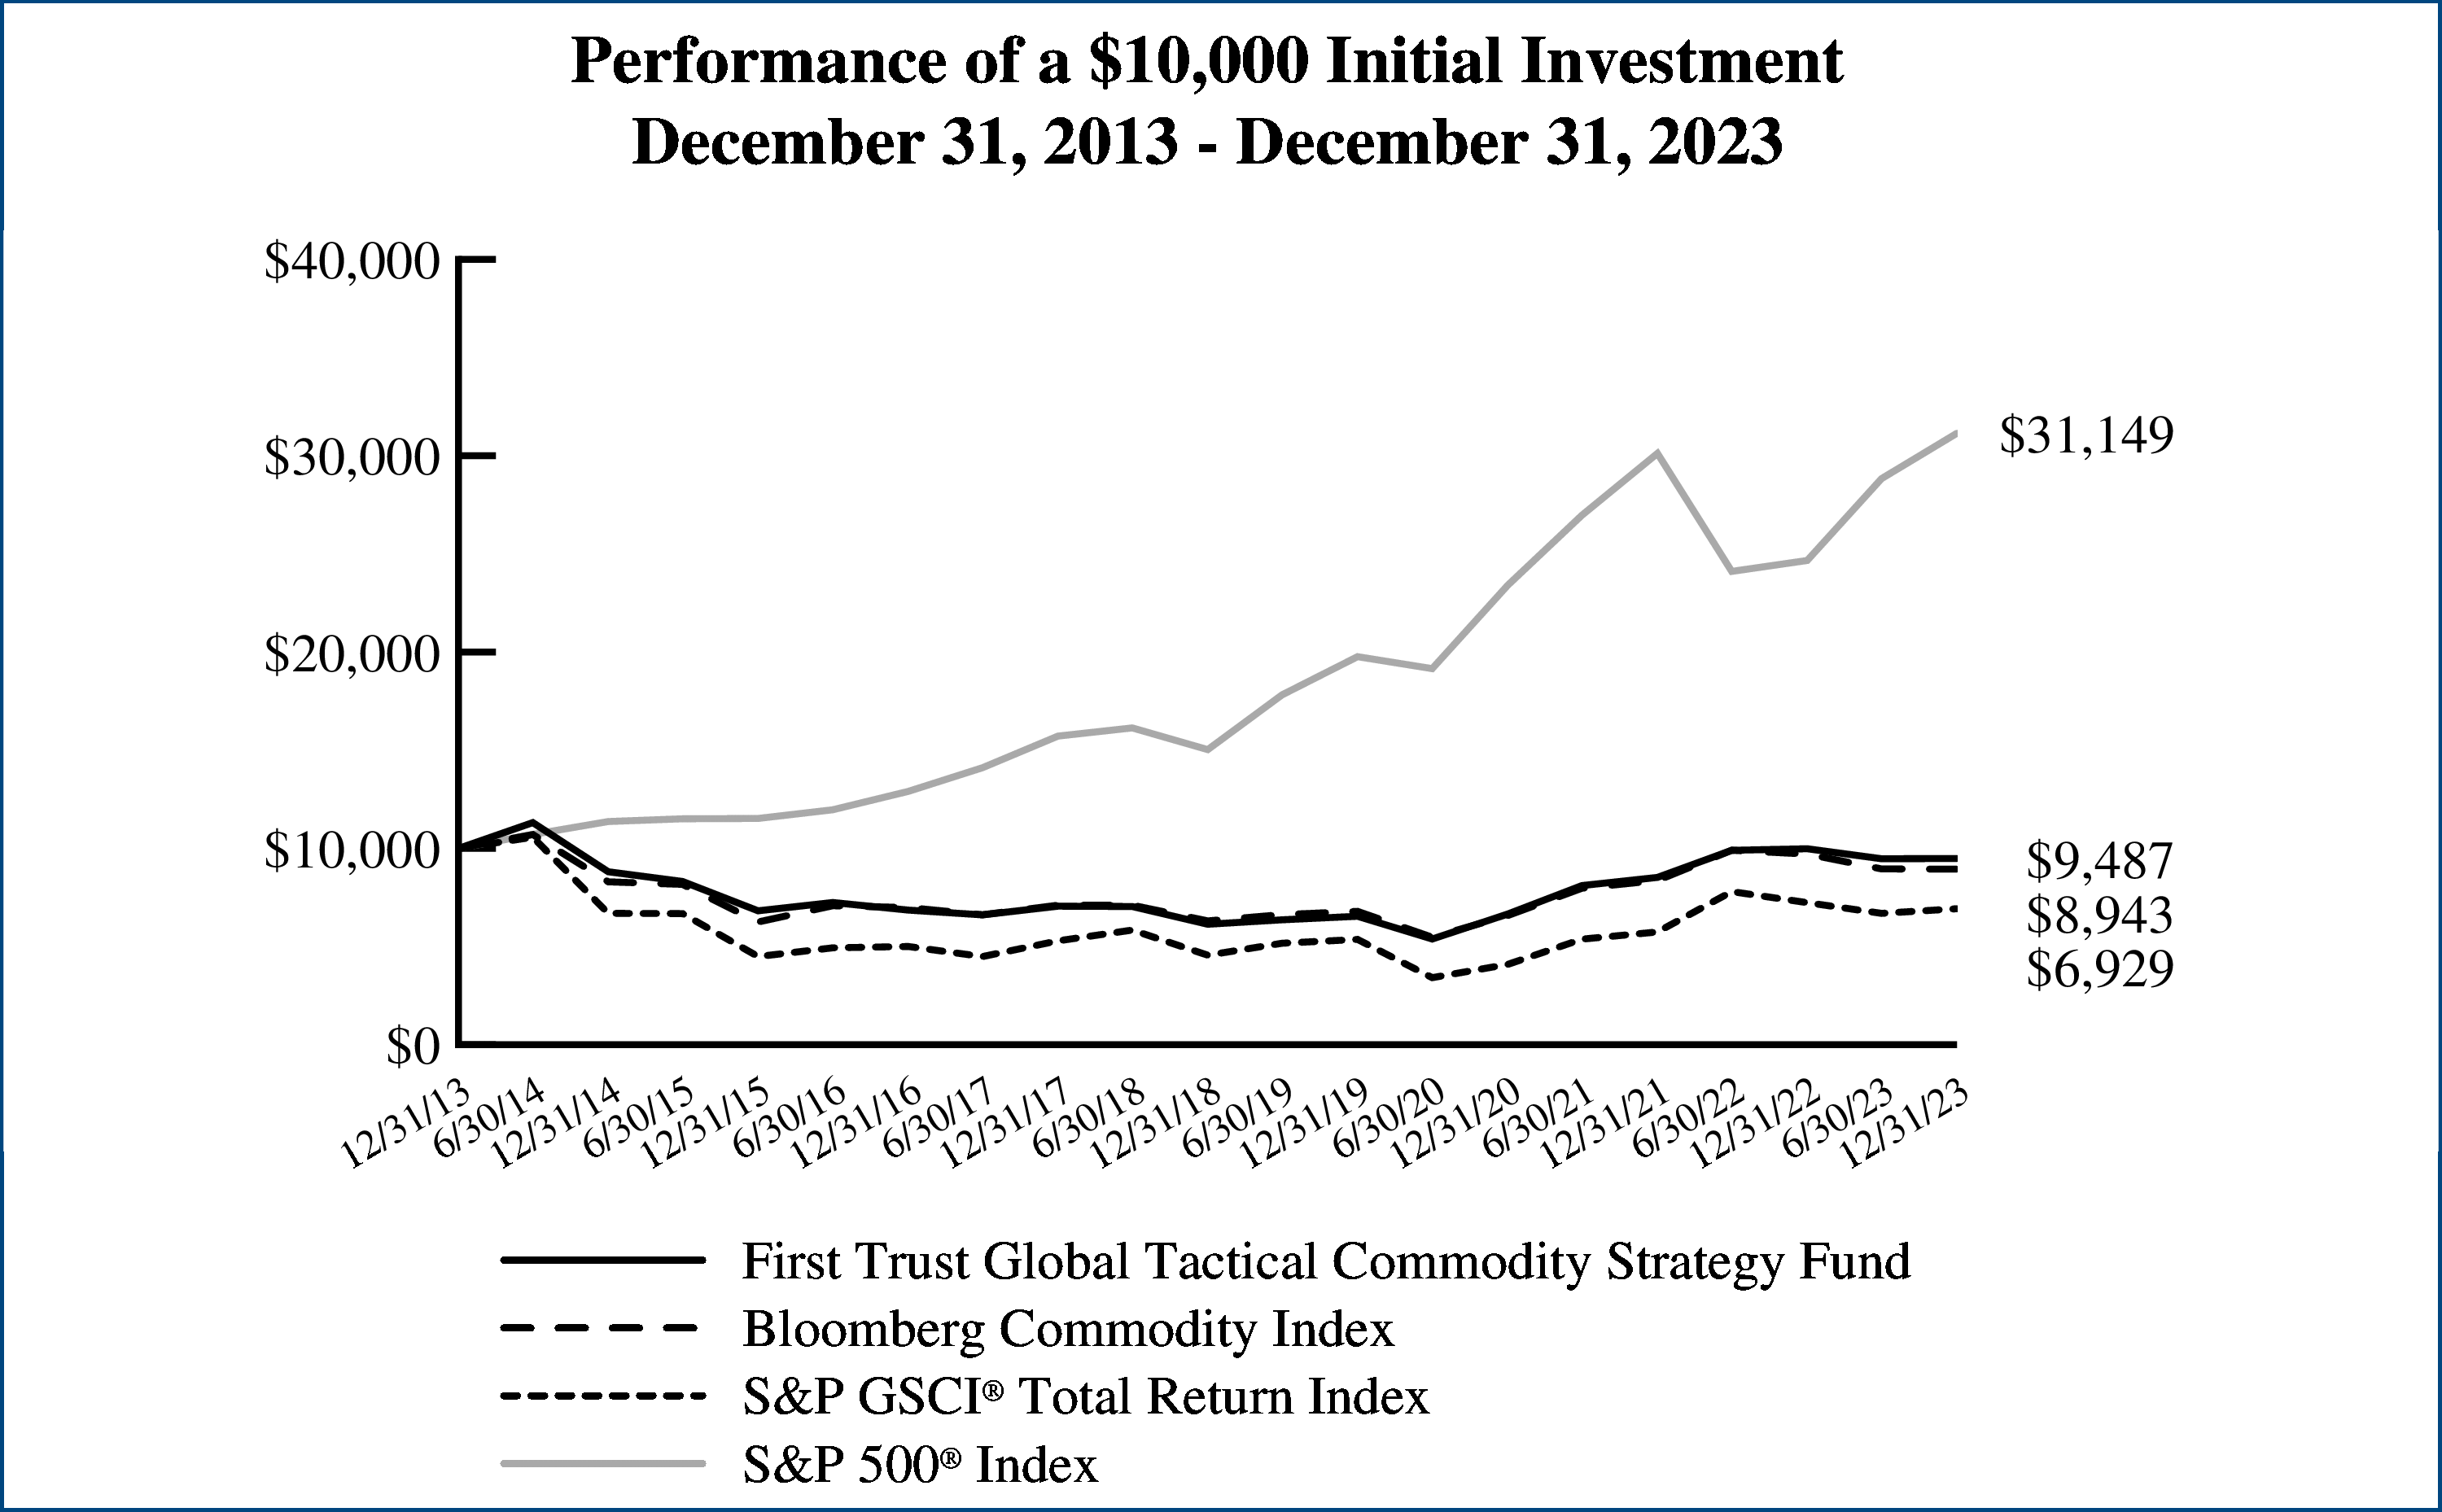
Fund Performance Overview (Unaudited)
First Trust Global Tactical Commodity Strategy Fund (FTGC)
The First Trust Global Tactical Commodity Strategy Fund (the “Fund”) seeks to provide total return by providing investors with commodity exposure while seeking a relatively stable risk profile. The Fund is an actively managed exchange-traded fund (“ETF”) that seeks to achieve attractive risk adjusted returns by investing in commodity futures contracts, exchange-traded commodity linked instruments, and commodity linked total return swaps (collectively, “Commodities Instruments”) through a wholly-owned subsidiary of the Fund organized under the laws of the Cayman Islands (the “Subsidiary”). The Fund will not invest directly in Commodities Instruments. The Fund expects to gain exposure to these investments exclusively by investing in the Subsidiary. The Subsidiary is advised by First Trust Advisors L.P., the Fund’s investment advisor (the “Advisor”).
The Fund’s investment in the Subsidiary is intended to provide the Fund with exposure to commodity markets within the limits of current federal income tax laws applicable to investment companies such as the Fund, which limit the ability of investment companies to invest directly in Commodities Instruments. The Subsidiary has the same investment objective as the Fund, but unlike the Fund, it may invest without limitation in Commodities Instruments. Except as otherwise noted, references to the Fund’s investments include the Fund’s indirect investments through the Subsidiary. The Fund will invest up to 25% of its total assets in the Subsidiary.
The Subsidiary seeks to make investments generally in Commodities Instruments while managing volatility. Investment weightings of the underlying Commodities Instruments held by the Subsidiary are rebalanced in an attempt to stabilize risk levels. The dynamic weighting process is designed to result in a disciplined, systematic investment process, which is keyed off of the Advisor’s volatility forecasting process. The Subsidiary may have both long and short positions in Commodities Instruments. However, for a given Commodity Instrument the Subsidiary will provide a net long exposure.
The remainder of the Fund’s assets will primarily be invested in: (1) U.S. government and agency securities with maturities of two years or less; (2) short-term repurchase agreements; (3) money market instruments; (4) ETFs and other investment companies registered under the Investment Company Act of 1940, as amended (the “1940 Act”) or established and registered in Canada or any province thereof; (5) Canadian ETFs; and (6) cash. The Fund uses such instruments as investments and to collateralize the Subsidiary’s Commodities Instruments exposure on a day-to-day basis.
|
| | Average Annual Total Returns | |
| | | | Inception
(10/21/13)
to 12/31/23 | | | Inception
(10/21/13)
to 12/31/23 |
| | | | | | | |
| | | | | | | |
| | | | | | | |
| | | | | | | |
Bloomberg Commodity Index | | | | | | | |
S&P GSCI® Total Return Index | | | | | | | |
| | | | | | | |
Total returns for the period since inception are calculated from the inception date of the Fund. “Average Annual Total Returns” represent the average annual change in value of an investment over the periods indicated. “Cumulative Total Returns” represent the total change in value of an investment over the periods indicated.
The Fund’s per share net asset value (“NAV”) is the value of one share of the Fund and is computed by dividing the value of all assets of the Fund (including accrued interest and dividends), less all liabilities (including accrued expenses and dividends declared but unpaid), by the total number of outstanding shares. The price used to calculate market return (“Market Price”) is determined by using the midpoint of the national best bid and offer price (“NBBO”) as of the time that the Fund’s NAV is calculated. Under the Securities and Exchange Commission’s rules, the NBBO consists of the highest displayed buy and lowest sell prices among the various exchanges trading the Fund at the time the Fund’s NAV is calculated. Prior to January 1, 2019, the price used was the midpoint between the highest bid and the lowest offer on the stock exchange on which shares of the Fund were listed for trading as of the time that the Fund’s NAV was calculated. Since shares of the Fund did not trade in the secondary market until after the Fund’s inception, for the period from inception to the first day of secondary market trading in shares of the Fund, the NAV of the Fund is used as a proxy for the secondary market trading price to calculate market returns. NAV and market returns assume that all distributions have been reinvested in the Fund at NAV and Market Price, respectively.
Fund Performance Overview (Unaudited) (Continued)
First Trust Global Tactical Commodity Strategy Fund (FTGC) (Continued)
An index is a statistical composite that tracks a specified financial market or sector. Unlike the Fund, the indices do not actually hold a portfolio of securities and therefore do not incur the expenses incurred by the Fund. These expenses negatively impact the performance of the Fund. Also, market returns do not include brokerage commissions that may be payable on secondary market transactions. If brokerage commissions were included, market returns would be lower. The total returns presented reflect the reinvestment of dividends on securities in the indices. The returns presented do not reflect the deduction of taxes that a shareholder would pay on Fund distributions or the redemption or sale of Fund shares. The investment return and principal value of shares of the Fund will vary with changes in market conditions. Shares of the Fund may be worth more or less than their original cost when they are redeemed or sold in the market. The Fund’s past performance is no guarantee of future performance.
| |
U.S. Government Bonds and Notes | |
| |
| |
Net Other Assets and Liabilities* | |
| |
| Includes variation margin on futures contracts. |
| Performance figures assume reinvestment of all distributions and do not reflect the deduction of taxes that a shareholder would pay on Fund distributions or the redemption or sale of Fund shares. An index is a statistical composite that tracks a specified financial market or sector. Unlike the Fund, the indices do not actually hold a portfolio of securities and therefore do not incur the expenses incurred by the Fund. These expenses negatively impact the performance of the Fund. The Fund’s past performance does not predict future performance. |
Frequency Distribution of Discounts and Premiums
Information showing the number of days the market price of the Fund’s shares was greater (at a premium) and less (at a discount) than the Fund’s net asset value for the most recently completed year, and the most recently completed calendar quarters since that year (or life of the Fund, if shorter) is available at https://www.ftportfolios.com/Retail/etf/home.aspx.
First Trust Global Tactical Commodity Strategy Fund (FTGC)Annual ReportDecember 31, 2023 (Unaudited) Advisor
First Trust Advisors L.P. (“First Trust” or the “Advisor”) serves as the investment advisor, commodity pool operator and commodity trading advisor to the First Trust Global Tactical Commodity Strategy Fund (the “Fund”). First Trust is responsible for the selection and ongoing monitoring of the Fund’s investment portfolio, managing the Fund’s business affairs and providing certain administrative services necessary for the management of the Fund.
Portfolio Management Team
The following persons serve as portfolio managers of the Fund:
John Gambla – CFA, FRM, PRM, Senior Portfolio Manager, Alternatives Investment Team of First Trust
Rob A. Guttschow – CFA, Senior Portfolio Manager, Alternatives Investment Team of First Trust
The portfolio managers are primarily and jointly responsible for the day-to-day management of the Fund. Each portfolio manager has served as a part of the portfolio management of the Fund since 2013.
Commentary
The Fund is an actively managed exchange-traded fund (“ETF”). The Fund’s investment objective is to seek to provide total return by providing investors with commodity exposure while seeking a relatively stable risk profile. For performance measurement, the Fund is benchmarked against the unmanaged Bloomberg Commodity Index (the “Benchmark”). This commentary discusses the 12-month market and Fund performance ended December 31, 2023.
Overall Market Recap
U.S. economic growth was strong during the 12-month period ended December 31, 2023. Average quarterly real gross domestic product growth for the first three quarters of the period was 3.1% annualized, and current expectations for the fourth quarter, according to the Atlanta Fed GDPNow model, are at 2.2% annualized growth. The U.S. Labor market, as measured by the U.S. Bureau of Labor Statistics’ Non-Farm payroll release, showed strong employment growth during the 12-month period ended December 31, 2023, with 2.70 million jobs added to the U.S. economy during the period. The robust growth in jobs has drawn more workers back into the economy as the U.S. Labor Force Participation Rate increased by 0.2%, rising to 62.5% as of the end of the period. After declining on a real basis (inflation adjusted) the prior two years, real wages finished the period up 0.6% on a year-over-year basis. Nominal wage growth slowed in 2023, declining from 4.8% in 2022 to 4.1% in 2023, but a substantial moderation in the inflation rate from 6.5% in 2022 to 3.4% in 2023 boosted real wages.
The Federal Reserve (the “Fed”) continued its interest rate hiking program during the calendar year, raising its short-term benchmark interest rate four times, with the final hike being 0.25% in late July 2023. So far, the Fed has successfully reduced inflation without throwing the U.S. economy into a recession. As the third and fourth quarters of 2023 progressed and inflation continued to moderate, U.S. equity and bond markets rallied as the market began to anticipate an end to the Fed’s restrictive interest rate policy. As of year-end, the market, as expressed in fixed income futures contracts, is expecting the Fed to reduce rates by approximately 1.50% in 2024, which would lower the Federal Funds target rate to 3.75%.
The U.S. equity market, as represented by the S&P 500® Index (the “Index”), rallied during the fiscal period, up 26.29%. Returns in the Index were particularly good for technology-related stocks, as the release of ChatGPT sparked a strong rally in technology stocks related to, or doing business in, the Artificial Intelligence industry. Bonds, as represented by the Bloomberg U.S. Aggregate Bond Index, were up during the fiscal period by 5.54% and riskier high yield bonds (Bloomberg U.S. Corporate High Yield Bond Index) were up 13.45%. Commodity markets declined with the Benchmark Index down 7.91%.
Fund Performance
The Fund’s performance for the 12-month period ended December 31, 2023 was -5.01% on a net asset value basis and -5.21% on a market price basis. The Fund’s Benchmark returned -7.91% during the same period.
The global commodity market is made up of several separate markets including agriculture, livestock, oil, industrial metals, and precious metals. These commodities are the building blocks of every economy in the world. Holding a physical commodity is not practical for most investors, but the futures market provides an alternative way to seek exposure to commodities. Individual commodity futures contracts, and the unmanaged benchmarks that measure their performance, offer attractive opportunities for
Portfolio Commentary (Continued)
First Trust Global Tactical Commodity Strategy Fund (FTGC)Annual ReportDecember 31, 2023 (Unaudited) investors to potentially diversify their portfolios and protect themselves against unforeseen rises in inflation. However, commodities and their benchmarks can be volatile. The Fund employs an investment style that seeks to control the Fund’s risk profile to a relatively stable band, thus providing investors broadly diversified commodity exposure with more risk stability than traditional unmanaged commodity benchmarks.
During the performance period, the Fund held allocations in 27 different commodities at various points in time. The Fund’s average sector allocation was 29.99% Energy, 14.56% Industrial Metals, 12.37% Precious Metals, 40.27% Agricultural, and 2.81% Livestock. As of December 31, 2023, the Fund held 27.84% in Energy-related futures contracts, 14.16% in Industrial Metal futures, 13.54% in Precious Metal futures, 41.76% in Agricultural futures, and 2.70% in Livestock futures.
During this performance period, the Fund profited from positions in the Precious Metals and Software sectors while the Agricultural, Industrial Metals and Energy sectors where negative contributors to the Fund’s total return. The strongest performing commodity for the Fund, and the largest contributor to the Fund’s total return, was cocoa which rallied 61.10% during the year according to the Bloomberg Cocoa Total Return Index. Coffee and sugar were also up during the year and contributed to the Fund’s total return. The largest negative contributor to the Fund’s total return during the period was the Agricultural sector where soybean oil, soybeans, corn, and wheat all declined in price. Relative to the Benchmark, the Fund’s allocation was, on average, overweight in bean oil, corn, and soybeans which detracted from the Fund’s relative performance versus the Benchmark. Despite its negative total return contribution for the period, the Energy sector was the Fund’s best relative performing sector. The Fund was underweight in natural gas throughout the period while natural gas, as measured by the Bloomberg Natural Gas Index, declined by 67.07%. On a relative basis, the Fund also added value via its allocation to gas-oil and gasoline, which were down 3.34% and up 2.20%, respectively, on the year. Heating oil declined by 7.79% during the same period and the Fund was overweight, on average, resulting in a small relative and absolute loss.
Precious metals were a positive contributor to the Fund’s total return for the same period with gold dominating the sector with its positive 7.14% return for the period. Silver and platinum were both negative for the period. Cattle returns were mixed with feeder cattle and live cattle being up low single digits for the period while lean hogs were down 25.87%. The Fund’s return impact from the cattle sector was in-line with the Benchmark resulting in minimal performance impacts.
Please see the Consolidated Portfolio of Investments for a complete list of all positions within the portfolio as of December 31, 2023.
Market and Fund Outlook
Today, we believe the Fund is well positioned to achieve its investment objective of seeking total return and a relatively stable risk profile while providing investors with commodity exposure. We believe that the Fund is currently broadly diversified across commodity futures and commodity sectors and that the risk control portfolio construction process is working well. Additionally, we believe that commodities are, and will continue to be, a valuable component of any well diversified portfolio. Because commodities are not highly correlated with traditional asset classes, they can potentially decrease portfolio volatility, enhance overall return, and provide meaningful diversification to an asset allocation strategy.
First Trust Global Tactical Commodity Strategy Fund (FTGC)Understanding Your Fund ExpensesDecember 31, 2023 (Unaudited) As a shareholder of First Trust Global Tactical Commodity Strategy Fund (the “Fund”), you incur two types of costs: (1) transaction costs; and (2) ongoing costs, including management fees, distribution and/or service (12b-1) fees, if any, and other Fund expenses. This Example is intended to help you understand your ongoing costs of investing in the Fund and to compare these costs with the ongoing costs of investing in other funds.
The Example is based on an investment of $1,000 invested at the beginning of the period and held through the six-month period ended December 31, 2023.
Actual Expenses
The first line in the following table provides information about actual account values and actual expenses. You may use the information in this line, together with the amount you invested, to estimate the expenses that you paid over the period. Simply divide your account value by $1,000 (for example, an $8,600 account value divided by $1,000 = 8.6), then multiply the result by the number in the first line under the heading entitled “Expenses Paid During the Six-Month Period” to estimate the expenses you paid on your account during this six-month period.
Hypothetical Example for Comparison Purposes
The second line in the following table provides information about hypothetical account values and hypothetical expenses based on the Fund’s actual expense ratio and an assumed rate of return of 5% per year before expenses, which is not the Fund’s actual return. The hypothetical account values and expenses may not be used to estimate the actual ending account balance or expenses you paid for the period. You may use this information to compare the ongoing costs of investing in the Fund and other funds. To do so, compare this 5% hypothetical example with the 5% hypothetical examples that appear in the shareholder reports of the other funds.
Please note that the expenses shown in the table are meant to highlight your ongoing costs only and do not reflect any transactional costs such as brokerage commissions. Therefore, the second line in the table is useful in comparing ongoing costs only, and will not help you determine the relative total costs of owning different funds. In addition, if these transactional costs were included, your costs would have been higher.
| Beginning
Account Value
July 1, 2023 | Ending
Account Value
December 31, 2023 | Annualized
Expense Ratio
Based on the
Six-Month
Period | Expenses Paid
During the
Six-Month
Period (a) |
First Trust Global Tactical Commodity Strategy Fund (FTGC) |
| | | | |
Hypothetical (5% return before expenses) | | | | |
| Expenses are equal to the annualized expense ratio as indicated in the table multiplied by the average account value over the period (July 1, 2023 through December 31, 2023), multiplied by 184/365 (to reflect the six-month period). |
First Trust Global Tactical Commodity Strategy Fund (FTGC)Consolidated Portfolio of InvestmentsDecember 31, 2023
| | | | |
U.S. GOVERNMENT BONDS AND NOTES — 45.4% |
| | | | |
| | | | |
| | | | |
| | | | |
| | | | |
| | | | |
| | | | |
| Total U.S. Government Bonds and Notes | |
| | |
U.S. TREASURY BILLS — 6.2% |
| | | | |
| | | | |
| | |
MONEY MARKET FUNDS — 39.9% |
| Dreyfus Government Cash Management Fund, Institutional Shares - 5.25% (b) | |
| Morgan Stanley Institutional Liquidity Funds - Treasury Portfolio - Institutional Class - 5.22% (b) | |
| | |
| | |
|
|
| Total Investments — 91.5% | |
| | |
| Net Other Assets and Liabilities — 8.5% | |
| | |
Futures Contracts at December 31, 2023 (See Note 2C - Futures Contracts in the Notes to Consolidated Financial Statements):
| | | | | Unrealized
Appreciation
(Depreciation)/
Value |
| | | | | |
| | | | | |
| | | | | |
| | | | | |
| | | | | |
| | | | | |
| | | | | |
| | | | | |
| | | | | |
Kansas City Hard Red Winter Wheat Futures | | | | | |
| | | | | |
| | | | | |
| | | | | |
| | | | | |
| | | | | |
| | | | | |
Low Sulphur Gasoil “G” Futures | | | | | |
Low Sulphur Gasoil “G” Futures | | | | | |
See Notes to Consolidated Financial Statements
First Trust Global Tactical Commodity Strategy Fund (FTGC)Consolidated Portfolio of Investments (Continued)December 31, 2023 Futures Contracts at December 31, 2023 (Continued):
| | | | | Unrealized Appreciation (Depreciation)/ Value |
| | | | | |
| | | | | |
| | | | | |
| | | | | |
| | | | | |
| | | | | |
| | | | | |
| | | | | |
| | | | | |
| | | | | |
Sugar #11 (World) Futures | | | | | |
| | | | | |
| | | | | |
| | | | | |
| | | | | |
| |
| Rate shown reflects yield as of December 31, 2023. |
Valuation InputsA summary of the inputs used to value the Fund’s investments as of December 31, 2023 is as follows (see Note 2A - Portfolio Valuation in the Notes to Consolidated Financial Statements):
|
| | | Level 2
Significant
Observable
Inputs | Level 3
Significant
Unobservable
Inputs |
U.S. Government Bonds and Notes | | | | |
| | | | |
| | | | |
| | | | |
| | | | |
| | | | |
|
| | | Level 2
Significant
Observable
Inputs | Level 3
Significant
Unobservable
Inputs |
| | | | |
| Includes cumulative appreciation/depreciation on futures contracts as reported in the Futures Contracts table. Only the current day’s variation margin is presented on the Consolidated Statement of Assets and Liabilities. |
See Notes to Consolidated Financial Statements
First Trust Global Tactical Commodity Strategy Fund (FTGC)Consolidated Statement of Assets and Liabilities
December 31, 2023
| |
| |
Cash segregated as collateral for open futures contracts | |
| |
| |
| |
| |
| |
|
| |
| |
| |
| |
| |
| |
| |
|
| |
| |
| |
Accumulated distributable earnings (loss) | |
| |
NET ASSET VALUE, per share | |
Number of shares outstanding (unlimited number of shares authorized, par value $0.01 per share) | |
| |
See Notes to Consolidated Financial Statements
First Trust Global Tactical Commodity Strategy Fund (FTGC)Consolidated Statement of Operations
For the Year Ended December 31, 2023
| |
| |
| |
| |
|
| |
| |
| |
NET INVESTMENT INCOME (LOSS) | |
|
NET REALIZED AND UNREALIZED GAIN (LOSS): | |
Net realized gain (loss) on: | |
| |
| |
| |
Net change in unrealized appreciation (depreciation) on: | |
| |
| |
Net change in unrealized appreciation (depreciation) | |
NET REALIZED AND UNREALIZED GAIN (LOSS) | |
NET INCREASE (DECREASE) IN NET ASSETS RESULTING FROM OPERATIONS | |
See Notes to Consolidated Financial Statements
First Trust Global Tactical Commodity Strategy Fund (FTGC)Consolidated Statements of Changes in Net Assets
| | |
| | |
Net investment income (loss) | | |
| | |
Net change in unrealized appreciation (depreciation) | | |
Net increase (decrease) in net assets resulting from operations | | |
|
DISTRIBUTIONS TO SHAREHOLDERS FROM: | | |
| | |
|
SHAREHOLDER TRANSACTIONS: | | |
Proceeds from shares sold | | |
| | |
Net increase (decrease) in net assets resulting from shareholder transactions | | |
Total increase (decrease) in net assets | | |
|
| | |
| | |
| | |
|
CHANGES IN SHARES OUTSTANDING: | | |
Shares outstanding, beginning of period | | |
| | |
| | |
Shares outstanding, end of period | | |
See Notes to Consolidated Financial Statements
First Trust Global Tactical Commodity Strategy Fund (FTGC)Consolidated Financial Highlights
For a share outstanding throughout each period
| |
| | | | | |
Net asset value, beginning of period | | | | | |
Income from investment operations: | | | | | |
Net investment income (loss) | | | | | |
Net realized and unrealized gain (loss) | | | | | |
Total from investment operations | | | | | |
Distributions paid to shareholders from: | | | | | |
| | | | | |
Net asset value, end of period | | | | | |
| | | | | |
|
Ratios to average net assets/supplemental data: | | | | | |
Net assets, end of period (in 000’s) | | | | | |
Ratio of total expenses to average net assets | | | | | |
Ratio of net investment income (loss) to average net assets | | | | | |
Portfolio turnover rate (c) | | | | | |
| Based on average shares outstanding. |
| Total return is calculated assuming an initial investment made at the net asset value at the beginning of the period, reinvestment of all distributions at net asset value during the period, and redemption at net asset value on the last day of the period. The returns presented do not reflect the deduction of taxes that a shareholder would pay on Fund distributions or the redemption or sale of Fund shares. Total return is calculated for the time period presented and is not annualized for periods of less than a year. |
| Portfolio turnover is calculated for the time period presented and is not annualized for periods of less than a year and does not include securities received or delivered from processing creations or redemptions, derivatives and in-kind transactions. |
See Notes to Consolidated Financial Statements
Notes to Consolidated Financial Statements
First Trust Global Tactical Commodity Strategy Fund (FTGC)December 31, 2023 1. Organization
First Trust Exchange-Traded Fund VII (the “Trust”) is an open-end management investment company organized as a Massachusetts business trust on November 6, 2012, and is registered with the Securities and Exchange Commission (“SEC”) under the Investment Company Act of 1940, as amended (the “1940 Act”).
The Trust currently consists of two funds that are offering shares. This report covers the First Trust Global Tactical Commodity Strategy Fund (the “Fund”), a diversified series of the Trust, which trades under the ticker “FTGC” on Nasdaq, Inc. and commenced operations on October 22, 2013. Unlike conventional mutual funds, the Fund issues and redeems shares on a continuous basis, at net asset value (“NAV”), only in large blocks of shares known as “Creation Units.”
The Fund is an actively managed exchange-traded fund. The investment objective of the Fund seeks to provide total return by providing investors with commodity exposure while seeking a relatively stable risk profile. The Fund seeks to achieve attractive risk adjusted returns by investing in commodity futures contracts, exchange-traded commodity linked instruments, and commodity linked total return swaps (collectively, “Commodities Instruments”) through a wholly-owned subsidiary of the Fund, FT Cayman Subsidiary II, organized under the laws of the Cayman Islands (the “Subsidiary”). The Fund will not invest directly in Commodities Instruments. The Fund expects to gain exposure to these investments exclusively by investing in the Subsidiary. The Fund will invest up to 25% of its total assets in the Subsidiary. As of December 31, 2023, the Fund invested 19.8% of the Fund’s total assets in the Subsidiary. There can be no assurance that the Fund will achieve its investment objective. The Fund may not be appropriate for all investors.
2. Significant Accounting Policies
The Fund is considered an investment company and follows accounting and reporting guidance under Financial Accounting Standards Board Accounting Standards Codification Topic 946, “Financial Services-Investment Companies.” The consolidated financial statements include the accounts on a consolidated basis of the Subsidiary. All intercompany accounts and transactions have been eliminated in consolidation. The following is a summary of significant accounting policies consistently followed by the Fund in the preparation of the consolidated financial statements. The preparation of the consolidated financial statements in accordance with accounting principles generally accepted in the United States of America (“U.S. GAAP”) requires management to make estimates and assumptions that affect the reported amounts and disclosures in the consolidated financial statements. Actual results could differ from those estimates.
A. Portfolio Valuation
The Fund’s NAV is determined daily as of the close of regular trading on the New York Stock Exchange (“NYSE”), normally 4:00 p.m. Eastern time, on each day the NYSE is open for trading. If the NYSE closes early on a valuation day, the NAV is determined as of that time. The Fund’s NAV is calculated by dividing the value of all assets of the Fund (including accrued interest and dividends), less all liabilities (including accrued expenses and dividends declared but unpaid), by the total number of shares outstanding.
The Fund’s investments are valued daily at market value or, in the absence of market value with respect to any portfolio securities, at fair value. Market value prices represent readily available market quotations such as last sale or official closing prices from a national or foreign exchange (i.e., a regulated market) and are primarily obtained from third-party pricing services. Fair value prices represent any prices not considered market value prices and are either obtained from a third-party pricing service or are determined by the Pricing Committee of the Fund’s investment advisor, First Trust Advisors L.P. (“First Trust” or the “Advisor”), in accordance with valuation procedures approved by the Trust’s Board of Trustees, and in accordance with provisions of the 1940 Act and rules thereunder. Investments valued by the Advisor’s Pricing Committee, if any, are footnoted as such in the footnotes to the Consolidated Portfolio of Investments. The Fund’s investments are valued as follows:
Exchange-traded futures contracts are valued at the end of the day settlement price.
U.S. Treasuries are valued on the basis of valuations provided by a third-party pricing service approved by the Trust’s Board of Trustees.
Shares of open-end funds are valued based on NAV per share.
If the Fund’s investments are not able to be priced by pre-established pricing methods, such investments may be valued by the Trust’s Board of Trustees or its delegate, the Advisor’s Pricing Committee, at fair value. A variety of factors may be considered in determining the fair value of such investments.
Notes to Consolidated Financial Statements (Continued)
First Trust Global Tactical Commodity Strategy Fund (FTGC)December 31, 2023 Valuing the Fund’s holdings using fair value pricing will result in using prices for those holdings that may differ from current market valuations. The Subsidiary’s holdings will be valued in the same manner as the Fund’s holdings.
The Fund is subject to fair value accounting standards that define fair value, establish the framework for measuring fair value and provide a three-level hierarchy for fair valuation based upon the inputs to the valuation as of the measurement date. The three levels of the fair value hierarchy are as follows:
• Level 1 – Level 1 inputs are quoted prices in active markets for identical investments. An active market is a market in which transactions for the investment occur with sufficient frequency and volume to provide pricing information on an ongoing basis.
• Level 2 – Level 2 inputs are observable inputs, either directly or indirectly, and include the following:
o Quoted prices for similar investments in active markets.
o Quoted prices for identical or similar investments in markets that are non-active. A non-active market is a market where there are few transactions for the investment, the prices are not current, or price quotations vary substantially either over time or among market makers, or in which little information is released publicly.
o Inputs other than quoted prices that are observable for the investment (for example, interest rates and yield curves observable at commonly quoted intervals, volatilities, prepayment speeds, loss severities, credit risks, and default rates).
o Inputs that are derived principally from or corroborated by observable market data by correlation or other means.
• Level 3 – Level 3 inputs are unobservable inputs. Unobservable inputs may reflect the reporting entity’s own assumptions about the assumptions that market participants would use in pricing the investment.
The inputs or methodologies used for valuing investments are not necessarily an indication of the risk associated with investing in those investments. A summary of the inputs used to value the Fund’s investments as of December 31, 2023, is included with the Fund’s Consolidated Portfolio of Investments.
B. Investment Transactions and Investment Income
Investment transactions are recorded as of the trade date. Realized gains and losses from investment transactions are recorded on the identified cost basis. Dividend income is recorded on the ex-dividend date. Interest income, if any, is recorded daily on the accrual basis. Amortization of premiums and accretion of discounts are recorded using the effective interest method.
C. Futures Contracts
The Fund, through the Subsidiary, may purchase and sell exchange-listed commodity contracts. When the Subsidiary purchases a listed futures contract, it agrees to purchase a specified reference asset (e.g., commodity) at a specified future date. When the Subsidiary sells or shorts a listed futures contract, it agrees to sell a specified reference asset (e.g., commodity) at a specified future date. The price at which the purchase and sale will take place is fixed when the Subsidiary enters into the contract. The exchange clearing corporation is the ultimate counterparty for all exchange-listed contracts, so credit risk is limited to the creditworthiness of the exchange’s clearing corporation. Margin deposits are posted as collateral with the clearing broker and, in turn, with the exchange clearing corporation. Open futures contracts can be closed out prior to settlement by entering into an offsetting transaction in a matching futures contract. If the Subsidiary is not able to enter into an offsetting transaction, the Subsidiary will continue to be required to maintain margin deposits on the futures contract. When the contract is closed or expires, the Subsidiary records a realized gain or loss equal to the difference between the value of the contract at the time it was opened and the value at the time it was closed or expired. This gain or loss is included in “Net realized gain (loss) on futures contracts” on the Consolidated Statement of Operations.
Exchange-listed commodity futures contracts are generally based upon commodities within the six principal commodity groups: energy, industrial metals, agriculture, precious metals, foods and fibers, and livestock. The price of a commodity futures contract will reflect the storage costs of purchasing the physical commodity. These storage costs include the time value of money invested in the physical commodity plus the actual costs of storing the commodity less any benefits from ownership of the physical commodity that are not obtained by the holder of a futures contract (this is sometimes referred to as the “convenience yield”). To the extent that these storage costs change for an underlying commodity while the Subsidiary is in a long position on that commodity, the value of the futures contract may change proportionately.
Upon entering into a futures contract, the Subsidiary must deposit funds, called margin, with its custodian in the name of the clearing broker equal to a specified percentage of the current value of the contract. Open futures contracts are marked-to-market daily with the change in value recognized as a component of “Net change in unrealized appreciation (depreciation) on futures contracts” on the
Notes to Consolidated Financial Statements (Continued)
First Trust Global Tactical Commodity Strategy Fund (FTGC)December 31, 2023 Consolidated Statement of Operations. This daily fluctuation in value of the contracts is also known as variation margin and is included as “Variation margin” payable or receivable on the Consolidated Statement of Assets and Liabilities.
When the Subsidiary purchases or sells a futures contract, the Subsidiary is required to collateralize its position in order to limit the risk associated with the use of leverage and other related risks. To collateralize its position, the Subsidiary segregates assets consisting of cash or liquid securities that, when added to any amounts deposited with a futures commission merchant as margin, are equal to the unrealized depreciation of the futures contract or otherwise collateralize its position in a manner consistent with the 1940 Act or the 1940 Act Rules and SEC interpretations thereunder. As the Subsidiary continues to engage in the described securities trading practices and properly segregates assets, the segregated assets will function as a practical limit on the amount of leverage which the Subsidiary may undertake and on the potential increase in the speculative character of the Subsidiary’s outstanding portfolio investments. Additionally, such segregated assets generally ensure the availability of adequate funds to meet the obligations of the Subsidiary arising from such investment activities.
D. Cash
The Fund holds assets equal to or greater than the full notional exposure of the futures contracts. These assets may consist of cash and other short-term securities to comply with SEC guidance with respect to coverage of futures contracts by registered investment companies. At December 31, 2023, the Fund had restricted cash held of $245,060,108, which is included in “Cash segregated as collateral for open futures contracts” on the Consolidated Statement of Assets and Liabilities.
E. Dividends and Distributions to Shareholders
Dividends from net investment income of the Fund, if any, are declared and paid quarterly, or as the Board of Trustees may determine from time to time. Distributions of net realized capital gains earned by the Fund, if any, are distributed at least annually. The Fund may also designate a portion of the amount paid to redeeming shareholders as a distribution for tax purposes.
Distributions in cash may be reinvested automatically in additional whole shares only if the broker through whom the shares were purchased makes such option available. Such shares will generally be reinvested by the broker based upon the market price of those shares and investors may be subject to customary brokerage commissions charged by the broker.
Distributions from net investment income and realized capital gains are determined in accordance with federal income tax regulations, which may differ from U.S. GAAP. Certain capital accounts in the consolidated financial statements are periodically adjusted for permanent differences in order to reflect their tax character. These permanent differences are primarily due to the varying treatment of income and gain/loss on portfolio securities held by the Fund and have no impact on net assets or NAV per share. Temporary differences, which arise from recognizing certain items of income, expense and gain/loss in different periods for consolidated financial statement and tax purposes, will reverse at some time in the future.
The tax character of distributions paid during the fiscal years ended December 31, 2023 and 2022 was as follows:
As of December 31, 2023, the components of distributable earnings on a tax basis for the Fund were as follows:
Undistributed ordinary income | |
Accumulated capital and other gain (loss) | |
Net unrealized appreciation (depreciation) | |
F. Income Taxes
The Fund intends to continue to qualify as a regulated investment company by complying with the requirements under Subchapter M of the Internal Revenue Code of 1986, as amended (the “Code”), which includes distributing substantially all of its net investment income and net realized gains to shareholders. Accordingly, no provision has been made for federal and state income taxes. However, due to the timing and amount of distributions, the Fund may be subject to an excise tax of 4% of the amount by which approximately 98% of the Fund’s taxable income exceeds the distributions from such taxable income for the calendar year.
Notes to Consolidated Financial Statements (Continued)
First Trust Global Tactical Commodity Strategy Fund (FTGC)December 31, 2023 The Subsidiary is classified as a controlled foreign corporation under Subchapter N of the Code. Therefore, the Fund is required to increase its taxable income by its share of the Subsidiary’s income, whether or not such earnings are distributed by the Subsidiary to the Fund. Net investment losses of the Subsidiary cannot be deducted by the Fund in the current period nor carried forward to offset taxable income in future periods.
The Fund is subject to accounting standards that establish a minimum threshold for recognizing, and a system for measuring, the benefits of a tax position taken or expected to be taken in a tax return. The taxable years ended 2020, 2021, 2022, and 2023 remain open to federal and state audit. As of December 31, 2023, management has evaluated the application of these standards to the Fund and has determined that no provision for income tax is required in the Fund’s consolidated financial statements for uncertain tax positions.
The Fund intends to utilize provisions of the federal income tax laws, which allow it to carry a realized capital loss forward indefinitely following the year of the loss and offset such loss against any future realized capital gains. The Fund is subject to certain limitations under U.S. tax rules on the use of capital loss carryforwards and net unrealized built-in losses. These limitations apply when there has been a 50% change in ownership. At December 31, 2023, for federal income tax purposes, the Fund had $60,457 of non-expiring capital loss carryforwards available, to the extent provided by regulations, to offset future capital gains. To the extent that these loss carryforwards are used to offset future capital gains, it is probable that the capital gains so offset will not be distributed to the Fund’s shareholders.
In order to present paid-in capital and accumulated distributable earnings (loss) (which consists of accumulated net investment income (loss), accumulated net realized gain (loss) and net unrealized appreciation (depreciation)) on the Consolidated Statement of Assets and Liabilities that more closely represent their tax character, certain adjustments have been made to paid-in capital, accumulated net investment income (loss) and accumulated net realized gain (loss). These adjustments are primarily due to the difference between book and tax treatment of net investment income from the Subsidiary. The results of operations and net assets were not affected by these adjustments. For the fiscal year ended December 31, 2023, the adjustments for the Fund were as follows:
Accumulated
Net Investment
Income (Loss) | Accumulated
Net Realized
Gain (Loss) | |
| | |
As of December 31, 2023, the aggregate cost, gross unrealized appreciation, gross unrealized depreciation, and net unrealized appreciation/(depreciation) (including short positions and derivatives, if any) for federal income tax purposes were as follows:
| Gross Unrealized
Appreciation | Gross Unrealized
(Depreciation) | Net Unrealized
Appreciation
(Depreciation) |
| | | |
G. Expenses
Expenses, other than the investment advisory fee and other excluded expenses, are paid by the Advisor (see Note 3).
3. Investment Advisory Fee, Affiliated Transactions and Other Fee Arrangements
First Trust, the investment advisor to the Fund, is a limited partnership with one limited partner, Grace Partners of DuPage L.P., and one general partner, The Charger Corporation. The Charger Corporation is an Illinois corporation controlled by James A. Bowen, Chief Executive Officer of First Trust. First Trust is responsible for the selection and ongoing monitoring of the Fund’s and the Subsidiary’s investment portfolios, managing the Fund’s business affairs and providing certain administrative services necessary for the management of the Fund.
Pursuant to the Investment Management Agreement between the Trust and the Advisor, First Trust manages the investment of the Fund’s assets and is responsible for the Fund’s and the Subsidiary’s expenses, including the cost of transfer agency, custody, fund administration, legal, audit, and other services, but excluding fee payments under the Investment Management Agreement, interest, taxes, brokerage commissions and other expenses connected with the execution of portfolio transactions, distribution and service fees payable pursuant to a Rule 12b-1 plan, if any, and extraordinary expenses. The annual unitary management fee payable by the Fund to First Trust for these services will be reduced at certain levels of the Fund’s net assets (“breakpoints”) and calculated pursuant to the following schedule:
Notes to Consolidated Financial Statements (Continued)
First Trust Global Tactical Commodity Strategy Fund (FTGC)December 31, 2023
| |
Fund net assets up to and including $2.5 billion | |
Fund net assets greater than $2.5 billion up to and including $5 billion | |
Fund net assets greater than $5 billion up to and including $7.5 billion | |
Fund net assets greater than $7.5 billion up to and including $10 billion | |
Fund net assets greater than $10 billion | |
Prior to November 6, 2023, First Trust also provided fund reporting services to the Fund for a flat annual fee in the amount of $9,250, which was covered under the annual unitary management fee. The Subsidiary does not pay First Trust a separate management fee.
Effective November 6, 2023, the Trust has multiple service agreements with The Bank of New York Mellon (“BNYM”). Under the service agreements, BNYM performs custodial, fund accounting, certain administrative services, and transfer agency services for the Fund. As custodian, BNYM is responsible for custody of the Fund’s assets. As fund accountant and administrator, BNYM is responsible for maintaining the books and records of the Fund’s securities and cash. As transfer agent, BNYM is responsible for maintaining shareholder records for the Fund. BNYM is a subsidiary of The Bank of New York Mellon Corporation, a financial holding company.
Prior to November 6, 2023, the Trust had multiple service agreements with Brown Brothers Harriman & Co. (“BBH”). Under the service agreements, BBH performed custodial, fund accounting, certain administrative services, and transfer agency services for the Fund. As custodian, BBH was responsible for custody of the Fund’s assets. As fund accountant and administrator, BBH was responsible for maintaining the books and records of the Fund’s securities and cash. As transfer agent, BBH was responsible for maintaining shareholder records for the Fund.
Each Trustee who is not an officer or employee of First Trust, any sub-advisor or any of their affiliates (“Independent Trustees”) is paid a fixed annual retainer that is allocated equally among each fund in the First Trust Fund Complex. Each Independent Trustee is also paid an annual per fund fee that varies based on whether the fund is a closed-end or other actively managed fund, a target outcome fund or an index fund.
Additionally, the Lead Independent Trustee and the Chairs of the Audit Committee, Nominating and Governance Committee and Valuation Committee are paid annual fees to serve in such capacities, with such compensation allocated pro rata among each fund in the First Trust Fund Complex based on net assets. Independent Trustees are reimbursed for travel and out-of-pocket expenses in connection with all meetings. The Lead Independent Trustee and Committee Chairs rotate every three years. The officers and “Interested” Trustee receive no compensation from the Trust for acting in such capacities.
4. Purchases and Sales of Securities
The costs of purchases of U.S. Government securities and non-U.S. Government securities, excluding short-term investments, for the fiscal year ended December 31, 2023, were $929,228,350 and $0, respectively. The proceeds from sales and paydowns of U.S. Government securities and non-U.S. Government securities, excluding short-term investments, for the fiscal year ended December 31, 2023 were $0 and $0, respectively.
For the fiscal year ended December 31, 2023, the Fund had no in-kind transactions.
Notes to Consolidated Financial Statements (Continued)
First Trust Global Tactical Commodity Strategy Fund (FTGC)December 31, 2023 5. Derivative Transactions
The following table presents the types of derivatives held by the Subsidiary at December 31, 2023, the primary underlying risk exposure and the location of these instruments as presented on the Consolidated Statement of Assets and Liabilities.
| | | |
| | Consolidated
Statement of Assets and
Liabilities Location | | Consolidated
Statement of Assets and
Liabilities Location | |
| | Unrealized appreciation on futures contracts* | | Unrealized depreciation on futures contracts* | |
| Includes cumulative appreciation/depreciation on futures contracts as reported in the Fund’s Consolidated Portfolio of Investments. Only the current day’s variation margin is presented on the Consolidated Statement of Assets and Liabilities. |
The following table presents the amount of net realized gain (loss) and change in net unrealized appreciation (depreciation) recognized for the fiscal year ended December 31, 2023, on derivative instruments, as well as the primary underlying risk exposure associated with the instruments.
|
Consolidated Statement of Operations Location | |
| |
Net realized gain (loss) on futures contracts | |
Net change in unrealized appreciation (depreciation) on futures contracts | |
During the fiscal year ended December 31, 2023, the notional value of futures contracts opened and closed were $17,779,149,508 and $18,451,796,087, respectively.
The Fund does not have the right to offset financial assets and financial liabilities related to futures contracts on the Consolidated Statement of Assets and Liabilities.
6. Creations, Redemptions and Transaction Fees
The Fund generally issues and redeems its shares in primary market transactions through a creation and redemption mechanism and does not sell or redeem individual shares. Instead, financial entities known as “Authorized Participants” have contractual arrangements with the Fund or one of the Fund’s service providers to purchase and redeem Fund shares directly with the Fund in Creation Units. Prior to the start of trading on every business day, the Fund publishes through the National Securities Clearing Corporation the “basket” of securities, cash or other assets that it will accept in exchange for a Creation Unit of the Fund’s shares. An Authorized Participant that wishes to effectuate a creation of the Fund’s shares deposits with the Fund the “basket” of securities, cash or other assets identified by the Fund that day, and then receives the Creation Unit of the Fund’s shares in return for those assets. After purchasing a Creation Unit, the Authorized Participant may continue to hold the Fund’s shares or sell them in the secondary market. The redemption process is the reverse of the purchase process: the Authorized Participant redeems a Creation Unit of the Fund’s shares for a basket of securities, cash or other assets. The combination of the creation and redemption process with secondary market trading in the Fund’s shares and underlying securities provides arbitrage opportunities that are designed to help keep the market price of the Fund’s shares at or close to the NAV per share of the Fund.
The Fund imposes fees in connection with the purchase of Creation Units. These fees may vary based upon various fact-based circumstances, including, but not limited to, the composition of the securities included in the Creation Unit or the countries in which the transactions are settled. The price for each Creation Unit will equal the daily NAV per share of the Fund times the number of shares in a Creation Unit, plus the fees described above and, if applicable, any operational processing and brokerage costs, transfer fees, stamp taxes and part or all of the spread between the expected bid and offer side of the market related to the securities comprising the creation basket.
The Fund also imposes fees in connection with the redemption of Creation Units. These fees may vary based upon various fact-based circumstances, including, but not limited to, the composition of the securities included in the Creation Unit or the countries in which
Notes to Consolidated Financial Statements (Continued)
First Trust Global Tactical Commodity Strategy Fund (FTGC)December 31, 2023 the transactions are settled. The price received for each Creation Unit will equal the daily NAV per share of the Fund times the number of shares in a Creation Unit, minus the fees described above and, if applicable, any operational processing and brokerage costs, transfer fees, stamp taxes and part or all of the spread between the expected bid and offer side of the market related to the securities comprising the redemption basket. Investors who use the services of a broker or other such intermediary in addition to an Authorized Participant to effect a redemption of a Creation Unit may also be assessed an amount to cover the cost of such services. The redemption fee charged by the Fund will comply with Rule 22c-2 of the 1940 Act which limits redemption fees to no more than 2% of the value of the shares redeemed.
7. Distribution Plan
The Board of Trustees adopted a Distribution and Service Plan pursuant to Rule 12b-1 under the 1940 Act. In accordance with the Rule 12b-1 plan, the Fund is authorized to pay an amount up to 0.25% of its average daily net assets each year to reimburse First Trust Portfolios L.P. (“FTP”), the distributor of the Fund, for amounts expended to finance activities primarily intended to result in the sale of Creation Units or the provision of investor services. FTP may also use this amount to compensate securities dealers or other persons that are Authorized Participants for providing distribution assistance, including broker-dealer and shareholder support and educational and promotional services.
No 12b-1 fees are currently paid by the Fund, and pursuant to a contractual arrangement, no 12b-1 fees will be paid any time before April 30, 2025.
8. Indemnification
The Trust, on behalf of the Fund, has a variety of indemnification obligations under contracts with its service providers. The Trust’s maximum exposure under these arrangements is unknown. However, the Trust has not had prior claims or losses pursuant to these contracts and expects the risk of loss to be remote.
9. Subsequent Events
Management has evaluated the impact of all subsequent events on the Fund through the date the consolidated financial statements were issued and has determined that there were no subsequent events requiring recognition or disclosure in the consolidated financial statements that have not already been disclosed.
Report of Independent Registered Public Accounting Firm
To the Shareholders and the Board of Trustees of First Trust Exchange-Traded Fund VII:
Opinion on the Financial Statements and Financial Highlights
We have audited the accompanying consolidated statement of assets and liabilities, including the consolidated portfolio of investments, of First Trust Global Tactical Commodity Strategy Fund (the “Fund”), one of the funds constituting the First Trust Exchange-Traded Fund VII, as of December 31, 2023, the related consolidated statement of operations for the year then ended, the consolidated statements of changes in net assets for each of the two years in the period then ended, the consolidated financial highlights for each of the five years in the period then ended, and the related notes. In our opinion, the financial statements and financial highlights present fairly, in all material respects, the financial position of the Fund as of December 31, 2023, and the results of its operations for the year then ended, the changes in its net assets for each of the two years in the period then ended, and the financial highlights for each of the five years in the period then ended in conformity with accounting principles generally accepted in the United States of America.
Basis for Opinion
These financial statements and financial highlights are the responsibility of the Fund’s management. Our responsibility is to express an opinion on the Fund’s financial statements and financial highlights based on our audits. We are a public accounting firm registered with the Public Company Accounting Oversight Board (United States) (PCAOB) and are required to be independent with respect to the Fund in accordance with the U.S. federal securities laws and the applicable rules and regulations of the Securities and Exchange Commission and the PCAOB.
We conducted our audits in accordance with the standards of the PCAOB. Those standards require that we plan and perform the audit to obtain reasonable assurance about whether the financial statements and financial highlights are free of material misstatement, whether due to error or fraud. The Fund is not required to have, nor were we engaged to perform, an audit of its internal control over financial reporting. As part of our audits we are required to obtain an understanding of internal control over financial reporting but not for the purpose of expressing an opinion on the effectiveness of the Fund’s internal control over financial reporting. Accordingly, we express no such opinion.
Our audits included performing procedures to assess the risks of material misstatement of the financial statements and financial highlights, whether due to error or fraud, and performing procedures that respond to those risks. Such procedures included examining, on a test basis, evidence regarding the amounts and disclosures in the financial statements and financial highlights. Our audits also included evaluating the accounting principles used and significant estimates made by management, as well as evaluating the overall presentation of the financial statements and financial highlights. Our procedures included confirmation of securities owned as of December 31, 2023, by correspondence with the custodian and brokers; when replies were not received from brokers, we performed other auditing procedures. We believe that our audits provide a reasonable basis for our opinion.
/s/ Deloitte & Touche, LLP
Chicago, Illinois
February 23, 2024
We have served as the auditor of one or more First Trust investment companies since 2001.
First Trust Global Tactical Commodity Strategy Fund (FTGC)December 31, 2023 (Unaudited) Proxy Voting Policies and Procedures
A description of the policies and procedures that the Trust uses to determine how to vote proxies and information on how the Fund voted proxies relating to its portfolio securities during the most recent 12-month period ended June 30 is available (1) without charge, upon request, by calling (800) 988-5891; (2) on the Fund’s website at www.ftportfolios.com; and (3) on the Securities and Exchange Commission’s (“SEC”) website at www.sec.gov.
Portfolio Holdings
The Fund files portfolio holdings information for each month in a fiscal quarter within 60 days after the end of the relevant fiscal quarter on Form N-PORT. Portfolio holdings information for the third month of each fiscal quarter will be publicly available on the SEC’s website at www.sec.gov. The Fund’s complete schedule of portfolio holdings for the second and fourth quarters of each fiscal year is included in the semi-annual and annual reports to shareholders, respectively, and is filed with the SEC on Form N-CSR. The semi-annual and annual report for the Fund is available to investors within 60 days after the period to which it relates. The Fund’s Forms N-PORT and Forms N-CSR are available on the SEC’s website listed above.
Federal Tax Information
For the taxable year ended December 31, 2023, the following percentages of income dividends paid by the Fund qualify for the dividends received deduction available to corporations and are hereby designated as qualified dividend income:
Dividend Received Deduction | Qualified Dividend Income |
| |
Distributions paid to foreign shareholders during the Fund’s fiscal year ended December 31, 2023 that were properly designated by the Fund as “interest-related dividends” or “short-term capital gain dividends,” may not be subject to federal income tax provided that the income was earned directly by such foreign shareholders.
Risk Considerations
Risks are inherent in all investing. Certain general risks that may be applicable to a Fund are identified below, but not all of the material risks relevant to each Fund are included in this report and not all of the risks below apply to each Fund. The material risks of investing in each Fund are spelled out in its prospectus, statement of additional information and other regulatory filings. Before investing, you should consider each Fund’s investment objective, risks, charges and expenses, and read each Fund’s prospectus and statement of additional information carefully. You can download each Fund’s prospectus at www.ftportfolios.com or contact First Trust Portfolios L.P. at (800) 621-1675 to request a prospectus, which contains this and other information about each Fund.
Concentration Risk. To the extent that a fund is able to invest a significant percentage of its assets in a single asset class or the securities of issuers within the same country, state, region, industry or sector, an adverse economic, business or political development may affect the value of the fund’s investments more than if the fund were more broadly diversified. A fund that tracks an index will be concentrated to the extent the fund’s corresponding index is concentrated. A concentration makes a fund more susceptible to any single occurrence and may subject the fund to greater market risk than a fund that is more broadly diversified.
Credit Risk. Credit risk is the risk that an issuer of a security will be unable or unwilling to make dividend, interest and/or principal payments when due and the related risk that the value of a security may decline because of concerns about the issuer’s ability to make such payments.
Cyber Security Risk. The funds are susceptible to potential operational risks through breaches in cyber security. A breach in cyber security refers to both intentional and unintentional events that may cause a fund to lose proprietary information, suffer data corruption or lose operational capacity. Such events could cause a fund to incur regulatory penalties, reputational damage, additional compliance costs associated with corrective measures and/or financial loss. In addition, cyber security breaches of a fund’s third-party service providers, such as its administrator, transfer agent, custodian, or sub-advisor, as applicable, or issuers in which the fund invests, can also subject a fund to many of the same risks associated with direct cyber security breaches.
Defined Outcome Funds Risk. To the extent a fund’s investment strategy is designed to deliver returns tied to the price performance of an underlying ETF, an investor may not realize the returns the fund seeks to achieve if that investor does not hold shares for the
Additional Information (Continued)
First Trust Global Tactical Commodity Strategy Fund (FTGC)December 31, 2023 (Unaudited) entire target outcome period. In the event an investor purchases shares after the first day of the target outcome period or sells shares prior to the end of the target outcome period, the buffer that the fund seeks to provide against a decline in the value of the underlying ETF may not be available, the enhanced returns that the fund seeks to provide (if any) may not be available and the investor may not participate in a gain in the value of the underlying ETF up to the cap for the investor’s investment period. Additionally, the fund will not participate in gains of the underlying ETF above the cap and a shareholder may lose their entire investment. If the fund seeks enhanced returns, there are certain time periods when the value of the fund may fall faster than the value of the underlying ETF, and it is very unlikely that, on any given day during which the underlying ETF share price increases in value, the fund’s share price will increase at the same rate as the enhanced returns sought by the fund, which is designed for an entire target outcome period. Trading flexible exchange options involves risks different from, or possibly greater than, the risks associated with investing directly in securities, such as less liquidity and correlation and valuation risks. A fund may experience substantial downside from specific flexible exchange option positions and certain positions may expire worthless.
Derivatives Risk. To the extent a fund uses derivative instruments such as futures contracts, options contracts and swaps, the fund may experience losses because of adverse movements in the price or value of the underlying asset, index or rate, which may be magnified by certain features of the derivative. These risks are heightened when a fund’s portfolio managers use derivatives to enhance the fund’s return or as a substitute for a position or security, rather than solely to hedge (or offset) the risk of a position or security held by the fund.
Equity Securities Risk. To the extent a fund invests in equity securities, the value of the fund’s shares will fluctuate with changes in the value of the equity securities. Equity securities prices fluctuate for several reasons, including changes in investors’ perceptions of the financial condition of an issuer or the general condition of the relevant stock market, such as market volatility, or when political or economic events affecting the issuers occur. In addition, common stock prices may be particularly sensitive to rising interest rates, as the cost of capital rises and borrowing costs increase. Equity securities may decline significantly in price over short or extended periods of time, and such declines may occur in the equity market as a whole, or they may occur in only a particular country, company, industry or sector of the market.
ETF Risk. The shares of an ETF trade like common stock and represent an interest in a portfolio of securities. The risks of owning an ETF generally reflect the risks of owning the underlying securities, although lack of liquidity in an ETF could result in it being more volatile and ETFs have management fees that increase their costs. Shares of an ETF trade on an exchange at market prices rather than net asset value, which may cause the shares to trade at a price greater than net asset value (premium) or less than net asset value (discount). In times of market stress, decisions by market makers to reduce or step away from their role of providing a market for an ETF’s shares, or decisions by an ETF’s authorized participants that they are unable or unwilling to proceed with creation and/or redemption orders of an ETF’s shares, could result in shares of the ETF trading at a discount to net asset value and in greater than normal intraday bid-ask spreads.
Fixed Income Securities Risk. To the extent a fund invests in fixed income securities, the fund will be subject to credit risk, income risk, interest rate risk, liquidity risk and prepayment risk. Income risk is the risk that income from a fund’s fixed income investments could decline during periods of falling interest rates. Interest rate risk is the risk that the value of a fund’s fixed income securities will decline because of rising interest rates. Liquidity risk is the risk that a security cannot be purchased or sold at the time desired, or cannot be purchased or sold without adversely affecting the price. Prepayment risk is the risk that the securities will be redeemed or prepaid by the issuer, resulting in lower interest payments received by the fund. In addition to these risks, high yield securities, or “junk” bonds, are subject to greater market fluctuations and risk of loss than securities with higher ratings, and the market for high yield securities is generally smaller and less liquid than that for investment grade securities.
Index or Model Constituent Risk. Certain funds may be a constituent of one or more indices or ETF models. As a result, such a fund may be included in one or more index-tracking exchange-traded funds or mutual funds. Being a component security of such a vehicle could greatly affect the trading activity involving a fund, the size of the fund and the market volatility of the fund. Inclusion in an index could increase demand for the fund and removal from an index could result in outsized selling activity in a relatively short period of time. As a result, a fund’s net asset value could be negatively impacted and the fund’s market price may be significantly below its net asset value during certain periods. In addition, index rebalances may potentially result in increased trading activity in a fund’s shares.
Index Provider Risk. To the extent a fund seeks to track an index, it is subject to Index Provider Risk. There is no assurance that the Index Provider will compile the Index accurately, or that the Index will be determined, maintained, constructed, reconstituted, rebalanced, composed, calculated or disseminated accurately. To correct any such error, the Index Provider may carry out an
Additional Information (Continued)
First Trust Global Tactical Commodity Strategy Fund (FTGC)December 31, 2023 (Unaudited) unscheduled rebalance or other modification of the Index constituents or weightings, which may increase the fund’s costs. The Index Provider does not provide any representation or warranty in relation to the quality, accuracy or completeness of data in the Index, and it does not guarantee that the Index will be calculated in accordance with its stated methodology. Losses or costs associated with any Index Provider errors generally will be borne by the fund and its shareholders.
Investment Companies Risk. To the extent a fund invests in the securities of other investment vehicles, the fund will incur additional fees and expenses that would not be present in a direct investment in those investment vehicles. Furthermore, the fund’s investment performance and risks are directly related to the investment performance and risks of the investment vehicles in which the fund invests.
LIBOR Risk. To the extent a fund invests in floating or variable rate obligations that use the London Interbank Offered Rate (“LIBOR”) as a reference interest rate, it is subject to LIBOR Risk. The United Kingdom’s Financial Conduct Authority, which regulates LIBOR, has ceased making LIBOR available as a reference rate over a phase-out period that began December 31, 2021. There is no assurance that any alternative reference rate, including the Secured Overnight Financing Rate (“SOFR”) will be similar to or produce the same value or economic equivalence as LIBOR or that instruments using an alternative rate will have the same volume or liquidity. The unavailability or replacement of LIBOR may affect the value, liquidity or return on certain fund investments and may result in costs incurred in connection with closing out positions and entering into new trades. Any potential effects of the transition away from LIBOR on the fund or on certain instruments in which the fund invests can be difficult to ascertain, and they may vary depending on a variety of factors, and they could result in losses to the fund.
Management Risk. To the extent that a fund is actively managed, it is subject to management risk. In managing an actively-managed fund’s investment portfolio, the fund’s portfolio managers will apply investment techniques and risk analyses that may not have the desired result. There can be no guarantee that a fund will meet its investment objective.
Market Risk. Market risk is the risk that a particular security, or shares of a fund in general, may fall in value. Securities held by a fund, as well as shares of a fund itself, are subject to market fluctuations caused by factors such as general economic conditions, political events, regulatory or market developments, changes in interest rates and perceived trends in securities prices. Shares of a fund could decline in value or underperform other investments as a result of the risk of loss associated with these market fluctuations. In addition, local, regional or global events such as war, acts of terrorism, spread of infectious diseases or other public health issues, recessions, or other events could have a significant negative impact on a fund and its investments. Such events may affect certain geographic regions, countries, sectors and industries more significantly than others. In February 2022, Russia invaded Ukraine which has caused and could continue to cause significant market disruptions and volatility within the markets in Russia, Europe, and the United States. The hostilities and sanctions resulting from those hostilities could have a significant impact on certain fund investments as well as fund performance. The COVID-19 global pandemic and the ensuing policies enacted by governments and central banks have caused and may continue to cause significant volatility and uncertainty in global financial markets. While the U.S. has resumed “reasonably” normal business activity, many countries continue to impose lockdown measures. Additionally, there is no guarantee that vaccines will be effective against emerging variants of the disease. These events also adversely affect the prices and liquidity of a fund’s portfolio securities or other instruments and could result in disruptions in the trading markets. Any of such circumstances could have a materially negative impact on the value of a fund’s shares and result in increased market volatility. During any such events, a fund’s shares may trade at increased premiums or discounts to their net asset value and the bid/ask spread on a fund’s shares may widen.
Non-U.S. Securities Risk. To the extent a fund invests in non-U.S. securities, it is subject to additional risks not associated with securities of domestic issuers. Non-U.S. securities are subject to higher volatility than securities of domestic issuers due to: possible adverse political, social or economic developments; restrictions on foreign investment or exchange of securities; capital controls; lack of liquidity; currency exchange rates; excessive taxation; government seizure of assets; the imposition of sanctions by foreign governments; different legal or accounting standards; and less government supervision and regulation of exchanges in foreign countries. Investments in non-U.S. securities may involve higher costs than investments in U.S. securities, including higher transaction and custody costs, as well as additional taxes imposed by non-U.S. governments. These risks may be heightened for securities of companies located, or with significant operations, in emerging market countries.
Operational Risk. Each fund is subject to risks arising from various operational factors, including, but not limited to, human error, processing and communication errors, errors of a fund’s service providers, counterparties or other third-parties, failed or inadequate processes and technology or systems failures. Each fund relies on third-parties for a range of services, including custody. Any delay or failure relating to engaging or maintaining such service providers may affect a fund’s ability to meet its investment objective.
Additional Information (Continued)
First Trust Global Tactical Commodity Strategy Fund (FTGC)December 31, 2023 (Unaudited) Although the funds and the funds’ investment advisor seek to reduce these operational risks through controls and procedures, there is no way to completely protect against such risks.
Passive Investment Risk. To the extent a fund seeks to track an index, the fund will invest in the securities included in, or representative of, the index regardless of their investment merit. A fund generally will not attempt to take defensive positions in declining markets.
Preferred Securities Risk. Preferred securities combine some of the characteristics of both common stocks and bonds. Preferred securities are typically subordinated to bonds and other debt securities in a company’s capital structure in terms of priority to corporate income, subjecting them to greater credit risk than those debt securities. Generally, holders of preferred securities have no voting rights with respect to the issuing company unless preferred dividends have been in arrears for a specified number of periods, at which time the preferred security holders may obtain limited rights. In certain circumstances, an issuer of preferred securities may defer payment on the securities and, in some cases, redeem the securities prior to a specified date. Preferred securities may also be substantially less liquid than other securities, including common stock.
Valuation Risk. The valuation of certain securities may carry more risk than that of common stock. Uncertainties in the conditions of the financial markets, unreliable reference data, lack of transparency and inconsistency of valuation models and processes may lead to inaccurate asset pricing. A fund may hold investments in sizes smaller than institutionally sized round lot positions (sometimes referred to as odd lots). However, third-party pricing services generally provide evaluations on the basis of institutionally-sized round lots. If a fund sells certain of its investments in an odd lot transaction, the sale price may be less than the value at which such securities have been held by the fund. Odd lots often trade at lower prices than institutional round lots. There is no assurance that the fund will be able to sell a portfolio security at the price established by the pricing service, which could result in a loss to the fund.
NOT FDIC INSURED NOT BANK GUARANTEED MAY LOSE VALUE
Remuneration
First Trust Advisors L.P. (“First Trust”) is authorised and regulated by the U.S. Securities and Exchange Commission and is entitled to market shares of certain funds it manages, including First Trust Global Tactical Commodity Strategy Fund (the “Fund”), in certain member states in the European Economic Area in accordance with the cooperation arrangements in Article 42 of the Alternative Investment Fund Managers Directive (the “Directive”). First Trust is required under the Directive to make disclosures in respect of remuneration. The following disclosures are made in line with First Trust’s interpretation of currently available regulatory guidance on remuneration disclosures.
During the year ended December 31, 2023, the amount of remuneration paid (or to be paid) by First Trust Advisors L.P. in respect of the Funds is $5,169,645. This figure is comprised of $293,559 paid (or to be paid) in fixed compensation and $4,876,086 paid (or to be paid) in variable compensation. There were a total of 28 beneficiaries of the remuneration described above. Those amounts include $674,631 paid (or to be paid) to senior management of First Trust Advisors L.P. and $4,495,014 paid (or to be paid) to other employees whose professional activities have a material impact on the risk profiles of First Trust Advisors L.P. or the Funds (collectively, “Code Staff”).
Code Staff included in the aggregated figures disclosed above are rewarded in line with First Trust’s remuneration policy (the “Remuneration Policy”) which is determined and implemented by First Trust’s senior management. The Remuneration Policy reflects First Trust’s ethos of good governance and encapsulates the following principal objectives:
i.
to provide a clear link between remuneration and performance of First Trust and to avoid rewarding for failure;
ii.
to promote sound and effective risk management consistent with the risk profiles of the funds managed by First Trust; and
iii.
to remunerate staff in line with the business strategy, objectives, values and interests of First Trust and the funds managed by First Trust in a manner that avoids conflicts of interest.
First Trust assesses various risk factors which it is exposed to when considering and implementing remuneration for Code Staff and considers whether any potential award to such person(s) would give rise to a conflict of interest. First Trust does not reward failure, or consider the taking of risk or failure to take risk in its remuneration of Code Staff.
Additional Information (Continued)
First Trust Global Tactical Commodity Strategy Fund (FTGC)December 31, 2023 (Unaudited) First Trust assesses performance for the purposes of determining payments in respect of performance-related remuneration of Code Staff by reference to a broad range of measures including (i) individual performance (using financial and non-financial criteria), and (ii) the overall performance of First Trust. Remuneration is not based upon the performance of the Fund.
The elements of remuneration are balanced between fixed and variable and the senior management sets fixed salaries at a level sufficient to ensure that variable remuneration incentivises and rewards strong individual performance but does not encourage excessive risk taking.
No individual is involved in setting his or her own remuneration.
Board of Trustees and Officers
First Trust Global Tactical Commodity Strategy Fund (FTGC)December 31, 2023 (Unaudited) The following tables identify the Trustees and Officers of the Trust. Unless otherwise indicated, the address of all persons is 120 East Liberty Drive, Suite 400, Wheaton, IL 60187.
The Trust’s statement of additional information includes additional information about the Trustees and is available, without charge, upon request, by calling (800) 988-5891.
Name,
Year of Birth and
Position with the Trust | Term of Office
and Year First
Elected or
Appointed | Principal Occupations
During Past 5 Years | Number of
Portfolios in
the First Trust
Fund Complex
Overseen by
Trustee | Other
Trusteeships or
Directorships
Held by Trustee
During Past
5 Years |
|
Richard E. Erickson, Trustee
(1951) | • Indefinite Term • Since Inception | Retired; Physician, Edward-Elmhurst Medical Group (2021 to September 2023); Physician and Officer, Wheaton Orthopedics (1990 to 2021) | | |
Thomas R. Kadlec, Trustee
(1957) | • Indefinite Term • Since Inception | Retired; President, ADM Investors Services, Inc. (Futures Commission Merchant) (2010 to July 2022) | | Director, National Futures Association and ADMIS Singapore Ltd.; Formerly, Director of ADM Investor Services, Inc., ADM Investor Services International, ADMIS Hong Kong Ltd., and Futures Industry Association |
Denise M. Keefe, Trustee
(1964) | • Indefinite Term • Since 2021 | Executive Vice President, Advocate Aurora Health and President, Advocate Aurora Continuing Health Division (Integrated Healthcare System) | | Director and Board Chair of Advocate Home Health Services, Advocate Home Care Products and Advocate Hospice; Director and Board Chair of Aurora At Home (since 2018); Director of Advocate Physician Partners Accountable Care Organization; Director of RML Long Term Acute Care Hospitals; Director of Senior Helpers (since 2021); and Director of MobileHelp (since 2022) |
Robert F. Keith, Trustee
(1956) | • Indefinite Term • Since Inception | President, Hibs Enterprises (Financial and Management Consulting) | | Formerly, Director of Trust Company of Illinois |
Niel B. Nielson, Trustee
(1954) | • Indefinite Term • Since Inception | Senior Advisor (2018 to Present), Managing Director and Chief Operating Officer (2015 to 2018), Pelita Harapan Educational Foundation (Educational Products and Services) | | |
Bronwyn Wright, Trustee
(1971) | • Indefinite Term • Since 2023 | Independent Director to a number of Irish collective investment funds (2009 to Present); Various roles at international affiliates of Citibank (1994 to 2009), including Managing Director, Citibank Europe plc and Head of Securities and Fund Services, Citi Ireland (2007 to 2009) | | |
Board of Trustees and Officers (Continued)
First Trust Global Tactical Commodity Strategy Fund (FTGC)December 31, 2023 (Unaudited) Name, Year of Birth and Position with the Trust | Term of Office and Year First Elected or Appointed | Principal Occupations During Past 5 Years | Number of Portfolios in the First Trust Fund Complex Overseen by Trustee | Other Trusteeships or Directorships Held by Trustee During Past 5 Years |
|
James A. Bowen(1), Trustee,
Chairman of the Board
(1955) | • Indefinite Term • Since Inception | Chief Executive Officer, First Trust Advisors L.P. and First Trust Portfolios L.P., Chairman of the Board of Directors, BondWave LLC (Software Development Company) and Stonebridge Advisors LLC (Investment Advisor) | | |
| Position and
Offices
with Trust | Term of Office
and Length of
Service | Principal Occupations
During Past 5 Years |
|
| President and Chief Executive Officer | • Indefinite Term • Since 2016 | Managing Director and Chief Financial Officer, First Trust Advisors L.P. and First Trust Portfolios L.P.; Chief Financial Officer, BondWave LLC (Software Development Company) and Stonebridge Advisors LLC (Investment Advisor) |
| Treasurer, Chief Financial Officer and Chief Accounting Officer | • Indefinite Term • Since 2023 | Senior Vice President, First Trust Advisors L.P. and First Trust Portfolios L.P., July 2021 to Present. Previously, Vice President, First Trust Advisors L.P. and First Trust Portfolios L.P., 2014 - 2021. |
| Secretary and Chief Legal Officer | • Indefinite Term • Since Inception | General Counsel, First Trust Advisors L.P. and First Trust Portfolios L.P.; Secretary and General Counsel, BondWave LLC; Secretary, Stonebridge Advisors LLC |
Daniel J. Lindquist
(1970) | | • Indefinite Term • Since Inception | Managing Director, First Trust Advisors L.P. and First Trust Portfolios L.P. |
| Chief Compliance Officer and Assistant Secretary | • Indefinite Term • Since Inception | Deputy General Counsel, First Trust Advisors L.P. and First Trust Portfolios L.P. |
| | • Indefinite Term • Since Inception | Senior Vice President, First Trust Advisors L.P. and First Trust Portfolios L.P. |
| | • Indefinite Term • Since Inception | Senior Vice President, First Trust Advisors L.P. and First Trust Portfolios L.P. |
(1)
Mr. Bowen is deemed an “interested person” of the Trust due to his position as Chief Executive Officer of First Trust Advisors L.P., investment advisor of the Trust.
(2)
The term “officer” means the president, vice president, secretary, treasurer, controller or any other officer who performs a policy making function.
First Trust Global Tactical Commodity Strategy Fund (FTGC)December 31, 2023 (Unaudited) Privacy Policy
First Trust values our relationship with you and considers your privacy an important priority in maintaining that relationship. We are committed to protecting the security and confidentiality of your personal information.
Sources of Information
We collect nonpublic personal information about you from the following sources:
• Information we receive from you and your broker-dealer, investment professional or financial representative through interviews, applications, agreements or other forms;
• Information about your transactions with us, our affiliates or others;
• Information we receive from your inquiries by mail, e-mail or telephone; and
• Information we collect on our website through the use of “cookies.” For example, we may identify the pages on our website that your browser requests or visits.
Information Collected
The type of data we collect may include your name, address, social security number, age, financial status, assets, income, tax information, retirement and estate plan information, transaction history, account balance, payment history, investment objectives, marital status, family relationships and other personal information.
Disclosure of Information
We do not disclose any nonpublic personal information about our customers or former customers to anyone, except as permitted by law. In addition to using this information to verify your identity (as required under law), the permitted uses may also include the disclosure of such information to unaffiliated companies for the following reasons:
• In order to provide you with products and services and to effect transactions that you request or authorize, we may disclose your personal information as described above to unaffiliated financial service providers and other companies that perform administrative or other services on our behalf, such as transfer agents, custodians and trustees, or that assist us in the distribution of investor materials such as trustees, banks, financial representatives, proxy services, solicitors and printers.
• We may release information we have about you if you direct us to do so, if we are compelled by law to do so, or in other legally limited circumstances (for example to protect your account from fraud).
In addition, in order to alert you to our other financial products and services, we may share your personal information within First Trust.
Use of Website Analytics
We currently use third party analytics tools, Google Analytics and AddThis, to gather information for purposes of improving First Trust’s website and marketing our products and services to you. These tools employ cookies, which are small pieces of text stored in a file by your web browser and sent to websites that you visit, to collect information, track website usage and viewing trends such as the number of hits, pages visited, videos and PDFs viewed and the length of user sessions in order to evaluate website performance and enhance navigation of the website. We may also collect other anonymous information, which is generally limited to technical and web navigation information such as the IP address of your device, internet browser type and operating system for purposes of analyzing the data to make First Trust’s website better and more useful to our users. The information collected does not include any personal identifiable information such as your name, address, phone number or email address unless you provide that information through the website for us to contact you in order to answer your questions or respond to your requests. To find out how to opt-out of these services click on: Google Analytics and AddThis.
Confidentiality and Security
With regard to our internal security procedures, First Trust restricts access to your nonpublic personal information to those First Trust employees who need to know that information to provide products or services to you. We maintain physical, electronic and procedural safeguards to protect your nonpublic personal information.
Policy Updates and Inquiries
As required by federal law, we will notify you of our privacy policy annually. We reserve the right to modify this policy at any time, however, if we do change it, we will tell you promptly. For questions about our policy, or for additional copies of this notice, please go to www.ftportfolios.com, or contact us at 1-800-621-1675 (First Trust Portfolios) or 1-800-222-6822 (First Trust Advisors).
March 2023
First Trust Exchange-Traded Fund VII
INVESTMENT ADVISOR
First Trust Advisors L.P.
120 East Liberty Drive, Suite 400
Wheaton, IL 60187
ADMINISTRATOR, CUSTODIAN,
FUND ACCOUNTANT &
TRANSFER AGENT
The Bank of New York Mellon
240 Greenwich Street
New York, NY 10286
INDEPENDENT REGISTERED
PUBLIC ACCOUNTING FIRM
Deloitte & Touche LLP
111 South Wacker Drive
Chicago, IL 60606
LEGAL COUNSEL
Chapman and Cutler LLP
320 South Canal Street
Chicago, IL 60606
|
For the Year Ended
December 31, 2023 |
First Trust Exchange-Traded Fund VII
First Trust Alternative Absolute Return Strategy ETF (FAAR) |
First Trust Alternative Absolute Return Strategy ETF (FAAR)
Annual Report
December 31, 2023
Caution Regarding Forward-Looking Statements
This report contains certain forward-looking statements within the meaning of the Securities Act of 1933, as amended, and the Securities Exchange Act of 1934, as amended. Forward-looking statements include statements regarding the goals, beliefs, plans or current expectations of First Trust Advisors L.P. (“First Trust” or the “Advisor”) and its representatives, taking into account the information currently available to them. Forward-looking statements include all statements that do not relate solely to current or historical fact. For example, forward-looking statements include the use of words such as “anticipate,” “estimate,” “intend,” “expect,” “believe,” “plan,” “may,” “should,” “would” or other words that convey uncertainty of future events or outcomes.
Forward-looking statements involve known and unknown risks, uncertainties and other factors that may cause the actual results, performance or achievements of the series of First Trust Exchange-Traded Fund VII (the “Trust”) described in this report (First Trust Alternative Absolute Return Strategy ETF; hereinafter referred to as the “Fund”) to be materially different from any future results, performance or achievements expressed or implied by the forward-looking statements. When evaluating the information included in this report, you are cautioned not to place undue reliance on these forward-looking statements, which reflect the judgment of the Advisor and its representatives only as of the date hereof. We undertake no obligation to publicly revise or update these forward-looking statements to reflect events and circumstances that arise after the date hereof.
Performance and Risk Disclosure
There is no assurance that the Fund will achieve its investment objective. The Fund is subject to market risk, which is the possibility that the market values of securities owned by the Fund will decline and that the value of the Fund’s shares may therefore be less than what you paid for them. Accordingly, you can lose money investing in the Fund. See “Risk Considerations” in the Additional Information section of this report for a discussion of certain other risks of investing in the Fund.
Performance data quoted represents past performance, which is no guarantee of future results, and current performance may be lower or higher than the figures shown. For the most recent month-end performance figures, please visit www.ftportfolios.com or speak with your financial advisor. Investment returns, net asset value and share price will fluctuate and Fund shares, when sold, may be worth more or less than their original cost.
The Advisor may also periodically provide additional information on Fund performance on the Fund’s webpage at www.ftportfolios.com.
How to Read This Report
This report contains information that may help you evaluate your investment in the Fund. It includes details about the Fund and presents data and analysis that provide insight into the Fund’s performance and investment approach.
By reading the portfolio commentary from the portfolio management team of the Fund, you may obtain an understanding of how the market environment affected the Fund’s performance. The statistical information that follows may help you understand the Fund’s performance compared to that of relevant market benchmarks.
It is important to keep in mind that the opinions expressed by personnel of the Advisor are just that: informed opinions. They should not be considered to be promises or advice. The opinions, like the statistics, cover the period through the date on the cover of this report. The material risks of investing in the Fund are spelled out in the prospectus, the statement of additional information, and other Fund regulatory filings.
First Trust Alternative Absolute Return Strategy ETF (FAAR)
Annual Letter from the Chairman and CEO
December 31, 2023
Dear Shareholders:
First Trust is pleased to provide you with the annual report for the First Trust Alternative Absolute Return Strategy ETF (the “Fund”), which contains detailed information about the Fund for the twelve months ended December 31, 2023.
As 2023 comes to a close, it strikes me that many of the critical themes investors have been navigating over the past year remain unresolved. High inflation, the direction of central bank policy, and the risk of an economic recession in the U.S. are just a few examples, but another is war. The war between Russia and Ukraine rages on and will enter its third full year in just a few short months. In addition, geopolitical tensions across the Middle East are rising. Israel is at war with Hamas, and the Houthi rebels have been attacking global shipping lanes in the Red Sea, threatening the global supply chain, and prompting a military response from the U.S. and Britain.
Despite these headwinds, the broader U.S. equity and fixed income markets surged during the year. In the U.S., the S&P 500® Index rose by 26.29% on a total return basis between December 31, 2022, and December 31, 2023, according to data from Bloomberg. The Bloomberg U.S. Aggregate Bond Index also enjoyed a positive total return, rising by 5.53% over the same period. These returns can be explained, in part, by expectations that the Federal Reserve (the “Fed”) could cut interest rates in 2024. In its December 2023 statement, the Fed indicated that it expects to reduce the Federal Funds target rate by as much as 75 basis points (“bps”) over three cuts throughout 2024. It appears investors expect even steeper cuts than the Fed announced. As of December 31, 2023, the Fed Funds Futures market was pricing in nearly six rate cuts totaling more than 150 bps by the end of 2024.
In some regards, the past year serves as a stark warning against taking an overly myopic view when it comes to investing. Data from the Investment Company Institute revealed that total net assets in money market accounts stood at a record $5.9 trillion on December 6, 2023, up from $4.8 trillion at the start of the year. While the figure may be sizable, it is not surprising, in my view, especially considering the impediments to growth mentioned above. While money market assets likely earned higher interest payments than they would have before the Fed began interest rate hikes, they certainly underperformed the S&P 500® Index’s staggering total return for the year.
Thank you for giving First Trust the opportunity to play a role in your financial future. We value our relationship with you and will report on the Fund again in six months.
Sincerely,
James A. Bowen
Chairman of the Board of Trustees
Chief Executive Officer of First Trust Advisors L.P.
Fund Performance Overview (Unaudited)
First Trust Alternative Absolute Return Strategy ETF (FAAR)
The First Trust Alternative Absolute Return Strategy ETF (the “Fund”) seeks to provide investors with long-term total return. The shares of the Fund are listed and trade on The Nasdaq Stock Market LLC under the ticker symbol “FAAR.” The Fund is an actively managed exchange-traded fund that seeks to achieve long-term total return through long and short investments in exchange-traded commodity futures contracts (“Commodity Futures”) through a wholly-owned subsidiary of the Fund organized under the laws of the Cayman Islands (the “Subsidiary”). The Fund does not invest directly in Commodity Futures. The Fund gains exposure to these investments exclusively by investing in the Subsidiary. The Subsidiary is advised by First Trust Advisors L.P., the Fund’s investment advisor.
The Fund’s investment in the Subsidiary is intended to provide the Fund with exposure to commodity markets within the limits of current federal income tax laws applicable to investment companies such as the Fund, which limit the ability of investment companies to invest directly in Commodity Futures. The Subsidiary has the same investment objective as the Fund, but unlike the Fund, it may invest without limitation in Commodity Futures. The Fund will invest up to 25% of its total assets in the Subsidiary.
The Subsidiary’s holdings primarily consist of Commodity Futures, which are contractual agreements to buy or sell a particular commodity or financial instrument at a pre-determined price at a settlement date in the future. The Fund, through the Subsidiary, engages in trading on commodity markets both inside and outside of the United States on behalf of the Fund. The Fund, through the Subsidiary, may invest in a range of Commodity Futures and markets as determined by the Fund’s investment advisor from time to time. The remainder of the Fund’s assets will primarily be invested in: (1) U.S. government and agency securities with maturities of two years or less; (2) short-term repurchase agreements; (3) money market instruments; and (4) cash.
|
| | Average Annual Total Returns | |
| | | Inception
(5/18/16)
to 12/31/23 | | Inception
(5/18/16)
to 12/31/23 |
| | | | | |
| | | | | |
| | | | | |
| | | | | |
3 Month U.S. Treasury Bills + 3% | | | | | |
Bloomberg Commodity Index | | | | | |
| | | | | |
Total returns for the period since inception are calculated from the inception date of the Fund. “Average Annual Total Returns” represent the average annual change in value of an investment over the periods indicated. “Cumulative Total Returns” represent the total change in value of an investment over the periods indicated.
The Fund’s per share net asset value (“NAV”) is the value of one share of the Fund and is computed by dividing the value of all assets of the Fund (including accrued interest and dividends), less all liabilities (including accrued expenses and dividends declared but unpaid), by the total number of outstanding shares. The price used to calculate market return (“Market Price”) is determined by using the midpoint of the national best bid and offer price (“NBBO”) as of the time that the Fund’s NAV is calculated. Under the Securities and Exchange Commission’s rules, the NBBO consists of the highest displayed buy and lowest sell prices among the various exchanges trading the Fund at the time the Fund’s NAV is calculated. Prior to January 1, 2019, the price used was the midpoint between the highest bid and the lowest offer on the stock exchange on which shares of the Fund were listed for trading as of the time that the Fund’s NAV was calculated. Since shares of the Fund did not trade in the secondary market until after the Fund’s inception, for the period from inception to the first day of secondary market trading in shares of the Fund, the NAV of the Fund is used as a proxy for the secondary market trading price to calculate market returns. NAV and market returns assume that all distributions have been reinvested in the Fund at NAV and Market Price, respectively.
An index is a statistical composite that tracks a specified financial market or sector. Unlike the Fund, the indices do not actually hold a portfolio of securities and therefore do not incur the expenses incurred by the Fund. These expenses negatively impact the performance of the Fund. Also, market returns do not include brokerage commissions that may be payable on secondary market transactions. If brokerage commissions were included, market returns would be lower. The total returns presented reflect the reinvestment of dividends on securities in the indices. The returns presented do not reflect the deduction of taxes that a shareholder would pay on Fund distributions or the redemption or sale of Fund shares. The investment return and principal value of shares of the Fund will vary with changes in market conditions. Shares of the Fund may be worth more or less than their original cost when they are redeemed or sold in the market. The Fund’s past performance is no guarantee of future performance.
Fund Performance Overview (Unaudited) (Continued)
First Trust Alternative Absolute Return Strategy ETF (FAAR) (Continued)
| |
U.S. Government Bonds and Notes | |
| |
| |
Net Other Assets and Liabilities* | |
| |
| Includes variation margin on futures contracts. |
| Performance figures assume reinvestment of all distributions and do not reflect the deduction of taxes that a shareholder would pay on Fund distributions or the redemption or sale of Fund shares. An index is a statistical composite that tracks a specified financial market or sector. Unlike the Fund, the indices do not actually hold a portfolio of securities and therefore do not incur the expenses incurred by the Fund. These expenses negatively impact the performance of the Fund. The Fund’s past performance does not predict future performance. |
Frequency Distribution of Discounts and Premiums
Information showing the number of days the market price of the Fund’s shares was greater (at a premium) and less (at a discount) than the Fund’s net asset value for the most recently completed year, and the most recently completed calendar quarters since that year (or life of the Fund, if shorter) is available at https://www.ftportfolios.com/Retail/etf/home.aspx.
First Trust Alternative Absolute Return Strategy ETF (FAAR)Annual ReportDecember 31, 2023 (Unaudited) Advisor
First Trust Advisors L.P. (“First Trust” or the “Advisor”) serves as the investment advisor, commodity pool operator and commodity trading advisor to the First Trust Alternative Absolute Return Strategy ETF (the “Fund”). First Trust is responsible for the selection and ongoing monitoring of the Fund’s investment portfolio, managing the Fund’s business affairs and providing certain administrative services necessary for the management of the Fund.
Portfolio Management Team
The following persons serve as portfolio managers of the Fund:
John Gambla – CFA, FRM, PRM, Senior Portfolio Manager, Alternatives Investment Team of First Trust
Rob A. Guttschow – CFA, Senior Portfolio Manager, Alternatives Investment Team of First Trust
The portfolio managers are primarily and jointly responsible for the day-to-day management of the Fund. Each portfolio manager has served as a part of the portfolio management of the Fund since 2016.
Commentary
The Fund is an actively managed exchange-traded fund (“ETF”). The Fund’s investment objective is to seek to provide investors with long-term total return. For performance measurement, the Fund is benchmarked to the unmanaged Bloomberg Commodity Index (the “Benchmark”), the 3 Month U.S. Treasury Bills + 3% annually, and the S&P 500® Index. This commentary discusses the 12-month market and Fund performance ended December 31, 2023.
Overall Market Recap
U.S. economic growth was strong during the 12-month period ended December 31, 2023. Average quarterly real gross domestic product growth for the first three quarters of the period was 3.1% annualized and current expectations for the fourth quarter, according to the Atlanta Fed GDPNow model, are at 2.2% annualized growth. The U.S. Labor market, as measured by the U.S. Bureau of Labor Statistics’ Non-Farm payroll release, showed strong employment growth during the 12-month period ended December 31, 2023, with 2.70 million jobs added to the U.S. economy during the period. The robust growth in jobs has drawn more workers back into the economy as the U.S. Labor Force Participation Rate increased by 0.2%, rising to 62.5% as of the end of the period. After declining on a real basis (inflation adjusted) the prior two years, real wages finished the period up 0.6% on a year-over-year basis. Nominal wage growth slowed in 2023, declining from 4.8% in 2022 to 4.1% in 2023, but a substantial moderation in the inflation rate from 6.5% in 2022 to 3.4% in 2023 boosted real wages.
The Federal Reserve (the “Fed”) continued its interest rate hiking program during the calendar year, raising its short-term benchmark rate four times, with the final hike being 0.25% in late July 2023. So far, the Fed has successfully reduced inflation without throwing the U.S. economy into a recession. As the third and fourth quarters of 2023 progressed and inflation continued to moderate, U.S. equity and bond markets rallied, as the market began to anticipate an end to the Fed’s restrictive interest rate policy. As of year-end, the market, as expressed in fixed income futures contracts, is expecting the Fed to reduce rates by approximately 1.50% in 2024, which would lower the Federal Funds target rate to 3.75%.
The U.S. equity market, as represented by the S&P 500® Index, rallied during the fiscal period, up 26.29%. Returns in the S&P 500® Index were particularly good for technology-related stocks, as the release of ChatGPT sparked a strong rally in technology stocks related to or doing business in the Artificial Intelligence industry. Bonds, as represented by the Bloomberg U.S. Aggregate Bond Index, were up during the fiscal period by 5.53% and riskier high yield bonds (Bloomberg U.S. Corporate High Yield Bond Index) were up 13.45%. Commodity markets declined with the Bloomberg Commodity Index down 7.91%.
Fund Performance
The Fund’s performance for the 12-month fiscal period ended December 31, 2023, was -5.79% on a net asset value (“NAV”) basis and -5.85% on a market price basis. The Fund’s benchmarks, (the Bloomberg Commodity Index, the 3 Month U.S Treasury Bills + 3%, and S&P 500® Index) returned -7.91%, 8.20%, and 26.29%, respectively.
The global commodity market is made up of several separate markets including agriculture, livestock, energy, industrial metals, and precious metals. These commodities are the building blocks of every economy in the world. Holding a physical commodity is not practical for most investors, but the futures market provides an alternative way to seek exposure to commodities. The Fund employs an
Portfolio Commentary (Continued)
First Trust Alternative Absolute Return Strategy ETF (FAAR)Annual ReportDecember 31, 2023 (Unaudited) investment style that seeks to profit from rising and falling commodity prices by purchasing futures contracts in commodities that are anticipated to rise in price and shorting or selling futures contracts in commodities that are anticipated to fall in price. Commodities and their respective futures contracts can be very volatile in price and there is no guarantee that the Fund’s portfolio managers will correctly anticipate which commodity futures contracts will rise or fall in price.
During the 12-month period ended December 31, 2023, the Fund held allocations in 27 different commodities contracts. The Fund’s average long and short exposure during the period was 53.2% and -39.8%, respectively. The average gross (long positions + absolute value of short positions) was 93.0% and the average net exposure was positive 13.4%. The average gross sector allocations were 19.4% energy, 11.6% industrial metals, 6.5% precious metals, 46.4% agricultural, and 9.0% livestock. As of December 31, 2023, the Fund’s gross exposure was 83.9%, comprised of 26.3% long positions and 57.6% short positions. The Fund’s largest exposure was an 8.5% short position in corn with the second largest exposure being a 6.8% short position in WTI crude oil.
During the period, the commodity market’s rapid up and down reversals with no clear trends resulted in the Fund struggling to profit off of market movements. The most negative sector for the Fund was the Agricultural sector where the Fund had negative performance on both its long and short positions. Bean-oil and soymeal were the largest negative contributors as both contracts had large price swings throughout the year which resulted in the Fund being long and short at the wrong times throughout the year. Precious Metals and the Cattle sector were two other sectors where the Fund’s overall position resulted in losses on both the long and short side of the market.
The Fund’s positions in the Energy sector added value throughout the period, as the Fund’s short position in natural gas benefitted with the BCOM Natural Gas Total Return Index down 65.3% for the fiscal period. Fund positions in gas-oil and gasoline were also profitable throughout the year while heating oil and Brent crude oil were negative contributors. Industrial metals and softs were detractors for the period with the largest impacts coming from a net short position in coffee (Bloomberg Coffee Total Return Index +25.11% for the year) and a net long position in lead (Bloomberg Lead Total Return Index returned -6.95% for the year).
Please see the Consolidated Portfolio of Investments for a complete list of all positions within the portfolio as of December 31, 2023.
Market and Fund Outlook
Today, we believe the Fund is well positioned to achieve its investment objective of seeking to provide investors with long-term total return. We believe that the Fund is currently broadly diversified across commodity futures and commodity sectors with a variety of long and short positions in anticipation of rising and falling prices. Additionally, we believe that the investment strategy employed by the Fund results in long / short commodity exposures that are not highly correlated to long positions in stock, bonds, or commodities; therefore, we believe the Fund could potentially decrease investor portfolio volatility, enhance overall return, and provide meaningful diversification to an asset allocation strategy.
First Trust Alternative Absolute Return Strategy ETF (FAAR)Understanding Your Fund ExpensesDecember 31, 2023 (Unaudited) As a shareholder of First Trust Alternative Absolute Return Strategy ETF (the “Fund”), you incur two types of costs: (1) transaction costs; and (2) ongoing costs, including management fees, distribution and/or service (12b-1) fees, if any, and other Fund expenses. This Example is intended to help you understand your ongoing costs of investing in the Fund and to compare these costs with the ongoing costs of investing in other funds.
The Example is based on an investment of $1,000 invested at the beginning of the period and held through the six-month period ended December 31, 2023.
Actual Expenses
The first line in the following table provides information about actual account values and actual expenses. You may use the information in this line, together with the amount you invested, to estimate the expenses that you paid over the period. Simply divide your account value by $1,000 (for example, an $8,600 account value divided by $1,000 = 8.6), then multiply the result by the number in the first line under the heading entitled “Expenses Paid During the Six-Month Period” to estimate the expenses you paid on your account during this six-month period.
Hypothetical Example for Comparison Purposes
The second line in the following table provides information about hypothetical account values and hypothetical expenses based on the Fund’s actual expense ratio and an assumed rate of return of 5% per year before expenses, which is not the Fund’s actual return. The hypothetical account values and expenses may not be used to estimate the actual ending account balance or expenses you paid for the period. You may use this information to compare the ongoing costs of investing in the Fund and other funds. To do so, compare this 5% hypothetical example with the 5% hypothetical examples that appear in the shareholder reports of the other funds.
Please note that the expenses shown in the table are meant to highlight your ongoing costs only and do not reflect any transactional costs such as brokerage commissions. Therefore, the second line in the table is useful in comparing ongoing costs only, and will not help you determine the relative total costs of owning different funds. In addition, if these transactional costs were included, your costs would have been higher.
| Beginning
Account Value
July 1, 2023 | Ending
Account Value
December 31, 2023 | Annualized
Expense Ratio
Based on the
Six-Month
Period | Expenses Paid
During the
Six-Month
Period (a) |
First Trust Alternative Absolute Return Strategy ETF (FAAR) |
| | | | |
Hypothetical (5% return before expenses) | | | | |
| Expenses are equal to the annualized expense ratio as indicated in the table multiplied by the average account value over the period (July 1, 2023 through December 31, 2023), multiplied by 184/365 (to reflect the six-month period). |
First Trust Alternative Absolute Return Strategy ETF (FAAR)Consolidated Portfolio of InvestmentsDecember 31, 2023
| | | | |
U.S. GOVERNMENT BONDS AND NOTES — 51.6% |
| | | | |
| | | | |
| | | | |
| | | | |
| | | | |
| | | | |
| | | | |
| Total U.S. Government Bonds and Notes | |
| | |
U.S. TREASURY BILLS — 7.6% |
| | | | |
| | | | |
| | |
MONEY MARKET FUNDS — 34.5% |
| Dreyfus Government Cash Management Fund, Institutional Shares - 5.25% (b) | |
| Morgan Stanley Institutional Liquidity Funds - Treasury Portfolio - Institutional Class - 5.22% (b) | |
| | |
| | |
|
|
| Total Investments — 93.7% | |
| | |
| Net Other Assets and Liabilities — 6.3% | |
| | |
Futures Contracts at December 31, 2023 (See Note 2C - Futures Contracts in the Notes to Consolidated Financial Statements):
| | | | | Unrealized
Appreciation
(Depreciation)/
Value |
| | | | | |
| | | | | |
| | | | | |
| | | | | |
| | | | | |
| | | | | |
Low Sulphur Gasoil “G” Futures | | | | | |
| | | | | |
| | | | | |
| | | | | |
| | | | | |
| | | | | |
| | | | | |
| | | | | |
Kansas City Hard Red Winter Wheat Futures | | | | | |
| | | | | |
| | | | | |
| | | | | |
See Notes to Consolidated Financial Statements
First Trust Alternative Absolute Return Strategy ETF (FAAR)Consolidated Portfolio of Investments (Continued)December 31, 2023 Futures Contracts at December 31, 2023 (Continued):
| | | | | Unrealized Appreciation (Depreciation)/ Value |
| | | | | |
| | | | | |
| | | | | |
| | | | | |
| | | | | |
Sugar #11 (World) Futures | | | | | |
| | | | | |
| | | | | |
| | | | | |
| |
| Rate shown reflects yield as of December 31, 2023. |
Valuation InputsA summary of the inputs used to value the Fund’s investments as of December 31, 2023 is as follows (see Note 2A - Portfolio Valuation in the Notes to Consolidated Financial Statements):
|
| | | Level 2
Significant
Observable
Inputs | Level 3
Significant
Unobservable
Inputs |
U.S. Government Bonds and Notes | | | | |
| | | | |
| | | | |
| | | | |
| | | | |
| | | | |
|
| | | Level 2
Significant
Observable
Inputs | Level 3
Significant
Unobservable
Inputs |
| | | | |
| Includes cumulative appreciation/depreciation on futures contracts as reported in the Futures Contracts table. Only the current day’s variation margin is presented on the Consolidated Statement of Assets and Liabilities. |
See Notes to Consolidated Financial Statements
First Trust Alternative Absolute Return Strategy ETF (FAAR)Consolidated Statement of Assets and Liabilities
December 31, 2023
| |
| |
Cash segregated as collateral for open futures contracts | |
| |
| |
| |
| |
| |
| |
|
| |
Investment advisory fees payable | |
| |
| |
|
| |
| |
| |
Accumulated distributable earnings (loss) | |
| |
NET ASSET VALUE, per share | |
Number of shares outstanding (unlimited number of shares authorized, par value $0.01 per share) | |
| |
See Notes to Consolidated Financial Statements
First Trust Alternative Absolute Return Strategy ETF (FAAR)Consolidated Statement of Operations
For the Year Ended December 31, 2023
| |
| |
| |
| |
|
| |
| |
| |
NET INVESTMENT INCOME (LOSS) | |
|
NET REALIZED AND UNREALIZED GAIN (LOSS): | |
Net realized gain (loss) on: | |
| |
| |
| |
Net change in unrealized appreciation (depreciation) on: | |
| |
| |
Net change in unrealized appreciation (depreciation) | |
NET REALIZED AND UNREALIZED GAIN (LOSS) | |
NET INCREASE (DECREASE) IN NET ASSETS RESULTING FROM OPERATIONS | |
See Notes to Consolidated Financial Statements
First Trust Alternative Absolute Return Strategy ETF (FAAR)Consolidated Statements of Changes in Net Assets
| | |
| | |
Net investment income (loss) | | |
| | |
Net change in unrealized appreciation (depreciation) | | |
Net increase (decrease) in net assets resulting from operations | | |
|
DISTRIBUTIONS TO SHAREHOLDERS FROM: | | |
| | |
|
SHAREHOLDER TRANSACTIONS: | | |
Proceeds from shares sold | | |
| | |
Net increase (decrease) in net assets resulting from shareholder transactions | | |
Total increase (decrease) in net assets | | |
|
| | |
| | |
| | |
|
CHANGES IN SHARES OUTSTANDING: | | |
Shares outstanding, beginning of period | | |
| | |
| | |
Shares outstanding, end of period | | |
See Notes to Consolidated Financial Statements
First Trust Alternative Absolute Return Strategy ETF (FAAR)Consolidated Financial Highlights
For a share outstanding throughout each period
| |
| | | | | |
Net asset value, beginning of period | | | | | |
Income from investment operations: | | | | | |
Net investment income (loss) | | | | | |
Net realized and unrealized gain (loss) | | | | | |
Total from investment operations | | | | | |
Distributions paid to shareholders from: | | | | | |
| | | | | |
Net asset value, end of period | | | | | |
| | | | | |
|
Ratios to average net assets/supplemental data: | | | | | |
Net assets, end of period (in 000’s) | | | | | |
Ratio of total expenses to average net assets | | | | | |
Ratio of net investment income (loss) to average net assets | | | | | |
Portfolio turnover rate (c) | | | | | |
| Based on average shares outstanding. |
| Total return is calculated assuming an initial investment made at the net asset value at the beginning of the period, reinvestment of all distributions at net asset value during the period, and redemption at net asset value on the last day of the period. The returns presented do not reflect the deduction of taxes that a shareholder would pay on Fund distributions or the redemption or sale of Fund shares. Total return is calculated for the time period presented and is not annualized for periods of less than a year. |
| Portfolio turnover is calculated for the time period presented and is not annualized for periods of less than a year and does not include securities received or delivered from processing creations or redemptions, derivatives and in-kind transactions. |
See Notes to Consolidated Financial Statements
Notes to Consolidated Financial Statements
First Trust Alternative Absolute Return Strategy ETF (FAAR)December 31, 2023 1. Organization
First Trust Exchange-Traded Fund VII (the “Trust”) is an open-end management investment company organized as a Massachusetts business trust on November 6, 2012, and is registered with the Securities and Exchange Commission (“SEC”) under the Investment Company Act of 1940, as amended (the “1940 Act”).
The Trust currently consists of two funds that are offering shares. This report covers the First Trust Alternative Absolute Return Strategy ETF (the “Fund”), a diversified series of the Trust, which trades under the ticker “FAAR” on Nasdaq, Inc. and commenced operations on May 18, 2016. Unlike conventional mutual funds, the Fund issues and redeems shares on a continuous basis, at net asset value (“NAV”), only in large blocks of shares known as “Creation Units.”
The Fund is an actively managed exchange-traded fund. The investment objective of the Fund seeks to provide investors with long-term total return. The Fund seeks to achieve long-term total return through long and short investments in exchange-traded commodity futures contracts (“Commodity Futures”) through a wholly-owned subsidiary of the Fund, FT Cayman Subsidiary III, organized under the laws of the Cayman Islands (the “Subsidiary”). The Fund does not invest directly in Commodity Futures. The Fund gains exposure to these investments exclusively by investing in the Subsidiary. The Fund will invest up to 25% of its total assets in the Subsidiary. As of December 31, 2023, the Fund invested 17.40% of the Fund’s total assets in the Subsidiary. There can be no assurance that the Fund will achieve its investment objective. The Fund may not be appropriate for all investors.
2. Significant Accounting Policies
The Fund is considered an investment company and follows accounting and reporting guidance under Financial Accounting Standards Board Accounting Standards Codification Topic 946, “Financial Services-Investment Companies.” The consolidated financial statements include the accounts on a consolidated basis of the Subsidiary. All intercompany accounts and transactions have been eliminated in consolidation. The following is a summary of significant accounting policies consistently followed by the Fund in the preparation of the consolidated financial statements. The preparation of the consolidated financial statements in accordance with accounting principles generally accepted in the United States of America (“U.S. GAAP”) requires management to make estimates and assumptions that affect the reported amounts and disclosures in the consolidated financial statements. Actual results could differ from those estimates.
A. Portfolio Valuation
The Fund’s NAV is determined daily as of the close of regular trading on the New York Stock Exchange (“NYSE”), normally 4:00 p.m. Eastern time, on each day the NYSE is open for trading. If the NYSE closes early on a valuation day, the NAV is determined as of that time. The Fund’s NAV is calculated by dividing the value of all assets of the Fund (including accrued interest and dividends), less all liabilities (including accrued expenses and dividends declared but unpaid), by the total number of shares outstanding.
The Fund’s investments are valued daily at market value or, in the absence of market value with respect to any portfolio securities, at fair value. Market value prices represent readily available market quotations such as last sale or official closing prices from a national or foreign exchange (i.e., a regulated market) and are primarily obtained from third-party pricing services. Fair value prices represent any prices not considered market value prices and are either obtained from a third-party pricing service or are determined by the Pricing Committee of the Fund’s investment advisor, First Trust Advisors L.P. (“First Trust” or the “Advisor”), in accordance with valuation procedures approved by the Trust’s Board of Trustees, and in accordance with provisions of the 1940 Act and rules thereunder. Investments valued by the Advisor’s Pricing Committee, if any, are footnoted as such in the footnotes to the Consolidated Portfolio of Investments. The Fund’s investments are valued as follows:
Exchange-traded futures contracts are valued at the end of the day settlement price.
U.S. Treasuries are valued on the basis of valuations provided by a third-party pricing service approved by the Trust’s Board of Trustees.
Shares of open-end funds are valued based on NAV per share.
If the Fund’s investments are not able to be priced by pre-established pricing methods, such investments may be valued by the Trust’s Board of Trustees or its delegate, the Advisor’s Pricing Committee, at fair value. A variety of factors may be considered in determining the fair value of such investments.
Notes to Consolidated Financial Statements (Continued)
First Trust Alternative Absolute Return Strategy ETF (FAAR)December 31, 2023 Valuing the Fund’s holdings using fair value pricing will result in using prices for those holdings that may differ from current market valuations. The Subsidiary’s holdings will be valued in the same manner as the Fund’s holdings.
The Fund is subject to fair value accounting standards that define fair value, establish the framework for measuring fair value and provide a three-level hierarchy for fair valuation based upon the inputs to the valuation as of the measurement date. The three levels of the fair value hierarchy are as follows:
• Level 1 – Level 1 inputs are quoted prices in active markets for identical investments. An active market is a market in which transactions for the investment occur with sufficient frequency and volume to provide pricing information on an ongoing basis.
• Level 2 – Level 2 inputs are observable inputs, either directly or indirectly, and include the following:
o Quoted prices for similar investments in active markets.
o Quoted prices for identical or similar investments in markets that are non-active. A non-active market is a market where there are few transactions for the investment, the prices are not current, or price quotations vary substantially either over time or among market makers, or in which little information is released publicly.
o Inputs other than quoted prices that are observable for the investment (for example, interest rates and yield curves observable at commonly quoted intervals, volatilities, prepayment speeds, loss severities, credit risks, and default rates).
o Inputs that are derived principally from or corroborated by observable market data by correlation or other means.
• Level 3 – Level 3 inputs are unobservable inputs. Unobservable inputs may reflect the reporting entity’s own assumptions about the assumptions that market participants would use in pricing the investment.
The inputs or methodologies used for valuing investments are not necessarily an indication of the risk associated with investing in those investments. A summary of the inputs used to value the Fund’s investments as of December 31, 2023, is included with the Fund’s Consolidated Portfolio of Investments.
B. Securities Transactions and Investment Income
Securities transactions are recorded as of the trade date. Realized gains and losses from securities transactions are recorded on the identified cost basis. Dividend income is recorded on the ex-dividend date. Interest income, if any, is recorded daily on the accrual basis. Amortization of premiums and accretion of discounts are recorded using the effective interest method.
C. Futures Contracts
The Fund, through the Subsidiary, may purchase and sell exchange-listed commodity contracts. When the Subsidiary purchases a listed futures contract, it agrees to purchase a specified reference asset (e.g., commodity) at a specified future date. When the Subsidiary sells or shorts a listed futures contract, it agrees to sell a specified reference asset (e.g., commodity) at a specified future date. The price at which the purchase and sale will take place is fixed when the Subsidiary enters into the contract. The exchange clearing corporation is the ultimate counterparty for all exchange-listed contracts, so credit risk is limited to the creditworthiness of the exchange’s clearing corporation. Margin deposits are posted as collateral with the clearing broker and, in turn, with the exchange clearing corporation. Open futures contracts can be closed out prior to settlement by entering into an offsetting transaction in a matching futures contract. If the Subsidiary is not able to enter into an offsetting transaction, the Subsidiary will continue to be required to maintain margin deposits on the futures contract. When the contract is closed or expires, the Subsidiary records a realized gain or loss equal to the difference between the value of the contract at the time it was opened and the value at the time it was closed or expired. This gain or loss is included in “Net realized gain (loss) on futures contracts” on the Consolidated Statement of Operations.
Exchange-listed commodity futures contracts are generally based upon commodities within the five principal commodity groups: energy, industrial metals, agriculture, precious metals, and livestock. The price of a commodity futures contract will reflect the storage costs of purchasing the physical commodity. These storage costs include the time value of money invested in the physical commodity plus the actual costs of storing the commodity less any benefits from ownership of the physical commodity that are not obtained by the holder of a futures contract (this is sometimes referred to as the “convenience yield”). To the extent that these storage costs change for an underlying commodity while the Subsidiary is in a long position on that commodity, the value of the futures contract may change proportionately.
Upon entering into a futures contract, the Subsidiary must deposit funds, called margin, with its custodian in the name of the clearing broker equal to a specified percentage of the current value of the contract. Open futures contracts are marked-to-market daily with the change in value recognized as a component of “Net change in unrealized appreciation (depreciation) on futures contracts” on the
Notes to Consolidated Financial Statements (Continued)
First Trust Alternative Absolute Return Strategy ETF (FAAR)December 31, 2023 Consolidated Statement of Operations. This daily fluctuation in value of the contracts is also known as variation margin and is included as “Variation margin” payable or receivable on the Consolidated Statement of Assets and Liabilities.
When the Subsidiary purchases or sells a futures contract, the Subsidiary is required to collateralize its position in order to limit the risk associated with the use of leverage and other related risks. To collateralize its position, the Subsidiary segregates assets consisting of cash or liquid securities that, when added to any amounts deposited with a futures commission merchant as margin, are equal to the unrealized depreciation of the futures contract or otherwise collateralize its position in a manner consistent with the 1940 Act or the 1940 Act Rules and SEC interpretations thereunder. As the Subsidiary continues to engage in the described securities trading practices and properly segregates assets, the segregated assets will function as a practical limit on the amount of leverage which the Subsidiary may undertake and on the potential increase in the speculative character of the Subsidiary’s outstanding portfolio investments. Additionally, such segregated assets generally ensure the availability of adequate funds to meet the obligations of the Subsidiary arising from such investment activities.
D. Cash
The Fund holds assets equal to or greater than the full notional exposure of the futures contracts. These assets may consist of cash and other short-term securities to comply with SEC guidance with respect to coverage of futures contracts by registered investment companies. At December 31, 2023, the Fund had restricted cash held of $8,314,160, which is included in “Cash segregated as collateral for open futures contracts” on the Consolidated Statement of Assets and Liabilities.
E. Dividends and Distributions to Shareholders
Dividends from net investment income of the Fund, if any, are declared and paid quarterly, or as the Board of Trustees may determine from time to time. Distributions of net realized capital gains earned by the Fund, if any, are distributed at least annually. The Fund may also designate a portion of the amount paid to redeeming shareholders as a distribution for tax purposes.
Distributions in cash may be reinvested automatically in additional whole shares only if the broker through whom the shares were purchased makes such option available. Such shares will generally be reinvested by the broker based upon the market price of those shares and investors may be subject to customary brokerage commissions charged by the broker.
Distributions from net investment income and realized capital gains are determined in accordance with federal income tax regulations, which may differ from U.S. GAAP. Certain capital accounts in the consolidated financial statements are periodically adjusted for permanent differences in order to reflect their tax character. These permanent differences are primarily due to the varying treatment of income and gain/loss on portfolio securities held by the Fund and have no impact on net assets or NAV per share. Temporary differences, which arise from recognizing certain items of income, expense and gain/loss in different periods for consolidated financial statement and tax purposes, will reverse at some time in the future.
The tax character of distributions paid during the fiscal years ended December 31, 2023 and 2022 was as follows:
As of December 31, 2023, the components of distributable earnings on a tax basis for the Fund were as follows:
Undistributed ordinary income | |
Accumulated capital and other gain (loss) | |
Net unrealized appreciation (depreciation) | |
F. Income Taxes
The Fund intends to continue to qualify as a regulated investment company by complying with the requirements under Subchapter M of the Internal Revenue Code of 1986, as amended (the “Code”), which includes distributing substantially all of its net investment income and net realized gains to shareholders. Accordingly, no provision has been made for federal and state income taxes. However, due to the timing and amount of distributions, the Fund may be subject to an excise tax of 4% of the amount by which approximately 98% of the Fund’s taxable income exceeds the distributions from such taxable income for the calendar year.
Notes to Consolidated Financial Statements (Continued)
First Trust Alternative Absolute Return Strategy ETF (FAAR)December 31, 2023 The Subsidiary is classified as a controlled foreign corporation under Subchapter N of the Code. Therefore, the Fund is required to increase its taxable income by its share of the Subsidiary’s income, whether or not such earnings are distributed by the Subsidiary to the Fund. Net investment losses of the Subsidiary cannot be deducted by the Fund in the current period nor carried forward to offset taxable income in future periods.
The Fund is subject to accounting standards that establish a minimum threshold for recognizing, and a system for measuring, the benefits of a tax position taken or expected to be taken in a tax return. The taxable years ended 2020, 2021, 2022, and 2023 remain open to federal and state audit. As of December 31, 2023, management has evaluated the application of these standards to the Fund and has determined that no provision for income tax is required in the Fund’s consolidated financial statements for uncertain tax positions.
The Fund intends to utilize provisions of the federal income tax laws, which allow it to carry a realized capital loss forward indefinitely following the year of the loss and offset such loss against any future realized capital gains. The Fund is subject to certain limitations under U.S. tax rules on the use of capital loss carryforwards and net unrealized built-in losses. These limitations apply when there has been a 50% change in ownership. At December 31, 2023, for federal income tax purposes, the Fund had $6,503 of non-expiring capital loss carryforwards available, to the extent provided by regulations, to offset future capital gains. To the extent that these loss carryforwards are used to offset future capital gains, it is probable that the capital gains so offset will not be distributed to the Fund’s shareholders.
In order to present paid-in capital and accumulated distributable earnings (loss) (which consists of accumulated net investment income (loss), accumulated net realized gain (loss) and net unrealized appreciation (depreciation)) on the Consolidated Statement of Assets and Liabilities that more closely represent their tax character, certain adjustments have been made to paid-in capital, accumulated net investment income (loss) and accumulated net realized gain (loss). These adjustments are primarily due to the difference between book and tax treatment of net investment income from the Subsidiary. The results of operations and net assets were not affected by these adjustments. For the fiscal year ended December 31, 2023, the adjustments for the Fund were as follows:
Accumulated
Net Investment
Income (Loss) | Accumulated
Net Realized
Gain (Loss) | |
| | |
As of December 31, 2023, the aggregate cost, gross unrealized appreciation, gross unrealized depreciation, and net unrealized appreciation/(depreciation) (including short positions and derivatives, if any) for federal income tax purposes were as follows:
| Gross Unrealized
Appreciation | Gross Unrealized
(Depreciation) | Net Unrealized
Appreciation
(Depreciation) |
| | | |
G. Expenses
Expenses, other than the investment advisory fee and other excluded expenses, are paid by the Advisor (see Note 3).
3. Investment Advisory Fee, Affiliated Transactions and Other Fee Arrangements
First Trust, the investment advisor to the Fund, is a limited partnership with one limited partner, Grace Partners of DuPage L.P., and one general partner, The Charger Corporation. The Charger Corporation is an Illinois corporation controlled by James A. Bowen, Chief Executive Officer of First Trust. First Trust is responsible for the selection and ongoing monitoring of the Fund’s and the Subsidiary’s investment portfolios, managing the Fund’s business affairs and providing certain administrative services necessary for the management of the Fund.
Pursuant to the Investment Management Agreement between the Trust and the Advisor, First Trust manages the investment of the Fund’s assets and is responsible for the Fund’s and the Subsidiary’s expenses, including the cost of transfer agency, custody, fund administration, legal, audit, and other services, but excluding fee payments under the Investment Management Agreement, interest, taxes, brokerage commissions and other expenses connected with the execution of portfolio transactions, distribution and service fees payable pursuant to a Rule 12b-1 plan, if any, and extraordinary expenses. The annual unitary management fee payable by the Fund to First Trust for these services will be reduced at certain levels of the Fund’s net assets (“breakpoints”) and calculated pursuant to the following schedule:
Notes to Consolidated Financial Statements (Continued)
First Trust Alternative Absolute Return Strategy ETF (FAAR)December 31, 2023
| |
Fund net assets up to and including $2.5 billion | |
Fund net assets greater than $2.5 billion up to and including $5 billion | |
Fund net assets greater than $5 billion up to and including $7.5 billion | |
Fund net assets greater than $7.5 billion up to and including $10 billion | |
Fund net assets greater than $10 billion | |
Prior to November 6, 2023, First Trust also provided fund reporting services to the Fund for a flat annual fee in the amount of $9,250, which was covered under the annual unitary management fee. The Subsidiary does not pay First Trust a separate management fee.
Effective November 6, 2023, the Trust has multiple service agreements with The Bank of New York Mellon (“BNYM”). Under the service agreements, BNYM performs custodial, fund accounting, certain administrative services, and transfer agency services for the Fund. As custodian, BNYM is responsible for custody of the Fund’s assets. As fund accountant and administrator, BNYM is responsible for maintaining the books and records of the Fund’s securities and cash. As transfer agent, BNYM is responsible for maintaining shareholder records for the Fund. BNYM is a subsidiary of The Bank of New York Mellon Corporation, a financial holding company.
Prior to November 6, 2023, the Trust had multiple service agreements with Brown Brothers Harriman & Co. (“BBH”). Under the service agreements, BBH performed custodial, fund accounting, certain administrative services, and transfer agency services for the Fund. As custodian, BBH was responsible for custody of the Fund’s assets. As fund accountant and administrator, BBH was responsible for maintaining the books and records of the Fund’s securities and cash. As transfer agent, BBH was responsible for maintaining shareholder records for the Fund.
Each Trustee who is not an officer or employee of First Trust, any sub-advisor or any of their affiliates (“Independent Trustees”) is paid a fixed annual retainer that is allocated equally among each fund in the First Trust Fund Complex. Each Independent Trustee is also paid an annual per fund fee that varies based on whether the fund is a closed-end or other actively managed fund, a target outcome fund or an index fund.
Additionally, the Lead Independent Trustee and the Chairs of the Audit Committee, Nominating and Governance Committee and Valuation Committee are paid annual fees to serve in such capacities, with such compensation allocated pro rata among each fund in the First Trust Fund Complex based on net assets. Independent Trustees are reimbursed for travel and out-of-pocket expenses in connection with all meetings. The Lead Independent Trustee and Committee Chairs rotate every three years. The officers and “Interested” Trustee receive no compensation from the Trust for acting in such capacities.
4. Purchases and Sales of Securities
The costs of purchases of U.S. Government securities and non-U.S. Government securities, excluding short-term investments, for the fiscal year ended December 31, 2023, were $67,837,315 and $0, respectively. The proceeds from sales and paydowns of U.S. Government securities and non-U.S. Government securities, excluding short-term investments, for the fiscal year ended December 31, 2023 were $0 and $0, respectively.
For the fiscal year ended December 31, 2023, the Fund had no in-kind transactions.
Notes to Consolidated Financial Statements (Continued)
First Trust Alternative Absolute Return Strategy ETF (FAAR)December 31, 2023 5. Derivative Transactions
The following table presents the types of derivatives held by the Subsidiary at December 31, 2023, the primary underlying risk exposure and the location of these instruments as presented on the Consolidated Statement of Assets and Liabilities.
| | | |
| | Consolidated
Statement of Assets and
Liabilities Location | | Consolidated
Statement of Assets and
Liabilities Location | |
| | Unrealized appreciation on futures contracts* | | Unrealized depreciation on futures contracts* | |
| Includes cumulative appreciation/depreciation on futures contracts as reported in the Fund’s Consolidated Portfolio of Investments. Only the current day’s variation margin is presented on the Consolidated Statement of Assets and Liabilities. |
The following table presents the amount of net realized gain (loss) and change in net unrealized appreciation (depreciation) recognized for the fiscal year ended December 31, 2023, on derivative instruments, as well as the primary underlying risk exposure associated with the instruments.
|
Consolidated Statement of Operations Location | |
| |
Net realized gain (loss) on futures contracts | |
Net change in unrealized appreciation (depreciation) on futures contracts | |
During the fiscal year ended December 31, 2023, the notional value of futures contracts opened and closed were $1,920,794,358 and $2,005,169,610, respectively.
The Fund does not have the right to offset financial assets and financial liabilities related to futures contracts on the Consolidated Statement of Assets and Liabilities.
6. Creations, Redemptions and Transaction Fees
The Fund generally issues and redeems its shares in primary market transactions through a creation and redemption mechanism and does not sell or redeem individual shares. Instead, financial entities known as “Authorized Participants” have contractual arrangements with the Fund or one of the Fund’s service providers to purchase and redeem Fund shares directly with the Fund in Creation Units. Prior to the start of trading on every business day, the Fund publishes through the National Securities Clearing Corporation the “basket” of securities, cash or other assets that it will accept in exchange for a Creation Unit of the Fund’s shares. An Authorized Participant that wishes to effectuate a creation of the Fund’s shares deposits with the Fund the “basket” of securities, cash or other assets identified by the Fund that day, and then receives the Creation Unit of the Fund’s shares in return for those assets. After purchasing a Creation Unit, the Authorized Participant may continue to hold the Fund’s shares or sell them in the secondary market. The redemption process is the reverse of the purchase process: the Authorized Participant redeems a Creation Unit of the Fund’s shares for a basket of securities, cash or other assets. The combination of the creation and redemption process with secondary market trading in the Fund’s shares and underlying securities provides arbitrage opportunities that are designed to help keep the market price of the Fund’s shares at or close to the NAV per share of the Fund.
The Fund imposes fees in connection with the purchase of Creation Units. These fees may vary based upon various fact-based circumstances, including, but not limited to, the composition of the securities included in the Creation Unit or the countries in which the transactions are settled. The price for each Creation Unit will equal the daily NAV per share of the Fund times the number of shares in a Creation Unit, plus the fees described above and, if applicable, any operational processing and brokerage costs, transfer fees, stamp taxes and part or all of the spread between the expected bid and offer side of the market related to the securities comprising the creation basket.
The Fund also imposes fees in connection with the redemption of Creation Units. These fees may vary based upon various fact-based circumstances, including, but not limited to, the composition of the securities included in the Creation Unit or the countries in which
Notes to Consolidated Financial Statements (Continued)
First Trust Alternative Absolute Return Strategy ETF (FAAR)December 31, 2023 the transactions are settled. The price received for each Creation Unit will equal the daily NAV per share of the Fund times the number of shares in a Creation Unit, minus the fees described above and, if applicable, any operational processing and brokerage costs, transfer fees, stamp taxes and part or all of the spread between the expected bid and offer side of the market related to the securities comprising the redemption basket. Investors who use the services of a broker or other such intermediary in addition to an Authorized Participant to effect a redemption of a Creation Unit may also be assessed an amount to cover the cost of such services. The redemption fee charged by the Fund will comply with Rule 22c-2 of the 1940 Act which limits redemption fees to no more than 2% of the value of the shares redeemed.
7. Distribution Plan
The Board of Trustees adopted a Distribution and Service Plan pursuant to Rule 12b-1 under the 1940 Act. In accordance with the Rule 12b-1 plan, the Fund is authorized to pay an amount up to 0.25% of its average daily net assets each year to reimburse First Trust Portfolios L.P. (“FTP”), the distributor of the Fund, for amounts expended to finance activities primarily intended to result in the sale of Creation Units or the provision of investor services. FTP may also use this amount to compensate securities dealers or other persons that are Authorized Participants for providing distribution assistance, including broker-dealer and shareholder support and educational and promotional services.
No 12b-1 fees are currently paid by the Fund, and pursuant to a contractual arrangement, no 12b-1 fees will be paid any time before April 30, 2025.
8. Indemnification
The Trust, on behalf of the Fund, has a variety of indemnification obligations under contracts with its service providers. The Trust’s maximum exposure under these arrangements is unknown. However, the Trust has not had prior claims or losses pursuant to these contracts and expects the risk of loss to be remote.
9. Subsequent Events
Management has evaluated the impact of all subsequent events on the Fund through the date the consolidated financial statements were issued and has determined that there were no subsequent events requiring recognition or disclosure in the consolidated financial statements that have not already been disclosed.
Report of Independent Registered Public Accounting Firm
To the Shareholders and the Board of Trustees of First Trust Exchange-Traded Fund VII:
Opinion on the Financial Statements and Financial Highlights
We have audited the accompanying consolidated statement of assets and liabilities, including the consolidated portfolio of investments, of First Trust Alternative Absolute Return Strategy ETF (the “Fund”), one of the funds constituting the First Trust Exchange-Traded Fund VII, as of December 31, 2023, the related consolidated statement of operations for the year then ended, the consolidated statements of changes in net assets for each of the two years in the period then ended, the consolidated financial highlights for each of the five years in the period then ended, and the related notes. In our opinion, the financial statements and financial highlights present fairly, in all material respects, the financial position of the Fund as of December 31, 2023, and the results of its operations for the year then ended, the changes in its net assets for each of the two years in the period then ended, and the financial highlights for each of the five years in the period then ended in conformity with accounting principles generally accepted in the United States of America.
Basis for Opinion
These financial statements and financial highlights are the responsibility of the Fund’s management. Our responsibility is to express an opinion on the Fund’s financial statements and financial highlights based on our audits. We are a public accounting firm registered with the Public Company Accounting Oversight Board (United States) (PCAOB) and are required to be independent with respect to the Fund in accordance with the U.S. federal securities laws and the applicable rules and regulations of the Securities and Exchange Commission and the PCAOB.
We conducted our audits in accordance with the standards of the PCAOB. Those standards require that we plan and perform the audit to obtain reasonable assurance about whether the financial statements and financial highlights are free of material misstatement, whether due to error or fraud. The Fund is not required to have, nor were we engaged to perform, an audit of its internal control over financial reporting. As part of our audits we are required to obtain an understanding of internal control over financial reporting but not for the purpose of expressing an opinion on the effectiveness of the Fund’s internal control over financial reporting. Accordingly, we express no such opinion.
Our audits included performing procedures to assess the risks of material misstatement of the financial statements and financial highlights, whether due to error or fraud, and performing procedures that respond to those risks. Such procedures included examining, on a test basis, evidence regarding the amounts and disclosures in the financial statements and financial highlights. Our audits also included evaluating the accounting principles used and significant estimates made by management, as well as evaluating the overall presentation of the financial statements and financial highlights. Our procedures included confirmation of securities owned as of December 31, 2023, by correspondence with the custodian and brokers; when replies were not received from brokers, we performed other auditing procedures. We believe that our audits provide a reasonable basis for our opinion.
/s/ Deloitte & Touche, LLP
Chicago, Illinois
February 23, 2024
We have served as the auditor of one or more First Trust investment companies since 2001.
First Trust Alternative Absolute Return Strategy ETF (FAAR)December 31, 2023 (Unaudited) Proxy Voting Policies and Procedures
A description of the policies and procedures that the Trust uses to determine how to vote proxies and information on how the Fund voted proxies relating to its portfolio securities during the most recent 12-month period ended June 30 is available (1) without charge, upon request, by calling (800) 988-5891; (2) on the Fund’s website at www.ftportfolios.com; and (3) on the Securities and Exchange Commission’s (“SEC”) website at www.sec.gov.
Portfolio Holdings
The Fund files portfolio holdings information for each month in a fiscal quarter within 60 days after the end of the relevant fiscal quarter on Form N-PORT. Portfolio holdings information for the third month of each fiscal quarter will be publicly available on the SEC’s website at www.sec.gov. The Fund’s complete schedule of portfolio holdings for the second and fourth quarters of each fiscal year is included in the semi-annual and annual reports to shareholders, respectively, and is filed with the SEC on Form N-CSR. The semi-annual and annual report for the Fund is available to investors within 60 days after the period to which it relates. The Fund’s Forms N-PORT and Forms N-CSR are available on the SEC’s website listed above.
Federal Tax Information
For the taxable year ended December 31, 2023, the following percentages of income dividends paid by the Fund qualify for the dividends received deduction available to corporations and are hereby designated as qualified dividend income:
Dividend Received Deduction | Qualified Dividend Income |
| |
Distributions paid to foreign shareholders during the Fund’s fiscal year ended December 31, 2023 that were properly designated by the Fund as “interest-related dividends” or “short-term capital gain dividends,” may not be subject to federal income tax provided that the income was earned directly by such foreign shareholders.
Risk Considerations
Risks are inherent in all investing. Certain general risks that may be applicable to a Fund are identified below, but not all of the material risks relevant to each Fund are included in this report and not all of the risks below apply to each Fund. The material risks of investing in each Fund are spelled out in its prospectus, statement of additional information and other regulatory filings. Before investing, you should consider each Fund’s investment objective, risks, charges and expenses, and read each Fund’s prospectus and statement of additional information carefully. You can download each Fund’s prospectus at www.ftportfolios.com or contact First Trust Portfolios L.P. at (800) 621-1675 to request a prospectus, which contains this and other information about each Fund.
Concentration Risk. To the extent that a fund is able to invest a significant percentage of its assets in a single asset class or the securities of issuers within the same country, state, region, industry or sector, an adverse economic, business or political development may affect the value of the fund’s investments more than if the fund were more broadly diversified. A fund that tracks an index will be concentrated to the extent the fund’s corresponding index is concentrated. A concentration makes a fund more susceptible to any single occurrence and may subject the fund to greater market risk than a fund that is more broadly diversified.
Credit Risk. Credit risk is the risk that an issuer of a security will be unable or unwilling to make dividend, interest and/or principal payments when due and the related risk that the value of a security may decline because of concerns about the issuer’s ability to make such payments.
Cyber Security Risk. The funds are susceptible to potential operational risks through breaches in cyber security. A breach in cyber security refers to both intentional and unintentional events that may cause a fund to lose proprietary information, suffer data corruption or lose operational capacity. Such events could cause a fund to incur regulatory penalties, reputational damage, additional compliance costs associated with corrective measures and/or financial loss. In addition, cyber security breaches of a fund’s third-party service providers, such as its administrator, transfer agent, custodian, or sub-advisor, as applicable, or issuers in which the fund invests, can also subject a fund to many of the same risks associated with direct cyber security breaches.
Defined Outcome Funds Risk. To the extent a fund’s investment strategy is designed to deliver returns tied to the price performance of an underlying ETF, an investor may not realize the returns the fund seeks to achieve if that investor does not hold shares for the
Additional Information (Continued)
First Trust Alternative Absolute Return Strategy ETF (FAAR)December 31, 2023 (Unaudited) entire target outcome period. In the event an investor purchases shares after the first day of the target outcome period or sells shares prior to the end of the target outcome period, the buffer that the fund seeks to provide against a decline in the value of the underlying ETF may not be available, the enhanced returns that the fund seeks to provide (if any) may not be available and the investor may not participate in a gain in the value of the underlying ETF up to the cap for the investor’s investment period. Additionally, the fund will not participate in gains of the underlying ETF above the cap and a shareholder may lose their entire investment. If the fund seeks enhanced returns, there are certain time periods when the value of the fund may fall faster than the value of the underlying ETF, and it is very unlikely that, on any given day during which the underlying ETF share price increases in value, the fund’s share price will increase at the same rate as the enhanced returns sought by the fund, which is designed for an entire target outcome period. Trading flexible exchange options involves risks different from, or possibly greater than, the risks associated with investing directly in securities, such as less liquidity and correlation and valuation risks. A fund may experience substantial downside from specific flexible exchange option positions and certain positions may expire worthless.
Derivatives Risk. To the extent a fund uses derivative instruments such as futures contracts, options contracts and swaps, the fund may experience losses because of adverse movements in the price or value of the underlying asset, index or rate, which may be magnified by certain features of the derivative. These risks are heightened when a fund’s portfolio managers use derivatives to enhance the fund’s return or as a substitute for a position or security, rather than solely to hedge (or offset) the risk of a position or security held by the fund.
Equity Securities Risk. To the extent a fund invests in equity securities, the value of the fund’s shares will fluctuate with changes in the value of the equity securities. Equity securities prices fluctuate for several reasons, including changes in investors’ perceptions of the financial condition of an issuer or the general condition of the relevant stock market, such as market volatility, or when political or economic events affecting the issuers occur. In addition, common stock prices may be particularly sensitive to rising interest rates, as the cost of capital rises and borrowing costs increase. Equity securities may decline significantly in price over short or extended periods of time, and such declines may occur in the equity market as a whole, or they may occur in only a particular country, company, industry or sector of the market.
ETF Risk. The shares of an ETF trade like common stock and represent an interest in a portfolio of securities. The risks of owning an ETF generally reflect the risks of owning the underlying securities, although lack of liquidity in an ETF could result in it being more volatile and ETFs have management fees that increase their costs. Shares of an ETF trade on an exchange at market prices rather than net asset value, which may cause the shares to trade at a price greater than net asset value (premium) or less than net asset value (discount). In times of market stress, decisions by market makers to reduce or step away from their role of providing a market for an ETF’s shares, or decisions by an ETF’s authorized participants that they are unable or unwilling to proceed with creation and/or redemption orders of an ETF’s shares, could result in shares of the ETF trading at a discount to net asset value and in greater than normal intraday bid-ask spreads.
Fixed Income Securities Risk. To the extent a fund invests in fixed income securities, the fund will be subject to credit risk, income risk, interest rate risk, liquidity risk and prepayment risk. Income risk is the risk that income from a fund’s fixed income investments could decline during periods of falling interest rates. Interest rate risk is the risk that the value of a fund’s fixed income securities will decline because of rising interest rates. Liquidity risk is the risk that a security cannot be purchased or sold at the time desired, or cannot be purchased or sold without adversely affecting the price. Prepayment risk is the risk that the securities will be redeemed or prepaid by the issuer, resulting in lower interest payments received by the fund. In addition to these risks, high yield securities, or “junk” bonds, are subject to greater market fluctuations and risk of loss than securities with higher ratings, and the market for high yield securities is generally smaller and less liquid than that for investment grade securities.
Index or Model Constituent Risk. Certain funds may be a constituent of one or more indices or ETF models. As a result, such a fund may be included in one or more index-tracking exchange-traded funds or mutual funds. Being a component security of such a vehicle could greatly affect the trading activity involving a fund, the size of the fund and the market volatility of the fund. Inclusion in an index could increase demand for the fund and removal from an index could result in outsized selling activity in a relatively short period of time. As a result, a fund’s net asset value could be negatively impacted and the fund’s market price may be significantly below its net asset value during certain periods. In addition, index rebalances may potentially result in increased trading activity in a fund’s shares.
Index Provider Risk. To the extent a fund seeks to track an index, it is subject to Index Provider Risk. There is no assurance that the Index Provider will compile the Index accurately, or that the Index will be determined, maintained, constructed, reconstituted, rebalanced, composed, calculated or disseminated accurately. To correct any such error, the Index Provider may carry out an
Additional Information (Continued)
First Trust Alternative Absolute Return Strategy ETF (FAAR)December 31, 2023 (Unaudited) unscheduled rebalance or other modification of the Index constituents or weightings, which may increase the fund’s costs. The Index Provider does not provide any representation or warranty in relation to the quality, accuracy or completeness of data in the Index, and it does not guarantee that the Index will be calculated in accordance with its stated methodology. Losses or costs associated with any Index Provider errors generally will be borne by the fund and its shareholders.
Investment Companies Risk. To the extent a fund invests in the securities of other investment vehicles, the fund will incur additional fees and expenses that would not be present in a direct investment in those investment vehicles. Furthermore, the fund’s investment performance and risks are directly related to the investment performance and risks of the investment vehicles in which the fund invests.
LIBOR Risk. To the extent a fund invests in floating or variable rate obligations that use the London Interbank Offered Rate (“LIBOR”) as a reference interest rate, it is subject to LIBOR Risk. The United Kingdom’s Financial Conduct Authority, which regulates LIBOR, has ceased making LIBOR available as a reference rate over a phase-out period that began December 31, 2021. There is no assurance that any alternative reference rate, including the Secured Overnight Financing Rate (“SOFR”) will be similar to or produce the same value or economic equivalence as LIBOR or that instruments using an alternative rate will have the same volume or liquidity. The unavailability or replacement of LIBOR may affect the value, liquidity or return on certain fund investments and may result in costs incurred in connection with closing out positions and entering into new trades. Any potential effects of the transition away from LIBOR on the fund or on certain instruments in which the fund invests can be difficult to ascertain, and they may vary depending on a variety of factors, and they could result in losses to the fund.
Management Risk. To the extent that a fund is actively managed, it is subject to management risk. In managing an actively-managed fund’s investment portfolio, the fund’s portfolio managers will apply investment techniques and risk analyses that may not have the desired result. There can be no guarantee that a fund will meet its investment objective.
Market Risk. Market risk is the risk that a particular security, or shares of a fund in general, may fall in value. Securities held by a fund, as well as shares of a fund itself, are subject to market fluctuations caused by factors such as general economic conditions, political events, regulatory or market developments, changes in interest rates and perceived trends in securities prices. Shares of a fund could decline in value or underperform other investments as a result of the risk of loss associated with these market fluctuations. In addition, local, regional or global events such as war, acts of terrorism, spread of infectious diseases or other public health issues, recessions, or other events could have a significant negative impact on a fund and its investments. Such events may affect certain geographic regions, countries, sectors and industries more significantly than others. In February 2022, Russia invaded Ukraine which has caused and could continue to cause significant market disruptions and volatility within the markets in Russia, Europe, and the United States. The hostilities and sanctions resulting from those hostilities could have a significant impact on certain fund investments as well as fund performance. The COVID-19 global pandemic and the ensuing policies enacted by governments and central banks have caused and may continue to cause significant volatility and uncertainty in global financial markets. While the U.S. has resumed “reasonably” normal business activity, many countries continue to impose lockdown measures. Additionally, there is no guarantee that vaccines will be effective against emerging variants of the disease. These events also adversely affect the prices and liquidity of a fund’s portfolio securities or other instruments and could result in disruptions in the trading markets. Any of such circumstances could have a materially negative impact on the value of a fund’s shares and result in increased market volatility. During any such events, a fund’s shares may trade at increased premiums or discounts to their net asset value and the bid/ask spread on a fund’s shares may widen.
Non-U.S. Securities Risk. To the extent a fund invests in non-U.S. securities, it is subject to additional risks not associated with securities of domestic issuers. Non-U.S. securities are subject to higher volatility than securities of domestic issuers due to: possible adverse political, social or economic developments; restrictions on foreign investment or exchange of securities; capital controls; lack of liquidity; currency exchange rates; excessive taxation; government seizure of assets; the imposition of sanctions by foreign governments; different legal or accounting standards; and less government supervision and regulation of exchanges in foreign countries. Investments in non-U.S. securities may involve higher costs than investments in U.S. securities, including higher transaction and custody costs, as well as additional taxes imposed by non-U.S. governments. These risks may be heightened for securities of companies located, or with significant operations, in emerging market countries.
Operational Risk. Each fund is subject to risks arising from various operational factors, including, but not limited to, human error, processing and communication errors, errors of a fund’s service providers, counterparties or other third-parties, failed or inadequate processes and technology or systems failures. Each fund relies on third-parties for a range of services, including custody. Any delay or failure relating to engaging or maintaining such service providers may affect a fund’s ability to meet its investment objective.
Additional Information (Continued)
First Trust Alternative Absolute Return Strategy ETF (FAAR)December 31, 2023 (Unaudited) Although the funds and the funds’ investment advisor seek to reduce these operational risks through controls and procedures, there is no way to completely protect against such risks.
Passive Investment Risk. To the extent a fund seeks to track an index, the fund will invest in the securities included in, or representative of, the index regardless of their investment merit. A fund generally will not attempt to take defensive positions in declining markets.
Preferred Securities Risk. Preferred securities combine some of the characteristics of both common stocks and bonds. Preferred securities are typically subordinated to bonds and other debt securities in a company’s capital structure in terms of priority to corporate income, subjecting them to greater credit risk than those debt securities. Generally, holders of preferred securities have no voting rights with respect to the issuing company unless preferred dividends have been in arrears for a specified number of periods, at which time the preferred security holders may obtain limited rights. In certain circumstances, an issuer of preferred securities may defer payment on the securities and, in some cases, redeem the securities prior to a specified date. Preferred securities may also be substantially less liquid than other securities, including common stock.
Valuation Risk. The valuation of certain securities may carry more risk than that of common stock. Uncertainties in the conditions of the financial markets, unreliable reference data, lack of transparency and inconsistency of valuation models and processes may lead to inaccurate asset pricing. A fund may hold investments in sizes smaller than institutionally sized round lot positions (sometimes referred to as odd lots). However, third-party pricing services generally provide evaluations on the basis of institutionally-sized round lots. If a fund sells certain of its investments in an odd lot transaction, the sale price may be less than the value at which such securities have been held by the fund. Odd lots often trade at lower prices than institutional round lots. There is no assurance that the fund will be able to sell a portfolio security at the price established by the pricing service, which could result in a loss to the fund.
NOT FDIC INSURED NOT BANK GUARANTEED MAY LOSE VALUE
Remuneration
First Trust Advisors L.P. (“First Trust”) is authorised and regulated by the U.S. Securities and Exchange Commission and is entitled to market shares of certain funds it manages, including First Trust Alternative Absolute Return Strategy ETF (the “Fund”), in certain member states in the European Economic Area in accordance with the cooperation arrangements in Article 42 of the Alternative Investment Fund Managers Directive (the “Directive”). First Trust is required under the Directive to make disclosures in respect of remuneration. The following disclosures are made in line with First Trust’s interpretation of currently available regulatory guidance on remuneration disclosures.
During the year ended December 31, 2023, the amount of remuneration paid (or to be paid) by First Trust Advisors L.P. in respect of the Funds is $331,427. This figure is comprised of $18,820 paid (or to be paid) in fixed compensation and $312,607 paid (or to be paid) in variable compensation. There were a total of 28 beneficiaries of the remuneration described above. Those amounts include $43,251 paid (or to be paid) to senior management of First Trust Advisors L.P. and $288,176 paid (or to be paid) to other employees whose professional activities have a material impact on the risk profiles of First Trust Advisors L.P. or the Funds (collectively, “Code Staff”).
Code Staff included in the aggregated figures disclosed above are rewarded in line with First Trust’s remuneration policy (the “Remuneration Policy”) which is determined and implemented by First Trust’s senior management. The Remuneration Policy reflects First Trust’s ethos of good governance and encapsulates the following principal objectives:
i.
to provide a clear link between remuneration and performance of First Trust and to avoid rewarding for failure;
ii.
to promote sound and effective risk management consistent with the risk profiles of the funds managed by First Trust; and
iii.
to remunerate staff in line with the business strategy, objectives, values and interests of First Trust and the funds managed by First Trust in a manner that avoids conflicts of interest.
First Trust assesses various risk factors which it is exposed to when considering and implementing remuneration for Code Staff and considers whether any potential award to such person(s) would give rise to a conflict of interest. First Trust does not reward failure, or consider the taking of risk or failure to take risk in its remuneration of Code Staff.
Additional Information (Continued)
First Trust Alternative Absolute Return Strategy ETF (FAAR)December 31, 2023 (Unaudited) First Trust assesses performance for the purposes of determining payments in respect of performance-related remuneration of Code Staff by reference to a broad range of measures including (i) individual performance (using financial and non-financial criteria), and (ii) the overall performance of First Trust. Remuneration is not based upon the performance of the Fund.
The elements of remuneration are balanced between fixed and variable and the senior management sets fixed salaries at a level sufficient to ensure that variable remuneration incentivises and rewards strong individual performance but does not encourage excessive risk taking.
No individual is involved in setting his or her own remuneration.
Board of Trustees and Officers
First Trust Alternative Absolute Return Strategy ETF (FAAR)December 31, 2023 (Unaudited) The following tables identify the Trustees and Officers of the Trust. Unless otherwise indicated, the address of all persons is 120 East Liberty Drive, Suite 400, Wheaton, IL 60187.
The Trust’s statement of additional information includes additional information about the Trustees and is available, without charge, upon request, by calling (800) 988-5891.
Name,
Year of Birth and
Position with the Trust | Term of Office
and Year First
Elected or
Appointed | Principal Occupations
During Past 5 Years | Number of
Portfolios in
the First Trust
Fund Complex
Overseen by
Trustee | Other
Trusteeships or
Directorships
Held by Trustee
During Past
5 Years |
|
Richard E. Erickson, Trustee
(1951) | • Indefinite Term • Since Inception | Retired; Physician, Edward-Elmhurst Medical Group (2021 to September 2023); Physician and Officer, Wheaton Orthopedics (1990 to 2021) | | |
Thomas R. Kadlec, Trustee
(1957) | • Indefinite Term • Since Inception | Retired; President, ADM Investors Services, Inc. (Futures Commission Merchant) (2010 to July 2022) | | Director, National Futures Association and ADMIS Singapore Ltd.; Formerly, Director of ADM Investor Services, Inc., ADM Investor Services International, ADMIS Hong Kong Ltd., and Futures Industry Association |
Denise M. Keefe, Trustee
(1964) | • Indefinite Term • Since 2021 | Executive Vice President, Advocate Aurora Health and President, Advocate Aurora Continuing Health Division (Integrated Healthcare System) | | Director and Board Chair of Advocate Home Health Services, Advocate Home Care Products and Advocate Hospice; Director and Board Chair of Aurora At Home (since 2018); Director of Advocate Physician Partners Accountable Care Organization; Director of RML Long Term Acute Care Hospitals; Director of Senior Helpers (since 2021); and Director of MobileHelp (since 2022) |
Robert F. Keith, Trustee
(1956) | • Indefinite Term • Since Inception | President, Hibs Enterprises (Financial and Management Consulting) | | Formerly, Director of Trust Company of Illinois |
Niel B. Nielson, Trustee
(1954) | • Indefinite Term • Since Inception | Senior Advisor (2018 to Present), Managing Director and Chief Operating Officer (2015 to 2018), Pelita Harapan Educational Foundation (Educational Products and Services) | | |
Bronwyn Wright, Trustee
(1971) | • Indefinite Term • Since 2023 | Independent Director to a number of Irish collective investment funds (2009 to Present); Various roles at international affiliates of Citibank (1994 to 2009), including Managing Director, Citibank Europe plc and Head of Securities and Fund Services, Citi Ireland (2007 to 2009) | | |
Board of Trustees and Officers (Continued)
First Trust Alternative Absolute Return Strategy ETF (FAAR)December 31, 2023 (Unaudited) Name, Year of Birth and Position with the Trust | Term of Office and Year First Elected or Appointed | Principal Occupations During Past 5 Years | Number of Portfolios in the First Trust Fund Complex Overseen by Trustee | Other Trusteeships or Directorships Held by Trustee During Past 5 Years |
|
James A. Bowen(1), Trustee,
Chairman of the Board
(1955) | • Indefinite Term • Since Inception | Chief Executive Officer, First Trust Advisors L.P. and First Trust Portfolios L.P., Chairman of the Board of Directors, BondWave LLC (Software Development Company) and Stonebridge Advisors LLC (Investment Advisor) | | |
| Position and
Offices
with Trust | Term of Office
and Length of
Service | Principal Occupations
During Past 5 Years |
|
| President and Chief Executive Officer | • Indefinite Term • Since 2016 | Managing Director and Chief Financial Officer, First Trust Advisors L.P. and First Trust Portfolios L.P.; Chief Financial Officer, BondWave LLC (Software Development Company) and Stonebridge Advisors LLC (Investment Advisor) |
| Treasurer, Chief Financial Officer and Chief Accounting Officer | • Indefinite Term • Since 2023 | Senior Vice President, First Trust Advisors L.P. and First Trust Portfolios L.P., July 2021 to Present. Previously, Vice President, First Trust Advisors L.P. and First Trust Portfolios L.P., 2014 - 2021. |
| Secretary and Chief Legal Officer | • Indefinite Term • Since Inception | General Counsel, First Trust Advisors L.P. and First Trust Portfolios L.P.; Secretary and General Counsel, BondWave LLC; Secretary, Stonebridge Advisors LLC |
Daniel J. Lindquist
(1970) | | • Indefinite Term • Since Inception | Managing Director, First Trust Advisors L.P. and First Trust Portfolios L.P. |
| Chief Compliance Officer and Assistant Secretary | • Indefinite Term • Since Inception | Deputy General Counsel, First Trust Advisors L.P. and First Trust Portfolios L.P. |
| | • Indefinite Term • Since Inception | Senior Vice President, First Trust Advisors L.P. and First Trust Portfolios L.P. |
| | • Indefinite Term • Since Inception | Senior Vice President, First Trust Advisors L.P. and First Trust Portfolios L.P. |
(1)
Mr. Bowen is deemed an “interested person” of the Trust due to his position as Chief Executive Officer of First Trust Advisors L.P., investment advisor of the Trust.
(2)
The term “officer” means the president, vice president, secretary, treasurer, controller or any other officer who performs a policy making function.
First Trust Alternative Absolute Return Strategy ETF (FAAR)December 31, 2023 (Unaudited) Privacy Policy
First Trust values our relationship with you and considers your privacy an important priority in maintaining that relationship. We are committed to protecting the security and confidentiality of your personal information.
Sources of Information
We collect nonpublic personal information about you from the following sources:
• Information we receive from you and your broker-dealer, investment professional or financial representative through interviews, applications, agreements or other forms;
• Information about your transactions with us, our affiliates or others;
• Information we receive from your inquiries by mail, e-mail or telephone; and
• Information we collect on our website through the use of “cookies.” For example, we may identify the pages on our website that your browser requests or visits.
Information Collected
The type of data we collect may include your name, address, social security number, age, financial status, assets, income, tax information, retirement and estate plan information, transaction history, account balance, payment history, investment objectives, marital status, family relationships and other personal information.
Disclosure of Information
We do not disclose any nonpublic personal information about our customers or former customers to anyone, except as permitted by law. In addition to using this information to verify your identity (as required under law), the permitted uses may also include the disclosure of such information to unaffiliated companies for the following reasons:
• In order to provide you with products and services and to effect transactions that you request or authorize, we may disclose your personal information as described above to unaffiliated financial service providers and other companies that perform administrative or other services on our behalf, such as transfer agents, custodians and trustees, or that assist us in the distribution of investor materials such as trustees, banks, financial representatives, proxy services, solicitors and printers.
• We may release information we have about you if you direct us to do so, if we are compelled by law to do so, or in other legally limited circumstances (for example to protect your account from fraud).
In addition, in order to alert you to our other financial products and services, we may share your personal information within First Trust.
Use of Website Analytics
We currently use third party analytics tools, Google Analytics and AddThis, to gather information for purposes of improving First Trust’s website and marketing our products and services to you. These tools employ cookies, which are small pieces of text stored in a file by your web browser and sent to websites that you visit, to collect information, track website usage and viewing trends such as the number of hits, pages visited, videos and PDFs viewed and the length of user sessions in order to evaluate website performance and enhance navigation of the website. We may also collect other anonymous information, which is generally limited to technical and web navigation information such as the IP address of your device, internet browser type and operating system for purposes of analyzing the data to make First Trust’s website better and more useful to our users. The information collected does not include any personal identifiable information such as your name, address, phone number or email address unless you provide that information through the website for us to contact you in order to answer your questions or respond to your requests. To find out how to opt-out of these services click on: Google Analytics and AddThis.
Confidentiality and Security
With regard to our internal security procedures, First Trust restricts access to your nonpublic personal information to those First Trust employees who need to know that information to provide products or services to you. We maintain physical, electronic and procedural safeguards to protect your nonpublic personal information.
Policy Updates and Inquiries
As required by federal law, we will notify you of our privacy policy annually. We reserve the right to modify this policy at any time, however, if we do change it, we will tell you promptly. For questions about our policy, or for additional copies of this notice, please go to www.ftportfolios.com, or contact us at 1-800-621-1675 (First Trust Portfolios) or 1-800-222-6822 (First Trust Advisors).
March 2023
First Trust Exchange-Traded Fund VII
INVESTMENT ADVISOR
First Trust Advisors L.P.
120 East Liberty Drive, Suite 400
Wheaton, IL 60187
ADMINISTRATOR, CUSTODIAN,
FUND ACCOUNTANT &
TRANSFER AGENT
The Bank of New York Mellon
240 Greenwich Street
New York, NY 10286
INDEPENDENT REGISTERED
PUBLIC ACCOUNTING FIRM
Deloitte & Touche LLP
111 South Wacker Drive
Chicago, IL 60606
LEGAL COUNSEL
Chapman and Cutler LLP
320 South Canal Street
Chicago, IL 60606
(b) Not applicable.
Item 2. Code of Ethics.
| (a) | The registrant, as of the end of the period covered by this report, has adopted a code of ethics that applies to the registrant’s principal executive officer, principal financial officer, principal accounting officer or controller, or persons performing similar functions, regardless of whether these individuals are employed by the registrant or a third party. |
| (c) | There have been no amendments, during the period covered by this report, to a provision of the code of ethics that applies to the registrant’s principal executive officer, principal financial officer, principal accounting officer or controller, or persons performing similar functions, regardless of whether these individuals are employed by the registrant or a third party, and that relates to any element of the code of ethics description. |
| (d) | The registrant, during the period covered by this report, has not granted any waivers, including an implicit waiver, from a provision of the code of ethics that applies to the registrant’s principal executive officer, principal financial officer, principal accounting officer or controller, or persons performing similar functions, regardless of whether these individuals are employed by the registrant or a third party, that relates to one or more of the items set forth in paragraph (b) of this item’s instructions. |
| (f) | A copy of the code of ethics that applies to the registrant’s principal executive officer, principal financial officer, principal accounting officer or controller is filed as an exhibit pursuant to Item 13(a)(1). |
Item 3. Audit Committee Financial Expert.
As of the end of the period covered by the report, the registrant’s board of trustees has determined that Thomas R. Kadlec, Robert F. Keith and Bronwyn Wright are qualified to serve as audit committee financial experts serving on its audit committee and that each of them is “independent,” as defined by Item 3 of Form N-CSR.
Item 4. Principal Accountant Fees and Services.
(a) Audit Fees (Registrant) — The aggregate fees billed for each of the last two fiscal years for professional services rendered by the principal accountant for the audit of the registrant’s annual financial statements or services that are normally provided by the accountant in connection with statutory and regulatory filings or engagements were $52,000 for the fiscal year ended December 31, 2022 and $58,000 for fiscal year ended December 31, 2023.
(b) Audit-Related Fees (Registrant) — The aggregate fees billed in each of the last two fiscal years for assurance and related services by the principal accountant that are reasonably related to the performance of the audit of the registrant’s financial statements and are not reported under paragraph (a) of this Item were $0 for the fiscal year ended December 31, 2022, and $0 for the fiscal year ended December 31, 2023.
Audit-Related Fees (Investment Advisor and Distributor) — The aggregate fees billed in each of the last two fiscal years for assurance and related services by the principal accountant that are reasonably related to the performance of the audit of the registrant’s financial statements and are not reported under paragraph (a) of this Item were $0 for the fiscal year ended December 31, 2022, and $0 for the fiscal year ended December 31, 2023.
(c) Tax Fees (Registrant) — The aggregate fees billed in each of the last two fiscal years for professional services rendered by the principal accountant for tax compliance, tax advice, and tax planning to the registrant were $28,000 for the fiscal year ended December 31, 2022 and $42,000 for fiscal year ended December 31, 2023. These fees were for tax consultation and/or tax return preparation.
Tax Fees (Investment Advisor and Distributor) — The aggregate fees billed in each of the last two fiscal years for professional services rendered by the principal accountant for tax compliance, tax advice, and tax planning to the registrant’s advisor and distributor were $0 for the fiscal year ended December 31, 2022, and $0 for the fiscal year ended December 31, 2023.
(d) All Other Fees (Registrant) — The aggregate fees billed in each of the last two fiscal years for products and services provided by the principal accountant to the registrant, other than the services reported in paragraphs (a) through (c) of this Item were $0 for the fiscal year ended December 31, 2022, and $0 for the fiscal year ended December 31, 2023.
All Other Fees (Investment Advisor and Distributor) — The aggregate fees billed in each of the last two fiscal years for products and services provided by the principal accountant to the registrant’s investment advisor and distributor, other than the services reported in paragraphs (a) through (c) of this Item were $0 for the fiscal year ended December 31, 2022, and $0 for the fiscal year ended December 31, 2023.
(e)(1) Disclose the audit committee’s pre-approval policies and procedures described in paragraph (c)(7) of Rule 2-01 of Regulation S-X.
Pursuant to its charter and its Audit and Non-Audit Services Pre-Approval Policy, the Audit Committee (the “Committee”) is responsible for the pre-approval of all audit services and permitted non-audit services (including the fees and terms thereof) to be performed for the registrant by its independent auditors. The Chairman of the Committee is authorized to give such pre-approvals on behalf of the Committee up to $25,000 and report any such pre-approval to the full Committee.
The Committee is also responsible for the pre-approval of the independent auditor’s engagements for non-audit services with the registrant’s advisor (not including a sub-advisor whose role is primarily portfolio management and is sub-contracted or overseen by another investment advisor) and any entity controlling, controlled by or under common control with the investment advisor that provides ongoing services to the registrant, if the engagement relates directly to the operations and financial reporting of the registrant, subject to the de minimis exceptions for non-audit services described in Rule 2-01 of Regulation S-X. If the independent auditor has provided non-audit services to the registrant’s advisor (other than any sub-advisor whose role is primarily portfolio management and is sub-contracted with or overseen by another investment advisor) and any entity controlling, controlled by or under common control with the investment advisor that provides ongoing services to the registrant that were not pre-approved pursuant to its policies, the Committee will consider whether the provision of such non-audit services is compatible with the auditor’s independence.
(e)(2) The percentage of services described in each of paragraphs (b) through (d) for the registrant and the registrant’s investment advisor of this Item that were approved by the audit committee pursuant to the pre-approval exceptions included in paragraph (c)(7)(i)(c) or paragraph (c)(7)(ii) of Rule 2-01 of Regulation S-X are as follows:
(b) 0%
(c) 0%
(d) 0%
(f) The percentage of hours expended on the principal accountant’s engagement to audit the registrant’s financial statements for the most recent fiscal year that were attributed to work performed by persons other than the principal accountant’s full-time, permanent employees was less than fifty percent.
(g) The aggregate non-audit fees billed by the registrant’s accountant for services rendered to the registrant, and rendered to the registrant’s investment advisor (not including any sub-advisor whose role is primarily portfolio management and is subcontracted with or overseen by another investment advisor), and any entity controlling, controlled by, or under common control with the advisor that provides ongoing services to the registrant for fiscal year ended December 31, 2022 were $28,000 for the registrant, $0 for the registrant’s investment advisor and $0 for the registrant’s distributor and for the registrant’s fiscal year ended December 31, 2023 were $42,000 for the registrant, $44,000 for the registrant’s investment advisor and $60,500 for the registrant’s distributor.
(h) The registrant’s audit committee of its Board of Trustees has determined that the provision of non-audit services that were rendered to the registrant’s investment advisor (not including any sub-advisor whose role is primarily portfolio management and is subcontracted with or overseen by another investment advisor), and any entity controlling, controlled by, or under common control with the investment advisor that provides ongoing services to the registrant that were not pre-approved pursuant to paragraph (c)(7)(ii) of Rule 2-01 of Regulation S-X is compatible with maintaining the principal accountant’s independence.
(i) Not applicable.
(j) Not applicable.
Items 5. Audit Committee of Listed Registrants.
The registrant has a separately designated standing audit committee established in accordance with Section 3(a)(58)(A) of the Securities Exchange Act of 1934 consisting of all the independent directors of the registrant. The audit committee of the registrant is comprised of: Richard E. Erickson, Thomas R. Kadlec, Denise M. Keefe, Robert F. Keith, Niel B. Nielson and Bronwyn Wright.
Item 6. Investments.
(a) Schedule of Investments in securities of unaffiliated issuers as of the close of the reporting period is included as part of the report to shareholders filed under Item 1 of this form.
(b) Not applicable.
Item 7. Disclosure of Proxy Voting Policies and Procedures for Closed-End Management Investment Companies.
Not applicable.
Item 8. Portfolio Managers of Closed-End Management Investment Companies.
Not applicable.
Item 9. Purchases of Equity Securities by Closed-End Management Investment Company and Affiliated Purchasers.
Not applicable.
Item 10. Submission of Matters to a Vote of Security Holders.
There have been no material changes to the procedures by which the shareholders may recommend nominees to the registrant’s board of directors, where those changes were implemented after the registrant last provided disclosure in response to the requirements of Item 407(c)(2)(iv) of Regulation S-K (17 CFR 229.407) (as required by Item 22(b)(15) of Schedule 14A (17 CFR 240.14a-101)), or this Item.
Item 11. Controls and Procedures.
(a) The registrant’s principal executive and principal financial officers, or persons performing similar functions, have concluded that the registrant’s disclosure controls and procedures (as defined in Rule 30a-3(c) under the Investment Company Act of 1940, as amended (the “1940 Act”) (17 CFR 270.30a-3 (c))) are effective, as of a date within 90 days of the filing date of the report that includes the disclosure required by this paragraph, based on their evaluation of these controls and procedures required by Rule 30a-3(b) under the 1940 Act (17 CFR 270.30a-3(b)) and Rules 13a-15(b) or 15d-15(b) under the Securities Exchange Act of 1934, as amended (17 CFR 240.13a-15(b) or 240.15d-15 (b)).
(b) There were no changes in the registrant’s internal control over financial reporting (as defined in Rule 30a-3(d) under the 1940 Act (17 CFR 270.30a-3(d)) that occurred during the period covered by this report that have materially affected, or are reasonably likely to materially affect, the registrant’s internal control over financial reporting.
Item 12. Disclosure of Securities Lending Activities for Closed-End Management Investment Companies.
Not applicable.
Item [18]. Recovery of Erroneously Awarded Compensation.
Not applicable.
Item 14 Exhibits.
SIGNATURES
Pursuant to the requirements of the Securities Exchange Act of 1934 and the Investment Company Act of 1940, the registrant has duly caused this report to be signed on its behalf by the undersigned, thereunto duly authorized.
| (registrant) | | First Trust Exchange-Traded Fund VII |
| By (Signature and Title)* | | /s/ James M. Dykas |
| | | James M. Dykas, President and Chief Executive Officer
(principal executive officer) |
Pursuant to the requirements of the Securities Exchange Act of 1934 and the Investment Company Act of 1940, this report has been signed below by the following persons on behalf of the registrant and in the capacities and on the dates indicated.
| By (Signature and Title)* | | /s/ James M. Dykas |
| | | James M. Dykas, President and Chief Executive Officer
(principal executive officer) |
| By (Signature and Title)* | | /s/ Derek D. Maltbie |
| | | Derek D. Maltbie, Treasurer, Chief Financial Officer
and Chief Accounting Officer
(principal financial officer) |
* Print the name and title of each signing officer under his or her signature.