![]()
Neuberger Berman | ||||
Annual Report November 30, 2021 | ||||
As permitted by regulations adopted by the U.S. Securities and Exchange Commission, paper copies of the Fund’s annual and semi-annual shareholder reports will no longer be sent by mail, unless you specifically request paper copies of the reports. Instead, the reports will be made available on the Fund’s website www.nb.com/CEFliterature, and you will be notified by mail each time a report is posted and provided with a website link to access the report.
If you already elected to receive shareholder reports electronically, you will not be affected by this change and you need not take any action. You may elect to receive shareholder reports and other communications from the Fund electronically anytime by contacting your financial intermediary (such as a broker-dealer or bank) or, if you are a direct investor, by calling 800.877.9700 or by sending an e-mail request to fundinfo@nb.com.
You may elect to receive all future reports in paper free of charge. If you invest through a financial intermediary, you can contact your financial intermediary to request that you continue to receive paper copies of your shareholder reports. If you invest directly with the Fund, you can call 800.877.9700 or send an email request to fundinfo@nb.com to inform the Fund that you wish to continue receiving paper copies of your shareholder reports. Your election to receive reports in paper will apply to all funds held in your account if you invest through your financial intermediary or all funds held with the fund complex if you invest directly with the Fund.
The “Neuberger Berman” name and logo and “Neuberger Berman Investment Advisers LLC” name are registered service marks of Neuberger Berman Group LLC. The individual Fund name in this piece is either a service mark or registered service mark of Neuberger Berman Investment Advisers LLC. ©2022 Neuberger Berman Investment Advisers LLC. All rights reserved.
Dear Stockholder,
I am pleased to present the annual report for Neuberger Berman MLP and Energy Income Fund Inc. (the Fund) for the 12 months ended November 30, 2021 (the reporting period). The report includes a portfolio commentary, a listing of the Fund’s investments, and its audited financial statements for the reporting period.
The Fund seeks to provide total return with an emphasis on cash distributions. The Fund remains committed to its investment strategy based on analysis of high-quality master limited partnerships and energy companies, with an emphasis on the midstream natural resources sector.
As previously communicated, on January 29, 2021, the Fund announced an increase in its monthly distribution rate to $0.0148 per share of common stock. On June 30, 2021, the Fund announced another increase in its monthly distribution rate to $0.0163 per share of common stock, representing an increase of approximately 10% from the prior monthly distribution rate of $0.0148 per share, and an overall increase of approximately 21% from the Fund’s monthly distribution rate of $0.01345 per share at the beginning of the reporting period. Neuberger Berman and the Fund’s Board of Directors continue to closely monitor market conditions and the Fund’s ability to generate distributable cash flow.
As previously communicated, in March of 2021, the Fund amended the terms of its credit facility to bring the amount of available debt financing in line with the Fund’s then-current asset level. Under the amended terms, the size of the Fund’s credit facility was increased from $50 million to $75 million, the commitment fee and spread-component of the interest rate were lowered and the duration of the credit facility was extended, among other changes. On November 19, 2021, the Fund announced that it further amended its credit facility to bring the amount of available debt financing in line with the Fund’s then-current asset level. Under the amended terms, the size of the Fund’s credit facility was increased from $75 million to $100 million.
Thank you for your confidence in the Fund. We will continue to do our best to retain your trust in the years to come.
Sincerely,

Joseph V. Amato
President and CEO
Neuberger Berman MLP and Energy Income Fund Inc.
1
Neuberger Berman MLP and Energy Income Fund Inc.
Portfolio Commentary (Unaudited)
Neuberger Berman MLP and Energy Income Fund Inc. (the Fund) produced a 54.03% total return on a net asset value (NAV) basis for the 12 months ended November 30, 2021 (the reporting period), outperforming its benchmark, the Alerian MLP Index (the Index), which posted a 38.75% total return for the same period. The use of leverage (typically a performance enhancer in up markets and a detractor during market retreats) contributed positively to the Fund’s performance during the reporting period. (Fund performance on a market price basis is provided in the table immediately following this commentary.)
During the reporting period, Energy led the market recovery as the top-performing sector within the S&P 500® Index. These stocks rallied as investors recognized strong underlying fundamentals alongside historically low stock prices. As COVID-19 vaccines became widely available and distributed in the developed world, demand for energy soared while supply remained constrained. Global oil demand currently exceeds supply by about one to two million barrels a day and storage levels in Cushing, OK, one of the world’s largest onshore oil storage and energy market hubs, are 26% below five-year averages. For 2022, OPEC forecasts a return to 2019 oil consumption levels.
Natural gas prices have rallied globally with growing demand. Natural gas storage levels in the U.S. and Europe dipped to five-year lows as usage soared during the peak summer season. Europe, for example, relies on imports and was forced into a bidding war with Asia for liquefied natural gas (LNG). In Asia, China appears to have an insatiable demand for natural gas as it aims to double the commodity’s share of its energy mix. In 2021, nearly 80% of new LNG supply was absorbed by China. The U.S. has a robust supply of natural gas and we believe the Fund’s midstream holdings (i.e., companies that provide essential services to move, store, and process energy) are poised to benefit as this supply is transported. In the U.S., natural gas remains the dominant source of electricity feedstock (raw material to make the product, in this case, electricity). Adding transportation infrastructure in certain regions of the U.S. is difficult and politically challenging, making the assets these midstream companies hold even more valuable, in our opinion.
Master Limited Partnership (MLP) share prices underperformed early in the pandemic, along with the broader Energy sector, but underlying fundamentals remained strong. Midstream companies generally reported consistent earnings even during early phases of the pandemic. During the reporting period, share prices for MLPs moved significantly higher and the Fund’s holdings overall outperformed the Index. We believe this is just the beginning of a closer alignment of fundamentals with share prices, which will benefit not only MLPs as a whole but particularly the high-quality companies the Fund seeks to invest in.
While the Fund’s exposure to renewable energy, which at the end of the reporting period was approximately 17% of net assets applicable to common stockholders, generated positive returns in aggregate but lagged the Index during the reporting period, we remain committed to the sector. We believe the Environmental, Social, and Governance (ESG) investing trend should favor investment in renewables and energy transition initiatives for decades to come, while the Biden Administration’s focus on infrastructure investment and climate change should also be supportive.
The Fund’s midstream holdings’ cash flows have remained steady and management teams have renewed financial flexibility to use excess cash flow for growth initiatives, debt reduction, share repurchases, and distributions. Higher quality midstream companies no longer rely on equity capital markets to fund capital expenditures and distribution coverage remains at an all-time high. We believe the potential for share buybacks and distribution increases will be significant catalysts in 2022 and beyond. In addition, as inflation concerns have grown, we believe the Fund is well positioned by owning hard assets with cash flow contracts typically indexed to yearly inflation adjustors.
2
While we anticipate periods of volatility, we believe that demand for energy around the world will continue to rise amid tight supply, benefiting the midstream companies positioned to meet the demand. We think the fundamentals of many midstream energy companies are strong and are likely to continue improving, which should make these companies sought after by investors seeking value, income and growth. We believe the Fund’s investments in renewables are also set to benefit over the longer term.
Sincerely,
Douglas Rachlin
Lead Portfolio Manager
Paolo Frattaroli
Portfolio Manager
The portfolio composition, industries and holdings of the Fund are subject to change without notice.
The opinions expressed are those of the Fund’s portfolio managers. The opinions are as of the date of this report and are subject to change without notice.
The value of securities owned by the Fund, as well as the market value of shares of the Fund’s common stock, may decline in response to certain events, including those directly involving the issuers whose securities are owned by the Fund; conditions affecting the general economy; overall market changes; local, regional, national or global political, social or economic instability; regulatory or legislative developments; price, currency and interest rate fluctuations, including those resulting from changes in central bank policies; and changes in investor sentiment.
3
MLP and Energy Income Fund Inc. (Unaudited)
| TICKER SYMBOL | |||
| MLP and Energy Income Fund Inc. | NML | ||
| PORTFOLIO BY TYPE OF INVESTMENT | |||
| (as a % of Total Investments*) | |||
| Common Stocks | 65.4 | % | |
| Master Limited Partnerships and Limited Partnerships | 34.6 | ||
| Total | 100.0 | % | |
| * | Does not include the impact of the Fund’s open positions in derivatives, if any. |
| PERFORMANCE HIGHLIGHTS | ||||||||||||||
| Average Annual Total Return Ended 11/30/2021 | ||||||||||||||
| Inception Date* | 1 Year | 5 Years | Life of Fund | |||||||||||
| At NAV | ||||||||||||||
| MLP and Energy Income Fund Inc.1 | 03/25/2013 | 54.03 | % | -2.05 | % | -4.99 | % | |||||||
| At Market Price | ||||||||||||||
| MLP and Energy Income Fund Inc.2 | 03/25/2013 | 59.28 | % | -4.96 | % | -7.96 | % | |||||||
| Index | ||||||||||||||
| Alerian MLP Index3 | 38.75 | % | -2.55 | % | -3.10 | % | ||||||||
| * | Date of initial public offering. The Fund commenced operations on March 28, 2013. |
Listed closed-end funds, unlike open-end funds, are not continually offered. Generally, there is an initial public offering and, once issued, shares of common stock of closed-end funds are sold in the secondary market on a stock exchange.
The performance data quoted represent past performance and do not indicate future results. Current performance may be lower or higher than the performance data quoted. For current performance data, please visit www.nb.com/cef-performance.
The results shown in the table reflect the reinvestment of income dividends and other distributions, if any. The results do not reflect the effect of taxes a stockholder would pay on Fund distributions or on the sale of shares of the Fund’s common stock.
The investment return and market price will fluctuate, and shares of the Fund’s common stock may trade at prices above or below NAV. Shares of the Fund’s common stock, when sold, may be worth more or less than their original cost.
| COMPARISON OF A $10,000 INVESTMENT | |
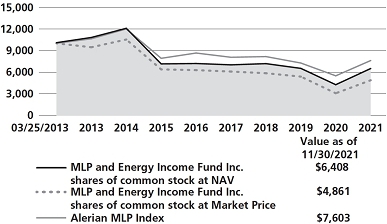 |
This graph shows the change in value of a hypothetical $10,000 investment in the Fund since the Fund’s inception. The graph is based on the Fund’s shares of common stock both at net asset value (NAV) and at market price. The Fund’s common stock may trade at market prices above or below NAV per share (see Performance Highlights chart). The result is compared with a broad-based market index. The market index has not been reduced to reflect any of the fees and costs of investing. The results shown in the graph reflect the reinvestment of income dividends and other distributions, if any, at prices obtained under the Fund’s Distribution Reinvestment Plan. The results do not reflect the effect of taxes a stockholder would pay on Fund distributions or on the sale of Fund shares. Results represent past performance and do not indicate future results.
4
MLP and Energy Income Fund Inc. (Unaudited)
Impact of the Fund’s Distribution Policy
The Fund has a practice of seeking to maintain a relatively stable level of distributions to common stockholders. In general, this practice does not affect the Fund’s investment strategy and may reduce the Fund’s NAV. Management believes the practice helps maintain the Fund’s competitiveness and may benefit the Fund’s market price and premium/discount to the Fund’s NAV per share. During the 12-month period ended November 30, 2021, the Fund made distributions to common stockholders totaling $0.18 per share, of which $0.18 will be treated as a return of capital for tax purposes.
Endnotes
| 1 | Returns based on the NAV of the Fund. |
| 2 | Returns based on the market price of shares of the Fund’s common stock on the NYSE American. |
| 3 | Please see “Description of Index” on page 6 for a description of the index. |
For more complete information on Neuberger Berman MLP and Energy Income Fund Inc., call Neuberger Berman Investment Advisers LLC (“NBIA”) at (877) 461-1899, or visit our website at www.nb.com.
5
Description of Index (Unaudited)
| Alerian MLP Index: | The index is a capped, float-adjusted, capitalization-weighted index that measures the performance of energy infrastructure Master Limited Partnerships (MLPs). The index’s constituents earn the majority of their cash flow from midstream activities involving energy commodities. The maximum constituent weight is capped at 10% at each quarterly rebalancing. Effective after market close on December 21, 2018, index constituents were required to have a minimum market cap of $75 million. Prior to this date, the index also included other non-infrastructure energy MLPs. |
Please note that the index does not take into account any fees and expenses or any tax consequences of investing in the individual securities that it tracks and that individuals cannot invest directly in any index. Data about the performance of this index are prepared or obtained by NBIA and include reinvestment of all income dividends and other distributions, if any. The Fund invests in securities not included in the above described index and generally does not invest in all securities included in the described index.
6
Schedule of Investments MLP and Energy Income Fund Inc.^
November 30, 2021
| NUMBER OF SHARES | VALUE | |||||||
| Common Stocks 77.6% | ||||||||
| Capital Markets 2.0% | ||||||||
| 32,000 | CME Group Inc. | $ | 7,056,640 | (a) | ||||
| Electric Utilities 2.5% | ||||||||
| 106,000 | NextEra Energy Inc. | 9,198,680 | (a) | |||||
| Equity Real Estate Investment Trusts 1.3% | ||||||||
| 25,000 | Crown Castle International Corp. | 4,541,250 | (a) | |||||
| Independent Power and Renewable Electricity Producers 15.7% | ||||||||
| 125,000 | Atlantica Sustainable Infrastructure PLC | 4,795,000 | (a) | |||||
| 416,000 | Clearway Energy Inc. | 15,525,120 | (a) | |||||
| 376,000 | NextEra Energy Partners LP | 31,978,800 | (a) | |||||
| 136,608 | Northland Power Inc. | 4,089,311 | ||||||
| 56,388,231 | ||||||||
| Multi-Utilities 11.0% | ||||||||
| 364,000 | CenterPoint Energy Inc. | 9,431,240 | (a) | |||||
| 200,000 | Dominion Energy Inc. | 14,240,000 | (a) | |||||
| 132,000 | Sempra Energy | 15,822,840 | (a) | |||||
| 39,494,080 | ||||||||
| Oil, Gas & Consumable Fuels 45.1% | ||||||||
| 475,000 | Antero Midstream Corp. | 4,612,250 | (a) | |||||
| 600,000 | Antero Resources Corp. | 10,536,000 | (a)* | |||||
| 150,000 | Cheniere Energy Inc. | 15,721,500 | (a)* | |||||
| 64,000 | ConocoPhillips | 4,488,320 | ||||||
| 320,000 | Coterra Energy Inc. | 6,425,600 | (a) | |||||
| 425,000 | ONEOK Inc. | 25,432,000 | (a) | |||||
| 1,016,000 | Targa Resources Corp. | 52,456,080 | (a) | |||||
| 150,000 | TC Energy Corp. | 7,036,500 | (a) | |||||
| 1,296,000 | Williams Cos Inc. | 34,719,840 | (a) | |||||
| 161,428,090 | ||||||||
| Total Common Stocks (Cost $197,145,973) | 278,106,971 | |||||||
| NUMBER OF UNITS | ||||||||
| Master Limited Partnerships and Limited Partnerships 41.1% | ||||||||
| Oil & Gas Storage & Transportation 39.8% | ||||||||
| 3,360,000 | Energy Transfer LP | 28,291,200 | (a) | |||||
| 2,176,000 | Enterprise Products Partners LP | 46,544,640 | (a) | |||||
| 300,000 | MPLX LP | 8,793,000 | (a) | |||||
| 336,000 | NuStar Energy LP | 4,704,000 | (a) | |||||
| 60,000 | Phillips 66 Partners LP | 2,066,400 | (a) | |||||
| 1,260,000 | Shell Midstream Partners LP | 14,364,000 | (a) | |||||
| 1,960,000 | Western Midstream Partners LP | 37,690,800 | (a) | |||||
| 142,454,040 | ||||||||
| Renewable Electricity 1.3% | ||||||||
| 130,000 | Brookfield Renewable Partners LP | 4,719,000 | (a) | |||||
| Total Master Limited Partnerships and Limited Partnerships (Cost $141,071,766) | 147,173,040 | |||||||
| See Notes to Financial Statements | 7 |
Schedule of Investments MLP and Energy Income Fund Inc.^ (cont’d)
| Total Investments 118.7% (Cost $338,217,739) | $ | 425,280,011 | ||||||
| Liabilities less other Assets (18.7)% | (67,135,846 | ) | ||||||
| Net Assets Applicable to Common Stockholders 100.0% | $ | 358,144,165 | ||||||
| * | Non-income producing security. |
| (a) | All or a portion of this security is pledged with the custodian in connection with the Fund’s loans payable outstanding. |
The following is a summary, categorized by Level (see Note A of Notes to Financial Statements), of inputs used to value the Fund’s investments as of November 30, 2021:
| Asset Valuation Inputs | ||||||||||||||||
| Investments: | Level 1 | Level 2 | Level 3 | Total | ||||||||||||
| Common Stocks(a) | $278,106,971 | $— | $— | $ | 278,106,971 | |||||||||||
| Master Limited Partnerships and Limited Partnerships(a) | 147,173,040 | — | — | 147,173,040 | ||||||||||||
| Total Investments | $425,280,011 | $— | $— | $ | 425,280,011 | |||||||||||
| (a) | The Schedule of Investments provides information on the industry categorization. |
| ^ | A balance indicated with a “—”, reflects either a zero balance or an amount that rounds to less than 1. |
| See Notes to Financial Statements | 8 |
Statement of Assets and Liabilities
Neuberger Berman
| MLP AND ENERGY INCOME FUND INC. | ||||
| November 30, 2021 | ||||
| Assets | ||||
| Investments in securities, at value* (Note A)—see Schedule of Investments: | ||||
| Unaffiliated issuers(a) | $425,280,011 | |||
| Dividends and interest receivable | 365,487 | |||
| Federal tax refunds receivable | 616,019 | |||
| Prepaid expenses and other assets | 5,153 | |||
| Total Assets | 426,266,670 | |||
| Liabilities | ||||
| Loans payable (Note A) | 66,600,000 | |||
| Due to custodian | 131,752 | |||
| Distributions payable—common stock | 16,094 | |||
| Payable to investment manager (Note B) | 277,650 | |||
| Payable to administrator (Note B) | 92,550 | |||
| Payable to directors | 7,320 | |||
| Interest payable (Note A) | 1,797 | |||
| Other accrued expenses and payables | 995,342 | |||
| Total Liabilities | 68,122,505 | |||
| Net Assets applicable to Common Stockholders | $358,144,165 | |||
| Net Assets applicable to Common Stockholders consist of: | ||||
| Paid-in capital—common stock | $735,896,899 | |||
| Total distributable earnings/(losses) | (377,752,734 | ) | ||
| Net Assets applicable to Common Stockholders | $358,144,165 | |||
| Shares of Common Stock Outstanding ($.0001 par value; 1,000,000,000 shares authorized) | 56,658,928 | |||
| Net Asset Value Per Share of Common Stock Outstanding | $6.32 | |||
| * Cost of Investments | ||||
| (a) Unaffiliated issuers | $338,217,739 | |||
| See Notes to Financial Statements | 9 |
Statement of Operations
Neuberger Berman
| MLP AND ENERGY INCOME FUND INC. | ||||
| For the Fiscal Year Ended November 30, 2021 | ||||
| Investment Income: | ||||
| Income (Note A): | ||||
| Dividend income—unaffiliated issuers | $20,200,572 | |||
| Return of capital on dividends from master limited partnerships and related companies | (17,698,339 | ) | ||
| Dividend income—unaffiliated issuers | 2,502,233 | |||
| Foreign taxes withheld | (110,306 | ) | ||
| Interest income—unaffiliated issuers | 80 | |||
| Total income | $2,392,007 | |||
| Expenses: | ||||
| Investment management fees (Note B) | 2,874,811 | |||
| Administration fees (Note B) | 958,270 | |||
| Audit fees | 189,040 | |||
| Custodian and accounting fees | 184,788 | |||
| Insurance | 9,373 | |||
| Legal fees | 169,052 | |||
| Stock exchange listing fees | 10,939 | |||
| Stockholder reports | 31,829 | |||
| Stock transfer agent fees | 18,096 | |||
| Interest (Note A) | 582,481 | |||
| Directors’ fees and expenses | 47,500 | |||
| Franchise and income tax | 1,704 | |||
| Miscellaneous | 4,142 | |||
| Total expenses | 5,082,025 | |||
| Net investment income/(loss) | $(2,690,018 | ) | ||
| Realized and Unrealized Gain/(Loss) on Investments (Note A): | ||||
| Net realized gain/(loss) on: | ||||
| Transactions in investment securities of unaffiliated issuers | 2,115,727 | |||
| Settlement of foreign currency transactions | (17,372 | ) | ||
| Change in net unrealized appreciation/(depreciation) in value of: | ||||
| Investment securities of unaffiliated issuers | 127,295,874 | |||
| Foreign currency translations | (15 | ) | ||
| Net gain/(loss) on investments | 129,394,214 | |||
| Net increase/(decrease) in net assets applicable to Common Stockholders resulting from operations | $126,704,196 | |||
| See Notes to Financial Statements | 10 |
Statements of Changes in Net Assets
Neuberger Berman
| MLP AND ENERGY INCOME FUND INC. | ||||||||
| Fiscal Year Ended November 30, 2021 | Fiscal Year Ended November 30, 2020 | |||||||
| Increase/(Decrease) in Net Assets Applicable to Common Stockholders: | ||||||||
| From Operations (Note A): | ||||||||
| Net investment income/(loss) | $(2,690,018 | ) | $(4,197,456 | ) | ||||
| Net realized gain/(loss) on investments | 2,098,355 | (115,763,140 | ) | |||||
| Change in net unrealized appreciation/(depreciation) of investments | 127,295,859 | (29,728,191 | ) | |||||
| Net increase/(decrease) in net assets applicable to Common Stockholders resulting from operations | 126,704,196 | (149,688,787 | ) | |||||
| Distributions to Common Stockholders From (Note A): | ||||||||
| Distributable earnings | — | — | ||||||
| Tax return of capital | (10,334,588 | ) | (18,264,004 | ) | ||||
| Total distributions to Common Stockholders | (10,334,588 | ) | (18,264,004 | ) | ||||
| Net Increase/(Decrease) in Net Assets Applicable to Common Stockholders | 116,369,608 | (167,952,791 | ) | |||||
| Net Assets Applicable to Common Stockholders: | ||||||||
| Beginning of year | 241,774,557 | 409,727,348 | ||||||
| End of year | $358,144,165 | $241,774,557 | ||||||
| See Notes to Financial Statements | 11 |
Statement of Cash Flows
Neuberger Berman
| MLP AND ENERGY INCOME FUND INC. | ||||
| For the Fiscal Year Ended November 30, 2021 | ||||
| Increase/(Decrease) in cash: | ||||
| Cash flows from operating activities: | ||||
| Net increase in net assets applicable to Common Stockholders resulting from operations | $126,704,196 | |||
| Adjustments to reconcile net increase in net assets applicable to Common Stockholders resulting from operations to net cash used in operating activities: | ||||
| Changes in assets and liabilities: | ||||
| Purchase of investment securities | (110,719,690 | ) | ||
| Proceeds from disposition of investment securities | 73,637,981 | |||
| Purchase/sale of short-term investment securities, net | 799,210 | |||
| Increase in dividends and interest receivable | (17,430 | ) | ||
| Increase in prepaid expenses and other assets | (1,131 | ) | ||
| Increase in payable to investment manager | 117,090 | |||
| Increase in payable to administrator | 39,030 | |||
| Decrease in payable to directors | (1,357 | ) | ||
| Increase in interest payable | 317 | |||
| Increase in other accrued expenses and payables | 559,468 | |||
| Return of capital on dividends | 17,698,339 | |||
| Unrealized appreciation on investment securities of unaffiliated issuers | (127,295,874 | ) | ||
| Net realized loss from transactions in investment securities of unaffiliated issuers | (2,115,727 | ) | ||
| Net cash provided by/(used in) operating activities | $(20,595,578 | ) | ||
| Cash flows from financing activities: | ||||
| Cash distributions paid on common stock | (10,336,174 | ) | ||
| Cash receipts from loan borrowings | 30,800,000 | |||
| Net cash provided by/(used in) financing activities | $20,463,826 | |||
| Net increase/(decrease) in cash | (131,752 | ) | ||
| Cash: | ||||
| Cash and restricted cash at beginning of year | — | |||
| Cash and restricted cash at the end of year | $(131,752 | ) | ||
| Supplemental disclosure: | ||||
| Cash paid for interest | $582,164 | |||
| See Notes to Financial Statements | 12 | |
Notes to Financial Statements Neuberger Berman MLP and Energy Income Fund Inc.
Note A—Summary of Significant Accounting Policies:
| 1 | General: Neuberger Berman MLP and Energy Income Fund Inc. (the “Fund”) was organized as a Maryland corporation on November 16, 2012 as a non-diversified, closed-end management investment company under the Investment Company Act of 1940, as amended (the “1940 Act”). The Fund’s Board of Directors (the “Board”) may classify or re-classify any unissued shares of capital stock into one or more classes of preferred stock without the approval of stockholders. | |
| A balance indicated with a “—”, reflects either a zero balance or a balance that rounds to less than 1. | ||
| The Fund is an investment company and accordingly follows the investment company accounting and reporting guidance of the Financial Accounting Standards Board (“FASB”) Accounting Standards Codification (“ASC”) Topic 946 “Financial Services – Investment Companies.” | ||
| The preparation of financial statements in accordance with U.S. generally accepted accounting principles (“GAAP”) requires Neuberger Berman Investment Advisers LLC (“Management” or “NBIA”) to make estimates and assumptions at the date of the financial statements. Actual results could differ from those estimates. | ||
| 2 | Portfolio valuation: In accordance with ASC 820 “Fair Value Measurement” (“ASC 820”), all investments held by the Fund are carried at the value that Management believes the Fund would receive upon selling an investment in an orderly transaction to an independent buyer in the principal or most advantageous market for the investment under current market conditions. Various inputs, including the volume and level of activity for the asset or liability in the market, are considered in valuing the Fund’s investments, some of which are discussed below. Significant Management judgment may be necessary to value investments in accordance with ASC 820. | |
| ASC 820 established a three-tier hierarchy of inputs to create a classification of value measurements for disclosure purposes. The three-tier hierarchy of inputs is summarized in the three broad Levels listed below. | ||
| ● | Level 1 – unadjusted quoted prices in active markets for identical investments | |
| ● | Level 2 – other observable inputs (including quoted prices for similar investments, interest rates, prepayment speeds, credit risk, amortized cost, etc.) | |
| ● | Level 3 – unobservable inputs (including the Fund’s own assumptions in determining the fair value of investments) | |
| The inputs or methodology used for valuing an investment are not necessarily an indication of the risk associated with investing in those securities. | ||
| The value of the Fund’s investments in equity securities (including master limited partnerships and limited partnerships), for which market quotations are readily available, is generally determined by Management by obtaining valuations from independent pricing services based on the latest sale price quoted on a principal exchange or market for that security (Level 1 inputs). Securities traded primarily on the NASDAQ Stock Market are normally valued at the NASDAQ Official Closing Price (“NOCP”) provided by NASDAQ each business day. The NOCP is the most recently reported price as of 4:00:02 p.m., Eastern Time, unless that price is outside the range of the “inside” bid and asked prices (i.e., the bid and asked prices that dealers quote to each other when trading for their own accounts); in that case, NASDAQ will adjust the price to equal the inside bid or asked price, whichever is closer. Because of delays in reporting trades, the NOCP may not be based on the price of the last trade to occur before the market closes. If there is no sale of a security on a particular day, the independent pricing services may value the security based on market quotations. | ||
13
| The value of the Fund’s investments in foreign securities is generally determined using the same valuation methods and inputs as other Fund investments, as discussed above. Foreign security prices expressed in local currency values are normally translated from the local currency into U.S. dollars using the exchange rates as of 4:00 p.m., Eastern Time on days the New York Stock Exchange (“NYSE”) is open for business. The Board has approved the use of ICE Data Services (“ICE”) to assist in determining the fair value of foreign equity securities when changes in the value of a certain index suggest that the closing prices on the foreign exchanges may no longer represent the amount that a Fund could expect to receive for those securities or on days when foreign markets are closed and U.S. markets are open. In each of these events, ICE will provide adjusted prices for certain foreign equity securities using a statistical analysis of historical correlations of multiple factors (Level 2 inputs). In the absence of precise information about the market values of these foreign securities as of the time as of which a Fund’s share price is calculated, the Board has determined on the basis of available data that prices adjusted or evaluated in this way are likely to be closer to the prices a Fund could realize on a current sale than are the prices of those securities established at the close of the foreign markets in which the securities primarily trade. | |
| Management has developed a process to periodically review information provided by independent pricing services for all types of securities. | |
| Investments in non-exchange traded investment companies with a readily determinable fair value are valued using the respective fund’s daily calculated net asset value (“NAV”) per share (Level 2 inputs). | |
| If a valuation is not available from an independent pricing service, or if Management has reason to believe that the valuation received does not represent the amount the Fund might reasonably expect to receive on a current sale in an orderly transaction, Management seeks to obtain quotations from brokers or dealers (generally considered Level 2 or Level 3 inputs depending on the number of quotes available). If such quotations are not readily available, the security is valued using methods the Fund’s Board has approved in the good-faith belief that the resulting valuation will reflect the fair value of the security. Inputs and assumptions considered in determining the fair value of a security based on Level 2 or Level 3 inputs may include, but are not limited to, the type of the security; the initial cost of the security; the existence of any contractual restrictions on the security’s disposition; the price and extent of public trading in similar securities of the issuer or of comparable companies; quotations or evaluated prices from broker-dealers and/or pricing services; information obtained from the issuer and/or analysts; an analysis of the company’s or issuer’s financial statements; an evaluation of the inputs that influence the issuer and the market(s) in which the security is purchased and sold. | |
| Fair value prices are necessarily estimates, and there is no assurance that such a price will be at or close to the price at which the security is next quoted or next trades. | |
| In December 2020, the Securities and Exchange Commission (“SEC”) adopted Rule 2a-5 under the 1940 Act, which establishes requirements for determining fair value in good faith for purposes of the 1940 Act, including related oversight and reporting requirements. The rule also defines when market quotations are “readily available” for purposes of the 1940 Act, which is the threshold for determining whether a fund must fair value a security. The rule became effective on March 8, 2021, however, the SEC adopted an eighteen-month transition period beginning from the effective date. Management is currently evaluating this guidance. | |
| 3 | Securities transactions and investment income: Securities transactions are recorded on trade date for financial reporting purposes. Dividend and distribution income is recorded on the ex-dividend date. Distributions received from the Fund’s investments in master limited partnerships or limited liability companies that have economic characteristics substantially similar to master limited partnerships (collectively, “MLPs”) generally are comprised of ordinary income and return of capital from the MLPs. The Fund allocates distributions between income and return of capital based on estimates made at the time such distributions are received. Such estimates are based on information provided by each MLP and other industry sources. These estimates may subsequently be revised based on actual allocations received from MLPs after their tax reporting periods are concluded, as the actual character of these distributions is not known until after the fiscal year end of the Fund. For the fiscal year ended November 30, 2021, the Fund estimated the allocation of investment income and return of capital for the distributions received from MLPs within the Statement of Operations to be approximately 12.4% as income and approximately 87.6% as return of capital. |
14
| Non-cash dividends included in dividend income, if any, are recorded at the fair market value of the securities received. Interest income, including accretion of discount (adjusted for original issue discount, where applicable), if any, is recorded on the accrual basis. Realized gains and losses from securities transactions are recorded on the basis of identified cost and stated separately in the Statement of Operations. | |
| 4 | Foreign currency translations: The accounting records of the Fund are maintained in U.S. dollars. Foreign currency amounts are normally translated into U.S. dollars using the exchange rate as of 4:00 p.m. Eastern Time, on days the NYSE is open for business, to determine the value of investments, other assets and liabilities. Purchase and sale prices of securities, and income and expenses, are translated into U.S. dollars at the prevailing rate of exchange on the respective dates of such transactions. Net unrealized foreign currency gain/(loss), if any, arises from changes in the value of assets and liabilities, other than investments in securities, as a result of changes in exchange rates and is stated separately in the Statement of Operations. |
| 5 | Income tax information: The Fund, as a corporation, is obligated to pay federal and state income tax on its taxable income. Currently, the highest regular marginal federal income tax rate for a corporation is 21%. |
| For federal income tax purposes, the estimated cost of investments held at November 30, 2021 was $260,263,129. The estimated gross unrealized appreciation was $177,629,908 and estimated gross unrealized depreciation was $11,407,520 resulting in net unrealized appreciation in value of investments of $166,222,388 based on cost for U.S. federal income tax purposes. | |
| The Fund invests a significant portion of its assets in MLPs, which generally are treated as partnerships for federal income tax purposes. As a limited partner in the MLPs, the Fund reports its allocable share of the MLP’s taxable income or loss in computing its own taxable income or loss. The Fund’s income tax expense or benefit is included in the Statement of Operations based on the component of income or gains (losses) to which such expense or benefit relates. Deferred income taxes reflect the net tax effects of temporary differences between the carrying amounts of assets and liabilities for financial reporting purposes and the amounts used for income tax purposes. A valuation allowance is recognized if, based on the weight of available evidence, it is more likely than not that some portion or all of the deferred income tax asset will not be realized. | |
| Components of the Fund’s deferred tax assets and liabilities as of November 30, 2021, are as follows: | |
| Deferred tax assets: | ||||
| Net operating loss carryforwards | $ | 46,413,999 | ||
| Capital loss carryforwards | 26,770,113 | |||
| Total deferred tax asset, before valuation allowance | 73,184,112 | |||
| Valuation allowance | (33,543,988 | ) | ||
| Net deferred tax asset, after valuation allowance | 39,640,124 | |||
| Deferred tax liabilities: | ||||
| Unrealized gains on investment securities | 39,640,124 | |||
| Total net deferred tax asset | $ | — | ||
15
| At November 30, 2021, a valuation allowance on deferred tax assets was deemed necessary because Management does not believe that it is more likely than not that the Fund will be able to recognize its deferred tax assets through future taxable income. The impact of any adjustments to the Fund’s estimates of future taxable income will be made in the same period that such determination is made. The Fund recognizes the tax benefits of uncertain tax positions only when the position is “more likely than not” to be sustained upon examination by the tax authorities based on the technical merits of the tax position. The Fund’s policy is to record interest and penalties on uncertain tax positions as part of tax expense. As of November 30, 2021, the Fund had no uncertain tax positions. | |
| Total income tax benefit differs from the amount computed by applying the federal statutory income tax rate of 21% to net investment loss and net realized and unrealized gains on investments for the fiscal year ended November 30, 2021, as follows: | |
| Application of statutory income tax rate | $ | 26,607,883 | ||
| State income tax benefit, net of federal tax benefit | 2,147,867 | |||
| Tax benefit on permanent items | (531,259 | ) | ||
| Valuation allowance | (28,224,491 | ) | ||
| Total income tax benefit | $ | — |
| Total income taxes are computed by applying the federal statutory rate plus a blended state income tax rate. | |
| Net operating loss carryforwards and capital loss carryforwards are available to offset future taxable income. The Fund has the following net operating loss carryforwards and capital loss carryforwards amounts: | |
| Fiscal Year Ended | Net Operating Loss Carryforwards | Expiration | ||||
| November 30, 2014 | $ | 67,380,785 | November 30, 2034 | |||
| November 30, 2016 | 35,502,250 | November 30, 2036 | ||||
| November 30, 2017 | 39,290,305 | November 30, 2037 | ||||
| November 30, 2018 | 28,172,155 | November 30, 2038 | ||||
| November 30, 2019 | 17,466,578 | Not Applicable | ||||
| November 30, 2021 | 16,698,283 | Not Applicable | ||||
| $ | 204,510,356 | |||||
| Fiscal Year Ended | Capital Loss Carryforwards | Expiration | ||||
| November 30, 2019 | $ | 10,808,793 | November 30, 2024 | |||
| November 30, 2020 | 107,146,257 | November 30, 2025 | ||||
| $ | 117,955,050 | |||||
| During the fiscal year ended November 30, 2021, the Fund utilized capital loss carryforwards of $5,360,559 and had capital loss carryforwards expire of $221,650,979. | |
| 6 | Distributions to common stockholders: The Fund has adopted a policy to pay common stockholders a stable monthly distribution. The Fund currently intends to pay distributions out of its distributable cash flow, which generally consists of cash and paid-in-kind distributions from MLPs or their affiliates, dividends from common stocks, interest from debt instruments and income from other investments held by the Fund less current or accrued operating expenses of the Fund, including taxes on Fund taxable income and leverage costs. Distributions to common stockholders relating to in-kind dividends or distributions received by the Fund on its investments will be paid in cash or additional shares of common stock. There is no assurance that the Fund will always be able to pay distributions of a particular size. The composition of the Fund’s distributions for the calendar year 2021 will be reported to Fund stockholders on IRS Form 1099-DIV. Distributions to common stockholders are recorded on the ex-date. |
16
| The Fund invests a significant portion of its assets in MLPs. The distributions the Fund receives from MLPs are generally composed of income and/or return of capital, but the MLPs do not report this information to the Fund until the following calendar year. At November 30, 2021, the Fund estimated these amounts within the financial statements since the information is not available from the MLPs until after the Fund’s fiscal year-end. For the fiscal year ended November 30, 2021, the character of distributions paid to stockholders disclosed within the Statement of Changes in Net Assets is based on estimates made at that time. All estimates are based upon MLP information sources available to the Fund. Based on past experience with MLPs, it is likely that a portion of the Fund’s distributions during the current year will be considered tax return of capital, but the actual amount of the tax return of capital, if any, is not determinable until after the Fund’s fiscal year-end. After calendar year-end, the Fund learns the nature of the distributions paid by MLPs during the previous year. After all applicable MLPs have informed the Fund of the actual breakdown of distributions paid to the Fund during its year, estimates previously recorded are adjusted on the books of the Fund to reflect actual results. As a result, the composition of the Fund’s distributions as reported herein may differ from the final composition determined after year-end and reported to Fund stockholders on IRS Form 1099-DIV. | |
| On November 30, 2021, the Fund declared a monthly distribution to common stockholders in the amount of $0.0163 per share, payable on December 31, 2021 to common stockholders of record on December 15, 2021, with an ex-date of December 14, 2021. Subsequent to November 30, 2021, the Fund declared a monthly distribution on December 31, 2021 to common stockholders in the amount of $0.0163 per share, payable on January 31, 2022, to common stockholders of record on January 18, 2022, with an ex-date of January 14, 2022. | |
| 7 | Expense allocation: Certain expenses are applicable to multiple funds within the complex of related investment companies. Expenses directly attributable to the Fund are charged to the Fund. Expenses borne by the complex of related investment companies, which includes open-end and closed-end investment companies for which NBIA serves as investment manager, that are not directly attributable to a particular investment company (e.g., the Fund) are allocated among the Fund and the other investment companies or series thereof in the complex on the basis of relative net assets, except where a more appropriate allocation of expenses to each of the investment companies or series thereof in the complex can otherwise be made fairly. |
| 8 | Financial leverage: In April 2015, the Fund entered into a $500 million secured, committed, margin facility with Société Générale, consisting of $300 million in committed floating-rate debt financing and $200 million in committed fixed-rate debt financing (the “Facility”). |
| On January 15, 2016, the Fund entered into an amendment to the credit agreement underlying the Facility (the “January Amendment”). The January Amendment waived prior compliance with, and amended certain terms relating to, the Fund’s levels of net assets and the covenant relating to distributions; amended certain other terms relating to margin requirements; and reduced the amount of permitted leverage. On March 31, 2016, the Fund entered into an additional amendment to the credit agreement underlying the Facility (the “March Amendment”). The March Amendment decreased the lender’s total commitment from $500 million to $200 million, bringing the amount of available debt financing in line with the Fund’s then-current asset level, and amended the terms of the commitment fees and duration of the floating-rate revolving portion of the Facility. On March 31, 2020, the Fund entered into an additional amendment to the credit agreement underlying the Facility (the “2020 Amendment”). The 2020 Amendment decreased the lender’s total commitment from $200 million to $50 million, bringing the amount of available debt financing in line with the Fund’s then-current asset level, and amended the terms of the commitment fees and duration of the floating-rate revolving portion of the Facility. The Fund paid $1,360,000 in breakage expenses/penalty fees in connection with the 2020 Amendment and repaid the outstanding amount of its fixed-rate loans. On March 31, 2021, the Fund entered into an additional amendment to the credit agreement underlying the Facility (the “March 2021 Amendment”). The March 2021 Amendment increased the lender’s total commitment from $50 million to $75 million, amended the terms of the commitment fee and spread-component of the interest rate, and extended the duration of the Facility, among other changes. On November 19, 2021, the Fund entered into an additional amendment to the credit agreement underlying the Facility (the “November 2021 Amendment”). The November 2021 Amendment further increased the lender’s total commitment from $75 million to $100 million, bringing the amount of available debt financing in line with the Fund’s then-current asset level. The Fund now has access to committed financing of up to $100 million in floating-rate revolving loans due March 28, 2024. Under the Facility, interest is charged on floating-rate loans based on an adjusted LIBOR rate and is payable on the last day of each interest period. |
17
| The Fund is required to pay a commitment fee under the Facility if the level of debt outstanding falls below a certain percentage. During the year ended November 30, 2021, the Fund was required to pay this commitment fee. The commitment fee is included in the Interest expense line item that is reflected in the Statement of Operations. Under the terms of the Facility, the Fund is also required to satisfy certain collateral requirements and maintain a certain level of net assets. | |
| During the year ended November 30, 2021, the average principal balance outstanding and average annualized interest rate under the Facility were approximately $54.7 million and 1.07%, respectively. At November 30, 2021, the principal balance outstanding under the Facility was $66.6 million. | |
| 9 | Concentration of risk: Under normal market conditions, the Fund invests in MLPs and other energy companies, many of which operate in the natural resources industry. The natural resources industry includes companies involved in: exploration and production, refining and marketing, mining, oilfield service, drilling, integrated natural gas midstream services, transportation and storage, shipping, electricity generation, distribution, development, gathering, processing and renewable resources. The focus of the Fund’s portfolio on a specific group of largely interrelated sectors may present more risks than if its portfolio were broadly diversified over numerous industries and sectors of the economy. A downturn in the natural resources industry would have a larger impact on the Fund than on an investment company that does not concentrate in such industry. |
| 10 | Indemnifications: Like many other companies, the Fund’s organizational documents provide that its officers (“Officers”) and directors (“Directors”) are indemnified against certain liabilities arising out of the performance of their duties to the Fund. In addition, both in some of its principal service contracts and in the normal course of its business, the Fund enters into contracts that provide indemnifications to other parties for certain types of losses or liabilities. The Fund’s maximum exposure under these arrangements is unknown as this could involve future claims against the Fund. |
| 11 | Other matters - Coronavirus: The outbreak of the novel coronavirus in many countries has, among other things, disrupted global travel and supply chains, and adversely impacted global commercial activity, the transportation industry and commodity prices in the energy sector. The impact of this virus has negatively affected and may continue to affect the economies of many nations, individual companies and the global securities and commodities markets, including liquidity and volatility. The development and fluidity of this situation precludes any prediction as to its ultimate impact, which may have a continued adverse effect on global economic and market conditions. Such conditions (which may be across industries, sectors or geographies) have impacted and may continue to impact the issuers of the securities held by the Fund. |
18
Note B—Investment Management Fees, Administration Fees, and Other Transactions with Affiliates:
| The Fund retains NBIA as its investment manager under a Management Agreement. For such investment management services, the Fund pays NBIA an investment management fee at an annual rate of 0.75% of the Fund’s average weekly Managed Assets. Managed Assets equal the total assets of the Fund, less liabilities other than the aggregate indebtedness entered into for purposes of leverage. | |
| The Fund retains NBIA as its administrator under an Administration Agreement. The Fund pays NBIA an administration fee at an annual rate of 0.25% of its average weekly Managed Assets under this agreement. Additionally, NBIA retains U.S. Bancorp Fund Services, LLC, d/b/a U.S. Bank Global Fund Services (“Fund Services”) as its sub-administrator under a Sub-Administration Agreement. NBIA pays Fund Services a fee for all services received under the Sub-Administration Agreement. |
Note C—Securities Transactions:
| During the year ended November 30, 2021, there were purchase and sale transactions of long-term securities of $110,719,691 and $73,637,981, respectively. | |
| During the year ended November 30, 2021, no brokerage commissions on securities transactions were paid to affiliated brokers. |
Note D—Recent Accounting Pronouncement:
| In January 2021, the FASB issued Accounting Standards Update No. 2021-01 (“ASU 2021-01”), “Reference Rate Reform (Topic 848)”. ASU 2021-01 is an update of ASU 2020-04, which is in response to concerns about structural risks of interbank offered rates, and particularly the risk of cessation of LIBOR, regulators have undertaken reference rate reform initiatives to identify alternative reference rates that are more observable or transaction based and less susceptible to manipulation. ASU 2020-04 provides optional guidance for a limited period of time to ease the potential burden in accounting for (or recognizing the effects of) reference rate reform on financial reporting. ASU 2020-04 is elective and applies to all entities, subject to meeting certain criteria, that have contracts, hedging relationships, and other transactions that reference LIBOR or another reference rate expected to be discontinued because of reference rate reform. The ASU 2021-01 update clarifies that certain optional expedients and exceptions in Topic 848 for contract modifications and hedge accounting apply to derivatives that are affected by the discounting transition. The amendments in this update are effective immediately through December 31, 2022, for all entities. Management is currently evaluating the implications, if any, of the additional requirements and its impact on the Fund’s financial statements. |
19
Financial Highlights
MLP and Energy Income Fund Inc.
The following table includes selected data for a share of common stock outstanding throughout each year and other performance information derived from the Financial Statements. Amounts that do not round to $0.01 or $(0.01) per share are presented as $0.00 or $(0.00), respectively. Ratios that do not round to 0.01% or (0.01)% are presented as 0.00% or (0.00)%, respectively. A “—” indicates that the line item was not applicable in the corresponding period.
| Year Ended November 30, | ||||||||||||||||||||
| 2021 | 2020 | 2019 | 2018 | 2017 | ||||||||||||||||
| Common Stock Net Asset Value, Beginning of Year | $ | 4.27 | $ | 7.23 | $ | 8.73 | $ | 9.19 | $ | 10.10 | ||||||||||
| Income From Investment Operations Applicable to Common Stockholders: | ||||||||||||||||||||
| Net Investment Income/(Loss)¢ | (0.05 | ) | (0.07 | ) | (0.15 | ) | (0.16 | ) | (0.19 | ) | ||||||||||
| Net Gains/(Losses) on Securities (both realized and unrealized) | 2.28 | (2.57 | ) | (0.69 | ) | 0.36 | (0.06 | ) | ||||||||||||
| Total From Investment Operations Applicable to Common Stockholders | 2.23 | (2.64 | ) | (0.84 | ) | 0.20 | (0.25 | ) | ||||||||||||
| Less Distributions to Common Stockholders From: | ||||||||||||||||||||
| Net Investment Income | — | — | — | (0.54 | ) | — | ||||||||||||||
| Tax Return of Capital | (0.18 | ) | (0.32 | ) | (0.66 | ) | (0.12 | ) | (0.66 | ) | ||||||||||
| Total Distributions to Common Stockholders | (0.18 | ) | (0.32 | ) | (0.66 | ) | (0.66 | ) | (0.66 | ) | ||||||||||
| Common Stock Net Asset Value, End of Year | $ | 6.32 | $ | 4.27 | $ | 7.23 | $ | 8.73 | $ | 9.19 | ||||||||||
| Common Stock Market Value, End of Year | $ | 5.02 | $ | 3.28 | $ | 6.32 | $ | 7.53 | $ | 8.44 | ||||||||||
| Total Return, Common Stock Net Asset Value† | 54.03 | % | (35.28 | )% | (9.22 | )% | 2.43 | % | (2.62 | )% | ||||||||||
| Total Return, Common Stock Market Value† | 59.28 | % | (43.13 | )% | (8.11 | )% | (3.80 | )% | (3.19 | )% | ||||||||||
| Supplemental Data/Ratios | ||||||||||||||||||||
| Net Assets Applicable to Common Stockholders, End of Year (in millions) | $ | 358.1 | $ | 241.8 | $ | 409.7 | $ | 494.4 | $ | 520.7 | ||||||||||
| Ratios are Calculated Using Average Net Assets Applicable to Common Stockholders | ||||||||||||||||||||
| Ratio of Expenses Including Deferred Income Tax (Benefit)/Expense# | 1.55 | % | 2.77 | % | 2.75 | % | 2.44 | % | 2.29 | % | ||||||||||
| Ratio of Expenses Excluding Deferred Income Tax (Benefit)/Expense | 1.55 | % | 2.77 | % | 2.75 | % | 2.55 | % | 2.29 | % | ||||||||||
| Ratio of Net Investment Income/(Loss) Including Deferred Income Tax Benefit/(Expense)# | (0.82 | )% | (1.62 | )% | (2.27 | )% | (1.69 | )% | (1.79 | )% | ||||||||||
| Ratio of Net Investment Income/(Loss) Excluding Deferred Income Tax Benefit/(Expense) | (0.82 | )% | (1.62 | )% | (2.27 | )% | (1.80 | )% | (1.79 | )% | ||||||||||
| Portfolio Turnover Rate | 20 | % | 41 | % | 29 | % | 35 | % | 15 | % | ||||||||||
| Loans Payable (in millions) | $ | 66.6 | $ | 35.8 | $ | 145.0 | $ | 161.0 | $ | 161.0 | ||||||||||
| Asset Coverage Per $1,000 of Loans Payable, End of YearØ | $ | 6,378 | $ | 7,754 | $ | 3,826 | $ | 4,234 | $ | 4,234 | ||||||||||
| See Notes to Financial Highlights | 20 |
Notes to Financial Highlights MLP and Energy Income Fund Inc.
| ¢ | Calculated based on the average number of shares of common stock outstanding during each fiscal period. |
| † | Total return based on per share NAV reflects the effects of changes in NAV on the performance of the Fund during each fiscal period. Total return based on per share market value assumes the purchase of shares of common stock at the market price on the first day and sale of common stock at the market price on the last day of the period indicated. Distributions, if any, are assumed to be reinvested at prices obtained under the Fund’s distribution reinvestment plan. Results represent past performance and do not indicate future results. Current returns may be lower or higher than the performance data quoted. Investment returns will fluctuate and shares of common stock when sold may be worth more or less than original cost. |
| # | For the years ended November 30, 2021, November 30, 2020, November 30, 2019, November 30, 2018, and November 30, 2017, the Fund accrued $0, $0, $0, $616,019, and $0, respectively, for net deferred income tax benefit. |
| Ø | Calculated by subtracting the Fund’s total liabilities (excluding loans payable and accumulated unpaid interest on loans payable) from the Fund’s total assets and dividing by the outstanding loans payable balance. |
21
Report of Independent Registered Public Accounting Firm
To the Stockholders and Board of Directors of
Neuberger Berman MLP and Energy Income Fund Inc.
Opinion on the Financial Statements
We have audited the accompanying statement of assets and liabilities of Neuberger Berman MLP and Energy Income Fund Inc. (the “Fund”), including the schedule of investments, as of November 30, 2021 and the related statements of operations and cash flows for the year then ended, the statements of changes in net assets for each of the two years in the period then ended, the financial highlights for each of the five years in the period then ended and the related notes (collectively referred to as the “financial statements”). In our opinion, the financial statements present fairly, in all material respects, the financial position of the Fund at November 30, 2021, the results of its operations and its cash flows for the year then ended, the changes in its net assets for each of the two years in the period then ended and its financial highlights for each of the five years in the period then ended, in conformity with U.S. generally accepted accounting principles.
Basis for Opinion
These financial statements are the responsibility of the Fund’s management. Our responsibility is to express an opinion on the Fund’s financial statements based on our audits. We are a public accounting firm registered with the Public Company Accounting Oversight Board (United States) (“PCAOB”) and are required to be independent with respect to the Fund in accordance with the U.S. federal securities laws and the applicable rules and regulations of the Securities and Exchange Commission and the PCAOB.
We conducted our audits in accordance with the standards of the PCAOB. Those standards require that we plan and perform the audit to obtain reasonable assurance about whether the financial statements are free of material misstatement, whether due to error or fraud. The Fund is not required to have, nor were we engaged to perform, an audit of the Fund’s internal control over financial reporting. As part of our audits, we are required to obtain an understanding of internal control over financial reporting, but not for the purpose of expressing an opinion on the effectiveness of the Fund’s internal control over financial reporting. Accordingly, we express no such opinion.
Our audits included performing procedures to assess the risks of material misstatement of the financial statements, whether due to error or fraud, and performing procedures that respond to those risks. Such procedures included examining, on a test basis, evidence regarding the amounts and disclosures in the financial statements. Our procedures included confirmation of securities owned as of November 30, 2021, by correspondence with the custodian. Our audits also included evaluating the accounting principles used and significant estimates made by management, as well as evaluating the overall presentation of the financial statements. We believe that our audits provide a reasonable basis for our opinion.

We have served as the auditor of one or more Neuberger Berman investment companies since 1954.
Boston, Massachusetts
January 27, 2022
22
Fund Investment Objective, Policies and Risks
Investment Objective and Policies
The Fund’s investment objective is to seek total return with an emphasis on cash distributions. There is no assurance that the Fund will achieve its investment objective.
Under normal market conditions, the Fund invests at least 80% of its total assets in master limited partnerships (“MLPs”) or energy companies (the “80% policy”). For purposes of the 80% policy, the Fund’s MLP investments may include, but are not limited to, MLPs structured as limited partnerships (“LPs”) or limited liability companies (“LLCs”); MLPs that are organized as LPs or LLCs, but taxed as “C” corporations; equity securities that represent an indirect interest in an MLP issued by an MLP affiliate, including institutional units and MLP general partner (“GP”) or managing member interests; “C” corporations whose predominant assets are interests in MLPs; MLP equity securities, including MLP common units, MLP subordinated units, MLP convertible subordinated units and MLP preferred units; private investments in public equities issued by MLPs; MLP debt securities; and other U.S. and non-U.S. equity and fixed income securities and derivative instruments that provide exposure to the MLP market, including pooled investment vehicles that primarily hold MLP interests and exchange-traded notes. Under the 80% policy, the Fund’s energy investments other than MLPs may include equity and fixed income securities of U.S. and non-U.S. companies that (i) operate within the oil and gas storage, transportation, refining, marketing, equipment and services, drilling, exploration or production sub-industries or (ii) have at least 50% of their assets, income, sales or profits committed to, or derived from, the exploration, development, production, gathering, transportation (including marine), transmission, terminal operation, processing, storage, refining, distribution, mining or marketing of natural gas, natural gas liquids (including propane), crude oil, refined petroleum products, electricity or other energy sources, including renewable energy, energy-related equipment or services. The Fund is non-diversified under the Investment Company Act of 1940, as amended (the “1940 Act”), and thus may invest a greater percentage of its assets in a single issuer than a diversified fund. The Fund’s investment objective and 80% policy are not fundamental and may be changed by the Fund’s Board of Directors without stockholder approval, however stockholders would be provided at least 60 days’ notice of any changes.
The Fund may invest up to 20% of its total assets in income-producing securities of non-MLP or energy-related issuers, such as common and preferred equity securities. The Fund may also invest in securities and other instruments issued by U.S. and Canadian income and royalty trusts and other issuers.
The Fund’s investments in MLPs are expected to emphasize companies that the portfolio managers believe have growth potential and operate in the midstream natural resources sector. These MLPs are anticipated to have 1) stable and reliable cash flows, 2) low correlation to commodity prices, and 3) multi-year contracts that charge flat fees to produce steady payments. Companies that are primarily engaged in activities such as the transportation, storage, gathering and processing of natural resources are generally referred to as midstream MLPs. While the Fund expects to emphasize midstream MLP investments, the Fund may invest in other sectors of the natural resources industry (including companies engaged in “upstream” or “downstream” production activities) or in non-energy securities. Furthermore, the Fund may selectively invest in non-MLP long positions in companies involved in any aspect of the natural resources industry. The natural resources industry includes companies involved in: exploration and production, refining and marketing, oilfield service, drilling, integrated natural gas midstream services, transportation and storage, shipping, electricity generation and distribution and renewable resources.
In pursuing the Fund’s investment objective, the portfolio managers intend to focus on midstream MLP investments and energy companies that they believe have the ability to provide attractive total return and cash distributions. In doing so, the portfolio managers expect to emphasize securities that they believe have an attractive risk/return profile and low correlation to interest rate fluctuations.
23
Because of its concentration in MLP investments, the Fund is not eligible to be a regulated investment company under the Internal Revenue Code of 1986, as amended. Accordingly, the Fund is treated as a taxable regular corporation, or so-called “C” corporation, for federal tax purposes. As a result, the Fund is subject to federal income tax on its taxable income at the graduated rates applicable to corporations (currently at a maximum rate of 21%) as well as state and local income taxes. The investment strategy of investing a substantial portion of its total assets in MLPs—and thus being treated as a “C” corporation, rather than as a regulated investment company, for federal income tax purposes—involves complicated and in some cases unsettled accounting, tax and net asset and share valuation aspects that cause the Fund to differ significantly from most other closed-end registered investment companies. This may result in unexpected and potentially significant accounting, tax and valuation consequences for the Fund and for its common stockholders. In addition, accounting, tax and valuation practices in this area are still developing, and there may not always be a clear consensus among industry participants as to the most appropriate approach. This may result in changes over time in the practices applied by the Fund, which, in turn, could have material adverse consequences on the Fund and its common stockholders.
The Fund uses leverage to pursue its investment objective. The Fund currently utilizes leverage through a secured credit facility, and may borrow money or use a variety of additional strategies to increase funds available for investment. Under the 1940 Act, the Fund is permitted to issue debt up to 33 1/3% of its total managed assets or equity securities (e.g., preferred shares) up to 50% of its total managed assets. The Fund may voluntarily elect to limit its leverage to less than the maximum amount permitted under the 1940 Act.
Risk Factors
This section contains a discussion of principal risks of investing in the Fund. The net asset value per share (“NAV”) and market price of, and distributions paid on, the Fund’s shares of common stock will fluctuate with and be affected by, among other things, the risks more fully described below. As with any fund, there can be no guarantee that the Fund will meet its investment objective or that the Fund’s performance will be positive for any period of time. Each of the following risks, which are described in alphabetical order and not in order of importance, can significantly affect the Fund’s performance. The relative importance of, or potential exposure as a result of, each of these risks will vary based on market and other investment-specific considerations. The Fund may be subject to other risks in addition to those identified below.
Anti-Takeover and Other Provisions in the Articles of Incorporation and Bylaws. The Fund’s Articles of Incorporation and Bylaws include provisions that could limit the ability of other entities or persons to acquire control of the Fund, to cause it to engage in certain transactions or to modify its structure. Such provisions may limit the ability of common stockholders to sell their shares at a premium over the then-current market prices and may have the effect of inhibiting structural changes to the Fund, such as a conversion to an open-end investment company.
Call Risk. Upon the issuer’s desire to call a security, or under other circumstances where a security is called, including when interest rates are low and issuers opt to repay the obligation underlying a “callable security” early, the Fund may have to reinvest the proceeds in an investment offering a lower yield and may not benefit from any increase in value that might otherwise result from declining interest rates.
Credit Risk. Credit risk is the risk that issuers, guarantors, or insurers may fail, or become less able or unwilling, to pay interest and/or principal when due. Changes in the actual or perceived creditworthiness of an issuer or a downgrade or default affecting any of the Fund’s securities could affect the Fund’s performance. Generally, the longer the maturity and the lower the credit quality of a security, the more sensitive it is to credit risk.
Dividend Risk. There is no guarantee that the companies in which the Fund invests will declare dividends in the future or that dividends, if declared, will remain at current levels or increase over time. Securities that pay dividends may be sensitive to changes in interest rates, and as interest rates rise or fall, the prices of such securities may fall.
24
Energy Sector Risk. The Fund concentrates its investments in the energy sector, and will therefore be susceptible to adverse economic, business, social, political, environmental, regulatory or other developments affecting that sector. The energy sector has historically experienced substantial price volatility. MLPs, energy infrastructure companies and other companies operating in the energy sector are subject to specific risks, including, among others: fluctuations in commodity prices and/or interest rates; increased governmental or environmental regulation; reduced availability of natural gas or other commodities for transporting, processing, storing or delivering; declines in domestic or foreign production; slowdowns in new construction; extreme weather or other natural disasters; and threats of attack by terrorists on energy assets. Energy companies can be significantly affected by the supply of, and demand for, particular energy products (such as oil and natural gas), which may result in overproduction or underproduction. Additionally, changes in the regulatory environment for energy companies may adversely impact their profitability. Over time, depletion of natural gas reserves and other energy reserves may also affect the profitability of energy companies.
During periods of heightened volatility, energy producers that are burdened with debt may seek bankruptcy relief. Bankruptcy laws may permit the revocation or renegotiation of contracts between energy producers and MLPs/energy infrastructure companies, which could have a dramatic impact on the ability of MLPs/energy infrastructure companies to pay distributions to its investors, including the Fund, which in turn could impact the ability of the Fund to pay distributions and dramatically impact the value of the Fund’s investments.
Interest Rate Risk. The Fund’s distribution rate and NAV will fluctuate in response to changes in interest rates. In general, the value of investments with interest rate risk, such as debt securities, will move in the direction opposite to movements in interest rates. If interest rates rise, the value of such securities may decline. Typically, the longer the maturity or duration of a debt security, the greater the effect a change in interest rates could have on the security’s price. Thus, the sensitivity of the Fund’s debt securities to interest rate risk will increase with any increase in the duration of those securities.
Issuer-Specific Risk. An individual security may be more volatile, and may perform differently, than the market as a whole. The Fund’s portfolio may contain fewer securities than the portfolios of other funds, which increases the risk that the value of the Fund could go down because of the poor performance of one or a few investments.
Leverage Risk. The Fund’s use of leverage may cause higher volatility for the Fund’s NAV, market price, and distribution rate. Leverage typically magnifies the total return of the Fund’s portfolio, whether that return is positive or negative. Leverage is intended to increase common stock net income, but there is no assurance that the Fund’s leveraging strategy will be successful or that the use of leverage will result in a higher yield on the Fund’s shares of common stock. Leverage may also increase the Fund’s liquidity risk, as the Fund may need to sell securities at inopportune times to stay within Fund, contractual or regulatory limits. The Fund’s use of leverage may increase operating costs, which may reduce total return. The Fund’s use of leverage may increase or decrease from time to time in its discretion and the Fund may, in the future, determine not to use leverage.
Liquidity Risk. From time to time, the trading market for a particular investment in which the Fund invests, or a particular type of instrument in which the Fund is invested, may become less liquid or even illiquid. Illiquid investments frequently can be more difficult to purchase or sell at an advantageous price or time, and there is a greater risk that the investments may not be sold for the price at which the Fund is carrying them. Certain investments that were liquid when the Fund purchased them may become illiquid, sometimes abruptly. Additionally, market closures due to holidays or other factors may render a security or group of securities (e.g., securities tied to a particular country or geographic region) illiquid for a period of time. An inability to sell a portfolio position can adversely affect the Fund’s value or prevent the Fund from being able to take advantage of other investment opportunities. Market prices for such securities or other investments may be volatile. During periods of substantial market volatility, an investment or even an entire market segment may become illiquid, sometimes abruptly, which can adversely affect the Fund’s ability to limit losses.
25
Market Premium/Discount Risk. The market price of the Fund’s shares of common stock will generally fluctuate in accordance with changes in the Fund’s NAV as well as the relative supply of and demand for shares on the secondary market. The Fund’s investment advisor cannot predict whether shares will trade below, at or above their NAV because the shares trade on the secondary market at market prices and not at NAV. Because the market price of the Fund’s shares of common stock will be determined by factors such as relative supply of and demand for the Fund’s common stock in the market, general market and economic circumstances, and other factors beyond the control of the Fund, the Fund cannot predict whether its shares of common stock will trade at, below or above NAV. This characteristic is a risk separate and distinct from the risk that the Fund’s NAV could decrease as a result of investment activities. Common stockholders bear a risk of loss to the extent that the price at which they sell their shares is lower than at the time of purchase.
Market Volatility Risk. Markets may be volatile and values of individual securities and other investments, including those of a particular type, may decline significantly in response to adverse issuer, political, regulatory, market, economic or other developments that may cause broad changes in market value, public perceptions concerning these developments, and adverse investor sentiment or publicity. Geopolitical and other risks, including environmental and public health risks may add to instability in world economies and markets generally. Changes in value may be temporary or may last for extended periods. If the Fund sells a portfolio position before it reaches its market peak, it may miss out on opportunities for better performance.
Master Limited Partnership Risk. Investing in MLPs involves certain risks related to investing in the underlying assets of the MLPs and risks associated with pooled investment vehicles. MLPs holding credit-related investments are subject to interest rate risk and the risk of default on payment obligations by debt issuers. MLPs that concentrate in a particular industry or a particular geographic region are subject to risks associated with such industry or region. Investments held by MLPs may be relatively illiquid, limiting the MLPs’ ability to vary their portfolios promptly in response to changes in economic or other conditions. MLPs may have limited financial resources, their securities may trade infrequently and in limited volume, and they may be subject to more abrupt or erratic price movements than securities of larger or more broadly based companies, and may be difficult to value. MLPs involve certain other risks, including risks related to limited control and voting rights on matters affecting MLPs, risks related to potential conflicts of interest between an MLP and the MLP’s general partner, cash flow risks, and risks related to the general partner’s right to require unitholders to sell their common units at an undesirable time or price. Distributions from an MLP may consist in part of a return of the amount originally invested, which would not be taxable to the extent the distributions do not exceed the investor’s adjusted basis in its MLP interest. These reductions in the Fund’s adjusted tax basis in the MLP securities will increase the amount of gain (or decrease the amount of loss) recognized by the Fund on a subsequent sale of the securities.
Much of the benefit the Fund derives from its investment in equity securities of MLPs is a result of MLPs generally being treated as partnerships for U.S. federal income tax purposes. A change in current tax law, or a change in the business of a given MLP, could result in an MLP being treated as a corporation for U.S. federal income tax purposes and subject to corporate level tax on its income, and could reduce the amount of cash available for distribution by the MLP to its unit holders, such as the Fund. If an MLP were classified as a corporation for federal income tax purposes, the MLP may incur significant federal and state tax liability, likely causing a reduction in the value of the Fund’s shares.
The risks of investing in an MLP generally include those inherent in investing in a partnership as opposed to a corporation. For example, state law governing partnerships is often less restrictive than state law governing corporations. Accordingly, there may be fewer protections afforded investors in an MLP than investors in a corporation. Although unitholders of an MLP are generally limited in their liability, similar to a corporation’s shareholders, creditors typically have the right to seek the return of distributions made to unitholders if the liability in question arose before the distributions were paid. This liability may stay attached to a unitholder even after it sells its units.
26
Master Limited Partnership Tax Risk. MLPs are generally treated as partnerships for U.S. federal income tax purposes. Partnerships do not pay U.S. federal income tax at the partnership level. Rather, each partner is allocated a share of the partnership’s income, gains, losses, deductions and expenses. A change in current tax law or a change in the underlying business mix of a given MLP could result in an MLP being treated as a corporation for U.S. federal income tax purposes, which would result in the MLP being required to pay U.S. federal income tax (as well as state and local income taxes) on its taxable income. This would have the effect of reducing the amount of cash available for distribution by the MLP and could result in a reduction in the value of the Fund’s investment in the MLP and lower income to the Fund. To the extent a distribution received by the Fund from an MLP is treated as a return of capital, the Fund’s adjusted tax basis in the interests of the MLP may be reduced, which will result in an increase in an amount of income or gain (or decrease in the amount of loss) that will be recognized by the Fund for tax purposes upon the sale of any such interests or upon subsequent distributions in respect of such interests. Furthermore, any return of capital distribution received from the MLP may require the Fund to restate the character of its distributions and amend any shareholder tax reporting previously issued. Moreover, a change in current tax law, or a change in the underlying business mix of a given MLP, could result in an MLP investment being treated as a corporation for U.S. federal income tax purposes, which could result in a reduction of the value of the Fund’s investment in the MLP and lower income to the Fund.
The Fund may invest in MLPs taxed as C corporations. Such MLPs are obligated to pay federal income tax on their taxable income at the corporate tax rate and the amount of cash available for distribution by such MLPs would generally be reduced by any such tax. Additionally, distributions received by the Fund would be taxed under federal income tax laws applicable to corporate dividends (as dividend income, potentially subject to the corporate dividends received deduction, return of capital, or capital gain). Thus, investment in MLPs taxed as C corporations could result in a reduction of the value of your investment in the Fund and lower income, as compared to investments in MLPs that are classified as partnerships for tax purposes.
Non-Diversified Fund Risk. The Fund is classified as non-diversified. As such, the percentage of the Fund’s assets invested in any single issuer or a few issuers is not limited as much as it is for a fund classified as diversified. Investing a higher percentage of its assets in any one or a few issuers could increase the Fund’s risk of loss and its share price volatility, because the value of its shares would be more susceptible to adverse events affecting those issuers.
Operational and Cybersecurity Risk. The Fund and its service providers, and your ability to transact with the Fund, may be negatively impacted due to operational matters arising from, among other problems, human errors, systems and technology disruptions or failures, or cybersecurity incidents. Cybersecurity incidents may allow an unauthorized party to gain access to fund assets, customer data, or proprietary information, or cause the Fund or its service providers, as well as the securities trading venues and their service providers, to suffer data corruption or lose operational functionality. Cybersecurity incidents can result from deliberate attacks or unintentional events. It is not possible for NBIA or the other Fund service providers to identify all of the cybersecurity or other operational risks that may affect the Fund or to develop processes and controls to completely eliminate or mitigate their occurrence or effects. Most issuers in which the Fund invests are heavily dependent on computers for data storage and operations, and require ready access to the internet to conduct their business. Thus, cybersecurity incidents could also affect issuers of securities in which the Fund invests, leading to significant loss of value.
Private Placements and Other Restricted Securities Risk. Private placements and other restricted securities, including securities for which Fund management has material non-public information, are securities that are subject to legal and/or contractual restrictions on their sales. These securities may not be sold to the public unless certain conditions are met, which may include registration under the applicable securities laws. As a result of the absence of a public trading market, the prices of these securities may be more difficult to determine than publicly traded securities and these securities may involve heightened risk as compared to investments in securities of publicly traded companies. Private placements and other restricted securities may be illiquid, and it frequently can be difficult to sell them at a time when it may otherwise be desirable to do so or the Fund may be able to sell them only at prices that are less than what the Fund regards as their fair market value. Transaction costs may be higher for these securities. In addition, the Fund may get only limited information about the issuer of a private placement or other restricted security.
27
Recent Market Conditions. National economies are substantially interconnected, as are global financial markets, which creates the possibility that conditions in one country or region might adversely impact issuers in a different country or region. Some countries, including the U.S., have in recent years adopted more protectionist trade policies. The rise in protectionist trade policies, changes to some major international trade agreements and the potential for changes to others, could affect the economies of many nations in ways that cannot necessarily be foreseen at the present time. Equity markets in the U.S. and China have been very sensitive to the outlook for resolving the U.S.-China “trade war,” a trend that may continue in the future.
High public debt in the U.S. and other countries creates ongoing systemic and market risks and policymaking uncertainty, and there may be a further increase in public debt due to the economic effects of the COVID-19 pandemic and ensuing economic relief and public health measures. Governments and central banks have moved to limit the potential negative economic effects of the COVID-19 pandemic with interventions that are unprecedented in size and scope and may continue to do so, but the ultimate impact of these efforts is uncertain. Governments’ efforts to limit potential negative economic effects of the pandemic may be altered, delayed, or eliminated at inopportune times for political, policy or other reasons. Interest rates have been unusually low in recent years in the U.S. and abroad, and central banks have reduced rates further in an effort to combat the economic effects of the COVID-19 pandemic. Because there is little precedent for this situation, it is difficult to predict the impact on various markets of a significant rate increase or other significant policy changes, perhaps in response to indications of increasing inflation. Over the longer term, rising interest rates may present a greater risk than has historically been the case due to the current period of relatively low rates and the effect of government fiscal and monetary policy initiatives and potential market reaction to those initiatives or their alteration or cessation.
The impact of the pandemic has negatively affected and may continue to affect the economies of many nations, individual companies and the global securities and commodities markets, including their liquidity, in ways that cannot necessarily be foreseen at the present time. The pandemic has accelerated trends toward working remotely and shopping on-line, which may negatively affect the value of office and commercial real estate and companies that have been slow to transition to an on-line business model, and has disrupted the supply chains that many businesses depend on. The travel, hospitality and public transit industries may suffer long-term negative effects from the pandemic and resulting changes to public behavior.
Funds and their advisers, as well as many of the companies in which they invest, are subject to regulation by the federal government. Over the past several years, the U.S. has moved away from tighter industry regulation, a trend that appears to be changing. Increased regulation may impose added costs on the Fund and its service providers for monitoring and compliance, and affect the businesses of various portfolio companies, in ways that cannot necessarily be foreseen at the present time.
Climate Change. There is widespread concern about the potential effects of global climate change on property and security values. A rise in sea levels, an increase in powerful windstorms and/or a climate-driven increase in flooding could cause coastal properties to lose value or become unmarketable altogether. Unlike previous declines in the real estate market, properties in affected coastal zones may not ever recover their value. Large wildfires driven by high winds and prolonged drought may devastate businesses and entire communities and may be very costly to any business found to be responsible for the fire. The U.S. administration appears concerned about the climate change problem and is focusing regulatory and public works projects around those concerns. Regulatory changes tied to concerns about climate change could adversely affect the value of certain land and the viability of certain industries.
Losses related to climate change could adversely affect corporate issuers and mortgage lenders, the value of mortgage-backed securities, the bonds of municipalities that depend on tax or other revenues and tourist dollars generated by affected properties, and insurers of the property and/or of corporate, municipal or mortgage-backed securities. Since property and security values are driven largely by buyers’ perceptions, it is difficult to know the time period over which these market effects might unfold.
28
LIBOR Transition. Certain financial contracts specify rates that are based on the London Interbank Offered Rate (LIBOR), which is produced daily by averaging the rates for inter-bank lending reported by a number of banks. As previously announced by the United Kingdom’s Financial Conduct Authority, most maturity and currencies of LIBOR were phased out at the end of 2021, with the remaining ones to be phased out on June 30, 2023. There are risks that the financial services industry will not have a suitable substitute in place by that time and that there will not be time to perform the substantial work necessary to revise the many existing contracts that rely on LIBOR. The transition process, or a failure of the industry to transition properly, might lead to increased volatility and illiquidity in markets that currently rely on LIBOR. It also could lead to a reduction in the value of some LIBOR-based investments and reduce the effectiveness of new hedges placed against existing LIBOR-based instruments. Some experts have called for legislation to ease the transition from LIBOR, but there is no assurance whether such state or pending federal legislation will adequately address all issues or be subject to litigation.
Risk Management. Risk is an essential part of investing. No risk management program can eliminate the Fund’s exposure to adverse events; at best, it may only reduce the possibility that the Fund will be affected by such events, and especially those risks that are not intrinsic to the Fund’s investment program. The Fund could experience losses if judgments about risk prove to be incorrect.
Sector Risk. From time to time, based on market or economic conditions, the Fund may have significant positions in one or more sectors of the market. To the extent the Fund invests more heavily in particular sectors, its performance will be especially sensitive to developments that significantly affect those sectors. Individual sectors may be more volatile, and may perform differently, than the broader market. The industries that constitute a sector may all react in the same way to economic, political or regulatory events.
Shareholder Activism Risk. Shareholder activism can take many forms, including making public demands that the Fund consider certain alternatives, engaging in public campaigns to attempt to influence the Fund’s governance and/or management, commencing proxy contests in an effort to elect the activists’ representatives or others to the Fund’s Board of Directors or to seek other actions such as a tender offer or Fund liquidation, and commencing litigation. Shareholder activism arises in a variety of situations, and has been increasing in the closed-end fund space recently. While the Fund is currently not subject to any shareholder activism, due to the potential volatility of the Fund’s common stock market price and for a variety of other reasons, the Fund may in the future become the target of shareholder activism. Shareholder activism could result in substantial costs and divert Management’s and the Fund’s Board’s attention and resources from its business. Also, the Fund may be required to incur significant legal and other expenses related to any activist shareholder matters. Further, the Fund’s stock price could be subject to significant fluctuation or otherwise be adversely affected by the events, risks and uncertainties of any shareholder activism. Shareholder activists seek short-term actions that can increase Fund costs per share and be detrimental to long-term stockholders.
Small- and Mid-Cap Companies Risk. At times, small- and mid-cap companies may be out of favor with investors. Compared to larger companies, small- and mid-cap companies may depend on a more limited management group, may have a shorter history of operations, less publicly available information, less stable earnings, and limited product lines, markets or financial resources. The securities of small- and mid-cap companies are often more volatile, which at times can be rapid and unpredictable, and less liquid than the securities of larger companies and may be more affected than other types of securities by the underperformance of a sector, during market downturns or by adverse publicity and investor perceptions.
Tax Risk. Unlike other closed-end funds that are structured as regulated investment companies for U.S. federal income tax purposes, the Fund will be taxable as a regular corporation, or “C” corporation, for U.S. federal income tax purposes. This means the Fund generally will be subject to U.S. federal income tax on its taxable income at the rates applicable to corporations (currently at a maximum rate of 21%), and will also be subject to state and local income taxes.
Valuation Risk. The Fund may not be able to sell an investment at the price at which the Fund has valued the investment. Such differences could be significant, particularly for illiquid securities and securities that trade in relatively thin markets and/or markets that experience extreme volatility. If market or other conditions make it difficult to value some investments, SEC rules and applicable accounting protocols may require the Fund to value these investments using more subjective methods, known as fair value methodologies. Using fair value methodologies to price investments may result in a value that is different from an investment’s most recent price and from the prices used by other funds to calculate their NAVs. The Fund’s ability to value its investments in an accurate and timely manner may be impacted by technological issues and/or errors by third party service providers, such as pricing services or accounting agents.
29
Distribution Reinvestment Plan
American Stock Transfer & Trust Company, LLC (the “Plan Agent”) will act as Plan Agent for stockholders who have not elected in writing to receive dividends and other distributions in cash (each a “Participant”), will open an account for each Participant under the Distribution Reinvestment Plan (“Plan”) in the same name as its then-current shares of the Fund’s common stock (“Shares”) are registered, and will put the Plan into effect for each Participant as of the first record date for a dividend or other distribution after the account is opened.
Whenever the Fund declares a dividend or distribution with respect to the Shares, each Participant will receive such dividends and other distributions in additional Shares, including fractional Shares acquired by the Plan Agent and credited to each Participant’s account. If on the payment date for a cash dividend or distribution, the net asset value is equal to or less than the market price per Share plus estimated brokerage commissions, the Plan Agent shall automatically receive such Shares, including fractions, for each Participant’s account. Except in the circumstances described in the next paragraph, the number of additional Shares to be credited to each Participant’s account shall be determined by dividing the dollar amount of the dividend or distribution payable on its Shares by the greater of the net asset value per Share determined as of the date of purchase or 95% of the then-current market price per Share on the payment date.
Should the net asset value per Share exceed the market price per Share plus estimated brokerage commissions on the payment date for a cash dividend or distribution, the Fund may, but is not required to, issue new Shares. If the Fund does not issue new Shares, and the net asset value per Share exceeds the market price per Share plus estimated brokerage commissions on the payment date for a cash dividend or distribution, then the Plan Agent or a broker-dealer selected by the Plan Agent shall endeavor, for a purchase period lasting until the last business day before the next date on which the Shares trade on an “ex-distribution” basis, but in no event, except as provided below, more than 30 days after the payment date, to apply the amount of such dividend or distribution on each Participant’s Shares (less their pro rata share of brokerage commissions incurred with respect to the Plan Agent’s open-market purchases in connection with the reinvestment of such dividend or distribution) to purchase Shares on the open market for each Participant’s account.
No such purchases may be made more than 30 days after the payment date for such dividend or distribution except where temporary curtailment or suspension of purchase is necessary to comply with applicable provisions of federal securities laws. If, at the close of business on any day during the purchase period the net asset value per Share equals or is less than the market price per Share plus estimated brokerage commissions, the Plan Agent will not make any further open-market purchases in connection with the reinvestment of such dividend or distribution. If the Plan Agent is unable to invest the full dividend or distribution amount through open-market purchases during the purchase period, the Plan Agent shall request that, with respect to the uninvested portion of such dividend or distribution amount, the Fund issue new Shares at the close of business on the earlier of the last day of the purchase period or the first day during the purchase period on which the net asset value per Share equals or is less than the market price per Share, plus estimated brokerage commissions, such Shares to be issued in accordance with the terms specified in the third paragraph hereof. These newly issued Shares will be valued at the then-current market price per Share at the time such Shares are to be issued.
For purposes of making the reinvestment purchase comparison under the Plan, (a) the market price of the Shares on a particular date shall be the last sales price on the New York Stock Exchange (or if the Shares are not listed on the New York Stock Exchange, such other exchange on which the Shares are principally traded) on that date, or, if there is no sale on such Exchange (or if not so listed, in the over-the-counter market) on that date, then the mean between the closing bid and asked quotations for such Shares on such Exchange on such date and (b) the net asset value per Share on a particular date shall be the net asset value per Share most recently calculated by or on behalf of the Fund. All dividends, distributions and other payments (whether made in cash or Shares) shall be made net of any applicable withholding tax.
30
Open-market purchases provided for above may be made on any securities exchange where the Fund’s Shares are traded, in the over-the-counter market or in negotiated transactions and may be on such terms as to price, delivery and otherwise as the Plan Agent shall determine. Each Participant’s uninvested funds held by the Plan Agent will not bear interest, and it is understood that, in any event, the Plan Agent shall have no liability in connection with any inability to purchase Shares within 30 days after the initial date of such purchase as herein provided, or with the timing of any purchases effected. The Plan Agent shall have no responsibility as to the value of the Shares acquired for each Participant’s account. For the purpose of cash investments, the Plan Agent may commingle each Participant’s funds with those of other stockholders of the Fund for whom the Plan Agent similarly acts as agent, and the average price (including brokerage commissions) of all Shares purchased by the Plan Agent as Plan Agent shall be the price per Share allocable to each Participant in connection therewith.
The Plan Agent may hold each Participant’s Shares acquired pursuant to the Plan together with the Shares of other stockholders of the Fund acquired pursuant to the Plan in noncertificated form in the Plan Agent’s name or that of the Plan Agent’s nominee. The Plan Agent will forward to each Participant any proxy solicitation material and will vote any Shares so held for each Participant only in accordance with the instructions set forth on proxies returned by the Participant to the Fund.
The Plan Agent will confirm to each Participant each acquisition made for its account as soon as practicable but not later than 60 days after the date thereof. Although each Participant may from time to time have an undivided fractional interest (computed to three decimal places) in a Share, no certificates for a fractional Share will be issued. However, dividends and distributions on fractional Shares will be credited to each Participant’s account. In the event of termination of a Participant’s account under the Plan, the Plan Agent will adjust for any such undivided fractional interest in cash at the market value of the Shares at the time of termination, less the pro rata expense of any sale required to make such an adjustment.
Any Share dividends or split Shares distributed by the Fund on Shares held by the Plan Agent for Participants will be credited to their accounts. In the event that the Fund makes available to its stockholders rights to purchase additional Shares or other securities, the Shares held for each Participant under the Plan will be added to other Shares held by the Participant in calculating the number of rights to be issued to each Participant.
The Plan Agent’s service fee for handling capital gains and other distributions or income dividends will be paid by the Fund. Participants will be charged their pro rata share of brokerage commissions on all open-market purchases.
Each Participant may terminate its account under the Plan by notifying the Plan Agent in writing. Such termination will be effective immediately if the Participant’s notice is received by the Plan Agent not less than ten days prior to any dividend or distribution record date, otherwise such termination will be effective the first trading day after the payment date for such dividend or distribution with respect to any subsequent dividend or distribution. The Plan may be terminated by the Plan Agent or the Fund upon notice in writing mailed to each Participant at least 30 days prior to any record date for the payment of any dividend or distribution by the Fund.
These terms and conditions may be amended or supplemented by the Plan Agent or the Fund at any time or times but, except when necessary or appropriate to comply with applicable law or the rules or policies of the Securities and Exchange Commission or any other regulatory authority, only by mailing to each Participant appropriate written notice at least 30 days prior to the effective date thereof. The amendment or supplement shall be deemed to be accepted by each Participant unless, prior to the effective date thereof, the Plan Agent receives written notice of the termination of its account under the Plan. Any such amendment may include an appointment by the Plan Agent in its place and stead of a successor Plan Agent under these terms and conditions, with full power and authority to perform all or any of the acts to be performed by the Plan Agent under these terms and conditions. Upon any such appointment of any Plan Agent for the purpose of receiving dividends and other distributions, the Fund will be authorized to pay to such successor Plan Agent, for each Participant’s account, all dividends and other distributions payable on Shares held in its name or under the Plan for retention or application by such successor Plan Agent as provided in these terms and conditions.
31
The Plan Agent shall at all times act in good faith and agrees to use its best efforts within reasonable limits to ensure the accuracy of all services performed under this Agreement and to comply with applicable law, but assumes no responsibility and shall not be liable for loss or damage due to errors unless such error is caused by the Plan Agent’s negligence, bad faith, or willful misconduct or that of its employees. These terms and conditions are governed by the laws of the State of Maryland.
Reinvested dividends and distributions are taxed in the same manner as cash dividends and distributions — i.e., reinvestment in additional Shares does not relieve stockholders of, or defer the need to pay, any income tax that may be payable (or that is required to be withheld) on Fund dividends and distributions. Participants should contact their tax professionals for information on how the Plan impacts their personal tax situation. For additional information about the Plan, please contact the Plan Agent by telephone at 1-866-227-2136 or by mail at 6201 15th Avenue, Brooklyn, NY, 11219 or online at www.astfinancial.com.
32
| Investment Manager and Administrator | Plan Agent | |
| Neuberger Berman Investment Advisers LLC | American Stock Transfer & Trust Company, LLC | |
| 1290 Avenue of the Americas | Plan Administration Department | |
| New York, NY 10104-0002 | P.O. Box 922 | |
| 877.461.1899 | Wall Street Station | |
| New York, NY 10269-0560 | ||
| Custodian | ||
| U.S. Bank, National Association | Overnight correspondence should be sent to: | |
| 1555 North Rivercenter Drive, Suite 302 | American Stock Transfer & Trust Company, LLC | |
| Milwaukee, WI 53212 | 6201 15th Avenue | |
| Brooklyn, NY 11219 | ||
| Transfer Agent | ||
| American Stock Transfer & Trust Company, LLC | Legal Counsel | |
| 6201 15th Avenue | K&L Gates LLP | |
| Brooklyn, NY 11219 | 1601 K Street, NW | |
| Shareholder Services 866.227.2136 | Washington, DC 20006-1600 | |
| Independent Registered Public Accounting Firm | ||
| Ernst & Young LLP | ||
| 200 Clarendon Street | ||
| Boston, MA 02116 |
33
The following tables set forth information concerning the Directors and Officers of the Fund. All persons named as Directors and Officers also serve in similar capacities for other funds administered or managed by NBIA. The Fund’s Statement of Additional Information includes additional information about the Directors as of the time of the Fund’s most recent public offering and is available upon request, without charge, by calling (877) 461-1899.
Information about the Board of Directors
| Name, (Year of Birth), and Address(1) | Position(s) and Length of Time Served(2) | Principal Occupation(s)(3) | Number of Funds in Fund Complex Overseen by Director | Other Directorships Held Outside Fund Complex by Director(3) | ||||
| CLASS I | ||||||||
| Independent Directors | ||||||||
| Marc Gary (1952) | Director since 2015 | Executive Vice Chancellor and Chief Operating Officer, Jewish Theological Seminary, since 2012; formerly, Executive Vice President and General Counsel, Fidelity Investments, 2007 to 2012; formerly, Executive Vice President and General Counsel, BellSouth Corporation, 2004 to 2007; formerly, Vice President and Associate General Counsel, BellSouth Corporation, 2000 to 2004; formerly, Associate, Partner, and National Litigation Practice Co-Chair, Mayer, Brown LLP, 1981 to 2000; formerly, Associate Independent Counsel, Office of Independent Counsel, 1990 to 1992. | 47 | Director, UJA Federation of Greater New York, since 2019; Trustee, Jewish Theological Seminary, since 2015; Director, Legility, Inc. (privately held for-profit company), since 2012; Director, Lawyers Committee for Civil Rights Under Law (not-for-profit), since 2005; formerly, Director, Equal Justice Works (not-for-profit), 2005 to 2014; formerly, Director, Corporate Counsel Institute, Georgetown University Law Center, 2007 to 2012; formerly, Director, Greater Boston Legal Services (not-for-profit), 2007 to 2012. |
34
| Name, (Year of Birth), and Address(1) | Position(s) and Length of Time Served(2) | Principal Occupation(s)(3) | Number of Funds in Fund Complex Overseen by Director | Other Directorships Held Outside Fund Complex by Director(3) | ||||
| Michael M. Knetter (1960) | Director since 2013 | President and Chief Executive Officer, University of Wisconsin Foundation, since 2010; formerly, Dean, School of Business, University of Wisconsin - Madison; formerly, Professor of International Economics and Associate Dean, Amos Tuck School of Business - Dartmouth College, 1998 to 2002. | 47 | Director, 1 William Street Credit Income Fund, since 2018; Board Member, American Family Insurance (a mutual company, not publicly traded), since March 2009; formerly, Trustee, Northwestern Mutual Series Fund, Inc., 2007 to 2011; formerly, Director, Wausau Paper, 2005 to 2011; formerly, Director, Great Wolf Resorts, 2004 to 2009. | ||||
| Tom D. Seip (1950) | Director since 2013; Chairman of the Board since 2013 | Formerly, Managing Member, Ridgefield Farm LLC (a private investment vehicle), 2004 to 2016; formerly, President and CEO, Westaff, Inc. (temporary staffing), May 2001 to January 2002; formerly, Senior Executive, The Charles Schwab Corporation, 1983 to 1998, including Chief Executive Officer, Charles Schwab Investment Management, Inc.; Trustee, Schwab Family of Funds and Schwab Investments, 1997 to 1998; and Executive Vice President-Retail Brokerage, Charles Schwab & Co., Inc., 1994 to 1997. | 47 | Formerly, Director, H&R Block, Inc. (tax services company), 2001 to 2018; formerly, Director, Talbot Hospice Inc., 2013 to 2016; formerly, Chairman, Governance and Nominating Committee, H&R Block, Inc., 2011 to 2015; formerly, Chairman, Compensation Committee, H&R Block, Inc., 2006 to 2010; formerly, Director, Forward Management, Inc. (asset management company), 1999 to 2006. |
35
| Name, (Year of Birth), and Address(1) | Position(s) and Length of Time Served(2) | Principal Occupation(s)(3) | Number of Funds in Fund Complex Overseen by Director | Other Directorships Held Outside Fund Complex by Director(3) | ||||
| CLASS II | ||||||||
| Independent Directors | ||||||||
| Michael J. Cosgrove (1949) | Director since 2015 | President, Carragh Consulting USA, since 2014; formerly, Executive, General Electric Company, 1970 to 2014, including President, Mutual Funds and Global Investment Programs, GE Asset Management, 2011 to 2014, President and Chief Executive Officer, Mutual Funds and Intermediary Business, GE Asset Management, 2007 to 2011, President, Institutional Sales and Marketing, GE Asset Management, 1998 to 2007, and Chief Financial Officer, GE Asset Management, and Deputy Treasurer, GE Company, 1988 to 1993. | 47 | Director, America Press, Inc. (not-for-profit Jesuit publisher), since 2015; formerly, Director, Fordham University, 2001 to 2018; formerly, Director, The Gabelli Go Anywhere Trust, June 2015 to June 2016; formerly, Director, Skin Cancer Foundation (not-for-profit), 2006 to 2015; formerly, Director, GE Investments Funds, Inc., 1997 to 2014; formerly, Trustee, GE Institutional Funds, 1997 to 2014; formerly, Director, GE Asset Management, 1988 to 2014; formerly, Director, Elfun Trusts, 1988 to 2014; formerly, Trustee, GE Pension & Benefit Plans, 1988 to 2014; formerly, Member of Board of Governors, Investment Company Institute. | ||||
| Deborah C. McLean (1954) | Director since 2015 | Member, Circle Financial Group (private wealth management membership practice), since 2011; Managing Director, Golden Seeds LLC (an angel investing group), since 2009; Adjunct Professor, Columbia University School of International and Public Affairs, since 2008; formerly, Visiting Assistant Professor, Fairfield University, Dolan School of Business, Fall 2007; formerly, Adjunct Associate Professor of Finance, Richmond, The American International University in London, 1999 to 2007. | 47 | Board member, Norwalk Community College Foundation, since 2014; Dean’s Advisory Council, Radcliffe Institute for Advanced Study, since 2014; formerly, Director and Treasurer, At Home in Darien (not-for-profit), 2012 to 2014; formerly, Director, National Executive Service Corps (not-for-profit), 2012 to 2013; formerly, Trustee, Richmond, The American International University in London, 1999 to 2013. | ||||
36
| Name, (Year of Birth), and Address(1) | Position(s) and Length of Time Served(2) | Principal Occupation(s)(3) | Number of Funds in Fund Complex Overseen by Director | Other Directorships Held Outside Fund Complex by Director(3) | ||||
| George W. Morriss (1947) | Director since 2013 | Adjunct Professor, Columbia University School of International and Public Affairs, since 2012; formerly, Executive Vice President and Chief Financial Officer, People’s United Bank, Connecticut (a financial services company), 1991 to 2001. | 47 | Director, 1 William Street Credit Income Fund, since 2018; Director and Chair, Thrivent Church Loan and Income Fund, since 2018; formerly, Trustee, Steben Alternative Investment Funds, Steben Select Multi-Strategy Fund, and Steben Select Multi-Strategy Master Fund, 2013 to 2017; formerly, Treasurer, National Association of Corporate Directors, Connecticut Chapter, 2011 to 2015; formerly, Manager, Larch Lane Multi-Strategy Fund complex (which consisted of three funds), 2006 to 2011; formerly, Member, NASDAQ Issuers’ Affairs Committee, 1995 to 2003. |
37
| Name, (Year of Birth), and Address(1) | Position(s) and Length of Time Served(2) | Principal Occupation(s)(3) | Number of Funds in Fund Complex Overseen by Director | Other Directorships Held Outside Fund Complex by Director(3) | ||||
| CLASS III | ||||||||
| Independent Directors | ||||||||
| Martha C. Goss (1949) | Director since 2013 | President, Woodhill Enterprises Inc./Chase Hollow Associates LLC (personal investment vehicle), since 2006; formerly, Consultant, Resources Global Professionals (temporary staffing), 2002 to 2006; formerly, Chief Financial Officer, Booz-Allen & Hamilton, Inc., 1995 to 1999; formerly, Enterprise Risk Officer, Prudential Insurance, 1994 to 1995; formerly, President, Prudential Asset Management Company, 1992 to 1994; formerly, President, Prudential Power Funding (investments in electric and gas utilities and alternative energy projects), 1989 to 1992; formerly, Treasurer, Prudential Insurance Company, 1983 to 1989. | 47 | Director, American Water (water utility), since 2003; Director, Allianz Life of New York (insurance), since 2005; Director, Berger Group Holdings, Inc. (engineering consulting firm), since 2013; Director, Financial Women’s Association of New York (not-for-profit association), since 2003; Trustee Emerita, Brown University, since 1998; Director, Museum of American Finance (not-for-profit), since 2013; formerly, Non-Executive Chair and Director, Channel Reinsurance (financial guaranty reinsurance), 2006 to 2010; formerly, Director, Ocwen Financial Corporation (mortgage servicing), 2005 to 2010; formerly, Director, Claire’s Stores, Inc. (retailer), 2005 to 2007; formerly, Director, Parsons Brinckerhoff Inc. (engineering consulting firm), 2007 to 2010; formerly, Director, Bank Leumi (commercial bank), 2005 to 2007; formerly, Advisory Board Member, Attensity (software developer), 2005 to 2007. |
38
| Name, (Year of Birth), and Address(1) | Position(s) and Length of Time Served(2) | Principal Occupation(s)(3) | Number of Funds in Fund Complex Overseen by Director | Other Directorships Held Outside Fund Complex by Director(3) | ||||
| James G. Stavridis (1955) | Director since 2015 | Operating Executive, The Carlyle Group, since 2018; Commentator, NBC News, since 2015; formerly, Dean, Fletcher School of Law and Diplomacy, Tufts University, 2013 to 2018; formerly, Admiral, United States Navy, 1976 to 2013, including Supreme Allied Commander, NATO and Commander, European Command, 2009 to 2013, and Commander, United States Southern Command, 2006 to 2009. | 47 | Director, American Water (water utility), since 2018; Director, NFP Corp. (insurance broker and consultant), since 2017; Director, U.S. Naval Institute, since 2014; Director, Onassis Foundation, since 2014; Director, BMC Software Federal, LLC, since 2014; Director, Vertical Knowledge, LLC, since 2013; formerly, Director, Navy Federal Credit Union, 2000-2002. |
39
| Name, (Year of Birth), and Address(1) | Position(s) and Length of Time Served(2) | Principal Occupation(s)(3) | Number of Funds in Fund Complex Overseen by Director | Other Directorships Held Outside Fund Complex by Director(3) | ||||
| Director who is an “Interested Person” | ||||||||
| Joseph V. Amato* (1962) | Chief Executive Officer and President since 2018 and Director since 2013 | President and Director, Neuberger Berman Group LLC, since 2009; President and Chief Executive Officer, Neuberger Berman BD LLC and Neuberger Berman Holdings LLC (including its predecessor, Neuberger Berman Inc.), since 2007; Chief Investment Officer (Equities) and President (Equities), NBIA (formerly, Neuberger Berman Fixed Income LLC and including predecessor entities), since 2007, and Board Member of NBIA since 2006; formerly, Global Head of Asset Management of Lehman Brothers Holdings Inc.’s (“LBHI”) Investment Management Division, 2006 to 2009; formerly, member of LBHI’s Investment Management Division’s Executive Management Committee, 2006 to 2009; formerly, Managing Director, Lehman Brothers Inc. (“LBI”), 2006 to 2008; formerly, Chief Recruiting and Development Officer, LBI, 2005 to 2006; formerly, Global Head of LBI’s Equity Sales and a Member of its Equities Division Executive Committee, 2003 to 2005; President and Chief Executive Officer, eleven registered investment companies for which NBIA acts as investment manager and/or administrator. | 47 | Member of Board of Advisors, McDonough School of Business, Georgetown University, since 2001; Member of New York City Board of Advisors, Teach for America, since 2005; Trustee, Montclair Kimberley Academy (private school), since 2007; Member of Board of Regents, Georgetown University, since 2013. | ||||
| (1) | The business address of each listed person is 1290 Avenue of the Americas New York, NY 10104. |
| (2) | The Board shall at all times be divided as equally as possible into three classes of Directors designated Class I, Class II and Class III. The Class I, Class II and Class III Directors shall serve until the Annual Meeting of Stockholders held in 2024, 2022 and 2023, respectively, and each third Annual Meeting of Stockholders thereafter, or until their successors have been duly elected and qualified. |
| (3) | Except as otherwise indicated, each individual has held the positions shown during at least the last five years. |
| * | Indicates a Director who is an “interested person” within the meaning of the 1940 Act. Mr. Amato is an interested person of the Fund by virtue of the fact that he is an officer of NBIA and/or its affiliates. |
40
Information about the Officers of the Fund
| Name, (Year of Birth), and Address(1) | Position(s) and Length of Time Served(2) | Principal Occupation(s)(3) | ||
| Claudia A. Brandon (1956) | Executive Vice President and Secretary since 2013 | Senior Vice President, Neuberger Berman, since 2007 and Employee since 1999; Senior Vice President, NBIA, since 2008 and Assistant Secretary since 2004; formerly, Vice President, Neuberger Berman, 2002 to 2006; formerly, Vice President — Mutual Fund Board Relations, NBIA, 2000 to 2008; formerly, Vice President, NBIA, 1986 to 1999 and Employee, 1984 to 1999; Executive Vice President and Secretary, thirty registered investment companies for which NBIA acts as investment manager and/or administrator. | ||
| Agnes Diaz (1971) | Vice President since 2013 | Senior Vice President, Neuberger Berman, since 2012; Senior Vice President, NBIA, since 2012 and Employee since 1996; formerly, Vice President, Neuberger Berman, 2007 to 2012; Vice President, eleven registered investment companies for which NBIA acts as investment manager and/or administrator. | ||
| Anthony DiBernardo (1979) | Assistant Treasurer since 2013 | Senior Vice President, Neuberger Berman, since 2014; Senior Vice President, NBIA, since 2014, and Employee since 2003; formerly, Vice President, Neuberger Berman, 2009 to 2014; Assistant Treasurer, eleven registered investment companies for which NBIA acts as investment manager and/or administrator. | ||
| Savonne Ferguson (1973) | Chief Compliance Officer since 2018 | Senior Vice President, Chief Compliance Officer (Mutual Funds) and Associate General Counsel, NBIA, since November 2018; formerly, Vice President T. Rowe Price Group, Inc. (2018), Vice President and Senior Legal Counsel, T. Rowe Price Associates, Inc. (2014-2018), Vice President and Director of Regulatory Fund Administration, PNC Capital Advisors, LLC (2009-2014), Secretary, PNC Funds and PNC Advantage Funds (2010-2014); Chief Compliance Officer, thirty registered investment companies for which NBIA acts as investment manager and/or administrator. | ||
| Corey A. Issing (1978) | Chief Legal Officer since 2016 (only for purposes of sections 307 and 406 of the Sarbanes-Oxley Act of 2002) | General Counsel — Mutual Funds since 2016 and Managing Director, NBIA, since 2017; formerly, Associate General Counsel (2015 to 2016), Counsel (2007 to 2015), Senior Vice President (2013-2016), Vice President (2009 — 2013); Chief Legal Officer (only for purposes of sections 307 and 406 of the Sarbanes-Oxley Act of 2002), thirty registered investment companies for which NBIA acts as investment manager and/or administrator. | ||
| Sheila R. James (1965) | Assistant Secretary since 2013 | Vice President, Neuberger Berman, since 2008 and Employee since 1999; Vice President, NBIA, since 2008; formerly, Assistant Vice President, Neuberger Berman, 2007; Employee, NBIA, 1991 to 1999; Assistant Secretary, thirty registered investment companies for which NBIA acts as investment manager and/or administrator. |
41
| Name, (Year of Birth), and Address(1) | Position(s) and Length of Time Served(2) | Principal Occupation(s)(3) | ||
| Brian Kerrane (1969) | Chief Operating Officer since 2015 and Vice President since 2013 | Managing Director, Neuberger Berman, since 2013; Chief Operating Officer — Mutual Funds and Managing Director, NBIA, since 2015; formerly, Senior Vice President, Neuberger Berman, 2006 to 2014; Vice President, NBIA, 2008 to 2015 and Employee since 1991; Chief Operating Officer, eleven registered investment companies for which NBIA acts as investment manager and/or administrator; Vice President, thirty registered investment companies for which NBIA acts as investment manager and/or administrator. | ||
| Anthony Maltese (1959) | Vice President since 2015 | Senior Vice President, Neuberger Berman, since 2014 and Employee since 2000; Senior Vice President, NBIA, since 2014; Vice President, eleven registered investment companies for which NBIA acts as investment manager and/or administrator. | ||
| Josephine Marone (1963) | Assistant Secretary since 2017 | Senior Paralegal, Neuberger Berman, since 2007 and Employee since 2007; Assistant Secretary, thirty registered investment companies for which NBIA acts as investment manager and/or administrator. | ||
| Owen F. McEntee, Jr. (1961) | Vice President since 2013 | Vice President, Neuberger Berman, since 2006; Vice President, NBIA, since 2006 and Employee since 1992; Vice President, eleven registered investment companies for which NBIA acts as investment manager and/or administrator. | ||
| John M. McGovern (1970) | Treasurer and Principal Financial and Accounting Officer since 2013 | Senior Vice President, Neuberger Berman, since 2007; Senior Vice President, NBIA, since 2007 and Employee since 1993; formerly, Vice President, Neuberger Berman, 2004 to 2006; formerly, Assistant Treasurer, 2002 to 2005; Treasurer and Principal Financial and Accounting Officer, eleven registered investment companies for which NBIA acts as investment manager and/or administrator. | ||
| Frank Rosato (1971) | Assistant Treasurer since 2013 | Vice President, Neuberger Berman, since 2006; Vice President, NBIA, since 2006 and Employee since 1995; Assistant Treasurer, eleven registered investment companies for which NBIA acts as investment manager and/or administrator. |
| (1) | The business address of each listed person is 1290 Avenue of the Americas New York, NY 10104. |
| (2) | Pursuant to the Bylaws of the Fund, each officer elected by the Directors shall hold office until his or her successor shall have been elected and qualified or until his or her earlier death, inability to serve, or resignation. Officers serve at the pleasure of the Directors and may be removed at any time with or without cause. |
| (3) | Except as otherwise indicated, each individual has held the positions shown during at least the last five years. |
42
Proxy Voting Policies and Procedures
A description of the policies and procedures that the Fund uses to determine how to vote proxies relating to portfolio securities is available, without charge, by calling 800-877-9700 (toll-free) and on the SEC’s website at www.sec.gov. Information regarding how the Fund voted proxies relating to portfolio securities during the most recent 12-month period ended June 30 is also available, upon request, without charge, by calling 800-877-9700 (toll-free), on the SEC’s website at www.sec.gov, and on Neuberger Berman’s website at www.nb.com.
The Fund files a complete schedule of portfolio holdings with the SEC for the first and third quarters of each fiscal year as an exhibit to its report on Form N-PORT. The Fund’s Forms N-PORT are available on the SEC’s website at www.sec.gov. The portfolio holdings information on Forms N-PORT is available upon request, without charge, by calling 800-877-9700 (toll-free).
43
Report of Votes of Stockholders
The Annual Meeting of Stockholders was held on September 29, 2021. Stockholders voted to elect four Class I Directors to serve until the Annual Meeting of Stockholders in 2024, or until their successors are elected and qualified. The Class II Directors (which include Michael J. Cosgrove, Deborah C. McLean and George W. Morriss) and the Class III Directors (which include Joseph V. Amato, Martha C. Goss and James G. Stavridis) continue to hold office until the Annual Meeting of Stockholders in 2022 and 2023, respectively or until their successors are elected and qualified.
To elect four Class I Directors to serve until the Annual Meeting of Stockholders in 2024 or until their successors are elected and qualified.
Shares of Common Stock
| Votes For | Votes Withheld | Abstentions | Broker Non-Votes | ||||||
| Marc Gary | 39,929,938 | 8,721,721 | — | — | |||||
| Michael M. Knetter | 39,682,267 | 8,969,392 | — | — | |||||
| Tom D. Seip | 39,687,260 | 8,964,399 | — | — | |||||
| Peter P. Trapp* | 39,656,130 | 8,995,529 | — | — |
| * | Peter P. Trapp retired from the Board effective December 31, 2021. |
44
Board Consideration of the Management Agreement
On an annual basis, the Board of Directors (the “Board or “Directors”) of Neuberger Berman MLP and Energy Income Fund Inc. (the “Fund”), including the Directors who are not “interested persons” of the Fund or of Neuberger Berman Investment Advisers LLC (“Management”) (including its affiliates), as such term is defined under the Investment Company Act of 1940, as amended (“1940 Act”), (“Independent Fund Directors”), considers whether to continue the Fund’s management agreement with Management (the “Agreement”). Throughout the process, the Independent Fund Directors are advised by counsel that is experienced in 1940 Act matters and that is independent of Management (“Independent Counsel”). At a meeting held on October 21, 2021, the Board, including the Independent Fund Directors, approved the continuation of the Agreement for the Fund.
In evaluating the Agreement, the Board, including the Independent Fund Directors, reviewed extensive materials provided by Management in response to questions submitted by the Independent Fund Directors and Independent Counsel, and met with senior representatives of Management regarding its personnel, operations, and profitability as they relate to the Fund. The annual contract review extends over at least two regular meetings of the Board to ensure that Management has time to respond to any questions the Independent Fund Directors may have on their initial review of the materials and that the Independent Fund Directors have time to consider those responses. Additionally, the Board considered the impact of significant market volatility that occurred during and after the period for which information was requested in conducting its evaluation of Management.
In connection with its deliberations, the Board also considered the broad range of information relevant to the annual contract review that is provided to the Board (including its various standing committees) at meetings throughout the year, including reports on investment performance based on net asset value and common stock market prices, portfolio risk, use of leverage, information regarding share price premiums and/or discounts, and other portfolio information for the Fund, as well as periodic reports on, among other matters, pricing and valuation; quality and cost of portfolio trade execution; compliance; and stockholder and other services provided by Management and its affiliates. The Contract Review Committee, which is comprised of Independent Fund Directors, was established by the Board to assist in its evaluation and analysis of materials for the annual contract review. The Board has also established other committees that focus throughout the year on specific areas relevant to the annual contract review, such as Fund performance or compliance matters, and that are charged with specific responsibilities regarding the annual contract review. Those committees provide reports to the full Board, including the members of the Contract Review Committee, which consider that information as part of the annual contract review process. The Board’s Contract Review Committee annually considers and updates the questions it asks of Management in light of legal advice furnished to it by Independent Counsel; its own business judgment; and developments in the industry, in the markets, in fund regulation and litigation, and in Management’s business model.
The Independent Fund Directors received from Independent Counsel a memorandum discussing the legal standards for their consideration of the proposed continuation of the Agreement. During the course of the year and during their deliberations regarding the annual contract review, the Contract Review Committee and the Independent Fund Directors met with Independent Counsel separately from representatives of Management.
Provided below is a description of the Board’s contract approval process and material factors that the Board considered at its meetings regarding renewals of the Agreement and the compensation to be paid thereunder. In connection with its approval of the continuation of the Agreement, the Board evaluated the terms of the Agreement, the overall fairness of the Agreement to the Fund, and whether the Agreement was in the best interests of the Fund and Fund stockholders. The Board’s determination to approve the continuation of the Agreement was based on a comprehensive consideration of all information provided to the Board throughout the year and specifically in connection with the annual contract review.
45
This description is not intended to include all of the factors considered by the Board. The Board members did not identify any particular information or factor that was all-important or controlling, and each Director may have attributed different weights to the various factors. The Board focused on the costs and benefits of the Agreement to the Fund and, through the Fund, Fund stockholders.
Nature, Extent, and Quality of Services
With respect to the nature, extent, and quality of the services provided, the Board considered the investment philosophy and decision-making processes of, and the qualifications, experience, and capabilities of, and the resources available to, the portfolio management personnel of Management who perform services for the Fund. The Board also considered Management’s long history and experience in managing and operating closed-end funds, such as the Fund, including experience monitoring and assessing discounts and premiums and complying with securities exchange requirements. The Board noted that Management also provides certain administrative services, including fund accounting and compliance services. The Board also considered Management’s policies and practices regarding brokerage, commissions, other trading costs, and allocation of portfolio transactions and reviewed the quality of the execution services that Management had provided. The Board also reviewed Management’s use of brokers to execute Fund transactions that provide research services to Management. Moreover, the Board considered Management’s approach to potential conflicts of interest both generally and between the Fund’s investments and those of other funds or accounts managed by Management. The Board also noted that Management had increased its capabilities with respect to environmental, social, and corporate governance matters and considered how those factors may relate to investment performance.
The Board recognized the extensive range of services that Management provides to the Fund beyond the investment management services. The Board noted that Management is also responsible for monitoring compliance with the Fund’s investment objective, policies, and restrictions, as well as compliance with applicable law, including implementing rulemaking initiatives of the U.S. Securities and Exchange Commission. In addition, the Board considered that Management has developed a leverage structure for the Fund tailored to its investment strategy and needs, has monitored the Fund’s ongoing compliance with legal and other restrictions associated with its leverage, and has recommended changes in and/or amendments to the amount or structure of its leverage over time. The Board also considered that Management assumes significant ongoing entrepreneurial and business risks as the investment adviser and sponsor to the Fund, for which it is entitled to reasonable compensation. The Directors also considered that Management’s responsibilities include continual management of investment, operational, enterprise, legal, regulatory, and compliance risks as they relate to the Fund, and the Board considers on a regular basis information regarding Management’s processes for monitoring and managing risk. In addition, the Board noted that when Management launches a new fund, it assumes entrepreneurial risk with respect to that fund, and that some funds have been liquidated without ever having been profitable to Management.
The Board also reviewed and evaluated Management’s activities under its contractual obligation to oversee the Fund’s various outside service providers, including its evaluation of service providers’ infrastructure, cybersecurity programs, compliance programs, and business continuity programs, among other matters. The Board also considered Management’s ongoing development of its own infrastructure and information technology to support the Fund through, among other things, cybersecurity, business continuity planning, and risk management. The Board noted Management’s largely seamless implementation of its business continuity plan in response to the COVID-19 pandemic and its success in continuously providing services to the Fund not withstanding the disruptions caused by the pandemic. In addition, the Board noted the positive compliance history of Management, as no significant compliance problems were reported to the Board with respect to Management. The Board also considered the general structure of the portfolio managers’ compensation and whether this structure provides appropriate incentives to act in the best interests of the Fund. The Board also considered the ability of Management to attract and retain qualified personnel to service the Fund.
46
As in past years, the Board also considered the manner in which Management addressed various matters that arose during the year, some of them a result of developments in the broader fund industry or the regulations governing it. In addition, the Board considered actions taken by Management in response to recent market conditions, the economic dislocation and rise in volatility that accompanied shutdowns related to the efforts to stem the spread of COVID-19, and considered the overall performance of Management in this context. The Board also noted that Management actively monitors any discount from net asset value per share at which the Fund’s common stock trades and evaluates potential ways to mitigate the discount and potential impacts on the discount, including the level of distributions that the Fund pays. The Board likewise took into account that Management monitors, to the extent information is publicly available, events that may disrupt the Fund’s long-term investment program.
Fund Performance
The Board requested a report from an outside consulting firm that specializes in the analysis of fund industry data that compared the Fund’s performance, along with its fees and other expenses, to a group of industry peers (“Expense Group”) and to a broader universe of funds pursuing generally similar strategies with the same investment classification and/or objective (“Performance Universe”). The Board considered the Fund’s performance and fees in light of the limitations inherent in the methodology for constructing such comparative groups and determining which investment companies should be included in the comparative groups, noting differences as compared to certain fund industry ranking and rating systems. The Board also considered the impact and inherent limitation on the comparisons due to the small number of funds included in the Expense Group and Performance Universe. In this regard, the Board recognized that the number of leveraged closed-end funds pursuing similar strategies with the same investment classification and/or objective as the Fund has decreased over time. The Board also recognized the limitations inherent in comparing the Fund’s performance to a benchmark index due to the Fund’s use of leverage and pursuit of an investment strategy that is not tied directly to an index. The Board also recognized the inherent limitations in comparing performance of peer funds utilizing leverage in light of, among other things, the impacts due to the level and type of leverage utilized and when peer funds entered into their leverage arrangements (which can impact pricing and, therefore, cost and performance). The Board also considered the premium/discount levels at which peer funds traded along with the distribution rates and yields of those funds.
With respect to investment performance, the Board considered information regarding the Fund’s short-and intermediate-term performance, net of the Fund’s fees and expenses, on an absolute basis, relative to a benchmark index that does not deduct the fees or expenses of investing, and compared to the performance of its Expense Group and Performance Universe, each constructed by the consulting firm. The Board also reviewed performance in relation to certain measures of the degree of investment risk undertaken by the portfolio managers.
The Performance Universe referenced in this section was identified by the consulting firm, as discussed above and the risk/return ratios referenced are the Sharpe ratios provided by the consulting firm. In the case of underperformance for any of the periods reported, the Board considered the magnitude and duration of that underperformance relative to the Performance Universe and/or the benchmark (e.g., the amount by which the Fund underperformed, including, for example, whether the Fund slightly underperformed or significantly underperformed its benchmark). With respect to performance quintile rankings for the Fund compared to its Performance Universe, the first quintile represents the highest (best) performance and the fifth quintile represents the lowest performance.
The Board considered that, based on performance data for the periods ended December 31, 2020: (1) as compared to its benchmark, the Fund’s performance was lower for the 1- and 3-year periods and higher for the 5-year period; and (2) as compared to its Performance Universe, the Fund’s performance was in the second quintile for the 1- and 3-year periods and the first quintile for the 5-year period. The Fund was launched in 2013 and therefore does not have 10-year performance. The Board also took into account that the Fund showed a risk/return ratio that was better than the median of its Performance Universe for the 3- and 5-year periods, meaning that per unit of risk taken versus a presumed risk-free investment, the Fund achieved a higher level of return than the median of its Performance Universe for those same periods. The Board noted the Fund’s ranking was in the second quintile of its Morningstar peer category and in the third quintile of its Lipper peer category for the 7-month period ending July 31, 2021. In addition, the Board met with the portfolio management team in March 2021 to discuss the Fund’s performance.
47
The Board identified the Fund as having underperformed in certain of these comparisons to an extent, and/or over a period of time, that the Board felt warranted additional inquiry, and discussed with Management the Fund’s performance, potential reasons for the relative performance, and steps that Management had taken, or intended to take, to improve performance. The Board noted that the type, amount and term of the leverage are consistent with the portfolio managers’ preferences for the Fund’s investment strategy. The Board also took into account the positive impact the Fund’s leverage arrangements had on performance. The Board also considered Management’s responsiveness with respect to the relative performance. The Board recognized that the performance data reflects a snapshot of a period as of a particular date and that selecting a different performance period could produce significantly different results. The Board further acknowledged that long-term performance could be impacted by even one period of significant outperformance or underperformance, and that a single investment theme could disproportionately affect performance. In this regard, the Board noted that performance, especially short-term performance, is only one of the factors that it deems relevant to its consideration of the Agreement and that, after considering all relevant factors, it determined to approve the continuation of the Agreement notwithstanding the Fund’s relative performance.
Fee Rates, Profitability, and Fall-out Benefits
With respect to the overall fairness of the Agreement, the Board considered the fee structure for the Fund under the Agreement as compared to the Expense Group provided by the consulting firm, as discussed above. The Board reviewed a comparison of the Fund’s management fee to its Expense Group. The Board noted that the comparative management fee analysis includes, in the Fund’s management fee, the separate administrative fees paid to Management. However, the Board noted that some funds in the Expense Group pay directly from fund assets for certain services that Management covers out of the administration fees for the Fund. Accordingly, the Board also considered the Fund’s total expense ratio as compared with its Expense Group as a way of taking account of these differences. The Board considered that only leveraged closed-end funds were considered for inclusion in the Expense Group presented for comparison with the Fund but also noted the challenges associated with making comparisons regarding expenses for leveraged closed-end funds. The Board took into account Management’s representations that relevant expenses would be difficult for the consulting firm to fully and accurately identify due to, among other things, differences in the type of leverage used and the way such leverage costs are reported. The Board also considered Management’s representations regarding the potential impact on expenses due to the time at which the funds in the Expense Group entered into their leverage arrangements and the funds’ fiscal year-ends (which determine the time period for which leverage costs are reported). With this understanding, the Board also considered the impact of investment-related expenses and taxes on the total expenses of the Fund and the funds in the Expense Group that the consulting firm was able to identify. The Board also considered Management’s representations that there were certain characteristics of leverage that increased leverage expenses but provided benefits and value to stockholders that were not reflected in the Fund’s expense ratio. The Board also considered that, in comparison to certain other products managed by Management, including open-end funds, there are additional portfolio management challenges in managing closed-end funds such as the Fund, including those associated with less liquid holdings and the use of leverage.
The Board considered the Fund’s contractual management fee on managed assets (generally consisting of net assets plus leverage proceeds), as well as the actual management fee on managed assets as a percentage of assets attributable to common stockholders as compared to the Fund’s Expense Group. The Board was aware of the additional expenses borne by common stockholders as a result of the Fund’s leveraged structure. The Board took into account that Management has a financial incentive for the Fund to continue to use leverage, which may create a conflict of interest. It also considered Management’s representation that it continues to believe the use of leverage is in the best interests of the Fund’s stockholders regardless of the level of compensation Management receives. With respect to the quintile rankings for fees and total expenses (net of waivers or other adjustments, if any) on managed assets for the Fund compared to its Expense Group, the first quintile represents the lowest fees and/or total expenses and the fifth quintile represents the highest fees and/or total expenses. The Board considered that, as compared to its Expense Group, the Fund’s contractual management fee and the actual management fee each ranked in the first quintile, and total expenses and total expenses excluding the investment-related expenses and taxes identified by the consulting firm each ranked in the second quintile.
48
In determining to renew the Agreement, the Board took into account Management’s representations regarding the effect that the cost of leverage had on the Fund’s total expenses relative to its peers with different types and levels of leverage and noted Management’s efforts to ensure the Fund’s leverage arrangements were among the best available for a fund of its size and investment strategy and with its preferences regarding types and levels of leverage at the time the Fund entered into its leverage arrangements. In addition, the Board considered its Closed-End Fund Committee’s ongoing evaluation of the Fund, including the use of leverage and the specific leverage arrangements.
In concluding that the benefits accruing to Management and its affiliates by virtue of their relationship with the Fund were reasonable in light of the costs of providing the investment advisory and other services and the benefits accruing to the Fund, the Board reviewed specific data as to Management’s estimated profit on the Fund for a recent period on a pre-tax basis without regard to distribution expenses, but including year-over-year changes in each of Management’s reported expense categories. (The Board also reviewed data on Management’s estimated profit on the Fund after distribution/servicing expenses and taxes were factored in, as indicators of the health of the business and the extent to which Management is directing its profits into the growth of the business.) The Board considered the cost allocation methodology that Management used in developing its estimated profitability figures. In recent years, the Board engaged an independent forensic accountant to review the profitability methodology utilized by Management when preparing this information and discussed with the consultant its conclusion that Management’s process for calculating and reporting its estimated profit was not unreasonable.
Recognizing that there is no uniform methodology regarding the allocation of firm-wide or complex-wide expenses within the asset management industry for determining profitability for this purpose and that the use of different reasonable methodologies can give rise to different profit and loss results, the Board, in recent years, requested from Management examples of profitability calculated by different methods and noted that the estimated profitability levels were still reasonable when calculated by these other methods. The Board further noted Management’s representation that its estimate of profitability is derived using methodology that is consistent with the methodology used to assess and/or report measures of profitability elsewhere at the firm. In addition, the Board recognized that Management’s calculations regarding its costs may not reflect all risks, including regulatory, legal, operational, reputational, and, where appropriate, entrepreneurial risks, associated with offering and managing a closed-end fund in the current regulatory and market environment. The Board also considered any fall-out (i.e., indirect) benefits likely to accrue to Management or its affiliates from their relationship with the Fund, such as research it may receive from broker-dealers executing the Fund’s portfolio transactions on an agency basis. The Board recognized that Management and its affiliates should be entitled to earn a reasonable level of profits for services they provide to the Fund and, based on review, concluded that Management’s reported level of estimated profitability on the Fund was reasonable.
Information Regarding Services to Other Clients
The Board also considered whether there were other funds or separate accounts that were advised or sub-advised by Management or its affiliates with investment objectives, policies, and strategies that were similar to those of the Fund. The Board compared the fees charged to the Fund to the fees charged to such comparable funds, noting Management’s representation that there were no such separate accounts. The Board considered the appropriateness and reasonableness of any differences between the fees charged to the Fund and such comparable funds, and determined that differences in fees and fee structures were consistent with the differences in the management and other services provided. The Board explored with Management its assertion that although, generally, the rates of fees paid by such funds, except other Neuberger Berman mutual funds, were lower than the fee rates paid by the Fund, the differences reflected Management’s greater level of responsibilities and significantly broader scope of services regarding the Fund, the more extensive regulatory obligations and risks associated with managing the Fund, and other financial considerations with respect to creation and sponsorship of the Fund.
49
Economies of Scale
The Board also evaluated apparent or anticipated economies of scale in relation to the services Management provides to the Fund and noted that there is little expectation that closed-end funds will show significant economies of scale. The Board considered that, as a closed-end investment company, the Fund does not continually offer new shares to raise additional assets (as does a typical open-end investment company), but may experience asset growth through investment performance and/or the increased use of leverage. The Board also considered that Management has provided, at no added cost to the Fund, certain additional services, including but not limited to, services required by new regulations or regulatory interpretations, services impelled by changes in the securities markets or the business landscape, and/or services requested by the Board. The Board considered that this is a way of sharing economies of scale with the Fund and its stockholders.
Conclusions
In approving the continuation of the Agreement, the Board concluded that, in its business judgment, the terms of the Agreement are fair and reasonable to the Fund and that approval of the continuation of the Agreement is in the best interests of the Fund and Fund stockholders. In reaching this determination, the Board considered that Management could be expected to continue to provide a high level of service to the Fund; that the Board retained confidence in Management’s capabilities to manage the Fund; that the Fund’s fee structure appeared to the Board to be reasonable given the nature, extent, and quality of services provided; and that the benefits accruing to Management and Management’s affiliates by virtue of their relationship with the Fund were reasonable in light of the costs of providing the investment advisory and other services and the benefits accruing to the Fund. The Board’s conclusions may be based in part on its consideration of materials prepared in connection with the approval or continuance of the Agreement in prior years and on the Board’s ongoing regular review of Fund performance and operations throughout the year, in addition to material prepared specifically for the most recent annual review of the Agreement.
50
This page has been left blank intentionally
51
52
 | ||||
| Neuberger Berman Investment Advisers LLC | ||||
| 1290 Avenue of the Americas New York, NY 10104–0002 Internal Sales & Services 877.461.1899 www.nb.com | ||||
| Statistics and projections in this report are derived from sources deemed to be reliable but cannot be regarded as a representation of future results of the Fund. This report is prepared for the general information of stockholders and is not an offer for shares of the Fund. | ||||
 N0372 01/22 N0372 01/22 | ||||
| (a) | Audit Fees |
| (b) | Audit-Related Fees |
| (c) | Tax Fees |
| (d) | All Other Fees |
| (e) | Audit Committee’s Pre-Approval Policies and Procedures |
| (f) | Hours Attributed to Other Persons |
| Type of Account | Number of Accounts Managed | Total Assets Managed ($ millions) | Number of Accounts Managed for which Advisory Fee is Performance-Based | Assets Managed for which Advisory Fee is Performance-Based ($ millions) |
Douglas A. Rachlin | ||||
| Registered Investment Companies* | 0 | $0 | 0 | $0 |
| Other Pooled Investment Vehicles** | 3 | $324 | 0 | $0 |
| Other Accounts*** | 1,059 | $1,508 | 0 | $0 |
| Paolo Frattaroli | ||||
| Registered Investment Companies* | 0 | $0 | 0 | $0 |
| Other Pooled Investment Vehicles** | 3 | $324 | 0 | $0 |
| Other Accounts*** | 1,059 | $1,508 | 0 | $0 |
| * | Registered Investment Companies include: Mutual Funds. |
| ** | A portion of certain accounts may be managed by other portfolio managers; however, the total assets of such accounts are included above even though the portfolio manager listed above is not involved in the day-to-day management of the entire account. |
| *** | Other Accounts include: Institutional Separate Accounts, Sub-Advised Accounts and Managed Accounts (WRAP Accounts). |
| Portfolio Manager | Dollar Range of Equity Securities Owned in the Registrant | ||
| Douglas A. Rachlin | F | ||
| Paolo Frattaroli | C |
| A = None B = $1-$10,000 C = $10,001 - $50,000 D = $50,001 - $100,000 | E = $100,001 - $500,000 F = $500,001 - $1,000,000 G = Over $1,000,000 |
| (a) | The Fund did not engage in any securities lending activity during its most recent fiscal year ended November 30, 2021. |
| (b) | The Fund did not engage in any securities lending activity and no services were provided by the securities lending agent to the Fund during its most recent fiscal year ended November 30, 2021. |
(a)(3) Not applicable to the Registrant.