Washington, D.C. 20549
Kevin J. McCarthy
Form N-CSR is to be used by management investment companies to file reports with the Commission not later than 10 days after the transmission to stockholders of any report that is required to be transmitted to stockholders under Rule 30e-1 under the Investment Company Act of 1940 (17 CFR 270.30e-1). The Commission may use the information provided on Form N-CSR in its regulatory, disclosure review, inspection, and policymaking roles.
A registrant is required to disclose the information specified by Form N-CSR, and the Commission will make this information public. A registrant is not required to respond to the collection of information contained in Form N-CSR unless the Form displays a currently valid Office of Management and Budget ("OMB") control number. Please direct comments concerning the accuracy of the information collection burden estimate and any suggestions for reducing the burden to Secretary, Securities and Exchange Commission, 450 Fifth Street, NW, Washington, DC 20549-0609. The OMB has reviewed this collection of information under the clearance requirements of 44 U.S.C. ss. 3507.
ITEM 1. REPORTS TO STOCKHOLDERS.
Life is Complex
Nuveen makes things e-simple.
It only takes a minute to sign up for e-Reports. Once enrolled, you’ll receive an e-mail as soon as your Nuveen Investments Fund information is ready—no more waiting for delivery by regular mail. Just click on the link within the e-mail to see the report and save it on your computer if you wish.
Free e-Reports right to your e-mail!
www.investordelivery.com
If you receive your Nuveen Fund dividends and statements from your financial advisor or brokerage account.
or
www.nuveen.com/accountaccess
If you receive your Nuveen Fund dividends and statements directly from Nuveen.
Table of Contents
| Chairman’s Letter to Shareholders | 4 |
| | |
| Portfolio Managers’ Comments | 5 |
| | |
| Fund Leverage | 9 |
| | |
| Common Share Information | 10 |
| | |
| Risk Considerations | 12 |
| | |
| Performance Overview and Holding Summaries | 13 |
| | |
| Portfolios of Investments | 15 |
| | |
| Statement of Assets and Liabilities | 41 |
| | |
| Statement of Operations | 42 |
| | |
| Statement of Changes in Net Assets | 43 |
| | |
| Statement of Cash Flows | 44 |
| | |
| Financial Highlights | 46 |
| | |
| Notes to Financial Statements | 48 |
| | |
| Reinvest Automatically, Easily and Conveniently | 58 |
| | |
| Glossary of Terms Used in this Report | 59 |
| | |
| Additional Fund Information | 63 |
Chairman’s Letter to Shareholders
Dear Shareholders,
I am pleased to have this opportunity to introduce myself to you as the new independent chairman of the Nuveen Fund Board, effective July 1, 2013. I am honored to have been selected as chairman, with its primary responsibility to serve the interests of the Nuveen Fund shareholders. My predecessor, Robert Bremner, was the first independent director to serve as chairman of the Board and I, and my fellow Board members, plan to continue his legacy of strong independent oversight of your funds.
The global economy has hit major turning points over the last several months to a year. The developed world is gradually recovering from its financial crisis while the emerging markets appear to be struggling with the downshift of China’s growth potential. Japan is entering a new era of growth after decades of economic stagnation and many of the Eurozone nations appear to be exiting their recession. Despite the positive events, there are still potential risks. Middle East tensions, rising oil prices, defaults in Europe and fallout from the financial stress in emerging markets could all reverse the recent progress in the global economy.
On the domestic front, the U.S. economy is experiencing sustainable slow growth. Corporate fundamentals are strong as earnings per share and corporate cash are at the highest level in two decades. Unemployment is trending down and the housing market has experienced a rebound, each assisting the positive economic scenario. However, there are some issues to be watched. Interest rates are expected to increase but significant uncertainty about the timing remains. Partisan politics in Washington D.C. with their troublesome outcomes add to the uncertainties that could cause problems for the economy going forward.
In the near term, governments are focused on economic recovery and the growth of their economies, which could lead to an environment of attractive investment opportunities. Over the long term, the uncertainties mentioned earlier could hinder the potential growth. Because of this, Nuveen’s investment management teams work hard to balance return and risk with a range of investment strategies. I encourage you to read the following commentary on the management of your fund.
On behalf of the other members of the Fund Board, we look forward to continuing to earn your trust in the months and years ahead.
Sincerely,
William J. Schneider
Chairman of the Nuveen Fund Board
January 21, 2014
Portfolio Managers’ Comments
Nuveen Intermediate Duration Municipal Term Fund (NID)
Nuveen Intermediate Duration Quality Municipal Term Fund (NIQ)
These Funds feature management by Nuveen Asset Management, LLC, an affiliate of Nuveen Investments. Portfolio managers John V. Miller, CFA, Timothy T. Ryan, CFA, Steven M. Hlavin and Daniel J. Close, CFA, discuss key investment strategies and the six-month performance of these two Nuveen Funds. John, Tim and Steve have managed NID since its inception in December 2012 and Dan has managed NIQ since its inception in February 2013.
What key strategies were used to manage NID and NIQ during the six-month reporting period ended November 30, 2013?
During the first part of this reporting period, widespread uncertainty about the next step for the Federal Reserve’s (Fed) quantitative easing program and the potential impact on the economy and financial markets led to increased market volatility. After surprising the market in September 2013 with its decision to wait for additional evidence of an improving economy before making any adjustments to the program, the Fed announced on December 18 (subsequent to the close of this reporting period) that it would begin tapering its monthly bond-buying program by $10 billion (to $75 billion) in January 2014. Political debate over federal spending and headline credit stories involving Detroit and Puerto Rico also contributed to the unsettled environment during this period and prompted an increase in selling by bondholders across the fixed income markets. Although the second half of the period brought some stabilization and a rally in the municipal market, municipal bond prices generally declined for the period as a whole, especially at the longer end of the maturity spectrum, while interest rates rose. During this time, we continued to take a bottom-up approach to discovering sectors that appeared undervalued as well as individual credits that had the potential to perform well over the long term and helped us keep our Funds fully invested.
At the beginning of this reporting period, both NID and NIQ had successfully completed their initial invest-up phases and we continued to look for opportunities to further enhance our holdings with bonds having long-term potential. During this reporting period, NID was primarily focused on continuing to search out high yield investment opportunities that would enable us to take greater advantage of NID’s 50% allowance for below investment grade and non-rated paper. The sell-off in the fixed income markets during the summer provided opportunities to add these types of bonds at attractive prices in the secondary market. To finance these additions to our portfolio, we sold selected investment grade bonds, particularly those with credits and structures that held up well during the market
Certain statements in this report are forward-looking statements. Discussions of specific investments are for illustration only and are not intended as recommendations of individual investments. The forward-looking statements and other views expressed herein are those of the portfolio managers as of the date of this report. Actual future results or occurrences may differ significantly from those anticipated in any forward-looking statements, and the views expressed herein are subject to change at any time, due to numerous market and other factors. The Funds disclaim any obligation to update publicly or revise any forward-looking statements or views expressed herein.
Ratings shown are the highest rating given by one of the following national rating agencies: Standard & Poor’s (S&P), Moody’s Investors Service (Moody’s), Inc. or Fitch, Inc. (Fitch). Credit ratings are subject to change. AAA, AA, A and BBB are investment grade ratings; BB, B, CCC, CC, C and D are below investment grade ratings. Certain bonds backed by U.S. government or agency securities are regarded as having an implied rating equal to the rating of such securities. Holdings designated N/R are not rated by these national rating agencies.
Bond insurance guarantees only the payment of principal and interest on the bond when due, and not the value of the bonds themselves, which will fluctuate with the bond market and the financial success of the issuer and the insurer. Insurance relates specifically to the bonds in the portfolio and not to the share prices of a Fund. No representation is made as to the insurers’ ability to meet their commitments.
Portfolio Managers’ Comments (continued)
sell-off, into strong demand by retail investors. For example, investment-grade California paper was in strong demand during this reporting period due to recent tax increases in California. Investment grade bonds of this type were originally purchased as short term placeholders until we could find attractive opportunities to swap them out for bonds in the below investment grade and non-rated sectors.
NIQ, which has a 20% allowance for below investment grade and non-rated paper, found value in diversified areas of the marketplace, including high quality general obligation (GO) bonds, utilities and toll bridge bonds and lower rated tax increment financing (TIF) district and higher education credits. The Fund also purchased BB-rated bonds that were part of the $1.2 billion new issue by the Iowa Finance Authority for the Iowa Fertilizer Company project. These bonds are intended to fund the construction of a nitrogen fertilizer plant located in southeast Iowa with a production capacity of 1.6 million tons per year. With growing demand for nitrogen fertilizer in the U.S., 50% of which is currently supplied by imports, we believe this project is well positioned competitively because it is U.S.-based, will offer reduced transportation costs and has access to cheaper sources of natural gas than foreign producers. Overall, our purchases focused on bonds with intermediate durations. Purchases were funded through relative value swapping as well as cash generated by a few bond calls. NIQ also sold some positions in Puerto Rico bonds.
As of November 30, 2013, both of these Funds continued to use inverse floating rate securities. We employ inverse floaters for a variety of reasons, including duration management, income enhancement and total return enhancement. During this reporting period, NIQ found it advantageous to terminate one of its inverse floating rate trusts as its duration was approaching the maximum ten-year threshold. As part of our duration management strategies, NID and NIQ also used duration shortening swaps to help maintain the ten-year duration mandate. During this reporting period, these derivatives made a modestly positive contribution to performance and remained in place at period end.
How did NID and NIQ perform over the six-month reporting period ended November 30, 2013?
The tables in each Fund’s Performance Overview and Holding Summaries section of this report provide the Funds’ total returns for the six-month and the since-inception periods ended November 30, 2013. Each Fund’s returns on common share net asset value (NAV) are compared with the performance of a corresponding market index and Lipper classification average.
For the six months ended November 30, 2013, the total returns on common share NAV for NID and NIQ underperformed the return for the S&P Municipal Bond Intermediate Index. For the same period, NID exceeded the average return for the Lipper General & Insured Leveraged Municipal Debt Funds Classification Average, while NIQ underperformed the average return on the Lipper Intermediate Municipal Debt Funds Classification Average.
Key management factors that influenced the Funds’ returns during this reporting period included duration and yield curve positioning, the use of derivatives, credit exposure and sector allocation. In addition, the use of leverage was an important factor affecting the performance of these Funds. Leverage is discussed in more detail later in this report.
As yields on municipal bonds rose and the yield curve steepened, municipal bonds with shorter maturities generally outperformed those with longer maturities. Overall, credits at the shorter end of the municipal yield curve (maturities of five years and less) posted the best returns during this reporting period, while bonds at the longest end produced the weakest results. Bonds with intermediate maturities also tended to outperform the market as a whole. In general, the Funds’ durations and yield curve positioning relative to the benchmark were negative for their performance during this reporting period. While NID and NIQ generally benefited from their intermediate-term orientation, both Funds tended
to have heavier weightings in the longer parts of the yield curve that underperformed and less exposure to the outperforming shorter end of the curve, relative to the benchmark. This detracted from the Funds’ performance in a rising interest rate environment. While both NID and NIQ maintained durations within their ten-year mandate, we anticipate that they will continue to have duration profiles longer than that of the S&P Municipal Bond Intermediate Index as the Funds’ seek to take advantage of an historically steep yield curve in the early years of their ten-year terms.
Although the relative performance of NID and NIQ was hindered by their weightings of bonds with longer maturities, these Funds used interest rate swaps to reduce duration and moderate interest rate risk, as previously described. Because the interest rate swaps were used to hedge against potential increases in interest rates, the swaps performed well as interest rates rose. This had a positive impact on the Funds’ total return performance for the reporting period, which was offset by their overall duration and yield curve positioning.
Credit exposure also factored into the Funds’ performance during this six-month reporting period, as events in the municipal market led investors to avoid risk. High yield bonds came under selling pressure, and credit spreads, or the difference in yield spreads between U.S. Treasury securities and comparable investments such as municipal bonds, began to widen for short and intermediate high yield municipal bonds. For the reporting period as a whole, AAA-rated bonds generally outperformed all other credit quality categories. However, A-rated bonds performed better than AA-rated bonds and B-rated credits outperformed BBB-, BB- and non-rated credits. This led to somewhat mixed performance results in terms of credit exposure, some of which can be tied to the performance of Puerto Rican bonds in the BBB-rated credit quality category. Overall, credit exposure was detrimental to the performance of NID and NIQ. Both Funds were underweighted in the AAA-rated quality category relative to the index and overweight in lower-rated bonds, especially BBB-rated bonds and below investment grade credits.
Sector allocation was generally positive for both Funds. NID benefited from its overweighting in health care, including hospitals and continuing care retirement communities (CCRCs), both of which outperformed the S&P Municipal Bond Intermediate Index during this reporting period. NIQ also received a positive contribution from its health care holdings and was overweight in higher education, which outperformed. In addition, NID was helped by being underweight in utilities, which underperformed during this reporting period. Among the poorest performing market sectors were tobacco credits backed by the 1998 master tobacco settlement agreement, due to their lower credit ratings and the tendency of investors to avoid risk. Both NID and NIQ were overweight in tobacco bonds relative to the index, which detracted from the Funds’ performance. During this reporting period, NIQ sold out of its position in tobacco bonds issued by The Children’s Trust Fund (Puerto Rico).
During this reporting period, two major credit events weighed on the municipal market. The City of Detroit, burdened by decades of population loss, changes in the auto manufacturing industry and significant tax base deterioration, has been under severe financial stress for an extended period. On July 18, 2013, the city filed for Chapter 9 bankruptcy, the largest municipal bankruptcy filing in U.S. history. After several challenges, Detroit was ruled eligible for Chapter 9 bankruptcy protection on its $18.5 billion debt on December 3, 2013 (subsequent to the close of this reporting period). Although a number of creditors filed notices that they plan to appeal the eligibility ruling, the bankruptcy case will continue while these appeals are pending, and the city is expected to present its restructuring plan to the court by March 1, 2014. Detroit’s bankruptcy will likely be a lengthy one, given the complexity of its debt portfolio, number of creditors, numerous union contracts, and significant legal questions that must be addressed. It is not yet clear how this bankruptcy will impact the actual creditworthiness, or the market’s perception of that creditworthiness, of other municipalities in Michigan. During this reporting period, both NID and NIQ had exposure to Detroit credits.
Portfolio Managers’ Comments (continued)
In NID, our holdings consisted largely of city water and sewer bonds. In addition, these bonds are supported by revenue streams generated by service fees. During this reporting period, NID sold out of its position in uninsured Detroit GOs, but continued to hold insured Detroit GOs. As of November 30, 2013, NIQ held two positions in insured Detroit GOs and a variety of water and sewer bonds, all of which were insured. NID and NIQ also held Detroit-related issues that are not obligations of the city and thus are not part of the bankruptcy filing. These included Detroit City School District bonds, which are backed by the state of Michigan, in NID and NIQ; Downtown Development Authority tax increment financing (TIF) bonds, which are backed by special pledged taxes, in NID; and Wayne County Airport, which is not a City of Detroit enterprise, in NIQ.
The second factor affecting the Funds’ holdings and performance were the multiple downgrades of debt issued by Puerto Rico in the aftermath of the commonwealth’s weakening economy and history of weak financial practices and high debt loads. In 2012, Moody’s downgraded Puerto Rico GO bonds to Baa3 from Baa1, Puerto Rico Sales Tax Financing Corporation (COFINA) senior sales tax revenue bonds to Aa3 from Aa2, and COFINA subordinate sales tax revenue bonds to A3 from A1. In October 2013, Moody’s further downgraded the COFINA senior sales tax bonds to A2, while affirming the subordinate bonds at A3. On November 14, 2013, Fitch Ratings announced that it was placing the majority of Puerto Rico issuance—with the exception of the COFINA bonds—on negative credit watch, which implies that another downgrade may be likely. While Fitch currently rates Puerto Rico issuance at BBB-, it affirmed the ratings on COFINA bonds at AA- for the senior bonds and A+ for the subordinate bonds, with stable outlooks. On December 11, 2013 (subsequent to the close of this reporting period), Moody’s announced that it also had placed its Baa3 rating on Puerto Rico GOs (and other Puerto Rico issues linked to the GO rating) on review for downgrade. These downgrades were based on Puerto Rico’s ongoing economic problems and, in the case of the COFINA bonds, the impact of these problems on the projected growth of sales tax revenues. However, the COFINA bonds were able to maintain a higher credit rating than the GOs because, unlike the revenue streams supporting some Puerto Rican issues, the sales taxes supporting the COFINA bonds cannot be diverted and used to support Puerto Rico’s GO bonds.
For the reporting period ended November 30, 2013, Puerto Rico paper underperformed the municipal market as a whole. During this reporting period, both NID and NIQ had exposure to Puerto Rico bonds. During the invest-up process in late 2012 and early 2013, our Puerto Rico positions were established with much of the current risk there already acknowledged. Because of that, we focused on purchasing Puerto Rico bonds that carried insurance protection or that had shorter maturities and therefore less price sensitivity. These credits benefited the Funds by offering higher yields, added diversification and triple exemption (i.e., exemption from federal, state, and local taxes). NID holds a variety of Puerto Rico credits, including insured GOs. During this reporting period, this Fund did some light trimming of these positions on a net basis, swapping some holdings for those offering relatively greater value. In addition to the sale of Puerto Rico tobacco bonds mentioned previously, NIQ sold its holdings of Puerto Rico aqueduct bonds in September and COFINA bonds in October.
Fund Leverage
IMPACT OF THE FUNDS’ LEVERAGE STRATEGIES ON PERFORMANCE
One important factor impacting the returns of the Funds relative to their comparative benchmarks was the Funds’ use of leverage through their issuance of preferred shares and/or investments in inverse floating rate securities, which represent leveraged investments in underlying bonds. The Funds use leverage because our research has shown that, over time, leveraging provides opportunities for additional income, particularly in the recent market environment where short-term market rates are at or near historical lows, meaning that the short-term rates the Fund has been paying on its leveraging instruments have been much lower than the interest the Fund has been earning on its portfolio of long-term bonds that it has bought with the proceeds of that leverage. However, use of leverage also can expose the Fund to additional price volatility. When a Fund uses leverage, the Fund will experience a greater increase in its net asset value if the municipal bonds acquired through the use of leverage increase in value, but it will also experience a correspondingly larger decline in its net asset value if the bonds acquired through leverage decline in value, which will make the Fund’s net asset value more volatile, and its total return performance more variable over time. In addition, income in levered funds will typically decrease in comparison to unlevered funds when short-term interest rates increase and increase when short-term interest rates decrease. Leverage detracted from the performance of both Funds over this reporting period.
As of November 30, 2013, the Funds’ percentages of effective and regulatory leverage are as shown in the accompanying table.
| | | | NID | | | NIQ | |
| Effective Leverage* | | | 36.76% | | | 38.08% | |
| Regulatory Leverage* | | | 22.67% | | | 24.67% | |
| * | Effective Leverage is a Fund’s effective economic leverage, and includes both regulatory leverage and the leverage effects of certain derivative and other investments in a Fund’s portfolio that increase the Fund’s investment exposure. Currently, the leverage effects of Tender Option Bond (TOB) inverse floater holdings are included in effective leverage values, in addition to any regulatory leverage. Regulatory leverage consists of preferred shares issued or borrowings of a Fund. Both of these are part of a Fund’s capital structure. Regulatory leverage is subject to asset coverage limits set forth in the Investment Company Act of 1940. |
THE FUNDS’ REGULATORY LEVERAGE
As of November 30, 2013, the Funds have issued and outstanding Variable Rate MuniFund Term Preferred (VMTP) Shares as shown in the accompanying table.
| | | | VMTP Shares | |
| | | | | | | Shares Issued at | |
| | | | | | | Liquidation | |
| Fund | | | Series | | | Value | |
| NID | | | 2016 | | | $175,000,000 | |
| NIQ | | | 2016 | | | $ 55,000,000 | |
Refer to Notes to Financial Statements, Note 1 – General Information and Significant Accounting Policies for further details on VMTP Shares.
Common Share Information
COMMON SHARE DIVIDEND INFORMATION
During the current reporting period ended November 30, 2013, the Funds’ monthly dividends to common shareholders were as shown in the accompanying table.
| | | Per Common Share Amounts | |
| | | | NID | | | NIQ | |
| June | | | $0.0550 | | | $0.0480 | |
| July | | | 0.0550 | | | 0.0480 | |
| August | | | 0.0550 | | | 0.0480 | |
| September | | | 0.0550 | | | 0.0480 | |
| October | | | 0.0550 | | | 0.0480 | |
| November | | | 0.0550 | | | 0.0480 | |
| | | | | | | | |
| Market Yield** | | | 5.91% | | | 5.09% | |
| Taxable-Equivalent Yield** | | | 8.21% | | | 7.07% | |
| ** | Market Yield is based on the Fund’s current annualized monthly dividend divided by the Fund’s current market price as of the end of the reporting period. Taxable-Equivalent Yield represents the yield that must be earned on a fully taxable investment in order to equal the yield of the Fund on an after-tax basis. It is based on a federal income tax rate of 28.0%. When comparing a Fund to investments that generate taxable qualified dividend income, the Taxable-Equivalent Yield would be lower. |
The Funds in this report seek to pay stable dividends at rates that reflect each Fund’s past results and projected future performance. During certain periods, each Fund may pay dividends at a rate that may be more or less than the amount of net investment income actually earned by the Fund during the period. If a Fund has cumulatively earned more than it has paid in dividends, it holds the excess in reserve as undistributed net investment income (UNII) as part of the Fund’s NAV. Conversely, if a Fund has cumulatively paid dividends in excess of its earnings, the excess constitutes negative UNII that is likewise reflected in the Fund’s NAV. Each Fund will, over time, pay all of its net investment income as dividends to shareholders. As of November 30, 2013, both Funds in this report had positive UNII balances, based upon our best estimate, for tax purposes and positive UNII balances for financial reporting purposes.
COMMON SHARE REPURCHASES
During November 2013, the Nuveen Funds’ Board of Directors/Trustees authorized an open-market share repurchase program, allowing each Fund to repurchase an aggregate of up to approximately 10% of its outstanding shares.
Since the inception of the Funds’ repurchase programs, the Funds have not repurchased any of their outstanding shares.
| | | | NID | | | NIQ | |
| Common Shares Cumulatively Repurchased and Retired | | | — | | | — | |
| Common Shares Authorized for Repurchase | | | 4,690,000 | | | 9,560,000 | |
OTHER COMMON SHARE INFORMATION
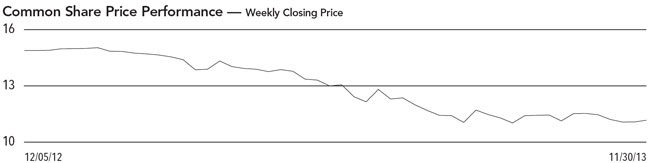
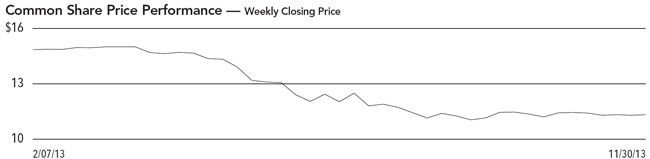
As of November 30, 2013, and during the current reporting period, the Funds’ common share prices were trading at a premium/(discount) to their common share NAVs as shown in the accompanying table.
| | | | | | | |
| | | NID | | | NIQ | |
| Common Share NAV | | $ | 12.73 | | | $ | 12.83 | |
| Common Share Price | | $ | 11.17 | | | $ | 11.32 | |
| Premium/(Discount) to NAV | | | (12.25 | )% | | | (11.77 | )% |
| 6-Month Average Premium/(Discount) to NAV | | | (8.98 | )% | | | (9.56 | )% |
Risk Considerations
Fund shares are not guaranteed or endorsed by any bank or other insured depository institution, and are not federally insured by the Federal Deposit Insurance Corporation. Past performance is no guarantee of future results. Fund common shares are subject to a variety of risks, including:
Investment, Market and Price Risk. An investment in common shares is subject to investment risk, including the possible loss of the entire principal amount that you invest. Your investment in common shares represents an indirect investment in the municipal securities owned by the Funds, which generally trade in the over-the-counter markets. Shares of closed-end investment companies like these Funds frequently trade at a discount to their net asset value (NAV). Your common shares at any point in time may be worth less than your original investment, even after taking into account the reinvestment of Fund dividends and distributions.
Tax Risk. The tax treatment of Fund distributions may be affected by new IRS interpretations of the Internal Revenue Code and future changes in tax laws and regulations.
Issuer Credit Risk. This is the risk that a security in a Fund’s portfolio will fail to make dividend or interest payments when due.
Ten-Year Term Risk. The Funds have a ten year term, at which time each Fund will liquidate its portfolio investments and return the proceeds to its shareholders at that time. The Funds’ investment objectives and policies are not designed to return a shareholder’s initial investment.
Interest Rate Risk. Fixed-income securities such as bonds, preferred, convertible and other debt securities will decline in value if market interest rates rise.
Reinvestment Risk. If market interest rates decline, income earned from a Fund’s portfolio may be reinvested at rates below that of the original bond that generated the income.
Call Risk or Prepayment Risk. Issuers may exercise their option to prepay principal earlier than scheduled, forcing a Fund to reinvest in lower-yielding securities.
Inverse Floater Risk. The Funds may invest in inverse floaters. Due to their leveraged nature, these investments can greatly increase a Fund’s exposure to interest rate risk and credit risk. In addition, investments in inverse floaters involve the risk that the Fund could lose more than its original principal investment.
Derivatives Risk. The Funds may use derivative instruments which involve a high degree of financial risk, including the risk that the loss on a derivative may be greater than the principal amount investment.
Leverage Risk. Each Fund’s use of leverage creates the possibility of higher volatility for the Fund’s per share NAV, market price, distributions and returns. There is no assurance that a Fund’s leveraging strategy will be successful. Certain aspects of the recently adopted Volcker Rule may limit the availability of tender option bonds, which are used by the Funds for leveraging and duration management purposes. The effects of this new Rule, expected to take effect in mid-2015, may make it more difficult for a Fund to maintain current or desired levels of leverage and may cause the Fund to incur additional expenses to maintain its leverage.
| NID | |
| | Nuveen Intermediate Duration Municipal Term Fund |
| | Performance Overview and Holding Summaries as of November 30, 2013 |
| Average Annual Total Returns as of November 30, 2013 | | | | |
| | Cumulative |
| | 6 – Month | | Since Inception1 | |
| NID at Common Share NAV | (6.96)% | | (7.39)% | |
| NID at Common Share Price | (11.62)% | | (22.17)% | |
| S&P Municipal Bond Intermediate Index | (1.04)% | | (1.91)% | |
| Lipper General & Insured Leveraged Municipal Debt Funds Classification Average | (7.58)% | | (7.42)% | |
Past performance is not predictive of future results. Current performance may be higher or lower than the data shown. Returns do not reflect the deduction of taxes that shareholders may have to pay on Fund distributions or upon the sale of Fund shares. Comparative index and Lipper return information is provided for the Fund’s shares at NAV only. Indexes and Lipper averages are not available for direct investment.
Portfolio Composition2,5 | | | | |
| (as a % of total investments) | | | | |
| Tax Obligation/Limited | | | 26.4 | % |
| Health Care | | | 10.4 | % |
| Consumer Staples | | | 9.1 | % |
| Transportation | | | 8.7 | % |
| Tax Obligation/General | | | 8.1 | % |
| Education and Civic Organizations | | | 8.0 | % |
| Industrials | | | 6.9 | % |
| Utilities | | | 5.8 | % |
| Other | | | 16.6 | % |
Credit Quality2,3,4 | | | | |
| (as a % of total investment exposure) | | | | |
| AA | | | 16.1 | % |
| A | | | 20.9 | % |
| BBB | | | 14.8 | % |
| BB or lower | | | 27.0 | % |
| N/R | | | 20.0 | % |
States2,5 | | | | |
| (as a % of total investments) | | | | |
| California | | | 9.9 | % |
| Texas | | | 8.7 | % |
| Illinois | | | 8.1 | % |
| Florida | | | 8.1 | % |
| Ohio | | | 5.6 | % |
| New Jersey | | | 5.4 | % |
| New York | | | 5.0 | % |
| Puerto Rico | | | 4.7 | % |
| Michigan | | | 4.2 | % |
| Pennsylvania | | | 3.8 | % |
| Colorado | | | 3.1 | % |
| Alabama | | | 3.1 | % |
| Virginia | | | 2.5 | % |
| National | | | 1.8 | % |
| Wisconsin | | | 1.7 | % |
| Guam | | | 1.6 | % |
| Iowa | | | 1.6 | % |
| Kansas | | | 1.5 | % |
| Washington | | | 1.5 | % |
| Other | | | 18.1 | % |
Refer to the Glossary of Terms Used in this Report for further definition of the terms used within this page.
| 1 | Since inception returns are from 12/5/12. |
| 2 | Holdings are subject to change. |
| 3 | Ratings shown are the highest rating given by one of the following national rating agencies: Standard & Poor’s Group, Moody’s Investors Service, Inc. or Fitch, Inc. Credit ratings are subject to change. AAA, AA, A and BBB are investment grade ratings; BB, B, CCC, CC, C and D are below-investment grade ratings. Certain bonds backed by U.S. Government or agency securities are regarded as having an implied rating equal to the rating of such securities. Holdings designated N/R are not rated by these national rating agencies. |
| 4 | Percentages may not add to 100% due to the exclusion of other assets less liabilities from the table. |
| 5 | Excluding investments in derivatives. |
| NIQ | |
| | Nuveen Intermediate Duration Quality Municipal Term Fund |
| | Performance Overview and Holding Summaries as of November 30, 2013 |
| Average Annual Total Returns as of November 30, 2013 | | | | |
| | Cumulative |
| | 6 – Month | | Since Inception1 | |
| NIQ at Common Share NAV | (7.07)% | | (7.78)% | |
| NIQ at Common Share Price | (11.36)% | | (22.10)% | |
| S&P Municipal Bond Intermediate Index | (1.04)% | | (1.29)% | |
| Lipper Intermediate Municipal Debt Funds Classification Average | (3.96)% | | (7.82)% | |
Past performance is not predictive of future results. Current performance may be higher or lower than the data shown. Returns do not reflect the deduction of taxes that shareholders may have to pay on Fund distributions or upon the sale of Fund shares. Comparative index and Lipper return information is provided for the Fund’s shares at NAV only. Indexes and Lipper averages are not available for direct investment.
Portfolio Composition2,5 | | | | |
| (as a % of total investments) | | | | |
| Tax Obligation/Limited | | | 20.5 | % |
| Tax Obligation/General | | | 13.8 | % |
| Health Care | | | 13.1 | % |
| Utilities | | | 13.1 | % |
| Education and Civic Organizations | | | 10.9 | % |
| Transportation | | | 10.5 | % |
| Consumer Staples | | | 6.7 | % |
| Other | | | 11.4 | % |
Credit Quality2,3,4 | | | | |
| (as a % of total investment exposure) | | | | |
| AAA/U.S. Guaranteed | | | 1.0 | % |
| AA | | | 33.5 | % |
| A | | | 25.7 | % |
| BBB | | | 16.7 | % |
| BB or Lower | | | 12.5 | % |
| N/R | | | 8.8 | % |
States2,5 | | | | |
| (as a % of total investments) | | | | |
| California | | | 13.3 | % |
| New Jersey | | | 9.2 | % |
| Michigan | | | 8.0 | % |
| Illinois | | | 7.2 | % |
| Florida | | | 6.7 | % |
| Texas | | | 5.8 | % |
| Tennessee | | | 4.8 | % |
| Puerto Rico | | | 3.9 | % |
| Ohio | | | 3.8 | % |
| Pennsylvania | | | 3.7 | % |
| New York | | | 3.2 | % |
| Rhode Island | | | 2.8 | % |
| Iowa | | | 2.7 | % |
| Georgia | | | 2.6 | % |
| Colorado | | | 2.6 | % |
| Other | | | 19.7 | % |
Refer to the Glossary of Terms Used in this Report for further definition of the terms used within this page.
| 1 | Since inception returns are from 2/7/13. |
| 2 | Holdings are subject to change. |
| 3 | Ratings shown are the highest rating given by one of the following national rating agencies: Standard & Poor’s Group, Moody’s Investors Service, Inc. or Fitch, Inc. Credit ratings are subject to change. AAA, AA, A and BBB are investment grade ratings; BB, B, CCC, CC, C and D are below-investment grade ratings. Certain bonds backed by U.S. Government or agency securities are regarded as having an implied rating equal to the rating of such securities. Holdings designated N/R are not rated by these national rating agencies. |
| 4 | Percentage may not add to 100% due to the exclusion of other assets less liabilities from the table. |
| 5 | Excluding investments in derivatives. |
| NID | |
| | Nuveen Intermediate Duration Municipal Term Fund |
| | Portfolio of Investments |
| | November 30, 2013 (Unaudited) |
| | Principal | | | Optional Call | | | | | | |
| | Amount (000) | | Description (1) | Provisions (2) | | Ratings (3) | | | Value | |
| | | | LONG-TERM INVESTMENTS – 127.4% (100.0% of Total Investments) | | | | | | | |
| | | | MUNICIPAL BONDS – 127.4% (100.0% of Total Investments) | | | | | | | |
| | | | National – 2.3% (1.8% of Total Investments) | | | | | | | |
| | | | MuniMae Tax-Exempt Bond Subsidiary Redeemable Preferred Shares, Multifamily Housing Pool: | | | | | | | |
| $ | 7,703 | | 5.000%, 1/31/28 (Mandatory put 1/31/18) (Alternative Minimum Tax) | 1/18 at 100.00 | | Ba1 | | $ | 7,636,413 | |
| | 5,000 | | 5.750%, 6/30/50 (Mandatory put 9/30/19) (Alternative Minimum Tax) | 5/14 at 100.00 | | Ba2 | | | 4,957,700 | |
| | 1,000 | | 4.900%, 7/31/49 (Mandatory put 9/30/14) (Alternative Minimum Tax) | 9/14 at 100.00 | | Ba1 | | | 989,980 | |
| | 13,703 | | Total National | | | | | | 13,584,093 | |
| | | | Alabama – 4.0% (3.1% of Total Investments) | | | | | | | |
| | 235 | | Jefferson County Public Building Authority, Alabama, Lease Revenue Warrants, Series 2006, 5.125%, 4/01/21 – AMBAC Insured | 4/16 at 100.00 | | CC | | | 209,526 | |
| | 7,000 | | Jefferson County, Alabama, General Obligation Refunding Warrants, Series 2003A, 5.000%, 4/01/22 – NPFG Insured | 2/14 at 100.00 | | A | | | 6,607,230 | |
| | 665 | | Jefferson County, Alabama, General Obligation Warrants, Series 2004A, 5.000%, 4/01/18 – NPFG Insured | 4/14 at 100.00 | | A | | | 646,633 | |
| | | | Jefferson County, Alabama, Limited Obligation School Warrants, Education Tax Revenue Bonds, Series 2004A: | | | | | | | |
| | 625 | | 5.250%, 1/01/16 | 1/14 at 100.00 | | B | | | 623,313 | |
| | 13,415 | | 5.250%, 1/01/20 | 1/14 at 100.00 | | B | | | 13,356,376 | |
| | 200 | | 5.500%, 1/01/22 – AGM Insured | 1/14 at 100.00 | | AA | | | 200,240 | |
| | 2,000 | | 5.250%, 1/01/23 | 1/14 at 100.00 | | B | | | 1,960,300 | |
| | 24,140 | | Total Alabama | | | | | | 23,603,618 | |
| | | | Alaska – 0.3% (0.2% of Total Investments) | | | | | | | |
| | 2,000 | | Northern Tobacco Securitization Corporation, Alaska, Tobacco Settlement Asset-Backed Bonds, Series 2006A, 5.000%, 6/01/32 | 6/14 at 100.00 | | B2 | | | 1,515,440 | |
| | | | Arizona – 0.9% (0.7% of Total Investments) | | | | | | | |
| | 1,000 | | Arizona Health Facilities Authority, Health Care Facilities Revenue Bonds, The Beatitudes Campus Project, Series 2006, 5.100%, 10/01/22 | 10/16 at 100.00 | | N/R | | | 937,430 | |
| | | | Downtown Phoenix Hotel Corporation, Arizona, Senior Revenue Bonds, Series 2005A: | | | | | | | |
| | 260 | | 4.125%, 7/01/19 – FGIC Insured | No Opt. Call | | BB+ | | | 245,198 | |
| | 200 | | 5.250%, 7/01/22 – FGIC Insured | 1/16 at 100.00 | | BB+ | | | 201,680 | |
| | 270 | | 5.250%, 7/01/25 – FGIC Insured | No Opt. Call | | BB+ | | | 270,940 | |
| | | | Florence Town Inc., Industrial Development Authority, Arizona, Education Revenue Bonds, Legacy Traditional School Project – Queen Creek and Casa Grande Campuses, Series 2013: | | | | | | | |
| | 150 | | 4.000%, 7/01/18 | No Opt. Call | | BB | | | 148,632 | |
| | 800 | | 5.000%, 7/01/23 | No Opt. Call | | BB | | | 752,824 | |
| | 100 | | Phoenix Industrial Development Authority, Arizona, Education Revenue Bonds, Great Hearts Academies – Veritas Project, Series 2012, 6.250%, 7/01/32 | 7/21 at 100.00 | | BB | | | 98,163 | |
| | 760 | | Pima County Industrial Development Authority, Arizona, Education Facility Revenue and Refunding Bonds, Edkey Charter Schools Project, Series 2013, 5.000%, 7/01/25 | 7/20 at 102.00 | | BB+ | | | 700,857 | |
| | 800 | | University Medical Center Corporation, Tucson, Arizona, Hospital Revenue Bonds, Series 2011, 5.000%, 7/01/19 | No Opt. Call | | BBB+ | | | 882,192 | |
| | 996 | | Watson Road Community Facilities District, Arizona, Special Assessment Revenue Bonds, Series 2005, 5.750%, 7/01/22 | 7/16 at 100.00 | | N/R | | | 1,015,213 | |
| | 5,336 | | Total Arizona | | | | | | 5,253,129 | |
| | | | California – 12.7% (9.9% of Total Investments) | | | | | | | |
| | 3,050 | | ABAG Finance Authority for Nonprofit Corporations, California, Revenue Bonds, Sharp HealthCare, Series 2009B, 6.375%, 8/01/34 | 8/14 at 100.00 | | A+ | | | 3,144,306 | |
| NID | Nuveen Intermediate Duration Municipal Term Fund (continued) |
| | Portfolio of Investments November 30, 2013 (Unaudited) |
| | Principal | | | Optional Call | | | | | | |
| | Amount (000) | | Description (1) | Provisions (2) | | Ratings (3) | | | Value | |
| | | | California (continued) | | | | | | | |
| $ | 100 | | Alameda Corridor Transportation Authority, California, Revenue Bonds, Refunding Subordinate Lien Series 2004A, 5.300%, 10/01/23 – AMBAC Insured | No Opt. Call | | BBB+ | | $ | 107,525 | |
| | 2,490 | | Alvord Unified School District, Riverside County, California, General Obligation Bonds, Tender Option Bond 3306, 26.213%, 8/01/23 (IF) (4) | No Opt. Call | | AA– | | | 4,685,558 | |
| | 750 | | Bay Area Toll Authority, California, Revenue Bonds, San Francisco Bay Area Toll Bridge, Tender Option Bond Trust 4740, 3.440%, 4/01/36 (IF) (4) | 10/26 at 100.00 | | AA | | | 734,040 | |
| | | | California Statewide Community Development Authority, Revenue Bonds, International School of the Peninsula, Palo Alto, California, Series 2006: | | | | | | | |
| | 1,190 | | 5.000%, 11/01/16 | No Opt. Call | | N/R | | | 1,240,206 | |
| | 2,125 | | 5.000%, 11/01/21 | 11/16 at 100.00 | | N/R | | | 2,166,629 | |
| | 5,000 | | Compton Community Redevelopment Agency, California, Tax Allocation Revenue Bonds, Redevelopment Projects, Second Lien Series 2010B, 5.750%, 8/01/26 | 8/20 at 100.00 | | N/R | | | 5,050,550 | |
| | 2,000 | | Foothill/Eastern Transportation Corridor Agency, California, Toll Road Revenue Bonds, Series 1995A, 5.000%, 1/01/35 – NPFG Insured | 1/14 at 100.00 | | A | | | 1,854,800 | |
| | | | Foothill/Eastern Transportation Corridor Agency, California, Toll Road Revenue Refunding Bonds, Series 1999: | | | | | | | |
| | 8,750 | | 0.000%, 1/15/33 | No Opt. Call | | BBB– | | | 2,417,188 | |
| | 5,000 | | 0.000%, 1/15/34 | No Opt. Call | | BBB– | | | 1,291,400 | |
| | | | Golden State Tobacco Securitization Corporation, California, Tobacco Settlement Asset-Backed Bonds, Series 2007A-1: | | | | | | | |
| | 14,425 | | 4.500%, 6/01/27 | 6/17 at 100.00 | | B | | | 12,075,168 | |
| | 5,100 | | 5.000%, 6/01/33 | 6/17 at 100.00 | | B | | | 3,842,493 | |
| | 3,475 | | Hesperia Public Financing Authority, California, Redevelopment and Housing Projects Tax Allocation Bonds, Series 2007A, 5.500%, 9/01/17 – SYNCORA GTY Insured | No Opt. Call | | N/R | | | 3,804,500 | |
| | 310 | | Indio Redevelopment Agency, California, Tax Allocation Bonds, Merged Area Redevelopment Project, Subordinate Lien Refunding Series 2008A, 5.000%, 8/15/23 | 8/18 at 100.00 | | BBB– | | | 306,807 | |
| | 250 | | National City Community Development Commission, California, Tax Allocation Bonds, National City Redevelopment Project, Series 2011, 7.000%, 8/01/32 | 8/21 at 100.00 | | A– | | | 291,385 | |
| | 495 | | Oak Valley Hospital District, Stanislaus County, California, General Obligation Bonds, Series 2005, 4.500%, 7/01/25 – FGIC Insured | 7/14 at 101.00 | | A2 | | | 496,604 | |
| | | | Palm Desert Financing Authority, California, Tax Allocation Revenue Bonds, Project Area 2, Series 2006D: | | | | | | | |
| | 1,020 | | 0.000%, 8/01/18 | No Opt. Call | | N/R | | | 797,069 | |
| | 1,165 | | 0.000%, 8/01/19 | No Opt. Call | | N/R | | | 853,572 | |
| | 1,310 | | 0.000%, 8/01/20 | No Opt. Call | | N/R | | | 898,608 | |
| | 1,450 | | 0.000%, 8/01/21 | No Opt. Call | | N/R | | | 928,319 | |
| | | | Palomar Pomerado Health Care District, California, Certificates of Participation, Series 2009: | | | | | | | |
| | 2,430 | | 5.500%, 11/01/19 | No Opt. Call | | Baa3 | | | 2,591,401 | |
| | 5,000 | | 6.625%, 11/01/29 | 11/19 at 100.00 | | Baa3 | | | 5,186,750 | |
| | 700 | | Redwood City, California, Special Tax Refunding Bonds, Redwood Shores Community Facilities District 99-1, Shores Transportation Improvement Project, Series 2012B, 5.000%, 9/01/29 | No Opt. Call | | N/R | | | 728,133 | |
| | 390 | | Riverside County, California, Community Facilities District 05-8, Scott Road, Special Tax Bonds Series 2013, 4.000%, 9/01/21 | No Opt. Call | | N/R | | | 391,014 | |
| | 2,395 | | San Bernardino Joint Powers Financing Authority, California, Tax Allocation Bonds, Series 2005A, 5.750%, 10/01/24 – AGM Insured | No Opt. Call | | AA– | | | 2,557,165 | |
| | 175 | | San Diego County, California, Certificates of Participation, Burnham Institute, Series 2006, 5.000%, 9/01/16 | 9/15 at 102.00 | | Baa2 | | | 187,201 | |
| | 260 | | San Diego, California, Community Facilities District 3 Liberty Station Special Tax Refunding Bonds Series 2013, 5.000%, 9/01/20 | No Opt. Call | | N/R | | | 287,053 | |
| | 420 | | San Jose Redevelopment Agency, California, Tax Allocation Bonds, Merged Area Redevelopment Project, Series 2003, 5.000%, 8/01/25 – FGIC Insured | 2/14 at 100.00 | | A | | | 420,063 | |
| | | | San Jose Redevelopment Agency, California, Tax Allocation Bonds, Merged Area Redevelopment Project, Series 2006D: | | | | | | | |
| | 100 | | 5.000%, 8/01/18 – AMBAC Insured | 8/17 at 100.00 | | BBB | | | 109,268 | |
| | 500 | | 5.000%, 8/01/21 – AMBAC Insured | 8/17 at 100.00 | | BBB | | | 521,930 | |
| | 550 | | San Jose Redevelopment Agency, California, Tax Allocation Bonds, Merged Area Redevelopment Project, Series 2007B, 5.000%, 8/01/19 – SYNCORA GTY Insured | No Opt. Call | | BBB | | | 585,002 | |
| | Principal | | | Optional Call | | | | | | |
| | Amount (000) | | Description (1) | Provisions (2) | | Ratings (3) | | | Value | |
| | | | California (continued) | | | | | | | |
| $ | 1,500 | | Tejon Ranch Public Facilities Financing Authority, California, Community Facilities District 2008-1 Tejon Industrial Complex East 2012A, 5.000%, 9/01/32 | No Opt. Call | | N/R | | $ | 1,386,360 | |
| | 1,500 | | Tejon Ranch Public Facilities Financing Authority, California, Community Facilities District 2008-1 Tejon Industrial Complex East 2012B, 5.000%, 9/01/32 | No Opt. Call | | N/R | | | 1,386,360 | |
| | 10,000 | | Tobacco Securitization Authority of Northern California, Tobacco Settlement Asset-Backed Bonds, Refunding Series 2005A-2, 5.400%, 6/01/27 | 6/17 at 100.00 | | B+ | | | 9,113,200 | |
| | 1,610 | | Tobacco Securitization Authority of Northern California, Tobacco Settlement Asset-Backed Bonds, Series 2005A-1, 4.750%, 6/01/23 | 6/15 at 100.00 | | B+ | | | 1,481,152 | |
| | 1,080 | | Ventura County Public Financing Authority, California, Lease Revenue Bonds Series 2013A, 5.000%, 11/01/24 | 11/22 at 100.00 | | AA+ | | | 1,211,684 | |
| | 400 | | Vernon, California, Electric System Revenue Bonds, Series 2009A, 5.125%, 8/01/21 | 8/19 at 100.00 | | A– | | | 433,176 | |
| | 88,465 | | Total California | | | | | | 75,563,639 | |
| | | | Colorado – 4.0% (3.1% of Total Investments) | | | | | | | |
| | 505 | | Bromley Park Metropolitan District 2, Brighton, Colorado, General Obligation Bonds, Refunding Series 2007A, 4.375%, 12/01/18 – RAAI Insured | 12/17 at 100.00 | | N/R | | | 523,054 | |
| | 4,005 | | Castle Oaks Metropolitan District, In the Town of Castle Rock, Douglas County, Colorado, General Obligation Bonds, Limited Tax Refunding and Improvement Series 2012, 5.500%, 12/01/22 | No Opt. Call | | N/R | | | 3,741,111 | |
| | 1,010 | | Colorado Educational and Cultural Facilities Authority, Charter School Revenue Bonds, Academy of Charter Schools Project, Series 2010B, 6.125%, 11/01/20 | No Opt. Call | | B– | | | 1,034,796 | |
| | 500 | | Colorado Educational and Cultural Facilities Authority, Charter School Revenue Bonds, Flagstaff Academy Project, Series 2008A, 6.750%, 8/01/28 | 8/18 at 100.00 | | N/R | | | 506,410 | |
| | 200 | | Colorado Educational and Cultural Facilities Authority, Charter School Revenue Bonds, Littleton Preparatory Charter School, Series 2013, 5.000%, 12/01/22 | No Opt. Call | | BBB– | | | 199,856 | |
| | 975 | | Colorado Health Facilities Authority, Colorado, Revenue Bonds, Total Longterm Care National Obligated Group Project, Series 2010A, 5.250%, 11/15/20 | No Opt. Call | | BBB | | | 1,062,175 | |
| | 979 | | Colorado Housing and Finance Authority, Revenue Bonds, Confluence Energy LLC Project, Series 2013, 6.875%, 10/01/27 (Alternative Minimum Tax) | No Opt. Call | | N/R | | | 879,409 | |
| | 3,270 | | Colorado Springs, Colorado, Utilities System Revenue Bonds, Tender Option Bond Trust 2012-5A, 14.194%, 11/15/30 (IF) | 11/22 at 100.00 | | AA | | | 3,221,996 | |
| | | | Colorado State Board of Governors, Colorado State University Auxiliary Enterprise System Revenue Bonds, Tender Option Bond Trust 3316: | | | | | | | |
| | 100 | | 22.813%, 9/01/22 (IF) (4) | No Opt. Call | | Aa2 | | | 177,335 | |
| | 300 | | 22.813%, 3/01/23 (IF) (4) | No Opt. Call | | Aa2 | | | 515,700 | |
| | 430 | | 22.761%, 3/01/24 (IF) (4) | No Opt. Call | | Aa2 | | | 704,796 | |
| | 725 | | 22.813%, 3/01/25 (IF) (4) | No Opt. Call | | Aa2 | | | 1,167,576 | |
| | 200 | | 22.813%, 9/01/25 (IF) (4) | No Opt. Call | | Aa2 | | | 311,490 | |
| | 3,385 | | Denver Convention Center Hotel Authority, Colorado, Revenue Bonds, Convention Center Hotel, Senior Lien Series 2006, 5.125%, 12/01/24 – SYNCORA GTY Insured | 11/16 at 100.00 | | BBB– | | | 3,485,298 | |
| | 300 | | E-470 Public Highway Authority, Colorado, Senior Revenue Bonds, Series 2007C-1, 5.500%, 9/01/24 – NPFG Insured | No Opt. Call | | A | | | 317,505 | |
| | 250 | | Lincoln Park Metropolitan District, Douglas County, Colorado, General Obligation Refunding and Improvement Bonds, Series 2008, 5.625%, 12/01/20 | 12/17 at 100.00 | | BBB– | | | 257,525 | |
| | 225 | | North Range Metropolitan District 1, Adams County, Colorado, Limited Tax General Obligation Bonds, Refunding Series 2007, 4.300%, 12/15/19 – ACA Insured | 12/16 at 100.00 | | N/R | | | 221,141 | |
| | | | Plaza Metropolitan District 1, Lakewood, Colorado, Tax Increment Revenue Bonds, Refunding Series 2013: | | | | | | | |
| | 500 | | 5.000%, 12/01/18 | No Opt. Call | | N/R | | | 533,335 | |
| | 1,000 | | 5.000%, 12/01/21 | No Opt. Call | | N/R | | | 1,033,700 | |
| | 625 | | Rendezous Residential Metropolitan District, Colorado, Limited Tax General Obligation Bonds, Refunding Series 2007, 5.200%, 12/01/17 | No Opt. Call | | N/R | | | 586,769 | |
| | 3,150 | | Westminster Economic Development Authority, Colorado, Tax Increment Revenue Bonds, Mandalay Gardens Urban Renewal Project, Series 2012, 5.000%, 12/01/27 | No Opt. Call | | A | | | 3,328,070 | |
| | 22,634 | | Total Colorado | | | | | | 23,809,047 | |
| NID | Nuveen Intermediate Duration Municipal Term Fund (continued) |
| | Portfolio of Investments November 30, 2013 (Unaudited) |
| | Principal | | | Optional Call | | | | | | |
| | Amount (000) | | Description (1) | Provisions (2) | | Ratings (3) | | | Value | |
| | | | Connecticut – 0.7% (0.5% of Total Investments) | | | | | | | |
| $ | 5,955 | | Mashantucket Western Pequot Tribe, Connecticut, Special Revenue Bonds, Subordinate Series 2013A, 6.050%, 7/01/31 | No Opt. Call | | N/R | | $ | 4,092,614 | |
| | | | District of Columbia – 0.6% (0.5% of Total Investments) | | | | | | | |
| | | | District of Columbia Student Dormitory Revenue Bonds, Provident Group – Howard Properties LLC Issue, Series 2013: | | | | | | | |
| | 500 | | 4.000%, 10/01/19 | No Opt. Call | | BBB– | | | 494,655 | |
| | 500 | | 4.000%, 10/01/20 | No Opt. Call | | BBB– | | | 485,385 | |
| | 670 | | 4.000%, 10/01/21 | No Opt. Call | | BBB– | | | 634,725 | |
| | | | District of Columbia, Tax Increment Revenue Bonds, Gallery Place Project, Tender Option Bond Trust 1187: | | | | | | | |
| | 745 | | 21.565%, 6/01/29 (IF) (4) | 6/21 at 100.00 | | A1 | | | 855,335 | |
| | 785 | | 21.484%, 6/01/30 (IF) (4) | 6/21 at 100.00 | | A1 | | | 885,794 | |
| | 520 | | 21.565%, 6/01/31 (IF) (4) | 6/21 at 100.00 | | A1 | | | 568,854 | |
| | 3,720 | | Total District of Columbia | | | | | | 3,924,748 | |
| | | | Florida – 10.3% (8.1% of Total Investments) | | | | | | | |
| | | | Atlantic Beach, Florida, Healthcare Facilities Revenue Refunding Bonds, Fleet Landing Project, Series 2013A: | | | | | | | |
| | 425 | | 5.000%, 11/15/20 | No Opt. Call | | BBB | | | 466,489 | |
| | 150 | | 5.000%, 11/15/23 | No Opt. Call | | BBB | | | 159,293 | |
| | 125 | | Boynton Beach, Florida, Revenue Bonds, Charter Schools of Boynton Beach, Series 2012A, 5.750%, 6/01/22 | No Opt. Call | | B | | | 116,856 | |
| | 430 | | Capital Projects Finance Authority, Florida, Student Housing Revenue Bonds, Capital Projects Loan Program, Series 2001F-1, 5.000%, 10/01/31 – NPFG Insured | 2/14 at 100.00 | | A | | | 394,731 | |
| | 2,460 | | Capital Trust Agency, Florida, Fixed Rate Air Cargo Revenue Refunding Bonds, Aero Miami FX, LLC Project, Series 2010A, 5.350%, 7/01/29 | 7/20 at 100.00 | | Baa3 | | | 2,523,124 | |
| | 1,000 | | Collier County Educational Facilities Authority, Florida, Revenue Bonds, Ave Maria University, Refunding Series 2013A, 4.500%, 6/01/23 | No Opt. Call | | BBB– | | | 978,170 | |
| | 3,915 | | Cory Lakes Community Development District, Florida, Special Assessment Bonds, Refunding Series 2001A, 7.200%, 5/01/23 | 1/14 at 100.00 | | N/R | | | 3,631,554 | |
| | 1,500 | | Escambia County, Florida, Environmental Improvement Revenue Bonds, International Paper Company Projects, Series 2006B, 5.000%, 8/01/26 (Alternative Minimum Tax) | 2/14 at 100.00 | | BBB | | | 1,499,910 | |
| | 3,500 | | Florida Development Finance Corporation, Educational Facilities Revenue Bonds, Renaissance Charter School, Inc. Projects, Series 2011A, 6.500%, 6/15/21 | No Opt. Call | | BB– | | | 3,522,085 | |
| | 400 | | Fontainbleau Lakes Community Development District, Miami-Dade County, Florida, Special Assessment Revenue Bonds, Series 2007B, 6.000%, 5/01/15 | No Opt. Call | | N/R | | | 409,212 | |
| | 1,255 | | Grand Bay at Doral Community Development District, Miami-Dade County, Florida, Special Assessment Bonds, Doral Breeze Project Series 2012, 5.125%, 11/01/22 | No Opt. Call | | N/R | | | 1,225,922 | |
| | | | Jacksonville, Florida, Economic Development Commission Health Care Facilities Revenue Bonds, Florida Proton Therapy Institute Project, Series 2007A: | | | | | | | |
| | 605 | | 6.000%, 9/01/17 | No Opt. Call | | N/R | | | 659,650 | |
| | 500 | | 6.250%, 9/01/27 | 9/17 at 100.00 | | N/R | | | 532,280 | |
| | | | Lake Powell Residential Golf Community Development District, Bay County, Florida, Special Assessment Revenue Refunding Bonds, Series 2012: | | | | | | | |
| | 1,555 | | 5.250%, 11/01/22 | No Opt. Call | | N/R | | | 1,542,000 | |
| | 1,310 | | 5.750%, 11/01/32 | No Opt. Call | | N/R | | | 1,235,055 | |
| | 2,500 | | Lee County Industrial Development Authority, Florida, Charter School Revenue Bonds, Lee County Community Charter Schools, Series 2007A, 5.250%, 6/15/27 | 6/17 at 100.00 | | BB | | | 2,406,150 | |
| | 1,000 | | Lee County Industrial Development Authority, Florida, Healthcare Facilities Revenue Bonds, Shell Point/Alliance Obligated Group, Shell Point Village/Alliance Community Project, Series 2007, 5.000%, 11/15/22 | 5/17 at 100.00 | | BB+ | | | 1,007,080 | |
| | 1,000 | | Live Oak Community Development District 2, Hillsborough County, Florida, Special Assessment Bonds. Series 2004A, 5.850%, 5/01/35 | 2/14 at 100.00 | | N/R | | | 982,940 | |
| | 405 | | Madison County, Florida, First Mortgage Revenue Bonds, Twin Oaks Project, Series 2005A, 6.000%, 7/01/25 (5) | 7/15 at 100.00 | | N/R | | | 374,386 | |
| | Principal | | | Optional Call | | | | | | |
| | Amount (000) | | Description (1) | Provisions (2) | | Ratings (3) | | | Value | |
| | | | Florida (continued) | | | | | | | |
| $ | 5,615 | | Martin County Industrial Development Authority, Florida, Industrial Development Revenue Refunding Bonds, Indiantown Cogeneration LP, Series 2013, 3.950%, 12/15/21 (Alternative Minimum Tax) | 6/20 at 100.00 | | Ba1 | | $ | 5,082,417 | |
| | | | Miami-Dade County Expressway Authority, Florida, Toll System Revenue Bonds, Tender Option Bond Trust 1156: | | | | | | | |
| | 700 | | 21.376%, 7/01/22 (IF) (4) | No Opt. Call | | A– | | | 1,195,250 | |
| | 820 | | 21.376%, 7/01/23 (IF) (4) | 7/22 at 100.00 | | A– | | | 1,324,546 | |
| | 1,115 | | 21.376%, 7/01/24 (IF) (4) | 7/22 at 100.00 | | A– | | | 1,693,629 | |
| | 800 | | 21.376%, 7/01/25 (IF) (4) | 7/22 at 100.00 | | A– | | | 1,170,360 | |
| | 1,510 | | Miromar Lakes Community Development District, Lee County, Florida, Capital Improvement Revenue Bonds, Refunding Series 2012, 4.875%, 5/01/22 | No Opt. Call | | N/R | | | 1,481,627 | |
| | 500 | | North Springs Improvement District, Broward County, Florida, Special Assessment Bonds, Heron Bay North Assessment Area, Series 2006B, 5.000%, 5/01/14 | No Opt. Call | | N/R | | | 500,320 | |
| | 2,500 | | North Springs Improvement District, Broward County, Florida, Special Assessment Bonds, Parkland Golf and Country Club Area A, Series 2005-A1, 5.450%, 5/01/26 | 5/15 at 100.00 | | N/R | | | 2,399,675 | |
| | 2,440 | | Northern Palm Beach County Improvement District, Florida, Special Assesment Revenue Bonds, Water Control and Improvement Refunding Bonds, Development Unit 16, Series 2012, 5.125%, 8/01/22 | No Opt. Call | | N/R | | | 2,396,153 | |
| | 900 | | Palm Beach County Health Facilities Authority, Florida, Revenue Bonds, Jupiter Medical Center, Series 2013A, 5.000%, 11/01/33 | 11/22 at 100.00 | | BBB+ | | | 896,031 | |
| | 5,400 | | Palm Glades Community Development District, Florida, Special Assessment Bonds, Series 2011B, 7.250%, 8/01/16 | No Opt. Call | | N/R | | | 5,637,870 | |
| | 1,455 | | Pelican Marsh Community Development District, Florida, Special Assessment Revenue Bonds, Refunding Series 2013, 3.500%, 5/01/19 | No Opt. Call | | N/R | | | 1,437,744 | |
| | 215 | | Seminole Tribe of Florida, Special Obligation Bonds, Series 2007A, 144A, 5.250%, 10/01/27 | 10/17 at 100.00 | | BBB– | | | 221,515 | |
| | 1,735 | | South-Dade Venture Community Development District, Florida, Special Assessment Revenue Bonds, Refunding Series 2012, 5.000%, 5/01/26 | No Opt. Call | | BBB– | | | 1,712,046 | |
| | 100 | | South-Dade Venture Community Development District, Florida, Special Assessment Revenue Bonds, Series 2004, 6.125%, 5/01/34 (Pre-refunded 5/01/14) | 5/14 at 101.00 | | N/R (6) | | | 103,420 | |
| | 1,130 | | Stonegate Community Development District, Florida, Special Assessment Revenue Bonds, Refunding Series 2013, 4.000%, 5/01/25 | 5/23 at 100.00 | | N/R | | | 1,056,866 | |
| | | | Tampa-Hillsborough County Expressway Authority, Florida, Revenue Bonds, Tender Option Bond Trust 1132: | | | | | | | |
| | 400 | | 21.475%, 7/01/27 (IF) (4) | 7/22 at 100.00 | | A– | | | 536,620 | |
| | 290 | | 21.475%, 7/01/28 (IF) (4) | 7/22 at 100.00 | | A– | | | 376,087 | |
| | 1,000 | | 16.526%, 7/01/29 (IF) (4) | 7/22 at 100.00 | | A– | | | 792,300 | |
| | 1,000 | | 16.526%, 7/01/30 (IF) (4) | 7/22 at 100.00 | | A– | | | 715,400 | |
| | 1,000 | | 21.475%, 7/01/31 (IF) (4) | 7/22 at 100.00 | | A– | | | 1,187,100 | |
| | 2,250 | | Venetian Community Development District, Sarasota County, Florida, Capital Improvement Revenue Bonds, Series 2012-A2, 5.000%, 5/01/23 | 5/22 at 100.00 | | N/R | | | 2,221,943 | |
| | 3,000 | | Verandah West Community Development District, Florida, Capital Improvement Revenue Bonds, Refunding Series 2013, 4.000%, 5/01/23 | No Opt. Call | | N/R | | | 2,743,170 | |
| | 765 | | Vizcaya in Kendall Community Development District, Florida, Special Assessment Revenue Bonds, Phase Two Assessment Area, Refunding Series 2012A-2, 5.600%, 5/01/22 | No Opt. Call | | N/R | | | 750,633 | |
| | 60,675 | | Total Florida | | | | | | 61,299,609 | |
| | | | Georgia – 1.8% (1.5% of Total Investments) | | | | | | | |
| | 2,000 | | Clayton County Development Authority, Georgia, Special Facilities Revenue Bonds, Delta Air Lines, Inc. Project, Series 2009A, 8.750%, 6/01/29 | 6/20 at 100.00 | | B | | | 2,326,540 | |
| | 435 | | Coffee County Hospital Authority, Georgia, Revenue Bonds, Coffee County Regional Medical Center, Series 2004, 5.000%, 12/01/26 | 12/14 at 100.00 | | BB– | | | 400,165 | |
| | | | Fulton County Residential Care Facilities Authority, Georgia, Revenue Bonds, Elderly Care, Lenbrook Square Project, Series 2006A: | | | | | | | |
| | 4,260 | | 5.000%, 7/01/17 | No Opt. Call | | N/R | | | 4,300,172 | |
| | 4,500 | | 5.000%, 7/01/27 | 7/17 at 100.00 | | N/R | | | 3,997,305 | |
| | 11,195 | | Total Georgia | | | | | | 11,024,182 | |
| NID | Nuveen Intermediate Duration Municipal Term Fund (continued) |
| | Portfolio of Investments November 30, 2013 (Unaudited) |
| | Principal | | | Optional Call | | | | | | |
| | Amount (000) | | Description (1) | Provisions (2) | | Ratings (3) | | | Value | |
| | | | Guam – 2.1% (1.6% of Total Investments) | | | | | | | |
| $ | 500 | | Government of Guam, Hotel Occupancy Tax Revenue Bonds, Series 2011A, 5.000%, 11/01/16 | No Opt. Call | | BBB+ | | $ | 542,680 | |
| | 1,500 | | Guam Government Department of Education, Certificates of Participation, John F. Kennedy High School Project, Series 2010A, 6.000%, 12/01/20 | No Opt. Call | | B+ | | | 1,575,990 | |
| | 2,000 | | Guam Government Waterworks Authority, Water and Wastewater System Revenue Bonds, Series 2010, 5.250%, 7/01/25 | 7/20 at 100.00 | | Ba1 | | | 2,001,000 | |
| | | | Guam Government, General Obligation Bonds, 2009 Series A: | | | | | | | |
| | 1,050 | | 6.000%, 11/15/19 | No Opt. Call | | BB– | | | 1,108,506 | |
| | 2,500 | | 6.750%, 11/15/29 | 11/19 at 100.00 | | BB– | | | 2,601,600 | |
| | 1,000 | | Guam Government, Limited Obligation Section 30 Revenue Bonds, Series 2009A, 5.375%, 12/01/24 | 12/19 at 100.00 | | BBB+ | | | 1,040,170 | |
| | 1,365 | | Guam Waterworks Authority, Water and Wastewater System Revenue Bonds, Series 2013, 5.250%, 7/01/24 (WI/DD, Settling 12/12/13) | 7/23 at 100.00 | | A– | | | 1,434,192 | |
| | 2,000 | | Guam, General Obligation Bonds, Series 2007A, 5.000%, 11/15/23 | 11/17 at 100.00 | | BB– | | | 1,967,640 | |
| | 11,915 | | Total Guam | | | | | | 12,271,778 | |
| | | | Hawaii – 0.4% (0.3% of Total Investments) | | | | | | | |
| | 740 | | Hawaii Housing Finance and Development Corporation, Multifamily Housing Revenue Bonds, Wilikina Apartments Project, Series 2012A, 4.250%, 5/01/22 | No Opt. Call | | BB | | | 719,842 | |
| | 1,550 | | Hawaii State Department of Transportation, Special Facility Revenue Bonds, Continental Airlines Inc., Series 1997, 5.625%, 11/15/27 | 2/14 at 100.00 | | B | | | 1,484,234 | |
| | 2,290 | | Total Hawaii | | | | | | 2,204,076 | |
| | | | Idaho – 0.8% (0.6% of Total Investments) | | | | | | | |
| | 4,645 | | Madison County, Idaho, Hospital Revenue Certificates of Participation, Madison Memorial Hospital, Series 2006, 5.250%, 9/01/26 | 9/16 at 100.00 | | BB+ | | | 4,539,140 | |
| | | | Illinois – 10.3% (8.1% of Total Investments) | | | | | | | |
| | 1,260 | | Bellwood, Illinois, General Obligation Bonds, Series 2006, 5.000%, 12/01/21 – SYNCORA GTY Insured | No Opt. Call | | N/R | | | 1,246,833 | |
| | 1,070 | | Bellwood, Illinois, General Obligation Bonds, Series 2008, 7.000%, 12/01/29 | No Opt. Call | | N/R | | | 1,036,552 | |
| | 9,935 | | CenterPoint Intermodal Center Program Trust, Illinois, Series 2004 Class A Certificates, 3.730%, 6/15/23 | 2/14 at 100.00 | | N/R | | | 9,933,212 | |
| | 9,535 | | Chicago Board of Education, Illinois, Unlimited Tax General Obligation Bonds, Dedicated Tax Revenues, Series 1999A, 5.500%, 12/01/26 – FGIC Insured | No Opt. Call | | A+ | | | 9,756,021 | |
| | 2,952 | | Chicago, Illinois, Certificates of Participation Tax Increment Bonds, 35th and State Redevelopment Project, Series 2012, 6.100%, 1/15/29 | No Opt. Call | | N/R | | | 2,687,768 | |
| | 330 | | Chicago, Illinois, Certificates of Participation Tax Increment Bonds, MetraMarket Project, Series 2010, 6.870%, 2/15/24 | 5/15 at 100.00 | | Baa3 | | | 341,834 | |
| | 975 | | Chicago, Illinois, Certificates of Participation, Tax Increment Allocation Revenue Bonds, Diversey-Narragansett Project, Series 2006, 7.460%, 2/15/26 | 2/14 at 100.00 | | N/R | | | 730,139 | |
| | | | Cook County, Illinois, General Obligation Bonds, Tender Option Bond Trust 4279: | | | | | | | |
| | 1,000 | | 22.690%, 11/15/20 (IF) (4) | No Opt. Call | | AA | | | 989,000 | |
| | 3,040 | | 22.690%, 11/15/20 (IF) (4) | No Opt. Call | | AA | | | 2,757,432 | |
| | 1,000 | | Cook County, Illinois, Recovery Zone Facility Revenue Bonds, Navistar International Corporation Project, Series 2010, 6.500%, 10/15/40 | 10/20 at 100.00 | | B3 | | | 997,380 | |
| | | | Illinois Finance Authority, Charter School Revenue Bonds, Chicago Charter School Foundation, Series 2007: | | | | | | | |
| | 1,650 | | 5.000%, 12/01/21 | 12/16 at 100.00 | | BBB+ | | | 1,684,056 | |
| | 4,000 | | 5.000%, 12/01/26 | 12/16 at 100.00 | | BBB+ | | | 3,941,760 | |
| | 5,530 | | Illinois Finance Authority, Recovery Zone Facility Revenue Bonds, Navistar International Corporation Project, Series 2010, 6.500%, 10/15/40 | 10/20 at 100.00 | | B3 | | | 5,515,511 | |
| | | | Illinois Finance Authority, Revenue Bonds, Centegra Health System, Tender Option Bond Trust 1122: | | | | | | | |
| | 480 | | 21.649%, 9/01/21 (IF) (4) | No Opt. Call | | A– | | | 730,349 | |
| | 330 | | 21.609%, 9/01/21 (IF) (4) | No Opt. Call | | A– | | | 501,788 | |
| | 435 | | 21.591%, 9/01/22 (IF) (4) | No Opt. Call | | A– | | | 642,965 | |
| | | | Illinois Finance Authority, Revenue Bonds, Friendship Village of Schaumburg, Series 2005A: | | | | | | | |
| | 665 | | 5.000%, 2/15/15 | No Opt. Call | | BB– | | | 670,786 | |
| | 3,525 | | 5.375%, 2/15/25 | 2/15 at 100.00 | | BB– | | | 3,331,619 | |
| | Principal | | | Optional Call | | | | | | |
| | Amount (000) | | Description (1) | Provisions (2) | | Ratings (3) | | | Value | |
| | | | Illinois (continued) | | | | | | | |
| $ | 2,680 | | Illinois Finance Authority, Revenue Bonds, Illinois Institute of Technology, Refunding Series 2006A, 5.000%, 4/01/24 | 4/16 at 100.00 | | Baa3 | | $ | 2,606,059 | |
| | | | Illinois Finance Authority, Revenue Bonds, Ingalls Health System, Series 2013: | | | | | | | |
| | 650 | | 4.000%, 5/15/18 | No Opt. Call | | Baa1 | | | 698,107 | |
| | 770 | | 4.000%, 5/15/19 | No Opt. Call | | Baa1 | | | 818,418 | |
| | 895 | | 5.000%, 5/15/20 | No Opt. Call | | Baa1 | | | 984,948 | |
| | 1,035 | | 5.000%, 5/15/21 | No Opt. Call | | Baa1 | | | 1,127,260 | |
| | 1,210 | | 5.000%, 5/15/22 | No Opt. Call | | Baa1 | | | 1,296,939 | |
| | 1,390 | | 5.000%, 5/15/23 | 5/22 at 100.00 | | Baa1 | | | 1,465,838 | |
| | 1,575 | | 5.000%, 5/15/24 | 5/22 at 100.00 | | Baa1 | | | 1,636,929 | |
| | 500 | | Illinois Finance Authority, Revenue Bonds, Montgomery Place Project, Series 2006A, 5.500%, 5/15/26 | 5/17 at 100.00 | | N/R | | | 500,455 | |
| | 620 | | Illinois Finance Authority, Revenue Refunding Bonds, Swedish Covenant Hospital, Refunding Series 2010A, 5.000%, 8/15/17 | No Opt. Call | | BBB+ | | | 679,675 | |
| | 1,000 | | Illinois State, General Obligation Bonds, Refunding Series 2012, 5.000%, 8/01/20 – AGM Insured | No Opt. Call | | AA– | | | 1,099,970 | |
| | 1,000 | | Pingree Grove Village, Illinois, Tax Assessment Bonds, Special Service Area 2 – Cambridge Lakes Project, Series 2005-2, 6.000%, 3/01/35 | 3/15 at 102.00 | | N/R | | | 973,790 | |
| | 61,037 | | Total Illinois | | | | | | 61,383,393 | |
| | | | Indiana – 1.6% (1.3% of Total Investments) | | | | | | | |
| | 1,250 | | Carmel, Indiana, Revenue Bonds, Barrington of Carmel Project, Series 2012A, 6.000%, 11/15/22 | No Opt. Call | | N/R | | | 1,222,913 | |
| | 4,345 | | Indiana Finance Authority, Educational Facilities Revenue Bonds, 21st Century Charter School Project, Series 2013A, 6.000%, 3/01/33 | 3/23 at 100.00 | | BB– | | | 4,067,094 | |
| | 1,000 | | Indiana Finance Authority, Educational Facilities Revenue Bonds, CFM-Northwest Indiana, LLC Project, Refunding Series 2013A, 6.250%, 7/01/23 | No Opt. Call | | BB | | | 1,009,260 | |
| | 950 | | Indiana Finance Authority, Educational Facilities Revenue Bonds, Charter Facilities Management Indianapolis LLC Project, Series 2013A, 6.250%, 7/01/23 | No Opt. Call | | BB | | | 958,797 | |
| | 960 | | Indiana Finance Authority, Educational Facilities Revenue Bonds, Drexel Foundation For Educational Excellence, Inc., Series 2009A, 6.000%, 10/01/21 | 10/19 at 100.00 | | BB– | | | 980,246 | |
| | 60 | | Indiana Finance Authority, Environmental Improvement Revenue Bonds, United States Steel Corporation Project, Refunding Series 2011, 6.000%, 12/01/19 | No Opt. Call | | BB– | | | 61,486 | |
| | 1,000 | | Indiana Finance Authority, Revenue Bonds, Marquette Project, Series 2012, 5.000%, 3/01/19 | No Opt. Call | | BBB | | | 1,062,930 | |
| | 400 | | Valparaiso, Indiana, Exempt Facilities Revenue Bonds, Pratt Paper LLC Project, Series 2013, 5.875%, 1/01/24 (Alternative Minimum Tax) | No Opt. Call | | N/R | | | 403,916 | |
| | 9,965 | | Total Indiana | | | | | | 9,766,642 | |
| | | | Iowa – 2.0% (1.6% of Total Investments) | | | | | | | |
| | 2,600 | | Iowa Finance Authority, Health Facility Revenue Bonds, Care Initiatives Project, Series 2006A, 5.500%, 7/01/25 | 7/16 at 100.00 | | BB+ | | | 2,616,354 | |
| | | | Iowa Finance Authority, Iowa, Midwestern Disaster Area Revenue Bonds, Iowa Fertilizer Company Project, Series 2013: | | | | | | | |
| | 6,320 | | 5.000%, 12/01/19 | No Opt. Call | | BB– | | | 6,116,306 | |
| | 1,000 | | 5.500%, 12/01/22 | 12/18 at 100.00 | | BB– | | | 944,340 | |
| | 2,000 | | 5.250%, 12/01/25 | 12/23 at 100.00 | | BB– | | | 1,801,540 | |
| | | | Iowa Higher Education Loan Authority, Private College Facility Revenue Bonds, Upper Iowa University Project, Series 2012: | | | | | | | |
| | 125 | | 3.000%, 9/01/16 | No Opt. Call | | BBB | | | 128,830 | |
| | 180 | | 4.000%, 9/01/18 | No Opt. Call | | BBB | | | 189,671 | |
| | 200 | | 3.000%, 9/01/19 | No Opt. Call | | BBB | | | 197,078 | |
| | 12,425 | | Total Iowa | | | | | | 11,994,119 | |
| | | | Kansas – 1.9% (1.5% of Total Investments) | | | | | | | |
| | 2,000 | | Kansas Development Finance Authority Hospital Revenue Bonds, Adventist Health System/Sunbelt Obligated Group, Tender Option Bond Trust 1125, 22.890%, 11/15/32 (IF) (4) | 5/22 at 100.00 | | AA | | | 2,342,200 | |
| | 310 | | Kansas Development Finance Authority Hospital Revenue Bonds, Adventist Health System/Sunbelt Obligated Group, Tender Option Bond Trust 3254, 18.506%, 5/15/20 (IF) (4) | No Opt. Call | | AA | | | 352,774 | |
| | 2,000 | | Overland Park, Kansas, Sales Tax Revenue Bonds, Prairiefire Community Improvement District No. 1 Project, Series 2012B, 6.100%, 12/15/34 | No Opt. Call | | N/R | | | 1,770,800 | |
| NID | Nuveen Intermediate Duration Municipal Term Fund (continued) |
| | Portfolio of Investments November 30, 2013 (Unaudited) |
| | Principal | | | Optional Call | | | | | | |
| | Amount (000) | | Description (1) | Provisions (2) | | Ratings (3) | | | Value | |
| | | | Kansas (continued) | | | | | | | |
| $ | 8,000 | | Overland Park, Kansas, Sales Tax Special Obligation Revenue Bonds, Prairiefire at Lionsgate Project, Series 2012, 5.250%, 12/15/29 | No Opt. Call | | N/R | | $ | 7,122,240 | |
| | 12,310 | | Total Kansas | | | | | | 11,588,014 | |
| | | | Louisiana – 1.2% (0.9% of Total Investments) | | | | | | | |
| | 1,500 | | Louisiana Local Government Environmental Facilities & Community Development Authority, Revenue Bonds, Westlake Chemical Corporation Project, Series 2007, 6.750%, 11/01/32 | 11/17 at 100.00 | | BBB | | | 1,594,830 | |
| | 2,395 | | Louisiana Local Government Environmental Facilities and Community Development Authority, Revenue Bonds, Capital Projects and Equipment Acquisition Program, Series 2000A, 6.300%, 7/01/30 – AMBAC Insured | No Opt. Call | | N/R | | | 2,414,495 | |
| | | | Louisiana Public Facilities Authority, Revenue Bonds, Ochsner Clinic Foundation Project, Series 2011: | | | | | | | |
| | 250 | | 5.250%, 5/15/22 | No Opt. Call | | Baa1 | | | 273,003 | |
| | 500 | | 6.250%, 5/15/31 | No Opt. Call | | Baa1 | | | 534,820 | |
| | 1,000 | | Louisiana Stadium and Exposition District, Revenue Refunding Bonds, Senior Lien Series 2013A, 5.000%, 7/01/22 | No Opt. Call | | A | | | 1,121,470 | |
| | 1,000 | | Saint Charles Parish, Louisiana, Gulf Opportunity Zone Revenue Bonds, Valero Project, Series 2010, 4.000%, 12/01/40 (Mandatory put 6/01/22) | No Opt. Call | | BBB | | | 992,380 | |
| | 6,645 | | Total Louisiana | | | | | | 6,930,998 | |
| | | | Maine – 0.1% (0.1% of Total Investments) | | | | | | | |
| | 350 | | Maine Health and Higher Educational Facilities Authority Revenue Bonds, Eastern Maine Medical Center Obligated Group Issue, Series 2013, 5.000%, 7/01/22 | No Opt. Call | | Baa1 | | | 390,023 | |
| | | | Maryland – 0.2% (0.2% of Total Investments) | | | | | | | |
| | 1,500 | | Maryland Economic Development Corporation, Senior Lien Student Housing Revenue Bonds, University of Maryland – Baltimore, Series 2003A, 5.625%, 10/01/23 | 2/14 at 100.00 | | B3 | | | 1,392,210 | |
| | | | Massachusetts – 1.2% (1.0% of Total Investments) | | | | | | | |
| | 1,755 | | Massachusetts Development Finance Agency, Revenue Bonds, Boston Architectural College, Series 2006, 5.000%, 1/01/27 – ACA Insured | 1/17 at 100.00 | | N/R | | | 1,710,511 | |
| | 1,750 | | Massachusetts Development Finance Authority, Revenue Bonds, Eastern Nazarene College, Series 1999, 5.625%, 4/01/29 | 2/14 at 100.00 | | BB+ | | | 1,750,088 | |
| | 1,000 | | Massachusetts Health and Educational Facilities Authority, Revenue Bonds, Milton Hospital Project, Series 2005D, 5.250%, 7/01/30 | 7/15 at 100.00 | | BB+ | | | 955,170 | |
| | 3,150 | | Massachusetts Port Authority, Special Facilities Revenue Bonds, Delta Air Lines Inc., Series 2001A, 5.000%, 1/01/27 – AMBAC Insured (Alternative Minimum Tax) | 1/14 at 100.00 | | N/R | | | 2,875,005 | |
| | 7,655 | | Total Massachusetts | | | | | | 7,290,774 | |
| | | | Michigan – 5.4% (4.2% of Total Investments) | | | | | | | |
| | 2,000 | | Detroit City School District, Wayne County, Michigan, General Obligation Bonds, Tender Option Bond Trust 3308, 23.671%, 11/01/27 – AGM Insured (IF) (4) | No Opt. Call | | Aa2 | | | 1,929,600 | |
| | 230 | | Detroit Downtown Development Authority, Michigan, Tax Increment Refunding Bonds, Development Area 1 Projects, Series 1998A, 4.750%, 7/01/25 – NPFG Insured | 1/14 at 100.00 | | A | | | 202,099 | |
| | 3,500 | | Detroit Water and Sewerage Department, Michigan, Sewage Disposal System Revenue Bonds, Refunding Senior Lien Series 2012A, 5.250%, 7/01/26 | 7/22 at 100.00 | | BBB+ | | | 3,368,785 | |
| | | | Detroit, Michigan, General Obligation Bonds, Series 2001A-1: | | | | | | | |
| | 1,000 | | 5.375%, 4/01/18 – NPFG Insured (5) | 2/14 at 100.00 | | A | | | 952,600 | |
| | 2,000 | | 5.000%, 4/01/19 – NPFG Insured (5) | 2/14 at 100.00 | | A | | | 1,846,100 | |
| | 300 | | Detroit, Michigan, General Obligation Bonds, Series 2005A, 5.000%, 4/01/22 – AGM Insured (5) | 4/16 at 100.00 | | AA– | | | 277,194 | |
| | | | Detroit, Michigan, Senior Lien Sewerage Disposal System Revenue Bonds, Series 2001B: | | | | | | | |
| | 310 | | 5.500%, 7/01/29 – FGIC Insured | No Opt. Call | | AA– | | | 310,626 | |
| | 10,340 | | 5.500%, 7/01/29 – FGIC Insured | No Opt. Call | | A | | | 10,044,586 | |
| | 2,000 | | Detroit, Michigan, Sewerage Disposal System Revenue Bonds, Series 1999A, 0.000%, 7/01/21 – FGIC Insured | No Opt. Call | | A | | | 1,254,620 | |
| | 100 | | Detroit, Michigan, Water Supply System Second Lien Revenue Bonds, Series 2003B, 5.000%, 7/01/34 – NPFG Insured | 2/14 at 100.00 | | A | | | 91,011 | |
| | Principal | | | Optional Call | | | | | | |
| | Amount (000) | | Description (1) | Provisions (2) | | Ratings (3) | | | Value | |
| | | | Michigan (continued) | | | | | | | |
| | | | Detroit, Michigan, Water Supply System Second Lien Revenue Bonds, Series 2006A: | | | | | | | |
| $ | 510 | | 5.250%, 7/01/22 – NPFG Insured | 7/16 at 100.00 | | A | | $ | 502,707 | |
| | 225 | | 5.250%, 7/01/23 – NPFG Insured | 7/16 at 100.00 | | A | | | 221,004 | |
| | 100 | | Detroit, Michigan, Water Supply System Senior Lien Revenue Bonds, Series 2003A, 5.000%, 7/01/34 – NPFG Insured | 2/14 at 100.00 | | A | | | 91,011 | |
| | | | Detroit-Wayne County Stadium Authority, Michigan, Wayne County Limited Tax General Obligation Bonds, Building Authority Stadium Refunding Series 2012: | | | | | | | |
| | 1,000 | | 5.000%, 10/01/17 | No Opt. Call | | BBB– | | | 1,082,920 | |
| | 1,000 | | 5.000%, 10/01/18 | No Opt. Call | | BBB– | | | 1,084,380 | |
| | 720 | | East Lansing, Michigan, Economic Development Corporation Limited Obligation Bonds, Burcham Hills Retirement Community First Mortgage, Series 2007-B1, 5.250%, 7/01/37 | 7/14 at 100.00 | | N/R | | | 641,477 | |
| | 1,270 | | Flint Hospital Building Authority, Michigan, Building Authority Revenue Bonds, Hurley Medical Center, Series 2013A, 5.000%, 7/01/23 | No Opt. Call | | Ba1 | | | 1,203,604 | |
| | 425 | | Michigan Finance Authority, Public School Academy Limited Obligation Revenue and Refunding Bonds, Detroit Service Learning Academy Project, Series 2011, 6.000%, 10/01/21 | No Opt. Call | | BB+ | | | 445,511 | |
| | 1,000 | | Michigan Finance Authority, Public School Academy Limited Obligation Revenue Bonds, Old Redford Academy Project, Series 2010A, 5.250%, 12/01/20 | No Opt. Call | | BB | | | 973,180 | |
| | 825 | | Michigan Finance Authority, Revenue Bonds, Trinity Health Credit Group, Tender Option Bond Trust 4286, 22.538%, 12/01/18 (IF), (4) | No Opt. Call | | Aa2 | | | 1,089,685 | |
| | 665 | | Michigan Public Educational Facilities Authority, Limited Obligation Revenue Bonds, Richfield Public School Academy, Series 2007, 5.000%, 9/01/22 | 9/17 at 100.00 | | BBB– | | | 660,764 | |
| | 2,000 | | Michigan Strategic Fund, Limited Obligation Revenue Bonds, Detroit Thermal LLC Project, Series 2013, 8.500%, 12/01/30 (Alternative Minimum Tax) | 12/23 at 100.00 | | N/R | | | 1,897,140 | |
| | 215 | | Summit Academy North, Michigan, Revenue Bonds, Public School Academy Series 2005, 5.000%, 11/01/15 | No Opt. Call | | BB | | | 215,538 | |
| | 1,685 | | Wayne Charter County, Michigan, Limited Tax General Obligation Airport Hotel Revenue Bonds, Detroit Metropolitan Wayne County Airport, Series 2001A, 5.000%, 12/01/30 – NPFG Insured | 2/14 at 100.00 | | A | | | 1,684,949 | |
| | 33,420 | | Total Michigan | | | | | | 32,071,091 | |
| | | | Minnesota – 0.8% (0.6% of Total Investments) | | | | | | | |
| | 3,500 | | Cloquet, Minnesota, Pollution Control Revenue Bonds, Potlatch Corporation, Refunding Series 1996, 5.900%, 10/01/26 | 2/14 at 100.00 | | BB+ | | | 3,499,720 | |
| | 1,445 | | Minneapolis, Minnesota, Tax Increment Revenue Bonds, Village at St. Anthony Falls Project, Refunding Series 2004, 5.750%, 2/01/27 | 2/14 at 100.00 | | N/R | | | 1,355,988 | |
| | 4,945 | | Total Minnesota | | | | | | 4,855,708 | |
| | | | Mississippi – 0.7% (0.5% of Total Investments) | | | | | | | |
| | 1,445 | | Mississippi Business Finance Corporation, Gulf Opportunity Zone Industrial Development Revenue Bonds, Northrop Grumman Ship Systems Inc. Project, Series 2006, 4.550%, 12/01/28 | 12/16 at 100.00 | | BBB+ | | | 1,352,838 | |
| | | | Mississippi Development Bank Special Obligation Bonds, Marshall County Industrial Development Authority, Mississippi Highway Construction Project, Tender Option Bond Trust 3315: | | | | | | | |
| | 800 | | 22.438%, 1/01/20 (IF) (4) | No Opt. Call | | AA– | | | 1,128,560 | |
| | 500 | | 22.438%, 1/01/20 (IF) (4) | No Opt. Call | | AA– | | | 646,425 | |
| | 985 | | Mississippi Hospital Equipment and Facilities Authority, Revenue Bonds, South Central Regional Medical Center, Refunding & Improvement Series 2006, 5.250%, 12/01/21 | 12/16 at 100.00 | | BBB | | | 1,019,938 | |
| | 3,730 | | Total Mississippi | | | | | | 4,147,761 | |
| | | | Missouri – 1.6% (1.3% of Total Investments) | | | | | | | |
| | 3,500 | | Kansas City Tax Increment Financing Commission, Missouri, Tax Increment Revenue Bonds, Briarcliff West Project, Series 2006A, 5.400%, 6/01/24 | 6/14 at 102.00 | | N/R | | | 3,554,845 | |
| | 600 | | Pevely, Missouri, Neighborhood Improvement District Bonds, Southern Heights Project, Series 2004, 5.250%, 3/01/22 – RAAI Insured | 2/14 at 100.00 | | N/R | | | 600,864 | |
| | 3,000 | | Poplar Bluff Regional Transportation Development District, Missouri, Transportation Sales Tax Revenue Bonds, Series 2012, 4.000%, 12/01/36 | No Opt. Call | | BBB | | | 2,626,140 | |
| | 1,275 | | Saint Louis, Missouri, Parking Revenue Bonds, Series 2006A, 5.000%, 12/15/22 – NPFG Insured | 12/16 at 100.00 | | A | | | 1,368,687 | |
| NID | Nuveen Intermediate Duration Municipal Term Fund (continued) |
| | Portfolio of Investments November 30, 2013 (Unaudited) |
| | Principal | | | Optional Call | | | | | | |
| | Amount (000) | | Description (1) | Provisions (2) | | Ratings (3) | | | Value | |
| | | | Missouri (continued) | | | | | | | |
| | | | St. Joseph Industrial Development Authority, Missouri, Tax Increment Bonds, Shoppes at North Village Project, Series 2005B: | | | | | | | |
| $ | 475 | | 5.375%, 11/01/23 | 11/14 at 100.00 | | N/R | | $ | 474,435 | |
| | 905 | | 5.500%, 11/01/27 | 11/14 at 100.00 | | N/R | | | 870,909 | |
| | 9,755 | | Total Missouri | | | | | | 9,495,880 | |
| | | | Nebraska – 0.5% (0.4% of Total Investments) | | | | | | | |
| | 3,000 | | Central Plains Energy Project, Nebraska, Gas Project 1 Revenue Bonds, Series 2007A, 5.250%, 12/01/21 | No Opt. Call | | A | | | 3,327,030 | |
| | | | Nevada – 1.6% (1.3% of Total Investments) | | | | | | | |
| | 1,630 | | Carson City, Nevada, Hospital Revenue Refunding Bonds, Carson-Tahoe Regional Healthcare Project, Series 2012, 5.000%, 9/01/27 | No Opt. Call | | BBB+ | | | 1,649,658 | |
| | 2,645 | | Henderson, Nevada, Limited Obligation Improvement Bonds, Local Improvement District T-18, Inspirada Series 2006, 5.150%, 9/01/21 | 2/14 at 100.00 | | N/R | | | 2,350,797 | |
| | | | Henderson, Nevada, Limited Obligation Refunding Bonds, Local Improvement District T-13 Cornerstone, Series 2013: | | | | | | | |
| | 645 | | 4.000%, 3/01/17 | No Opt. Call | | N/R | | | 636,454 | |
| | 770 | | 4.000%, 3/01/18 | No Opt. Call | | N/R | | | 746,261 | |
| | 730 | | 4.000%, 3/01/19 | No Opt. Call | | N/R | | | 694,770 | |
| | 830 | | 5.000%, 3/01/20 | No Opt. Call | | N/R | | | 820,563 | |
| | 880 | | 5.000%, 3/01/21 | No Opt. Call | | N/R | | | 858,264 | |
| | 915 | | 5.000%, 3/01/22 | No Opt. Call | | N/R | | | 880,971 | |
| | 1,000 | | Las Vegas Redevelopment Agency, Nevada, Tax Increment Revenue Bonds, Series 2009A, 7.500%, 6/15/23 | 6/19 at 100.00 | | BBB– | | | 1,105,980 | |
| | 10,045 | | Total Nevada | | | | | | 9,743,718 | |
| | | | New Hampshire – 0.2% (0.2% of Total Investments) | | | | | | | |
| | | | Manchester Housing and Redevelopment Authority, New Hampshire, Meals and Rooms Tax Revenue Bonds, Series 2000A: | | | | | | | |
| | 335 | | 6.750%, 1/01/14 – ACA Insured | No Opt. Call | | Caa1 | | | 334,956 | |
| | 100 | | 6.750%, 1/01/15 – ACA Insured | 2/14 at 100.00 | | Caa1 | | | 99,765 | |
| | | | Manchester Housing and Redevelopment Authority, New Hampshire, Revenue Bonds, Series 2000B: | | | | | | | |
| | 265 | | 0.000%, 1/01/17 – ACA Insured | No Opt. Call | | Caa1 | | | 215,999 | |
| | 500 | | 0.000%, 1/01/18 – ACA Insured | No Opt. Call | | Caa1 | | | 379,110 | |
| | 320 | | 0.000%, 1/01/19 – ACA Insured | No Opt. Call | | N/R | | | 225,027 | |
| | 370 | | 0.000%, 1/01/20 – ACA Insured | No Opt. Call | | Caa1 | | | 241,373 | |
| | 1,890 | | Total New Hampshire | | | | | | 1,496,230 | |
| | | | New Jersey – 6.9% (5.4% of Total Investments) | | | | | | | |
| | 2,420 | | Camden County Improvement Authority, New Jersey, Revenue Bonds, Cooper Health System, Series 2005A, 5.000%, 2/15/25 | 2/15 at 100.00 | | BBB | | | 2,393,767 | |
| | 2,500 | | New Jersey Economic Development Authority, Cigarette Tax Revenue Refunding Bonds, Series 2012, 4.000%, 6/15/19 | No Opt. Call | | BBB+ | | | 2,666,450 | |
| | 3,000 | | New Jersey Economic Development Authority, School Facilities Construction Financing Program Bonds, Refunding Series 2012II, 5.000%, 3/01/26 | No Opt. Call | | A+ | | | 3,280,410 | |
| | | | New Jersey Economic Development Authority, School Facilities Construction Financing Program Bonds, Tender Option Bond Trust 1151: | | | | | | | |
| | 1,440 | | 3.171%, 9/01/25 (IF) (4) | 3/25 at 100.00 | | A+ | | | 1,317,528 | |
| | 1,200 | | 4.681%, 9/01/27 (IF) (4) | 3/23 at 100.00 | | A+ | | | 1,091,760 | |
| | 7,500 | | New Jersey Economic Development Authority, Special Facilities Revenue Bonds, Continental Airlines Inc., Series 1999, 5.250%, 9/15/29 (Alternative Minimum Tax) | 9/22 at 101.00 | | B | | | 6,981,000 | |
| | 7,000 | | New Jersey Health Care Facilities Financing Authority, New Jersey, Revenue Bonds, Saint Peters University Hospital, Refunding Series 2011, 6.000%, 7/01/26 | 7/21 at 100.00 | | BB+ | | | 7,302,540 | |
| | 5,000 | | New Jersey Health Care Facilities Financing Authority, Revenue Bonds, Saint Joseph’s Healthcare System Obligated Group Issue, Series 2008, 6.625%, 7/01/38 | 7/18 at 100.00 | | BBB– | | | 5,051,650 | |
| | 1,000 | | New Jersey Health Care Facilities Financing Authority, Trinitas Hospital Obligated Group, Series 2007A, 5.250%, 7/01/23 | 7/17 at 100.00 | | BBB– | | | 1,039,000 | |
| | Principal | | | Optional Call | | | | | | |
| | Amount (000) | | Description (1) | Provisions (2) | | Ratings (3) | | | Value | |
| | | | New Jersey (continued) | | | | | | | |
| $ | 500 | | New Jersey Turnpike Authority, Revenue Bonds, Tender Option Bond Trust 1154, 21.475%, 1/01/24 (IF) (4) | 7/22 at 100.00 | | A+ | | $ | 811,550 | |
| | 10,985 | | Tobacco Settlement Financing Corporation, New Jersey, Tobacco Settlement Asset-Backed Bonds, Series 2007-1A, 4.625%, 6/01/26 | 6/17 at 100.00 | | B1 | | | 9,383,387 | |
| | 42,545 | | Total New Jersey | | | | | | 41,319,042 | |
| | | | New Mexico – 0.7% (0.5% of Total Investments) | | | | | | | |
| | 1,305 | | Bernalillo County, New Mexico, Multifamily Housing Revenue Bonds, Valencia Retirement Apartments Project, Series 2001A, 5.450%, 6/01/34 – AMBAC Insured (Alternative Minimum Tax) | 2/14 at 100.00 | | N/R | | | 1,203,341 | |
| | 1,000 | | Jicarilla Apache Nation, New Mexico, Revenue Bonds, Series 2002A, 5.500%, 9/01/23 | No Opt. Call | | N/R | | | 965,950 | |
| | 2,000 | | Santa Fe, New Mexico, Retirement Facilities Revenue Bonds, EL Castillo Retirement Residences Project, Series 2012, 5.000%, 5/15/32 | No Opt. Call | | BBB– | | | 1,872,800 | |
| | 4,305 | | Total New Mexico | | | | | | 4,042,091 | |
| | | | New York – 6.3% (5.0% of Total Investments) | | | | | | | |
| | 1,190 | | Buffalo and Erie County Industrial Land Development Corporation, New York, Revenue Bonds, Medaille College, Series 2012, 5.000%, 4/01/22 | No Opt. Call | | BB+ | | | 1,205,708 | |
| | | | Build NYC Resource Corporation, New York, Revenue Bonds, Bronx Charter School for Excellence, Series 2013A: | | | | | | | |
| | 505 | | 4.000%, 4/01/20 | No Opt. Call | | BBB– | | | 508,384 | |
| | 570 | | 4.000%, 4/01/23 | No Opt. Call | | BBB– | | | 544,327 | |
| | | | Dormitory Authority of the State of New York, Insured Revenue Bonds, Pace University, Series 2013A: | | | | | | | |
| | 1,000 | | 5.000%, 5/01/21 | No Opt. Call | | BBB– | | | 1,069,660 | |
| | 840 | | 5.000%, 5/01/23 | No Opt. Call | | BBB– | | | 883,168 | |
| | | | New York City Industrial Development Agency, New York, American Airlines-JFK International Airport Special Facility Revenue Bonds, Series 2005: | | | | | | | |
| | 3,715 | | 7.500%, 8/01/16 (Alternative Minimum Tax) | No Opt. Call | | N/R | | | 3,894,732 | |
| | 7,850 | | 7.625%, 8/01/25 (Alternative Minimum Tax) | 8/16 at 101.00 | | N/R | | | 8,504,141 | |
| | | | New York City Industrial Development Agency, New York, Civic Facility Revenue Bonds, Vaughn College of Aeronautics, Series 2006A: | | | | | | | |
| | 755 | | 5.000%, 12/01/16 | No Opt. Call | | BB | | | 781,191 | |
| | 1,500 | | 5.000%, 12/01/21 | 12/16 at 100.00 | | BB | | | 1,506,285 | |
| | 195 | | New York City Industrial Development Agency, New York, Civic Facility Revenue Bonds, Vaughn College of Aeronautics, Series 2006B, 5.000%, 12/01/16 | No Opt. Call | | BB | | | 201,765 | |
| | 190 | | New York City Industrial Development Agency, New York, PILOT Revenue Bonds, Queens Baseball Stadium Project, Series 2006, 5.000%, 1/01/22 – AMBAC Insured | 1/17 at 100.00 | | Ba1 | | | 190,504 | |
| | 2,300 | | Port Authority of New York and New Jersey, Special Project Bonds, JFK International Air Terminal LLC Project, Eighth Series 2010, 6.500%, 12/01/28 | 12/15 at 100.00 | | BBB | | | 2,406,996 | |
| | 3,030 | | Seneca Nation of Indians Capital Improvements Authority, New York, Special Obligation Bonds, Series 2007A, 5.250%, 12/01/16 | No Opt. Call | | BB | | | 3,094,054 | |
| | 2,000 | | Suffolk County Industrial Development Agency, New York, Continuing Care Retirement Community Revenue Bonds, Jefferson’s Ferry Project, Series 2006, 5.000%, 11/01/28 | 11/16 at 100.00 | | BBB– | | | 2,035,520 | |
| | | | TSASC Inc., New York, Tobacco Asset-Backed Bonds, Series 2006: | | | | | | | |
| | 4,060 | | 5.000%, 6/01/26 | 6/16 at 100.00 | | BB– | | | 3,540,929 | |
| | 10,000 | | 5.000%, 6/01/34 | 6/16 at 100.00 | | B | | | 7,556,200 | |
| | 39,700 | | Total New York | | | | | | 37,923,564 | |
| | | | North Carolina – 0.4% (0.3% of Total Investments) | | | | | | | |
| | 2,600 | | Charlotte, North Carolina, Special Facility Refunding Revenue Bonds, Charlotte/Douglas International Airport, US Airways, Inc. Project, Series 1998, 5.600%, 7/01/27 (Alternative Minimum Tax) | 2/14 at 100.00 | | N/R | | | 2,474,004 | |
| | | | Ohio – 7.1% (5.6% of Total Investments) | | | | | | | |
| | 24,900 | | Buckeye Tobacco Settlement Financing Authority, Ohio, Tobacco Settlement Asset-Backed Revenue Bonds, Senior Lien, Series 2007A-2, 5.125%, 6/01/24 | 6/17 at 100.00 | | B– | | | 20,957,832 | |
| | 2,000 | | Ohio Air Quality Development Authority, Ohio, Revenue Bonds, Ohio Valley Electric Corporation Project, Series 2009E, 5.625%, 10/01/19 | No Opt. Call | | BBB– | | | 2,182,300 | |
| NID | Nuveen Intermediate Duration Municipal Term Fund (continued) |
| | Portfolio of Investments November 30, 2013 (Unaudited) |
| | Principal | | | Optional Call | | | | | | |
| | Amount (000) | | Description (1) | Provisions (2) | | Ratings (3) | | | Value | |
| | | | Ohio (continued) | | | | | | | |
| $ | 95 | | Ohio Air Quality Development Authority, Revenue Refunding Bonds, AK Steel Holding Corporation, Series 2012A, 6.750%, 6/01/24 (Alternative Minimum Tax) | 2/22 at 100.00 | | B– | | $ | 76,308 | |
| | 3,400 | | Southeastern Ohio Port Authority, Hospital Facilities Revenue Bonds, Memorial Health System Obligated Group Project, Refunding and Improvement Series 2012, 5.000%, 12/01/22 | No Opt. Call | | N/R | | | 3,334,822 | |
| | 6,000 | | State of Ohio, Solid Waste Disposal Revenue Bonds (USG Corporation Project) Series 1997 Remarketed, 5.600%, 8/01/32 (Alternative Minimum Tax) | 2/14 at 100.00 | | CCC+ | | | 5,686,980 | |
| | | | Toledo-Lucas County Port Authority, Ohio, Special Assessment Revenue Bonds, Crocker Park Public Improvement Project, Series 2003: | | | | | | | |
| | 2,000 | | 5.250%, 12/01/23 | 2/14 at 100.00 | | BB | | | 2,025,200 | |
| | 8,445 | | 5.375%, 12/01/35 | 12/14 at 101.00 | | BB | | | 8,144,274 | |
| | 46,840 | | Total Ohio | | | | | | 42,407,716 | |
| | | | Oklahoma – 1.5% (1.2% of Total Investments) | | | | | | | |
| | 9,096 | | Tulsa Municipal Airport Trust, Oklahoma, Revenue Bonds, American Airlines Inc., Series 1995, 6.250%, 6/01/20 | 6/14 at 100.00 | | N/R | | | 9,095,545 | |
| | | | Oregon – 0.3% (0.2% of Total Investments) | | | | | | | |
| | 1,000 | | Astoria Hospital Facilities Authority, Oregon, Hospital Revenue and Refunding Bonds, Columbia Memorial Hospital, Series 2012, 5.000%, 8/01/31 | No Opt. Call | | BBB– | | | 983,230 | |
| | 730 | | Port of Saint Helens, Oregon, Pollution Control Revenue Bonds, Boise Cascade Project, Series 1997, 5.650%, 12/01/27 | No Opt. Call | | N/R | | | 725,810 | |
| | 1,730 | | Total Oregon | | | | | | 1,709,040 | |
| | | | Pennsylvania – 4.8% (3.8% of Total Investments) | | | | | | | |
| | 2,500 | | Aliquippa Municipal Water Authority, Pennsylvania, Water and Sewer Revenue Bonds, Subordinated Series 2013, 5.000%, 5/15/26 | No Opt. Call | | N/R | | | 2,417,350 | |
| | 4,025 | | Butler County Industrial Development Authority, Pennsylvania, Revenue Refunding Bonds, AK Steel Corporation Project, Series 2012-A, 6.250%, 6/01/20 (Alternative Minimum Tax) | No Opt. Call | | B– | | | 3,481,625 | |
| | 1,450 | | Doylestown Hospital Authority, Pennsylvania, Hospital Revenue Bonds, Series 2013A, 5.000%, 7/01/23 | No Opt. Call | | BBB | | | 1,531,360 | |
| | 2,385 | | Lebanon County Health Facilities Authority, Pennsylvania, Revenue Bonds, Good Samaritan Hospital Project, Series 2002, 6.000%, 11/15/35 | 2/14 at 100.00 | | B+ | | | 2,181,583 | |
| | 1,595 | | Northampton County Industrial Development Authority, Pennsylvania, Revenue Bonds, Morningstar Senior Living, Inc., Series 2012, 5.000%, 7/01/27 | No Opt. Call | | BBB– | | | 1,494,611 | |
| | 3,000 | | Pennsylvania Economic Development Finance Authority, Solid Waste Disposal Revenue Bonds (USG Corporation Project) Series 1999, 6.000%, 6/01/31 (Alternative Minimum Tax) | 6/14 at 100.00 | | CCC+ | | | 2,977,530 | |
| | 2,500 | | Pennsylvania Economic Development Financing Authority, Exempt Facilities Revenue Bonds, National Gypsum Company, Series 1997A, 6.250%, 11/01/27 (Alternative Minimum Tax) | 2/14 at 100.00 | | N/R | | | 2,449,850 | |
| | 2,000 | | Pennsylvania Economic Development Financing Authority, Exempt Facilities Revenue Bonds, National Gypsum Company, Series 1997B, 6.125%, 11/01/27 (Alternative Minimum Tax) | 5/14 at 100.00 | | N/R | | | 1,937,180 | |
| | 1,020 | | Pennsylvania Economic Development Financing Authority, Revenue Bonds, Northwestern Human Services Inc., Series 1998A, 5.250%, 6/01/28 | 6/14 at 100.00 | | N/R | | | 987,809 | |
| | 750 | | Pennsylvania Economic Development Financing Authority, Sewage Sludge Disposal Revenue Bonds, Philadelphia Biosolids Facility Project, Series 2009, 6.250%, 1/01/32 | 1/20 at 100.00 | | BBB | | | 746,813 | |
| | 1,000 | | Philadelphia Hospitals and Higher Education Facilities Authority, Pennsylvania, Hospital Revenue Bonds, Temple University Health System Obligated Group, Series 2007B, 5.500%, 7/01/26 | 7/17 at 100.00 | | BB+ | | | 897,390 | |
| | 3,000 | | Philadelphia Hospitals and Higher Education Facilities Authority, Pennsylvania, Hospital Revenue Bonds, Temple University Health System Obligated Group, Series 2012B, 6.250%, 7/01/23 | No Opt. Call | | BB+ | | | 2,980,620 | |
| | 5,000 | | Susquehanna Area Regional Airport Authority, Pennsylvania, Airport System Revenue Bonds, Series 2012C, 3.000%, 1/01/17 | No Opt. Call | | Ba1 | | | 4,897,200 | |
| | 30,225 | | Total Pennsylvania | | | | | | 28,980,921 | |
| | | | Puerto Rico – 6.0% (4.7% of Total Investments) | | | | | | | |
| | 5,000 | | Puerto Rico Aqueduct and Sewerage Authority, Revenue Bonds, Senior Lien Series 2008A, 6.125%, 7/01/24 | No Opt. Call | | BBB– | | | 4,066,450 | |
| | 1,000 | | Puerto Rico Convention Center District Authority, Hotel Occupancy Tax Revenue Bonds, Series 2006A, 5.000%, 7/01/23 – FGIC Insured | 7/16 at 100.00 | | BBB+ | | | 752,910 | |
| | Principal | | | Optional Call | | | | | | |
| | Amount (000) | | Description (1) | Provisions (2) | | Ratings (3) | | | Value | |
| | | | Puerto Rico (continued) | | | | | | | |
| $ | 600 | | Puerto Rico Electric Power Authority, Power Revenue Bonds, Series 2003NN, 5.250%, 7/01/19 – NPFG Insured | No Opt. Call | | A | | $ | 565,818 | |
| | 875 | | Puerto Rico Electric Power Authority, Power Revenue Refunding Bonds, Series 2002, 5.000%, 7/01/19 – NPFG Insured | No Opt. Call | | A | | | 815,028 | |
| | 875 | | Puerto Rico Government Development Bank, Adjustable Refunding Bonds, Variable Rate Demand Obligations, Series 1985, 4.750%, 12/01/15 – NPFG Insured | 6/14 at 100.00 | | A | | | 862,724 | |
| | | | Puerto Rico Government Development Bank, Senior Note Revenue Bonds, Senior Lien, Series 2006B: | | | | | | | |
| | 3,655 | | 5.000%, 12/01/15 | No Opt. Call | | BBB– | | | 3,365,341 | |
| | 100 | | 5.000%, 12/01/16 | No Opt. Call | | BBB– | | | 91,079 | |
| | 2,000 | | Puerto Rico Government Development Bank, Senior Note Revenue Bonds, Senior Notes, Series 2006C, 5.250%, 1/01/15 (Alternative Minimum Tax) | No Opt. Call | | BBB– | | | 1,917,420 | |
| | 2,375 | | Puerto Rico Highway and Transportation Authority, Highway Revenue Bonds, Refunding Series 2002E, 5.500%, 7/01/22 – AGM Insured | No Opt. Call | | AA– | | | 2,326,408 | |
| | 1,080 | | Puerto Rico Highway and Transportation Authority, Subordinate Lien Highway Revenue Bonds, Series 2003, 5.000%, 7/01/23 – CIFG Insured | No Opt. Call | | BBB– | | | 806,166 | |
| | 795 | | Puerto Rico Infrastructure Financing Authority, Special Tax Revenue Bonds, Series 2005A, 4.000%, 7/01/16 – FGIC Insured | No Opt. Call | | BBB+ | | | 732,616 | |
| | 890 | | Puerto Rico Public Buildings Authority, Guaranteed Government Facilities Revenue Bonds, Series 2007M, 6.250%, 7/01/23 | No Opt. Call | | BBB– | | | 730,850 | |
| | 1,000 | | Puerto Rico Public Buildings Authority, Guaranteed Government Facilities Revenue Refunding Bonds, Series 2002C, 5.750%, 7/01/19 | No Opt. Call | | BBB– | | | 855,020 | |
| | 1,500 | | Puerto Rico Sales Tax Financing Corporation, Sales Tax Revenue Bonds, First Subordinate Series 2009A, 5.000%, 8/01/18 | No Opt. Call | | A+ | | | 1,488,810 | |
| | | | Puerto Rico, General Obligation and Public Improvement Bonds, Series 2002A: | | | | | | | |
| | 1,040 | | 5.500%, 7/01/18 – NPFG Insured | No Opt. Call | | A | | | 1,000,064 | |
| | 4,170 | | 5.500%, 7/01/19 – NPFG Insured | No Opt. Call | | A | | | 3,986,103 | |
| | | | Puerto Rico, General Obligation Bonds, Public Improvement Refunding Series 2007A: | | | | | | | |
| | 3,700 | | 5.250%, 7/01/15 | No Opt. Call | | BBB– | | | 3,609,350 | |
| | 3,280 | | 5.500%, 7/01/21 – FGIC Insured | No Opt. Call | | BBB– | | | 2,645,681 | |
| | 5,255 | | University of Puerto Rico, University System Revenue Bonds, Series 2006P, 5.000%, 6/01/15 | No Opt. Call | | BBB– | | | 5,080,902 | |
| | 39,190 | | Total Puerto Rico | | | | | | 35,698,740 | |
| | | | Rhode Island – 1.1% (0.8% of Total Investments) | | | | | | | |
| | 6,000 | | Rhode Island Health & Educational Building Corporation, Public Schools Financing Program Revenue Bonds, Pooled Series 2009E, 6.000%, 5/15/29 – AGC Insured | 5/19 at 100.00 | | A3 | | | 6,365,820 | |
| | | | South Carolina – 1.6% (1.3% of Total Investments) | | | | | | | |
| | | | South Carolina JOBS Economic Development Authority, Hospital Revenue Bonds, Bon Secours Health System Obligated Group, Tender Option Bond Trust 1141: | | | | | | | |
| | 1,500 | | 21.737%, 11/01/27 (IF) (4) | 11/22 at 100.00 | | A– | | | 1,912,875 | |
| | 1,010 | | 21.716%, 11/01/28 (IF) (4) | 11/22 at 100.00 | | A– | | | 1,233,089 | |
| | 1,255 | | 21.737%, 11/01/29 (IF) (4) | 11/22 at 100.00 | | A– | | | 1,471,613 | |
| | 5,000 | | York County, South Carolina, Celanese, Series 1994, 5.700%, 1/01/24 (Alternative Minimum Tax) | 2/14 at 100.00 | | BB– | | | 4,995,900 | |
| | 8,765 | | Total South Carolina | | | | | | 9,613,477 | |
| | | | Tennessee – 0.6% (0.4% of Total Investments) | | | | | | | |
| | 1,210 | | Chattanooga Health, Educational, and Housing Facility Board, Tennessee, Revenue Refunding Bonds, CDFI Phase I, LLC Project, Series 2005A, 5.000%, 10/01/25 | 10/15 at 100.00 | | BBB– | | | 1,206,709 | |
| | 2,000 | | Clarksville Natural Gas Acquisition Corporation, Tennessee, Natural Gas Revenue Bonds, Series 2006, 5.000%, 12/15/21 – SYNCORA GTY Insured | No Opt. Call | | A | | | 2,176,300 | |
| | 3,210 | | Total Tennessee | | | | | | 3,383,009 | |
| | | | Texas – 11.1% (8.7% of Total Investments) | | | | | | | |
| | | | Austin Convention Enterprises Inc., Texas, Convention Center Hotel Revenue Bonds, First Tier Series 2006A: | | | | | | | |
| | 3,780 | | 5.250%, 1/01/24 – SYNCORA GTY Insured | 1/17 at 100.00 | | BB+ | | | 3,805,477 | |
| | 275 | | 5.000%, 1/01/34 – SYNCORA GTY Insured | 1/17 at 100.00 | | BB+ | | | 247,877 | |
| NID | Nuveen Intermediate Duration Municipal Term Fund (continued) |
| | Portfolio of Investments November 30, 2013 (Unaudited) |
| | Principal | | | Optional Call | | | | | | |
| | Amount (000) | | Description (1) | Provisions (2) | | Ratings (3) | | | Value | |
| | | | Texas (continued) | | | | | | | |
| $ | 7,000 | | Austin Convention Enterprises Inc., Texas, Convention Center Hotel Revenue Bonds, Second Tier Series 2006B, 5.750%, 1/01/24 | 1/17 at 100.00 | | Ba2 | | $ | 7,096,250 | |
| | | | Austin, Texas, Estancia Hill Country Public Improvement District, Area 1Special Assessment Revenue Bonds, Series 2013: | | | | | | | |
| | 1,695 | | 4.500%, 11/01/18 | No Opt. Call | | N/R | | | 1,692,339 | |
| | 1,500 | | 6.000%, 11/01/28 | 11/23 at 100.00 | | N/R | | | 1,492,605 | |
| | 680 | | Bexar County, Texas, Health Facilities Development Corporation Revenue Bonds, Army Retirement Residence, Series 2007, 5.000%, 7/01/27 | 7/17 at 100.00 | | BBB | | | 688,092 | |
| | 1,895 | | Board of Managers, Joint Guadalupe County – Seguin City Hospital, Texas, FHA Insured Hospital Mortgage Revenue Bonds, Guadalupe Regional Medical Center Project, Series 2007, 5.500%, 8/15/36 | 8/18 at 100.00 | | Baa3 | | | 1,960,283 | |
| | 2,000 | | Dallas Area Rapid Transit, Texas, Sales Tax Revenue Bonds, Tender Option Bond Trust 3307, 23.806%, 12/01/26 – AMBAC Insured (IF) (4) | No Opt. Call | | AA+ | | | 3,551,600 | |
| | 2,000 | | Gulf Coast Industrial Development Authority, Texas, Solid Waste Disposal Revenue Bonds, Citgo Petroleum Corporation Project, Series 1995, 4.875%, 5/01/25 (Alternative Minimum Tax) | 10/22 at 100.00 | | BB+ | | | 1,894,940 | |
| | | | Harris County Cultural Education Facilities Finance Corporation, Texas, Revenue Refunding Bonds, Young Men’s Christian Association of the Greater Houston Area, Series 2013A: | | | | | | | |
| | 330 | | 5.000%, 6/01/18 | No Opt. Call | | Baa3 | | | 368,072 | |
| | 1,500 | | 5.000%, 6/01/20 | No Opt. Call | | Baa3 | | | 1,654,125 | |
| | 535 | | 5.000%, 6/01/21 | No Opt. Call | | Baa3 | | | 585,456 | |
| | 855 | | 5.000%, 6/01/22 | No Opt. Call | | Baa3 | | | 928,983 | |
| | 915 | | 5.000%, 6/01/23 | No Opt. Call | | Baa3 | | | 987,093 | |
| | 4,735 | | Harris County-Houston Sports Authority, Texas, Junior Lien Revenue Refunding Bonds, Series 2001B, 5.250%, 11/15/40 – NPFG Insured | 5/14 at 100.00 | | A | | | 4,692,385 | |
| | 750 | | Health Facilities Development District of Central Texas, Revenue Bonds, Legacy at Willow Bend Project, Series 2006A, 5.625%, 11/01/26 | 11/16 at 100.00 | | N/R | | | 751,710 | |
| | 200 | | Love Field Airport Modernization Corporation, Texas, Special Facilities Revenue Bonds, Southwest Airlines Company – Love Field Modernization Program Project, Series 2012, 5.000%, 11/01/21 (Alternative Minimum Tax) | No Opt. Call | | BBB– | | | 210,544 | |
| | 1,250 | | Port Corpus Christi Authority, Nueces County, Texas, Pollution Control Revenue Bonds, Celanese Project, Refunding Series 2002B, 6.700%, 11/01/30 (Alternative Minimum Tax) | 5/14 at 100.00 | | BB– | | | 1,252,513 | |
| | 1,500 | | Red River Authority, Texas, Pollution Control Revenue Bonds, AEP Texas North Company, Public Service Company of Oklahoma and AEP Texas Central Company Oklaunion Project, Refunding Series 2007, 4.450%, 6/01/20 – NPFG Insured | No Opt. Call | | A | | | 1,604,265 | |
| | 2,680 | | San Antonio Public Facilities Corporation, Texas, Improvement and Refunding Lease Revenue Bonds, Convention Center Refinancing and Expansion Project, Tender Option Bond Trust 4281, 22.825%, 9/15/20 (IF) (4) | No Opt. Call | | AA+ | | | 3,622,422 | |
| | | | Tarrant County Cultural Education Facilities Finance Corporation, Texas, Hospital Revenue Bonds, Scott & White Healthcare Project, Tender Option Bond Trust 1149: | | | | | | | |
| | 100 | | 21.593%, 8/15/22 (IF) (4) | No Opt. Call | | AA– | | | 167,175 | |
| | 155 | | 21.391%, 8/15/24 (IF) (4) | 8/23 at 100.00 | | AA– | | | 238,888 | |
| | 200 | | 21.593%, 8/15/26 (IF) (4) | 8/23 at 100.00 | | AA– | | | 276,950 | |
| | 170 | | 21.351%, 8/15/27 (IF) (4) | 8/23 at 100.00 | | AA– | | | 223,273 | |
| | | | Texas Municipal Gas Acquisition and Supply Corporation I, Gas Supply Revenue Bonds, Senior Lien Series 2008D: | | | | | | | |
| | 895 | | 5.625%, 12/15/17 | No Opt. Call | | A– | | | 1,008,110 | |
| | 10,145 | | 6.250%, 12/15/26 | No Opt. Call | | A– | | | 11,660,866 | |
| | | | Texas Municipal Gas Acquisition and Supply Corporation III, Gas Supply Revenue Bonds, Series 2012: | | | | | | | |
| | 2,500 | | 5.000%, 12/15/19 | No Opt. Call | | A3 | | | 2,749,850 | |
| | 5,000 | | 5.000%, 12/15/20 | No Opt. Call | | A3 | | | 5,458,500 | |
| | 5,000 | | 5.000%, 12/15/22 | No Opt. Call | | A3 | | | 5,294,600 | |
| | 60,240 | | Total Texas | | | | | | 66,165,243 | |
| | | | Vermont – 0.6% (0.5% of Total Investments) | | | | | | | |
| | 3,600 | | Vermont Economic Development Authority, Solid Waste Disposal Revenue Bonds, Casella Waste Systems, Inc. Project, Series 2013, 4.750%, 4/02/36 (Mandatory put 4/02/18) (Alternative Minimum Tax) | No Opt. Call | | B+ | | | 3,465,828 | |
| | Principal | | | Optional Call | | | | | | |
| | Amount (000) | | Description (1) | Provisions (2) | | Ratings (3) | | | Value | |
| | | | Virgin Islands – 1.0% (0.8% of Total Investments) | | | | | | | |
| $ | 6,000 | | Virgin Islands Public Finance Authority, Gross Receipts Taxes Loan Note, Refunding Series 2012A, 4.000%, 10/01/22 | No Opt. Call | | BBB+ | | $ | 6,172,740 | |
| | | | Virginia – 3.2% (2.5% of Total Investments) | | | | | | | |
| | | | Dulles Town Center Community Development Authority, Loudon County, Virginia Special Assessment Refunding Bonds, Dulles Town Center Project, Series 2012: | | | | | | | |
| | 1,265 | | 4.000%, 3/01/20 | No Opt. Call | | N/R | | | 1,205,545 | |
| | 1,000 | | 5.000%, 3/01/21 | No Opt. Call | | N/R | | | 994,890 | |
| | 1,410 | | 5.000%, 3/01/22 | No Opt. Call | | N/R | | | 1,390,613 | |
| | | | Fairfax County Industrial Development Authority, Virginia, Healthcare Revenue Bonds, Inova Health System, Tender Option Bond Trust 3309: | | | | | | | |
| | 1,800 | | 22.813%, 5/15/20 (IF) (4) | No Opt. Call | | AA+ | | | 2,647,530 | |
| | 120 | | 22.813%, 5/15/20 (IF) (4) | No Opt. Call | | AA+ | | | 169,416 | |
| | 400 | | 17.781%, 5/15/20 (IF) (4) | No Opt. Call | | AA+ | | | 377,480 | |
| | 2,615 | | Giles County Industrial Development Authority, Virginia, Exempt Facility Revenue Bonds, Hoechst Celanese Project, Series 1996, 6.450%, 5/01/26 | 2/14 at 100.00 | | BB– | | | 2,616,229 | |
| | 2,727 | | Peninsula Town Center Community Development Authority, Virginia, Special Obligation Bonds, Series 2007, 5.800%, 9/01/17 | No Opt. Call | | N/R | | | 2,833,980 | |
| | 1,000 | | Roanoke Economic Development Authority, Virgina, Residential Care Facility Mortgage Revenue Refunding Bonds, Virginia Lutheran Homes Brandon Oaks Project, Series 2012, 5.000%, 12/01/32 | No Opt. Call | | N/R | | | 831,930 | |
| | | | Route 460 Funding Corporation, Virginia, Toll Road Revenue Bonds, Series 2012B: | | | | | | | |
| | 90 | | 0.000%, 7/01/24 | No Opt. Call | | BBB– | | | 52,251 | |
| | 465 | | 0.000%, 7/01/25 | No Opt. Call | | BBB– | | | 249,359 | |
| | 1,600 | | 0.000%, 7/01/26 | No Opt. Call | | BBB– | | | 800,120 | |
| | 2,515 | | 0.000%, 7/01/27 | No Opt. Call | | BBB– | | | 1,155,643 | |
| | 2,220 | | 0.000%, 7/01/28 | No Opt. Call | | BBB– | | | 963,702 | |
| | | | Virginia Gateway Community Development Authority, Prince William County, Virginia, Special Assessment Refunding Bonds, Series 2012: | | | | | | | |
| | 695 | | 5.000%, 3/01/25 | No Opt. Call | | N/R | | | 679,738 | |
| | 1,000 | | 4.500%, 3/01/29 | No Opt. Call | | N/R | | | 877,775 | |
| | 1,505 | | 5.000%, 3/01/30 | No Opt. Call | | N/R | | | 1,430,743 | |
| | 22,427 | | Total Virginia | | | | | | 19,276,944 | |
| | | | Washington – 1.9% (1.5% of Total Investments) | | | | | | | |
| | 550 | | Tacoma Consolidated Local Improvement District 65, Washington, Special Assessment Bonds, Series 2013, 5.750%, 4/01/43 | 4/14 at 100.00 | | N/R | | | 507,711 | |
| | 2,000 | | Washington State Health Care Facilities Authority, Revenue Bonds, Group Health Cooperative of Puget Sound, Series 2006, 5.000%, 12/01/24 – RAAI Insured | 12/16 at 100.00 | | BBB– | | | 1,986,635 | |
| | | | Washington State Housing Finance Commission, Non-Profit Housing Revenue Bonds, Mirabella Project, Series 2012A: | | | | | | | |
| | 4,700 | | 6.000%, 10/01/22 | No Opt. Call | | N/R | | | 4,574,087 | |
| | 2,135 | | 6.500%, 10/01/32 | No Opt. Call | | N/R | | | 1,977,774 | |
| | | | Washington State Housing Finance Commission, Non-Profit Revenue Bonds, Emerald Heights Project, Refunding 2013: | | | | | | | |
| | 1,000 | | 5.000%, 7/01/21 | No Opt. Call | | A– | | | 1,085,320 | |
| | 1,000 | | 5.000%, 7/01/23 | No Opt. Call | | A– | | | 1,063,390 | |
| | 11,385 | | Total Washington | | | | | | 11,194,917 | |
| | | | Wisconsin – 2.1% (1.7% of Total Investments) | | | | | | | |
| | 1,740 | | Green Bay Redevelopment Authority, Wisconsin, Industrial Development Revenue Bonds, Fort James Project, Series 1999, 5.600%, 5/01/19 (Alternative Minimum Tax) | No Opt. Call | | N/R | | | 1,868,308 | |
| | 5,805 | | Oneida Tribe of Indians of Wisconsin, Retail Sales Revenue Bonds, Series 2011-144A, 5.500%, 2/01/21 | No Opt. Call | | AA– | | | 6,371,800 | |
| | 350 | | Oneida Tribe of Indians of Wisconsin, Retail Sales Revenue Bonds, Series 2011-144A, 6.500%, 2/01/31 | 2/19 at 102.00 | | AA– | | | 378,228 | |
| | | | Public Finance Authority of Wisconsin, Educational Facility Revenue Bonds, Cottonwood Classical Preparatory School in Albuquerque, New Mexico, Series 2012A: | | | | | | | |
| | 1,200 | | 5.250%, 12/01/22 | No Opt. Call | | N/R | | | 1,140,480 | |
| | 1,610 | | 6.000%, 12/01/32 | No Opt. Call | | N/R | | | 1,445,313 | |
| NID | Nuveen Intermediate Duration Municipal Term Fund (continued) |
| | Portfolio of Investments November 30, 2013 (Unaudited) |
| | Principal | | | Optional Call | | | | | | |
| | Amount (000) | | Description (1) | Provisions (2) | | Ratings (3) | | | Value | |
| | | | Wisconsin (continued) | | | | | | | |
| $ | 930 | | Public Finance Authority of Wisconsin, Revenue Bonds, Roseman University of Health Sciences, Series 2012, 5.000%, 4/01/22 | No Opt. Call | | BB+ | | $ | 919,956 | |
| | | | University of Wisconsin Hospitals and Clinics Authority, Revenue Bonds, Tender Option Bond Trust 4287: | | | | | | | |
| | 50 | | 22.494%, 4/01/20 (IF) (4) | No Opt. Call | | Aa3 | | | 79,525 | |
| | 100 | | 22.363%, 10/01/20 (IF) (4) | No Opt. Call | | Aa3 | | | 161,310 | |
| | 185 | | 21.952%, 10/01/20 (IF) (4) | No Opt. Call | | Aa3 | | | 275,704 | |
| | 100 | | 22.363%, 10/01/20 (IF) (4) | No Opt. Call | | Aa3 | | | 142,475 | |
| | 12,070 | | Total Wisconsin | | | | | | 12,783,099 | |
| $ | 785,273 | | Total Long-Term Investments (cost $827,757,909) | | | | | | 760,630,444 | |
| | | | Variable Rate MuniFund Term Preferred Shares, at Liquidation Value – (29.3)% (7) | | | | | | (175,000,000 | ) |
| | | | Other Assets Less Liabilities – 1.9% (8) | | | | | | 11,371,060 | |
| | | | Net Assets Applicable to Common Shares – 100% | | | | | $ | 597,001,504 | |
Investments in Derivatives as of November 30, 2013
Swaps outstanding:
| | | | | Fund | | | | | | Fixed Rate | | | | | | Unrealized | |
| | | Notional | | Pay/Receive | | Floating Rate | | Fixed Rate | | Payment | | Effective | | Termination | | Appreciation | |
| Counterparty | | Amount | | Floating Rate | | Index | | (Annualized) | | Frequency | | Date (9) | | Date | | (Depreciation) (8) | |
| JPMorgan | | | $45,300,000 | | Receive | | 3-Month USD-LIBOR | | | 2.591 | % | Semi-Annually | | 5/15/14 | | 5/15/25 | | | $2,556,518 | |
| JPMorgan | | | 25,000,000 | | Receive | | USD-BMA Index | | | 3.323 | | Quarterly | | 7/28/14 | | 7/28/39 | | | 664,999 | |
| | | | $70,300,000 | | | | | | | | | | | | | | | | $3,221,517 | |
| (1) | All percentages shown in the Portfolio of Investments are based on net assets applicable to common shares unless otherwise noted. |
| (2) | Optional Call Provisions: Dates (month and year) and prices of the earliest optional call or redemption. There may be other call provisions at varying prices at later dates. Certain mortgage-backed securities may be subject to periodic principal paydowns. |
| (3) | Ratings: Using the highest of Standard & Poor’s Group (“Standard & Poor’s”), Moody’s Investors Service, Inc. (“Moody’s”) or Fitch, Inc. (“Fitch”) rating. Ratings below BBB by Standard & Poor’s, Baa by Moody’s or BBB by Fitch are considered to be below investment grade. Holdings designated N/R are not rated by any of these national rating agencies. |
| (4) | Investment, or portion of investment, has been pledged to collateralize the net payment obligations for investments in derivatives and/or inverse floating rate transactions. |
| (5) | At or subsequent to the end of the reporting period, this security is non-income producing. Non-income producing, in the case of a fixed-income security, generally denotes that the issuer has (1) defaulted on the payment of principal or interest, (2) is under the protection of the Federal Bankruptcy Court or (3) the Fund’s Adviser has concluded that the issue is not likely to meet its future interest payment obligations and has directed the Fund’s custodian to cease accruing additional income on the Fund’s records. |
| (6) | Backed by an escrow or trust containing sufficient U.S. Government or U.S. Government agency securities, which ensure the timely payment of principal and interest. Certain bonds backed by U.S. Government or agency securities are regarded as having an implied rating equal to the rating of such securities. |
| (7) | Variable Rate MuniFund Term Preferred Shares, at Liquidation Value as a percentage of Total Investments is 23.0%. |
| (8) | Other Assets Less Liabilities includes the Unrealized Appreciation (Depreciation) of derivative instruments as listed within Investments in Derivatives as of the end of the reporting period. |
| (9) | Effective date represents the date on which both the Fund and Counterparty commence interest payment accruals on each swap contract. |
| WI/DD | Investment, or portion of investment, purchased on a when-issued or delayed delivery basis. |
| (IF) | Inverse floating rate investment. |
| 144A | Investment is exempt from registration under Rule 144A of the Securities Act of 1933, as amended. These investments may only be resold in transactions exempt from registration, which are normally those transactions with qualified institutional buyers. |
| USD-LIBOR | United States Dollar-London Inter-Bank Offered Rate. |
| USD-BMA | United States Dollar-Bond Market Association. |
See accompanying notes to financial statements.
| NIQ | |
| | Nuveen Intermediate Duration Quality Municipal Term Fund |
| | Portfolio of Investments |
| | November 30, 2013 (Unaudited) |
| | Principal | | | Optional Call | | | | | | |
| | Amount (000) | | Description (1) | Provisions (2) | | Ratings (3) | | | Value | |
| | | | LONG TERM INVESTMENTS – 129.8% (100.0% of Total Investments) | | | | | | | |
| | | | MUNICIPAL BONDS – 129.8% (100.0% of Total Investments) | | | | | | | |
| | | | Alabama – 3.1% (2.4% of Total Investments) | | | | | | | |
| $ | 2,000 | | Alabama Federal Aid Highway Finance Authority, Federal Highway Grant Anticipation Revenue Bonds, Tender Option Bond Trust 2013-2W, 22.538%, 9/01/26 (IF) (4) | 9/22 at 100.00 | | AA | | $ | 2,873,100 | |
| | 2,500 | | Jefferson County, Alabama, General Obligation Refunding Warrants, Series 2003A, 5.000%, 4/01/22 – NPFG Insured | 2/14 at 100.00 | | A | | | 2,359,725 | |
| | 4,500 | | Total Alabama | | | | | | 5,232,825 | |
| | | | Arizona – 2.2% (1.7% of Total Investments) | | | | | | | |
| | 455 | | Arizona Health Facilities Authority, Health Care Facilities Revenue Bonds, The Beatitudes Campus Project, Series 2006, 5.100%, 10/01/22 | 10/16 at 100.00 | | N/R | | | 426,531 | |
| | | | Arizona Health Facilities Authority, Hospital Revenue Bonds, Phoenix Children’s Hospital, Series 2013D: | | | | | | | |
| | 965 | | 5.000%, 2/01/24 | 2/23 at 100.00 | | BBB+ | | | 1,018,683 | |
| | 1,065 | | 5.000%, 2/01/26 | 2/23 at 100.00 | | BBB+ | | | 1,090,304 | |
| | 1,000 | | University Medical Center Corporation, Tucson, Arizona, Hospital Revenue Bonds, Series 2011, 5.000%, 7/01/19 | No Opt. Call | | BBB+ | | | 1,102,740 | |
| | 3,485 | | Total Arizona | | | | | | 3,638,258 | |
| | | | California – 17.3% (13.3% of Total Investments) | | | | | | | |
| | 1,000 | | ABAG Finance Authority for Nonprofit Corporations, California, Revenue Bonds, Sharp HealthCare, Series 2009B, 6.375%, 8/01/34 | 8/14 at 100.00 | | A+ | | | 1,030,920 | |
| | 3,000 | | Alameda Corridor Transportation Authority, California, Senior Lien Revenue Refunding Bonds, Series 2013A, 5.000%, 10/01/27 – AGM Insured | 10/23 at 100.00 | | AA– | | | 3,263,520 | |
| | | | California Municipal Finance Authority, Revenue Bonds, Biola University, Series 2013: | | | | | | | |
| | 560 | | 5.000%, 10/01/19 | No Opt. Call | | Baa1 | | | 622,014 | |
| | 415 | | 5.000%, 10/01/21 | No Opt. Call | | Baa1 | | | 453,836 | |
| | 3,000 | | Foothill/Eastern Transportation Corridor Agency, California, Toll Road Revenue Bonds, Series 1995A, 5.000%, 1/01/35 – NPFG Insured | 1/14 at 100.00 | | A | | | 2,782,200 | |
| | 5,000 | | Foothill/Eastern Transportation Corridor Agency, California, Toll Road Revenue Refunding Bonds, Series 1999, 0.000%, 1/15/33 | No Opt. Call | | BBB– | | | 1,381,250 | |
| | 3,000 | | Golden State Tobacco Securitization Corporation, California, Tobacco Settlement Asset-Backed Bonds, Series 2007A-1, 5.000%, 6/01/33 | 6/17 at 100.00 | | B | | | 2,260,290 | |
| | | | Hesperia Public Financing Authority, California, Redevelopment and Housing Projects Tax Allocation Bonds, Series 2007A: | | | | | | | |
| | 1,350 | | 5.500%, 9/01/17 – SYNCORA GTY Insured | No Opt. Call | | N/R | | | 1,478,007 | |
| | 660 | | 5.500%, 9/01/27 – SYNCORA GTY Insured | No Opt. Call | | N/R | | | 654,291 | |
| | 1,265 | | Independent Cities Finance Authority, California, Mobile Home Park Revenue Bonds, Rancho Vallecitos Mobile Home Park, Series 2013, 4.500%, 4/15/23 | No Opt. Call | | BBB | | | 1,305,012 | |
| | | | Inland Empire Tobacco Securitization Authority, California, Tobacco Settlement Asset-Backed Bonds, Series 2007: | | | | | | | |
| | 1,460 | | 5.000%, 6/01/21 | 6/17 at 100.00 | | B | | | 1,355,274 | |
| | 1,170 | | 4.625%, 6/01/21 | 6/17 at 100.00 | | B | | | 1,060,079 | |
| | | | Jurupa Community Services District, California, Special Tax Bonds, Community Facilities District 31 Eastvale Area, Series 2013: | | | | | | | |
| | 150 | | 4.000%, 9/01/25 | 9/22 at 100.00 | | N/R | | | 139,818 | |
| | 305 | | 4.000%, 9/01/26 | 9/22 at 100.00 | | N/R | | | 279,444 | |
| | 250 | | 4.000%, 9/01/27 | 9/22 at 100.00 | | N/R | | | 224,870 | |
| NIQ | Nuveen Intermediate Duration Quality Municipal Term Fund (continued) |
| | Portfolio of Investments November 30, 2013 (Unaudited) |
| | Principal | | | Optional Call | | | | | | |
| | Amount (000) | | Description (1) | Provisions (2) | | Ratings (3) | | | Value | |
| | | | California (continued) | | | | | | | |
| | | | Monrovia Redevelopment Agency, California, Central Project Area 1 Subordinate Tax Allocation Refunding Bonds, Series 2012: | | | | | | | |
| $ | 335 | | 4.000%, 8/01/14 | No Opt. Call | | BBB | | $ | 342,333 | |
| | 695 | | 4.000%, 8/01/15 | No Opt. Call | | BBB | | | 728,770 | |
| | 760 | | Palomar Pomerado Health Care District, California, Certificates of Participation, Series 2010, 5.250%, 11/01/21 | 11/20 at 100.00 | | Baa3 | | | 782,162 | |
| | 1,820 | | Patterson Public Finance Authority, California, Revenue Bonds, Community Facilities District 2001-1, Senior Series 2013A , 5.000%, 9/01/22 | No Opt. Call | | N/R | | | 1,889,142 | |
| | 185 | | Riverside County Redevelopment Agency, California, Tax Allocation Housing Bonds, Series 2011A, 0.000%, 10/01/26 | No Opt. Call | | A– | | | 112,441 | |
| | 490 | | San Bernardino County Financing Authority, California, Revenue Bonds, Courthouse Facilities Project, Series 2007, 5.100%, 6/01/17 | No Opt. Call | | N/R | | | 497,453 | |
| | | | San Diego, California, Community Facilities District 3 Liberty Station Special Tax Refunding Bonds Series 2013: | | | | | | | |
| | 200 | | 5.000%, 9/01/14 | No Opt. Call | | N/R | | | 206,390 | |
| | 395 | | 5.000%, 9/01/15 | No Opt. Call | | N/R | | | 421,275 | |
| | 340 | | 5.000%, 9/01/17 | No Opt. Call | | N/R | | | 376,717 | |
| | 155 | | San Joaquin Hills Transportation Corridor Agency, Orange County, California, Toll Road Revenue Refunding Bonds, Series 1997A, 5.250%, 1/15/30 – NPFG Insured | 1/14 at 100.00 | | A | | | 146,291 | |
| | 1,080 | | San Jose Redevelopment Agency, California, Tax Allocation Bonds, Merged Area Redevelopment Project, Series 2005A, 5.000%, 8/01/17 – NPFG Insured | 8/15 at 100.00 | | A | | | 1,133,903 | |
| | 2,865 | | Vernon, California, Electric System Revenue Bonds, Series 2009A, 5.125%, 8/01/21 | 8/19 at 100.00 | | A– | | | 3,102,623 | |
| | 925 | | Washington Township Health Care District, California, Revenue Bonds, Series 2009A, 6.000%, 7/01/29 | 7/19 at 100.00 | | Baa1 | | | 980,898 | |
| | 32,830 | | Total California | | | | | | 29,011,223 | |
| | | | Colorado – 3.4% (2.6% of Total Investments) | | | | | | | |
| | | | Colorado Educational and Cultural Facilities Authority, Charter School Refunding Revenue Bonds, Pinnacle Charter School, Inc. K-8 Facility Project, Series 2013: | | | | | | | |
| | 280 | | 4.000%, 6/01/18 | No Opt. Call | | A | | | 301,627 | |
| | 310 | | 4.000%, 6/01/20 | No Opt. Call | | A | | | 328,842 | |
| | 200 | | 5.000%, 6/01/21 | No Opt. Call | | A | | | 223,210 | |
| | | | Colorado State Board of Governors, Colorado State University Auxiliary Enterprise System Revenue Bonds, Tender Option Bond Trust 3316: | | | | | | | |
| | 100 | | 22.813%, 9/01/22 (IF) (4) | No Opt. Call | | AA– | | | 177,335 | |
| | 300 | | 22.813%, 3/01/23 (IF) (4) | No Opt. Call | | AA– | | | 515,700 | |
| | 430 | | 22.761%, 3/01/24 (IF) (4) | No Opt. Call | | AA– | | | 704,796 | |
| | 725 | | 22.813%, 3/01/25 (IF) (4) | No Opt. Call | | AA– | | | 1,167,576 | |
| | 200 | | 22.813%, 9/01/25 (IF) (4) | No Opt. Call | | AA– | | | 311,490 | |
| | 200 | | Denver Convention Center Hotel Authority, Colorado, Revenue Bonds, Convention Center Hotel, Senior Lien Series 2006, 4.500%, 12/01/25 – SYNCORA GTY Insured | 11/16 at 100.00 | | BBB– | | | 200,472 | |
| | 340 | | E-470 Public Highway Authority, Colorado, Senior Revenue Bonds, Series 1997B, 0.000%, 9/01/21 – NPFG Insured | No Opt. Call | | A | | | 250,141 | |
| | 1,535 | | Lincoln Park Metropolitan District, Douglas County, Colorado, General Obligation Refunding and Improvement Bonds, Series 2008, 5.625%, 12/01/20 | 12/17 at 100.00 | | BBB– | | | 1,581,204 | |
| | 4,620 | | Total Colorado | | | | | | 5,762,393 | |
| | | | Florida – 8.7% (6.7% of Total Investments) | | | | | | | |
| | | | Atlantic Beach, Florida, Healthcare Facilities Revenue Refunding Bonds, Fleet Landing Project, Series 2013A: | | | | | | | |
| | 420 | | 5.000%, 11/15/20 | No Opt. Call | | BBB | | | 461,000 | |
| | 150 | | 5.000%, 11/15/23 | No Opt. Call | | BBB | | | 159,293 | |
| | 515 | | Belmont Community Development District, Florida, Capital Improvement Revenue Bonds, Phase 1 Project, Series 2013A, 5.500%, 11/01/23 | No Opt. Call | | N/R | | | 504,211 | |
| | 1,270 | | Brwoard County, Florida, Fuel System Revenue Bonds, Fort Lauderdale Fuel Facilities LLC Project, Series 2013A, 5.000%, 4/01/23 – AGM Insured (Alternative Minimum Tax) | No Opt. Call | | AA– | | | 1,391,984 | |
| | Principal | | | Optional Call | | | | | | |
| | Amount (000) | | Description (1) | Provisions (2) | | Ratings (3) | | | Value | |
| | | | Florida (continued) | | | | | | | |
| $ | 485 | | Capital Trust Agency, Florida, Fixed Rate Air Cargo Revenue Refunding Bonds, Aero Miami FX, LLC Project, Series 2010A, 5.350%, 7/01/29 | 7/20 at 100.00 | | Baa3 | | $ | 497,445 | |
| | 2,000 | | Collier County Educational Facilities Authority, Florida, Revenue Bonds, Ave Maria University, Refunding Series 2013A, 4.500%, 6/01/23 | No Opt. Call | | BBB– | | | 1,956,340 | |
| | 2,960 | | Florida Municipal Power Agency, Revenue Bonds, St. Lucie Project, Refunding Series 2012A, 5.000%, 10/01/26 | No Opt. Call | | A2 | | | 3,197,866 | |
| | 400 | | Fontainbleau Lakes Community Development District, Miami-Dade County, Florida, Special Assessment Revenue Bonds, Series 2007B, 6.000%, 5/01/15 | No Opt. Call | | N/R | | | 409,212 | |
| | | | Martin County Industrial Development Authority, Florida, Industrial Development Revenue Refunding Bonds, Indiantown Cogeneration LP, Series 2013: | | | | | | | |
| | 2,535 | | 3.950%, 12/15/21 (Alternative Minimum Tax) | 6/20 at 100.00 | | Ba1 | | | 2,294,555 | |
| | 500 | | 4.200%, 12/15/25 (Alternative Minimum Tax) | 6/20 at 100.00 | | Ba1 | | | 426,665 | |
| | 1,400 | | Palm Beach County Health Facilities Authority, Florida, Revenue Bonds, Jupiter Medical Center, Series 2013A, 5.000%, 11/01/22 | No Opt. Call | | BBB+ | | | 1,524,586 | |
| | 250 | | Seminole Tribe of Florida, Special Obligation Bonds, Series 2007A, 144A, 5.750%, 10/01/22 | 10/17 at 100.00 | | BBB– | | | 264,728 | |
| | 1,630 | | Verandah West Community Development District, Florida, Capital Improvement Revenue Bonds, Refunding Series 2013, 4.000%, 5/01/23 | No Opt. Call | | N/R | | | 1,490,456 | |
| | 14,515 | | Total Florida | | | | | | 14,578,341 | |
| | | | Georgia – 3.5% (2.6% of Total Investments) | | | | | | | |
| | 1,000 | | Atlanta, Georgia, Tax Allocation Bonds, Princeton Lakes Project, Series 2006, 5.500%, 1/01/31 | 1/16 at 100.00 | | BBB– | | | 1,000,140 | |
| | 2,000 | | East Point Building Authority, Georgia, Revenue Bonds, Water and Sewer Project Revenue Bonds, Series 2006A, 5.000%, 2/01/34 – SYNCORA GTY Insured | 2/16 at 100.00 | | N/R | | | 1,898,140 | |
| | 2,000 | | Fulton County Development Authority, Georgia, Revenue Bonds, Robert W. Woodruff Arts Center, Inc. Project, Refunding Series 2009B, 5.000%, 3/15/16 | No Opt. Call | | A2 | | | 2,191,420 | |
| | 960 | | Liberty County Industrial Authority, Georgia, Revenue Bonds, Series 2012A-2, 3.930%, 7/01/26 | 2/14 at 100.00 | | N/R | | | 720,504 | |
| | 5,960 | | Total Georgia | | | | | | 5,810,204 | |
| | | | Idaho – 0.6% (0.5% of Total Investments) | | | | | | | |
| | 1,000 | | Madison County, Idaho, Hospital Revenue Certificates of Participation, Madison Memorial Hospital, Series 2006, 5.250%, 9/01/20 | 9/16 at 100.00 | | BB+ | | | 1,015,450 | |
| | | | Illinois – 9.4% (7.2% of Total Investments) | | | | | | | |
| | 2,500 | | Cook County, Illinois, General Obligation Bonds, Tender Option Bond Trust 2013-2A, 18.330%, 11/15/25 (IF) | 11/22 at 100.00 | | AA | | | 2,995,100 | |
| | 1,500 | | Hillside, Cook County, Illinois, Senior Lien Tax Increment Revenue Bonds, Mannheim Redevelopment Project, Series 2008, 6.550%, 1/01/20 | 1/18 at 102.00 | | N/R | | | 1,512,720 | |
| | 1,000 | | Illinois Finance Authority, Charter School Revenue Bonds, Chicago Charter School Foundation, Series 2007, 5.000%, 12/01/26 | 12/16 at 100.00 | | BBB+ | | | 985,440 | |
| | 1,500 | | Illinois Finance Authority, Revenue Bonds, Friendship Village of Schaumburg, Series 2005A, 5.375%, 2/15/25 | 2/15 at 100.00 | | BB– | | | 1,417,710 | |
| | 2,680 | | Illinois Finance Authority, Revenue Bonds, Illinois Institute of Technology, Refunding Series 2006A, 5.000%, 4/01/24 | 4/16 at 100.00 | | Baa3 | | | 2,606,059 | |
| | 250 | | Illinois Finance Authority, Revenue Bonds, Montgomery Place Project, Series 2006A, 5.500%, 5/15/26 | 5/17 at 100.00 | | N/R | | | 250,228 | |
| | 5,000 | | Illinois State, General Obligation Bonds, Series 2013, 5.000%, 7/01/23 | No Opt. Call | | A– | | | 5,280,650 | |
| | 1,000 | | Southwestern Illinois Development Authority, Local Government Revenue Bonds, Edwardsville Community Unit School District 7 Project, Series 2007, 0.000%, 12/01/22 – AGM Insured | No Opt. Call | | AA– | | | 701,240 | |
| | 15,430 | | Total Illinois | | | | | | 15,749,147 | |
| NIQ | Nuveen Intermediate Duration Quality Municipal Term Fund (continued) |
| | Portfolio of Investments November 30, 2013 (Unaudited) |
| | Principal | | | Optional Call | | | | | | |
| | Amount (000) | | Description (1) | Provisions (2) | | Ratings (3) | | | Value | |
| | | | Indiana – 1.4% (1.1% of Total Investments) | | | | | | | |
| $ | 1,180 | | Indiana Finance Authority, Educational Facilities Revenue Bonds, 21st Century Charter School Project, Series 2013A, 6.000%, 3/01/33 | 3/23 at 100.00 | | BB– | | $ | 1,104,527 | |
| | 1,145 | | Indiana Finance Authority, Provate Activity Bonds, Ohio River Bridges East End Crossing Project, Series 2013B, 5.000%, 1/01/19 (Alternative Minimum Tax) | 1/17 at 100.00 | | BBB | | | 1,224,268 | |
| | 2,325 | | Total Indiana | | | | | | 2,328,795 | |
| | | | Iowa – 3.6% (2.7% of Total Investments) | | | | | | | |
| | 1,000 | | Iowa Finance Authority, Health Facility Revenue Bonds, Care Initiatives Project, Series 2006A, 5.500%, 7/01/25 | 7/16 at 100.00 | | BB+ | | | 1,006,290 | |
| | 2,000 | | Iowa Finance Authority, Iowa, Midwestern Disaster Area Revenue Bonds, Iowa Fertilizer Company Project, Series 2013, 5.000%, 12/01/19 | No Opt. Call | | BB– | | | 1,935,540 | |
| | 1,405 | | Iowa Higher Education Loan Authority, Private College Facility Revenue Bonds, Wartburg College, Series 2005A, 5.000%, 10/01/22 | 2/14 at 100.00 | | BB | | | 1,389,447 | |
| | 2,000 | | Iowa Tobacco Settlement Authority, Tobacco Asset-Backed Revenue Bonds, Series 2005B, 5.600%, 6/01/34 | 6/17 at 100.00 | | B+ | | | 1,669,100 | |
| | 6,405 | | Total Iowa | | | | | | 6,000,377 | |
| | | | Kentucky – 0.9% (0.7% of Total Investments) | | | | | | | |
| | | | Kentucky Economic Development Finance Authority, Louisville Arena Project Revenue Bonds, Louisville Arena Authority, Inc., Series 2008-A1: | | | | | | | |
| | 1,320 | | 5.750%, 12/01/28 – AGC Insured | 6/18 at 100.00 | | AA– | | | 1,363,256 | |
| | 115 | | 6.000%, 12/01/33 – AGC Insured | 6/18 at 100.00 | | AA– | | | 115,089 | |
| | 1,435 | | Total Kentucky | | | | | | 1,478,345 | |
| | | | Louisiana – 0.3% (0.2% of Total Investments) | | | | | | | |
| | 500 | | Louisiana Local Government Environmental Facilities & Community Development Authority, Revenue Bonds, Westlake Chemical Corporation Project, Series 2007, 6.750%, 11/01/32 | 11/17 at 100.00 | | BBB | | | 531,610 | |
| | | | Maine – 0.6% (0.5% of Total Investments) | | | | | | | |
| | 1,000 | | Maine Health and Higher Educational Facilities Authority Revenue Bonds, Eastern Maine Medical Center Obligated Group Issue, Series 2013, 5.000%, 7/01/33 | 7/23 at 100.00 | | Baa1 | | | 1,003,360 | |
| | | | Maryland – 1.0% (0.8% of Total Investments) | | | | | | | |
| | | | Maryland Health and Higher Educational Facilities Authority, Revenue Bonds, Frederick Memorial Hospital Issue, Series 2012A: | | | | | | | |
| | 195 | | 5.000%, 7/01/20 | No Opt. Call | | Baa1 | | | 221,210 | |
| | 275 | | 5.000%, 7/01/22 | No Opt. Call | | Baa1 | | | 305,583 | |
| | 1,000 | | Prince George’s County, Maryland, General Obligation Consolidated Public Improvement Bonds, Series 2011A, 5.000%, 9/15/22 | No Opt. Call | | AAA | | | 1,186,230 | |
| | 1,470 | | Total Maryland | | | | | | 1,713,023 | |
| | | | Massachusetts – 2.9% (2.3% of Total Investments) | | | | | | | |
| | 1,000 | | Massachusetts Development Finance Agency Revenue Bonds, Boston Medical Center Issue, Series 2012C, 5.000%, 7/01/29 | No Opt. Call | | BBB+ | | | 994,070 | |
| | 250 | | Massachusetts Development Finance Agency, First Mortgage Revenue Bonds, Brookhaven at Lexington Project, Series 2005A, 5.000%, 3/01/35 – RAAI Insured | 2/14 at 100.00 | | A | | | 244,065 | |
| | 1,000 | | Massachusetts Development Finance Agency, Resource Recovery Revenue Bonds, Covanta Energy Project, Series 2012A, 4.875%, 11/01/27 (Alternative Minimum Tax) | No Opt. Call | | BB+ | | | 895,650 | |
| | 1,770 | | Massachusetts Development Finance Authority, Revenue Bonds, Eastern Nazarene College, Series 1999, 5.625%, 4/01/19 | 2/14 at 100.00 | | BB+ | | | 1,770,372 | |
| | | | Massachusetts Port Authority, Special Facilities Revenue Bonds, Delta Air Lines Inc., Series 2001A: | | | | | | | |
| | 140 | | 5.000%, 1/01/21 – AMBAC Insured | 2/14 at 100.00 | | N/R | | | 136,570 | |
| | 1,000 | | 5.000%, 1/01/27 – AMBAC Insured (Alternative Minimum Tax) | 1/14 at 100.00 | | N/R | | | 912,700 | |
| | 5,160 | | Total Massachusetts | | | | | | 4,953,427 | |
| | Principal | | | Optional Call | | | | | | |
| | Amount (000) | | Description (1) | Provisions (2) | | Ratings (3) | | | Value | |
| | | | Michigan – 10.3% (8.0% of Total Investments) | | | | | | | |
| $ | 1,000 | | Detroit City School District, Wayne County, Michigan, General Obligation Bonds, Tender Option Bond Trust 3308, 23.588%, 11/01/26 – AGM Insured (IF) (4) | No Opt. Call | | Aa2 | | $ | 1,065,850 | |
| | 810 | | Detroit, Michigan, General Obligation Bonds, Refunding Series 2005C, 5.000%, 4/01/15 – AGM Insured (5) | No Opt. Call | | AA– | | | 803,334 | |
| | 400 | | Detroit, Michigan, General Obligation Bonds, Series 2005A, 5.000%, 4/01/25 – AGM Insured (5) | No Opt. Call | | AA– | | | 353,880 | |
| | 500 | | Detroit, Michigan, Second Lien Sewerage Disposal System Revenue Bonds, Series 2005A, 5.000%, 7/01/35 – NPFG Insured | 7/15 at 100.00 | | A | | | 453,935 | |
| | 370 | | Detroit, Michigan, Senior Lien Sewerage Disposal System Revenue Bonds, Remarketed Series 1998A, 5.250%, 7/01/23 – AGC Insured | 7/17 at 100.00 | | AA– | | | 370,100 | |
| | 2,500 | | Detroit, Michigan, Senior Lien Sewerage Disposal System Revenue Bonds, Series 2004A, 5.250%, 7/01/19 – AGM Insured | No Opt. Call | | AA– | | | 2,522,875 | |
| | | | Detroit, Michigan, Sewer Disposal System Revenue Bonds, Second Lien, Series 2006B: | | | | | | | |
| | 50 | | 5.000%, 7/01/33 – NPFG Insured | 7/16 at 100.00 | | A | | | 45,624 | |
| | 60 | | 5.000%, 7/01/33 – FGIC Insured | 7/16 at 100.00 | | A | | | 54,749 | |
| | 1,260 | | 5.000%, 7/01/36 – MBIA-NPFG Insured | 7/16 at 100.00 | | A | | | 1,141,258 | |
| | 735 | | Detroit, Michigan, Water Supply System Second Lien Revenue Bonds, Series 2003B, 5.000%, 7/01/34 – NPFG Insured | 2/14 at 100.00 | | A | | | 668,931 | |
| | 250 | | Detroit, Michigan, Water Supply System Second Lien Revenue Bonds, Series 2006A, 5.000%, 7/01/34 – AGM Insured | 7/16 at 100.00 | | AA– | | | 234,698 | |
| | 290 | | Detroit, Michigan, Water Supply System Second Lien Revenue Refunding Bonds, Series 2006C, 5.000%, 7/01/33 – AGM Insured | No Opt. Call | | AA– | | | 272,731 | |
| | | | Detroit, Michigan, Water Supply System Senior Lien Revenue Bonds, Series 2003A: | | | | | | | |
| | 250 | | 5.000%, 7/01/27 – NPFG Insured | 2/14 at 100.00 | | A | | | 236,758 | |
| | 565 | | 5.000%, 7/01/34 – NPFG Insured | 2/14 at 100.00 | | A | | | 514,212 | |
| | 440 | | Detroit, Michigan, Water Supply System Senior Lien Revenue Bonds, Series 2003D. RMKTD, 5.000%, 7/01/33 – NPFG Insured | No Opt. Call | | A | | | 401,491 | |
| | 10 | | Detroit, Michigan, Water Supply System Senior Lien Revenue Refunding Bonds, Series 2006D, 5.000%, 7/01/32 – AGM Insured | 7/16 at 100.00 | | AA– | | | 9,422 | |
| | 730 | | Flint Hospital Building Authority, Michigan, Building Authority Revenue Bonds, Hurley Medical Center, Series 2013A, 5.000%, 7/01/23 | No Opt. Call | | Ba1 | | | 691,836 | |
| | 2,020 | | Michigan Finance Authority, Hospital Revenue and REfunding Bonds, Crittenton Hospital Medical Center, Series 2012A, 4.125%, 6/01/32 | No Opt. Call | | A– | | | 1,757,380 | |
| | 250 | | Michigan Finance Authority, Public School Academy Limited Obligation Revenue Bonds, Old Redford Academy Project, Series 2010A, 5.250%, 12/01/20 | No Opt. Call | | BB | | | 243,295 | |
| | 1,405 | | Michigan Finance Authority, Revenue Bonds, Trinity Health Credit Group, Tender Option Bond Trust 4286, 22.538%, 12/01/18 (IF) (4) | No Opt. Call | | Aa2 | | | 1,855,766 | |
| | 2,900 | | Taylor Brownfield Redevelopment Authority, Wayne County, Michigan, Tax Increment Bonds, Series 2005A, 5.000%, 5/01/29 – NPFG Insured | 5/15 at 100.00 | | A | | | 2,657,183 | |
| | 1,000 | | Wayne County Airport Authority, Michigan, Revenue Bonds, Detroit Metropolitan Airport, Refunding Series 2010C, 5.000%, 12/01/14 | No Opt. Call | | A | | | 1,044,640 | |
| | 17,795 | | Total Michigan | | | | | | 17,399,948 | |
| | | | Minnesota – 1.7% (1.3% of Total Investments) | | | | | | | |
| | 750 | | Rochester, Minnesota, Health Care Facilities Revenue Bonds, Olmsted Medical Center Project, Series 2013, 5.000%, 7/01/20 | No Opt. Call | | A– | | | 856,148 | |
| | | | Saint Paul Housing and Redevelopment Authority, Minnesota, Lease Revenue Bonds, Saint Paul Conservatory for Performing Artists Charter School Project, Series 2013A: | | | | | | | |
| | 205 | | 3.550%, 3/01/21 | No Opt. Call | | BBB– | | | 192,060 | |
| | 100 | | 3.700%, 3/01/22 | No Opt. Call | | BBB– | | | 92,048 | |
| | | | Sauk Rapids, Minnesota, Health Care and Housing Facilities Revenue Bonds, Good Shepherd Luthran Home, Refunding Series 2013: | | | | | | | |
| | 610 | | 5.000%, 1/01/17 | No Opt. Call | | N/R | | | 631,667 | |
| | 500 | | 5.000%, 1/01/18 | No Opt. Call | | N/R | | | 518,385 | |
| | 500 | | 5.000%, 1/01/19 | No Opt. Call | | N/R | | | 516,750 | |
| | 2,665 | | Total Minnesota | | | | | | 2,807,058 | |
| NIQ | Nuveen Intermediate Duration Quality Municipal Term Fund (continued) |
| | Portfolio of Investments November 30, 2013 (Unaudited) |
| | Principal | | | Optional Call | | | | | | |
| | Amount (000) | | Description (1) | Provisions (2) | | Ratings (3) | | | Value | |
| | | | Mississippi – 2.4% (1.8% of Total Investments) | | | | | | | |
| | | | Mississippi Development Bank Special Obligation Bonds, Marshall County Industrial Development Authority, Mississippi Highway Construction Project, Tender Option Bond Trust 3315: | | | | | | | |
| $ | 800 | | 22.438%, 1/01/20 (IF) (4) | No Opt. Call | | AA– | | $ | 1,234,240 | |
| | 1,000 | | 22.438%, 1/01/20 (IF) (4) | No Opt. Call | | AA– | | | 1,465,300 | |
| | 200 | | 22.438%, 1/01/20 (IF) (4) | No Opt. Call | | AA– | | | 282,140 | |
| | 1,000 | | Mississippi Hospital Equipment and Facilities Authority, Revenue Bonds, South Central Regional Medical Center, Refunding & Improvement Series 2006, 5.250%, 12/01/21 | 12/16 at 100.00 | | BBB | | | 1,035,470 | |
| | 3,000 | | Total Mississippi | | | | | | 4,017,150 | |
| | | | Missouri – 1.0% (0.8% of Total Investments) | | | | | | | |
| | 700 | | Franklin County Industrial Development Authority, Missouri, Sales Tax Refunding Revenue Bonds, Phoenix Center II Community Improvement District Project, Series 2013A, 4.000%, 11/01/25 | 11/20 at 100.00 | | N/R | | | 667,954 | |
| | 1,000 | | Kansas City Tax Increment Financing Commission, Missouri, Tax Increment Revenue Bonds, Briarcliff West Project, Series 2006A, 5.400%, 6/01/24 | 6/14 at 102.00 | | N/R | | | 1,015,670 | |
| | 1,700 | | Total Missouri | | | | | | 1,683,624 | |
| | | | Nebraska – 1.8% (1.4% of Total Investments) | | | | | | | |
| | 3,000 | | Central Plains Energy Project, Nebraska, Gas Project 3 Revenue Bonds, Series 2012, 5.000%, 9/01/32 | 9/22 at 100.00 | | A | | | 2,970,540 | |
| | | | New Jersey – 11.9% (9.2% of Total Investments) | | | | | | | |
| | | | Atlantic City, New Jersey, General Obligation Bonds, Tax Appeal Series 2012: | | | | | | | |
| | 1,425 | | 4.000%, 11/01/23 – AGM Insured | 11/22 at 100.00 | | AA– | | | 1,460,454 | |
| | 4,805 | | 4.000%, 11/01/24 – AGM Insured | 11/22 at 100.00 | | AA– | | | 4,868,474 | |
| | 2,405 | | 4.000%, 11/01/25 – AGM Insured | 11/22 at 100.00 | | AA– | | | 2,420,488 | |
| | 615 | | New Jersey Economic Development Authority, Charter School Revenue Bonds, Lady Liberty Academy Charter School Project, Series 2013A, 5.150%, 8/01/23 | No Opt. Call | | BB+ | | | 580,886 | |
| | | | New Jersey Economic Development Authority, Cigarette Tax Revenue Refunding Bonds, Series 2012: | | | | | | | |
| | 2,000 | | 5.000%, 6/15/24 | 6/22 at 100.00 | | BBB+ | | | 2,116,240 | |
| | 1,000 | | 5.000%, 6/15/28 | No Opt. Call | | BBB+ | | | 1,007,580 | |
| | | | New Jersey Economic Development Authority, Private Activity Bonds, The Goethals Bridge Replacement Project, Series 2013: | | | | | | | |
| | 860 | | 5.000%, 1/01/21 (Alternative Minimum Tax) | No Opt. Call | | BBB– | | | 939,215 | |
| | 500 | | 5.000%, 1/01/22 (Alternative Minimum Tax) | No Opt. Call | | BBB– | | | 539,985 | |
| | 500 | | 5.000%, 7/01/22 (Alternative Minimum Tax) | No Opt. Call | | BBB– | | | 539,420 | |
| | 1,000 | | New Jersey Economic Development Authority, School Facilities Construction Financing Program Bonds, Tender Option Bond Trust 1151, 3.171%, 9/01/25 (IF) (4) | 3/25 at 100.00 | | A+ | | | 914,950 | |
| | 1,000 | | New Jersey Economic Development Authority, Special Facilities Revenue Bonds, Continental Airlines Inc., Series 1999, 5.250%, 9/15/29 (Alternative Minimum Tax) | 9/22 at 101.00 | | B | | | 930,800 | |
| | 1,045 | | New Jersey Health Care Facilities Financing Authority, New Jersey, Revenue Bonds, Saint Peters University Hospital, Series 2007, 5.250%, 7/01/21 | 7/18 at 100.00 | | BB+ | | | 1,064,542 | |
| | 195 | | New Jersey Health Care Facilities Financing Authority, Revenue Bonds, Saint Joseph’s Healthcare System Obligated Group Issue, Series 2008, 6.000%, 7/01/18 | No Opt. Call | | BBB– | | | 214,730 | |
| | 3,000 | | Tobacco Settlement Financing Corporation, New Jersey, Tobacco Settlement Asset-Backed Bonds, Series 2007-1A, 5.000%, 6/01/29 | 6/17 at 100.00 | | B2 | | | 2,394,210 | |
| | 20,350 | | Total New Jersey | | | | | | 19,991,974 | |
| | Principal | | | Optional Call | | | | | | |
| | Amount (000) | | Description (1) | Provisions (2) | | Ratings (3) | | | Value | |
| | | | New York – 4.2% (3.2% of Total Investments) | | | | | | | |
| | | | New York City Industrial Development Agency, New York, American Airlines-JFK International Airport Special Facility Revenue Bonds, Series 2005: | | | | | | | |
| $ | 1,395 | | 7.500%, 8/01/16 (Alternative Minimum Tax) | No Opt. Call | | N/R | | $ | 1,462,490 | |
| | 2,000 | | 7.625%, 8/01/25 (Alternative Minimum Tax) | 8/16 at 101.00 | | N/R | | | 2,166,660 | |
| | | | New York City Industrial Development Agency, New York, Civic Facility Revenue Bonds, Vaughn College of Aeronautics, Series 2006A: | | | | | | | |
| | 330 | | 5.000%, 12/01/16 | No Opt. Call | | BB | | | 341,448 | |
| | 1,800 | | 5.000%, 12/01/21 | 12/16 at 100.00 | | BB | | | 1,807,542 | |
| | 195 | | New York City Industrial Development Agency, New York, Civic Facility Revenue Bonds, Vaughn College of Aeronautics, Series 2006B, 5.000%, 12/01/16 | No Opt. Call | | BB | | | 201,765 | |
| | 1,000 | | Suffolk County Industrial Development Agency, New York, Continuing Care Retirement Community Revenue Bonds, Jefferson’s Ferry Project, Series 2006, 5.000%, 11/01/28 | 11/16 at 100.00 | | BBB– | | | 1,017,760 | |
| | 6,720 | | Total New York | | | | | | 6,997,665 | |
| | | | North Carolina – 1.6% (1.2% of Total Investments) | | | | | | | |
| | 1,000 | | Charlotte, North Carolina, Special Facility Refunding Revenue Bonds, Charlotte/Douglas International Airport, US Airways, Inc. Project, Series 1998, 5.600%, 7/01/27 (Alternative Minimum Tax) | 2/14 at 100.00 | | N/R | | | 951,540 | |
| | 1,040 | | North Carolina Eastern Municipal Power Agency, Power System Revenue Refunding Bonds, Series 1993B, 6.000%, 1/01/18 – AMBAC Insured | No Opt. Call | | Baa1 | | | 1,233,565 | |
| | 400 | | North Carolina Turnpike Authority, Triangle Expressway System Revenue Bonds, Series 2009A, 5.250%, 1/01/25 – AGC Insured | No Opt. Call | | AA– | | | 434,884 | |
| | 2,440 | | Total North Carolina | | | | | | 2,619,989 | |
| | | | Ohio – 4.9% (3.8% of Total Investments) | | | | | | | |
| | 5,000 | | Buckeye Tobacco Settlement Financing Authority, Ohio, Tobacco Settlement Asset-Backed Revenue Bonds, Senior Lien, Series 2007A-2, 5.875%, 6/01/30 | 6/17 at 100.00 | | B | | | 3,981,500 | |
| | 2,000 | | Ohio Air Quality Development Authority, Ohio, Revenue Bonds, Ohio Valley Electric Corporation Project, Series 2009E, 5.625%, 10/01/19 | No Opt. Call | | BBB– | | | 2,182,300 | |
| | 2,000 | | Ross County, Ohio, Hospital Revenue Refunding Bonds, Adena Health System Series 2008, 5.750%, 12/01/28 | 12/18 at 100.00 | | A– | | | 2,143,760 | |
| | 9,000 | | Total Ohio | | | | | | 8,307,560 | |
| | | | Oregon – 0.6% (0.5% of Total Investments) | | | | | | | |
| | 965 | | Astoria Hospital Facilities Authority, Oregon, Hospital Revenue and Refunding Bonds, Columbia Memorial Hospital, Series 2012, 5.000%, 8/01/22 | No Opt. Call | | BBB– | | | 1,035,387 | |
| | | | Pennsylvania – 4.8% (3.7% of Total Investments) | | | | | | | |
| | 90 | | East Hempfield Township Industrial Development Authority, Pennsylvania, Student Services Inc – Student Housing Project at Millersville University, Series 2013, 4.000%, 7/01/19 | No Opt. Call | | BBB– | | | 92,463 | |
| | | | Erie Higher Education Building Authority, Pennsylvania, Revenue Bonds, Gannon University Project, Series 2013: | | | | | | | |
| | 465 | | 4.000%, 5/01/20 | No Opt. Call | | BBB | | | 485,702 | |
| | 480 | | 4.000%, 5/01/21 | No Opt. Call | | BBB | | | 491,563 | |
| | 500 | | 4.000%, 5/01/22 | No Opt. Call | | BBB | | | 502,835 | |
| | 520 | | 4.000%, 5/01/23 | No Opt. Call | | BBB | | | 515,954 | |
| | 2,190 | | Erie Sewer Authority, Erie County, Pennsylvania, Sewer Revenue Bonds, Series 2012A, 5.000%, 6/01/21 – AGM Insured | No Opt. Call | | AA– | | | 2,459,655 | |
| | | | Lebanon County Health Facilities Authority, Pennsylvania, Revenue Bonds, Good Samaritan Hospital Project, Series 2002: | | | | | | | |
| | 255 | | 5.900%, 11/15/28 | 2/14 at 100.00 | | B+ | | | 240,725 | |
| | 1,000 | | 6.000%, 11/15/35 | 2/14 at 100.00 | | B+ | | | 914,710 | |
| | 500 | | Pennsylvania Economic Development Financing Authority, Revenue Bonds, Northwestern Human Services Inc., Series 1998A, 5.250%, 6/01/28 | 6/14 at 100.00 | | N/R | | | 484,220 | |
| NIQ | Nuveen Intermediate Duration Quality Municipal Term Fund (continued) |
| | Portfolio of Investments November 30, 2013 (Unaudited) |
| | Principal | | | Optional Call | | | | | | |
| | Amount (000) | | Description (1) | Provisions (2) | | Ratings (3) | | | Value | |
| | | | Pennsylvania (continued) | | | | | | | |
| $ | 1,000 | | Pittsburgh Water and Sewerage Authority, Pennsylvania, First Lien Water and Sewerage System Revenue Bonds, Series 2005, 5.000%, 9/01/19 (Pre-refunded 9/01/15) – NPFG Insured | 9/15 at 100.00 | | A (6) | | $ | 1,082,560 | |
| | | | Southcentral Pennsylvania General Authority, Revenue Bonds, Hanover Hospital Inc., Series 2013: | | | | | | | |
| | 370 | | 5.000%, 12/01/20 | No Opt. Call | | BBB– | | | 398,338 | |
| | 435 | | 5.000%, 12/01/21 | No Opt. Call | | BBB– | | | 461,918 | |
| | 7,805 | | Total Pennsylvania | | | | | | 8,130,643 | |
| | | | Puerto Rico – 5.1% (3.9% of Total Investments) | | | | | | | |
| | 2,095 | | Puerto Rico Municipal Finance Agency, Series 2005B, 5.250%, 7/01/19 – CIFG Insured | No Opt. Call | | AA– | | | 2,076,920 | |
| | 2,445 | | Puerto Rico, General Obligation and Public Improvement Bonds, Series 2002A, 5.500%, 7/01/18 – NPFG Insured | No Opt. Call | | A | | | 2,351,112 | |
| | 1,700 | | Puerto Rico, General Obligation Bonds, Public Improvement Refunding Series 2007A, 5.500%, 7/01/19 – NPFG Insured | No Opt. Call | | A | | | 1,625,030 | |
| | 2,570 | | Puerto Rico, Highway Revenue Bonds, Highway and Transportation Authority, Series 2005BB, 5.250%, 7/01/22 – AGM Insured | No Opt. Call | | AA– | | | 2,495,573 | |
| | 8,810 | | Total Puerto Rico | | | | | | 8,548,635 | |
| | | | Rhode Island – 3.7% (2.8% of Total Investments) | | | | | | | |
| | 4,000 | | Rhode Island Health & Educational Building Corporation, Public Schools Financing Program Revenue Bonds, Pooled Series 2009E, 6.000%, 5/15/29 – AGC Insured | 5/19 at 100.00 | | A3 | | | 4,243,880 | |
| | 2,000 | | Rhode Island Tobacco Settlement Financing Corporation, Tobacco Settlement Asset-Backed Bonds, Series 2002A, 6.250%, 6/01/42 | 2/14 at 100.00 | | BBB– | | | 1,943,060 | |
| | 6,000 | | Total Rhode Island | | | | | | 6,186,940 | |
| | | | South Carolina – 0.7% (0.5% of Total Investments) | | | | | | | |
| | 1,000 | | Piedmont Municipal Power Agency, South Carolina, Electric Revenue Bonds, Series 2010-A2, 5.000%, 1/01/18 | No Opt. Call | | A– | | | 1,146,430 | |
| | | | Tennessee – 6.2% (4.8% of Total Investments) | | | | | | | |
| | | | Knox County Health, Educational and Housing Facility Board, Tennesse, Hospital Revenue Refunding Bonds, Covenant Health, Series 2012A: | | | | | | | |
| | 1,440 | | 5.000%, 1/01/25 | No Opt. Call | | A | | | 1,531,282 | |
| | 2,000 | | 5.000%, 1/01/26 | No Opt. Call | | A | | | 2,105,100 | |
| | 2,000 | | Memphis-Shelby County Airport Authority, Tennessee, Airport Revenue Bonds, Series 2010B, 5.750%, 7/01/22 (Alternative Minimum Tax) | 7/20 at 100.00 | | A | | | 2,253,360 | |
| | 400 | | The Tennessee Energy Acquisition Corporation, Gas Revenue Bonds, Series 2006B, 5.625%, 9/01/26 | No Opt. Call | | BBB | | | 408,924 | |
| | | | The Tennessee Energy Acquisition Corporation, Gas Revenue Bonds, Series 2006C: | | | | | | | |
| | 1,020 | | 5.000%, 2/01/21 | No Opt. Call | | A | | | 1,114,421 | |
| | 1,490 | | 5.000%, 2/01/24 | No Opt. Call | | A | | | 1,601,780 | |
| | 1,365 | | 5.000%, 2/01/25 | No Opt. Call | | A | | | 1,449,930 | |
| | 9,715 | | Total Tennessee | | | | | | 10,464,797 | |
| | | | Texas – 7.6% (5.8% of Total Investments) | | | | | | | |
| | 200 | | Central Texas Regional Mobility Authority, Revenue Bonds, Senior Lien Series 2010, 5.750%, 1/01/25 | 1/20 at 100.00 | | Baa2 | | | 212,084 | |
| | 500 | | Central Texas Regional Mobility Authority, Revenue Bonds, Subordinate Lien Refunding Series 2013, 5.000%, 1/01/22 | No Opt. Call | | Baa3 | | | 506,950 | |
| | 685 | | Denton County Fresh Water Supply District 7, Texas, General Obligation Bonds, Refunding Series 2013, 4.000%, 2/15/21 – AGM Insured | No Opt. Call | | AA– | | | 715,702 | |
| | 125 | | Harris County-Houston Sports Authority, Texas, Junior Lien Revenue Refunding Bonds, Series 2001B, 5.250%, 11/15/40 – NPFG Insured | 5/14 at 100.00 | | A | | | 123,875 | |
| | 200 | | Harris County-Houston Sports Authority, Texas, Revenue Bonds, Senior Lien Series 2001G, 5.250%, 11/15/30 – NPFG Insured | 2/14 at 100.00 | | A | | | 198,842 | |
| | 150 | | Harris County-Houston Sports Authority, Texas, Senior Lien Revenue Refunding Bonds, Series 2001A, 5.250%, 11/15/30 – NPFG Insured | 2/14 at 100.00 | | A | | | 149,132 | |
| | Principal | | | Optional Call | | | | | | |
| | Amount (000) | | Description (1) | Provisions (2) | | Ratings (3) | | | Value | |
| | | | Texas (continued) | | | | | | | |
| $ | 305 | | Harris County-Houston Sports Authority, Texas, Senior Lien Special Revenue Bonds, Series 1998A, 5.000%, 11/15/25 – NPFG Insured | 2/14 at 100.00 | | A | | $ | 303,908 | |
| | 515 | | Houston, Texas, Hotel Occupancy Tax and Special Revenue Bonds, Convention and Entertainment Facilities Department, Refunding Series 2011A, 5.250%, 9/01/19 | No Opt. Call | | A2 | | | 589,464 | |
| | 900 | | Lewisville, Texas, Combination Contract Revenue and Special Assessment Bonds, Lewisville Castle Hills Public Improvement District 3 Project, Series 2004, 6.125%, 9/01/29 – ACA Insured | No Opt. Call | | N/R | | | 912,141 | |
| | 100 | | Love Field Airport Modernization Corporation, Texas, Special Facilities Revenue Bonds, Southwest Airlines Company – Love Field Modernization Program Project, Series 2012, 5.000%, 11/01/20 (Alternative Minimum Tax) | No Opt. Call | | BBB– | | | 106,240 | |
| | 430 | | Lufkin Health Facilities Development Corporation, Texas, Health System Revenue Bonds, Memorial Health System of East Texas, Refunding Series 2009, 6.000%, 2/15/24 | 2/19 at 100.00 | | BBB– | | | 453,254 | |
| | | | Tarrant County Cultural Education Facilities Finance Corporation, Texas, Hospital Revenue Bonds, Scott & White Healthcare Project, Tender Option Bond Trust 1149: | | | | | | | |
| | 100 | | 21.593%, 8/15/22 (IF) (4) | No Opt. Call | | AA– | | | 167,175 | |
| | 155 | | 21.391%, 8/15/24 (IF) (4) | 8/23 at 100.00 | | AA– | | | 238,888 | |
| | 200 | | 21.593%, 8/15/26 (IF) (4) | 8/23 at 100.00 | | AA– | | | 276,950 | |
| | 175 | | 21.351%, 8/15/27 (IF) (4) | 8/23 at 100.00 | | AA– | | | 229,840 | |
| | 3,000 | | Texas Municipal Gas Acquisition and Supply Corporation I, Gas Supply Revenue Bonds, Senior Lien Series 2008D, 6.250%, 12/15/26 | No Opt. Call | | A– | | | 3,448,260 | |
| | 3,000 | | Texas Municipal Gas Acquisition and Supply Corporation III, Gas Supply Revenue Bonds, Series 2012, 5.000%, 12/15/27 | No Opt. Call | | A3 | | | 2,988,680 | |
| | 230 | | Texas Public Finance Authority Charter School Finance Corporation, Education Revenue Bonds, Uplift Education, Series 2007A, 5.750%, 12/01/27 | 12/17 at 100.00 | | BBB– | | | 235,382 | |
| | 360 | | Texas Public Finance Authority, Revenue Bonds, Texas Southern University Financing System, Series 2011, 6.000%, 5/01/23 | 5/21 at 100.00 | | Baa1 | | | 403,621 | |
| | 460 | | Waco Health Facilities Development Corporation, Texas, Hillcrest Health System Project, FHA Insured Mortgage Revenue Bonds, Series 2006A, 5.000%, 8/01/31 (Pre-refunded 8/01/16) – NPFG Insured | 8/16 at 100.00 | | A (6) | | | 515,573 | |
| | 11,790 | | Total Texas | | | | | | 12,775,961 | |
| | | | Vermont – 0.5% (0.4% of Total Investments) | | | | | | | |
| | 900 | | Vermont Economic Development Authority, Solid Waste Disposal Revenue Bonds, Casella Waste Systems, Inc. Project, Series 2013, 4.750%, 4/01/36 (Mandatory put 4/02/18) (Alternative Minimum Tax) | No Opt. Call | | B+ | | | 866,457 | |
| | | | Virgin Islands – 1.2% (1.0% of Total Investments) | | | | | | | |
| | 2,000 | | Virgin Islands Public Finance Authority, Gross Receipts Taxes Loan Note, Refunding Series 2012A, 4.000%, 10/01/22 – AGM Insured | No Opt. Call | | AA– | | | 2,097,580 | |
| | | | Virginia – 0.3% (0.3% of Total Investments) | | | | | | | |
| | 535 | | Chesapeake, Virginia, Transportation System Senior Toll Road Revenue Bonds, Series 2012A, 5.000%, 7/15/21 | No Opt. Call | | BBB | | | 585,579 | |
| | | | Wisconsin – 0.4% (0.3% of Total Investments) | | | | | | | |
| | | | University of Wisconsin Hospitals and Clinics Authority, Revenue Bonds, Tender Option Bond Trust 4287: | | | | | | | |
| | 50 | | 21.494%, 4/01/20 (IF) (4) | No Opt. Call | | Aa3 | | | 79,525 | |
| | 100 | | 22.363%, 10/01/20 (IF) (4) | No Opt. Call | | Aa3 | | | 161,310 | |
| | 185 | | 21.952%, 10/01/20 (IF) (4) | No Opt. Call | | Aa3 | | | 275,704 | |
| | 100 | | 22.363%, 10/01/20 (IF) (4) | No Opt. Call | | Aa3 | | | 142,475 | |
| | 435 | | Total Wisconsin | | | | | | 659,014 | |
| $ | 217,260 | | Total Long-Term Investments (cost $237,076,188) | | | | | | 218,099,709 | |
| | | | Variable Rate MuniFund Term Preferred Shares, at Liquidation Value – (32.7)% (7) | | | | | | (55,000,000 | ) |
| | | | Other Assets Less Liabilities – 2.9% (8) | | | | | | 4,879,077 | |
| | | | Net Assets Applicable to Common Shares – 100% | | | | | $ | 167,978,786 | |
| NIQ | Nuveen Intermediate Duration Quality Municipal Term Fund (continued) |
| | Portfolio of Investments November 30, 2013 (Unaudited) |
Investments in Derivatives as of November 30, 2013
Swaps outstanding:
| | | | | Fund | | | | | | Fixed Rate | | | | | | Unrealized | |
| | | Notional | | Pay/Receive | | Floating Rate | | Fixed Rate | | Payment | | Effective | | Termination | | Appreciation | |
| Counterparty | | Amount | | Floating Rate | | Index | | (Annualized) | | Frequency | | Date (9) | | Date | | (Depreciation) (8) | |
| Barclays Bank PLC | | | $ 4,700,000 | | Receive | | 3-Month USD-LIBOR | | | 2.310 | % | Semi-Annually | | 5/15/14 | | 5/15/23 | | | $ 218,331 | |
| Barclays Bank PLC | | | 5,000,000 | | Receive | | 3-Month USD-LIBOR | | | 2.735 | | Semi-Annually | | 5/05/15 | | 5/05/25 | | | 327,391 | |
| Barclays Bank PLC | | | 11,500,000 | | Receive | | 3-Month USD-LIBOR | | | 3.129 | | Semi-Annually | | 5/15/14 | | 5/15/33 | | | 902,329 | |
| JPMorgan | | | 7,000,000 | | Receive | | USD-BMA Index | | | 2.940 | | Quarterly | | 7/17/14 | | 7/17/35 | | | 441,842 | |
| | | | $28,200,000 | | | | | | | | | | | | | | | | $1,889,893 | |
| (1) | All percentages shown in the Portfolio of Investments are based on net assets applicable to common shares unless otherwise noted. |
| (2) | Optional Call Provisions: Dates (month and year) and prices of the earliest optional call or redemption. There may be other call provisions at varying prices at later dates. Certain mortgage-backed securities may be subject to periodic principal paydowns. |
| (3) | Ratings: Using the highest of Standard & Poor’s Group (“Standard & Poor’s”), Moody’s Investors Service, Inc. (“Moody’s”) or Fitch, Inc. (“Fitch”) rating. Ratings below BBB by Standard & Poor’s, Baa by Moody’s or BBB by Fitch are considered to be below investment grade. Holdings designated N/R are not rated by any of these national rating agencies. |
| (4) | Investment, or portion of investment, has been pledged to collateralize the net payment obligations for investments in derivatives and/or inverse floating rate transactions. |
| (5) | At or subsequent to the end of the reporting period, this security is non-income producing. Non-income producing, in the case of a fixed-income security, generally denotes that the issuer has (1) defaulted on the payment of principal or interest, (2) is under the protection of the Federal Bankruptcy Court or (3) the Fund’s Adviser has concluded that the issue is not likely to meet its future interest payment obligations and has directed the Fund’s custodian to cease accruing additional income on the Fund’s records. |
| (6) | Backed by an escrow or trust containing sufficient U.S. Government or U.S. Government agency securities, which ensure the timely payment of principal and interest. Certain bonds backed by U.S. Government or agency securities are regarded as having an implied rating equal to the rating of such securities. |
| (7) | Variable Rate MuniFund Term Preferred Shares, at Liquidation Value as a percentage of Total Investments is 25.2%. |
| (8) | Other Assets Less Liabilities includes the Unrealized Appreciation (Depreciation) of derivative instruments as listed within Investments in Derivatives as of the end of the reporting period. |
| (9) | Effective date represents the date on which both the Fund and Counterparty commence interest payment accruals on each swap contract. |
| (IF) | Inverse floating rate investment. |
| 144A | Investment is exempt from registration under Rule 144A of the Securities Act of 1933, as amended. These investments may only be resold in transactions exempt from registration, which are normally those transactions with qualified institutional buyers. |
| USD-LIBOR | United States Dollar-London Inter-Bank Offered Rate. |
| USD-BMA | United States Dollar-Bond Market Association. |
See accompanying notes to financial statements.
| Statement of | |
| | Assets & Liabilities |
| | November 30, 2013 (Unaudited) |
| | | | | | Intermediate | |
| | | | Intermediate | | | Duration | |
| | | | Duration | | | Quality | |
| | | | (NID | ) | | (NIQ | ) |
| Assets | | | | | | | |
| Investments, at value (cost $827,757,909 and $237,076,188, respectively) | | $ | 760,630,444 | | $ | 218,099,709 | |
| Receivable for: | | | | | | | |
| Interest | | | 15,425,874 | | | 4,005,361 | |
| Investments sold | | | 725,648 | | | 165,000 | |
| Deferred offering costs | | | 135,510 | | | 75,822 | |
| Unrealized appreciation on swaps | | | 3,221,517 | | | 1,889,893 | |
| Other assets | | | 6,213 | | | — | |
| Total assets | | | 780,145,206 | | | 224,235,785 | |
| Liabilities | | | | | | | |
| Cash overdraft | | | 3,763,393 | | | 515,426 | |
| Payable for: | | | | | | | |
| Common share dividends | | | 2,424,326 | | | 592,597 | |
| Investments purchased | | | 1,427,544 | | | — | |
| Offering costs | | | 5,000 | | | 18,314 | |
| Variable Rate MuniFund Term Preferred (VMTP) Shares, at liquidation value | | | 175,000,000 | | | 55,000,000 | |
| Accrued expenses: | | | | | | | |
| Management fees | | | 420,931 | | | 102,706 | |
| Trustees fees | | | 9,310 | | | 892 | |
| Other | | | 93,198 | | | 27,064 | |
| Total liabilities | | | 183,143,702 | | | 56,256,999 | |
| Net assets applicable to common shares | | $ | 597,001,504 | | $ | 167,978,786 | |
| Common shares outstanding | | | 46,909,660 | | | 13,097,144 | |
| Net asset value per common share outstanding (net assets applicable to common shares, divided by common shares outstanding) | | $ | 12.73 | | $ | 12.83 | |
| Net assets applicable to common shares consist of: | | | | | | | |
| Common shares, $.01 par value per share | | $ | 469,097 | | $ | 130,971 | |
| Paid-in surplus | | | 670,189,992 | | | 187,085,186 | |
| Undistributed (Over-distribution of) net investment income | | | 2,453,283 | | | 766,229 | |
| Accumulated net realized gain (loss) | | | (12,204,920 | ) | | (2,917,014 | ) |
| Net unrealized appreciation (depreciation) | | | (63,905,948 | ) | | (17,086,586 | ) |
| Net assets applicable to common shares | | $ | 597,001,504 | | $ | 167,978,786 | |
| Authorized shares: | | | | | | | |
| Common | | | Unlimited | | | Unlimited | |
| Preferred | | | Unlimited | | | Unlimited | |
See accompanying notes to financial statements.
| Statement of | |
| | Operations |
| | Six Months Ended November 30, 2013 (Unaudited) |
| | | | | | | Intermediate | |
| | | | Intermediate | | | Duration | |
| | | | Duration | | | Quality | |
| | | | (NID | ) | | (NIQ | ) |
| Investment Income | | $ | 19,930,353 | | $ | 5,003,651 | |
| Expenses | | | | | | | |
| Management fees | | | 2,574,851 | | | 630,822 | |
| Shareholder servicing agent fees and expenses | | | 8,186 | | | 8,168 | |
| Interest expense and amortization of offering costs | | | 1,087,080 | | | 310,133 | |
| Custodian fees and expenses | | | 69,185 | | | 22,879 | |
| Trustees fees and expenses | | | 8,387 | | | 1,008 | |
| Professional fees | | | 65,411 | | | 18,812 | |
| Shareholder reporting expenses | | | 36,148 | | | 14,103 | |
| Investor relations expenses | | | 39,032 | | | 12,715 | |
| Other expenses | | | 11,290 | | | 7,104 | |
| Total expenses | | | 3,899,570 | | | 1,025,744 | |
| Net investment income (loss) | | | 16,030,783 | | | 3,977,907 | |
| Realized and Unrealized Gain (Loss) | | | | | | | |
| Net realized gain (loss) from investments | | | (7,857,834 | ) | | (2,901,969 | ) |
| Change in net unrealized appreciation (depreciation) of: | | | | | | | |
| Investments | | | (56,368,188 | ) | | (15,635,110 | ) |
| Swaps | | | 2,202,774 | | | 1,425,277 | |
| Net realized and unrealized gain (loss) | | | (62,023,248 | ) | | (17,111,802 | ) |
| Net increase (decrease) in net assets applicable to common shares from operations | | $ | (45,992,465 | ) | $ | (13,133,895 | ) |
See accompanying notes to financial statements.
| Statement of | |
| | Changes in Net Assets (Unaudited) |
| | | Intermediate Duration (NID) | | | Intermediate Duration Quality (NIQ) | |
| | | | Six Months | | | | | | Six Months | | | | |
| | | | Ended | | Period Ended | | | Ended | | | Period Ended | |
| | | | 11/30/13 | | | 5/31/13 | * | | 11/30/13 | | | 5/31/13 | ** |
| Operations | | | | | | | | | | | | | |
| Net investment income (loss) | | $ | 16,030,783 | | $ | 12,209,943 | | $ | 3,977,907 | | $ | 1,809,650 | |
| Net realized gain (loss) from investments | | | (7,857,834 | ) | | (4,347,097 | ) | | (2,901,969 | ) | | (15,067 | ) |
| Change in net unrealized appreciation (depreciation) of: | | | | | | | | | | | | | |
| Investments | | | (56,368,188 | ) | | (10,759,277 | ) | | (15,635,110 | ) | | (3,341,369 | ) |
| Swaps | | | 2,202,774 | | | 1,018,743 | | | 1,425,277 | | | 464,616 | |
| Net increase (decrease) in net assets applicable to common shares from operations | | | (45,992,465 | ) | | (1,877,688 | ) | | (13,133,895 | ) | | (1,082,170 | ) |
| Distributions to Common Shareholders | | | | | | | | | | | | | |
| From net investment income | | | (15,480,188 | ) | | (10,319,979 | ) | | (3,771,978 | ) | | (1,257,239 | ) |
| Decrease in net assets applicable to common shares from distributions to common shareholders | | | (15,480,188 | ) | | (10,319,979 | ) | | (3,771,978 | ) | | (1,257,239 | ) |
| Capital Share Transactions | | | | | | | | | | | | | |
| Proceeds from sale of common shares, net of offering costs | | | — | | | 670,533,500 | | | — | | | 187,097,749 | |
| Net proceeds from common shares issued to shareholders due to reinvestment of distributions | | | — | | | 38,049 | | | — | | | 26,044 | |
| Net increase (decrease) in net assets applicable to common shares from capital share transactions | | | — | | | 670,571,549 | | | — | | | 187,123,793 | |
| Net increase (decrease) in net assets applicable to common shares | | | (61,472,653 | ) | | 658,373,882 | | | (16,905,873 | ) | | 184,784,384 | |
| Net assets applicable to common shares at the beginning of period | | | 658,474,157 | | | 100,275 | | | 184,884,659 | | | 100,275 | |
| Net assets applicable to common shares at the end of period | | $ | 597,001,504 | | $ | 658,474,157 | | $ | 167,978,786 | | $ | 184,884,659 | |
| Undistributed (Over-distribution of) net investment income at the end of period | | $ | 2,453,283 | | $ | 1,902,688 | | $ | 766,229 | | $ | 560,300 | |
| * | For the period December 5, 2012 (commencement of operations) through May 31, 2013. |
| ** | For the period February 7, 2013 (commencement of operations) through May 31, 2013. |
See accompanying notes to financial statements.
| Statement of | |
| | Cash Flows |
| | Six Months Ended November 30, 2013 (Unaudited) |
| | | | | | Intermediate | |
| | | | Intermediate | | | Duration | |
| | | | Duration | | | Quality | |
| | | | (NID | ) | | (NIQ | ) |
| Cash Flows from Operating Activities: | | | | | | | |
| Net Increase (Decrease) in Net Assets Applicable to Common Shares from Operations | | $ | (45,992,465 | ) | $ | (13,133,895 | ) |
| Adjustments to reconcile the net increase (decrease) in net assets applicable to common shares from operations to net cash provided by (used in) operating activities: | | | | | | | |
| Purchases of investments | | | (95,773,443 | ) | | (20,764,034 | ) |
| Proceeds from sales and maturities of investments | | | 89,671,915 | | | 18,174,755 | |
| Amortization (Accretion) of premiums and discounts, net | | | 3,824,989 | | | 1,439,485 | |
| (Increase) Decrease in: | | | | | | | |
| Receivable for interest | | | (855,657 | ) | | (169,688 | ) |
| Receivable for investments sold | | | 3,129,352 | | | 330,000 | |
| Other assets | | | (3,434 | ) | | — | |
| Increase (Decrease) in: | | | | | | | |
| Payable for investment purchased | | | 1,427,544 | | | — | |
| Accrued management fees | | | (40,145 | ) | | (13,174 | ) |
| Accrued Trustees fees | | | 1,477 | | | (1,959 | ) |
| Accrued other expenses | | | (35,394 | ) | | (19,511 | ) |
| Net realized (gain) loss from investments | | | 7,857,834 | | | 2,901,969 | |
| Change in net unrealized (appreciation) depreciation of: | | | | | | | |
| Investments | | | 56,368,188 | | | 15,635,110 | |
| Swaps | | | (2,202,774 | ) | | (1,425,277 | ) |
| Net cash provided by (used in) operating activities | | | 17,377,987 | | | 2,953,781 | |
| Cash Flows from Financing Activities: | | | | | | | |
| (Increase) Decrease in deferred offering costs | | | (23,245 | ) | | 16,267 | |
| Increase (Decrease) in: | | | | | | | |
| Cash overdraft | | | (1,802,759 | ) | | 515,426 | |
| Payable for offering costs | | | (31,000 | ) | | (62,686 | ) |
| Cash distributions paid to common shareholders | | | (15,520,983 | ) | | (3,778,840 | ) |
| Net cash provided by (used in) financing activities | | | (17,377,987 | ) | | (3,309,833 | ) |
| Net Increase (Decrease) in Cash | | | — | | | (356,052 | ) |
| Cash at the beginning of period | | | — | | | 356,052 | |
| Cash at the End of Period | | $ | — | | $ | — | |
| | | | | | | | |
| Supplemental Disclosure of Cash Flow Information | | | | | | | |
| | | | | | | | |
| | | | | | | Intermediate | |
| | | | Intermediate | | | Duration | |
| | | | Duration | | | Quality | |
| | | | (NID | ) | | (NIQ | ) |
| Cash paid for interest (excluding amortization of offering costs) | | $ | 1,066,637 | | $ | 293,866 | |
See accompanying notes to financial statements.
THIS PAGE INTENTIONALLY LEFT BLANK
| Financial | |
| | Highlights (Unaudited) |
| | |
| Selected data for a common share outstanding throughout each period: |
| | | | | | Investment Operations | | Less Distributions | | | | | | | | | | |
| | | Beginning Common Share Net Asset Value | | Net Investment Income (Loss | ) | Net Realized/ Unrealized Gain (Loss | ) | Total | | From Net Investment Income to Common Shareholders | | From Accumulated Net Realized Gains to Common Shareholders | | Total | | Offering Costs | | Ending Common Share Net Asset Value | | Ending Market Value | |
| Intermediate Duration (NID) |
| Year Ended 5/31: |
| 2014(g) | | $ | 14.04 | | $ | .34 | | $ | (1.32 | ) | $ | (.98 | ) | $ | (.33 | ) | $ | — | | $ | (.33 | ) | $ | — | | $ | 12.73 | | $ | 11.17 | |
| 2013(d) | | | 14.33 | | | .26 | | | (.30 | ) | | (.04 | ) | | (.22 | ) | | — | | | (.22 | ) | | (.03 | ) | | 14.04 | | | 13.00 | |
| |
| Intermediate Duration Quality (NIQ) |
| Year Ended 5/31: |
| 2014(g) | | | 14.12 | | | .30 | | | (1.30 | ) | | (1.00 | ) | | (.29 | ) | | — | | | (.29 | ) | | — | | | 12.83 | | | 11.32 | |
| 2013(e) | | | 14.33 | | | .14 | | | (.22 | ) | | (.08 | ) | | (.10 | ) | | — | | | (.10 | ) | | (.03 | ) | | 14.12 | | | 13.09 | |
| | | VMTP Shares at the End of Period | |
| | | | Aggregate | | | Asset | |
| | | | Amount | | | Coverage | |
| | | | Outstanding | | | Per $100,000 | |
| | | | (000 | ) | | Share | |
| Intermediate Duration (NID) | | | | | | | |
| Year Ended 5/31: | | | | | | | |
| 2014(g) | | $ | 175,000 | | $ | 441,144 | |
| 2013(d) | | | 175,000 | | | 476,271 | |
| | | | | | | | |
| Intermediate Duration Quality (NIQ) | | | | | | | |
| Year Ended 5/31: | | | | | | | |
| 2014(g) | | | 55,000 | | | 405,416 | |
| 2013(e) | | | 55,000 | | | 436,154 | |
| | | | | | | | | Ratios/Supplemental Data | |
| | | Total Returns | | | | Ratios to Average Net Assets Applicable to Common Shares(b) | | | |
| | | | | | | | | | | | | | |
| | | Based on Common Share Net Asset Value | (a) | Based on Market Value | (a) | Ending Net Assets Applicable to Common Shares (000 | ) | Expenses | (c) | Net Investment Income (Loss | ) | Portfolio Turnover Rate | (f) |
| | | | | | | | | | | | | | | | | | | | |
| | | | | | | | | | | | | | | | | | | | |
| | | | (6.96 | )% | | (11.62 | )% | $ | 597,002 | | | 1.29 | %* | | 5.31 | %* | | 12 | % |
| | | | (.46 | ) | | (11.94 | ) | | 658,474 | | | 1.05 | * | | 3.97 | * | | 20 | |
| | | | | | | | | | | | | | | | | | | | |
| | | | | | | | | | | | | | | | | | | | |
| | | | (7.07 | ) | | (11.36 | ) | | 167,979 | | | 1.21 | * | | 4.70 | * | | 8 | |
| | | | (.77 | ) | | (12.12 | ) | | 184,885 | | | 1.10 | * | | 3.30 | * | | 1 | |
| (a) | Total Return Based on Market Value is the combination of changes in the market price per share and the effect of reinvested dividend income and reinvested capital gains distributions, if any, at the average price paid per share at the time of reinvestment. The last dividend declared in the period, which is typically paid on the first business day of the following month, is assumed to be reinvested at the ending market price. The actual reinvestment for the last dividend declared in the period may take place over several days, and in some instances may not be based on the market price, so the actual reinvestment price may be different from the price used in the calculation. Total returns are not annualized. |
| | |
| | Total Return Based on Common Share Net Asset Value is the combination of changes in common share net asset value, reinvested dividend income at net asset value and reinvested capital gains distributions at net asset value, if any. The last dividend declared in the period, which is typically paid on the first business day of the following month, is assumed to be reinvested at the ending net asset value. The actual reinvest price for the last dividend declared in the period may often be based on the Fund’s market price (and not its net asset value), and therefore may be different from the price used in the calculation. Total returns are not annualized. |
| (b) | Net Investment Income (Loss) ratios reflect income earned and expenses incurred on assets attributable to VMTP Shares. |
| (c) | The expense ratios reflect, among other things, all interest expense and other costs related to VMTP Shares and/or the interest expense deemed to have been paid by the Fund on the floating rate certificates issued by the special purpose trusts for the self-deposited inverse floaters held by the Fund, where applicable, each as described in Note 1 – General Information and Significant Accounting Policies, Variable Rate MuniFund Term Preferred Shares and Note 3 – Portfolio Securities and Investments in Derivatives, Inverse Floating Rate Securities, respectively, as follows: |
| Intermediate Duration (NID) | | | | |
| Year Ended 5/31: | | | | |
| 2014(g) | | | .36 | %* |
| 2013(d) | | | .23 | * |
| | | | | |
| Intermediate Duration Quality (NIQ) | | | | |
| Year Ended 5/31: | | | | |
| 2014(g) | | | .37 | %* |
| 2013(e) | | | .30 | * |
| (d) | For the period December 5, 2013 (commencement of operations) through May 31, 2013. |
| (e) | For the period February 7, 2013 (commencement of operations) through May 31, 2013. |
| (f) | Portfolio Turnover Rate is calculated based on lesser of long-term purchases or sales (as disclosed in Note 5 – Investment Transactions) divided by the average long-term market value during the period. |
| (g) | For the six months ended November 30, 2013. |
| * | Annualized. |
See accompanying notes to financial statements.
| Notes to | |
| | Financial Statements (Unaudited) |
1. General Information and Significant Accounting Policies
General Information
Fund Information
The funds covered in this report and their corresponding New York Stock Exchange (“NYSE”) symbols are as follows (each a “Fund” and collectively, the “Funds”):
| | • | Nuveen Intermediate Duration Municipal Term Fund (NID) (“Intermediate Duration (NID)”) |
| | • | Nuveen Intermediate Duration Quality Municipal Term Fund (NIQ) (“Intermediate Duration Quality (NIQ)”) |
The Funds are registered under the Investment Company Act of 1940, as amended, as diversified closed-end registered investment companies. Intermediate Duration (NID) and Intermediate Duration Quality (NIQ) were organized as Massachusetts business trusts on September 11, 2012 and December 11, 2012, respectively. Intermediate Duration and Intermediate Duration Quality each have a term of ten years and intend to liquidate and distribute their net assets to shareholders on or before March 31, 2023 and June 30, 2023, respectively.
Intermediate Duration seeks to provide a high level of current income exempt from regular federal income tax with a secondary objective of seeking additional total return. Intermediate Duration will seek to achieve its investment objectives by investing in municipal securities that Nuveen Asset Management, LLC (the “Sub-Adviser”), a subsidiary of Nuveen Fund Advisors, LLC, (the “Adviser”) a wholly-owned subsidiary of Nuveen Investments, Inc. (“Nuveen”) believes are underrated or undervalued, based upon its bottom-up, research-driven investment strategy. The Fund also will seek to reduce the risk of rising interest rates by maintaining a portfolio with an intermediate duration (including the effects of leverage). The Fund’s portfolio will be actively managed, with the goal of capitalizing on historically favorable municipal credit spreads (the difference between yields on municipal securities across all debt rating categories) currently available in the market. Under normal circumstances, the Fund will invest at least 80% of its managed assets (as defined in Note 7 – Management Fees and Other Transactions with Affiliates) in municipal securities and other related investments, the income from which is exempt from regular federal income tax. The Fund will invest at least 50% of its managed assets in investment grade municipal securities; it also may invest in below investment grade securities, which are regarded as having predominately speculative characteristics with respect to an issuer’s capacity to pay interest and repay principal, and are commonly referred to as junk bonds or high yield debt.
Intermediate Duration Quality seeks to provide current income exempt from regular federal income tax with a secondary objective of seeking additional total return. The Fund seeks to achieve its investment objectives by investing in a diversified portfolio of primarily investment grade quality municipal securities (at least 80%), the income from which is exempt from regular federal income tax. The Fund also will seek to reduce the risk of rising interest rates by maintaining a portfolio with an intermediate duration of between three and ten years (including the effects of leverage). The Fund will emphasize the purchase of municipal securities that the Sub-Adviser believes are underrated or undervalued. The Fund’s portfolio will be actively managed, seeking to capitalize on favorable relative value opportunities, with the goal of outperforming broad municipal market benchmarks over the life of the Fund.
Investment Adviser
The Adviser is responsible for each Fund’s overall investment strategy and asset allocation decisions. The Adviser has entered into sub-advisory agreements with the Sub-Adviser, under which the Sub-Adviser manages the investment portfolios of the Funds.
Significant Accounting Policies
The following is a summary of significant accounting policies followed by the Funds in the preparation of their financial statements in accordance with U.S. generally accepted accounting principles (“U.S. GAAP”).
Investment Transactions
Investment transactions are recorded on a trade date basis. Realized gains and losses from investment transactions are determined on the specific identification method, which is the same basis used for federal income tax purposes. Investments purchased on a when-issued/delayed delivery basis may have extended settlement periods. Any investments so purchased are subject to market fluctuation during this period. The Funds have instructed
the custodian to earmark securities in the Funds’ portfolios with a current value at least equal to the amount of the when-issued/delayed delivery purchase commitments. As of November 30, 2013, the Funds’ outstanding when issued/delayed delivery purchase commitments were as follows:
| | | | | |
| | | | Intermediate | |
| | | | Duration | |
| | | | (NID | ) |
| Outstanding when-issued/delayed delivery purchase commitments | | $ | 1,427,544 | |
Investment Income
Investment income, which reflects the amortization of premiums and includes accretion of discounts for financial reporting purposes, is recorded on an accrual basis. Investment income also reflects paydown gains and losses, if any.
Professional Fees
Professional fees presented on the Statement of Operations consist of legal fees incurred in the normal course of operations, audit fees, tax consulting fees and, in some cases, workout expenditures. Workout expenditures are incurred in an attempt to protect or enhance an investment, or to pursue other claims or legal actions on behalf of Fund shareholders. Should a Fund receive a refund of workout expenditures paid in a prior reporting period, such amounts will be recognized as “Legal fee refund” on the Statement of Operations.
Dividends and Distributions to Common Shareholders
Dividends from net investment income are declared monthly. Net realized capital gains and/or market discount from investment transactions, if any, are distributed to shareholders at least annually. Furthermore, capital gains are distributed only to the extent they exceed available capital loss carryforwards.
Distributions to common shareholders of net investment income, net realized capital gains and/or market discount, if any, are recorded on the ex-dividend date. The amount and timing of distributions are determined in accordance with federal income tax regulations, which may differ from U.S. GAAP.
Variable Rate MuniFund Term Preferred Shares
Each Fund has issued and outstanding Variable Rate MuniFund Term Preferred (“VMTP”) Shares, with a $100,000 liquidation value per share. Each Fund issued their VMTP Shares in privately negotiated offerings, which were offered to qualified institutional buyers pursuant to Rule 144A under the Securities Act of 1933.
As of November 30, 2013, the number of VMTP Shares outstanding, at liquidation value, for each Fund were as follows:
| | | | | | | | | | | |
| | | | | | | | | Shares | |
| | | | | | | | | Outstanding at | |
| | | | | | | | | $100,000 Per | |
| | | | | | | | | Shares | |
| | | | | | | Share | | Liquidation | |
| | | | Series | | Outstanding | | | Value | |
| Intermediate Duration (NID) | | | 2016 | | | 1,750 | | $ | 175,000,000 | |
| Intermediate Duration Quality (NIQ) | | | 2016 | | | 550 | | $ | 55,000,000 | |
The Fund is obligated to redeem its VMTP Shares by the date as specified in its offering document (“Term Redemption Date”), unless earlier redeemed or repurchased by the Fund. VMTP Shares are subject to optional and mandatory redemption in certain circumstances. The VMTP Shares are subject to redemption at the option of the Fund (“Optional Redemption Date”), subject to payment of premium for approximately one year following the date of issuance (“Premium Expiration Date”), and at par thereafter. The Fund may be obligated to redeem certain of the VMTP Shares if the Fund fails to maintain certain asset coverage and leverage ratio requirements and such failures are not cured by the applicable cure date. The redemption price per share is equal to the sum of the liquidation value per share plus any accumulated but unpaid dividends. The Term Redemption Date, Optional Redemption Date and Premium Expiration Date for the Fund’s VMTP Shares are as follows:
| | | | | | | | | |
| | | | Term | | Optional | | Premium | |
| | Series | | Redemption Date | | Redemption Date | | Expiration Date | |
| Intermediate Duration (NID) | 2016 | | March 1, 2016 | | August 7, 2014 | | August 6, 2014 | |
| Intermediate Duration Quality (NIQ) | 2016 | | April 1, 2016 | | September 4, 2014 | | September 3, 2014 | |
Notes to Financial Statements (Unaudited) (continued)
The average liquidation value of VMTP Shares outstanding and annualized dividend rate for each Fund during the six months ended November 30, 2013, were as follows:
| | | | | | | Intermediate | |
| | | | Intermediate | | | Duration | |
| | | | Duration | | | Quality | |
| | | | (NID | ) | | (NIQ | ) |
| Average liquidation value of VMTP Shares outstanding | | $ | 175,000,000 | | $ | 55,000,000 | |
| Annualized dividend rate | | | 1.22 | % | | 1.08 | % |
VMTP shares generally do not trade, and market quotations are generally not available. VMTP shares are short-term or short/intermediate-term instruments that pay a variable dividend rate tied to a short-term index, plus an additional fixed “spread” amount established at the time of issuance. The fair value of VMTP shares is expected to be approximately their liquidation (“par”) value so long as the fixed “spread” on the VMTP shares remains roughly in line with the “spread” rates being demanded by investors on instruments having similar terms in the current market environment. In present market conditions, the Funds’ Adviser has determined that fair value of VMTP shares is their liquidation value, but their fair value could vary if market conditions change materially. For financial reporting purposes only, the liquidation value of VMTP Shares is recorded as a liability and recognized as “Variable Rate MuniFund Term Preferred (VMTP) Shares, at liquidation value” on the Statement of Assets and Liabilities. Dividends on VMTP shares (which are treated as interest payments for financial reporting purposes) are set weekly. Unpaid dividends on VMTP Shares are recognized as a component of “Interest payable” on the Statement of Assets and Liabilities. Dividends accrued on VMTP Shares are recognized as a component of “Interest expense and amortization of offering costs” on the Statement of Operations.
Offering costs incurred in connection with each Fund’s offering of VMTP Shares were recorded as a deferred charge, which are amortized over the life of the shares and are recognized as components of “Deferred offering costs” on the Statement of Assets and Liabilities and “Interest expense and amortization of offering costs” on the Statement of Operations.
Indemnifications
Under the Funds’ organizational documents, their officers and trustees are indemnified against certain liabilities arising out of the performance of their duties to the Funds. In addition, in the normal course of business, the Funds enter into contracts that provide general indemnifications to other parties. The Funds’ maximum exposure under these arrangements is unknown as this would involve future claims that may be made against the Funds that have not yet occurred. However, the Funds have not had prior claims or losses pursuant to these contracts and expect the risk of loss to be remote.
Netting Agreements
In the ordinary course of business, the Funds may enter into transactions subject to enforceable International Swaps and Derivative Association, Inc. (“ISDA”) master agreements or other similar arrangements (“netting agreements”). Generally, the right to offset in netting agreements allows each Fund to offset any exposure to a specific counterparty with any collateral received or delivered to that counterparty based on the terms of the agreements. Generally, a Fund manages its cash collateral and securities collateral on a counterparty basis. As of November 30, 2013, the Funds were not invested in any portfolio securities or derivative instruments, other than the swap contracts further described in Note 3 – Portfolio Securities and Investments in Derivatives, Swap Contracts that are subject to netting agreements.
Use of Estimates
The preparation of financial statements in conformity with U.S. GAAP requires management to make estimates and assumptions that affect the reported amounts of assets and liabilities at the date of the financial statements and the reported amounts of increases and decreases in net assets applicable to common shares from operations during the reporting period. Actual results may differ from those estimates.
2. Investment Valuation and Fair Value Measurements
Investment Valuation
Prices of municipal bonds and swap contracts are provided by a pricing service approved by the Funds’ Board of Trustees. These securities are generally classified as Level 2 for fair value measurement purposes. The pricing service establishes a security’s fair value using methods that may include consideration of the following: yields or prices of investments of comparable quality, type of issue, coupon, maturity and rating, market quotes or indications of value from security dealers, evaluations of anticipated cash flows or collateral, general market conditions and other information and analysis, including the obligor’s credit characteristics considered relevant. In pricing certain securities, particularly less liquid and lower quality securities, the pricing service may consider information about a security, its issuer or market activity provided by the Adviser. These securities are generally classified as Level 2 or Level 3 depending on the priority of the significant inputs.
Certain securities may not be able to be priced by the pre-established pricing methods as described above. Such securities may be valued by the Funds’ Board of Trustees or its designee at fair value. These securities generally include, but are not limited to, restricted securities (securities which may not be publicly sold without registration under the Securities Act of 1933, as amended) for which a pricing service is unable to provide a market price; securities whose trading has been formally suspended; debt securities that have gone into default and for which there is no current market quotation; a security whose market price is not available from a pre-established pricing source; a security with respect to which an event has occurred that is likely to materially affect the value of the security after the market has closed but before the calculation of a Fund’s net asset value (as may be
the case in non-U.S. markets on which the security is primarily traded) or make it difficult or impossible to obtain a reliable market quotation; and a security whose price, as provided by the pricing service, is not deemed to reflect the security’s fair value. As a general principle, the fair value of a security would appear to be the amount that the owner might reasonably expect to receive for it in a current sale. A variety of factors may be considered in determining the fair value of such securities, which may include consideration of the following: yields or prices of investments of comparable quality, type of issue, coupon, maturity and rating, market quotes or indications of value from securities dealers, evaluations of anticipated cash flows or collateral, general market conditions and other information and analysis, including the obligor’s credit characteristics considered relevant. These securities are generally classified as Level 2 or Level 3 depending on the priority of the significant inputs. Regardless of the method employed to value a particular security, all valuations are subject to review by the Funds’ Board of Trustees or its designee.
Fair Value Measurements
Fair value is defined as the price that the Funds would receive upon selling an investment or transferring a liability in an orderly transaction to an independent buyer in the principal or most advantageous market for the investment. A three-tier hierarchy is used to maximize the use of observable market data and minimize the use of unobservable inputs and to establish classification of fair value measurements for disclosure purposes. Observable inputs reflect the assumptions market participants would use in pricing the asset or liability. Observable inputs are based on market data obtained from sources independent of the reporting entity. Unobservable inputs reflect the reporting entity’s own assumptions about the assumptions market participants would use in pricing the asset or liability. Unobservable inputs are based on the best information available in the circumstances. The following is a summary of the three-tiered hierarchy of valuation input levels.
| | |
| Level 1 – | Inputs are unadjusted and prices are determined using quoted prices in active markets for identical securities. |
| Level 2 – | Prices are determined using other significant observable inputs (including quoted prices for similar securities, interest rates, prepayment speeds, credit risk, etc.). |
| Level 3 – | Prices are determined using significant unobservable inputs (including management’s assumptions in determining the fair value of investments). |
The inputs or methodologies used for valuing securities are not an indication of the risks associated with investing in those securities. The following is a summary of each Fund’s fair value measurements as of the end of the reporting period:
| Intermediate Duration (NID) | | | Level 1 | | | Level 2 | | | Level 3 | | | Total | |
| Long-Term Investments*: | | | | | | | | | | | | | |
| Municipal Bonds | | $ | — | | $ | 760,630,444 | | $ | — | | $ | 760,630,444 | |
| Derivatives: | | | | | | | | | | | | | |
| Swaps** | | | — | | | 3,221,517 | | | — | | | 3,221,517 | |
| Total | | $ | — | | $ | 763,851,961 | | $ | — | | $ | 763,851,961 | |
| | | | | | | | | | | | | | |
| Intermediate Duration Quality (NIQ) | | | Level 1 | | | Level 2 | | | Level 3 | | | Total | |
| Long-Term Investments*: | | | | | | | | | | | | | |
| Municipal Bonds | | $ | — | | $ | 218,099,709 | | $ | — | | $ | 218,099,709 | |
| Derivatives: | | | | | | | | | | | | | |
| Swaps** | | | — | | | 1,889,893 | | | — | | | 1,889,893 | |
| Total | | $ | — | | $ | 219,989,602 | | $ | — | | $ | 219,989,602 | |
| * | Refer to the Fund’s Portfolio of Investments for state classifications. |
| ** | Represents net unrealized appreciation (depreciation) as reported in the Fund’s Portfolio of Investments. |
The Nuveen funds’ Board of Directors/Trustees is responsible for the valuation process and has delegated the oversight of the daily valuation process to the Adviser’s Valuation Committee. The Valuation Committee, pursuant to the valuation policies and procedures adopted by the Board of Directors/Trustees, is responsible for making fair value determinations, evaluating the effectiveness of the funds’ pricing policies and reporting to the Board of Directors/Trustees. The Valuation Committee is aided in its efforts by the Adviser’s dedicated Securities Valuation Team, which is responsible for administering the daily valuation process and applying fair value methodologies as approved by the Valuation Committee. When determining the reliability of independent pricing services for investments owned by the funds, the Valuation Committee, among other things, conducts due diligence reviews of the pricing services and monitors the quality of security prices received through various testing reports conducted by the Securities Valuation Team.
The Valuation Committee will consider pricing methodologies it deems relevant and appropriate when making a fair value determination, based on the facts and circumstances specific to the portfolio instrument. Fair value determinations generally will be derived as follows, using public or private market information:
| (i.) | If available, fair value determinations shall be derived by extrapolating from recent transactions or quoted prices for identical or comparable securities. |
| | |
| (ii.) | If such information is not available, an analytical valuation methodology may be used based on other available information including, but not limited to: analyst appraisals, research reports, corporate action information, issuer financial statements and shelf registration statements. Such analytical valuation methodologies may include, but are not limited to: multiple of earnings, discount from market value of a similar freely-traded security, discounted cash flow analysis, book value or a multiple thereof, risk premium/yield analysis, yield to maturity and/or fundamental investment analysis. |
Notes to Financial Statements (Unaudited) (continued)
The purchase price of a portfolio instrument will be used to fair value the instrument only if no other valuation methodology is available or deemed appropriate, and it is determined that the purchase price fairly reflects the instrument’s current value.
For each portfolio security that has been fair valued pursuant to the policies adopted by the Board of Directors/Trustees, the fair value price is compared against the last available and next available market quotations. The Valuation Committee reviews the results of such testing and fair valuation occurrences are reported to the Board of Directors/Trustees.
3. Portfolio Securities and Investments in Derivatives
Portfolio Securities
Inverse Floating Rate Securities
Each Fund is authorized to invest in inverse floating rate securities. An inverse floating rate security is created by depositing a municipal bond, typically with a fixed interest rate, into a special purpose trust created by a broker-dealer. In turn, this trust (a) issues floating rate certificates, in face amounts equal to some fraction of the deposited bond’s par amount or market value, that typically pay short-term tax-exempt interest rates to third parties, and (b) issues to a long-term investor (such as one of the Funds) an inverse floating rate certificate (sometimes referred to as an “inverse floater”) that represents all remaining or residual interest in the trust. The income received by the inverse floater holder varies inversely with the short-term rate paid to the floating rate certificates’ holders, and in most circumstances the inverse floater holder bears substantially all of the underlying bond’s downside investment risk and also benefits disproportionately from any potential appreciation of the underlying bond’s value. The price of an inverse floating rate security will be more volatile than that of the underlying bond because the interest rate is dependent on not only the fixed coupon rate of the underlying bond but also on the short-term interest paid on the floating rate certificates, and because the inverse floating rate security essentially bears the risk of loss of the greater face value of the underlying bond.
The inverse floater held by a Fund gives the Fund the right (a) to cause the holders of the floating rate certificates to tender their notes at par, and (b) to have the broker transfer the fixed-rate bond held by the trust to the Fund, thereby collapsing the trust.
A Fund may purchase an inverse floating rate security in a secondary market transaction without first owning the underlying bond (referred to as an “externally-deposited inverse floater”), or instead by first selling a fixed-rate bond to a broker-dealer for deposit into the special purpose trust and receiving in turn the residual interest in the trust (referred to as a “self-deposited inverse floater”). An investment in an externally-deposited inverse floater is identified in the Portfolio of Investments as “(IF) – Inverse floating rate investment.” The Fund’s Statement of Assets and Liabilities shows only the inverse floaters and not the underlying bonds as an asset, and does not reflect the short-term floating rate certificates as liabilities. Also, the Fund reflects in “Investment Income” only the net amount of earnings on its inverse floater investment (net of the interest paid to the holders of the short-term floating rate certificates and the expenses of the trust), and does not show the amount of that interest paid as an interest expense on the Statement of Operations.
An investment in a self-deposited inverse floater is accounted for as a financing transaction. In such instances, a fixed-rate bond deposited into a special purpose trust is identified in the Portfolio of Investments as “(UB) – Underlying bond of an inverse floating rate trust reflected as a financing transaction,” with the Fund accounting for the short-term floating rate certificates issued by the trust, at their liquidation value, as “Floating rate obligations” on the Statement of Assets and Liabilities. In addition, the Fund reflects in “Investment Income” the entire earnings of the underlying bond and recognizes the related interest paid to the holders of the short-term floating rate certificates as a component of “Interest expense and amortization of offering costs” on the Statement of Operations.
During the six months ended November 30, 2013, each Fund invested in externally-deposited inverse floaters. The Funds did not have any transactions in self-deposited inverse floaters.
As of November 30, 2013, the total amount of floating rate obligations issued by each Fund’s self-deposited inverse floaters and externally-deposited inverse floaters was as follows:
| | | | | | | Intermediate | |
| | | | Intermediate | | | Duration | |
| | | | Duration | | | Quality | |
| | | | (NID | ) | | (NIQ | ) |
| Floating rate obligations: self-deposited inverse floaters | | $ | — | | $ | — | |
| Floating rate obligations: externally-deposited inverse floaters | | | 172,060,000 | | | 48,320,000 | |
| Total | | $ | 172,060,000 | | $ | 48,320,000 | |
Each Fund may also enter into shortfall and forbearance agreements (sometimes referred to as a “recourse trust” or “credit recovery swap”) (such agreements are referred to herein as “Recourse Trusts”), with a broker-dealer by which a Fund agrees to reimburse the broker-dealer, in certain circumstances, for the difference between the liquidation value of the fixed-rate bond held by the trust and the liquidation value of the floating rate certificates issued by the trust plus any shortfalls in interest cash flows. Under these agreements, a Fund’s potential exposure to losses related to or on inverse floaters may increase beyond the value of a Fund’s inverse floater investments as a Fund may potentially be liable to fulfill all amounts owed to holders of the floating rate certificates. At period end, any such shortfall is denoted as “Unrealized depreciation on Recourse Trusts” on the Statement of Assets and Liabilities.
As of November 30, 2013, each Fund’s maximum exposure to the floating rate obligations issued by externally-deposited Recourse Trusts was as follows:
| | | | | | | Intermediate | |
| | | | Intermediate | | | Duration | |
| | | | Duration | | | Quality | |
| | | | (NID | ) | | (NIQ | ) |
| Maximum exposure to Recourse Trusts | | $ | 172,060,000 | | $ | 48,320,000 | |
Zero Coupon Securities
Each Fund is authorized to invest in zero coupon securities. A zero coupon security does not pay a regular interest coupon to its holders during the life of the security. Income to the holder of the security comes from accretion of the difference between the original purchase price of the security at issuance and the par value of the security at maturity and is effectively paid at maturity. The market prices of zero coupon securities generally are more volatile than the market prices of securities that pay interest periodically.
Investments in Derivatives
Each Fund is authorized to invest in certain derivative instruments, such as futures, options and swap contracts. Each Fund limits its investments in futures, options on futures and swap contracts to the extent necessary for the Adviser to claim the exclusion from registration by the Commodity Futures Trading Commission as a commodity pool operator with respect to the Fund. The Funds record derivative instruments at fair value, with changes in fair value recognized on the Statement of Operations, when applicable. Even though the Funds’ investments in derivatives may represent economic hedges, they are not considered to be hedge transactions for financial reporting purposes.
Swap Contracts
Forward interest rate swap transactions involve a Fund’s agreement with a counterparty to pay, in the future, a fixed or variable rate payment in exchange for the counterparty paying a Fund a variable or fixed rate payment, the accruals for which would begin at a specified date in the future (the “effective date”). The amount of the payment obligation is based on the notional amount of the swap contract and the termination date of the swap (which is akin to a bond’s maturity). The value of a Fund’s swap commitment would increase or decrease based primarily on the extent to which long-term interest rates for bonds having a maturity of the swap’s termination date increases or decreases. Forward interest rate swap contracts are valued daily. The net amount recorded on these transactions for each counterparty is recognized on the Statement of Assets and Liabilities as a component of “Unrealized appreciation or depreciation on swaps (, net)” with the change during the fiscal period recognized on the Statement of Operations as a component of “Change in net unrealized appreciation (depreciation) of swaps.”
A Fund may terminate a swap contract prior to the effective date, at which point a realized gain or loss is recognized. When a swap is terminated, it ordinarily does not involve the delivery of securities or other underlying assets or principal, but rather is settled in cash on a net basis. Net realized gains and losses during the fiscal period are recognized on the Statement of Operations as a component of “Net realized gain (loss) from swaps.” A Fund intends, but is not obligated, to terminate its forward interest rate swaps before the effective date. Accordingly, the risk of loss with respect to the swap counterparty on such transactions is limited to the credit risk associated with a counterparty failing to honor its commitment to pay any realized gain to the Fund upon termination.
During the six months ended November 30, 2013, each Fund used swap contracts to help maintain the ten-year duration mandate.
The average notional amount of swap contracts outstanding during the six months ended November 30, 2013, was as follows:
| | | | | | | Intermediate | |
| | | | Intermediate | | | Duration | |
| | | | Duration | | | Quality | |
| | | | (NID | ) | | (NIQ | ) |
| Average notional amount of swap contracts outstanding* | | $ | 61,966,667 | | $ | 25,866,667 | |
| * | The average notional amount is calculated based on the outstanding notional at the beginning of the fiscal year and at the end of each fiscal quarter within the current fiscal year. |
The following table presents the fair value of all swap contracts held by the Funds as of November 30, 2013, the location of these instruments on the Statement of Assets and Liabilities and the primary underlying risk exposure.
| | | | | | | Location on the Statement of Assets and Liabilities |
| | | | | | | Asset Derivatives | | | (Liability) Derivatives | |
| Underlying | | | Derivative | | | | | | | | | | | | | |
| Risk Exposure | | | Instrument | | | Location | | | Value | | | Location | | | Value | |
| Intermediate Duration (NID) | | | | | | | | | | | | | | | | |
| Interest rate | | | Swaps | | | Unrealized appreciation | | $ | 3,221,517 | | | — | | $ | — | |
| | | | | | | on swaps | | | | | | | | | | |
| Intermediate Duration Quality (NIQ) | | | | | | | | | | | | | | | | |
| Interest rate | | | Swaps | | | Unrealized appreciation | | $ | 1,889,893 | | | — | | $ | — | |
| | | | | | | on swaps | | | | | | | | | | |
Notes to Financial Statements (Unaudited) (continued)
The following table presents the swap contracts, which are subject to netting agreements, as well as collateral delivered to those swap contracts.
| Fund | | Counterparty | | Gross Unrealized Appreciation on Swaps | * | Gross Unrealized (Depreciation) on Swaps | * | Amounts Netted on Statement of Assets and Liabilities | | Net Unrealized Appreciation (Depreciation) on Swaps | | Collateral Pledged to (from) Counterparty | | Net Exposure | |
| Intermediate Duration (NID) | | | | | | | | | | | | | | | | | | | | | | |
| | | | JPMorgan | | $ | 3,221,517 | | $ | — | | $ | — | | $ | 3,221,517 | | $ | (3,221,517 | ) | $ | — | |
| | | | | | | | | | | | | | | | | | | | | | | |
| Intermediate Duration Quality (NIQ) | | | | | | | | | | | | | | | | | | | | | | |
| | | Barclays Bank PLC | | $ | 1,448,051 | | $ | — | | $ | — | | $ | 1,448,051 | | $ | (1,448,051 | ) | $ | — | |
| | | | JPMorgan | | | 441,842 | | | — | | | — | | | 441,842 | | | (441,842 | ) | | — | |
| | | | | | | | | | | | | | | | | | | | | | | |
| Total | | | | | $ | | | $ | | | | | | | | | | | ) | $ | — | |
| * | Represents gross unrealized appreciation (depreciation) for the counterparty as reported in the Fund’s Portfolio of Investments. |
The following table presents the amount of net realized gain (loss) and change in net unrealized appreciation (deprecation) recognized on swap contracts during the six months ended November 30, 2013, and the primary underlying risk exposure.
| | | | | | | | | | | | Change in Net | |
| | | | | | | | | | | | | Unrealized | |
| | | | Underlying | | | Derivative | | Net Realized | | Appreciation | |
| Fund | | Risk Exposure | | | Instrument | | | Gain (Loss | ) | (Depreciation | ) |
| Intermediate Duration (NID) | | | Interest rate | | | Swaps | | $ | — | | $ | 2,202,774 | |
| Intermediate Duration Quality (NIQ) | | | Interest rate | | | Swaps | | | — | | | 1,425,277 | |
Market and Counterparty Credit Risk
In the normal course of business each Fund may invest in financial instruments and enter into financial transactions where risk of potential loss exists due to changes in the market (market risk) or failure of the other party to the transaction to perform (counterparty credit risk). The potential loss could exceed the value of the financial assets recorded on the financial statements. Financial assets, which potentially expose each Fund to counterparty credit risk, consist principally of cash due from counterparties on forward, option and swap transactions, when applicable. The extent of each Fund’s exposure to counterparty credit risk in respect to these financial assets approximates their carrying value as recorded on the Statement of Assets and Liabilities.
Each Fund helps manage counterparty credit risk by entering into agreements only with counterparties the Adviser believes have the financial resources to honor their obligations and by having the Adviser monitor the financial stability of the counterparties. Additionally, counterparties may be required to pledge collateral daily (based on the daily valuation of the financial asset) on behalf of each Fund with a value approximately equal to the amount of any unrealized gain above a pre-determined threshold. Reciprocally, when each Fund has an unrealized loss, the Funds have instructed the custodian to pledge assets of the Funds as collateral with a value approximately equal to the amount of the unrealized loss above a pre-determined threshold. Collateral pledges are monitored and subsequently adjusted if and when the valuations fluctuate, either up or down, by at least the pre-determined threshold amount.
4. Fund Shares
Common Shares
Transactions in common shares were as follows:
| | | Intermediate Duration (NID) | | | Intermediate Duration Quality (NIQ) | |
| | | | Six Months | | | | | | Six Months | | | | |
| | | | Ended | | | Year Ended | | | Ended | | Year Ended | |
| | | | 11/30/13 | | | 5/31/13 | * | | 11/30/13 | | | 5/31/13 | ** |
| Common shares sold | | | — | | | 46,907,000 | | | — | | | 13,095,335 | |
| Common shares issued to shareholders due to reinvestment of distributions | | | — | | | 2,660 | | | — | | | 1,809 | |
| * | For the period December 5, 2012 (commencement of operations) through May 31, 2013. |
| ** | For the period February 7, 2013 (commencement of operations) through May 31, 2013. |
Preferred Shares
The Funds did not have any transactions in VMTP Shares during the six months ended November 30, 2013. Transactions in VMTP Shares of the period ended May 31, 2013 were as follows:
| | | Period Ended May 31, 2013 |
| | | | Series | | | Shares | | | Amount | |
| Intermediate Duration (NID) | | | | | | | | | | |
| VMTP Shares issued | | | 2016 | | | 1,750 | | $ | 175,000,000 | |
| Intermediate Duration Quality (NIQ) | | | | | | | | | | |
| VMTP Shares issued | | | 2016 | | | 550 | | $ | 55,000,000 | |
5. Investment Transactions
Purchases and sales (including maturities but excluding short-term investments and derivative transactions, where applicable) during the six months ended November 30, 2013, were as follows:
| | | | | | | Intermediate | |
| | | | Intermediate | | | Duration | |
| | | | Duration | | | Quality | |
| | | | (NID | ) | | (NIQ | ) |
| Purchases | | $ | 95,773,443 | | $ | 20,764,034 | |
| Sales and maturities | | | 89,671,915 | | | 18,174,755 | |
6. Income Tax Information
Each Fund is a separate taxpayer for federal income tax purposes. Each Fund intends to distribute substantially all of its net investment income and net capital gains to shareholders and to otherwise comply with the requirements of Subchapter M of the Internal Revenue Code applicable to regulated investment companies. Therefore, no federal income tax provision is required. Furthermore, each Fund intends to satisfy conditions that will enable interest from municipal securities, which is exempt from regular federal income taxes, to retain such tax-exempt status when distributed to shareholders of the Funds. Net realized capital gains and ordinary income distributions paid by the Funds are subject to federal taxation.
For all open tax years and all major taxing jurisdictions, management of the Funds has concluded that there are no significant uncertain tax positions that would require recognition in the financial statements. Open tax years are those that are open for examination by taxing authorities (i.e., generally the last four tax year ends and the interim tax period since then). Furthermore, management of the Funds is also not aware of any tax positions for which it is reasonably possible that the total amounts of unrecognized tax benefits will significantly change in the next twelve months.
The following information is presented on an income tax basis. Differences between amounts for financial statement and federal income tax purposes are primarily due to timing differences in recognizing taxable market discount, timing differences in recognizing certain gains and losses on investment transactions and the treatment of investments in inverse floating rate securities reflected as financing transactions, if any. To the extent that differences arise that are permanent in nature, such amounts are reclassified within the capital accounts as detailed below. Temporary differences do not require reclassification. Temporary and permanent differences do not impact the net asset values of the Funds.
As of November 30, 2013, the cost and unrealized appreciation (depreciation) of investments (excluding investments in derivatives), as determined on a federal income tax basis, were as follows:
| | | | | | Intermediate | |
| | | Intermediate | | Duration | |
| | | | Duration | | | Quality | |
| | | | (NID | ) | | (NIQ | ) |
| Cost of investments | | $ | 827,716,343 | | $ | 237,044,778 | |
| Gross unrealized: | | | | | | | |
| Appreciation | | $ | 906,141 | | $ | 200,528 | |
| Depreciation | | | (67,992,040 | ) | | (19,145,597 | ) |
| Net unrealized appreciation (depreciation) of investments | | $ | (67,085,899 | ) | $ | (18,945,069 | ) |
Notes to Financial Statements (Unaudited) (continued)
Permanent differences, primarily due to taxable market discount and nondeductible offering costs resulted in reclassifications among the Funds’ components of net assets as of May 31, 2013, the Funds’ last tax year end, as follows:
| | | | | Intermediate | |
| | | | Intermediate | | | Duration | |
| | | | Duration | | | Quality | |
| | | | (NID | ) | | (NIQ | ) |
| Paid-in surplus | | $ | (12,735 | ) | $ | (7,911 | ) |
| Undistributed (Over-distribution of) net investment income | | | 12,724 | | | 7,889 | |
| Accumulated net realized gain (loss) | | | 11 | | | 22 | |
The tax components of undistributed net tax-exempt income, net ordinary income and net long-term capital gains as of May 31, 2013, the Funds’ last tax year end, were as follows:
| | | | | | Intermediate | |
| | | Intermediate | | | Duration | |
| | | | Duration | | | Quality | |
| | | | (NID | ) | | (NIQ | ) |
Undistributed net tax-exempt income1 | | $ | 4,358,364 | | $ | 1,179,718 | |
Undistributed net ordinary income2 | | | — | | | — | |
| Undistributed net long-term capital gains | | | — | | | — | |
| 1 | Undistributed net tax-exempt income (on a tax basis) has not been reduced for the dividend declared on May 1, 2013, and paid on June 3, 2013. |
| 2 | Net ordinary income consists of taxable market discount income and net short-term capital gains, if any. |
The tax character of distributions paid during the period from each Fund’s commencement of operations through May 31, 2013, the Funds’ last tax year end, was designated for purposes of the dividends paid deduction as follows:
| | | | | | | Intermediate | |
| | | | Intermediate | | | Duration | |
| | | | Duration | | | Quality | |
| | | | (NID | ) | | (NIQ | ) |
| Distributions from net tax-exempt income | | $ | 8,446,467 | | $ | 783,375 | |
Distributions from net ordinary income2 | | | 385 | | | — | |
| Distributions from net long-term capital gains | | | — | | | — | |
| 2 | Net ordinary income consists of taxable market discount income and net short-term capital gains, if any. |
The Funds have elected to defer late-year losses in accordance with federal income tax rules. These losses are treated as having arisen on the first day of the current fiscal year. The Funds have elected to defer losses as follows:
| | | | | | | | |
| | | | | | | Intermediate | |
| | | | Intermediate | | | Duration | |
| | | | Duration | | | Quality | |
| | | | (NID | ) | | (NIQ | ) |
Post-October capital losses1 | | $ | 4,159,891 | | $ | 15,045 | |
Late-year ordinary losses2 | | | — | | | — | |
| 1 | Capital losses incurred from each Fund’s commencement of operations through May 31, 2013, the Funds’ last tax year end. |
| 2 | Ordinary losses incurred from January 1, 2013 or from the Fund’s commencement of operations through May 31, 2013, and specified losses incurred from each Fund’s commencement of operations through May 31, 2013. |
7. Management Fees and Other Transactions with Affiliates
Each Fund’s management fee compensates the Adviser for overall investment advisory and administrative services and general office facilities. The Sub-Adviser is compensated for its services to the Funds from the management fees paid to the Adviser.
Each Fund’s management fee consists of two components – a fund-level fee, based only on the amount of assets within the Fund, and a complex-level fee, based on the aggregate amount of all eligible fund assets managed by the Adviser. This pricing structure enables Fund shareholders to benefit from growth in the assets within their respective Fund as well as from growth in the amount of complex-wide assets managed by the Adviser.
The annual fund-level fee for each Fund, payable monthly, is calculated according to the following schedule:
| | | | | | Intermediate |
| | | Intermediate | | Duration |
| | | | Duration | | Quality |
| | | | (NID) | | (NIQ) |
| Average Daily Managed Assets* | | | Fund-Level Fee Rate | | Fund-Level Fee Rate |
| For the first $125 million | | | .4000 | % | | .3000 | % |
| For the next $125 million | | | .3875 | | | .2875 | |
| For the next $250 million | | | .3750 | | | .2750 | |
| For the next $500 million | | | .3625 | | | .2625 | |
| For the next $1 billion | | | .3500 | | | .2500 | |
| For the next $3 billion | | | .3375 | | | .2375 | |
| For managed assets over $5 billion | | | .3250 | | | .2250 | |
The annual complex-level fee for each Fund, payable monthly, is calculated according to the following schedule:
| | | |
| Complex-Level Managed Asset Breakpoint Level* | Effective Rate at Breakpoint Level |
| $55 billion | .2000 | % |
| $56 billion | .1996 | |
| $57 billion | .1989 | |
| $60 billion | .1961 | |
| $63 billion | .1931 | |
| $66 billion | .1900 | |
| $71 billion | .1851 | |
| $76 billion | .1806 | |
| $80 billion | .1773 | |
| $91 billion | .1691 | |
| $125 billion | .1599 | |
| $200 billion | .1505 | |
| $250 billion | .1469 | |
| $300 billion | .1445 | |
| * | For the fund-level and complex-level fees, managed assets include closed-end fund assets managed by the Adviser that are attributable to certain types of leverage. For these purposes, leverage includes the funds’ use of preferred stock and borrowings and certain investments in the residual interest certificates (also called inverse floating rate securities) in tender option bond (TOB) trusts, including the portion of assets held by a TOB trust that has been effectively financed by the trust’s issuance of floating rate securities, subject to an agreement by the Adviser as to certain funds to limit the amount of such assets for determining managed assets in certain circumstances. The complex-level fee is calculated based upon the aggregate daily managed assets of all Nuveen Funds that constitute “eligible assets.” Eligible assets do not include assets attributable to investments in other Nuveen Funds or assets in excess of $2 billion added to the Nuveen Fund complex in connection with the Adviser’s assumption of the management of the former First American Funds effective January 1, 2011. As of November 30, 2013, the complex-level fee rate for each of these Funds was .1679%. |
The Funds pay no compensation directly to those of its trustees who are affiliated with the Adviser or to its officers, all of whom receive remuneration for their services to the Funds from the Adviser or its affiliates. The Board of Trustees has adopted a deferred compensation plan for independent trustees that enables trustees to elect to defer receipt of all or a portion of the annual compensation they are entitled to receive from certain Nuveen-advised funds. Under the plan, deferred amounts are treated as though equal dollar amounts had been invested in shares of select Nuveen-advised funds.
| Reinvest Automatically, |
| | Easily and Conveniently |
| Nuveen makes reinvesting easy. A phone call is all it takes to set up your reinvestment account. |
Nuveen Closed-End Funds Automatic Reinvestment Plan
Nuveen Closed-End Fund allows you to conveniently reinvest distributions in additional Fund shares. By choosing to reinvest, you’ll be able to invest money regularly and automatically, and watch your investment grow through the power of compounding. Just like distributions in cash, there may be times when income or capital gains taxes may be payable on distributions that are reinvested. It is important to note that an automatic reinvestment plan does not ensure a profit, nor does it protect you against loss in a declining market.
Easy and convenient
To make recordkeeping easy and convenient, each month you’ll receive a statement showing your total distributions, the date of investment, the shares acquired and the price per share, and the total number of shares you own.
How shares are purchased
The shares you acquire by reinvesting will either be purchased on the open market or newly issued by the Fund. If the shares are trading at or above net asset value at the time of valuation, the Fund will issue new shares at the greater of the net asset value or 95% of the then-current market price. If the shares are trading at less than net asset value, shares for your account will be purchased on the open market. If the Plan Agent begins purchasing Fund shares on the open market while shares are trading below net asset value, but the Fund’s shares subsequently trade at or above their net asset value before the Plan Agent is able to complete its purchases, the Plan Agent may cease open-market purchases and may invest the uninvested portion of the distribution in newly-issued Fund shares at a price equal to the greater of the shares’ net asset value or 95% of the shares’ market value on the last business day immediately prior to the purchase date. Distributions received to purchase shares in the open market will normally be invested shortly after the distribution payment date. No interest will be paid on distributions awaiting reinvestment. Because the market price of the shares may increase before purchases are completed, the average purchase price per share may exceed the market price at the time of valuation, resulting in the acquisition of fewer shares than if the distribution had been paid in shares issued by the Fund. A pro rata portion of any applicable brokerage commissions on open market purchases will be paid by Plan participants. These commissions usually will be lower than those charged on individual transactions.
Flexible
You may change your distribution option or withdraw from the Plan at any time, should your needs or situation change. You can reinvest whether your shares are registered in your name, or in the name of a brokerage firm, bank, or other nominee. Ask your investment advisor if his or her firm will participate on your behalf. Participants whose shares are registered in the name of one firm may not be able to transfer the shares to another firm and continue to participate in the Plan. The Fund reserves the right to amend or terminate the Plan at any time. Although the Fund reserves the right to amend the Plan to include a service charge payable by the participants, there is no direct service charge to participants in the Plan at this time.
Call today to start reinvesting distributions
For more information on the Nuveen Automatic Reinvestment Plan or to enroll in or withdraw from the Plan, speak with your financial advisor or call us at (800) 257-8787.
Glossary of Terms Used in this Report
| | |
| ■ | Auction Rate Bond: An auction rate bond is a security whose interest payments are adjusted periodically through an auction process, which process typically also serves as a means for buying and selling the bond. Auctions that fail to attract enough buyers for all the shares offered for sale are deemed to have “failed,” with current holders receiving a formula-based interest rate until the next scheduled auction. |
| | |
| ■ | Average Annual Total Return: This is a commonly used method to express an investment’s performance over a particular, usually multi-year time period. It expresses the return that would have been necessary each year to equal the investment’s actual cumulative performance (including change in NAV or market price and reinvested dividends and capital gains distributions, if any) over the time period being considered. |
| | |
| ■ | Duration: Duration is a measure of the expected period over which a bond’s principal and interest will be paid, and consequently is a measure of the sensitivity of a bond’s or bond fund’s value to changes when market interest rates change. Generally, the longer a bond’s or fund’s duration, the more the price of the bond or fund will change as interest rates change. |
| | |
| ■ | Effective Leverage: Effective leverage is a fund’s effective economic leverage, and includes both regulatory leverage (see leverage) and the leverage effects of certain derivative investments in a fund’s portfolio. Currently, the leverage effects of Tender Option Bond (TOB) inverse floater holdings are included in effective leverage values, in addition to any regulatory leverage. |
| | |
| ■ | Forward Interest Rate Swap: A contractual agreement between two counterparties under which one party agrees to make periodic payments to the other for an agreed period of time based on a fixed rate, while the other party agrees to make periodic payments based on a floating rate of interest based on an underlying index. Alternatively, both series of cash flows to be exchanged could be calculated using floating rates of interest but floating rates that are based upon different underlying indices. |
| | |
| ■ | Gross Domestic Product (GDP): The total market value of all final goods and services produced in a country/region in a given year, equal to total consumer, investment and government spending, plus the value of exports, minus the value of imports. |
| | |
| ■ | Inverse Floating Rate Securities: Inverse floating rate securities, also known as inverse floaters or tender option bonds (TOBs), are created by depositing a municipal bond, typically with a fixed interest rate, into a special purpose trust created by a broker-dealer. This trust, in turn, (a) issues floating rate certificates typically paying short-term tax-exempt interest rates to third parties in amounts equal to some fraction of the deposited bond’s par amount or market value, and (b) issues an inverse floating rate certificate (sometimes referred to as an “inverse floater”) to an investor (such as a Fund) interested in gaining investment exposure to a long-term municipal bond. The income received by the holder of the inverse floater varies inversely with the short-term rate paid to the floating rate certificates’ holders, and in most circumstances the holder of the inverse floater bears substantially all of the underlying bond’s downside investment risk. The holder of the inverse floater typically also benefits disproportionately from any potential appreciation of the underlying bond’s value. Hence, an inverse floater essentially represents an investment in the underlying bond on a leveraged basis. |
Glossary of Terms Used in this Report (continued)
| | |
| ■ | Leverage: Leverage is created whenever a fund has investment exposure (both reward and/or risk) equivalent to more than 100% of the investment capital. |
| | |
| ■ | Lipper General & Insured Leveraged Municipal Debt Funds Classification Average: Calculated using the returns of all closed-end funds in this category. Lipper returns account for the effects of management fees and assume reinvestment of distributions, but do not reflect any applicable sales charges. |
| | |
| ■ | Lipper Intermediate Municipal Debt Funds Classification Average: Represents the average annualized total return for all reporting funds in the Lipper Intermediate Municipal Debt Funds Classification. Lipper returns account for the effects of management fees and assume reinvestment of distributions, but do not reflect any applicable sales charge. |
| | |
| ■ | Net Asset Value (NAV) Per Share: A fund’s Net Assets is equal to its total assets (securities, cash, accrued earnings and receivables) less its total liabilities. NAV per share is equal to the fund’s Net Assets divided by its number of shares outstanding. |
| | |
| ■ | Pre-Refunding: Pre-Refunding, also known as advanced refundings or refinancings, is a procedure used by state and local governments to refinance municipal bonds to lower interest expenses. The issuer sells new bonds with a lower yield and uses the proceeds to buy U.S. Treasury securities, the interest from which is used to make payments on the higher-yielding bonds. Because of this collateral, pre-refunding generally raises a bond’s credit rating and thus its value. |
| | |
| ■ | Regulatory Leverage: Regulatory Leverage consists of preferred shares issued by or borrowings of a fund. Both of these are part of a fund’s capital structure. Regulatory leverage is subject to asset coverage limits set in the Investment Company Act of 1940. |
| | |
| ■ | S&P Municipal Bond Intermediate Index: An unleveraged, market value-weighted index containing all of the bonds in the S&P Municipal Bond Index with maturity dates between 3 and 14.999 years. Index returns assume reinvestment of distributions, but do not reflect any applicable sales charges or management fees. |
| | |
| ■ | Total Investment Exposure: Total investment exposure is a fund’s assets managed by the Adviser that are attributable to financial leverage. For these purposes, financial leverage includes a fund’s use of preferred stock and borrowings and investments in the residual interest certificates (also called inverse floating rate securities) in tender option bond (TOB) trusts, including the portion of assets held by a TOB trust that has been effectively financed by the trust’s issuance of floating rate securities. |
| | |
| ■ | Zero Coupon Bond: A zero coupon bond does not pay a regular interest coupon to its holders during the life of the bond. Tax-exempt income to the holder of the bond comes from accretion of the difference between the original purchase price of the bond at issuance and the par value of the bond at maturity and is effectively paid at maturity. The market prices of zero coupon bonds generally are more volatile than the market prices of bonds that pay interest periodically. |
Notes
Notes
Additional Fund Information
| Board of Trustees | | | | | | | | | | |
| William Adams IV* | | Robert P. Bremner | | Jack B. Evans | | William C. Hunter | | David J. Kundert | | John K. Nelson |
| William J. Schneider | | Thomas S. Schreier, Jr.* | | Judith M. Stockdale | | Carole E. Stone | | Virginia L. Stringer | | Terence J. Toth |
| | | | | | | | | | | |
| * Interested Board Member. | | | | | | | | |
| | | | | | | | | | | |
| Fund Manager | | Custodian | | Legal Counsel | | Independent Registered | | Transfer Agent and |
| Nuveen Fund Advisors, LLC | | State Street Bank | | Chapman and Cutler LLP | | Public Accounting Firm | | Shareholder Services |
| 333 West Wacker Drive | | & Trust Company | | Chicago, IL 60603 | | Ernst & Young LLP | | State Street Bank |
| Chicago, IL 60606 | | Boston, MA 02111 | | | | Chicago, IL 60606 | | & Trust Company |
| | | | | | | | | Nuveen Funds |
| | | | | | | | | P.O. Box 43071 |
| | | | | | | | | Providence, RI 02940-3071 |
| | | | | | | | | (800) 257-8787 |
| | | | | | | | | |
Quarterly Form N-Q Portfolio of Investments Information
Each Fund is required to file its complete schedule of portfolio holdings with the Securities and Exchange Commission (SEC) for the first and third quarters of each fiscal year on Form N-Q. You may obtain this information directly from the SEC. Visit the SEC on-line at http://www.sec.gov or in person at the SEC’s Public Reference Room in Washington, D.C. Call the SEC toll-free at (800) SEC-0330 for room hours and operation.
Nuveen Funds’ Proxy Voting Information
You may obtain (i) information regarding how each fund voted proxies relating to portfolio securities held during the most recent twelve-month period ended June 30, without charge, upon request, by calling Nuveen Investments toll-free at (800) 257-8787 or on Nuveen’s website at www.nuveen.com and (ii) a description of the policies and procedures that each fund used to determine how to vote proxies relating to portfolio securities without charge, upon request, by calling Nuveen Investments toll free at (800) 257-8787. You may also obtain this information directly from the SEC. Visit the SEC on-line at http://www.sec.gov.
CEO Certification Disclosure
Each Fund’s Chief Executive Officer has submitted to the New York Stock Exchange (NYSE) the annual CEO certification as required by Section 303A.12(a) of the NYSE Listed Company Manual. Each Fund has filed with the SEC the certification of its Chief Executive Officer and Chief Financial Officer required by Section 302 of the Sarbanes-Oxley Act.
Common Share Information
Each Fund intends to repurchase shares of its own common stock at such times and in such amounts as is deemed advisable. During the period covered by this report, the Fund repurchased shares of its common stock as shown in the accompanying table. Any future repurchases will be reported to shareholders in the next annual or semi-annual report.
| | | | NID | | | NIQ | |
| Common shares repurchased | | | — | | | — | |
| Nuveen Investments: |
| | Serving Investors for Generations |
Since 1898, financial advisors and their clients have relied on Nuveen Investments to provide dependable investment solutions through continued adherence to proven, long-term investing principles. Today, we offer a range of high quality equity and fixed-income solutions designed to be integral components of a well-diversified core portfolio.
Focused on meeting investor needs.
Nuveen Investments provides high-quality investment services designed to help secure the long-term goals of institutional and individual investors as well as the consultants and financial advisors who serve them. Nuveen Investments markets a wide range of specialized investment solutions which provide investors access to capabilities of its high-quality boutique investment affiliates—Nuveen Asset Management, Symphony Asset Management, NWQ Investment Management Company, Santa Barbara Asset Management, Tradewinds Global Investors, Winslow Capital Management and Gresham Investment Management. In total, Nuveen Investments managed approximately $215 billion as of September 30, 2013.
Find out how we can help you.
To learn more about how the products and services of Nuveen Investments may be able to help you meet your financial goals, talk to your financial advisor, or call us at (800) 257-8787. Please read the information provided carefully before you invest. Investors should consider the investment objective and policies, risk considerations, charges and expenses of any investment carefully. Where applicable, be sure to obtain a prospectus, which contains this and other relevant information. To obtain a prospectus, please contact your securities representative or Nuveen Investments, 333 W. Wacker Dr., Chicago, IL 60606. Please read the prospectus carefully before you invest or send money.
Learn more about Nuveen Funds at: www.nuveen.com/cef
| Distributed by Nuveen Investments, LLC | 333 West Wacker Drive | Chicago, IL 60606 | www.nuveen.com |  |
ESA-C-1113D
ITEM 2. CODE OF ETHICS.
Not applicable to this filing.
ITEM 3. AUDIT COMMITTEE FINANCIAL EXPERT.
Not applicable to this filing.
ITEM 4. PRINCIPAL ACCOUNTANT FEES AND SERVICES.
Not applicable to this filing.
ITEM 5. AUDIT COMMITTEE OF LISTED REGISTRANTS.
Not applicable to this filing.
ITEM 6. SCHEDULE OF INVESTMENTS.
(a) See Portfolio of Investments in Item 1.
(b) Not applicable.
ITEM 7. DISCLOSURE OF PROXY VOTING POLICIES AND PROCEDURES FOR CLOSED-END MANAGEMENT INVESTMENT COMPANIES.
Not applicable to this filing.
ITEM 8. PORTFOLIO MANAGERS OF CLOSED-END MANAGEMENT INVESTMENT COMPANIES.
Not applicable to this filing.
ITEM 9. PURCHASES OF EQUITY SECURITIES BY CLOSED-END MANAGEMENT INVESTMENT COMPANY AND AFFILIATED PURCHASERS.
Not applicable.
ITEM 10. SUBMISSION OF MATTERS TO A VOTE OF SECURITY HOLDERS.
There have been no material changes to the procedures by which shareholders may recommend nominees to the registrant's Board implemented after the registrant last provided disclosure in response to this Item.
ITEM 11. CONTROLS AND PROCEDURES.
ITEM 12. EXHIBITS.
File the exhibits listed below as part of this Form.
Pursuant to the requirements of the Securities Exchange Act of 1934 and the Investment Company Act of 1940, the registrant has duly caused this report to be signed on its behalf by the undersigned, thereunto duly authorized.
Kevin J. McCarthy
Pursuant to the requirements of the Securities Exchange Act of 1934 and the Investment Company Act of 1940, this report has been signed below by the following persons on behalf of the registrant and in the capacities and on the dates indicated.
Gifford R. Zimmerman
Stephen D. Foy