Life is Complex
Nuveen makes things e-simple.
It only takes a minute to sign up for e-Reports. Once enrolled, you'll receive an e-mail as soon as your Nuveen Investments Fund information is ready—no more waiting for delivery by regular mail. Just click on the link within the e-mail to see the report and save it on your computer if you wish.
Free e-Reports right to your e-mail!
www.investordelivery.com
If you receive your Nuveen Fund dividends and statements from your financial advisor or brokerage account.
or
www.nuveen.com/accountaccess
If you receive your Nuveen Fund dividends and statements directly from Nuveen.
Table of Contents
| Chairman's Letter to Shareholders | 4 |
| | |
| Portfolio Managers' Comments | 5 |
| | |
| Fund Leverage | 8 |
| | |
| Common Share Information | 9 |
| | |
| Risk Considerations | 11 |
| | |
| Performance Overview and Holding Summaries | 12 |
| | |
| Portfolios of Investments | 16 |
| | |
| Statement of Assets and Liabilities | 44 |
| | |
| Statement of Operations | 45 |
| | |
| Statement of Changes in Net Assets | 46 |
| | |
| Statement of Cash Flows | 47 |
| | |
| Financial Highlights | 48 |
| | |
| Notes to Financial Statements | 50 |
| | |
| Additional Fund Information | 62 |
| | |
| Glossary of Terms Used in this Report | 63 |
| | |
| Reinvest Automatically, Easily and Conveniently | 67 |
Chairman's Letter to Shareholders
Dear Shareholders,
For better or for worse, the financial markets spent most of the past year waiting for the U.S. Federal Reserve (Fed) to end its accommodative monetary policy. The policy has propped up stock and bond markets since the Great Recession, but the question remains: how will markets behave without its influence? This uncertainty was a considerable source of volatility for stock and bond prices for much of 2015, despite the Fed carefully conveying its intention to raise rates slowly and only when the economy shows evidence of readiness.
As was widely expected, the long-awaited Fed rate hike materialized in mid-December. While the move was interpreted as a vote of confidence on the U.S. economy's underlying strength, the Fed emphasized that future rate increases will be gradual and guided by its ongoing assessment of financial conditions. Headwinds including rising borrowing costs, softer commodity prices, low inflation, a strong U.S. dollar and a stagnant global economy could necessitate keeping monetary conditions accommodative for longer. Meanwhile, policy makers in Europe and Japan are deploying their available tools to try to bolster their economies' fragile growth, while Chinese authorities have stepped up efforts to manage China's slowdown.
Although the new year began with a more pessimistic tone to investor sentiment and elevated volatility in the markets, we caution investors from making long-term decisions based on short-term news. In times like these, you can look to a professional investment manager with the experience and discipline to maintain the proper perspective on short-term events. And if the daily headlines do concern you, I encourage you to reach out to your financial advisor. Your financial advisor can help you evaluate your investment strategies in light of current events, your time horizon and risk tolerance.
On behalf of the other members of the Nuveen Fund Board, we look forward to continuing to earn your trust in the months and years ahead.
Sincerely,
William J. Schneider
Chairman of the Board
January 25, 2016
Portfolio Managers' Comments
Nuveen Intermediate Duration Municipal Term Fund (NID)
Nuveen Intermediate Duration Quality Municipal Term Fund (NIQ)
These Funds feature portfolio management by Nuveen Asset Management, LLC, an affiliate of Nuveen Investments, Inc. Portfolio managers John V. Miller, CFA, Timothy T. Ryan, CFA, Steven M. Hlavin and Daniel J. Close, CFA, discuss key investment strategies and the six-month performance of these two Nuveen Funds. John, Tim and Steve have managed NID since its inception in December 2012 and Dan has managed NIQ since its inception in February 2013.
What key strategies were used to manage NID and NIQ during the six-month reporting period ended November 30, 2015?
Although anticipation of rising interest rates weighed on fixed income markets during this reporting period, favorable technical and fundamental factors helped the broad municipal market deliver a modest gain for the reporting period overall. (As was widely expected, the U.S. Federal Reserve raised its target federal funds rate at the December meeting, after the close of this reporting period.) During this reporting period, we continued to take a bottom-up approach to discovering sectors that appeared undervalued as well as individual credits that we believed had the potential to perform well over the long term.
Our trading activity continued to focus on pursuing the Funds' investment objectives. Generally speaking, throughout the six-month reporting period, the Funds maintained their overall positioning strategies in terms of duration and yield curve positioning, credit quality exposures and sector allocations. We've also continued to be more cautious in selecting individual securities. As investor demand for municipal securities has increased and created a slight supply-demand imbalance, we've started to see underwriters bring new issues to market that are structured with terms more favorable to the issuer and perhaps less advantageous to the investor than in the recent past. We believe this shift in the marketplace merits extra vigilance on our part to ensure that every credit considered for the portfolio offers adequate reward potential for the level of risk to the bondholder. In cases where our convictions have been less certain, we've sought compensation for the additional risk or have passed on the deal all together.
To keep the Funds fully invested, we continued to focus on purchasing bonds in areas of the market that we expected to perform well as the economy continued to improve. We emphasized intermediate and longer maturities, lower-rated credits and sectors offering higher yields. To fund these purchases, we generally reinvested the proceeds from called and maturing bonds. In some cases, we sold bonds that we believed had deteriorating fundamentals or could be traded for a better relative value, as well as selling short-dated, higher quality issues that we tend to hold over short timeframes as a source of liquidity.
Certain statements in this report are forward-looking statements. Discussions of specific investments are for illustration only and are not intended as recommendations of individual investments. The forward-looking statements and other views expressed herein are those of the portfolio managers as of the date of this report. Actual future results or occurrences may differ significantly from those anticipated in any forward-looking statements, and the views expressed herein are subject to change at any time, due to numerous market and other factors. The Funds disclaim any obligation to update publicly or revise any forward-looking statements or views expressed herein.Ratings shown are the highest rating given by one of the following national rating agencies: Standard & Poor's, (S&P) Moody's Investors Service, Inc. (Moody's) or Fitch, Inc. (Fitch) Credit ratings are subject to change. AAA, AA, A, and BBB are investment grade ratings; BB, B, CCC, CC, C and D are below investment grade ratings. Certain bonds backed by U.S. government or agency securities are regarded as having an implied rating equal to the rating of such securities. Holdings designated N/R are not rated by these national rating agencies.
Bond insurance guarantees only the payment of principal and interest on the bond when due, and not the value of the bonds themselves, which will fluctuate with the bond market and the financial success of the issuer and the insurer. Insurance relates specifically to the bonds in the portfolio and not to the share prices of a Fund. No representation is made as to the insurers' ability to meet their commitments.
Refer to the Glossary of Terms Used in this Report for further definition of the terms used within this section.
Portfolio Managers' Comments (continued)
Trading activity in both NID and NIQ was relatively muted during this reporting period, as we believe the Funds continued to be well positioned to offer attractive yields for their level of duration exposure. We continued to seek opportunities to reduce bonds with lower book yields per unit of duration and replace them with lower-rated bonds offering higher yields. In NID, we bought BB rated U.S. Steel bonds, an A rated Sumter County Central Florida Health Alliance credit and an unrated bond issued for a senior living facility in Cape Coral, Florida. While we actively pursued opportunities in lower rated bonds NID's weighting in AAA rated bonds increased meaningfully during the period due to a sizeable refunding that occurred during the reporting period. NID held a Guam-issued general obligation (GO) bond that was pre-refunded in September, which bolstered the Fund's AAA rated category because the refunded bond is backed by U.S. Treasury securities. In addition, the Guam GO contributed to performance as its price appreciated significantly due to the refunding. NIQ added lower quality bonds issued for Downtown Phoenix Hotel, New York Convention Center and Port of Seattle.
Notable sales in NID during the reporting period included U.S. territory paper issued for the Virgin Islands and New Jersey appropriation bonds, given our concerns about the potential for elevated volatility as the State of New Jersey continues to work through its budget woes. NIQ also reduced (but did not eliminate) an appropriation bond and sold a Detroit sewers credit.
As of November 30, 2015, both of these Funds continued to use inverse floating rate securities. We employ inverse floaters for a variety of reasons, including duration management, income enhancement and total return enhancement. As part of our duration management strategies, NID and NIQ also used duration shortening forward interest rate swaps to help maintain the Funds' ten-year maximum duration mandate. Since long-term interest rates generally decreased during the reporting period, the swaps had a negative impact on performance.
How did NID and NIQ perform during the six-month reporting period ended November 30, 2015?
The tables in each Fund's Performance Overview and Holding Summaries section of this report provide the Funds' total returns for the six-month, one-year and since-inception periods ended November 30, 2015. Each Fund's total returns at common share net asset value (NAV) are compared with the performance of a corresponding market index and Lipper classification averages.
For the six months ended November 30, 2015, the total returns at common share NAV for NID slightly underperformed the return for the S&P Municipal Bond Intermediate Index, while NIQ outperformed this index. For the same period, NID underperformed the average return for the Lipper General & Insured Leveraged Municipal Debt Funds Classification Average and NIQ outperformed the Lipper Intermediate Municipal Debt Funds Classification Average.
For both Funds, duration and yield curve positioning was a meaningful contributor to relative performance over this reporting period. While NID and NIQ maintain effective durations in the intermediate range, both Funds include overweight exposures to longer maturity bonds relative to the benchmark index weighting and relative underweights in short maturity bonds. This positioning was advantageous in this reporting period as intermediate- and longer-dated bonds generally outperformed shorter-dated bonds.
The Funds' sector strategies were another source of relative gains in this reporting period. In particular, both Funds benefited strongly from their overweight allocations to tobacco settlement bonds, the top-performing sector in the municipal market for the reporting period. NID was also aided by overweight positions in the dedicated tax (or land secured), hospital and transportation (especially tollroads) sectors, while NIQ was further boosted by its underweight allocation to state GOs.
Credit exposure, however, was detrimental to both Funds' relative performance. NID and NIQ held approximately 45% and 21%, respectively, of their managed assets in bonds rated below investment grade and not rated. These exposures were hurt by widening credit spreads, which drove lower rated bonds to underperform the intermediate municipal market during this reporting period.
Individual credit selection was also unfavorable for both NID and NIQ during this reporting period. NID's holdings in corporate-backed municipal bonds were the main detractors, as these types of bonds were dragged lower, in part, by their association with the high yield corporate bond market. With companies, especially in the energy and industrial sectors, now dealing with lower commodity prices and rising interest rates, the fear of rising defaults put intense pressure on the high yield corporate market. However, the downturn was milder for the tax-exempt debt issued by high yield companies for several reasons. Compared to the taxable high yield corporate market, the corporate-backed municipal market is considerably smaller (less supply and lower trading volumes), and the premium placed on the municipal bonds' tax-exempt status provides greater upward support to their prices. In NIQ, our tender-option bonds were beneficial to performance, but relative gains were partially offset by the negative impact from the interest rate swaps used within our duration management strategy.
An Update Involving Puerto Rico
As noted in the Funds' previous shareholder reports, we continue to monitor situations in the broader municipal market for any impact on the Funds' holdings and performance: the ongoing economic problems of Puerto Rico is one such case. Puerto Rico's continued economic weakening, escalating debt service obligations, and long-standing inability to deliver a balanced budget led to multiple downgrades on its debt over the past two years. Puerto Rico has warned investors since 2014 that the island's debt burden may be unsustainable and the Commonwealth has been exploring various strategies to deal with this burden, including Chapter 9 bankruptcy, which is currently not available by law.
In terms of Puerto Rico holdings, shareholders should note that NID had limited exposure to Puerto Rico debt during this reporting period, generally totaling under 1%, while NIQ had no exposure to Puerto Rico bonds. The Puerto Rico credits offered higher yields, added diversification and triple exemption (i.e., exemption from most federal, state and local taxes). Puerto Rico general obligation debt is currently rated Caa2/CC/CC (below investment grade) by Moody's, S&P and Fitch, respectively, with negative outlooks.
Fund Leverage
IMPACT OF THE FUNDS' LEVERAGE STRATEGIES ON PERFORMANCE
One important factor impacting the returns of the Funds relative to their comparative benchmarks was the Funds' use of leverage through their issuance of preferred shares and/or investments in inverse floating rate securities, which represent leveraged investments in underlying bonds. The Funds use leverage because our research has shown that, over time, leveraging provides opportunities for additional income, particularly in the recent market environment where short-term market rates are at or near historical lows, meaning that the short-term rates the Fund has been paying on its leveraging instruments have been much lower than the interest the Fund has been earning on its portfolio of long-term bonds that it has bought with the proceeds of that leverage. However, use of leverage also can expose the Fund to additional price volatility. When a Fund uses leverage, the Fund will experience a greater increase in its net asset value if the municipal bonds acquired through the use of leverage increase in value, but it will also experience a correspondingly larger decline in its net asset value if the bonds acquired through leverage decline in value, which will make the Fund's net asset value more volatile, and its total return performance more variable over time. In addition, income in levered funds will typically decrease in comparison to unlevered funds when short-term interest rates increase and increase when short-term interest rates decrease. Leverage had a positive impact on the performance of both Funds over this reporting period.
As of November 30, 2015, the Funds' percentages of leverage are as shown in the accompanying table.
| | NID | | NIQ | |
| Effective Leverage* | 35.93% | | 36.24% | |
| Regulatory Leverage* | 21.41% | | 23.22% | |
| * | Effective Leverage is a Fund's effective economic leverage, and includes both regulatory leverage and the leverage effects of certain derivative and other investments in a Fund's portfolio that increase the Fund's investment exposure. Currently, the leverage effects of Tender Option Bond (TOB) inverse floater holdings are included in effective leverage values, in addition to any regulatory leverage. Regulatory leverage consists of preferred shares issued or borrowings of a Fund. Both of these are part of a Fund's capital structure. Regulatory leverage is subject to asset coverage limits set forth in the Investment Company Act of 1940. |
THE FUNDS' REGULATORY LEVERAGE
As of November 30, 2015, the Funds have issued and outstanding Variable Rate MuniFund Term Preferred (VMTP) Shares as shown in the accompanying table.
| | | | VMTP Shares | |
| | | | | | | Shares Issued at | |
| | | | Series | | | Liquidation Value | |
| NID | | | 2018 | | $ | 175,000,000 | |
| NIQ | | | 2018 | | $ | 55,000,000 | |
During the current reporting period, each Fund refinanced all its outstanding VMTP Shares with the issuance of new VMTP Shares.
Refer to Notes to Financial Statements, Note 4 — Fund Shares, Preferred Shares for further details on VMTP Shares and each Fund's respective transactions.
Common Share Information
COMMON SHARE DISTRIBUTION INFORMATION
The following information regarding the Funds' distributions is current as of November 30, 2015. Each Fund's distribution levels may vary over time based on each Fund's investment activity and portfolio investment value changes.
During the current reporting period, each Fund's distributions to common shareholders were as shown in the accompanying table.
| | | | Per Common Share Amounts | |
| Ex-Dividend Date | | | NID | | | NIQ | |
| June 2015 | | $ | 0.0570 | | $ | 0.0495 | |
| July | | | 0.0570 | | | 0.0495 | |
| August | | | 0.0570 | | | 0.0495 | |
| September | | | 0.0570 | | | 0.0475 | |
| October | | | 0.0570 | | | 0.0475 | |
| November 2015 | | | 0.0570 | | | 0.0475 | |
| | | | | | | | |
| Market Yield* | | | 5.44% | | | 4.51% | |
| Taxable-Equivalent Yield* | | | 7.56% | | | 6.26% | |
| * | Market Yield is based on the Fund's current annualized monthly dividend divided by the Fund's current market price as of the end of the reporting period. Taxable-Equivalent Yield represents the yield that must be earned on a fully taxable investment in order to equal the yield of the Fund on an after-tax basis. It is based on a federal income tax rate of 28.0%. When comparing a Fund to investments that generate qualified dividend income, the Taxable-Equivalent Yield would be lower. |
Each Fund in this report seeks to pay regular monthly dividends out of their net investment income at a rate that reflects its past and projected net income performance. To permit each Fund to maintain a more stable monthly dividend, the Fund may pay dividends at a rate that may be more or less than the amount of net income actually earned by the Fund during the period. If a Fund has cumulatively earned more than it has paid in dividends, it will hold the excess in reserve as undistributed net investment income (UNII) as part of the Fund's net asset value. Conversely, if a Fund has cumulatively paid in dividends more than it has earned, the excess will constitute a negative UNII that will likewise be reflected in the Fund's net asset value. Each Fund will, over time, pay all its net investment income as dividends to shareholders.
As of November 30, 2015, the Funds had positive UNII balances, based upon our best estimate, for tax purposes and positive UNII balances for financial reporting purposes.
All monthly dividends paid by each Fund during the current reporting period were paid from net investment income. If a portion of the Fund's monthly distributions was sourced from or comprised of elements other than net investment income, including capital gains and/or a return of capital, shareholders would have received a notice to that effect. For financial reporting purposes the composition and per share amounts of each Fund's dividends for the reporting period are presented in this report's Statement of Changes in Net Assets and Financial Highlights, respectively. For income tax purposes distribution information for each Fund as of its most recent tax year end is presented in Note 6 — Income Tax Information within the Notes to Financial Statements of this report.
Common Share Information (continued)
COMMON SHARE REPURCHASES
During August 2015, the Funds' Board of Trustees reauthorized an open-market share repurchase program, allowing each Fund to repurchase an aggregate of up to approximately 10% of its outstanding shares.
As of November 30, 2015, and since the inception of the Funds' repurchase programs, the Funds have cumulatively repurchased and retired common shares as shown in the accompanying table.
| | | | NID | | | NIQ | |
| Common shares cumulatively repurchased and retired | | | 0 | | | 0 | |
| Common shares authorized for repurchase | | | 4,690,000 | | | 1,310,000 | |
OTHER COMMON SHARE INFORMATION
As of November 30, 2015, and during the current reporting period, the Funds' common share prices were trading at a premium/(discount) to their common share NAVs as shown in the accompanying table.
| | | | NID | | | NIQ | |
| Common share NAV | | $ | 13.69 | | $ | 13.88 | |
| Common share price | | $ | 12.57 | | $ | 12.64 | |
| Premium/(Discount) to NAV | | | (8.18 | )% | | (8.93 | )% |
| 6-month average premium/(discount) to NAV | | | (9.53 | )% | | (9.36 | )% |
Risk Considerations
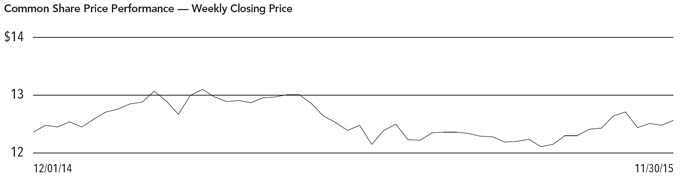
Nuveen Intermediate Duration Municipal Term Fund (NID)
Investing in closed-end funds involves risk; principal loss is possible. There is no guarantee the Fund's investment objectives will be achieved. Closed-end fund shares may frequently trade at a discount or premium to their net asset value. Debt or fixed income securities such as those held by the Fund, are subject to market risk, credit risk, interest rate risk, derivatives risk, liquidity risk, and income risk. As interest rates rise, bond prices fall. Lower credit debt securities may be more likely to fail to make timely interest or principal payments. Leverage increases return volatility and magnifies the Fund's potential return and its risks; there is no guarantee a fund's leverage strategy will be successful. For these and other risks, including the Fund's limited term and inverse floater risk, see the Fund's web page at www.nuveen.com/NID.
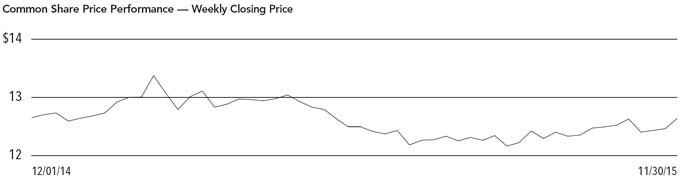
Nuveen Intermediate Duration Quality Municipal Term Fund (NIQ)
Investing in closed-end funds involves risk; principal loss is possible. There is no guarantee the Fund's investment objectives will be achieved. Closed-end fund shares may frequently trade at a discount or premium to their net asset value. Debt or fixed income securities such as those held by the Fund, are subject to market risk, credit risk, interest rate risk, derivatives risk, liquidity risk, and income risk. As interest rates rise, bond prices fall. Leverage increases return volatility and magnifies the Fund's potential return and its risks; there is no guarantee a fund's leverage strategy will be successful. For these and other risks, including the Fund's limited term and inverse floater risk, see the Fund's web page at www.nuveen.com/NIQ.
| NID | |
| | Nuveen Intermediate Duration Municipal Term Fund |
| | Performance Overview and Holding Summaries as of November 30, 2015 |
Refer to the Glossary of Terms Used in this Report for further definition of the terms used within this section.
Average Annual Total Returns as of November 30, 2015
| | | Cumulative | | Average Annual | |
| | | 6-Month | | 1-Year | | Since Inception | |
| NID at Common Share NAV | | 2.30% | | 4.09% | | 3.26% | |
| NID at Common Share Price | | 3.51% | | 7.43% | | (0.77)% | |
| S&P Municipal Bond Intermediate Index | | 2.35% | | 2.97% | | 2.42% | |
| Lipper General & Insured Leveraged Municipal Debt Funds Classification Average | | 3.80% | | 5.39% | | 6.57% | |
Since inception returns are from 12/05/12. Past performance is not predictive of future results. Current performance may be higher or lower than the data shown. Returns do not reflect the deduction of taxes that shareholders may have to pay on Fund distributions or upon the sale of Fund shares. Returns at NAV are net of Fund expenses, and assume reinvestment of distributions. Comparative index and Lipper return information is provided for the Fund's shares at NAV only. Indexes and Lipper averages are not available for direct investment.
This data relates to the securities held in the Fund's portfolio of investments as of the end of the reporting period. It should not be construed as a measure of performance for the Fund itself. Holdings are subject to change.
Ratings shown are the highest rating given by one of the following national rating agencies: Standard & Poor's Group, Moody's Investors Service, Inc. or Fitch, Inc. Credit ratings are subject to change. AAA, AA, A and BBB are investment grade ratings; BB, B, CCC, CC, C and D are below-investment grade ratings. Certain bonds backed by U.S. Government or agency securities are regarded as having an implied rating equal to the rating of such securities. Holdings designated N/R are not rated by these national rating agencies.
| Fund Allocation | |
| (% of net assets) | |
| Long-Term Municipal Bonds | 125.5% |
| Short-Term Municipal Bonds | 0.2% |
| Other Asset Less Liabilities | 1.6% |
| Net Asset Plus VMTP Shares, at Liquidation Value | 127.3% |
| VMTP Shares, at Liquidation Value | (27.3)% |
| Net Assets | 100% |
| Credit Quality | |
(% of total investment exposure)1 | |
| AAA/U.S. Guaranteed | 2.0% |
| AA | 23.2% |
| A | 16.4% |
| BBB | 13.1% |
| BB or Lower | 25.4% |
| N/R (not rated) | 19.9% |
| Total | 100% |
| Portfolio Composition | |
(% of total investments)1 | |
| Tax Obligation/Limited | 24.8% |
| Health Care | 14.2% |
| Consumer Staples | 9.6% |
| Industrials | 9.2% |
| Education and Civic Organizations | 8.2% |
| Transportation | 6.7% |
| Long-Term Care | 6.5% |
| Utilities | 5.4% |
| Tax Obligation/General | 5.2% |
| Other | 10.2% |
| Total | 100% |
| States and Territories | |
(as a % of total investments)1 | |
| Florida | 9.9% |
| Illinois | 9.2% |
| California | 8.8% |
| Texas | 7.0% |
| New York | 5.4% |
| Michigan | 5.2% |
| Ohio | 5.2% |
| Pennsylvania | 5.2% |
| New Jersey | 4.8% |
| Colorado | 3.6% |
| Alabama | 2.6% |
| Virginia | 2.2% |
| Guam | 2.1% |
| Wisconsin | 2.1% |
| Indiana | 2.1% |
| Iowa | 2.0% |
| Washington | 2.0% |
| Kansas | 1.6% |
| Other | 19.0% |
| Total | 100% |
| 1 | | Excluding investments in derivatives. |
| NIQ | |
| | Nuveen Intermediate Duration Quality Municipal Term Fund |
| | Performance Overview and Holding Summaries as of November 30, 2015 |
Refer to the Glossary of Terms Used in this Report for further definition of the terms used within this section.
Average Annual Total Returns as of November 30, 2015
| | | Cumulative | | Average Annual | |
| | | 6-Month | | 1-Year | | Since Inception | |
| NIQ at Common Share NAV | | 3.56% | | 3.68% | | 3.01% | |
| NIQ at Common Share Price | | 3.59% | | 4.18% | | (1.61)% | |
| S&P Municipal Bond Intermediate Index | | 2.35% | | 2.97% | | 2.80% | |
| Lipper Intermediate Municipal Debt Funds Classification Average | | 2.79% | | 3.91% | | 5.64% | |
Since inception returns are from 2/07/13. Past performance is not predictive of future results. Current performance may be higher or lower than the data shown. Returns do not reflect the deduction of taxes that shareholders may have to pay on Fund distributions or upon the sale of Fund shares. Returns at NAV are net of Fund expenses, and assume reinvestment of distributions. Comparative index and Lipper return information is provided for the Fund's shares at NAV only. Indexes and Lipper averages are not available for direct investment.
This data relates to the securities held in the Fund's portfolio of investments as of the end of the reporting period. It should not be construed as a measure of performance for the Fund itself. Holdings are subject to change.
Ratings shown are the highest rating given by one of the following national rating agencies: Standard & Poor's Group, Moody's Investors Service, Inc. or Fitch, Inc. Credit ratings are subject to change. AAA, AA, A and BBB are investment grade ratings; BB, B, CCC, CC, C and D are below-investment grade ratings. Certain bonds backed by U.S. Government or agency securities are regarded as having an implied rating equal to the rating of such securities. Holdings designated N/R are not rated by these national rating agencies.
| Fund Allocation | |
| (% of net assets) | |
| Long-Term Municipal Bonds | 127.9% |
| Other Asset Less Liabilities | 2.4% |
| Net Asset Plus VMTP Shares, at Liquidation Value | 130.3% |
| VMTP Shares, at Liquidation Value | (30.3)% |
| Net Assets | 100% |
| Credit Quality | |
(% of total investment exposure)1 | |
| AAA/U.S. Guaranteed | 4.1% |
| AA | 35.4% |
| A | 22.4% |
| BBB | 17.3% |
| BB or Lower | 12.3% |
| N/R (not rated) | 8.5% |
| Total | 100% |
| Portfolio Composition | |
(% of total investments)1 | |
| Tax Obligation/Limited | 17.5% |
| Utilities | 17.3% |
| Health Care | 14.5% |
| Transportation | 13.4% |
| Tax Obligation/General | 8.3% |
| Education and Civic Organizations | 8.0% |
| Consumer Staples | 5.6% |
| Water and Sewer | 4.5% |
| Other | 10.9% |
| Total | 100% |
| States and Territories | |
(as a % of total investments)1 | |
| California | 10.6% |
| Illinois | 10.0% |
| Texas | 7.8% |
| Florida | 7.1% |
| Michigan | 6.3% |
| New Jersey | 5.2% |
| Tennessee | 4.9% |
| New York | 3.9% |
| Ohio | 3.8% |
| Pennsylvania | 3.3% |
| Georgia | 3.0% |
| Colorado | 3.0% |
| Alabama | 2.6% |
| Arizona | 2.5% |
| Iowa | 2.2% |
| Missouri | 2.2% |
| Mississippi | 2.0% |
| Other | 19.6% |
| Total | 100% |
| 1 | | Excluding investments in derivatives. |
| NID | | |
| | Nuveen Intermediate Duration Municipal Term Fund | |
| | Portfolio of Investments | November 30, 2015 (Unaudited) |
| | Principal
Amount (000) | | Description (1) | Optional Call Provisions (2) | | Ratings (3) | | | Value | |
| | | | LONG-TERM INVESTMENTS – 125.5% (99.8 of Total Investments) | | | | | | | |
| | | | MUNICIPAL BONDS – 125.5% (99.8% 0f Total Investments) | | | | | | | |
| | | | Alabama – 3.2% (2.6% of Total Investments) | | | | | | | |
| $ | 235 | | Jefferson County Public Building Authority, Alabama, Lease Revenue Warrants, Series 2006, 5.125%, 4/01/21 – AMBAC Insured | 4/16 at 100.00 | | B1 | | $ | 233,470 | |
| | 7,000 | | Jefferson County, Alabama, General Obligation Refunding Warrants, Series 2003A, 5.000%, 4/01/22 – NPFG Insured | 4/16 at 100.00 | | AA– | | | 7,002,660 | |
| | 665 | | Jefferson County, Alabama, General Obligation Warrants, Series 2004A, 5.000%, 4/01/18 – NPFG Insured | 4/16 at 100.00 | | AA– | | | 665,791 | |
| | | | Jefferson County, Alabama, Limited Obligation School Warrants, Education Tax Revenue Bonds, Series 2004A: | | | | | | | |
| | 625 | | 5.250%, 1/01/16 | No Opt. Call | | A– | | | 628,644 | |
| | 10,000 | | 5.250%, 1/01/20 | 1/16 at 100.00 | | A– | | | 10,058,300 | |
| | 200 | | 5.500%, 1/01/22 – AGM Insured | 1/16 at 100.00 | | AA | | | 201,166 | |
| | 2,000 | | 5.250%, 1/01/23 | 1/16 at 100.00 | | A– | | | 2,011,660 | |
| | 20,725 | | Total Alabama | | | | | | 20,801,691 | |
| | | | Alaska – 0.3% (0.2% of Total Investments) | | | | | | | |
| | 2,000 | | Northern Tobacco Securitization Corporation, Alaska, Tobacco Settlement Asset-Backed Bonds, Series 2006A, 5.000%, 6/01/32 | 12/15 at 100.00 | | B | | | 1,827,540 | |
| | | | Arizona – 1.5% (1.2% of Total Investments) | | | | | | | |
| | 895 | | Arizona Health Facilities Authority, Health Care Facilities Revenue Bonds, The Beatitudes Campus Project, Series 2006, 5.100%, 10/01/22 | 10/16 at 100.00 | | N/R | | | 900,128 | |
| | 2,000 | | Arizona Health Facilities Authority, Hospital System Revenue Bonds, Phoenix Children's Hospital, Refunding Series 2012A, 5.000%, 2/01/27 | 2/22 at 100.00 | | BBB+ | | | 2,195,300 | |
| | | | Downtown Phoenix Hotel Corporation, Arizona, Senior Revenue Bonds, Series 2005A: | | | | | | | |
| | 260 | | 4.125%, 7/01/19 (Pre-refunded 1/01/16) – FGIC Insured | 1/16 at 100.00 | | BB (4) | | | 260,809 | |
| | 300 | | 5.250%, 7/01/25 (Pre-refunded 1/01/16) – FGIC Insured | 1/16 at 100.00 | | BB (4) | | | 301,221 | |
| | 200 | | Downtown Phoenix Hotel Corporation, Arizona, Senior Revenue Bonds, Series 2005A, 5.250%, 7/01/22 (Pre-refunded 1/01/16) – FGIC Insured | 1/16 at 100.00 | | N/R (4) | | | 200,814 | |
| | 695 | | Estrella Mountain Ranch Community Facilities District, Goodyear City, Arizona, Special Assessment Revenue Bonds, Montecito Assessment District 2, Series 2015, 4.750%, 7/01/30 | 7/25 at 100.00 | | N/R | | | 687,049 | |
| | | | Florence Town Inc., Industrial Development Authority, Arizona, Education Revenue Bonds, Legacy Traditional School Project – Queen Creek and Casa Grande Campuses, Series 2013: | | | | | | | |
| | 90 | | 4.000%, 7/01/18 | No Opt. Call | | BB | | | 91,346 | |
| | 1,050 | | 5.000%, 7/01/23 | No Opt. Call | | BB | | | 1,120,917 | |
| | 90 | | Phoenix Industrial Development Authority, Arizona, Education Revenue Bonds, Great Hearts Academies – Veritas Project, Series 2012, 6.250%, 7/01/32 | 7/21 at 100.00 | | BB | | | 96,097 | |
| | 1,000 | | Phoenix Industrial Development Authority, Arizona, Lease Revenue Bonds, Guam Facilities Foundation, Inc. Project, Series 2014, 5.125%, 2/01/34 | 2/24 at 100.00 | | B+ | | | 994,080 | |
| | 760 | | Pima County Industrial Development Authority, Arizona, Education Facility Revenue and Refunding Bonds, Edkey Charter Schools Project, Series 2013, 5.000%, 7/01/25 | 7/20 at 102.00 | | BB | | | 729,600 | |
| | 800 | | University Medical Center Corporation, Tucson, Arizona, Hospital Revenue Bonds, Series 2011, 5.000%, 7/01/19 (ETM) | No Opt. Call | | N/R (4) | | | 908,648 | |
| | 942 | | Watson Road Community Facilities District, Arizona, Special Assessment Revenue Bonds, Series 2005, 5.750%, 7/01/22 | 7/16 at 100.00 | | N/R | | | 951,090 | |
| | 9,082 | | Total Arizona | | | | | | 9,437,099 | |
| | | | California – 10.9% (8.6% of Total Investments) | | | | | | | |
| | 100 | | Alameda Corridor Transportation Authority, California, Revenue Bonds, Refunding Subordinate Lien Series 2004A, 5.300%, 10/01/23 – AMBAC Insured | No Opt. Call | | BBB+ | | | 107,319 | |
| | Principal Amount (000) | | Description (1) | Optional Call Provisions (2) | | Ratings (3) | | | Value | |
| | | | California (continued) | | | | | | | |
| $ | 2,490 | | Alvord Unified School District, Riverside County, California, General Obligation Bonds, Tender Option Bond 3306, 26.373%, 8/01/23-NPFG Insured (IF) (5) | No Opt. Call | | AA | | $ | 5,491,445 | |
| | 965 | | Antelope Valley Healthcare District, California, Revenue Bonds, Series 2011A, 6.875%, 3/01/26 | No Opt. Call | | Ba3 | | | 1,066,084 | |
| | 750 | | Bay Area Toll Authority, California, Revenue Bonds, San Francisco Bay Area Toll Bridge, Tender Option Bond Trust 4740, 3.380%, 4/01/36 (IF) (5) | 10/26 at 100.00 | | AA | | | 720,180 | |
| | 500 | | California Statewide Communities Development Authority, California, Revenue Bonds, Loma Linda University Medical Center, Series 2014A, 5.250%, 12/01/29 | 12/24 at 100.00 | | BB+ | | | 546,270 | |
| | | | California Statewide Community Development Authority, Revenue Bonds, International School of the Peninsula, Palo Alto, California, Series 2006: | | | | | | | |
| | 415 | | 5.000%, 11/01/16 | No Opt. Call | | N/R | | | 421,250 | |
| | 2,125 | | 5.000%, 11/01/21 | 11/16 at 100.00 | | N/R | | | 2,156,429 | |
| | 5,000 | | Compton Community Redevelopment Agency, California, Tax Allocation Revenue Bonds, Redevelopment Projects, Second Lien Series 2010B, 5.750%, 8/01/26 | 8/20 at 100.00 | | N/R | | | 5,381,150 | |
| | | | Golden State Tobacco Securitization Corporation, California, Tobacco Settlement Asset-Backed Bonds, Series 2007A-1: | | | | | | | |
| | 13,420 | | 4.500%, 6/01/27 | 6/17 at 100.00 | | B+ | | | 13,243,392 | |
| | 5,100 | | 5.000%, 6/01/33 | 6/17 at 100.00 | | B | | | 4,652,526 | |
| | 2,355 | | Hesperia Public Financing Authority, California, Redevelopment and Housing Projects Tax Allocation Bonds, Series 2007A, 5.500%, 9/01/17 – SYNCORA GTY Insured | No Opt. Call | | N/R | | | 2,454,522 | |
| | 310 | | Indio Redevelopment Agency, California, Tax Allocation Bonds, Merged Area Redevelopment Project, Subordinate Lien Refunding Series 2008A, 5.000%, 8/15/23 | 8/18 at 100.00 | | BBB– | | | 329,074 | |
| | 250 | | National City Community Development Commission, California, Tax Allocation Bonds, National City Redevelopment Project, Series 2011, 7.000%, 8/01/32 | 8/21 at 100.00 | | A– | | | 313,358 | |
| | | | Palm Desert Financing Authority, California, Tax Allocation Revenue Bonds, Project Area 2, Series 2006D: | | | | | | | |
| | 1,020 | | 0.000%, 8/01/18 | No Opt. Call | | N/R | | | 882,320 | |
| | 1,165 | | 0.000%, 8/01/19 | No Opt. Call | | N/R | | | 950,034 | |
| | 1,310 | | 0.000%, 8/01/20 | No Opt. Call | | N/R | | | 1,006,814 | |
| | 1,450 | | 0.000%, 8/01/21 | No Opt. Call | | N/R | | | 1,046,886 | |
| | | | Palomar Pomerado Health Care District, California, Certificates of Participation, Series 2009: | | | | | | | |
| | 2,430 | | 5.500%, 11/01/19 | No Opt. Call | | Ba1 | | | 2,644,083 | |
| | 5,000 | | 6.625%, 11/01/29 | 11/19 at 100.00 | | Ba1 | | | 5,516,400 | |
| | 700 | | Redwood City, California, Special Tax Refunding Bonds, Redwood Shores Community Facilities District 99-1, Shores Transportation Improvement Project, Series 2012B, 5.000%, 9/01/29 | No Opt. Call | | N/R | | | 764,827 | |
| | 340 | | Riverside County, California, Special Tax Bonds, Community Facilities District 05-8 Scott Road, Series 2013, 4.000%, 9/01/21 | No Opt. Call | | N/R | | | 367,979 | |
| | 500 | | Roseville, California, Special Tax Bonds, Community Facilities District 1 Westbrook, Series 2014, 5.000%, 9/01/29 | 9/24 at 100.00 | | N/R | | | 512,065 | |
| | 2,395 | | San Bernardino Joint Powers Financing Authority, California, Tax Allocation Bonds, Series 2005A, 5.750%, 10/01/24 – AGM Insured | No Opt. Call | | AA | | | 2,881,137 | |
| | 260 | | San Diego, California, Community Facilities District 3 Liberty Station Special Tax Refunding Bonds Series 2013, 5.000%, 9/01/20 | No Opt. Call | | N/R | | | 292,874 | |
| | 100 | | San Jose Redevelopment Agency, California, Tax Allocation Bonds, Merged Area Redevelopment Project, Refunding Series 2006D, 5.000%, 8/01/18 – AMBAC Insured | 8/17 at 100.00 | | BBB+ | | | 106,572 | |
| | 420 | | San Jose Redevelopment Agency, California, Tax Allocation Bonds, Merged Area Redevelopment Project, Series 2003, 5.000%, 8/01/25 – FGIC Insured | 2/16 at 100.00 | | AA– | | | 426,703 | |
| | 550 | | San Jose Redevelopment Agency, California, Tax Allocation Bonds, Merged Area Redevelopment Project, Series 2007B, 5.000%, 8/01/19 – SYNCORA GTY Insured | No Opt. Call | | BBB+ | | | 584,914 | |
| | 1,500 | | Tejon Ranch Public Facilities Financing Authority, California, Community Facilities District 2008-1 Tejon Industrial Complex East 2012A, 5.000%, 9/01/32 | No Opt. Call | | N/R | | | 1,592,880 | |
| | 1,500 | | Tejon Ranch Public Facilities Financing Authority, California, Community Facilities District 2008-1 Tejon Industrial Complex East 2012B, 5.000%, 9/01/32 | No Opt. Call | | N/R | | | 1,592,880 | |
| NID | Nuveen Intermediate Duration Municipal Term Fund | |
| | Portfolio of Investments (continued) | November 30, 2015 (Unaudited) |
| | | | | | | | | | | |
| | Principal
Amount (000) | | Description (1) | Optional Call Provisions (2) | | Ratings (3) | | | Value | |
| | | | California (continued) | | | | | | | |
| $ | 10,000 | | Tobacco Securitization Authority of Northern California, Tobacco Settlement Asset-Backed Bonds, Refunding Series 2005A-2, 5.400%, 6/01/27 | 6/17 at 100.00 | | B+ | | $ | 9,774,100 | |
| | 1,520 | | Tobacco Securitization Authority of Northern California, Tobacco Settlement Asset-Backed Bonds, Series 2005A-1, 4.750%, 6/01/23 | 12/15 at 100.00 | | B+ | | | 1,519,985 | |
| | 120 | | Vernon, California, Electric System Revenue Bonds, Series 2009A, 5.125%, 8/01/21 (Pre-refunded 8/01/19) | 8/19 at 100.00 | | N/R (4) | | | 132,390 | |
| | 280 | | Vernon, California, Electric System Revenue Bonds, Series 2009A, 5.125%, 8/01/21 | 8/19 at 100.00 | | A– | | | 309,095 | |
| | 66,340 | | Total California | | | | | | 69,787,937 | |
| | | | Colorado – 4.5% (3.6% of Total Investments) | | | | | | | |
| | 505 | | Bromley Park Metropolitan District 2, Brighton, Colorado, General Obligation Bonds, Refunding Series 2007A, 4.375%, 12/01/18 – RAAI Insured | 12/17 at 100.00 | | AA | | | 520,882 | |
| | 2,120 | | Bromley Park Metropolitan District 3, Brighton, Colorado, General Obligation Bonds, Refunding & Improvement Series 2007, 4.750%, 12/01/37 – RAAI Insured | 12/17 at 100.00 | | AA | | | 2,165,432 | |
| | 4,005 | | Castle Oaks Metropolitan District, Castle Rock, Douglas County, Colorado, General Obligation Limited Tax Bonds, Refunding & Improvement Series 2012, 5.500%, 12/01/22 (Pre-refunded 12/01/17) | 12/17 at 100.00 | | N/R (4) | | | 4,017,815 | |
| | 765 | | Colorado Educational and Cultural Facilities Authority, Charter School Revenue Bonds, Academy of Charter Schools Project, Series 2010B, 6.125%, 11/01/20 | No Opt. Call | | B | | | 812,009 | |
| | 500 | | Colorado Educational and Cultural Facilities Authority, Charter School Revenue Bonds, Flagstaff Academy Project, Series 2008A, 6.750%, 8/01/28 | 8/18 at 100.00 | | N/R | | | 524,050 | |
| | 165 | | Colorado Educational and Cultural Facilities Authority, Charter School Revenue Bonds, Littleton Preparatory Charter School, Series 2013, 5.000%, 12/01/22 | No Opt. Call | | BB+ | | | 178,126 | |
| | 975 | | Colorado Health Facilities Authority, Colorado, Revenue Bonds, Total Long-Term Care National Obligated Group Project, Series 2010A, 5.250%, 11/15/20 | No Opt. Call | | A | | | 1,050,407 | |
| | 889 | | Colorado Housing and Finance Authority, Revenue Bonds, Confluence Energy LLC Project, Series 2013, 6.875%, 10/01/27 (Alternative Minimum Tax) | No Opt. Call | | N/R | | | 907,023 | |
| | 3,270 | | Colorado Springs, Colorado, Utilities System Revenue Bonds, Tender Option Bond Trust 2015-XF0223, 14.092%, 10/01/20 (IF) | No Opt. Call | | AA | | | 4,213,199 | |
| | | | Colorado State Board of Governors, Colorado State University Auxiliary Enterprise System Revenue Bonds, Tender Option Bond Trust 3316: | | | | | | | |
| | 100 | | 22.846%, 9/01/22 (IF) (5) | No Opt. Call | | Aa2 | | | 212,250 | |
| | 300 | | 22.846%, 3/01/23 (IF) (5) | No Opt. Call | | Aa2 | | | 652,080 | |
| | 430 | | 22.795%, 3/01/24 (IF) (5) | No Opt. Call | | Aa2 | | | 943,618 | |
| | 725 | | 22.846%, 3/01/25 (IF) (5) | No Opt. Call | | Aa2 | | | 1,576,259 | |
| | 200 | | 22.846%, 9/01/25 (IF) (5) | No Opt. Call | | Aa2 | | | 422,250 | |
| | 3,385 | | Denver Convention Center Hotel Authority, Colorado, Revenue Bonds, Convention Center Hotel, Senior Lien Series 2006, 5.125%, 12/01/24 – SYNCORA GTY Insured | 11/16 at 100.00 | | BBB– | | | 3,497,450 | |
| | 860 | | Fitzsimons Village Metropolitan District 3, Arapahoe County, Colorado, Tax Increment/Public Improvement Fee Supported Revenue Bonds, Series 2014A, 5.750%, 3/01/32 | No Opt. Call | | N/R | | | 870,045 | |
| | 250 | | Lincoln Park Metropolitan District, Douglas County, Colorado, General Obligation Refunding and Improvement Bonds, Series 2008, 5.625%, 12/01/20 (Pre-refunded 12/01/17) | 12/17 at 100.00 | | N/R (4) | | | 273,323 | |
| | 225 | | North Range Metropolitan District 1, Adams County, Colorado, Limited Tax General Obligation Bonds, Refunding Series 2007, 4.300%, 12/15/19 – ACA Insured | 12/16 at 100.00 | | N/R | | | 226,296 | |
| | | | Plaza Metropolitan District 1, Lakewood, Colorado, Tax Increment Revenue Bonds, Refunding Series 2013: | | | | | | | |
| | 500 | | 5.000%, 12/01/18 | No Opt. Call | | N/R | | | 527,945 | |
| | 1,000 | | 5.000%, 12/01/21 | No Opt. Call | | N/R | | | 1,078,450 | |
| | 590 | | Rendezvous Residential Metropolitan District, Colorado, Limited Tax General Obligation Bonds, Refunding Series 2007, 5.200%, 12/01/17 | No Opt. Call | | N/R | | | 548,547 | |
| | Principal Amount (000) | | Description (1) | Optional Call Provisions (2) | | Ratings (3) | | | Value | |
| | | | Colorado (continued) | | | | | | | |
| $ | 3,150 | | Westminster Economic Development Authority, Colorado, Tax Increment Revenue Bonds, Mandalay Gardens Urban Renewal Project, Series 2012, 5.000%, 12/01/27 | No Opt. Call | | A | | $ | 3,523,433 | |
| | 24,909 | | Total Colorado | | | | | | 28,740,889 | |
| | | | Connecticut – 0.1% (0.1% of Total Investments) | | | | | | | |
| | 6,579 | | Mashantucket Western Pequot Tribe, Connecticut, Special Revenue Bonds, Subordinate Series 2013A, 6.050%, 7/01/31 (6) | No Opt. Call | | N/R | | | 434,018 | |
| | | | District of Columbia – 0.7% (0.6% of Total Investments) | | | | | | | |
| | | | District of Columbia Student Dormitory Revenue Bonds, Provident Group – Howard Properties LLC Issue, Series 2013: | | | | | | | |
| | 500 | | 4.000%, 10/01/19 | No Opt. Call | | BB+ | | | 509,660 | |
| | 500 | | 4.000%, 10/01/20 | No Opt. Call | | BB+ | | | 508,000 | |
| | 670 | | 4.000%, 10/01/21 | No Opt. Call | | BB+ | | | 676,667 | |
| | | | District of Columbia, Tax Increment Revenue Bonds, Gallery Place Project, Tender Option Bond Trust 1187: | | | | | | | |
| | 745 | | 21.005%, 6/01/29 (IF) (5) | 6/21 at 100.00 | | Aa3 | | | 1,105,841 | |
| | 785 | | 20.927%, 6/01/30 (IF) (5) | 6/21 at 100.00 | | Aa3 | | | 1,137,520 | |
| | 520 | | 21.005%, 6/01/31 (IF) (5) | 6/21 at 100.00 | | Aa3 | | | 747,578 | |
| | 3,720 | | Total District of Columbia | | | | | | 4,685,266 | |
| | | | Florida – 12.5% (9.9% of Total Investments) | | | | | | | |
| | 1,735 | | Arborwood Community Development District, Florida, Capital Improvement Revenue Bonds, Master Infrastructure Projects, Series 2005A-2, 5.350%, 5/01/36 | No Opt. Call | | N/R | | | 1,735,347 | |
| | | | Atlantic Beach, Florida, Healthcare Facilities Revenue Refunding Bonds, Fleet Landing Project, Series 2013A: | | | | | | | |
| | 425 | | 5.000%, 11/15/20 | No Opt. Call | | BBB | | | 471,249 | |
| | 150 | | 5.000%, 11/15/23 | No Opt. Call | | BBB | | | 168,347 | |
| | 795 | | Ave Maria Stewardship Community District, Florida, Capital Improvement Revenue Bonds, Series 2015, 5.000%, 5/01/30 | 5/25 at 100.00 | | N/R | | | 795,557 | |
| | 125 | | Boynton Beach, Florida, Revenue Bonds, Charter Schools of Boynton Beach, Series 2012A, 5.750%, 6/01/22 (6) | No Opt. Call | | CC | | | 56,241 | |
| | 7,200 | | Cape Coral Health Facilities Authority, Florida, Senior Housing Revenue Bonds, Gulf Care Inc. Project, Series 2015, 5.750%, 7/01/30 | 7/25 at 100.00 | | N/R | | | 7,435,223 | |
| | 430 | | Capital Projects Finance Authority, Student Housing Revenue Bonds, Capital Projects Loan Program – Florida Universities, Series 2001F, 5.000%, 10/01/31 – NPFG Insured | 2/16 at 100.00 | | AA– | | | 429,961 | |
| | 2,295 | | Capital Trust Agency, Florida, Fixed Rate Air Cargo Revenue Refunding Bonds, Aero Miami FX, LLC Project, Series 2010A, 5.350%, 7/01/29 | 7/20 at 100.00 | | Baa3 | | | 2,510,523 | |
| | 1,000 | | Collier County Educational Facilities Authority, Florida, Revenue Bonds, Ave Maria University, Refunding Series 2013A, 4.500%, 6/01/23 | No Opt. Call | | BBB– | | | 1,053,840 | |
| | 3,000 | | Collier County Industrial Development Authority, Florida, Continuing Care Community Revenue Bonds, Arlington of Naples Project, TEMPS 70 Series 2014B-2, 6.500%, 5/15/20 | 5/16 at 100.00 | | N/R | | | 3,004,650 | |
| | 2,845 | | Florida Development Finance Corporation, Educational Facilities Revenue Bonds, Renaissance Charter School, Inc. Projects, Series 2011A, 6.500%, 6/15/21 | No Opt. Call | | BB– | | | 3,143,782 | |
| | 1,025 | | Grand Bay at Doral Community Development District, Miami-Dade County, Florida, Special Assessment Bonds, Doral Breeze Project Series 2012, 5.125%, 11/01/22 | No Opt. Call | | N/R | | | 1,074,497 | |
| | | | Jacksonville Economic Development Commission, Florida, Health Care Facilities Revenue Bonds, Florida Proton Therapy Institute Project, Series 2007A: | | | | | | | |
| | 350 | | 6.000%, 9/01/17 | No Opt. Call | | N/R | | | 375,428 | |
| | 1,500 | | 6.250%, 9/01/27 | 9/17 at 100.00 | | N/R | | | 1,582,020 | |
| | | | Lake Powell Residential Golf Community Development District, Bay County, Florida, Special Assessment Revenue Refunding Bonds, Series 2012: | | | | | | | |
| | 1,170 | | 5.250%, 11/01/22 | No Opt. Call | | N/R | | | 1,234,186 | |
| | 1,310 | | 5.750%, 11/01/32 | No Opt. Call | | N/R | | | 1,378,788 | |
| NID | Nuveen Intermediate Duration Municipal Term Fund | |
| | Portfolio of Investments (continued) | November 30, 2015 (Unaudited) |
| | Principal Amount (000) | | Description (1) | Optional Call Provisions (2) | | Ratings (3) | | | Value | |
| | | | Florida (continued) | | | | | | | |
| $ | 2,330 | | Lee County Industrial Development Authority, Florida, Charter School Revenue Bonds, Lee County Community Charter Schools, Series 2007A, 5.250%, 6/15/27 | 6/17 at 100.00 | | BB | | $ | 2,368,888 | |
| | 1,000 | | Lee County Industrial Development Authority, Florida, Healthcare Facilities Revenue Bonds, Shell Point/Alliance Obligated Group, Shell Point Village/Alliance Community Project, Series 2007, 5.000%, 11/15/22 | 5/17 at 100.00 | | BBB– | | | 1,048,630 | |
| | 1,000 | | Live Oak Community Development District 2, Hillsborough County, Florida, Special Assessment Bonds. Series 2004A, 5.850%, 5/01/35 | 5/16 at 100.00 | | N/R | | | 1,000,740 | |
| | 405 | | Madison County, Florida, First Mortgage Revenue Bonds, Twin Oaks Project, Series 2005A, 6.000%, 7/01/25 (6) | 1/16 at 100.00 | | N/R | | | 264,538 | |
| | 5,615 | | Martin County Industrial Development Authority, Florida, Industrial Development Revenue Refunding Bonds, Indiantown Cogeneration LP, Series 2013, 3.950%, 12/15/21 (Alternative Minimum Tax) | 6/20 at 100.00 | | Ba1 | | | 5,820,508 | |
| | | | Miami-Dade County Expressway Authority, Florida, Toll System Revenue Bonds, Tender Option Bond Trust 1156: | | | | | | | |
| | 700 | | 21.136%, 7/01/22 (IF) (5) | No Opt. Call | | A2 | | | 1,359,225 | |
| | 820 | | 21.136%, 7/01/23 (IF) (5) | 7/22 at 100.00 | | A2 | | | 1,586,618 | |
| | 1,115 | | 21.136%, 7/01/24 (IF) (5) | 7/22 at 100.00 | | A2 | | | 2,078,360 | |
| | 800 | | 21.136%, 7/01/25 (IF) (5) | 7/22 at 100.00 | | A2 | | | 1,457,840 | |
| | 1,230 | | Miromar Lakes Community Development District, Lee County, Florida, Capital Improvement Revenue Bonds, Refunding Series 2012, 4.875%, 5/01/22 | No Opt. Call | | N/R | | | 1,317,010 | |
| | 2,200 | | North Springs Improvement District, Broward County, Florida, Special Assessment Bonds, Parkland Golf and Country Club Area A, Series 2005-A1, 5.450%, 5/01/26 | 5/16 at 100.00 | | N/R | | | 2,201,056 | |
| | 1,990 | | Northern Palm Beach County Improvement District, Florida, Water Control and Improvement Bonds, Development Unit 16, Refunding Series 2012, 5.125%, 8/01/22 | 8/16 at 100.00 | | N/R | | | 2,091,271 | |
| | 500 | | Palm Beach County Health Facilities Authority, Florida, Hospital Revenue Bonds, BRCH Corporation Obligated Group, Refunding Series 2014, 5.000%, 12/01/25 | 12/24 at 100.00 | | BBB+ | | | 578,845 | |
| | 900 | | Palm Beach County Health Facilities Authority, Florida, Revenue Bonds, Jupiter Medical Center, Series 2013A, 5.000%, 11/01/33 | 11/22 at 100.00 | | BBB+ | | | 965,430 | |
| | 1,900 | | Palm Glades Community Development District, Florida, Special Assessment Bonds, Series 2011B, 7.250%, 8/01/16 | No Opt. Call | | N/R | | | 1,925,099 | |
| | 725 | | Pelican Marsh Community Development District, Florida, Special Assessment Revenue Bonds, Refunding Series 2013, 3.500%, 5/01/19 | No Opt. Call | | N/R | | | 746,098 | |
| | 2,150 | | Seminole Tribe of Florida, Special Obligation Bonds, Series 2007A, 144A, 5.500%, 10/01/24 | 10/17 at 100.00 | | BBB– | | | 2,265,692 | |
| | 1,735 | | South-Dade Venture Community Development District, Florida, Special Assessment Revenue Bonds, Refunding Series 2012, 5.000%, 5/01/26 | No Opt. Call | | BBB– | | | 1,868,439 | |
| | 1,130 | | Stonegate Community Development District, Florida, Special Assessment Revenue Bonds, Refunding Series 2013, 4.000%, 5/01/25 | 5/23 at 100.00 | | N/R | | | 1,173,189 | |
| | | | Sumter County Industrial Development Authority, Florida, Hospital Revenue Bonds, Central Florida Health Alliance Projects, Series 2014B: | | | | | | | |
| | 2,925 | | 5.000%, 7/01/29 | 7/24 at 100.00 | | A– | | | 3,285,945 | |
| | 2,350 | | 5.000%, 7/01/30 | 7/24 at 100.00 | | A– | | | 2,626,948 | |
| | 1,560 | | 5.000%, 7/01/31 | 7/24 at 100.00 | | A– | | | 1,738,932 | |
| | 1,400 | | 5.000%, 7/01/32 | 7/24 at 100.00 | | A– | | | 1,553,986 | |
| | | | Tampa-Hillsborough County Expressway Authority, Florida, Revenue Bonds, Tender Option Bond Trust 1132: | | | | | | | |
| | 400 | | 21.035%, 7/01/27 (IF) (5) | 7/22 at 100.00 | | A | | | 687,500 | |
| | 290 | | 21.035%, 7/01/28 (IF) (5) | 7/22 at 100.00 | | A | | | 490,434 | |
| | 1,000 | | 16.086%, 7/01/29 (IF) (5) | 7/22 at 100.00 | | A | | | 1,339,850 | |
| | 1,000 | | 16.086%, 7/01/30 (IF) (5) | 7/22 at 100.00 | | A | | | 1,315,150 | |
| | 1,000 | | 21.035%, 7/01/31 (IF) (5) | 7/22 at 100.00 | | A | | | 1,625,300 | |
| | 1,855 | | Tolomato Community Development District, Florida, Special Assessment Bonds, Series 2006, 5.400%, 5/01/37 | 5/16 at 100.00 | | N/R | | | 1,856,391 | |
| | Principal Amount (000) | | Description (1) | Optional Call Provisions (2) | | Ratings (3) | | | Value | |
| | | | Florida (continued) | | | | | | | |
| $ | 1,890 | | Venetian Community Development District, Sarasota County, Florida, Capital Improvement Revenue Bonds, Series 2012-A2, 5.000%, 5/01/23 | 5/22 at 100.00 | | N/R | | $ | 2,012,604 | |
| | 2,525 | | Verandah West Community Development District, Florida, Capital Improvement Revenue Bonds, Refunding Series 2013, 4.000%, 5/01/23 | No Opt. Call | | N/R | | | 2,510,153 | |
| | 630 | | Vizcaya in Kendall Community Development District, Florida, Special Assessment Revenue Bonds, Phase Two Assessment Area, Refunding Series 2012A-2, 5.600%, 5/01/22 | No Opt. Call | | N/R | | | 665,217 | |
| | 72,425 | | Total Florida | | | | | | 80,275,525 | |
| | | | Georgia – 1.5% (1.2% of Total Investments) | | | | | | | |
| | 2,000 | | Clayton County Development Authority, Georgia, Special Facilities Revenue Bonds, Delta Air Lines, Inc. Project, Series 2009A, 8.750%, 6/01/29 | 6/20 at 100.00 | | BB | | | 2,448,860 | |
| | | | Fulton County Residential Care Facilities Elderly Authority, Georgia, First Mortgage Revenue Bonds, Lenbrook Project, Series 2006A: | | | | | | | |
| | 2,300 | | 5.000%, 7/01/17 | No Opt. Call | | N/R | | | 2,356,994 | |
| | 4,500 | | 5.000%, 7/01/27 | 7/17 at 100.00 | | N/R | | | 4,557,285 | |
| | 8,800 | | Total Georgia | | | | | | 9,363,139 | |
| | | | Guam – 2.7% (2.1% of Total Investments) | | | | | | | |
| | 500 | | Government of Guam, Hotel Occupancy Tax Revenue Bonds, Series 2011A, 5.000%, 11/01/16 | No Opt. Call | | A– | | | 519,615 | |
| | | | Guam Government Department of Education, Certificates of Participation, John F. Kennedy High School Project, Series 2010A: | | | | | | | |
| | 1,500 | | 6.000%, 12/01/20 | No Opt. Call | | B+ | | | 1,616,835 | |
| | 325 | | 6.875%, 12/01/40 | 12/20 at 100.00 | | B+ | | | 356,567 | |
| | 2,000 | | Guam Government Waterworks Authority, Water and Wastewater System Revenue Bonds, Series 2010, 5.250%, 7/01/25 | 7/20 at 100.00 | | A– | | | 2,208,120 | |
| | 865 | | Guam Government, General Obligation Bonds, 2009 Series A, 6.000%, 11/15/19 | No Opt. Call | | BB– | | | 958,437 | |
| | 2,500 | | Guam Government, General Obligation Bonds, 2009 Series A, 6.750%, 11/15/29 (Pre-refunded 11/15/19) | 11/19 at 100.00 | | N/R (4) | | | 3,045,375 | |
| | 2,000 | | Guam Government, General Obligation Bonds, Series 2007A, 5.000%, 11/15/23 (Pre-refunded 11/15/17) | 11/17 at 100.00 | | BB– (4) | | | 2,167,080 | |
| | 1,000 | | Guam Government, Limited Obligation Section 30 Revenue Bonds, Series 2009A, 5.375%, 12/01/24 | 12/19 at 100.00 | | BBB+ | | | 1,107,950 | |
| | 2,025 | | Guam Power Authority, Revenue Bonds, Series 2012A, 5.000%, 10/01/30 – AGM Insured | 10/22 at 100.00 | | AA | | | 2,371,761 | |
| | 1,100 | | Guam Waterworks Authority, Water and Wastewater System Revenue Bonds, Refunding Series 2014A, 5.000%, 7/01/29 | 7/24 at 100.00 | | A– | | | 1,227,908 | |
| | 1,365 | | Guam Waterworks Authority, Water and Wastewater System Revenue Bonds, Series 2013, 5.250%, 7/01/24 | 7/23 at 100.00 | | A– | | | 1,588,573 | |
| | 15,180 | | Total Guam | | | | | | 17,168,221 | |
| | | | Hawaii – 1.3% (1.0% of Total Investments) | | | | | | | |
| | 6,070 | | Hawaii Department of Budget and Finance, Special Purpose Revenue Bonds, Hawaii Pacific University, Series 2015, 5.000%, 7/01/20 | No Opt. Call | | N/R | | | 6,166,818 | |
| | 620 | | Hawaii Housing Finance and Development Corporation, Multifamily Housing Revenue Bonds, Wilikina Apartments Project, Series 2012A, 4.250%, 5/01/22 | No Opt. Call | | BB+ | | | 616,540 | |
| | 1,550 | | Hawaii State Department of Transportation, Special Facility Revenue Bonds, Continental Airlines Inc., Series 1997, 5.625%, 11/15/27 | 5/16 at 100.00 | | BB– | | | 1,549,938 | |
| | 8,240 | | Total Hawaii | | | | | | 8,333,296 | |
| | | | Idaho – 0.7% (0.6% of Total Investments) | | | | | | | |
| | 4,645 | | Madison County, Idaho, Hospital Revenue Certificates of Participation, Madison Memorial Hospital, Series 2006, 5.250%, 9/01/26 | 9/16 at 100.00 | | BB+ | | | 4,692,007 | |
| | | | Illinois – 11.5% (9.2% of Total Investments) | | | | | | | |
| | 1,070 | | Bellwood, Illinois, General Obligation Bonds, Series 2008, 7.000%, 12/01/29 (Pre-refunded 12/01/16) | 12/16 at 100.00 | | N/R (4) | | | 1,140,577 | |
| | 9,115 | | CenterPoint Intermodal Center Program Trust, Illinois, Class A Certificates, Series 2004, 3.840%, 6/15/23 | 12/15 at 100.00 | | N/R | | | 9,115,000 | |
| NID | Nuveen Intermediate Duration Municipal Term Fund | |
| | Portfolio of Investments (continued) | November 30, 2015 (Unaudited) |
| | Principal Amount (000) | | Description (1) | Optional Call Provisions (2) | | Ratings (3) | | | Value | |
| | | | Illinois (continued) | | | | | | | |
| $ | 2,719 | | Chicago, Illinois, Certificates of Participation Tax Increment Bonds, 35th and State Redevelopment Project, Series 2012, 6.100%, 1/15/29 | No Opt. Call | | N/R | | $ | 2,728,383 | |
| | 279 | | Chicago, Illinois, Certificates of Participation Tax Increment Bonds, MetraMarket Project, Series 2010, 6.870%, 2/15/24 | 5/16 at 100.00 | | Ba2 | | | 280,043 | |
| | 900 | | Chicago, Illinois, Certificates of Participation, Tax Increment Allocation Revenue Bonds, Diversey-Narragansett Project, Series 2006, 7.460%, 2/15/26 | 1/16 at 100.00 | | N/R | | | 652,311 | |
| | 1,500 | | Chicago, Illinois, General Obligation Bonds, Project and Refunding Series 2003B, 5.000%, 1/01/20 | No Opt. Call | | BBB+ | | | 1,582,005 | |
| | | | Cook County, Illinois, General Obligation Bonds, Tender Option Bond Trust 2015-XF0124: | | | | | | | |
| | 1,000 | | 20.840%, 11/15/20 (IF) (5) | No Opt. Call | | AA | | | 1,366,900 | |
| | 3,040 | | 20.840%, 11/15/20 (IF) (5) | No Opt. Call | | AA | | | 3,945,616 | |
| | 1,000 | | Cook County, Illinois, Recovery Zone Facility Revenue Bonds, Navistar International Corporation Project, Series 2010, 6.500%, 10/15/40 | 10/20 at 100.00 | | Caa1 | | | 939,130 | |
| | | | Illinois Finance Authority, Charter School Revenue Bonds, Chicago Charter School Foundation, Series 2007: | | | | | | | |
| | 1,650 | | 5.000%, 12/01/21 | 12/16 at 100.00 | | BBB | | | 1,692,389 | |
| | 4,000 | | 5.000%, 12/01/26 | 12/16 at 100.00 | | BBB | | | 4,048,160 | |
| | 5,530 | | Illinois Finance Authority, Recovery Zone Facility Revenue Bonds, Navistar International Corporation Project, Series 2010, 6.500%, 10/15/40 | 10/20 at 100.00 | | Caa1 | | | 5,173,148 | |
| | | | Illinois Finance Authority, Revenue Bonds, Centegra Health System, Tender Option Bond Trust 1122: | | | | | | | |
| | 480 | | 20.692%, 9/01/21 (IF) (5) | No Opt. Call | | BBB | | | 765,317 | |
| | 330 | | 20.654%, 9/01/21 (IF) (5) | No Opt. Call | | BBB | | | 525,782 | |
| | 435 | | 20.637%, 9/01/22 (IF) (5) | No Opt. Call | | BBB | | | 700,224 | |
| | 3,525 | | Illinois Finance Authority, Revenue Bonds, Friendship Village of Schaumburg, Series 2005A, 5.375%, 2/15/25 | 2/16 at 100.00 | | BB– | | | 3,525,388 | |
| | | | Illinois Finance Authority, Revenue Bonds, Illinois Institute of Technology, Refunding Series 2006A: | | | | | | | |
| | 2,680 | | 5.000%, 4/01/24 | 4/16 at 100.00 | | Baa3 | | | 2,685,735 | |
| | 1,950 | | 5.000%, 4/01/26 | 4/16 at 100.00 | | Baa3 | | | 1,952,925 | |
| | | | Illinois Finance Authority, Revenue Bonds, Ingalls Health System, Series 2013: | | | | | | | |
| | 650 | | 4.000%, 5/15/18 | No Opt. Call | | Baa1 | | | 681,239 | |
| | 770 | | 4.000%, 5/15/19 | No Opt. Call | | Baa1 | | | 815,784 | |
| | 895 | | 5.000%, 5/15/20 | No Opt. Call | | Baa1 | | | 990,112 | |
| | 1,035 | | 5.000%, 5/15/21 | No Opt. Call | | Baa1 | | | 1,155,391 | |
| | 1,210 | | 5.000%, 5/15/22 | No Opt. Call | | Baa1 | | | 1,357,487 | |
| | 1,575 | | 5.000%, 5/15/24 | 5/22 at 100.00 | | Baa1 | | | 1,732,973 | |
| | 500 | | Illinois Finance Authority, Revenue Bonds, Montgomery Place Project, Series 2006A, 5.500%, 5/15/26 | 5/17 at 100.00 | | N/R | | | 506,405 | |
| | 3,400 | | Illinois Finance Authority, Revenue Refunding Bonds, Resurrection Health Care Corporation, Series 2009, 6.125%, 5/15/25 | 5/19 at 100.00 | | BBB+ | | | 3,798,582 | |
| | 100 | | Illinois Finance Authority, Revenue Refunding Bonds, Resurrection Health Care Corporation, Series 2009, 6.125%, 5/15/25 (Pre-refunded 5/15/19) | 5/19 at 100.00 | | N/R (4) | | | 116,943 | |
| | 620 | | Illinois Finance Authority, Revenue Refunding Bonds, Swedish Covenant Hospital, Refunding Series 2010A, 5.000%, 8/15/17 | No Opt. Call | | BBB+ | | | 652,711 | |
| | 2,500 | | Illinois Sports Facility Authority, State Tax Supported Bonds, Refunding Series 2014, 5.000%, 6/15/27 – AGM Insured | 6/24 at 100.00 | | AA | | | 2,816,800 | |
| | 1,450 | | Illinois State, General Obligation Bonds, February Series 2014, 5.000%, 2/01/24 | No Opt. Call | | A– | | | 1,600,322 | |
| | | | Illinois State, General Obligation Bonds, Refunding Series 2012: | | | | | | | |
| | 1,000 | | 5.000%, 8/01/20 – AGM Insured | No Opt. Call | | AA | | | 1,113,310 | |
| | 1,750 | | 5.000%, 8/01/22 | No Opt. Call | | A– | | | 1,932,980 | |
| | 4,000 | | 5.000%, 8/01/23 – AGM Insured | No Opt. Call | | AA | | | 4,530,680 | |
| | 2,000 | | Illinois State, General Obligation Bonds, Tender Option Bond Trust 2015-XF1010, 16.705%, 8/01/23 – AGM Insured (IF) (5) | No Opt. Call | | AA | | | 3,061,360 | |
| | Principal Amount (000) | | Description (1) | Optional Call Provisions (2) | | Ratings (3) | | | Value | |
| | | | Illinois (continued) | | | | | | | |
| | | | Romeoville, Illinois, Revenue Bonds, Lewis University Project, Series 2015: | | | | | | | |
| $ | 1,100 | | 5.000%, 10/01/25 | 4/25 at 100.00 | | BBB+ | | $ | 1,274,295 | |
| | 200 | | 5.000%, 10/01/26 | 4/25 at 100.00 | | BBB+ | | | 229,500 | |
| | 2,500 | | Wauconda, Illinois, Special Service Area 1 Social Tax Bonds, Liberty Lake Project, Refunding Series 2015, 5.000%, 3/01/33 – BAM Insured | 3/25 at 100.00 | | AA | | | 2,798,275 | |
| | 68,458 | | Total Illinois | | | | | | 73,984,182 | |
| | | | Indiana – 2.6% (2.1% of Total Investments) | | | | | | | |
| | 1,250 | | Carmel, Indiana, Revenue Bonds, Barrington of Carmel Project, Series 2012A, 6.000%, 11/15/22 | No Opt. Call | | N/R | | | 1,381,025 | |
| | 4,345 | | Indiana Finance Authority, Educational Facilities Revenue Bonds, 21st Century Charter School Project, Series 2013A, 6.000%, 3/01/33 | 3/23 at 100.00 | | B+ | | | 4,248,715 | |
| | 1,000 | | Indiana Finance Authority, Educational Facilities Revenue Bonds, CFM-Northwest Indiana, LLC Project, Refunding Series 2013A, 6.250%, 7/01/23 | No Opt. Call | | BB– | | | 1,068,950 | |
| | 950 | | Indiana Finance Authority, Educational Facilities Revenue Bonds, Charter Facilities Management Indianapolis LLC Project, Series 2013A, 6.250%, 7/01/23 | No Opt. Call | | BB– | | | 1,015,503 | |
| | 760 | | Indiana Finance Authority, Educational Facilities Revenue Bonds, Drexel Foundation For Educational Excellence, Inc., Series 2009A, 6.000%, 10/01/21 | 10/19 at 100.00 | | B– | | | 740,004 | |
| | 3,785 | | Indiana Finance Authority, Environmental Improvement Revenue Bonds, United States Steel Corporation Project, Refunding Series 2010, 6.000%, 12/01/26 | 6/20 at 100.00 | | BB– | | | 2,890,188 | |
| | 6,330 | | Indiana Finance Authority, Environmental Improvement Revenue Bonds, United States Steel Corporation Project, Refunding Series 2011, 6.000%, 12/01/19 | No Opt. Call | | BB– | | | 4,887,835 | |
| | 400 | | Valparaiso, Indiana, Exempt Facilities Revenue Bonds, Pratt Paper LLC Project, Series 2013, 5.875%, 1/01/24 (Alternative Minimum Tax) | No Opt. Call | | N/R | | | 459,252 | |
| | 18,820 | | Total Indiana | | | | | | 16,691,472 | |
| | | | Iowa – 2.6% (2.0% of Total Investments) | | | | | | | |
| | 2,600 | | Iowa Finance Authority, Health Facility Revenue Bonds, Care Initiatives Project, Series 2006A, 5.500%, 7/01/25 | 7/16 at 100.00 | | BB+ | | | 2,636,192 | |
| | | | Iowa Finance Authority, Iowa, Midwestern Disaster Area Revenue Bonds, Iowa Fertilizer Company Project, Series 2013: | | | | | | | |
| | 9,320 | | 5.000%, 12/01/19 | No Opt. Call | | BB– | | | 9,875,471 | |
| | 1,150 | | 5.500%, 12/01/22 | 12/18 at 100.00 | | BB– | | | 1,212,664 | |
| | 2,100 | | 5.250%, 12/01/25 | 12/23 at 100.00 | | BB– | | | 2,293,284 | |
| | | | Iowa Higher Education Loan Authority, Private College Facility Revenue Bonds, Upper Iowa University Project, Series 2012: | | | | | | | |
| | 125 | | 3.000%, 9/01/16 | No Opt. Call | | BB | | | 125,573 | |
| | 180 | | 4.000%, 9/01/18 | No Opt. Call | | BB | | | 185,009 | |
| | 200 | | 3.000%, 9/01/19 | No Opt. Call | | BB | | | 198,890 | |
| | 15,675 | | Total Iowa | | | | | | 16,527,083 | |
| | | | Kansas – 2.0% (1.6% of Total Investments) | | | | | | | |
| | 2,000 | | Kansas Development Finance Authority Hospital Revenue Bonds, Adventist Health System Sunbelt Obligated Group, Tender Option Bond Trust 1125, 22.443%, 11/15/32 (IF) (5) | 5/22 at 100.00 | | Aa2 | | | 3,241,100 | |
| | 310 | | Kansas Development Finance Authority, Hospital Revenue Bonds, Adventist Health System Sunbelt Obligated Group, Tender Option Bond Trust 2015-XF2190. Formerly Tender Option Bond Trust 3254, 18.555%, 5/15/20 (IF) (5) | No Opt. Call | | Aa2 | | | 465,136 | |
| | 200 | | Kansas Power Pool, a Municipal Energy Agency Electric Utility Revenue Bonds, Dogwood Facility, Series 2015A, 5.000%, 12/01/28 | 12/25 at 100.00 | | A3 | | | 230,730 | |
| | 2,000 | | Overland Park, Kansas, Sales Tax Revenue Bonds, Prairiefire Community Improvement District No. 1 Project, Series 2012B, 6.100%, 12/15/34 | No Opt. Call | | N/R | | | 1,977,760 | |
| | 8,000 | | Overland Park, Kansas, Sales Tax Special Obligation Revenue Bonds, Prairiefire at Lionsgate Project, Series 2012, 5.250%, 12/15/29 | No Opt. Call | | N/R | | | 7,077,760 | |
| | 12,510 | | Total Kansas | | | | | | 12,992,486 | |
| NID | Nuveen Intermediate Duration Municipal Term Fund | |
| | Portfolio of Investments (continued) | November 30, 2015 (Unaudited) |
| | Principal Amount (000) | | Description (1) | Optional Call Provisions (2) | | Ratings (3) | | | Value | |
| | | | Louisiana – 1.5% (1.2% of Total Investments) | | | | | | | |
| $ | 1,850 | | Jefferson Parish Hospital Service District 2, Louisiana, Hospital Revenue Bonds, East Jefferson General Hospital, Refunding Series 2011, 6.250%, 7/01/26 | No Opt. Call | | BB | | $ | 1,890,811 | |
| | 1,500 | | Louisiana Local Government Environmental Facilities & Community Development Authority, Revenue Bonds, Westlake Chemical Corporation Project, Series 2007, 6.750%, 11/01/32 | 11/17 at 100.00 | | BBB+ | | | 1,623,705 | |
| | 2,265 | | Louisiana Local Government Environmental Facilities and Community Development Authority, Revenue Bonds, Capital Projects and Equipment Acquisition Program, Series 2000A, 6.300%, 7/01/30 – AMBAC Insured | No Opt. Call | | N/R (4) | | | 2,593,131 | |
| | | | Louisiana Public Facilities Authority, Revenue Bonds, Ochsner Clinic Foundation Project, Series 2011: | | | | | | | |
| | 250 | | 5.250%, 5/15/22 | No Opt. Call | | Baa1 | | | 280,593 | |
| | 500 | | 6.250%, 5/15/31 | No Opt. Call | | Baa1 | | | 594,825 | |
| | 1,000 | | Louisiana Stadium and Exposition District, Revenue Refunding Bonds, Senior Lien Series 2013A, 5.000%, 7/01/22 | No Opt. Call | | A | | | 1,189,710 | |
| | 1,000 | | New Orleans, Louisiana, Water Revenue Bonds, Refunding Series 2014, 5.000%, 12/01/21 | No Opt. Call | | A– | | | 1,165,400 | |
| | 285 | | Saint Tammany Public Trust Financing Authority, Louisiana, Revenue Bonds, Christwood Project, Refunding Series 2015, 5.250%, 11/15/29 | 11/24 at 100.00 | | N/R | | | 298,150 | |
| | 8,650 | | Total Louisiana | | | | | | 9,636,325 | |
| | | | Maine – 0.1% (0.0% of Total Investments) | | | | | | | |
| | 350 | | Maine Health and Higher Educational Facilities Authority Revenue Bonds, Eastern Maine Medical Center Obligated Group Issue, Series 2013, 5.000%, 7/01/22 | No Opt. Call | | BBB | | | 398,951 | |
| | | | Massachusetts – 1.1% (0.9% of Total Investments) | | | | | | | |
| | 1,755 | | Massachusetts Development Finance Agency, Revenue Bonds, Boston Architectural College, Series 2006, 5.000%, 1/01/27 – ACA Insured | 1/17 at 100.00 | | N/R | | | 1,772,111 | |
| | 1,990 | | Massachusetts Educational Financing Authority, Education Loan Revenue Bonds Issue K Series 2013, 5.250%, 7/01/29 (Alternative Minimum Tax) | 7/22 at 100.00 | | AA | | | 2,180,344 | |
| | 3,150 | | Massachusetts Port Authority, Special Facilities Revenue Bonds, Delta Air Lines Inc., Series 2001A, 5.000%, 1/01/27 – AMBAC Insured (Alternative Minimum Tax) | 1/16 at 100.00 | | N/R | | | 3,158,253 | |
| | 6,895 | | Total Massachusetts | | | | | | 7,110,708 | |
| | | | Michigan – 6.6% (5.2% of Total Investments) | | | | | | | |
| | 205 | | Detroit Downtown Development Authority, Michigan, Tax Increment Refunding Bonds, Development Area 1 Projects, Series 1998A, 4.750%, 7/01/25 – NPFG Insured | 1/16 at 100.00 | | AA– | | | 205,021 | |
| | | | Detroit, Michigan, General Obligation Bonds, Series 2001A-1: | | | | | | | |
| | 155 | | 5.375%, 4/01/18 – NPFG Insured | 4/16 at 100.00 | | A3 | | | 155,353 | |
| | 310 | | 5.000%, 4/01/19 | 4/16 at 100.00 | | A3 | | | 310,189 | |
| | 47 | | Detroit, Michigan, General Obligation Bonds, Series 2005A, 5.000%, 4/01/22 – AGM Insured | 4/16 at 100.00 | | AA | | | 46,862 | |
| | 100 | | Detroit, Michigan, Water Supply System Second Lien Revenue Bonds, Series 2003B, 5.000%, 7/01/34 – NPFG Insured | 1/16 at 100.00 | | AA– | | | 100,330 | |
| | 30 | | Detroit, Michigan, Water Supply System Senior Lien Revenue Bonds, Series 2003A, 5.000%, 7/01/34 – NPFG Insured | 1/16 at 100.00 | | A3 | | | 30,097 | |
| | 1,080 | | East Lansing, Michigan, Economic Development Corporation Limited Obligation Bonds, Burcham Hills Retirement Community First Mortgage, Series 2007-B1, 5.250%, 7/01/37 | 1/16 at 100.00 | | N/R | | | 1,080,302 | |
| | 1,270 | | Flint Hospital Building Authority, Michigan, Building Authority Revenue Bonds, Hurley Medical Center, Series 2013A, 5.000%, 7/01/23 | No Opt. Call | | BBB– | | | 1,316,165 | |
| | | | Michigan Finance Authority, Detroit, Michigan, Local Government Loan Program, Unlimited Tax General Obligation Bonds, Series 2014G-2A: | | | | | | | |
| | 845 | | 5.375%, 4/01/18 – NPFG Insured | 1/16 at 100.00 | | AA– | | | 846,927 | |
| | 1,690 | | 5.000%, 4/01/19 | 1/16 at 100.00 | | AA– | | | 1,691,031 | |
| | 254 | | Michigan Finance Authority, Detroit, Michigan, Local Government Loan Program, Unlimited Tax General Obligation Bonds, Series 2014G-8A, 5.000%, 4/01/22 – AGM Insured | 4/16 at 100.00 | | AA | | | 255,475 | |
| | | | Michigan Finance Authority, Local Government Loan Program Revenue Bonds, Detroit Water & Sewerage Department Water Supply System Local Project, Series 2014C-3: | | | | | | | |
| | 5,000 | | 5.000%, 7/01/24 – AGM Insured | No Opt. Call | | AA | | | 5,861,350 | |
| | 5,000 | | 5.000%, 7/01/25 – AGM Insured | 7/24 at 100.00 | | AA | | | 5,819,850 | |
| | 5,000 | | 5.000%, 7/01/26 – AGM Insured | 7/24 at 100.00 | | AA | | | 5,770,350 | |
| | Principal Amount (000) | | Description (1) | Optional Call Provisions (2) | | Ratings (3) | | | Value | |
| | | | Michigan (continued) | | | | | | | |
| | | | Michigan Finance Authority, Local Government Loan Program Revenue Bonds, Detroit Water & Sewerage Department Water Supply System Local Project, Series 2014C-7: | | | | | | | |
| $ | 2,000 | | 5.000%, 7/01/25 – NPFG Insured | 7/24 at 100.00 | | AA– | | $ | 2,298,340 | |
| | 2,000 | | 5.000%, 7/01/26 – NPFG Insured | 7/24 at 100.00 | | AA– | | | 2,280,460 | |
| | 750 | | Michigan Finance Authority, Public School Academy Limited Obligation Revenue Bonds, Old Redford Academy Project, Series 2010A, 5.250%, 12/01/20 | No Opt. Call | | BB | | | 766,358 | |
| | 340 | | Michigan Finance Authority, Public School Academy Revenue Bonds, Detroit Service Learning Academy Project, Refunding Series 2011, 6.000%, 10/01/21 | No Opt. Call | | BB– | | | 341,170 | |
| | 825 | | Michigan Finance Authority, Revenue Bonds, Trinity Health Credit Group, Tender Option Bond Trust 2015-XF0126, 22.219%, 12/01/18 (IF) (5) | No Opt. Call | | AA– | | | 1,383,335 | |
| | 535 | | Michigan Public Educational Facilities Authority, Limited Obligation Revenue Bonds, Richfield Public School Academy, Series 2007, 5.000%, 9/01/22 | 9/17 at 100.00 | | BBB– | | | 545,481 | |
| | 1,930 | | Michigan Strategic Fund, Limited Obligation Revenue Bonds, Detroit Thermal LLC Project, Series 2013, 8.500%, 12/01/30 (Alternative Minimum Tax) | 12/23 at 100.00 | | N/R | | | 1,867,043 | |
| | 7,505 | | Michigan Strategic Fund, Limited Obligation Revenue Bonds, Events Center Project, Series 2014A, 4.125%, 7/01/45 (Mandatory put 1/01/19) | 7/18 at 100.00 | | N/R | | | 7,617,425 | |
| | 1,625 | | Star International Academy, Wayne County, Michigan, Public School Academy Revenue Bonds, Refunding Series 2012, 5.000%, 3/01/33 | No Opt. Call | | BBB | | | 1,689,041 | |
| | 38,496 | | Total Michigan | | | | | | 42,277,955 | |
| | | | Minnesota – 0.6% (0.5% of Total Investments) | | | | | | | |
| | 3,500 | | Cloquet, Minnesota, Pollution Control Revenue Bonds, Potlatch Corporation, Refunding Series 1996, 5.900%, 10/01/26 | 4/16 at 100.00 | | BB | | | 3,503,605 | |
| | | | Minnesota Higher Education Facilities Authority, Revenue Bonds, Minneapolis College of Art and Design, Series 2015-8D: | | | | | | | |
| | 260 | | 4.000%, 5/01/24 | 5/23 at 100.00 | | Baa2 | | | 278,130 | |
| | 250 | | 4.000%, 5/01/26 | 5/23 at 100.00 | | Baa2 | | | 261,598 | |
| | 4,010 | | Total Minnesota | | | | | | 4,043,333 | |
| | | | Mississippi – 0.6% (0.5% of Total Investments) | | | | | | | |
| | 1,845 | | Mississippi Business Finance Corporation, Gulf Opportunity Zone Industrial Development Revenue Bonds, Northrop Grumman Ship Systems Inc. Project, Series 2006, 4.550%, 12/01/28 | 12/16 at 100.00 | | BB+ | | | 1,855,018 | |
| | | | Mississippi Development Bank Special Obligation Bonds, Marshall County Industrial Development Authority, Mississippi Highway Construction Project, Tender Option Bond Trust 3315: | | | | | | | |
| | 800 | | 22.598%, 1/01/20 (IF) (5) | No Opt. Call | | AA– | | | 1,388,000 | |
| | 500 | | 22.598%, 1/01/20 (IF) (5) | No Opt. Call | | AA– | | | 829,650 | |
| | 3,145 | | Total Mississippi | | | | | | 4,072,668 | |
| | | | Missouri – 1.5% (1.2% of Total Investments) | | | | | | | |
| | 3,500 | | Kansas City Tax Increment Financing Commission, Missouri, Tax Increment Revenue Bonds, Briarcliff West Project, Series 2006A, 5.400%, 6/01/24 | 6/16 at 100.00 | | N/R | | | 3,531,290 | |
| | 595 | | Pevely, Missouri, Neighborhood Improvement District Bonds, Southern Heights Project, Series 2004, 5.250%, 3/01/22 – RAAI Insured | 3/16 at 100.00 | | AA | | | 596,369 | |
| | 3,000 | | Poplar Bluff Regional Transportation Development District, Missouri, Transportation Sales Tax Revenue Bonds, Series 2012, 4.000%, 12/01/36 | No Opt. Call | | BBB | | | 3,081,900 | |
| | 865 | | Raymore, Missouri, Tax Increment Revenue Bonds, Raymore Galleria Project, Refunding & Improvement Series 2014A, 5.000%, 5/01/24 | 5/23 at 100.00 | | N/R | | | 909,522 | |
| | | | St. Joseph Industrial Development Authority, Missouri, Tax Increment Bonds, Shoppes at North Village Project, Series 2005B: | | | | | | | |
| | 405 | | 5.375%, 11/01/23 | 5/16 at 100.00 | | N/R | | | 405,522 | |
| | 905 | | 5.500%, 11/01/27 | 5/16 at 100.00 | | N/R | | | 905,950 | |
| | 9,270 | | Total Missouri | | | | | | 9,430,553 | |
| | | | Nebraska – 0.7% (0.6% of Total Investments) | | | | | | | |
| | 2,000 | | Central Plains Energy Project, Nebraska, Gas Project 1 Revenue Bonds, Series 2007A, 5.250%, 12/01/21 | No Opt. Call | | A | | | 2,342,500 | |
| NID | Nuveen Intermediate Duration Municipal Term Fund | |
| | Portfolio of Investments (continued) | November 30, 2015 (Unaudited) |
| | Principal Amount (000) | | Description (1) | Optional Call Provisions (2) | | Ratings (3) | | | Value | |
| | | | Nebraska (continued) | | | | | | | |
| $ | 1,445 | | Central Plains Energy Project, Nebraska, Gas Project 3 Revenue Bonds, Series 2012, 5.000%, 9/01/32 | 9/22 at 100.00 | | A | | $ | 1,592,535 | |
| | 635 | | Douglas County Hospital Authority 2, Nebraska, Hospital Revenue Bonds, Madonna Rehabilitation Hospital Project, Series 2014, 5.000%, 5/15/26 | 5/24 at 100.00 | | BBB+ | | | 725,957 | |
| | 4,080 | | Total Nebraska | | | | | | 4,660,992 | |
| | | | Nevada – 1.5% (1.2% of Total Investments) | | | | | | | |
| | 1,630 | | Carson City, Nevada, Hospital Revenue Bonds, Carson-Tahoe Regional Healthcare Project, Refunding Series 2012, 5.000%, 9/01/27 | No Opt. Call | | BBB+ | | | 1,794,875 | |
| | 620 | | Clark County, Nevada, Passenger Facility Charge Revenue Bonds, Las Vegas-McCarran International Airport, Series 2010A, 5.000%, 7/01/30 | 1/20 at 100.00 | | A+ | | | 693,656 | |
| | | | Henderson, Nevada, Limited Obligation Bonds, Local Improvement District T-13 Cornerstone, Refunding Series 2013: | | | | | | | |
| | 615 | | 4.000%, 3/01/17 | No Opt. Call | | N/R | | | 620,203 | |
| | 735 | | 4.000%, 3/01/18 | No Opt. Call | | N/R | | | 740,138 | |
| | 690 | | 4.000%, 3/01/19 | No Opt. Call | | N/R | | | 691,684 | |
| | 795 | | 5.000%, 3/01/20 | No Opt. Call | | N/R | | | 823,517 | |
| | 835 | | 5.000%, 3/01/21 | No Opt. Call | | N/R | | | 863,407 | |
| | 870 | | 5.000%, 3/01/22 | No Opt. Call | | N/R | | | 897,214 | |
| | 1,800 | | Henderson, Nevada, Limited Obligation Bonds, Local Improvement District T-18, Inspirada Series 2006, 5.150%, 9/01/21 | 3/16 at 100.00 | | N/R | | | 1,662,966 | |
| | 1,000 | | Las Vegas Redevelopment Agency, Nevada, Tax Increment Revenue Bonds, Series 2009A, 7. 500%, 6/15/23 | 6/19 at 100.00 | | BBB | | | 1,129,020 | |
| | 9,590 | | Total Nevada | | | | | | 9,916,680 | |
| | | | New Hampshire – 0.2% (0.2% of Total Investments) | | | | | | | |
| | | | Manchester Housing and Redevelopment Authority, New Hampshire, Revenue Bonds, Series 2000B: | | | | | | | |
| | 265 | | 0.000%, 1/01/17 – ACA Insured | No Opt. Call | | AA | | | 256,101 | |
| | 500 | | 0.000%, 1/01/18 – ACA Insured | No Opt. Call | | AA | | | 466,520 | |
| | 320 | | 0.000%, 1/01/19 – ACA Insured | No Opt. Call | | AA | | | 287,504 | |
| | 370 | | 0.000%, 1/01/20 – ACA Insured | No Opt. Call | | AA | | | 319,354 | |
| | 1,455 | | Total New Hampshire | | | | | | 1,329,479 | |
| | | | New Jersey – 6.0% (4.8% of Total Investments) | | | | | | | |
| | | | New Jersey Economic Development Authority, School Facilities Construction Financing Program Bonds, Tender Option Bond Trust 1151: | | | | | | | |
| | 1,440 | | 2.712%, 9/01/25 (IF) (5) | 3/25 at 100.00 | | A– | | | 687,744 | |
| | 1,200 | | 4.213%, 9/01/27 (IF) (5) | 3/23 at 100.00 | | A– | | | 545,640 | |
| | | | New Jersey Economic Development Authority, Special Facilities Revenue Bonds, Continental Airlines Inc., Series 1999: | | | | | | | |
| | 3,000 | | 5.125%, 9/15/23 (Alternative Minimum Tax) | 3/16 at 100.00 | | BB– | | | 3,286,920 | |
| | 7,550 | | 5.250%, 9/15/29 (Alternative Minimum Tax) | 9/22 at 101.00 | | BB– | | | 8,247,545 | |
| | 7,000 | | New Jersey Health Care Facilities Financing Authority, New Jersey, Revenue Bonds, Saint Peters University Hospital, Refunding Series 2011, 6.000%, 7/01/26 | 7/21 at 100.00 | | BB+ | | | 7,632,170 | |
| | 5,000 | | New Jersey Health Care Facilities Financing Authority, Revenue Bonds, Saint Joseph's Healthcare System Obligated Group Issue, Series 2008, 6.625%, 7/01/38 | 7/18 at 100.00 | | BBB– | | | 5,529,150 | |
| | 910 | | New Jersey Health Care Facilities Financing Authority, Trinitas Hospital Obligated Group, Series 2007A, 5.250%, 7/01/23 | 7/17 at 100.00 | | BBB | | | 960,414 | |
| | 500 | | New Jersey Turnpike Authority, Revenue Bonds, Tender Option Bond Trust 1154, 21.235%, 1/01/24 (IF) (5) | 7/22 at 100.00 | | A+ | | | 952,175 | |
| | 10,985 | | Tobacco Settlement Financing Corporation, New Jersey, Tobacco Settlement Asset-Backed Bonds, Series 2007-1A, 4.625%, 6/01/26 | 6/17 at 100.00 | | B+ | | | 10,863,504 | |
| | 37,585 | | Total New Jersey | | | | | | 38,705,262 | |
| | | | New Mexico – 0.5% (0.4% of Total Investments) | | | | | | | |
| | 1,235 | | Bernalillo County, New Mexico, Multifamily Housing Revenue Bonds, Valencia Retirement Apartments Project, Series 2001A, 5.450%, 6/01/34 – AMBAC Insured (Alternative Minimum Tax) | 12/15 at 100.00 | | N/R | | | 1,235,494 | |
| | Principal | | | Optional Call | | | | | | |
| | Amount (000) | | Description (1) | Provisions (2) | | Ratings (3) | | | Value | |
| | | | New Mexico (continued) | | | | | | | |
| $ | 2,000 | | Santa Fe, New Mexico, Retirement Facilities Revenue Bonds, EL Castillo Retirement Residences Project, Series 2012, 5.000%, 5/15/32 | No Opt. Call | | BBB– | | $ | 2,090,220 | |
| | 3,235 | | Total New Mexico | | | | | | 3,325,714 | |
| | | | New York – 6.8% (5.4% of Total Investments) | | | | | | | |
| | | | Build New York City Resource Corporation, New York, Revenue Bonds, Bronx Charter School for Excellence, Series 2013A: | | | | | | | |
| | 505 | | 4.000%, 4/01/20 | No Opt. Call | | BBB– | | | 527,548 | |
| | 570 | | 4.000%, 4/01/23 | No Opt. Call | | BBB– | | | 591,569 | |
| | | | Build New York City Resource Corporation, New York, Solid Waste Disposal Revenue Bonds, Pratt Paper NY, Inc. Project, Series 2014: | | | | | | | |
| | 320 | | 3.750%, 1/01/20 (Alternative Minimum Tax) | No Opt. Call | | N/R | | | 332,419 | |
| | 1,080 | | 4.500%, 1/01/25 (Alternative Minimum Tax) | No Opt. Call | | N/R | | | 1,164,542 | |
| | | | Dormitory Authority of the State of New York, Insured Revenue Bonds, Pace University, Series 2013A: | | | | | | | |
| | 840 | | 5.000%, 5/01/23 | No Opt. Call | | BB+ | | | 936,071 | |
| | 1,000 | | 5.000%, 5/01/28 | No Opt. Call | | BB+ | | | 1,081,470 | |
| | 1,000 | | Dormitory Authority of the State of New York, Orange Regional Medical Center Obligated Group Revenue Bonds, Series 2008, 6.500%, 12/01/21 | 12/18 at 100.00 | | Ba1 | | | 1,121,500 | |
| | 1,000 | | Nassau County Tobacco Settlement Corporation, New York, Tobacco Settlement Asset-Backed Bonds, Refunding Series 2006A-2, 5.250%, 6/01/26 | 6/16 at 100.00 | | B | | | 1,003,560 | |
| | 7,850 | | New York City Industrial Development Agency, New York, American Airlines-JFK International Airport Special Facility Revenue Bonds, Series 2005, 7.625%, 8/01/25 (Alternative Minimum Tax) | 8/16 at 101.00 | | N/R | | | 8,240,851 | |
| | 200 | | New York City Industrial Development Agency, New York, Civic Facility Revenue Bonds, Vaughn College of Aeronautics, Series 2006A, 5.000%, 12/01/16 | No Opt. Call | | BB | | | 204,600 | |
| | 70 | | New York City Industrial Development Agency, New York, Civic Facility Revenue Bonds, Vaughn College of Aeronautics, Series 2006B, 5.000%, 12/01/16 | No Opt. Call | | BB | | | 71,610 | |
| | 190 | | New York City Industrial Development Agency, New York, PILOT Revenue Bonds, Queens Baseball Stadium Project, Series 2006, 5.000%, 1/01/22 – AMBAC Insured | 1/17 at 100.00 | | BB+ | | | 197,030 | |
| | 6,500 | | New York Liberty Development Corporation, New York, Liberty Revenue Bonds, 3 World Trade Center Project, Class 2 Series 2014, 5.150%, 11/15/34 | 11/24 at 100.00 | | N/R | | | 6,786,585 | |
| | 1,600 | | Seneca Nation of Indians Capital Improvements Authority, New York, Special Obligation Bonds, Series 2007A, 5.000%, 12/01/23 | 6/17 at 100.00 | | N/R | | | 1,647,280 | |
| | 5,000 | | Suffolk County Industrial Development Agency, New York, Continuing Care Retirement Community Revenue Bonds, Jefferson's Ferry Project, Series 2006, 5.000%, 11/01/28 | 11/16 at 100.00 | | BBB– | | | 5,092,050 | |
| | | | TSASC Inc., New York, Tobacco Asset-Backed Bonds, Series 2006: | | | | | | | |
| | 5,060 | | 5.000%, 6/01/26 | 6/16 at 100.00 | | BB– | | | 5,118,190 | |
| | 10,000 | | 5.000%, 6/01/34 | 6/16 at 100.00 | | B | | | 9,535,600 | |
| | 42,785 | | Total New York | | | | | | 43,652,475 | |
| | | | Ohio – 6.5% (5.2% of Total Investments) | | | | | | | |
| | 21,900 | | Buckeye Tobacco Settlement Financing Authority, Ohio, Tobacco Settlement Asset-Backed Revenue Bonds, Senior Lien, Series 2007A-2, 5.125%, 6/01/24 | 6/17 at 100.00 | | B– | | | 19,627,217 | |
| | 2,000 | | Ohio Air Quality Development Authority, Ohio, Revenue Bonds, Ohio Valley Electric Corporation Project, Series 2009E, 5.625%, 10/01/19 | No Opt. Call | | BBB– | | | 2,230,660 | |
| | 130 | | Ohio Air Quality Development Authority, Revenue Refunding Bonds, AK Steel Holding Corporation, Series 2012A, 6.750%, 6/01/24 (Alternative Minimum Tax) | 2/22 at 100.00 | | CCC+ | | | 91,449 | |
| | 250 | | Ohio Water Development Authority, Ohio, Environmental Improvement Bonds, United States Steel Corporation Project, Refunding Series 2011, 6.600%, 5/01/29 | No Opt. Call | | BB– | | | 190,980 | |
| | 3,400 | | Southeastern Ohio Port Authority, Hospital Facilities Revenue Bonds, Memorial Health System Obligated Group Project, Refunding and Improvement Series 2012, 5.000%, 12/01/22 | No Opt. Call | | BB | | | 3,674,856 | |
| | 6,000 | | State of Ohio, Solid Waste Disposal Revenue Bonds (USG Corporation Project) Series 1997 Remarketed, 5.600%, 8/01/32 (Alternative Minimum Tax) | 2/16 at 100.00 | | B | | | 6,000,420 | |
| NID | Nuveen Intermediate Duration Municipal Term Fund | |
| | Portfolio of Investments (continued) | November 30, 2015 (Unaudited) |
| | Principal | | | Optional Call | | | | | | |
| | Amount (000) | | Description (1) | Provisions (2) | | Ratings (3) | | | Value | |
| | | | Ohio (continued) | | | | | | | |
| $ | 1,675 | | Toledo-Lucas County Port Authority, Ohio, Special Assessment Revenue Bonds, Crocker Park Public Improvement Project, Series 2003, 5.250%, 12/01/23 (Pre-refunded 12/01/15) | 12/15 at 100.00 | | BB (4) | | $ | 1,680,276 | |
| | 8,445 | | Toledo-Lucas County Port Authority, Ohio, Special Assessment Revenue Bonds, Crocker Park Public Improvement Project, Series 2003, 5.375%, 12/01/35 (Pre-refunded 12/01/15) | 12/15 at 100.00 | | BB (4) | | | 8,453,022 | |
| | 43,800 | | Total Ohio | | | | | | 41,948,880 | |
| | | | Oklahoma – 0.6% (0.5% of Total Investments) | | | | | | | |
| | 3,300 | | Tulsa Municipal Airport Trust, Oklahoma, Revenue Bonds, American Airlines Inc., Refunding Series 2015, 5.000%, 6/01/35 (Mandatory put 6/01/25) (Alternative Minimum Tax) | No Opt. Call | | BB– | | | 3,654,189 | |
| | | | Oregon – 0.3% (0.2% of Total Investments) | | | | | | | |
| | 1,000 | | Astoria Hospital Facilities Authority, Oregon, Hospital Revenue and Refunding Bonds, Columbia Memorial Hospital, Series 2012, 5.000%, 8/01/31 | No Opt. Call | | BBB– | | | 1,057,680 | |
| | 730 | | Port of Saint Helens, Oregon, Pollution Control Revenue Bonds, Boise Cascade Project, Series 1997, 5.650%, 12/01/27 | No Opt. Call | | N/R | | | 732,110 | |
| | 1,730 | | Total Oregon | | | | | | 1,789,790 | |
| | | | Pennsylvania – 6.5% (5.2% of Total Investments) | | | | | | | |
| | 2,268 | | Aliquippa Municipal Water Authority, Pennsylvania, Water and Sewer Revenue Bonds, Subordinated Series 2013, 5.000%, 5/15/26 | No Opt. Call | | N/R | | | 2,356,073 | |
| | | | Allegheny Country Industrial Development Authority, Pennsylvania, Environmental Improvement Revenue Bonds, United States Steel Corporation Project, Refunding Series 2009: | | | | | | | |
| | 5,125 | | 6.500%, 5/01/17 | No Opt. Call | | BB– | | | 4,366,653 | |
| | 3,300 | | 6.750%, 11/01/24 | 11/19 at 100.00 | | BB– | | | 2,534,631 | |
| | 420 | | 6.875%, 5/01/30 | 11/19 at 100.00 | | BB– | | | 316,579 | |
| | 2,265 | | Allegheny County Industrial Development Authority, Pennsylvania, Revenue Bonds, United States Steel Corporation, Series 2005, 5.500%, 11/01/16 | No Opt. Call | | BB– | | | 2,036,824 | |
| | 920 | | Allegheny County Redevelopment Authority, Pennsylvania, TIF Revenue Bonds, Pittsburg Mills Project, Series 2004, 5.600%, 7/01/23 | 1/16 at 100.00 | | N/R | | | 929,191 | |
| | 3,685 | | Allentown Neighborhood Improvement Zone Development Authority, Pennsylvania, Tax Revenue Bonds, Series 2012A, 5.000%, 5/01/32 | No Opt. Call | | Baa2 | | | 3,929,279 | |
| | 4,025 | | Butler County Industrial Development Authority, Pennsylvania, Revenue Refunding Bonds, AK Steel Corporation Project, Series 2012-A, 6.250%, 6/01/20 (Alternative Minimum Tax) | No Opt. Call | | CCC+ | | | 3,709,561 | |
| | 1,450 | | Doylestown Hospital Authority, Pennsylvania, Hospital Revenue Bonds, Series 2013A, 5.000%, 7/01/23 | No Opt. Call | | BBB | | | 1,617,316 | |
| | 825 | | East Hempfield Township Industrial Development Authority, Pennsylvania, Student Services Inc – Student Housing Project at Millersville University, Series 2015, 5.000%, 7/01/30 | 7/25 at 100.00 | | BBB– | | | 884,780 | |
| | 1,000 | | Montgomery County Industrial Development Authority, Pennsylvania, Revenue Bonds, Whitemarsh Continuing Care Retirement Community Project, Series 2015, 5.000%, 1/01/30 | 1/25 at 100.00 | | N/R | | | 1,011,610 | |
| | 1,595 | | Northampton County Industrial Development Authority, Pennsylvania, Revenue Bonds, Morningstar Senior Living, Inc., Series 2012, 5.000%, 7/01/27 | No Opt. Call | | BBB– | | | 1,677,063 | |
| | 4,000 | | Pennsylvania Economic Development Finance Authority, Solid Waste Disposal Revenue Bonds (USG Corporation Project) Series 1999, 6.000%, 6/01/31 (Alternative Minimum Tax) | 12/15 at 100.00 | | B | | | 4,000,160 | |
| | 750 | | Pennsylvania Economic Development Financing Authority, Sewage Sludge Disposal Revenue Bonds, Philadelphia Biosolids Facility Project, Series 2009, 6.250%, 1/01/32 | 1/20 at 100.00 | | BBB | | | 829,673 | |
| | 4,000 | | Pennsylvania Public School Building Authority, Lease Revenue Bonds, School District of Philadelphia, Series 2006B, 5.000%, 6/01/27 – AGM Insured | No Opt. Call | | AA | | | 4,645,160 | |
| | 1,000 | | Philadelphia Hospitals and Higher Education Facilities Authority, Pennsylvania, Hospital Revenue Bonds, Temple University Health System Obligated Group, Series 2007B, 5.500%, 7/01/26 | 7/17 at 100.00 | | BBB– | | | 1,034,480 | |
| | 3,000 | | Philadelphia Hospitals and Higher Education Facilities Authority, Pennsylvania, Hospital Revenue Bonds, Temple University Health System Obligated Group, Series 2012B, 6.250%, 7/01/23 | No Opt. Call | | BBB– | | | 3,154,590 | |
| | 2,595 | | Susquehanna Area Regional Airport Authority, Pennsylvania, Airport System Revenue Bonds, Series 2012C, 3.000%, 1/01/17 | No Opt. Call | | Ba1 | | | 2,635,352 | |
| | 42,223 | | Total Pennsylvania | | | | | | 41,668,975 | |
| | Principal | | | Optional Call | | | | | | |
| | Amount (000) | | Description (1) | Provisions (2) | | Ratings (3) | | | Value | |
| | | | Puerto Rico – 0.5% (0.4% of Total Investments) | | | | | | | |
| $ | 3,500 | | Puerto Rico Infrastructure Financing Authority, Special Tax Revenue Bonds, Series 2005C, 5.500%, 7/01/27 – AMBAC Insured | No Opt. Call | | CC | | $ | 3,340,820 | |
| | | | Rhode Island – 1.0% (0.8% of Total Investments) | | | | | | | |
| | 6,000 | | Rhode Island Health & Educational Building Corporation, Public Schools Financing Program Revenue Bonds, Pooled Series 2009E, 6.000%, 5/15/29 – AGC Insured | 5/19 at 100.00 | | A3 | | | 6,556,080 | |
| | | | South Carolina – 1.9% (1.5% of Total Investments) | | | | | | | |
| | | | South Carolina JOBS Economic Development Authority, Hospital Revenue Bonds, Bon Secours Health System Obligated Group, Tender Option Bond Trust 1141: | | | | | | | |
| | 1,500 | | 21.415%, 11/01/27 (IF) (5) | 11/22 at 100.00 | | A2 | | | 2,438,250 | |
| | 1,010 | | 21.395%, 11/01/28 (IF) (5) | 11/22 at 100.00 | | A2 | | | 1,618,273 | |
| | 1,255 | | 21.415%, 11/01/29 (IF) (5) | 11/22 at 100.00 | | A2 | | | 1,977,755 | |
| | 1,450 | | South Carolina JOBS Economic Development Authority, Economic Development Revenue Bonds, Palmetto Scholars Academy Project, Series 2015A, 5.125%, 8/15/35 | 2/25 at 100.00 | | BB | | | 1,453,045 | |
| | 5,000 | | York County, South Carolina, Celanese, Series 1994, 5.700%, 1/01/24 (Alternative Minimum Tax) | 1/16 at 100.00 | | BB– | | | 5,013,050 | |
| | 10,215 | | Total South Carolina | | | | | | 12,500,373 | |
| | | | Tennessee – 1.6% (1.3% of Total Investments) | | | | | | | |
| | 2,000 | | Clarksville Natural Gas Acquisition Corporation, Tennessee, Natural Gas Revenue Bonds, Series 2006, 5.000%, 12/15/21 – SYNCORA GTY Insured | No Opt. Call | | A | | | 2,307,840 | |
| | 1,935 | | Knox County Health, Educational and Housing Facility Board, Tennessee, Hospital Revenue Refunding Bonds, Covenant Health, Series 2012A, 5.000%, 1/01/26 | No Opt. Call | | A | | | 2,231,713 | |
| | 4,650 | | Knox County Health, Educational, and Housing Facilities Board, Tennessee, Revenue Bonds, Provision Center for Proton Therapy Project, Series 2014, 5.250%, 5/01/25 | 11/24 at 100.00 | | N/R | | | 4,677,249 | |
| | 1,000 | | The Tennessee Energy Acquisition Corporation, Gas Revenue Bonds, Series 2006C, 5.000%, 2/01/23 | No Opt. Call | | A | | | 1,158,860 | |
| | 9,585 | | Total Tennessee | | | | | | 10,375,662 | |
| | | | Texas – 8.8% (7.0% of Total Investments) | | | | | | | |
| | 275 | | Austin Convention Enterprises Inc., Texas, Convention Center Hotel Revenue Bonds, First Tier Series 2006A, 5.000%, 1/01/34 – SYNCORA GTY Insured | 1/17 at 100.00 | | BBB– | | | 277,783 | |
| | 7,000 | | Austin Convention Enterprises Inc., Texas, Convention Center Hotel Revenue Bonds, Second Tier Series 2006B, 5.750%, 1/01/24 | 1/17 at 100.00 | | BB | | | 7,181,650 | |
| | | | Austin, Texas, Estancia Hill Country Public Improvement District, Area 1 Special Assessment Revenue Bonds, Series 2013: | | | | | | | |
| | 1,300 | | 4.500%, 11/01/18 | No Opt. Call | | N/R | | | 1,339,442 | |
| | 1,500 | | 6.000%, 11/01/28 | 11/23 at 100.00 | | N/R | | | 1,601,205 | |
| | 610 | | Bexar County, Texas, Health Facilities Development Corporation Revenue Bonds, Army Retirement Residence, Series 2007, 5.000%, 7/01/27 | 7/17 at 100.00 | | BBB | | | 627,647 | |
| | 2,095 | | Board of Managers, Joint Guadalupe County – Seguin City Hospital, Texas, FHA Insured Hospital | 8/18 at 100.00 | | Ba1 (4) | | | 2,346,253 | |
| | | | Mortgage Revenue Bonds, Guadalupe Regional Medical Center Project, Series 2007, 5.500%, 8/15/36 (Pre-refunded 8/15/18) | | | | | | | |
| | 1,000 | | Clifton Higher Education Finance Corporation, Texas, Education Revenue Bonds, Idea Public Schools, Series 2012, 3.750%, 8/15/22 | No Opt. Call | | BBB | | | 1,057,700 | |
| | 2,000 | | Dallas Area Rapid Transit, Texas, Sales Tax Revenue Bonds, Tender Option Bond Trust 3307, 23.966%, 12/01/26 – AMBAC Insured (IF) (5) | No Opt. Call | | AA+ | | | 4,856,500 | |
| | 2,000 | | Gulf Coast Industrial Development Authority, Texas, Solid Waste Disposal Revenue Bonds, Citgo Petroleum Corporation Project, Series 1995, 4.875%, 5/01/25 (Alternative Minimum Tax) | 10/22 at 100.00 | | BB | | | 2,093,560 | |
| | | | Harris County Cultural Education Facilities Finance Corporation, Texas, Revenue Refunding Bonds, Young Men's Christian Association of the Greater Houston Area, Series 2013A: | | | | | | | |
| | 330 | | 5.000%, 6/01/18 | No Opt. Call | | Baa3 | | | 354,833 | |
| | 1,500 | | 5.000%, 6/01/20 | No Opt. Call | | Baa3 | | | 1,666,470 | |
| | 535 | | 5.000%, 6/01/21 | No Opt. Call | | Baa3 | | | 597,638 | |
| | 855 | | 5.000%, 6/01/22 | No Opt. Call | | Baa3 | | | 963,517 | |
| | 915 | | 5.000%, 6/01/23 | No Opt. Call | | Baa3 | | | 1,039,230 | |
| | 1,500 | | Health Facilities Development District of Central Texas, Revenue Bonds, Legacy at Willow Bend Project, Series 2006A, 5.625%, 11/01/26 | 11/16 at 100.00 | | N/R | | | 1,516,650 | |
| NID | Nuveen Intermediate Duration Municipal Term Fund | |
| | Portfolio of Investments (continued) | November 30, 2015 (Unaudited) |
| | Principal | | | Optional Call | | | | | | |
| | Amount (000) | | Description (1) | Provisions (2) | | Ratings (3) | | | Value | |
| | | | Texas (continued) | | | | | | | |
| $ | 200 | | Love Field Airport Modernization Corporation, Texas, Special Facilities Revenue Bonds, Southwest Airlines Company – Love Field Modernization Program Project, Series 2012, 5.000%, 11/01/21 (Alternative Minimum Tax) | No Opt. Call | | Baa1 | | $ | 227,466 | |
| | 1,000 | | New Hope Cultural Education Facilities Finance Corporation, Texas, Student Housing Revenue Bonds, CHF-Collegiate Housing Corpus Christi I, L.L.C.-Texas A&M University-Corpus Christi Project, Series 2014A, 5.000%, 4/01/34 | 4/24 at 100.00 | | BBB– | | | 1,046,050 | |
| | 1,250 | | Port Corpus Christi Authority, Nueces County, Texas, Pollution Control Revenue Bonds, Celanese Project, Refunding Series 2002B, 6.700%, 11/01/30 (Alternative Minimum Tax) | 5/16 at 100.00 | | BB– | | | 1,254,288 | |
| | 1,500 | | Red River Authority, Texas, Pollution Control Revenue Bonds, AEP Texas North Company, Public Service Company of Oklahoma and AEP Texas Central Company Oklaunion Project, Refunding Series 2007, 4.450%, 6/01/20 – NPFG Insured | No Opt. Call | | AA– | | | 1,644,780 | |
| | 2,680 | | San Antonio Public Facilities Corporation, Texas, Lease Revenue Bonds, Convention Center Refinancing & Expansion Project, Tender Option Bond Trust 2015-XF0125, 22.376%, 9/15/20 (IF) (5) | No Opt. Call | | AA+ | | | 4,613,860 | |
| | | | Tarrant County Cultural Education Facilities Finance Corporation, Texas, Hospital Revenue Bonds, Scott & White Healthcare Project, Tender Option Bond Trust 1149: | | | | | | | |
| | 100 | | 22.953%, 8/15/22 (IF) (5) | No Opt. Call | | AA– | | | 191,065 | |
| | 155 | | 21.747%, 8/15/24 (IF) (5) | 8/23 at 100.00 | | AA– | | | 297,394 | |
| | 200 | | 21.953%, 8/15/26 (IF) (5) | 8/23 at 100.00 | | AA– | | | 368,930 | |
| | 170 | | 21.706%, 8/15/27 (IF) (5) | 8/23 at 100.00 | | AA– | | | 304,825 | |
| | | | Texas Municipal Gas Acquisition and Supply Corporation I, Gas Supply Revenue Bonds, Senior Lien Series 2008D: | | | | | | | |
| | 485 | | 5.625%, 12/15/17 | No Opt. Call | | BBB+ | | | 511,505 | |
| | 9,320 | | 6.250%, 12/15/26 | No Opt. Call | | BBB+ | | | 11,401,155 | |
| | 5,000 | | Texas Municipal Gas Acquisition and Supply Corporation III, Gas Supply Revenue Bonds, Series 2012, 5.000%, 12/15/22 | No Opt. Call | | A3 | | | 5,837,600 | |
| | 1,190 | | Westlake, Texas, Special Assessment Revenue Bonds, Solana Public Improvement District, Series 2015, 6.125%, 9/01/35 | 9/25 at 100.00 | | N/R | | | 1,189,726 | |
| | 46,665 | | Total Texas | | | | | | 56,408,722 | |
| | | | Utah – 1.0% (0.8% of Total Investments) | | | | | | | |
| | 6,000 | | Salt Lake County, Utah, Research Facility Revenue Bonds, Huntsman Cancer Foundation, Series 2013A-1, 5.000%, 12/01/33 (Mandatory put 12/15/20) | 12/18 at 100.00 | | N/R | | | 6,346,500 | |
| | | | Vermont – 0.6% (0.4% of Total Investments) | | | | | | | |
| | 3,600 | | Vermont Economic Development Authority, Solid Waste Disposal Revenue Bonds, Casella Waste Systems, Inc. Project, Series 2013, 4.750%, 4/01/36 (Mandatory put 4/01/18) (Alternative Minimum Tax) | No Opt. Call | | B+ | | | 3,619,872 | |
| | | | Virgin Islands – 1.8% (1.4% of Total Investments) | | | | | | | |
| | 3,000 | | Virgin Islands Public Finance Authority, Gross Receipts Taxes Loan Note, Working Capital Series 2014A, 5.000%, 10/01/29 | 10/24 at 100.00 | | BBB+ | | | 3,291,510 | |
| | 640 | | Virgin Islands Public Finance Authority, Matching Fund Loan Notes Revenue Bonds, Senior Lien Series 2010A, 5.000%, 10/01/25 | 10/20 at 100.00 | | BBB | | | 711,514 | |
| | 1,515 | | Virgin Islands Public Finance Authority, Matching Fund Loan Notes Revenue Bonds, Senior Lien, Refunding Series 2013B, 5.000%, 10/01/24 – AGM Insured | No Opt. Call | | AA | | | 1,825,560 | |
| | 5,000 | | Virgin Islands Public Finance Authority, Matching Fund Revenue Loan Note – Diageo Project, Series 2009A, 6.750%, 10/01/37 | 10/19 at 100.00 | | Baa3 | | | 5,635,900 | |
| | 10,155 | | Total Virgin Islands | | | | | | 11,464,484 | |
| | | | Virginia – 2.8% (2.2% of Total Investments) | | | | | | | |
| | | | Dulles Town Center Community Development Authority, Loudon County, Virginia Special Assessment Refunding Bonds, Dulles Town Center Project, Series 2012: | | | | | | | |
| | 1,265 | | 4.000%, 3/01/20 | No Opt. Call | | N/R | | | 1,277,448 | |
| | 1,000 | | 5.000%, 3/01/21 | No Opt. Call | | N/R | | | 1,051,940 | |
| | 1,410 | | 5.000%, 3/01/22 | No Opt. Call | | N/R | | | 1,487,339 | |
| | Principal | | | Optional Call | | | | | | |
| | Amount (000) | | Description (1) | Provisions (2) | | Ratings (3) | | | Value | |
| | | | Virginia (continued) | | | | | | | |
| | | | Fairfax County Industrial Development Authority, Virginia, Healthcare Revenue Bonds, Inova Health System, Tender Option Bond Trust 3309: | | | | | | | |
| $ | 1,800 | | 22.846%, 5/15/20 (IF) (5) | No Opt. Call | | AA+ | | $ | 3,255,210 | |
| | 120 | | 22.846%, 5/15/20 (IF) (5) | No Opt. Call | | AA+ | | | 214,752 | |
| | 400 | | 17.842%, 5/15/20 (IF) (5) | No Opt. Call | | AA+ | | | 525,060 | |
| | 2,615 | | Giles County Industrial Development Authority, Virginia, Exempt Facility Revenue Bonds, Hoechst Celanese Project, Series 1996, 6.450%, 5/01/26 | 5/16 at 100.00 | | BB– | | | 2,623,446 | |
| | 1,651 | | Peninsula Town Center Community Development Authority, Virginia, Special Obligation Bonds, Series 2007, 5.800%, 9/01/17 | No Opt. Call | | N/R | | | 1,761,138 | |
| | 1,000 | | Roanoke Economic Development Authority, Virginia, Residential Care Facility Mortgage Revenue Refunding Bonds, Virginia Lutheran Homes Brandon Oaks Project, Series 2012, 5.000%, 12/01/32 | No Opt. Call | | N/R | | | 1,010,590 | |
| | | | Virginia Gateway Community Development Authority, Prince William County, Virginia, Special Assessment Refunding Bonds, Series 2012: | | | | | | | |
| | 695 | | 5.000%, 3/01/25 | No Opt. Call | | N/R | | | 728,805 | |
| | 620 | | 4.500%, 3/01/29 | No Opt. Call | | N/R | | | 615,685 | |
| | 1,505 | | 5.000%, 3/01/30 | No Opt. Call | | N/R | | | 1,561,317 | |
| | 1,410 | | Virginia Small Business Financing Authority, Revenue Bonds, Hampton University, Refunding Series 2014, 5.000%, 10/01/23 | No Opt. Call | | A– | | | 1,662,418 | |
| | 15,491 | | Total Virginia | | | | | | 17,775,148 | |
| | | | Washington – 2.5% (2.0% of Total Investments) | | | | | | | |
| | 500 | | Tacoma Consolidated Local Improvement District 65, Washington, Special Assessment Bonds, Series 2013, 5.750%, 4/01/43 | 4/16 at 100.00 | | N/R | | | 499,780 | |
| | 2,000 | | Washington State Health Care Facilities Authority, Revenue Bonds, Group Health Cooperative of Puget Sound, Series 2006, 5.000%, 12/01/24 – RAAI Insured | 12/16 at 100.00 | | AA | | | 2,074,420 | |
| | | | Washington State Housing Finance Commission, Non-Profit Housing Revenue Bonds, Mirabella Project, Series 2012A: | | | | | | | |
| | 3,800 | | 6.000%, 10/01/22 | No Opt. Call | | N/R | | | 4,202,532 | |
| | 2,135 | | 6.500%, 10/01/32 | No Opt. Call | | N/R | | | 2,317,051 | |
| | | | Washington State Housing Finance Commission, Non-Profit Revenue Bonds, Emerald Heights Project, Refunding 2013: | | | | | | | |
| | 1,000 | | 5.000%, 7/01/21 | No Opt. Call | | A– | | | 1,114,950 | |
| | 1,000 | | 5.000%, 7/01/23 | No Opt. Call | | A– | | | 1,121,810 | |
| | 5,000 | | Washington State Health Care Facilities Authority, Tender Option Bond Trust, Series 2015-XF1017, 2.631%, 1/01/35 (IF) (5) | 7/24 at 100.00 | | A | | | 4,813,200 | |
| | 15,435 | | Total Washington | | | | | | 16,143,743 | |
| | | | Wisconsin – 2.7% (2.1% of Total Investments) | | | | | | | |
| | 1,740 | | Green Bay Redevelopment Authority, Wisconsin, Industrial Development Revenue Bonds, Fort James Project, Series 1999, 5.600%, 5/01/19 (Alternative Minimum Tax) | No Opt. Call | | N/R | | | 1,913,582 | |
| | | | Oneida Tribe of Indians of Wisconsin, Retail Sales Revenue Bonds, Series 2011-144A: | | | | | | | |
| | 4,580 | | 5.500%, 2/01/21 | No Opt. Call | | AA– | | | 5,073,220 | |
| | 350 | | 6.500%, 2/01/31 | 2/19 at 102.00 | | AA– | | | 401,706 | |
| | 415 | | Platteville Redevelopment Authority, Wisconsin, Revenue Bonds, University of Wisconsin – Platteville Real Estate Foundation Project, Series 2012A, 5.000%, 7/01/42 | 7/22 at 100.00 | | BBB– | | | 428,853 | |
| | | | Public Finance Authority of Wisconsin, Educational Facility Revenue Bonds, Cottonwood Classical Preparatory School in Albuquerque, New Mexico, Series 2012A: | | | | | | | |
| | 1,200 | | 5.250%, 12/01/22 | No Opt. Call | | N/R | | | 1,231,788 | |
| | 1,610 | | 6.000%, 12/01/32 | No Opt. Call | | N/R | | | 1,641,282 | |
| | 760 | | Public Finance Authority of Wisconsin, Revenue Bonds, Roseman University of Health Sciences, Series 2012, 5.000%, 4/01/22 | No Opt. Call | | BB– | | | 782,435 | |
| | 1,115 | | Public Finance Authority of Wisconsin, Student Housing Revenue Bonds, Collegiate Housing Foundation – Cullowhee LLC – Western California University Project, Series 2015A, 5.000%, 7/01/30 | 7/25 at 100.00 | | BBB– | | | 1,182,948 | |
| | 3,130 | | Public Finance Authority, Wisconsin, Senior Airport Facilities Revenue and Refunding Bonds, TrIPS Obligated Group, Series 2012B, 5.000%, 7/01/22 (Alternative Minimum Tax) | No Opt. Call | | BBB | | | 3,316,797 | |
| NID | Nuveen Intermediate Duration Municipal Term Fund | |
| | Portfolio of Investments (continued) | November 30, 2015 (Unaudited) |
| | Principal | | | Optional Call | | | | | | |
| | Amount (000) | | Description (1) | Provisions (2) | | Ratings (3) | | | Value | |
| | | | Wisconsin (continued) | | | | | | | |
| | | | University of Wisconsin Hospitals and Clinics Authority, Revenue Bonds, Tender Option Bond Trust 2015-XF0127: | | | | | | | |
| $ | 50 | | 20.690%, 4/01/20 (IF) (5) | No Opt. Call | | Aa3 | | $ | 96,190 | |
| | 100 | | 21.517%, 10/01/20 (IF) (5) | No Opt. Call | | Aa3 | | | 204,440 | |
| | 185 | | 21.126%, 10/01/20 (IF) (5) | No Opt. Call | | Aa3 | | | 363,730 | |
| | 100 | | 21.517%, 10/01/20 (IF) (5) | No Opt. Call | | Aa3 | | | 193,435 | |
| | 250 | | Wisconsin Health and Educational Facilities Authority, Revenue Bonds, Beloit Health System, Inc., Series 2010B, 5.000%, 4/01/30 | 4/20 at 100.00 | | A– | | | 264,078 | |
| | 15,585 | | Total Wisconsin | | | | | | 17,094,484 | |
| | | | Wyoming – 0.1% (0.1% of Total Investments) | | | | | | | |
| | 595 | | Sweetwater County, Wyoming, Solid Waste Disposal Revenue Bonds, FMC Corporation, Series 2005, 5.600%, 12/01/35 (Alternative Minimum Tax) | 12/15 at 100.00 | | BBB | | | 597,053 | |
| $ | 761,533 | | Total Long-Term Investments (cost $803,311,612) | | | | | | 805,587,721 | |
| | Principal | | | Optional Call | | | | | | |
| | Amount (000) | | Description (1) | Provisions (2) | | Ratings (3) | | | Value | |
| | | | SHORT-TERM INVESTMENTS – 0.2% (0.2% of Total Investments) | | | | | | | |
| | | | MUNICIPAL BONDS – 0.2% (0.2% of Total Investments) | | | | | | | |
| $ | 1,160 | | California Statewide Community Development Authority, Revenue Bonds, Daughters of Charity Health System, Series 2014A, 6.000%, 12/15/15 (7) | No Opt. Call | | N/R | | $ | 1,160,917 | |
| | 110 | | California Statewide Community Development Authority, Revenue Bonds, Daughters of Charity Health System, Series 2014B, 6.000%, 12/15/15 (7) | No Opt. Call | | N/R | | | 110,087 | |
| | 170 | | California Statewide Community Development Authority, Revenue Bonds, Daughters of Charity Health System, Series 2014C, 6.000%, 12/15/15 (7) | No Opt. Call | | N/R | | | 170,134 | |
| $ | 1,440 | | Total Short-Term Investments (cost $1,440,000) | | | | | | 1,441,138 | |
| | | | Total Investments (cost $804,751,612) – 125.7% | | | | | | 807,028,859 | |
| | | | Variable Rate MuniFund Term Preferred Shares, at Liquidation Value – (27.3)% (8) | | | | | | (175,000,000 | ) |
| | | | Other Assets Less Liabilities – 1.6% (9) | | | | | | 10,161,313 | |
| | | | Net Assets Applicable to Common Shares – 100% | | | | | $ | 642,190,172 | |
Investments in Derivatives as of November 30, 2015
Interest Rate Swaps outstanding:
| | | | | | | | | | | | | | | | | | | Variation | | | |
| | | | | Fund | | | | | | Fixed Rate | | | | | | | | Margin | | Unrealized | |
| | | Notional | | Pay/Receive | | Floating Rate | | Fixed Rate | | Payment | | Effective | | Termination | | | | Receivable/ | | Appreciation | |
| Counterparty | | Amount | | Floating Rate | | Index | | (Annualized) | | Frequency | | Date (10) | | Date | | Value | | Payable | | (Depreciation) | |
| JPMorgan* | | $24,300,000 | | Receive | | 3-Month USD LIBOR-ICE | | 2.857% | | Semi-Annually | | 7/13/16 | | 7/13/26 | | $(1,425,451) | | $(46,964) | | $(1,425,451) | |
| JPMorgan | | 21,400,000 | | Receive | | Weekly USD-SIFMA | | 1.985 | | Quarterly | | 10/3/16 | | 10/3/28 | | (367,495) | | N/A | | (367,495) | |
| | | $45,700,000 | | | | | | | | | | | | | | $(1,792,946) | | $(46,964) | | $(1,792,946) | |
* Citigroup is the clearing broker for this transaction.
| (1) | All percentages shown in the Portfolio of Investments are based on net assets applicable to common shares unless otherwise noted. |
| (2) | Optional Call Provisions: Dates (month and year) and prices of the earliest optional call or redemption. There may be other call provisions at varying prices at later dates. Certain mortgage-backed securities may be subject to periodic principal paydowns. |
| (3) | Ratings: Using the highest of Standard & Poor's Group ("Standard & Poor's"), Moody's Investor Service, Inc. ("Moody's") or Fitch, Inc. ("Fitch") rating. Ratings below BBB by Standard & Poor's, Baa by Moody's or BBB by Fitch are considered to be below investment grade. Holdings designated N/R are not rated by any of these national rating agencies. |
| (4) | Backed by an escrow or trust containing sufficient U.S. Government or U.S. Government agency securities, which ensure the timely payment of principal and interest. Certain bonds backed by U.S. Government or agency securities are regarded as having an implied rating equal to the rating of such securities. |
| (5) | Investment, or portion of investment, has been pledged to collateralize the net payment obligations for investments in inverse floating rate transactions. |
| (6) | As of, or subsequent to, the end of the reporting period, this security is non-income producing. Non-income producing, in the case of a fixed-income security, generally denotes that the issuer has (1) defaulted on the payment of principal or interest, (2) is under the protection of the Federal Bankruptcy Court or (3) the Fund's Adviser has concluded that the issue is not likely to meet its future interest payment obligations and has ceased accruing additional income on the Fund's records. |
| (7) | Investment valued at fair value using methods determined in good faith by, or at the discretion of, the Board. For fair value measurement disclosure purposes, investment classified as Level 3. See Notes to Financial Statements, Note 2 – Investment Valuation and Fair Value Measurements for more information. |
| (8) | Variable Rate MuniFund Term Preferred Shares, at Liquidation Value as a percentage of Total Investments is 21.7%. |
| (9) | Other assets less liabilities includes the unrealized appreciation (depreciation) of certain over-the-counter derivatives as presented on the Statement of Assets and Liabilities. The unrealized appreciation (depreciation) of exchange-cleared and exchange-traded derivatives is recognized as part of the cash collateral at brokers and/or the receivable or payable for variation margin as presented on the Statement of Assets and Liabilities, when applicable. |
| (10) | Effective date represents the date on which both the Fund and counterparty commence interest payment accruals on each swap contract. |
| (ETM) | Escrowed to maturity. |
| (IF) | Inverse floating rate investment. |
| 144A | Investment is exempt from registration under Rule 144A of the Securities Act of 1933, as amended. These investments may only be resold in transactions exempt from registration, which are normally those transactions with qualified institutional buyers. |
| USD LIBOR-ICE | United States Dollar-London Inter-Bank Offered Rate Intercontinental Exchange |
| USD-SIFMA | United States Dollar-Securities Industry and Financial Markets Association |
See accompanying notes to financial statements.
| NIQ | | |
| | Nuveen Intermediate Duration Quality Municipal Term Fund | |
| | Portfolio of Investments | November 30, 2015 (Unaudited) |
| | Principal | | | Optional Call | | | | | | |
| | Amount (000) | | Description (1) | Provisions (2) | | Ratings (3) | | | Value | |
| | | | LONG-TERM INVESTMENTS – 127.9% (100.0% of Total Investments) | | | | | | | |
| | | | MUNICIPAL BONDS – 127.9% (100.0% of Total Investments) | | | | | | | |
| | | | Alabama – 3.3% (2.6% of Total Investments) | | | | | | | |
| $ | 2,000 | | Alabama Federal Aid Highway Finance Authority, Federal Highway Grant Anticipation Revenue Bonds, Tender Option Bond Trust 2013-2W, 22.453%, 9/01/26 (IF) (4) | 9/22 at 100.00 | | AA | | $ | 3,521,700 | |
| | 2,500 | | Jefferson County, Alabama, General Obligation Refunding Warrants, Series 2003A, 5.000%, 4/01/22 – NPFG Insured | 4/16 at 100.00 | | AA– | | | 2,500,950 | |
| | 4,500 | | Total Alabama | | | | | | 6,022,650 | |
| | | | Arizona – 3.2% (2.5% of Total Investments) | | | | | | | |
| | 405 | | Arizona Health Facilities Authority, Health Care Facilities Revenue Bonds, The Beatitudes Campus Project, Series 2006, 5.100%, 10/01/22 | 10/16 at 100.00 | | N/R | | | 407,321 | |
| | | | Arizona Health Facilities Authority, Hospital Revenue Bonds, Phoenix Children's Hospital, Series 2013D: | | | | | | | |
| | 965 | | 5.000%, 2/01/24 | 2/23 at 100.00 | | BBB+ | | | 1,114,758 | |
| | 1,065 | | 5.000%, 2/01/26 | 2/23 at 100.00 | | BBB+ | | | 1,206,453 | |
| | 1,945 | | Downtown Phoenix Hotel Corporation, Arizona, Senior Revenue Bonds, Series 2005A, 5.250%, 7/01/26 (Pre-refunded 1/01/16) – FGIC Insured | 1/16 at 100.00 | | N/R (5) | | | 1,952,916 | |
| | 1,000 | | University Medical Center Corporation, Tucson, Arizona, Hospital Revenue Bonds, Series 2011, 5.000%, 7/01/19 (ETM) | No Opt. Call | | N/R (5) | | | 1,135,810 | |
| | 5,380 | | Total Arizona | | | | | | 5,817,258 | |
| | | | California – 13.6% (10.6% of Total Investments) | | | | | | | |
| | 3,000 | | Alameda Corridor Transportation Authority, California, Revenue Bonds, Refunding Senior Lien Series 2013A, 5.000%, 10/01/27 – AGM Insured | 10/23 at 100.00 | | AA | | | 3,570,000 | |
| | | | California Municipal Finance Authority, Revenue Bonds, Biola University, Series 2013: | | | | | | | |
| | 560 | | 5.000%, 10/01/19 | No Opt. Call | | Baa1 | | | 622,154 | |
| | 415 | | 5.000%, 10/01/21 | No Opt. Call | | Baa1 | | | 473,905 | |
| | 1,930 | | California Statewide Communities Development Authority, California, Revenue Bonds, Loma Linda University Medical Center, Series 2014A, 5.250%, 12/01/34 | 12/24 at 100.00 | | BB+ | | | 2,064,926 | |
| | 3,000 | | Golden State Tobacco Securitization Corporation, California, Tobacco Settlement Asset-Backed Bonds, Series 2007A-1, 5.000%, 6/01/33 | 6/17 at 100.00 | | B | | | 2,736,780 | |
| | | | Hesperia Public Financing Authority, California, Redevelopment and Housing Projects Tax Allocation Bonds, Series 2007A: | | | | | | | |
| | 915 | | 5.500%, 9/01/17 – SYNCORA GTY Insured | No Opt. Call | | N/R | | | 953,668 | |
| | 660 | | 5.500%, 9/01/27 – SYNCORA GTY Insured | No Opt. Call | | N/R | | | 679,114 | |
| | 1,265 | | Independent Cities Finance Authority, California, Mobile Home Park Revenue Bonds, Rancho Vallecitos Mobile Home Park, Series 2013, 4.500%, 4/15/23 | No Opt. Call | | A– | | | 1,398,483 | |
| | | | Inland Empire Tobacco Securitization Authority, California, Tobacco Settlement Asset-Backed Bonds, Series 2007: | | | | | | | |
| | 1,345 | | 5.000%, 6/01/21 | 6/17 at 100.00 | | B– | | | 1,346,076 | |
| | 1,075 | | 4.625%, 6/01/21 | 6/17 at 100.00 | | B– | | | 1,066,862 | |
| | | | Jurupa Community Services District, California, Special Tax Bonds, Community Facilities District 31 Eastvale Area, Series 2013: | | | | | | | |
| | 150 | | 4.000%, 9/01/25 | 9/22 at 100.00 | | N/R | | | 158,537 | |
| | 305 | | 4.000%, 9/01/26 | 9/22 at 100.00 | | N/R | | | 321,025 | |
| | 250 | | 4.000%, 9/01/27 | 9/22 at 100.00 | | N/R | | | 261,998 | |
| | 670 | | Palomar Pomerado Health Care District, California, Certificates of Participation, Series 2010, 5.250%, 11/01/21 | 11/20 at 100.00 | | Ba1 | | | 723,808 | |
| | 1,805 | | Patterson Public Financing Authority, California, Revenue Bonds, Community Facilities District 2001-1, Senior Series 2013A, 5.000%, 9/01/22 | No Opt. Call | | N/R | | | 1,995,030 | |
| | 185 | | Riverside County Redevelopment Agency, California, Tax Allocation Housing Bonds, Series 2011A, 0.000%, 10/01/26 | No Opt. Call | | A | | | 169,429 | |
| | Principal | | | Optional Call | | | | | | |
| | Amount (000) | | Description (1) | Provisions (2) | | Ratings (3) | | | Value | |
| | | | California (continued) | | | | | | | |
| $ | 200 | | San Bernardino County Financing Authority, California, Revenue Bonds, Courthouse Facilities Project, Series 2007, 5.100%, 6/01/17 | No Opt. Call | | N/R | | $ | 202,842 | |
| | 340 | | San Diego, California, Community Facilities District 3 Liberty Station Special Tax Refunding Bonds Series 2013, 5.000%, 9/01/17 | No Opt. Call | | N/R | | | 361,090 | |
| | 1,080 | | San Jose Redevelopment Agency, California, Tax Allocation Bonds, Merged Area Redevelopment Project, Series 2005A, 5.000%, 8/01/17 – NPFG Insured | 2/16 at 100.00 | | AA– | | | 1,084,255 | |
| | 955 | | Vernon, California, Electric System Revenue Bonds, Series 2009A, 5.125%, 8/01/21 (Pre-refunded 8/01/19) | 8/19 at 100.00 | | N/R (5) | | | 1,053,604 | |
| | 2,160 | | Vernon, California, Electric System Revenue Bonds, Series 2009A, 5.125%, 8/01/21 | 8/19 at 100.00 | | A– | | | 2,384,445 | |
| | 925 | | Washington Township Health Care District, California, Revenue Bonds, Series 2009A, 6.000%, 7/01/29 | 7/19 at 100.00 | | Baa1 | | | 1,043,160 | |
| | 23,190 | | Total California | | | | | | 24,671,191 | |
| | | | Colorado – 3.8% (3.0% of Total Investments) | | | | | | | |
| | | | Colorado Educational and Cultural Facilities Authority, Charter School Refunding Revenue Bonds, Pinnacle Charter School, Inc. K-8 Facility Project, Series 2013: | | | | | | | |
| | 280 | | 4.000%, 6/01/18 | No Opt. Call | | A | | | 295,162 | |
| | 310 | | 4.000%, 6/01/20 | No Opt. Call | | A | | | 334,524 | |
| | 250 | | 5.000%, 6/01/21 | No Opt. Call | | A | | | 285,170 | |
| | | | Colorado State Board of Governors, Colorado State University Auxiliary Enterprise System Revenue Bonds, Tender Option Bond Trust 3316: | | | | | | | |
| | 100 | | 22.846%, 9/01/22 (IF) (4) | No Opt. Call | | Aa2 | | | 212,250 | |
| | 300 | | 22.846%, 3/01/23 (IF) (4) | No Opt. Call | | Aa2 | | | 652,080 | |
| | 430 | | 22.795%, 3/01/24 (IF) (4) | No Opt. Call | | Aa2 | | | 943,618 | |
| | 725 | | 22.846%, 3/01/25 (IF) (4) | No Opt. Call | | Aa2 | | | 1,576,259 | |
| | 200 | | 22.846%, 9/01/25 (IF) (4) | No Opt. Call | | Aa2 | | | 422,250 | |
| | 200 | | Denver Convention Center Hotel Authority, Colorado, Revenue Bonds, Convention Center Hotel, Senior Lien Series 2006, 4.500%, 12/01/25 – SYNCORA GTY Insured | 11/16 at 100.00 | | BBB– | | | 202,892 | |
| | 350 | | E-470 Public Highway Authority, Colorado, Senior Revenue Bonds, Series 1997B, 0.000%, 9/01/21 – NPFG Insured | No Opt. Call | | AA– | | | 307,349 | |
| | 1,535 | | Lincoln Park Metropolitan District, Douglas County, Colorado, General Obligation Refunding and Improvement Bonds, Series 2008, 5.625%, 12/01/20 (Pre-refunded 12/01/17) | 12/17 at 100.00 | | N/R (5) | | | 1,678,200 | |
| | 4,680 | | Total Colorado | | | | | | 6,909,754 | |
| | | | Florida – 9.1% (7.1% of Total Investments) | | | | | | | |
| | | | Atlantic Beach, Florida, Healthcare Facilities Revenue Refunding Bonds, Fleet Landing Project, Series 2013A: | | | | | | | |
| | 420 | | 5.000%, 11/15/20 | No Opt. Call | | BBB | | | 465,704 | |
| | 150 | | 5.000%, 11/15/23 | No Opt. Call | | BBB | | | 168,347 | |
| | 515 | | Belmont Community Development District, Florida, Capital Improvement Revenue Bonds, Phase 1 Project, Series 2013A, 5.500%, 11/01/23 | No Opt. Call | | N/R | | | 534,585 | |
| | 1,270 | | Broward County, Florida, Fuel System Revenue Bonds, Fort Lauderdale Fuel Facilities LLC Project, Series 2013A, 5.000%, 4/01/23 – AGM Insured (Alternative Minimum Tax) | No Opt. Call | | AA | | | 1,494,879 | |
| | 455 | | Capital Trust Agency, Florida, Fixed Rate Air Cargo Revenue Refunding Bonds, Aero Miami FX, LLC Project, Series 2010A, 5.350%, 7/01/29 | 7/20 at 100.00 | | Baa3 | | | 497,729 | |
| | 2,000 | | Collier County Educational Facilities Authority, Florida, Revenue Bonds, Ave Maria University, Refunding Series 2013A, 4.500%, 6/01/23 | No Opt. Call | | BBB– | | | 2,107,680 | |
| | 1,000 | | Florida Mid-Bay Bridge Authority, Revenue Bonds, 1st Senior Lien Series 2015A, 5.000%, 10/01/23 | No Opt. Call | | BBB+ | | | 1,162,390 | |
| | 2,960 | | Florida Municipal Power Agency, Revenue Bonds, Saint Lucie Project, Refunding Series 2012A, 5.000%, 10/01/26 | No Opt. Call | | A2 | | | 3,451,596 | |
| | | | Martin County Industrial Development Authority, Florida, Industrial Development Revenue Refunding Bonds, Indiantown Cogeneration LP, Series 2013: | | | | | | | |
| | 2,535 | | 3.950%, 12/15/21 (Alternative Minimum Tax) | 6/20 at 100.00 | | Ba1 | | | 2,627,781 | |
| | 500 | | 4.200%, 12/15/25 (Alternative Minimum Tax) | 6/20 at 100.00 | | Ba1 | | | 509,100 | |
| NIQ | Nuveen Intermediate Duration Quality Municipal Term Fund | |
| | Portfolio of Investments (continued) | November 30, 2015 (Unaudited) |
| | Principal | | | Optional Call | | | | | | |
| | Amount (000) | | Description (1) | Provisions (2) | | Ratings (3) | | | Value | |
| | | | Florida (continued) | | | | | | | |
| $ | 1,400 | | Palm Beach County Health Facilities Authority, Florida, Revenue Bonds, Jupiter Medical Center, Series 2013A, 5.000%, 11/01/22 | No Opt. Call | | BBB+ | | $ | 1,581,510 | |
| | 250 | | Seminole Tribe of Florida, Special Obligation Bonds, Series 2007A, 144A, 5.750%, 10/01/22 | 10/17 at 100.00 | | BBB– | | | 264,728 | |
| | 305 | | Southeast Overtown/Park West Community Redevelopment Agency, Florida, Tax Increment Revenue Bonds, Series 2014A-1, 5.000%, 3/01/24 | No Opt. Call | | BBB+ | | | 348,771 | |
| | 1,370 | | Verandah West Community Development District, Florida, Capital Improvement Revenue Bonds, Refunding Series 2013, 4.000%, 5/01/23 | No Opt. Call | | N/R | | | 1,361,944 | |
| | 15,130 | | Total Florida | | | | | | 16,576,744 | |
| | | | Georgia – 3.8% (3.0% of Total Investments) | | | | | | | |
| | 1,025 | | Atlanta, Georgia, Tax Allocation Bonds, Perry Bolton Project Series 2014, 4.000%, 7/01/22 | No Opt. Call | | A– | | | 1,111,356 | |
| | 1,000 | | Atlanta, Georgia, Tax Allocation Bonds, Princeton Lakes Project, Series 2006, 5.500%, 1/01/31 | 1/16 at 100.00 | | BBB– | | | 1,000,910 | |
| | 2,000 | | East Point Building Authority, Georgia, Revenue Bonds, Water & Sewer Project Series 2006A, 5.000%, 2/01/34 – SYNCORA GTY Insured | 2/16 at 100.00 | | N/R | | | 2,003,300 | |
| | 2,000 | | Fulton County Development Authority, Georgia, Revenue Bonds, Robert W. Woodruff Arts Center, Inc. Project, Refunding Series 2009B, 5.000%, 3/15/16 (ETM) | No Opt. Call | | A2 (5) | | | 2,027,260 | |
| | 905 | | Liberty County Industrial Authority, Georgia, Revenue Bonds, Series 2012A-2, 3.930%, 7/01/26 | 1/16 at 100.00 | | N/R | | | 778,027 | |
| | 6,930 | | Total Georgia | | | | | | 6,920,853 | |
| | | | Idaho – 0.6% (0.4% of Total Investments) | | | | | | | |
| | 1,000 | | Madison County, Idaho, Hospital Revenue Certificates of Participation, Madison Memorial Hospital, Series 2006, 5.250%, 9/01/20 | 9/16 at 100.00 | | BB+ | | | 1,017,000 | |
| | | | Illinois – 12.8% (10.0% of Total Investments) | | | | | | | |
| | 2,500 | | Cook County, Illinois, General Obligation Bonds, Tender Option Bond Trust 2015-XF1007, 20.776%, 11/15/25 (IF) (4) | 11/22 at 100.00 | | AA | | | 3,504,300 | |
| | 1,190 | | Hillside, Cook County, Illinois, Tax Increment Revenue Bonds, Mannheim Redevelopment Project, Senior Lien Series 2008, 6.550%, 1/01/20 | 1/18 at 102.00 | | N/R | | | 1,276,251 | |
| | 1,790 | | Illinois Toll Highway Authority, Toll Highway Revenue Bonds, Refunding Senior Lien Series 2014A, 5.000%, 12/01/19 | No Opt. Call | | AA– | | | 2,044,860 | |
| | 1,000 | | Illinois Finance Authority, Charter School Revenue Bonds, Chicago Charter School Foundation, Series 2007, 5.000%, 12/01/26 | 12/16 at 100.00 | | BBB | | | 1,012,040 | |
| | 1,500 | | Illinois Finance Authority, Revenue Bonds, Friendship Village of Schaumburg, Series 2005A, 5.375%, 2/15/25 | 2/16 at 100.00 | | BB– | | | 1,500,165 | |
| | 2,680 | | Illinois Finance Authority, Revenue Bonds, Illinois Institute of Technology, Refunding Series 2006A, 5.000%, 4/01/24 | 4/16 at 100.00 | | Baa3 | | | 2,685,735 | |
| | 250 | | Illinois Finance Authority, Revenue Bonds, Montgomery Place Project, Series 2006A, 5.500%, 5/15/26 | 5/17 at 100.00 | | N/R | | | 253,203 | |
| | 4,000 | | Illinois Municipal Electric Agency, Power Supply System Revenue Bonds, Refunding Series 2015A, 5.000%, 2/01/27 | No Opt. Call | | A1 | | | 4,727,720 | |
| | 5,000 | | Illinois State, General Obligation Bonds, Series 2013, 5.000%, 7/01/23 | No Opt. Call | | A– | | | 5,532,749 | |
| | 1,000 | | Southwestern Illinois Development Authority, Local Government Revenue Bonds, Edwardsville Community Unit School District 7 Project, Series 2007, 0.000%, 12/01/22 – AGM Insured | No Opt. Call | | AA | | | 819,280 | |
| | 20,910 | | Total Illinois | | | | | | 23,356,303 | |
| | | | Indiana – 2.3% (1.8% of Total Investments) | | | | | | | |
| | 1,180 | | Indiana Finance Authority, Educational Facilities Revenue Bonds, 21st Century Charter School Project, Series 2013A, 6.000%, 3/01/33 | 3/23 at 100.00 | | B+ | | | 1,153,851 | |
| | 1,500 | | Indiana Finance Authority, Lease Appropriation Bonds, Stadium Project, Refunding Series 2015A, 5.000%, 2/01/25 | No Opt. Call | | AA+ | | | 1,831,875 | |
| | 1,145 | | Indiana Finance Authority, Private Activity Bonds, Ohio River Bridges East End Crossing Project, Series 2013B, 5.000%, 1/01/19 (Alternative Minimum Tax) | 1/17 at 100.00 | | BBB+ | | | 1,192,735 | |
| | 3,825 | | Total Indiana | | | | | | 4,178,461 | |
| | Principal | | | Optional Call | | | | | | |
| | Amount (000) | | Description (1) | Provisions (2) | | Ratings (3) | | | Value | |
| | | | Iowa – 2.8% (2.2% of Total Investments) | | | | | | | |
| $ | 1,000 | | Iowa Finance Authority, Health Facility Revenue Bonds, Care Initiatives Project, Series 2006A, 5.500%, 7/01/25 | 7/16 at 100.00 | | BB+ | | $ | 1,013,920 | |
| | 2,000 | | Iowa Finance Authority, Iowa, Midwestern Disaster Area Revenue Bonds, Iowa Fertilizer Company Project, Series 2013, 5.000%, 12/01/19 | No Opt. Call | | BB– | | | 2,119,200 | |
| | 2,000 | | Iowa Tobacco Settlement Authority, Tobacco Asset-Backed Revenue Bonds, Series 2005B, 5.600%, 6/01/34 | 6/17 at 100.00 | | B+ | | | 1,991,340 | |
| | 5,000 | | Total Iowa | | | | | | 5,124,460 | |
| | | | Kentucky – 2.1% (1.6% of Total Investments) | | | | | | | |
| | | | Kentucky Economic Development Finance Authority, Louisville Arena Project Revenue Bonds, Louisville Arena Authority, Inc., Series 2008-A1: | | | | | | | |
| | 1,320 | | 5.750%, 12/01/28 – AGC Insured | 6/18 at 100.00 | | AA | | | 1,423,105 | |
| | 115 | | 6.000%, 12/01/33 – AGC Insured | 6/18 at 100.00 | | AA | | | 125,191 | |
| | 3,000 | | Kentucky Public Transportation Infrastructure Authority, First Tier Toll Revenue Bonds, Downtown Crossing Project, Capital Appreciation Series 2013B, 0.000%, 7/01/23 | No Opt. Call | | Baa3 | | | 2,245,590 | |
| | 4,435 | | Total Kentucky | | | | | | 3,793,886 | |
| | | | Louisiana – 0.9% (0.7% of Total Investments) | | | | | | | |
| | 500 | | Louisiana Local Government Environmental Facilities & Community Development Authority, Revenue Bonds, Westlake Chemical Corporation Project, Series 2007, 6.750%, 11/01/32 | 11/17 at 100.00 | | BBB+ | | | 541,235 | |
| | 1,000 | | New Orleans, Louisiana, Water Revenue Bonds, Refunding Series 2014, 5.000%, 12/01/22 | No Opt. Call | | A– | | | 1,176,770 | |
| | 1,500 | | Total Louisiana | | | | | | 1,718,005 | |
| | | | Maine – 2.4% (1.9% of Total Investments) | | | | | | | |
| | 1,000 | | Maine Health and Higher Educational Facilities Authority Revenue Bonds, Eastern Maine Medical Center Obligated Group Issue, Series 2013, 5.000%, 7/01/33 | 7/23 at 100.00 | | BBB | | | 1,078,750 | |
| | | | Maine Turnpike Authority, Special Obligation Bonds, Series 2014: | | | | | | | |
| | 620 | | 5.000%, 7/01/25 | No Opt. Call | | A | | | 743,876 | |
| | 340 | | 5.000%, 7/01/27 | No Opt. Call | | A | | | 400,139 | |
| | 1,850 | | 5.000%, 7/01/29 | No Opt. Call | | A | | | 2,146,426 | |
| | 3,810 | | Total Maine | | | | | | 4,369,191 | |
| | | | Maryland – 1.0% (0.8% of Total Investments) | | | | | | | |
| | | | Maryland Health and Higher Educational Facilities Authority, Revenue Bonds, Frederick Memorial Hospital Issue, Series 2012A: | | | | | | | |
| | 195 | | 5.000%, 7/01/20 | No Opt. Call | | Baa1 | | | 220,329 | |
| | 275 | | 5.000%, 7/01/22 | No Opt. Call | | Baa1 | | | 317,592 | |
| | 1,000 | | Prince George's County, Maryland, General Obligation Consolidated Public Improvement Bonds, Series 2011A, 5.000%, 9/15/22 | No Opt. Call | | AAA | | | 1,209,740 | |
| | 1,470 | | Total Maryland | | | | | | 1,747,661 | |
| | | | Massachusetts – 2.0% (1.5% of Total Investments) | | | | | | | |
| | 250 | | Massachusetts Development Finance Agency, First Mortgage Revenue Bonds, Brookhaven at Lexington Project, Series 2005A, 5.000%, 3/01/35 – RAAI Insured | 3/16 at 100.00 | | AA | | | 250,585 | |
| | 1,000 | | Massachusetts Development Finance Agency, Resource Recovery Revenue Bonds, Covanta Energy Project, Series 2012A, 4.875%, 11/01/27 (Alternative Minimum Tax) | No Opt. Call | | BB+ | | | 1,007,980 | |
| | 420 | | Massachusetts Development Finance Agency, Revenue Bonds, Boston Medical Center Issue, Series 2012C, 5.000%, 7/01/29 | 7/22 at 100.00 | | BBB | | | 461,030 | |
| | | | Massachusetts Development Finance Agency, Revenue Bonds, Boston Medical Center Issue, Series 2012C: | | | | | | | |
| | 80 | | 5.000%, 7/01/29 (Pre-refunded 7/01/22) | 7/22 at 100.00 | | N/R (5) | | | 96,606 | |
| | 500 | | 5.000%, 7/01/29 (Pre-refunded 7/01/22) | 7/22 at 100.00 | | Baa2 (5) | | | 603,790 | |
| | | | Massachusetts Port Authority, Special Facilities Revenue Bonds, Delta Air Lines Inc., Series 2001A: | | | | | | | |
| | 140 | | 5.000%, 1/01/21 – AMBAC Insured | 1/16 at 100.00 | | N/R | | | 140,291 | |
| | 1,000 | | 5.000%, 1/01/27 – AMBAC Insured (Alternative Minimum Tax) | 1/16 at 100.00 | | N/R | | | 1,002,620 | |
| | 3,390 | | Total Massachusetts | | | | | | 3,562,902 | |
| NIQ | Nuveen Intermediate Duration Quality Municipal Term Fund |
| | Portfolio of Investments (continued) | November 30, 2015 (Unaudited) |
| | Principal | | | Optional Call | | | | | |
| | Amount (000) | | Description (1) | Provisions (2) | | Ratings (3) | | Value | |
| | | | Michigan – 8.1% (6.3% of Total Investments) | | | | | | |
| $ | 1,000 | | Detroit City School District, Wayne County, Michigan, General Obligation Bonds, Tender Option Bond Trust 3308, 23.015%, 11/01/26 – AGM Insured (IF) (4) | No Opt. Call | | Aa1 | $ | 1,884,450 | |
| | 62 | | Detroit, Michigan, General Obligation Bonds, Series 2005A, 5.000%, 4/01/25 – AGM Insured | 4/16 at 100.00 | | AA | | 62,483 | |
| | | | Detroit, Michigan, Sewer Disposal System Revenue Bonds, Second Lien, Series 2006B: | | | | | | |
| | 50 | | 5.000%, 7/01/33 – NPFG Insured | 7/16 at 100.00 | | AA– | | 50,535 | |
| | 60 | | 5.000%, 7/01/33 – FGIC Insured | 7/16 at 100.00 | | AA– | | 60,641 | |
| | 1,260 | | 5.000%, 7/01/36 – MBIA-NPFG Insured | 7/16 at 100.00 | | AA– | | 1,273,469 | |
| | 735 | | Detroit, Michigan, Water Supply System Second Lien Revenue Bonds, Series 2003B, 5.000%, 7/01/34 – NPFG Insured | 1/16 at 100.00 | | AA– | | 737,426 | |
| | 250 | | Detroit, Michigan, Water Supply System Second Lien Revenue Bonds, Series 2006A, 5.000%, 7/01/34 – AGM Insured | 7/16 at 100.00 | | AA | | 252,833 | |
| | 290 | | Detroit, Michigan, Water Supply System Second Lien Revenue Refunding Bonds, Series 2006C, 5.000%, 7/01/33 – AGM Insured | No Opt. Call | | AA | | 293,286 | |
| | 165 | | Detroit, Michigan, Water Supply System Senior Lien Revenue Bonds, Series 2003A, 5.000%, 7/01/34 – NPFG Insured | 1/16 at 100.00 | | A3 | | 165,533 | |
| | 440 | | Detroit, Michigan, Water Supply System Senior Lien Revenue Bonds, Series 2003D. RMKTD, 5.000%, 7/01/33 – NPFG Insured | No Opt. Call | | AA– | | 444,704 | |
| | 10 | | Detroit, Michigan, Water Supply System Senior Lien Revenue Refunding Bonds, Series 2006D, 5.000%, 7/01/32 – AGM Insured | 7/16 at 100.00 | | AA | | 10,113 | |
| | 730 | | Flint Hospital Building Authority, Michigan, Building Authority Revenue Bonds, Hurley Medical Center, Series 2013A, 5.000%, 7/01/23 | No Opt. Call | | BBB– | | 756,536 | |
| | 338 | | Michigan Finance Authority, Detroit, Michigan, Local Government Loan Program, Unlimited Tax General Obligation Bonds, Series 2014G-8A, 5.000%, 4/01/25 – AGM Insured | 4/16 at 100.00 | | AA | | 340,633 | |
| | 2,020 | | Michigan Finance Authority, Hospital Revenue Bonds, Crittenton Hospital Medical Center, Refunding Series 2012A, 4.125%, 6/01/32 (Pre-refunded 6/01/22) | 6/22 at 100.00 | | N/R (5) | | 2,310,920 | |
| | 3,000 | | Michigan Finance Authority, Local Government Loan Program Revenue Bonds, Detroit Water & Sewerage Department Water Supply System Local Project, Refunding Senior Loan Series 2014D-1, 5.000%, 7/01/23 – AGM Insured | No Opt. Call | | AA | | 3,489,449 | |
| | 190 | | Michigan Finance Authority, Public School Academy Limited Obligation Revenue Bonds, Old Redford Academy Project, Series 2010A, 5.250%, 12/01/20 | No Opt. Call | | BB | | 194,144 | |
| | 1,405 | | Michigan Finance Authority, Revenue Bonds, Trinity Health Credit Group, Tender Option Bond Trust 2015-XF0126, 22.219%, 12/01/18 (IF) (4) | No Opt. Call | | AA– | | 2,355,862 | |
| | 12,005 | | Total Michigan | | | | | 14,683,017 | |
| | | | Minnesota – 1.5% (1.2% of Total Investments) | | | | | | |
| | 750 | | Rochester, Minnesota, Health Care Facilities Revenue Bonds, Olmsted Medical Center Project, Series 2013, 5.000%, 7/01/20 | No Opt. Call | | A– | | 855,548 | |
| | | | Saint Paul Housing and Redevelopment Authority, Minnesota, Lease Revenue Bonds, Saint Paul Conservatory for Performing Artists Charter School Project, Series 2013A: | | | | | | |
| | 205 | | 3.550%, 3/01/21 | No Opt. Call | | BBB– | | 206,937 | |
| | 100 | | 3.700%, 3/01/22 | No Opt. Call | | BBB– | | 101,555 | |
| | | | Sauk Rapids, Minnesota, Health Care and Housing Facilities Revenue Bonds, Good Shepherd Lutheran Home, Refunding Series 2013: | | | | | | |
| | 610 | | 5.000%, 1/01/17 | No Opt. Call | | N/R | | 626,824 | |
| | 500 | | 5.000%, 1/01/18 | No Opt. Call | | N/R | | 523,580 | |
| | 500 | | 5.000%, 1/01/19 | No Opt. Call | | N/R | | 530,620 | |
| | 2,665 | | Total Minnesota | | | | | 2,845,064 | |
| | | | Mississippi – 2.5% (2.0% of Total Investments) | | | | | | |
| | | | Mississippi Development Bank Special Obligation Bonds, Marshall County Industrial Development Authority, Mississippi Highway Construction Project, Tender Option Bond Trust 3315: | | | | | | |
| | 800 | | 22.598%, 1/01/20 (IF) (4) | No Opt. Call | | AA– | | 1,449,480 | |
| | 1,000 | | 22.598%, 1/01/20 (IF) (4) | No Opt. Call | | AA– | | 1,780,950 | |
| | 200 | | 22.598%, 1/01/20 (IF) (4) | No Opt. Call | | AA– | | 347,000 | |
| | 1,000 | | Mississippi Hospital Equipment and Facilities Authority, Revenue Bonds, South Central Regional Medical Center, Refunding & Improvement Series 2006, 5.250%, 12/01/21 | 12/16 at 100.00 | | BBB | | 1,030,270 | |
| | 3,000 | | Total Mississippi | | | | | 4,607,700 | |
| | Principal | | | Optional Call | | | | | | |
| | Amount (000) | | Description (1) | Provisions (2) | | Ratings (3) | | | Value | |
| | | | Missouri – 2.8% (2.2% of Total Investments) | | | | | | | |
| $ | 500 | | Franklin County Industrial Development Authority, Missouri, Sales Tax Refunding Revenue Bonds, Phoenix Center II Community Improvement District Project, Series 2013A, 4.000%, 11/01/25 | 11/20 at 100.00 | | N/R | | $ | 517,025 | |
| | 1,000 | | Kansas City Tax Increment Financing Commission, Missouri, Tax Increment Revenue Bonds, Briarcliff West Project, Series 2006A, 5.400%, 6/01/24 | 6/16 at 100.00 | | N/R | | | 1,008,940 | |
| | 3,000 | | Missouri Joint Municipal Electric Utility Commission, Power Project Revenue Bonds, Plum Point Project, Refunding Series 2014A, 5.000%, 1/01/23 | No Opt. Call | | A | | | 3,572,160 | |
| | 4,500 | | Total Missouri | | | | | | 5,098,125 | |
| | | | Nebraska – 1.8% (1.4% of Total Investments) | | | | | | | |
| | 3,000 | | Central Plains Energy Project, Nebraska, Gas Project 3 Revenue Bonds, Series 2012, 5.000%, 9/01/32 | 9/22 at 100.00 | | A | | | 3,306,300 | |
| | | | New Jersey – 6.7% (5.2% of Total Investments) | | | | | | | |
| | 615 | | New Jersey Economic Development Authority, Charter School Revenue Bonds, Lady Liberty Academy Charter School Project, Series 2013A, 5.150%, 8/01/23 | No Opt. Call | | B | | | 511,133 | |
| | | | New Jersey Economic Development Authority, Cigarette Tax Revenue Refunding Bonds, Series 2012: | | | | | | | |
| | 2,000 | | 5.000%, 6/15/24 | 6/22 at 100.00 | | BBB+ | | | 2,166,160 | |
| | 1,000 | | 5.000%, 6/15/28 | No Opt. Call | | BBB+ | | | 1,057,250 | |
| | | | New Jersey Economic Development Authority, Private Activity Bonds, The Goethals Bridge Replacement Project, Series 2013: | | | | | | | |
| | 860 | | 5.000%, 1/01/21 (Alternative Minimum Tax) | No Opt. Call | | BBB | | | 973,486 | |
| | 500 | | 5.000%, 1/01/22 (Alternative Minimum Tax) | No Opt. Call | | BBB | | | 572,585 | |
| | 500 | | 5.000%, 7/01/22 (Alternative Minimum Tax) | No Opt. Call | | BBB | | | 575,200 | |
| | 620 | | 5.000%, 1/01/23 (Alternative Minimum Tax) | No Opt. Call | | BBB | | | 709,460 | |
| | 1,000 | | New Jersey Economic Development Authority, School Facilities Construction Financing Program Bonds, Tender Option Bond Trust 1151, 2.712%, 9/01/25 (IF) (4) | 3/25 at 100.00 | | A– | | | 477,600 | |
| | 1,000 | | New Jersey Economic Development Authority, Special Facilities Revenue Bonds, Continental Airlines Inc., Series 1999, 5.250%, 9/15/29 (Alternative Minimum Tax) | 9/22 at 101.00 | | BB– | | | 1,092,390 | |
| | 1,045 | | New Jersey Health Care Facilities Financing Authority, New Jersey, Revenue Bonds, Saint Peters University Hospital, Series 2007, 5.250%, 7/01/21 | 7/18 at 100.00 | | BB+ | | | 1,098,002 | |
| | 195 | | New Jersey Health Care Facilities Financing Authority, Revenue Bonds, Saint Joseph's Healthcare System Obligated Group Issue, Series 2008, 6.000%, 7/01/18 | No Opt. Call | | BBB– | | | 205,255 | |
| | 3,000 | | Tobacco Settlement Financing Corporation, New Jersey, Tobacco Settlement Asset-Backed Bonds, Series 2007-1A, 5.000%, 6/01/29 | 6/17 at 100.00 | | B | | | 2,717,310 | |
| | 12,335 | | Total New Jersey | | | | | | 12,155,831 | |
| | | | New York – 5.0% (3.9% of Total Investments) | | | | | | | |
| | 495 | | Buffalo and Erie County Industrial Land Development Corporation, New York, Revenue Bonds, Catholic Health System, Inc. Project, Series 2015, 5.000%, 7/01/29 | 7/25 at 100.00 | | BBB+ | | | 563,439 | |
| | 500 | | Buffalo and Fort Erie Public Bridge Authority, New York, Toll Bridge System Revenue Bonds, Refunding Series 2014, 5.000%, 1/01/18 | No Opt. Call | | A+ | | | 541,615 | |
| | | | New York City Industrial Development Agency, New York, American Airlines-JFK International Airport Special Facility Revenue Bonds, Series 2005: | | | | | | | |
| | 385 | | 7.500%, 8/01/16 (Alternative Minimum Tax) | No Opt. Call | | N/R | | | 395,152 | |
| | 2,000 | | 7.625%, 8/01/25 (Alternative Minimum Tax) | 8/16 at 101.00 | | N/R | | | 2,099,580 | |
| | | | New York City Industrial Development Agency, New York, Civic Facility Revenue Bonds, Vaughn College of Aeronautics, Series 2006A: | | | | | | | |
| | 100 | | 5.000%, 12/01/16 | No Opt. Call | | BB | | | 102,300 | |
| | 1,800 | | 5.000%, 12/01/21 | 12/16 at 100.00 | | BB | | | 1,860,228 | |
| | 65 | | New York City Industrial Development Agency, New York, Civic Facility Revenue Bonds, Vaughn College of Aeronautics, Series 2006B, 5.000%, 12/01/16 | No Opt. Call | | BB | | | 66,495 | |
| | 2,000 | | New York Convention Center Development Corporation, New York, Hotel Unit Fee Secured Revenue Bonds, Refunding Series 2015, 5.000%, 11/15/25 | No Opt. Call | | Aa3 | | | 2,462,660 | |
| | 1,000 | | Suffolk County Industrial Development Agency, New York, Continuing Care Retirement Community Revenue Bonds, Jefferson's Ferry Project, Series 2006, 5.000%, 11/01/28 | 11/16 at 100.00 | | BBB– | | | 1,018,410 | |
| | 8,345 | | Total New York | | | | | | 9,109,879 | |
| NIQ | Nuveen Intermediate Duration Quality Municipal Term Fund |
| | Portfolio of Investments (continued) | November 30, 2015 (Unaudited) |
| | Principal | | | Optional Call | | | | | | |
| | Amount (000) | | Description (1) | Provisions (2) | | Ratings (3) | | | Value | |
| | | | North Carolina – 0.9% (0.7% of Total Investments) | | | | | | | |
| $ | 1,040 | | North Carolina Eastern Municipal Power Agency, Power System Revenue Bonds, Refunding Series 1993B, 6.000%, 1/01/18 – AMBAC Insured (ETM) | No Opt. Call | | AAA | | $ | 1,150,167 | |
| | 400 | | North Carolina Turnpike Authority, Triangle Expressway System Revenue Bonds, Series 2009A, 5.250%, 1/01/25 – AGC Insured | No Opt. Call | | AA | | | 434,704 | |
| | 1,440 | | Total North Carolina | | | | | | 1,584,871 | |
| | | | Ohio – 4.9% (3.8% of Total Investments) | | | | | | | |
| | 3,500 | | Buckeye Tobacco Settlement Financing Authority, Ohio, Tobacco Settlement Asset-Backed Revenue Bonds, Senior Lien, Series 2007A-2, 5.875%, 6/01/30 | 6/17 at 100.00 | | B– | | | 3,129,630 | |
| | 2,000 | | Ohio Air Quality Development Authority, Ohio, Revenue Bonds, Ohio Valley Electric Corporation Project, Series 2009E, 5.625%, 10/01/19 | No Opt. Call | | BBB– | | | 2,230,660 | |
| | 1,150 | | Ohio State Treasurer, Tax-Exempt Private Activity Bonds, Portsmouth Gateway Group, LLC – Borrower, Portsmouth Bypass Project, Series 2015, 5.000%, 12/31/27 – AGM Insured (Alternative Minimum Tax) | 6/25 at 100.00 | | AA | | | 1,328,894 | |
| | 2,000 | | Ross County, Ohio, Hospital Revenue Refunding Bonds, Adena Health System Series 2008, 5.750%, 12/01/28 | 12/18 at 100.00 | | A– | | | 2,233,020 | |
| | 8,650 | | Total Ohio | | | | | | 8,922,204 | |
| | | | Oregon – 0.6% (0.5% of Total Investments) | | | | | | | |
| | 965 | | Astoria Hospital Facilities Authority, Oregon, Hospital Revenue and Refunding Bonds, Columbia Memorial Hospital, Series 2012, 5.000%, 8/01/22 | No Opt. Call | | BBB– | | | 1,085,866 | |
| | | | Pennsylvania – 4.2% (3.3% of Total Investments) | | | | | | | |
| | 90 | | East Hempfield Township Industrial Development Authority, Pennsylvania, Student Services Inc – Student Housing Project at Millersville University, Series 2013, 4.000%, 7/01/19 | No Opt. Call | | BBB– | | | 94,831 | |
| | | | Erie Higher Education Building Authority, Pennsylvania, Revenue Bonds, Gannon University Project, Series 2013: | | | | | | | |
| | 465 | | 4.000%, 5/01/20 | No Opt. Call | | BBB | | | 504,767 | |
| | 480 | | 4.000%, 5/01/21 | No Opt. Call | | BBB | | | 521,270 | |
| | 500 | | 4.000%, 5/01/22 | No Opt. Call | | BBB | | | 541,440 | |
| | 520 | | 4.000%, 5/01/23 | No Opt. Call | | BBB | | | 563,347 | |
| | 2,190 | | Erie Sewer Authority, Erie County, Pennsylvania, Sewer Revenue Bonds, Series 2012A, 5.000%, 6/01/21 – AGM Insured | No Opt. Call | | AA | | | 2,552,292 | |
| | 1,700 | | Pennsylvania Economic Development Financing Authority, Private Activity Revenue Bonds, Pennsylvania Rapid Bridge Replacement Project, Series 2015, 5.000%, 6/30/28 (Alternative Minimum Tax) | 6/26 at 100.00 | | BBB | | | 1,912,704 | |
| | | | Southcentral Pennsylvania General Authority, Revenue Bonds, Hanover Hospital Inc., Series 2013: | | | | | | | |
| | 370 | | 5.000%, 12/01/20 | No Opt. Call | | BBB | | | 418,992 | |
| | 435 | | 5.000%, 12/01/21 | No Opt. Call | | BBB | | | 494,443 | |
| | 6,750 | | Total Pennsylvania | | | | | | 7,604,086 | |
| | | | Rhode Island – 1.8% (1.4% of Total Investments) | | | | | | | |
| | 3,000 | | Rhode Island Health & Educational Building Corporation, Public Schools Financing Program Revenue Bonds, Pooled Series 2009E, 6.000%, 5/15/29 – AGC Insured | 5/19 at 100.00 | | A3 | | | 3,278,040 | |
| | | | South Carolina – 1.9% (1.5% of Total Investments) | | | | | | | |
| | 1,000 | | Piedmont Municipal Power Agency, South Carolina, Electric Revenue Bonds, Series 2010-A2, 5.000%, 1/01/18 | No Opt. Call | | A– | | | 1,081,720 | |
| | 2,000 | | South Carolina Public Service Authority, Santee Cooper Revenue Obligations, Refunding Series 2014B, 5.000%, 12/01/31 | 6/24 at 100.00 | | AA– | | | 2,324,300 | |
| | 3,000 | | Total South Carolina | | | | | | 3,406,020 | |
| | | | Tennessee – 6.3% (4.9% of Total Investments) | | | | | | | |
| | | | Knox County Health, Educational and Housing Facility Board, Tennessee, Hospital Revenue Refunding Bonds, Covenant Health, Series 2012A: | | | | | | | |
| | 1,440 | | 5.000%, 1/01/25 | No Opt. Call | | A | | | 1,671,912 | |
| | 2,170 | | 5.000%, 1/01/26 | No Opt. Call | | A | | | 2,502,748 | |
| | Principal | | | Optional Call | | | | | | |
| | Amount (000) | | Description (1) | Provisions (2) | | Ratings (3) | | | Value | |
| | | | Tennessee (continued) | | | | | | | |
| $ | 2,000 | | Memphis-Shelby County Airport Authority, Tennessee, Airport Revenue Bonds, Series 2010B, 5.750%, 7/01/22 (Alternative Minimum Tax) | 7/20 at 100.00 | | A | | $ | 2,322,820 | |
| | 400 | | The Tennessee Energy Acquisition Corporation, Gas Revenue Bonds, Series 2006B, 5.625%, 9/01/26 | No Opt. Call | | BBB | | | 461,056 | |
| | | | The Tennessee Energy Acquisition Corporation, Gas Revenue Bonds, Series 2006C: | | | | | | | |
| | 1,020 | | 5.000%, 2/01/21 | No Opt. Call | | A | | | 1,159,332 | |
| | 1,490 | | 5.000%, 2/01/24 | No Opt. Call | | A | | | 1,717,255 | |
| | 1,365 | | 5.000%, 2/01/25 | No Opt. Call | | A | | | 1,587,126 | |
| | 9,885 | | Total Tennessee | | | | | | 11,422,249 | |
| | | | Texas – 9.9% (7.8% of Total Investments) | | | | | | | |
| | 200 | | Central Texas Regional Mobility Authority, Revenue Bonds, Senior Lien Series 2010, 5.750%, 1/01/25 | 1/20 at 100.00 | | BBB+ | | | 222,340 | |
| | 500 | | Central Texas Regional Mobility Authority, Revenue Bonds, Subordinate Lien Refunding Series 2013, 5.000%, 1/01/22 | No Opt. Call | | BBB | | | 553,920 | |
| | 685 | | Denton County Fresh Water Supply District 7, Texas, General Obligation Bonds, Refunding Series 2013, 4.000%, 2/15/21 – AGM Insured | No Opt. Call | | AA | | | 738,348 | |
| | 2,000 | | Gulf Coast Industrial Development Authority, Texas, Solid Waste Disposal Revenue Bonds, Citgo Petroleum Corporation Project, Series 1995, 4.875%, 5/01/25 (Alternative Minimum Tax) | 10/22 at 100.00 | | BB | | | 2,093,560 | |
| | | | Harris County-Houston Sports Authority, Texas, Revenue Bonds, Refunding Second Lien Series 2014C: | | | | | | | |
| | 230 | | 5.000%, 11/15/22 | No Opt. Call | | A3 | | | 268,433 | |
| | 1,660 | | 5.000%, 11/15/23 | No Opt. Call | | A3 | | | 1,955,032 | |
| | 960 | | 5.000%, 11/15/25 | 11/24 at 100.00 | | A3 | | | 1,127,251 | |
| | 515 | | Houston, Texas, Hotel Occupancy Tax and Special Revenue Bonds, Convention and Entertainment Facilities Department, Refunding Series 2011A, 5.250%, 9/01/19 | No Opt. Call | | A2 | | | 587,218 | |
| | | | Irving, Texas, Hotel Occupancy Tax Revenue Bonds, Series 2014B: | | | | | | | |
| | 465 | | 4.000%, 8/15/22 | 8/19 at 100.00 | | BBB+ | | | 487,404 | |
| | 535 | | 4.000%, 8/15/23 | 8/19 at 100.00 | | BBB+ | | | 557,962 | |
| | 100 | | Love Field Airport Modernization Corporation, Texas, Special Facilities Revenue Bonds, Southwest Airlines Company – Love Field Modernization Program Project, Series 2012, 5.000%, 11/01/20 (Alternative Minimum Tax) | No Opt. Call | | Baa1 | | | 112,539 | |
| | | | Tarrant County Cultural Education Facilities Finance Corporation, Texas, Hospital Revenue Bonds, Scott & White Healthcare Project, Tender Option Bond Trust 1149: | | | | | | | |
| | 100 | | 21.953%, 8/15/22 (IF) (4) | No Opt. Call | | AA– | | | 191,065 | |
| | 155 | | 21.747%, 8/15/24 (IF) (4) | 8/23 at 100.00 | | AA– | | | 297,394 | |
| | 200 | | 21.953%, 8/15/26 (IF) (4) | 8/23 at 100.00 | | AA– | | | 368,930 | |
| | 175 | | 21.706%, 8/15/27 (IF) (4) | 8/23 at 100.00 | | AA– | | | 313,791 | |
| | 3,000 | | Texas Municipal Gas Acquisition and Supply Corporation I, Gas Supply Revenue Bonds, Senior Lien Series 2008D, 6.250%, 12/15/26 | No Opt. Call | | BBB+ | | | 3,669,900 | |
| | 3,000 | | Texas Municipal Gas Acquisition and Supply Corporation III, Gas Supply Revenue Bonds, Series 2012, 5.000%, 12/15/27 | No Opt. Call | | A3 | | | 3,358,080 | |
| | 230 | | Texas Public Finance Authority Charter School Finance Corporation, Education Revenue Bonds, Uplift Education, Series 2007A, 5.750%, 12/01/27 | 12/17 at 100.00 | | BBB– | | | 243,172 | |
| | 360 | | Texas Public Finance Authority, Revenue Bonds, Texas Southern University Financing System, Series 2011, 6.000%, 5/01/23 | 5/21 at 100.00 | | BBB | | | 405,108 | |
| | 460 | | Waco Health Facilities Development Corporation, Texas, Hillcrest Health System Project, FHA Insured Mortgage Revenue Bonds, Series 2006A, 5.000%, 8/01/31 (Pre-refunded 8/01/16) – NPFG Insured | 8/16 at 100.00 | | AA– (5) | | | 474,329 | |
| | 15,530 | | Total Texas | | | | | | 18,025,776 | |
| | | | Utah – 1.7% (1.4% of Total Investments) | | | | | | | |
| | 3,000 | | Salt Lake County, Utah, Research Facility Revenue Bonds, Huntsman Cancer Foundation, Series 2013A-1, 5.000%, 12/01/33 (Mandatory put 12/15/20) | 12/18 at 100.00 | | N/R | | | 3,173,250 | |
| NIQ | Nuveen Intermediate Duration Quality Municipal Term Fund | |
| | Portfolio of Investments (continued) | November 30, 2015 (Unaudited) |
| | Principal | | | Optional Call | | | | | | |
| | Amount (000) | | Description (1) | Provisions (2) | | Ratings (3) | | | Value | |
| | | | Vermont – 0.5% (0.4% of Total Investments) | | | | | | | |
| $ | 900 | | Vermont Economic Development Authority, Solid Waste Disposal Revenue Bonds, Casella Waste Systems, Inc. Project, Series 2013, 4.750%, 4/01/36 (Mandatory put 4/02/18) (Alternative Minimum Tax) | No Opt. Call | | B+ | | $ | 904,968 | |
| | | | Virgin Islands – 1.2% (0.9% of Total Investments) | | | | | | | |
| | 2,000 | | Virgin Islands Public Finance Authority, Gross Receipts Taxes Loan Note, Refunding Series 2012A, 4.000%, 10/01/22 – AGM Insured | No Opt. Call | | AA | | | 2,130,660 | |
| | | | Virginia – 0.3% (0.3% of Total Investments) | | | | | | | |
| | 535 | | Chesapeake, Virginia, Transportation System Senior Toll Road Revenue Bonds, Series 2012A, 5.000%, 7/15/21 | No Opt. Call | | BBB | | | 612,142 | |
| | | | Washington – 0.5% (0.4% of Total Investments) | | | | | | | |
| | 700 | | Port of Seattle, Washington, Revenue Bonds, Intermediate Lien Series 2015A, 5.000%, 4/01/27 | 10/24 at 100.00 | | A+ | | | 830,942 | |
| | | | West Virginia – 0.6% (0.4% of Total Investments) | | | | | | | |
| | 1,035 | | West Virginia Economic Development Authority, Solid Waste Disposal Facilities Revenue Bonds, Appalachian Power Company – Amos Project, Refunding Series 2015A, 1.900%, 3/01/40 | No Opt. Call | | Baa1 | | | 1,040,806 | |
| | | | Wisconsin – 0.5% (0.4% of Total Investments) | | | | | | | |
| | | | University of Wisconsin Hospitals and Clinics Authority, Revenue Bonds, Tender Option Bond Trust 2015-XF0127: | | | | | | | |
| | 100 | | 21.517%, 10/01/20 (IF) (4) | No Opt. Call | | Aa3 | | | 204,440 | |
| | 185 | | 21.126%, 10/01/20 (IF) (4) | No Opt. Call | | Aa3 | | | 363,730 | |
| | 100 | | 21.517%, 10/01/20 (IF) (4) | No Opt. Call | | Aa3 | | | 193,435 | |
| | 435 | | Total Wisconsin | | | | | | 857,795 | |
| $ | 208,825 | | Total Long-Term Investments (cost $228,284,852) | | | | | | 232,471,910 | |
| | | | Variable Rate MuniFund Term Preferred Shares, at Liquidation Value – (30.3)% (6) | | | | | | (55,000,000 | ) |
| | | | Other Assets Less Liabilities – 2.4% (7) | | | | | | 4,345,611 | |
| | | | Net Assets Applicable to Common Shares – 100% | | | | | $ | 181,817,521 | |
Investments in Derivatives as of November 30, 2015
Interest Rate Swaps:
| | | | | | | | | | | | | | | | | | | Variation | | | |
| | | | | Fund | | | | | | Fixed Rate | | | | | | | | Margin | | Unrealized | |
| | | Notional | | Pay/Receive | | Floating Rate | | Fixed Rate | | Payment | | Effective | | Termination | | | | Receivable/ | | Appreciation | |
| Counterparty | | Amount | | Floating Rate | | Index | | (Annualized) | | Frequency | | Date (8) | | Date | | Value | | Payable | | (Depreciation) | |
| Barclays* | | $ 4,600,000 | | Receive | | 3-Month USD LIBOR-ICE | | 2.504 | % | Semi-Annually | | 9/20/16 | | 9/20/26 | | $(104,229) | | $(12,937) | | $(104,229) | |
| JPMorgan* | | 6,700,000 | | Receive | | 3-Month USD LIBOR-ICE | | 2.857 | | Semi-Annually | | 7/13/16 | | 7/13/26 | | (393,025) | | (8,670) | | (393,025) | |
| JPMorgan | | 9,800,000 | | Receive | | Weekly USD-SIFMA | | 1.947 | | Quarterly | | 6/09/16 | | 6/09/26 | | (292,087) | | N/A | | (292,087) | |
| | | $21,100,000 | | | | | | | | | | | | | | $(789,341) | | $(21,607) | | $(789,341) | |
| * | Citigroup is the clearing broker for this transaction. |
| (1) | All percentages shown in the Portfolio of Investments are based on net assets applicable to common shares unless otherwise noted. |
| (2) | Optional Call Provisions: Dates (month and year) and prices of the earliest optional call or redemption. There may be other call provisions at varying prices at later dates. Certain mortgage-backed securities may be subject to periodic principal paydowns. |
| (3) | Ratings: Using the highest of Standard & Poor's Group ("Standard & Poor's"), Moody's Investors Service, Inc. ("Moody's") or Fitch, Inc. ("Fitch") rating. Ratings below BBB by Standard & Poor's, Baa by Moody's or BBB by Fitch are considered to be below investment grade. Holdings designated N/R are not rated by any of these national rating agencies. |
| (4) | Investment, or portion of investment, has been pledged to collateralize the net payment obligations for investments in inverse floating rate transactions. |
| (5) | Backed by an escrow or trust containing sufficient U.S. Government or U.S. Government agency securities, which ensure the timely payment of principal and interest. Certain bonds backed by U.S. Government or agency securities are regarded as having an implied rating equal to the rating of such securities. |
| (6) | Variable Rate MuniFund Term Preferred Shares, at Liquidation Value as a percentage of Total Investments is 23.7%. |
| (7) | Other assets less liabilities includes the unrealized appreciation (depreciation) of certain over-the-counter derivatives as presented on the Statement of Assets and Liabilities. The unrealized appreciation (depreciation) of exchange-cleared and exchange-traded derivatives is recognized as part of the cash collateral at brokers and/or the receivable or payable for variation margin as presented on the Statement of Assets and Liabilities, when applicable. |
| (8) | Effective date represents the date on which both the Fund and counterparty commence interest payment accruals on each contract. |
| (ETM) | Escrowed to maturity. |
| (IF) | Inverse floating rate investment. |
| 144A | Investment is exempt from registration under Rule 144A of the Securities Act of 1933, as amended. These investments may only be resold in transactions exempt from registration, which are normally those transactions with qualified institutional buyers. |
| USD LIBOR-ICE | United States Dollar-London Inter-Bank Offered Rate Intercontinental Exchange |
| USD-SIFMA | United States Dollar-Securities Industry and Financial Markets Association |
See accompanying notes to financial statements.
| Statement of | |
| | Assets and Liabilities | November 30, 2015 (Unaudited) |
| | | | | | | Intermediate | |
| | | | Intermediate | | | Duration | |
| | | | Duration | | | Quality | |
| | | | (NID | ) | | (NIQ | ) |
| Assets | | | | | | | |
| Long-term investments, at value (cost $803,311,612 and $228,284,852, respectively) | | $ | 805,587,721 | | $ | 232,471,910 | |
| Short-term investments, at value (cost $1,440,000 and $—, respectively) | | | 1,441,138 | | | — | |
| Cash | | | — | | | 365,374 | |
Cash collateral at brokers(1) | | | 1,592,709 | | | 781,751 | |
| Receivable for: | | | | | | | |
| Interest | | | 14,935,811 | | | 4,102,463 | |
| Investments sold | | | 1,220,000 | | | 190,000 | |
| Deferred offering costs | | | 35,018 | | | 10,524 | |
| Other assets | | | 25,354 | | | 1,575 | |
| Total assets | | | 824,837,751 | | | 237,923,597 | |
| Liabilities | | | | | | | |
| Cash overdraft | | | 4,017,627 | | | — | |
| Unrealized depreciation on interest rate swaps | | | 367,495 | | | 292,087 | |
| Payable for: | | | | | | | |
| Dividends | | | 2,515,901 | | | 590,169 | |
| Interest | | | 130,890 | | | 41,137 | |
| Offering costs | | | — | | | 17,658 | |
| Variation margin on swap contracts | | | 46,964 | | | 21,607 | |
| Variable Rate MuniFund Term Preferred ("VMTP") Shares, at liquidation value | | | 175,000,000 | | | 55,000,000 | |
| Accrued expenses: | | | | | | | |
| Management fees | | | 441,495 | | | 106,087 | |
| Trustees fees | | | 25,504 | | | 836 | |
| Other | | | 101,703 | | | 36,495 | |
| Total liabilities | | | 182,647,579 | | | 56,106,076 | |
| Net assets applicable to common shares | | $ | 642,190,172 | | $ | 181,817,521 | |
| Common shares outstanding | | | 46,909,660 | | | 13,097,144 | |
| Net asset value ("NAV") per common share outstanding | | $ | 13.69 | | $ | 13.88 | |
| Net assets applicable to common shares consist of: | | | | | | | |
| Common shares, $0.01 par value per share | | $ | 469,097 | | $ | 130,971 | |
| Paid-in surplus | | | 670,273,908 | | | 187,016,880 | |
| Undistributed (Over-distribution of) net investment income | | | 3,320,500 | | | 266,131 | |
| Accumulated net realized gain (loss) | | | (32,357,634 | ) | | (8,994,178 | ) |
| Net unrealized appreciation (depreciation) | | | 484,301 | | | 3,397,717 | |
| Net assets applicable to common shares | | $ | 642,190,172 | | $ | 181,817,521 | |
| Authorized shares: | | | | | | | |
| Common | | | Unlimited | | | Unlimited | |
| Preferred | | | Unlimited | | | Unlimited | |
(1) Cash pledged to collateralize the net payment obligations for investments in derivatives.
See accompanying notes to financial statements.
| Statement of | |
| | Operations | Six Months Ended November 30, 2015 (Unaudited) |
| | | | | | | Intermediate | |
| | | | Intermediate | | | Duration | |
| | | | Duration | | | Quality | |
| | | | (NID | ) | | (NIQ | ) |
| Investment Income | | $ | 20,002,492 | | $ | 4,661,584 | |
| Expenses | | | | | | | |
| Management fees | | | 2,693,261 | | | 644,438 | |
| Interest expense and amortization of offering costs | | | 1,006,655 | | | 364,387 | |
| Custodian fees | | | 52,770 | | | 21,460 | |
| Trustees fees | | | 10,354 | | | 2,945 | |
| Professional fees | | | 50,840 | | | 23,414 | |
| Shareholder reporting expenses | | | 34,329 | | | 11,645 | |
| Shareholder servicing agent fees | | | 9,688 | | | 8,185 | |
| Stock exchange listing fees | | | 7,476 | | | 3,984 | |
| Investor relations expenses | | | 22,897 | | | 6,557 | |
| Other | | | 29,773 | | | 13,561 | |
| Total expenses | | | 3,918,043 | | | 1,100,576 | |
| Net investment income (loss) | | | 16,084,449 | | | 3,561,008 | |
| Realized and Unrealized Gain (Loss) | | | | | | | |
| Net realized gain (loss) from: | | | | | | | |
| Investments | | | (852,679 | ) | | (19,019 | ) |
| Swaps | | | (8,309,806 | ) | | (1,694,194 | ) |
| Change in net unrealized appreciation (depreciation) of: | | | | | | | |
| Investments | | | 401,731 | | | 3,349,210 | |
| Swaps | | | 7,522,727 | | | 1,087,904 | |
| Net realized and unrealized gain (loss) | | | (1,238,027 | ) | | 2,723,901 | |
| Net increase (decrease) in net assets applicable to common shares from operations | | $ | 14,846,422 | | $ | 6,284,909 | |
See accompanying notes to financial statements.
| Statement of | | |
| | Changes in Net Assets | (Unaudited) |
| | | Intermediate | | Intermediate |
| | | Duration (NID) | | Duration Quality (NIQ) |
| | | | Six Months | | | Year | | | Six Months | | | Year | |
| | | | Ended | | | Ended | | | Ended | | | Ended | |
| | | | 11/30/15 | | | 5/31/15 | | | 11/30/15 | | | 5/31/15 | |
| Operations | | | | | | | | | | | | | |
| Net investment income (loss) | | $ | 16,084,449 | | $ | 32,450,093 | | $ | 3,561,008 | | $ | 7,617,188 | |
| Net realized gain (loss) from: | | | | | | | | | | | | | |
| Investments | | | (852,679 | ) | | (4,531,653 | ) | | (19,019 | ) | | (1,116,149 | ) |
| Swaps | | | (8,309,806 | ) | | (2,150,000 | ) | | (1,694,194 | ) | | (2,692,675 | ) |
| Change in net unrealized appreciation (depreciation) of: | | | | | | | | | | | | | |
| Investments | | | 401,731 | | | 13,987,130 | | | 3,349,210 | | | 2,954,981 | |
| Swaps | | | 7,522,727 | | | (6,487,736 | ) | | 1,087,904 | | | (1,282,038 | ) |
| Net increase (decrease) in net assets applicable to common shares from operations | | | 14,846,422 | | | 33,267,834 | | | 6,284,909 | | | 5,481,307 | |
| Distributions to Common Shareholders | | | | | | | | | | | | | |
| From net investment income | | | (16,043,104 | ) | | (32,104,971 | ) | | (3,811,269 | ) | | (7,809,827 | ) |
| Decrease in net assets applicable to common shares from distributions to common shareholders | | | (16,043,104 | ) | | (32,104,971 | ) | | (3,811,269 | ) | | (7,809,827 | ) |
| Net increase (decrease) in net assets applicable to common shares | | | (1,196,682 | ) | | 1,162,863 | | | 2,473,640 | | | (2,328,520 | ) |
| Net assets applicable to common shares at the beginning of period | | | 643,386,854 | | | 642,223,991 | | | 179,343,881 | | | 181,672,401 | |
| Net assets applicable to common shares at the end of period | | $ | 642,190,172 | | $ | 643,386,854 | | $ | 181,817,521 | | $ | 179,343,881 | |
| Undistributed (Over-distribution of) net investment income at the end of period | | $ | 3,320,500 | | $ | 3,279,155 | | $ | 266,131 | | $ | 516,392 | |
See accompanying notes to financial statements.
| Statement of | | |
| | Cash Flows | Six Months Ended November 30, 2015 (Unaudited) |
| | | | | | | Intermediate | |
| | | Intermediate | | | Duration | |
| | | | Duration | | | Quality | |
| | | | (NID | ) | | (NIQ | ) |
| Cash Flows from Operating Activities: | | | | | | | |
| Net Increase (Decrease) in Net Assets Applicable to Common Shares from Operations | | $ | 14,846,422 | | $ | 6,284,909 | |
| Adjustments to reconcile the net increase (decrease) in net assets applicable to common shares from operations to net cash provided by (used in) operating activities: | | | | | | | |
| Purchases of investments | | | (50,776,887 | ) | | (5,938,117 | ) |
| Proceeds from sales and maturities of investments | | | 65,287,261 | | | 6,815,257 | |
| Proceeds from (Purchases of) short-term investments, net | | | — | | | 2,240,000 | |
| Proceeds from (Payments for) swaps contracts, net | | | (8,309,806 | ) | | (1,694,194 | ) |
| Investments transactions adjustment, net | | | (206,920 | ) | | (5,385 | ) |
| Taxes paid on undistributed capital gains | | | (16 | ) | | — | |
| Amortization (Accretion) of premiums and discounts, net | | | 3,186,679 | | | 1,489,717 | |
| Amortization of deferred offering costs | | | 10,457 | | | 16,675 | |
| (Increase) Decrease in: | | | | | | | |
| Cash collateral at brokers | | | (1,592,709 | ) | | (781,751 | ) |
| Receivable for interest | | | (262,096 | ) | | (137,833 | ) |
| Receivable for investments sold | | | (345,000 | ) | | 110,000 | |
| Other assets | | | 3,082 | | | 3,292 | |
| Increase (Decrease) in: | | | | | | | |
| Payable for interest | | | (55,857 | ) | | (10,548 | ) |
| Payable for investments purchased | | | (5,309,157 | ) | | (1,145,580 | ) |
| Payable for variation margin on swap contracts | | | 46,964 | | | 21,607 | |
| Accrued management fees | | | (16,182 | ) | | (3,289 | ) |
| Accrued Trustees fees | | | 3,288 | | | (37 | ) |
| Accrued other expenses | | | (7,628 | ) | | (13,803 | ) |
| Net realized (gain) loss from: | | | | | | | |
| Investments | | | 852,679 | | | 19,019 | |
| Paydowns | | | — | | | (2,252 | ) |
| Swaps | | | 8,309,806 | | | 1,694,194 | |
| Change in net unrealized (appreciation) depreciation of: | | | | | | | |
| Investments | | | (401,731 | ) | | (3,349,210 | ) |
Swaps(1) | | | (8,948,178 | ) | | (1,585,158 | ) |
| Net cash provided by (used in) operating activities | | | 16,314,471 | | | 4,027,514 | |
| Cash Flows from Financing Activities | | | | | | | |
| Increase (Decrease) in: | | | | | | | |
| Cash overdraft | | | (254,342 | ) | | — | |
| Payable for offering costs | | | — | | | 10,581 | |
| Cash distributions paid to common shareholders | | | (16,060,129 | ) | | (3,839,302 | ) |
| Net cash provided by (used in) financing activities | | | (16,314,471 | ) | | (3,828,721 | ) |
| Net Increase (Decrease) in Cash | | | — | | | 198,793 | |
| Cash at beginning of period | | | — | | | 166,581 | |
| Cash at end of period | | $ | — | | $ | 365,374 | |
| | | | | | | | |
| | | | | | Intermediate | |
| | | Intermediate | | | Duration | |
| | | | Duration | | | Quality | |
| Supplemental Disclosure of Cash Flow Information | | | (NID | ) | | (NIQ | ) |
| Cash paid for interest (excluding amortization of offering costs) | | $ | 907,651 | | $ | 285,337 | |
(1) Excluding exchange-cleared swaps.
See accompanying notes to financial statements.
| Financial | |
| | Highlights (Unaudited) |
Selected data for a common share outstanding throughout each period:
| | | | | | Investment Operations | | Less Distributions to
Common Shareholders | | Common Share |
| | | Beginning
Common
Share
NAV | | Net
Investment
Income
(Loss) | | Net
Realized/
Unrealized
Gain (Loss) | | Total | | From
Net
Investment
Income | | From
Accumulated
Net Realized
Gains | | Total | | Offering
Costs | | Ending
NAV | | Ending
Share
Price | |
| Intermediate Duration (NID) |
| Year Ended 5/31: |
| 2016(g) | | $ | 13.72 | | $ | 0.34 | | $ | (0.03 | ) | $ | 0.31 | | $ | (0.34 | ) | $ | — | | $ | (0.34 | ) | $ | — | | $ | 13.69 | | $ | 12.57 | |
| 2015 | | | 13.69 | | | 0.69 | | | 0.02 | | | 0.71 | | | (0.68 | ) | | — | | | (0.68 | ) | | — | | | 13.72 | | | 12.48 | |
| 2014 | | | 14.04 | | | 0.69 | | | (0.37 | ) | | 0.32 | | | (0.67 | ) | | — | | | (0.67 | ) | | — | ** | | 13.69 | | | 12.59 | |
| 2013(d) | | | 14.33 | | | 0.26 | | | (0.30 | ) | | (0.04 | ) | | (0.22 | ) | | — | | | (0.22 | ) | | (0.03 | ) | | 14.04 | | | 13.00 | |
| | | | | | | | | | | | | | | | | | | | | | | | | | | | | | | | |
| Intermediate Duration Quality (NIQ) |
| Year Ended 5/31: |
| 2016(g) | | | 13.69 | | | 0.27 | | | 0.21 | | | 0.48 | | | (0.29 | ) | | — | | | (0.29 | ) | | — | | | 13.88 | | | 12.64 | |
| 2015 | | | 13.87 | | | 0.58 | | | (0.16 | ) | | 0.42 | | | (0.60 | ) | | — | | | (0.60 | ) | | — | | | 13.69 | | | 12.49 | |
| 2014 | | | 14.12 | | | 0.60 | | | (0.27 | ) | | 0.33 | | | (0.58 | ) | | — | | | (0.58 | ) | | — | | | 13.87 | | | 12.92 | |
| 2013(e) | | | 14.33 | | | 0.14 | | | (0.22 | ) | | (0.08 | ) | | (0.10 | ) | | — | | | (0.10 | ) | | (0.03 | ) | | 14.12 | | | 13.09 | |
| | | VMTP Shares | |
| | | at the End of Period | |
| | | | Aggregate | | | Asset | |
| | | | Amount | | | Coverage | |
| | | | Outstanding | | | Per $100,000 | |
| | | | (000 | ) | | Share | |
| Intermediate Duration (NID) | | | | | | | |
| Year Ended 5/31: | | | | | | | |
| 2016(g) | | $ | 175,000 | | $ | 466,966 | |
| 2015 | | | 175,000 | | | 467,650 | |
| 2014 | | | 175,000 | | | 466,985 | |
| 2013(d) | | | 175,000 | | | 476,271 | |
| | | | | | | | |
| Intermediate Duration Quality (NIQ) | | | | | | | |
| Year Ended 5/31: | | | | | | | |
| 2016(g) | | | 55,000 | | | 430,577 | |
| 2015 | | | 55,000 | | | 426,080 | |
| 2014 | | | 55,000 | | | 430,313 | |
| 2013(e) | | | 55,000 | | | 436,154 | |
| | | | | | | | | Common Share Supplemental Data/
Ratios Applicable to Common Shares |
| | | | Common Share
Total Returns | | | | | Ratios to Average Net Assets | | | | |
| | | | Based on
NAV | (a) | | Based on
Share
Price | (a) | | Ending Net
Assets (000) | | | Expenses | (c) | | Net
Investment
Income (Loss) | (b) | | Portfolio
Turnover
Rate | (f) |
| | | | | | | | | | | | | | | | | | | | |
| | | | | | | | | | | | | | | | | | | | |
| | | | 2.30 | % | | 3.51 | % | $ | 642,190 | | | 1.19 | %* | | 5.05 | %* | | 6 | % |
| | | | 5.29 | | | 4.62 | | | 643,387 | | | 1.23 | | | 5.01 | | | 18 | |
| | | | 2.66 | | | 2.47 | | | 642,224 | | | 1.28 | | | 5.33 | | | 19 | |
| | | | (0.46 | ) | | (11.94 | ) | | 658,474 | | | 1.05 | * | | 3.97 | * | | 20 | |
| | | | | | | | | | | | | | | | | | | | |
| | | | | | | | | | | | | | | | | | | | |
| | | | 3.56 | | | 3.59 | | | 181,818 | | | 1.18 | * | | 4.03 | * | | 3 | |
| | | | 3.01 | | | 1.27 | | | 179,344 | | | 1.16 | | | 4.17 | | | 15 | |
| | | | 2.70 | | | 3.64 | | | 181,672 | | | 1.21 | | | 4.57 | | | 13 | |
| | | | (0.77 | ) | | (12.12 | ) | | 184,885 | | | 1.10 | * | | 3.30 | * | | 1 | |
| (a) | Total Return Based on Common Share NAV is the combination of changes in common share NAV, reinvested dividend income at NAV and reinvested capital gains distributions at NAV, if any. The last dividend declared in the period, which is typically paid on the first business day of the following month, is assumed to be reinvested at the ending NAV. The actual reinvest price for the last dividend declared in the period may often be based on the Fund's market price (and not its NAV), and therefore may be different from the price used in the calculation. Total returns are not annualized. |
| | |
| | Total Return Based on Common Share Price is the combination of changes in the market price per share and the effect of reinvested dividend income and reinvested capital gains distributions, if any, at the average price paid per share at the time of reinvestment. The last dividend declared in the period, which is typically paid on the first business day of the following month, is assumed to be reinvested at the ending market price. The actual reinvestment for the last dividend declared in the period may take place over several days, and in some instances may not be based on the market price, so the actual reinvestment price may be different from the price used in the calculation. Total returns are not annualized. |
| (b) | Net Investment Income (Loss) ratios reflect income earned and expenses incurred on assets attributable to preferred shares issued by the Fund. |
| (c) | The expense ratios reflect, among other things, all interest expense and other costs related to preferred shares (as described in Note 4 – Fund Shares, Preferred Shares), as follows: |
| Intermediate Duration (NID) | | |
| Year Ended 5/31: | | |
| 2016(g) | 0.28 | %* |
| 2015 | 0.33 | |
| 2014 | 0.36 | |
| 2013(d) | 0.23 | * |
| Intermediate Duration Quality (NIQ) | | |
| Year Ended 5/31: | | |
| 2016(g) | 0.36 | %* |
| 2015 | 0.33 | |
| 2014 | 0.36 | |
| 2013(e) | 0.30 | * |
| (d) | For the period December 5, 2012 (commencement of operations) through May 31, 2013. |
| (e) | For the period February 7, 2013 (commencement of operations) through May 31, 2013. |
| (f) | Portfolio Turnover Rate is calculated based on the lesser of long-term purchases or sales (as disclosed in Note 5 – Investment Transactions) divided by the average long-term market value during the period. |
| (g) | For the six months ended November 30, 2015. |
| * | Annualized. |
| ** | Rounds to less than $0.01 per share. |
See accompanying notes to financial statements.
Notes to Financial Statements (Unaudited)
1. General Information and Significant Accounting Policies
General Information
Fund Information
The funds covered in this report and their corresponding New York Stock Exchange ("NYSE") symbols are as follows (each a "Fund" and collectively, the "Funds"):
| | | |
| | • | Nuveen Intermediate Duration Municipal Term Fund (NID) ("Intermediate Duration (NID)") |
| | • | Nuveen Intermediate Duration Quality Municipal Term Fund (NIQ) ("Intermediate Duration Quality (NIQ)") |
The Funds are registered under the Investment Company Act of 1940, as amended, as diversified, closed-end management investment companies. Intermediate Duration (NID) and Intermediate Duration Quality (NIQ) were organized as Massachusetts business trusts on September 11, 2012 and December 11, 2012, respectively. Intermediate Duration (NID) and Intermediate Duration Quality (NIQ) each have a term of ten years and intend to liquidate and distribute their net assets to shareholders on or before March 31, 2023 and June 30, 2023, respectively.
The end of the reporting period for the Funds is November 30, 2015, and the period covered by these Notes to Financial Statements is the six months ended November 30, 2015 (the "current fiscal period").
Investment Adviser
The Funds' investment adviser is Nuveen Fund Advisors, LLC (the "Adviser"), a wholly-owned subsidiary of Nuveen Investments, Inc. ("Nuveen"). The Adviser is responsible for each Fund's overall investment strategy and asset allocation decisions. The Adviser has entered into sub-advisory agreements with Nuveen Asset Management, LLC (the "Sub-Adviser"), a subsidiary of the Adviser, under which the Sub-Adviser manages the investment portfolios of the Funds.
Investment Objectives and Principal Investment Strategies
Intermediate Duration (NID) seeks to provide a high level of current income exempt from regular federal income tax with a secondary objective of seeking additional total return. The Fund will seek to achieve its investment objectives by investing in municipal securities that the Sub-Adviser believes are underrated or undervalued, based upon its bottom-up, research-driven investment strategy. The Fund also will seek to reduce the risk of rising interest rates by maintaining a portfolio with an intermediate duration of between three and ten years (including the effects of leverage). The Fund's portfolio will be actively managed, with the goal of capitalizing on historically favorable municipal credit spreads (the difference between yields on municipal securities across all debt rating categories) currently available in the market. Under normal circumstances, the Fund will invest at least 80% of its managed assets (as defined in Note 7 – Management Fees and Other Transactions with Affiliates) in municipal securities and other related investments, the income from which is exempt from regular federal income tax. The Fund will invest at least 50% of its managed assets in investment grade municipal securities; it also may invest in below investment grade securities, which are regarded as having predominately speculative characteristics with respect to an issuer's capacity to pay interest and repay principal, and are commonly referred to as junk bonds or high yield debt.
Intermediate Duration Quality (NIQ) seeks to provide current income exempt from regular federal income tax with a secondary objective of seeking additional total return. The Fund seeks to achieve its investment objectives by investing in a diversified portfolio of primarily investment grade quality municipal securities (at least 80% of managed assets), the income from which is exempt from regular federal income tax. The Fund also will seek to reduce the risk of rising interest rates by maintaining a portfolio with an intermediate duration of between three and ten years (including the effects of leverage). The Fund will emphasize the purchase of municipal securities that the Sub-Adviser believes are underrated or undervalued. The Fund's portfolio will be actively managed, seeking to capitalize on favorable relative value opportunities, with the goal of outperforming broad municipal market benchmarks over the life of the Fund.
Significant Accounting Policies
Each Fund is an investment company and follows accounting and reporting guidance under Financial Accounting Standards Board (FASB) Accounting Standards Codification (ASC) Topic 946 "Financial Services-Investment Companies." The following is a summary of significant accounting policies followed by the Funds in the preparation of their financial statements in accordance with U.S. generally accepted accounting principles ("U.S. GAAP").
Investment Transactions
Investment transactions are recorded on a trade date basis. Realized gains and losses from investment transactions are determined on the specific identification method, which is the same basis used for federal income tax purposes. Investments purchased on a when-issued/delayed delivery basis may have extended settlement periods. Any investments so purchased are subject to market fluctuation during this period. The Funds have earmarked securities in their portfolios with a current value at least equal to the amount of the when-issued/delayed delivery purchase commitments.
As of the end of the reporting period, the Funds' did not have any when issued/delayed delivery purchase commitments.
Investment Income
Investment income, which reflects the amortization of premiums and includes accretion of discounts for financial reporting purposes, is recorded on an accrual basis. Investment income also reflects paydown gains and losses, if any.
Professional Fees
Professional fees presented on the Statement of Operations consist of legal fees incurred in the normal course of operations, audit fees, tax consulting fees and, in some cases, workout expenditures. Workout expenditures are incurred in an attempt to protect or enhance an investment, or to pursue other claims or legal actions on behalf of Fund shareholders. If a refund is received for workout expenditures paid in a prior reporting period, such amounts will be recognized as "Legal fee refund" on the Statement of Operations.
Dividends and Distributions to Common Shareholders
Dividends from net investment income are declared monthly. Net realized capital gains and/or market discount from investment transactions, if any, are distributed to shareholders at least annually. Furthermore, capital gains are distributed only to the extent they exceed available capital loss carryforwards.
Distributions to common shareholders of net investment income, net realized capital gains and/or market discount, if any, are recorded on the ex-dividend date. The amount and timing of distributions are determined in accordance with federal income tax regulations, which may differ from U.S. GAAP.
Indemnifications
Under the Funds' organizational documents, their officers and trustees are indemnified against certain liabilities arising out of the performance of their duties to the Funds. In addition, in the normal course of business, the Funds enter into contracts that provide general indemnifications to other parties. The Funds' maximum exposure under these arrangements is unknown as this would involve future claims that may be made against the Funds that have not yet occurred. However, the Funds have not had prior claims or losses pursuant to these contracts and expect the risk of loss to be remote.
Netting Agreements
In the ordinary course of business, the Funds may enter into transactions subject to enforceable International Swaps and Derivative Association, Inc. ("ISDA") master agreements or other similar arrangements ("netting agreements"). Generally, the right to offset in netting agreements allows each Fund to offset certain securities and derivatives with a specific counterparty as well as any collateral received or delivered to that counterparty based on the terms of the agreements. Generally, each Fund manages its cash collateral and securities collateral on a counterparty basis.
The Funds' investments subject to netting agreements as of the end of the reporting period, if any, are further described in Note 3 – Portfolio Securities and Investments in Derivatives.
Use of Estimates
The preparation of financial statements in conformity with U.S. GAAP requires management to make estimates and assumptions that affect the reported amounts of assets and liabilities at the date of the financial statements and the reported amounts of increases and decreases in net assets applicable to common shares from operations during the reporting period. Actual results may differ from those estimates.
2. Investment Valuation and Fair Value Measurements
The fair valuation input levels as described below are for fair value measurement purposes.
Fair value is defined as the price that would be received upon selling an investment or transferring a liability in an orderly transaction to an independent buyer in the principal or most advantageous market for the investment. A three-tier hierarchy is used to maximize the use of observable market data and minimize the use of unobservable inputs and to establish classification of fair value measurements for disclosure purposes. Observable inputs reflect the assumptions market participants would use in pricing the asset or liability. Observable inputs are based on market data obtained from sources independent of the reporting entity. Unobservable inputs reflect the reporting entity's own assumptions about the assumptions market
Notes to Financial Statements (Unaudited) (continued)
participants would use in pricing the asset or liability. Unobservable inputs are based on the best information available in the circumstances. The following is a summary of the three-tiered hierarchy of valuation input levels.
| | |
| Level 1 – | Inputs are unadjusted and prices are determined using quoted prices in active markets for identical securities. |
| Level 2 – | Prices are determined using other significant observable inputs (including quoted prices for similar securities, interest rates, prepayment speeds, credit risk, etc.). |
| Level 3 – | Prices are determined using significant unobservable inputs (including management's assumptions in determining the fair value of investments). |
Prices of fixed income securities are provided by a pricing service approved by the Funds' Board of Trustees (the "Board"). The pricing service establishes a security's fair value using methods that may include consideration of the following: yields or prices of investments of comparable quality, type of issue, coupon, maturity and rating, market quotes or indications of value from security dealers, evaluations of anticipated cash flows or collateral, general market conditions and other information and analysis, including the obligor's credit characteristics considered relevant. These securities are generally classified as Level 2. In pricing certain securities, particularly less liquid and lower quality securities, the pricing service may consider information about a security, its issuer or market activity provided by the Adviser. These securities are generally classified as Level 2 or Level 3 depending on the priority of the significant inputs.
Prices of swap contracts are also provided by a pricing service approved by the Board using the same methods as described above, and are generally classified as Level 2.
Certain securities may not be able to be priced by the pre-established pricing methods as described above. Such securities may be valued by the Board and/or its appointee at fair value. These securities generally include, but are not limited to, restricted securities (securities which may not be publicly sold without registration under the Securities Act of 1933, as amended) for which a pricing service is unable to provide a market price; securities whose trading has been formally suspended; debt securities that have gone into default and for which there is no current market quotation; a security whose market price is not available from a pre-established pricing source; a security with respect to which an event has occurred that is likely to materially affect the value of the security after the market has closed but before the calculation of a Fund's net asset value ("NAV") (as may be the case in non-U.S. markets on which the security is primarily traded) or make it difficult or impossible to obtain a reliable market quotation; and a security whose price, as provided by the pricing service, is not deemed to reflect the security's fair value. As a general principle, the fair value of a security would appear to be the amount that the owner might reasonably expect to receive for it in a current sale. A variety of factors may be considered in determining the fair value of such securities, which may include consideration of the following: yields or prices of investments of comparable quality, type of issue, coupon, maturity and rating, market quotes or indications of value from securities dealers, evaluations of anticipated cash flows or collateral, general market conditions and other information and analysis, including the obligor's credit characteristics considered relevant. These securities are generally classified as Level 2 or Level 3 depending on the priority of the significant inputs. Regardless of the method employed to value a particular security, all valuations are subject to review by the Board and/or its appointee.
The inputs or methodologies used for valuing securities are not an indication of the risks associated with investing in those securities. The following is a summary of each Fund's fair value measurements as of the end of the reporting period:
| Intermediate Duration (NID) | | | Level 1 | | | Level 2 | | | Level 3 | | | Total | |
| Long-Term Investments*: | | | | | | | | | | | | | |
| Municipal Bonds | | $ | — | | $ | 805,587,721 | | $ | — | | $ | 805,587,721 | |
| Short-Term Investments*: | | | | | | | | | | | | | |
| Municipal Bonds | | | — | | | — | | | 1,441,138 | *** | | 1,441,138 | |
| Investments in Derivatives: | | | | | | | | | | | | | |
| Interest Rate Swaps** | | | — | | | (1,792,946 | ) | | — | | | (1,792,946 | ) |
| Total | | $ | — | | $ | 803,794,775 | | $ | 1,441,138 | | $ | 805,235,913 | |
| Intermediate Duration Quality (NIQ) | | | | | | | | | | | | | |
| Long-Term Investments*: | | | | | | | | | | | | | |
| Municipal Bonds | | $ | — | | $ | 232,471,910 | | $ | — | | $ | 232,471,910 | |
| Investments in Derivatives: | | | | | | | | | | | | | |
| Interest Rate Swaps** | | | — | | | (789,342 | ) | | — | | | (789,342 | ) |
| Total | | $ | — | | $ | 231,682,568 | | $ | — | | $ | 231,682,568 | |
| * | Refer to the Fund's Portfolio of Investments for state classifications. |
| ** | Represents net unrealized appreciation (depreciation) as reported in the Fund's Portfolio of Investments. |
| *** | Refer to the Fund's Portfolio of Investments for securities classified as Level 3. |
The Board is responsible for the valuation process and has appointed the oversight of the daily valuation process to the Adviser's Valuation Committee. The Valuation Committee, pursuant to the valuation policies and procedures adopted by the Board is responsible for making fair value determinations, evaluating the effectiveness of the Funds' pricing policies and reporting to the Board. The Valuation Committee is aided in its efforts by the Adviser's dedicated Securities Valuation Team, which is responsible for administering the daily valuation process and applying fair value methodologies as approved by the Valuation Committee. When determining the reliability of independent pricing services for investments owned by the Funds, the Valuation Committee, among other things, conducts due diligence reviews of the pricing services and monitors the quality of security prices received through various testing reports conducted by the Securities Valuation Team.
The Valuation Committee will consider pricing methodologies it deems relevant and appropriate when making a fair value determination, based on the facts and circumstances specific to the portfolio instrument. Fair value determinations generally will be derived as follows, using public or private market information:
| | | |
| | (i) | If available, fair value determinations shall be derived by extrapolating from recent transactions or quoted prices for identical or comparable securities. |
| | | |
| | (ii) | If such information is not available, an analytical valuation methodology may be used based on other available information including, but not limited to: analyst appraisals, research reports, corporate action information, issuer financial statements and shelf registration statements. Such analytical valuation methodologies may include, but are not limited to: multiple of earnings, discount from market value of a similar freely-traded security, discounted cash flow analysis, book value or a multiple thereof, risk premium/yield analysis, yield to maturity and/or fundamental investment analysis. |
The purchase price of a portfolio instrument will be used to fair value the instrument only if no other valuation methodology is available or deemed appropriate, and it is determined that the purchase price fairly reflects the instrument's current value.
For each portfolio security that has been fair valued pursuant to the policies adopted by the Board, the fair value price is compared against the last available and next available market quotations. The Valuation Committee reviews the results of such testing and fair valuation occurrences are reported to the Board.
3. Portfolio Securities and Investments in Derivatives
Portfolio Securities
Inverse Floating Rate Securities
Each Fund is authorized to invest in inverse floating rate securities. An inverse floating rate security is created by depositing a municipal bond (referred to as an "Underlying Bond"), typically with a fixed interest rate, into a special purpose tender option bond ("TOB") trust (referred to as the "TOB Trust") created by or at the direction of one or more Funds. In turn, the TOB Trust issues (a) floating rate certificates (referred to as "Floaters") in face amounts equal to some fraction of the Underlying Bond's par amount or market value, and (b) an inverse floating rate certificate (referred to as an "Inverse Floater") that represents all remaining or residual interest in the TOB Trust. Floaters typically pay short-term tax-exempt interest rates to third parties who are also provided a right to tender their certificate and receive its par value, which may be paid from the proceeds of a remarketing of the Floaters, by a loan to the TOB Trust from a third party liquidity provider ("Liquidity Provider"), or by the sale of assets from the TOB Trust. The Inverse Floater is issued to a long term investor, such as one or more of the Funds. The income received by the Inverse Floater holder varies inversely with the short-term rate paid to holders of the Floaters, and in most circumstances the Inverse Floater holder bears substantially all of the Underlying Bond's downside investment risk and also benefits disproportionately from any potential appreciation of the Underlying Bond's value. The value of an Inverse Floater will be more volatile than that of the Underlying Bond because the interest rate is dependent on not only the fixed coupon rate of the Underlying Bond but also on the short-term interest paid on the Floaters, and because the Inverse Floater essentially bears the risk of loss (and possible gain) of the greater face value of the Underlying Bond.
The Inverse Floater held by a Fund gives the Fund the right to (a) cause the holders of the Floaters to tender their certificates at par (or slightly more than par in certain circumstances), and (b) have the trustee of the TOB Trust (the "Trustee") transfer the Underlying Bond held by the TOB Trust to the Fund, thereby collapsing the TOB Trust.
The Fund may acquire an Inverse Floater in a transaction where it (a) transfers an Underlying Bond that it owns to a TOB Trust created by a third party or (b) transfers an Underlying Bond that it owns, or that it has purchased in a secondary market transaction for the purpose of creating an Inverse Floater, to a TOB Trust created at its direction, and in return receives the Inverse Floater of the TOB Trust (referred to as a "self-deposited Inverse Floater"). A Fund may also purchase an Inverse Floater in a secondary market transaction from a third party creator of the TOB Trust without first owning the Underlying Bond (referred to as an "externally-deposited Inverse Floater").
An investment in a self-deposited Inverse Floater is accounted for as a "financing" transaction (i.e., a secured borrowing). For a self-deposited Inverse Floater, the Underlying Bond deposited into the TOB Trust is identified in the Fund's Portfolio of Investments as "(UB) – Underlying bond of an inverse floating rate trust reflected as a financing transaction," with the Fund recognizing as liabilities, labeled "Floating rate obligations" on the Statement of Assets and Liabilities, (a) the liquidation value of Floaters issued by the TOB Trust, and (b) the amount of any borrowings by the TOB Trust from a Liquidity Provider to enable the TOB Trust to purchase outstanding Floaters in lieu of a remarketing. In addition, the Fund recognizes in "Investment Income" the entire earnings of the Underlying Bond, and recognizes (a) the interest paid to the holders of the Floaters or on the TOB Trust's borrowings, and (b) other expenses related to remarketing, administration, trustee, liquidity and other services to a TOB Trust, as a component of "Interest expense and amortization of offering costs" on the Statement of Operations.
In contrast, an investment in an externally-deposited Inverse Floater is accounted for as a purchase of the Inverse Floater and is identified in the Fund's Portfolio of Investments as "(IF) – Inverse floating rate investment." For an externally-deposited Inverse Floater, a Fund's Statement of Assets and Liabilities recognizes the Inverse Floater and not the Underlying Bond as an asset, and the Fund does not recognize the Floaters, or any related
Notes to Financial Statements (Unaudited) (continued)
borrowings from a Liquidity Provider, as a liability. Additionally, the Fund reflects in "Investment Income" only the net amount of earnings on the Inverse Floater (net of the interest paid to the holders of the Floaters or the Liquidity Provider as lender, and the expenses of the Trust), and does not show the amount of that interest paid or the expenses of the TOB Trust as described above as interest expense on the Statement of Operations.
Fees paid upon the creation of a TOB Trust for self-deposited Inverse Floaters and externally-deposited Inverse Floaters are recognized as part of the cost basis of the Inverse Floater and are capitalized over the term of the TOB Trust.
As of the end of the reporting period, the aggregate value of Floaters issued by each Fund's TOB Trust for self-deposited Inverse Floaters and externally-deposited Inverse Floaters was as follows:
| | | | | | | Intermediate | |
| | | | Intermediate | | | Duration | |
| | | | Duration | | | Quality | |
| Floating Rate Obligations Outstanding | | | (NID | ) | | (NIQ | ) |
| Floating rate obligations: self-deposited Inverse Floaters | | $ | — | | $ | — | |
| Floating rate obligations: externally-deposited Inverse Floaters | | | 185,060,000 | | | 48,320,000 | |
| Total | | $ | 185,060,000 | | $ | 48,320,000 | |
TOB Trusts are supported by a liquidity facility provided by a Liquidity Provider pursuant to which the Liquidity Provider agrees, in the event that Floaters are (a) tendered to the Trustee for remarketing and the remarketing does not occur, or (b) subject to mandatory tender pursuant to the terms of the TOB Trust agreement, to either purchase Floaters or to provide the Trustee with an advance from a loan facility to fund the purchase of Floaters by the TOB Trust. In certain circumstances, the Liquidity Provider may otherwise elect to have the Trustee sell the Underlying Bond to retire the Floaters that were tendered and not remarketed prior to providing such a loan. In these circumstances, the Liquidity Provider remains obligated to provide a loan to the extent that the proceeds of the sale of the Underlying Bond is not sufficient to pay the purchase price of the Floaters.
The size of the commitment under the loan facility for a given TOB Trust is at least equal to the balance of that TOB Trust's outstanding Floaters plus any accrued interest. In consideration of the loan facility, fee schedules are in place and are charged by the Liquidity Provider(s). Any loans made by the Liquidity Provider will be secured by the purchased Floaters held by the TOB Trust. Interest paid on any outstanding loan balances will be effectively borne by the Fund that owns the Inverse Floaters of the TOB Trust that has incurred the borrowing and may be at a rate that is greater than the rate that would have been paid had the Floaters been successfully remarketed.
As described above, any amounts outstanding under a liquidity facility are recognized as a component of "Floating rate obligations" on the Statement of Assets and Liabilities by the Fund holding the corresponding Inverse Floaters issued by the borrowing TOB Trust. As of the end of the reporting period, Intermediate Duration Quality (NIQ) had outstanding borrowings under such liquidity facilities in the amount of $7,490,400, which are recognized as a component of "Floating rate obligations". There were no loans outstanding under such facilities for Intermediate Duration (NID) as of the end of the reporting period.
Each Fund may also enter into shortfall and forbearance agreements (sometimes referred to as a "recourse arrangement" or "credit recovery swap") (TOB Trusts involving such agreements are referred to herein as "Recourse Trusts"), under which a Fund agrees to reimburse the Liquidity Provider for the Trust's Floaters, in certain circumstances, for the amount (if any) by which the liquidation value of the Underlying Bond held by the TOB Trust may fall short of the sum of the liquidation value of the Floaters issued by the TOB Trust plus any amounts borrowed by the TOB Trust from the Liquidity Provider, plus any shortfalls in interest cash flows. Under these agreements, a Fund's potential exposure to losses related to or on an Inverse Floater may increase beyond the value of the Inverse Floater as a Fund may potentially be liable to fulfill all amounts owed to holders of the Floaters or the Liquidity Provider. Any such shortfall amount in the aggregate is recognized as "Unrealized depreciation on Recourse Trusts" on the Statement of Assets and Liabilities.
As of the end of the reporting period, each Fund's maximum exposure to the Floaters issued by Recourse Trusts for self-deposited Inverse Floaters and externally-deposited Inverse Floaters was as follows:
| | | | | | | Intermediate | |
| | | | Intermediate | | | Duration | |
| | | | Duration | | | Quality | |
| Floating Rate Obligations – Recourse Trusts | | | (NID | ) | | (NIQ | ) |
| Maximum exposure to Recourse Trusts: self-deposted Inverse Floaters | | $ | — | | $ | — | |
| Maximum exposure to Recourse Trusts: externally-deposited Inverse Floaters | | | 175,250,000 | | | 48,320,000 | |
| Total | | $ | 175,250,000 | | $ | 48,320,000 | |
Zero Coupon Securities
A zero coupon security does not pay a regular interest coupon to its holders during the life of the security. Income to the holder of the security comes from accretion of the difference between the original purchase price of the security at issuance and the par value of the security at maturity and is effectively paid at maturity. The market prices of zero coupon securities generally are more volatile than the market prices of securities that pay interest periodically.
Investments in Derivatives
In addition to the inverse floating rate securities in which each Fund may invest, which are considered portfolio securities for financial reporting purposes, each Fund is authorized to invest in certain other derivative instruments, such as futures, options and swap contracts. Each Fund limits its investments in futures, options on futures and swap contracts to the extent necessary for the Adviser to claim the exclusion from registration by the Commodity Futures Trading Commission as a commodity pool operator with respect to the Fund. The Funds record derivative instruments at fair value, with changes in fair value recognized on the Statement of Operations, when applicable. Even though the Funds' investments in derivatives may represent economic hedges, they are not considered to be hedge transactions for financial reporting purposes.
Interest Rate Swaps Contracts
Interest rate swap contracts involve a Fund's agreement with the counterparty to pay or receive a fixed rate payment in exchange for the counterparty receiving or paying a variable rate payment. Forward interest rate swap contracts involve a Fund's agreement with a counterparty to pay, in the future, a fixed or variable rate payment in exchange for the counterparty paying the Fund a variable or fixed rate payment, the accruals for which would begin at a specified date in the future (the "effective date"). The amount of the payment obligation is based on the notional amount of the swap contract and the termination date of the swap contract. Swap contracts do not involve the delivery of securities or other underlying assets or principal. Accordingly, the risk of loss with respect to the swap counterparty on such transactions is limited to the net amount of interest payments that the Fund is to receive.
Interest rate swap contracts are valued daily. Upon entering into an interest rate swap contract (and beginning on the effective date for a forward interest rate swap contract), a Fund accrues the fixed rate payment expected to be paid or received and the variable rate payment expected to be received or paid on the interest rate swap contracts on a daily basis, and recognizes the daily change in the fair value of the Fund's contractual rights and obligations under the contracts. For over-the-counter ("OTC") swaps, the net amount recorded on these transactions, for each counterparty, is recognized on the Statement of Assets and Liabilities as a component of "Unrealized appreciation or depreciation on interest rate swaps (, net)."
Upon the execution of an exchanged-cleared swap contract, in certain instances a Fund is obligated to deposit cash or eligible securities, also known as "initial margin," into an account at its clearing broker equal to a specified percentage of the contract amount. Cash held by the broker to cover initial margin requirements on open swap contracts, if any, is recognized as "Cash collateral at brokers" on the Statement of Assets and Liabilities. Investments in exchange-cleared interest rate swap contracts obligate a Fund and the clearing broker to settle monies on a daily basis representing changes in the prior day's "mark-to-market" of the swap contract. If a Fund has unrealized appreciation, the clearing broker will credit the Fund's account with an amount equal to the appreciation. Conversely, if the Fund has unrealized depreciation, the clearing broker will debit the Fund's account with an amount equal to the depreciation. These daily cash settlements are also known as "variation margin." Variation margin is recognized as a receivable and/or payable for "Variation margin on swap contracts" on the Statement of Assets and Liabilities.
The net amount of periodic payments settled in cash are recognized as a component of "Net realized gain (loss) from swaps" on the Statement of Operations, in addition to the net realized gain or loss recorded upon the termination of the swap contract. For tax purposes, payments expected to be received or paid on the swap contacts are treated as ordinary income or expense, respectively.
Changes in the value of the swap contracts during the fiscal period are recognized as a component of "Change in net unrealized appreciation (depreciation) of swaps." In certain instances, payments are made or received upon entering into the swap contract to compensate for differences between the stated terms of the swap agreements and prevailing market conditions (credit spreads, currency exchange rates, interest rates, and other relevant factors). Payments received or made at the beginning of the measurement period, if any, are recognized as "Interest rate swaps premiums paid and/or received" on the Statement of Assets and Liabilities.
During the current fiscal period, each Fund used duration shortening interest rate swap contracts to help maintain its ten-year duration mandate.
The average notional amount of interest rate swap contracts outstanding during the current fiscal period was as follows:
| | | | | | | Intermediate | |
| | | | Intermediate | | | Duration | |
| | | | Duration | | | Quality | |
| | | | (NID | ) | | (NIQ | ) |
| Average notional amount of interest rate swap contracts outstanding* | | $ | 65,500,000 | | $ | 26,966,667 | |
| * | The average notional amount is calculated based on the outstanding notional at the beginning of the fiscal period and at the end of each fiscal quarter within the current fiscal period. |
Notes to Financial Statements (Unaudited) (continued)
The following table presents the fair value of all swap contracts held by the Funds as of the end of the reporting period, the location of these instruments on the Statement of Assets and Liabilities and the primary underlying risk exposure.
| | | | | Location on the Statement of Assets and Liabilities |
| | | | | Asset Derivatives | | (Liability) Derivatives | |
| Underlying | | Derivative | | | | | | | | | | | |
| Risk Exposure | | Instrument | | Location | | Value | | Location | | | Value | |
| Intermediate Duration (NID) | | | | | | | | | | | | | |
| Interest Rate | | Swaps (OTC) | | — | | $ | — | | Unrealized depreciation on interest rate swaps | | $ | (367,495) | |
| | | | | | | | | | | | | | |
| | | Swaps (Exchange-Cleared) | | — | | $ | — | | Cash collateral at brokers and Payable for variation margin on swap contracts* | | $ | (1,425,451) | |
| Total | | | | | | | — | | | | $ | (1,792,946) | |
| Intermediate Duration Quality (NIQ) | | | | | | | | | | | | | |
| Interest Rate | | Swaps (OTC) | | — | | $ | — | | Unrealized depreciation on interest rate swaps | | $ | (292,087) | |
| | | Swaps (Exchange-Cleared) | | — | | $ | — | | Cash collateral at brokers | | $ | (497,254) | |
| | | | | | | | | | and Payable for variation | | | | |
| | | | | | | | | | margin on swap contracts* | | | | |
| Total | | | | | | | — | | | | $ | (789,341) | |
| * | Value represents the unrealized appreciation (depreciation) of swaps as reported in the Fund's Portfolio of Investments and not the asset and/or liability amount as described in the table above. |
The following table presents the swap contracts subject to netting agreements, and the collateral delivered related to those swap contracts as of the end of the reporting period.
| | | | | Gross | | Gross | | Amounts | | Net Unrealized | | Gross Amounts Not Offset
on the Statement of
Assets and Liabilities | | | |
| Fund | | Counterparty | | Unrealized
Appreciation on
Interest
Rate Swaps | ** | Unrealized
(Depreciation) on
Interest
Rate Swaps | ** | Netted on
Statement
of Assets and
Liabilities | | Appreciation
(Depreciation) on
Interest
Rate Swaps | | Financial
Instruments | *** | Collateral
Pledged
to (from)
Counterparty | | Net
Exposure | |
| Intermediate Duration (NID) | | | | | | | | | | | | | | | | | | | | | | | | | |
| | | JPMorgan | | $ | — | | $ | (367,495 | ) | $ | — | | $ | (367,495 | ) | $ | 367,495 | | $ | — | | $ | — | |
| | | | | | | | | | | | | | | | | | | | | | | | | | |
| Intermediate Duration Quality (NIQ) | | | | | | | | | | | | | | | | | | | | | | | | | |
| | | JPMorgan | | $ | — | | $ | (292,087 | ) | $ | — | | $ | (292,087 | ) | $ | 292,087 | | $ | — | | $ | — | |
| ** | Represents gross unrealized appreciation (depreciation) for the counterparty as reported in the Fund's Portfolio of Investments. |
| *** | Represents inverse floating rate securities available for offset. |
The following table presents the amount of net realized gain (loss) and change in net unrealized appreciation (depreciation) recognized on swap contracts on the Statement of Operations during the current fiscal period and the primary underlying risk exposure.
| | | | | | | | | | | | | | |
| | | | | | | | | | | | Change in Net | |
| | | | | | | | | Net Realized | | Unrealized Appreciation | |
| | | | Underlying | | | Derivative | | | Gain (Loss) from | | (Depreciation) of | |
| Fund | | | Risk Exposure | | | Instrument | | | Swaps | | | Swaps | |
| Intermediate Duration (NID) | | | Interest rate | | | Swaps | | $ | (8,309,806 | ) | $ | 7,522,727 | |
| Intermediate Duration Quality (NIQ) | | | Interest rate | | | Swaps | | $ | (1,694,194 | ) | $ | 1,087,904 | |
Market and Counterparty Credit Risk
In the normal course of business each Fund may invest in financial instruments and enter into financial transactions where risk of potential loss exists due to changes in the market (market risk) or failure of the other party to the transaction to perform (counterparty credit risk). The potential loss could exceed the value of the financial assets recorded on the financial statements. Financial assets, which potentially expose each Fund to counterparty credit risk, consist principally of cash due from counterparties on forward, option and swap transactions, when applicable. The extent of each Fund's exposure to counterparty credit risk in respect to these financial assets approximates their carrying value as recorded on the Statement of Assets and Liabilities.
Each Fund helps manage counterparty credit risk by entering into agreements only with counterparties the Adviser believes have the financial resources to honor their obligations and by having the Adviser monitor the financial stability of the counterparties. Additionally, counterparties may be required to pledge collateral daily (based on the daily valuation of the financial asset) on behalf of each Fund with a value approximately equal to the amount of any unrealized gain above a pre-determined threshold. Reciprocally, when each Fund has an unrealized loss, the Funds have instructed the custodian to
pledge assets of the Funds as collateral with a value approximately equal to the amount of the unrealized loss above a pre-determined threshold. Collateral pledges are monitored and subsequently adjusted if and when the valuations fluctuate, either up or down, by at least the pre-determined threshold amount.
4. Fund Shares
Common Share Transactions
The Funds did not have any transactions in common shares during current and prior fiscal periods.
Preferred Shares
Variable Rate MuniFund Term Preferred Shares
Each Fund has issued and outstanding Variable Rate MuniFund Term Preferred ("VMTP") Shares, with $100,000 liquidation value per share. VMTP Shares are issued via private placement and are not publicly available.
As of the end of the reporting period, VMTP Shares outstanding, at liquidation value, for each Fund was as follows:
| | | | | | | | | | Shares | |
| | | | | | | | | Outstanding at | |
| | | | | | | Shares | | $ 100,000 Per Share | |
| Fund | | | Series | | | Outstanding | | Liquidation Value | |
| Intermediate Duration (NID) | | | 2018 | | | 1,750 | | $ | 175,000,000 | |
| Intermediate Duration Quality (NIQ) | | | 2018 | | | 550 | | $ | 55,000,000 | |
Intermediate Duration (NID) and Intermediate Duration Quality (NIQ) refinanced all of their outstanding Series 2016 VMTP Shares with the issuance of new Series 2018 VMTP Shares on July 1, 2015 and October 1, 2015, respectively.
Each Fund is obligated to redeem its VMTP Shares by the date as specified in its offering document ("Term Redemption Date"), unless earlier redeemed or repurchased by the Fund. VMTP Shares are subject to optional and mandatory redemption in certain circumstances. The VMTP Shares are subject to redemption at the option of each Fund ("Optional Redemption Date"), subject to payment of premium for approximately one year following the date of issuance ("Premium Expiration Date"), and at par thereafter. Each Fund may be obligated to redeem certain of the VMTP Shares if the Fund fails to maintain certain asset coverage and leverage ratio requirements and such failures are not cured by the applicable cure date. The redemption price per share is equal to the sum of the liquidation value per share plus any accumulated but unpaid dividends. The Term Redemption Date, Optional Redemption Date and Premium Expiration Date for each Fund's series of VMTP Shares are as follows:
| | | Term | Optional | Premium | |
| Fund | Series | Redemption Date | Redemption Date | Expiration Date | |
| Intermediate Duration (NID) | 2018 | August 1, 2018 | July 1, 2016 | June 30, 2016 | |
| Intermediate Duration Quality (NIQ) | 2018 | November 1, 2018 | October 1, 2016 | September 30, 2016 | |
The average liquidation value of VMTP Shares outstanding and annualized dividend rate for each Fund during the current fiscal period were as follows:
| | | | | | | Intermediate | |
| | | | Intermediate | | | Duration | |
| | | | Duration | | | Quality | |
| | | | (NID | ) | | (NIQ | ) |
| Average liquidation value of VMTP Shares outstanding | | $ | 175,000,000 | | $ | 55,000,000 | |
| Annualized dividend rate | | | 0.97 | % | | 1.00 | % |
VMTP Shares generally do not trade, and market quotations are generally not available. VMTP Shares are short-term or short/intermediate-term instruments that pay a variable dividend rate tied to a short-term index, plus an additional fixed "spread" amount established at the time of issuance. The fair value of VMTP Shares is expected to be approximately their liquidation par value so long as the fixed "spread" on the VMTP Shares remains roughly in line with the "spread" rates being demanded by investors on instruments having similar terms in the current market environment. In present market conditions, the Funds' Adviser has determined that fair value of VMTP Shares is their liquidation value, but their fair value could vary if market conditions change materially. For financial reporting purposes, the liquidation value of VMTP Shares is a liability and is recognized as "Variable Rate MuniFund Term Preferred ("VMTP") Shares, at liquidation value" on the Statement of Assets and Liabilities.
Dividends on VMTP Shares (which are treated as interest payments for financial reporting purposes) are set weekly. Unpaid dividends on VMTP Shares are recognized as a component of "Interest payable" on the Statement of Assets and Liabilities, when applicable. Dividends accrued on VMTP Shares are recognized as a component of "Interest expense and amortization of offering costs" on the Statement of Operations.
Notes to Financial Statements (Unaudited) (continued)
Costs incurred in connection with each Fund's offering of VMTP Shares were recorded as a deferred charge, which are amortized over the life of the shares and are recognized as components of "Deferred offering costs" on the Statement of Assets and Liabilities and "Interest expense and amortization of offering costs" on the Statement of Operations.
Intermediate Duration (NID) and Intermediate Duration Quality (NIQ) incurred offering costs of $144,405 and $80,000, respectively, in connection with their issuance of Series 2018 VMTP Shares, which were expensed as incurred and are recognized as a component of "Interest expense and amortization of offering costs" on the Statement of Operations.
Preferred Share Transactions
Transaction in preferred shares for the Funds during the Funds' current and prior fiscal period, where applicable, are noted in the following tables.
Transaction in VMTP Shares for the Funds, where applicable, were as follows:
| | | Six Months Ended |
| | | November 30, 2015 |
| | | | Series | | | Shares | | | Amount | |
| Intermediate Duration (NID) | | | | | | | | | | |
| VMTP Shares issued | | | 2018 | | | 1,750 | | $ | 175,000,000 | |
| VMTP Shares exchanged | | | 2016 | | | (1,750 | ) | | (175,000,000 | ) |
| Net increase (decrease) | | | | | | | | | | |
| | | Six Months Ended |
| | | November 30, 2015 |
| Intermediate Duration Quality (NIQ) | | | Series | | | Shares | | | Amount | |
| VMTP Shares issued | | | 2018 | | | 550 | | $ | 55,000,000 | |
| VMTP Shares exchanged | | | 2016 | | | (550 | ) | | (55,000,000 | ) |
| Net increase (decrease) | | | | | | | | | | |
5. Investment Transactions
Long-term purchases and sales (including maturities but excluding and derivative transactions, where applicable) during the current fiscal period were as follows:
| | | | | | | Intermediate | |
| | | | Intermediate | | | Duration | |
| | | | Duration | | | Quality | |
| | | | (NID | ) | | (NIQ | ) |
| Purchases | | $ | 50,776,887 | | $ | 5,938,117 | |
| Sales and Maturities | | | 65,287,261 | | | 6,815,257 | |
6. Income Tax Information
Each Fund is a separate taxpayer for federal income tax purposes. Each Fund intends to distribute substantially all of its net investment income and net capital gains to shareholders and to otherwise comply with the requirements of Subchapter M of the Internal Revenue Code applicable to regulated investment companies. Therefore, no federal income tax provision is required. Furthermore, each Fund intends to satisfy conditions that will enable interest from municipal securities, which is exempt from regular federal income taxes, to retain such tax-exempt status when distributed to shareholders of the Funds. Net realized capital gains and ordinary income distributions paid by the Funds are subject to federal taxation.
For all open tax years and all major taxing jurisdictions, management of the Funds has concluded that there are no significant uncertain tax positions that would require recognition in the financial statements. Open tax years are those that are open for examination by taxing authorities (i.e., generally the last four tax year ends and the interim tax period since then). Furthermore, management of the Funds is also not aware of any tax positions for which it is reasonably possible that the total amounts of unrecognized tax benefits will significantly change in the next twelve months.
The following information is presented on an income tax basis. Differences between amounts for financial statement and federal income tax purposes are primarily due to timing differences in recognizing taxable market discount, timing differences in recognizing certain gains and losses on investment transactions and the treatment of investments in inverse floating rate securities reflected as financing transactions, if any. To the extent that differences arise that are permanent in nature, such amounts are reclassified within the capital accounts as detailed below. Temporary differences do not require reclassification. Temporary and permanent differences do not impact the NAVs of the Funds.
As of November 30, 2015, the cost and unrealized appreciation (depreciation) of investments (excluding investments in derivatives), as determined on a federal income tax basis, were as follows:
| | | | | | | Intermediate | |
| | | | Intermediate | | | Duration | |
| | | | Duration | | | Quality | |
| | | | (NID | ) | | (NIQ | ) |
| Cost of Investments | | $ | 803,715,805 | | $ | 228,155,620 | |
| Gross unrealized: | | | | | | | |
| Appreciation | | $ | 21,317,200 | | $ | 5,810,194 | |
| Depreciation | | | (18,004,146 | ) | | (1,493,904 | ) |
| Net unrealized appreciation (depreciation) of investments | | $ | 3,313,054 | | $ | 4,316,290 | |
Permanent differences, primarily due to taxable market discount, federal taxes paid, treatment of notional principal contracts, paydowns and nondeductible offering costs resulted in reclassifications among the Funds' components of net assets as of May 31, 2015, the Funds' last tax year end, as follows:
| | | | | | | Intermediate | |
| | | | Intermediate | | | Duration | |
| | | | Duration | | | Quality | |
| | | | (NID | ) | | (NIQ | ) |
| Paid-in surplus | | $ | (59,854 | ) | $ | (35,861 | ) |
| Undistributed (Over-distribution of) net investment income | | | (2,741 | ) | | (80,744 | ) |
| Accumulated net realized gain (loss) | | | 62,595 | | | 116,605 | |
The tax components of undistributed net tax-exempt income, net ordinary income and net long-term capital gains as of May 31, 2015, the Funds' last tax year end, were as follows:
| | | | | | | | |
| | | | | | | Intermediate | |
| | | | Intermediate | | | Duration | |
| | | | Duration | | | Quality | |
| | | | (NID | ) | | (NIQ | ) |
Undistributed net tax-exempt income1 | | $ | 5,297,839 | | $ | 1,113,486 | |
Undistributed net ordinary income2 | | | 1,925 | | | — | |
| Undistributed net long-term capital gains | | | — | | | — | |
| 1 | Undistributed net tax-exempt income (on a tax basis) has not been reduced for the dividend declared on May 1, 2015, and paid on June 1, 2015. |
| 2 | Net ordinary income consists of taxable market discount income and net short-term capital gains, if any. |
The tax character of distributions paid during the Funds' last tax year ended May 31, 2015, was designated for purposes of the dividends paid deduction as follows:
| | | | | | | Intermediate | |
| | | | Intermediate | | | Duration | |
| | | | Duration | | | Quality | |
| | | | (NID | ) | | (NIQ | ) |
| Distributions from net tax-exempt income | | $ | 33,990,207 | | $ | 8,302,404 | |
Distributions from net ordinary income2 | | | 18,764 | | | 30,330 | |
| Distributions from net long-term capital gains | | | — | | | — | |
| 2 | Net ordinary income consists of taxable market discount income and net short-term capital gains, if any. |
Notes to Financial Statements (Unaudited) (continued)
As of May 31, 2015, the Funds' last tax year end, the Funds had unused capital loss carryforwards available for federal income tax purposes to be applied against future capital gains, if any. The capital losses are not subject to expiration.
| | | | | | | Intermediate | |
| | | | Intermediate | | | Duration | |
| | | | Duration | | | Quality | |
| | | | (NID | ) | | (NIQ | ) |
| Capital loss carryforwards – not subject to expiration | | $ | 23,166,802 | | $ | 4,239,753 | |
The Funds have elected to defer late-year losses in accordance with federal income tax rules. These losses are treated as having arisen on the first day of the current fiscal year. The following Fund has elected to defer losses as follows:
| | | | | |
| | | | Intermediate | |
| | | | Duration | |
| | | | Quality | |
| | | | (NIQ | ) |
Post-October capital losses3 | | $ | 3,041,212 | |
Late-year ordinary losses4 | | | — | |
| 3 | Capital losses incurred from November 1, 2014 through May 31, 2015, the Funds' last tax year end. |
| 4 | Ordinary losses incurred from January 1, 2015 through May 31, 2015, and specified losses incurred from November 1, 2014 through May 31, 2015. |
7. Management Fees and Other Transactions with Affiliates
Each Fund's management fee compensates the Adviser for overall investment advisory and administrative services and general office facilities. The Sub-Adviser is compensated for its services to the Funds from the management fees paid to the Adviser.
Each Fund's management fee consists of two components – a fund-level fee, based only on the amount of assets within each individual Fund, and a complex-level fee, based on the aggregate amount of all eligible fund assets managed by the Adviser. This pricing structure enables Fund shareholders to benefit from growth in the assets within their respective Fund as well as from growth in the amount of complex-wide assets managed by the Adviser.
The annual Fund-level fee, payable monthly, for each Fund is calculated according to the following schedule:
| | | | | | | Intermediate | |
| | | | Intermediate | | | Duration | |
| | | | Duration | | | Quality | |
| | | | (NID | ) | | (NIQ | ) |
| Average Daily Managed Assets* | | | Fund-Level Fee | | | Fund-Level Fee | |
| For the first $125 million | | | 0.4000 | % | | 0.3000 | % |
| For the next $125 million | | | 0.3875 | | | 0.2875 | |
| For the next $250 million | | | 0.3750 | | | 0.2750 | |
| For the next $500 million | | | 0.3625 | | | 0.2625 | |
| For the next $1 billion | | | 0.3500 | | | 0.2500 | |
| For the next $3 billion | | | 0.3375 | | | 0.2375 | |
| For managed assets over $5 billion | | | 0.3250 | | | 0.2250 | |
The annual complex-level fee, payable monthly, for each Fund is calculated according to the following schedule:
| Complex-Level Managed Asset Breakpoint Level* | Effective Rate at Breakpoint Level |
| $55 billion | 0.2000 | % |
| $56 billion | 0.1996 | |
| $57 billion | 0.1989 | |
| $60 billion | 0.1961 | |
| $63 billion | 0.1931 | |
| $66 billion | 0.1900 | |
| $71 billion | 0.1851 | |
| $76 billion | 0.1806 | |
| $80 billion | 0.1773 | |
| $91 billion | 0.1691 | |
| $125 billion | 0.1599 | |
| $200 billion | 0.1505 | |
| $250 billion | 0.1469 | |
| $300 billion | 0.1445 | |
| * | For the fund-level and complex-level fees, managed assets include closed-end fund assets managed by the Adviser that are attributable to certain types of leverage. For these purposes, leverage includes the funds' use of preferred stock and borrowings and certain investments in the residual interest certificates (also called inverse floating rate securities) in tender option bond (TOB) trusts, including the portion of assets held by a TOB trust that has been effectively financed by the trust's issuance of floating rate securities, subject to an agreement by the Adviser as to certain funds to limit the amount of such assets for determining managed assets in certain circumstances. The complex-level fee is calculated based upon the aggregate daily managed assets of all Nuveen Funds that constitute "eligible assets." Eligible assets do not include assets attributable to investments in other Nuveen Funds or assets in excess of $2 billion added to the Nuveen Fund complex in connection with the Adviser's assumption of the management of the former First American Funds effective January 1, 2011. As of November 30, 2015, the complex-level fee for each Fund was 0.1639%. |
The Funds pay no compensation directly to those of its trustees who are affiliated with the Adviser or to its officers, all of whom receive remuneration for their services to the Funds from the Adviser or its affiliates. The Board has adopted a deferred compensation plan for independent trustees that enables trustees to elect to defer receipt of all or a portion of the annual compensation they are entitled to receive from certain Nuveen-advised funds. Under the plan, deferred amounts are treated as though equal dollar amounts had been invested in shares of select Nuveen-advised funds.
8. Borrowing Arrangements
During the current fiscal period, the Funds, along with certain other funds managed by the Adviser ("Participating Funds"), established a 364-day, $2.53 billion standby credit facility with a group of lenders, under which the Participating Funds may borrow for various purposes other than leveraging for investment purposes. A large portion of this facility's capacity (and its associated costs as described below) is currently dedicated for use by a small number of Participating Funds, which does not include any of the Funds covered by this shareholder report. The remaining capacity under the facility (and the corresponding portion of the facility's annual costs) is separately dedicated to most of the other open-end funds in the Nuveen fund family, along with a number of Nuveen closed-end funds, including all of the Funds covered by this shareholder report. The credit facility expires in July 2016 unless extended or renewed.
The credit facility has the following terms: a fee of 0.15% per annum on unused commitment amounts, and interest at a rate equal to the higher of (a) one-month LIBOR (London Inter-Bank Offered Rate) plus 1.25% per annum or (b) the Fed Funds rate plus 1.25% per annum on amounts borrowed. Participating Funds paid administration, legal and arrangement fees, which are recognized as a component of "Other expenses" on the Statement of Operations, and along with commitment fees, have been allocated among such Participating Funds based upon the relative proportions of the facility's aggregate capacity reserved for them and other factors deemed relevant by the Adviser and the Board of each Participating Fund.
During the current fiscal period, neither Fund utilized this facility.
Additional Fund Information
| Board of Trustees | | | | | |
| William Adams IV* | Jack B. Evans | William C. Hunter | David J. Kundert | John K. Nelson | William J. Schneider |
| Thomas S. Schreier, Jr.* | Judith M. Stockdale | Carole E. Stone | Virginia L. Stringer** | Terence J. Toth | |
| * | Interested Board Member. |
| ** | Retired from the Funds' Board of Trustees effective December 31, 2015. |
| | | | | |
| | | | | |
| Fund Manager | Custodian | Legal Counsel | Independent Registered | Transfer Agent and |
| Nuveen Fund Advisors, LLC | State Street Bank | Chapman and Cutler LLP | Public Accounting Firm | Shareholder Services |
| 333 West Wacker Drive | & Trust Company | Chicago, IL 60603 | KPMG LLP | State Street Bank |
| Chicago, IL 60606 | Boston, MA 02111 | | Chicago, IL 60601 | & Trust Company |
| | | | | Nuveen Funds |
| | | | | P.O. Box 43071 |
| | | | | Providence, RI 02940-3071 |
| | | | | (800) 257-8787 |
Quarterly Form N-Q Portfolio of Investments Information
Each Fund is required to file its complete schedule of portfolio holdings with the Securities and Exchange Commission (SEC) for the first and third quarters of each fiscal year on Form N-Q. You may obtain this information directly from the SEC. Visit the SEC on-line at http://www.sec.gov or in person at the SEC's Public Reference Room in Washington, D.C. Call the SEC toll-free at (800) SEC-0330 for room hours and operation.
Nuveen Funds' Proxy Voting Information
You may obtain (i) information regarding how each fund voted proxies relating to portfolio securities held during the most recent twelve-month period ended June 30, without charge, upon request, by calling Nuveen Investments toll-free at (800) 257-8787 or on Nuveen's website at www.nuveen.com and (ii) a description of the policies and procedures that each fund used to determine how to vote proxies relating to portfolio securities without charge, upon request, by calling Nuveen Investments toll free at (800) 257-8787. You may also obtain this information directly from the SEC. Visit the SEC on-line at http://www.sec.gov.
CEO Certification Disclosure
Each Fund's Chief Executive Officer (CEO) has submitted to the New York Stock Exchange (NYSE) the annual CEO certification as required by Section 303A.12(a) of the NYSE Listed Company Manual. Each Fund has filed with the SEC the certification of its CEO and Chief Financial Officer required by Section 302 of the Sarbanes-Oxley Act.
Common Share Repurchases
Each Fund intends to repurchase, through its open-market share repurchase program, shares of its own common stock at such times and in such amounts as is deemed advisable. During the period covered by this report, each Fund repurchased shares of its common stock, as shown in the accompanying table. Any future repurchases will be reported to shareholders in the next annual or semi-annual report.
| | | | NID | | | NIQ | |
| Common shares repurchased | | | — | | | — | |
FINRA BrokerCheck
The Financial Industry Regulatory Authority (FINRA) provides information regarding the disciplinary history of FINRA member firms and associated investment professionals. This information as well as an investor brochure describing FINRA BrokerCheck is available to the public by calling the FINRA BrokerCheck Hotline number at (800) 289-9999 or by visiting www.FINRA.org.
Glossary of Terms Used in this Report
| | |
| ■ | Auction Rate Bond: An auction rate bond is a security whose interest payments are adjusted periodically through an auction process, which process typically also serves as a means for buying and selling the bond. Auctions that fail to attract enough buyers for all the shares offered for sale are deemed to have "failed," with current holders receiving a formula-based interest rate until the next scheduled auction. |
| | |
| ■ | Average Annual Total Return: This is a commonly used method to express an investment's performance over a particular, usually multi-year time period. It expresses the return that would have been necessary each year to equal the investment's actual cumulative performance (including change in NAV or market price and reinvested dividends and capital gains distributions, if any) over the time period being considered. |
| | |
| ■ | Duration: Duration is a measure of the expected period over which a bond's principal and interest will be paid, and consequently is a measure of the sensitivity of a bond's or bond fund's value to changes when market interest rates change. Generally, the longer a bond's or fund's duration, the more the price of the bond or fund will change as interest rates change. |
| | |
| ■ | Effective Leverage: Effective leverage is a fund's effective economic leverage, and includes both regulatory leverage (see leverage) and the leverage effects of certain derivative investments in a fund's portfolio. Currently, the leverage effects of Tender Option Bond (TOB) inverse floater holdings are included in effective leverage values, in addition to any regulatory leverage. |
| | |
| ■ | Forward Interest Rate Swap: A contractual agreement between two counterparties under which one party agrees to make periodic payments to the other for an agreed period of time based on a fixed rate, while the other party agrees to make periodic payments based on a floating rate of interest based on an underlying index. Alternatively, both series of cash flows to be exchanged could be calculated using floating rates of interest but floating rates that are based upon different underlying indices. |
| | |
| ■ | Inverse Floating Rate Securities: Inverse floating rate securities, also known as inverse floaters or tender option bonds (TOBs), are created by depositing a municipal bond, typically with a fixed interest rate, into a special purpose trust. This trust, in turn, (a) issues floating rate certificates typically paying short-term tax-exempt interest rates to third parties in amounts equal to some fraction of the deposited bond's par amount or market value, and (b) issues an inverse floating rate certificate (sometimes referred to as an "inverse floater") to an investor (such as a Fund) interested in gaining investment exposure to a long-term municipal bond. The income received by the holder of the inverse floater varies inversely with the short-term rate paid to the floating rate certificates' holders, and in most circumstances the holder of the inverse floater bears substantially all of the underlying bond's downside investment risk. The holder of the inverse floater typically also benefits disproportionately from any potential appreciation of the underlying bond's value. Hence, an inverse floater essentially represents an investment in the underlying bond on a leveraged basis. |
| | |
| ■ | Leverage: Leverage is created whenever a fund has investment exposure (both reward and/or risk) equivalent to more than 100% of the investment capital. |
| | |
| ■ | Lipper General & Insured Leveraged Municipal Debt Funds Classification Average: Calculated using the returns of all closed-end funds in this category. Lipper returns account for the effects of management fees and assume reinvestment of distributions, but do not reflect any applicable sales charges. |
| | |
| ■ | Lipper Intermediate Municipal Debt Funds Classification Average: Represents the average annualized total return for all reporting funds in the Lipper Intermediate Municipal Debt Funds Classification. Lipper returns account for the effects of management fees and assume reinvestment of distributions, but do not reflect any applicable sales charge. |
| | |
| ■ | Net Asset Value (NAV) Per Share: A fund's Net Assets is equal to its total assets (securities, cash, accrued earnings and receivables) less its total liabilities. NAV per share is equal to the fund's Net Assets divided by its number of shares outstanding. |
Glossary of Terms Used in this Report (continued)
| | |
| ■ | Pre-Refunding: Pre-Refunding, also known as advanced refundings or refinancings, is a procedure used by state and local governments to refinance municipal bonds to lower interest expenses. The issuer sells new bonds with a lower yield and uses the proceeds to buy U.S. Treasury securities, the interest from which is used to make payments on the higher-yielding bonds. Because of this collateral, pre-refunding generally raises a bond's credit rating and thus its value. |
| | |
| ■ | Regulatory Leverage: Regulatory Leverage consists of preferred shares issued by or borrowings of a fund. Both of these are part of a fund's capital structure. Regulatory leverage is subject to asset coverage limits set in the Investment Company Act of 1940. |
| | |
| ■ | S&P Municipal Bond Intermediate Index: An unleveraged, market value-weighted index containing all of the bonds in the S&P Municipal Bond Index with maturity dates between 3 and 14.999 years. Index returns assume reinvestment of distributions, but do not reflect any applicable sales charges or management fees. |
| | |
| ■ | Total Investment Exposure: Total investment exposure is a fund's assets managed by the Adviser that are attributable to financial leverage. For these purposes, financial leverage includes a fund's use of preferred stock and borrowings and investments in the residual interest certificates (also called inverse floating rate securities) in tender option bond (TOB) trusts, including the portion of assets held by a TOB trust that has been effectively financed by the trust's issuance of floating rate securities. |
| | |
| ■ | Zero Coupon Bond: A zero coupon bond does not pay a regular interest coupon to its holders during the life of the bond. Income to the holder of the bond comes from accretion of the difference between the original purchase price of the bond at issuance and the par value of the bond at maturity and is effectively paid at maturity. The market prices of zero coupon bonds generally are more volatile than the market prices of bonds that pay interest periodically. |
Notes
Notes
Reinvest Automatically, Easily and Conveniently
Nuveen makes reinvesting easy. A phone call is all it takes to set up your reinvestment account.
Nuveen Closed-End Funds Automatic Reinvestment Plan
Nuveen Closed-End Fund allows you to conveniently reinvest distributions in additional Fund shares. By choosing to reinvest, you'll be able to invest money regularly and automatically, and watch your investment grow through the power of compounding. Just like distributions in cash, there may be times when income or capital gains taxes may be payable on distributions that are reinvested. It is important to note that an automatic reinvestment plan does not ensure a profit, nor does it protect you against loss in a declining market.
Easy and convenient
To make recordkeeping easy and convenient, each month you'll receive a statement showing your total distributions, the date of investment, the shares acquired and the price per share, and the total number of shares you own.
How shares are purchased
The shares you acquire by reinvesting will either be purchased on the open market or newly issued by the Fund. If the shares are trading at or above net asset value at the time of valuation, the Fund will issue new shares at the greater of the net asset value or 95% of the then-current market price. If the shares are trading at less than net as -set value, shares for your account will be purchased on the open market. If the Plan Agent begins purchasing Fund shares on the open market while shares are trading below net asset value, but the Fund's shares subsequently trade at or above their net asset value before the Plan Agent is able to complete its purchases, the Plan Agent may cease open-market purchases and may invest the uninvested portion of the distribution in newly-issued Fund shares at a price equal to the greater of the shares' net asset value or 95% of the shares' market value on the last business day imme -diately prior to the purchase date. Distributions received to purchase shares in the open market will normally be invested shortly after the distribution payment date. No interest will be paid on distributions awaiting reinvestment. Because the market price of the shares may increase before purchases are completed, the average purchase price per share may exceed the market price at the time of valuation, resulting in the acquisition of fewer shares than if the distribution had been paid in shares issued by the Fund. A pro rata portion of any applicable brokerage commissions on open market purchases will be paid by Plan participants. These commissions usually will be lower than those charged on individual transactions.
Flexible
You may change your distribution option or withdraw from the Plan at any time, should your needs or situation change. You can reinvest whether your shares are registered in your name, or in the name of a brokerage firm, bank, or other nominee. Ask your investment advisor if his or her firm will participate on your behalf. Participants whose shares are registered in the name of one firm may not be able to transfer the shares to another firm and continue to participate in the Plan. The Fund reserves the right to amend or terminate the Plan at any time. Although the Fund reserves the right to amend the Plan to include a service charge payable by the participants, there is no direct service charge to participants in the Plan at this time.
Call today to start reinvesting distributions
For more information on the Nuveen Automatic Reinvestment Plan or to enroll in or withdraw from the Plan, speak with your financial advisor or call us at (800) 257-8787.
| Nuveen Investments: |
| | Serving Investors for Generations |
Since 1898, financial advisors and their clients have relied on Nuveen Investments to provide dependable investment solutions through continued adherence to proven, long-term investing principles. Today, we offer a range of high quality equity and fixed-income solutions designed to be integral components of a well-diversified core portfolio.
Focused on meeting investor needs.
Nuveen Investments provides high-quality investment services designed to help secure the long-term goals of institutional and individual investors as well as the consultants and financial advisors who serve them. Nuveen Investments markets a wide range of specialized investment solutions which provide investors access to capabilities of its high-quality boutique investment affiliates—Nuveen Asset Management, Symphony Asset Management, NWQ Investment Management Company, Santa Barbara Asset Management, Tradewinds Global Investors, Winslow Capital Management and Gresham Investment Management. In total, Nuveen Investments managed approximately $225 billion as of December 31, 2015.
Find out how we can help you.
To learn more about how the products and services of Nuveen Investments may be able to help you meet your financial goals, talk to your financial advisor, or call us at (800) 257-8787. Please read the information provided carefully before you invest. Investors should consider the investment objective and policies, risk considerations, charges and expenses of any investment carefully. Where applicable, be sure to obtain a prospectus, which contains this and other relevant information. To obtain a prospectus, please contact your securities representative or Nuveen Investments, 333 W. Wacker Dr., Chicago, IL 60606. Please read the prospectus carefully before you invest or send money.
Learn more about Nuveen Funds at: www.nuveen.com/cef
Distributed by Nuveen Investments, LLC | 333 West Wacker Drive | Chicago, IL 60606 | www.nuveen.com | |
ESA-C-1115D 13131-INV-B-01/17
ITEM 2. CODE OF ETHICS.