Exhibit (c)(2)

Fairness Opinion – Presentation to the Special Committee January 3rd, 2019
2 CONFIDENTIAL Preface These materials were prepared by MHT Securities (“MHT,“ our”, “we” or “us”) as part of a presentation being made in support of our formal written opinion being delivered to the Special Committee of the Board of Directors (the “Special Committee”) of Truett - Hurst, Inc . (“Truett - Hurst” or the “Company”) in connection with the proposed tender offer more specifically set forth in the Company’s Tender Offer Statement on Schedule TO, including the Offer to Purchase filed as Exhibit (a)( 1 )(i) and associated Letter of Transmittal, to be filed shortly with the Securities and Exchange Commission (“Offer”) . These materials were compiled on a confidential basis for use solely by the Special Committee and may not be used or relied upon by any other person or body without the prior written approval of MHT . These materials were prepared from publicly available information as well as information supplied by Truett - Hurst and other sources as of January 2 , 2019 . We have not independently verified any information whether publicly available or furnished to us concerning Truett - Hurst or any other entity, and therefore neither MHT nor any of its partners, directors, officers, employees or affiliates expresses any view as to the accuracy or completeness of such information, including without limitation the accuracy or achievability of any valuations, projections, estimates or assumptions . Actual results may vary from such valuations, projections, estimates and assumptions, and such variations may be material . In addition, we have relied upon and assumed, without independent verification, that the final form of the Offer will not differ in any material respect from the draft Offer provided to us on December 22 , 2018 . Our only opinion is the formal written opinion set forth in our letter delivered to the Special Committee in which we express our opinion as to the fairness, from a financial point of view, of the consideration to be offered to the holders of Truett - Hurst’s Class A Common Stock (the “Common Stock”) in the Offer . These materials are for discussion purposes only and are incomplete without reference to, and should be viewed solely in conjunction with, the oral briefing by MHT to the Special Committee . These materials were prepared for this specific use by us, and were not prepared to conform with any disclosure standards under securities laws or otherwise . These materials are not intended to provide the sole basis for evaluating the fairness, from a financial point of view, of the consideration to be offered to the holders of Truett - Hurst’s Class A Common S tock in the Offer, and do not purport to contain all information that should be considered in making a recommendation with respect to the Offer . Our written opinion and these materials were approved by a committee of persons within MHT authorized to approve such written opinion and related materials . Several analytical methodologies and factors are described in these materials and no one method of analysis or factor should be regarded as critical to the overall conclusion we have reached . Each analytical technique has inherent strengths and weaknesses, and the nature of the available information may further affect the value of particular techniques . The conclusions we have reached are based on all the analyses and factors presented herein taken as a whole and also on the application of our own judgment or qualitative analysis of the information available to us, without any independent verification thereof . We therefore give no opinion as to the value or merit standing alone of any one or more parts of the materials that follow . Further, our opinion does not address the underlying business decision of the Company to pursue the Offer or the relative merits of the Offer as compared with any other alternative business strategies which may be available to the Company . Likewise, we make no recommendation to holders of the Company’s Class A C ommon S tock whether to tender their shares in the Offer . These materials are necessarily based upon economic, market and other conditions as in effect on, and the information made available to us as of, the date hereof . It should be understood that subsequent developments may affect the conclusions we have reached .
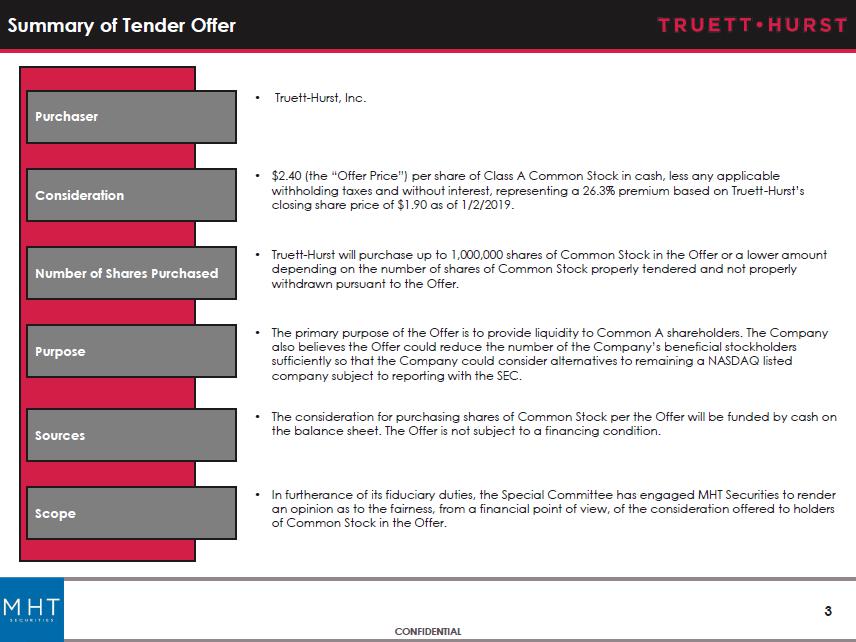
3 CONFIDENTIAL Summary of Tender Offer Purchaser • Truett - Hurst, Inc. Consideration • $2.40 (the “Offer Price”) per share of Class A Common S tock in cash, less any applicable withholding taxes and without interest, representing a 26.3% premium based on Truett - Hurst’s closing share price of $1.90 as of 1/2/2019. Purpose • The primary purpose of the Offer is to provide liquidity to Common A shareholders. The Company also believes the Offer could reduce the number of the Company’s beneficial stockholders sufficiently so that the Company could consider alternatives to remaining a NASDAQ listed company subject to reporting with the SEC. Scope • In furtherance of its fiduciary duties, the Special Committee has engaged MHT Securities to render an opinion as to the fairness, from a financial point of view, of the consideration offered to holders of Common Stock in the Offer. Sources • The consideration for purchasing shares of Common Stock per the Offer will be funded by cash on the balance sheet. The Offer is not subject to a financing condition. Number of Shares Purchased • Truett - Hurst will purchase up to 1,000,000 shares of Common S tock in the Offer or a lower amount depending on the number of shares of Common S tock properly tendered and not properly withdrawn pursuant to the Offer.
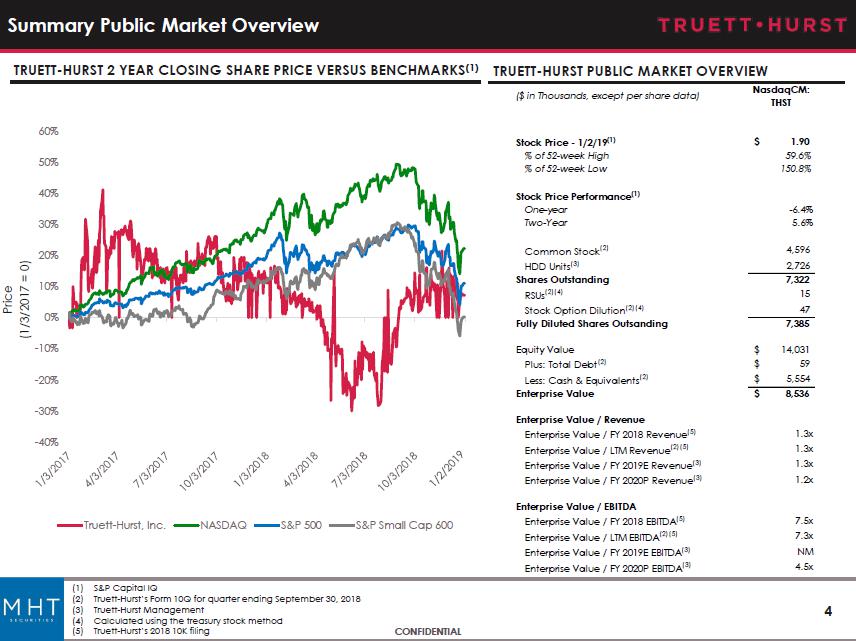
4 CONFIDENTIAL -40% -30% -20% -10% 0% 10% 20% 30% 40% 50% 60% Truett-Hurst, Inc. NASDAQ S&P 500 S&P Small Cap 600 Summary Public Market Overview Price (1/3/2017 = 0) TRUETT - HURST 2 YEAR CLOSING SHARE PRICE VERSUS BENCHMARKS (1 ) (1) S&P Capital IQ (2) Truett - Hurst’s Form 10 Q for quarter ending September 30 , 2018 (3) Truett - Hurst Management (4) Calculated using the treasury stock method (5) Truett - Hurst’s 2018 10 K filing TRUETT - HURST PUBLIC MARKET OVERVIEW ($ in Thousands, except per share data) NasdaqCM: THST Stock Price - 1/2/19 (1) 1.90$ % of 52-week High 59.6% % of 52-week Low 150.8% Stock Price Performance (1) One-year -6.4% Two-Year 5.6% Common Stock (2) 4,596 HDD Units (3) 2,726 Shares Outstanding 7,322 RSUs (2)(4) 15 Stock Option Dilution (2)(4) 47 Fully Diluted Shares Outsanding 7,385 Equity Value 14,031$ Plus: Total Debt (2) 59$ Less: Cash & Equivalents (2) 5,554$ Enterprise Value 8,536$ Enterprise Value / Revenue Enterprise Value / FY 2018 Revenue (5) 1.3x Enterprise Value / LTM Revenue (2)(5) 1.3x Enterprise Value / FY 2019E Revenue (3) 1.3x Enterprise Value / FY 2020P Revenue (3) 1.2x Enterprise Value / EBITDA Enterprise Value / FY 2018 EBITDA (5) 7.5x Enterprise Value / LTM EBITDA (2)(5) 7.3x Enterprise Value / FY 2019E EBITDA (3) NM Enterprise Value / FY 2020P EBITDA (3) 4.5x
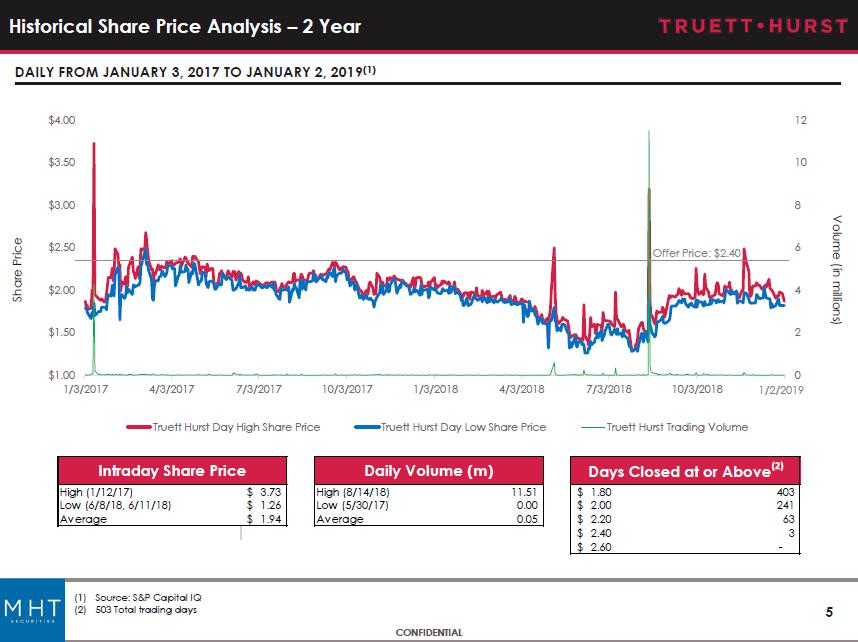
5 CONFIDENTIAL 0 2 4 6 8 10 12 $1.00 $1.50 $2.00 $2.50 $3.00 $3.50 $4.00 1/3/2017 4/3/2017 7/3/2017 10/3/2017 1/3/2018 4/3/2018 7/3/2018 10/3/2018 Truett Hurst Day High Share Price Truett Hurst Day Low Share Price Truett Hurst Trading Volume Historical Share Price Analysis – 2 Year Share Price Volume (in millions) DAILY FROM JANUARY 3, 2017 TO JANUARY 2, 2019 (1 ) (1) Source : S&P Capital IQ (2) 503 Total trading days Offer Price: $2.40 1 / 2 / 2019 High (1/12/17) 3.73$ High (8/14/18) 11.51 1.80$ 403 Low (6/8/18, 6/11/18) 1.26$ Low (5/30/17) 0.00 2.00$ 241 Average 1.94$ Average 0.05 2.20$ 63 2.40$ 3 2.60$ - Intraday Share Price Daily Volume (m) Days Closed at or Above (2)
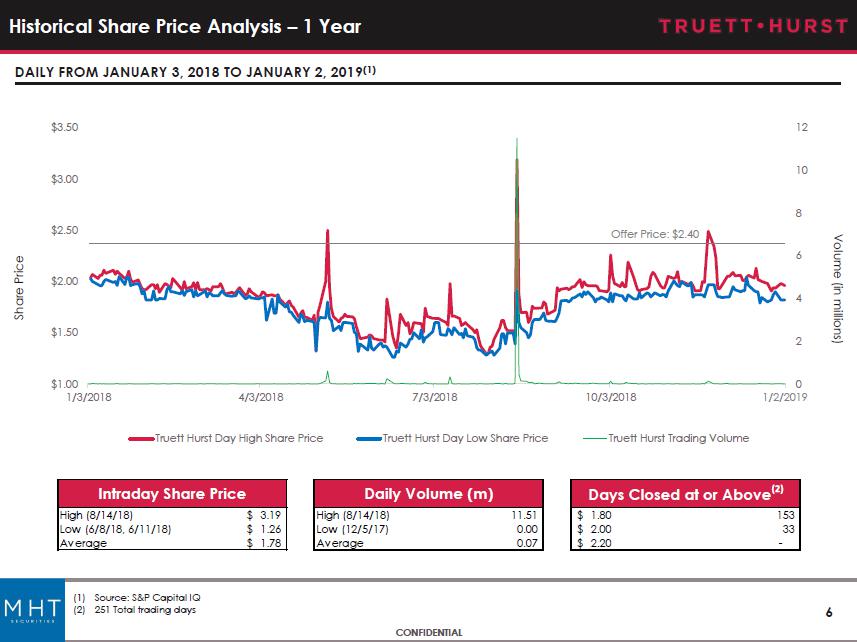
6 CONFIDENTIAL 0 2 4 6 8 10 12 $1.00 $1.50 $2.00 $2.50 $3.00 $3.50 1/3/2018 4/3/2018 7/3/2018 10/3/2018 Truett Hurst Day High Share Price Truett Hurst Day Low Share Price Truett Hurst Trading Volume Historical Share Price Analysis – 1 Year Share Price Volume (in millions) DAILY FROM JANUARY 3, 2018 TO JANUARY 2, 2019 (1 ) (1) Source : S&P Capital IQ (2) 251 Total trading days Offer Price: $2.40 1 / 2 / 2019 High (8/14/18) 3.19$ High (8/14/18) 11.51 1.80$ 153 Low (6/8/18, 6/11/18) 1.26$ Low (12/5/17) 0.00 2.00$ 33 Average 1.78$ Average 0.07 2.20$ - Intraday Share Price Daily Volume (m) Days Closed at or Above (2)
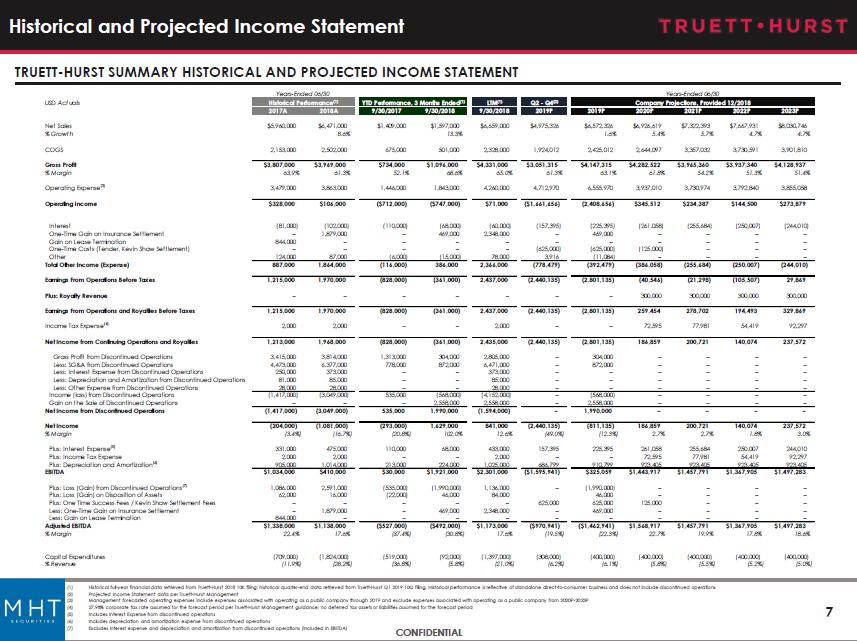
7 CONFIDENTIAL Historical and Projected Income Statement TRUETT - HURST SUMMARY HISTORICAL AND PROJECTED INCOME STATEMENT Years-Ended 06/30 Years-Ended 06/30 USD Actuals Historical Performance (1) YTD Performance, 3 Months Ended (1) LTM (1) Q2 - Q4 (2) Company Projections, Provided 12/2018 2017A 2018A 9/30/2017 9/30/2018 9/30/2018 2019P 2019P 2020P 2021P 2022P 2023P Net Sales $5,960,000 $6,471,000 $1,409,000 $1,597,000 $6,659,000 $4,975,326 $6,572,326 $6,926,619 $7,322,393 $7,667,931 $8,030,746 % Growth 8.6% 13.3% 1.6% 5.4% 5.7% 4.7% 4.7% COGS 2,153,000 2,502,000 675,000 501,000 2,328,000 1,924,012 2,425,012 2,644,097 3,357,032 3,730,591 3,901,810 Gross Profit $3,807,000 $3,969,000 $734,000 $1,096,000 $4,331,000 $3,051,315 $4,147,315 $4,282,522 $3,965,360 $3,937,340 $4,128,937 % Margin 63.9% 61.3% 52.1% 68.6% 65.0% 61.3% 63.1% 61.8% 54.2% 51.3% 51.4% Operating Expense (3) 3,479,000 3,863,000 1,446,000 1,843,000 4,260,000 4,712,970 6,555,970 3,937,010 3,730,974 3,792,840 3,855,058 Operating Income $328,000 $106,000 ($712,000) ($747,000) $71,000 ($1,661,656) (2,408,656) $345,512 $234,387 $144,500 $273,879 Interest (81,000) (102,000) (110,000) (68,000) (60,000) (157,395) (225,395) (261,058) (255,684) (250,007) (244,010) One-Time Gain on Insurance Settlement – 1,879,000 – 469,000 2,348,000 – 469,000 – – – – Gain on Lease Termination 844,000 – – – – – – – – – – One-Time Costs (Tender, Kevin Shaw Settlement) – – – – – (625,000) (625,000) (125,000) – – – Other 124,000 87,000 (6,000) (15,000) 78,000 3,916 (11,084) – – – – Total Other Income (Expense) 887,000 1,864,000 (116,000) 386,000 2,366,000 (778,479) (392,479) (386,058) (255,684) (250,007) (244,010) Earnings From Operations Before Taxes 1,215,000 1,970,000 (828,000) (361,000) 2,437,000 (2,440,135) (2,801,135) (40,546) (21,298) (105,507) 29,869 Plus: Royalty Revenue – – – – – – – 300,000 300,000 300,000 300,000 Earnings From Operations and Royalties Before Taxes 1,215,000 1,970,000 (828,000) (361,000) 2,437,000 (2,440,135) (2,801,135) 259,454 278,702 194,493 329,869 Income Tax Expense (4) 2,000 2,000 – – 2,000 – – 72,595 77,981 54,419 92,297 Net Income from Continuing Operations and Royalties 1,213,000 1,968,000 (828,000) (361,000) 2,435,000 (2,440,135) (2,801,135) 186,859 200,721 140,074 237,572 Gross Profit from Discontinued Operations 3,415,000 3,814,000 1,313,000 304,000 2,805,000 – 304,000 – – – – Less: SG&A from Discontinued Operations 4,473,000 6,377,000 778,000 872,000 6,471,000 – 872,000 – – – – Less: Interest Expense from Discontinued Operations 250,000 373,000 – – 373,000 – – – – – – Less: Depreciation and Amortization from Discontinued Operations 81,000 85,000 – – 85,000 – – – – – – Less: Other Expense from Discontinued Operations 28,000 28,000 – – 28,000 – – – – – – Income (loss) from Discontinued Operations (1,417,000) (3,049,000) 535,000 (568,000) (4,152,000) – (568,000) – – – – Gain on the Sale of Discontinued Operations – – – 2,558,000 2,558,000 – 2,558,000 – – – – Net Income from Discontinued Operations (1,417,000) (3,049,000) 535,000 1,990,000 (1,594,000) – 1,990,000 – – – – Net Income (204,000) (1,081,000) (293,000) 1,629,000 841,000 (2,440,135) (811,135) 186,859 200,721 140,074 237,572 % Margin (3.4%) (16.7%) (20.8%) 102.0% 12.6% (49.0%) (12.3%) 2.7% 2.7% 1.8% 3.0% Plus: Interest Expense (5) 331,000 475,000 110,000 68,000 433,000 157,395 225,395 261,058 255,684 250,007 244,010 Plus: Income Tax Expense 2,000 2,000 – – 2,000 – – 72,595 77,981 54,419 92,297 Plus: Depreciation and Amortization (6) 905,000 1,014,000 213,000 224,000 1,025,000 686,799 910,799 923,405 923,405 923,405 923,405 EBITDA $1,034,000 $410,000 $30,000 $1,921,000 $2,301,000 ($1,595,941) $325,059 $1,443,917 $1,457,791 $1,367,905 $1,497,283 Plus: Loss (Gain) from Discontinued Operations (7) 1,086,000 2,591,000 (535,000) (1,990,000) 1,136,000 – (1,990,000) – – – – Plus: Loss (Gain) on Disposition of Assets 62,000 16,000 (22,000) 46,000 84,000 46,000 – – – – Plus: One Time Success Fees / Kevin Shaw Settlement Fees – – – – – 625,000 625,000 125,000 – – – Less: One-Time Gain on Insurance Settlement – 1,879,000 – 469,000 2,348,000 – 469,000 – – – – Less: Gain on Lease Termination 844,000 – – – – – – – – – – Adjusted EBITDA $1,338,000 $1,138,000 ($527,000) ($492,000) $1,173,000 ($970,941) ($1,462,941) $1,568,917 $1,457,791 $1,367,905 $1,497,283 % Margin 22.4% 17.6% (37.4%) (30.8%) 17.6% (19.5%) (22.3%) 22.7% 19.9% 17.8% 18.6% Capital Expenditures (709,000) (1,824,000) (519,000) (92,000) (1,397,000) (308,000) (400,000) (400,000) (400,000) (400,000) (400,000) % Revenue (11.9%) (28.2%) (36.8%) (5.8%) (21.0%) (6.2%) (6.1%) (5.8%) (5.5%) (5.2%) (5.0%)

8 CONFIDENTIAL Historical Balance Sheet TRUETT - HURST HISTORICAL AND PROJECTED BALANCE SHEET ($ IN THOUSANDS) (1) Balance sheet as of 9/30/2018 retrieved from Truett - Hurst Q1 2019 10Q filing (2) Projected balance sheet per Truett - Hurst Management (3) Includes current assets from discontinued operations as of September 30, 2018 (4) Includes net intangible assets as of September 30, 2018 (5) Includes current liabilities from discontinued operations as of September 30, 2018 As of June 30, (2) Sep-18 (1) 2019P 2020P 2021P 2022P 2023P ASSETS Current Assets: Cash & Cash Equivalents $5,554 $4,331 $4,771 $5,924 $7,176 $8,647 Accounts Receivable 918 0 0 0 0 0 Inventory 6,162 8,517 10,661 11,694 11,207 10,988 Other Current Assets (3) 930 171 171 171 171 171 Total Current Assets $13,564 $13,019 $15,603 $17,789 $18,555 $19,807 Non-Current Assets: Net PP&E $6,233 $5,980 $5,709 $5,438 $5,200 $4,928 Other Non-Current Assets (4) $106 $246 $194 $142 $96 $44 Total Non-Current Assets 6,339 6,226 5,903 5,580 5,296 4,973 Total Assets $19,903 $19,245 $21,506 $23,369 $23,851 $24,779 LIABILITIES Current Liabilities: Accounts Payable $692 $168 $558 $581 $581 $581 Accrued Expenses 1,552 – – – – – Other Current Liabilities (5) 363 559 559 525 525 525 Total Current Liabilities $2,607 $726 $1,116 $1,107 $1,107 $1,107 Debt (Incl. Current Portion) Bank Loans – $4,458 $4,370 $4,276 $4,177 $4,072 Capitalized Lease Obligations 59 48 48 – – – Total Debt $59 $4,506 $4,417 $4,276 $4,177 $4,072 Other Non-Current Liabilities Other Non-Current Liabilities – – – – – – Total Other Non-Current Liabilities – – – – – – Total Liabilities $2,666 $5,232 $5,534 $5,382 $5,283 $5,179 EQUITY Common Equity 22,560 N/A N/A N/A N/A N/A Retained Earnings (5,323) N/A N/A N/A N/A N/A Total Equity 17,237 14,013 15,973 17,987 18,568 19,601 Total Liabilities & Equity $19,903 $19,245 $21,506 $23,369 $23,851 $24,779
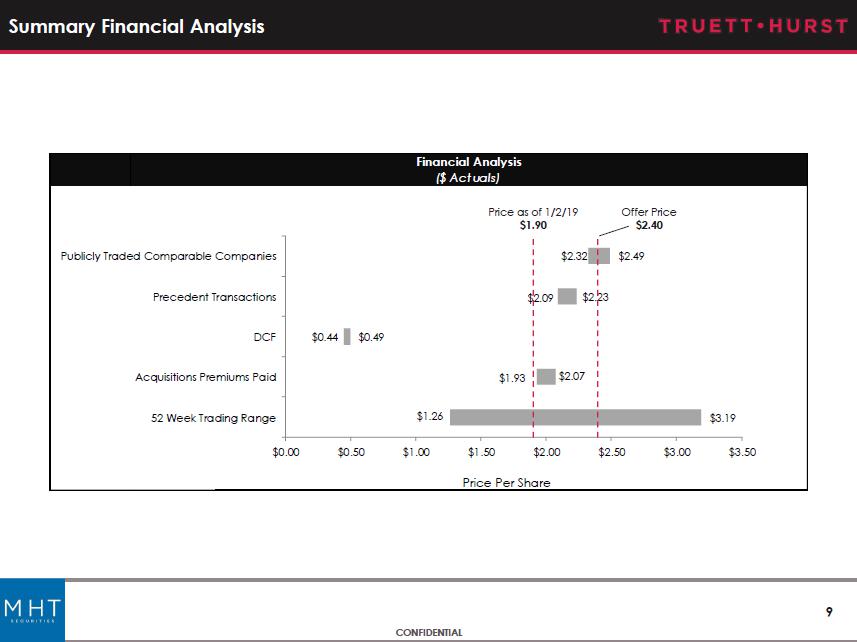
9 CONFIDENTIAL Summary Financial Analysis Price as of 1/2/19 $1.90 Offer Price $2.40 Financial Analysis ($ Actuals) Price Per Share $1.26 $1.93 $0.44 $2.09 $2.32 $3.19 $2.07 $0.49 $2.23 $2.49 $0.00 $0.50 $1.00 $1.50 $2.00 $2.50 $3.00 $3.50 52 Week Trading Range Acquisitions Premiums Paid DCF Precedent Transactions Publicly Traded Comparable Companies
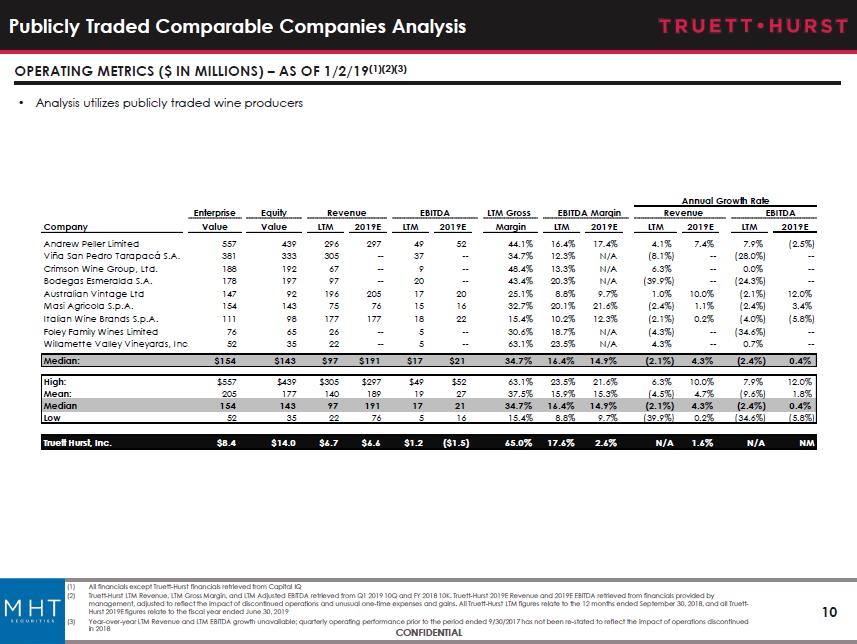
10 CONFIDENTIAL Publicly Traded Comparable Companies Analysis OPERATING METRICS ($ IN MILLIONS) – AS OF 1/2/19 (1)(2)(3) • Analysis utilizes publicly traded wine producers (1) All financials except Truett - Hurst financials retrieved from Capital IQ (2) Truett - Hurst LTM Revenue, LTM Gross Margin, and LTM Adjusted EBITDA retrieved from Q1 2019 10Q and FY 2018 10K. Truett - Hurst 2019E Revenue and 2019E EBITDA retrieved from financials provided by management, adjusted to reflect the impact of discontinued operations and unusual one - time expenses and gains . All Truett - Hurst LTM figures relate to the 12 months ended September 30, 2018, and all Truett - Hurst 2019E figures relate to the fiscal year ended June 30, 2019 (3) Year - over - year LTM Revenue and LTM EBITDA growth unavailable; quarterly operating performance prior to the period ended 9/30/201 7 has not been re - stated to reflect the impact of operations discontinued in 2018 Annual Growth Rate Enterprise Equity Revenue EBITDA LTM Gross EBITDA Margin Revenue EBITDA Company Value Value LTM 2019E LTM 2019E Margin LTM 2019E LTM 2019E LTM 2019E Andrew Peller Limited 557 439 296 297 49 52 44.1% 16.4% 17.4% 4.1% 7.4% 7.9% (2.5%) Viña San Pedro Tarapacá S.A. 381 333 305 -- 37 -- 34.7% 12.3% N/A (8.1%) -- (28.0%) -- Crimson Wine Group, Ltd. 188 192 67 -- 9 -- 48.4% 13.3% N/A 6.3% -- 0.0% -- Bodegas Esmeralda S.A. 178 197 97 -- 20 -- 43.4% 20.3% N/A (39.9%) -- (24.3%) -- Australian Vintage Ltd 147 92 196 205 17 20 25.1% 8.8% 9.7% 1.0% 10.0% (2.1%) 12.0% Masi Agricola S.p.A. 154 143 75 76 15 16 32.7% 20.1% 21.6% (2.4%) 1.1% (2.4%) 3.4% Italian Wine Brands S.p.A. 111 98 177 177 18 22 15.4% 10.2% 12.3% (2.1%) 0.2% (4.0%) (5.8%) Foley Family Wines Limited 76 65 26 -- 5 -- 30.6% 18.7% N/A (4.3%) -- (34.6%) -- Willamette Valley Vineyards, Inc. 52 35 22 -- 5 -- 63.1% 23.5% N/A 4.3% -- 0.7% -- Median: $154 $143 $97 $191 $17 $21 34.7% 16.4% 14.9% (2.1%) 4.3% (2.4%) 0.4% High: $557 $439 $305 $297 $49 $52 63.1% 23.5% 21.6% 6.3% 10.0% 7.9% 12.0% Mean: 205 177 140 189 19 27 37.5% 15.9% 15.3% (4.5%) 4.7% (9.6%) 1.8% Median 154 143 97 191 17 21 34.7% 16.4% 14.9% (2.1%) 4.3% (2.4%) 0.4% Low 52 35 22 76 5 16 15.4% 8.8% 9.7% (39.9%) 0.2% (34.6%) (5.8%) Truett Hurst, Inc. $8.4 $14.0 $6.7 $6.6 $1.2 ($1.5) 65.0% 17.6% 2.6% N/A 1.6% N/A NM
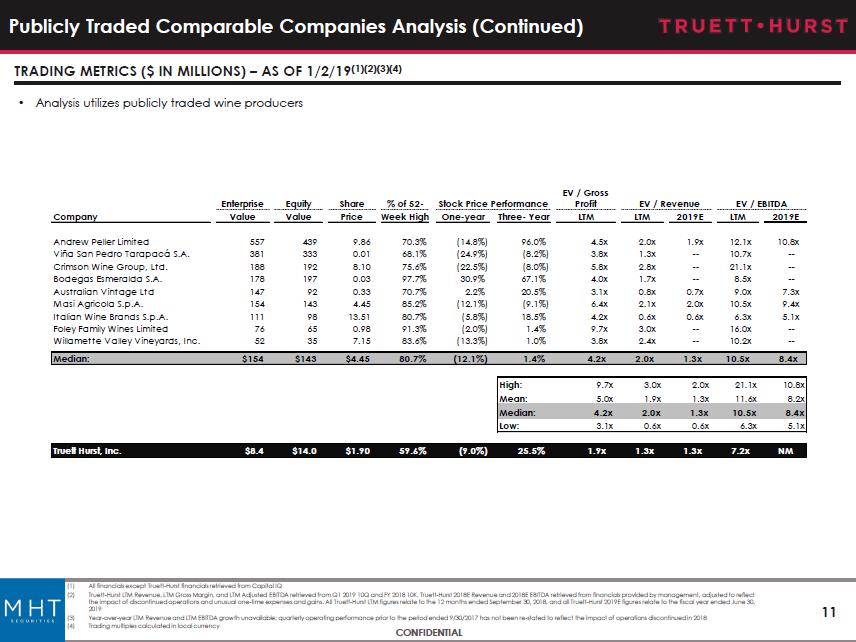
11 CONFIDENTIAL Publicly Traded Comparable Companies Analysis (Continued) TRADING METRICS ($ IN MILLIONS) – AS OF 1/2/19 (1)(2)(3)(4) • Analysis utilizes publicly traded wine producers (1) All financials except Truett - Hurst financials retrieved from Capital IQ (2) Truett - Hurst LTM Revenue, LTM Gross Margin, and LTM Adjusted EBITDA retrieved from Q1 2019 10Q and FY 2018 10K. Truett - Hurst 2018E Revenue and 2018E EBITDA retrieved from financials provided by management, adjusted to reflect the impact of discontinued operations and unusual one - time expenses and gains . All Truett - Hurst LTM figures relate to the 12 months ended September 30, 2018, and all Truett - Hurst 2019E figures relate to th e fiscal year ended June 30, 2019 (3) Year - over - year LTM Revenue and LTM EBITDA growth unavailable; quarterly operating performance prior to the period ended 9/30/201 7 has not been re - stated to reflect the impact of operations discontinued in 2018 (4) Trading multiples calculated in local currency Enterprise Equity Share % of 52- EV / Revenue EV / EBITDA Company Value Value Price Week High One-year Three- Year LTM LTM 2019E LTM 2019E Andrew Peller Limited 557 439 9.86 70.3% (14.8%) 96.0% 4.5x 2.0x 1.9x 12.1x 10.8x Viña San Pedro Tarapacá S.A. 381 333 0.01 68.1% (24.9%) (8.2%) 3.8x 1.3x -- 10.7x -- Crimson Wine Group, Ltd. 188 192 8.10 75.6% (22.5%) (8.0%) 5.8x 2.8x -- 21.1x -- Bodegas Esmeralda S.A. 178 197 0.03 97.7% 30.9% 67.1% 4.0x 1.7x -- 8.5x -- Australian Vintage Ltd 147 92 0.33 70.7% 2.2% 20.5% 3.1x 0.8x 0.7x 9.0x 7.3x Masi Agricola S.p.A. 154 143 4.45 85.2% (12.1%) (9.1%) 6.4x 2.1x 2.0x 10.5x 9.4x Italian Wine Brands S.p.A. 111 98 13.51 80.7% (5.8%) 18.5% 4.2x 0.6x 0.6x 6.3x 5.1x Foley Family Wines Limited 76 65 0.98 91.3% (2.0%) 1.4% 9.7x 3.0x -- 16.0x -- Willamette Valley Vineyards, Inc. 52 35 7.15 83.6% (13.3%) 1.0% 3.8x 2.4x -- 10.2x -- Median: $154 $143 $4.45 80.7% (12.1%) 1.4% 4.2x 2.0x 1.3x 10.5x 8.4x High: 9.7x 3.0x 2.0x 21.1x 10.8x Mean: 5.0x 1.9x 1.3x 11.6x 8.2x Median: 4.2x 2.0x 1.3x 10.5x 8.4x Low: 3.1x 0.6x 0.6x 6.3x 5.1x Truett Hurst, Inc. $8.4 $14.0 $1.90 59.6% (9.0%) 25.5% 1.9x 1.3x 1.3x 7.2x NM Stock Price Performance EV / Gross Profit

12 CONFIDENTIAL Publicly Traded Comparable Companies Analysis (Continued) (1) Low and High EBITDA multiples shown represent 95% and 105% of the median trading multiple of comparable companies (2) Truett - Hurst LTM Adjusted EBITDA as of September 30, 2018. Retrieved from Q1 2019 10Q and FY 2018 10K, adjusted to reflect the impac t o f discontinued operations and unusual one - time expenses and gains (3) The implied price per share is calculated using the implied equity value and the fully - diluted share count, calculated using the treasury stock method PUBLICLY TRADED COMPARABLES ANALYSIS – LATEST 12 MONTHS (LTM) ($ in Millions Except per Share Prices) Truett-Hurst Public Comparable Multiples (1) LTM (2) Implied Valuation Range Low Median High Adj. EBITDA Low Median High LTM Adjusted EBITDA 9.9x 10.5x 11.0x $1.17 $11.7 $12.3 $12.9 Less Net Debt: (5.5) (5.5) (5.5) Implied Equity Value: 17.2 17.8 18.4 Implied Price per Share: (3) $2.32 $2.41 $2.49

13 CONFIDENTIAL Precedent Transactions Analysis PRECEDENT TRANSACTIONS ($ IN MILLIONS) (1) Note: Precedent transaction data retrieved from S&P CapitalIQ Wineries and Vineyards (Less than 50% Stake Acquisition) Enterprise Percent Date Target Acquirer Target Description Location Value Revenue EBITDA Acquired 12/7/2017 Viña San Pedro Tarapacá S.A. CCU Inversiones S.A. Viña San Pedro Tarapacá S.A. produces and exports wines in Chile and internationally. Santiago, Chile $528.6 1.6x 8.9x 16% 1/22/2015 Bodegas Bilbaínas, S.A. Ducde, S.A. Bodegas Bilbaínas, S.A. produces and markets wine in Spain. Bilbao, Spain 38.6 2.3 8.3 6% 10/6/2013 Barkan Wine Cellars Ltd. Tempo Beverages Ltd. Barkan Wine Cellars Ltd. produces and markets wines. Hulda, Israel 86.6 2.0 12.3 16% High: $528.6 2.3x 12.3x Mean: 217.9 2.0 9.8 Median: 86.6 2.0 8.9 Low: 38.6 1.6 8.3 Enterprise Value /
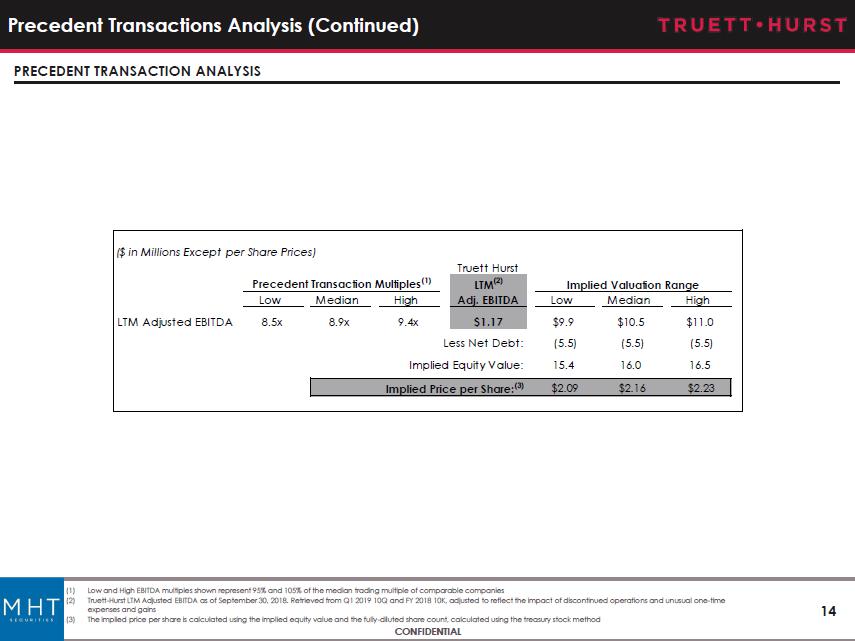
14 CONFIDENTIAL Precedent Transactions Analysis (Continued) (1) Low and High EBITDA multiples shown represent 95% and 105% of the median trading multiple of comparable companies (2) Truett - Hurst LTM Adjusted EBITDA as of September 30, 2018. Retrieved from Q1 2019 10Q and FY 2018 10K, adjusted to reflect the impact of discontinued operatio ns and unusual one - time expenses and gains (3) The implied price per share is calculated using the implied equity value and the fully - diluted share count, calculated using the treasury stock method PRECEDENT TRANSACTION ANALYSIS ($ in Millions Except per Share Prices) Truett Hurst Precedent Transaction Multiples (1) LTM (2) Implied Valuation Range Low Median High Adj. EBITDA Low Median High LTM Adjusted EBITDA 8.5x 8.9x 9.4x $1.17 $9.9 $10.5 $11.0 Less Net Debt: (5.5) (5.5) (5.5) Implied Equity Value: 15.4 16.0 16.5 Implied Price per Share: (3) $2.09 $2.16 $2.23
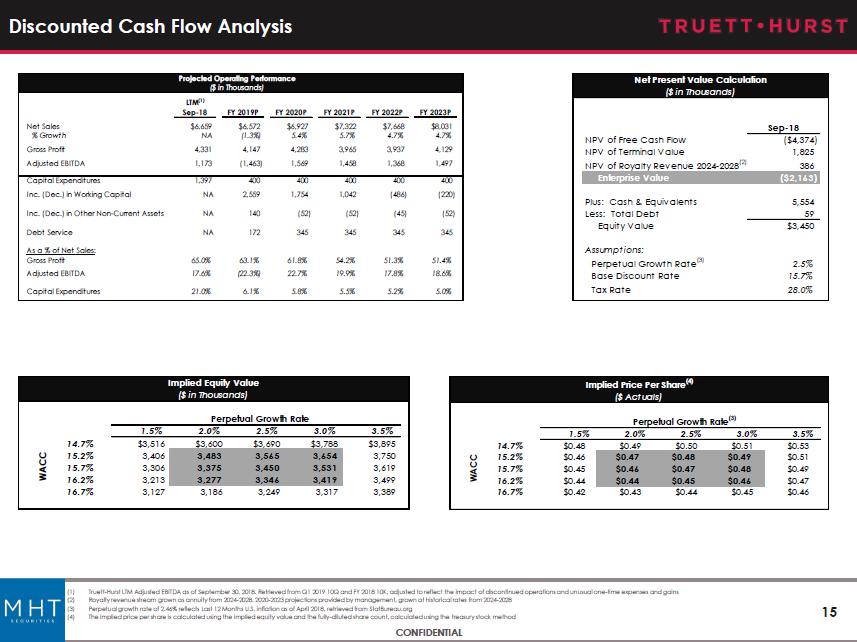
15 CONFIDENTIAL Discounted Cash Flow Analysis (1) Truett - Hurst LTM Adjusted EBITDA as of September 30, 2018. Retrieved from Q1 2019 10Q and FY 2018 10K, adjusted to reflect the i mpact of discontinued operations and unusual one - time expenses and gains (2) Royalty revenue stream grown as annuity from 2024 - 2028. 2020 - 2023 projections provided by management, grown at historical rates from 2024 - 2028 (3) Perpetual growth rate of 2.46% reflects Last 12 Months U.S. inflation as of April 2018, retrieved from StatBureau.org (4) The implied price per share is calculated using the implied equity value and the fully - diluted share count, calculated using the treasury stock method Projected Operating Performance ($ in Thousands) LTM (1) Sep-18 FY 2019P FY 2020P FY 2021P FY 2022P FY 2023P Net Sales $6,659 $6,572 $6,927 $7,322 $7,668 $8,031 % Growth NA (1.3%) 5.4% 5.7% 4.7% 4.7% Gross Profit 4,331 4,147 4,283 3,965 3,937 4,129 Adjusted EBITDA 1,173 (1,463) 1,569 1,458 1,368 1,497 Capital Expenditures 1,397 400 400 400 400 400 Inc. (Dec.) in Working Capital NA 2,559 1,754 1,042 (486) (220) Inc. (Dec.) in Other Non-Current Assets NA 140 (52) (52) (45) (52) Debt Service NA 172 345 345 345 345 As a % of Net Sales: Gross Profit 65.0% 63.1% 61.8% 54.2% 51.3% 51.4% Adjusted EBITDA 17.6% (22.3%) 22.7% 19.9% 17.8% 18.6% Capital Expenditures 21.0% 6.1% 5.8% 5.5% 5.2% 5.0% Net Present Value Calculation ($ in Thousands) Sep-18 NPV of Free Cash Flow ($4,374) NPV of Terminal Value 1,825 NPV of Royalty Revenue 2024-2028 (2) 386 Enterprise Value ($2,163) Plus: Cash & Equivalents 5,554 Less: Total Debt 59 Equity Value $3,450 Assumptions: Perpetual Growth Rate (3) 2.5% Base Discount Rate 15.7% Tax Rate 28.0% Implied Equity Value ($ in Thousands) Perpetual Growth Rate 1.5% 2.0% 2.5% 3.0% 3.5% 14.7% $3,516 $3,600 $3,690 $3,788 $3,895 15.2% 3,406 3,483 3,565 3,654 3,750 15.7% 3,306 3,375 3,450 3,531 3,619 16.2% 3,213 3,277 3,346 3,419 3,499 16.7% 3,127 3,186 3,249 3,317 3,389 WACC Implied Price Per Share (4) ($ Actuals) Perpetual Growth Rate (3) 1.5% 2.0% 2.5% 3.0% 3.5% 14.7% $0.48 $0.49 $0.50 $0.51 $0.53 15.2% $0.46 $0.47 $0.48 $0.49 $0.51 15.7% $0.45 $0.46 $0.47 $0.48 $0.49 16.2% $0.44 $0.44 $0.45 $0.46 $0.47 16.7% $0.42 $0.43 $0.44 $0.45 $0.46 WACC
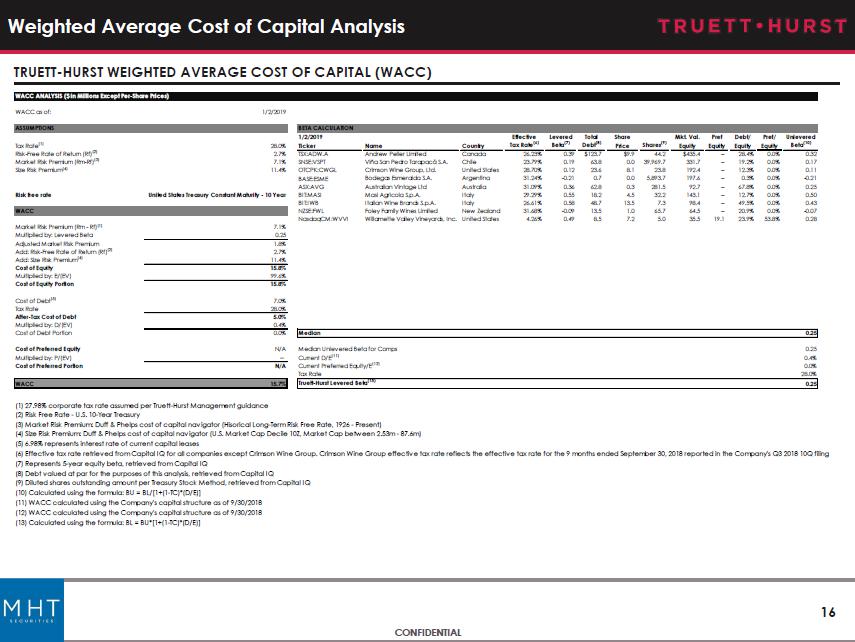
16 CONFIDENTIAL Weighted Average Cost of Capital Analysis TRUETT - HURST WEIGHTED AVERAGE COST OF CAPITAL (WACC) (1) 27.98% corporate tax rate assumed per Truett-Hurst Management guidance (2) Risk Free Rate - U.S. 10-Year Treasury (3) Market Risk Premium: Duff & Phelps cost of capital navigator (Hisorical Long-Term Risk Free Rate, 1926 - Present) (4) Size Risk Premium: Duff & Phelps cost of capital navigator (U.S. Market Cap Decile 10Z, Market Cap between 2.53m - 87.6m) (5) 6.98% represents interest rate of current capital leases (6) Effective tax rate retrieved from Capital IQ for all companies except Crimson Wine Group. Crimson Wine Group effective tax rate reflects the effective tax rate for the 9 months ended September 30, 2018 reported in the Company's Q3 2018 10Q filing (7) Represents 5-year equity beta, retrieved from Capital IQ (8) Debt valued at par for the purposes of this analysis, retrieved from Capital IQ (9) Diluted shares outstanding amount per Treasury Stock Method, retrieved from Capital IQ (10) Calculated using the formula: BU = BL/[1+(1-TC)*(D/E)] (11) WACC calculated using the Company's capital structure as of 9/30/2018 (12) WACC calculated using the Company's capital structure as of 9/30/2018 (13) Calculated using the formula: BL = BU*[1+(1-TC)*(D/E)] WACC ANALYSIS ($ in Millions Except Per-Share Prices) WACC as of: 1/2/2019 ASSUMPTIONS BETA CALCULATION 1/2/2019 Effective Levered Total Share Mkt. Val. Pref Debt/ Pref/ Unlevered Tax Rate (1) 28.0% Ticker Name Country Tax Rate (6) Beta (7) Debt (8) Price Shares (9) Equity Equity Equity Equity Beta (10) Risk-Free Rate of Return (Rf) (2) 2.7% TSX:ADW.A Andrew Peller Limited Canada 26.23% 0.39 $123.7 $9.9 44.2 $435.4 – 28.4% 0.0% 0.32 Market Risk Premium (Rm-Rf) (3) 7.1% SNSE:VSPT Viña San Pedro Tarapacá S.A. Chile 23.79% 0.19 63.8 0.0 39,969.7 331.7 – 19.2% 0.0% 0.17 Size Risk Premium (4) 11.4% OTCPK:CWGL Crimson Wine Group, Ltd. United States 28.70% 0.12 23.6 8.1 23.8 192.4 – 12.3% 0.0% 0.11 BASE:ESME Bodegas Esmeralda S.A. Argentina 31.24% -0.21 0.7 0.0 5,893.7 197.6 – 0.3% 0.0% -0.21 ASX:AVG Australian Vintage Ltd Australia 31.09% 0.36 62.8 0.3 281.5 92.7 – 67.8% 0.0% 0.25 Risk free rate United States Treasury Constant Maturity - 10 Year BIT:MASI Masi Agricola S.p.A. Italy 29.29% 0.55 18.2 4.5 32.2 143.1 – 12.7% 0.0% 0.50 BIT:IWB Italian Wine Brands S.p.A. Italy 26.61% 0.58 48.7 13.5 7.3 98.4 – 49.5% 0.0% 0.43 WACC NZSE:FWL Foley Family Wines Limited New Zealand 31.68% -0.09 13.5 1.0 65.7 64.5 – 20.9% 0.0% -0.07 NasdaqCM:WVVI Willamette Valley Vineyards, Inc. United States 4.26% 0.49 8.5 7.2 5.0 35.5 19.1 23.9% 53.8% 0.28 Market Risk Premium (Rm - Rf) (1) 7.1% Multiplied by: Levered Beta 0.25 Adjusted Market Risk Premium 1.8% Add: Risk-Free Rate of Return (Rf) (2) 2.7% Add: Size Risk Premium (4) 11.4% Cost of Equity 15.8% Multiplied by: E/(EV) 99.6% Cost of Equity Portion 15.8% Cost of Debt (5) 7.0% Tax Rate 28.0% After-Tax Cost of Debt 5.0% Multiplied by: D/(EV) 0.4% Cost of Debt Portion 0.0% Median 0.25 Cost of Preferred Equity N/A Median Unlevered Beta for Comps 0.25 Multiplied by: P/(EV) – Current D/E (11) 0.4% Cost of Preferred Portion N/A Current Preferred Equity/E (12) 0.0% Tax Rate 28.0% WACC 15.7% Truett-Hurst Levered Beta (13) 0.25
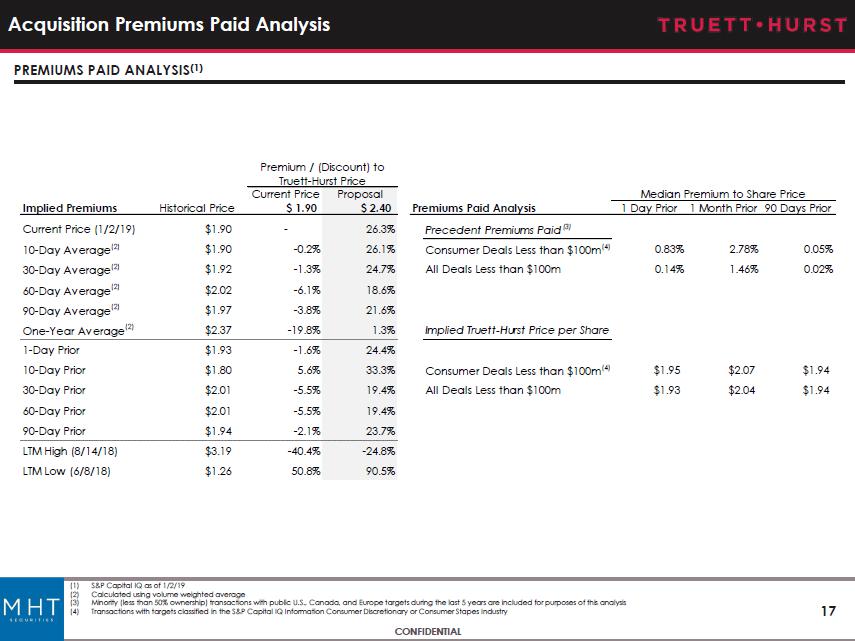
17 CONFIDENTIAL Acquisition Premiums Paid Analysis PREMIUMS PAID ANALYSIS (1) (1) S&P Capital IQ as of 1 / 2 / 19 (2) Calculated using volume weighted average (3) Minority (less than 50 % ownership) transactions with public U . S . , Canada, and Europe targets during the last 5 years are included for purposes of this analysis (4) Transactions with targets classified in the S&P Capital IQ Information Consumer Discretionary or Consumer Stapes Industry Current Price Proposal Implied Premiums Historical Price $ 1.90 $ 2.40 Premiums Paid Analysis 1 Day Prior 1 Month Prior 90 Days Prior Current Price (1/2/19) $1.90 - 26.3% Precedent Premiums Paid (3) 10-Day Average (2) $1.90 -0.2% 26.1% Consumer Deals Less than $100m (4) 0.83% 2.78% 0.05% 30-Day Average (2) $1.92 -1.3% 24.7% All Deals Less than $100m 0.14% 1.46% 0.02% 60-Day Average (2) $2.02 -6.1% 18.6% 90-Day Average (2) $1.97 -3.8% 21.6% One-Year Average (2) $2.37 -19.8% 1.3% Implied Truett-Hurst Price per Share 1-Day Prior $1.93 -1.6% 24.4% 10-Day Prior $1.80 5.6% 33.3% Consumer Deals Less than $100m (4) $1.95 $2.07 $1.94 30-Day Prior $2.01 -5.5% 19.4% All Deals Less than $100m $1.93 $2.04 $1.94 60-Day Prior $2.01 -5.5% 19.4% 90-Day Prior $1.94 -2.1% 23.7% LTM High (8/14/18) $3.19 -40.4% -24.8% LTM Low (6/8/18) $1.26 50.8% 90.5% Premium / (Discount) to Truett-Hurst Price Median Premium to Share Price