UNITED STATES
SECURITIES AND EXCHANGE COMMISSION
Washington, D.C. 20549
FORM N-CSR
CERTIFIED SHAREHOLDER REPORT OF REGISTERED
MANAGEMENT INVESTMENT COMPANIES
Investment Company Act file number 811-22811
Bridge Builder Trust
(Exact name of registrant as specified in charter)
615 East Michigan Street
Milwaukee, WI 53202
(Address of principal executive offices) (Zip code)
Helge K. Lee, Secretary
Bridge Builder Trust
c/o 12555 Manchester Road
Des Peres, MO 63131
(Name and address of agent for service)
414-287-3700
Registrant’s telephone number, including area code
Date of fiscal year end: June 30, 2017
Date of reporting period: June 30, 2017
Item 1. Reports to Stockholders.

Bridge BuilderTM
MUTUAL FUNDS
Annual Report
June 30, 2017
Bridge Builder Core Bond Fund
Bridge Builder Core Plus Bond Fund
Bridge Builder Municipal Bond Fund
Bridge Builder Large Cap Growth Fund
Bridge Builder Large Cap Value Fund
Bridge Builder Small/Mid Cap Growth Fund
Bridge Builder Small/Mid Cap Value Fund
Bridge Builder International Equity Fund
| Page | ||||
| 1 | ||||
| 2 | ||||
| 4 | ||||
| 6 | ||||
| 8 | ||||
| 10 | ||||
| 12 | ||||
| 14 | ||||
| 16 | ||||
| 19 | ||||
| 21 | ||||
| 22 | ||||
| 25 | ||||
| 30 | ||||
| 33 | ||||
| 35 | ||||
| 37 | ||||
| 39 | ||||
| 41 | ||||
| 43 | ||||
| 45 | ||||
| 47 | ||||
| 52 | ||||
| 54 | ||||
| 80 | ||||
| 81 | ||||
Board Consideration of Investment Advisory Agreement and Sub-advisory Agreements | 83 | |||
| 89 | ||||
| 91 | ||||
| Annual Report • June 30, 2017 |
Bridge Builder Mutual Funds
Dear Shareholder,
It is our pleasure to provide you with the Bridge Builder Mutual Funds annual report for the fiscal year ended June 30, 2017. In this report you will find performance information, summaries of portfolio holdings, financial statements and other important information about each of the Bridge Builder Mutual Funds.
During the past year, select changes were made to the Bridge Builder Mutual Fund lineup in support of our long-term investment philosophy. In the Bridge Builder International Equity Fund, Pzena Investment Management, LLC was added as an additional sub-adviser. Within the Bridge Builder Small/Mid Cap Value Fund, LSV Asset Management was also added as a sub-adviser. In the Bridge Builder Core Plus Bond Fund, Pacific Investment Management Company LLC (“PIMCO”) was added as sub-adviser to the Fund and Janus Capital Management, LLC was removed as a sub-adviser.
For details about individual fund performance and market commentary, please refer to the Management’s Discussion of Fund Performance section of this report for each Fund.
Bridge Builder Mutual Funds are available exclusively through Edward Jones Advisory Solutions®, an asset allocation program providing investment advisory services. Each Bridge Builder Fund uses a multi-manager sub-advised structure, where several leading asset management firms are selected to invest a portion of the Fund’s assets. Each manager within a Fund provides a unique perspective and investment approach. These managers are selected by Olive Street Investment Advisers, LLC (“Olive Street”), an affiliate of Edward Jones, and are approved by the Bridge Builder Mutual Funds’ Board of Trustees. Olive Street selects sub-advisers that it expects to use for the long term and strives to combine complementary investment styles, performance patterns and portfolio characteristics and to select high-quality strategies that have generally demonstrated a track record of success. The Funds are managed according to the key tenets of our investment philosophy: diversification, high quality and a long-term approach.
For additional information about the Funds, visit www.bridgebuildermutualfunds.com.
We look forward to playing an important role in helping you pursue your financial goals.
Sincerely,
| ||
William H. Broderick, III
Chairman, Bridge Builder Trust | ||
 | ||
Ryan T. Robson
President, Bridge Builder Trust
Principal, Edward Jones Investment Advisory | ||

| Annual Report • June 30, 2017 | 1 |
Management’s Discussion of Fund Performance (Unaudited)
Investment Objective
The investment objective of the Bridge Builder Core Bond Fund (the “Fund”) is to provide total return (capital appreciation plus income).
Investment Strategy
The Fund’s assets are allocated across different fixed-income market sectors and maturities. Most of the Fund’s investments are fixed-income securities issued or guaranteed by the U.S. government or its agencies, municipalities, U.S. corporate issuers, asset-backed securities, privately-issued securities, floating rate securities, and mortgage-related and mortgage-backed securities. The Fund employs a multi-manager sub-advised structure.
Investment Commentary
For the fiscal year ended June 30, 2017, the Fund returned 0.33% and outperformed its benchmark, the Bloomberg Barclays U.S. Aggregate Bond Index, which returned -0.31%. In general, interest rates increased over the year, and when interest rates increase, bond prices generally decrease. The Federal Reserve Board (the “Fed”) raised rates three times over the past 12 months as the U.S. economy continued to improve. Bonds with credit risk, like corporate bonds, tend to perform well in an improving economy, and the past year was no exception. The period was positive for U.S. corporate bonds, especially high-yield corporates, leading them to outperform U.S. government bonds, which were overall negative for the year. Securitized bonds were mostly flat over the period.
The largest contributor to the Fund’s relative performance was security selection, meaning that the Fund invested in individual bonds that performed better than those in the benchmark index. The Fund also benefited from an overweight position to U.S. corporate bonds, as corporate bonds outperformed over the period. Another positive contributor to performance was relative maturity positioning. While interest rate positioning was a positive contributor to performance overall, within the securitized bond sector, it detracted from performance.
Investment Sub-advisers
| Robert W. Baird & Co. Inc. utilizes a structured, risk-controlled philosophy with a disciplined duration approach to invest its allocated portion of the Fund’s assets. | J.P. Morgan Investment Management, Inc. incorporates a bottom-up, value-oriented approach in managing its allocated portion of the Fund’s assets. | Loomis, Sayles & Company, L.P. employs an investment philosophy that focuses on relative value investing on a risk-adjusted basis, seeking to add value for clients primarily through security selection while managing top-down risks in the portfolio. | PGIM, Inc. uses a team approach to attempt to add value by tilting toward fixed-income sectors that it believes are attractive and by utilizing its extensive research capabilities to choose attractive fixed-income securities within sectors. |
| 2 | Annual Report • June 30, 2017 |
Bridge Builder Core Bond Fund
Management’s Discussion of Fund Performance (Unaudited) (Continued)
The following chart compares the value of a hypothetical $10,000 investment in the Bridge Builder Core Bond Fund from its inception (October 28, 2013) to June 30, 2017 as compared with the Bloomberg Barclays U.S. Aggregate Bond Index.
Growth of a Hypothetical $10,000 Investment as of June 30, 2017
vs.
Bloomberg Barclays U.S. Aggregate Bond Index
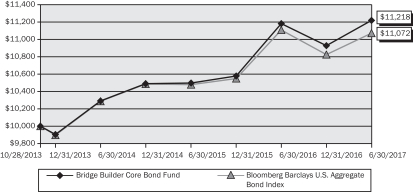
Average Annual Total Returns as of June 30, 2017
| 1 Year | 3 Years | Since Inception (10/28/2013) | ||||||||||
Bridge Builder Core Bond Fund | 0.33 | % | 2.92 | % | 3.18 | % | ||||||
Bloomberg Barclays U.S. Aggregate Bond Index | -0.31 | % | 2.48 | % | 2.81 | % | ||||||
Performance data quoted represents past performance; past performance does not guarantee future results. The investment return and principal value of an investment will fluctuate so that an investor’s shares, when redeemed, may be worth more or less than their original cost. Current performance of the Fund may be lower or higher than the performance quoted. As of the latest prospectus, the gross and net expense ratios of the Fund were 0.37%(1) and 0.17%(2), respectively. Performance data current to the most recent month end may be obtained by calling 1.855.823.3611.
The performance table does not reflect the deduction of taxes that a shareholder may pay on Fund distributions or the redemption of Fund shares. Returns shown for the Fund include the reinvestment of all dividends, if any. Total return calculations reflect the effect of the Adviser’s fee waiver agreement for the Fund. If such fee waivers had not occurred, the quoted performance would be lower.
Portfolio Characteristics (3)
| Security Type Breakdown | (% of Investments) | |||
Mortgage-Backed Obligations | 31.4 | % | ||
Corporate Bonds | 29.0 | |||
Government Related Bonds | 22.2 | |||
Asset-Backed Obligations | 9.8 | |||
Short-Term Investments | 7.6 | |||
Preferred Stocks | 0.0 | * | ||
| * | Amount less than 0.05%. |
| Annual Report • June 30, 2017 | 3 |
Bridge Builder Core Plus Bond Fund
Management’s Discussion of Fund Performance (Unaudited)
Investment Objective
The investment objective of the Bridge Builder Core Plus Bond Fund (the “Fund”) is to provide total return (capital appreciation plus income).
Investment Strategy
The Fund’s assets are allocated across different fixed-income market sectors and maturities. Most of the Fund’s investments are fixed-income securities issued or guaranteed by the U.S. government or its agencies, municipalities, U.S. corporate issuers, asset-backed securities, privately-issued securities, floating rate securities, and mortgage-related and mortgage-backed securities. The Fund may invest in high-yield securities deemed below investment grade, and securities issued by foreign entities, including emerging market securities. The Fund employs a multi-manager sub-advised structure.
Investment Commentary
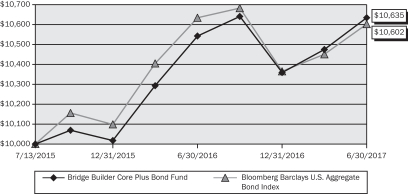
For the fiscal year ended June 30, 2017, the Fund returned 0.87% and outperformed its benchmark, the Bloomberg Barclays U.S. Aggregate Bond Index, which returned -0.31%. In general, interest rates increased over the year, and when interest rates increase, bond prices generally decrease. The Fed raised rates three times over the past 12 months as the U.S. economy continued to improve. Bonds with credit risk, like corporate bonds, tend to perform well in an improving economy, and the past year was no exception. The period was positive for U.S. corporate bonds, especially high-yield corporates, leading them to outperform U.S. government bonds, which were overall negative for the year. Securitized bonds were mostly flat over the period.
The largest contributor to the Fund’s relative performance was security selection, meaning that the Fund invested in individual bonds which performed better than those in the benchmark index. Security selection was particularly strong in the corporate and securitized sectors. Another positive contributor to performance was relative interest rate positioning. The Fund also benefited from its comparative sector weighting decisions. Relative to its benchmark, the Fund was overweight corporate bonds, which performed well over the period, especially high yield issuances. The Fund also benefited from its underweight position in government-related bonds, which delivered negative returns for the period.
Investment Sub-advisers
| Pacific Investment Management Company LLC seeks to achieve the Fund’s investment objective by investing in a multi-sector portfolio of fixed-income instruments of varying maturities, which may be represented by forwards or derivatives such as futures contracts or swap agreements. | Loomis, Sayles & Company, L.P. generally seeks fixed-income securities of issuers whose credit profiles it believes are improving. Loomis Sayles relies primarily on issue selection as the key driver to investment performance. Loomis Sayles also analyzes different sectors of the economy and differences in the yields of various fixed-income securities in an effort to find securities that it believes may produce attractive returns in comparison to these securities’ risks. | Metropolitan West Asset Management, LLC employs a value-oriented fixed-income management philosophy and an investment process predicated on a long-term economic outlook. | T. Rowe Price Associates, Inc. emphasizes the value of in-depth fundamental research, diversification and risk management practices. T. Rowe Price’s strategy integrates top-down sector allocation with bottom-up security selection in pursuit of the Fund’s investment objective. |
| 4 | Annual Report • June 30, 2017 |
Bridge Builder Core Plus Bond Fund
Management’s Discussion of Fund Performance (Unaudited) (Continued)
The following chart compares the value of a hypothetical $10,000 investment in the Bridge Builder Core Plus Bond Fund from its inception (July 13, 2015) to June 30, 2017 as compared with the Bloomberg Barclays U.S. Aggregate Bond Index.
Growth of a Hypothetical $10,000 Investment as of June 30, 2017
vs.
Bloomberg Barclays U.S. Aggregate Bond Index
Average Annual Total Returns of June 30, 2017
| 1 Year | Since Inception (7/13/2015) | |||||||
Bridge Builder Core Plus Bond Fund | 0.87 | % | 3.18 | % | ||||
Bloomberg Barclays U.S. Aggregate Bond Index | -0.31 | % | 3.01 | % | ||||
Performance data quoted represents past performance; past performance does not guarantee future results. The investment return and principal value of an investment will fluctuate so that an investor’s shares, when redeemed, may be worth more or less than their original cost. Current performance of the Fund may be lower or higher than the performance quoted. As of the latest prospectus, the gross and net expense ratios of the Fund were 0.44%(1) and 0.24%(2), respectively. Performance data current to the most recent month end may be obtained by calling 1.855.823.3611.
The performance table does not reflect the deduction of taxes that a shareholder may pay on Fund distributions or the redemption of Fund shares. Returns shown for the Fund include the reinvestment of all dividends, if any. Total return calculations reflect the effect of the Adviser’s fee waiver agreement for the Fund. If such fee waivers had not occurred, the quoted performance would be lower.
Portfolio Characteristics (3)
| Security Type Breakdown | (% of Investments) | |||
Corporate Bonds | 34.0 | % | ||
Mortgage-Backed Obligations | 22.8 | |||
Government Related | 20.7 | |||
Asset-Backed Obligations | 12.9 | |||
Short-Term Investments | 7.3 | |||
Bank Loans | 2.2 | |||
Preferred Stocks | 0.1 | |||
| Annual Report • June 30, 2017 | 5 |
Bridge Builder Municipal Bond Fund
Management’s Discussion of Fund Performance (Unaudited)
Investment Objective
The investment objective of the Bridge Builder Municipal Bond Fund (the “Fund”) is to provide current income exempt from federal tax, with a secondary goal of preservation of investment principal.
Investment Strategy
The Fund invests, under normal conditions, at least 80% of its net assets in municipal securities of any maturity or duration whose interest is exempt from federal income tax. Municipal securities include debt obligations issued by or on behalf of a governmental entity or other qualifying issuer that pay interest that is generally excludable from gross income for federal income tax purposes. Interest may be includable in taxable income for investors subject to the federal alternative minimum tax. The Fund employs a multi-manager sub-advised structure.
Investment Commentary
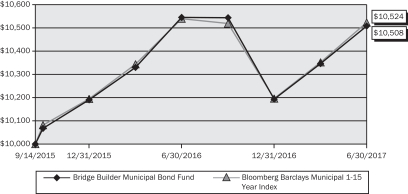
For the fiscal year ended, June 30, 2017, the Fund returned -0.36% and underperformed its benchmark, the Bloomberg Barclays Municipal 1-15 Year Index’s return of -0.15%. It was a tale of two periods, as the last half of 2016 was generally volatile for municipal bonds. We believe the impact of the presidential election in late 2016 led to mutual fund outflows, higher interest rates and weaker performance. Generally, when interest rates rise, bond prices fall. In 2017, stronger demand for municipals coupled with relatively lower supply of new bond issuance over the period aided performance.
The increase in interest rates was the biggest contributor to the Fund’s negative returns over the fiscal year. This was primarily due to the Fund’s allocation to longer maturity bonds, which were the most affected by the increase in rates. The Fund’s largest allocation was to revenue bonds, which were a stronger performing area of the market. Additionally, security selection within revenue bonds was additive to performance over the year. The Fund also had an allocation to below investment grade bonds, which are not included in the index. This allocation resulted in relative underperformance versus the benchmark, as these lower quality bonds underperformed over the period.
Investment Sub-advisers
| FIAM LLC allocates assets across different market sectors and maturities, normally investing in investment-grade municipal securities. When selecting investments, FIAM analyzes issuer credit quality, security-specific features, current and potential future valuation, and trading opportunities. | T. Rowe Price Associates Inc.’s investment approach emphasizes in-depth fundamental research, diversification, and strict risk management practices in the pursuit of the Fund’s investment objective. Investment decisions reflect the portfolio managers’ outlook for interest rates and the economy, as well as the prices, yields, and credit quality of various municipal securities. | Wells Capital Management, Inc. starts its investment process with a top-down, macroeconomic outlook. Wells Capital Management’s security selection is based on several factors including improving financial trends, positive industry and sector dynamics, improving economic conditions, specific demographic trends and value relative to other securities. |
| 6 | Annual Report • June 30, 2017 |
Bridge Builder Municipal Bond Fund
Management’s Discussion of Fund Performance (Unaudited) (Continued)
The following chart compares the value of a hypothetical $10,000 investment in the Bridge Builder Municipal Bond Fund from its inception (September 14, 2015) to June 30, 2017 as compared with the Bloomberg Barclays Municipal 1-15 Year Index.
Growth of a Hypothetical $10,000 Investment as of June 30, 2017
vs.
Bloomberg Barclays Municipal 1-15 Year Index
Average Annual Total Returns as of June 30, 2017
| 1 Year | Since Inception (9/14/2015) | |||||||
Bridge Builder Municipal Bond Fund | -0.36 | % | 2.80 | % | ||||
Bloomberg Barclays Municipal 1-15 Year Index | -0.15 | % | 2.88 | % | ||||
Performance data quoted represents past performance; past performance does not guarantee future results. The investment return and principal value of an investment will fluctuate so that an investor’s shares, when redeemed, may be worth more or less than their original cost. Current performance of the Fund may be lower or higher than the performance quoted. As of the latest prospectus, the gross and net expense ratios of the Fund were 0.44%(1) and 0.26%(2), respectively. Performance data current to the most recent month end may be obtained by calling 1.855.823.3611.
The performance table does not reflect the deduction of taxes that a shareholder may pay on Fund distributions or the redemption of Fund shares. Returns shown for the Fund include the reinvestment of all dividends, if any. Total return calculations reflect the effect of the Adviser’s fee waiver agreement for the Fund. If such fee waivers had not occurred, the quoted performance would be lower.
Portfolio Characteristics (3)
| Security Type Breakdown | (% of Investments) | |||
General Obligation | 23.8 | % | ||
General Revenue | 21.5 | |||
Healthcare | 15.0 | |||
Education | 12.9 | |||
Transportation | 12.0 | |||
Utilities | 8.5 | |||
Short-Term Investments | 3.7 | |||
Housing | 2.6 | |||
| Breakdown by State | (% of Long-Term Investments) | |||
New York | 10.9 | % | ||
Texas | 10.2 | |||
Illinois | 9.7 | |||
Florida | 7.0 | |||
Pennsylvania | 6.2 | |||
California | 4.9 | |||
Connecticut | 3.9 | |||
New Jersey | 3.6 | |||
Maryland | 3.4 | |||
Michigan | 3.3 | |||
Other | 36.9 | |||
| Annual Report • June 30, 2017 | 7 |
Bridge Builder Large Cap Growth Fund
Management’s Discussion of Fund Performance (Unaudited)
Investment Objective
The investment objective of the Bridge Builder Large Cap Growth Fund (the “Fund”) is to provide capital appreciation.
Investment Strategy
The Fund primarily invests in equity securities of large-capitalization companies, which are defined as those whose market capitalizations typically fall within the range of the Russell 1000® Index. The Fund follows an investing style that favors growth investments and employs a multi-manager sub-advised structure.
Investment Commentary
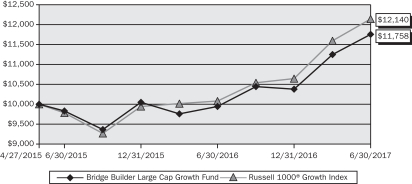
For the fiscal year ended June 30, 2017, the Fund returned 18.26%, underperforming its benchmark, the Russell 1000® Growth Index, which returned 20.42%. Compared to its benchmark, the Fund was overweight in energy, the worst performing sector for the period. In addition, the Fund’s stock selection within healthcare detracted from performance. These two positions accounted for a majority of the Fund’s underperformance over the one-year period. Stock selection and an overweight position in the financials sector benefited Fund performance, as financials was one of the best performing sectors.
Within large capitalization stocks, financials and information technology have led the broad market for the year. In contrast, energy and telecommunications were the worst-performing sectors for the one-year period. Within the large-capitalization portion of the market, growth outperformed value-style stocks for the one-year period.
Investment Sub-advisers
| Lazard Asset Management LLC invests primarily in equity securities of U.S. companies that have strong and/or improving financial productivity and are undervalued based on their earnings, cash flow or asset values. | Sustainable Growth Advisers, LP seeks to identify large-capitalization companies that exhibit characteristics such as pricing power, repeat revenue streams and global reach that seem to have the potential for long-term earnings growth within the context of low business risk. | Jennison Associates LLC invests in companies that have strong capital appreciation potential. It follows a highly disciplined investment selection and management process of identifying companies that show superior absolute and relative earnings growth and are believed to be attractively valued. | William Blair Investment Management, LLC invests primarily in a diversified portfolio of equity securities of domestic growth companies of all sizes that are expected to exhibit quality growth characteristics. William Blair performs fundamental company analysis and focuses on stock selection. | BlackRock Investment Management, LLC invests in equity securities with the objective of approximating the capitalization weighted total rate of return of the segment of the United States market for publicly traded equity securities represented by the Russell 1000® Growth Index. |
| 8 | Annual Report • June 30, 2017 |
Bridge Builder Large Cap Growth Fund
Management’s Discussion of Fund Performance (Unaudited) (Continued)
The following chart compares the value of a hypothetical $10,000 investment in the Bridge Builder Large Cap Growth Fund from its inception (April 27, 2015) to June 30, 2017 as compared with the Russell 1000® Growth Index.
Growth of a Hypothetical $10,000 Investment as of June 30, 2017
vs.
Russell 1000® Growth Index
Average Annual Total Returns as of June 30, 2017
| 1 Year | Since Inception (4/27/2015) | |||||||
Bridge Builder Large Cap Growth Fund | 18.26 | % | 7.73 | % | ||||
Russell 1000® Growth Index | 20.42 | % | 9.32 | % | ||||
Performance data quoted represents past performance; past performance does not guarantee future results. The investment return and principal value of an investment will fluctuate so that an investor’s shares, when redeemed, may be worth more or less than their original cost. Current performance of the Fund may be lower or higher than the performance quoted. As of the latest prospectus, the gross and net expense ratios of the Fund were 0.50%(1) and 0.32%(2), respectively. Performance data current to the most recent month end may be obtained by calling 1.855.823.3611.
The performance table does not reflect the deduction of taxes that a shareholder may pay on Fund distributions or the redemption of Fund shares. Returns shown for the Fund include the reinvestment of all dividends, if any. Total return calculations reflect the effect of the Adviser’s fee waiver agreement for the Fund. If such fee waivers had not occurred, the quoted performance would be lower.
Portfolio Characteristics (3)
| Sector Breakdown | (% of Investments) | |||
Information Technology | 34.0 | % | ||
Consumer Discretionary | 16.4 | |||
Healthcare | 13.8 | |||
Industrials | 10.4 | |||
Financials | 6.8 | |||
Consumer Staples | 6.3 | |||
Energy | 4.3 | |||
Short-Term Investments | 4.3 | |||
Materials | 1.7 | |||
Real Estate | 1.1 | |||
Telecommunication Services | 0.9 | |||
Utilities | 0.0 | * | ||
| * | Amount less than 0.05%. |
| Top Ten Equity Holdings | (% of Net Assets) | |||
Alphabet, Inc. – Class A | 3.4 | % | ||
Microsoft Corp. | 3.2 | |||
Facebook, Inc. | 3.2 | |||
Amazon.com, Inc. | 3.0 | |||
Apple, Inc. | 2.9 | |||
Visa, Inc. | 2.0 | |||
Lowes Companies, Inc. | 1.9 | |||
Schlumberger Ltd. | 1.7 | |||
Alphabet, Inc. – Class C | 1.6 | |||
Starbucks Corp. | 1.6 | |||
| Annual Report • June 30, 2017 | 9 |
Bridge Builder Large Cap Value Fund
Management’s Discussion of Fund Performance (Unaudited)
Investment Objective
The investment objective of the Bridge Builder Large Cap Value Fund (the “Fund”) is to provide capital appreciation.
Investment Strategy
The Fund primarily invests in equity securities of large-capitalization companies, which are defined as those whose market capitalizations typically fall within the range of the Russell 1000® Index. The Fund follows an investing style that favors value investments and employs a multi-manager sub-advised structure.
Investment Commentary
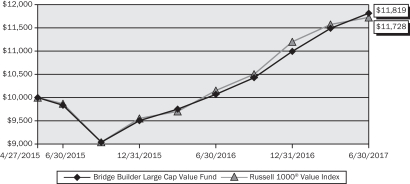
For the fiscal year ended June 30, 2017, the Fund returned 17.38%, outperforming its benchmark, the Russell 1000® Value Index, which returned 15.53%. Compared to the benchmark, the majority of the Fund’s outperformance was driven by underweights to the telecommunications, utilities and real estate sectors as these higher-dividend-yielding, more defensive sectors underperformed. Financials detracted from Fund performance, both from a stock selection and underweight perspective, as financials was one of the best performing sectors.
Within large capitalization stocks, financials and information technology led the broad market for the year. Conversely, energy and telecommunications were the worst-performing sectors of the market over this period. Within the large-capitalization portion of the market, growth outperformed value-style stocks for the one-year period.
Investment Sub-advisers
| Artisan Partners Limited Partnership employs a fundamental investment process to construct a diversified portfolio of equity securities that are undervalued, in solid financial condition and have attractive business economics. | Barrow, Hanley, Mewhinney & Strauss, LLC believes that equity market inefficiencies can best be exploited through adherence to a value-oriented investment process dedicated to the selection of securities on a bottom-up basis. Barrow Hanley implements this strategy by seeking to construct portfolios of individual stocks that reflect three value characteristics: price/earnings and price/book ratios below the market, and dividend yields above the market (as measured by the S&P 500 Index). | Wellington Management Company, LLP uses substantial proprietary, fundamental research resources to identify companies with superior prospects for dividend growth and capital appreciation that sell at reasonable valuation levels. Wellington Management believes that above-average growth in dividends is an effective and often overlooked indicator of higher quality, shareholder-oriented companies that have the ability to produce consistent, above-average returns over the long term. | BlackRock Investment Management, LLC invests in equity securities with the objective of approximating the capitalization weighted total rate of return of the segment of the United States market for publicly traded equity securities represented by the Russell 1000® Value Index. |
| 10 | Annual Report • June 30, 2017 |
Bridge Builder Large Cap Value Fund
Management’s Discussion of Fund Performance (Unaudited) (Continued)
The following chart compares the value of a hypothetical $10,000 investment in the Bridge Builder Large Cap Value Fund from its inception (April 27, 2015) to June 30, 2017 as compared with the Russell 1000® Value Index.
Growth of a Hypothetical $10,000 Investment as of June 30, 2017
vs.
Russell 1000® Value Index
Average Annual Total Returns as of June 30, 2017
| 1 Year | Since Inception (4/27/2015) | |||||||
Bridge Builder Large Cap Value Fund | 17.38 | % | 7.98 | % | ||||
Russell 1000® Value Index | 15.53 | % | 7.60 | % | ||||
Performance data quoted represents past performance; past performance does not guarantee future results. The investment return and principal value of an investment will fluctuate so that an investor’s shares, when redeemed, may be worth more or less than their original cost. Current performance of the Fund may be lower or higher than the performance quoted. As of the latest prospectus, the gross and net expense ratios of the Fund were 0.50%(1) and 0.35%(2), respectively. Performance data current to the most recent month end may be obtained by calling 1.855.823.3611.
The performance table does not reflect the deduction of taxes that a shareholder may pay on Fund distributions or the redemption of Fund shares. Returns shown for the Fund include the reinvestment of all dividends, if any. Total return calculations reflect the effect of the Adviser’s fee waiver agreement for the Fund. If such fee waivers had not occurred, the quoted performance would be lower.
Portfolio Characteristics (3)
| Sector Breakdown | (% of Investments) | |||
Financials | 20.1 | % | ||
Healthcare | 13.9 | |||
Consumer Discretionary | 12.9 | |||
Information Technology | 11.6 | |||
Industrials | 10.7 | |||
Energy | 8.6 | |||
Consumer Staples | 8.0 | |||
Materials | 7.4 | |||
Short-Term Investments | 3.8 | |||
Real Estate | 1.7 | |||
Telecommunication Services | 0.7 | |||
Utilities | 0.6 | |||
| Top Ten Equity Holdings | (% of Net Assets) | |||
Citigroup, Inc. | 1.9 | % | ||
Medtronic Plc | 1.9 | |||
Cardinal Health, Inc. | 1.7 | |||
Berkshire Hathaway, Inc. | 1.7 | |||
Chubb Ltd. | 1.5 | |||
Microsoft Corp. | 1.4 | |||
Apple, Inc. | 1.4 | |||
Lyondellbasell Industries NV | 1.3 | |||
Merck & Co., Inc. | 1.3 | |||
UnitedHealth Group, Inc. | 1.2 | |||
| Annual Report • June 30, 2017 | 11 |
Bridge Builder Small/Mid Cap Growth Fund
Management’s Discussion of Fund Performance (Unaudited)
Investment Objective
The investment objective of the Bridge Builder Small/Mid Cap Growth Fund (the “Fund”) is to provide capital appreciation.
Investment Strategy
The Fund primarily invests in equity securities of small- and mid-capitalization companies, which are defined as those whose market capitalizations typically fall within the range of the Russell MidCap® Index and the Russell 2000® Index. The Fund follows an investing style that favors growth investments and employs a multi-manager sub-advised structure.
Investment Commentary
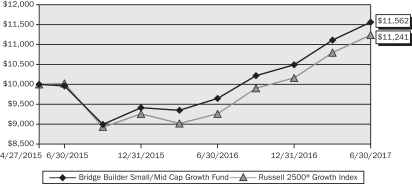
For the fiscal year ended June 30, 2017, the Fund returned 19.87%, while its benchmark, the Russell 2500® Growth Index, returned 21.44% for the period. Compared to its benchmark, the majority of the Fund’s relative underperformance was driven by negative stock selection in the consumer discretionary sector. Additionally, the Fund was overweight in the energy and consumer staples sectors, which detracted from relative performance. The Fund benefited from positive stock selection within the financial sector.
For the year, small-capitalization stocks outperformed mid-capitalization stocks. Within sectors, healthcare and information technology outperformed the broader market. Conversely, the energy and consumer staples sectors underperformed the broader market. Within the mid-capitalization segment of the market, growth stocks outperformed value stocks; within the small-capitalization segment of the market, value stocks slightly outperformed growth stocks.
Investment Sub-advisers
| Eagle Asset Management, Inc. invests primarily in small-capitalization companies. The team generally focuses on investing in small capitalization companies that demonstrate growth potential at a price that does not appear to reflect the company’s true underlying value. The portfolio managers use a three-pronged investment philosophy: quality, valuation and balance. | Champlain Investment Partners, LLC seeks capital appreciation by investing mainly in common stocks of medium-sized companies that it believes have strong long-term fundamentals, superior capital appreciation potential and attractive valuations. Champlain expects to identify a diversified universe of medium-sized companies that trade at a discount to their estimated or intrinsic fair values. | ClearBridge Investments, LLC invests primarily in mid-capitalization companies. The team normally invests in stocks selected for their long-term growth potential. The portfolio managers conduct bottom-up, fundamental research and look for attractive valuations, favorable growth and attractive risk/reward profiles, and strong free cash flow and balance sheets. | BlackRock Investment Management, LLC invests in equity securities with the objective of approximating the capitalization-weighted total rate of return of the segment of the United States market for publicly traded equity securities represented by the Russell Midcap® Growth Index, which tracks the performance of mid-capitalization companies, and the Russell 2000® Growth Index, which tracks the performance of small capitalization companies. | Stephens Investment Management Group, LLC employs a disciplined, bottom-up investment selection process that combines rigorous fundamental analysis with quantitative screening in an effort to identify companies that exhibit potential for superior earnings growth that is unrecognized by the markets. |
| 12 | Annual Report • June 30, 2017 |
Bridge Builder Small/Mid Cap Growth Fund
Management’s Discussion of Fund Performance (Unaudited) (Continued)
The following chart compares the value of a hypothetical $10,000 investment in the Bridge Builder Small/Mid Cap Growth Fund from its inception (April 27, 2015) to June 30, 2017 as compared with the Russell 2500® Growth Index.
Growth of a Hypothetical $10,000 Investment as of June 30, 2017
vs.
Russell 2500® Growth Index
Average Annual Total Returns as of June 30, 2017
| 1 Year | Since Inception (4/27/2015) | |||||||
Bridge Builder Small/Mid Cap Growth Fund | 19.87 | % | 6.90 | % | ||||
Russell 2500® Growth Index | 21.44 | % | 5.52 | % | ||||
Performance data quoted represents past performance; past performance does not guarantee future results. The investment return and principal value of an investment will fluctuate so that an investor’s shares, when redeemed, may be worth more or less than their original cost. Current performance of the Fund may be lower or higher than the performance quoted. As of the latest prospectus, the gross and net expense ratios of the Fund were 0.72%(1) and 0.48%(2), respectively. Performance data current to the most recent month end may be obtained by calling 1.855.823.3611.
The performance table does not reflect the deduction of taxes that a shareholder may pay on Fund distributions or the redemption of Fund shares. Returns shown for the Fund include the reinvestment of all dividends, if any. Total return calculations reflect the effect of the Adviser’s fee waiver agreement for the Fund. If such fee waivers had not occurred, the quoted performance would be lower.
Portfolio Characteristics (3)
Sector Breakdown | (% of Investments) | |||
Information Technology | 22.9 | % | ||
Healthcare | 20.2 | |||
Industrials | 15.2 | |||
Consumer Discretionary | 11.2 | |||
Financials | 9.6 | |||
Consumer Staples | 6.9 | |||
Short-Term Investments | 4.5 | |||
Materials | 4.3 | |||
Real Estate | 2.6 | |||
Energy | 2.2 | |||
Telecommunication Services | 0.2 | |||
Utilities | 0.2 | |||
Top Ten Equity Holdings | (% of Net Assets) | |||
Rockwell Automation, Inc. | 1.4 | % | ||
IDEX Corp. | 1.3 | |||
Workday, Inc. | 1.3 | |||
Dentsply Sirona, Inc. | 1.3 | |||
Fortinet, Inc. | 1.2 | |||
Splunk, Inc. | 1.1 | |||
Mettler-Toledo International, Inc. | 1.0 | |||
Berry Global Group, Inc. | 1.0 | |||
Palo Alto Networks, Inc. | 1.0 | |||
Advance Auto Parts, Inc. | 1.0 | |||
| Annual Report • June 30, 2017 | 13 |
Bridge Builder Small/Mid Cap Value Fund
Management’s Discussion of Fund Performance (Unaudited)
Investment Objective
The investment objective of the Bridge Builder Small/Mid Cap Value Fund (the “Fund”) is to provide capital appreciation.
Investment Strategy
The Fund primarily invests in equity securities of small- and mid-capitalization companies, which are defined as those whose market capitalizations typically fall within the range of the Russell MidCap® Index and the Russell 2000® Index. The Fund follows an investing style that favors value investments and employs a multi-manager sub-advised structure.
Investment Commentary
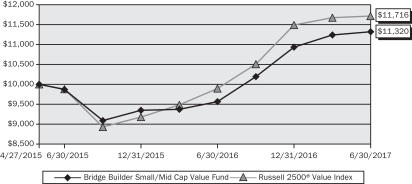
For the fiscal year ended June 30, 2017, the Fund returned 18.33%, while its benchmark, the Russell 2500® Value Index, returned 18.36% for the period. Compared to its benchmark, the majority of the Fund’s relative underperformance was driven by negative stock selection within the healthcare and consumer discretionary sectors. The Fund benefited from an overweight in information technology; given the strong performance of the sector, the overweight position helped offset negative contributions from stock selection.
For the year, small-capitalization stocks outperformed mid-capitalization stocks. Within sectors, information technology and financials outperformed the broader market. Conversely, the telecommunications and energy sectors underperformed the broader market. Within the mid-capitalization segment of the market, growth stocks outperformed value stocks; within the small-capitalization segment of the market, value stocks slightly outperformed growth stocks.
Investment Sub-advisers
| Vaughan Nelson Investment Management, LP uses a bottom-up value-oriented investment process. Vaughan Nelson seeks companies that typically possess one or more of the following attributes: companies earning a positive return on capital with stable-to-improving returns, valued at a discount to their asset value, and/or having an attractive and sustainable dividend level. | Boston Partners Global Investors, Inc. primarily invests in medium-capitalization companies and uses bottom-up fundamental analysis to make investment decisions. Boston Partner’s strategy seeks to add value through bottom-up stock selection. The strategy is designed to identify companies with attractive valuation, sound business fundamentals and improving business momentum. | Silvercrest Asset Management Group LLC invests in small-capitalization companies that typically possess one or more of the following attributes: business that results in relatively consistent longer-term earnings and cash flow growth, franchise/asset value that may make the company attractive to potential acquirers, cyclically depressed earnings and/or cash flow that has potential for improvement, or a catalyst that will promote recognition of the company’s undervalued status. | Advisory Research, Inc. uses a bottom-up approach that seeks to identify companies with attractive valuations relative to net asset value. The strategy invests in stocks that Advisory Research believes are profitable, undervalued on a price-to-book basis and exhibit low levels of leverage. | BlackRock Investment Management, LLC invests in equity securities with the objective of approximating the capitalization-weighted total rate of return of the segment of the United States market for publicly traded equity securities represented by the Russell Midcap® Value Index, which tracks the performance of mid-capitalization companies, and the Russell 2000® Value Index, which tracks the performance of small capitalization companies. | LSV Asset Management primarily invests in medium capitalization companies. LSV uses a bottom-up investment style, seeking to identify companies that are trading at prices substantially below their intrinsic value. |
| 14 | Annual Report • June 30, 2017 |
Bridge Builder Small/Mid Cap Value Fund
Management’s Discussion of Fund Performance (Unaudited) (Continued)
The following chart compares the value of a hypothetical $10,000 investment in the Bridge Builder Small/Mid Cap Value Fund from its inception (April 27, 2015) to June 30, 2017 as compared with the Russell 2500® Value Index.
Growth of a Hypothetical $10,000 Investment as of June 30, 2017
vs.
Russell 2500® Value Index
Average Annual Total Returns as of June 30, 2017
| 1 Year | Since Inception (4/27/2015) | |||||||
Bridge Builder Small/Mid Cap Value Fund | 18.33 | % | 5.86 | % | ||||
Russell 2500® Value Index | 18.36 | % | 7.55 | % | ||||
Performance data quoted represents past performance; past performance does not guarantee future results. The investment return and principal value of an investment will fluctuate so that an investor’s shares, when redeemed, may be worth more or less than their original cost. Current performance of the Fund may be lower or higher than the performance quoted. As of the latest prospectus, the gross and net expense ratios of the Fund were 0.81%(1) and 0.62%(2), respectively. Performance data current to the most recent month end may be obtained by calling 1.855.823.3611.
The performance table does not reflect the deduction of taxes that a shareholder may pay on Fund distributions or the redemption of Fund shares. Returns shown for the Fund include the reinvestment of all dividends, if any. Total return calculations reflect the effect of the Adviser’s fee waiver agreement for the Fund. If such fee waivers had not occurred, the quoted performance would be lower.
Portfolio Characteristics (3)
| Sector Breakdown | (% of Investments) | |||
Financials | 23.4 | % | ||
Industrials | 15.4 | |||
Information Technology | 13.9 | |||
Consumer Discretionary | 11.4 | |||
Real Estate | 7.9 | |||
Materials | 6.7 | |||
Energy | 5.8 | |||
Healthcare | 5.5 | |||
Utilities | 4.4 | |||
Short-Term Investments | 3.3 | |||
Consumer Staples | 2.0 | |||
Telecommunication Services | 0.3 | |||
| Top Ten Equity Holdings | (% of Net Assets) | |||
Brunswick Corp. | 1.1 | % | ||
Fidelity National Information Services, Inc. | 1.0 | |||
Reinsurance Group of America, Inc. | 0.9 | |||
Crown Holdings, Inc. | 0.8 | |||
Huntington Bancshares, Inc. | 0.7 | |||
Investors Bancorp, Inc. | 0.7 | |||
Fifth Third Bancorp | 0.6 | |||
ManpowerGroup, Inc. | 0.6 | |||
Unum Group | 0.6 | |||
SunTrust Banks, Inc. | 0.6 | |||
| Annual Report • June 30, 2017 | 15 |
Bridge Builder International Equity Fund
Management’s Discussion of Fund Performance (Unaudited)
Investment Objective
The investment objective of the Bridge Builder International Equity Fund (the “Fund”) is to provide capital appreciation.
Investment Strategy
The Fund primarily invests in non-U.S. dollar denominated securities of large capitalization companies that derive a majority of their revenues or profits from a country or countries other than the United States. The Fund employs a multi-manager sub-advised structure.
Investment Commentary
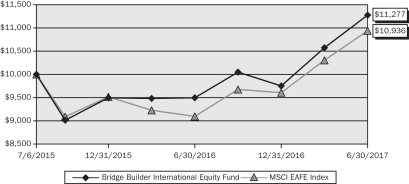
For the fiscal year ended June 30, 2017, the Fund returned 18.78%, while its benchmark, the MSCI EAFE Index, returned 20.27%, which resulted in relative underperformance. Select Eurozone countries such as Germany, France and Spain outperformed the broader market, while the U.K. underperformed. Despite a notable decline in the Japanese yen, the U.S. dollar generally depreciated versus the currencies of other developed regions, boosting returns of international securities for U.S. investors. Financials, information technology, and materials outperformed all other sectors, as telecommunication services, utilities, healthcare, and energy lagged. Growth stocks in developed markets underperformed value stocks, and small-capitalization securities performed better than large-capitalization securities.
Compared to its benchmark, the Fund was most underweight in financials and materials. Since financials and materials led other sectors, these underweight sectors drove the majority of the Fund’s relative underperformance, offsetting the positive impact of being overweight information technology. The Fund also differed from its benchmark in that it had an allocation to emerging markets. Positive stock selection, especially in emerging markets, healthcare, and consumer discretionary, supported relative returns.
Investment Sub-advisers
| Baillie Gifford Overseas Limited primarily uses proprietary, fundamental research to identify companies for investment that can exhibit sustained, above-average growth with attractive financial characteristics and sustainable competitive advantages. When evaluating individual companies for investment, Baillie Gifford normally focuses on growth/quality, management, valuation and sell discipline. | BlackRock Investment Management, LLC’s equity index strategies invest in portfolios of international equity securities with the objective of approximating as closely as practicable the capitalization weighted total rates of return of the markets in certain countries for value and growth equity securities traded outside the United States, as represented by the MSCI EAFE Growth and MSCI EAFE Value Indices. | Edinburgh Partners Limited employs a disciplined, value-oriented, global investment strategy to select stocks. Edinburgh Partners aims to identify and buy undervalued non-U.S. companies, including those in the emerging markets, and hold them until share prices reflect their long-term earnings potential. | Manning & Napier Advisors, LLC uses a bottom up strategy focusing on individual security selection to choose stocks from companies outside the U.S. Manning & Napier uses fundamental analysis to look for companies trading at attractive valuations and for strong strategic profiles, companies with competitive strength in rebounding industries, and businesses going through restructuring. | |||
Pzena Investment Management, LLC focuses on deep value investing, seeking to identify international securities that are trading at prices substantially below their intrinsic value but have solid long term prospects. | Mondrian Investment Partners Limited employs an active, value-oriented approach to managing international equities, and invests in securities where rigorous dividend discount analysis identifies value in terms of the long-term flow of income. The philosophy is built upon the assumption that dividend yield and future real growth are critical in determining a company’s total expected return and that the dividend component will be a meaningful portion of the expected return over time. | WCM Investment Management uses a bottom-up approach that seeks to identify companies with attractive fundamentals, such as long-term growth in revenue and earnings, and that show a high probability for superior future growth. WCM’s investment process focuses on seeking industry-leading companies that WCM believes possess growing competitive advantages; corporate cultures emphasizing strong, quality and experienced management; low or no debt; and attractive relative valuations. |
| 16 | Annual Report • June 30, 2017 |
Bridge Builder International Equity Fund
Management’s Discussion of Fund Performance (Unaudited) (Continued)
The following chart compares the value of a hypothetical $10,000 investment in the Bridge Builder International Equity Fund from its inception (July 6, 2015) to June 30, 2017 as compared with the MSCI EAFE Index.
Growth of a Hypothetical $10,000 Investment as of June 30, 2017
vs.
MSCI EAFE Index
Average Annual Total Returns as of June 30, 2017
| 1 Year | Since Inception (7/06/2015) | |||||||
Bridge Builder International Equity Fund | 18.78 | % | 6.24 | % | ||||
MSCI EAFE Index | 20.27 | % | 4.61 | % | ||||
Performance data quoted represents past performance; past performance does not guarantee future results. The investment return and principal value of an investment will fluctuate so that an investor’s shares, when redeemed, may be worth more or less than their original cost. Current performance of the Fund may be lower or higher than the performance quoted. As of the latest prospectus, the gross and net expense ratios of the Fund were 0.70%(1) and 0.47%(2), respectively. Performance data current to the most recent month end may be obtained by calling 1.855.823.3611.
The performance table does not reflect the deduction of taxes that a shareholder may pay on Fund distributions or the redemption of Fund shares. Returns shown for the Fund include the reinvestment of all dividends, if any. Total return calculations reflect the effect of the Adviser’s fee waiver agreement for the Fund. If such fee waivers had not occurred, the quoted performance would be lower.
| Annual Report • June 30, 2017 | 17 |
Bridge Builder International Equity Fund
Management’s Discussion of Fund Performance (Unaudited) (Continued)
Portfolio Characteristics (3)
| Sector Breakdown | (% of Investments) | |||
Financials | 17.8 | % | ||
Consumer Discretionary | 14.9 | |||
Consumer Staples | 12.3 | |||
Healthcare | 11.9 | |||
Information Technology | 11.8 | |||
Industrials | 11.8 | |||
Energy | 5.6 | |||
Short-Term Investments | 4.2 | |||
Telecommunication Services | 3.9 | |||
Materials | 3.2 | |||
Utilities | 1.9 | |||
Real Estate | 0.7 | |||
| Country Breakdown | (% of Long-Term Investments) | |||
Japan | 17.8 | % | ||
United Kingdom | 14.8 | |||
Switzerland | 8.9 | |||
France | 7.5 | |||
Germany | 6.5 | |||
China | 4.8 | |||
Netherlands | 4.3 | |||
Hong Kong | 3.8 | |||
Spain | 3.7 | |||
Australia | 2.5 | |||
Other | 25.4 | |||
| Top Ten Equity Holdings | (% of Net Assets) | |||
Nestle SA | 1.8 | % | ||
Sanofi SA | 1.4 | |||
Novartis AG | 1.4 | |||
Tesco Plc | 1.3 | |||
BP Plc | 1.2 | |||
Roche Holding AG | 1.2 | |||
Taiwan Semiconductor Manufacturing Co. Ltd. - ADR | 1.2 | |||
Tencent Holdings Ltd. | 0.9 | |||
Telefonica SA | 0.9 | |||
Sumitomo Mitsui Financial Group, Inc. | 0.9 | |||
ADR American Depository Receipt
| 18 | Annual Report • June 30, 2017 |
Management’s Discussion of Fund Performance (Unaudited)
Disclosures
| (1) | The Gross Expense Ratio, per the Fund’s Prospectus, includes all categories of expenses before any expense reductions or fee waivers. |
| (2) | Olive Street Investment Advisers, LLC has contractually agreed, until at least October 28, 2017, to waive its management fees to the extent management fees to be paid to the Adviser exceed the management fees the Fund is required to pay the Fund’s sub-advisers. This contractual agreement may only be changed or eliminated with the approval of the Board of Trustees. Such waivers are not subject to recoupment by the Adviser. |
| (3) | Fund holdings, sector and portfolio characteristics are subject to change at any time and are not recommendations to buy or sell any security. |
Mutual fund investing involves risk. The value of your investment in a Fund could go down as well as up. Investing in the bond market is subject to certain risks including market, credit, interest-rate, liquidity and reinvestment risk. Investments in asset-backed, mortgage-related and mortgage- backed securities may be more sensitive to changes in interest rates, prepayments and impairment of the value of the collateral underlying the security. Investments in lower-rated and non-rated securities presents a greater risk of loss to principal and interest than higher-rated securities. The risks to the municipal bond market can include unusual volatility, liquidity issues, the inability of the issuer to repay the obligation and a tax risk to the investor if the municipal obligation fails to meet requirements. There is no guarantee that all of the municipal bond income will remain exempt from federal or state income taxes. Investments in municipal securities may be adversely affected by unfavorable legislative or political developments and economic developments that impact the financial condition of municipal issuers. Investments in small and mid-cap companies may involve additional risks such as limited liquidity and greater volatility than larger companies. Investments in non-U.S. dollar-denominated foreign securities (including emerging market securities) may be more sensitive to currency fluctuations, political and economic instability, differing government regulations and liquidity risk. Multi-manager funds may lead to overlapping securities transactions resulting in higher transaction expenses compared to a single manager fund. Outcomes depend on the skill of the sub-advisers and adviser and the allocation of assets amongst them.
You cannot invest directly in an index.
DEFINITIONS
Bloomberg Barclays U.S. Aggregate Bond Index measures the performance of the U.S. dollar-denominated investment grade, fixed-rate taxable bond market.
Bloomberg Barclays Municipal 1-15 Year Index (1-17) is a subset of the Bloomberg Barclays Municipal Bond Index covering only maturities between 1 and 17 years. The Bloomberg Barclays Municipal Bond Index is an unmanaged index composed of tax-exempt bonds with maturities greater than one year and a minimum credit rating of Baa.
Duration is a measure of the sensitivity of the price of a fixed income security (or a portfolio of fixed income securities) to changes in interest rates.
Free Cash Flow is a measure of financial performance calculated as operating cash flow minus capital expenditures. Free cash flow represents the cash that a company is able to generate after laying out the money required to maintain or expand its asset base. Free cash flow is important because it allows a company to pursue opportunities that enhance shareholder value. Without cash, it’s tough to develop new products, make acquisitions, pay dividends and reduce debt.
The Morgan Stanley Capital International (MSCI) Europe, Australasia, Far East Index (EAFE) is an unmanaged index of over 900 companies, and is a generally accepted benchmark for major overseas markets.
Price to Earnings Ratio is a valuation ratio of a company’s current share price compared to its per-share earnings. It is calculated by dividing the current closing price of the stock by the earnings per share of the last four quarters.
Price to Book Ratio is a ratio used to compare a stock’s market value to its book value. It is calculated by dividing the current closing price of the stock by the latest quarter’s book value per share.
The Russell 1000® Index consists of the largest 1,000 companies in a group of 3,000 U.S. companies in the Russell 3000® Index, as ranked by market capitalization.
The Russell 1000® Growth Index measures the performance of the large-cap growth segment of the U.S. equity universe. It includes those Russell 1000® companies with higher price-to-book ratios and higher forecasted growth values.
The Russell 1000® Value Index measures the performance of the large-cap value segment of the U.S. equity universe. It includes those Russell 1000® companies with lower price-to-book ratios and lower expected growth values.
The Russell 2000® Index consists of the smallest 2,000 companies in a group of 3,000 U.S. companies in the Russell 3000® Index, as ranked by market capitalization.
| Annual Report • June 30, 2017 | 19 |
Bridge Builder Mutual Funds
Management’s Discussion of Fund Performance (Unaudited) (Continued)
The Russell 2000® Growth Index measures the performance of the small-cap growth segment of the U.S. equity universe. It includes those Russell 2000® companies with higher price-to-book ratios and higher forecasted growth values.
The Russell 2000® Value Index measures the performance of the small-cap value segment of the U.S. equity universe. It includes those Russell 2000® companies with lower price-to-book ratios and lower forecasted growth values.
The Russell 2500® Growth Index measures the performance of the small to mid-cap growth segment of the U.S. equity universe. It includes those Russell 2500® Index companies with higher price-to-book ratios and higher forecasted growth values.
The Russell 2500® Value Index measures the performance of the small to mid-cap value segment of the U.S. equity universe. It includes those Russell 2500 Index companies with lower price-to-book and lower forecasted growth values.
The Russell 3000® Index measures the performance of the 3,000 largest publicly held companies incorporated in the U.S. based on market capitalization.
The Russell Midcap® Index measures the performance of the mid-cap segment of the U.S. equity universe.
The Russell Midcap® Growth Index measures the performance of the mid-cap growth segment of the U.S. equity universe. It includes those Russell 1000® companies with higher price-to-book ratios and higher forecasted growth values.
The Russell Midcap® Value Index measures the performance of the mid-cap value segment of the U.S. equity universe. It includes those Russell 1000® companies with lower price-to-book ratios and lower forecasted growth values.
The S&P 500 Index, an unmanaged index, consists of 500 stocks chosen for market size, liquidity, and industry group representation. It is a market-value weighted index (stock price times number of shares outstanding), with each stock’s weight in the Index proportionate to its market value.
| 20 | Annual Report • June 30, 2017 |
Bridge Builder Mutual Funds
Fund Expense Examples (Unaudited)
As a shareholder of the Funds, you incur two types of costs: (1) ongoing costs, including management fees and other Fund expenses; and (2) Edward Jones Advisory Solutions® program and administrative fees, which are charged outside of the Funds. This example is intended to help you understand your ongoing costs (in dollars) of investing in the Funds and to compare these costs with the ongoing costs of investing in other mutual funds.
Actual Expenses
The Examples are based on $1,000 invested at the beginning of the period and held for the entire period from January 1, 2017 to June 30, 2017.
The first line of the table below provides information about actual account values and actual expenses. You may use the information in this line, together with the amount you invested, to estimate the expenses you paid over the period. Simply divide your account value by $1,000 (for example, an $8,600 account value divided by $1,000 equals 8.6), then multiply the result by the number in the applicable line under the heading titled “Expenses paid during the period” to estimate the expenses you paid on your account during the period.
Hypothetical Example for Comparison Purposes
The second line of the table below provides information about hypothetical account values and hypothetical expenses based on the Funds’ actual expense ratio and an assumed rate of return of 5% per year before expenses, which is not the Funds’ actual return. The hypothetical account values and expenses may not be used to estimate the actual ending account balance or expenses you paid for the period. You may use this information to compare the ongoing costs of investing in the Funds with other funds. To do so, compare this 5% hypothetical example with the 5% hypothetical examples that appear in the shareholder reports of other funds.
Please note that the expenses shown in the table are meant to highlight your ongoing costs of owning shares of a Fund only and do not reflect annual Edward Jones Advisory Solutions® program and administrative fees. If fees of Edward Jones Advisory Solutions® had been included, your costs would have been higher.
| Beginning account value | Ending account value | Annualized Expense Ratio | Expenses paid during the period* | |||||||||||||||||
Bridge Builder Core Bond Fund | ||||||||||||||||||||
| Actual | $ | 1,000.00 | $ | 1,026.40 | 0.15 | % | $ | 0.75 | ||||||||||||
| Hypothetical | 1,000.00 | 1,024.05 | 0.75 | |||||||||||||||||
Bridge Builder Core Plus Bond Fund | ||||||||||||||||||||
| Actual | 1,000.00 | 1,026.60 | 0.19 | 0.95 | ||||||||||||||||
| Hypothetical | 1,000.00 | 1,023.85 | 0.95 | |||||||||||||||||
Bridge Builder Municipal Bond Fund | ||||||||||||||||||||
| Actual | 1,000.00 | 1,030.80 | 0.21 | 1.06 | ||||||||||||||||
| Hypothetical | 1,000.00 | 1,023.75 | 1.05 | |||||||||||||||||
Bridge Builder Large Cap Growth Fund | ||||||||||||||||||||
| Actual | 1,000.00 | 1,132.90 | 0.27 | 1.43 | ||||||||||||||||
| Hypothetical | 1,000.00 | 1,023.46 | 1.35 | |||||||||||||||||
Bridge Builder Large Cap Value Fund | ||||||||||||||||||||
| Actual | 1,000.00 | 1,074.70 | 0.29 | 1.49 | ||||||||||||||||
| Hypothetical | 1,000.00 | 1,023.36 | 1.45 | |||||||||||||||||
Bridge Builder Small/Mid Cap Growth Fund | ||||||||||||||||||||
| Actual | 1,000.00 | 1,101.60 | 0.42 | 2.19 | ||||||||||||||||
| Hypothetical | 1,000.00 | 1,022.71 | 2.11 | |||||||||||||||||
Bridge Builder Small/Mid Cap Value Fund | ||||||||||||||||||||
| Actual | 1,000.00 | 1,035.30 | 0.48 | 2.42 | ||||||||||||||||
| Hypothetical | 1,000.00 | 1,022.41 | 2.41 | |||||||||||||||||
Bridge Builder International Equity Fund | ||||||||||||||||||||
| Actual | 1,000.00 | 1,156.70 | 0.41 | 2.19 | ||||||||||||||||
| Hypothetical | 1,000.00 | 1,022.76 | 2.06 | |||||||||||||||||
| * | Expenses are equal to the Funds’ annualized expense ratio, multiplied by the average account value over the period, multiplied by 181/365 (to reflect the six-month period). Expenses do not include Edward Jones Advisory Solutions® program and administrative fees, which are charged outside of the Fund. |
| Annual Report • June 30, 2017 | 21 |
Summary Schedule of Investments
June 30, 2017
| Principal Amount | Value | |||||||
BONDS & NOTES – 97.65% | ||||||||
Asset-Backed Obligations – 10.28% | ||||||||
Various Securities (1)(7)(8) | $ | 1,409,959,511 | $ | 1,397,292,348 | ||||
|
| |||||||
Total Asset-Backed Obligations | 1,397,292,348 | |||||||
|
| |||||||
Corporate Bonds – 30.68% | ||||||||
| Basic Materials – 1.40% | ||||||||
Various Securities (1) | 180,181,000 | 190,689,263 | ||||||
|
| |||||||
Total Basic Materials | 190,689,263 | |||||||
|
| |||||||
| Communications – 2.39% | ||||||||
Various Securities (1) | 309,534,000 | 325,205,476 | ||||||
|
| |||||||
Total Communications | 325,205,476 | |||||||
|
| |||||||
| Consumer, Cyclical – 1.93% | ||||||||
Various Securities (1)(8) | 252,615,997 | 262,363,944 | ||||||
|
| |||||||
Total Consumer, Cyclical | 262,363,944 | |||||||
|
| |||||||
| Consumer, Non-cyclical – 4.22% | ||||||||
Various Securities (1) | 553,213,977 | 574,146,298 | ||||||
|
| |||||||
Total Consumer, Non-cyclical | 574,146,298 | |||||||
|
| |||||||
| Diversified – 0.06% | ||||||||
Various Securities (1) | 8,037,000 | 8,560,548 | ||||||
|
| |||||||
Total Diversified | 8,560,548 | |||||||
|
| |||||||
| Energy – 3.29% | ||||||||
Various Securities (1) | 426,042,125 | 446,422,063 | ||||||
|
| |||||||
Total Energy | 446,422,063 | |||||||
|
| |||||||
| Financials – 11.74% | ||||||||
Citigroup, Inc., 2.75%, Apr. 2022 | 26,291,000 | 26,292,262 | ||||||
Other Securities (1) | 1,509,912,880 | 1,570,146,382 | ||||||
|
| |||||||
Total Financials | 1,596,438,644 | |||||||
|
| |||||||
| Industrials – 1.77% | ||||||||
Various Securities (1) | 232,212,046 | 240,466,197 | ||||||
|
| |||||||
Total Industrials | 240,466,197 | |||||||
|
| |||||||
| Real Estate – 0.07% | ||||||||
Various Securities | 9,518,000 | 9,769,998 | ||||||
|
| |||||||
Total Real Estate | 9,769,998 | |||||||
|
| |||||||
| Technology – 1.51% | ||||||||
Various Securities (1) | 197,675,000 | 204,527,729 | ||||||
|
| |||||||
Total Technology | 204,527,729 | |||||||
|
| |||||||
| Utilities – 2.30% | ||||||||
Various Securities (1) | 295,644,758 | 312,983,779 | ||||||
|
| |||||||
Total Utilities | 312,983,779 | |||||||
|
| |||||||
Total Corporate Bonds | 4,171,573,939 | |||||||
|
| |||||||
Government Related – 23.47% | ||||||||
| Other Government Related – 2.83% | ||||||||
Residual Funding Co. Principal Strip, 0.00%, Jul. 2020 | 25,916,000 | 24,564,196 | ||||||
Other Securities (1) | 341,058,000 | 360,361,262 | ||||||
|
| |||||||
Total Other Government Related | 384,925,458 | |||||||
|
| |||||||
| U.S. Treasury – 20.64% | ||||||||
U.S. Treasury Note/Bond, 1.25%, May 2019 | 27,740,000 | 27,673,896 | ||||||
U.S. Treasury Note/Bond, 1.25%, Jun. 2019 | 50,673,000 | 50,536,436 | ||||||
U.S. Treasury Note/Bond, 1.38%, Apr. 2021 | 93,575,000 | 92,379,767 | ||||||
U.S. Treasury Note/Bond, 1.50%, May 2020 | 34,255,000 | 34,214,853 | ||||||
U.S. Treasury Note/Bond, 1.63%, Apr. 2023 | 78,315,000 | 76,611,022 | ||||||
The accompanying notes are an integral part of these financial statements.
| 22 | Annual Report • June 30, 2017 |
Bridge Builder Core Bond Fund
Summary Schedule of Investments
June 30, 2017 (Continued)
| Principal Amount | Value | |||||||
| U.S. Treasury – 20.64% – (continued) | ||||||||
U.S. Treasury Note/Bond, 1.63%, Nov. 2020 | $ | 23,776,000 | $ | 23,759,285 | ||||
U.S. Treasury Note/Bond, 1.75%, Mar. 2022 | 64,525,000 | 64,194,826 | ||||||
U.S. Treasury Note/Bond, 1.75%, May 2023 | 79,000,000 | 77,808,838 | ||||||
U.S. Treasury Note/Bond, 1.88%, Jan. 2022 | 51,000,000 | 51,059,772 | ||||||
U.S. Treasury Note/Bond, 1.88%, Mar. 2022 | 63,286,000 | 63,320,617 | ||||||
U.S. Treasury Note/Bond, 1.88%, Apr. 2022 | 28,171,000 | 28,163,309 | ||||||
U.S. Treasury Note/Bond, 2.00%, Dec. 2021 | 51,000,000 | 51,366,588 | ||||||
U.S. Treasury Note/Bond, 2.00%, Nov. 2026 | 27,627,000 | 26,941,712 | ||||||
U.S. Treasury Note/Bond, 2.13%, Jun. 2021 | 51,510,000 | 52,248,447 | ||||||
U.S. Treasury Note/Bond, 2.13%, Sep. 2021 | 116,865,000 | 118,449,105 | ||||||
U.S. Treasury Note/Bond, 2.13%, May 2025 | 69,875,000 | 69,427,381 | ||||||
U.S. Treasury Note/Bond, 2.25%, Jul. 2021 | 50,000,000 | 50,949,200 | ||||||
U.S. Treasury Note/Bond, 2.25%, Nov. 2025 | 122,335,000 | 122,349,313 | ||||||
U.S. Treasury Note/Bond, 2.50%, May 2024 | 63,300,000 | 64,838,000 | ||||||
U.S. Treasury Note/Bond, 2.88%, May 2043 (4) | 137,150,000 | 138,639,312 | ||||||
U.S. Treasury Note/Bond, 3.00%, May 2045 | 37,295,000 | 38,489,596 | ||||||
U.S. Treasury Note/Bond, 3.00%, Feb. 2047 | 50,810,000 | 52,504,971 | ||||||
U.S. Treasury Note/Bond, 3.50%, Feb. 2039 | 98,799,100 | 111,762,629 | ||||||
U.S. Treasury Note/Bond, 4.25%, Nov. 2040 | 25,610,000 | 32,213,590 | ||||||
U.S. Treasury Note/Bond, 4.75%, Feb. 2037 | 36,425,000 | 48,580,423 | ||||||
U.S. Treasury Note/Bond, 5.25%, Nov. 2028 | 19,540,500 | 25,163,728 | ||||||
U.S. Treasury Strip Coupon, 0.00%, May 2020 | 39,615,000 | 37,892,896 | ||||||
U.S. Treasury Strip Coupon, 0.00%, Aug. 2020 | 28,543,000 | 27,143,679 | ||||||
U.S. Treasury Strip Coupon, 0.00%, Feb. 2022 | 33,917,000 | 31,043,348 | ||||||
U.S. Treasury Strip Coupon, 0.00%, Feb. 2023 | 61,562,000 | 54,829,888 | ||||||
U.S. Treasury Strip Coupon, 0.00%, May 2023 | 33,770,000 | 29,868,045 | ||||||
U.S. Treasury Note/Bond, 0.75%-8.75%, Oct. 2017-Nov. 2046 | 507,781,000 | 532,425,242 | ||||||
U.S. Treasury Strip Coupon, 0.00%, Nov. 2017-Aug. 2041 | 602,741,000 | 470,480,238 | ||||||
Other Securities (2) | 39,845,737 | 28,320,349 | ||||||
|
| |||||||
Total U.S. Treasury | 2,805,650,301 | |||||||
|
| |||||||
Total Government Related | 3,190,575,759 | |||||||
|
| |||||||
Mortgage-Backed Obligations – 33.22% | ||||||||
Fannie Mae, 2.68%, Dec. 2026 | 43,307,000 | 42,293,963 | ||||||
Fannie Mae, 3.00%, Aug. 2025 (3) | 25,500,000 | 26,141,485 | ||||||
Fannie Mae, 3.00%, Jul. 2027 (3) | 39,050,000 | 40,072,013 | ||||||
Fannie Mae, 3.00%, Jul. 2042 (3) | 58,285,000 | 58,193,929 | ||||||
Fannie Mae, 3.09%, Apr. 2027 | 23,211,000 | 23,561,702 | ||||||
Fannie Mae, 3.50%, Jul. 2041 (3) | 80,295,000 | 82,444,168 | ||||||
Fannie Mae, 4.00%, Jul. 2040 (3) | 136,089,155 | 143,066,031 | ||||||
Fannie Mae, 4.50%, Jul. 2041 (3) | 55,285,000 | 59,288,801 | ||||||
Freddie Mac, 3.00%, Jul. 2043 (3) | 46,325,000 | 46,216,423 | ||||||
Freddie Mac, 3.36%, Dec. 2026 | 27,000,000 | 28,128,794 | ||||||
Freddie Mac, 3.50%, Jul. 2042 (3) | 28,295,000 | 29,059,848 | ||||||
Freddie Mac, 4.00%, Jul. 2041 (3) | 47,280,000 | 49,716,026 | ||||||
Ginnie Mae, 3.00%, Jul. 2045 (3) | 23,660,000 | 23,896,600 | ||||||
Ginnie Mae, 3.50%, Jul. 2045 (3) | 50,360,000 | 52,150,142 | ||||||
Ginnie Mae, 4.00%, Jul. 2042 (3) | 56,750,000 | 59,711,641 | ||||||
Morgan Stanley Bank of America Merrill Lynch Trust 2015-C23, 3.45%, Jul. 2050 | 27,200,000 | 27,992,053 | ||||||
Mortgage Repurchase Agreement Financing Trust Series 2016-4, 2.32%, May 2019 | 23,130,000 | 23,067,896 | ||||||
Fannie Mae, 1.35%-10.50%, Aug. 2017-Nov. 2048 (3) | 1,333,342,030 | 1,380,531,374 | ||||||
Fannie Mae, 1.54%-4.33%, Aug. 2019-Apr. 2029 | 104,232,300 | 106,062,912 | ||||||
Freddie Mac, 0.00%-10.00%, Oct. 2017-Jul. 2047 | 454,405,070 | 471,082,776 | ||||||
Freddie Mac, 1.00%-5.09%, Jan. 2019-Jan. 2031 | 324,596,235 | 182,188,112 | ||||||
Ginnie Mae, 3.00%-8.50%, Mar. 2025-May 2063 (3) | 247,857,487 | 256,887,082 | ||||||
Ginnie Mae, 0.00%-23.51%, Nov. 2020-Jun. 2067 | 235,740,655 | 195,096,660 | ||||||
Other Securities (1)(7)(8) | 1,282,584,264 | 1,110,461,409 | ||||||
|
| |||||||
Total Mortgage-Backed Obligations | 4,517,311,840 | |||||||
|
| |||||||
Total Bonds & Notes | 13,276,753,886 | |||||||
|
| |||||||
The accompanying notes are an integral part of these financial statements.
| Annual Report • June 30, 2017 | 23 |
Bridge Builder Core Bond Fund
Summary Schedule of Investments
June 30, 2017 (Continued)
| Shares | Value | |||||||
PREFERRED STOCKS – 0.02% | ||||||||
| Financials – 0.02% | ||||||||
Various Securities | 95,000 | $ | 2,605,850 | |||||
|
| |||||||
Total Preferred Stocks | 2,605,850 | |||||||
|
| |||||||
SHORT-TERM INVESTMENTS – 8.07% | ||||||||
| Money Market Funds – 8.06% | ||||||||
Fidelity Institutional Money Market Government Funds – Class I , 0.81% (5)(6) | 547,323,679 | 547,323,679 | ||||||
Goldman Sachs Financial Square Treasury Solutions Fund – Class I , 0.84% (5)(6) | 548,895,840 | 548,895,840 | ||||||
|
| |||||||
Total Money Market Funds | 1,096,219,519 | |||||||
|
| |||||||
| Principal Amount | Value | |||||||
| U.S. Treasury Bills – 0.01% | ||||||||
U.S. Treasury Bill, 0.00%, Apr. 2018 (4) | $ | 1,000,000 | $ | 990,471 | ||||
|
| |||||||
Total U.S. Treasury Bills | 990,471 | |||||||
|
| |||||||
Total Short-Term Investments | 1,097,209,990 | |||||||
|
| |||||||
TOTAL INVESTMENTS IN SECURITIES – 105.74% | 14,376,569,726 | |||||||
LIABILITIES IN EXCESS OF OTHER ASSETS – (5.74)% | (780,742,021 | ) | ||||||
|
| |||||||
TOTAL NET ASSETS – 100.00% | $ | 13,595,827,705 | ||||||
|
| |||||||
Percentages are stated as a percent of net assets
| (1) | Security is restricted or includes restricted securities as defined in Rule 144(A) under the Securities Act of 1933. The value of these securities totals $1,934,772,921, which represents 14.23% of total net assets. See Note 3(d) in the Notes to Financial Statements. |
| (2) | Inflation protected security or includes inflation protected securities. The value of these securities total $18,115,750, which represents 0.13% of total net assets. |
| (3) | Delayed delivery purchase commitment security or includes delayed delivery purchase commitment securities. The value of these securities total $713,114,849, which represents 5.25% of total net assets. See Note 3(a) in the Notes to Financial Statements. |
| (4) | Partially assigned as collateral for certain futures contracts. The value of the pledged issues total $2,672,390, which represent 0.02% of total net assets. |
| (5) | Partially assigned as collateral for certain delayed delivery securities. See Note 3(a) in the Notes to Financial Statements. |
| (6) | Represents annualized seven-day yield as of the close of the reporting period. |
| (7) | Includes securities that are treated as illiquid by the Fund. The value of these securities total $47,290,200, which represents 0.35% of total net assets. |
| (8) | Includes securities categorized as Level 3 per the Trust’s fair value hierarchy. The value of these securities total $127,785,038, which represents 0.94% of total net assets. |
Open Futures Contracts
Number of Contracts | Description | Counterparty | Settlement Month | Notional Amount | Value | Unrealized Appreciation (Depreciation) | ||||||||||||||
| (1,650) | U.S. 10 Year Note Future | J.P. Morgan | Sep. 2017 | $ | (208,560,324 | ) | $ | (207,126,562 | ) | $ | 1,433,762 | |||||||||
| 643 | U.S. 2 Year Note Future | J.P. Morgan | Sep. 2017 | 139,149,354 | 138,958,329 | (191,025 | ) | |||||||||||||
| 2,885 | U.S. 5 Year Note Future | J.P. Morgan | Sep. 2017 | 340,766,902 | 339,956,682 | (810,220 | ) | |||||||||||||
| (491) | U.S. Long Bond Future | J.P. Morgan | Sep. 2017 | (75,443,364 | ) | (75,460,562 | ) | (17,198 | ) | |||||||||||
| 507 | U.S. Ultra Bond Future | J.P. Morgan | Sep. 2017 | 83,270,200 | 84,098,625 | 828,425 | ||||||||||||||
|
| |||||||||||||||||||
| $ | 1,243,744 | |||||||||||||||||||
|
| |||||||||||||||||||
The accompanying notes are an integral part of these financial statements.
| 24 | Annual Report • June 30, 2017 |
Bridge Builder Core Plus Bond Fund
Summary Schedule of Investments
June 30, 2017
| Principal Amount | Value | |||||||
BONDS & NOTES – 95.19% | ||||||||
Asset-Backed Obligations – 13.59% | ||||||||
Denali Capital CLO X Ltd., 2.32%, Apr. 2025 (1) | $ | 15,200,000 | $ | 15,201,414 | ||||
Dryden 35 EURO CLO 2014 BV, 0.70%, May 2027 (1) | EUR 13,350,000 | 15,232,455 | ||||||
Munda CLO 1 BV, 0.61%, Dec. 2024 (1) | 20,000,000 | 21,464,079 | ||||||
National Collegiate Student Loan Trust, 1.46%, Jul. 2030 | $ | 15,229,079 | 15,060,001 | |||||
SoFi Consumer Loan Program LLC, 2.50%, May 2026 (1) | 15,900,000 | 15,897,122 | ||||||
VOLT LVIII LLC, 3.38%, May 2047 (1) | 27,945,674 | 27,935,525 | ||||||
VOLT LXI LLC, 3.13%, Jun. 2047 (1) | 16,755,000 | 16,755,000 | ||||||
VOLT LX LLC, 3.25%, June 2047 (1) | 15,600,000 | 15,586,316 | ||||||
Other Securities (1)(6)(8)* | 736,662,958 | 729,806,841 | ||||||
|
| |||||||
Total Asset-Backed Obligations | 872,938,753 | |||||||
|
| |||||||
Corporate Bonds – 35.81% | ||||||||
| Basic Materials – 0.90% | ||||||||
Various Securities (1) | 56,277,000 | 57,993,847 | ||||||
|
| |||||||
Total Basic Materials | 57,993,847 | |||||||
|
| |||||||
| Communications – 3.72% | ||||||||
Various Securities (1)* | 233,448,000 | 239,157,592 | ||||||
|
| |||||||
Total Communications | 239,157,592 | |||||||
|
| |||||||
| Consumer, Cyclical – 3.23% | ||||||||
Various Securities (1)(6)(8)* | 199,882,268 | 207,711,723 | ||||||
|
| |||||||
Total Consumer, Cyclical | 207,711,723 | |||||||
|
| |||||||
| Consumer, Non-cyclical – 5.27% | ||||||||
Anheuser-Busch InBev Finance, Inc., 3.65%, Feb. 2026 | $ | 15,318,000 | 15,783,177 | |||||
Other Securities (1)(6)(8)* | 316,800,000 | 323,004,705 | ||||||
|
| |||||||
Total Consumer, Non-cyclical | 338,787,882 | |||||||
|
| |||||||
| Diversified – 0.04% | ||||||||
Various Securities | $ | 2,460,000 | 2,617,525 | |||||
|
| |||||||
Total Diversified | 2,617,525 | |||||||
|
| |||||||
| Energy – 2.86% | ||||||||
Petrobras Global Finance BV, 6.13%, Jan. 2022 | 16,825,000 | 17,371,812 | ||||||
Other Securities (1)* | 160,625,350 | 166,227,945 | ||||||
|
| |||||||
Total Energy | 183,599,757 | |||||||
|
| |||||||
| Financials – 13.17% | ||||||||
Ally Financial, Inc., 8.00%, Nov. 2031 | $ | 14,690,000 | 17,995,250 | |||||
Barclays Plc, 7.25%, Mar. 2163 | GBP 14,083,000 | 19,349,974 | ||||||
Lloyds Banking Group Plc, 7.00%, Jun. 2164 | 18,850,000 | 25,453,564 | ||||||
Bank of America Corp., 3.25%-7.63%, Aug. 2017-Apr. 2038 | $ | 69,615,000 | 71,850,297 | |||||
Other Securities (1)* | 688,696,885 | 711,166,833 | ||||||
|
| |||||||
Total Financials | 845,815,918 | |||||||
|
| |||||||
| Industrials – 1.86% | ||||||||
Various Securities (1)* | 115,406,000 | 119,143,306 | ||||||
|
| |||||||
Total Industrials | 119,143,306 | |||||||
|
| |||||||
| Real Estate – 0.69% | ||||||||
Various Securities | $ | 43,880,000 | 44,559,857 | |||||
|
| |||||||
Total Real Estate | 44,559,857 | |||||||
|
| |||||||
| Technology – 1.93% | ||||||||
Various Securities (1)* | 119,245,000 | 123,601,537 | ||||||
|
| |||||||
Total Technology | 123,601,537 | |||||||
|
| |||||||
| Utilities – 2.14% | ||||||||
Various Securities (1) | $ | 134,790,000 | 137,377,314 | |||||
|
| |||||||
Total Utilities | 137,377,314 | |||||||
|
| |||||||
Total Corporate Bonds | 2,300,366,258 | |||||||
|
| |||||||
The accompanying notes are an integral part of these financial statements.
| Annual Report • June 30, 2017 | 25 |
Bridge Builder Core Plus Bond Fund
Summary Schedule of Investments
June 30, 2017 (Continued)
| Principal Amount | Value | |||||||
Government Related – 21.79% | ||||||||
| Other Government Related – 2.27% | ||||||||
Various Securities (1)* | 27,803,635,962 | $ | 145,625,050 | |||||
|
| |||||||
Total Other Government Related | 145,625,050 | |||||||
|
| |||||||
| U.S. Treasury – 19.52% | ||||||||
U.S. Treasury Inflation Indexed Bonds, 0.13%, Jul. 2026 (2) | $ | 34,296,434 | 33,073,184 | |||||
U.S. Treasury Note/Bond, 0.63%, Jul. 2017 | 22,055,000 | 22,050,611 | ||||||
U.S. Treasury Note/Bond, 0.63%, Jun. 2018 | 25,000,000 | 24,841,800 | ||||||
U.S. Treasury Note/Bond, 0.75%, Apr. 2018 | 80,780,000 | 80,432,888 | ||||||
U.S. Treasury Note/Bond, 0.75%, Oct. 2018 | 15,235,000 | 15,117,767 | ||||||
U.S. Treasury Note/Bond, 0.88%, May 2018 | 16,750,000 | 16,691,107 | ||||||
U.S. Treasury Note/Bond, 0.88%, May 2019 | 34,710,000 | 34,390,009 | ||||||
U.S. Treasury Note/Bond, 1.25%, Apr. 2019 | 92,135,000 | 91,911,849 | ||||||
U.S. Treasury Note/Bond, 1.25%, May 2019 | 47,490,000 | 47,376,831 | ||||||
U.S. Treasury Note/Bond, 1.38%, May 2021 | 19,150,000 | 18,883,700 | ||||||
U.S. Treasury Note/Bond, 1.50%, Jan. 2022 | 20,990,000 | 20,671,057 | ||||||
U.S. Treasury Note/Bond, 1.75%, May 2022 | 115,525,000 | 114,834,507 | ||||||
U.S. Treasury Note/Bond, 1.75%, Jun. 2022 | 142,410,000 | 141,475,506 | ||||||
U.S. Treasury Note/Bond, 1.88%, Apr. 2022 | 23,745,000 | 23,738,518 | ||||||
U.S. Treasury Note/Bond, 2.00%, Apr. 2024 | 131,200,000 | 130,180,182 | ||||||
U.S. Treasury Note/Bond, 2.00%, May 2024 | 79,700,000 | 79,036,896 | ||||||
U.S. Treasury Note/Bond, 2.00%, Nov. 2026 | 44,737,000 | 43,627,299 | ||||||
U.S. Treasury Note/Bond, 2.13%, Feb. 2024 | 16,207,000 | 16,222,202 | ||||||
U.S. Treasury Note/Bond, 2.25%, Feb. 2027 | 28,345,000 | 28,218,780 | ||||||
U.S. Treasury Note/Bond, 2.50%, May 2046 | 21,990,000 | 20,494,504 | ||||||
U.S. Treasury Note/Bond, 2.88%, Nov. 2046 | 18,635,000 | 18,769,675 | ||||||
U.S. Treasury Note/Bond, 3.00%, May 2047 | 115,950,000 | 119,872,357 | ||||||
U.S. Treasury Inflation Indexed Bonds, 0.13%-0.88%, Apr. 2021-Feb. 2047 (2) | 53,528,296 | 52,185,056 | ||||||
U.S. Treasury Note/Bond, 0.50%-3.00%, Jul. 2017-Feb. 2046 (5) | 60,770,000 | 60,071,684 | ||||||
|
| |||||||
Total U.S. Treasury | 1,254,167,969 | |||||||
|
| |||||||
Total Government Related | 1,399,793,019 | |||||||
|
| |||||||
Mortgage-Backed Obligations – 24.00% | ||||||||
Alternative Loan Trust, 1.67%, Jun. 2046 | 20,220,899 | 18,591,877 | ||||||
Eurosail Plc, 1.06%, Sep. 2045 | GBP 13,616,612 | 16,371,999 | ||||||
Fannie Mae, 3.00%, Jun. 2043 | $ | 16,351,792 | 16,414,888 | |||||
Fannie Mae, 3.00%, Nov. 2046 | 17,847,876 | 17,851,179 | ||||||
Fannie Mae, 3.50%, Jul. 2041 (3) | 35,495,000 | 36,445,056 | ||||||
Fannie Mae, 4.00%, Jul. 2040 (3) | 59,580,000 | 62,619,509 | ||||||
Fannie Mae, 4.50%, Aug. 2040 (3) | 39,580,000 | 42,396,952 | ||||||
Fannie Mae, 4.50%, Apr. 2047 | 42,394,381 | 45,459,858 | ||||||
Freddie Mac, 3.50%, Oct. 2045 | 16,193,489 | 16,734,732 | ||||||
Freddie Mac, 3.50%, Aug. 2046 | 34,436,855 | 35,480,114 | ||||||
Freddie Mac, 4.00%, Nov. 2045 | 18,130,372 | 19,079,306 | ||||||
Ginnie Mae, 3.50%, Jul. 2045 (3) | 21,930,000 | 22,709,543 | ||||||
Ginnie Mae, 4.00%, Jul. 2042 (3) | 38,480,000 | 40,488,175 | ||||||
Ginnie Mae, 4.50%, Jul. 2041 (3) | 24,170,000 | 25,681,551 | ||||||
Rosslyn Portfolio Trust, 2.11%, Jun. 2033 (1) | 15,800,000 | 15,799,684 | ||||||
Fannie Mae, 2.28%-6.50%, Oct. 2021-Jul. 2047 (3) | 371,366,031 | 383,355,126 | ||||||
Freddie Mac, 2.50%-8.00%, Jul. 2030-Apr. 2047 (3) | 179,472,011 | 184,671,925 | ||||||
Ginnie Mae, 2.50%-5.50%, May 2040-May 2047 (3) | 161,508,478 | 167,589,920 | ||||||
Other Securities (1)(6)(8)* | 383,378,392 | 373,594,074 | ||||||
|
| |||||||
Total Mortgage-Backed Obligations | 1,541,335,468 | |||||||
|
| |||||||
Total Bonds & Notes | 6,114,433,498 | |||||||
|
| |||||||
Bank Loans – 2.26% | ||||||||
Various Securities (6)(8)* | 145,336,850 | 145,311,196 | ||||||
|
| |||||||
Total Bank Loans | 145,311,196 | |||||||
|
| |||||||
The accompanying notes are an integral part of these financial statements.
| 26 | Annual Report • June 30, 2017 |
Bridge Builder Core Plus Bond Fund
Summary Schedule of Investments
June 30, 2017 (Continued)
| Shares | Value | |||||||
PREFERRED STOCKS – 0.07% | ||||||||
| Consumer, Non-cyclical – 0.03% | ||||||||
Various Securities | 17,080 | $ | 1,780,590 | |||||
|
| |||||||
Total Consumer, Non-cyclical | 1,780,590 | |||||||
|
| |||||||
| Financials – 0.04% | ||||||||
Various Securities | 107,846 | 2,780,270 | ||||||
|
| |||||||
Total Financials | 2,780,270 | |||||||
|
| |||||||
Total Preferred Stocks | 4,560,860 | |||||||
|
| |||||||
SHORT-TERM INVESTMENTS – 7.68% | ||||||||
| Money Market Funds – 6.55% | ||||||||
Fidelity Institutional Money Market Government Funds – Class I , 0.81% (4)(7) | 208,992,028 | 208,992,028 | ||||||
Goldman Sachs Financial Square Treasury Solutions Fund – Class I , 0.84% (4)(7) | 211,946,351 | 211,946,351 | ||||||
|
| |||||||
Total Money Market Funds | 420,938,379 | |||||||
|
| |||||||
| Principal Amount | Value | |||||||
| Certificate of Deposit – 0.05% | ||||||||
Credit Suisse AG/New York NY , 2.03% | $ | 2,940,000 | $ | 2,944,692 | ||||
|
| |||||||
Total Certificate of Deposit | 2,944,692 | |||||||
|
| |||||||
| Commercial Paper – 0.07% | ||||||||
Enbridge Energy Partners LP, 1.88% | 3,140,000 | 3,134,581 | ||||||
Ford Motor Credit Co. LLC, 1.78% | 1,490,000 | 1,486,055 | ||||||
|
| |||||||
Total Commercial Paper | 4,620,636 | |||||||
|
| |||||||
| Repurchase Agreement – 0.98% | ||||||||
Merrill Lynch Pierce Fenner & Smith, Inc., 1.33%, dated 6/29/2017, due 7/3/2017, repurchase price $50,005,542, (collaterized by U.S. Treasury Bond, value $50,769,343, 3.63%, 2/15/2044) (Cost $50,000,000) | 50,000,000 | 50,000,000 | ||||||
Merrill Lynch Pierce Fenner & Smith, Inc., 1.39%, dated 6/30/2017, due 7/3/2017, repurchase price $13,001,546, (collaterized by U.S. Treasury Bond, value $13,054,991, 3.63%, 8/15/2043) (Cost $13,000,000) | 13,000,000 | 13,000,000 | ||||||
|
| |||||||
Total Repurchase Agreement | 63,000,000 | |||||||
|
| |||||||
| U.S. Treasury Bills – 0.03% | ||||||||
U.S. Treasury Bill, 0.00%, Sep. 2017 (5) | 2,040,000 | 2,036,446 | ||||||
|
| |||||||
Total U.S. Treasury Bills | 2,036,446 | |||||||
|
| |||||||
Total Short-Term Investments | 493,540,153 | |||||||
|
| |||||||
TOTAL INVESTMENTS IN SECURITIES – 105.20% | 6,757,845,707 | |||||||
LIABILITIES IN EXCESS OF OTHER ASSETS – (5.20)% | (334,372,760 | ) | ||||||
|
| |||||||
TOTAL NET ASSETS – 100.00% | $ | 6,423,472,947 | ||||||
|
| |||||||
Percentages are stated as a percent of net assets
Principal amounts are denominated in the currency in which the security was purchased.
| * | Includes securities whose principal amounts are denominated in a currency other than the U.S. dollar. |
| (1) | Restricted security or includes restricted securities as defined in Rule 144(A) under the Securities Act of 1933. The value of these securities total $1,110,223,761, which represents 17.28% of total net assets. See Note 3(d) in the Notes to Financial Statements. |
| (2) | Inflation protected security or includes inflation protected securities. The value of these securities total $85,258,240 which represents 1.33% of total net assets. |
The accompanying notes are an integral part of these financial statements.
| Annual Report • June 30, 2017 | 27 |
Bridge Builder Core Plus Bond Fund
Summary Schedule of Investments
June 30, 2017 (Continued)
| (3) | Delayed delivery purchase commitment security or includes delayed delivery purchase commitment securities. The value of these securities totals $267,385,976, which represents 4.16% of total net assets. See Note 3(a) in the Notes to Financial Statements. |
| (4) | Partially assigned as collateral for certain delayed delivery securities. See Note 3(a) in the Notes to Financial Statements. |
| (5) | Partially assigned as collateral for certain futures and swap contracts. The value of the pledged issues total $5,485,076, which represent 0.09% of total net assets. |
| (6) | Includes securities that are treated as illiquid by the Fund. The value of these securities total $14,458,790, which represents 0.23% of the total net assets. |
| (7) | Represents annualized seven-day yield as of the close of the reporting period. |
| (8) | Includes securities categorized as Level 3 per the Trust’s fair value hierarchy. The value of these securities total $62,688,278, which represents 0.98% of total net assets. |
Open Futures Contracts
Number of Contracts | Description | Counterparty | Settlement Month | Notional Amount | Value | Unrealized Appreciation (Depreciation) | ||||||||||||||
| 54 | U.S. 10 Year Note Future | Goldman Sachs | Sep. 2017 | $ | 6,817,586 | $ | 6,778,688 | $ | (38,898 | ) | ||||||||||
| 2,429 | U.S. 10 Year Note Future | RBC Capital Markets | Sep. 2017 | 306,277,974 | 304,915,406 | (1,362,568 | ) | |||||||||||||
| (508) | U.S. Ultra 10 Year Note Future | Goldman Sachs | Sep. 2017 | (68,649,933 | ) | (68,484,750 | ) | 165,183 | ||||||||||||
| 995 | U.S. 2 Year Note Future | Citigroup Global Markets | Sep. 2017 | 215,330,251 | 215,028,829 | (301,422 | ) | |||||||||||||
| 204 | U.S. 2 Year Note Future | Goldman Sachs | Sep. 2017 | 44,121,703 | 44,086,313 | (35,390 | ) | |||||||||||||
| 471 | U.S. 5 Year Note Future | Citigroup Global Markets | Sep. 2017 | 55,632,069 | 55,500,727 | (131,342 | ) | |||||||||||||
| 97 | U.S. 5 Year Note Future | Goldman Sachs | Sep. 2017 | 11,439,334 | 11,430,086 | (9,248 | ) | |||||||||||||
| 373 | U.S. Long Bond Future | Goldman Sachs | Sep. 2017 | 56,708,253 | 57,325,437 | 617,184 | ||||||||||||||
| 144 | U.S. Ultra Bond Future | Goldman Sachs | Sep. 2017 | 23,810,140 | 23,886,000 | 75,860 | ||||||||||||||
|
| |||||||||||||||||||
| $ | (1,020,641 | ) | ||||||||||||||||||
|
| |||||||||||||||||||
Forward Foreign Currency Exchange Contracts
Over-the-Counter
| Purchase Contracts | Counterparty | Currency Purchased/Sold | Currency Amount Purchased | Value at Settlement Date | Value at June 30, 2017 | Unrealized Appreciation (Depreciation) | ||||||||||||||
| Euro, Settlement 7/21/17 | Canadian Imperial Bank of Commerce | EUR/USD | 1,365,763 | $ | 1,489,392 | $ | 1,561,727 | $ | 72,335 | |||||||||||
| British Pound, Settlement 8/15/17 | J.P. Morgan | GBP/USD | 5,307,000 | 6,829,637 | 6,922,336 | 92,699 | ||||||||||||||
| British Pound, Settlement 8/15/17 | Morgan Stanley | GBP/USD | 5,810,000 | 7,373,715 | 7,578,439 | 204,724 | ||||||||||||||
| Mexican Peso, Settlement 8/08/17 | Morgan Stanley | MXN/USD | 274,329,000 | 14,368,793 | 15,016,270 | 647,477 | ||||||||||||||
| Euro, Settlement 8/15/17 | J.P. Morgan | EUR/USD | 4,616,000 | 5,167,393 | 5,285,280 | 117,887 | ||||||||||||||
| Euro, Settlement 8/15/17 | Morgan Stanley | EUR/USD | 715,000 | 807,079 | 818,669 | 11,590 | ||||||||||||||
| Turkish Lira, Settlement 8/15/17 | Morgan Stanley | TRY/USD | 51,796,000 | 14,052,222 | 14,521,380 | 469,158 | ||||||||||||||
|
|
|
|
|
| |||||||||||||||
| $ | 50,088,231 | $ | 51,704,101 | $ | 1,615,870 | |||||||||||||||
|
|
|
|
|
| |||||||||||||||
| Sale Contracts | Counterparty | Currency Purchased/Sold | Currency Amount Sold | Value at Settlement Date | Value at June 30, 2017 | Unrealized Appreciation (Depreciation) | ||||||||||||||
| Euro, Settlement 7/21/17 | Royal Bank of Canada | USD/EUR | (1,365,763 | ) | $ | (1,500,385 | ) | $ | (1,561,727 | ) | $ | (61,342 | ) | |||||||
| British Pound, Settlement 8/15/17 | J.P. Morgan | USD/GBP | (20,971,000 | ) | (26,590,171 | ) | (27,354,121 | ) | (763,950 | ) | ||||||||||
| British Pound, Settlement 8/15/17 | Morgan Stanley | USD/GBP | (58,032,000 | ) | (74,896,578 | ) | (75,695,690 | ) | (799,112 | ) | ||||||||||
| Australian Dollar, Settlement 8/15/17 | Morgan Stanley | USD/AUD | (9,828,000 | ) | (7,247,467 | ) | (7,549,205 | ) | (301,738 | ) | ||||||||||
| Euro, Settlement 8/15/17 | J.P. Morgan | USD/EUR | (949,000 | ) | (1,061,926 | ) | (1,086,597 | ) | (24,671 | ) | ||||||||||
| Euro, Settlement 8/15/17 | Morgan Stanley | USD/EUR | (73,210,000 | ) | (80,948,777 | ) | (83,824,821 | ) | (2,876,044 | ) | ||||||||||
| Israeli New Shekel, Settlement 8/17/17 | HSBC | USD/ILS | (13,807,198 | ) | (3,846,939 | ) | (3,965,714 | ) | (118,775 | ) | ||||||||||
| Japanese Yen, Settlement 8/15/17 | Morgan Stanley | USD/JPY | (2,475,700,000 | ) | (21,842,104 | ) | (22,055,739 | ) | (213,635 | ) | ||||||||||
| Mexican Peso, Settlement 7/14/17 | HSBC | USD/MXN | (40,525,000 | ) | (2,220,305 | ) | (2,227,647 | ) | (7,342 | ) | ||||||||||
| Mexican Peso, Settlement 7/14/17 | Canadian Imperial Bank of Commerce | USD/MXN | (2,785,000 | ) | (152,287 | ) | (153,090 | ) | (803 | ) | ||||||||||
| Mexican Peso, Settlement 7/14/17 | Citigroup Global Markets | USD/MXN | (27,430,000 | ) | (1,440,342 | ) | (1,507,819 | ) | (67,477 | ) | ||||||||||
| Turkish Lira, Settlement 8/15/17 | Deutsche Bank | USD/TRY | (1,724,000 | ) | (482,141 | ) | (483,336 | ) | (1,195 | ) | ||||||||||
|
|
|
|
|
| |||||||||||||||
| $ | (222,229,422 | ) | $ | (227,465,506 | ) | $ | (5,236,084 | ) | ||||||||||||
|
|
|
|
|
| |||||||||||||||
| $ | (172,141,191 | ) | $ | (175,761,405 | ) | $ | (3,620,214 | ) | ||||||||||||
|
|
|
|
|
| |||||||||||||||
The accompanying notes are an integral part of these financial statements.
| 28 | Annual Report • June 30, 2017 |
Bridge Builder Core Plus Bond Fund
Summary Schedule of Investments
June 30, 2017 (Continued)
Centrally Cleared Interest Rate Swap
| Counterparty | Fixed Annual Rate | Floating Rate | Floating Rate Paid or Received | Payment Frequency | Maturity Date | Notional Amount | Value | Unrealized Appreciation/ (Depreciation) | ||||||||||||||||||||
| Citigroup Global Markets | 1.60% | 3 Month LIBOR | Received | Quarterly | 06/30/2019 | $ | 10,840,000 | $ | 10,848,705 | $ | 8,705 | |||||||||||||||||
|
|
|
|
|
| |||||||||||||||||||||||
| $ | 10,840,000 | $ | 10,848,705 | $ | 8,705 | |||||||||||||||||||||||
|
|
|
|
|
| |||||||||||||||||||||||
The accompanying notes are an integral part of these financial statements.
| Annual Report • June 30, 2017 | 29 |
Bridge Builder Municipal Bond Fund
Summary Schedule of Investments
June 30, 2017
| Principal Amount | Value | |||||||
MUNICIPAL BONDS – 95.71% | ||||||||
| Education – 12.82% | ||||||||
Connecticut State Health & Educational Facility Authority, 1.00%, Jul. 2042 | $ | 28,000,000 | $ | 27,906,760 | ||||
Cypress-Fairbanks Independent School District, 3.00%, Feb. 2040 | 9,000,000 | 9,119,850 | ||||||
Dallas Independent School District, 5.00%, Feb. 2036 | 5,485,000 | 6,302,320 | ||||||
School Board of Miami-Dade County/The, 5.00%, Feb. 2029 | 8,000,000 | 9,405,840 | ||||||
School Board of Miami-Dade County/The, 5.00%, May 2031 | 5,000,000 | 5,725,950 | ||||||
State Public School Building Authority, 5.00%, Dec. 2022 | 7,370,000 | 8,399,515 | ||||||
University of Akron/The, 5.00%, Jan. 2037 | 6,675,000 | 7,573,388 | ||||||
Virginia Public School Authority, 5.00%, Aug. 2021 | 6,000,000 | 6,866,820 | ||||||
Connecticut State Health & Educational Facility Authority, 2.00%, Jul. 2042 (3) | 1,325,000 | 1,274,054 | ||||||
New Jersey Economic Development Authority, 5.00%, Jun. 2019 (3) | 4,500,000 | 4,710,105 | ||||||
New York State Dormitory Authority, 5.00%, Aug. 2018-Oct. 2030 (3) | 6,500,000 | 7,677,103 | ||||||
Other Securities (1) | 212,290,000 | 233,714,711 | ||||||
|
| |||||||
Total Education | 328,676,416 | |||||||
|
| |||||||
| General Obligation – 23.66% | ||||||||
City of Binghamton NY, 2.50%, Apr. 2018 | 5,647,617 | 5,705,336 | ||||||
City of New York NY, 5.00%, Aug. 2017 | 6,365,000 | 6,383,522 | ||||||
City of New York NY, 5.00%, Aug. 2021 | 6,000,000 | 6,861,720 | ||||||
City of New York NY, 5.00%, Aug. 2028 | 10,350,000 | 12,471,655 | ||||||
City of Philadelphia PA, 5.00%, Aug. 2028 | 6,000,000 | 6,975,600 | ||||||
Commonwealth of Massachusetts, 1.05%, Aug. 2043 | 10,515,000 | 10,413,530 | ||||||
Commonwealth of Massachusetts, 4.00%, Dec. 2017 | 6,015,000 | 6,090,970 | ||||||
Commonwealth of Pennsylvania, 5.00%, Mar. 2023 | 9,970,000 | 11,664,800 | ||||||
County of Pima AZ, 4.00%, Jul. 2022 | 13,160,000 | 14,721,434 | ||||||
County of Suffolk NY, 2.00%, Jul. 2017 | 13,400,000 | 13,408,308 | ||||||
Dallas County Community College District, 5.00%, Feb. 2021 | 7,610,000 | 8,584,917 | ||||||
Dallas County Community College District, 5.00%, Feb. 2022 | 7,665,000 | 8,866,259 | ||||||
State of Connecticut, 5.00%, Aug. 2019 | 20,380,000 | 21,750,351 | ||||||
State of Connecticut, 5.00%, Sep. 2022 | 5,725,000 | 6,519,687 | ||||||
State of Maryland, 5.00%, Mar. 2020 | 6,000,000 | 6,601,740 | ||||||
State of Texas, 5.00%, Apr. 2027 | 5,000,000 | 6,133,750 | ||||||
State of Washington, 5.00%, Jul. 2031 | 5,000,000 | 5,856,050 | ||||||
City of New York NY, 0.91%-5.00%, Aug. 2018-Aug. 2034 | 14,955,000 | 16,046,505 | ||||||
Commonwealth of Pennsylvania, 5.00%, Feb. 2020-Mar. 2031 (3) | 12,175,000 | 13,985,063 | ||||||
State of Connecticut, 4.00%-5.00%, Jun. 2027-Nov. 2032 | 4,420,000 | 4,916,978 | ||||||
State of Illinois, 5.00%-5.50%, Jan. 2018-Jul. 2038 (3) | 27,355,000 | 28,004,993 | ||||||
Other Securities (1) | 348,173,500 | 384,892,416 | ||||||
|
| |||||||
Total General Obligation | 606,855,584 | |||||||
|
| |||||||
| General Revenue – 21.38% | ||||||||
California State Public Works Board, 5.00%, May 2018 | 15,265,000 | 15,782,331 | ||||||
Denver Convention Center Hotel Authority, 5.00%, Dec. 2022 | 4,950,000 | 5,701,311 | ||||||
Industrial Development Board of the City of Mobile Alabama, 1.63%, Jul. 2034 | 11,500,000 | 11,514,720 | ||||||
Louisiana Public Facilities Authority, 5.00%, Jun. 2021 | 7,695,000 | 8,637,484 | ||||||
New Jersey Economic Development Authority, 5.00%, Jun. 2025 | 5,190,000 | 5,561,915 | ||||||
New York State Dormitory Authority, 5.00%, Feb. 2031 | 5,000,000 | 5,975,050 | ||||||
New York State Dormitory Authority, 5.25%, Mar. 2033 | 5,000,000 | 5,988,050 | ||||||
Texas Municipal Gas Acquisition & Supply Corp. I, 6.25%, Dec. 2026 | 7,585,000 | 9,263,257 | ||||||
Commonwealth of Pennsylvania, 5.00%, Nov. 2020-Nov. 2021 (3) | 4,800,000 | 5,320,368 | ||||||
Illinois Finance Authority, 4.00%-8.00%, May 2023-May 2047 (3) | 4,925,000 | 5,411,039 | ||||||
New Jersey Economic Development Authority, 4.00%-5.63%, Jan. 2020-Jan. 2052 (3) | 14,250,000 | 15,533,034 | ||||||
New York State Dormitory Authority, 5.00%, Mar. 2018-Mar. 2027 (3) | 13,000,000 | 14,309,580 | ||||||
State of Illinois, 4.50%-5.00%, Jun. 2019-Jun. 2025 (3) | 9,235,000 | 10,136,796 | ||||||
Other Securities (1)(2)(5) | 404,920,000 | 429,078,111 | ||||||
|
| |||||||
Total General Revenue | 548,213,046 | |||||||
|
| |||||||
The accompanying notes are an integral part of these financial statements.
| 30 | Annual Report • June 30, 2017 |
Bridge Builder Municipal Bond Fund
Summary Schedule of Investments
June 30, 2017 (Continued)
| Principal Amount | Value | |||||||
| Healthcare – 14.89% | ||||||||
Arizona Health Facilities Authority, 0.93%, Jul. 2035 | $ | 10,000,000 | $ | 10,000,000 | ||||
Illinois Finance Authority, 0.93%, Jul. 2032 | 9,500,000 | 9,500,000 | ||||||
Indiana Health Facility Financing Authority, 4.00%, Nov. 2027 | 7,410,000 | 7,425,264 | ||||||
Michigan State Hospital Finance Authority, 1.40%, Nov. 2047 | 7,565,000 | 7,584,139 | ||||||
New York State Dormitory Authority, 5.00%, May. 2024 | 4,870,000 | 5,810,592 | ||||||
Connecticut State Health & Educational Facility Authority, 4.00%-5.00%, Jul. 2043-Jul. 2046 (3) | 2,630,000 | 2,739,921 | ||||||
Illinois Finance Authority, 0.89%-5.25%, Nov. 2023-May 2047 (3) | 41,065,000 | 44,413,345 | ||||||
New York State Dormitory Authority, 4.00%-5.00%, Dec. 2018-Jul. 2025 (1)(3) | 3,200,000 | 3,571,678 | ||||||
Other Securities (1)(2)(5) | 268,546,250 | 290,854,695 | ||||||
|
| |||||||
Total Healthcare | 381,899,634 | |||||||
|
| |||||||
| Housing – 2.59% | ||||||||
Various Securities (1) | 65,265,000 | 66,346,944 | ||||||
|
| |||||||
Total Housing | 66,346,944 | |||||||
|
| |||||||
| Transportation – 11.95% | ||||||||
Chicago Midway International Airport, 5.00%, Jan. 2021 | 5,000,000 | 5,534,700 | ||||||
Chicago Transit Authority, 5.00%, Jun. 2026 | 8,275,000 | 9,365,976 | ||||||
Illinois State Toll Highway Authority, 5.00%, Jan. 2041 | 7,000,000 | 7,901,390 | ||||||
New York State Thruway Authority, 5.00%, May 2019 | 25,325,000 | 27,065,587 | ||||||
Texas Transportation Commission State Highway Fund, 5.00%, Oct. 2023 | 5,000,000 | 5,998,450 | ||||||
Other Securities (1)(2)(5) | 226,560,000 | 250,633,822 | ||||||
|
| |||||||
Total Transportation | 306,499,925 | |||||||
|
| |||||||
| Utilities – 8.42% | ||||||||
City of Baltimore MD, 5.00%, Jul. 2029 | 4,770,000 | 5,775,993 | ||||||
City of Houston TX Combined Utility System Revenue, 0.91%, May 2034 | 10,000,000 | 10,000,000 | ||||||
County of King WA Sewer Revenue, 0.95%, Jan. 2032 | 8,250,000 | 8,250,000 | ||||||
County of Pima AZ Sewer System Revenue, 5.00%, Jul. 2022 | 10,000,000 | 11,706,900 | ||||||
Michigan Finance Authority, 5.00%, Oct. 2025 | 5,000,000 | 6,167,850 | ||||||
Municipal Electric Authority of Georgia, 5.00%, Jan. 2020 | 5,075,000 | 5,473,235 | ||||||
New York City Water & Sewer System, 5.00%, Jun. 2031 | 6,075,000 | 7,201,184 | ||||||
Other Securities | 147,095,000 | 161,485,052 | ||||||
|
| |||||||
Total Utilities | 216,060,214 | |||||||
|
| |||||||
Total Municipal Bonds | 2,454,551,763 | |||||||
|
| |||||||
| Shares | Value | |||||||
SHORT-TERM INVESTMENTS – 3.72% | ||||||||
| Money Market Funds – 3.72% | ||||||||
Fidelity Institutional Money Market Government Funds – Class I , 0.81% (4) | 47,660,254 | $ | 47,660,254 | |||||
Goldman Sachs Financial Square Treasury Solutions Fund – Class I , 0.84% (4) | 47,654,460 | 47,654,460 | ||||||
|
| |||||||
Total Short-Term Investments | 95,314,714 | |||||||
|
| |||||||
TOTAL INVESTMENTS IN SECURITIES – 99.43% | 2,549,866,477 | |||||||
OTHER ASSETS IN EXCESS OF LIABILITIES – 0.57% | 14,707,025 | |||||||
|
| |||||||
TOTAL NET ASSETS – 100.00% | $ | 2,564,573,502 | ||||||
|
| |||||||
Percentages are stated as a percent of net assets
| (1) | Includes restricted securities as defined in Rule 144(A) under the Securities Act of 1933. The value of these securities total $46,540,887, which represents 1.81% of total net assets. See Note 3(d) in the Notes to Financial Statements. |
| (2) | Includes securities that are treated as illiquid by the Fund. The value of these securities totals $19,408,965, which represents 0.76% of total net assets. |
The accompanying notes are an integral part of these financial statements.
| Annual Report • June 30, 2017 | 31 |
Bridge Builder Municipal Bond Fund
Summary Schedule of Investments
June 30, 2017 (Continued)
| (3) | Issuer includes securities in multiple categories. The market value of the issuer as a whole is greater than 1% of the Fund’s total net assets. |
| (4) | Represents annualized seven-day yield as of the close of the reporting period. |
| (5) | Includes securities categorized as Level 3 per the Trust’s fair value hierarchy. The value of these securities total $20,908,965, which represents 0.82% of total net assets. |
State/U.S. Territory | Percentage of Net Assets | |||
Alabama | 0.99 | % | ||
Alaska | 0.17 | |||
Arizona | 2.45 | |||
Arkansas | 0.04 | |||
California | 4.72 | |||
Colorado | 1.40 | |||
Connecticut | 3.76 | |||
Delaware | 0.21 | |||
District of Columbia | 0.67 | |||
Florida | 6.67 | |||
Georgia | 1.87 | |||
Guam | 0.06 | |||
Hawaii | 0.09 | |||
Idaho | 0.32 | |||
Illinois | 9.25 | |||
Indiana | 2.21 | |||
Iowa | 0.36 | |||
Kansas | 0.21 | |||
Kentucky | 1.32 | |||
Louisiana | 1.46 | |||
Maine | 0.19 | |||
Maryland | 3.24 | |||
Massachusetts | 2.38 | |||
Michigan | 3.16 | |||
Minnesota | 0.95 | |||
Mississippi | 0.56 | |||
Missouri | 0.68 | |||
Montana | 0.05 | |||
Nebraska | 0.04 | |||
Nevada | 0.96 | |||
State/U.S. Territory | Percentage of Net Assets | |||
New Hampshire | 0.36 | % | ||
New Jersey | 3.49 | |||
New Mexico | 0.33 | |||
New York | 10.41 | |||
North Carolina | 2.41 | |||
Ohio | 1.78 | |||
Oklahoma | 0.91 | |||
Oregon | 0.48 | |||
Pennsylvania | 5.89 | |||
Puerto Rico | 0.20 | |||
Rhode Island | 0.40 | |||
South Carolina | 0.76 | |||
South Dakota | 0.21 | |||
Tennessee | 1.23 | |||
Texas | 9.73 | |||
Utah | 0.41 | |||
Vermont | 0.12 | |||
Virgin Islands | 0.12 | |||
Virginia | 2.72 | |||
Washington | 2.19 | |||
West Virginia | 0.37 | |||
Wisconsin | 0.75 | |||
|
| |||
Total Municipal Bonds | 95.71 | |||
|
| |||
SHORT-TERM INVESTMENTS | 3.72 | |||
|
| |||
TOTAL INVESTMENTS IN SECURITIES | 99.43 | |||
OTHER ASSETS IN EXCESS OF LIABILITIES | 0.57 | |||
|
| |||
TOTAL NET ASSETS | 100.00 | % | ||
|
| |||
The accompanying notes are an integral part of these financial statements.
| 32 | Annual Report • June 30, 2017 |
Bridge Builder Large Cap Growth Fund
Summary Schedule of Investments
June 30, 2017
| Shares | Value | |||||||
COMMON STOCKS – 95.36% |
| |||||||
| Consumer Discretionary – 16.34% | ||||||||
Amazon.com, Inc. (1) | 128,696 | $ | 124,577,728 | |||||
Chipotle Mexican Grill, Inc. (1) | 75,744 | 31,517,078 | ||||||
Comcast Corp. – Class A | 798,921 | 31,094,005 | ||||||
Lowes Companies, Inc. | 1,011,133 | 78,393,141 | ||||||
Nike, Inc. | 850,656 | 50,188,704 | ||||||
Starbucks Corp. | 1,161,612 | 67,733,596 | ||||||
The Priceline Group, Inc. (1) | 27,710 | 51,832,109 | ||||||
Other Securities (1) | 3,404,041 | 251,150,257 | ||||||
|
| |||||||
Total Consumer Discretionary |
| 686,486,618 | ||||||
|
| |||||||
| Consumer Staples – 6.31% | ||||||||
Coca Cola Co. | 1,317,943 | 59,109,744 | ||||||
Costco Wholesale Corp. | 178,297 | 28,515,039 | ||||||
Mondelez International, Inc. | 884,671 | 38,208,940 | ||||||
Other Securities (1) | 1,990,214 | 139,256,039 | ||||||
|
| |||||||
Total Consumer Staples |
| 265,089,762 | ||||||
|
| |||||||
| Energy – 4.31% | ||||||||
Core Laboratories NV | 300,435 | 30,425,053 | ||||||
Schlumberger Ltd. | 1,061,761 | 69,906,344 | ||||||
Other Securities (1) | 1,038,356 | 80,795,787 | ||||||
|
| |||||||
Total Energy |
| 181,127,184 | ||||||
|
| |||||||
| Financials – 6.73% | ||||||||
Citigroup, Inc. | 848,235 | 56,729,957 | ||||||
Intercontinental Exchange, Inc. | 867,676 | 57,197,202 | ||||||
Morgan Stanley | 633,211 | 28,215,882 | ||||||
State Street Corp. | 358,061 | 32,128,814 | ||||||
Other Securities (1) | 1,415,940 | 108,371,096 | ||||||
|
| |||||||
Total Financials |
| 282,642,951 | ||||||
|
| |||||||
| Healthcare – 13.78% | ||||||||
Allergan Plc | 168,632 | 40,992,753 | ||||||
Celgene Corp. (1) | 313,213 | 40,676,972 | ||||||
Cerner Corp. (1) | 538,644 | 35,803,667 | ||||||
Johnson & Johnson | 284,854 | 37,683,336 | ||||||
Novo Nordisk A/S – ADR | 712,554 | 30,561,441 | ||||||
Pfizer, Inc. | 1,122,245 | 37,696,210 | ||||||
Regeneron Pharmaceuticals, Inc. (1) | 80,005 | 39,293,656 | ||||||
UnitedHealth Group, Inc. | 356,875 | 66,171,763 | ||||||
Zoetis, Inc. | 691,414 | 43,130,405 | ||||||
Other Securities (1) | 2,321,016 | 207,038,281 | ||||||
|
| |||||||
Total Healthcare |
| 579,048,484 | ||||||
|
| |||||||
| Industrials – 10.29% | ||||||||
Honeywell International, Inc. | 211,774 | 28,227,356 | ||||||
J.B. Hunt Transportation Services, Inc. | 354,607 | 32,403,988 | ||||||
Kansas City Southern | 297,467 | 31,129,922 | ||||||
Raytheon Co. | 255,301 | 41,226,005 | ||||||
Union Pacific Corp. | 255,067 | 27,779,347 | ||||||
United Technologies Corp. | 281,160 | 34,332,448 | ||||||
Other Securities (1) | 3,204,266 | 237,319,077 | ||||||
|
| |||||||
Total Industrials |
| 432,418,143 | ||||||
|
| |||||||
| Information Technology – 33.89% | ||||||||
Alibaba Group Holding Ltd. – ADR (1) | 203,739 | 28,706,825 | ||||||
Alliance Data Systems Corp. | 130,921 | 33,606,112 | ||||||
Alphabet, Inc. – Class A (1) | 155,937 | 144,971,510 | ||||||
| Shares | Value | |||||||
Alphabet, Inc. – Class C (1) | 75,096 | $ | 68,241,988 | |||||
Apple, Inc. | 838,234 | 120,722,461 | ||||||
Autodesk, Inc. (1) | 301,783 | 30,425,762 | ||||||
Automatic Data Processing, Inc. | 372,276 | 38,143,399 | ||||||
Cisco Systems, Inc. | 870,645 | 27,251,189 | ||||||
Facebook, Inc. (1) | 882,919 | 133,303,111 | ||||||
FleetCor Technologies, Inc. (1) | 257,373 | 37,115,760 | ||||||
Mastercard, Inc. | 331,056 | 40,206,751 | ||||||
Microsoft Corp. | 1,948,948 | 134,340,986 | ||||||
Red Hat, Inc. (1) | 655,481 | 62,762,306 | ||||||
Salesforce.com, Inc. (1) | 711,635 | 61,627,591 | ||||||
SAP SE – ADR | 284,171 | 29,744,179 | ||||||
Visa, Inc. | 885,804 | 83,070,699 | ||||||
Other Securities (1) | 5,543,209 | 350,017,303 | ||||||
|
| |||||||
Total Information Technology |
| 1,424,257,932 | ||||||
|
| |||||||
| Materials – 1.69% | ||||||||
Ecolab, Inc. | 322,919 | 42,867,497 | ||||||
Other Securities (1) | 513,029 | 28,204,745 | ||||||
|
| |||||||
Total Materials |
| 71,072,242 | ||||||
|
| |||||||
| Real Estate – 1.11% | ||||||||
Equinix, Inc. | 73,392 | 31,496,911 | ||||||
Other Securities (1) | 155,450 | 15,381,313 | ||||||
|
| |||||||
Total Real Estate |
| 46,878,224 | ||||||
|
| |||||||
| Telecommunication Services – 0.91% | ||||||||
AT&T, Inc. | 911,435 | 34,388,443 | ||||||
Other Securities (1) | 87,091 | 3,901,909 | ||||||
|
| |||||||
Total Telecommunication Services |
| 38,290,352 | ||||||
|
| |||||||
| Utilities – 0.00% (3) | ||||||||
Various Securities | 2,094 | 36,059 | ||||||
|
| |||||||
Total Utilities | 36,059 | |||||||
|
| |||||||
Total Common Stocks |
| $ | 4,007,347,951 | |||||
|
| |||||||
SHORT-TERM INVESTMENTS – 4.30% |
| |||||||
| Money Market Funds – 4.30% | ||||||||
Goldman Sachs Financial Square Government Fund – Class I, 0.86% (2) | 90,274,862 | $ | 90,274,862 | |||||
JPMorgan U.S. Government Money Market Fund – Class I, 0.85% (2) | 90,274,863 | 90,274,863 | ||||||
|
| |||||||
Total Short-Term Investments |
| 180,549,725 | ||||||
|
| |||||||
TOTAL INVESTMENTS IN SECURITIES – 99.66% |
| 4,187,897,676 | ||||||
| OTHER ASSETS IN EXCESS OF LIABILITIES – 0.34% | 14,577,461 | |||||||
|
| |||||||
| TOTAL NET ASSETS – 100.00% | $ | 4,202,475,137 | ||||||
|
| |||||||
The accompanying notes are an integral part of these financial statements.
| Annual Report • June 30, 2017 | 33 |
Bridge Builder Large Cap Growth Fund
Summary Schedule of Investments
June 30, 2017 (Continued)
Percentages are stated as a percent of net assets
ADR American Depositary Receipt
| (1) | Non-income producing security or includes securities that are non-income producing. |
| (2) | Represents annualized seven-day yield as of the close of the reporting period. |
| (3) | Amount calculated is less than 0.005%. |
The sector classifications listed above are in accordance with Global Industry Classification Standards (GICS), which was developed by and/or is the exclusive property of MSCI, Inc. and Standard & Poor Financial Services LLC (“S&P”).
The accompanying notes are an integral part of these financial statements.
| 34 | Annual Report • June 30, 2017 |
Bridge Builder Large Cap Value Fund
Summary Schedule of Investments
June 30, 2017
| Shares | Value | |||||||
COMMON STOCKS – 95.27% |
| |||||||
| Consumer Discretionary – 12.77% | ||||||||
Liberty Interactive Corp. (1) | 1,459,184 | $ | 35,808,375 | |||||
Lowes Companies, Inc. | 672,002 | 52,100,315 | ||||||
Michelin | 306,022 | 40,729,798 | ||||||
Nike, Inc. | 995,620 | 58,741,580 | ||||||
TJX Companies, Inc. | 501,089 | 36,163,593 | ||||||
Other Securities (1) | 8,930,988 | 419,870,049 | ||||||
|
| |||||||
Total Consumer Discretionary |
| 643,413,710 | ||||||
|
| |||||||
| Consumer Staples – 7.91% | ||||||||
Coca Cola Co. | 870,492 | 39,041,566 | ||||||
Colgate Palmolive Co. | 533,610 | 39,556,509 | ||||||
Costco Wholesale Corp. | 278,223 | 44,496,204 | ||||||
CVS Health Corp. | 664,381 | 53,456,095 | ||||||
PepsiCo, Inc. | 297,308 | 34,336,101 | ||||||
Other Securities (1) | 2,540,361 | 187,880,929 | ||||||
|
| |||||||
Total Consumer Staples |
| 398,767,404 | ||||||
|
| |||||||
| Energy – 8.56% | ||||||||
Devon Energy Corp. | 1,371,954 | 43,861,369 | ||||||
Exxon Mobil Corp. | 525,038 | 42,386,318 | ||||||
Hess Corp. | 1,373,244 | 60,244,214 | ||||||
Occidental Petroleum Corp. | 963,925 | 57,710,190 | ||||||
Schlumberger Ltd. | 521,407 | 34,329,437 | ||||||
Other Securities (1) | 6,770,469 | 192,691,043 | ||||||
|
| |||||||
Total Energy |
| 431,222,571 | ||||||
|
| |||||||
| Financials – 19.89% | ||||||||
American Express Co. | 725,000 | 61,074,000 | ||||||
Bank of America Corp. | 1,952,354 | 47,364,108 | ||||||
Berkshire Hathaway, Inc. (1) | 497,497 | 84,261,067 | ||||||
Chubb Ltd. | 529,334 | 76,954,577 | ||||||
Citigroup, Inc. | 1,447,005 | 96,775,694 | ||||||
JPMorgan Chase & Co. | 520,614 | 47,584,120 | ||||||
Marsh & McLennan Companies, Inc. | 437,328 | 34,094,091 | ||||||
PNC Financial Services Group, Inc. | 487,084 | 60,822,179 | ||||||
Wells Fargo & Co. | 1,071,440 | 59,368,490 | ||||||
Other Securities (1) | 11,770,903 | 433,629,967 | ||||||
|
| |||||||
Total Financials |
| 1,001,928,293 | ||||||
|
| |||||||
| Healthcare – 13.77% | ||||||||
Cardinal Health, Inc. | 1,105,999 | 86,179,442 | ||||||
Express Scripts Holding Co. (1) | 829,625 | 52,963,260 | ||||||
Johnson & Johnson | 446,233 | 59,032,164 | ||||||
Medtronic Plc | 1,066,172 | 94,622,765 | ||||||
Merck & Co., Inc. | 1,021,572 | 65,472,549 | ||||||
Pfizer, Inc. | 1,014,259 | 34,068,960 | ||||||
UnitedHealth Group, Inc. | 335,445 | 62,198,212 | ||||||
Other Securities (1) | 2,821,257 | 239,330,534 | ||||||
|
| |||||||
Total Healthcare |
| 693,867,886 | ||||||
|
| |||||||
| Industrials – 10.59% | ||||||||
Air Lease Corp. | 1,374,424 | 51,348,481 | ||||||
Canadian National Railway Co. | 494,772 | 40,101,271 | ||||||
General Dynamics Corp. | 176,732 | 35,010,609 | ||||||
Honeywell International, Inc. | 379,813 | 50,625,275 | ||||||
Lockheed Martin Corp. | 131,205 | 36,423,820 | ||||||
Union Pacific Corp. | 333,643 | 36,337,059 | ||||||
United Parcel Service, Inc. | 336,590 | 37,223,488 | ||||||
| Shares | Value | |||||||
United Technologies Corp. | 477,343 | $ | 58,288,354 | |||||
Other Securities (1) | 3,046,125 | 188,403,930 | ||||||
|
| |||||||
Total Industrials |
| 533,762,287 | ||||||
|
| |||||||
| Information Technology – 11.49% | ||||||||
Accenture Plc | 300,582 | 37,175,982 | ||||||
Alphabet, Inc. – Class C (1) | 49,928 | 45,371,071 | ||||||
Apple, Inc. | 494,539 | 71,223,507 | ||||||
Microsoft Corp. | 1,043,813 | 71,950,030 | ||||||
Oracle Corp. | 1,184,289 | 59,380,250 | ||||||
QUALCOMM, Inc. | 882,056 | 48,707,132 | ||||||
Visa, Inc. | 391,330 | 36,698,927 | ||||||
Other Securities (1) | 3,204,837 | 208,589,879 | ||||||
|
| |||||||
Total Information Technology |
| 579,096,778 | ||||||
|
| |||||||
| Materials – 7.34% | ||||||||
Agrium, Inc. | 412,756 | 37,350,291 | ||||||
Celanese Corp. | 542,805 | 51,533,907 | ||||||
Goldcorp, Inc. | 3,027,476 | 39,084,715 | ||||||
Lyondellbasell Industries NV | 804,104 | 67,858,337 | ||||||
Other Securities (1) | 9,027,299 | 174,111,926 | ||||||
|
| |||||||
Total Materials |
| 369,939,176 | ||||||
|
| |||||||
| Real Estate – 1.67% | ||||||||
Various Securities (1) | 1,002,493 | 84,135,426 | ||||||
|
| |||||||
Total Real Estate |
| 84,135,426 | ||||||
|
| |||||||
| Telecommunication Services – 0.68% | ||||||||
Various Securities (1) | 836,734 | 34,366,672 | ||||||
|
| |||||||
Total Telecommunication Services |
| 34,366,672 | ||||||
|
| |||||||
| Utilities – 0.60% | ||||||||
Various Securities (1) | 568,985 | 30,239,360 | ||||||
|
| |||||||
Total Utilities |
| 30,239,360 | ||||||
|
| |||||||
Total Common Stocks |
| 4,800,739,563 | ||||||
|
| |||||||
SHORT-TERM INVESTMENTS – 3.78% |
| |||||||
| Money Market Funds – 3.78% | ||||||||
Goldman Sachs Financial Square Government Fund – Class I, 0.86% (2) | 95,203,699 | 95,203,699 | ||||||
JPMorgan U.S. Government Money Market Fund – Class I, 0.85% (2) | 95,203,699 | 95,203,699 | ||||||
|
| |||||||
Total Short-Term Investments |
| 190,407,398 | ||||||
|
| |||||||
TOTAL INVESTMENTS IN SECURITIES – 99.05% |
| 4,991,146,961 | ||||||
| OTHER ASSETS IN EXCESS OF LIABILITIES – 0.95% | 47,855,363 | |||||||
|
| |||||||
| TOTAL NET ASSETS – 100.00% | $ | 5,039,002,324 | ||||||
|
| |||||||
The accompanying notes are an integral part of these financial statements.
| Annual Report • June 30, 2017 | 35 |
Bridge Builder Large Cap Value Fund
Summary Schedule of Investments
June 30, 2017 (Continued)
Percentages are stated as a percent of net assets
| (1) | Non-income producing security or includes securities that are non-income producing. |
| (2) | Represents annualized seven-day yield as of the close of the reporting period. |
The sector classifications listed above are in accordance with Global Industry Classification Standards (GICS), which was developed by and/or is the exclusive property of MSCI, Inc. and Standard & Poor Financial Services LLC (“S&P”).
The accompanying notes are an integral part of these financial statements.
| 36 | Annual Report • June 30, 2017 |
Bridge Builder Small/Mid Cap Growth Fund
Summary Schedule of Investments
June 30, 2017
| Shares | Value | |||||||
COMMON STOCKS – 95.65% |
| |||||||
| Consumer Discretionary – 11.19% | ||||||||
Advance Auto Parts, Inc. | 210,440 | $ | 24,535,200 | |||||
Delphi Automotive Plc | 179,876 | 15,766,131 | ||||||
Marriott International, Inc. | 168,862 | 16,938,547 | ||||||
Ross Stores, Inc. | 349,517 | 20,177,616 | ||||||
Other Securities (1) | 4,705,237 | 205,645,452 | ||||||
|
| |||||||
Total Consumer Discretionary |
| 283,062,946 | ||||||
|
| |||||||
| Consumer Staples – 6.87% | ||||||||
Casey’s General Stores, Inc. | 173,173 | 18,548,560 | ||||||
Flowers Foods, Inc. | 921,000 | 15,942,510 | ||||||
Snyder’s-Lance, Inc. | 504,319 | 17,459,524 | ||||||
TreeHouse Foods, Inc. (1) | 250,649 | 20,475,517 | ||||||
Whole Foods Market, Inc. | 433,207 | 18,242,347 | ||||||
Other Securities (1) | 1,850,515 | 83,234,946 | ||||||
|
| |||||||
Total Consumer Staples |
| 173,903,404 | ||||||
|
| |||||||
| Energy – 2.18% | ||||||||
Core Laboratories NV | 221,395 | 22,420,672 | ||||||
Other Securities (1) | 2,481,433 | 32,747,052 | ||||||
|
| |||||||
Total Energy |
| 55,167,724 | ||||||
|
| |||||||
| Financials – 9.65% | ||||||||
Affiliated Managers Group, Inc. | 111,580 | 18,506,659 | ||||||
Allied World Assurance Co. Holdings AG | 330,100 | 17,462,290 | ||||||
Arthur J. Gallagher & Co. | 269,350 | 15,420,287 | ||||||
Northern Trust Corp. | 202,000 | 19,636,420 | ||||||
Other Securities (1) | 2,988,137 | 172,991,386 | ||||||
|
| |||||||
Total Financials |
| 244,017,042 | ||||||
|
| |||||||
| Healthcare – 20.19% | ||||||||
Align Technology, Inc. (1) | 121,484 | 18,237,178 | ||||||
AmerisourceBergen Corp. | 170,711 | 16,137,311 | ||||||
BioMarin Pharmaceutical, Inc. (1) | 186,094 | 16,901,057 | ||||||
C.R. Bard, Inc. | 55,183 | 17,443,898 | ||||||
Dentsply Sirona, Inc. | 495,680 | 32,139,891 | ||||||
Integra LifeSciences Holdings Corp. (1) | 437,740 | �� | 23,861,207 | |||||
Laboratory Corp. of America Holdings (1) | 122,000 | 18,805,080 | ||||||
Medidata Solutions, | 207,359 | 16,215,474 | ||||||
Mettler-Toledo International, Inc. (1) | 45,021 | 26,496,659 | ||||||
NuVasive, Inc. (1) | 271,949 | 20,918,317 | ||||||
PAREXEL International | 212,877 | 18,501,140 | ||||||
STERIS Plc | 211,000 | 17,196,500 | ||||||
The Cooper Companies, Inc. | 77,147 | 18,470,535 | ||||||
Other Securities (1) | 5,270,277 | 249,380,676 | ||||||
|
| |||||||
Total Healthcare |
| 510,704,923 | ||||||
|
| |||||||
| Industrials – 15.21% | ||||||||
A.O. Smith Corp. | 311,767 | 17,561,835 | ||||||
Acuity Brands, Inc. | 84,843 | 17,246,885 | ||||||
Dover Corp. | 200,726 | 16,102,240 | ||||||
IDEX Corp. | 296,416 | 33,497,972 | ||||||
Rockwell Automation, Inc. | 213,744 | 34,617,978 | ||||||
United Rentals, Inc. (1) | 160,529 | 18,093,224 | ||||||
WABCO Holdings, Inc. (1) | 126,805 | 16,168,906 | ||||||
| Shares | Value | |||||||
Wabtec Corp. | 170,202 | $ | 15,573,483 | |||||
Other Securities (1) | 4,153,233 | 215,976,207 | ||||||
|
| |||||||
Total Industrials |
| 384,838,730 | ||||||
|
| |||||||
| Information Technology – 22.93% | ||||||||
Aspen Technology, | 405,091 | 22,385,329 | ||||||
Check Point Software Technologies Ltd. (1) | 142,900 | 15,587,532 | ||||||
Fortinet, Inc. (1) | 786,654 | 29,452,326 | ||||||
IPG Photonics Corp. (1) | 121,195 | 17,585,395 | ||||||
MercadoLibre, Inc. | 97,688 | 24,507,965 | ||||||
Palo Alto Networks, | 190,135 | 25,441,964 | ||||||
Red Hat, Inc. (1) | 211,104 | 20,213,208 | ||||||
Splunk, Inc. (1) | 479,668 | 27,288,313 | ||||||
WEX, Inc. (1) | 174,964 | 18,243,496 | ||||||
Workday, Inc. (1) | 336,499 | 32,640,403 | ||||||
Other Securities (1) | 6,593,952 | 346,667,517 | ||||||
|
| |||||||
Total Information Technology |
| 580,013,448 | ||||||
|
| |||||||
| Materials – 4.32% | ||||||||
AptarGroup, Inc. | 271,530 | 23,585,096 | ||||||
Berry Global Group, | 446,689 | 25,465,740 | ||||||
Martin Marietta Materials, Inc. | 79,242 | 17,637,684 | ||||||
Other Securities (1) | 1,073,680 | 42,622,018 | ||||||
|
| |||||||
Total Materials |
| 109,310,538 | ||||||
|
| |||||||
| Real Estate – 2.66% | ||||||||
Jones Lang LaSalle, Inc. | 122,294 | 15,286,750 | ||||||
SBA Communications | 178,370 | 24,062,113 | ||||||
Other Securities (1) | 676,961 | 27,829,197 | ||||||
|
| |||||||
Total Real Estate |
| 67,178,060 | ||||||
|
| |||||||
| Telecommunication Services – 0.23% | ||||||||
Various Securities (1) | 448,214 | 5,866,317 | ||||||
|
| |||||||
Total Telecommunication Services |
| 5,866,317 | ||||||
|
| |||||||
| Utilities – 0.22% | ||||||||
Various Securities (1) | 125,437 | 5,648,598 | ||||||
|
| |||||||
Total Utilities |
| 5,648,598 | ||||||
|
| |||||||
Total Common Stocks |
| 2,419,711,730 | ||||||
|
| |||||||
RIGHTS – 0.00% (2) | ||||||||
| Healthcare – 0.00% (2) | ||||||||
Dyax Corp., expires 12/31/2019 (1)(4)(5) | 15,849 | 57,056 | ||||||
|
| |||||||
Total Rights |
| 57,056 | ||||||
|
| |||||||
| SHORT-TERM INVESTMENTS – 4.51% | ||||||||
| Money Market Funds – 4.51% | ||||||||
Goldman Sachs Financial Square Government Fund – Class I , 0.86% (3) | 57,084,352 | 57,084,352 | ||||||
JPMorgan U.S. Government Money Market Fund – Class I , 0.85% (3) | 57,084,353 | 57,084,353 | ||||||
|
| |||||||
The accompanying notes are an integral part of these financial statements.
| Annual Report • June 30, 2017 | 37 |
Bridge Builder Small/Mid Cap Growth Fund
Summary Schedule of Investments
June 30, 2017 (Continued)
| Shares | Value | |||||
Total Short-Term Investments | $ | 114,168,705 | ||||
|
| |||||
| TOTAL INVESTMENTS IN SECURITIES – 100.16% (Cost: $2,218,193,200) | 2,533,937,491 | |||||
| LIABILITIES IN EXCESS OF OTHER ASSETS – (0.16)% | (4,120,070 | ) | ||||
|
| |||||
| TOTAL NET ASSETS – 100.00% | $ | 2,529,817,421 | ||||
|
| |||||
Percentages are stated as a percent of net assets
| (1) | Non-income producing security or includes securities that are non-income producing. |
| (2) | Amount calculated is less than 0.005%. |
| (3) | Represents annualized seven-day yield as of the close of the reporting period. |
| (4) | Security is categorized as Level 3 per the Trust’s fair value hierarchy. This security represents $57,056 or 0.00% of the Fund’s net assets. |
| (5) | Security is treated as illiquid by the Fund. The value of this security totals $57,056, which represents 0.00% of the total net assets. |
The sector classifications listed above are in accordance with Global Industry Classification Standards (GICS), which was developed by and/or is the exclusive property of MSCI, Inc. and Standard & Poor’s Financial Services LLC (“S&P”).
The accompanying notes are an integral part of these financial statements.
| 38 | Annual Report • June 30, 2017 |
Bridge Builder Small/Mid Cap Value Fund
Summary Schedule of Investments
June 30, 2017
| Shares | Value | |||||||
COMMON STOCKS – 96.76% |
| |||||||
| Consumer Discretionary – 11.41% | ||||||||
Adient Plc | 225,649 | $ | 14,752,932 | |||||
Aramark | 354,742 | 14,537,327 | ||||||
Brunswick Corp. | 556,831 | 34,930,009 | ||||||
Interpublic Group of Companies, Inc. | 727,874 | 17,905,700 | ||||||
Jack in the Box, Inc. | 142,560 | 14,042,160 | ||||||
Mohawk Industries, Inc. (1) | 72,432 | 17,506,090 | ||||||
Newell Brands, Inc. | 338,742 | 18,163,346 | ||||||
Other Securities (1) | 7,052,632 | 238,284,022 | ||||||
|
| |||||||
Total Consumer Discretionary |
| 370,121,586 | ||||||
|
| |||||||
| Consumer Staples – 1.97% | ||||||||
Casey’s General Stores, Inc. | 135,316 | 14,493,697 | ||||||
Other Securities (1) | 1,533,061 | 49,380,362 | ||||||
|
| |||||||
Total Consumer Staples |
| 63,874,059 | ||||||
|
| |||||||
| Energy – 5.84% | ||||||||
Tesoro Corp. | 147,707 | 13,825,375 | ||||||
Other Securities (1) | 8,803,588 | 175,504,478 | ||||||
|
| |||||||
Total Energy |
| 189,329,853 | ||||||
|
| |||||||
| Financials – 23.41% | ||||||||
Ares Capital Corp. | 1,021,100 | 16,725,618 | ||||||
Arthur J. Gallagher & Co. | 251,647 | 14,406,791 | ||||||
BancorpSouth, Inc. | 470,703 | 14,356,441 | ||||||
Discover Financial Services | 301,053 | 18,722,486 | ||||||
East West Bancorp, Inc. | 253,710 | 14,862,332 | ||||||
Fifth Third Bancorp | 752,301 | 19,529,734 | ||||||
First American Financial Corp. | 365,218 | 16,321,592 | ||||||
Huntington Bancshares, Inc. | 1,672,543 | 22,612,781 | ||||||
IBERIABANK Corp. | 172,505 | 14,059,158 | ||||||
Investors Bancorp, Inc. | 1,617,480 | 21,609,533 | ||||||
Navigators Group, Inc. | 273,750 | 15,028,875 | ||||||
New Residential Investment Corp. | 1,022,525 | 15,910,489 | ||||||
Raymond James Financial, Inc. | 181,986 | 14,598,917 | ||||||
Reinsurance Group of America, Inc. | 224,749 | 28,855,524 | ||||||
SunTrust Banks, Inc. | 331,284 | 18,790,428 | ||||||
Synchrony Financial | 559,707 | 16,690,463 | ||||||
Texas Capital Bancshares, Inc. (1) | 181,903 | 14,079,292 | ||||||
Unum Group | 406,956 | 18,976,358 | ||||||
Other Securities (1)(3)(4) | 13,431,728 | 443,667,503 | ||||||
|
| |||||||
Total Financials |
| 759,804,315 | ||||||
|
| |||||||
| Healthcare – 5.54% | ||||||||
Analogic Corp. | 220,879 | 16,046,859 | ||||||
Other Securities (1) | 3,824,021 | 163,643,857 | ||||||
|
| |||||||
Total Healthcare |
| 179,690,716 | ||||||
|
| |||||||
| Industrials – 15.45% | ||||||||
Armstrong World Industries, Inc. (1) | 316,380 | 14,553,480 | ||||||
ManpowerGroup, Inc. | 173,468 | 19,367,702 | ||||||
Masonite International Corp. (1) | 185,020 | 13,969,010 | ||||||
Snap-on, Inc. | 96,166 | 15,194,228 | ||||||
Stanley Black & Decker, Inc. | 120,408 | 16,945,018 | ||||||
The Brink’s Co. | 273,764 | 18,342,188 | ||||||
Other Securities (1) | 10,161,804 | 403,115,023 | ||||||
|
| |||||||
Total Industrials |
| 501,486,649 | ||||||
|
| |||||||
| Information Technology – 13.90% | ||||||||
Activision Blizzard, Inc. | 248,952 | 14,332,167 | ||||||
Amdocs Ltd. | 246,886 | 15,914,272 | ||||||
| Shares | Value | |||||||
Arrow Electronics, Inc. (1) | 228,330 | $ | 17,905,639 | |||||
Avnet, Inc. | 364,800 | 14,183,424 | ||||||
CommScope Holding Co., Inc. (1) | 390,305 | 14,843,299 | ||||||
Fidelity National Information Services, Inc. | 362,356 | 30,945,202 | ||||||
Flex Ltd. (1) | 878,035 | 14,320,751 | ||||||
Harris Corp. | 167,844 | 18,308,424 | ||||||
NCR Corp. (1) | 408,100 | 16,666,804 | ||||||
Other Securities (1) | 7,252,198 | 293,732,101 | ||||||
|
| |||||||
Total Information Technology |
| 451,152,083 | ||||||
|
| |||||||
| Materials – 6.66% | ||||||||
Crown Holdings, | 417,741 | 24,922,428 | ||||||
Packaging Corporation of America | 124,125 | 13,826,284 | ||||||
Reliance Steel & Aluminum Co. | 194,111 | 14,133,222 | ||||||
Other Securities (1) | 5,321,029 | 163,311,639 | ||||||
|
| |||||||
Total Materials |
| 216,193,573 | ||||||
|
| |||||||
| Real Estate – 7.89% | ||||||||
Boston Properties, Inc. | 122,908 | 15,120,142 | ||||||
SL Green Realty Corp. | 148,534 | 15,714,897 | ||||||
The Howard Hughes Corp. (1) | 113,083 | 13,891,116 | ||||||
Other Securities (1) | 8,088,615 | 211,181,913 | ||||||
|
| |||||||
Total Real Estate | 255,908,068 | |||||||
|
| |||||||
| Telecommunication Services – 0.26% | ||||||||
Various Securities (1) | 595,623 | 8,521,717 | ||||||
|
| |||||||
Total Telecommunication Services |
| 8,521,717 | ||||||
|
| |||||||
| Utilities – 4.43% | ||||||||
Edison International | 174,965 | 13,680,513 | ||||||
Other Securities (1) | 3,096,431 | 130,144,373 | ||||||
|
| |||||||
Total Utilities |
| 143,824,886 | ||||||
|
| |||||||
Total Common Stocks |
| 3,139,907,505 | ||||||
|
| |||||||
SHORT-TERM INVESTMENTS – 3.29% |
| |||||||
| Money Market Funds – 3.29% | ||||||||
Goldman Sachs Financial Square Government Fund – Class I , 0.86% (2) | 53,371,008 | 53,371,008 | ||||||
JPMorgan U.S. Government Money Market Fund – Class I, 0.85% (2) | 53,371,008 | 53,371,008 | ||||||
|
| |||||||
Total Short-Term Investments |
| 106,742,016 | ||||||
|
| |||||||
TOTAL INVESTMENTS IN SECURITIES – 100.05% |
| 3,246,649,521 | ||||||
| LIABILITIES IN EXCESS OF OTHER ASSETS – (0.05)% | (1,484,923 | ) | ||||||
|
| |||||||
| TOTAL NET ASSETS – 100.00% | $ | 3,245,164,598 | ||||||
|
| |||||||
The accompanying notes are an integral part of these financial statements.
| Annual Report • June 30, 2017 | 39 |
Bridge Builder Small/Mid Cap Value Fund
Summary Schedule of Investments
June 30, 2017 (Continued)
Percentages are stated as a percent of net assets
| (1) | Non-income producing security or includes securities that are non-income producing. |
| (2) | Represents annualized seven-day yield as of the close of the reporting period. |
| (3) | Includes securities that are categorized as Level 3 or security is categorized as Level 3 per the Trust’s fair value hierarchy. These securities represent $34,135 or 0.00% of the Fund’s net assets. |
| (4) | Includes a security that is treated as illiquid by the Fund. The value of this security totals $34,135, which represents 0.00% of the total net assets. |
The sector classifications listed above are in accordance with Global Industry Classification Standards (GICS), which was developed by and/or is the exclusive property of MSCI, Inc. and Standard & Poor’s Financial Services LLC (“S&P”).
The accompanying notes are an integral part of these financial statements.
| 40 | Annual Report • June 30, 2017 |
Bridge Builder International Equity Fund
Summary Schedule of Investments
June 30, 2017
| Shares | Value | |||||||
COMMON STOCKS – 94.79% |
| |||||||
| Consumer Discretionary – 14.60% | ||||||||
Adidas AG | 175,001 | $ | 33,556,303 | |||||
Compass Group Plc | 1,375,739 | 29,038,643 | ||||||
Ctrip.com International Ltd. – ADR (1) | 712,295 | 38,364,209 | ||||||
Galaxy Entertainment Group Ltd. | 6,345,000 | 38,509,739 | ||||||
Honda Motor Co. Ltd. | 1,544,600 | 42,319,078 | ||||||
Kingfisher Plc | 8,330,005 | 32,628,106 | ||||||
Panasonic Corp. | 2,924,165 | 39,842,510 | ||||||
Other Securities (1)(2) | 17,878,213 | 499,530,607 | ||||||
|
| |||||||
Total Consumer Discretionary |
| 753,789,195 | ||||||
|
| |||||||
| Consumer Staples – 12.22% | ||||||||
Japan Tobacco, Inc. | 1,231,700 | 43,291,922 | ||||||
Nestle SA | 1,041,117 | 90,803,807 | ||||||
Reckitt Benckiser Group Plc | 339,064 | 34,372,151 | ||||||
Tesco Plc (1) | 31,235,678 | 68,769,793 | ||||||
Other Securities (1)(2) | 50,323,983 | 393,790,216 | ||||||
|
| |||||||
Total Consumer Staples |
| 631,027,889 | ||||||
|
| |||||||
| Energy – 5.58% | ||||||||
BP Plc | 10,810,377 | 62,399,690 | ||||||
Eni SpA | 2,458,652 | 36,948,392 | ||||||
Royal Dutch Shell Plc | 488,053 | 12,967,003 | ||||||
Royal Dutch Shell Plc – Class A | 1,176,557 | 31,284,619 | ||||||
Royal Dutch Shell Plc – Class B | 828,889 | 22,252,809 | ||||||
TOTAL SA | 890,819 | 44,226,597 | ||||||
Other Securities (1) | 6,396,441 | 77,757,544 | ||||||
|
| |||||||
Total Energy | 287,836,654 | |||||||
|
| |||||||
| Financials – 17.63% | ||||||||
AIA Group Ltd. | 4,031,600 | 29,496,641 | ||||||
Banco Bilbao Vizcaya Argentaria SA | 3,615,089 | 30,113,571 | ||||||
BNP Paribas SA | 414,444 | 29,837,017 | ||||||
Chubb Ltd. | 223,381 | 32,475,130 | ||||||
Commerzbank AG (1) | 2,676,873 | 31,964,427 | ||||||
DNB ASA | 1,665,431 | 28,353,618 | ||||||
HSBC Holdings Plc | 3,771,843 | 35,010,296 | ||||||
Nomura Holdings, Inc. | 5,370,800 | 32,388,309 | ||||||
Royal Bank of Scotland Group Plc (1) | 9,984,081 | 32,215,729 | ||||||
Sumitomo Mitsui Financial Group, Inc. | 1,143,200 | 44,635,632 | ||||||
Sumitomo Mitsui Trust Holdings, Inc. | 814,500 | 29,256,262 | ||||||
United Overseas Bank Ltd. | 2,496,726 | 41,916,633 | ||||||
Other Securities (1)(2) | 86,972,860 | 512,625,605 | ||||||
|
| |||||||
Total Financials | 910,288,870 | |||||||
|
| |||||||
| Healthcare – 11.77% | ||||||||
AstraZeneca Plc | 505,920 | 33,888,482 | ||||||
CSL Ltd. | 347,295 | 36,858,246 | ||||||
GlaxoSmithKline Plc | 1,443,736 | 30,733,341 | ||||||
Novartis AG | 882,668 | 73,726,264 | ||||||
Novartis AG – ADR | 232,215 | 19,382,986 | ||||||
Roche Holding AG | 239,958 | 61,312,850 | ||||||
Sanofi SA | 776,755 | 74,428,797 | ||||||
Takeda Pharmaceutical Co. Ltd. | 562,400 | 28,552,472 | ||||||
Other Securities (1)(2) | 8,843,084 | 248,963,154 | ||||||
|
| |||||||
Total Healthcare | 607,846,592 | |||||||
|
| |||||||
| Shares | Value | |||||||
| Industrials – 11.72% | ||||||||
ABB Ltd. | 1,195,580 | $ | 29,675,626 | |||||
Atlas Copco AB – Class A | 986,018 | 37,914,151 | ||||||
CK Hutchison Holdings Ltd. | 2,647,500 | 33,224,922 | ||||||
East Japan Railway Co. | 384,800 | 36,862,389 | ||||||
PostNL NV | 6,382,968 | 29,787,532 | ||||||
Other Securities (1)(2) | 14,874,193 | 437,724,690 | ||||||
|
| |||||||
Total Industrials | 605,189,310 | |||||||
|
| |||||||
| Information Technology – 11.69% | ||||||||
Baidu, Inc. – ADR (1) | 244,456 | 43,723,400 | ||||||
Nokia OYJ | 4,810,990 | 29,499,742 | ||||||
Omron Corp. | 747,500 | 32,538,227 | ||||||
Samsung Electronic Co. Ltd. | 15,167 | 31,590,159 | ||||||
Taiwan Semiconductor Manufacturing Co. Ltd. | 2,291,000 | 15,652,601 | ||||||
Taiwan Semiconductor Manufacturing Co. Ltd. – ADR | 1,741,915 | 60,897,348 | ||||||
Tencent Holdings Ltd. | 1,354,116 | 48,578,858 | ||||||
Other Securities (1)(2) | 62,385,426 | 341,348,785 | ||||||
|
| |||||||
Total Information Technology |
| 603,829,120 | ||||||
|
| |||||||
| Materials – 3.20% | ||||||||
Bayer AG | 272,141 | 35,272,320 | ||||||
Novozymes A/S | 735,699 | 32,186,187 | ||||||
Other Securities (1)(2) | 5,314,327 | 97,948,989 | ||||||
|
| |||||||
Total Materials | 165,407,496 | |||||||
|
| |||||||
| Real Estate – 0.68% | ||||||||
Various Securities | 4,050,123 | 35,130,926 | ||||||
|
| |||||||
Total Real Estate | 35,130,926 | |||||||
|
| |||||||
| Telecommunication Services – 3.83% | ||||||||
Telefonica SA | 4,634,020 | 47,969,697 | ||||||
TeliaSonera AB | 6,125,485 | 28,229,855 | ||||||
Other Securities (1) | 21,745,263 | 121,646,627 | ||||||
|
| |||||||
Total Telecommunication Services |
| 197,846,179 | ||||||
|
| |||||||
| Utilities – 1.87% | ||||||||
Enel SpA | 6,515,683 | 34,946,919 | ||||||
Other Securities (1)(2) | 6,957,276 | 61,572,995 | ||||||
|
| |||||||
Total Utilities | 96,519,914 | |||||||
|
| |||||||
Total Common Stocks |
| 4,894,712,145 | ||||||
|
| |||||||
| PREFERRED STOCKS – 0.23% | ||||||||
| Consumer Discretionary – 0.22% | ||||||||
Bayer Motoren Werke AG | 873 | $ | 72,045 | |||||
Porsche Automobil Holding SE | 2,796 | 157,335 | ||||||
Schaeffler AG | 2,720 | 39,022 | ||||||
Volkswagen AG | 71,705 | 10,953,374 | ||||||
|
| |||||||
Total Consumer Discretionary | 11,221,776 | |||||||
|
| |||||||
| Consumer Staples – 0.01% | ||||||||
Henkel AG & Co. KGaA | 3,270 | 450,913 | ||||||
|
| |||||||
| Materials – 0.00% (3) | ||||||||
Fuchs Petrolub SE | 1,139 | 62,079 | ||||||
|
| |||||||
Total Preferred Stocks |
| 11,734,768 | ||||||
|
| |||||||
The accompanying notes are an integral part of these financial statements.
| Annual Report • June 30, 2017 | 41 |
Bridge Builder International Equity Fund
Summary Schedule of Investments
June 30, 2017 (Continued)
| Shares | Value | |||||||
| SHORT-TERM INVESTMENTS – 4.22% | ||||||||
| Money Market Funds – 4.22% | ||||||||
Goldman Sachs Financial Square Government Fund – Class I , 0.86% (4) | 108,847,557 | $ | 108,847,557 | |||||
JPMorgan U.S. Government Money Market Fund – Class I , 0.85% (4) | 108,847,557 | 108,847,557 | ||||||
|
| |||||||
Total Short-Term Investments |
| 217,695,114 | ||||||
|
| |||||||
| TOTAL INVESTMENTS IN SECURITIES – 99.24% (Cost: $4,686,916,551) | 5,124,142,027 | |||||||
| OTHER ASSETS IN EXCESS OF LIABILITIES – 0.76% | 39,430,933 | |||||||
|
| |||||||
| TOTAL NET ASSETS – 100.00% | $ | 5,163,572,960 | ||||||
|
| |||||||
Percentages are stated as a percent of net assets
ADR American Depositary Receipt
| (1) | Non-income producing security or includes securities that are non-income producing. |
| (2) | Includes restricted securities as defined in Rule 144(A) under the Securities Act of 1933. The value of these securities total $52,232,220, which represents 1.01% of total net assets. |
| (3) | Amount less than 0.005%. |
| (4) | Represents annualized seven-day yield as of the close of the reporting period. |
The sector classifications listed above are in accordance with Global Industry Classification Standards (GICS®), which was developed by and/or is the exclusive property of MSCI, Inc. and Standard & Poor’s Financial Services LLC (“S&P”).
COUNTRY | % of Net Assets | |||
Australia | 2.36 | % | ||
Austria | 0.01 | |||
Belgium | 0.84 | |||
Bermuda | 0.10 | |||
Brazil | 1.00 | |||
Canada | 1.09 | |||
Chile | 0.18 | |||
China | 4.59 | |||
Denmark | 2.29 | |||
Finland | 0.85 | |||
France | 7.10 | |||
Germany | 6.13 | |||
Hong Kong | 3.56 | |||
India | 1.00 | |||
Indonesia | 0.45 | |||
Ireland | 1.67 | |||
Israel | 0.03 | |||
Italy | 1.92 | |||
Japan | 16.96 | |||
Luxembourg | 0.01 | |||
Macau | 0.01 | |||
Malaysia | 0.12 | |||
Mexico | 0.68 | |||
Netherlands | 4.05 | |||
COUNTRY | % of Net Assets | |||
New Zealand | 0.01 | % | ||
Norway | 0.57 | |||
Philippines | 0.08 | |||
Portugal | 0.25 | |||
Republic of Korea | 1.71 | |||
Russia | 0.56 | |||
Singapore | 1.84 | |||
South Africa | 0.72 | |||
Spain | 3.54 | |||
Sweden | 2.12 | |||
Switzerland | 8.50 | |||
Taiwan | 1.99 | |||
Thailand | 0.61 | |||
United Kingdom | 14.07 | |||
United States | 1.45 | |||
Other (individually each country is less than 0.005%) | 0.00 | |||
|
| |||
Total Country | 95.02 | |||
|
| |||
SHORT-TERM INVESTMENTS | 4.22 | |||
|
| |||
TOTAL INVESTMENTS IN SECURITIES | 99.24 | |||
OTHER ASSETS IN EXCESS OF LIABILITIES | 0.76 | |||
|
| |||
TOTAL NET ASSETS | 100.00 | % | ||
|
| |||
The accompanying notes are an integral part of these financial statements.
| 42 | Annual Report • June 30, 2017 |
Bridge Builder Mutual Funds
Statements of Assets and Liabilities
June 30, 2017
Bridge Builder Core Bond Fund | Bridge Builder Core Plus Bond Fund | Bridge Builder Bond Fund | Bridge Builder Large Cap Growth Fund | |||||||||||||
Assets | ||||||||||||||||
Investments, at value (1) | $ | 14,376,569,726 | $ | 6,757,845,707 | $ | 2,549,866,477 | $ | 4,187,897,676 | ||||||||
Foreign currency, at value (2) | — | 256,161 | — | — | ||||||||||||
Cash | 174,687 | — | — | 2,925 | ||||||||||||
Receivable for investments sold | 309,680,185 | 90,263,677 | 1,053,880 | 6,369,517 | ||||||||||||
Receivable for fund shares sold | 37,178,952 | 41,995,960 | 21,702,706 | 25,223,706 | ||||||||||||
Receivable from Custodian | 4,972,252 | 2,260,500 | — | — | ||||||||||||
Receivable for forward foreign currency exchange contracts | — | 71,532 | — | — | ||||||||||||
Dividend and interest receivable | 68,171,026 | 33,497,807 | 28,319,424 | 3,142,603 | ||||||||||||
Tax reclaim receivable | — | 24,901 | — | 210,409 | ||||||||||||
Deposits at broker for futures contracts | — | 650,000 | — | — | ||||||||||||
Variation margin on centrally cleared swap contracts | — | 52,663 | — | — | ||||||||||||
Prepaid expenses and other assets | 191,038 | 235,181 | 62,488 | 163,608 | ||||||||||||
Total Assets | 14,796,937,866 | 6,927,154,089 | 2,601,004,975 | 4,223,010,444 | ||||||||||||
Liabilities | ||||||||||||||||
Payable for investments purchased | 1,184,822,365 | 492,468,894 | 32,076,897 | 15,343,278 | ||||||||||||
Payable for fund shares redeemed | 13,916,582 | 5,193,700 | 3,798,269 | 4,075,037 | ||||||||||||
Payable for forward foreign currency exchange transactions | — | 3,691,746 | — | — | ||||||||||||
Foreign withholding tax payable | — | 1,400 | — | — | ||||||||||||
Payable to Adviser | 1,297,909 | 753,862 | 349,184 | 803,560 | ||||||||||||
Payable to Trustees | 70,550 | 35,417 | 13,917 | 21,755 | ||||||||||||
Variation margin on futures contracts | 135,587 | 1,026,689 | — | — | ||||||||||||
Accrued expenses and other liabilities | 867,168 | 509,434 | 193,206 | 291,677 | ||||||||||||
Total Liabilities | 1,201,110,161 | 503,681,142 | 36,431,473 | 20,535,307 | ||||||||||||
Net Assets | $ | 13,595,827,705 | $ | 6,423,472,947 | $ | 2,564,573,502 | $ | 4,202,475,137 | ||||||||
Net Assets Consist of | ||||||||||||||||
Paid in capital ($0.00 par value common stock unlimited authorized shares). | $ | 13,434,933,817 | $ | 6,426,965,261 | $ | 2,554,585,819 | $ | 3,708,208,863 | ||||||||
Undistributed (distributions in excess of) net investment income | 5,252,483 | 2,397,290 | 591,688 | 19,720,284 | ||||||||||||
Accumulated net realized gain/(loss) | (34,528,635 | ) | (34,321,216 | ) | (5,091,134 | ) | (95,224,059 | ) | ||||||||
Unrealized net appreciation/(depreciation) on: | ||||||||||||||||
Investments | 188,926,296 | 33,046,230 | 14,487,129 | 569,769,081 | ||||||||||||
Foreign currency translation | — | 17,532 | — | 968 | ||||||||||||
Futures contracts | 1,243,744 | (1,020,641 | ) | — | — | |||||||||||
Forward foreign currency exchange contracts | — | (3,620,214 | ) | — | — | |||||||||||
Swap contracts | — | 8,705 | — | — | ||||||||||||
Net Assets | $ | 13,595,827,705 | $ | 6,423,472,947 | $ | 2,564,573,502 | $ | 4,202,475,137 | ||||||||
Net Assets | $ | 13,595,827,705 | $ | 6,423,472,947 | $ | 2,564,573,502 | $ | 4,202,475,137 | ||||||||
Shares Outstanding | 1,336,731,909 | 636,526,505 | 252,850,046 | 362,586,427 | ||||||||||||
Net Asset Value | $ | 10.17 | $ | 10.09 | $ | 10.14 | $ | 11.59 | ||||||||
(1) Cost of investments | $ | 14,187,643,430 | $ | 6,724,799,477 | $ | 2,535,379,348 | $ | 3,618,128,595 | ||||||||
(2) Cost of foreign currency | — | 257,843 | — | — | ||||||||||||
The accompanying notes are an integral part of these financial statements.
| Annual Report • June 30, 2017 | 43 |
Bridge Builder Mutual Funds
Statements of Assets and Liabilities
June 30, 2017 (Continued)
Bridge Builder Large Cap Value Fund | Bridge Builder Small/Mid Cap | Bridge Builder Small/Mid Cap Value Fund | Bridge Builder Equity Fund | |||||||||||||
Assets | ||||||||||||||||
Investments, at value (1) | $ | 4,991,146,961 | $ | 2,533,937,491 | $ | 3,246,649,521 | $ | 5,124,142,027 | ||||||||
Foreign currency, at value (2) | — | — | — | 2,997,471 | ||||||||||||
Cash | 118,990 | 3,531 | 92,866 | 25,711 | ||||||||||||
Receivable for investments sold | 27,420,203 | 2,358,507 | 13,903,097 | 7,327,094 | ||||||||||||
Receivable for fund shares sold | 27,485,222 | 11,631,926 | 12,174,778 | 39,508,277 | ||||||||||||
Receivable from Custodian | — | 278,038 | 100,606 | 1,028,360 | ||||||||||||
Dividend and interest receivable | 5,578,687 | 791,472 | 4,329,323 | 10,780,805 | ||||||||||||
Tax reclaim receivable | 523,073 | — | 7,415 | 6,528,313 | ||||||||||||
Prepaid expenses and other assets | 176,389 | 89,082 | 122,094 | 223,129 | ||||||||||||
Total Assets | 5,052,449,525 | 2,549,090,047 | 3,277,379,700 | 5,192,561,187 | ||||||||||||
Liabilities | ||||||||||||||||
Payable for investments purchased | 6,977,715 | 15,263,557 | 27,342,129 | 20,538,618 | ||||||||||||
Payable for fund shares redeemed | 5,045,740 | 3,037,304 | 3,497,165 | 5,537,382 | ||||||||||||
Foreign withholding tax payable | 6,070 | — | 1,091 | 851,340 | ||||||||||||
Payable to Adviser | 1,027,168 | 780,732 | 1,107,003 | 1,425,524 | ||||||||||||
Payable to Trustees | 25,833 | 10,818 | 16,778 | 26,131 | ||||||||||||
Accrued expenses and other liabilities | 364,675 | 180,215 | 250,936 | 609,232 | ||||||||||||
Total Liabilities | 13,447,201 | 19,272,626 | 32,215,102 | 28,988,227 | ||||||||||||
Net Assets | $ | 5,039,002,324 | $ | 2,529,817,421 | $ | 3,245,164,598 | $ | 5,163,572,960 | ||||||||
Net Assets Consist of | ||||||||||||||||
Paid in capital ($0.00 par value common stock unlimited authorized shares) | $ | 4,584,899,081 | $ | 2,216,232,738 | $ | 2,933,633,105 | $ | 4,702,093,123 | ||||||||
Undistributed (distributions in excess of) net investment income | 459,668 | 3,254,145 | 14,328,259 | 59,566,927 | ||||||||||||
Accumulated net realized gain/(loss) | (10,824,532 | ) | (5,413,753 | ) | (40,659,840 | ) | (35,601,956 | ) | ||||||||
Unrealized net appreciation/(depreciation) on: | ||||||||||||||||
Investments | 464,460,476 | 315,744,291 | 337,863,074 | 437,225,476 | ||||||||||||
Foreign currency translation | 7,631 | — | — | 289,390 | ||||||||||||
Net Assets | $ | 5,039,002,324 | $ | 2,529,817,421 | $ | 3,245,164,598 | $ | 5,163,572,960 | ||||||||
Net Assets | $ | 5,039,002,324 | $ | 2,529,817,421 | $ | 3,245,164,598 | $ | 5,163,572,960 | ||||||||
Shares Outstanding | 442,683,533 | 220,163,036 | 291,066,611 | 466,636,919 | ||||||||||||
Net Asset Value | $ | 11.38 | $ | 11.49 | $ | 11.15 | $ | 11.07 | ||||||||
(1) Cost of investments | $ | 4,526,686,485 | $ | 2,218,193,200 | $ | 2,908,786,447 | $ | 4,686,916,551 | ||||||||
(2) Cost of foreign currency | — | — | — | 2,997,810 | ||||||||||||
The accompanying notes are an integral part of these financial statements.
| 44 | Annual Report • June 30, 2017 |
Bridge Builder Mutual Funds
Year Ended June 30, 2017
| Bridge Builder Core Bond Fund | Bridge Builder Core Plus Bond Fund | Bridge Builder Municipal Bond Fund | Bridge Builder Large Cap Growth Fund | |||||||||||||
Investment Income | ||||||||||||||||
Dividend income | $ | 126,959 | $ | 829,805 | $ | — | $ | 43,060,451 | ||||||||
Less: Foreign taxes withheld and issuance fees | — | (9,272 | ) | — | (302,989 | ) | ||||||||||
Interest | 293,338,785 | 131,935,321 | 45,937,135 | 650,870 | ||||||||||||
Less: Foreign taxes withheld | (1,266 | ) | — | — | — | |||||||||||
Other income | 1,972,652 | 952,782 | 24,054 | — | ||||||||||||
Total investment income | 295,437,130 | 133,708,636 | 45,961,189 | 43,408,332 | ||||||||||||
Expenses | ||||||||||||||||
Investment advisory fee | 36,524,537 | 19,084,324 | 7,936,312 | 13,808,551 | ||||||||||||
Professional fees | 213,334 | 159,222 | 87,380 | 74,286 | ||||||||||||
Administration fee | 1,106,130 | 551,758 | 266,074 | 332,863 | ||||||||||||
Fund accounting fees | 1,109,185 | 360,852 | 125,963 | 36,705 | ||||||||||||
Transfer agent fees and expenses | 36,708 | 26,027 | 19,548 | 21,334 | ||||||||||||
Trustee fees and expenses | 285,173 | 150,313 | 53,353 | 77,710 | ||||||||||||
Printing and mailing expense | 109,419 | 142,938 | 12,544 | 69,738 | ||||||||||||
Custody fees | 299,803 | 156,263 | 28,632 | 101,239 | ||||||||||||
Insurance expense | 54,809 | 22,362 | 9,928 | 15,309 | ||||||||||||
Registration fees | 578,771 | 570,176 | 211,189 | 291,675 | ||||||||||||
Offering costs | — | 1,618 | 14,206 | — | ||||||||||||
Other expenses | 99,339 | 28,210 | 14,272 | 23,383 | ||||||||||||
Total expenses before fee waivers | 40,417,208 | 21,254,063 | 8,779,401 | 14,852,793 | ||||||||||||
Fee waivers by Adviser | (23,148,248 | ) | (11,580,478 | ) | (4,186,171 | ) | (6,208,575 | ) | ||||||||
Net expenses | 17,268,960 | 9,673,585 | 4,593,230 | 8,644,218 | ||||||||||||
Net Investment Income | 278,168,170 | 124,035,051 | 41,367,959 | 34,764,114 | ||||||||||||
Realized Gain/(Loss) and Change in Unrealized Appreciation/(Depreciation) |
| |||||||||||||||
Net realized gain/(loss) on: | ||||||||||||||||
Investments | 31,717,467 | (11,919,848 | ) | (5,123,432 | ) | 5,208,597 | ||||||||||
Forward foreign currency exchange contracts | — | 35,797 | — | — | ||||||||||||
Foreign currency transactions | — | (724,288 | ) | — | 2,228 | |||||||||||
Futures contracts | (1,809,397 | ) | (3,061,900 | ) | 208,462 | 31,009 | ||||||||||
Swap contracts | — | 194,437 | — | — | ||||||||||||
Net realized gain/(loss) | 29,908,070 | (15,475,802 | ) | (4,914,970 | ) | 5,241,834 | ||||||||||
Net change in unrealized appreciation/(depreciation) on: | ||||||||||||||||
Investments | (218,579,866 | ) | (39,709,082 | ) | (37,883,684 | ) | 495,975,776 | |||||||||
Forward foreign currency exchange contracts | — | (3,717,604 | ) | — | — | |||||||||||
Foreign currency transactions | — | 8,416 | — | (2,048 | ) | |||||||||||
Futures contracts | 3,009,840 | (2,409,231 | ) | 285 | (475 | ) | ||||||||||
Swap contracts | — | 24,001 | — | — | ||||||||||||
Net change in unrealized appreciation/(depreciation) | (215,570,026 | ) | (45,803,500 | ) | (37,883,399 | ) | 495,973,253 | |||||||||
Net realized gain/(loss) and net change in unrealized appreciation/(depreciation) | (185,661,956 | ) | (61,279,302 | ) | (42,798,369 | ) | 501,215,087 | |||||||||
Net Increase/(Decrease) in Net Assets Resulting from Operations | $ | 92,506,214 | $62,755,749 | $ | (1,430,410 | ) | $ | 535,979,201 | ||||||||
The accompanying notes are an integral part of these financial statements.
| Annual Report • June 30, 2017 | 45 |
Bridge Builder Mutual Funds
Statements of Operations
Year Ended June 30, 2017 (Continued)
Bridge Builder Value Fund | Bridge Builder Small/Mid Cap Growth Fund | Bridge Builder Small/Mid Cap Value Fund | Bridge Builder International Equity Fund | |||||||||||||
Investment Income | ||||||||||||||||
Dividend income | $ | 76,106,929 | $ | 15,192,366 | $ | 38,221,384 | $ | 104,359,691 | ||||||||
Less: Foreign taxes withheld and issuance fees | (830,055 | ) | (83,141 | ) | (8,069 | ) | (9,197,841 | ) | ||||||||
Interest | 812,408 | 402,717 | 408,945 | 810,571 | ||||||||||||
Other Income | — | — | — | 12,602 | ||||||||||||
Total investment income | 76,089,282 | 15,511,942 | 38,622,260 | 95,985,023 | ||||||||||||
Expenses | ||||||||||||||||
Investment advisory fee | 15,797,614 | 12,870,051 | 15,711,035 | 22,238,988 | ||||||||||||
Professional fees | 79,376 | 65,435 | 73,873 | 101,477 | ||||||||||||
Administration fee | 363,802 | 294,142 | 343,766 | 482,714 | ||||||||||||
Fund accounting fees | 25,558 | 55,765 | 66,259 | 174,777 | ||||||||||||
Transfer agent fees and expenses | 22,200 | 19,463 | 19,820 | 22,851 | ||||||||||||
Trustee fees and expenses | 92,090 | 49,233 | 63,603 | 94,138 | ||||||||||||
Printing and mailing expense | 55,870 | 79,508 | 113,938 | 153,140 | ||||||||||||
Custody fees | 129,231 | 138,514 | 230,418 | 863,864 | ||||||||||||
Insurance expense | 15,297 | 9,657 | 9,546 | 15,285 | ||||||||||||
Registration fees | 392,117 | 178,954 | 238,452 | 526,236 | ||||||||||||
Offering costs | — | — | — | 1,573 | ||||||||||||
Other expenses | 20,943 | 13,608 | 10,391 | 89,226 | ||||||||||||
Total expenses before fee waivers | 16,994,098 | 13,774,330 | 16,881,101 | 24,764,269 | ||||||||||||
Fee waivers by Adviser | (6,192,732 | ) | (5,049,641 | ) | (5,264,070 | ) | (9,361,680 | ) | ||||||||
Net expenses | 10,801,366 | 8,724,689 | 11,617,031 | 15,402,589 | ||||||||||||
Net Investment Income | 65,287,916 | 6,787,253 | 27,005,229 | 80,582,434 | ||||||||||||
Realized Gain/(Loss) and Change in Unrealized Appreciation/(Depreciation) | ||||||||||||||||
Net realized gain/(loss) on: | ||||||||||||||||
Investments | 46,291,004 | 25,125,229 | 8,735,220 | 4,003,353 | ||||||||||||
Foreign currency transactions | (92,602 | ) | — | 327 | (2,934,716 | ) | ||||||||||
Futures contracts | 106,980 | 80,483 | 91,953 | — | ||||||||||||
Net realized gain/(loss) | 46,305,382 | 25,205,712 | 8,827,500 | 1,068,637 | ||||||||||||
Net change in unrealized appreciation/(depreciation) on: | ||||||||||||||||
Investments | 450,102,925 | 328,830,965 | 341,148,286 | 600,005,967 | ||||||||||||
Foreign currency transactions | 6,793 | — | — | 355,458 | ||||||||||||
Futures contracts | (16,897 | ) | (922 | ) | (5,127 | ) | — | |||||||||
Net change in unrealized appreciation/(depreciation) | 450,092,821 | 328,830,043 | 341,143,159 | 600,361,425 | ||||||||||||
Net realized gain/(loss) and net change in unrealized appreciation/(depreciation) | 496,398,203 | 354,035,755 | 349,970,659 | 601,430,062 | ||||||||||||
Net Increase/(Decrease) in Net Assets Resulting from Operations | $ | 561,686,119 | $ | 360,823,008 | $ | 376,975,888 | $ | 682,012,496 | ||||||||
The accompanying notes are an integral part of these financial statements.
| 46 | Annual Report • June 30, 2017 |
Bridge Builder Mutual Funds
Statements of Changes in Net Assets
| Bridge Builder Core Bond Fund | Bridge Builder Core Plus Bond Fund | |||||||||||||||
| Year Ended June 30, 2017 | Year Ended June 30, 2016 | Year Ended June 30, 2017 | From July 13, 2015(1) to June 30, 2016 | |||||||||||||
Operations | ||||||||||||||||
Net investment income | $ | 278,168,170 | $ | 231,779,154 | $ | 124,035,051 | $ | 48,780,003 | ||||||||
Net realized gain/(loss) | 29,908,070 | 65,404,379 | (15,475,802 | ) | 12,600,392 | |||||||||||
Net change in unrealized appreciation/(depreciation) | (215,570,026 | ) | 334,150,897 | (45,803,500 | ) | 74,235,112 | ||||||||||
Net increase/(decrease) in net assets resulting from operations | 92,506,214 | 631,334,430 | 62,755,749 | 135,615,507 | ||||||||||||
Distributions to Shareholders | ||||||||||||||||
Net investment income | (287,012,333 | ) | (253,982,394 | ) | (130,561,739 | ) | (51,492,786 | ) | ||||||||
Net realized gains | (73,473,364 | ) | (16,924,614 | ) | (14,343,061 | ) | (5,487,024 | ) | ||||||||
Total distributions | (360,485,697 | ) | (270,907,008 | ) | (144,904,800 | ) | (56,979,810 | ) | ||||||||
Capital Transactions | ||||||||||||||||
Proceeds from shares sold | 4,592,515,464 | 3,118,058,832 | 2,675,769,459 | 4,682,322,382 | ||||||||||||
Reinvestment of dividends | 360,485,697 | 270,907,008 | 144,904,800 | 56,979,810 | ||||||||||||
Cost of shares redeemed | (1,851,399,810 | ) | (1,598,839,809 | ) | (725,478,354 | ) | (407,511,796 | ) | ||||||||
Net increase/(decrease) from capital transactions | 3,101,601,351 | 1,790,126,031 | 2,095,195,905 | 4,331,790,396 | ||||||||||||
Net increase/(decrease) in net assets | 2,833,621,868 | 2,150,553,453 | 2,013,046,854 | 4,410,426,093 | ||||||||||||
Net Assets | ||||||||||||||||
Beginning of period | 10,762,205,837 | 8,611,652,384 | 4,410,426,093 | — | ||||||||||||
End of period* | $ | 13,595,827,705 | $ | 10,762,205,837 | $ | 6,423,472,947 | $ | 4,410,426,093 | ||||||||
* Including undistributed (distribution in excess of) net investment income of: | $ | 5,252,483 | $ | (2,659,967 | ) | $ | 2,397,290 | $ | 382,475 | |||||||
Change in Shares Outstanding | ||||||||||||||||
Shares outstanding, beginning of period | 1,028,013,351 | 852,228,279 | 429,207,231 | — | ||||||||||||
Shares sold | 453,547,669 | 306,024,896 | 264,417,554 | 464,114,031 | ||||||||||||
Shares issued to holders in reinvestments of dividends | 35,651,613 | 26,574,504 | 14,481,172 | 5,681,926 | ||||||||||||
Shares redeemed | (180,480,724 | ) | (156,814,328 | ) | (71,579,452 | ) | (40,588,726 | ) | ||||||||
Shares outstanding, end of period | 1,336,731,909 | 1,028,013,351 | 636,526,505 | 429,207,231 | ||||||||||||
| (1) | Inception Date. |
The accompanying notes are an integral part of these financial statements.
| Annual Report • June 30, 2017 | 47 |
Bridge Builder Mutual Funds
Statements of Changes in Net Assets (Continued)
| Bridge Builder Municipal Bond Fund | Bridge Builder Large Cap Growth Fund | |||||||||||||||
| Year Ended June 30, 2017 | From September 14, 2015(1) to June 30, 2016 | Year Ended June 30, 2017 | Year Ended June 30, 2016 | |||||||||||||
Operations | ||||||||||||||||
Net investment income | $ | 41,367,959 | $ | 19,152,512 | $ | 34,764,114 | $ | 22,563,197 | ||||||||
Net realized gain/(loss) | (4,914,970 | ) | 2,889,375 | 5,241,834 | (96,378,262 | ) | ||||||||||
Net change in unrealized appreciation/(depreciation) | (37,883,399 | ) | 52,370,528 | 495,973,253 | 103,732,839 | |||||||||||
Net increase/(decrease) in net assets resulting from operations. | (1,430,410 | ) | 74,412,415 | 535,979,201 | 29,917,774 | |||||||||||
Distributions to Shareholders | ||||||||||||||||
Net investment income | (41,223,252 | ) | (18,710,793 | ) | (27,066,103 | ) | (13,598,060 | ) | ||||||||
Net realized gains | (2,316,920 | ) | (751,113 | ) | — | — | ||||||||||
Total distributions | (43,540,172 | ) | (19,461,906 | ) | (27,066,103 | ) | (13,598,060 | ) | ||||||||
Capital Transactions | ||||||||||||||||
Proceeds from shares sold | 958,966,674 | 2,107,230,136 | 1,877,270,140 | 392,563,854 | ||||||||||||
Reinvestment of dividends | 43,540,172 | 19,461,906 | 27,066,103 | 13,598,060 | ||||||||||||
Cost of shares redeemed | (364,922,593 | ) | (209,682,720 | ) | (533,778,981 | ) | (686,778,841 | ) | ||||||||
Net increase/(decrease) from capital transactions | 637,584,253 | 1,917,009,322 | 1,370,557,262 | (280,616,927 | ) | |||||||||||
Net increase/(decrease) in net assets | 592,613,671 | 1,971,959,831 | 1,879,470,360 | (264,297,213 | ) | |||||||||||
Net Assets | ||||||||||||||||
Beginning of period | 1,971,959,831 | — | 2,323,004,777 | 2,587,301,990 | ||||||||||||
End of period* | $ | 2,564,573,502 | $ | 1,971,959,831 | $ | 4,202,475,137 | $ | 2,323,004,777 | ||||||||
* Including undistributed (distribution in excess of) net investment income of: | $ | 591,688 | $ | 449,475 | $ | 19,720,284 | $ | 12,003,172 | ||||||||
Change in Shares Outstanding | ||||||||||||||||
Shares outstanding, beginning of period | 189,905,395 | — | 234,806,335 | 263,257,032 | ||||||||||||
Shares sold | 94,587,944 | 208,572,659 | 174,989,157 | 40,329,028 | ||||||||||||
Shares issued to holders in reinvestments of dividends | 4,338,588 | 1,909,748 | 2,630,331 | 1,381,917 | ||||||||||||
Shares redeemed | (35,981,881 | ) | (20,577,012 | ) | (49,839,396 | ) | (70,161,642 | ) | ||||||||
Shares outstanding, end of period | 252,850,046 | 189,905,395 | 362,586,427 | 234,806,335 | ||||||||||||
| (1) | Inception Date. |
The accompanying notes are an integral part of these financial statements.
| 48 | Annual Report • June 30, 2017 |
Bridge Builder Mutual Funds
Statements of Changes in Net Assets (Continued)
| Bridge Builder Large Cap Value Fund | Bridge Builder Small/Mid Cap Growth Fund | |||||||||||||||
| Year Ended June 30, 2017 | Year Ended June 30, 2016 | Year Ended June 30, 2017 | Year Ended June 30, 2016 | |||||||||||||
Operations | ||||||||||||||||
Net investment income | $ | 65,287,916 | $ | 40,088,388 | $ | 6,787,253 | $ | 5,757,322 | ||||||||
Net realized gain/(loss) | 46,305,382 | (56,729,446 | ) | 25,205,712 | (27,545,681 | ) | ||||||||||
Net change in unrealized appreciation/(depreciation) | 450,092,821 | 74,791,086 | 328,830,043 | (17,563,663 | ) | |||||||||||
Net increase/(decrease) in net assets resulting from operations | 561,686,119 | 58,150,028 | 360,823,008 | (39,352,022 | ) | |||||||||||
Distributions to Shareholders | ||||||||||||||||
Net investment income | (65,546,222 | ) | (39,341,020 | ) | (6,879,324 | ) | (3,645,669 | ) | ||||||||
Net realized gains | — | (1,055,143 | ) | — | — | |||||||||||
Total distributions | (65,546,222 | ) | (40,396,163 | ) | (6,879,324 | ) | (3,645,669 | ) | ||||||||
Capital Transactions | ||||||||||||||||
Proceeds from shares sold | 2,489,233,237 | 721,481,157 | 921,180,878 | 594,799,290 | ||||||||||||
Reinvestment of dividends | 65,546,222 | 40,396,163 | 6,879,324 | 3,645,669 | ||||||||||||
Cost of shares redeemed | (606,993,967 | ) | (334,614,371 | ) | (398,945,835 | ) | (332,938,844 | ) | ||||||||
Net increase/(decrease) from capital transactions | 1,947,785,492 | 427,262,949 | 529,114,367 | 265,506,115 | ||||||||||||
Net increase/(decrease) in net assets | 2,443,925,389 | 445,016,814 | 883,058,051 | 222,508,424 | ||||||||||||
Net Assets | ||||||||||||||||
Beginning of period | 2,595,076,935 | 2,150,060,121 | 1,646,759,370 | 1,424,250,946 | ||||||||||||
End of period* | $ | 5,039,002,324 | $ | 2,595,076,935 | $ | 2,529,817,421 | $ | 1,646,759,370 | ||||||||
* Including undistributed (distribution in excess of) net investment income of: | $ | 459,668 | $ | 808,299 | $ | 3,254,145 | $ | 3,084,927 | ||||||||
Change in Shares Outstanding | ||||||||||||||||
Shares outstanding, beginning of period | 263,234,341 | 219,174,548 | 171,165,757 | 143,016,696 | ||||||||||||
Shares sold | 230,265,286 | 74,914,480 | 86,039,542 | 63,075,409 | ||||||||||||
Shares issued to holders in reinvestments of dividends | 6,024,258 | 4,275,788 | 657,051 | 395,838 | ||||||||||||
Shares redeemed | (56,840,352 | ) | (35,130,475 | ) | (37,699,314 | ) | (35,322,186 | ) | ||||||||
Shares outstanding, end of period | 442,683,533 | 263,234,341 | 220,163,036 | 171,165,757 | ||||||||||||
The accompanying notes are an integral part of these financial statements.
| Annual Report • June 30, 2017 | 49 |
Bridge Builder Mutual Funds
Statements of Changes in Net Assets (Continued)
| Bridge Builder Small/Mid Cap Value Fund | Bridge Builder International Equity Fund | |||||||||||||||
| Year Ended June 30, 2017 | Year Ended June 30, 2016 | Year Ended June 30, 2017 | From July 6, 2015(1) to June 30, 2016 | |||||||||||||
Operations | ||||||||||||||||
Net investment income | $ | 27,005,229 | $ | 10,756,149 | $ | 80,582,434 | $ | 40,870,866 | ||||||||
Net realized gain/(loss) | 8,827,500 | (49,868,026 | ) | 1,068,637 | (38,898,238 | ) | ||||||||||
Net change in unrealized appreciation/(depreciation) | 341,143,159 | 9,329,611 | 600,361,425 | (162,846,559 | ) | |||||||||||
Net increase/(decrease) in net assets resulting from operations | 376,975,888 | (29,782,266 | ) | 682,012,496 | (160,873,931 | ) | ||||||||||
Distributions to Shareholders | ||||||||||||||||
Net investment income | (19,093,726 | ) | (4,920,447 | ) | (49,670,345 | ) | (9,875,287 | ) | ||||||||
Net realized gains | — | (620,344 | ) | — | — | |||||||||||
Total distributions | (19,093,726 | ) | (5,540,791 | ) | (49,670,345 | ) | (9,875,287 | ) | ||||||||
Capital Transactions | ||||||||||||||||
Proceeds from shares sold | 1,457,340,385 | 1,150,047,952 | 2,680,262,362 | 2,870,546,054 | ||||||||||||
Reinvestment of dividends | 19,093,726 | 5,540,791 | 49,670,345 | 9,875,287 | ||||||||||||
Cost of shares redeemed | (465,896,028 | ) | (130,656,224 | ) | (664,890,995 | ) | (243,483,026 | ) | ||||||||
Net increase/(decrease) from capital transactions | 1,010,538,083 | 1,024,932,519 | 2,065,041,712 | 2,636,938,315 | ||||||||||||
Net increase/(decrease) in net assets | 1,368,420,245 | 989,609,462 | 2,697,383,863 | 2,466,189,097 | ||||||||||||
Net Assets | ||||||||||||||||
Beginning of period | 1,876,744,353 | 887,134,891 | 2,466,189,097 | — | ||||||||||||
End of period* | $ | 3,245,164,598 | $ | 1,876,744,353 | $ | 5,163,572,960 | $ | 2,466,189,097 | ||||||||
* Including undistributed (distribution in excess of) net investment income of: | $ | 14,328,259 | $ | 7,231,980 | $ | 59,566,927 | $ | 30,408,333 | ||||||||
Change in Shares Outstanding | ||||||||||||||||
Shares outstanding, beginning of period | 197,601,525 | 89,850,507 | 261,005,845 | — | ||||||||||||
Shares sold | 135,671,957 | 121,145,000 | 265,787,026 | 285,868,889 | ||||||||||||
Shares issued to holders in reinvestments of dividends | 1,766,302 | 609,548 | 5,201,083 | 1,063,002 | ||||||||||||
Shares redeemed | (43,973,173 | ) | (14,003,530 | ) | (65,357,035 | ) | (25,926,046 | ) | ||||||||
Shares outstanding, end of period | 291,066,611 | 197,601,525 | 466,636,919 | 261,005,845 | ||||||||||||
| (1) | Inception Date. |
The accompanying notes are an integral part of these financial statements.
| 50 | Annual Report • June 30, 2017 |
[THIS PAGE INTENTIONALLY LEFT BLANK]
Bridge Builder Mutual Funds
| Per Share Operating Performance | ||||||||||||||||||||||||||||
| Change in Net Assets Resulting from Operations | Less Distributions | |||||||||||||||||||||||||||
| Net asset value, beginning of period | Net investment income | Net realized and unrealized gain/(loss) | Net increase/ (decrease) in net asset value from operations | Distributions from net investment income | Distributions from net realized gains | Total Distributions | ||||||||||||||||||||||
Bridge Builder Core Bond Fund | ||||||||||||||||||||||||||||
For the year ended June 30, 2017 | $ | 10.47 | 0.25 | (0.22 | ) | 0.03 | (0.26 | ) | (0.07 | ) | (0.33 | ) | ||||||||||||||||
For the year ended June 30, 2016 | $ | 10.10 | 0.24 | 0.41 | 0.65 | (0.26 | ) | (0.02 | ) | (0.28 | ) | |||||||||||||||||
For the year ended June 30, 2015 | $ | 10.14 | 0.24 | (0.04 | ) | 0.20 | (0.24 | ) | — | (0.24 | ) | |||||||||||||||||
For the period 10/28/13(7) - 6/30/14 | $ | 10.00 | 0.14 | 0.15 | 0.29 | (0.15 | ) | — | (0.15 | ) | ||||||||||||||||||
Bridge Builder Core Plus Bond Fund | ||||||||||||||||||||||||||||
For the year ended June 30, 2017 | $ | 10.28 | 0.24 | (0.15 | ) | 0.09 | (0.25 | ) | (0.03 | ) | (0.28 | ) | ||||||||||||||||
For the period 7/13/15(7) - 6/30/16 | $ | 10.00 | 0.22 | 0.31 | 0.53 | (0.23 | ) | (0.02 | ) | (0.25 | ) | |||||||||||||||||
Bridge Builder Municipal Bond Fund | ||||||||||||||||||||||||||||
For the year ended June 30, 2017 | $ | 10.38 | 0.19 | (0.23 | ) | (0.04 | ) | (0.19 | ) | (0.01 | ) | (0.20 | ) | |||||||||||||||
For the period 9/14/15(7) - 6/30/16 | $ | 10.00 | 0.16 | 0.38 | 0.54 | (0.15 | ) | (0.01 | ) | (0.16 | ) | |||||||||||||||||
Bridge Builder Large Cap Growth Fund | ||||||||||||||||||||||||||||
For the year ended June 30, 2017 | $ | 9.89 | 0.10 | 1.69 | 1.79 | (0.09 | ) | — | (0.09 | ) | ||||||||||||||||||
For the year ended June 30, 2016 | $ | 9.83 | 0.09 | 0.02 | 0.11 | (0.05 | ) | — | (0.05 | ) | ||||||||||||||||||
For the period 4/27/15(7) - 6/30/15 | $ | 10.00 | 0.01 | (0.18 | ) | (0.17 | ) | — | — | — | ||||||||||||||||||
Bridge Builder Large Cap Value Fund | ||||||||||||||||||||||||||||
For the year ended June 30, 2017 | $ | 9.86 | 0.18 | 1.52 | 1.70 | (0.18 | ) | — | (0.18 | ) | ||||||||||||||||||
For the year ended June 30, 2016 | $ | 9.81 | 0.17 | 0.05 | 0.22 | (0.17 | ) | 0.00 | (8) | (0.17 | ) | |||||||||||||||||
For the period 4/27/15(7) - 6/30/15 | $ | 10.00 | 0.03 | (0.19 | ) | (0.16 | ) | (0.03 | ) | — | (0.03 | ) | ||||||||||||||||
Bridge Builder Small/Mid Cap Growth Fund | ||||||||||||||||||||||||||||
For the year ended June 30, 2017 | $ | 9.62 | 0.03 | 1.88 | 1.91 | (0.04 | ) | — | (0.04 | ) | ||||||||||||||||||
For the year ended June 30, 2016 | $ | 9.96 | 0.03 | (0.35 | ) | (0.32 | ) | (0.02 | ) | — | (0.02 | ) | ||||||||||||||||
For the period 4/27/15(7) - 6/30/15 | $ | 10.00 | 0.01 | (0.05 | ) | (0.04 | ) | — | — | — | ||||||||||||||||||
Bridge Builder Small/Mid Cap Value Fund | ||||||||||||||||||||||||||||
For the year ended June 30, 2017 | $ | 9.50 | 0.11 | 1.63 | 1.74 | (0.09 | ) | — | (0.09 | ) | ||||||||||||||||||
For the year ended June 30, 2016 | $ | 9.87 | 0.08 | (0.38 | ) | (0.30 | ) | (0.06 | ) | (0.01 | ) | (0.07 | ) | |||||||||||||||
For the period 4/27/15(7) - 6/30/15 | $ | 10.00 | 0.02 | (0.15 | ) | (0.13 | ) | — | — | — | ||||||||||||||||||
Bridge Builder International Equity Fund | ||||||||||||||||||||||||||||
For the year ended June 30, 2017 | $ | 9.45 | 0.15 | 1.60 | 1.75 | (0.13 | ) | — | (0.13 | ) | ||||||||||||||||||
For the period 7/6/15(7) - 6/30/16 | $ | 10.00 | 0.16 | (0.67 | ) | (0.51 | ) | (0.04 | ) | — | (0.04 | ) | ||||||||||||||||
| (1) | Annualized for periods less than one year. |
| (2) | Total return is calculated assuming an initial investment made at the net asset value at the beginning of the period, reinvestment of all dividends and distributions at net asset value during the period and redemption on the last day of the period and is not annualized. |
| (3) | Includes adjustments in accordance with accounting principles generally accepted in the United States of America and as such, the net asset value for financial reporting purposes and the returns based upon those net asset values may differ from the net asset value and returns for shareholder transactions. |
| (4) | Ratios do not include the impact of the expenses of the underlying funds in which the fund invests. |
| (5) | Portfolio turnover is not annualized. |
| (6) | Excludes securities received in capital contribution in-kind. |
| (7) | Inception Date. |
| (8) | Less than $0.005. |
The accompanying notes are an integral part of these financial statements.
| 52 | Annual Report • June 30, 2017 |
| Ratios/Supplemental Data | ||||||||||||||||||||||||||
| Ratios to Average Net Assets of: (1) | ||||||||||||||||||||||||||
| Net asset value, end of period | Total return (2)(3) | Net assets, end of period (millions) | Expenses, | Expenses, net of waivers (4) | Net investment (loss) | Portfolio turnover rate (5) | ||||||||||||||||||||
| $ | 10.17 | 0.33 | % | $ | 13,596 | 0.35 | % | 0.15 | % | 2.44 | % | 232 | % | |||||||||||||
| $ | 10.47 | 6.51 | % | $ | 10,762 | 0.36 | % | 0.16 | % | 2.32 | % | 238 | % | |||||||||||||
| $ | 10.10 | 2.01 | % | $ | 8,612 | 0.38 | % | 0.18 | % | 2.17 | % | 115 | % | |||||||||||||
| $ | 10.14 | 2.91 | % | $ | 7,005 | 0.40 | % | 0.20 | % | 1.99 | % | 262 | %(6) | |||||||||||||
| $ | 10.09 | 0.87 | % | $ | 6,423 | 0.40 | % | 0.18 | % | 2.34 | % | 198 | % | |||||||||||||
| $ | 10.28 | 5.43 | % | $ | 4,410 | 0.43 | % | 0.23 | % | 2.23 | % | 197 | % | |||||||||||||
| $ | 10.14 | (0.36 | )% | $ | 2,565 | 0.40 | % | 0.21 | % | 1.88 | % | 23 | % | |||||||||||||
| $ | 10.38 | 5.46 | % | $ | 1,972 | 0.43 | % | 0.25 | % | 1.76 | % | 21 | % | |||||||||||||
| $ | 11.59 | 18.26 | % | $ | 4,202 | 0.47 | % | 0.28 | % | 1.11 | % | 44 | % | |||||||||||||
| $ | 9.89 | 1.14 | % | $ | 2,323 | 0.49 | % | 0.31 | % | 0.89 | % | 45 | % | |||||||||||||
| $ | 9.83 | (1.70 | )% | $ | 2,587 | 0.54 | % | 0.37 | % | 0.86 | % | 7 | % | |||||||||||||
| $ | 11.38 | 17.38 | % | $ | 5,039 | 0.47 | % | 0.30 | % | 1.82 | % | 23 | % | |||||||||||||
| $ | 9.86 | 2.35 | % | $ | 2,595 | 0.49 | % | 0.34 | % | 1.83 | % | 33 | % | |||||||||||||
| $ | 9.81 | (1.62 | )% | $ | 2,150 | 0.54 | % | 0.40 | % | 2.14 | % | 7 | % | |||||||||||||
| $ | 11.49 | 19.87 | % | $ | 2,530 | 0.68 | % | 0.43 | % | 0.34 | % | 27 | % | |||||||||||||
| $ | 9.62 | (3.16 | )% | $ | 1,647 | 0.71 | % | 0.47 | % | 0.41 | % | 49 | % | |||||||||||||
| $ | 9.96 | (0.40 | )% | $ | 1,424 | 0.77 | % | 0.49 | % | 0.51 | % | 12 | % | |||||||||||||
| $ | 11.15 | 18.33 | % | $ | 3,245 | 0.69 | % | 0.47 | % | 1.10 | % | 48 | % | |||||||||||||
| $ | 9.50 | (3.08 | )% | $ | 1,877 | 0.73 | % | 0.54 | % | 1.19 | % | 49 | % | |||||||||||||
| $ | 9.87 | (1.30 | )% | $ | 887 | 0.81 | % | 0.62 | % | 1.21 | % | 8 | % | |||||||||||||
| $ | 11.07 | 18.78 | % | $ | 5,164 | 0.67 | % | 0.42 | % | 2.17 | % | 22 | % | |||||||||||||
| $ | 9.45 | (5.06 | )% | $ | 2,466 | 0.69 | % | 0.46 | % | 1.99 | % | 18 | % | |||||||||||||
The accompanying notes are an integral part of these financial statements.
| Annual Report • June 30, 2017 | 53 |
Bridge Builder Mutual Funds
1. ORGANIZATION
The Bridge Builder Trust (the “Trust”) is a Delaware statutory trust organized under the laws of the State of Delaware on December 19, 2012, and is registered with the Securities and Exchange Commission (the “SEC”) as an open-end management investment company under the Investment Company Act of 1940, as amended (the “1940 Act”). As of June 30, 2017, the Trust consisted of nine series, of which the eight active series identified below are presented in this report (each a “Fund,” and collectively, the “Funds”). The one remaining series is inactive and currently not available for purchase.
Olive Street Investment Advisers, LLC (the “Adviser”) acts as investment adviser to the Funds.
| Fund | Investment Objective | |
| Bridge Builder Core Bond Fund (“Core Bond Fund”) | To provide total return (capital appreciation plus income) | |
| Bridge Builder Core Plus Bond Fund (“Core Plus Bond Fund”) | To provide total return (capital appreciation plus income) | |
| Bridge Builder Municipal Bond Fund (“Municipal Bond Fund”) | To provide current income exempt from federal tax, with a secondary goal of preservation of investment principal | |
| Bridge Builder Large Cap Growth Fund (“Large Cap Growth Fund”) | To provide capital appreciation | |
| Bridge Builder Large Cap Value Fund (“Large Cap Value Fund”) | To provide capital appreciation | |
| Bridge Builder Small/Mid Cap Growth Fund (“Small/Mid Cap Growth Fund”) | To provide capital appreciation | |
| Bridge Builder Small/Mid Cap Value Fund (“Small/Mid Cap Value Fund”) | To provide capital appreciation | |
| Bridge Builder International Equity Fund (“International Equity Fund”) | To provide capital appreciation |
The Funds are diversified and each currently offer a single class of shares. The Funds are available for investment exclusively through Edward Jones Advisory Solutions®.
2. SIGNIFICANT ACCOUNTING POLICIES
The following is a summary of significant accounting policies consistently followed by the Trust in the preparation of its financial statements. These policies are in conformity with generally accepted accounting principles (“GAAP”) in the United States of America.
a) Use of Estimates – The presentation of financial statements in conformity with GAAP requires management to make estimates and assumptions that affect the reported amounts of assets and liabilities at the date of the financial statements and the reported amounts of revenues and expenses during the reporting period. Actual results could differ from those estimates and assumptions.
b) Investment Valuation – All securities and other investments are recorded at their estimated fair value, as described in Note 4.
c) Federal Income Taxes – Each Fund is treated as a separate taxable entity for Federal income tax purposes. The Funds intend to comply with the requirements of Subchapter M of the Internal Revenue Code of 1986, as amended (the “Internal Revenue Code”), applicable to regulated investment companies and to distribute substantially all of their net investment income and capital gains to shareholders. As a result, no provision for Federal income tax is recorded in the financial statements.
The Adviser has reviewed the Funds’ tax positions for all open tax years (the prior three years of tax filings or since inception, if shorter, are considered open for examination) and has concluded that there is no tax liability/benefit resulting from uncertain income tax positions taken or expected to be taken in future tax returns. The Funds are also not aware of any tax position for which it is reasonably possible that the total amounts of unrecognized tax expense will significantly change in the next twelve months.
| 54 | Annual Report • June 30, 2017 |
Bridge Builder Mutual Funds
Notes to Financial Statements (Continued)
As of June 30, 2017, the Funds had no tax examinations or audits in progress.
d) Distributions to Shareholders – Distributions to shareholders are recorded on the ex-dividend date. Distributions of net investment income for the Core Bond, Core Plus Bond and Municipal Bond Funds are generally declared daily and paid monthly. The Large Cap Value Fund will generally declare and pay distributions of net investment income quarterly. The Large Cap Growth, Small/Mid Cap Growth, Small/Mid Cap Value and International Equity Funds will generally declare and pay distributions of net investment income annually, as necessary. Realized capital gains, if any, are distributed by each Fund at least annually, as necessary. The amount and timing of distributions are determined in accordance with Federal income tax regulations, which may differ from GAAP. To the extent these “book/tax” differences are permanent in nature, these amounts are reclassified within the capital accounts in the financial statements to reflect their tax character.
e) Indemnifications – In the normal course of business, the Trust may enter into contracts with service providers that contain general indemnification clauses. The Trust’s maximum exposure under these arrangements is unknown, as this would involve future claims against the Trust that have not yet occurred.
f) Investment Transactions, Income and Expense Allocation – Investment transactions are recorded on trade date. Securities gains and losses, net of foreign taxes withheld, if any, are calculated on the basis of identified cost. Dividend income (expense), net of foreign taxes withheld, if any, is recognized on ex-dividend date except in the case of foreign securities, in which case dividends are recorded as soon as the information becomes available, which may be after the published ex-dividend date. Issuance fees, if any, are custodial fees on American Depositary Receipts (ADRs) charged by ADR agents on ADR Dividends and are recorded when paid. Interest income is recognized on an accrual basis, while discounts and premiums on securities purchased are amortized or accreted, respectively, using the constant yield method over the life of the security. Expenses common to multiple Funds are allocated among the respective Funds based upon their relative net asset values or other reasonable allocation methods.
g) Foreign Currency Translation and Transactions – The books and records of the Funds are maintained in U.S. dollars. The Funds’ assets and liabilities in foreign currencies are translated into U.S. dollars at the prevailing exchange rate on the valuation date. Transactions denominated in foreign currencies are translated into U.S. dollars at the prevailing exchange rate on the date of the transaction. The Funds’ income earned and expense incurred in foreign denominated currencies are translated into U.S. dollars at the prevailing exchange rate on the date of such activity.
The Funds do not isolate that portion of the results of operations arising from changes in the foreign exchange rates on investments and derivatives from the fluctuations that result from changes in the market prices of investments and derivatives held or sold during the period. Accordingly, such foreign currency gains (losses) are included in the reported net realized gain (loss) on investments in securities and derivatives and net change in unrealized appreciation (depreciation) on investment securities and derivatives on the Statements of Operations.
h) Offering and Organizational Costs – Offering costs, including professional fees, printing fees and the offering of the initial registration statement are accounted for as deferred costs until operations begin and are then amortized over a period of twelve months. Organizational costs, if any, are expensed as incurred.
3. SECURITIES AND OTHER INVESTMENTS
a) Delayed Delivery Securities – Certain Funds may enter into contracts to purchase mortgage securities for a fixed price at a future date beyond customary settlement time if the Fund sets aside on its books liquid assets in an amount sufficient to meet the purchase price, or if the Fund enters into offsetting contracts for the forward sale of other securities it owns. In the case of delayed delivery mortgage purchase commitments, the unit price and the estimated principal amount are established when the Fund enters into a contract, with the actual principal amount being within a specified range of the estimate. For these obligations, the Fund will earmark liquid assets in an amount sufficient to cover its obligations. Forward commitments may be considered securities in themselves, and
| Annual Report • June 30, 2017 | 55 |
Bridge Builder Mutual Funds
Notes to Financial Statements (Continued)
involve a risk of loss if the value of the security to be purchased declines prior to the settlement date. This risk is in addition to the risk of decline in the value of the Fund’s other assets. Where such purchases are made through dealers, the Fund relies on the dealer to consummate the sale. The dealer’s failure to do so may result in a loss to the Fund of an advantageous yield or price. Although the Fund will generally enter into forward commitments with the intention of acquiring securities for its portfolio, the Fund may dispose of a commitment prior to settlement if it deems it appropriate to do so.
A Fund may enter into delayed delivery sale commitments to hedge its portfolio positions or to sell securities it owns under delayed delivery arrangements. Proceeds of the sale commitments are not received until the contractual settlement date. Unsettled sale commitments are valued at current market value of the underlying securities. If the sale commitment is closed through the acquisition of an offsetting purchase commitment, the Fund realizes a gain or loss on the commitment without regard to any unrealized appreciation/(depreciation) on the underlying security. If the Fund delivers securities under the commitment, the Fund realizes a gain or loss from the sale of the securities based upon the unit price established at the date the commitment was entered into.
b) Derivatives – The Funds invest in derivatives as permitted by their investment objectives and policies. Derivatives are financial instruments whose value is based on the value of another underlying asset, interest rate, index or financial instrument.
Futures Contracts – Certain Funds may enter into futures contracts, which are agreements between two parties to buy or sell a specified underlying instrument for a fixed price on a specified future date. The Funds buy and sell futures contracts to gain or hedge exposure to certain risk factors. Upon entering into a futures contract, the Funds are required to deposit with the broker cash or securities, which are referred to as initial margin. Securities deposited as initial margin are designated on the Summary Schedule of Investments, and cash deposited is recorded as Deposits at broker for futures on the Statements of Assets and Liabilities. Exchange traded futures are marked to market daily based on the price movement of the contract. This change in value creates either a payable or receivable for the Fund as either more or less margin is required by the clearing agent. This change in value, known as variation margin, is moved daily between the Fund and its counterparty. A change in the market value of an open futures contracts is recorded as unrealized appreciation/(depreciation) until the contract is closed. When a contract is closed, the Fund will record a realized gain or loss equal to the difference between the proceeds of the closing transaction and the Fund’s basis in the contracts. Futures contracts outstanding at period end, if any, are listed within each Fund’s Summary Schedule of Investments.
Forward Foreign Currency Exchange Contracts – Certain Funds buy and sell forward foreign currency exchange contracts, which are agreements between two parties to buy and sell currencies at a set price on a future date. These contracts are used to protect against a decline in value relative to the U.S. dollar of the currencies in which portfolio securities are denominated or quoted (or an increase in the value of a currency in which securities that a Fund intends to buy are denominated, when a Fund holds cash reserves and short term investments), or for other investment purposes. The market value of the contract will fluctuate with changes in currency exchange rates. The contract is marked to market daily and the change in market value is recorded as unrealized appreciation/(depreciation). When the contract is closed in its foreign currency, the Funds record a realized gain or loss equal to the difference between the value of the contract at the time it was opened and the value at the time it was closed. Non-deliverable forward foreign currency exchange contracts are settled with the counterparty in U.S. dollars without the delivery of foreign currency. The Funds could be exposed to risk if the value of the currency changes unfavorably, if the counterparties to the contracts are unable to meet the terms of their contracts or if the Funds are unable to enter into a closing position. Forward foreign currency exchange contracts outstanding at period end, if any, are listed within each Fund’s Summary Schedule of Investments.
Repurchase Agreements – In a repurchase agreement, a fund buys a security from another party (the counterparty), usually a financial institution, with the agreement that it be sold back in the future. Repurchase agreements subject a fund to counterparty risk, meaning that the fund could lose money if the other party fails to perform under the
| 56 | Annual Report • June 30, 2017 |
Bridge Builder Mutual Funds
Notes to Financial Statements (Continued)
terms of the agreement. A Fund mitigates this risk by ensuring that the Fund’s repurchase agreements are collateralized by cash and/or U.S. government securities. All collateral is held by a Fund’s custodian (or, with multi-party agreements, the agent’s bank) and is monitored daily to ensure that its market value is at least equal to the repurchase price under the agreement. In the event of a default by the counterparty, realization of the collateral proceeds could be delayed or limited and the value of the collateral may decline. Investments in repurchase agreements are also based on a review of the credit quality of the repurchase agreement counterparty. Certain Funds may enter into repurchase agreements in which eligible securities are transferred into joint trading accounts maintained by the custodian or sub-custodian under a triparty agreement for investment companies and other clients advised by the Sub-adviser (as defined below) and its affiliates. A Fund may participate on a pro rata basis with the other investment companies and clients in its share of the securities transferred under such repurchase agreements and in its share of proceeds from any repurchase or other disposition of such securities. Repurchase agreements are subject to Master Netting Agreements, which are agreements between a Fund and its counterparties that provide for the net settlement of all transactions and collateral with the Fund through a single payment, in the event of default or termination. Amounts presented on the Summary Schedule of Investments are gross settlement amounts.
Swap Agreements – Certain Funds may invest in swap agreements. Swap agreements are bilaterally negotiated agreements between a Fund and a counterparty to exchange or swap investment cash flows, assets, or market-linked returns at specified, future intervals. Swap agreements may be privately negotiated in the over the counter market (“OTC Swaps”) or may be cleared through a third-party, known as a central counterparty or derivatives clearing organization (“Centrally Cleared Swaps”). A Fund may enter into credit default, interest rate and total return swap agreements to manage its exposure to credit, interest rate and equity risk. Securities or cash may be used as collateral or margin in accordance with the terms of the swap agreement in order to provide assets in the event of a default or bankruptcy.
Centrally Cleared Swaps are marked to market daily and the change, if any, is recorded as swap variation margin on the Statements of Assets and Liabilities. OTC Swaps are marked to market daily and the change, if any, is included in the OTC Swap Contracts, at Value line item on the Statements of Assets and Liabilities. Both OTC and Centrally Cleared Swaps show this component as change in unrealized appreciation/(depreciation) on the Statements of Operations. Swap variation margin is accounted for as unrealized appreciation/(depreciation) until the contract is closed, at which time the gains or losses are realized. Upfront premiums received/(paid) represent cash payments made upon the opening of the swap agreement to compensate for differences between the stated terms of the contract and the current market value contract. These upfront payments are recorded as assets/(liabilities) and are included within the market value of the swap contract. Upon liquidation or termination of the swap agreement, these payments are recorded as realized gain/(loss) on the Statements of Operations. Net periodic payments received/(paid) by the Fund are also included in the realized gain/(loss) on swap contracts on the Statements of Operations. Swap contracts outstanding, including their respective notional amounts at period end, if any, are listed within each Fund’s Summary Schedule of Investments.
Interest Rate Swaps – Certain Funds may enter into interest rate swap contracts to manage fund exposure to interest rates or to either preserve or generate a return on a particular investment or portion of its portfolio. These are agreements between counterparties to exchange periodic interest payments based on interest rates. One cash flow stream will typically be a floating rate payment based upon a specified interest rate while the other is typically a fixed interest rate.
Credit Default Swap Contracts – Certain Funds may enter into credit default swap contracts to provide a measure of protection against risk of loss following a default, or other credit event in respect of issuers within an underlying index or a single issuer, or to gain credit exposure to an underlying index or issuer. In a credit default swap contract, the protection buyer typically makes an up-front payment and a periodic stream of payments to the protection seller,
| Annual Report • June 30, 2017 | 57 |
Bridge Builder Mutual Funds
Notes to Financial Statements (Continued)
in exchange for the right to receive a contingent payment upon the occurrence of a credit event on the reference obligation or other equally ranked obligations of the reference entity. As a seller of protection on a credit default swap contract, the Fund will generally receive from the protection buyer a fixed rate of income throughout the term of the swap provided there is no credit event. Credit events are contract specific but may include bankruptcy, failure to pay, restructuring and obligation acceleration. Upon the occurrence of a credit event, the difference between the par value and market value of the reference obligation, net of any proportional amount of the up-front payment, is recorded as a realized gain or loss.
Implied credit spreads are used to determine the value of credit default swap contracts and reflect the cost of buying/selling protection, which may include up-front payments made to enter into the contract. Therefore, higher spreads indicate a greater likelihood that a seller will be obligated to perform (i.e. make payment) under the swap contract. Implied credit spreads for credit default swaps on credit indexes are linked to the weighted average spread across the underlying reference obligations included in a particular index.
Risks of loss may exceed amounts recognized on the Summary Schedule of Investments. A Fund’s maximum risk of loss from counterparty risk, either as the protection seller or as the protection buyer, is the fair value of the contract. This risk may be mitigated by having a master netting arrangement between the specific Fund and the counterparty. Where a Fund is a seller of protection, the maximum potential amount of future payments the Fund may be required to make is equal to the notional amount of the relevant credit default contract. The Fund’s risk of loss associated with these instruments may exceed their value, as recorded in the Summary Schedule of Investments.
c) Loan Participation, Assignments and Unfunded Commitments – Certain Funds invest in loan participations and assignments. When one of the Funds purchases a loan participation, the Fund typically enters into a contractual relationship with the lender or a third party selling such participations (“Selling Participant”), but not the borrower. In this case, the Fund assumes the credit risk of the borrower and the Selling Participant and any other persons inter-positioned between the Fund and the borrower (“Intermediate Participants”). In contrast, when one of the Funds purchases an assignment, the contractual relationship is with the borrower and the credit risk assumed by the Fund is only with the borrower. Although certain loan participations or assignments are secured by collateral, the Fund could experience delays or limitations in realizing such collateral or have its interest subordinated to other indebtedness of the obligor.
The Funds may also enter into unfunded loan commitments, which are contractual obligations for future funding. These unfunded commitments represent a future obligation in full, even though a percentage of the loan may not be utilized by the borrower. These types of investments may include standby financing commitments, such as revolving credit facilities, which obligate the Fund to supply additional cash to the borrower on demand. The value of the unfunded portion of the investment is determined using pro-rata allocation, based on its par value relative to the par value of the entire investment. The unfunded loan commitments are marked daily and any unrealized appreciation (depreciation) from unfunded commitments is reported in the Statements of Assets and Liabilities as well as the Statements of Operations. When investing in loan participations, the Fund has the right to receive payments of principal, interest and any fees to which it is entitled only from the lender selling the loan participation and only upon receipt of payments by the lender from the borrower. The Fund may receive a commitment fee based on the undrawn portion of the underlying line of credit portion of the loan. In certain circumstances, the Fund may receive a penalty fee upon the prepayment of a loan by a borrower. Fees earned or paid are recorded as a component of interest income or interest expense, respectively, on the Statements of Operations. In addition, loan participations and assignments are vulnerable to market conditions such that economic conditions or other events may reduce the demand for loan participations and assignments and certain loan participations and assignments which were liquid, when purchased, may become illiquid.
d) Restricted Securities – The Funds may own investment securities that are unregistered and thus restricted as to resale. These securities are valued after giving due consideration to pertinent factors, including recent private sales, market conditions and the issuer’s financial performance. Where future disposition of these securities requires
| 58 | Annual Report • June 30, 2017 |
Bridge Builder Mutual Funds
Notes to Financial Statements (Continued)
registration under the Securities Act of 1933, a Fund may have the right to include these securities in such registration, generally without cost to the Fund. A Fund generally has no right to require registration of the unregistered securities it holds. All restricted securities held at June 30, 2017 met the definition of Rule 144A of the Securities Act of 1933 and can be traded with an institutional investor without registration. The Adviser has determined the following Funds’ June 30, 2017 restricted securities to be liquid and illiquid pursuant to the Funds’ illiquid and restricted securities guidelines:
| Restricted Securities | ||||||||
Fund | Illiquid | Liquid | ||||||
Core Bond Fund | $ | 34,043,990 | $ | 1,900,728,931 | ||||
Core Plus Bond Fund | 13,966,986 | 1,096,256,775 | ||||||
Municipal Bond Fund | 5,990,966 | 40,549,921 | ||||||
International Equity Fund | — | 52,232,220 | ||||||
4. INVESTMENT VALUATION AND FAIR VALUE MEASUREMENTS
a) Investment Valuation Policies – The Net Asset Value (“NAV”) of the Funds’ shares are generally valued as of the close of the regular trading on the New York Stock Exchange (“NYSE”), normally 4:00 p.m. Eastern time, on each day the NYSE is open. The NAV per share of each Fund is computed by dividing the total net assets of the Fund by the total number of shares outstanding. For purposes of calculating the NAV, portfolio securities and derivative instruments are valued using valuation methods adopted by the Trust’s Board of Trustees (“Board”).
The Board has delegated responsibility for applying approved valuation policies to the Adviser. The Adviser monitors the continual appropriateness of valuation methods applied and determines if adjustments should be made in light of market factor changes and events affecting issuers. The Adviser performs a series of activities to provide reasonable assurance of the accuracy of the prices utilized including: periodic vendor due diligence meetings and reviewing the results of back testing on a monthly basis. The Adviser provides the Board with reporting on the results of the back testing as well as positions which were fair valued during the period.
The Board has established a Valuation Committee whose function is to monitor the valuation of portfolio securities and derivative instruments and determine in good faith the fair value of the Funds’ holdings after considering all relevant factors. The Valuation Committee is generally responsible for overseeing the day-to-day valuation processes and is authorized to make all necessary determinations to fair value the portfolio securities and other assets for which market quotations are not readily available or if it is deemed that the prices obtained from brokers, dealers or independent pricing services are unreliable.
Additionally, the Board has adopted valuation procedures that allow for the use of fair value pricing in appropriate circumstances. For example, such circumstances may arise when trading in a security has been halted or suspended, when a security has been delisted from a national exchange, when a security has not been traded for an extended period of time, or when a significant event with respect to a security occurs after the close of the market or exchange on which the security principally trades and before the time a Fund calculates its own share price. If there is no price, or in the Adviser’s determination the price provided for a security by an independent pricing agent or broker does not represent fair value, then the security will be fair valued. Thinly traded securities and certain foreign securities may be impacted more by the use of fair valuations than other securities. In using fair value pricing, a Fund attempts to establish the price that it might reasonably have expected to receive upon a sale of the security at 4:00 p.m. Eastern time. Valuing securities at fair value involves greater reliance on judgment than valuation of securities based on readily available market quotations. When using fair value to price securities, a Fund may value those securities higher or lower than another fund using market quotations or fair value to price the same securities. Further, there can be no assurance that the Fund could obtain the fair value assigned to a security if it were to sell the security at approximately the same time at which the Fund determines its net asset value.
| Annual Report • June 30, 2017 | 59 |
Bridge Builder Mutual Funds
Notes to Financial Statements (Continued)
b) Fair Value Hierarchy – The Funds have performed an analysis of all existing investments to determine the significance and character of all inputs to their fair value determination. Various inputs are used in determining the value of each Fund’s investments. These inputs are summarized in the following three broad categories:
| • | Level 1 – Fair value measurement within Level 1 should be based on a quoted price in an active market that the Funds have the ability to access for the asset or liability at the measurement date. Because a quoted price alone forms the basis for the measurement, the access requirement within Level 1 limits discretion in pricing the asset or liability, including in situations in which there are multiple markets for the asset or liability with different prices and no single market represents a principal market for the asset or liability. Importantly, the Financial Accounting Standards Board (FASB) has indicated that when a quoted price in an active market for a security is available, that price should be used to measure fair value without regard to an entity’s intent to transact at that price. |
| • | Level 2 – Fair value measurement within Level 2 should be based on all inputs other than quoted prices included within Level 1 that are observable for the asset or liability. Other significant observable market inputs include quoted prices for similar instruments in active markets, quoted adjusted prices in active markets, quoted prices for identical or similar instruments in markets that are not active, and model-derived valuations in which the majority of significant inputs and significant value drivers are observable in active markets. |
| • | Level 3 – Fair value measurement within Level 3 should be based on unobservable inputs in such cases where markets don’t exist or are illiquid. Significant unobservable inputs include model derived valuations in which the majority of significant inputs or significant value drivers are unobservable. Unobservable inputs are those inputs that reflect the Fund’s own assumptions that market participants would use to price the asset or liability based on the best available information. |
c) Valuation Techniques – Fixed-income securities, including corporate, convertible and municipal bonds and notes, U.S. government agencies, U.S. Treasury obligations, sovereign issues, bank loans, convertible preferred securities and non-U.S. bonds (other than short-term securities) are valued using that day’s bid price provided by an independent pricing service. Fixed-income securities are normally valued on the basis of quotes obtained from independent pricing services in accordance with procedures adopted by the Board. Independent pricing services typically use information provided by market makers or estimates of market values obtained from yields and other relevant data relating to investments or securities with similar characteristics. The independent pricing service’s internal models use inputs that are observable such as, among other things, issuer details, interest rates, yield curves, prepayment speeds, trade information, market color, credit risks/spreads, default rates and quoted prices for similar assets and the securities’ terms and conditions. Securities that use similar valuation techniques and inputs as described above are generally categorized as Level 2 of the fair value hierarchy.
Mortgage- and asset-backed securities are usually issued as separate tranches, or classes, of securities within each package of underlying securities. These securities are also normally valued by pricing service providers that use broker-dealer quotations or valuation estimates from their internal pricing models. The pricing models for these securities usually consider tranche level attributes, estimated cash flows and market-based yield spreads for each tranche and current market data and packaged collateral performance, as available. Mortgage- and asset-backed securities that use such valuation techniques and inputs are typically categorized as Level 2.
Short-term securities with 60 days or less remaining to maturity when acquired by a Fund are generally valued on an amortized cost basis, which approximates fair value. These securities are typically categorized as Level 2 in the fair value hierarchy.
Equity securities traded on a national securities exchange are valued at the last reported sale price at the close of regular trading on each day the exchange is open for trading. Securities listed on the NASDAQ National Market System for which market quotations are readily available are valued using the NASDAQ Official Closing Price. These valuations are typically categorized as Level 1 in the fair value hierarchy. Securities traded on an exchange for which
| 60 | Annual Report • June 30, 2017 |
Bridge Builder Mutual Funds
Notes to Financial Statements (Continued)
there have been no sales are valued at the mean between the last bid and ask price on such day. Securities and financial instruments for which prices are not available from an independent pricing service may be valued using market quotations obtained from one or more dealers that make markets in the respective securities in accordance with procedures adopted by the Board and are classified as Level 2 or Level 3 depending on the observability of inputs.
Certain vendor-priced securities may also be considered Level 3 if significant unobservable inputs are used by the vendors.
Foreign securities, currencies and other assets denominated in currencies other than U.S. dollars are translated to dollars using exchange rates obtained from independent pricing services. All assets denominated in foreign currencies are converted to U.S. dollars using the applicable currency exchange rates as of the close of the NYSE, generally 4:00 p.m. Eastern time.
Valuation adjustments may be applied to certain common and preferred stocks that are solely traded on a foreign exchange to account for the market movement between the close of the foreign market and the close of the NYSE. These securities are generally valued using pricing service providers that consider the correlation of the trading patterns of the foreign securities to the intraday trading in the U.S. markets for investments. Securities using these valuation adjustments are categorized as Level 2 of the fair value hierarchy.
Open-ended mutual funds (including money market funds) are valued at the end of the day’s net asset value and are categorized as Level 1 of the fair value hierarchy.
Exchange traded financial derivative instruments, such as futures contracts or options contracts that are traded on a national securities or commodities exchange, are valued at the last reported sales or settlement price. To the extent these securities are actively traded and valuation adjustments are not applied, they are categorized as Level 1 of the fair value hierarchy. If there was no sale activity, the financial derivative is valued at the mean between the highest bid and lowest ask price on the relevant exchange closest to the close of the NYSE and are classified as Level 2.
OTC derivatives, including forward foreign currency exchange contracts and swap contracts, are fair valued by the Funds on a daily basis using observable inputs, such as quotations provided by an independent pricing service, the counterparty, dealers or brokers, whenever available and considered reliable.
The U.S. Dollar value of forward foreign currency exchange contracts is determined using current forward currency exchange rates supplied by an independent pricing service.
Centrally cleared credit default swap contracts and interest rate swap contracts are marked to market daily based on quotations as provided by an independent pricing service. The independent pricing services aggregate valuation information from various market participants to create a single reference value for each credit default swap contract and interest rate swap contract.
The Funds value the repurchase agreements they have entered based on the respective contract amounts, which approximate fair value. As such, repurchase agreements are carried at the amount of cash paid plus accrued interest receivable (or interest payable in periods of increased demand for collateral).
| Annual Report • June 30, 2017 | 61 |
Bridge Builder Mutual Funds
Notes to Financial Statements (Continued)
Quantitative Information
The following tables represent each Fund’s valuation inputs as presented in the Summary Schedule of Investments.
Core Bond Fund
| Level 1 | Level 2 | Level 3 | Total | |||||||||||||
Assets | ||||||||||||||||
Asset-Backed Obligations | $ | — | $ | 1,314,550,118 | $ | 82,742,230 | $ | 1,397,292,348 | ||||||||
Corporate Bonds | ||||||||||||||||
Basic Materials | — | 190,689,263 | — | 190,689,263 | ||||||||||||
Communications | — | 325,205,476 | — | 325,205,476 | ||||||||||||
Consumer Cyclical | — | 256,242,452 | 6,121,492 | 262,363,944 | ||||||||||||
Consumer Non-cyclical | — | 574,146,298 | — | 574,146,298 | ||||||||||||
Diversified | — | 8,560,548 | — | 8,560,548 | ||||||||||||
Energy | — | 446,422,063 | — | 446,422,063 | ||||||||||||
Financials | — | 1,596,260,476 | 178,168 | 1,596,438,644 | ||||||||||||
Industrials | — | 240,466,197 | — | 240,466,197 | ||||||||||||
Real Estate | — | 9,769,998 | — | 9,769,998 | ||||||||||||
Technology | — | 204,527,729 | — | 204,527,729 | ||||||||||||
Utilities | — | 312,983,779 | — | 312,983,779 | ||||||||||||
Government Related | — | 3,190,575,759 | — | 3,190,575,759 | ||||||||||||
Mortgage-Backed Obligations | — | 4,478,568,692 | 38,743,148 | 4,517,311,840 | ||||||||||||
Preferred Stocks | ||||||||||||||||
Financials | 2,605,850 | — | — | 2,605,850 | ||||||||||||
Short-Term Investments | ||||||||||||||||
Money Market Funds | 1,096,219,519 | — | — | 1,096,219,519 | ||||||||||||
U.S. Treasury Bills | — | 990,471 | — | 990,471 | ||||||||||||
Futures Contracts (1) | 2,262,187 | — | — | 2,262,187 | ||||||||||||
Total Assets | $ | 1,101,087,556 | $ | 13,149,959,319 | $ | 127,785,038 | $ | 14,378,831,913 | ||||||||
Liabilities | ||||||||||||||||
Futures Contracts (1) | $ | 1,018,443 | $ | — | $ | — | $ | 1,018,443 | ||||||||
Total Liabilities | $ | 1,018,443 | $ | — | $ | — | $ | 1,018,443 | ||||||||
| 62 | Annual Report • June 30, 2017 |
Bridge Builder Mutual Funds
Notes to Financial Statements (Continued)
| Core Plus Bond Fund | ||||||||||||||||
| Level 1 | Level 2 | Level 3 | Total | |||||||||||||
Assets | ||||||||||||||||
Asset-Backed Obligations | $ | — | $ | 844,830,821 | $ | 28,107,932 | $ | 872,938,753 | ||||||||
Bank Loans | — | 144,819,392 | 491,804 | 145,311,196 | ||||||||||||
Corporate Bonds | ||||||||||||||||
Basic Materials | — | 57,993,847 | — | 57,993,847 | ||||||||||||
Communications | — | 239,157,592 | — | 239,157,592 | ||||||||||||
Consumer, Cyclical | — | 196,408,250 | 11,303,473 | 207,711,723 | ||||||||||||
Consumer, Non-cyclical | — | 335,175,463 | 3,612,419 | 338,787,882 | ||||||||||||
Diversified | — | 2,617,525 | — | 2,617,525 | ||||||||||||
Energy | — | 183,599,757 | — | 183,599,757 | ||||||||||||
Financials | — | 845,815,918 | — | 845,815,918 | ||||||||||||
Industrials | — | 119,143,306 | — | 119,143,306 | ||||||||||||
Real Estate | — | 44,559,857 | — | 44,559,857 | ||||||||||||
Technology | — | 123,601,537 | — | 123,601,537 | ||||||||||||
Utilities | — | 137,377,314 | — | 137,377,314 | ||||||||||||
Government Related | — | 1,399,793,019 | — | 1,399,793,019 | ||||||||||||
Mortgage-Backed Obligations | — | 1,522,162,818 | 19,172,650 | 1,541,335,468 | ||||||||||||
Preferred Stocks | ||||||||||||||||
Consumer, Non-cyclical | 1,780,590 | — | — | 1,780,590 | ||||||||||||
Financials | 2,780,270 | — | — | 2,780,270 | ||||||||||||
Short-Term Investments | ||||||||||||||||
Certificate of Deposit | — | 2,944,692 | — | 2,944,692 | ||||||||||||
Commercial Paper | — | 4,620,636 | — | 4,620,636 | ||||||||||||
Repurchase Agreements | — | 63,000,000 | — | 63,000,000 | ||||||||||||
Money Market Funds | 420,938,379 | — | — | 420,938,379 | ||||||||||||
U.S. Treasury Bills | — | 2,036,446 | — | 2,036,446 | ||||||||||||
Futures Contracts (1) | 858,227 | — | — | 858,227 | ||||||||||||
Forward Foreign Currency Exchange Contracts (1) | — | 1,615,870 | — | 1,615,870 | ||||||||||||
Swap Contracts (1) | — | 8,705 | — | 8,705 | ||||||||||||
Total Assets | $ | 426,357,466 | $ | 6,271,282,765 | $ | 62,688,278 | $ | 6,760,328,509 | ||||||||
Liabilities | ||||||||||||||||
Futures Contracts (1) | $ | 1,878,868 | $ | — | $ | — | $ | 1,878,868 | ||||||||
Forward Foreign Currency Exchange Contracts (1) | — | 5,236,084 | — | 5,236,084 | ||||||||||||
Total Liabilities | $ | 1,878,868 | $ | 5,236,084 | $ | — | $ | 7,114,952 | ||||||||
| Municipal Bond Fund | ||||||||||||||||
| Level 1 | Level 2 | Level 3 | Total | |||||||||||||
Assets | ||||||||||||||||
Municipal Bonds | ||||||||||||||||
Education | $ | — | $ | 328,676,416 | $ | — | $ | 328,676,416 | ||||||||
General Obligation | — | 606,855,584 | — | 606,855,584 | ||||||||||||
General Revenue | — | 539,581,665 | 8,631,381 | 548,213,046 | ||||||||||||
Healthcare | — | 370,224,998 | 11,674,636 | 381,899,634 | ||||||||||||
Housing | — | 66,346,944 | — | 66,346,944 | ||||||||||||
Transportation | — | 305,896,977 | 602,948 | 306,499,925 | ||||||||||||
Utilities | — | 216,060,214 | — | 216,060,214 | ||||||||||||
Short-Term Investments | 95,314,714 | — | — | 95,314,714 | ||||||||||||
Total Assets | $ | 95,314,714 | $ | 2,433,642,798 | $ | 20,908,965 | $ | 2,549,866,477 | ||||||||
| Annual Report • June 30, 2017 | 63 |
Bridge Builder Mutual Funds
Notes to Financial Statements (Continued)
| Large Cap Growth Fund | ||||||||||||||||
| Level 1 | Level 2 | Level 3 | Total | |||||||||||||
Assets | ||||||||||||||||
Common Stocks | ||||||||||||||||
Consumer Discretionary | $ | 674,067,214 | $ | 12,419,404 | $ | — | $ | 686,486,618 | ||||||||
Consumer Staples | 265,089,762 | — | — | 265,089,762 | ||||||||||||
Energy | 181,127,184 | — | — | 181,127,184 | ||||||||||||
Financials | 282,642,951 | — | — | 282,642,951 | ||||||||||||
Healthcare | 579,048,484 | — | — | 579,048,484 | ||||||||||||
Industrials | 432,418,143 | — | — | 432,418,143 | ||||||||||||
Information Technology | 1,424,257,932 | — | — | 1,424,257,932 | ||||||||||||
Materials | 71,072,242 | — | — | 71,072,242 | ||||||||||||
Real Estate | 46,878,224 | — | — | 46,878,224 | ||||||||||||
Telecommunication Services | 38,290,352 | — | — | 38,290,352 | ||||||||||||
Utilities | 36,059 | — | — | 36,059 | ||||||||||||
Short-Term Investments | 180,549,725 | — | — | 180,549,725 | ||||||||||||
Total Assets | $ | 4,175,478,272 | $ | 12,419,404 | $ | — | $ | 4,187,897,676 | ||||||||
| Large Cap Value Fund | ||||||||||||||||
| Level 1 | Level 2 | Level 3 | Total | |||||||||||||
Assets | ||||||||||||||||
Common Stocks | ||||||||||||||||
Consumer Discretionary | $ | 602,683,912 | $ | 40,729,798 | $ | — | $ | 643,413,710 | ||||||||
Consumer Staples | 398,767,404 | — | — | 398,767,404 | ||||||||||||
Energy | 431,222,571 | — | — | 431,222,571 | ||||||||||||
Financials | 1,001,928,293 | — | — | 1,001,928,293 | ||||||||||||
Healthcare | 693,867,886 | — | — | 693,867,886 | ||||||||||||
Industrials | 533,762,287 | — | — | 533,762,287 | ||||||||||||
Information Technology | 546,975,499 | 32,121,279 | — | 579,096,778 | ||||||||||||
Materials | 369,939,176 | — | — | 369,939,176 | ||||||||||||
Real Estate | 84,135,426 | — | — | 84,135,426 | ||||||||||||
Telecommunication Services | 34,366,672 | — | — | 34,366,672 | ||||||||||||
Utilities | 30,239,360 | — | — | 30,239,360 | ||||||||||||
Short-Term Investments | 190,407,398 | — | — | 190,407,398 | ||||||||||||
Total Assets | $ | 4,918,295,884 | $ | 72,851,077 | $ | — | $ | 4,991,146,961 | ||||||||
| Small/Mid Cap Growth Fund | ||||||||||||||||
| Level 1 | Level 2 | Level 3 | Total | |||||||||||||
Assets | ||||||||||||||||
Common Stocks | ||||||||||||||||
Consumer Discretionary | $ | 283,062,946 | $ | — | $ | — | $ | 283,062,946 | ||||||||
Consumer Staples | 173,903,404 | — | — | 173,903,404 | ||||||||||||
Energy | 55,167,724 | — | — | 55,167,724 | ||||||||||||
Financials | 244,017,042 | — | — | 244,017,042 | ||||||||||||
Healthcare | 510,704,923 | — | — | 510,704,923 | ||||||||||||
Industrials | 384,838,730 | — | — | 384,838,730 | ||||||||||||
Information Technology | 580,013,448 | — | — | 580,013,448 | ||||||||||||
Materials | 109,310,538 | — | — | 109,310,538 | ||||||||||||
Real Estate | 67,178,060 | — | — | 67,178,060 | ||||||||||||
Telecommunication Services | 5,866,317 | — | — | 5,866,317 | ||||||||||||
Utilities | 5,648,598 | — | — | 5,648,598 | ||||||||||||
Rights | ||||||||||||||||
Healthcare | — | — | 57,056 | 57,056 | ||||||||||||
Short-Term Investments | 114,168,705 | — | — | 114,168,705 | ||||||||||||
Total Assets | $ | 2,533,880,435 | $ | — | $ | 57,056 | $ | 2,533,937,491 | ||||||||
| 64 | Annual Report • June 30, 2017 |
Bridge Builder Mutual Funds
Notes to Financial Statements (Continued)
| Small/Mid Cap Value Fund | ||||||||||||||||
| Level 1 | Level 2 | Level 3 | Total | |||||||||||||
Assets | ||||||||||||||||
Common Stocks | ||||||||||||||||
Consumer Discretionary | $ | 370,121,586 | $ | — | $ | — | $ | 370,121,586 | ||||||||
Consumer Staples | 63,874,059 | — | — | 63,874,059 | ||||||||||||
Energy | 189,329,853 | — | — | 189,329,853 | ||||||||||||
Financials | 759,770,180 | — | 34,135 | (2) | 759,804,315 | |||||||||||
Healthcare | 179,690,716 | — | — | 179,690,716 | ||||||||||||
Industrials | 501,486,649 | — | — | 501,486,649 | ||||||||||||
Information Technology | 451,152,083 | — | — | 451,152,083 | ||||||||||||
Materials | 216,193,573 | — | — | 216,193,573 | ||||||||||||
Real Estate | 255,908,068 | — | — | 255,908,068 | ||||||||||||
Telecommunication Services | 8,521,717 | — | — | 8,521,717 | ||||||||||||
Utilities | 143,824,886 | — | — | 143,824,886 | ||||||||||||
Short-Term Investments | 106,742,016 | — | — | 106,742,016 | ||||||||||||
Total Assets | $ | 3,246,615,386 | $ | — | $ | 34,135 | $ | 3,246,649,521 | ||||||||
| International Equity Fund | ||||||||||||||||
| Level 1 | Level 2 | Level 3 | Total | |||||||||||||
Assets | ||||||||||||||||
Common Stocks | ||||||||||||||||
Consumer Discretionary | $ | 83,828,808 | $ | 669,960,387 | $ | — | $ | 753,789,195 | ||||||||
Consumer Staples | 93,177,899 | 537,849,990 | — | 631,027,889 | ||||||||||||
Energy | 46,219,645 | 241,617,009 | — | 287,836,654 | ||||||||||||
Financials | 68,112,987 | 842,175,883 | — | 910,288,870 | ||||||||||||
Healthcare | 111,477,185 | 496,369,407 | — | 607,846,592 | ||||||||||||
Industrials | 33,926,788 | 571,262,522 | — | 605,189,310 | ||||||||||||
Information Technology | 209,608,048 | 394,221,072 | — | 603,829,120 | ||||||||||||
Materials | 11,162,664 | 154,244,832 | — | 165,407,496 | ||||||||||||
Real Estate | 90,191 | 35,040,735 | — | 35,130,926 | ||||||||||||
Telecommunication Services | 7,633,879 | 190,212,300 | — | 197,846,179 | ||||||||||||
Utilities | 28,479 | 96,491,435 | — | 96,519,914 | ||||||||||||
Preferred Stocks | ||||||||||||||||
Consumer Discretionary | — | 11,221,776 | — | 11,221,776 | ||||||||||||
Consumer Staples | — | 450,913 | — | 450,913 | ||||||||||||
Materials | — | 62,079 | — | 62,079 | ||||||||||||
Short-Term Investments | 217,695,114 | — | — | 217,695,114 | ||||||||||||
Total Assets | $ | 882,961,687 | $ | 4,241,180,340 | $ | — | $ | 5,124,142,027 | ||||||||
| (1) | Derivative instruments, including futures and forward foreign currency exchange contracts are reported at the cumulative unrealized appreciation/(depreciation) of the instrument within the Funds’ Summary Schedule of Investments. Interest rate swaps are reported at value. Only current day’s variation margin is reported within the Statements of Assets and Liabilities for exchange-traded and cleared derivatives. |
| (2) | Includes a security valued at $0. |
| Annual Report • June 30, 2017 | 65 |
Bridge Builder Mutual Funds
Notes to Financial Statements (Continued)
The Funds recognize all transfers at the end of the reporting period. Transfers from Level 1 and Level 2 to Level 3 are generally due to a decline in market activity which resulted in a lack of or fewer observable market inputs used to determine price or the removal of a fair value valuation adjustment. Transfers from Level 3 to Level 2 are generally the result of increased observable market activity, resulting in an increase in the number of observable inputs used to determine price.
Below are the transfers between levels for the Core Bond, Core Plus Bond, Municipal Bond and International Equity Funds during the reporting period from July 1, 2016 to June 30, 2017. There were no transfers between levels for the Large Cap Growth, Large Cap Value, Small/Mid Cap Growth and Small/Mid Cap Value Funds during the reporting period ended June 30, 2017.
| Core Bond Fund | Core Plus Bond Fund | Municipal Bond Fund | International Equity Fund | |||||||||||||
Transfers into Level 1 (1) | $ | — | $ | — | $ | — | $ | 223,040 | ||||||||
Transfers out of Level 1 (2) | — | — | — | (17,704,762 | ) | |||||||||||
|
|
|
|
|
|
|
| |||||||||
Net transfers out of Level 1 | $ | — | $ | — | $ | — | $ | (17,481,722 | ) | |||||||
|
|
|
|
|
|
|
| |||||||||
Transfers into Level 2 (1)(2) | $ | 32,130,438 | $ | 12,004,044 | $ | 3,499,895 | $ | 17,704,762 | ||||||||
Transfers out of Level 2 (1)(2) | (10,878,400 | ) | (11,287,146 | ) | (2,657,078 | ) | (223,040 | ) | ||||||||
|
|
|
|
|
|
|
| |||||||||
Net transfers into Level 2 | $ | 21,252,038 | $ | 716,898 | $ | 842,817 | $ | 17,481,722 | ||||||||
|
|
|
|
|
|
|
| |||||||||
Transfers into Level 3 (2) | $ | 10,878,400 | $ | 11,287,146 | $ | 2,657,078 | $ | — | ||||||||
Transfers out of Level 3 (1) | (32,130,438 | ) | (12,004,044 | ) | (3,499,895 | ) | — | |||||||||
|
|
|
|
|
|
|
| |||||||||
Net transfers into/(out of) Level 3 | $ | (21,252,038 | ) | $ | (716,898 | ) | $ | (842,817 | ) | $ | — | |||||
|
|
|
|
|
|
|
| |||||||||
| (1) | Securities transferred from Level 3 to Level 2 and Level 2 to Level 1 were the result of additional market data being obtained and observed or the removal of a fair value valuation adjustment. |
| (2) | Securities transferred from Level 1 to Level 2 and Level 2 to Level 3 because of the application of a fair value valuation adjustment or the lack of observable market data. |
The Core Bond, Core Plus Bond, Municipal Bond, Small/Mid Cap Growth and Small/Mid Cap Value Funds all held Level 3 securities at the end of the period. In the aggregate, securities classified as Level 3 in the Small/Mid Cap Growth and Small/Mid Cap Value Funds have been deemed immaterial.
Below is a roll forward which details the activity of securities in Level 3 during the period ended June 30, 2017:
| Core Bond Fund | Core Plus Bond Fund | Municipal Bond Fund | ||||||||||
Beginning Balance – June 30, 2016 | $ | 89,805,226 | $ | 20,768,569 | $ | 7,663,325 | ||||||
Purchases | 100,645,730 | 47,299,595 | 28,310,013 | |||||||||
Sales proceeds and paydowns | (43,089,298 | ) | (4,974,354 | ) | (14,306,949 | ) | ||||||
Transfers into Level 3 | 10,878,400 | 11,287,146 | 2,657,078 | |||||||||
Transfer out of Level 3 | (32,130,438 | ) | (12,004,044 | ) | (3,499,895 | ) | ||||||
Realized gains/(losses), net | 131,072 | (12,026 | ) | — | ||||||||
Change in unrealized gains/(losses), net | 1,544,346 | 323,392 | 85,393 | |||||||||
|
|
|
|
|
| |||||||
Ending Balance – June 30, 2017 | $ | 127,785,038 | $ | 62,688,278 | $ | 20,908,965 | ||||||
|
|
|
|
|
| |||||||
The realized and unrealized gains/(losses) from Level 3 transactions are included with the net realized gain/(loss) on investments and net change in unrealized appreciation/(depreciation) on investments on the Statements of Operations, respectively. The net change in unrealized appreciation/(depreciation) on investments related to Level 3 securities held by the Core Bond, Core Plus Bond and Municipal Bond Funds at June 30, 2017 total $599,313, $(355,847) and $(65,943), respectively.
The following provides a general description of the impact of a change in an unobservable input on the fair value measurement and the interrelationship of unobservable inputs, where relevant and significant. Interrelationships may also exist between observable and unobservable inputs (for example, as interest rates rise, prepayment rates decline).
| 66 | Annual Report • June 30, 2017 |
Bridge Builder Mutual Funds
Notes to Financial Statements (Continued)
Significant unobservable inputs used by the third-party pricing vendors and broker-dealers generally include prepayment rates, interest rates, probability of default and loss severity in the event of default. Significant increases/(decreases) in any of those inputs in isolation could result in a significantly lower (higher) fair value measurement. Generally, a change in the assumption used for the probability of default is accompanied by a directionally similar change in the assumption used for the loss severity and a directionally opposite change in the assumption used for prepayment rates.
Additionally, third-party pricing vendors and broker-dealers could use market activity related to comparable securities to supplement the inputs noted above. Usually, an increase/(decrease) in the price of a comparable bond would result in a higher (lower) fair value measurement.
The following tables present information about unobservable inputs related to the Funds’ categories of Level 3 investments as of June 30, 2017:
Quantitative Information about Level 3 Fair Value Measurements*
Core Bond Fund
| Investment Type | Fair Value at 6/30/17 | Valuation Methodology | Unobservable Inputs | Input Value/Range | Weighted Average | |||||||||
Asset-Backed Obligations | $ | 27,969,534 | Discounted Cash Flow | Internal Rate of Return | 2.36%-7.80% | 3.29 | % | |||||||
| Life expectancy (in months) | 10.44-16.44 | 11.25 | ||||||||||||
Corporate Bonds | $ | 6,121,492 | Discounted Cash Flow | Internal Rate of Return | 3.68% | 3.68 | % | |||||||
Mortgage-Backed Obligations | $ | 1,640,351 | Discounted Cash Flow | Internal Rate of Return | 1.46%-6.19% | 6.19 | % | |||||||
| Life expectancy (in months) | 0.60-7.20 | 7.20 | ||||||||||||
Asset-Backed Obligations | $ | 8,425,274 | Market activity | Recent transaction | $100.00 | $ | 100.00 | |||||||
Corporate Bonds | $ | 178,168 | Market activity | Recent transaction | $100.00 | $ | 100.00 | |||||||
Mortgage-Backed Obligations | $ | 34,420,360 | Market activity | Recent transaction | $10.34-$100.31 | $ | 96.01 | |||||||
Core Plus Bond Fund
| Investment Type | Fair Value at 6/30/17 | Valuation Methodology | Unobservable Inputs | Input Value/Range | Weighted Average | |||||||||
Asset-Backed Obligations | $ | 7,792,719 | Discounted Cash Flow | Internal Rate of Return | 4.13%-4.58% | 4.40 | % | |||||||
| Life expectancy (in months) | 20.88-30.12 | 24.60 | ||||||||||||
Bank Loans | $ | 491,804 | Discounted Cash Flow | Internal Rate of Return | 5.37% | 5.37 | % | |||||||
Corporate Bonds | $ | 14,915,892 | Discounted Cash Flow | Internal Rate of Return | 2.90%-4.60% | 3.63 | % | |||||||
Mortgage-Backed Obligations | $ | 2,272,650 | Discounted Cash Flow | Internal Rate of Return | 9.44% | 9.44 | % | |||||||
| Life expectancy (in months) | 60.36 | 60.36 | ||||||||||||
Asset-Backed Obligations | $ | 1,585,000 | Market activity | Recent transaction | $100.00 | $ | 100.00 | |||||||
Mortgage-Backed Obligations | $ | 16,900,000 | Market activity | Recent transaction | $100.00 | $ | 100.00 | |||||||
Municipal Bond Fund
| Investment Type | Fair Value at 6/30/17 | Valuation Methodology | Unobservable Inputs | Input Value/Range | Weighted Average | |||||||||
Municipal Bonds | $ | 20,908,965 | Discounted Cash Flow | Internal Rate of Return | 2.45%-6.19% | 3.86 | % | |||||||
* The tables above do not include Level 3 securities that are valued using a single broker’s quote. At June 30, 2017, the value of these securities was $49,029,859, $18,730,213, and $0 for the Core Bond, Core Plus Bond
| Annual Report • June 30, 2017 | 67 |
Bridge Builder Mutual Funds
Notes to Financial Statements (Continued)
and Municipal Bond Funds, respectively. The inputs for these securities are not readily available or cannot be reasonably estimated and are generally those inputs described in this Note 4. The appropriateness of fair values for these securities is monitored on an ongoing basis which may include results of back testing, results of pricing vendor and/or broker due diligence, unchanged price review and consideration of macro or security specific events.
5. DERIVATIVE INSTRUMENTS
Certain Funds use derivative instruments as part of their principal investment strategy to achieve their stated investment objective. The Funds’ derivative contracts held at period end are not accounted for as hedging instruments under GAAP. For financial reporting purposes, the Funds do not offset derivative assets and derivative liabilities across derivative types that are subject to master netting arrangements in the Statements of Assets and Liabilities. There were no financial instruments subject to a netting agreement for which the Funds are not currently netting.
The following table lists the fair value of derivative instruments held by the Funds, by primary underlying risk and contract type, as included in the Statements of Assets and Liabilities* at period end.
| Assets | Liabilities | |||||||||||||||||||||||
| Unrealized Appreciation on Futures Contracts* | Swaps at Value* | Unrealized Appreciation on Forward Foreign Currency Exchange Contracts | Unrealized Depreciation on Futures Contracts* | Swaps at Value* | Unrealized on Forward | |||||||||||||||||||
Interest Rate Risk: | ||||||||||||||||||||||||
Core Bond Fund | $ | 2,262,187 | $ | — | $ | — | $ | (1,018,443 | ) | $ | — | $ | — | |||||||||||
Core Plus Bond Fund | 858,227 | 8,705 | — | (1,878,868 | ) | — | — | |||||||||||||||||
Foreign Exchange Risk: | ||||||||||||||||||||||||
Core Plus Bond Fund | — | — | 1,615,870 | — | — | (5,236,084 | ) | |||||||||||||||||
| * | May include cumulative unrealized appreciation/(depreciation) as reported on the Summary Schedule of Investments. Only current day’s variation margin is reported on the Statements of Assets and Liabilities for exchange traded derivatives. |
The following table lists the effect of derivative instruments held by the Funds, by primary underlying risk and contract type, on the Statements of Operations for the period ended June 30, 2017.
| Realized Gain/(Loss) on Derivatives recognized as a result of Operations | Net Change in Unrealized Appreciation/(Depreciation) on Derivatives recognized as a result of Operations | |||||||||||||||||||||||
| Futures Contracts | Forward Foreign Currency Exchange Contracts | Swaps | Futures Contracts | Forward Foreign Currency Exchange Contracts | Swaps | |||||||||||||||||||
Interest Rate Risk: | ||||||||||||||||||||||||
Core Bond Fund | $ | (1,809,397 | ) | $ | — | $ | — | $ | 3,009,840 | $ | — | $ | — | |||||||||||
Core Plus Bond Fund | (3,061,900 | ) | — | — | (2,409,231 | ) | — | 8,705 | ||||||||||||||||
Municipal Bond Fund | 208,462 | — | — | 285 | — | — | ||||||||||||||||||
Equity Risk: | ||||||||||||||||||||||||
Large Cap Growth Fund | 31,009 | — | — | (475 | ) | — | — | |||||||||||||||||
Large Cap Value Fund | 106,980 | — | — | (16,897 | ) | — | — | |||||||||||||||||
Small/Mid Cap Growth Fund | 80,483 | — | — | (922 | ) | — | — | |||||||||||||||||
Small/Mid Cap Value Fund | 91,953 | — | — | (5,127 | ) | — | — | |||||||||||||||||
Foreign Exchange Risk: | ||||||||||||||||||||||||
Core Plus Bond Fund | — | 35,797 | — | — | (3,717,604 | ) | — | |||||||||||||||||
Credit Risk: | ||||||||||||||||||||||||
Core Plus Bond Fund | — | — | 194,437 | — | — | 15,296 | ||||||||||||||||||
| 68 | Annual Report • June 30, 2017 |
Bridge Builder Mutual Funds
Notes to Financial Statements (Continued)
The following tables present the Funds’ gross OTC derivative assets and liabilities by counterparty and contract type, net of amounts available for offset under a master netting agreement and the related collateral received or pledged by the Funds as of June 30, 2017:
| Core Plus Bond Fund | ||||||||||||||||||||||||||
Investment | Gross Amounts of | Gross Amounts | Net Amounts | Gross Amounts not offset in the Statements of Assets & Liabilities | ||||||||||||||||||||||
| Counterparty | Financial Instruments | Collateral (Pledged)/ Received | Net Amount | |||||||||||||||||||||||
Canadian Imperial Bank of Commerce | Forward Foreign Currency Exchange Contracts | $ | 72,335 | $ | (803 | ) | $ | 71,532 | $ | — | $ | — | $ | 71,532 | ||||||||||||
J.P. Morgan | Forward Foreign Currency Exchange Contracts | 210,586 | (210,586 | ) | — | — | — | — | ||||||||||||||||||
Morgan Stanley | Forward Foreign Currency Exchange Contracts | 1,332,949 | (1,332,949 | ) | — | — | — | — | ||||||||||||||||||
Total Financial Instruments Subject to a Master Netting Arrangement or Similar Arrangement | 1,615,870 | (1,544,338 | ) | 71,532 | — | — | 71,532 | |||||||||||||||||||
| Annual Report • June 30, 2017 | 69 |
Bridge Builder Mutual Funds
Notes to Financial Statements (Continued)
| Gross Amounts not offset in the Statements of Assets & Liabilities | ||||||||||||||||||||||||||
| Counterparty | Investment Type | Gross Amounts of Recognized Liabilities | Gross Amounts Offset in the Statements of Assets & Liabilities | Net Amounts Presented in the Statements of Assets & Liabilities | Financial Instruments | Collateral (Pledged)/ Received | Net Amount | |||||||||||||||||||
Canadian Imperial Bank of Commerce | Forward Foreign Currency Exchange Contracts | $ | 803 | $ | (803 | ) | $ | — | $ | — | $ | — | $ | — | ||||||||||||
Citigroup Global Markets | Forward Foreign Currency Exchange Contracts | 67,477 | — | 67,477 | — | — | 67,477 | |||||||||||||||||||
Deutsche Bank | Forward Foreign Currency Exchange Contracts | 1,195 | — | 1,195 | — | — | 1,195 | |||||||||||||||||||
HSBC | Forward Foreign Currency Exchange Contracts | 126,117 | — | 126,117 | — | — | 126,117 | |||||||||||||||||||
J.P. Morgan | Forward Foreign Currency Exchange Contracts | 788,621 | (210,586 | ) | 578,035 | — | — | 578,035 | ||||||||||||||||||
Morgan Stanley | Forward Foreign Currency Exchange Contracts | 4,190,529 | (1,332,949 | ) | 2,857,580 | — | — | 2,857,580 | ||||||||||||||||||
Royal Bank of Canada | Forward Foreign Currency Exchange Contracts | 61,342 | — | 61,342 | — | — | 61,342 | |||||||||||||||||||
Total Financial Instruments Subject to a Master Netting Arrangement or Similar Arrangement | 5,236,084 | (1,544,338 | ) | 3,691,746 | — | — | 3,691,746 | |||||||||||||||||||
The Funds’ average monthly notional amount of derivatives during the period ended June 30, 2017 were as follows:
| Average Monthly Notional Amount of: | ||||||||||||||||
| Purchased Futures | Sold Futures | Swaps | Forward Foreign Currency Exchange Contracts | |||||||||||||
Core Bond Fund | $ | 518,143,090 | $ | (133,674,232 | ) | $ | — | $ | — | |||||||
Core Plus Bond Fund | 358,250,651 | (77,394,094 | ) | 7,633,266 | 47,559,809 | |||||||||||
Municipal Bond Fund | 587,196 | — | — | — | ||||||||||||
Large Cap Growth Fund | 169,380 | — | — | — | ||||||||||||
Large Cap Value Fund | 333,674 | — | — | — | ||||||||||||
Small/Mid Cap Growth Fund | 564,115 | — | — | — | ||||||||||||
Small/Mid Cap Value Fund | 229,709 | — | — | — | ||||||||||||
| 70 | Annual Report • June 30, 2017 |
Bridge Builder Mutual Funds
Notes to Financial Statements (Continued)
6. FEES AND OTHER TRANSACTIONS WITH AFFILIATES
The Adviser acts as investment adviser to the Funds pursuant to an investment advisory agreement (the “Advisory Agreement”) with the Trust. The Adviser is a wholly owned subsidiary of The Jones Financial Companies, L.L.L.P. Under the Advisory Agreement, the Adviser furnishes, at its own expense, all services, facilities and personnel necessary in connection with managing the Funds’ investments.
The Adviser provides the Trust with such investment research, advice and investment supervision as the Trust may from time to time consider necessary for the proper management of the assets of the Funds, and furnishes continuously an investment program for the Funds. In fulfilling this obligation, the Adviser, among other things, recommends the hiring and termination of, and monitors the ongoing performance of, one or more investment advisers (the “Sub-advisers”) and allocates Fund assets among the Sub-advisers.
In consideration of the services provided by the Adviser pursuant to the Advisory Agreement, the Funds pay the Adviser an investment advisory fee at an annual rate based on a percentage of each Fund’s average daily net assets. In an effort to pass along lower fund expenses to shareholders, the Adviser does not retain any portion of the advisory fees. The Adviser has contractually agreed to waive its advisory fees for each Fund to the extent advisory fees paid to the Adviser exceed the aggregate advisory fees the Fund is required to pay each Sub-adviser. The annual advisory fee and amounts of advisory fees waived by the Adviser during the period ended June 30, 2017 are noted in the table below:
Fund | Annual Advisory Fee | Advisory Fees Waived by Adviser | ||||||
Core Bond Fund | 0.32 | % | $ | (23,148,248 | ) | |||
Core Plus Bond Fund | 0.36 | (11,580,478 | ) | |||||
Municipal Bond Fund | 0.36 | (4,186,171 | ) | |||||
Large Cap Growth Fund | 0.44 | (6,208,575 | ) | |||||
Large Cap Value Fund | 0.44 | (6,192,732 | ) | |||||
Small/Mid Cap Growth Fund | 0.64 | (5,049,641 | ) | |||||
Small/Mid Cap Value Fund | 0.64 | (5,264,070 | ) | |||||
International Equity Fund | 0.60 | (9,361,680 | ) | |||||
None of the advisory fees waived by the Adviser pursuant to the agreement described above are subject to recoupment by the Adviser.
The Adviser has selected and the Board has approved the following Sub-advisers to sub-advise discrete portions of each of the Fund’s assets:
| Fund | Sub-advisers | |
| Core Bond Fund | Robert W. Baird & Co., Inc. J.P. Morgan Investment Management, Inc. Loomis, Sayles & Company, L.P. PGIM, Inc. | |
| Core Plus Bond Fund | Pacific Investment Management Company LLC Loomis Sayles & Company, L.P. Metropolitan West Asset Management, LLC T. Rowe Price Associates, Inc. | |
| Municipal Bond Fund | FIAM, LLC T. Rowe Price Associates, Inc. Wells Capital Management, Inc. | |
| Large Cap Growth Fund | Lazard Asset Management LLC Sustainable Growth Advisers, LP Jennison Associates LLC William Blair Investment Management, LLC BlackRock Investment Management, LLC |
| Annual Report • June 30, 2017 | 71 |
Bridge Builder Mutual Funds
Notes to Financial Statements (Continued)
| Fund | Sub-advisers | |
| Large Cap Value Fund | Barrow, Hanley, Mewhinney & Strauss, LLC Wellington Management Company LLP Artisan Partners Limited Partnership BlackRock Investment Management, LLC | |
| Small/Mid Cap Growth Fund | Champlain Investment Partners, LLC ClearBridge Investments, LLC Eagle Asset Management, Inc. Stephens Investment Management Group, LLC BlackRock Investment Management, LLC | |
| Small/Mid Cap Value Fund | Boston Partners Global Investors, Inc. Vaughan Nelson Investment Management, L.P. Silvercrest Asset Management Group LLC Advisory Research, Inc. BlackRock Investment Management, LLC LSV Asset Management | |
| International Equity Fund | Baillie Gifford Overseas Limited Edinburgh Partners Limited Manning & Napier Advisors, LLC Mondrian Investment Partners Limited WCM Investment Management BlackRock Investment Management, LLC Pzena Investment Management, LLC |
Subject to the supervision of the Adviser, the Sub-advisers provide the Funds, among other services, a continuous investment program and determine from time to time which securities or other investments shall be purchased, sold or exchanged for the Funds, including providing or obtaining such services as may be necessary in managing, acquiring or disposing of securities, cash or other investments. For their services as Sub-advisers to the Funds, each Sub-adviser is entitled to receive fees directly from each Fund it serves.
Pursuant to an operating expense limitation agreement between the Adviser and the Funds, effective until October 28, 2017, the Adviser has contractually agreed to reduce its fees and/or pay Fund expenses (excluding acquired fund fees and expenses, portfolio transaction expenses, interest expense in connection with investment activities, taxes and non-routine expenses) to limit total annual fund operating expenses after fee waivers and/or expense reimbursements to each of the amounts listed below (each an “Expense Cap”).
| Fund | Expense Cap | |
| Core Bond Fund | 0.48% | |
| Core Plus Bond Fund | 0.42 | |
| Municipal Bond Fund | 0.48 | |
| Large Cap Growth Fund | 0.51 | |
| Large Cap Value Fund | 0.51 | |
| Small/Mid Cap Growth Fund | 0.73 | |
| Small/Mid Cap Value Fund | 0.73 | |
| International Equity Fund | 0.67 |
The Trust has agreed to repay the expense reimbursement to the Adviser. However, the repayment of previously waived expenses is limited to amounts that do not cause the aggregate operating expenses of the Fund to exceed the current expense cap or the expense cap in place at the time the waiver was generated. The Adviser has up to three fiscal years from the time the expenses were reimbursed to request reimbursement from a Fund. During the period ended June 30, 2017, the Funds did not exceed the Expense Cap, and there are no expense reimbursements currently available for recoupment in future periods.
Administrator – U.S. Bancorp Fund Services, LLC (“USBFS”) acts as the Trust’s administrator (the “Administrator”) pursuant to an administration agreement. USBFS provides certain administrative services to the Trust, including,
| 72 | Annual Report • June 30, 2017 |
Bridge Builder Mutual Funds
Notes to Financial Statements (Continued)
among other responsibilities, fund accounting and certain compliance services. For these services, the Funds pay the administrator monthly, a fee accrued daily and based on average daily net assets. The Funds may also reimburse the Administrator for such out-of-pocket expenses as incurred by the Administrator in the performance of its duties. The amounts paid directly to the Administrator by the Funds for administrative services are included in the Administration Fee in the Statements of Operations.
Custodian – U.S. Bank National Association is the custodian (the “Custodian”) for the Trust in accordance with a custodian agreement. Custodian fees are paid monthly and based on assets held in custody, investment purchases and sales activity and account maintenance fees, plus reimbursement for certain out-of-pocket expenses. The amounts paid directly to the Custodian by the Funds for custody services are included in Custody fees in the Statements of Operations.
Trustees – Trustee fees and expenses displayed in the Statements of Operations include amounts accrued by the Funds to pay remuneration to each Trustee who is not an “interested person” as defined by the 1940 Act (an “Independent Trustee”) of the Trust. The Trustees who are not Independent Trustees of the Trust are not compensated by the Trust.
Affiliated Transactions – The Funds may participate in purchase and sale transactions with other funds or accounts that have a common investment adviser (or sub-adviser), commonly referred to as “cross trades.” These cross trades are executed in accordance with procedures adopted by the Trust’s Board and comply with Rule 17a-7 of the 1940 Act, which require, among other things, that such cross trades be effected at the independent current market price of the security. During the period ended June 30, 2017, the aggregate value of purchases and sales cross trades with other Funds or accounts were as follows:
| Purchases | Sales | |||||||
Large Cap Growth Fund | $ | 36,094,416 | $ | 40,075,805 | ||||
Large Cap Value Fund | 80,026,611 | 35,660,817 | ||||||
Small/Mid Cap Growth Fund | 39,630,923 | 49,378,502 | ||||||
Small/Mid Cap Value Fund | 28,547,619 | 35,908,761 | ||||||
International Equity Fund | 13,946,335 | 22,682,070 | ||||||
7. LINE OF CREDIT ARRANGEMENT
The Trust is a party to an unsecured, uncommitted line of credit agreement with U.S. Bank, N.A., expiring June 29, 2018. The arrangement allows the Funds to borrow for temporary purposes to meet large or unexpected redemptions. The Funds collectively may borrow up to $200 million. Interest is charged on borrowings at the prevailing prime rate minus one and one-half percent and is reflected as interest expense on the Statements of Operations. The Funds are not subject to any commitment fees under this arrangement. The Funds did not have any outstanding borrowings under this agreement during the period ended June 30, 2017.
8. INTERFUND LENDING AGREEMENT
On June 1, 2016, the Funds received exemptive relief from the SEC to enter into a master interfund lending agreement with each other that permits each Fund to lend money directly to and borrow money directly from other Funds for temporary purposes. Each Fund may lend to another Fund, in aggregate, up to 15% of its current net assets at the time of the loan and a Fund’s loans, in aggregate, to any one Fund under the agreement may not exceed 5% of the lending Fund’s net assets. A loan under the agreement will not exceed duration of seven days and interest is charged on borrowings at a rate determined based on current short-term market interest rates and short-term lending rates available to the Funds. As of June 30, 2017, the Funds have yet to lend under this agreement.
| Annual Report • June 30, 2017 | 73 |
Bridge Builder Mutual Funds
Notes to Financial Statements (Continued)
9. INVESTMENT TRANSACTIONS
For the period ended June 30, 2017, purchases and sales of investment securities, other than short-term investments, were as follows:
| Core Bond Fund | Core Plus Bond Fund | Municipal Bond Fund | Large Cap Growth Fund | Large Cap Value Fund | Small/Mid Cap Growth Fund | Small/Mid Cap Value Fund | International Equity Fund | |||||||||||||||||||||||||
Purchases: | ||||||||||||||||||||||||||||||||
U.S. Government | $ | 24,303,380,225 | $ | 9,130,824,732 | $ | — | $ | — | $ | — | $ | — | $ | — | $ | — | ||||||||||||||||
Other | 4,626,802,773 | 3,104,885,322 | 1,118,201,953 | 2,594,859,350 | 2,593,409,477 | 1,081,684,619 | 2,168,839,672 | 2,784,379,216 | ||||||||||||||||||||||||
Sales: | ||||||||||||||||||||||||||||||||
U.S. Government | 22,527,659,323 | 8,819,346,258 | — | — | — | — | — | — | ||||||||||||||||||||||||
Other | 3,283,812,726 | 1,269,472,777 | 494,806,487 | 1,310,381,892 | 778,719,115 | 515,598,044 | 1,149,324,435 | 768,759,562 | ||||||||||||||||||||||||
10. FEDERAL INCOME TAX INFORMATION
GAAP requires that certain components of net assets be reclassified between financial and tax reporting. Temporary differences do not require reclassification. Temporary and permanent differences have no effect on net assets or net asset value per share. For the period ended June 30, 2017, the Funds made the following permanent book-to-tax reclassifications primarily related to the treatment of foreign currency, paydowns and difference between book and tax accretion methods for market premium:
| Undistributed Net Investment Income/(Loss) | Accumulated Net Realized Gain/(Loss) | Paid-In Capital | ||||||||||
Core Bond Fund | $ | 16,756,613 | $ | (16,756,613 | ) | $ | — | |||||
Core Plus Bond Fund | 8,541,503 | (8,541,503 | ) | — | ||||||||
Municipal Bond Fund | (2,494 | ) | 2,494 | — | ||||||||
Large Cap Growth Fund | 19,101 | (778 | ) | (18,323 | ) | |||||||
Large Cap Value Fund | (90,325 | ) | 90,325 | — | ||||||||
Small/Mid Cap Growth Fund | 261,289 | (261,289 | ) | — | ||||||||
Small/Mid Cap Value Fund | (815,224 | ) | 829,993 | (14,769 | ) | |||||||
International Equity Fund | (1,753,495 | ) | 1,617,518 | 135,977 | ||||||||
At June 30, 2017, gross unrealized appreciation and depreciation of investments, based on cost for federal income tax purposes were as follows:
| Core Bond Fund | Core Plus Bond Fund | Municipal Bond Fund | Large Cap Growth Fund | Large Cap Value Fund | Small/Mid Cap Growth Fund | Small/Mid Cap Value Fund | International Equity Fund | |||||||||||||||||||||||||
Cost of Investments | $ | 14,203,166,928 | $ | 6,727,677,596 | $ | 2,535,379,348 | $ | 3,640,075,867 | $ | 4,551,978,994 | $ | 2,229,585,535 | $ | 2,937,280,778 | $ | 4,722,098,986 | ||||||||||||||||
|
|
|
|
|
|
|
|
|
|
|
|
|
|
|
| |||||||||||||||||
Gross Unrealized Appreciation | $ | 244,658,099 | $ | 67,113,055 | $ | 29,920,953 | $ | 629,605,238 | $ | 596,164,825 | $ | 409,630,633 | $ | 427,754,945 | $ | 592,617,448 | ||||||||||||||||
Gross Unrealized Depreciation | (71,255,301 | ) | (36,944,944 | ) | (15,433,824 | ) | (81,783,429 | ) | (156,996,858 | ) | (105,278,677 | ) | (118,386,202 | ) | (190,574,407 | ) | ||||||||||||||||
|
|
|
|
|
|
|
|
|
|
|
|
|
|
|
| |||||||||||||||||
Net Unrealized Appreciation | $ | 173,402,798 | $ | 30,168,111 | $ | 14,487,129 | $ | 547,821,809 | $ | 439,167,967 | $ | 304,351,956 | $ | 309,368,743 | $ | 402,043,041 | ||||||||||||||||
|
|
|
|
|
|
|
|
|
|
|
|
|
|
|
| |||||||||||||||||
The differences between book basis and tax basis appreciation/(depreciation) on investments is primarily attributable to wash sale loss deferrals, and differences in the tax treatment of mark to market on passive foreign investment companies and the amortization of premiums.
| 74 | Annual Report • June 30, 2017 |
Bridge Builder Mutual Funds
Notes to Financial Statements (Continued)
As of June 30, 2017, the components of accumulated earnings/(losses) on a tax basis were as follows:
| Core Bond Fund | Core Plus Bond Fund | Municipal Bond Fund | Large Cap Growth Fund | Large Cap Value Fund | Small/Mid Cap Growth Fund | Small/Mid Cap Value Fund | International Equity Fund | |||||||||||||||||||||||||
Accumulated Capital and Other Losses | $ | (18,303,040 | ) | $ | (33,301,863 | ) | $ | (5,091,134 | ) | $ | (73,244,280 | ) | $ | — | $ | — | $ | (12,198,796 | ) | $ | (4,411,361 | ) | ||||||||||
Other Gains/(Losses) | (3,977,642 | ) | 4,256,056 | (26,291 | ) | (4,372 | ) | (2,761 | ) | (270 | ) | — | (20,112 | ) | ||||||||||||||||||
Undistributed Net Ordinary Income | 8,528,028 | — | — | 19,692,149 | 462,429 | 3,228,238 | 14,361,546 | 63,578,878 | ||||||||||||||||||||||||
Undistributed Tax-Exempt Income | — | — | 617,979 | — | — | — | — | — | ||||||||||||||||||||||||
Undistributed Long-Term Capital Gain | — | — | — | — | 14,467,977 | 6,004,759 | — | — | ||||||||||||||||||||||||
Unrealized Appreciation/(Depreciation) | 174,646,542 | 25,553,493 | 14,487,129 | 547,822,777 | 439,175,598 | 304,351,956 | 309,368,743 | 402,332,432 | ||||||||||||||||||||||||
|
|
|
|
|
|
|
|
|
|
|
|
|
|
|
| |||||||||||||||||
Total Accumulated Gain/(Loss) | $ | 160,893,888 | $ | (3,492,314 | ) | $ | 9,987,683 | $ | 494,266,274 | $ | 454,103,243 | $ | 313,584,683 | $ | 311,531,493 | $ | 461,479,837 | |||||||||||||||
|
|
|
|
|
|
|
|
|
|
|
|
|
|
|
| |||||||||||||||||
The differences between book basis and tax basis components of net assets are primarily attributable to wash sale loss deferrals and other book and tax differences including paydowns, organizational costs, straddle loss deferrals, post-October capital loss deferrals and capital loss carryforwards.
At June 30, 2017, the Funds had the following capital loss carryforwards. The capital loss carryforwards do not have an expiration date and will retain their character as either short-term or long-term capital losses. The ability to utilize capital loss carryforwards in the future may be limited under the Internal Revenue Code and related regulations based on the results of future transactions.
| Capital Loss Carryforwards | ||||
Core Bond Fund | $ | — | ||
Core Plus Bond Fund | — | |||
Municipal Bond Fund | — | |||
Large Cap Growth Fund | 73,244,280 | |||
Large Cap Value Fund | — | |||
Small/Mid Cap Growth Fund | — | |||
Small/Mid Cap Value Fund | 12,198,796 | |||
International Equity Fund | 4,411,361 | |||
At June 30, 2017 the Core Bond, Core Plus Bond and Municipal Bond Funds deferred, on a tax basis, post-October capital losses of $18,303,040, $32,518,975 and $5,091,134, respectively. Additionally, at June 30, 2017 the Core Plus Bond Fund deferred, on a tax basis, late-year ordinary losses of $782,888. Under current tax law, capital losses realized after October 31, and late-year ordinary losses realized after December 31 may be deferred and treated as occurring on the first business day of the Fund’s next taxable year.
| Annual Report • June 30, 2017 | 75 |
Bridge Builder Mutual Funds
Notes to Financial Statements (Continued)
The tax character of distributions paid by the Funds during the fiscal periods ended June 30, 2017 and June 30, 2016 were as follows:
| Core Bond Fund | Core Plus Bond Fund | Municipal Bond Fund | Large Cap Growth Fund | |||||||||||||||||||||||||||||
| 2017 | 2016 | 2017 | 2016 | 2017 | 2016 | 2017 | 2016 | |||||||||||||||||||||||||
Distributions paid from: | ||||||||||||||||||||||||||||||||
Net Ordinary Income (1) | $ | 349,650,342 | $ | 262,062,980 | $ | 143,426,455 | $ | 56,840,027 | $ | 2,649,832 | $ | 883,304 | $ | 27,066,103 | $ | 13,598,060 | ||||||||||||||||
Tax-Exempt Income | — | — | — | — | 40,713,891 | 18,578,602 | — | — | ||||||||||||||||||||||||
Net Long-Term Capital Gains | 10,835,355 | 8,844,028 | 1,478,345 | 139,783 | 176,449 | — | — | — | ||||||||||||||||||||||||
Return of Capital | — | — | — | — | — | — | — | — | ||||||||||||||||||||||||
|
|
|
|
|
|
|
|
|
|
|
|
|
|
|
| |||||||||||||||||
Total Distributions Paid | $ | 360,485,697 | $ | 270,907,008 | $ | 144,904,800 | $ | 56,979,810 | $ | 43,540,172 | $ | 19,461,906 | $ | 27,066,103 | $ | 13,598,060 | ||||||||||||||||
|
|
|
|
|
|
|
|
|
|
|
|
|
|
|
| |||||||||||||||||
| Large Cap Value Fund | Small/Mid Cap Growth Fund | Small/Mid Cap Value Fund | International Equity Fund | |||||||||||||||||||||||||||||
| 2017 | 2016 | 2017 | 2016 | 2017 | 2016 | 2017 | 2016 | |||||||||||||||||||||||||
Distributions paid from: | ||||||||||||||||||||||||||||||||
Net Ordinary Income (1) | $ | 65,546,222 | $ | 40,386,381 | $ | 6,879,324 | $ | 3,645,669 | $ | 19,093,726 | $ | 5,499,345 | $ | 49,670,345 | $ | 9,875,287 | ||||||||||||||||
Tax-Exempt Income | — | — | — | — | — | — | — | — | ||||||||||||||||||||||||
Net Long-Term Capital Gains | — | 9,782 | — | — | — | 41,446 | — | — | ||||||||||||||||||||||||
Return of Capital | — | — | — | — | — | — | — | — | ||||||||||||||||||||||||
|
|
|
|
|
|
|
|
|
|
|
|
|
|
|
| |||||||||||||||||
Total Distributions Paid | $ | 65,546,222 | $ | 40,396,163 | $ | 6,879,324 | $ | 3,645,669 | $ | 19,093,726 | $ | 5,540,791 | $ | 49,670,345 | $ | 9,875,287 | ||||||||||||||||
|
|
|
|
|
|
|
|
|
|
|
|
|
|
|
| |||||||||||||||||
| (1) | Net Ordinary Income includes net short-term capital gains, if any. |
11. RISKS
Investing in the Funds may involve certain risks including, but not limited to, those described below. Please refer to the Funds’ prospectus and statement of additional information for more information on risks associated with investing in the Funds.
a) Interest Rate Risk – Certain Funds invest in fixed-income securities that change in value based on changes in interest rates. If rates increase, the value of these investments generally declines. On the other hand, if rates fall, the value of these investments generally increases. Current market conditions may pose heightened risks for the Funds. Recent and potential future changes in monetary policy made by central banks and/or their governments are likely to affect the level of interest rates. A rise in interest rates may, in turn, increase volatility and reduce liquidity in the fixed income markets and result in a decline in the value of the fixed income investments held by the Funds. The value of a fixed-income security with greater duration will be more sensitive to changes in interest rates than a similar security with less duration. Duration is a measure of the sensitivity of the price of a fixed-income security (or a portfolio of fixed-income securities) to changes in interest rates. The prices of fixed-income securities with less duration generally will be less affected by changes in interest rates than the prices of fixed-income securities with greater duration. For example, a five-year duration means the fixed income security is expected to decrease in value by 5% if interest rates rise 1% and increase in value by 5% if interest rates fall 1%, holding other factors constant. Usually, the changes in the value of fixed-income securities will not affect cash income generated, but may affect the value of your investment in the Fund. Floating rate instruments also react to interest rate changes in a similar manner although generally to a lesser degree (depending, however, on the characteristics of the reset terms, including the benchmark rate chosen, frequency of reset and reset caps or floors, among other things). Zero coupon bonds have longer durations than coupon-bearing bonds with comparable maturities and generally experience greater volatility in response to changing interest rates.
b) Liquidity Risk – Low trading volume, a lack of a market maker, or contractual or legal restrictions may limit or prevent a Fund from selling securities or closing derivative positions at desirable times or prices. During times of
| 76 | Annual Report • June 30, 2017 |
Bridge Builder Mutual Funds
Notes to Financial Statements (Continued)
significant market or economic turmoil, usually liquid markets for certain of a Fund’s investments may experience extreme reductions in buy-side demand, which may result in values of a Fund’s portfolio securities declining significantly over short or extended periods of time. These reductions in value may occur regardless of whether there has been a change in interest rates or a change in the credit rating of the issuer of the security. Under certain adverse market or economic conditions, Fund investments previously determined to be liquid may be deemed to be illiquid, and, because of regulatory limitations on investments in illiquid securities, a Fund may not be able to make or gain the desired level of exposure to certain investments that it otherwise would.
c) Redemption Risk – A Fund may experience losses when selling securities to meet redemption requests. This risk is greater for larger redemption requests or redemption requests during adverse market conditions. Because the Funds currently are available only to participants in a single asset allocation program, a reduction in the allocation of program assets to the Funds could result in one or more large redemption requests. Moreover, as a result of the requirement that a Fund satisfy redemption requests even during times of significant market or economic turmoil, a Fund may be forced to sell portfolio securities during periods of reduced liquidity when prices are rapidly declining. This may require a Fund to realize investment losses at times that a Sub-adviser believes that it would have been advisable to hold a particular investment until a more orderly sale could occur or the market recovers.
d) Credit Risk – There is a risk that issuers and counterparties will not make payments on securities, repurchase agreements or other investments held by a Fund. Such defaults could result in losses to a Fund. In addition, the credit quality of securities held by a Fund may be lowered if an issuer’s financial condition changes. Lower credit quality may lead to greater volatility in the price of a security and in shares of a Fund. Lower credit quality also may affect liquidity and make it difficult for the Fund to sell the security. A Fund may invest in securities that are rated in the lowest investment grade category. Such securities may exhibit speculative characteristics similar to high yield securities, and issuers of such securities may be more vulnerable to changes in economic conditions than issuers of higher grade securities.
e) Counterparty Risk – When a Fund enters into an investment contract, such as an OTC Swap or a repurchase agreement, the Fund is exposed to the risk that the other party will not fulfill its contractual obligations. For example, in a repurchase agreement, there exists the risk that a Fund buys a security from a seller (counterparty) that agrees to repurchase the security at an agreed upon price and time, but the counterparty later fails to repurchase the security.
f) Market Risk – Various market risks can affect the price or liquidity of an issuer’s securities in which a Fund may invest. Returns from the securities in which a Fund invests may underperform returns from the various general securities markets or different asset classes. Different types of securities tend to go through cycles of outperformance and underperformance in comparison to the general securities markets. Adverse events occurring with respect to an issuer’s performance or financial position can depress the value of the issuer’s securities. The liquidity in a market for a particular security will affect its value and may be affected by factors relating to the issuer, as well as the depth of the market for that security. Declines in dealer market-making capacity as a result of structural or regulatory changes could decrease liquidity and/or increase volatility in the fixed-income markets. As a result, a Fund’s value may fluctuate and/or a Fund may experience increased redemptions from shareholders, which may impact the Fund’s liquidity or force the Fund to sell securities into a declining or illiquid market. Other market risks that can affect value include a market’s current attitudes about types of securities, market reactions to political or economic events, including litigation, and tax and regulatory effects (including lack of adequate regulations for a market or particular type of instrument).
g) Equity Risk – Since certain Funds purchase equity securities, those Funds are subject to equity risk. This is the risk that stock prices will fall over short or extended periods of time. Although the stock market has historically outperformed other asset classes over the long term, the stock market tends to move in cycles. Individual stock prices may fluctuate drastically from day-to-day and may underperform other asset classes over an extended period of time.
| Annual Report • June 30, 2017 | 77 |
Bridge Builder Mutual Funds
Notes to Financial Statements (Continued)
Individual companies may report poor results or be negatively affected by industry and/or economic trends and developments. The prices of securities issued by such companies may suffer a decline in response. These price movements may result from factors affecting individual companies, industries or the securities market as a whole.
h) Multi-Manager and Multi-Style Management Risk – Fund performance is dependent upon the success of the Adviser and the Sub-advisers in implementing a Fund’s investment strategies in pursuit of its objective. To a significant extent, a Fund’s performance will depend on the success of the Adviser’s methodology in allocating the Fund’s assets to Sub-advisers and its selection and oversight of the Sub-advisers and on a Sub-adviser’s skill in executing the relevant strategy and selecting investments for the Fund. There can be no assurance that the Adviser or Sub-advisers will be successful in this regard. In addition, because portions of each Fund’s assets are managed by different Sub-advisers using different styles/strategies, a Fund could experience overlapping security transactions. Certain Sub-advisers may be purchasing securities at the same time that other Sub-advisers may be selling those same securities, which may lead to higher transaction expenses compared to a fund using a single investment management style. The Adviser’s and the Sub-advisers’ judgments about the attractiveness, value and potential appreciation of a particular asset class or individual security in which a Fund invests may prove to be incorrect, and there is no guarantee that the Adviser’s or a Sub-adviser’s judgment will produce the desired results. In addition, a Fund may allocate its assets so as to under- or over-emphasize certain strategies or investments under market conditions that are not optimal, in which case a Fund’s value may be adversely affected.
i) Foreign Securities Risk – The securities of foreign issuers, including ADRs and GDRs, may be less liquid and more volatile than securities of comparable U.S. issuers. The costs associated with securities transactions are often higher in foreign countries than the United States. Additionally, investments in securities of foreign issuers, even those publicly traded in the United States, may involve risks which are in addition to those inherent in domestic investments. Foreign companies may not be subject to the same regulatory requirements of U.S. companies, and as a consequence, there may be less publicly available information about such companies. Also, foreign companies may not be subject to uniform accounting, and financial reporting standards and requirements comparable to those applicable to U.S. companies. Foreign governments and foreign economies, particularly in emerging markets, may be less stable than the U.S. Government and the U.S. economy.
j) Currency Risk – While the Funds’ net assets are valued in U.S. dollars, the securities of foreign companies are frequently denominated in foreign currencies. Thus, a change in the value of a foreign currency against the U.S. dollar will result in a corresponding change in value of securities denominated in that currency. Some of the factors that may impair the investments denominated in a foreign currency are: (1) it may be expensive to convert foreign currencies into U.S. dollars and vice versa; (2) complex political and economic factors may significantly affect the values of various currencies, including U.S. dollars, and their exchange rates; (3) government intervention may increase risks involved in purchasing or selling foreign currency options, forward contracts and futures contracts, since exchange rates may not be free to fluctuate in response to other market forces; (4) there may be no systematic reporting of last sale information for foreign currencies or regulatory requirement that quotations available through dealers or other market sources be firm or revised on a timely basis; (5) available quotation information is generally representative of very large round-lot transactions in the inter-bank market and thus may not reflect exchange rates for smaller odd-lot transactions (less than $1 million) where rates may be less favorable; and (6) the inter-bank market in foreign currencies is a global, around-the-clock market. To the extent that a market is closed while the markets for the underlying currencies remain open, certain markets may not always reflect significant price and rate movements.
k) Geographic Focus Risk – To the extent that a significant portion of a Fund’s portfolio is invested in the securities of companies in a particular country or region, a Fund may be more susceptible to economic, political, regulatory or other events or conditions affecting issuers within that country or region. As a result, a Fund may be subject to greater price volatility and risk of loss than a fund holding more geographically diverse investments.
| 78 | Annual Report • June 30, 2017 |
Bridge Builder Mutual Funds
Notes to Financial Statements (Continued)
l) High Yield Securities Risk – High yield, or “junk,” securities involve greater risks of default or downgrade and are more volatile than investment grade securities because the prospect for repayment of principal and interest of many of these securities is speculative. High-yield securities also may be less liquid than higher quality investments.
12. REGULATORY MATTER
In October 2016, the SEC adopted significant reforms to investment company reporting forms and rules. The reforms include amendments to Regulation S-X that will require investment companies to add certain standardized enhanced disclosures, particularly derivative disclosures, to their financial statements. Compliance with the new and amended rules is required for financial statements filed with the SEC with a period end after August 1, 2017; adoption will have no material effect on the Funds’ net assets or results of operations.
Accounting Standards Update 2017-08 (ASU 2017-08) Premium Amortization on Purchased Callable Debt Securities
During March 2017, the Financial Accounting Standards Board (FASB) issued ASU 2017-08, which shortens the premium amortization period for purchased non-contingently callable debt securities. ASU 2017-08 specifies that the premium amortization period ends at the earliest call date, for purchased non-contingently callable debt securities. ASU 2017-08 is effective for fiscal years, and interim periods within those fiscal years, beginning after December 15, 2018. Management is currently evaluating the implications of ASU 2017-08, if any.
13. SUBSEQUENT EVENTS
The Funds have evaluated subsequent events through the date of issuance of this report and have determined that there are no material events that would require accrual or disclosure.
| Annual Report • June 30, 2017 | 79 |
Bridge Builder Mutual Funds
Report of Independent Registered Public Accounting Firm
To the Board of Trustees of Bridge Builder Trust and Shareholders of the Bridge Builder Core Bond Fund, Bridge Builder Core Plus Bond Fund, Bridge Builder Municipal Bond Fund, Bridge Builder Large Cap Growth Fund, Bridge Builder Large Cap Value Fund, Bridge Builder Small/Mid Cap Growth Fund, Bridge Builder Small/Mid Cap Value Fund and Bridge Builder International Equity Fund
In our opinion, the accompanying statements of assets and liabilities, including the summary schedules of investments, and the related statements of operations and of changes in net assets and the financial highlights present fairly, in all material respects, the financial position of Bridge Builder Core Bond Fund, Bridge Builder Core Plus Bond Fund, Bridge Builder Municipal Bond Fund, Bridge Builder Large Cap Growth Fund, Bridge Builder Large Cap Value Fund, Bridge Builder Small/Mid Cap Growth Fund, Bridge Builder Small/Mid Cap Value Fund and Bridge Builder International Equity Fund (each an individual Fund of the Bridge Builder Trust, hereafter referred to as the “Funds”) as of June 30, 2017, the results of each of their operations for the year then ended, the changes in each of their net assets for each of the two years in the period then ended (or for Bridge Builder Core Plus Bond Fund, for the year ended June 30, 2017 and for the period July 13, 2015 (inception date) through June 30, 2016, and for Bridge Builder Municipal Bond Fund, for the year ended June 30, 2017 and for the period September 14, 2015 (inception date) through June 30, 2016, and for Bridge Builder International Equity Fund, for the year ended June 30, 2017 and for the period July 6, 2015 (inception date) through June 30, 2016) and the financial highlights for each of the periods presented therein, in conformity with accounting principles generally accepted in the United States of America. These financial statements and financial highlights (hereafter referred to as “financial statements”) are the responsibility of the Funds’ management. Our responsibility is to express an opinion on these financial statements based on our audits. We conducted our audits of these financial statements in accordance with the standards of the Public Company Accounting Oversight Board (United States). Those standards require that we plan and perform the audit to obtain reasonable assurance about whether the financial statements are free of material misstatement. An audit includes examining, on a test basis, evidence supporting the amounts and disclosures in the financial statements, assessing the accounting principles used and significant estimates made by management, and evaluating the overall financial statement presentation. We believe that our audits, which included confirmation of securities as of June 30, 2017 by correspondence with the custodian and brokers, provide a reasonable basis for our opinions.
/s/ PricewaterhouseCoopers LLP
Chicago, Illinois
August 25, 2017
| 80 | Annual Report • June 30, 2017 |
Bridge Builder Mutual Funds
Trustees and Officers (Unaudited)
Independent Trustees of the Trust (1)
| Name | Role | Term | Principal Occupation | Number of Portfolios in Fund Complex (3) Overseen by Trustees | Other Directorships Held During Past Five Years | |||||
Jean E. Carter (Born: 1957) | Lead Independent Trustee | Indefinite Term; Since Inception | Retired; Director of Investment Management Group for Russell Investment Group (1982-2005) | 9 | Chair, Brandes U.S. registered mutual funds (nine funds). | |||||
Janice L. Innis-Thompson (Born: 1966) | Trustee, Chair of the Nominating and Governance Committee | Indefinite Term; Since Inception | Chief Compliance & Ethics Officer, Samsung Electronics America (since 2017); Retired (2016-2017); Senior Vice President, Chief Compliance & Ethics Officer, TIAA-CREF (2006-2016) | 9 | None. | |||||
Michelle M. Keeley (Born: 1964) | Trustee | Indefinite Term; Since August 2015 | Retired; Executive Vice President, Ameriprise Financial Services, Inc. (2002-2010) | 9 | Independent Director, Federal Home Loan Bank; Inside Director, Ameriprise Bank, FSB. | |||||
William N. Scheffel (Born: 1953) | Trustee | Indefinite Term; Since Inception | Retired; Executive Vice President, Chief Financial Officer and Treasurer, Centene Corporation (2003-2016) | 9 | None. | |||||
John M. Tesoro (Born: 1952) | Trustee, Chair of the Audit Committee | Indefinite Term; Since Inception | Retired; Partner, KPMG LLP (2002-2012) | 9 | Audit Committee Chair; Teton Advisors, Inc. (registered investment adviser). Trustee, BBH Trust (six funds). |
| Annual Report • June 30, 2017 | 81 |
Bridge Builder Mutual Funds
Trustees and Officers (Unaudited) (Continued)
Interested Trustees of the Trust (2)
| Name | Role | Term | Principal Occupation | Number of Portfolios in Fund Complex (3) Overseen by Trustees | Other Directorships Held During Past Five Years | |||||
William H. Broderick III (Born: 1952) | Trustee, Chairman | Indefinite Term; Since Inception | Chief Executive Officer, Victory Wireline, LLC (2015-Present); Retired (2013-2015); Principal, Investment Advisory, Edward Jones Client Strategies Group (1986-2012) | 9 | None. | |||||
William E. Fiala (Born: 1967) | Trustee | Indefinite Term; Since Inception | Principal, Edward Jones Client Strategies Group (1994-Present) | 9 | None. |
Officers of the Trust
| Name | Role | Term | Principal Occupation | |||
Ryan T. Robson (Born: 1978) | President | Indefinite Term; Since July 1, 2016 | Principal, Edward Jones Client Strategies Group (since 2013); Director, PricewaterhouseCoopers LLP (2010-2013) | |||
Julius A. Drelick, III (Born: 1966) | Vice President | Indefinite Term; Since May 24, 2017 | Director of Fund Administration and Strategic Products at Edward Jones (since 2016); Senior Vice President and Chief Compliance Officer at Voya Investment Management, LLC (2004-2016) | |||
Aaron J. Masek (Born: 1974) | Treasurer | Indefinite Term; Since July 1, 2016 | Director, Finance, Edward Jones (since 2015); Vice President and Treasurer, AQR Funds (2010-2015) | |||
Alan J. Herzog (Born: 1973) | Chief Compliance Officer and Vice President | Indefinite Term; Since January 1, 2015 | Principal, Edward Jones and General Partner, The Jones Financial Companies, LLLP (since 2013); Senior Counsel, Wells Fargo Advisors, LLC (2008-2013) | |||
Helge K. Lee (Born: 1946) | Secretary | Indefinite Term; Since July 1, 2016 | Associate General Counsel and Leader of the Fee-Based Platforms Team in the Legal Division, Edward Jones (since 2014); Special Counsel, Godfrey & Kahn (2005-2014) | |||
Rebecca A. Paulzine (Born: 1979) | Assistant Secretary | Indefinite Term; Since November 10, 2016 | Associate General Counsel at Edward Jones (since 2014); Senior Counsel at Thrivent Financial for Lutherans (2010-2014) |
| (1) | The Trustees of the Trust who are not “interested persons” of the Trust as defined under the 1940 Act (“Independent Trustees”). |
| (2) | Mr. Broderick and Mr. Fiala are “interested persons” of the Trust as defined by the 1940 Act by virtue of the fact that they are affiliated persons of the Adviser’s parent company, The Jones Financial Companies, L.L.L.P. |
| (3) | The “Fund Complex” is comprised of each Fund offered by the Trust, one of which is offered in a separate SAI, and the Edward Jones Money Market Fund. No Trustee oversees, nor receives compensation from, the Edward Jones Money Market Fund, which is advised by Passport Research, Ltd., an affiliate of the Adviser. |
The business address of the Trustees and Officers is the address of the Trust: 615 East Michigan Street, Milwaukee, Wisconsin, 53202.
The Statement of Additional Information includes additional information about the Trustees and is available upon request, without charge, by calling 1-855-823-3611.
| 82 | Annual Report • June 30, 2017 |
Bridge Builder Mutual Funds
Board Consideration of Investment Advisory Agreement and Sub-advisory Agreements (Unaudited)
Pursuant to Section 15 of the Investment Company Act of 1940 (the “1940 Act”), the Board of Trustees (the “Board” or the “Trustees”) of the Bridge Builder Trust (the “Trust”), including a majority of the Trustees who are not parties to the agreements or “interested persons” of any party, as defined in the 1940 Act (the “Independent Trustees”), must determine annually whether to approve the continuation of the Trust’s investment advisory and sub-advisory agreements.
At an in-person meeting held on May 23-24, 2017 (the “May Meeting”), the Trustees, including the Independent Trustees, considered and approved the continuance of an investment advisory agreement (the “Advisory Agreement”) with the Adviser for the Bridge Builder Core Bond Fund (the “Core Bond Fund”), the Bridge Builder Core Plus Bond Fund (the “Core Plus Bond Fund”), the Bridge Builder Municipal Bond Fund (the “Municipal Bond Fund”), the Bridge Builder Large Cap Growth Fund (the “Large Cap Growth Fund”), the Bridge Builder Large Cap Value Fund (the “Large Cap Value Fund”), the Bridge Builder Small/Mid Cap Growth Fund (the “Small/Mid Cap Growth Fund”), the Bridge Builder Small/Mid Cap Value Fund (the “Small/Mid Cap Value Fund”), and the Bridge Builder International Equity Fund (the “International Equity Fund”) (collectively, the “Funds”). The Trustees, including the Independent Trustees, also considered and approved the continuance of an investment sub-advisory agreement (each, a “Sub-advisory Agreement and collectively, the “Sub-advisory Agreements”) with each of the following Fund sub-advisers: Robert W. Baird & Co. Inc. (“Baird”), J.P. Morgan Investment Management, Inc. (“J.P. Morgan”), Loomis, Sayles & Company, L.P. (“Loomis Sayles”), Prudential Investment Management, Inc. (“Prudential”), Metropolitan West Asset Management, LLC (“MetWest”), T. Rowe Price Associates, Inc. (“T. Rowe Price”), FIAM, LLC (“FIAM”), Wells Capital Management, Inc. (“Wells Capital”), Lazard Asset Management, LLC (“Lazard”), Sustainable Growth Advisers, LP (“SGA”), Jennison Associates, LLC (“Jennison”), William Blair Investment Management, LLC (“William Blair”), BlackRock Investment Management, LLC (“BlackRock”), Artisan Partners, LP (“Artisan”), Barrow, Hanley, Mewhinney & Strauss, LLC (“Barrow Hanley”), Wellington Management Company, LLP (“Wellington”), Eagle Asset Management, Inc. (“Eagle”), Champlain Investment Partners, LLC (“Champlain”), ClearBridge Investments, LLC (“ClearBridge”), Stephens Investment Management Group, LLC (“Stephens”), Advisory Research, Inc. (“Advisory Research”), Vaughan Nelson Investment Management, LP (“Vaughan Nelson”), Boston Partners Global Investors, Inc. (“Boston Partners”), Silvercrest Asset Management Group, LLC (“Silvercrest”), Baillie Gifford Overseas Limited (“Baillie Gifford”), Edinburgh Partners Limited (“Edinburgh”), Manning & Napier Advisors, LLC (“Manning & Napier”), Mondrian Investment Partners Limited (“Mondrian”), and WCM Investment Management (“WCM”) (collectively, the “Sub-advisers”).
In connection with the annual review process and in advance of the May Meeting, the Adviser and the Sub-advisers provided information to the Board in response to requests for information by the Independent Trustees to facilitate the Board’s evaluation of the terms of the Advisory Agreement and Sub-advisory Agreements (collectively, the “Agreements”). The information furnished by the Adviser included materials describing, among other matters: (i) the nature, extent, and quality of the services provided by the Adviser and the Sub-advisers; (ii) each Fund’s historical investment performance and the historical investment performance of each Sub-adviser; (iii) the Adviser’s and the Sub-advisers’ personnel, including portfolio managers; (iv) the investment practices and techniques used by the Adviser and the Sub-advisers in managing the Fund; (v) the advisory fees payable by the Funds to the Adviser and the Funds’ overall fees and operating expenses, compared with those of a category and a peer group of mutual funds; (vi) the sub-advisory fees payable by the Adviser to each Sub-adviser; (vii) the Adviser’s and the Sub-advisers’ compliance policies and procedures; and (viii) other “fall-out” benefits the Adviser and/or its affiliates and the Sub-advisers may receive based on their relationships with the Funds. At a telephonic Board meeting held on May 9, 2017 and at the May Meeting (collectively, the “May Meetings”), representatives of the Adviser made presentations and responded to questions regarding the services, fees, and other aspects of the Agreements.
In addition to the May Meetings, the Board met periodically over the course of the year since the most recent annual renewal. At these meetings, representatives of the Adviser and the Sub-advisers furnished quarterly reports and other information to the Board regarding the performance of the Funds, the services provided to the Funds by the Adviser and the Sub-advisers, and compliance and operations matters related to the Trust, the Funds, the Adviser, and the Sub-advisers.
| Annual Report • June 30, 2017 | 83 |
Bridge Builder Mutual Funds
Board Consideration of Investment Advisory Agreement and Sub-advisory Agreements (Unaudited) (Continued)
At the May Meetings, the Trustees received advice from Fund counsel, and the Independent Trustees received additional advice from their independent legal counsel, including advice regarding the legal standards applicable to the consideration of the approval of advisory arrangements. The Independent Trustees met in executive session, outside the presence of the interested Trustees, Trust officers, and representatives of the Adviser and the Sub-advisers, to discuss the Agreements and the services to be provided by the Adviser and the Sub-advisers.
In considering and approving the Agreements, the Trustees considered information that they deemed relevant, including, but not limited to, the information discussed in further detail below. The Board considered not only the specific information presented in connection with the May Meetings, but also the knowledge gained over time through previous interactions with the Adviser and the Sub-advisers. The Board did not identify any particular information or consideration that was all-important or controlling, and each individual Trustee may have attributed different weights to various factors.
1. The nature, extent and quality of the services provided by the Adviser and the Sub-advisers. The Trustees considered the nature, extent and quality of the services provided to the Funds by the Adviser and each Sub-adviser, including their respective responsibilities for management of the Funds. In this regard, the Board considered the Adviser’s oversight role and responsibilities with regard to the Sub-advisers, and the Sub-advisers’ roles in the day-to-day management of each Fund’s portfolio. The Board considered the Adviser’s assumption of business, entrepreneurial and overall managerial risks by advising the Funds. The Board also contemplated the Adviser’s oversight of the Sub-advisers, which includes continuous analysis of, and regular discussions with each Sub-adviser about, the investment strategies and performance of each Fund and of the portion of a Fund’s assets allocated to a particular Sub-adviser, periodic due diligence on-site visits to the Sub-advisers, and other in-person meetings with the Sub-advisers. The Board also considered the Adviser’s robust processes relating to Sub-adviser selection, monitoring, termination and allocation adjustments. The Board also took into account the Adviser’s oversight of the Funds’ other service providers.
The Board also noted the Adviser’s and each Sub-adviser’s operations, including resources devoted to support such operations. The Board considered the Adviser’s and each Sub-adviser’s ability to attract and retain qualified investment professionals and the experience and skills of management and investment personnel of the Adviser and the Sub-advisers. The Board also noted the compliance programs and compliance records of the Adviser and the Sub-advisers. In addition, the Board considered the administrative and other services that are or will be provided to the Funds by the Adviser, including a new analytical tool the Adviser intends to employ to help mitigate the Funds’ risks.
Based on the above factors, as well as those discussed below, the Board concluded, within the context of its full deliberations, that the Adviser and the Sub-advisers are capable of continuing to provide services of the nature, extent and quality contemplated by the terms of the Agreements.
2. Fees and Other Expenses. The Board reviewed comparisons of the advisory fee and total fees and expenses of each Fund to its category and peer funds on a gross basis and also net of fee and expense waivers and reimbursements. In this regard, the Trustees received and reviewed reports prepared by Morningstar Associates, LLC, an independent provider of mutual fund industry data, comparing each Fund’s advisory fees and gross and net expense ratios to those paid by an independently-selected category and peer group of mutual funds. The Board noted that, for each of the Funds, advisory fees and net expenses were below their respective peer group medians. The Board observed that the Adviser had no similarly managed separate accounts for purposes of comparison. The Board reviewed the information provided by certain of the Sub-advisers regarding fees charged to other similarly managed accounts, if any. To the extent provided, the Board reviewed information about structural, operational and other differences between such similarly managed accounts and the sleeves managed for the Funds.
The Board noted that, although the Adviser has historically paid all sub-advisory fees to the Sub-advisers, the Funds have agreed to assume the obligation to pay sub-advisory fees going forward. However, the Board considered that
| 84 | Annual Report • June 30, 2017 |
Bridge Builder Mutual Funds
Board Consideration of Investment Advisory Agreement and Sub-advisory Agreements (Unaudited) (Continued)
the Adviser has contractually agreed to waive its advisory fees to the extent advisory fees to be paid to the Adviser exceed the sub-advisory fees paid to a Sub-adviser for management of its allocated portion of a Fund or Funds. The Board noted that the Adviser may terminate this waiver arrangement following notice, without Board approval, once a year.
Based on the above factors, as well as those discussed below, the Board concluded, within the context of its full deliberations, that the advisory and sub-advisory fees were reasonable in light of the nature, extent and quality of the services rendered by the Adviser and the Sub-advisers.
3. The Funds’ Investment Performance Record. The Board reviewed the investment performance of each Fund on an absolute basis and in comparison to appropriate benchmarks and each Fund’s respective category and peer group as independently selected by Morningstar Associates, LLC.
The Board observed that the Core Bond Fund outperformed its peer group median and benchmark index for the one-year and three-year periods ended March 31, 2017. The Board also reviewed the investment performance of each Sub-adviser of the Core Bond Fund, noting that Baird, J.P. Morgan and Prudential outperformed the Fund’s benchmark index for the one- and three-year periods. The Board also noted that Loomis Sayles outperformed the Fund’s benchmark index over its one-year track record.
The Board observed that the Core Plus Bond Fund underperformed its peer group median and outperformed its benchmark index for the one-year period ended March 31, 2017. The Board also reviewed the investment performance of each Sub-adviser of the Core Plus Bond Fund, noting that each of them outperformed the Fund’s benchmark index.
The Board reviewed the performance of the Municipal Bond Fund, which outperformed its peer group median and its benchmark index for the one-year period ended March 31, 2017. In reviewing the investment performance of each Sub-adviser of the Municipal Bond Fund, the Board observed that FIAM and both T. Rowe Price sleeves outperformed the Fund’s benchmark index, while Wells Capital underperformed the Fund’s benchmark index.
The Board observed that the Large Cap Growth Fund outperformed its peer group median and underperformed its benchmark index for the one-year period ended March 31, 2017. In reviewing the investment performance of each Sub-adviser of the Large Cap Growth Fund, the Board noted that SGA and Lazard outperformed the Fund’s benchmark index, while BlackRock, Jennison and William Blair underperformed the Fund’s benchmark index.
The Board considered the performance of the Large Cap Value Fund. The Board noted that the Large Cap Value Fund underperformed its peer group median and its benchmark index for the one-year period ended March 31, 2017. In reviewing the investment performance of each Sub-adviser of the Large Cap Value Fund, the Board noted that Artisan and Barrow Hanley outperformed the Fund’s benchmark index, while BlackRock and Wellington underperformed the Fund’s benchmark index.
The Board observed that the Small/Mid Cap Growth Fund outperformed its peer group median, but it underperformed its benchmark index for the one-period ended March 31, 2017. In reviewing the investment performance of each Sub-adviser of the Small/Mid Cap Growth Fund, the Board observed that Eagle, Stephens, Champlain and one of the BlackRock sleeves outperformed the Fund’s benchmark index, while, Clearbridge and the other BlackRock sleeve underperformed the Fund’s benchmark index.
The Board reviewed the performance of the Small/Mid Cap Value Fund, observing that it underperformed its peer group median and its benchmark index for the one-year period ended March 31, 2017. The Board reviewed the performance of each Sub-adviser as well, noting that one BlackRock sleeve and Silvercrest outperformed the Fund’s benchmark index, while Advisory Research, Boston Partners the other BlackRock sleeve, and Vaughan Nelson underperformed the Fund’s benchmark index.
| Annual Report • June 30, 2017 | 85 |
Bridge Builder Mutual Funds
Board Consideration of Investment Advisory Agreement and Sub-advisory Agreements (Unaudited) (Continued)
Finally, the Board observed that the International Equity Fund outperformed its peer group median and underperformed its benchmark index for the one-year period ended March 31, 2017. In reviewing the performance of each Sub-adviser of the International Equity Fund, the Board noted that each Sub-adviser other than Edinburgh underperformed the Fund’s benchmark index.
4. Profitability and Economies of Scale. The Board considered that the Adviser has contractually agreed to waive its advisory fees to the extent advisory fees to be paid to the Adviser exceed the sub-advisory fees paid to a Sub-adviser for management of its allocated portion of a Fund or Funds. Therefore, the Adviser does not profit or receive any differential compensation from allocating assets in any particular manner among the Sub-advisers. In addition, the Board did not consider the profitability of the Sub-advisers to be a material factor in their determination, given that the Sub-advisers are not affiliated with the Adviser and, therefore, the fees were negotiated at arm’s length. The Board received and considered information regarding the Adviser’s rigorous fee negotiation process. The Board also considered whether the Funds’ fee structure is designed to share economies of scale with shareholders as the Funds’ assets grow. In this regard, the Board noted that most of the Sub-advisers have agreed to contractual breakpoints in the sub-advisory fee schedules, which accrue to the benefit of the Fund shareholders in light of the Adviser’s contractual fee waiver.
5. Indirect Benefits. The Board noted that Fund shares are currently available exclusively to investors participating in Edward Jones Advisory Solutions®, an investment advisory program (asset-based fee program) sponsored by Edward D. Jones & Co., L.P. (“Edward Jones”), an affiliate of the Adviser. Accordingly, the Board received and considered information about asset-based fees received by Edward Jones from participants in Edward Jones Advisory Solutions® in connection with their investments in the Funds as an indirect or “fall-out” benefit. In addition, the Board considered that the Adviser and Edward Jones may derive a benefit to their reputations and standing in the investment community from their relationship with the Funds. The Board also noted that certain Sub-advisers use soft dollars generated from executing Fund portfolio trades to purchase research, which could be viewed as a fall-out benefit to such Sub-advisers to the extent they use the research generated from such trading activities across their client base.
Based on the Board’s deliberations and its evaluation of the information described above and other information it believed relevant, the Board, including all of the Independent Trustees, unanimously approved the continuation of the Agreements for an additional year.
Sub-Advisory Agreement for Pacific Investment Management Company LLC
Pursuant to Section 15(a) of the 1940 Act, a fund’s advisory and sub-advisory agreements must be approved: (i) by a vote of a majority of the shareholders of the fund; and (ii) by a vote of a majority of the members of the Board of Trustees (the “Board” or the “Trustees”) of the Trust who are not parties to the agreements or “interested persons” of any party, as defined in the 1940 Act (the “Independent Trustees”), cast in person at a meeting called for the purpose of voting on such approval.1
In advance of the in-person Meeting held on February 28-March 1, 2017 (the “in-person Meeting”) and a telephonic meeting held on February 22, 2017, Olive Street Investment Advisers, LLC (the “Adviser”) and Pacific Investment Management Company LLC (“PIMCO”) furnished information to the Board necessary for the Board to evaluate the terms of a new sub-advisory agreement with PIMCO (the “PIMCO Sub-advisory Agreement”) for the Bridge Builder Core Plus Bond Fund (the “Core Plus Bond Fund”). This information included materials describing, among other matters: (i) the nature, extent and quality of the services proposed to be provided by PIMCO; (ii) PIMCO’s investment management personnel; (iii) PIMCO’s operations; (iv) PIMCO’s investment philosophy and investment process; (v) the sub-advisory fees proposed to be payable to PIMCO; (vi) PIMCO’s policies and compliance procedures, including those related to personal securities transactions; and (vii) the investment performance of accounts managed by PIMCO with strategies similar to the portion of the Core Plus Bond Fund proposed to be managed by PIMCO.
| 1 | Bridge Builder Trust and the Adviser have received an exemptive order from the Securities and Exchange Commission permitting them to enter into and materially amend sub-advisory agreements without obtaining shareholder approval under Section 15(a) of the 1940 Act and granting them relief from certain disclosure requirements. |
| 86 | Annual Report • June 30, 2017 |
Bridge Builder Mutual Funds
Board Consideration of Investment Advisory Agreement and Sub-advisory Agreements (Unaudited) (Continued)
At the in-person Meeting, representatives of the Adviser and PIMCO also made presentations and responded to questions regarding PIMCO’s services and fees, as well as other aspects of the PIMCO Sub-advisory Agreement. The Independent Trustees received advice from Trust counsel and from their independent legal counsel, including advice regarding the legal standards applicable to the consideration of advisory and sub-advisory arrangements, and met in executive session outside the presence of the interested Trustees, Trust management and representatives of the Adviser and PIMCO to discuss the PIMCO Sub-advisory Agreement and the services to be provided by PIMCO thereunder.
In considering the approval of the PIMCO Sub-advisory Agreement, the Board considered various factors, as discussed in further detail below:
1. The nature, extent and quality of the services to be provided by PIMCO under the PIMCO Sub-advisory Agreement. The Board reviewed the portfolio management services proposed to be provided by PIMCO, including how PIMCO’s investment approach and process complement those of the other sub-advisers that manage the Core Plus Bond Fund, as well as the background and experience of PIMCO’s portfolio management personnel. The Board discussed the history of PIMCO and its experience in the role of sub-adviser to registered investment companies. The Board reviewed the resources of PIMCO, organizational and personnel changes that had occurred within the past few years and the terms of the proposed PIMCO Sub-advisory Agreement. The Trustees also considered other services to be provided to the Core Plus Bond Fund by PIMCO under the Adviser’s supervision, such as monitoring adherence to the Core Plus Bond Fund’s investment restrictions, monitoring compliance with various Core Plus Bond Fund policies and procedures and with applicable securities laws and regulations and monitoring valuation and liquidity.
Based on the factors above, as well as those discussed below, the Board concluded, within the context of its full deliberations, that PIMCO is capable of providing services of the type and nature contemplated by the terms of the PIMCO Sub-advisory Agreement.
2. Fees and Other Expenses. The Trustees reviewed a report on the sub-advisory fees proposed to be payable by the Adviser to PIMCO. The Board was also informed about the process by which the Adviser negotiates fees with potential sub-advisers. Based on the factors above, as well as those discussed below, the Board concluded, within the context of its full deliberations, that the sub-advisory fees were reasonable in light of the nature and quality of the services expected to be rendered by PIMCO.
3. PIMCO’s Investment Performance Record. Because PIMCO is new to the Core Plus Bond Fund, the Board was not able to evaluate an investment performance record for the portion of the Core Plus Bond Fund to be managed by PIMCO. The Board did consider PIMCO’s performance history with respect to similarly-managed investment accounts.
4. Profitability and Economies of Scale. The Board did not consider profitability of PIMCO to be a material factor, given that PIMCO is not affiliated with the Adviser and, therefore, the fees were negotiated at arm’s length.
5. Indirect Benefits. The Board considered potential “fall-out” or ancillary benefits to PIMCO, as a result of its relationship with the Core Plus Bond Fund. The Board considered that ancilarry benefits could result from a greater amount of assets under PIMCO’s management, potentially allowing the sub-adviser to leverage its increased trade volume to negotiate more favorable execution rates for all its clients. Ancillary benefits could also include the ability to market to shareholders other financial products and services offered by PIMCO that follow investment strategies similar to those of the Core Plus Bond Fund.
| Annual Report • June 30, 2017 | 87 |
Bridge Builder Mutual Funds
Board Consideration of Investment Advisory Agreement and Sub-advisory Agreements (Unaudited) (Continued)
CONCLUSION
While formal Board action was not taken with respect to the conclusions discussed above, those conclusions formed, in part, the basis for the Board’s approval of the PIMCO Sub-advisory Agreement at the Meeting. The Board concluded, in the exercise of its reasonable judgment, that the terms of the PIMCO Sub-advisory Agreement, including the compensation to be paid thereunder, are reasonable in relation to the services expected to be provided by PIMCO to the Core Plus Bond Fund and that the appointment of PIMCO and the approval of the PIMCO Sub-advisory Agreement would be in the best interests of the Core Plus Bond Fund and its shareholders. Based on the Board’s deliberations and its evaluation of the information described above and other factors and information it believed relevant, the Board, including all of the Independent Trustees, unanimously approved (a) the appointment of PIMCO as a sub-adviser to the Core Plus Bond Fund and (b) the PIMCO Sub-advisory Agreement.
| 88 | Annual Report • June 30, 2017 |
Bridge Builder Mutual Funds
General Information (Unaudited)
Proxy Voting Procedures and Proxy Voting Record
A description of the policies and procedures that the Funds use to determine how to vote proxies relating to portfolio securities is available, free of charge, by calling 1-855-823-3611. This information is also available through the Securities and Exchange Commission’s website at http://www.sec.gov. Information regarding how the Trust voted proxies relating to portfolio securities during the 12-month period ending June 30 is available without charge, upon request, by calling 1-855-823-3611. This information is also available through the Securities and Exchange Commission’s website at http://www.sec.gov.
Form N-Q Disclosure
The Trust files its complete schedule of portfolio holdings with the Securities and Exchange Commission for the first and third quarters of each fiscal year on Form N-Q. The Trust’s Form N-Q filings are available on the Securities and Exchange Commission’s website at http://www.sec.gov. The Trust’s Form N-Q filings may be reviewed and copied at the Commission’s Public Reference Room in Washington, D.C., and information on the operation of the Public Reference Room may be obtained by calling 1-800-SEC-0330. Information regarding the Trust’s Form N-Q filings is also available, without charge, by calling, 1-855-823-3611.
Household Delivery of Shareholder Documents
To reduce expenses the Funds may mail only one copy of the prospectus, Statement of Additional Information and each annual and semiannual report to those addresses shared by two or more accounts. If you wish to receive individual copies of these documents, please call the Trust at 1-855-823-3611. You will begin receiving individual copies thirty days after your request is received.
Schedule of Investments
Each Fund’s complete schedule of investments in securities of unaffiliated issuers is available without charge, upon request, by calling 1-855-823-3611, and on the SEC website at http://www.sec.gov as a part of Form N-CSR.
Tax Notice
The following table lists the percentages of dividend income distributed by the Funds for the period ended June 30, 2017, that were designated as qualified dividend income under the Jobs and Growth Tax Relief Reconciliation Act of 2003 and qualify for the corporate dividends received deduction, respectively.
| % of Dividend Income Distributed | ||||||||
| Fund | Qualified Dividend Income | Corporate Dividends Received Deduction | ||||||
| Core Bond Fund | 0.00 | % | 0.00 | % | ||||
| Core Plus Bond Fund | 0.00 | 0.00 | ||||||
| Municipal Bond Fund | 0.00 | 0.00 | ||||||
| Large Cap Growth Fund | 100.00 | 100.00 | ||||||
| Large Cap Value Fund | 100.00 | 88.62 | ||||||
| Small/Mid Cap Growth Fund | 100.00 | 100.00 | ||||||
| Small/Mid Cap Value Fund | 100.00 | 100.00 | ||||||
| International Equity Fund | 100.00 | 0.60 | ||||||
| Annual Report • June 30, 2017 | 89 |
Bridge Builder Mutual Funds
General Information (Unaudited) (Continued)
The following table lists the percentages of ordinary income distributions paid by the Funds, for the period ended June 30, 2017, that were designated as short-term capital gain distributions under Internal Revenue Code Section 871(k)(2)(c) and qualify as interest related dividends under Internal Revenue Code Section 871(k)(2)(c), respectively.
| % of Ordinary Income Distributions | ||
| Fund | Short-Term Capital Gain Distributions | |
| Core Bond Fund | 17.91% | |
| Core Plus Bond Fund | 8.96 | |
| Municipal Bond Fund | 80.68 | |
| Large Cap Growth Fund | 0.00 | |
| Large Cap Value Fund | 0.00 | |
| Small/Mid Cap Growth Fund | 0.00 | |
| Small/Mid Cap Value Fund | 0.00 | |
| International Equity Fund | 0.00 |
For the fiscal year ended June 30, 2017, the International Equity Fund earned foreign source income of $103,718,540, which amounts to $0.22 per share, and paid foreign taxes of $8,873,873, which amounts to $0.02 per share, which it intends to pass through to its shareholders pursuant to Section 853 of the Internal Revenue Code.
| 90 | Annual Report • June 30, 2017 |
Bridge Builder Mutual Funds
FACTS | What Does the Bridge Builder Trust (“Bridge Builder”) Do with Your Personal Information? | |||
Why? | Financial companies choose how they share your personal information. Federal law gives consumers the right to limit some but not all sharing. Federal law also requires us to tell you how we collect, share and protect your personal information. Please read this notice carefully to understand what we do. | |||
What? | The types of personal information we collect and share depend on the product or service you have with us. This information can include: | |||
| * Social Security number | * Investment experience | |||
| * Account transactions | * Risk tolerance | |||
| * Transaction history | * Account transactions | |||
| When you are no longer our customer, we continue to share your information as described in this notice. | ||||
How? | All financial companies need to share customers’ personal information to run their everyday business. In the section below, we list the reasons financial companies can share their customers’ personal information; the reasons Bridge Builder chooses to share; and whether you can limit this sharing. | |||
| REASONS WE CAN SHARE YOUR PERSONAL INFORMATION | DOES BRIDGE BUILDER SHARE? | CAN YOU LIMIT THIS SHARING? | ||
| For our everyday business purposes – such as to process your transactions, maintain your account(s), respond to court orders and legal investigations, or report to credit bureaus | Yes | No | ||
| For our marketing purposes – to offer our products and services to you | No | We don’t share | ||
| For joint marketing with other financial companies | No | We don’t share | ||
| For our affiliates’ everyday business purposes – information about your transactions and experiences | Yes | No | ||
| For our affiliates’ everyday business purposes – information about your creditworthiness | No | We don’t share | ||
| For nonaffiliates to market to you | No | We don’t share |
WHO WE ARE | ||
Who is providing this notice? | Bridge Builder Trust |
WHAT WE DO | ||
How does Bridge Builder protect my personal information? | To protect your personal information from unauthorized access and use, we use security measures that comply with federal law. These measures include computer safeguards and secured files and buildings. | |
How does Bridge Builder collect my personal information? | We collect your personal information, for example, when you deposit money with us, if you ever were to give us your contact information, open an account with us, provide us account information or make a wire transfer. | |
Why can’t I limit all sharing? | Federal law gives you the right to limit only:
* Sharing for affiliates’ everyday business purposes – information about your creditworthiness * Affiliates from using your information to market to you * Sharing for nonaffiliates to market to you
State laws and individual companies may give you additional rights to limit sharing. |
DEFINITIONS | ||
Affiliates | Companies related by common ownership or control. They can be financial and nonfinancial companies.
Olive Street Investment Advisers, LLC (“Olive Street”), our investment adviser, may be deemed to be affiliated with us. Olive Street is a wholly owned subsidiary of The Jones Financial Companies, L.L.L.P. (“JFC”), and is affiliated with other subsidiaries of JFC, including Edward D. Jones & Co., L.P., and Edward Jones Trust Company. | |
Nonaffiliates | Companies not related by common ownership or control. They can be financial and nonfinancial companies.
Bridge Builder does not share with non-affiliates so they can market to you. | |
Joint Marketing | A formal agreement between nonaffiliated financial companies that together market financial products or services to you.
Bridge Builder does not currently engage in joint marketing efforts. |
| Questions? Call 855-823-3611 or go to www.bridgebuildermutualfunds.com |
| Annual Report • June 30, 2017 | 91 |
Investment Adviser
Olive Street Investment Advisers, LLC
12555 Manchester Road
St. Louis, MO 63131
Administrator, Fund Accountant & Transfer Agent
U.S. Bancorp Fund Services, LLC
615 East Michigan Street
Milwaukee, WI 53202
Distributor
Quasar Distributors, LLC
615 East Michigan Street
Milwaukee, WI 53202
Custodian
U.S. Bank, N.A.
1555 North RiverCenter Drive, Suite 302
Milwaukee, WI 53212
Legal Counsel
Morgan Lewis & Bockius, LLP
1701 Market Street
Philadelphia, PA 19103
Independent Registered Public Accounting Firm
PricewaterhouseCoopers LLP
One North Wacker
Chicago, IL 60606

Bridge Builder Mutual Funds
Bridge Builder mutual funds, available exclusively through Edward Jones Advisory Solutions®, provide investors diversified expertise from leading asset management firms. The management of Bridge Builder mutual funds is rooted in our investment philosophy of diversification, a long-term approach and high quality.
Visit www.bridgebuildermutualfunds.com for more information.
Enroll in e-delivery
Add convenience and organization to your financial life by signing up for e-delivery. Visit www.edwardjones.com/edelivery to learn more and enroll. DES-8308-A
Item 2. Code of Ethics.
The registrant has adopted a code of ethics that applies to the registrant’s principal executive officer and principal financial officer. The registrant has not made any amendments to its code of ethics during the period covered by this report. The registrant has not granted any waivers from any provisions of the code of ethics during the period covered by this report.
Incorporated by reference to the Registrant’s Form N-CSR filed December 16, 2015.
Item 3. Audit Committee Financial Expert.
The registrant’s board of trustees has determined that John Tesoro and William Scheffel are the “audit committee financial experts” and are considered to be “independent” as each term is defined in Item 3 of Form N-CSR.
Item 4. Principal Accountant Fees and Services.
The registrant has engaged its principal accountant to perform audit services, audit-related services, and tax services during the past two fiscal years. “Audit fees” refer to performing an audit of the registrant’s annual financial statements or services that are normally provided by the accountant in connection with statutory and regulatory filings or engagements for those fiscal years. “Audit-related fees” refer to the assurance and related services by the principal accountant that are reasonably related to the performance of the audit. “Tax fees” refer to professional services rendered by the principal accountant for tax compliance, tax advice, and tax planning. The following table details the aggregate fees billed or expected to be billed for the last two fiscal years for audit fees, audit-related fees, tax fees and other fees by the principal accountant.
| FYE 6/30/2017 | FYE 6/30/2016 | |||||||
Audit Fees | $ | 434,975 | $ | 409,250 | ||||
Audit-Related Fees | ||||||||
Tax Fees | $ | 56,018 | $ | 64,007 | ||||
All Other Fees | ||||||||
The audit committee has adopted pre-approval policies and procedures that require the audit committee to pre-approve all audit and non-audit services of the registrant, including services provided to any entity affiliated with the registrant.
The percentage of services described in each of paragraphs (b) through (d) of this Item that were approved by the audit committee pursuant to paragraph (c)(7)(i)(C) of Rule 2-01 of Regulation S-X were as follows:
| FYE 6/30/2017 | FYE 6/30/2016 | |||||||
Audit-Related Fees | 0 | % | 0 | % | ||||
Tax Fees | 0 | % | 0 | % | ||||
All Other Fees | 0 | % | 0 | % | ||||
All of the principal accountant’s hours spent on auditing the registrant’s financial statements were attributed to work performed by full-time permanent employees of the principal accountant. The following table indicates the non-audit fees billed or expected to be billed by the registrant’s accountant for services to the registrant and to the registrant’s investment adviser (and any entity controlling, controlled by, or under common control with the investment adviser) for the last two years.
Non-Audit Related Fees | FYE 6/30/2017 | FYE 6/30/2016 | ||||||
Registrant | $ | 56,018 | $ | 64,007 | ||||
Registrant’s Investment Adviser | $ | 0 | $ | 0 | ||||
Item 5. Audit Committee of Listed Registrants.
Not applicable to registrants who are not listed issuers (as defined in Rule 10A-3 under the Securities Exchange Act of 1934).
Item 6. Investments.
Bridge Builder Core Bond Fund
Schedule of Investments
June 30, 2017
| Principal Amount | Value | |||||||
BONDS & NOTES - 97.65% | ||||||||
Asset-Backed Obligations - 10.28% | ||||||||
A Voce CLO Ltd. | ||||||||
2.32%, 07/15/2026 (Acquired 03/16/2017, Cost $6,500,000) (1) | $ | 6,500,000 | $ | 6,500,208 | ||||
ABFC 2005-AQ1 Trust | ||||||||
4.80%, 01/25/2034 | 497,912 | 504,776 | ||||||
ABFC 2006-OPT1 Trust | ||||||||
1.37%, 09/25/2036 | 4,500,221 | 4,257,515 | ||||||
Academic Loan Funding Trust 2012-1 | ||||||||
2.02%, 12/27/2022 (Acquired 10/28/2013 through 11/14/2014, Cost $252,761) (1) | 252,258 | 252,705 | ||||||
Academic Loan Funding Trust 2013-1 | ||||||||
2.02%, 12/26/2044 (Acquired 11/15/2013, Cost $1,085,037) (1) | 1,091,494 | 1,086,268 | ||||||
Accredited Mortgage Loan Trust 2006-2 | ||||||||
1.37%, 09/25/2036 | 229,949 | 229,670 | ||||||
AJAX Mortgage Loan Trust | ||||||||
3.47%, 04/25/2057 (Acquired 05/19/2017, Cost $1,045,683) (1) | 1,045,799 | 1,043,900 | ||||||
AJAX Mortgage Loan Trust 2016-2 | ||||||||
4.13%, 10/25/2056 (Acquired 10/20/2016, Cost $1,283,533) (1) | 1,285,816 | 1,281,344 | ||||||
AJAX Mortgage Loan Trust 2016-C | ||||||||
4.00%, 10/25/2057 (Acquired 10/21/2016, Cost $2,841,799) (1) | 2,841,799 | 2,830,157 | ||||||
American Credit Acceptance Receivables Trust 2015-2 | ||||||||
4.32%, 05/12/2021 (Acquired 06/17/2015, Cost $979,934) (1) | 980,000 | 999,337 | ||||||
American Credit Acceptance Receivables Trust 2016-3 | ||||||||
1.70%, 11/12/2020 (Acquired 07/22/2016, Cost $594,990) (1) | 595,005 | 594,172 | ||||||
American Credit Acceptance Receivables Trust 2016-4 | ||||||||
2.91%, 02/13/2023 (Acquired 11/04/2016, Cost $1,411,861) (1) | 1,412,000 | 1,417,770 | ||||||
American Credit Acceptance Receivables Trust 2017-2 | ||||||||
2.86%, 06/12/2023 (Acquired 05/23/2017, Cost $5,995,089) (1) | 5,996,000 | 5,988,154 | ||||||
3.69%, 06/12/2023 (Acquired 05/23/2017, Cost $3,659,599) (1) | 3,660,000 | 3,654,621 | ||||||
American Express Credit Account Master Trust | ||||||||
1.93%, 09/15/2022 | 20,818,000 | 20,863,735 | ||||||
1.44%, 09/16/2024 | 17,400,000 | 17,511,304 | ||||||
American Express Credit Account Master Trust 2013-1 | ||||||||
1.86%, 02/16/2021 | 5,250,000 | 5,273,135 | ||||||
American Homes 4 Rent 2014-SFR2 Trust | ||||||||
3.79%, 10/17/2036 (Acquired 07/16/2015 through 03/23/2017, Cost $4,065,252) (1) | 3,954,188 | 4,130,795 | ||||||
4.29%, 10/17/2036 (Acquired 09/18/2014, Cost $300,372) (1) | 300,000 | 314,567 | ||||||
6.23%, 10/17/2036 (Acquired 04/02/2015, Cost $1,075,359) (1) | 1,000,000 | 1,108,709 | ||||||
American Homes 4 Rent 2014-SFR3 Trust | ||||||||
4.60%, 12/17/2036 (Acquired 04/06/2015 through 11/12/2015, Cost $615,383) (1) | 600,000 | 633,292 | ||||||
6.42%, 12/17/2036 (Acquired 04/01/2015 through 04/22/2015, Cost $1,088,919) (1) | 1,000,000 | 1,121,957 | ||||||
3.47%, 04/17/2052 (Acquired 04/01/2015 through 04/13/2015, Cost $2,192,977) (1) | 2,161,660 | 2,229,432 | ||||||
5.64%, 04/17/2052 (Acquired 04/01/2015 through 01/14/2016, Cost $1,446,311) (1) | 1,400,000 | 1,504,092 | ||||||
American Homes 4 Rent 2015-SFR2 Trust | ||||||||
3.73%, 10/17/2045 (Acquired 09/14/2015 through 03/22/2017, Cost $1,882,757) (1) | 1,873,479 | 1,965,783 | ||||||
AmeriCredit Automobile Receivables 2015-4 | ||||||||
1.84%, 04/08/2019 | 1,583,476 | 1,584,033 | ||||||
AmeriCredit Automobile Receivables 2016-1 | ||||||||
1.84%, 06/10/2019 | 1,481,182 | 1,482,218 | ||||||
AmeriCredit Automobile Receivables Trust | ||||||||
1.51%, 05/18/2020 | 4,703,000 | 4,699,557 | ||||||
2.30%, 02/18/2022 | 1,153,000 | 1,154,409 | ||||||
2.71%, 08/18/2022 | 618,000 | 621,218 | ||||||
3.13%, 01/18/2023 | 1,387,000 | 1,392,358 | ||||||
AmeriCredit Automobile Receivables Trust 2016-2 | ||||||||
1.42%, 10/08/2019 | 1,260,034 | 1,259,668 | ||||||
1.79%, 10/08/2019 | 3,543,449 | 3,547,923 | ||||||
1.60%, 11/09/2020 | 342,000 | 341,953 | ||||||
AmeriCredit Automobile Receivables Trust 2016-3 | ||||||||
1.65%, 11/08/2019 | 1,897,186 | 1,899,998 | ||||||
Americredit Automobile Receivables Trust 2016-4 | ||||||||
1.83%, 12/08/2021 | 900,000 | 892,410 | ||||||
AmeriCredit Automobile Receivables Trust 2017-2 | ||||||||
3.42%, 04/18/2023 | 6,000,000 | 6,042,570 | ||||||
| Principal Amount | Value | |||||||
Ameriquest Mortgage Securities, Inc. Asset-Backed Pass-Through Certificates Series 2003-13 | ||||||||
5.08%, 01/25/2034 | 2,332 | 2,532 | ||||||
Amortizing Residential Collateral Trust 2002-BC5 | ||||||||
2.25%, 07/25/2032 | 3,552,218 | 3,517,589 | ||||||
Anchor Assets IX LLC | ||||||||
5.13%, 02/15/2020 (Acquired 04/04/2016 through 12/13/2016, Cost $7,489,236) (1)(7)(8) | 7,500,000 | 7,500,000 | ||||||
Arcadia Receivables Credit Trust 2017-1 | ||||||||
3.25%, 06/15/2023 (Acquired 03/07/2017, Cost $4,957,816) (1) | 4,957,816 | 4,971,435 | ||||||
Argent Securities, Inc. | ||||||||
2.36%, 03/25/2034 | 3,570,651 | 3,437,139 | ||||||
Argent Securities, Inc. Asset Back Pass Through Certificates Series 2004-W5 | ||||||||
2.26%, 04/25/2034 | 3,667,317 | 3,439,273 | ||||||
Argent Securities, Inc. Asset-Backed Pass-Through Certificates Series 2005-W3 | ||||||||
1.56%, 11/25/2035 | 3,984,631 | 3,942,460 | ||||||
Asset Backed Securities Corp. Home Equity Loan Trust Series 2003-HE6 | ||||||||
1.90%, 11/25/2033 | 1,862,969 | 1,794,216 | ||||||
Asset Backed Securities Corp. Home Equity Loan Trust Series 2004-HE6 | ||||||||
1.94%, 09/25/2034 | 1,343,065 | 1,342,444 | ||||||
Asset Backed Securities Corp. Home Equity Loan Trust Series OOMC 2006-HE3 | ||||||||
1.39%, 03/25/2036 | 3,038,542 | 3,003,370 | ||||||
Asset Backed Securities Corp. Home Equity Loan Trust Series AEG 2006-HE1 | ||||||||
1.43%, 01/25/2036 | 5,984,525 | 5,907,771 | ||||||
Asset-Backed Pass-Through Certificates Series 2004-R2 | ||||||||
2.00%, 04/25/2034 | 479,864 | 479,151 | ||||||
Atlas Senior Loan Fund IV Ltd. | ||||||||
2.68%, 02/17/2026 (Acquired 12/13/2013 through 04/01/2015, Cost $15,219,338) (1) | 15,250,000 | 15,253,645 | ||||||
Atlas Senior Loan Fund Ltd. | ||||||||
0.00%, 01/15/2030 (Acquired 06/23/2017, Cost $3,750,000) (1) | 3,750,000 | 3,750,000 | ||||||
Atlas Senior Loan Fund V Ltd. | ||||||||
2.59%, 07/16/2026 (Acquired 10/07/2016, Cost $4,250,000) (1) | 4,250,000 | 4,256,723 | ||||||
Avis Budget Rental Car Funding AESOP LLC | ||||||||
1.92%, 09/20/2019 (Acquired 12/17/2014, Cost $4,894,008) (1) | 4,900,000 | 4,897,722 | ||||||
2.46%, 07/20/2020 (Acquired 02/05/2014 through 06/27/2014, Cost $10,303,004) (1) | 10,300,000 | 10,327,327 | ||||||
2.50%, 07/20/2021 (Acquired 01/22/2015, Cost $7,899,456) (1) | 7,900,000 | 7,864,107 | ||||||
2.63%, 12/20/2021 (Acquired 05/20/2015, Cost $6,599,356) (1) | 6,600,000 | 6,562,247 | ||||||
AXIS Equipment Finance Receivables III LLC | ||||||||
1.90%, 03/20/2020 (Acquired 04/16/2015, Cost $542,517) (1) | 542,526 | 542,170 | ||||||
AXIS Equipment Finance Receivables IV LLC | ||||||||
2.21%, 11/20/2021 (Acquired 10/20/2016, Cost $1,598,618) (1) | 1,598,677 | 1,592,064 | ||||||
B2R Mortgage Trust 2015-1 | ||||||||
2.52%, 05/15/2048 (Acquired 04/07/2015 through 03/22/2017, Cost $1,209,583) (1) | 1,210,428 | 1,201,949 | ||||||
B2R Mortgage Trust 2015-2 | ||||||||
3.34%, 11/15/2048 (Acquired 11/10/2015, Cost $2,881,720) (1) | 2,881,738 | 2,917,065 | ||||||
BA Credit Card Trust | ||||||||
1.36%, 09/15/2020 | 1,200,000 | 1,199,079 | ||||||
1.95%, 08/15/2022 | 7,548,000 | 7,572,945 | ||||||
Battalion CLO IV Ltd. | ||||||||
2.29%, 10/22/2025 (Acquired 03/22/2017, Cost $5,000,000) (1) | 5,000,000 | 4,997,470 | ||||||
Battalion CLO V Ltd. | ||||||||
2.33%, 04/17/2026 (Acquired 03/22/2017, Cost $2,750,000) (1) | 2,750,000 | 2,748,614 | ||||||
Battalion CLO VI Ltd. | ||||||||
2.34%, 10/17/2026 (Acquired 04/04/2017, Cost $2,100,000) (1) | 2,100,000 | 2,099,750 | ||||||
Battalion CLO VII Ltd. | ||||||||
2.35%, 10/17/2026 (Acquired 03/22/2017, Cost $4,000,000) (1) | 4,000,000 | 3,997,984 | ||||||
Bayview Financial Mortgage Pass-Through Trust 2007-B | ||||||||
6.83%, 08/28/2047 | 227,396 | 204,397 | ||||||
Bayview Opportunity Master Fund IIa Trust 2016-RPL3 | ||||||||
3.47%, 07/28/2031 (Acquired 07/15/2016, Cost $490,747) (1) | 490,747 | 488,593 | ||||||
Bayview Opportunity Master Fund IIIa Trust 2016-RN3 | ||||||||
3.60%, 09/29/2031 (Acquired 09/26/2016, Cost $982,341) (1) | 982,341 | 987,723 | ||||||
Bayview Opportunity Master Fund IIIb Trust 2017-RN2 | ||||||||
3.47%, 04/28/2032 (Acquired 04/21/2017, Cost $847,401) (1) | 847,401 | 846,520 | ||||||
Bayview Opportunity Master Fund IIIb Trust 2017-RN3 | ||||||||
3.23%, 05/28/2032 (Acquired 05/19/2017, Cost $2,441,086) (1) | 2,441,086 | 2,437,806 | ||||||
Bayview Opportunity Master Fund IVb Trust 2017-NPL1 | ||||||||
3.60%, 01/28/2032 (Acquired 01/26/2017, Cost $1,811,009) (1) | 1,811,009 | 1,807,258 | ||||||
BCC Funding Co. X | ||||||||
2.22%, 10/20/2020 (Acquired 06/17/2015, Cost $928,828) (1) | 928,830 | 927,885 | ||||||
BCC Funding XIII LLC | ||||||||
2.20%, 12/20/2021 (Acquired 09/14/2016, Cost $2,421,157) (1) | 2,421,371 | 2,420,761 | ||||||
| Principal Amount | Value | |||||||
Bear Stearns Asset Backed Securities I Trust 2004-HE6 | ||||||||
2.07%, 08/25/2034 | 7,536,175 | 7,145,464 | ||||||
Bear Stearns Asset Backed Securities I Trust 2004-HE7 | ||||||||
2.12%, 08/25/2034 | 924,542 | 891,107 | ||||||
Bear Stearns Asset Backed Securities Trust 2003-2 | ||||||||
2.72%, 03/25/2043 | 4,683,753 | 4,626,174 | ||||||
Bear Stearns Asset Backed Securities Trust 2006-SD1 | ||||||||
1.59%, 04/25/2036 | 36,690 | 35,853 | ||||||
Benefit Street Partners CLO VII Ltd. | ||||||||
2.69%, 07/18/2027 (Acquired 03/11/2016, Cost $1,981,099) (1) | 2,000,000 | 2,000,228 | ||||||
BlueMountain CLO 2015-1 Ltd. | ||||||||
2.49%, 04/13/2027 (Acquired 12/13/2016, Cost $775,000) (1) | 775,000 | 777,819 | ||||||
BMW Vehicle Owner Trust 2014-A | ||||||||
0.97%, 11/26/2018 | 74,961 | 74,930 | ||||||
BXG Receivables Note Trust 2012-A | ||||||||
2.66%, 12/02/2027 (Acquired 10/28/2013, Cost $312,826) (1) | 314,989 | 311,748 | ||||||
CAM Mortgage Trust 2016-2 | ||||||||
3.25%, 06/15/2057 (Acquired 05/10/2017, Cost $980,100) (1) | 975,276 | 976,487 | ||||||
CAM Mortgage Trust 2017-1 | ||||||||
3.22%, 08/01/2057 (Acquired 03/17/2017, Cost $1,945,131) (1) | 1,945,292 | 1,946,611 | ||||||
Camillo Issuer LLC 2016-SFR1 A | ||||||||
5.00%, 12/05/2023 (7)(8) | 5,147,228 | 5,135,969 | ||||||
Capital Auto Receivables Asset Trust 2016-2 | ||||||||
1.32%, 01/22/2019 | 621,791 | 621,515 | ||||||
Capital Auto Receivables Asset Trust 2016-3 | ||||||||
1.36%, 04/22/2019 | 1,914,635 | 1,913,787 | ||||||
Capital One Multi-Asset Execution Trust | ||||||||
1.61%, 02/15/2022 | 8,584,000 | 8,634,499 | ||||||
2.00%, 01/17/2023 | 17,500,000 | 17,571,748 | ||||||
1.57%, 01/15/2025 | 6,284,000 | 6,312,740 | ||||||
2.43%, 01/15/2025 | 5,385,000 | 5,457,690 | ||||||
CarFinance Capital Auto Trust 2014-1 | ||||||||
2.72%, 04/15/2020 (Acquired 03/17/2014, Cost $182,658) (1) | 182,667 | 183,287 | ||||||
CarFinance Capital Auto Trust 2014-2 | ||||||||
1.44%, 11/16/2020 (Acquired 07/29/2014, Cost $479,582) (1) | 479,591 | 479,107 | ||||||
CarFinance Capital Auto Trust 2015-1 | ||||||||
1.75%, 06/15/2021 (Acquired 02/18/2015 through 10/05/2016, Cost $1,866,996) (1) | 1,871,114 | 1,870,936 | ||||||
Carlyle Global Market Strategies CLO 2014-3 Ltd. | ||||||||
2.32%, 07/27/2026 (Acquired 02/24/2017, Cost $3,000,000) (1) | 3,000,000 | 2,998,482 | ||||||
Carlyle US CLO 2017-1 Ltd. | ||||||||
2.39%, 04/20/2031 (Acquired 03/08/2017, Cost $5,469,200) (1)(8) | 5,500,000 | 5,502,288 | ||||||
Carlyle US CLO 2017-2 Ltd. | ||||||||
0.00%, 07/20/2031 (Acquired 05/18/2017, Cost $2,983,200) (1) | 3,000,000 | 2,990,382 | ||||||
CarMax Auto Owner Trust | ||||||||
1.93%, 03/15/2022 | 8,359,000 | 8,365,658 | ||||||
CarMax Auto Owner Trust 2013-4 | ||||||||
1.28%, 05/15/2019 | 186,690 | 186,563 | ||||||
CarMax Auto Owner Trust 2014-2 | ||||||||
0.98%, 01/15/2019 | 290,595 | 290,362 | ||||||
CarMax Auto Owner Trust 2016-4 | ||||||||
1.40%, 08/15/2021 | 5,788,000 | 5,740,607 | ||||||
Carnow Auto Receivables Trust 2016-1 | ||||||||
2.26%, 05/15/2019 (Acquired 12/09/2016, Cost $2,253,155) (1) | 2,253,186 | 2,254,505 | ||||||
3.49%, 02/15/2021 (Acquired 12/09/2016, Cost $2,249,771) (1) | 2,250,000 | 2,259,642 | ||||||
Carrington Mortgage Loan Trust Series 2006-OPT1 | ||||||||
1.40%, 02/25/2036 | 784,108 | 778,462 | ||||||
Catamaran CLO 2014-1 Ltd. | ||||||||
2.71%, 04/20/2026 (Acquired 04/02/2014, Cost $5,491,744) (1) | 5,500,000 | 5,500,929 | ||||||
2.96%, 04/20/2026 (Acquired 04/02/2014, Cost $4,396,740) (1) | 4,500,000 | 4,450,221 | ||||||
Catamaran CLO 2014-2 Ltd. | ||||||||
2.56%, 10/18/2026 (Acquired 11/17/2016, Cost $1,000,000) (1) | 1,000,000 | 1,000,774 | ||||||
Catamaran CLO 2015-1 Ltd. | ||||||||
2.70%, 04/22/2027 (Acquired 03/31/2015 through 04/29/2016, Cost $2,243,040) (1) | 2,250,000 | 2,250,257 | ||||||
Chase Funding Trust Series 2003-4 | ||||||||
5.32%, 05/25/2033 | 172,290 | 175,136 | ||||||
Chase Funding Trust Series 2003-6 | ||||||||
4.28%, 11/25/2034 | 473,370 | 483,646 | ||||||
5.12%, 11/25/2034 | 278,023 | 287,166 | ||||||
Chase Issuance Trust | ||||||||
1.71%, 06/15/2023 | 19,794,000 | 19,955,719 | ||||||
| Principal Amount | Value | |||||||
1.56%, 03/15/2024 | 7,100,000 | 7,121,482 | ||||||
Citi Held For Asset Issuance 2016-MF1 | ||||||||
4.48%, 08/15/2022 (Acquired 02/26/2016, Cost $1,209,393) (1) | 1,210,627 | 1,226,001 | ||||||
6.64%, 08/15/2022 (Acquired 02/26/2016, Cost $3,239,693) (1) | 3,250,000 | 3,388,333 | ||||||
Citibank Credit Card Issuance Trust | ||||||||
1.74%, 01/19/2021 | 13,395,000 | 13,412,056 | ||||||
1.84%, 04/22/2026 | 10,900,000 | 10,956,621 | ||||||
Citigroup Mortgage Loan Trust, Inc. | ||||||||
1.58%, 10/25/2035 | 418,367 | 418,159 | ||||||
CLUB Credit Trust 2017-NP1 | ||||||||
2.39%, 04/17/2023 (Acquired 06/14/2017, Cost $1,545,995) (1) | 1,546,000 | 1,546,532 | ||||||
3.17%, 04/17/2023 (Acquired 06/14/2017, Cost $1,999,991) (1) | 2,000,000 | 2,002,872 | ||||||
Colony American Finance 2016-2 Ltd. | ||||||||
2.55%, 11/15/2048 (Acquired 11/02/2016, Cost $1,342,231) (1) | 1,342,272 | 1,315,165 | ||||||
Conseco Financial Co. | ||||||||
6.40%, 10/15/2018 | 1,626 | 1,626 | ||||||
6.24%, 12/01/2028 | 36,486 | 37,702 | ||||||
6.22%, 03/01/2030 | 93,417 | 99,748 | ||||||
6.18%, 04/01/2030 | 27,932 | 29,463 | ||||||
Continental Credit Card 2016-1 | ||||||||
4.56%, 01/15/2023 (Acquired 12/13/2016, Cost $1,078,686) (1) | 1,078,688 | 1,078,583 | ||||||
COOF Securitization Trust 2014-1 Ltd. | ||||||||
3.03%, 06/25/2040 IO (Acquired 05/16/2014, Cost $367,493) (1) | 2,056,760 | 190,528 | ||||||
Countrywide Asset-Backed Certificates | ||||||||
5.12%, 02/25/2035 | 56,535 | 57,193 | ||||||
4.54%, 02/25/2036 | 239,347 | 244,928 | ||||||
4.74%, 04/25/2036 | 160,580 | 148,124 | ||||||
4.63%, 09/25/2046 | 100,485 | 87,284 | ||||||
CPS Auto Receivables Trust 2013-A | ||||||||
1.31%, 06/15/2020 (Acquired 10/28/2013, Cost $148,353) (1) | 148,454 | 148,101 | ||||||
CPS Auto Receivables Trust 2014-C | ||||||||
1.31%, 02/15/2019 (Acquired 09/09/2014 through 06/18/2015, Cost $125,016) (1) | 125,023 | 125,004 | ||||||
3.77%, 08/17/2020 (Acquired 09/09/2014, Cost $557,984) (1) | 558,000 | 567,518 | ||||||
CPS Auto Receivables Trust 2014-D | ||||||||
1.49%, 04/15/2019 (Acquired 12/10/2014 through 10/05/2016, Cost $284,914) (1) | 284,905 | 284,835 | ||||||
4.35%, 11/16/2020 (Acquired 12/10/2014, Cost $524,983) (1) | 525,000 | 536,792 | ||||||
CPS Auto Receivables Trust 2015-A | ||||||||
1.53%, 07/15/2019 (Acquired 03/19/2015 through 10/05/2016, Cost $476,011) (1) | 476,007 | 475,769 | ||||||
4.00%, 02/16/2021 (Acquired 03/19/2015, Cost $445,969) (1) | 446,000 | 455,026 | ||||||
CPS Auto Receivables Trust 2015-B | ||||||||
1.65%, 11/15/2019 (Acquired 06/09/2015 through 12/13/2016, Cost $1,401,860) (1) | 1,401,828 | 1,402,456 | ||||||
4.20%, 05/17/2021 (Acquired 06/09/2015, Cost $1,904,951) (1) | 1,905,000 | 1,927,790 | ||||||
CPS Auto Receivables Trust 2015-C | ||||||||
1.77%, 06/17/2019 (Acquired 09/11/2015 through 10/20/2016, Cost $1,077,592) (1) | 1,077,348 | 1,077,802 | ||||||
4.63%, 08/16/2021 (Acquired 09/11/2015, Cost $1,375,869) (1) | 1,376,000 | 1,403,969 | ||||||
CPS Auto Receivables Trust 2016-A | ||||||||
2.25%, 10/15/2019 (Acquired 01/22/2016, Cost $763,802) (1) | 763,808 | 765,387 | ||||||
CPS Auto Receivables Trust 2016-B | ||||||||
2.07%, 11/15/2019 (Acquired 04/14/2016 through 05/20/2016, Cost $2,670,157) (1) | 2,669,781 | 2,673,142 | ||||||
CPS Auto Receivables Trust 2016-C | ||||||||
1.62%, 01/15/2020 (Acquired 07/18/2016, Cost $5,210,120) (1) | 5,210,120 | 5,206,267 | ||||||
3.27%, 06/15/2022 (Acquired 07/18/2016, Cost $839,940) (1) | 840,000 | 847,063 | ||||||
CPS Auto Receivables Trust 2017-B | ||||||||
2.92%, 02/15/2022 (Acquired 04/11/2017, Cost $1,440,814) (1) | 1,441,000 | 1,440,109 | ||||||
3.95%, 03/15/2023 (Acquired 04/11/2017, Cost $3,484,222) (1) | 3,485,000 | 3,485,427 | ||||||
CPS Auto Trust | ||||||||
1.50%, 06/15/2020 (Acquired 10/13/2016, Cost $5,235,333) (1) | 5,235,594 | 5,225,395 | ||||||
Credit Acceptance Auto Loan Trust 2014-2 | ||||||||
1.88%, 03/15/2022 (Acquired 09/01/2015 through 02/22/2016, Cost $489,448) (1) | 489,953 | 490,029 | ||||||
Credit Acceptance Auto Loan Trust 2015-2 | ||||||||
2.40%, 02/15/2023 (Acquired 08/12/2015, Cost $2,820,940) (1) | 2,821,000 | 2,831,565 | ||||||
3.76%, 02/15/2024 (Acquired 08/12/2015, Cost $433,999) (1) | 434,000 | 439,217 | ||||||
Credit Acceptance Auto Loan Trust 2017-1 | ||||||||
2.56%, 10/15/2025 (Acquired 02/14/2017, Cost $1,986,918) (1) | 1,987,000 | 1,993,082 | ||||||
3.04%, 12/15/2025 (Acquired 02/14/2017, Cost $870,849) (1) | 871,000 | 872,806 | ||||||
3.48%, 02/17/2026 (Acquired 02/14/2017, Cost $729,951) (1) | 730,000 | 735,782 | ||||||
Credit Acceptance Auto Loan Trust 2017-2 | ||||||||
3.35%, 06/15/2026 (Acquired 06/20/2017, Cost $810,988) (1)(8) | 811,000 | 810,987 | ||||||
Credit-Based Asset Servicing & Securitization LLC | ||||||||
3.90%, 12/25/2035 | 13,900 | 13,851 | ||||||
| Principal Amount | Value | |||||||
CSMC 2016-RPL1 Trust | ||||||||
4.15%, 12/26/2046 (Acquired 11/28/2016 through 01/01/2017, Cost $12,692,061) (1) | 12,721,122 | 12,500,513 | ||||||
CWABS Asset-Backed Certificates Trust 2004-15 | ||||||||
4.61%, 04/25/2035 | 34,410 | 34,594 | ||||||
CWABS Asset-Backed Certificates Trust 2005-1 | ||||||||
5.03%, 07/25/2035 | 61,730 | 62,941 | ||||||
CWABS Asset-Backed Certificates Trust 2005-11 | ||||||||
4.67%, 02/25/2036 | 302,580 | 305,522 | ||||||
CWABS Asset-Backed Certificates Trust 2005-17 | ||||||||
4.64%, 05/25/2036 | 41,532 | 70,082 | ||||||
CWABS, Inc. Asset-Backed Certificates Series 2003-5 | ||||||||
5.27%, 01/25/2034 | 27,435 | 27,313 | ||||||
CWABS, Inc. Asset-Backed Certificates Series 2003-BC1 | ||||||||
2.02%, 03/25/2033 | 828,605 | 809,718 | ||||||
CWABS, Inc. Asset-Backed Certificates Series 2004-1 | ||||||||
1.97%, 03/25/2034 | 56,719 | 56,601 | ||||||
2.04%, 03/25/2034 | 9,211 | 8,963 | ||||||
1.78%, 04/25/2034 | 1,112 | 1,097 | ||||||
CWABS, Inc. Asset-Backed Certificates Trust 2004-6 | ||||||||
2.12%, 10/25/2034 | 23,374 | 22,354 | ||||||
2.00%, 11/25/2034 | 1,099,518 | 1,090,133 | ||||||
CWHEQ Home Equity Loan Trust Series 2007-S1 | ||||||||
5.69%, 11/25/2036 | 14,525 | 14,357 | ||||||
Discover Card Execution Note Trust | ||||||||
1.39%, 03/15/2022 | 13,393,000 | 13,280,842 | ||||||
1.82%, 12/15/2026 | 2,987,000 | 3,002,876 | ||||||
Drive Auto Receivables Trust 2015-A | ||||||||
4.12%, 07/15/2022 (Acquired 03/12/2015, Cost $1,765,839) (1) | 1,766,000 | 1,788,643 | ||||||
Drive Auto Receivables Trust 2015-B | ||||||||
3.84%, 07/15/2021 (Acquired 05/20/2015, Cost $1,920,797) (1) | 1,921,000 | 1,949,977 | ||||||
Drive Auto Receivables Trust 2015-C | ||||||||
4.20%, 09/15/2021 (Acquired 07/15/2015, Cost $926,465) (1) | 926,471 | 941,407 | ||||||
Drive Auto Receivables Trust 2016-B | ||||||||
2.56%, 06/15/2020 (Acquired 05/18/2016, Cost $635,995) (1) | 636,000 | 638,093 | ||||||
Drive Auto Receivables Trust 2016-C | ||||||||
4.18%, 03/15/2024 (Acquired 11/16/2016, Cost $2,995,534) (1) | 2,996,000 | 3,059,258 | ||||||
Drive Auto Receivables Trust 2017-1 | ||||||||
1.67%, 05/15/2019 | 5,248,000 | 5,247,999 | ||||||
2.84%, 04/15/2022 | 3,543,000 | 3,552,225 | ||||||
3.84%, 03/15/2023 | 5,373,000 | 5,394,690 | ||||||
Drive Auto Receivables Trust 2017-A | ||||||||
1.48%, 03/15/2019 (Acquired 01/24/2017, Cost $9,715,010) (1) | 9,715,162 | 9,712,890 | ||||||
2.51%, 01/15/2021 (Acquired 01/24/2017, Cost $812,973) (1) | 813,000 | 816,059 | ||||||
2.98%, 01/18/2022 (Acquired 01/24/2017, Cost $1,293,869) (1) | 1,294,000 | 1,303,422 | ||||||
4.16%, 05/15/2024 (Acquired 01/24/2017, Cost $1,723,966) (1) | 1,724,000 | 1,752,815 | ||||||
Drive Auto Receivables Trust 2017-B | ||||||||
1.59%, 12/17/2018 (Acquired 03/21/2017, Cost $8,711,000) (1) | 8,711,000 | 8,710,542 | ||||||
2.20%, 05/15/2020 (Acquired 03/21/2017, Cost $4,050,729) (1) | 4,051,000 | 4,052,696 | ||||||
2.61%, 08/16/2021 (Acquired 03/21/2017, Cost $3,415,666) (1) | 3,416,000 | 3,420,953 | ||||||
3.72%, 10/17/2022 (Acquired 03/21/2017, Cost $2,981,993) (1) | 2,982,000 | 3,000,585 | ||||||
DT Auto Owner Trust 2015-2 | ||||||||
4.25%, 02/15/2022 (Acquired 06/10/2015, Cost $1,355,982) (1) | 1,356,000 | 1,384,527 | ||||||
DT Auto Owner Trust 2016-2 | ||||||||
1.73%, 08/15/2019 (Acquired 04/06/2016, Cost $180,098) (1) | 180,100 | 180,106 | ||||||
DT Auto Owner Trust 2016-3 | ||||||||
1.75%, 11/15/2019 (Acquired 06/08/2016, Cost $2,337,189) (1) | 2,337,191 | 2,338,037 | ||||||
2.65%, 07/15/2020 (Acquired 06/08/2016, Cost $1,099,918) (1) | 1,100,000 | 1,104,810 | ||||||
DT Auto Owner Trust 2016-4 | ||||||||
1.44%, 11/15/2019 (Acquired 09/28/2016, Cost $3,713,221) (1) | 3,713,340 | 3,713,339 | ||||||
2.74%, 10/17/2022 (Acquired 02/15/2017, Cost $2,998,341) (1) | 3,000,000 | 3,007,225 | ||||||
DT Auto Owner Trust 2017-1 | ||||||||
3.55%, 11/15/2022 (Acquired 02/06/2017 through 02/14/2017, Cost $4,869,741) (1) | 4,869,000 | 4,879,259 | ||||||
DT Auto Owner Trust 2017-2 | ||||||||
1.72%, 05/15/2020 (Acquired 05/09/2017, Cost $7,799,381) (1) | 7,799,420 | 7,799,695 | ||||||
3.03%, 01/17/2023 (Acquired 05/09/2017, Cost $3,025,905) (1) | 3,026,000 | 3,028,011 | ||||||
ENGS Commercial Finance Trust 2016-1 | ||||||||
2.63%, 02/22/2022 (Acquired 10/27/2016, Cost $1,303,464) (1) | 1,303,591 | 1,301,656 | ||||||
Exeter Automobile Receivables Trust 2014-2 | ||||||||
3.26%, 12/16/2019 (Acquired 05/20/2014, Cost $334,988) (1) | 335,000 | 337,090 | ||||||
Exeter Automobile Receivables Trust 2014-3 | ||||||||
| Principal Amount | Value | |||||||
2.77%, 11/15/2019 (Acquired 10/09/2014 through 02/13/2017, Cost $5,630,342) (1) | 5,617,564 | 5,629,915 | ||||||
Exeter Automobile Receivables Trust 2015-1 | ||||||||
2.84%, 03/16/2020 (Acquired 02/26/2015, Cost $1,031,415) (1) | 1,031,479 | 1,035,326 | ||||||
Exeter Automobile Receivables Trust 2015-2 | ||||||||
1.54%, 11/15/2019 (Acquired 05/12/2015, Cost $196,910) (1) | 196,913 | 196,837 | ||||||
Exeter Automobile Receivables Trust 2016-1 | ||||||||
2.35%, 07/15/2020 (Acquired 02/04/2016, Cost $963,871) (1) | 963,911 | 965,230 | ||||||
5.52%, 10/15/2021 (Acquired 02/04/2016, Cost $2,229,912) (1) | 2,230,000 | 2,323,760 | ||||||
Exeter Automobile Receivables Trust 2016-2 | ||||||||
2.21%, 07/15/2020 (Acquired 05/09/2016, Cost $773,433) (1) | 773,469 | 773,907 | ||||||
Exeter Automobile Receivables Trust 2016-3 | ||||||||
1.84%, 11/16/2020 (Acquired 10/03/2016, Cost $4,948,167) (1) | 4,948,405 | 4,936,935 | ||||||
Exeter Automobile Receivables Trust 2017-1 | ||||||||
3.95%, 12/15/2022 (Acquired 01/30/2017, Cost $834,991) (1) | 835,000 | 844,836 | ||||||
Exeter Automobile Receivables Trust 2017-2 | ||||||||
2.82%, 05/16/2022 (Acquired 04/19/2017, Cost $6,118,178) (1) | 6,119,000 | 6,106,315 | ||||||
Fifth Third Auto Trust 2014-3 | ||||||||
0.96%, 03/15/2019 | 89,912 | 89,830 | ||||||
First Investors Auto Owner Trust 2014-3 | ||||||||
1.67%, 11/16/2020 (Acquired 11/07/2014 through 12/02/2015, Cost $345,805) (1) | 346,199 | 346,246 | ||||||
First Investors Auto Owner Trust 2015-2 | ||||||||
1.59%, 12/16/2019 (Acquired 08/16/2015, Cost $290,111) (1) | 290,111 | 290,099 | ||||||
4.22%, 12/15/2021 (Acquired 08/18/2015, Cost $279,990) (1) | 280,000 | 286,516 | ||||||
First Investors Auto Owner Trust 2016-1 | ||||||||
1.92%, 05/15/2020 (Acquired 03/03/2016, Cost $363,452) (1) | 363,696 | 363,958 | ||||||
First Investors Auto Owner Trust 2016-2 | ||||||||
1.53%, 11/16/2020 (Acquired 09/12/2016, Cost $4,241,433) (1) | 4,241,639 | 4,234,585 | ||||||
First Investors Auto Owner Trust 2017-1 | ||||||||
2.67%, 04/17/2023 (Acquired 02/14/2017, Cost $2,766,443) (1) | 2,767,000 | 2,773,109 | ||||||
3.60%, 04/17/2023 (Acquired 02/14/2017, Cost $2,846,314) (1) | 2,847,000 | 2,860,934 | ||||||
FirstKey Lending 2015-SFR1 Trust | ||||||||
2.55%, 03/09/2047 (Acquired 04/09/2015 through 03/22/2017, Cost $3,256,051) (1) | 3,250,679 | 3,249,806 | ||||||
3.42%, 03/09/2047 (Acquired 04/09/2015, Cost $1,453,616) (1) | 1,442,000 | 1,447,342 | ||||||
Flagship Credit Auto Trust 2014-1 | ||||||||
2.55%, 02/18/2020 (Acquired 04/08/2014, Cost $185,454) (1) | 185,462 | 185,703 | ||||||
Flagship Credit Auto Trust 2014-2 | ||||||||
1.43%, 12/16/2019 (Acquired 10/09/2014 through 10/05/2016, Cost $203,011) (1) | 203,090 | 203,100 | ||||||
2.84%, 11/16/2020 (Acquired 10/09/2014, Cost $891,969) (1) | 892,000 | 897,786 | ||||||
3.95%, 12/15/2020 (Acquired 10/09/2014, Cost $439,972) (1) | 440,000 | 444,829 | ||||||
Flagship Credit Auto Trust 2015-1 | ||||||||
1.63%, 06/15/2020 (Acquired 03/05/2015 through 10/05/2016, Cost $658,780) (1) | 658,816 | 658,602 | ||||||
Flagship Credit Auto Trust 2015-3 | ||||||||
2.38%, 10/15/2020 (Acquired 10/28/2015, Cost $912,217) (1) | 912,218 | 913,336 | ||||||
3.68%, 03/15/2022 (Acquired 10/28/2015, Cost $567,936) (1) | 568,000 | 577,285 | ||||||
4.65%, 03/15/2022 (Acquired 10/28/2015, Cost $566,903) (1) | 567,000 | 583,396 | ||||||
Flagship Credit Auto Trust 2016-1 | ||||||||
2.77%, 12/15/2020 (Acquired 02/19/2016, Cost $1,228,728) (1) | 1,230,238 | 1,239,751 | ||||||
6.22%, 06/15/2022 (Acquired 02/19/2016, Cost $2,986,316) (1) | 3,000,000 | 3,209,160 | ||||||
Flagship Credit Auto Trust 2016-2 | ||||||||
2.28%, 05/15/2020 (Acquired 04/25/2016, Cost $715,015) (1) | 715,023 | 715,958 | ||||||
Flagship Credit Auto Trust 2016-3 | ||||||||
1.61%, 12/15/2019 (Acquired 08/02/2016, Cost $3,695,551) (1) | 3,695,577 | 3,693,817 | ||||||
Flagship Credit Auto Trust 2016-4 | ||||||||
1.47%, 03/16/2020 (Acquired 10/19/2016, Cost $2,760,840) (1) | 2,760,977 | 2,757,649 | ||||||
2.71%, 11/15/2022 (Acquired 10/19/2016, Cost $1,742,920) (1) | 1,743,000 | 1,731,579 | ||||||
Flagship Credit Auto Trust 2017-2 | ||||||||
2.96%, 07/15/2023 (Acquired 05/19/2017, Cost $5,194,079) (1) | 5,195,000 | 5,181,398 | ||||||
3.62%, 07/15/2023 (Acquired 05/19/2017, Cost $2,994,816) (1) | 2,995,000 | 2,984,765 | ||||||
Ford Credit Auto Owner Trust 2014-B | ||||||||
0.90%, 10/15/2018 | 54,416 | 54,400 | ||||||
Ford Credit Auto Owner Trust 2014-C | ||||||||
1.06%, 05/15/2019 | 335,402 | 335,039 | ||||||
Ford Credit Auto Owner Trust 2014-REV2 | ||||||||
2.31%, 04/15/2026 (Acquired 02/20/2015 through 02/23/2015, Cost $6,851,127) (1) | 6,820,000 | 6,886,097 | ||||||
Ford Credit Auto Owner Trust 2015-A | ||||||||
1.28%, 09/15/2019 | 493,221 | 492,875 | ||||||
Ford Credit Auto Owner Trust 2016-REV1 | ||||||||
2.31%, 08/15/2027 (Acquired 02/23/2016, Cost $6,998,618) (1) | 7,000,000 | 7,036,679 | ||||||
Ford Credit Auto Owner Trust 2016-REV2 | ||||||||
2.03%, 12/15/2027 (Acquired 03/09/2017, Cost $9,809,588) (1) | 10,000,000 | 9,926,134 | ||||||
| Principal Amount | Value | |||||||
Ford Credit Auto Owner Trust 2017-A | ||||||||
1.92%, 04/15/2022 | 12,721,000 | 12,721,396 | ||||||
Ford Credit Auto Owner Trust 2017-B | ||||||||
1.49%, 05/15/2020 | 9,698,000 | 9,695,313 | ||||||
Ford Credit Floorplan Master Owner Trust A | ||||||||
1.95%, 11/15/2021 | 3,011,000 | 3,014,578 | ||||||
2.07%, 05/15/2022 | 5,224,000 | 5,224,638 | ||||||
Foursight Capital Automobile Receivables Trust 2017-1 | ||||||||
3.05%, 12/15/2022 (Acquired 04/10/2017, Cost $3,999,848) (1) | 4,000,000 | 3,999,560 | ||||||
Fremont Home Loan Trust 2004-2 | ||||||||
2.07%, 07/25/2034 | 1,229,294 | 1,154,778 | ||||||
Galaxy XVIII CLO Ltd. | ||||||||
2.33%, 10/15/2026 (Acquired 03/17/2017, Cost $7,000,000) (1) | 7,000,000 | 6,996,472 | ||||||
GCAT 2015-2 | ||||||||
3.75%, 07/25/2020 (Acquired 07/22/2015 through 07/27/2015, Cost $1,426,840) (1) | 1,427,355 | 1,430,352 | ||||||
GCAT 2017-2 LLC | ||||||||
3.50%, 04/25/2047 (Acquired 04/19/2017, Cost $3,345,314) (1) | 3,351,639 | 3,337,762 | ||||||
GCAT 2017-3 LLC | ||||||||
3.35%, 04/25/2047 (Acquired 05/04/2017, Cost $2,170,814) (1) | 2,170,814 | 2,170,455 | ||||||
GCAT 2017-5 LLC | ||||||||
3.23%, 07/25/2047 (Acquired 06/23/2017, Cost $2,637,000) (1) | 2,637,000 | 2,634,832 | ||||||
GE Capital Mortgage Services, Inc. 1999-HE1 Trust | ||||||||
6.27%, 04/25/2029 | 79 | 79 | ||||||
6.71%, 04/25/2029 | 39,563 | 33,676 | ||||||
GE Mortgage Services LLC | ||||||||
6.74%, 12/25/2028 | 5 | 4 | ||||||
GLC Trust 2013-1 | ||||||||
3.00%, 07/15/2021 (Acquired 07/01/2014, Cost $169,730) (1) | 170,203 | 169,748 | ||||||
GLS Auto Receivables Trust 2015-1 | ||||||||
2.25%, 12/15/2020 (Acquired 06/26/2015, Cost $580,719) (1) | 580,719 | 580,273 | ||||||
4.43%, 12/15/2020 (Acquired 06/26/2015, Cost $953,983) (1) | 954,000 | 961,728 | ||||||
GLS Auto Receivables Trust 2016-1 | ||||||||
2.73%, 10/15/2020 (Acquired 05/12/2016, Cost $1,471,469) (1) | 1,471,539 | 1,471,567 | ||||||
4.39%, 01/15/2021 (Acquired 05/12/2016, Cost $959,987) (1) | 960,000 | 962,770 | ||||||
GM Financial Automobile Leasing Trust 2015-1 | ||||||||
1.53%, 09/20/2018 | 725,099 | 725,305 | ||||||
1.73%, 06/20/2019 | 502,000 | 502,516 | ||||||
GM Financial Consumer Automobile 2017-1 | ||||||||
1.78%, 10/18/2021 (Acquired 04/03/2017, Cost $6,975,036) (1) | 6,976,000 | 6,972,903 | ||||||
GMAT 2013-1 Trust | ||||||||
6.97%, 11/25/2043 (Acquired 11/06/2013 through 02/10/2014, Cost $503,054) (1) | 502,744 | 503,492 | ||||||
GMF Floorplan Owner Revolving Trust | ||||||||
1.66%, 05/15/2020 (Acquired 05/13/2015, Cost $4,600,000) (1) | 4,600,000 | 4,611,977 | ||||||
2.01%, 05/17/2021 (Acquired 05/24/2016, Cost $4,900,000) (1) | 4,900,000 | 4,943,610 | ||||||
GO Financial Auto Securitization Trust 2015-1 | ||||||||
3.59%, 10/15/2020 (Acquired 05/19/2015, Cost $362,365) (1) | 362,373 | 362,490 | ||||||
GO Financial Auto Securitization Trust 2015-2 | ||||||||
3.27%, 11/15/2018 (Acquired 11/19/2015, Cost $134,654) (1) | 134,654 | 134,673 | ||||||
4.80%, 08/17/2020 (Acquired 11/19/2015, Cost $1,872,912) (1) | 1,873,000 | 1,887,060 | ||||||
Gold Key Resorts 2014-A LLC | ||||||||
3.22%, 03/17/2031 (Acquired 12/01/2014, Cost $871,349) (1) | 871,482 | 874,097 | ||||||
Golden Bear 2016-R LLC | ||||||||
5.65%, 09/20/2047 (Acquired 06/23/2017, Cost $2,626,909) (1) | 2,589,700 | 2,623,522 | ||||||
Goodgreen 2017-1 Trust | ||||||||
3.74%, 10/15/2052 (Acquired 04/21/2017, Cost $2,125,721) (1) | 2,126,688 | 2,151,568 | ||||||
Green Tree Agency Advance Funding Trust I | ||||||||
2.38%, 10/15/2048 (Acquired 09/28/2016, Cost $1,186,997) (1) | 1,187,000 | 1,182,085 | ||||||
GSAA Trust | ||||||||
1.54%, 03/25/2035 | 3,821,533 | 3,807,800 | ||||||
1.49%, 06/25/2035 | 663,936 | 661,780 | ||||||
GSAMP Trust 2005-WMC2 | ||||||||
1.53%, 11/25/2035 | 3,103,199 | 3,087,112 | ||||||
GSAMP Trust 2006-HE7 | ||||||||
1.45%, 10/25/2046 | 1,756,015 | 1,733,596 | ||||||
HERO Funding II 2016-3B | ||||||||
5.24%, 09/20/2042 (Acquired 06/22/2017, Cost $2,118,282) (1) | 2,083,159 | 2,118,364 | ||||||
HERO Funding Trust 2016-3 | ||||||||
3.08%, 09/20/2042 (Acquired 09/15/2016, Cost $1,614,867) (1) | 1,614,987 | 1,645,042 | ||||||
HERO Funding Trust 2016-4A | ||||||||
3.57%, 09/20/2047 (Acquired 03/16/2017, Cost $4,646,846) (1) | 4,707,213 | 4,806,907 | ||||||
| Principal Amount | Value | |||||||
HERO Funding Trust 2017-1A | ||||||||
4.46%, 09/20/2047 (Acquired 04/21/2017, Cost $8,002,612) (1) | 7,811,587 | 8,054,274 | ||||||
Hertz Vehicle Financing LLC 2016-1 | ||||||||
2.32%, 03/25/2020 (Acquired 02/04/2016, Cost $8,699,042) (1) | 8,700,000 | 8,669,692 | ||||||
Hertz Vehicle Financing LLC 2016-4 | ||||||||
2.65%, 07/25/2022 (Acquired 06/01/2016, Cost $2,599,882) (1) | 2,600,000 | 2,546,933 | ||||||
Hilton Grand Vacations Trust 2017-A | ||||||||
2.66%, 12/26/2028 (Acquired 02/22/2017, Cost $2,744,489) (1) | 2,744,858 | 2,745,920 | ||||||
Home Equity Mortgage Loan Asset-Backed Trust Series INABS 2006-A | ||||||||
1.42%, 03/25/2036 | 61,134 | 56,980 | ||||||
Honda Auto Receivables 2014-2 Owner Trust | ||||||||
0.77%, 03/19/2018 | 14,127 | 14,123 | ||||||
Honda Auto Receivables 2017-1 Owner Trust | ||||||||
1.72%, 07/21/2021 | 10,961,000 | 10,968,129 | ||||||
2.05%, 06/21/2023 | 3,364,000 | 3,380,203 | ||||||
Honda Auto Receivables 2017-2 Owner Trust | ||||||||
1.87%, 09/15/2023 | 1,934,000 | 1,928,227 | ||||||
HSBC Home Equity Loan Trust USA 2007-3 | ||||||||
2.21%, 11/20/2036 | 72,867 | 72,970 | ||||||
Hyundai Auto Lease Securitization Trust 2017-B | ||||||||
1.97%, 07/15/2020 (Acquired 05/24/2017, Cost $8,023,606) (1) | 8,025,000 | 8,033,409 | ||||||
Hyundai Auto Receivables Trust 2014-B | ||||||||
0.90%, 12/17/2018 | 206,718 | 206,641 | ||||||
Hyundai Auto Receivables Trust 2015-B | ||||||||
1.12%, 11/15/2019 | 710,694 | 709,328 | ||||||
Imc Home Equity Loan Trust 1997-5 | ||||||||
6.88%, 11/20/2028 | 144 | 143 | ||||||
JP Morgan Mortgage Acquisition Trust 2006-CH1 | ||||||||
1.35%, 07/25/2036 | 3,518,941 | 3,479,254 | ||||||
Kabbage Asset Securitization LLC | ||||||||
4.57%, 03/15/2022 (Acquired 03/07/2017, Cost $12,846,025) (1) | 12,810,000 | 13,103,957 | ||||||
5.79%, 03/15/2022 (Acquired 03/07/2017 through 03/15/2017, Cost $3,714,651) (1) | 3,710,000 | 3,770,323 | ||||||
KGS-Alpha SBA COOF Trust | ||||||||
0.60%, 05/25/2039 IO (Acquired 10/28/2013, Cost $152,754) (1) | 4,482,850 | 71,797 | ||||||
KGS-Alpha SBA COOF Trust 2014-2 | ||||||||
3.39%, 04/25/2040 IO (Acquired 10/21/2014, Cost $376,067) (1) | 1,983,409 | 163,720 | ||||||
KSBA 2012-2 A | ||||||||
0.80%, 08/25/2038 (Acquired 02/19/2014, Cost $460,727) (1) | 6,681,744 | 146,591 | ||||||
KVK CLO 2014-1 Ltd. | ||||||||
2.48%, 05/15/2026 (Acquired 02/10/2017, Cost $7,000,000) (1) | 7,000,000 | 6,997,627 | ||||||
KVK CLO 2014-2 Ltd. | ||||||||
2.34%, 07/15/2026 (Acquired 04/04/2017, Cost $4,250,000) (1) | 4,250,000 | 4,257,935 | ||||||
KVK CLO 2014-3 Ltd. | ||||||||
2.36%, 10/15/2026 (Acquired 03/21/2017, Cost $9,250,000) (1) | 9,250,000 | 9,245,338 | ||||||
LendingClub Issuance Trust Series 2016-NP1 | ||||||||
3.75%, 06/15/2022 (Acquired 07/29/2016, Cost $688,615) (1) | 687,918 | 692,046 | ||||||
6.50%, 06/15/2022 (Acquired 03/17/2017 through 03/28/2017, Cost $4,014,225) (1) | 3,900,000 | 4,015,288 | ||||||
3.00%, 01/17/2023 (Acquired 11/30/2016, Cost $828,553) (1) | 828,553 | 831,153 | ||||||
Lendmark Funding Trust 2016-A | ||||||||
4.82%, 08/21/2023 (Acquired 02/26/2016 through 03/23/2017, Cost $2,569,729) (1) | 2,568,000 | 2,633,168 | ||||||
Lendmark Funding Trust 2017-1A | ||||||||
2.83%, 01/22/2024 (Acquired 06/22/2017, Cost $2,507,490) (1)(8) | 2,508,000 | 2,507,487 | ||||||
Lila Mexican Holdings LLC | ||||||||
4.16%, 08/11/2022 (7)(8) | 3,848,183 | 3,787,605 | ||||||
Long Beach Mortgage Loan Trust 2004-1 | ||||||||
1.97%, 02/25/2034 | 1,303,811 | 1,298,862 | ||||||
Long Beach Mortgage Loan Trust 2004-3 | ||||||||
2.07%, 07/25/2034 | 50,253 | 48,642 | ||||||
Long Beach Mortgage Loan Trust 2006-WL2 | ||||||||
1.42%, 01/25/2036 | 36,132 | 35,920 | ||||||
LV Tower 52 Issuer 2013-1 | ||||||||
5.75%, 02/15/2023 (Acquired 08/03/2015 through 02/14/2017, Cost $5,207,917) (1)(7)(8) | 5,218,694 | 5,244,787 | ||||||
7.75%, 02/15/2023 (Acquired 08/03/2015 through 02/14/2017, Cost $1,963,457) (1)(7)(8) | 1,966,997 | 1,976,832 | ||||||
Magnetite XI Ltd. | ||||||||
2.28%, 01/18/2027 (Acquired 04/03/2017, Cost $8,750,000) (1) | 8,750,000 | 8,756,466 | ||||||
Mariner Finance Issuance Trust 2017-A | ||||||||
3.62%, 02/20/2029 (Acquired 02/16/2017, Cost $2,998,855) (1) | 2,999,000 | 3,022,329 | ||||||
Marlette Funding Trust 2016-1 | ||||||||
3.06%, 01/17/2023 (Acquired 07/20/2016, Cost $1,647,178) (1) | 1,647,561 | 1,654,985 | ||||||
Marlette Funding Trust 2017-1 | ||||||||
| Principal Amount | Value | |||||||
2.83%, 03/15/2024 (Acquired 03/17/2017, Cost $4,545,837) (1) | 4,545,864 | 4,562,254 | ||||||
Marlette Funding Trust 2017-2 | ||||||||
2.39%, 07/15/2024 (Acquired 06/22/2017, Cost $12,857,972) (1) | 12,858,000 | 12,857,972 | ||||||
MASTR Asset Backed Securities Trust 2005-HE1 | ||||||||
1.94%, 05/25/2035 | 669,029 | 668,929 | ||||||
MASTR Asset Backed Securities Trust 2006-NC1 | ||||||||
1.52%, 01/25/2036 | 3,293,192 | 3,270,109 | ||||||
Mid-State Capital Co. 2006-1 Trust | ||||||||
6.08%, 10/15/2040 (Acquired 10/28/2013, Cost $858,917) (1) | 864,347 | 900,137 | ||||||
Mid-State Capital Trust 2010-1 | ||||||||
3.50%, 12/15/2045 (Acquired 10/28/2013, Cost $391,770) (1) | 383,328 | 391,088 | ||||||
5.25%, 12/15/2045 (Acquired 10/28/2013, Cost $709,353) (1) | 689,784 | 725,324 | ||||||
Mill Creek II CLO Ltd. | ||||||||
2.91%, 04/20/2028 (Acquired 03/21/2016, Cost $3,750,000) (1) | 3,750,000 | 3,811,849 | ||||||
Morgan Stanley ABS Capital I, Inc. Trust 2004-NC1 | ||||||||
2.27%, 12/27/2033 | 3,425,098 | 3,339,434 | ||||||
Morgan Stanley ABS Capital I, Inc. Trust 2004-OP1 | ||||||||
2.09%, 11/25/2034 | 5,620,012 | 5,287,547 | ||||||
Murray Hill Marketplace Trust 2016-LC1 | ||||||||
4.19%, 11/25/2022 (Acquired 02/15/2017, Cost $1,071,916) (1) | 1,064,782 | 1,074,334 | ||||||
6.15%, 11/25/2022 (Acquired 03/17/2017, Cost $3,047,355) (1) | 3,000,000 | 3,052,749 | ||||||
Nationstar HECM Loan Trust 2015-2A | ||||||||
2.88%, 11/25/2025 (Acquired 11/19/2015, Cost $269,387) (1) | 269,387 | 269,509 | ||||||
4.11%, 11/25/2025 (Acquired 11/19/2015, Cost $1,963,997) (1) | 1,964,000 | 1,981,924 | ||||||
Nationstar HECM Loan Trust 2016-1A | ||||||||
4.36%, 02/25/2026 (Acquired 02/25/2016, Cost $1,962,000) (1) | 1,962,000 | 1,961,996 | ||||||
Nationstar HECM Loan Trust 2016-2 | ||||||||
2.24%, 06/25/2026 (Acquired 06/23/2016, Cost $504,081) (1) | 504,081 | 503,570 | ||||||
Nationstar HECM Loan Trust 2016-3 | ||||||||
2.01%, 08/25/2026 (Acquired 08/11/2016, Cost $821,406) (1) | 821,407 | 819,651 | ||||||
Nationstar HECM Loan Trust 2017-1 | ||||||||
2.94%, 05/25/2027 (Acquired 05/19/2017, Cost $510,000) (1) | 510,000 | 509,228 | ||||||
Navient Student Loan Trust 2016-2 | ||||||||
1.97%, 06/25/2065 (Acquired 04/05/2016, Cost $1,287,118) (1) | 1,287,118 | 1,291,604 | ||||||
New Century Home Equity Loan Trust Series 2003-5 | ||||||||
5.14%, 11/25/2033 | 253,156 | 255,198 | ||||||
Nissan Auto Receivables 2014-B Owner Trust | ||||||||
1.11%, 05/15/2019 | 147,308 | 147,167 | ||||||
NRPL Trust 2015-1 | ||||||||
3.88%, 11/01/2054 (Acquired 02/19/2015, Cost $1,530,335) (1) | 1,530,335 | 1,524,339 | ||||||
3.88%, 11/01/2054 (Acquired 02/19/2015, Cost $960,564) (1) | 1,000,000 | 973,049 | ||||||
NRPL Trust 2015-2 | ||||||||
3.75%, 10/25/2057 (Acquired 06/04/2015, Cost $3,644,934) (1) | 3,657,630 | 3,661,235 | ||||||
3.75%, 10/25/2057 (Acquired 03/08/2016, Cost $1,160,167) (1) | 1,250,000 | 1,159,966 | ||||||
NRZ Advance Receivables Trust Advance Receivables Backed 2016-T1 | ||||||||
2.75%, 06/15/2049 (Acquired 06/23/2016, Cost $1,269,000) (1) | 1,269,000 | 1,259,071 | ||||||
NYMT Residential 2016-RP1 | ||||||||
4.00%, 03/25/2021 (Acquired 04/04/2016, Cost $474,843) (1) | 476,206 | 472,634 | ||||||
Oakwood Mortgage Investors, Inc. | ||||||||
6.45%, 11/15/2017 | 3,065 | 3,102 | ||||||
OCP CLO 2017-13 Ltd. | ||||||||
0.00%, 07/15/2030 (Acquired 06/16/2017, Cost $4,242,350) (1) | 4,250,000 | 4,244,161 | ||||||
Ocwen Master Advance Receivables Trust | ||||||||
3.21%, 11/15/2047 (Acquired 11/06/2015, Cost $4,767,959) (1)(8) | 4,768,000 | 4,756,757 | ||||||
4.20%, 11/15/2047 (Acquired 11/06/2015, Cost $729,998) (1) | 730,000 | 729,960 | ||||||
4.69%, 11/15/2047 (Acquired 11/06/2015, Cost $1,749,999) (1) | 1,750,000 | 1,750,819 | ||||||
2.52%, 08/17/2048 (Acquired 08/03/2016, Cost $2,708,998) (1) | 2,709,000 | 2,696,563 | ||||||
4.25%, 08/17/2048 (Acquired 08/03/2016, Cost $2,037,959) (1) | 2,037,963 | 2,033,757 | ||||||
3.81%, 08/16/2049 (Acquired 04/27/2017, Cost $1,450,110) (1) | 1,500,000 | 1,462,171 | ||||||
OnDeck Asset Securitization Trust II LLC | ||||||||
4.21%, 05/17/2020 (Acquired 04/27/2016 through 03/23/2017, Cost $6,992,382) (1) | 6,983,000 | 6,995,226 | ||||||
7.63%, 05/17/2020 (Acquired 04/27/2016, Cost $507,988) (1) | 508,000 | 516,916 | ||||||
OneMain Direct Auto Receivables Trust 2016-1 | ||||||||
2.04%, 01/15/2021 (Acquired 07/12/2016, Cost $2,525,878) (1) | 2,525,953 | 2,528,807 | ||||||
4.58%, 09/15/2021 (Acquired 07/12/2016, Cost $666,951) (1) | 667,000 | 677,376 | ||||||
OneMain Direct Auto Receivables Trust 2017-1 | ||||||||
2.16%, 10/15/2020 (Acquired 01/26/2017, Cost $19,499,634) (1) | 19,500,000 | 19,494,799 | ||||||
OneMain Financial Issuance Trust 2014-1 | ||||||||
2.43%, 06/18/2024 (Acquired 04/09/2014 through 04/16/2014, Cost $379,181) (1) | 379,160 | 379,304 | ||||||
3.24%, 06/18/2024 (Acquired 04/09/2014, Cost $401,959) (1) | 402,000 | 402,408 | ||||||
| Principal Amount | Value | |||||||
OneMain Financial Issuance Trust 2014-2 | ||||||||
2.47%, 09/18/2024 (Acquired 07/23/2014 through 08/04/2014, Cost $1,341,167) (1) | 1,340,813 | 1,342,562 | ||||||
3.02%, 09/18/2024 (Acquired 07/23/2014, Cost $1,864,000) (1) | 1,864,000 | 1,871,450 | ||||||
OneMain Financial Issuance Trust 2015-1 | ||||||||
3.19%, 03/18/2026 (Acquired 01/28/2015, Cost $3,451,303) (1) | 3,452,000 | 3,486,433 | ||||||
3.85%, 03/18/2026 (Acquired 02/13/2015, Cost $500,214) (1) | 500,000 | 507,086 | ||||||
OneMain Financial Issuance Trust 2015-2 | ||||||||
2.57%, 07/18/2025 (Acquired 05/12/2015 through 09/25/2015, Cost $15,848,423) (1) | 15,848,376 | 15,866,483 | ||||||
3.10%, 07/18/2025 (Acquired 05/12/2015, Cost $1,626,677) (1) | 1,627,000 | 1,623,113 | ||||||
OneMain Financial Issuance Trust 2016-1 | ||||||||
3.66%, 02/20/2029 (Acquired 09/19/2016 through 09/20/2016, Cost $2,701,133) (1) | 2,645,000 | 2,706,956 | ||||||
6.00%, 02/20/2029 (Acquired 05/12/2016, Cost $1,874,916) (1) | 1,900,000 | 1,945,419 | ||||||
OneMain Financial Issuance Trust 2016-2 | ||||||||
5.67%, 03/20/2028 (Acquired 07/19/2016, Cost $3,672,124) (1) | 3,675,000 | 3,708,619 | ||||||
Oportun Funding II LLC | ||||||||
4.70%, 03/08/2021 (Acquired 02/12/2016, Cost $2,900,873) (1) | 2,901,000 | 2,955,135 | ||||||
6.41%, 03/08/2021 (Acquired 02/12/2016, Cost $810,961) (1) | 811,000 | 829,472 | ||||||
Oportun Funding III LLC | ||||||||
3.69%, 07/08/2021 (Acquired 06/22/2016, Cost $3,331,762) (1) | 3,332,000 | 3,363,870 | ||||||
Oportun Funding IV LLC | ||||||||
4.85%, 11/08/2021 (Acquired 10/14/2016, Cost $723,592) (1) | 723,661 | 738,206 | ||||||
Oportun Funding VI LLC | ||||||||
3.23%, 06/08/2023 (Acquired 06/01/2017, Cost $1,956,720) (1) | 1,957,000 | 1,967,227 | ||||||
Option One Mortgage Loan Trust 2004-3 | ||||||||
2.12%, 11/25/2034 | 1,691,802 | 1,595,483 | ||||||
OZLM Funding II Ltd. | ||||||||
2.61%, 10/30/2027 (Acquired 10/06/2016, Cost $4,500,000) (1) | 4,500,000 | 4,505,454 | ||||||
OZLM XV Ltd. | ||||||||
2.41%, 01/20/2029 (Acquired 11/22/2016, Cost $7,725,975) (1)(8) | 7,750,000 | 7,784,875 | ||||||
Palmer Square CLO 2015-1 Ltd. | ||||||||
2.47%, 05/21/2029 (Acquired 05/11/2017, Cost $8,000,000) (1) | 8,000,000 | 7,999,920 | ||||||
Palmer Square CLO 2015-2 Ltd. | ||||||||
0.00%, 07/20/2030 (Acquired 06/27/2017, Cost $7,250,000) (1) | 7,250,000 | 7,250,000 | ||||||
Park Place Securities, Inc. Asset-Backed Pass-Through Certificates Series 2005-WCH | ||||||||
2.06%, 01/25/2036 | 4,800,000 | 4,758,420 | ||||||
PFS Tax Lien Trust 2014-1 | ||||||||
1.44%, 05/15/2029 (Acquired 04/29/2014, Cost $155,089) (1) | 155,094 | 153,909 | ||||||
Progreso Receivables Funding LLC | ||||||||
3.00%, 07/28/2020 (Acquired 06/30/2015, Cost $1,203,000) (1) | 1,203,000 | 1,207,582 | ||||||
5.00%, 07/28/2020 (Acquired 06/30/2015, Cost $605,000) (1) | 605,000 | 608,763 | ||||||
Progress Residential 2015-SFR2 Trust | ||||||||
2.74%, 06/12/2032 (Acquired 05/20/2015, Cost $3,358,777) (1) | 3,358,827 | 3,375,912 | ||||||
3.14%, 06/12/2032 (Acquired 05/20/2015, Cost $2,011,975) (1) | 2,012,000 | 2,013,640 | ||||||
3.44%, 06/12/2032 (Acquired 05/20/2015, Cost $2,137,967) (1) | 2,138,000 | 2,142,613 | ||||||
4.43%, 06/12/2032 (Acquired 05/20/2015, Cost $891,983) (1) | 892,000 | 899,873 | ||||||
Progress Residential 2015-SFR3 Trust | ||||||||
3.07%, 11/12/2032 (Acquired 10/23/2015, Cost $5,235,832) (1) | 5,235,992 | 5,313,658 | ||||||
4.67%, 11/12/2032 (Acquired 10/23/2015, Cost $294,991) (1) | 295,000 | 305,405 | ||||||
5.66%, 11/12/2032 (Acquired 10/23/2015, Cost $999,987) (1) | 1,000,000 | 1,047,053 | ||||||
Progress Residential 2016-SFR1 Trust | ||||||||
5.06%, 09/17/2033 (Acquired 07/15/2016, Cost $1,859,000) (1) | 1,859,000 | 1,940,098 | ||||||
Prosper Marketplace Issuance Trust Series 2017-1 | ||||||||
2.56%, 06/15/2023 (Acquired 05/19/2017, Cost $2,944,939) (1) | 2,945,000 | 2,951,452 | ||||||
Purchasing Power Funding 2015-1A LLC | ||||||||
4.75%, 12/15/2019 (Acquired 11/03/2015, Cost $3,500,000) (1) | 3,500,000 | 3,508,589 | ||||||
RAMP Series 2005-RS1 Trust | ||||||||
4.71%, 01/25/2035 | 8,859 | 8,941 | ||||||
RAMP Series 2006-RZ1 Trust | ||||||||
1.52%, 03/25/2036 | 63,731 | 63,711 | ||||||
RASC Series 2002-KS4 Trust | ||||||||
1.72%, 07/25/2032 | 4,305 | 3,927 | ||||||
RASC Series 2003-KS5 Trust | ||||||||
1.80%, 07/25/2033 | 4,840 | 4,575 | ||||||
3.62%, 07/25/2033 | 1,123 | 1,120 | ||||||
RASC Series 2003-KS9 Trust | ||||||||
1.86%, 11/25/2033 | 5,813 | 4,900 | ||||||
RASC Series 2004-KS2 Trust | ||||||||
4.30%, 03/25/2034 | 1,988 | 2,007 | ||||||
RASC Series 2005-KS6 Trust | ||||||||
1.84%, 07/25/2035 | 1,178,196 | 1,180,465 | ||||||
| Principal Amount | Value | |||||||
RBSHD 2013-1 Trust | ||||||||
7.69%, 10/25/2047 (Acquired 02/20/2014, Cost $530,419) (1)(7)(8) | 529,542 | 529,600 | ||||||
Renaissance Home Equity Loan Trust | ||||||||
5.61%, 04/25/2037 | 303,866 | 163,555 | ||||||
Renaissance Home Equity Loan Trust 2005-3 | ||||||||
4.81%, 11/25/2035 | 112,876 | 114,582 | ||||||
Renew 2017-1 | ||||||||
3.67%, 09/20/2052 (Acquired 04/21/2017, Cost $3,052,376) (1) | 3,052,376 | 3,042,351 | ||||||
Rice Park Financing Trust 2016-A | ||||||||
4.63%, 10/31/2041 (Acquired 11/30/2016, Cost $6,663,298) (1)(7)(8) | 6,679,447 | 7,046,295 | ||||||
Santander Drive Auto Receivables Trust 2015-2 | ||||||||
1.83%, 01/15/2020 | 2,410,908 | 2,412,482 | ||||||
Santander Drive Auto Receivables Trust 2017-1 | ||||||||
1.49%, 02/18/2020 | 2,451,000 | 2,449,197 | ||||||
2.10%, 06/15/2021 | 4,842,000 | 4,838,173 | ||||||
2.58%, 05/16/2022 | 3,957,000 | 3,956,459 | ||||||
3.17%, 04/17/2023 | 5,074,000 | 5,065,046 | ||||||
Santander Drive Auto Receivables Trust 2017-2 | ||||||||
2.79%, 08/15/2022 | 13,150,000 | 13,132,885 | ||||||
3.49%, 07/17/2023 | 1,633,000 | 1,633,334 | ||||||
Saxon Asset Securities Trust 2003-1 | ||||||||
4.80%, 06/25/2033 | 72,268 | 72,838 | ||||||
Securitized Asset Backed Receivables LLC Trust 2005-OP2 | ||||||||
1.54%, 10/25/2035 (Acquired 03/13/2014, Cost $350,931) (1) | 354,062 | 353,630 | ||||||
Securitized Asset Backed Receivables LLC Trust 2006-CB1 | ||||||||
3.44%, 01/25/2036 | 72,840 | 57,725 | ||||||
Sierra Auto Receivables Securitization Trust 2016-1 | ||||||||
2.85%, 01/18/2022 (Acquired 06/22/2016, Cost $473,745) (1) | 473,746 | 473,981 | ||||||
Silver Spring CLO Ltd. | ||||||||
2.61%, 10/15/2026 (Acquired 06/24/2016, Cost $5,868,648) (1) | 5,954,635 | 5,954,635 | ||||||
Skopos Auto Receivables Trust 2015-2 | ||||||||
3.55%, 02/15/2020 (Acquired 11/05/2015, Cost $133,543) (1) | 133,548 | 133,622 | ||||||
SMORE 2014-1A A1R MTG | ||||||||
0.00%, 05/15/2026 (8) | 8,425,273 | 8,425,273 | ||||||
SoFi Consumer Loan Program 2016-2 LLC | ||||||||
3.09%, 10/27/2025 (Acquired 07/26/2016, Cost $1,500,859) (1) | 1,501,059 | 1,513,545 | ||||||
Sound Point Clo XVI Ltd. | ||||||||
2.57%, 07/25/2030 (Acquired 05/19/2017, Cost $7,745,459) (1) | 7,750,000 | 7,750,000 | ||||||
Specialty Underwriting & Residential Finance Trust Series 2004-BC4 | ||||||||
1.89%, 10/25/2035 | 297,132 | 295,566 | ||||||
Specialty Underwriting & Residential Finance Trust Series 2006-BC1 | ||||||||
1.52%, 12/25/2036 | 1,739,387 | 1,731,896 | ||||||
SpringCastle America Funding LLC | ||||||||
3.05%, 04/25/2029 (Acquired 09/16/2016, Cost $3,059,475) (1) | 3,059,571 | 3,077,607 | ||||||
Springleaf Funding Trust 2015-A | ||||||||
3.16%, 11/15/2024 (Acquired 02/18/2015 through 02/17/2016, Cost $18,654,055) (1) | 18,692,000 | 18,861,217 | ||||||
3.62%, 11/15/2024 (Acquired 02/18/2015, Cost $1,086,792) (1) | 1,087,000 | 1,096,118 | ||||||
Springleaf Funding Trust 2017-A | ||||||||
2.68%, 07/15/2030 (Acquired 06/21/2017, Cost $9,896,995) (1) | 9,900,000 | 9,878,398 | ||||||
Structured Asset Investment Loan Trust 2004-4 | ||||||||
2.02%, 04/25/2034 | 720,327 | 684,837 | ||||||
Structured Asset Securities Co. Pass Through Certificates Series 2002-AL1 | ||||||||
3.45%, 02/25/2032 | 54,177 | 53,956 | ||||||
3.45%, 02/25/2032 | 109,992 | 108,066 | ||||||
Structured Asset Securities Co. Mortgage Loan Trust 2005-7XS | ||||||||
5.44%, 04/25/2035 | 7,870 | 8,164 | ||||||
Structured Asset Securities Co. Mortgage Pass-Through Certificates Series 2004-6XS | ||||||||
6.03%, 03/25/2034 | 183,952 | 184,932 | ||||||
6.05%, 03/25/2034 | 147,114 | 149,611 | ||||||
Synchrony Credit Card Master Note Trust 2015-1 | ||||||||
2.37%, 03/15/2023 | 4,950,000 | 4,999,097 | ||||||
Synchrony Credit Card Master Note Trust 2016-3 | ||||||||
1.58%, 09/15/2022 | 6,000,000 | 5,959,016 | ||||||
Towd Point Mortgage Trust 2017-2 | ||||||||
2.75%, 04/25/2057 (Acquired 05/05/2017, Cost $9,305,840) (1) | 9,274,163 | 9,362,325 | ||||||
Toyota Auto Receivables 2014-C Owner Trust | ||||||||
0.93%, 07/16/2018 | 102,580 | 102,505 | ||||||
Toyota Auto Receivables 2016-D Owner Trust | ||||||||
1.23%, 10/15/2020 | 16,381,000 | 16,275,836 | ||||||
Toyota Auto Receivables 2017-A Owner Trust | ||||||||
| Principal Amount | Value | |||||||
1.42%, 09/16/2019 | 9,534,000 | 9,528,658 | ||||||
Trafigura Securitisation Finance Plc 2014-1 | ||||||||
2.11%, 10/15/2018 (Acquired 10/23/2014, Cost $3,719,000) (1)(7)(8) | 3,719,000 | 3,717,196 | ||||||
Tricolor Auto Securitization Trust 2017-1 | ||||||||
5.09%, 05/15/2020 (Acquired 02/21/2017, Cost $3,391,291) (1)(7)(8) | 3,391,291 | 3,389,280 | ||||||
Tricon American Homes 2015-SFR1 Trust | ||||||||
2.42%, 05/17/2032 (Acquired 04/28/2015, Cost $851,523) (1) | 851,523 | 856,282 | ||||||
TRINITAS CLO IV Ltd. | ||||||||
2.91%, 04/18/2028 (Acquired 05/02/2016, Cost $7,500,000) (1) | 7,500,000 | 7,522,748 | ||||||
United Auto Credit Securitization Trust 2016-2 | ||||||||
1.67%, 09/10/2018 (Acquired 09/13/2016, Cost $2,410,099) (1) | 2,410,099 | 2,410,415 | ||||||
Upstart Securitization Trust 2017-1 | ||||||||
2.64%, 06/20/2024 (Acquired 06/13/2017, Cost $2,578,978) (1) | 2,579,000 | 2,578,369 | ||||||
US Residential Opportunity Fund III Trust 2016-1 | ||||||||
3.47%, 07/27/2036 (Acquired 07/20/2016, Cost $1,764,534) (1) | 1,764,534 | 1,776,474 | ||||||
Verizon Owner Trust 2016-1 | ||||||||
1.42%, 01/20/2021 (Acquired 07/12/2016, Cost $374,958) (1) | 375,000 | 373,143 | ||||||
Verizon Owner Trust 2016-2 | ||||||||
1.68%, 05/20/2021 (Acquired 03/14/2017, Cost $11,936,294) (1) | 12,000,000 | 11,967,541 | ||||||
Verizon Owner Trust 2017-1 | ||||||||
2.06%, 09/20/2021 (Acquired 03/07/2017, Cost $3,271,435) (1) | 3,272,000 | 3,283,881 | ||||||
Verizon Owner Trust 2017-2 | ||||||||
1.92%, 12/20/2021 (Acquired 06/13/2017, Cost $12,591,135) (1) | 12,593,000 | 12,590,570 | ||||||
VM DEBT LLC | ||||||||
6.50%, 10/02/2024 (Acquired 03/23/2017, Cost $4,635,246) (1)(7)(8) | 4,640,000 | 4,640,000 | ||||||
VML 2014-NPL1 LLC | ||||||||
3.88%, 04/27/2054 (Acquired 11/26/2014, Cost $137,257) (1) | 137,257 | 137,107 | ||||||
VOLT LI LLC | ||||||||
3.50%, 10/25/2046 (Acquired 10/27/2016, Cost $2,736,910) (1) | 2,736,910 | 2,739,288 | ||||||
VOLT LIII LLC | ||||||||
3.88%, 12/26/2046 (Acquired 12/20/2016, Cost $2,998,355) (1) | 2,998,355 | 3,017,174 | ||||||
VOLT LIV LLC | ||||||||
3.63%, 02/25/2047 (Acquired 02/23/2017, Cost $2,463,039) (1) | 2,463,039 | 2,464,744 | ||||||
VOLT LIX LLC | ||||||||
3.25%, 05/25/2047 (Acquired 05/25/2017, Cost $1,997,810) (1) | 1,997,810 | 2,000,313 | ||||||
VOLT LV LLC | ||||||||
3.50%, 03/25/2047 (Acquired 03/17/2017, Cost $3,717,551) (1) | 3,717,551 | 3,723,797 | ||||||
VOLT LVI LLC | ||||||||
3.50%, 03/25/2047 (Acquired 04/04/2017, Cost $3,945,421) (1) | 3,945,421 | 3,957,936 | ||||||
VOLT LVII LLC 2017-NPL4 | ||||||||
3.38%, 04/25/2047 (Acquired 04/27/2017, Cost $3,787,256) (1) | 3,787,256 | 3,784,454 | ||||||
VOLT LVIII LLC | ||||||||
3.38%, 05/28/2047 (Acquired 05/11/2017, Cost $2,646,620) (1) | 2,646,620 | 2,645,659 | ||||||
VOLT LX LLC | ||||||||
3.25%, 04/25/2059 (Acquired 06/09/2017, Cost $3,254,000) (1) | 3,254,000 | 3,251,146 | ||||||
VOLT LXI LLC | ||||||||
3.13%, 06/25/2047 (Acquired 06/27/2017, Cost $9,987,000) (1)(8) | 9,987,000 | 9,987,000 | ||||||
VOLT NPL X LLC | ||||||||
3.38%, 10/26/2054 (Acquired 11/13/2014, Cost $254,553) (1) | 254,685 | 255,252 | ||||||
VOLT XIX LLC | ||||||||
3.88%, 04/25/2055 (Acquired 12/15/2014, Cost $319,119) (1) | 319,288 | 319,427 | ||||||
VOLT XL LLC | ||||||||
4.38%, 11/27/2045 (Acquired 12/08/2015, Cost $1,143,145) (1) | 1,143,861 | 1,147,990 | ||||||
VOLT XXII LLC | ||||||||
3.50%, 02/25/2055 (Acquired 02/26/2015 through 05/18/2017, Cost $2,064,199) (1) | 2,062,458 | 2,069,713 | ||||||
4.25%, 02/25/2055 (Acquired 02/25/2015, Cost $660,086) (1) | 665,941 | 666,114 | ||||||
VOLT XXIV LLC | ||||||||
3.50%, 02/25/2055 (Acquired 03/23/2015, Cost $1,371,721) (1) | 1,372,429 | 1,375,102 | ||||||
VOLT XXV LLC | ||||||||
3.50%, 06/26/2045 (Acquired 06/17/2015, Cost $4,565,920) (1) | 4,569,189 | 4,580,386 | ||||||
VOLT XXXIII LLC | ||||||||
3.50%, 03/25/2055 (Acquired 03/13/2015 through 04/18/2017, Cost $3,234,696) (1) | 3,229,688 | 3,241,513 | ||||||
VOLT XXXVIII LLC | ||||||||
3.88%, 09/25/2045 (Acquired 09/10/2015 through 07/28/2016, Cost $904,825) (1) | 903,259 | 907,081 | ||||||
Voya CLO 2015-1 Ltd. | ||||||||
2.64%, 04/18/2027 (Acquired 06/05/2017, Cost $1,335,637) (1) | 1,335,000 | 1,335,095 | ||||||
Wells Fargo Dealer Floorplan Master Note Trust | ||||||||
1.71%, 01/20/2020 | 5,300,000 | 5,309,495 | ||||||
West CLO 2013-1 Ltd. | ||||||||
2.34%, 11/07/2025 (Acquired 04/28/2017, Cost $15,000,000) (1) | 15,000,000 | 14,999,880 | ||||||
| Principal Amount | Value | |||||||
Westgate Resorts 2015-1 LLC | ||||||||
2.75%, 05/20/2027 (Acquired 02/20/2015, Cost $247,984) (1) | 248,001 | 248,552 | ||||||
Westgate Resorts 2017-1 LLC | ||||||||
3.05%, 12/20/2030 (Acquired 03/30/2017, Cost $1,985,339) (1) | 1,987,658 | 1,992,668 | ||||||
4.05%, 12/20/2030 (Acquired 03/30/2017, Cost $3,532,535) (1) | 3,537,597 | 3,554,143 | ||||||
Westlake Automobile Receivables Trust 2015-3 | ||||||||
4.40%, 05/17/2021 (Acquired 02/10/2016, Cost $997,082) (1) | 1,000,000 | 1,014,291 | ||||||
Westlake Automobile Receivables Trust 2016-2 | ||||||||
1.57%, 06/17/2019 (Acquired 06/07/2016, Cost $841,208) (1) | 841,230 | 841,175 | ||||||
4.10%, 06/15/2021 (Acquired 06/07/2016, Cost $299,963) (1) | 300,000 | 304,818 | ||||||
Westlake Automobile Receivables Trust 2016-3 | ||||||||
2.46%, 01/18/2022 (Acquired 10/14/2016, Cost $1,872,909) (1) | 1,873,000 | 1,868,166 | ||||||
Westlake Automobile Receivables Trust 2017-1 | ||||||||
2.70%, 10/17/2022 (Acquired 03/09/2017, Cost $1,194,941) (1) | 1,195,000 | 1,198,712 | ||||||
3.46%, 10/17/2022 (Acquired 03/09/2017, Cost $1,201,923) (1) | 1,202,000 | 1,208,190 | ||||||
World Omni Auto Receivables Trust 2015-A | ||||||||
1.34%, 05/15/2020 | 390,297 | 390,057 | ||||||
World Omni Auto Receivables Trust 2017-A | ||||||||
1.93%, 09/15/2022 | 7,539,000 | 7,539,960 | ||||||
|
| |||||||
Total Asset-Backed Obligations (Cost $1,392,494,033) | $ | 1,397,292,348 | ||||||
|
| |||||||
Corporate Bonds - 30.68% | ||||||||
Basic Materials - 1.40% | ||||||||
Agrium, Inc. | ||||||||
3.15%, 10/01/2022 | 875,000 | $ | 892,583 | |||||
3.38%, 03/15/2025 | 430,000 | 430,084 | ||||||
4.13%, 03/15/2035 | 1,960,000 | 1,952,625 | ||||||
6.13%, 01/15/2041 | 2,850,000 | 3,462,647 | ||||||
5.25%, 01/15/2045 | 712,000 | 809,383 | ||||||
Air Liquide Finance SA | ||||||||
2.25%, 09/27/2023 (Acquired 09/22/2016, Cost $548,759) (1) | 550,000 | 531,708 | ||||||
Anglo American Capital PLC | ||||||||
9.38%, 04/08/2019 (Acquired 10/28/2013, Cost $234,735) (1) | 215,000 | 240,531 | ||||||
Barrick Gold Corp. | ||||||||
6.45%, 10/15/2035 | 203,000 | 241,870 | ||||||
Barrick North America Finance LLC | ||||||||
5.75%, 05/01/2043 | 4,480,000 | 5,436,776 | ||||||
Barrick PD Australia Finance Pty Ltd. | ||||||||
5.95%, 10/15/2039 | 1,150,000 | 1,391,129 | ||||||
BHP Billiton Finance USA Ltd. | ||||||||
3.85%, 09/30/2023 | 646,000 | 687,409 | ||||||
5.00%, 09/30/2043 | 740,000 | 857,486 | ||||||
6.25%, 10/19/2075 (Acquired 10/14/2015, Cost $985,000) (1) | 985,000 | 1,073,650 | ||||||
CF Industries, Inc. | ||||||||
7.13%, 05/01/2020 | 900,000 | 994,500 | ||||||
4.50%, 12/01/2026 (Acquired 11/10/2016 through 02/16/2017, Cost $1,664,536) (1) | 1,666,000 | 1,713,080 | ||||||
5.38%, 03/15/2044 | 2,040,000 | 1,825,800 | ||||||
Chevron Phillips Chemical Co. LLC / Chevron Phillips Chemical Co. LP | ||||||||
3.40%, 12/01/2026 (Acquired 11/17/2016, Cost $528,687) (1) | 530,000 | 538,896 | ||||||
Dow Chemical Co./The | ||||||||
8.55%, 05/15/2019 | 12,359,000 | 13,843,044 | ||||||
4.13%, 11/15/2021 | 470,000 | 499,261 | ||||||
3.00%, 11/15/2022 | 918,000 | 935,576 | ||||||
7.38%, 11/01/2029 | 339,000 | 455,251 | ||||||
5.25%, 11/15/2041 | 199,000 | 230,892 | ||||||
4.38%, 11/15/2042 | 1,570,000 | 1,623,765 | ||||||
Eastman Chemical Co. | ||||||||
2.70%, 01/15/2020 | 7,390,000 | 7,486,905 | ||||||
4.50%, 01/15/2021 | 352,000 | 373,639 | ||||||
4.65%, 10/15/2044 | 2,930,000 | 3,104,194 | ||||||
EI du Pont de Nemours & Co. | ||||||||
5.60%, 12/15/2036 | 155,000 | 185,182 | ||||||
4.90%, 01/15/2041 | 161,000 | 180,022 | ||||||
FMC Corp. | ||||||||
3.95%, 02/01/2022 | 1,725,000 | 1,788,979 | ||||||
Freeport-McMoRan, Inc. | ||||||||
6.75%, 02/01/2022 | 649,000 | 671,715 | ||||||
3.55%, 03/01/2022 | 5,025,000 | 4,709,329 | ||||||
Georgia-Pacific LLC | ||||||||
5.40%, 11/01/2020 (Acquired 11/22/2013, Cost $3,371,557) (1) | 3,160,000 | 3,456,655 | ||||||
3.73%, 07/15/2023 (Acquired 12/10/2013, Cost $5,285,027) (1) | 5,380,000 | 5,640,860 | ||||||
| Principal Amount | Value | |||||||
Glencore Finance Canada Ltd. | ||||||||
4.25%, 10/25/2022 (Acquired 11/20/2013, Cost $4,868,615) (1) | 5,000,000 | 5,179,840 | ||||||
Glencore Funding LLC | ||||||||
2.50%, 01/15/2019 (Acquired 10/28/2013, Cost $530,800) (1) | 537,000 | 538,599 | ||||||
4.13%, 05/30/2023 (Acquired 10/28/2013, Cost $52,303) (1) | 54,000 | 55,409 | ||||||
4.63%, 04/29/2024 (Acquired 10/08/2014 through 03/24/2017, Cost $1,542,647) (1) | 1,500,000 | 1,568,100 | ||||||
4.00%, 03/27/2027 (Acquired 05/24/2017, Cost $6,239,331) (1) | 6,300,000 | 6,199,206 | ||||||
Goldcorp, Inc. | ||||||||
3.63%, 06/09/2021 | 1,810,000 | 1,876,079 | ||||||
International Paper Co. | ||||||||
3.00%, 02/15/2027 | 4,714,000 | 4,537,267 | ||||||
5.00%, 09/15/2035 | 2,265,000 | 2,479,743 | ||||||
8.70%, 06/15/2038 | 350,000 | 514,955 | ||||||
7.30%, 11/15/2039 | 500,000 | 676,918 | ||||||
6.00%, 11/15/2041 | 3,150,000 | 3,846,068 | ||||||
5.15%, 05/15/2046 | 1,085,000 | 1,210,888 | ||||||
Lubrizol Co. | ||||||||
8.88%, 02/01/2019 | 1,205,000 | 1,330,426 | ||||||
LYB International Finance BV | ||||||||
5.25%, 07/15/2043 | 760,000 | 848,933 | ||||||
4.88%, 03/15/2044 | 945,000 | 1,002,026 | ||||||
LyondellBasell Industries NV | ||||||||
5.00%, 04/15/2019 | 1,854,000 | 1,938,307 | ||||||
5.75%, 04/15/2024 | 2,550,000 | 2,921,915 | ||||||
4.63%, 02/26/2055 | 3,300,000 | 3,237,554 | ||||||
Mexichem SAB de CV | ||||||||
4.88%, 09/19/2022 (Acquired 06/27/2017, Cost $3,651,801) (1) | 3,425,000 | 3,643,344 | ||||||
Monsanto Co. | ||||||||
4.70%, 07/15/2064 | 91,000 | 91,805 | ||||||
Mosaic Co./The | ||||||||
4.25%, 11/15/2023 | 10,506,000 | 11,053,289 | ||||||
5.45%, 11/15/2033 | 814,000 | 859,603 | ||||||
4.88%, 11/15/2041 | 52,000 | 48,842 | ||||||
5.63%, 11/15/2043 | 2,920,000 | 2,984,786 | ||||||
Nucor Corp. | ||||||||
4.00%, 08/01/2023 | 176,000 | 186,001 | ||||||
6.40%, 12/01/2037 | 800,000 | 1,035,300 | ||||||
Potash Co. of Saskatchewan, Inc. | ||||||||
3.25%, 12/01/2017 | 31,000 | 31,191 | ||||||
6.50%, 05/15/2019 | 392,000 | 421,818 | ||||||
3.00%, 04/01/2025 | 1,100,000 | 1,062,865 | ||||||
PPG Industries, Inc. | ||||||||
9.00%, 05/01/2021 | 217,000 | 265,355 | ||||||
5.50%, 11/15/2040 | 118,000 | 140,102 | ||||||
Rio Tinto Alcan, Inc. | ||||||||
5.75%, 06/01/2035 | 54,000 | 63,467 | ||||||
Rio Tinto Finance USA Ltd. | ||||||||
3.75%, 06/15/2025 | 8,735,000 | 9,193,622 | ||||||
Samarco Mineracao SA | ||||||||
5.75%, 10/24/2023 (Acquired 10/28/2013, Cost $537,527) (1) | 537,000 | 304,747 | ||||||
Sherwin-Williams Co./The | ||||||||
2.75%, 06/01/2022 | 10,900,000 | 10,892,239 | ||||||
3.13%, 06/01/2024 | 401,000 | 402,927 | ||||||
3.45%, 06/01/2027 | 331,000 | 333,358 | ||||||
4.50%, 06/01/2047 | 1,885,000 | 1,978,042 | ||||||
Solvay Finance America LLC | ||||||||
3.40%, 12/03/2020 (Acquired 01/08/2016, Cost $3,997,388) (1) | 4,000,000 | 4,127,088 | ||||||
4.45%, 12/03/2025 (Acquired 08/03/2016 through 03/27/2017, Cost $7,374,513) (1) | 7,000,000 | 7,450,422 | ||||||
Southern Copper Co. | ||||||||
5.88%, 04/23/2045 | 2,000,000 | 2,143,426 | ||||||
Union Carbide Co. | ||||||||
7.50%, 06/01/2025 | 624,000 | 763,496 | ||||||
7.75%, 10/01/2096 | 681,000 | 902,986 | ||||||
Vale Canada Ltd. | ||||||||
7.20%, 09/15/2032 | 850,000 | 911,625 | ||||||
Vale Overseas Ltd. | ||||||||
5.88%, 06/10/2021 | 1,612,000 | 1,730,482 | ||||||
4.38%, 01/11/2022 | 5,000,000 | 5,089,000 | ||||||
6.25%, 08/10/2026 | 5,612,000 | 6,053,945 | ||||||
8.25%, 01/17/2034 | 424,000 | 503,500 | ||||||
| Principal Amount | Value | |||||||
6.88%, 11/21/2036 | 4,732,000 | 5,075,070 | ||||||
6.88%, 11/10/2039 | 107,000 | 114,758 | ||||||
Westlake Chemical Corp. | ||||||||
5.00%, 08/15/2046 | 2,461,000 | 2,603,103 | ||||||
|
| |||||||
| 190,689,263 | ||||||||
|
| |||||||
Communications - 2.39% | ||||||||
21st Century Fox America, Inc. | ||||||||
7.25%, 05/18/2018 | 203,000 | 212,415 | ||||||
8.88%, 04/26/2023 | 108,000 | 138,604 | ||||||
9.50%, 07/15/2024 | 175,000 | 238,111 | ||||||
3.70%, 10/15/2025 | 380,000 | 389,518 | ||||||
7.30%, 04/30/2028 | 454,000 | 580,257 | ||||||
7.63%, 11/30/2028 | 310,000 | 405,887 | ||||||
6.20%, 12/15/2034 | 258,000 | 317,973 | ||||||
6.65%, 11/15/2037 | 310,000 | 409,413 | ||||||
6.90%, 08/15/2039 | 155,000 | 204,843 | ||||||
6.15%, 02/15/2041 | 350,000 | 442,290 | ||||||
4.75%, 11/15/2046 | 1,885,000 | 2,014,565 | ||||||
Amazon.com, Inc. | ||||||||
3.80%, 12/05/2024 | 1,086,000 | 1,157,753 | ||||||
4.80%, 12/05/2034 | 854,000 | 984,162 | ||||||
America Movil SAB de CV | ||||||||
5.00%, 10/16/2019 | 3,500,000 | 3,734,400 | ||||||
5.00%, 03/30/2020 | 7,300,000 | 7,841,185 | ||||||
3.13%, 07/16/2022 | 374,000 | 381,140 | ||||||
6.13%, 03/30/2040 | 283,000 | 343,771 | ||||||
AT&T, Inc. | ||||||||
5.50%, 02/01/2018 | 270,000 | 275,804 | ||||||
5.80%, 02/15/2019 | 273,000 | 289,608 | ||||||
4.60%, 02/15/2021 | 578,000 | 616,408 | ||||||
3.00%, 06/30/2022 | 2,013,000 | 2,016,539 | ||||||
3.60%, 02/17/2023 | 18,282,000 | 18,708,574 | ||||||
3.90%, 03/11/2024 | 3,750,000 | 3,840,795 | ||||||
4.45%, 04/01/2024 | 764,000 | 804,322 | ||||||
3.95%, 01/15/2025 | 811,000 | 826,626 | ||||||
3.40%, 05/15/2025 | 6,476,000 | 6,367,067 | ||||||
4.50%, 05/15/2035 | 6,175,000 | 6,081,418 | ||||||
5.25%, 03/01/2037 | 5,377,000 | 5,734,726 | ||||||
6.30%, 01/15/2038 | 743,000 | 874,429 | ||||||
6.00%, 08/15/2040 | 2,106,000 | 2,380,738 | ||||||
5.35%, 09/01/2040 | 1,543,000 | 1,635,788 | ||||||
6.38%, 03/01/2041 | 329,000 | 384,642 | ||||||
5.15%, 03/15/2042 | 866,000 | 885,448 | ||||||
4.30%, 12/15/2042 | 2,149,000 | 1,998,265 | ||||||
4.80%, 06/15/2044 | 4,305,000 | 4,272,084 | ||||||
4.35%, 06/15/2045 | 511,000 | 474,920 | ||||||
4.75%, 05/15/2046 | 3,860,000 | 3,790,312 | ||||||
5.65%, 02/15/2047 | 2,875,000 | 3,170,050 | ||||||
4.55%, 03/09/2049 | 1,445,000 | 1,359,801 | ||||||
BellSouth Co. | ||||||||
6.55%, 06/15/2034 | 2,520,000 | 2,896,291 | ||||||
British Telecommunications Plc | ||||||||
5.95%, 01/15/2018 | 289,000 | 295,480 | ||||||
2.35%, 02/14/2019 | 220,000 | 221,224 | ||||||
9.13%, 12/15/2030 | 721,000 | 1,096,396 | ||||||
CBS Co. | ||||||||
1.95%, 07/01/2017 | 4,840,000 | 4,840,000 | ||||||
3.70%, 08/15/2024 | 848,000 | 870,235 | ||||||
4.00%, 01/15/2026 | 1,000,000 | 1,034,869 | ||||||
3.38%, 02/15/2028 | 4,022,000 | 3,942,401 | ||||||
5.90%, 10/15/2040 | 67,000 | 79,652 | ||||||
4.85%, 07/01/2042 | 77,000 | 80,491 | ||||||
4.90%, 08/15/2044 | 315,000 | 331,258 | ||||||
Centel Capital Co. | ||||||||
9.00%, 10/15/2019 | 464,000 | 526,911 | ||||||
Charter Communications Operating LLC / Charter Communications Operating Capital | ||||||||
3.58%, 07/23/2020 | 7,033,000 | 7,267,171 | ||||||
4.91%, 07/23/2025 | 13,261,000 | 14,327,343 | ||||||
6.38%, 10/23/2035 | 1,861,000 | 2,208,127 | ||||||
6.48%, 10/23/2045 | 1,489,000 | 1,789,337 | ||||||
| Principal Amount | Value | |||||||
5.38%, 05/01/2047 (Acquired 03/30/2017 through 06/27/2017, Cost $6,289,298) (1) | 6,200,000 | 6,567,995 | ||||||
6.83%, 10/23/2055 | 1,745,000 | 2,129,759 | ||||||
Cisco Systems, Inc. | ||||||||
3.00%, 06/15/2022 | 889,000 | 914,161 | ||||||
3.63%, 03/04/2024 | 550,000 | 581,787 | ||||||
2.95%, 02/28/2026 | 467,000 | 467,166 | ||||||
5.90%, 02/15/2039 | 515,000 | 670,443 | ||||||
5.50%, 01/15/2040 | 481,000 | 600,583 | ||||||
Comcast Cable Communications Holdings, Inc. | ||||||||
9.46%, 11/15/2022 | 542,000 | 725,788 | ||||||
Comcast Cable Holdings LLC | ||||||||
10.13%, 04/15/2022 | 186,000 | 235,997 | ||||||
Comcast Co. | ||||||||
3.00%, 02/01/2024 | 4,564,000 | 4,625,605 | ||||||
4.25%, 01/15/2033 | 1,895,000 | 2,021,677 | ||||||
4.20%, 08/15/2034 | 555,000 | 588,343 | ||||||
6.50%, 11/15/2035 | 2,370,000 | 3,145,246 | ||||||
6.45%, 03/15/2037 | 310,000 | 412,931 | ||||||
6.95%, 08/15/2037 | 107,000 | 151,115 | ||||||
Cox Communications, Inc. | ||||||||
3.25%, 12/15/2022 (Acquired 10/28/2013, Cost $327,805) (1) | 348,000 | 347,228 | ||||||
3.85%, 02/01/2025 (Acquired 12/01/2014, Cost $1,997,418) (1) | 2,000,000 | 2,015,246 | ||||||
3.35%, 09/15/2026 (Acquired 09/08/2016, Cost $368,420) (1) | 369,000 | 362,376 | ||||||
4.80%, 02/01/2035 (Acquired 12/01/2014, Cost $7,148,537) (1) | 7,150,000 | 6,999,221 | ||||||
8.38%, 03/01/2039 (Acquired 10/28/2013, Cost $163,210) (1) | 134,000 | 177,778 | ||||||
Cox Enterprises, Inc. | ||||||||
7.38%, 07/15/2027 (Acquired 10/28/2013, Cost $311,797) (1) | 273,000 | 335,158 | ||||||
Crown Castle Towers LLC | ||||||||
3.22%, 05/15/2022 (Acquired 04/30/2015, Cost $589,000) (1) | 589,000 | 603,336 | ||||||
Deutsche Telekom International Finance BV | ||||||||
6.00%, 07/08/2019 | 209,000 | 225,252 | ||||||
2.23%, 01/17/2020 (Acquired 06/26/2017, Cost $4,620,693) (1) | 4,602,000 | 4,608,622 | ||||||
3.60%, 01/19/2027 (Acquired 01/09/2017, Cost $399,519) (1) | 400,000 | 407,014 | ||||||
8.75%, 06/15/2030 | 648,000 | 961,147 | ||||||
4.88%, 03/06/2042 (Acquired 10/28/2013, Cost $233,402) (1) | 240,000 | 263,617 | ||||||
Discovery Communications LLC | ||||||||
4.38%, 06/15/2021 | 752,000 | 793,658 | ||||||
6.35%, 06/01/2040 | 1,161,000 | 1,281,061 | ||||||
eBay, Inc. | ||||||||
2.60%, 07/15/2022 | 2,356,000 | 2,334,996 | ||||||
3.45%, 08/01/2024 | 669,000 | 673,404 | ||||||
4.00%, 07/15/2042 | 213,000 | 187,730 | ||||||
Grupo Televisa SAB | ||||||||
5.00%, 05/13/2045 | 1,460,000 | 1,406,311 | ||||||
6.13%, 01/31/2046 | 382,000 | 425,010 | ||||||
GTP Acquisition Partners I LLC | ||||||||
2.35%, 06/15/2020 (Acquired 05/20/2015, Cost $271,000) (1) | 271,000 | 267,925 | ||||||
3.48%, 06/16/2025 (Acquired 05/20/2015, Cost $314,000) (1) | 314,000 | 320,261 | ||||||
Historic TW, Inc. | ||||||||
9.15%, 02/01/2023 | 347,000 | 445,052 | ||||||
NBCUniversal Media LLC | ||||||||
4.38%, 04/01/2021 | 700,000 | 754,453 | ||||||
6.40%, 04/30/2040 | 372,000 | 499,813 | ||||||
5.95%, 04/01/2041 | 527,000 | 675,616 | ||||||
4.45%, 01/15/2043 | 1,765,000 | 1,876,404 | ||||||
New Cingular Wireless Services, Inc. | ||||||||
8.75%, 03/01/2031 | 1,140,000 | 1,634,608 | ||||||
Nippon Telegraph & Telephone Co. | ||||||||
1.40%, 07/18/2017 | 237,000 | 236,998 | ||||||
Orange SA | ||||||||
2.75%, 02/06/2019 | 3,000,000 | 3,038,148 | ||||||
9.00%, 03/01/2031 | 1,393,000 | 2,107,252 | ||||||
Qwest Co. | ||||||||
6.75%, 12/01/2021 | 3,866,000 | 4,270,604 | ||||||
Rogers Communications, Inc. | ||||||||
4.10%, 10/01/2023 | 1,255,000 | 1,331,000 | ||||||
3.63%, 12/15/2025 | 4,350,000 | 4,453,869 | ||||||
8.75%, 05/01/2032 | 258,000 | 370,493 | ||||||
SK Telecom Co. Ltd. | ||||||||
6.63%, 07/20/2027 (Acquired 10/28/2013 through 11/27/2013, Cost $421,559) (1) | 361,000 | 462,877 | ||||||
| Principal Amount | Value | |||||||
Sky Plc | ||||||||
3.75%, 09/16/2024 (Acquired 10/08/2015, Cost $286,163) (1) | 287,000 | 294,829 | ||||||
Sprint Capital Co. | ||||||||
6.90%, 05/01/2019 | 301,000 | 321,992 | ||||||
Sprint Spectrum Co. LLC / Sprint Spectrum Co. II LLC / Sprint Spectrum Co. III LLC | ||||||||
3.36%, 09/20/2021 (Acquired 10/20/2016, Cost $2,935,955) (1) | 2,936,000 | 2,961,690 | ||||||
TCI Communications, Inc. | ||||||||
7.13%, 02/15/2028 | 138,000 | 182,403 | ||||||
Telecom Italia Capital SA | ||||||||
7.00%, 06/04/2018 | 5,000,000 | 5,218,750 | ||||||
7.18%, 06/18/2019 | 215,000 | 234,619 | ||||||
7.20%, 07/18/2036 | 1,644,000 | 1,906,012 | ||||||
Telefonica Emisiones SAU | ||||||||
6.22%, 07/03/2017 | 545,000 | 545,000 | ||||||
3.19%, 04/27/2018 | 221,000 | 223,340 | ||||||
5.13%, 04/27/2020 | 500,000 | 539,211 | ||||||
5.46%, 02/16/2021 | 233,000 | 256,104 | ||||||
4.10%, 03/08/2027 | 5,844,000 | 6,038,342 | ||||||
5.21%, 03/08/2047 | 4,830,000 | 5,222,930 | ||||||
Thomson Reuters Co. | ||||||||
4.70%, 10/15/2019 | 222,000 | 233,400 | ||||||
3.95%, 09/30/2021 | 934,000 | 973,576 | ||||||
3.85%, 09/29/2024 | 342,000 | 352,367 | ||||||
4.50%, 05/23/2043 | 312,000 | 312,780 | ||||||
Time Warner Cable LLC | ||||||||
6.75%, 07/01/2018 | 5,490,000 | 5,743,792 | ||||||
8.75%, 02/14/2019 | 184,000 | 202,390 | ||||||
4.13%, 02/15/2021 | 222,000 | 232,128 | ||||||
6.55%, 05/01/2037 | 375,000 | 448,261 | ||||||
7.30%, 07/01/2038 | 1,023,000 | 1,308,917 | ||||||
6.75%, 06/15/2039 | 539,000 | 660,460 | ||||||
5.88%, 11/15/2040 | 475,000 | 530,057 | ||||||
5.50%, 09/01/2041 | 5,615,000 | 6,041,465 | ||||||
Time Warner Entertainment Co. LP | ||||||||
8.38%, 07/15/2033 | 879,000 | 1,207,844 | ||||||
Time Warner, Inc. | ||||||||
4.75%, 03/29/2021 | 585,000 | 629,948 | ||||||
7.57%, 02/01/2024 | 330,000 | 409,706 | ||||||
3.55%, 06/01/2024 | 2,300,000 | 2,330,822 | ||||||
3.60%, 07/15/2025 | 2,670,000 | 2,680,573 | ||||||
2.95%, 07/15/2026 | 2,000,000 | 1,887,006 | ||||||
3.80%, 02/15/2027 | 2,850,000 | 2,869,565 | ||||||
7.63%, 04/15/2031 | 4,118,000 | 5,617,290 | ||||||
7.70%, 05/01/2032 | 712,000 | 991,281 | ||||||
6.20%, 03/15/2040 | 323,000 | 386,216 | ||||||
6.25%, 03/29/2041 | 170,000 | 207,931 | ||||||
5.38%, 10/15/2041 | 181,000 | 198,263 | ||||||
4.65%, 06/01/2044 | 2,145,000 | 2,124,157 | ||||||
Verizon Communications, Inc. | ||||||||
3.45%, 03/15/2021 | 535,000 | 553,857 | ||||||
2.95%, 03/15/2022 (Acquired 10/28/2013 through 03/02/2017, Cost $2,638,332) (1) | 2,677,000 | 2,695,305 | ||||||
4.13%, 03/16/2027 | 4,800,000 | 4,957,862 | ||||||
5.05%, 03/15/2034 | 1,000,000 | 1,059,718 | ||||||
4.40%, 11/01/2034 | 4,343,000 | 4,304,803 | ||||||
4.27%, 01/15/2036 | 8,521,000 | 8,233,229 | ||||||
5.25%, 03/16/2037 | 2,785,000 | 2,997,153 | ||||||
4.81%, 03/15/2039 (Acquired 10/28/2013 through 04/18/2016, Cost $12,339,745) (1) | 13,093,000 | 13,250,339 | ||||||
4.86%, 08/21/2046 | 5,218,000 | 5,216,706 | ||||||
4.52%, 09/15/2048 | 6,971,000 | 6,609,352 | ||||||
5.01%, 08/21/2054 | 448,000 | 441,532 | ||||||
4.67%, 03/15/2055 | 6,680,000 | 6,253,736 | ||||||
Viacom, Inc. | ||||||||
3.25%, 03/15/2023 | 69,000 | 68,381 | ||||||
3.88%, 04/01/2024 | 1,016,000 | 1,034,604 | ||||||
4.85%, 12/15/2034 | 153,000 | 152,216 | ||||||
6.88%, 04/30/2036 | 750,000 | 877,211 | ||||||
4.38%, 03/15/2043 | 1,370,000 | 1,219,367 | ||||||
Vodafone Group Plc | ||||||||
1.50%, 02/19/2018 | 1,218,000 | 1,217,732 | ||||||
2.95%, 02/19/2023 | 78,000 | 78,406 | ||||||
| Principal Amount | Value | |||||||
Walt Disney Co./The | ||||||||
3.00%, 02/13/2026 | 1,000,000 | 1,005,264 | ||||||
1.85%, 07/30/2026 | 259,000 | 235,776 | ||||||
2.95%, 06/15/2027 | 700,000 | 693,430 | ||||||
3.00%, 07/30/2046 | 160,000 | 140,109 | ||||||
|
| |||||||
| 325,205,476 | ||||||||
|
| |||||||
Consumer, Cyclical - 1.93% | ||||||||
Air Canada 2013-1 Class A Pass Through Trust | ||||||||
4.13%, 05/15/2025 (Acquired 10/28/2013, Cost $319,690) (1) | 331,562 | 343,995 | ||||||
American Airlines 2011-1 Class A Pass Through Trust | ||||||||
5.25%, 01/31/2021 | 95,240 | 100,716 | ||||||
American Airlines 2013-1 Class A Pass Through Trust | ||||||||
4.00%, 07/15/2025 | 1,238,437 | 1,294,166 | ||||||
American Airlines 2013-2 Class A Pass Through Trust | ||||||||
4.95%, 01/15/2023 | 3,915,492 | 4,169,999 | ||||||
American Airlines 2015-1 Class A Pass Through Trust | ||||||||
3.38%, 05/01/2027 | 2,707,255 | 2,720,791 | ||||||
American Airlines 2016-2 Class A Pass Through Trust | ||||||||
3.65%, 06/15/2028 | 237,656 | 241,221 | ||||||
American Airlines 2016-2 Class AA Pass Through Trust | ||||||||
3.20%, 06/15/2028 | 1,480,480 | 1,467,452 | ||||||
American Airlines 2016-3 Class AA Pass Through Trust | ||||||||
3.00%, 10/15/2028 | 2,338,000 | 2,291,240 | ||||||
American Airlines 2017-1 Class AA Pass Through Trust | ||||||||
3.65%, 02/15/2029 | 727,000 | 748,810 | ||||||
American Honda Finance Corp. | ||||||||
1.60%, 02/16/2018 (Acquired 10/28/2013, Cost $301,497) (1) | 302,000 | 302,279 | ||||||
2.13%, 10/10/2018 | 352,000 | 354,271 | ||||||
2.25%, 08/15/2019 | 739,000 | 745,307 | ||||||
2.90%, 02/16/2024 | 300,000 | 303,805 | ||||||
2.30%, 09/09/2026 | 185,000 | 174,735 | ||||||
Arrow Electronics, Inc. | ||||||||
3.00%, 03/01/2018 | 197,000 | 198,410 | ||||||
4.50%, 03/01/2023 | 183,000 | 193,527 | ||||||
AutoZone, Inc. | ||||||||
3.75%, 06/01/2027 | 550,000 | 551,263 | ||||||
BMW US Capital LLC | ||||||||
2.25%, 09/15/2023 (Acquired 09/08/2016, Cost $891,529) (1) | 894,000 | 867,926 | ||||||
CK Hutchison International 16 Ltd. | ||||||||
1.88%, 10/03/2021 (Acquired 09/28/2016, Cost $399,732) (1) | 402,000 | 390,097 | ||||||
2.75%, 10/03/2026 (Acquired 09/28/2016, Cost $594,906) (1) | 600,000 | 573,855 | ||||||
Continental Airlines 1997-4 Class A Pass Through Trust | ||||||||
6.90%, 01/02/2018 | 1,491 | 1,508 | ||||||
Continental Airlines 1999-2 Class A-1 Pass Through Trust | ||||||||
7.26%, 03/15/2020 | 21,821 | 23,240 | ||||||
Continental Airlines 2007-1 Class A Pass Through Trust | ||||||||
5.98%, 04/19/2022 (8) | 5,560,920 | 6,117,013 | ||||||
Continental Airlines 2012-2 Class A Pass Through Trust | ||||||||
4.00%, 10/29/2024 | 5,155,103 | 5,432,189 | ||||||
CVS Health Co. | ||||||||
2.13%, 06/01/2021 | 1,527,000 | 1,508,242 | ||||||
3.50%, 07/20/2022 | 3,000,000 | 3,110,838 | ||||||
4.00%, 12/05/2023 | 6,401,000 | 6,760,512 | ||||||
2.88%, 06/01/2026 | 617,000 | 597,989 | ||||||
5.30%, 12/05/2043 | 3,260,000 | 3,761,835 | ||||||
CVS Pass-Through Trust | ||||||||
5.77%, 01/10/2033 (Acquired 02/08/2017, Cost $989,816) (1) | 872,819 | 991,878 | ||||||
5.93%, 01/10/2034 (Acquired 10/28/2013, Cost $701,836) (1) | 640,503 | 734,341 | ||||||
4.70%, 01/10/2036 (Acquired 08/05/2016 through 01/19/2017, Cost $2,721,243) (1) | 2,476,482 | 2,619,623 | ||||||
CVS Pass-Through Trust Series 2014 | ||||||||
4.16%, 08/11/2036 (Acquired 01/19/2017 through 03/15/2017, Cost $4,477,667) (1) | 4,444,602 | 4,507,715 | ||||||
Daimler Finance North America LLC | ||||||||
1.88%, 01/11/2018 (Acquired 10/28/2013 through 12/10/2013, Cost $3,079,151) (1) | 3,080,000 | 3,083,659 | ||||||
2.38%, 08/01/2018 (Acquired 10/28/2013, Cost $195,282) (1) | 195,000 | 196,253 | ||||||
2.00%, 08/03/2018 (Acquired 07/28/2015, Cost $299,774) (1) | 300,000 | 300,771 | ||||||
2.25%, 07/31/2019 (Acquired 11/19/2013 through 11/20/2013, Cost $3,233,740) (1) | 3,250,000 | 3,264,853 | ||||||
2.25%, 03/02/2020 (Acquired 02/23/2015, Cost $3,570,492) (1) | 3,575,000 | 3,578,464 | ||||||
2.88%, 03/10/2021 (Acquired 03/03/2014, Cost $699,193) (1) | 700,000 | 709,947 | ||||||
3.45%, 01/06/2027 (Acquired 01/03/2017, Cost $3,003,377) (1) | 3,015,000 | 3,064,488 | ||||||
8.50%, 01/18/2031 | 155,000 | 232,939 | ||||||
| Principal Amount | Value | |||||||
Darden Restaurants, Inc. | ||||||||
3.85%, 05/01/2027 | 564,000 | 573,107 | ||||||
Delta Air Lines 2007-1 Class A Pass Through Trust | ||||||||
6.82%, 08/10/2022 | 2,544,225 | 2,919,498 | ||||||
Delta Air Lines 2010-2 Class A Pass Through Trust | ||||||||
4.95%, 05/23/2019 | 191,571 | 198,995 | ||||||
Delta Air Lines 2011-1 Class A Pass Through Trust | ||||||||
5.30%, 04/15/2019 | 75,778 | 79,567 | ||||||
Delta Air Lines 2012-1 Class A Pass Through Trust | ||||||||
4.75%, 05/07/2020 | 257,169 | 269,385 | ||||||
Delta Air Lines, Inc. | ||||||||
2.88%, 03/13/2020 | 8,200,000 | 8,306,636 | ||||||
Ford Motor Co. | ||||||||
7.45%, 07/16/2031 | 2,600,000 | 3,287,692 | ||||||
4.75%, 01/15/2043 | 7,640,000 | 7,384,098 | ||||||
5.29%, 12/08/2046 | 1,900,000 | 1,952,577 | ||||||
Ford Motor Credit Co. LLC | ||||||||
1.68%, 09/08/2017 | 944,000 | 944,238 | ||||||
1.72%, 12/06/2017 | 2,000,000 | 2,000,166 | ||||||
2.15%, 01/09/2018 | 386,000 | 387,317 | ||||||
2.24%, 06/15/2018 | 942,000 | 944,302 | ||||||
2.55%, 10/05/2018 | 1,500,000 | 1,509,910 | ||||||
2.38%, 03/12/2019 | 819,000 | 822,738 | ||||||
2.60%, 11/04/2019 | 1,000,000 | 1,006,694 | ||||||
3.16%, 08/04/2020 | 1,300,000 | 1,324,691 | ||||||
3.34%, 03/18/2021 | 800,000 | 815,375 | ||||||
3.34%, 03/28/2022 | 6,214,000 | 6,304,874 | ||||||
4.25%, 09/20/2022 | 3,800,000 | 3,991,543 | ||||||
4.38%, 08/06/2023 | 800,000 | 841,567 | ||||||
3.81%, 01/09/2024 | 1,122,000 | 1,135,778 | ||||||
4.13%, 08/04/2025 | 265,000 | 269,597 | ||||||
General Motors Co. | ||||||||
4.00%, 04/01/2025 | 8,070,000 | 8,100,811 | ||||||
6.60%, 04/01/2036 | 2,921,000 | 3,387,656 | ||||||
General Motors Financial Co., Inc. | ||||||||
2.65%, 04/13/2020 | 1,300,000 | 1,305,949 | ||||||
4.38%, 09/25/2021 | 5,000,000 | 5,289,650 | ||||||
3.45%, 01/14/2022 | 8,051,000 | 8,184,180 | ||||||
3.45%, 04/10/2022 | 6,502,000 | 6,607,918 | ||||||
3.15%, 06/30/2022 | 10,160,000 | 10,116,820 | ||||||
3.70%, 05/09/2023 | 5,249,000 | 5,329,462 | ||||||
3.95%, 04/13/2024 | 2,250,000 | 2,281,388 | ||||||
4.00%, 01/15/2025 | 250,000 | 251,084 | ||||||
4.30%, 07/13/2025 | 580,000 | 591,623 | ||||||
4.00%, 10/06/2026 | 1,190,000 | 1,183,232 | ||||||
4.35%, 01/17/2027 | 979,000 | 991,150 | ||||||
Home Depot, Inc./The | ||||||||
2.63%, 06/01/2022 | 494,000 | 501,411 | ||||||
3.00%, 04/01/2026 | 148,000 | 148,805 | ||||||
2.13%, 09/15/2026 | 298,000 | 278,618 | ||||||
5.88%, 12/16/2036 | 5,490,000 | 7,159,542 | ||||||
4.20%, 04/01/2043 | 655,000 | 696,425 | ||||||
4.40%, 03/15/2045 | 268,000 | 294,338 | ||||||
3.50%, 09/15/2056 | 214,000 | 194,242 | ||||||
Hyundai Capital America | ||||||||
2.40%, 10/30/2018 (Acquired 10/27/2015, Cost $2,716,853) (1) | 2,717,000 | 2,722,752 | ||||||
2.00%, 07/01/2019 (Acquired 06/07/2016, Cost $300,859) (1) | 301,000 | 298,619 | ||||||
3.10%, 04/05/2022 (Acquired 03/29/2017 through 04/07/2017, Cost $13,707,230) (1) | 13,726,000 | 13,760,713 | ||||||
Hyundai Capital Services, Inc. | ||||||||
3.50%, 09/13/2017 (Acquired 10/28/2013 through 09/30/2014, Cost $4,665,968) (1) | 4,650,000 | 4,665,085 | ||||||
3.00%, 03/06/2022 (Acquired 02/27/2017, Cost $3,710,983) (1) | 3,725,000 | 3,709,917 | ||||||
Lowe’s Cos, Inc. | ||||||||
3.38%, 09/15/2025 | 477,000 | 492,758 | ||||||
4.65%, 04/15/2042 | 449,000 | 497,036 | ||||||
4.05%, 05/03/2047 | 4,729,000 | 4,816,652 | ||||||
Macy’s Retail Holdings, Inc. | ||||||||
7.45%, 07/15/2017 | 134,000 | 134,152 | ||||||
4.38%, 09/01/2023 | 393,000 | 386,138 | ||||||
6.90%, 01/15/2032 | 400,000 | 415,085 | ||||||
6.38%, 03/15/2037 | 179,000 | 182,600 | ||||||
| Principal Amount | Value | |||||||
Magna International, Inc. | ||||||||
3.63%, 06/15/2024 | 1,658,000 | 1,702,524 | ||||||
Marriott International, Inc./MD | ||||||||
3.00%, 03/01/2019 | 7,250,000 | 7,361,063 | ||||||
McDonald’s Co. | ||||||||
4.70%, 12/09/2035 | 591,000 | 652,992 | ||||||
6.30%, 10/15/2037 | 679,000 | 884,637 | ||||||
Newell Rubbermaid, Inc. | ||||||||
5.50%, 04/01/2046 | 8,884,000 | 10,711,314 | ||||||
Nissan Motor Acceptance Co. | ||||||||
1.80%, 03/15/2018 (Acquired 10/28/2013, Cost $724,888) (1) | 727,000 | 727,130 | ||||||
2.65%, 09/26/2018 (Acquired 02/25/2014, Cost $502,091) (1) | 500,000 | 505,079 | ||||||
1.90%, 09/14/2021 (Acquired 09/07/2016, Cost $313,494) (1) | 314,000 | 306,520 | ||||||
Nordstrom, Inc. | ||||||||
4.00%, 10/15/2021 | 398,000 | 406,491 | ||||||
O’Reilly Automotive, Inc. | ||||||||
3.55%, 03/15/2026 | 500,000 | 503,477 | ||||||
Starbucks Co. | ||||||||
4.30%, 06/15/2045 | 604,000 | 663,629 | ||||||
Target Co. | ||||||||
3.50%, 07/01/2024 | 355,000 | 368,205 | ||||||
Toyota Motor Credit Co. | ||||||||
1.45%, 01/12/2018 | 193,000 | 193,116 | ||||||
1.55%, 10/18/2019 | 10,363,000 | 10,317,942 | ||||||
2.80%, 07/13/2022 | 640,000 | 650,835 | ||||||
United Airlines 2016-1 Class A Pass Through Trust | ||||||||
3.45%, 07/07/2028 | 882,000 | 888,615 | ||||||
United Airlines 2016-1 Class AA Pass Through Trust | ||||||||
3.10%, 07/07/2028 | 6,990,000 | 6,955,050 | ||||||
US Airways 1998-1A Pass Through Trust | ||||||||
6.85%, 01/30/2018 (8) | 4,391 | 4,479 | ||||||
Walgreen Co. | ||||||||
4.40%, 09/15/2042 | 400,000 | 401,042 | ||||||
Walgreens Boots Alliance, Inc. | ||||||||
3.80%, 11/18/2024 | 670,000 | 695,921 | ||||||
4.50%, 11/18/2034 | 1,079,000 | 1,133,464 | ||||||
Wal-Mart Stores, Inc. | ||||||||
3.30%, 04/22/2024 | 3,820,000 | 3,988,985 | ||||||
7.55%, 02/15/2030 | 72,000 | 105,211 | ||||||
6.20%, 04/15/2038 | 108,000 | 147,802 | ||||||
5.00%, 10/25/2040 | 124,000 | 149,520 | ||||||
WW Grainger, Inc. | ||||||||
4.60%, 06/15/2045 | 973,000 | 1,060,583 | ||||||
|
| |||||||
| 262,363,944 | ||||||||
|
| |||||||
Consumer, Non-cyclical - 4.22% | ||||||||
Abbott Laboratories | ||||||||
2.90%, 11/30/2021 | 15,375,000 | 15,521,293 | ||||||
3.88%, 09/15/2025 | 748,000 | 769,409 | ||||||
4.75%, 11/30/2036 | 10,000,000 | 10,896,830 | ||||||
4.90%, 11/30/2046 | 4,278,000 | 4,728,084 | ||||||
AbbVie, Inc. | ||||||||
1.80%, 05/14/2018 | 7,230,000 | 7,239,189 | ||||||
2.00%, 11/06/2018 | 866,000 | 868,079 | ||||||
3.20%, 11/06/2022 | 769,000 | 788,636 | ||||||
2.85%, 05/14/2023 | 5,474,000 | 5,461,049 | ||||||
3.60%, 05/14/2025 | 13,071,000 | 13,334,433 | ||||||
4.50%, 05/14/2035 | 4,194,000 | 4,427,878 | ||||||
4.30%, 05/14/2036 | 450,000 | 458,479 | ||||||
Aetna, Inc. | ||||||||
2.80%, 06/15/2023 | 419,000 | 418,216 | ||||||
6.75%, 12/15/2037 | 341,000 | 472,192 | ||||||
4.50%, 05/15/2042 | 205,000 | 221,717 | ||||||
4.75%, 03/15/2044 | 1,800,000 | 2,026,255 | ||||||
Ahold Finance USA LLC | ||||||||
6.88%, 05/01/2029 | 3,280,000 | 4,116,653 | ||||||
Allergan Funding SCS | ||||||||
3.45%, 03/15/2022 | 14,180,000 | 14,615,440 | ||||||
3.85%, 06/15/2024 | 1,198,000 | 1,249,424 | ||||||
3.80%, 03/15/2025 | 4,115,000 | 4,256,712 | ||||||
4.55%, 03/15/2035 | 6,389,000 | 6,824,787 | ||||||
| Principal Amount | Value | |||||||
4.75%, 03/15/2045 | 905,000 | 978,271 | ||||||
Allergan, Inc./U.S. | ||||||||
3.38%, 09/15/2020 | 539,000 | 555,114 | ||||||
2.80%, 03/15/2023 | 971,000 | 961,335 | ||||||
Amgen, Inc. | ||||||||
5.70%, 02/01/2019 | 204,000 | 216,258 | ||||||
2.20%, 05/11/2020 | 5,028,000 | 5,051,984 | ||||||
2.70%, 05/01/2022 | 5,600,000 | 5,631,522 | ||||||
2.65%, 05/11/2022 | 9,884,000 | 9,915,886 | ||||||
3.63%, 05/15/2022 | 845,000 | 882,496 | ||||||
3.13%, 05/01/2025 | 525,000 | 526,207 | ||||||
4.95%, 10/01/2041 | 464,000 | 503,637 | ||||||
4.66%, 06/15/2051 | 9,145,000 | 9,700,778 | ||||||
Anheuser-Busch Cos LLC | ||||||||
5.50%, 01/15/2018 | 103,000 | 105,113 | ||||||
Anheuser-Busch InBev Finance, Inc. | ||||||||
1.90%, 02/01/2019 | 132,000 | 132,300 | ||||||
2.63%, 01/17/2023 | 160,000 | 159,336 | ||||||
3.30%, 02/01/2023 | 4,301,000 | 4,428,322 | ||||||
3.70%, 02/01/2024 | 960,000 | 1,004,496 | ||||||
3.65%, 02/01/2026 | 7,730,000 | 7,964,745 | ||||||
4.70%, 02/01/2036 | 7,482,000 | 8,265,754 | ||||||
4.00%, 01/17/2043 | 810,000 | 812,121 | ||||||
4.90%, 02/01/2046 | 8,685,000 | 9,816,065 | ||||||
Anheuser-Busch InBev Worldwide, Inc. | ||||||||
2.20%, 08/01/2018 | 5,080,000 | 5,110,968 | ||||||
3.75%, 01/15/2022 | 1,441,000 | 1,519,534 | ||||||
4.95%, 01/15/2042 | 2,735,000 | 3,091,277 | ||||||
4.44%, 10/06/2048 (Acquired 10/28/2013, Cost $128,214) (1) | 139,000 | 148,111 | ||||||
Anthem, Inc. | ||||||||
2.30%, 07/15/2018 | 289,000 | 290,630 | ||||||
3.13%, 05/15/2022 | 484,000 | 492,962 | ||||||
3.30%, 01/15/2023 | 271,000 | 276,359 | ||||||
3.50%, 08/15/2024 | 694,000 | 713,432 | ||||||
4.63%, 05/15/2042 | 400,000 | 432,410 | ||||||
4.65%, 01/15/2043 | 391,000 | 421,962 | ||||||
5.10%, 01/15/2044 | 1,881,000 | 2,179,349 | ||||||
4.65%, 08/15/2044 | 395,000 | 428,440 | ||||||
BAT International Finance Plc | ||||||||
3.95%, 06/15/2025 (Acquired 06/10/2015, Cost $4,987,480) (1) | 5,000,000 | 5,189,680 | ||||||
Baxalta, Inc. | ||||||||
3.60%, 06/23/2022 | 367,000 | 379,998 | ||||||
5.25%, 06/23/2045 | 167,000 | 196,270 | ||||||
Bayer US Finance LLC | ||||||||
3.38%, 10/08/2024 (Acquired 10/01/2014, Cost $467,401) (1) | 471,000 | 482,301 | ||||||
Baylor Scott & White Holdings | ||||||||
4.19%, 11/15/2045 | 1,800,000 | 1,842,988 | ||||||
3.97%, 11/15/2046 | 3,700,000 | 3,664,591 | ||||||
Becton Dickinson and Co. | ||||||||
2.68%, 12/15/2019 | 135,000 | 136,660 | ||||||
2.40%, 06/05/2020 | 4,350,000 | 4,359,239 | ||||||
2.89%, 06/06/2022 | 9,520,000 | 9,531,852 | ||||||
3.36%, 06/06/2024 | 7,936,000 | 7,951,364 | ||||||
3.73%, 12/15/2024 | 1,972,000 | 2,004,479 | ||||||
4.67%, 06/06/2047 | 538,000 | 554,156 | ||||||
Biogen, Inc. | ||||||||
3.63%, 09/15/2022 | 673,000 | 703,780 | ||||||
5.20%, 09/15/2045 | 366,000 | 418,101 | ||||||
Brown-Forman Co. | ||||||||
4.50%, 07/15/2045 | 375,000 | 410,021 | ||||||
Bunge Ltd. Finance Corp. | ||||||||
8.50%, 06/15/2019 | 7,456,000 | 8,339,282 | ||||||
3.50%, 11/24/2020 | 283,000 | 290,110 | ||||||
3.25%, 08/15/2026 | 284,000 | 271,386 | ||||||
Cardinal Health, Inc. | ||||||||
3.75%, 09/15/2025 | 412,000 | 428,173 | ||||||
3.41%, 06/15/2027 | 800,000 | 796,584 | ||||||
4.90%, 09/15/2045 | 315,000 | 347,618 | ||||||
Cargill, Inc. | ||||||||
3.30%, 03/01/2022 (Acquired 10/28/2013, Cost $794,457) (1) | 800,000 | 824,911 | ||||||
| Principal Amount | Value | |||||||
Celgene Co. | ||||||||
3.25%, 08/15/2022 | 1,220,000 | 1,254,033 | ||||||
4.00%, 08/15/2023 | 298,000 | 316,013 | ||||||
3.63%, 05/15/2024 | 686,000 | 710,415 | ||||||
5.70%, 10/15/2040 | 302,000 | 348,480 | ||||||
Cigna Co. | ||||||||
3.25%, 04/15/2025 | 970,000 | 973,868 | ||||||
5.38%, 02/15/2042 | 3,040,000 | 3,659,917 | ||||||
Cleveland Clinic Foundation/The | ||||||||
4.86%, 01/01/2114 | 1,612,000 | 1,650,316 | ||||||
Coca-Cola Femsa SAB de CV | ||||||||
2.38%, 11/26/2018 | 8,790,000 | 8,834,038 | ||||||
3.88%, 11/26/2023 | 550,000 | 575,890 | ||||||
Conagra Brands, Inc. | ||||||||
4.95%, 08/15/2020 | 40,000 | 42,290 | ||||||
9.75%, 03/01/2021 | 1,750,000 | 2,140,173 | ||||||
7.00%, 10/01/2028 | 3,250,000 | 4,112,868 | ||||||
Constellation Brands, Inc. | ||||||||
4.25%, 05/01/2023 | 200,000 | 212,891 | ||||||
Danaher Co. | ||||||||
2.40%, 09/15/2020 | 280,000 | 283,568 | ||||||
Danone SA | ||||||||
2.59%, 11/02/2023 (Acquired 10/26/2016, Cost $1,600,000) (1) | 1,600,000 | 1,560,856 | ||||||
Diageo Investment Co. | ||||||||
8.00%, 09/15/2022 | 516,000 | 647,840 | ||||||
DP World Ltd. | ||||||||
6.85%, 07/02/2037 (Acquired 07/30/2015 through 04/26/2017, Cost $1,538,429) (1) | 1,363,000 | 1,601,713 | ||||||
Dr Pepper Snapple Group, Inc. | ||||||||
3.43%, 06/15/2027 (Acquired 06/05/2017, Cost $354,839) (1) | 350,000 | 352,476 | ||||||
4.42%, 12/15/2046 | 9,350,000 | 9,746,618 | ||||||
Ecolab, Inc. | ||||||||
1.45%, 12/08/2017 | 5,928,000 | 5,924,372 | ||||||
2.25%, 01/12/2020 | 233,000 | 234,495 | ||||||
3.25%, 01/14/2023 | 452,000 | 466,220 | ||||||
5.50%, 12/08/2041 | 103,000 | 126,329 | ||||||
Equifax, Inc. | ||||||||
2.30%, 06/01/2021 | 338,000 | 335,649 | ||||||
ERAC USA Finance LLC | ||||||||
6.38%, 10/15/2017 (Acquired 10/28/2013, Cost $41,516) (1) | 41,000 | 41,531 | ||||||
2.80%, 11/01/2018 (Acquired 01/07/2014, Cost $4,901,224) (1) | 4,875,000 | 4,925,310 | ||||||
4.50%, 08/16/2021 (Acquired 10/28/2013, Cost $412,723) (1) | 400,000 | 428,303 | ||||||
6.70%, 06/01/2034 (Acquired 10/28/2013, Cost $576,505) (1) | 508,000 | 631,494 | ||||||
5.63%, 03/15/2042 (Acquired 10/28/2013, Cost $368,496) (1) | 357,000 | 405,930 | ||||||
4.50%, 02/15/2045 (Acquired 02/10/2015, Cost $296,678) (1) | 300,000 | 296,121 | ||||||
Express Scripts Holding Co. | ||||||||
4.75%, 11/15/2021 | 4,000,000 | 4,322,140 | ||||||
3.00%, 07/15/2023 | 178,000 | 176,735 | ||||||
3.50%, 06/15/2024 | 897,000 | 904,603 | ||||||
4.50%, 02/25/2026 | 755,000 | 800,230 | ||||||
4.80%, 07/15/2046 | 218,000 | 222,048 | ||||||
Fomento Economico Mexicano SAB de CV | ||||||||
4.38%, 05/10/2043 | 526,000 | 534,390 | ||||||
Forest Laboratories LLC | ||||||||
4.38%, 02/01/2019 (Acquired 08/13/2014, Cost $1,389,138) (1) | 1,351,000 | 1,393,294 | ||||||
5.00%, 12/15/2021 (Acquired 08/04/2014 through 01/12/2015, Cost $5,014,965) (1) | 4,738,000 | 5,172,470 | ||||||
Gilead Sciences, Inc. | ||||||||
2.50%, 09/01/2023 | 250,000 | 246,262 | ||||||
3.70%, 04/01/2024 | 4,637,000 | 4,819,373 | ||||||
3.50%, 02/01/2025 | 385,000 | 395,137 | ||||||
3.65%, 03/01/2026 | 374,000 | 385,216 | ||||||
2.95%, 03/01/2027 | 4,930,000 | 4,785,290 | ||||||
4.60%, 09/01/2035 | 4,558,000 | 4,892,448 | ||||||
4.00%, 09/01/2036 | 313,000 | 311,607 | ||||||
5.65%, 12/01/2041 | 2,325,000 | 2,821,846 | ||||||
4.15%, 03/01/2047 | 600,000 | 604,240 | ||||||
GlaxoSmithKline Capital, Inc. | ||||||||
2.85%, 05/08/2022 | 320,000 | 326,908 | ||||||
6.38%, 05/15/2038 | 217,000 | 298,274 | ||||||
Grupo Bimbo SAB de CV | ||||||||
3.88%, 06/27/2024 (Acquired 06/27/2014 through 02/14/2017, Cost $4,995,118) (1) | 5,000,000 | 5,145,604 | ||||||
| Principal Amount | Value | |||||||
Humana, Inc. | ||||||||
7.20%, 06/15/2018 | 215,000 | 225,838 | ||||||
JM Smucker Co./The | ||||||||
3.00%, 03/15/2022 | 4,750,000 | 4,840,469 | ||||||
Johnson & Johnson | ||||||||
4.38%, 12/05/2033 | 1,225,000 | 1,394,699 | ||||||
4.50%, 12/05/2043 | 2,780,000 | 3,218,984 | ||||||
Kellogg Co. | ||||||||
3.25%, 05/21/2018 | 234,000 | 237,353 | ||||||
Kimberly-Clark Co. | ||||||||
7.50%, 11/01/2018 | 52,000 | 56,028 | ||||||
2.40%, 03/01/2022 | 140,000 | 139,705 | ||||||
Kraft Foods Group, Inc. | ||||||||
6.13%, 08/23/2018 | 531,000 | 556,268 | ||||||
5.38%, 02/10/2020 | 138,000 | 148,724 | ||||||
3.50%, 06/06/2022 | 388,000 | 401,695 | ||||||
6.88%, 01/26/2039 | 1,645,000 | 2,118,080 | ||||||
6.50%, 02/09/2040 | 310,000 | 388,252 | ||||||
5.00%, 06/04/2042 | 505,000 | 533,802 | ||||||
Kraft Heinz Foods Co. | ||||||||
2.00%, 07/02/2018 | 2,771,000 | 2,778,044 | ||||||
2.80%, 07/02/2020 | 3,775,000 | 3,831,176 | ||||||
3.95%, 07/15/2025 | 1,858,000 | 1,916,209 | ||||||
3.00%, 06/01/2026 | 3,625,000 | 3,468,320 | ||||||
5.00%, 07/15/2035 | 2,785,000 | 3,014,790 | ||||||
4.38%, 06/01/2046 | 5,510,000 | 5,369,969 | ||||||
Kroger Co./The | ||||||||
6.15%, 01/15/2020 | 206,000 | 225,069 | ||||||
4.00%, 02/01/2024 | 63,000 | 65,274 | ||||||
7.50%, 04/01/2031 | 1,417,000 | 1,879,231 | ||||||
6.90%, 04/15/2038 | 1,434,000 | 1,811,957 | ||||||
5.40%, 07/15/2040 | 95,000 | 102,482 | ||||||
4.45%, 02/01/2047 | 1,010,000 | 974,931 | ||||||
Laboratory Co. of America Holdings | ||||||||
4.63%, 11/15/2020 | 6,630,000 | 7,037,446 | ||||||
3.20%, 02/01/2022 | 1,127,000 | 1,150,053 | ||||||
Massachusetts Institute of Technology | ||||||||
4.68%, 07/01/2114 | 1,645,000 | 1,794,354 | ||||||
Mead Johnson Nutrition Co. | ||||||||
4.13%, 11/15/2025 | 891,000 | 960,798 | ||||||
Medtronic Global Holdings SCA | ||||||||
3.35%, 04/01/2027 | 6,670,000 | 6,800,585 | ||||||
Medtronic, Inc. | ||||||||
3.13%, 03/15/2022 | 419,000 | 431,976 | ||||||
3.15%, 03/15/2022 | 396,000 | 409,751 | ||||||
3.50%, 03/15/2025 | 13,000,000 | 13,527,748 | ||||||
4.38%, 03/15/2035 | 924,000 | 1,016,662 | ||||||
Merck & Co., Inc. | ||||||||
2.40%, 09/15/2022 | 211,000 | 212,385 | ||||||
2.80%, 05/18/2023 | 526,000 | 535,898 | ||||||
3.70%, 02/10/2045 | 70,000 | 69,914 | ||||||
Molson Coors Brewing Co. | ||||||||
3.00%, 07/15/2026 | 581,000 | 558,890 | ||||||
Mondelez International Holdings Netherlands BV | ||||||||
1.63%, 10/28/2019 (Acquired 10/19/2016, Cost $4,623,205) (1) | 4,631,000 | 4,587,705 | ||||||
Mylan NV | ||||||||
3.00%, 12/15/2018 | 3,115,000 | 3,157,140 | ||||||
2.50%, 06/07/2019 | 4,895,000 | 4,934,302 | ||||||
3.15%, 06/15/2021 | 4,415,000 | 4,491,159 | ||||||
3.95%, 06/15/2026 | 1,992,000 | 2,018,569 | ||||||
5.25%, 06/15/2046 | 366,000 | 400,908 | ||||||
Mylan, Inc. | ||||||||
2.55%, 03/28/2019 | 600,000 | 604,352 | ||||||
3.13%, 01/15/2023 (Acquired 06/01/2016 through 03/17/2017, Cost $5,341,027) (1) | 5,504,000 | 5,475,308 | ||||||
5.40%, 11/29/2043 | 100,000 | 110,213 | ||||||
New York and Presbyterian Hospital/The | ||||||||
4.02%, 08/01/2045 | 125,000 | 127,332 | ||||||
4.76%, 08/01/2116 | 2,364,000 | 2,267,433 | ||||||
Novartis Capital Co. | ||||||||
2.40%, 05/17/2022 | 6,440,000 | 6,489,968 | ||||||
| Principal Amount | Value | |||||||
3.40%, 05/06/2024 | 922,000 | 962,204 | ||||||
PepsiCo., Inc. | ||||||||
3.00%, 08/25/2021 | 258,000 | 266,950 | ||||||
3.10%, 07/17/2022 | 593,000 | 614,427 | ||||||
4.88%, 11/01/2040 | 82,000 | 95,023 | ||||||
4.60%, 07/17/2045 | 196,000 | 219,559 | ||||||
3.45%, 10/06/2046 | 700,000 | 658,729 | ||||||
4.00%, 05/02/2047 | 3,837,000 | 3,929,169 | ||||||
Pfizer, Inc. | ||||||||
5.80%, 08/12/2023 | 4,000,000 | 4,700,056 | ||||||
3.00%, 12/15/2026 | 1,125,000 | 1,128,261 | ||||||
President & Fellows of Harvard College | ||||||||
3.30%, 07/15/2056 | 5,599,000 | 5,365,415 | ||||||
Procter & Gamble - Esop | ||||||||
9.36%, 01/01/2021 | 124,977 | 141,467 | ||||||
Providence St. Joseph Health Obligated Group | ||||||||
2.75%, 10/01/2026 | 1,200,000 | 1,149,451 | ||||||
Quest Diagnostics, Inc. | ||||||||
3.50%, 03/30/2025 | 4,820,000 | 4,895,804 | ||||||
3.45%, 06/01/2026 | 223,000 | 223,447 | ||||||
Reckitt Benckiser Treasury Services Plc | ||||||||
3.00%, 06/26/2027 (Acquired 06/21/2017, Cost $11,829,447) (1) | 11,865,000 | 11,694,998 | ||||||
Reynolds American, Inc. | ||||||||
2.30%, 06/12/2018 | 8,841,000 | 8,879,591 | ||||||
4.00%, 06/12/2022 | 4,590,000 | 4,863,279 | ||||||
5.70%, 08/15/2035 | 1,100,000 | 1,304,844 | ||||||
Roche Holdings, Inc. | ||||||||
3.35%, 09/30/2024 (Acquired 11/13/2014, Cost $788,922) (1) | 780,000 | 805,044 | ||||||
RR Donnelley & Sons Co. | ||||||||
7.63%, 06/15/2020 | 107,000 | 119,037 | ||||||
Shire Acquisitions Investments Ireland DAC | ||||||||
2.40%, 09/23/2021 | 13,135,000 | 12,980,533 | ||||||
2.88%, 09/23/2023 | 668,000 | 662,009 | ||||||
Smithfield Foods, Inc. | ||||||||
3.35%, 02/01/2022 (Acquired 03/20/2017, Cost $9,982,014) (1) | 10,000,000 | 10,050,957 | ||||||
4.25%, 02/01/2027 (Acquired 01/25/2017 through 01/30/2017, Cost $264,690) (1) | 265,000 | 271,773 | ||||||
Stryker Co. | ||||||||
3.50%, 03/15/2026 | 213,000 | 218,172 | ||||||
Sysco Corp. | ||||||||
3.75%, 10/01/2025 | 277,000 | 287,184 | ||||||
3.25%, 07/15/2027 | 1,350,000 | 1,328,158 | ||||||
Teva Pharmaceutical Finance Netherlands III BV | ||||||||
1.40%, 07/20/2018 | 14,589,000 | 14,554,803 | ||||||
2.80%, 07/21/2023 | 735,000 | 714,796 | ||||||
3.15%, 10/01/2026 | 5,442,000 | 5,168,692 | ||||||
4.10%, 10/01/2046 | 585,000 | 539,613 | ||||||
Texas Health Resources | ||||||||
4.33%, 11/15/2055 | 1,000,000 | 1,047,962 | ||||||
Thermo Fisher Scientific, Inc. | ||||||||
3.00%, 04/15/2023 | 227,000 | 228,814 | ||||||
2.95%, 09/19/2026 | 476,000 | 462,905 | ||||||
Tyson Foods, Inc. | ||||||||
4.50%, 06/15/2022 | 2,485,000 | 2,693,976 | ||||||
3.95%, 08/15/2024 | 1,451,000 | 1,518,473 | ||||||
4.88%, 08/15/2034 | 400,000 | 438,086 | ||||||
UnitedHealth Group, Inc. | ||||||||
1.63%, 03/15/2019 | 291,000 | 290,024 | ||||||
3.38%, 11/15/2021 | 685,000 | 714,116 | ||||||
2.75%, 02/15/2023 | 520,000 | 523,816 | ||||||
2.88%, 03/15/2023 | 310,000 | 314,719 | ||||||
3.10%, 03/15/2026 | 550,000 | 552,889 | ||||||
4.63%, 07/15/2035 | 427,000 | 480,447 | ||||||
5.80%, 03/15/2036 | 500,000 | 633,674 | ||||||
6.63%, 11/15/2037 | 562,000 | 775,426 | ||||||
4.38%, 03/15/2042 | 5,170,000 | 5,558,531 | ||||||
Verisk Analytics, Inc. | ||||||||
4.00%, 06/15/2025 | 7,000,000 | 7,233,646 | ||||||
Wesleyan University | ||||||||
4.78%, 07/01/2116 | 3,012,000 | 2,951,359 | ||||||
Western Union Co./The | ||||||||
| Principal Amount | Value | |||||||
3.60%, 03/15/2022 | 1,300,000 | 1,324,820 | ||||||
6.20%, 06/21/2040 | 300,000 | 315,631 | ||||||
Wm Wrigley Jr Co. | ||||||||
2.90%, 10/21/2019 (Acquired 12/10/2013, Cost $4,970,733) (1) | 4,960,000 | 5,043,011 | ||||||
Wyeth LLC | ||||||||
6.45%, 02/01/2024 | 82,000 | 99,645 | ||||||
Zimmer Biomet Holdings, Inc. | ||||||||
3.38%, 11/30/2021 | 3,650,000 | 3,741,287 | ||||||
3.55%, 04/01/2025 | 6,000,000 | 6,061,056 | ||||||
Zoetis, Inc. | ||||||||
3.45%, 11/13/2020 | 150,000 | 155,114 | ||||||
3.25%, 02/01/2023 | 1,000,000 | 1,024,760 | ||||||
4.50%, 11/13/2025 | 336,000 | 366,863 | ||||||
|
| |||||||
| 574,146,298 | ||||||||
|
| |||||||
Diversified - 0.06% | ||||||||
CK Hutchison International 17 Ltd. | ||||||||
2.88%, 04/05/2022 (Acquired 03/30/2017, Cost $799,297) (1) | 800,000 | 803,399 | ||||||
Hutchison Whampoa International 09 Ltd. | ||||||||
7.63%, 04/09/2019 (Acquired 10/28/2013, Cost $658,024) (1) | 612,000 | 668,182 | ||||||
Hutchison Whampoa International 09/19 Ltd. | ||||||||
5.75%, 09/11/2019 (Acquired 12/03/2013, Cost $6,527,391) (1) | 6,175,000 | 6,629,437 | ||||||
Hutchison Whampoa International 12 II Ltd. | ||||||||
3.25%, 11/08/2022 (Acquired 10/28/2013, Cost $430,135) (1) | 450,000 | 459,530 | ||||||
|
| |||||||
| 8,560,548 | ||||||||
|
| |||||||
Energy - 3.29% | ||||||||
Alberta Energy Co. Ltd. | ||||||||
7.38%, 11/01/2031 | 274,000 | 332,916 | ||||||
Anadarko Finance Co. | ||||||||
7.50%, 05/01/2031 | 206,000 | 257,454 | ||||||
Anadarko Holding Co. | ||||||||
7.15%, 05/15/2028 | �� | 170,000 | 204,268 | |||||
Anadarko Petroleum Co. | ||||||||
8.70%, 03/15/2019 | 664,000 | 732,358 | ||||||
6.95%, 06/15/2019 | 11,711,000 | 12,694,783 | ||||||
6.45%, 09/15/2036 | 2,685,000 | 3,163,738 | ||||||
0.00%, 10/10/2036 | 4,000,000 | 1,651,884 | ||||||
6.60%, 03/15/2046 | 2,537,000 | 3,132,667 | ||||||
ANR Pipeline Co. | ||||||||
9.63%, 11/01/2021 | 337,000 | 429,552 | ||||||
Apache Co. | ||||||||
6.90%, 09/15/2018 | 258,000 | 272,640 | ||||||
3.25%, 04/15/2022 | 99,000 | 100,433 | ||||||
5.10%, 09/01/2040 | 600,000 | 613,721 | ||||||
4.75%, 04/15/2043 | 416,000 | 417,753 | ||||||
APT Pipelines Ltd. | ||||||||
4.25%, 07/15/2027 (Acquired 03/24/2017, Cost $1,090,481) (1) | 1,098,000 | 1,124,170 | ||||||
Baker Hughes, Inc. | ||||||||
5.13%, 09/15/2040 | 600,000 | 686,377 | ||||||
Boardwalk Pipelines LP | ||||||||
4.95%, 12/15/2024 | 1,057,000 | 1,119,856 | ||||||
5.95%, 06/01/2026 | 254,000 | 282,858 | ||||||
4.45%, 07/15/2027 | 200,000 | 204,786 | ||||||
BP Capital Markets Plc | ||||||||
1.38%, 11/06/2017 | 229,000 | 228,920 | ||||||
2.24%, 05/10/2019 | 400,000 | 403,094 | ||||||
3.25%, 05/06/2022 | 262,000 | 269,485 | ||||||
3.81%, 02/10/2024 | 1,615,000 | 1,684,371 | ||||||
3.22%, 04/14/2024 | 2,262,000 | 2,283,760 | ||||||
3.54%, 11/04/2024 | 700,000 | 718,660 | ||||||
3.51%, 03/17/2025 | 45,000 | 46,072 | ||||||
3.12%, 05/04/2026 | 462,000 | 457,948 | ||||||
3.02%, 01/16/2027 | 402,000 | 391,152 | ||||||
3.59%, 04/14/2027 | 650,000 | 659,591 | ||||||
Buckeye Partners LP | ||||||||
2.65%, 11/15/2018 | 2,900,000 | 2,915,503 | ||||||
4.88%, 02/01/2021 | 704,000 | 745,221 | ||||||
4.15%, 07/01/2023 | 348,000 | 357,345 | ||||||
4.35%, 10/15/2024 | 390,000 | 401,733 | ||||||
3.95%, 12/01/2026 | 158,000 | 156,409 | ||||||
5.85%, 11/15/2043 | 591,000 | 634,745 | ||||||
| Principal Amount | Value | |||||||
Burlington Resources Finance Co. | ||||||||
7.40%, 12/01/2031 | 53,000 | 71,668 | ||||||
Burlington Resources, Inc. | ||||||||
8.20%, 03/15/2025 | 206,000 | 270,154 | ||||||
Cameron International Co. | ||||||||
3.60%, 04/30/2022 | 5,900,000 | 6,103,869 | ||||||
Canadian Natural Resources Ltd. | ||||||||
1.75%, 01/15/2018 | 687,000 | 686,948 | ||||||
5.90%, 02/01/2018 | 2,996,000 | 3,064,845 | ||||||
2.95%, 01/15/2023 | 6,209,000 | 6,158,738 | ||||||
7.20%, 01/15/2032 | 41,000 | 49,989 | ||||||
6.45%, 06/30/2033 | 1,153,000 | 1,333,737 | ||||||
5.85%, 02/01/2035 | 200,000 | 222,035 | ||||||
6.50%, 02/15/2037 | 118,000 | 140,266 | ||||||
6.75%, 02/01/2039 | 206,000 | 245,721 | ||||||
4.95%, 06/01/2047 | 2,937,000 | 2,984,826 | ||||||
Cenovus Energy, Inc. | ||||||||
3.00%, 08/15/2022 | 1,884,000 | 1,801,168 | ||||||
5.25%, 06/15/2037 (Acquired 06/27/2017 through 06/29/2017, Cost $3,968,911) (1) | 4,235,000 | 3,959,323 | ||||||
6.75%, 11/15/2039 | 1,168,000 | 1,228,257 | ||||||
4.45%, 09/15/2042 | 310,000 | 252,699 | ||||||
5.40%, 06/15/2047 (Acquired 04/04/2017, Cost $2,297,681) (1) | 2,300,000 | 2,149,502 | ||||||
Chevron Co. | ||||||||
2.36%, 12/05/2022 | 315,000 | 313,505 | ||||||
2.57%, 05/16/2023 | 2,000,000 | 2,003,112 | ||||||
2.90%, 03/03/2024 | 1,303,000 | 1,315,004 | ||||||
CNOOC Finance 2013 Ltd. | ||||||||
3.00%, 05/09/2023 | 2,200,000 | 2,176,159 | ||||||
CNOOC Finance 2015 Australia Pty Ltd. | ||||||||
2.63%, 05/05/2020 | 1,583,000 | 1,587,211 | ||||||
CNOOC Finance 2015 USA LLC | ||||||||
3.50%, 05/05/2025 | 670,000 | 670,108 | ||||||
CNOOC Nexen Finance 2014 ULC | ||||||||
4.25%, 04/30/2024 | 1,165,000 | 1,225,839 | ||||||
Conoco Funding Co. | ||||||||
3.35%, 11/15/2024 | 598,000 | 609,064 | ||||||
7.25%, 10/15/2031 | 54,000 | 72,229 | ||||||
ConocoPhillips Canada Funding Co. I | ||||||||
5.95%, 10/15/2036 | 300,000 | 366,196 | ||||||
ConocoPhillips Co. | ||||||||
4.20%, 03/15/2021 | 839,000 | 889,471 | ||||||
6.95%, 04/15/2029 | 400,000 | 513,084 | ||||||
6.50%, 02/01/2039 | 150,000 | 198,178 | ||||||
DCP Midstream Operating LP | ||||||||
9.75%, 03/15/2019 (Acquired 10/28/2013 through 12/09/2013, Cost $5,423,985) (1) | 4,960,000 | 5,542,800 | ||||||
Devon Energy Co. | ||||||||
3.25%, 05/15/2022 | 896,000 | 890,384 | ||||||
7.95%, 04/15/2032 | 1,000,000 | 1,304,041 | ||||||
5.60%, 07/15/2041 | 2,301,000 | 2,392,557 | ||||||
4.75%, 05/15/2042 | 323,000 | 313,554 | ||||||
Devon Financing Co. LLC | ||||||||
7.88%, 09/30/2031 | 4,450,000 | 5,775,348 | ||||||
Ecopetrol SA | ||||||||
5.88%, 09/18/2023 | 395,000 | 431,932 | ||||||
4.13%, 01/16/2025 | 383,000 | 375,340 | ||||||
5.38%, 06/26/2026 | 537,000 | 558,480 | ||||||
Enbridge Energy Partners LP | ||||||||
4.38%, 10/15/2020 | 6,575,000 | 6,919,786 | ||||||
Enbridge, Inc. | ||||||||
2.90%, 07/15/2022 | 3,135,000 | 3,128,162 | ||||||
3.70%, 07/15/2027 | 7,579,000 | 7,574,233 | ||||||
5.50%, 12/01/2046 | 500,000 | 564,260 | ||||||
Encana Co. | ||||||||
6.50%, 05/15/2019 | 1,142,000 | 1,218,067 | ||||||
8.13%, 09/15/2030 | 400,000 | 507,946 | ||||||
7.20%, 11/01/2031 | 500,000 | 595,339 | ||||||
6.50%, 08/15/2034 | 268,000 | 306,075 | ||||||
Energy Transfer Partners LP | ||||||||
9.70%, 03/15/2019 | 107,000 | 119,837 | ||||||
3.60%, 02/01/2023 | 229,000 | 230,451 | ||||||
| Principal Amount | Value | |||||||
4.90%, 02/01/2024 | 687,000 | 724,996 | ||||||
4.05%, 03/15/2025 | 682,000 | 684,796 | ||||||
4.20%, 04/15/2027 | 497,000 | 495,030 | ||||||
6.63%, 10/15/2036 | 5,441,000 | 6,090,927 | ||||||
7.50%, 07/01/2038 | 1,500,000 | 1,821,173 | ||||||
6.05%, 06/01/2041 | 500,000 | 532,468 | ||||||
6.50%, 02/01/2042 | 140,000 | 156,562 | ||||||
Eni SpA | ||||||||
5.70%, 10/01/2040 (Acquired 10/28/2013, Cost $547,165) (1) | 557,000 | 584,084 | ||||||
Eni USA Inc | ||||||||
7.30%, 11/15/2027 | 400,000 | 499,240 | ||||||
EnLink Midstream Partners LP | ||||||||
2.70%, 04/01/2019 | 4,008,000 | 3,999,363 | ||||||
4.15%, 06/01/2025 | 1,129,000 | 1,115,001 | ||||||
5.05%, 04/01/2045 | 378,000 | 351,235 | ||||||
5.45%, 06/01/2047 | 2,634,000 | 2,629,746 | ||||||
Enterprise Products Operating LLC | ||||||||
3.35%, 03/15/2023 | 1,017,000 | 1,044,151 | ||||||
3.90%, 02/15/2024 | 3,400,000 | 3,536,700 | ||||||
3.75%, 02/15/2025 | 515,000 | 530,393 | ||||||
3.70%, 02/15/2026 | 304,000 | 309,654 | ||||||
6.65%, 10/15/2034 | 672,000 | 836,494 | ||||||
5.75%, 03/01/2035 | 1,075,000 | 1,220,263 | ||||||
5.95%, 02/01/2041 | 201,000 | 238,401 | ||||||
4.85%, 08/15/2042 | 4,000,000 | 4,238,964 | ||||||
4.85%, 03/15/2044 | 199,000 | 211,231 | ||||||
4.95%, 10/15/2054 | 177,000 | 183,974 | ||||||
EOG Resources, Inc. | ||||||||
6.88%, 10/01/2018 | 186,000 | 196,769 | ||||||
4.10%, 02/01/2021 | 547,000 | 573,685 | ||||||
2.63%, 03/15/2023 | 249,000 | 245,733 | ||||||
5.10%, 01/15/2036 | 784,000 | 860,988 | ||||||
EQT Midstream Partners LP | ||||||||
4.00%, 08/01/2024 | 2,000,000 | 2,029,686 | ||||||
Exxon Mobil Co. | ||||||||
2.73%, 03/01/2023 | 1,338,000 | 1,353,645 | ||||||
4.11%, 03/01/2046 | 716,000 | 756,438 | ||||||
FORTIS, Inc. | ||||||||
2.10%, 10/04/2021 (Acquired 09/29/2016, Cost $2,139,307) (1) | 2,144,000 | 2,099,716 | ||||||
3.06%, 10/04/2026 (Acquired 09/29/2016 through 03/16/2017, Cost $10,973,923) (1) | 11,124,000 | 10,735,705 | ||||||
Gazprom OAO Via Gaz Capital SA | ||||||||
6.51%, 03/07/2022 (Acquired 05/16/2016 through 05/18/2016, Cost $1,227,446) (1) | 1,140,000 | 1,257,593 | ||||||
4.95%, 07/19/2022 (Acquired 06/07/2016, Cost $621,630) (1) | 610,000 | 630,979 | ||||||
Gulf South Pipeline Co. LP | ||||||||
4.00%, 06/15/2022 | 1,100,000 | 1,132,559 | ||||||
Halliburton Co. | ||||||||
3.50%, 08/01/2023 | 1,032,000 | 1,062,078 | ||||||
4.85%, 11/15/2035 | 200,000 | 214,051 | ||||||
7.45%, 09/15/2039 | 521,000 | 709,004 | ||||||
7.60%, 08/15/2096 (Acquired 10/28/2013, Cost $350,909) (1) | 258,000 | 335,320 | ||||||
Helmerich & Payne International Drilling Co. | ||||||||
4.65%, 03/15/2025 | 4,710,000 | 4,939,490 | ||||||
Hess Corp. | ||||||||
7.13%, 03/15/2033 | 1,050,000 | 1,187,167 | ||||||
6.00%, 01/15/2040 | 880,000 | 896,050 | ||||||
Husky Energy, Inc. | ||||||||
6.20%, 09/15/2017 | 3,630,000 | 3,662,122 | ||||||
6.15%, 06/15/2019 | 119,000 | 127,352 | ||||||
6.80%, 09/15/2037 | 2,100,000 | 2,610,573 | ||||||
KazMunayGas National Co. | ||||||||
3.88%, 04/19/2022 (Acquired 05/05/2017, Cost $1,599,292) (1) | 1,590,000 | 1,573,464 | ||||||
Kerr-McGee Co. | ||||||||
6.95%, 07/01/2024 | 127,000 | 148,954 | ||||||
7.88%, 09/15/2031 | 1,191,000 | 1,531,447 | ||||||
Kinder Morgan Energy Partners LP | ||||||||
9.00%, 02/01/2019 | 454,000 | 500,822 | ||||||
5.00%, 10/01/2021 | 4,875,000 | 5,235,331 | ||||||
4.15%, 02/01/2024 | 5,694,000 | 5,847,914 | ||||||
4.30%, 05/01/2024 | 3,700,000 | 3,824,461 | ||||||
7.30%, 08/15/2033 | 1,650,000 | 1,987,780 | ||||||
| Principal Amount | Value | |||||||
6.95%, 01/15/2038 | 242,000 | 289,319 | ||||||
6.50%, 09/01/2039 | 107,000 | 121,300 | ||||||
7.50%, 11/15/2040 | 483,000 | 603,208 | ||||||
Kinder Morgan, Inc./DE | ||||||||
7.80%, 08/01/2031 | 3,000,000 | 3,782,484 | ||||||
Magellan Midstream Partners LP | ||||||||
6.55%, 07/15/2019 | 206,000 | 223,415 | ||||||
4.25%, 02/01/2021 | 502,000 | 528,688 | ||||||
3.20%, 03/15/2025 | 386,000 | 374,392 | ||||||
4.20%, 12/01/2042 | 417,000 | 394,371 | ||||||
5.15%, 10/15/2043 | 441,000 | 479,352 | ||||||
4.20%, 03/15/2045 | 5,725,000 | 5,323,466 | ||||||
Marathon Oil Co. | ||||||||
6.00%, 10/01/2017 | 289,000 | 291,745 | ||||||
5.90%, 03/15/2018 | 291,000 | 298,456 | ||||||
2.80%, 11/01/2022 | 700,000 | 671,042 | ||||||
6.60%, 10/01/2037 | 410,000 | 452,902 | ||||||
Marathon Petroleum Co. | ||||||||
3.63%, 09/15/2024 | 1,241,000 | 1,254,059 | ||||||
MPLX LP | ||||||||
4.88%, 12/01/2024 | 819,000 | 873,260 | ||||||
4.88%, 06/01/2025 | 1,876,000 | 1,989,476 | ||||||
5.20%, 03/01/2047 | 4,085,000 | 4,189,494 | ||||||
Nabors Industries, Inc. | ||||||||
6.15%, 02/15/2018 | 82,000 | 82,820 | ||||||
5.00%, 09/15/2020 | 595,000 | 593,512 | ||||||
4.63%, 09/15/2021 | 1,195,000 | 1,135,011 | ||||||
National Oilwell Varco, Inc. | ||||||||
1.35%, 12/01/2017 | 162,000 | 161,784 | ||||||
Nexen Energy ULC | ||||||||
6.40%, 05/15/2037 | 4,408,000 | 5,615,422 | ||||||
Noble Energy, Inc. | ||||||||
8.25%, 03/01/2019 | 323,000 | 354,326 | ||||||
5.63%, 05/01/2021 | 355,000 | 365,175 | ||||||
3.90%, 11/15/2024 | 550,000 | 565,208 | ||||||
6.00%, 03/01/2041 | 386,000 | 432,427 | ||||||
5.25%, 11/15/2043 | 2,675,000 | 2,771,627 | ||||||
5.05%, 11/15/2044 | 2,000,000 | 2,056,722 | ||||||
Noble Holding International Ltd. | ||||||||
5.75%, 03/16/2018 | 158,000 | 158,957 | ||||||
Occidental Petroleum Co. | ||||||||
2.70%, 02/15/2023 | 100,000 | 99,968 | ||||||
3.50%, 06/15/2025 | 455,000 | 464,733 | ||||||
3.40%, 04/15/2026 | 246,000 | 248,249 | ||||||
3.00%, 02/15/2027 | 333,000 | 324,297 | ||||||
4.63%, 06/15/2045 | 158,000 | 167,724 | ||||||
Oleoducto Central SA | ||||||||
4.00%, 05/07/2021 (Acquired 04/30/2014, Cost $224,099) (1) | 225,000 | 233,437 | ||||||
ONEOK Partners LP | ||||||||
3.20%, 09/15/2018 | 1,815,000 | 1,836,284 | ||||||
8.63%, 03/01/2019 | 353,000 | 388,324 | ||||||
3.38%, 10/01/2022 | 151,000 | 152,365 | ||||||
5.00%, 09/15/2023 | 334,000 | 360,822 | ||||||
4.90%, 03/15/2025 | 2,500,000 | 2,676,935 | ||||||
6.65%, 10/01/2036 | 1,050,000 | 1,264,952 | ||||||
6.20%, 09/15/2043 | 2,500,000 | 2,875,107 | ||||||
Pemex Finance Ltd. | ||||||||
10.61%, 08/15/2017 | 20,125 | 20,312 | ||||||
Petro-Canada | ||||||||
6.05%, 05/15/2018 | 263,000 | 272,461 | ||||||
5.95%, 05/15/2035 | 350,000 | 419,788 | ||||||
6.80%, 05/15/2038 | 423,000 | 551,873 | ||||||
Petrofac Ltd. | ||||||||
3.40%, 10/10/2018 (Acquired 10/28/2013 through 11/14/2013, Cost $5,053,595) (1) | 5,029,000 | 4,728,060 | ||||||
Petroleos Mexicanos | ||||||||
5.75%, 03/01/2018 | 301,000 | 308,028 | ||||||
8.00%, 05/03/2019 | 2,000,000 | 2,187,500 | ||||||
5.50%, 01/21/2021 | 9,323,000 | 9,779,827 | ||||||
6.38%, 02/04/2021 | 448,000 | 484,870 | ||||||
4.88%, 01/24/2022 | 3,500,000 | 3,599,750 | ||||||
| Principal Amount | Value | |||||||
5.38%, 03/13/2022 (Acquired 12/06/2016, Cost $1,124,224) (1) | 1,130,000 | 1,189,607 | ||||||
4.63%, 09/21/2023 | 1,292,000 | 1,307,504 | ||||||
4.88%, 01/18/2024 | 363,000 | 367,683 | ||||||
6.88%, 08/04/2026 | 5,324,000 | 5,898,992 | ||||||
6.50%, 03/13/2027 (Acquired 12/06/2016, Cost $1,470,886) (1) | 1,484,000 | 1,594,187 | ||||||
6.63%, 06/15/2035 | 647,000 | 668,836 | ||||||
6.50%, 06/02/2041 | 2,870,000 | 2,849,910 | ||||||
6.38%, 01/23/2045 | 1,002,000 | 976,950 | ||||||
5.63%, 01/23/2046 | 3,070,000 | 2,721,555 | ||||||
6.75%, 09/21/2047 | 1,194,000 | 1,205,797 | ||||||
Phillips 66 | ||||||||
4.30%, 04/01/2022 | 5,736,000 | 6,145,700 | ||||||
5.88%, 05/01/2042 | 3,000,000 | 3,629,136 | ||||||
Phillips 66 Partners LP | ||||||||
2.65%, 02/15/2020 | 3,650,000 | 3,662,399 | ||||||
3.55%, 10/01/2026 | 190,000 | 184,567 | ||||||
4.68%, 02/15/2045 | 2,100,000 | 2,014,211 | ||||||
4.90%, 10/01/2046 | 412,000 | 406,873 | ||||||
Plains All American Pipeline LP / PAA Finance Co. | ||||||||
3.65%, 06/01/2022 | 382,000 | 389,659 | ||||||
3.60%, 11/01/2024 | 1,050,000 | 1,020,596 | ||||||
4.65%, 10/15/2025 | 1,950,000 | 1,998,908 | ||||||
4.70%, 06/15/2044 | 4,000,000 | 3,650,868 | ||||||
4.90%, 02/15/2045 | 875,000 | 814,778 | ||||||
QEP Resources, Inc. | ||||||||
6.80%, 03/01/2020 | 107,000 | 111,280 | ||||||
Raizen Fuels Finance SA | ||||||||
5.30%, 01/20/2027 (Acquired 04/21/2017 through 04/24/2017, Cost $1,630,697) (1) | 1,580,000 | 1,601,725 | ||||||
Regency Energy Partners LP / Regency Energy Finance Corp. | ||||||||
5.88%, 03/01/2022 | 5,000,000 | 5,507,375 | ||||||
5.00%, 10/01/2022 | 6,300,000 | 6,756,051 | ||||||
Reliance Holding USA, Inc. | ||||||||
5.40%, 02/14/2022 (Acquired 11/20/2013, Cost $1,127,061) (1) | 1,115,000 | 1,221,216 | ||||||
Rockies Express Pipeline LLC | ||||||||
5.63%, 04/15/2020 (Acquired 10/28/2013, Cost $197,823) (1) | 215,000 | 228,437 | ||||||
Sabine Pass Liquefaction LLC | ||||||||
5.75%, 05/15/2024 | 5,027,000 | 5,598,037 | ||||||
5.63%, 03/01/2025 | 5,000,000 | 5,520,950 | ||||||
5.88%, 06/30/2026 | 1,771,000 | 1,982,098 | ||||||
Schlumberger Holdings Co. | ||||||||
3.63%, 12/21/2022 (Acquired 12/10/2015, Cost $5,592,932) (1) | 5,599,000 | 5,824,780 | ||||||
Schlumberger Investment SA | ||||||||
3.30%, 09/14/2021 (Acquired 10/28/2013, Cost $338,768) (1) | 337,000 | 348,206 | ||||||
3.65%, 12/01/2023 | 409,000 | 429,853 | ||||||
Shell International Finance BV | ||||||||
4.30%, 09/22/2019 | 310,000 | 326,373 | ||||||
4.38%, 03/25/2020 | 885,000 | 941,760 | ||||||
2.13%, 05/11/2020 | 699,000 | 702,683 | ||||||
2.88%, 05/10/2026 | 2,296,000 | 2,265,838 | ||||||
4.13%, 05/11/2035 | 625,000 | 651,461 | ||||||
6.38%, 12/15/2038 | 619,000 | 824,580 | ||||||
4.00%, 05/10/2046 | 2,467,000 | 2,440,909 | ||||||
3.75%, 09/12/2046 | 726,000 | 688,071 | ||||||
Sinopec Group Overseas Development 2012 Ltd. | ||||||||
3.90%, 05/17/2022 (Acquired 06/22/2015, Cost $611,297) (1) | 600,000 | 626,121 | ||||||
Sinopec Group Overseas Development 2013 Ltd. | ||||||||
4.38%, 10/17/2023 (Acquired 10/28/2013, Cost $475,816) (1) | 475,000 | 505,863 | ||||||
Sinopec Group Overseas Development 2015 Ltd. | ||||||||
2.50%, 04/28/2020 (Acquired 04/21/2015, Cost $8,977,842) (1) | 9,000,000 | 9,042,886 | ||||||
Sinopec Group Overseas Development 2016 Ltd. | ||||||||
3.50%, 05/03/2026 (Acquired 04/25/2016, Cost $1,984,966) (1) | 2,000,000 | 1,988,030 | ||||||
Southern Natural Gas Co. LLC | ||||||||
8.00%, 03/01/2032 | 446,000 | 603,350 | ||||||
4.80%, 03/15/2047 (Acquired 03/07/2017, Cost $426,790) (1) | 428,000 | 453,569 | ||||||
Spectra Energy Capital LLC | ||||||||
8.00%, 10/01/2019 | 515,000 | 573,831 | ||||||
5.65%, 03/01/2020 | 253,000 | 271,828 | ||||||
3.30%, 03/15/2023 | 467,000 | 468,689 | ||||||
7.50%, 09/15/2038 | 1,457,000 | 1,915,299 | ||||||
Spectra Energy Partners LP | ||||||||
| Principal Amount | Value | |||||||
2.95%, 09/25/2018 | 306,000 | 309,449 | ||||||
3.50%, 03/15/2025 | 787,000 | 779,039 | ||||||
5.95%, 09/25/2043 | 207,000 | 239,159 | ||||||
4.50%, 03/15/2045 | 3,000,000 | 2,960,751 | ||||||
Statoil ASA | ||||||||
1.20%, 01/17/2018 | 221,000 | 220,667 | ||||||
1.15%, 05/15/2018 | 304,000 | 303,000 | ||||||
5.25%, 04/15/2019 | 382,000 | 404,465 | ||||||
3.15%, 01/23/2022 | 237,000 | 243,578 | ||||||
2.45%, 01/17/2023 | 280,000 | 277,348 | ||||||
2.65%, 01/15/2024 | 663,000 | 654,490 | ||||||
3.25%, 11/10/2024 | 508,000 | 519,114 | ||||||
4.25%, 11/23/2041 | 193,000 | 197,956 | ||||||
Suncor Energy, Inc. | ||||||||
3.60%, 12/01/2024 | 677,000 | 692,763 | ||||||
5.95%, 12/01/2034 | 1,048,000 | 1,263,809 | ||||||
Sunoco Logistics Partners Operations LP | ||||||||
5.50%, 02/15/2020 | 410,000 | 437,629 | ||||||
4.25%, 04/01/2024 | 833,000 | 854,039 | ||||||
5.95%, 12/01/2025 | 200,000 | 224,939 | ||||||
4.95%, 01/15/2043 | 1,482,000 | 1,383,811 | ||||||
5.30%, 04/01/2044 | 200,000 | 195,218 | ||||||
5.35%, 05/15/2045 | 633,000 | 621,224 | ||||||
TC PipeLines LP | ||||||||
4.38%, 03/13/2025 | 6,215,000 | 6,477,230 | ||||||
3.90%, 05/25/2027 | 5,457,000 | 5,445,611 | ||||||
Texas Eastern Transmission LP | ||||||||
2.80%, 10/15/2022 (Acquired 10/28/2013, Cost $678,273) (1) | 714,000 | 700,385 | ||||||
Tosco Co. | ||||||||
7.80%, 01/01/2027 | 522,000 | 675,336 | ||||||
8.13%, 02/15/2030 | 361,000 | 502,112 | ||||||
Total Capital Canada Ltd. | ||||||||
2.75%, 07/15/2023 | 350,000 | 351,837 | ||||||
Total Capital International SA | ||||||||
2.75%, 06/19/2021 | 900,000 | 917,619 | ||||||
2.70%, 01/25/2023 | 144,000 | 144,717 | ||||||
3.75%, 04/10/2024 | 229,000 | 241,913 | ||||||
TransCanada PipeLines Ltd. | ||||||||
1.63%, 11/09/2017 | 1,052,000 | 1,052,479 | ||||||
1.88%, 01/12/2018 | 205,000 | 205,276 | ||||||
6.50%, 08/15/2018 | 196,000 | 205,880 | ||||||
7.13%, 01/15/2019 | 273,000 | 293,860 | ||||||
4.88%, 01/15/2026 | 792,000 | 885,968 | ||||||
6.20%, 10/15/2037 | 573,000 | 730,976 | ||||||
7.25%, 08/15/2038 | 217,000 | 302,320 | ||||||
Valero Energy Corp. | ||||||||
7.50%, 04/15/2032 | 250,000 | 320,803 | ||||||
6.63%, 06/15/2037 | 5,000,000 | 6,151,145 | ||||||
Western Gas Partners LP | ||||||||
4.65%, 07/01/2026 | 414,000 | 423,825 | ||||||
5.45%, 04/01/2044 | 977,000 | 992,995 | ||||||
Williams Cos, Inc./The | ||||||||
5.75%, 06/24/2044 | 2,500,000 | 2,581,250 | ||||||
Williams Partners LP | ||||||||
4.30%, 03/04/2024 | 2,500,000 | 2,600,627 | ||||||
3.90%, 01/15/2025 | 700,000 | 707,749 | ||||||
6.30%, 04/15/2040 | 4,219,000 | 4,894,964 | ||||||
4.90%, 01/15/2045 | 7,000,000 | 7,018,417 | ||||||
Williams Partners LP / ACMP Finance Corp. | ||||||||
4.88%, 05/15/2023 | 1,000,000 | 1,037,620 | ||||||
Woodside Finance Ltd. | ||||||||
3.65%, 03/05/2025 (Acquired 02/26/2015, Cost $3,298,446) (1) | 3,300,000 | 3,288,308 | ||||||
|
| |||||||
| 446,422,063 | ||||||||
|
| |||||||
Financials - 11.74% | ||||||||
ABN AMRO Bank NV | ||||||||
2.50%, 10/30/2018 (Acquired 10/28/2013 through 11/07/2014, Cost $6,550,869) (1) | 6,542,000 | 6,593,087 | ||||||
2.10%, 01/18/2019 (Acquired 05/11/2017 through 05/12/2017, Cost $1,596,770) (1) | 1,594,000 | 1,596,491 | ||||||
2.45%, 06/04/2020 (Acquired 05/28/2015, Cost $1,997,359) (1) | 2,000,000 | 2,012,132 | ||||||
4.75%, 07/28/2025 (Acquired 07/21/2015 through 02/17/2017, Cost $1,047,879) (1) | 1,031,000 | 1,086,922 | ||||||
ACE INA Holdings, Inc. | ||||||||
| Principal Amount | Value | |||||||
2.88%, 11/03/2022 | 312,000 | 317,353 | ||||||
2.70%, 03/13/2023 | 300,000 | 300,208 | ||||||
3.15%, 03/15/2025 | 3,409,000 | 3,456,688 | ||||||
3.35%, 05/03/2026 | 250,000 | 255,727 | ||||||
4.35%, 11/03/2045 | 305,000 | 334,925 | ||||||
AerCap Ireland Capital DAC / AerCap Global Aviation Trust | ||||||||
3.50%, 05/26/2022 | 701,000 | 719,316 | ||||||
AerCap Ireland Capital Ltd. / AerCap Global Aviation Trust | ||||||||
4.50%, 05/15/2021 | 11,879,000 | 12,602,312 | ||||||
AIA Group Ltd. | ||||||||
2.25%, 03/11/2019 (Acquired 04/15/2016, Cost $1,276,957) (1) | 1,270,000 | 1,269,267 | ||||||
3.20%, 03/11/2025 (Acquired 03/04/2015 through 09/29/2015, Cost $9,307,235) (1) | 9,545,000 | 9,460,893 | ||||||
AIG Global Funding | ||||||||
1.65%, 12/15/2017 (Acquired 12/08/2014, Cost $452,934) (1) | 453,000 | 453,289 | ||||||
AIG SunAmerica Global Financing X | ||||||||
6.90%, 03/15/2032 (Acquired 10/28/2013, Cost $1,160,478) (1) | 955,000 | 1,262,716 | ||||||
Air Lease Corp. | ||||||||
2.13%, 01/15/2020 | 1,263,000 | 1,256,877 | ||||||
3.88%, 04/01/2021 | 400,000 | 417,214 | ||||||
3.00%, 09/15/2023 | 710,000 | 705,816 | ||||||
3.63%, 04/01/2027 | 340,000 | 340,069 | ||||||
Allstate Co./The | ||||||||
3.15%, 06/15/2023 | 420,000 | 430,337 | ||||||
Ally Financial, Inc. | ||||||||
8.00%, 12/31/2018 | 43,000 | 46,386 | ||||||
3.50%, 01/27/2019 | 1,000,000 | 1,013,750 | ||||||
American Express Centurion Bank | ||||||||
6.00%, 09/13/2017 | 506,000 | 510,134 | ||||||
American Express Credit Corp. | ||||||||
7.00%, 03/19/2018 | 284,000 | 294,560 | ||||||
1.80%, 07/31/2018 | 456,000 | 456,118 | ||||||
1.88%, 11/05/2018 | 831,000 | 832,315 | ||||||
2.13%, 03/18/2019 | 318,000 | 319,535 | ||||||
1.88%, 05/03/2019 | 7,093,000 | 7,095,752 | ||||||
2.25%, 08/15/2019 | 250,000 | 252,393 | ||||||
2.38%, 05/26/2020 | 894,000 | 901,443 | ||||||
2.60%, 09/14/2020 | 319,000 | 323,632 | ||||||
2.25%, 05/05/2021 | 380,000 | 379,378 | ||||||
2.70%, 03/03/2022 | 1,250,000 | 1,260,393 | ||||||
American International Group, Inc. | ||||||||
6.40%, 12/15/2020 | 5,100,000 | 5,770,650 | ||||||
4.88%, 06/01/2022 | 3,500,000 | 3,839,966 | ||||||
4.13%, 02/15/2024 | 879,000 | 928,121 | ||||||
3.75%, 07/10/2025 | 444,000 | 452,290 | ||||||
3.88%, 01/15/2035 | 376,000 | 364,876 | ||||||
4.50%, 07/16/2044 | 1,757,000 | 1,789,102 | ||||||
8.18%, 05/15/2058 | 107,000 | 144,450 | ||||||
American Tower Corp. | ||||||||
2.25%, 01/15/2022 | 600,000 | 584,980 | ||||||
American Tower Trust #1 | ||||||||
1.55%, 03/15/2018 (Acquired 10/28/2013, Cost $389,094) (1) | 396,000 | 395,201 | ||||||
3.07%, 03/15/2023 (Acquired 12/05/2014 through 05/20/2015, Cost $2,882,461) (1) | 2,900,000 | 2,921,765 | ||||||
Ameriprise Financial, Inc. | ||||||||
7.30%, 06/28/2019 | 215,000 | 236,895 | ||||||
2.88%, 09/15/2026 | 1,015,000 | 985,611 | ||||||
Ameritech Capital Funding Co. | ||||||||
6.45%, 01/15/2018 | 321,000 | 328,922 | ||||||
AmSouth BanCorp. | ||||||||
6.75%, 11/01/2025 | 527,000 | 618,417 | ||||||
ANZ New Zealand Int’l Ltd./London | ||||||||
1.75%, 03/29/2018 (Acquired 03/24/2015, Cost $2,436,950) (1) | 2,437,000 | 2,439,213 | ||||||
2.60%, 09/23/2019 (Acquired 09/16/2014, Cost $3,648,883) (1) | 3,650,000 | 3,677,904 | ||||||
2.85%, 08/06/2020 (Acquired 07/30/2015, Cost $249,868) (1) | 250,000 | 253,696 | ||||||
Aon Plc | ||||||||
4.00%, 11/27/2023 | 5,000,000 | 5,279,200 | ||||||
3.50%, 06/14/2024 | 815,000 | 831,054 | ||||||
3.88%, 12/15/2025 | 500,000 | 522,533 | ||||||
6.25%, 09/30/2040 | 172,000 | 217,037 | ||||||
Arch Capital Finance LLC | ||||||||
5.03%, 12/15/2046 | 437,000 | 486,514 | ||||||
| Principal Amount | Value | |||||||
Athene Global Funding | ||||||||
2.75%, 04/20/2020 (Acquired 04/17/2017, Cost $1,404,588) (1) | 1,407,000 | 1,409,974 | ||||||
4.00%, 01/25/2022 (Acquired 06/23/2017, Cost $1,152,308) (1) | 1,104,000 | 1,146,651 | ||||||
Australia & New Zealand Banking Group Ltd. | ||||||||
4.88%, 01/12/2021 (Acquired 10/28/2013, Cost $312,796) (1) | 296,000 | 319,754 | ||||||
4.40%, 05/19/2026 (Acquired 05/12/2016, Cost $225,901) (1) | 226,000 | 233,211 | ||||||
Australia & New Zealand Banking Group Ltd./New York NY | ||||||||
1.45%, 05/15/2018 | 640,000 | 639,382 | ||||||
AvalonBay Communities, Inc. | ||||||||
2.85%, 03/15/2023 | 600,000 | 596,929 | ||||||
2.90%, 10/15/2026 | 220,000 | 212,813 | ||||||
3.90%, 10/15/2046 | 214,000 | 206,612 | ||||||
AXIS Specialty Finance Plc | ||||||||
2.65%, 04/01/2019 | 2,890,000 | 2,906,800 | ||||||
BAC Capital Trust VI | ||||||||
5.63%, 03/08/2035 | 43,000 | 45,788 | ||||||
Banco Santander SA | ||||||||
3.50%, 04/11/2022 | 7,200,000 | 7,368,221 | ||||||
4.25%, 04/11/2027 | 1,600,000 | 1,660,718 | ||||||
Bank Nederlandse Gemeenten NV | ||||||||
2.63%, 04/28/2021 (Acquired 01/25/2016, Cost $6,500,246) (1) | 6,350,000 | 6,489,903 | ||||||
Bank of America Corp. | ||||||||
6.40%, 08/28/2017 | 2,293,000 | 2,309,287 | ||||||
5.75%, 12/01/2017 | 480,000 | 488,129 | ||||||
2.00%, 01/11/2018 | 2,408,000 | 2,411,708 | ||||||
6.88%, 04/25/2018 | 1,513,000 | 1,574,484 | ||||||
5.65%, 05/01/2018 | 825,000 | 850,915 | ||||||
1.95%, 05/12/2018 | 500,000 | 500,533 | ||||||
6.88%, 11/15/2018 | 1,500,000 | 1,596,902 | ||||||
2.05%, 12/07/2018 | 1,089,000 | 1,094,079 | ||||||
2.60%, 01/15/2019 | 978,000 | 987,240 | ||||||
2.65%, 04/01/2019 | 710,000 | 718,576 | ||||||
7.63%, 06/01/2019 | 360,000 | 397,166 | ||||||
2.25%, 04/21/2020 | 701,000 | 701,235 | ||||||
5.63%, 07/01/2020 | 2,625,000 | 2,874,438 | ||||||
2.63%, 10/19/2020 | 2,885,000 | 2,913,841 | ||||||
5.88%, 01/05/2021 | 15,000,000 | 16,670,205 | ||||||
2.63%, 04/19/2021 | 2,500,000 | 2,510,855 | ||||||
5.00%, 05/13/2021 | 2,570,000 | 2,803,952 | ||||||
3.30%, 01/11/2023 | 6,184,000 | 6,305,015 | ||||||
4.10%, 07/24/2023 | 217,000 | 229,690 | ||||||
4.13%, 01/22/2024 | 11,747,000 | 12,397,044 | ||||||
4.00%, 04/01/2024 | 2,490,000 | 2,609,396 | ||||||
4.20%, 08/26/2024 | 5,765,000 | 5,980,899 | ||||||
4.00%, 01/22/2025 | 1,489,000 | 1,515,060 | ||||||
3.95%, 04/21/2025 | 5,201,000 | 5,270,335 | ||||||
3.88%, 08/01/2025 | 621,000 | 642,490 | ||||||
4.45%, 03/03/2026 | 7,140,000 | 7,431,619 | ||||||
4.25%, 10/22/2026 | 544,000 | 560,255 | ||||||
3.25%, 10/21/2027 | 6,250,000 | 6,040,275 | ||||||
4.18%, 11/25/2027 | 3,950,000 | 4,017,897 | ||||||
3.82%, 01/20/2028 | 4,980,000 | 5,067,006 | ||||||
3.71%, 04/24/2028 | 4,500,000 | 4,533,948 | ||||||
6.11%, 01/29/2037 | 3,580,000 | 4,386,463 | ||||||
7.75%, 05/14/2038 | 137,000 | 197,229 | ||||||
4.44%, 01/20/2048 | 1,990,000 | 2,110,475 | ||||||
Bank of Montreal | ||||||||
1.40%, 09/11/2017 | 201,000 | 200,984 | ||||||
2.38%, 01/25/2019 | 215,000 | 216,940 | ||||||
1.50%, 07/18/2019 | 522,000 | 517,118 | ||||||
2.55%, 11/06/2022 | 878,000 | 876,458 | ||||||
Bank of New York Mellon Co./The | ||||||||
4.60%, 01/15/2020 | 387,000 | 411,146 | ||||||
2.60%, 08/17/2020 | 663,000 | 672,742 | ||||||
2.45%, 11/27/2020 | 247,000 | 249,388 | ||||||
2.50%, 04/15/2021 | 215,000 | 216,687 | ||||||
3.55%, 09/23/2021 | 355,000 | 370,741 | ||||||
2.60%, 02/07/2022 | 700,000 | 704,819 | ||||||
3.65%, 02/04/2024 | 93,000 | 96,989 | ||||||
3.25%, 09/11/2024 | 650,000 | 663,488 | ||||||
| Principal Amount | Value | |||||||
3.00%, 02/24/2025 | 5,360,000 | 5,351,033 | ||||||
2.80%, 05/04/2026 | 305,000 | 297,871 | ||||||
Bank of Nova Scotia/The | ||||||||
1.45%, 04/25/2018 | 867,000 | 866,124 | ||||||
1.85%, 04/14/2020 | 1,900,000 | 1,888,887 | ||||||
1.88%, 09/20/2021 (Acquired 09/13/2016, Cost $400,000) (1) | 400,000 | 391,341 | ||||||
2.70%, 03/07/2022 | 14,340,000 | 14,418,741 | ||||||
Bank of Tokyo-Mitsubishi UFJ Ltd./The | ||||||||
2.15%, 09/14/2018 (Acquired 09/08/2015, Cost $349,959) (1) | 350,000 | 350,738 | ||||||
2.30%, 03/10/2019 (Acquired 03/04/2014 through 06/26/2015, Cost $5,521,920) (1) | 5,525,000 | 5,540,625 | ||||||
2.35%, 09/08/2019 (Acquired 09/02/2014, Cost $339,949) (1) | 340,000 | 341,023 | ||||||
4.10%, 09/09/2023 (Acquired 10/28/2013, Cost $243,974) (1) | 239,000 | 255,409 | ||||||
3.75%, 03/10/2024 (Acquired 03/04/2014, Cost $3,209,840) (1) | 3,215,000 | 3,355,682 | ||||||
BanPonce Trust I | ||||||||
8.33%, 02/01/2027 | 234,000 | 227,352 | ||||||
Banque Federative du Credit Mutuel SA | ||||||||
2.00%, 04/12/2019 (Acquired 03/22/2017, Cost $5,322,007) (1) | 5,350,000 | 5,349,604 | ||||||
Barclays Plc | ||||||||
6.05%, 12/04/2017 (Acquired 10/28/2013, Cost $387,243) (1) | 382,000 | 388,560 | ||||||
3.20%, 08/10/2021 | 2,993,000 | 3,036,018 | ||||||
3.68%, 01/10/2023 | 12,745,000 | 13,075,745 | ||||||
3.65%, 03/16/2025 | 2,522,000 | 2,509,463 | ||||||
4.38%, 01/12/2026 | 3,514,000 | 3,651,454 | ||||||
4.34%, 01/10/2028 | 2,360,000 | 2,429,627 | ||||||
5.25%, 08/17/2045 | 413,000 | �� | 463,006 | |||||
BB&T Co. | ||||||||
1.60%, 08/15/2017 | 384,000 | 384,028 | ||||||
6.85%, 04/30/2019 | 170,000 | 184,451 | ||||||
5.25%, 11/01/2019 | 284,000 | 303,568 | ||||||
2.63%, 06/29/2020 | 1,100,000 | 1,118,592 | ||||||
Berkshire Hathaway Finance Corp. | ||||||||
1.30%, 08/15/2019 | 4,564,000 | 4,531,062 | ||||||
5.75%, 01/15/2040 | 134,000 | 172,239 | ||||||
4.40%, 05/15/2042 | 1,524,000 | 1,662,048 | ||||||
4.30%, 05/15/2043 | 322,000 | 344,251 | ||||||
Berkshire Hathaway, Inc. | ||||||||
3.75%, 08/15/2021 | 605,000 | 644,017 | ||||||
3.00%, 02/11/2023 | 268,000 | 274,614 | ||||||
3.13%, 03/15/2026 | 8,130,000 | 8,222,267 | ||||||
BlackRock, Inc. | ||||||||
5.00%, 12/10/2019 | 484,000 | 519,707 | ||||||
4.25%, 05/24/2021 | 475,000 | 511,907 | ||||||
3.38%, 06/01/2022 | 493,000 | 514,269 | ||||||
3.50%, 03/18/2024 | 405,000 | 425,824 | ||||||
Blackstone Holdings Finance Co. LLC | ||||||||
5.88%, 03/15/2021 (Acquired 10/28/2013, Cost $1,547,007) (1) | 1,445,000 | 1,604,149 | ||||||
4.45%, 07/15/2045 (Acquired 04/22/2015 through 04/23/2015, Cost $168,892) (1) | 170,000 | 171,028 | ||||||
BNP Paribas SA | ||||||||
2.38%, 05/21/2020 | 1,390,000 | 1,403,758 | ||||||
3.25%, 03/03/2023 | 430,000 | 441,007 | ||||||
3.80%, 01/10/2024 (Acquired 05/08/2017, Cost $5,277,468) (1) | 5,208,000 | 5,422,382 | ||||||
4.63%, 03/13/2027 (Acquired 03/06/2017, Cost $829,235) (1) | 830,000 | 875,336 | ||||||
BNZ International Funding Ltd./London | ||||||||
2.35%, 03/04/2019 (Acquired 02/25/2014, Cost $515,933) (1) | 516,000 | 518,412 | ||||||
2.10%, 09/14/2021 (Acquired 09/06/2016, Cost $399,681) (1) | 400,000 | 391,386 | ||||||
Boston Properties LP | ||||||||
3.13%, 09/01/2023 | 300,000 | 303,673 | ||||||
3.65%, 02/01/2026 | 557,000 | 563,707 | ||||||
2.75%, 10/01/2026 | 480,000 | 453,251 | ||||||
BPCE SA | ||||||||
1.63%, 01/26/2018 | 1,300,000 | 1,297,845 | ||||||
2.50%, 12/10/2018 | 2,500,000 | 2,522,330 | ||||||
2.50%, 07/15/2019 | 1,000,000 | 1,008,380 | ||||||
5.70%, 10/22/2023 (Acquired 10/28/2013 through 09/29/2016, Cost $4,480,767) (1) | 4,345,000 | 4,834,681 | ||||||
4.63%, 07/11/2024 (Acquired 09/15/2016, Cost $609,897) (1) | 600,000 | 621,937 | ||||||
5.15%, 07/21/2024 (Acquired 05/16/2016 through 03/24/2017, Cost $4,943,936) (1) | 4,800,000 | 5,128,570 | ||||||
3.38%, 12/02/2026 | 500,000 | 506,166 | ||||||
Brighthouse Financial, Inc. | ||||||||
3.70%, 06/22/2027 (Acquired 06/15/2017, Cost $4,564,216) (1) | 4,568,000 | 4,497,913 | ||||||
4.70%, 06/22/2047 (Acquired 06/15/2017, Cost $1,758,891) (1) | 1,771,000 | 1,741,138 | ||||||
| Principal Amount | Value | |||||||
Brixmor Operating Partnership LP | ||||||||
3.85%, 02/01/2025 | 1,100,000 | 1,085,653 | ||||||
Caisse Centrale Desjardins | ||||||||
1.84%, 01/29/2018 (Acquired 01/26/2015, Cost $7,000,000) (1) | 7,000,000 | 7,021,315 | ||||||
Canadian Imperial Bank of Commerce | ||||||||
1.60%, 09/06/2019 | 1,500,000 | 1,485,874 | ||||||
2.55%, 06/16/2022 | 800,000 | 798,177 | ||||||
Capital One Bank USA NA | ||||||||
2.15%, 11/21/2018 | 5,000,000 | 5,006,855 | ||||||
3.38%, 02/15/2023 | 4,164,000 | 4,199,015 | ||||||
Capital One Financial Corp. | ||||||||
2.45%, 04/24/2019 | 353,000 | 354,900 | ||||||
2.50%, 05/12/2020 | 6,584,285 | 6,612,334 | ||||||
3.05%, 03/09/2022 | 2,500,000 | 2,519,372 | ||||||
3.75%, 04/24/2024 | 824,000 | 842,055 | ||||||
3.20%, 02/05/2025 | 726,000 | 710,717 | ||||||
4.20%, 10/29/2025 | 1,240,000 | 1,250,458 | ||||||
3.75%, 07/28/2026 | 960,000 | 936,889 | ||||||
3.75%, 03/09/2027 | 5,757,427 | 5,737,149 | ||||||
Capital One NA/Mclean VA | ||||||||
1.65%, 02/05/2018 | 13,000,000 | 12,994,826 | ||||||
1.85%, 02/05/2018 | 3,000,000 | 3,007,008 | ||||||
2.40%, 09/05/2019 | 500,000 | 501,803 | ||||||
2.95%, 07/23/2021 | 4,120,000 | 4,150,035 | ||||||
2.25%, 09/13/2021 | 7,005,000 | 6,874,525 | ||||||
Carlyle Investment Management, LLC | ||||||||
0.00%, 07/15/2019 (8) | 178,168 | 178,168 | ||||||
CDP Financial, Inc. | ||||||||
4.40%, 11/25/2019 (Acquired 10/28/2013, Cost $325,247) (1) | 310,000 | 327,612 | ||||||
Charles Schwab Co./The | ||||||||
3.23%, 09/01/2022 | 165,000 | 169,957 | ||||||
3.20%, 03/02/2027 | 1,700,000 | 1,708,114 | ||||||
Chubb Co./The | ||||||||
5.75%, 05/15/2018 | 117,000 | 121,206 | ||||||
Citibank NA | ||||||||
2.10%, 06/12/2020 | 5,271,000 | 5,272,966 | ||||||
Citigroup, Inc. | ||||||||
1.70%, 04/27/2018 | 1,500,000 | 1,498,509 | ||||||
1.75%, 05/01/2018 | 800,000 | 799,654 | ||||||
2.15%, 07/30/2018 | 658,000 | 660,083 | ||||||
2.05%, 12/07/2018 | 3,600,000 | 3,605,458 | ||||||
2.40%, 02/18/2020 | 2,500,000 | 2,509,770 | ||||||
2.35%, 08/02/2021 | 269,000 | 266,531 | ||||||
2.75%, 04/25/2022 | 26,291,000 | 26,292,262 | ||||||
3.75%, 06/16/2024 | 4,000,000 | 4,144,312 | ||||||
4.40%, 06/10/2025 | 11,687,000 | 12,170,503 | ||||||
5.50%, 09/13/2025 | 494,000 | 549,388 | ||||||
3.70%, 01/12/2026 | 10,750,000 | 10,873,496 | ||||||
3.40%, 05/01/2026 | 1,000,000 | 989,330 | ||||||
3.20%, 10/21/2026 | 8,770,000 | 8,529,921 | ||||||
4.30%, 11/20/2026 | 1,570,000 | 1,612,776 | ||||||
4.45%, 09/29/2027 | 5,000,000 | 5,200,660 | ||||||
3.89%, 01/10/2028 | 4,100,000 | 4,167,121 | ||||||
6.63%, 01/15/2028 | 387,000 | 472,396 | ||||||
4.13%, 07/25/2028 | 6,257,000 | 6,352,375 | ||||||
8.13%, 07/15/2039 | 164,000 | 252,072 | ||||||
5.88%, 01/30/2042 | 212,000 | 267,502 | ||||||
4.65%, 07/30/2045 | 156,000 | 169,874 | ||||||
4.75%, 05/18/2046 | 1,200,000 | 1,261,410 | ||||||
Citizens Bank NA/Providence RI | ||||||||
2.45%, 12/04/2019 | 8,000,000 | 8,068,584 | ||||||
Citizens Financial Group, Inc. | ||||||||
2.38%, 07/28/2021 | 188,000 | 186,356 | ||||||
4.30%, 12/03/2025 | 343,000 | 357,647 | ||||||
CME Group, Inc. | ||||||||
3.00%, 09/15/2022 | 1,135,000 | 1,161,869 | ||||||
3.00%, 03/15/2025 | 838,000 | 845,561 | ||||||
5.30%, 09/15/2043 | 115,000 | 143,161 | ||||||
CNA Financial Co. | ||||||||
7.35%, 11/15/2019 | 700,000 | 782,277 | ||||||
| Principal Amount | Value | |||||||
7.25%, 11/15/2023 | 7,470,000 | 9,040,769 | ||||||
3.95%, 05/15/2024 | 303,000 | 314,328 | ||||||
4.50%, 03/01/2026 | 221,000 | 237,117 | ||||||
Comerica Bank | ||||||||
2.50%, 06/02/2020 | 8,000,000 | 8,016,832 | ||||||
Comerica, Inc. | ||||||||
3.80%, 07/22/2026 | 984,000 | 995,160 | ||||||
Commonwealth Bank of Australia | ||||||||
2.00%, 09/06/2021 (Acquired 08/29/2016, Cost $449,640) (1) | 450,000 | 441,665 | ||||||
4.50%, 12/09/2025 (Acquired 12/02/2015, Cost $776,596) (1) | 778,000 | 814,690 | ||||||
Commonwealth Bank of Australia/New York NY | ||||||||
2.05%, 03/15/2019 | 2,750,000 | 2,752,953 | ||||||
Compass Bank | ||||||||
2.75%, 09/29/2019 | 5,000,000 | 5,038,940 | ||||||
3.88%, 04/10/2025 | 5,840,000 | 5,817,855 | ||||||
Cooperatieve Centrale Raiffeisen-Boerenleenbank BA/Netherlands | ||||||||
3.88%, 02/08/2022 | 5,323,000 | 5,646,500 | ||||||
4.38%, 08/04/2025 | 316,000 | 331,408 | ||||||
5.80%, 09/30/2110 (Acquired 10/28/2013, Cost $375,759) (1) | 361,000 | 450,663 | ||||||
Cooperatieve Rabobank UA | ||||||||
4.63%, 12/01/2023 | 3,900,000 | 4,202,188 | ||||||
Credit Agricole SA | ||||||||
4.38%, 03/17/2025 (Acquired 01/04/2017, Cost $301,038) (1) | 305,000 | 316,132 | ||||||
Credit Agricole SA/London | ||||||||
4.13%, 01/10/2027 (Acquired 01/03/2017, Cost $1,093,697) (1) | 1,099,000 | 1,148,619 | ||||||
Credit Suisse AG/New York NY | ||||||||
1.70%, 04/27/2018 | 375,000 | 374,977 | ||||||
Credit Suisse Group AG | ||||||||
3.57%, 01/09/2023 (Acquired 01/04/2017 through 03/23/2017, Cost $2,591,825) (1) | 2,603,000 | 2,669,002 | ||||||
4.28%, 01/09/2028 (Acquired 05/04/2017, Cost $2,516,062) (1) | 2,480,000 | 2,563,794 | ||||||
Credit Suisse Group Funding Guernsey Ltd. | ||||||||
2.75%, 03/26/2020 | 541,000 | 545,215 | ||||||
3.80%, 09/15/2022 | 613,000 | 636,820 | ||||||
3.80%, 06/09/2023 | 8,500,000 | 8,761,945 | ||||||
3.75%, 03/26/2025 | 1,900,000 | 1,919,840 | ||||||
4.55%, 04/17/2026 | 2,193,000 | 2,329,839 | ||||||
4.88%, 05/15/2045 | 250,000 | 275,550 | ||||||
Credit Suisse/New York NY | ||||||||
2.30%, 05/28/2019 | 413,000 | 415,733 | ||||||
5.30%, 08/13/2019 | 169,000 | 180,518 | ||||||
3.00%, 10/29/2021 | 1,265,000 | 1,288,958 | ||||||
3.63%, 09/09/2024 | 560,000 | 578,530 | ||||||
Crown Castle International Corp. | ||||||||
4.88%, 04/15/2022 | 1,112,000 | 1,214,646 | ||||||
5.25%, 01/15/2023 | 400,000 | 444,282 | ||||||
4.00%, 03/01/2027 | 261,000 | 268,671 | ||||||
Dai-ichi Life Insurance Co. Ltd./The | ||||||||
4.00%, 12/29/2049 (Acquired 07/13/2016, Cost $1,179,000) (1) | 1,179,000 | 1,168,389 | ||||||
Daiwa Securities Group, Inc. | ||||||||
3.13%, 04/19/2022 (Acquired 04/12/2017, Cost $854,000) (1) | 854,000 | 859,836 | ||||||
Danske Bank A/S | ||||||||
2.00%, 09/08/2021 (Acquired 08/31/2016, Cost $556,087) (1) | 558,000 | 548,423 | ||||||
2.70%, 03/02/2022 (Acquired 02/23/2017, Cost $541,171) (1) | 542,000 | 545,419 | ||||||
DDR Corp. | ||||||||
4.70%, 06/01/2027 | 368,000 | 368,836 | ||||||
Deutsche Bank AG | ||||||||
3.13%, 01/13/2021 | 2,000,000 | 2,009,794 | ||||||
4.25%, 10/14/2021 | 4,165,000 | 4,361,017 | ||||||
4.50%, 04/01/2025 | 300,000 | 298,018 | ||||||
4.10%, 01/13/2026 | 850,000 | 862,147 | ||||||
Deutsche Bank AG/London | ||||||||
6.00%, 09/01/2017 | 901,000 | 906,947 | ||||||
1.88%, 02/13/2018 | 2,429,000 | 2,428,322 | ||||||
2.50%, 02/13/2019 | 6,000,000 | 6,022,524 | ||||||
3.70%, 05/30/2024 | 2,063,000 | 2,062,763 | ||||||
Dexia Credit Local SA | ||||||||
1.88%, 09/15/2021 (Acquired 09/07/2016, Cost $2,744,476) (1) | 2,750,000 | 2,683,268 | ||||||
Discover Bank | ||||||||
3.10%, 06/04/2020 | 8,000,000 | 8,151,752 | ||||||
4.20%, 08/08/2023 | 8,311,000 | 8,739,964 | ||||||
| Principal Amount | Value | |||||||
Discover Financial Services | ||||||||
3.75%, 03/04/2025 | 2,920,000 | 2,885,421 | ||||||
4.10%, 02/09/2027 | 740,000 | 741,355 | ||||||
Duke Realty LP | ||||||||
3.63%, 04/15/2023 | 7,744,000 | 7,928,625 | ||||||
3.25%, 06/30/2026 | 203,000 | 199,364 | ||||||
EPR Properties | ||||||||
4.50%, 06/01/2027 | 807,000 | 811,924 | ||||||
Equity Commonwealth | ||||||||
6.65%, 01/15/2018 | 401,000 | 401,480 | ||||||
5.88%, 09/15/2020 | 1,393,000 | 1,489,619 | ||||||
ERP Operating LP | ||||||||
2.38%, 07/01/2019 | 646,000 | 649,822 | ||||||
4.63%, 12/15/2021 | 260,000 | 280,916 | ||||||
3.00%, 04/15/2023 | 200,000 | 200,821 | ||||||
2.85%, 11/01/2026 | 542,000 | 521,220 | ||||||
Fifth Third Bancorp | ||||||||
2.88%, 07/27/2020 | 3,007,000 | 3,069,485 | ||||||
2.60%, 06/15/2022 | 15,397,000 | 15,316,058 | ||||||
Fifth Third Bank/Cincinnati OH | ||||||||
2.38%, 04/25/2019 | 1,100,000 | 1,107,364 | ||||||
First Tennessee Bank NA | ||||||||
2.95%, 12/01/2019 | 5,000,000 | 5,054,790 | ||||||
FMR LLC | ||||||||
4.95%, 02/01/2033 (Acquired 10/28/2013, Cost $247,548) (1) | 250,000 | 278,775 | ||||||
6.45%, 11/15/2039 (Acquired 10/28/2013, Cost $297,060) (1) | 258,000 | 340,150 | ||||||
GE Capital International Funding Unlimited Co. | ||||||||
2.34%, 11/15/2020 | 5,186,000 | 5,227,006 | ||||||
3.37%, 11/15/2025 | 772,000 | 798,292 | ||||||
4.42%, 11/15/2035 | 6,028,000 | 6,567,735 | ||||||
General Electric Capital Co. | ||||||||
2.20%, 01/09/2020 | 161,000 | 162,446 | ||||||
Genworth Holdings, Inc. | ||||||||
4.90%, 08/15/2023 | 161,000 | 133,630 | ||||||
Goldman Sachs Capital I | ||||||||
6.35%, 02/15/2034 | 127,000 | 156,678 | ||||||
Goldman Sachs Group, Inc./The | ||||||||
5.95%, 01/18/2018 | 1,289,000 | 1,317,821 | ||||||
6.15%, 04/01/2018 | 1,466,000 | 1,513,056 | ||||||
2.63%, 01/31/2019 | 263,000 | 265,733 | ||||||
7.50%, 02/15/2019 | 3,617,000 | 3,923,494 | ||||||
2.55%, 10/23/2019 | 1,000,000 | 1,010,960 | ||||||
5.38%, 03/15/2020 | 2,985,000 | 3,222,952 | ||||||
2.60%, 04/23/2020 | 1,328,000 | 1,340,236 | ||||||
6.00%, 06/15/2020 | 1,514,000 | 1,670,155 | ||||||
2.75%, 09/15/2020 | 396,000 | 400,738 | ||||||
2.88%, 02/25/2021 | 680,000 | 687,232 | ||||||
5.25%, 07/27/2021 | 403,000 | 441,667 | ||||||
2.35%, 11/15/2021 | 2,600,000 | 2,568,402 | ||||||
5.75%, 01/24/2022 | 17,947,000 | 20,203,997 | ||||||
3.63%, 01/22/2023 | 4,815,000 | 4,969,022 | ||||||
3.50%, 01/23/2025 | 6,509,000 | 6,580,273 | ||||||
3.75%, 05/22/2025 | 1,305,000 | 1,336,426 | ||||||
3.75%, 02/25/2026 | 9,005,000 | 9,170,233 | ||||||
3.50%, 11/16/2026 | 700,000 | 696,361 | ||||||
3.85%, 01/26/2027 | 2,975,000 | 3,026,783 | ||||||
6.75%, 10/01/2037 | 4,938,000 | 6,424,037 | ||||||
5.15%, 05/22/2045 | 4,128,000 | 4,592,660 | ||||||
4.75%, 10/21/2045 | 3,993,000 | 4,424,312 | ||||||
Goodman Australia Industrial Fund Bond Issuer Pty Ltd. | ||||||||
3.40%, 09/30/2026 (Acquired 09/26/2016, Cost $997,876) (1) | 1,000,000 | 982,313 | ||||||
Great-West Life & Annuity Insurance Capital LP II | ||||||||
3.72%, 05/16/2046 (Acquired 10/28/2013, Cost $303,942) (1) | 301,000 | 298,743 | ||||||
Great-West Lifeco Finance Delaware LP | ||||||||
4.15%, 06/03/2047 (Acquired 05/23/2017, Cost $1,091,414) (1) | 1,100,000 | 1,103,286 | ||||||
Guardian Life Insurance Co. of America/The | ||||||||
7.38%, 09/30/2039 (Acquired 12/03/2015, Cost $5,269,508) (1) | 4,083,000 | 5,824,669 | ||||||
4.85%, 01/24/2077 (Acquired 01/17/2017, Cost $241,648) (1) | 244,000 | 258,834 | ||||||
Hartford Financial Services Group, Inc./The | ||||||||
6.00%, 01/15/2019 | 4,591,000 | 4,865,620 | ||||||
| Principal Amount | Value | |||||||
5.13%, 04/15/2022 | 5,500,000 | 6,104,659 | ||||||
8.13%, 06/15/2038 | 236,000 | 249,041 | ||||||
HCP, Inc. | ||||||||
4.20%, 03/01/2024 | 241,000 | 250,581 | ||||||
3.40%, 02/01/2025 | 662,000 | 651,926 | ||||||
Highmark, Inc. | ||||||||
4.75%, 05/15/2021 (Acquired 10/28/2013 through 07/30/2014, Cost $3,329,411) (1) | 3,322,000 | 3,431,666 | ||||||
Hospitality Properties Trust | ||||||||
4.65%, 03/15/2024 | 366,000 | 380,922 | ||||||
4.95%, 02/15/2027 | 566,000 | 591,097 | ||||||
HSBC Bank Plc | ||||||||
1.50%, 05/15/2018 (Acquired 10/28/2013, Cost $940,717) (1) | 944,000 | 942,953 | ||||||
4.75%, 01/19/2021 (Acquired 10/28/2013 through 10/29/2014, Cost $1,457,447) (1) | 1,382,000 | 1,489,505 | ||||||
HSBC Finance Co. | ||||||||
6.68%, 01/15/2021 | 7,800,000 | 8,789,617 | ||||||
7.35%, 11/27/2032 | 32,000 | 41,332 | ||||||
HSBC Holdings Plc | ||||||||
2.65%, 01/05/2022 | 2,618,000 | 2,609,143 | ||||||
4.00%, 03/30/2022 | 1,494,000 | 1,575,548 | ||||||
3.26%, 03/13/2023 | 7,784,000 | 7,930,635 | ||||||
3.60%, 05/25/2023 | 2,901,000 | 2,997,525 | ||||||
4.25%, 03/14/2024 | 1,795,000 | 1,857,093 | ||||||
4.25%, 08/18/2025 | 1,009,000 | 1,036,645 | ||||||
4.38%, 11/23/2026 | 559,000 | 580,089 | ||||||
4.04%, 03/13/2028 | 10,784,000 | 11,171,027 | ||||||
6.10%, 01/14/2042 | 743,000 | 976,289 | ||||||
HSBC USA, Inc. | ||||||||
1.63%, 01/16/2018 | 769,000 | 769,266 | ||||||
5.00%, 09/27/2020 | 3,000,000 | 3,224,553 | ||||||
9.13%, 05/15/2021 | 75,000 | 91,108 | ||||||
Huntington Bancshares, Inc./OH | ||||||||
3.15%, 03/14/2021 | 225,000 | 229,418 | ||||||
2.30%, 01/14/2022 | 4,220,000 | 4,156,173 | ||||||
Huntington National Bank/The | ||||||||
2.00%, 06/30/2018 | 440,000 | 441,567 | ||||||
2.20%, 11/06/2018 | 3,328,000 | 3,337,288 | ||||||
2.88%, 08/20/2020 | 4,534,000 | 4,610,779 | ||||||
Industrial & Commercial Bank of China Ltd./New York | ||||||||
2.35%, 11/13/2017 | 676,000 | 677,984 | ||||||
2.45%, 10/20/2021 | 1,150,000 | 1,130,864 | ||||||
ING Bank NV | ||||||||
2.00%, 11/26/2018 (Acquired 02/08/2017, Cost $355,590) (1) | 355,000 | 355,305 | ||||||
1.65%, 08/15/2019 (Acquired 08/08/2016, Cost $799,418) (1) | 800,000 | 792,158 | ||||||
2.50%, 10/01/2019 (Acquired 09/23/2014, Cost $1,146,973) (1) | 1,150,000 | 1,157,879 | ||||||
2.45%, 03/16/2020 (Acquired 03/10/2015, Cost $1,997,917) (1) | 2,000,000 | 2,008,974 | ||||||
5.80%, 09/25/2023 (Acquired 01/14/2014 through 05/01/2017, Cost $5,864,219) (1) | 5,583,000 | 6,303,436 | ||||||
ING Groep NV | ||||||||
3.15%, 03/29/2022 | 4,000,000 | 4,075,740 | ||||||
Intercontinental Exchange, Inc. | ||||||||
2.50%, 10/15/2018 | 243,000 | 245,274 | ||||||
4.00%, 10/15/2023 | 578,000 | 619,671 | ||||||
International Lease Finance Corp. | ||||||||
8.63%, 01/15/2022 | 1,200,000 | 1,477,503 | ||||||
5.88%, 08/15/2022 | 438,000 | 494,429 | ||||||
Invesco Finance Plc | ||||||||
4.00%, 01/30/2024 | 2,889,000 | 3,064,683 | ||||||
3.75%, 01/15/2026 | 4,249,000 | 4,405,797 | ||||||
Jackson National Life Global Funding | ||||||||
4.70%, 06/01/2018 (Acquired 10/28/2013, Cost $314,364) (1) | 310,000 | 318,064 | ||||||
1.88%, 10/15/2018 (Acquired 10/07/2015, Cost $224,949) (1) | 225,000 | 225,409 | ||||||
2.50%, 06/27/2022 (Acquired 06/20/2017, Cost $797,581) (1) | 800,000 | 794,220 | ||||||
3.25%, 01/30/2024 (Acquired 01/24/2017, Cost $459,674) (1) | 460,000 | 465,979 | ||||||
3.05%, 04/29/2026 (Acquired 04/25/2016, Cost $471,220) (1) | 473,000 | 464,310 | ||||||
Jefferies Group LLC | ||||||||
5.13%, 04/13/2018 | 1,534,000 | 1,573,459 | ||||||
6.88%, 04/15/2021 | 1,385,000 | 1,576,292 | ||||||
5.13%, 01/20/2023 | 2,600,000 | 2,830,945 | ||||||
4.85%, 01/15/2027 | 116,000 | 121,177 | ||||||
6.45%, 06/08/2027 | 578,000 | 662,284 | ||||||
6.25%, 01/15/2036 | 155,000 | 169,128 | ||||||
| Principal Amount | Value | |||||||
John Hancock Life Insurance Co. | ||||||||
7.38%, 02/15/2024 (Acquired 10/28/2013, Cost $845,568) (1) | 731,000 | 871,976 | ||||||
JPMorgan Chase & Corp. | ||||||||
2.25%, 01/23/2020 | 2,000,000 | 2,006,072 | ||||||
4.25%, 10/15/2020 | 64,000 | 67,955 | ||||||
2.30%, 08/15/2021 | 3,600,000 | 3,578,706 | ||||||
4.35%, 08/15/2021 | 10,000,000 | 10,702,530 | ||||||
3.38%, 05/01/2023 | 3,800,000 | 3,855,571 | ||||||
3.13%, 01/23/2025 | 4,000,000 | 3,976,944 | ||||||
3.30%, 04/01/2026 | 1,870,000 | 1,857,099 | ||||||
3.20%, 06/15/2026 | 11,090,000 | 10,960,968 | ||||||
2.95%, 10/01/2026 | 5,000,000 | 4,826,015 | ||||||
3.63%, 12/01/2027 | 7,779,000 | 7,700,237 | ||||||
5.60%, 07/15/2041 | 494,000 | 613,399 | ||||||
4.95%, 06/01/2045 | 6,575,000 | 7,345,038 | ||||||
4.26%, 02/22/2048 | 3,014,000 | 3,167,850 | ||||||
KeyBank NA/Cleveland OH | ||||||||
3.18%, 05/22/2022 | 567,000 | 577,328 | ||||||
2.40%, 06/09/2022 | 750,000 | 746,184 | ||||||
KeyCorp. | ||||||||
2.90%, 09/15/2020 | 280,000 | 284,820 | ||||||
5.10%, 03/24/2021 | 211,000 | 230,843 | ||||||
Kimco Realty Corp. | ||||||||
3.80%, 04/01/2027 | 1,100,000 | 1,100,320 | ||||||
LeasePlan Co. NV | ||||||||
2.50%, 05/16/2018 (Acquired 10/28/2013 through 10/20/2014, Cost $9,211,166) (1) | 9,206,000 | 9,230,718 | ||||||
2.88%, 01/22/2019 (Acquired 10/14/2015, Cost $724,770) (1) | 725,000 | 727,321 | ||||||
Legg Mason, Inc. | ||||||||
3.95%, 07/15/2024 | 820,000 | 831,992 | ||||||
Liberty Mutual Group, Inc. | ||||||||
5.00%, 06/01/2021 (Acquired 03/14/2017, Cost $1,823,161) (1) | 1,700,000 | 1,847,431 | ||||||
4.95%, 05/01/2022 (Acquired 10/26/2016, Cost $389,065) (1) | 351,000 | 384,922 | ||||||
4.25%, 06/15/2023 (Acquired 10/28/2013, Cost $319,909) (1) | 322,000 | 342,526 | ||||||
6.50%, 03/15/2035 (Acquired 11/19/2013 through 04/28/2016, Cost $4,986,970) (1) | 4,500,000 | 5,632,038 | ||||||
6.50%, 05/01/2042 (Acquired 03/17/2017, Cost $2,462,753) (1) | 2,000,000 | 2,592,526 | ||||||
4.85%, 08/01/2044 (Acquired 12/13/2016 through 03/23/2017, Cost $2,723,354) (1) | 2,745,000 | 2,949,151 | ||||||
10.75%, 06/15/2058 (Acquired 10/28/2013, Cost $399,255) (1) | 269,000 | 426,365 | ||||||
Liberty Mutual Insurance Co. | ||||||||
8.50%, 05/15/2025 (Acquired 07/01/2014, Cost $864,098) (1) | 700,000 | 902,274 | ||||||
7.70%, 10/15/2097 (Acquired 10/28/2013, Cost $106,312) (1) | 100,000 | 141,218 | ||||||
Liberty Property LP | ||||||||
3.25%, 10/01/2026 | 303,000 | 293,525 | ||||||
Lincoln National Co. | ||||||||
8.75%, 07/01/2019 | 1,534,000 | 1,724,727 | ||||||
4.20%, 03/15/2022 | 873,000 | 928,933 | ||||||
7.00%, 06/15/2040 | 1,715,000 | 2,305,833 | ||||||
3.20%, 04/20/2067 | 121,000 | 110,715 | ||||||
Lloyds Bank Plc | ||||||||
1.75%, 05/14/2018 | 3,200,000 | 3,204,454 | ||||||
5.80%, 01/13/2020 (Acquired 10/28/2013, Cost $183,253) (1) | 172,000 | 187,108 | ||||||
Lloyds Banking Group Plc | ||||||||
3.00%, 01/11/2022 | 950,000 | 959,280 | ||||||
4.58%, 12/10/2025 | 550,000 | 570,280 | ||||||
3.75%, 01/11/2027 | 3,337,000 | 3,357,733 | ||||||
Mack-Cali Realty LP | ||||||||
2.50%, 12/15/2017 | 5,050,000 | 5,057,595 | ||||||
Macquarie Bank Ltd. | ||||||||
1.60%, 10/27/2017 (Acquired 10/22/2014 through 03/18/2016, Cost $2,827,202) (1) | 2,829,000 | 2,829,263 | ||||||
2.60%, 06/24/2019 (Acquired 06/16/2014 through 03/16/2016, Cost $1,093,425) (1) | 1,093,000 | 1,102,286 | ||||||
2.40%, 01/21/2020 (Acquired 01/14/2015, Cost $1,598,148) (1) | 1,600,000 | 1,602,631 | ||||||
2.85%, 07/29/2020 (Acquired 07/23/2015, Cost $399,648) (1) | 400,000 | 406,196 | ||||||
4.00%, 07/29/2025 (Acquired 07/23/2015, Cost $499,385) (1) | 500,000 | 523,089 | ||||||
Macquarie Group Ltd. | ||||||||
3.00%, 12/03/2018 (Acquired 11/25/2013, Cost $5,990,990) (1) | 6,000,000 | 6,074,784 | ||||||
6.00%, 01/14/2020 (Acquired 10/28/2013, Cost $496,384) (1) | 475,000 | 515,978 | ||||||
6.25%, 01/14/2021 (Acquired 10/28/2013 through 09/19/2014, Cost $1,175,500) (1) | 1,111,000 | 1,235,630 | ||||||
Manufacturers & Traders Trust Co. | ||||||||
6.63%, 12/04/2017 | 464,000 | 473,446 | ||||||
Manulife Financial Co. | ||||||||
4.90%, 09/17/2020 | 225,000 | 241,890 | ||||||
| Principal Amount | Value | |||||||
Manulife Financial Corp. | ||||||||
4.06%, 02/24/2032 | 1,560,000 | 1,574,074 | ||||||
Markel Co. | ||||||||
7.13%, 09/30/2019 | 3,780,000 | 4,178,027 | ||||||
5.00%, 04/05/2046 | 1,265,000 | 1,385,729 | ||||||
Marsh & McLennan Cos, Inc. | ||||||||
2.35%, 03/06/2020 | 3,769,000 | 3,788,056 | ||||||
4.80%, 07/15/2021 | 5,000,000 | 5,435,360 | ||||||
2.75%, 01/30/2022 | 24,000 | 24,232 | ||||||
3.50%, 03/10/2025 | 580,000 | 595,336 | ||||||
Massachusetts Mutual Life Insurance Co. | ||||||||
7.63%, 11/15/2023 (Acquired 10/30/2014, Cost $663,531) (1) | 550,000 | 670,045 | ||||||
8.88%, 06/01/2039 (Acquired 11/20/2013 through 04/26/2016, Cost $2,500,320) (1) | 1,760,000 | 2,886,924 | ||||||
5.38%, 12/01/2041 (Acquired 10/28/2013, Cost $212,550) (1) | 203,000 | 240,872 | ||||||
4.90%, 04/01/2077 (Acquired 03/20/2017, Cost $4,955,055) (1) | 5,000,000 | 5,355,060 | ||||||
MassMutual Global Funding II | ||||||||
2.50%, 10/17/2022 (Acquired 10/28/2013, Cost $368,243) (1) | 386,000 | 384,575 | ||||||
2.75%, 06/22/2024 (Acquired 06/19/2017, Cost $699,777) (1) | 700,000 | 694,641 | ||||||
MBIA Insurance Co. | ||||||||
12.42%, 01/15/2033 (Acquired 10/28/2013, Cost $63,107) (1) | 86,000 | 41,280 | ||||||
MetLife, Inc. | ||||||||
7.72%, 02/15/2019 | 202,000 | 220,647 | ||||||
4.37%, 09/15/2023 | 2,535,000 | 2,774,846 | ||||||
6.50%, 12/15/2032 | 56,000 | 72,799 | ||||||
4.88%, 11/13/2043 | 3,000,000 | 3,395,736 | ||||||
Metropolitan Life Global Funding I | ||||||||
1.50%, 01/10/2018 (Acquired 10/28/2013 through 11/05/2014, Cost $1,390,377) (1) | 1,392,000 | 1,391,651 | ||||||
2.30%, 04/10/2019 (Acquired 03/10/2016 through 11/17/2016, Cost $1,610,091) (1) | 1,598,000 | 1,611,436 | ||||||
3.88%, 04/11/2022 (Acquired 10/28/2013, Cost $1,506,686) (1) | 1,480,000 | 1,566,450 | ||||||
3.00%, 01/10/2023 (Acquired 07/14/2015, Cost $400,557) (1) | 407,000 | 413,765 | ||||||
3.45%, 12/18/2026 (Acquired 12/12/2016 through 03/15/2017, Cost $9,884,212) (1) | 9,893,000 | 10,141,235 | ||||||
Mitsubishi UFJ Financial Group, Inc. | ||||||||
2.95%, 03/01/2021 | 330,000 | 335,323 | ||||||
3.00%, 02/22/2022 | 206,000 | 209,037 | ||||||
2.53%, 09/13/2023 | 481,000 | 471,123 | ||||||
Mizuho Bank Ltd. | ||||||||
1.85%, 03/21/2018 (Acquired 10/28/2013, Cost $375,096) (1) | 376,000 | 376,508 | ||||||
1.80%, 03/26/2018 (Acquired 03/19/2015, Cost $604,801) (1) | 605,000 | 605,397 | ||||||
2.65%, 09/25/2019 (Acquired 09/18/2014, Cost $2,997,517) (1) | 3,000,000 | 3,022,104 | ||||||
2.40%, 03/26/2020 (Acquired 03/19/2015, Cost $4,996,459) (1) | 5,000,000 | 5,004,195 | ||||||
3.60%, 09/25/2024 (Acquired 09/18/2014, Cost $1,248,178) (1) | 1,250,000 | 1,294,415 | ||||||
Mizuho Financial Group, Inc. | ||||||||
2.95%, 02/28/2022 | 2,000,000 | 2,017,002 | ||||||
Morgan Stanley | ||||||||
6.63%, 04/01/2018 | 1,104,000 | 1,143,211 | ||||||
7.30%, 05/13/2019 | 2,257,000 | 2,467,589 | ||||||
2.38%, 07/23/2019 | 450,000 | 453,136 | ||||||
5.63%, 09/23/2019 | 2,302,000 | 2,473,181 | ||||||
2.65%, 01/27/2020 | 750,000 | 757,858 | ||||||
2.80%, 06/16/2020 | 1,282,000 | 1,301,066 | ||||||
5.50%, 07/24/2020 | 360,000 | 393,022 | ||||||
5.75%, 01/25/2021 | 12,049,000 | 13,330,339 | ||||||
2.50%, 04/21/2021 | 2,000,000 | 1,998,278 | ||||||
5.50%, 07/28/2021 | 2,692,000 | 2,984,763 | ||||||
2.63%, 11/17/2021 | 13,321,000 | 13,299,993 | ||||||
2.75%, 05/19/2022 | 5,910,000 | 5,908,050 | ||||||
3.75%, 02/25/2023 | 600,000 | 623,877 | ||||||
4.10%, 05/22/2023 | 3,460,000 | 3,611,627 | ||||||
3.88%, 04/29/2024 | 2,050,000 | 2,131,073 | ||||||
3.70%, 10/23/2024 | 1,167,000 | 1,197,745 | ||||||
4.00%, 07/23/2025 | 1,981,000 | 2,067,827 | ||||||
5.00%, 11/24/2025 | 4,959,000 | 5,393,200 | ||||||
3.13%, 07/27/2026 | 4,269,000 | 4,150,954 | ||||||
4.35%, 09/08/2026 | 930,000 | 966,960 | ||||||
3.63%, 01/20/2027 | 7,500,000 | 7,547,865 | ||||||
3.95%, 04/23/2027 | 14,190,000 | 14,280,717 | ||||||
6.38%, 07/24/2042 | 2,000,000 | 2,661,920 | ||||||
4.30%, 01/27/2045 | 459,000 | 475,342 | ||||||
MUFG Americas Holdings Co. | ||||||||
2.25%, 02/10/2020 | 360,000 | 360,202 | ||||||
| Principal Amount | Value | |||||||
National Australia Bank Ltd./New York | ||||||||
2.50%, 05/22/2022 | 12,764,000 | 12,690,084 | ||||||
3.38%, 01/14/2026 | 407,000 | 411,414 | ||||||
National Retail Properties, Inc. | ||||||||
3.60%, 12/15/2026 | 700,000 | 694,373 | ||||||
National Rural Utilities Cooperative Finance Corp. | ||||||||
10.38%, 11/01/2018 | 222,000 | 246,897 | ||||||
2.95%, 02/07/2024 | 341,000 | 344,138 | ||||||
3.05%, 04/25/2027 | 462,000 | 460,906 | ||||||
8.00%, 03/01/2032 | 791,000 | 1,159,180 | ||||||
Nationwide Building Society | ||||||||
2.45%, 07/27/2021 (Acquired 07/20/2016, Cost $252,629) (1) | 253,000 | 252,807 | ||||||
4.00%, 09/14/2026 (Acquired 09/07/2016 through 02/01/2017, Cost $937,065) (1) | 951,000 | 940,760 | ||||||
Nationwide Financial Services, Inc. | ||||||||
5.38%, 03/25/2021 (Acquired 02/05/2015, Cost $2,182,451) (1) | 2,000,000 | 2,193,254 | ||||||
Nationwide Mutual Insurance Co. | ||||||||
8.25%, 12/01/2031 (Acquired 02/13/2014, Cost $375,011) (1) | 300,000 | 429,229 | ||||||
9.38%, 08/15/2039 (Acquired 10/28/2013 through 10/06/2015, Cost $9,484,646) (1) | 6,433,000 | 10,753,544 | ||||||
New York Life Global Funding | ||||||||
2.10%, 01/02/2019 (Acquired 12/05/2013, Cost $8,146,389) (1) | 8,150,000 | 8,189,617 | ||||||
2.15%, 06/18/2019 (Acquired 06/11/2014 through 06/10/2015, Cost $1,911,988) (1) | 1,912,000 | 1,923,120 | ||||||
Nomura Holdings, Inc. | ||||||||
6.70%, 03/04/2020 | 5,300,000 | 5,870,386 | ||||||
Nordea Bank AB | ||||||||
1.63%, 05/15/2018 (Acquired 10/28/2013, Cost $257,171) (1) | 258,000 | 258,061 | ||||||
1.88%, 09/17/2018 (Acquired 09/09/2015, Cost $4,829,477) (1) | 4,835,000 | 4,842,335 | ||||||
1.63%, 09/30/2019 (Acquired 09/22/2016, Cost $549,047) (1) | 550,000 | 545,551 | ||||||
2.50%, 09/17/2020 (Acquired 09/09/2015, Cost $449,297) (1) | 450,000 | 454,256 | ||||||
4.25%, 09/21/2022 (Acquired 12/03/2015 through 03/13/2017, Cost $8,081,337) (1) | 7,865,000 | 8,339,613 | ||||||
Northern Trust Corp. | ||||||||
3.38%, 05/08/2032 | 411,000 | 410,868 | ||||||
Ontario Teachers’ Cadillac Fairview Properties Trust | ||||||||
3.13%, 03/20/2022 (Acquired 03/13/2017, Cost $1,002,782) (1) | 1,003,000 | 1,017,243 | ||||||
3.88%, 03/20/2027 (Acquired 03/13/2017, Cost $1,040,981) (1) | 1,044,000 | 1,070,073 | ||||||
Pacific Life Insurance Co. | ||||||||
9.25%, 06/15/2039 (Acquired 10/28/2013 through 10/12/2016, Cost $1,260,924) (1) | 876,000 | 1,429,411 | ||||||
People’s United Bank NA | ||||||||
4.00%, 07/15/2024 | 1,220,000 | 1,230,891 | ||||||
PNC Bank NA | ||||||||
2.95%, 01/30/2023 | 6,500,000 | 6,566,242 | ||||||
4.20%, 11/01/2025 | 322,000 | 346,027 | ||||||
PNC Financial Services Group, Inc./The | ||||||||
6.70%, 06/10/2019 | 212,000 | 230,510 | ||||||
5.13%, 02/08/2020 | 588,000 | 632,476 | ||||||
4.38%, 08/11/2020 | 679,000 | 722,654 | ||||||
2.85%, 11/09/2022 | 575,000 | 579,284 | ||||||
3.90%, 04/29/2024 | 2,090,000 | 2,182,932 | ||||||
Pricoa Global Funding I | ||||||||
1.90%, 09/21/2018 (Acquired 09/14/2015, Cost $1,514,724) (1) | 1,515,000 | 1,517,557 | ||||||
Principal Financial Group, Inc. | ||||||||
3.13%, 05/15/2023 | 380,000 | 382,977 | ||||||
3.40%, 05/15/2025 | 7,000,000 | 7,144,809 | ||||||
Principal Life Global Funding II | ||||||||
3.00%, 04/18/2026 (Acquired 04/11/2016, Cost $1,995,239) (1) | 2,000,000 | 1,971,390 | ||||||
Private Export Funding Co. | ||||||||
1.88%, 07/15/2018 | 975,000 | 979,455 | ||||||
4.38%, 03/15/2019 | 970,000 | 1,016,203 | ||||||
2.80%, 05/15/2022 | 1,200,000 | 1,238,368 | ||||||
3.55%, 01/15/2024 | 2,489,000 | 2,662,214 | ||||||
3.25%, 06/15/2025 | 2,730,000 | 2,843,579 | ||||||
Progressive Corp./The | ||||||||
2.45%, 01/15/2027 | 880,000 | 834,576 | ||||||
4.13%, 04/15/2047 | 8,050,000 | 8,374,568 | ||||||
Prologis LP | ||||||||
4.25%, 08/15/2023 | 295,000 | 318,418 | ||||||
3.75%, 11/01/2025 | 177,000 | 184,285 | ||||||
Protective Life Co. | ||||||||
7.38%, 10/15/2019 | 854,000 | 950,908 | ||||||
Protective Life Global Funding | ||||||||
2.70%, 11/25/2020 (Acquired 11/19/2015, Cost $4,996,945) (1) | 5,000,000 | 5,036,730 | ||||||
| Principal Amount | Value | |||||||
2.00%, 09/14/2021 (Acquired 09/07/2016, Cost $1,100,000) (1) | 1,100,000 | 1,070,578 | ||||||
Prudential Financial, Inc. | ||||||||
2.35%, 08/15/2019 | 650,000 | 653,908 | ||||||
6.63%, 06/21/2040 | 5,995,000 | 8,121,906 | ||||||
Prudential Insurance Co. of America/The | ||||||||
8.30%, 07/01/2025 (Acquired 10/28/2013 through 08/06/2015, Cost $2,100,348) (1) | 1,691,000 | 2,234,327 | ||||||
Realty Income Corp. | ||||||||
3.00%, 01/15/2027 | 427,000 | 404,457 | ||||||
Regions Bank/Birmingham AL | ||||||||
7.50%, 05/15/2018 | 2,787,000 | 2,917,683 | ||||||
2.25%, 09/14/2018 | 1,400,000 | 1,405,716 | ||||||
Regions Financial Co. | ||||||||
3.20%, 02/08/2021 | 5,643,000 | 5,768,980 | ||||||
Reliance Standard Life Global Funding II | ||||||||
2.15%, 10/15/2018 (Acquired 10/13/2015, Cost $3,998,731) (1) | 4,000,000 | 4,008,704 | ||||||
2.50%, 04/24/2019 (Acquired 03/28/2017, Cost $2,717,240) (1) | 2,700,000 | 2,718,068 | ||||||
2.50%, 01/15/2020 (Acquired 09/27/2016, Cost $404,658) (1) | 400,000 | 400,632 | ||||||
2.38%, 05/04/2020 (Acquired 04/27/2015, Cost $5,989,363) (1) | 6,000,000 | 5,976,780 | ||||||
3.05%, 01/20/2021 (Acquired 01/12/2016, Cost $527,560) (1) | 528,000 | 533,892 | ||||||
Royal Bank of Canada | ||||||||
1.20%, 09/19/2017 | 727,000 | 726,709 | ||||||
2.20%, 07/27/2018 | 78,000 | 78,489 | ||||||
2.00%, 10/01/2018 | 779,000 | 782,120 | ||||||
1.88%, 02/05/2020 | 1,100,000 | 1,094,067 | ||||||
2.13%, 03/02/2020 | 6,509,000 | 6,519,772 | ||||||
4.65%, 01/27/2026 | 531,000 | 569,174 | ||||||
Santander Bank NA | ||||||||
8.75%, 05/30/2018 | 4,878,000 | 5,170,626 | ||||||
Santander Holdings USA, Inc. | ||||||||
2.70%, 05/24/2019 | 2,000,000 | 2,014,840 | ||||||
Santander Issuances SAU | ||||||||
5.18%, 11/19/2025 | 3,310,000 | 3,548,237 | ||||||
Santander UK Group Holdings Plc | ||||||||
3.13%, 01/08/2021 | 308,000 | 312,674 | ||||||
Santander UK Plc | ||||||||
2.38%, 03/16/2020 | 7,325,000 | 7,367,514 | ||||||
5.00%, 11/07/2023 (Acquired 01/21/2015 through 03/23/2017, Cost $4,352,856) (1) | 4,150,000 | 4,448,875 | ||||||
Scentre Group Trust 1 / Scentre Group Trust 2 | ||||||||
3.50%, 02/12/2025 (Acquired 08/30/2016 through 03/16/2017, Cost $1,407,976) (1) | 1,390,000 | 1,395,253 | ||||||
Simon Property Group LP | ||||||||
4.38%, 03/01/2021 | 6,932,000 | 7,381,748 | ||||||
4.13%, 12/01/2021 | 442,000 | 469,848 | ||||||
3.75%, 02/01/2024 | 910,000 | 947,497 | ||||||
Skandinaviska Enskilda Banken AB | ||||||||
1.75%, 03/19/2018 (Acquired 10/28/2013, Cost $298,403) (1) | 299,000 | 299,108 | ||||||
2.38%, 11/20/2018 (Acquired 11/13/2013 through 11/07/2014, Cost $5,199,270) (1) | 5,200,000 | 5,240,867 | ||||||
2.38%, 03/25/2019 (Acquired 03/18/2014, Cost $1,224,622) (1) | 1,225,000 | 1,232,504 | ||||||
2.45%, 05/27/2020 (Acquired 05/19/2015, Cost $2,997,247) (1) | 3,000,000 | 3,023,964 | ||||||
Societe Generale SA | ||||||||
2.38%, 10/01/2018 | 1,000,000 | 1,006,709 | ||||||
3.25%, 01/12/2022 (Acquired 01/05/2017, Cost $6,983,897) (1) | 7,000,000 | 7,155,568 | ||||||
4.25%, 04/14/2025 (Acquired 06/16/2017, Cost $812,111) (1) | 800,000 | 811,291 | ||||||
SouthTrust Bank | ||||||||
7.69%, 05/15/2025 | 253,000 | 315,109 | ||||||
SpareBank 1 Boligkreditt AS | ||||||||
1.75%, 11/15/2019 (Acquired 10/28/2013, Cost $529,216) (1) | 537,000 | 533,683 | ||||||
Springleaf Finance Co. | ||||||||
6.90%, 12/15/2017 | 100,000 | 101,500 | ||||||
Stadshypotek AB | ||||||||
1.88%, 10/02/2019 (Acquired 10/28/2013, Cost $678,023) (1) | 683,000 | 682,052 | ||||||
Standard Chartered Plc | ||||||||
1.70%, 04/17/2018 (Acquired 04/13/2015, Cost $749,775) (1) | 750,000 | 748,725 | ||||||
2.10%, 08/19/2019 (Acquired 10/06/2016, Cost $2,498,723) (1) | 2,500,000 | 2,490,915 | ||||||
2.40%, 09/08/2019 (Acquired 09/03/2014, Cost $7,643,699) (1) | 7,650,000 | 7,657,520 | ||||||
3.05%, 01/15/2021 (Acquired 01/12/2016, Cost $798,831) (1) | 800,000 | 809,857 | ||||||
5.20%, 01/26/2024 (Acquired 10/28/2013, Cost $625,270) (1) | 609,000 | 649,986 | ||||||
State Street Co. | ||||||||
3.10%, 05/15/2023 | 321,000 | 326,658 | ||||||
3.70%, 11/20/2023 | 1,385,000 | 1,465,310 | ||||||
3.55%, 08/18/2025 | 247,000 | 257,226 | ||||||
| Principal Amount | Value | |||||||
Stifel Financial Co. | ||||||||
3.50%, 12/01/2020 | 5,000,000 | 5,101,915 | ||||||
Sumitomo Mitsui Banking Co. | ||||||||
2.45%, 01/10/2019 | 5,000,000 | 5,043,300 | ||||||
2.45%, 01/16/2020 | 2,725,000 | 2,741,671 | ||||||
3.95%, 07/19/2023 | 250,000 | 265,176 | ||||||
Sumitomo Mitsui Financial Group, Inc. | ||||||||
2.06%, 07/14/2021 | 568,000 | 558,770 | ||||||
2.44%, 10/19/2021 | 531,000 | 528,719 | ||||||
2.85%, 01/11/2022 | 1,100,000 | 1,112,034 | ||||||
2.63%, 07/14/2026 | 644,000 | 612,199 | ||||||
3.01%, 10/19/2026 | 297,000 | 290,642 | ||||||
Sumitomo Mitsui Trust Bank Ltd. | ||||||||
2.05%, 10/18/2019 (Acquired 10/12/2016, Cost $1,549,343) (1) | 1,550,000 | 1,545,629 | ||||||
SunTrust Bank/Atlanta GA | ||||||||
7.25%, 03/15/2018 | 1,608,000 | 1,668,324 | ||||||
SunTrust Banks, Inc. | ||||||||
6.00%, 09/11/2017 | 103,000 | 103,804 | ||||||
2.50%, 05/01/2019 | 8,810,000 | 8,892,946 | ||||||
2.90%, 03/03/2021 | 324,000 | 328,911 | ||||||
2.70%, 01/27/2022 | 9,210,000 | 9,228,254 | ||||||
Svenska Handelsbanken AB | ||||||||
2.50%, 01/25/2019 | 2,000,000 | 2,020,940 | ||||||
2.40%, 10/01/2020 | 2,000,000 | 2,012,922 | ||||||
Swedbank AB | ||||||||
2.38%, 02/27/2019 (Acquired 02/20/2014, Cost $5,995,873) (1) | 6,000,000 | 6,044,916 | ||||||
Synchrony Financial | ||||||||
1.88%, 08/15/2017 | 2,620,000 | 2,620,582 | ||||||
2.60%, 01/15/2019 | 1,350,000 | 1,357,248 | ||||||
3.00%, 08/15/2019 | 4,775,000 | 4,842,519 | ||||||
3.75%, 08/15/2021 | 6,000,000 | 6,162,180 | ||||||
4.25%, 08/15/2024 | 2,000,000 | 2,042,974 | ||||||
4.50%, 07/23/2025 | 2,000,000 | 2,056,878 | ||||||
3.70%, 08/04/2026 | 1,865,000 | 1,799,997 | ||||||
TD Ameritrade Holding Co. | ||||||||
5.60%, 12/01/2019 | 355,000 | 383,726 | ||||||
2.95%, 04/01/2022 | 725,000 | 741,809 | ||||||
Teachers Insurance & Annuity Association of America | ||||||||
6.85%, 12/16/2039 (Acquired 11/22/2013, Cost $267,863) (1) | 218,000 | 298,852 | ||||||
4.90%, 09/15/2044 (Acquired 09/07/2016, Cost $228,432) (1) | 200,000 | 224,166 | ||||||
4.27%, 05/15/2047 (Acquired 05/03/2017, Cost $3,349,283) (1) | 3,360,000 | 3,444,770 | ||||||
The Goldman Sachs Group, Inc. | ||||||||
2.91%, 06/05/2023 | 1,000,000 | 996,034 | ||||||
3.69%, 06/05/2028 | 3,488,000 | 3,502,231 | ||||||
The Travelers Company, Inc. | ||||||||
4.00%, 05/30/2047 | 2,610,000 | 2,668,827 | ||||||
TIAA Asset Management Finance Co. LLC | ||||||||
2.95%, 11/01/2019 (Acquired 03/10/2015, Cost $3,735,427) (1) | 3,700,000 | 3,753,054 | ||||||
Toronto-Dominion Bank/The | ||||||||
1.75%, 07/23/2018 | 556,000 | 556,921 | ||||||
2.25%, 11/05/2019 | 432,000 | 435,224 | ||||||
2.50%, 12/14/2020 | 500,000 | 505,724 | ||||||
3.63%, 09/15/2031 | 667,000 | 661,784 | ||||||
Travelers Cos, Inc./The | ||||||||
5.80%, 05/15/2018 | 110,000 | 113,970 | ||||||
Trinity Acquisition Plc | ||||||||
4.40%, 03/15/2026 | 2,300,000 | 2,401,922 | ||||||
UBS AG/Stamford CT | ||||||||
5.75%, 04/25/2018 | 322,000 | 332,269 | ||||||
2.05%, 06/01/2020 | 8,200,000 | 8,263,501 | ||||||
UBS Group Funding Jersey Ltd. | ||||||||
2.95%, 09/24/2020 (Acquired 09/21/2015, Cost $1,248,583) (1) | 1,250,000 | 1,276,852 | ||||||
4.13%, 09/24/2025 (Acquired 06/14/2016, Cost $205,269) (1) | 200,000 | 209,666 | ||||||
4.13%, 04/15/2026 (Acquired 03/29/2016, Cost $600,813) (1) | 602,000 | 627,881 | ||||||
UBS Group Funding Switzerland AG | ||||||||
3.49%, 05/23/2023 (Acquired 04/07/2017, Cost $363,326) (1) | 360,000 | 368,276 | ||||||
4.25%, 03/23/2028 (Acquired 03/16/2017, Cost $7,715,000) (1) | 7,715,000 | 8,060,948 | ||||||
UDR, Inc. | ||||||||
2.95%, 09/01/2026 | 276,000 | 260,811 | ||||||
Ventas Realty LP | ||||||||
| Principal Amount | Value | |||||||
3.10%, 01/15/2023 | 13,500,000 | 13,543,348 | ||||||
3.75%, 05/01/2024 | 382,000 | 388,574 | ||||||
3.50%, 02/01/2025 | 251,000 | 249,395 | ||||||
4.13%, 01/15/2026 | 449,000 | 461,815 | ||||||
3.85%, 04/01/2027 | 677,000 | 680,602 | ||||||
VEREIT Operating Partnership LP | ||||||||
4.60%, 02/06/2024 | 1,550,000 | 1,618,882 | ||||||
Voya Financial, Inc. | ||||||||
5.50%, 07/15/2022 | 8,000,000 | 8,883,440 | ||||||
3.13%, 07/15/2024 | 1,600,000 | 1,575,726 | ||||||
3.65%, 06/15/2026 | 200,000 | 200,400 | ||||||
Wachovia Corp. | ||||||||
5.75%, 02/01/2018 | 1,865,000 | 1,908,708 | ||||||
WEA Finance LLC / Westfield UK & Europe Finance Plc | ||||||||
3.25%, 10/05/2020 (Acquired 09/28/2015, Cost $5,986,195) (1) | 6,000,000 | 6,105,486 | ||||||
Wells Fargo & Co. | ||||||||
5.63%, 12/11/2017 | 948,000 | 964,502 | ||||||
2.15%, 01/30/2020 | 1,583,000 | 1,588,765 | ||||||
2.60%, 07/22/2020 | 478,000 | 484,700 | ||||||
4.60%, 04/01/2021 | 1,377,000 | 1,484,210 | ||||||
3.50%, 03/08/2022 | 1,929,000 | 2,003,745 | ||||||
3.07%, 01/24/2023 | 800,000 | 810,631 | ||||||
3.30%, 09/09/2024 | 1,900,000 | 1,927,364 | ||||||
3.00%, 02/19/2025 | 4,075,000 | 4,012,111 | ||||||
3.55%, 09/29/2025 | 700,000 | 711,755 | ||||||
3.00%, 04/22/2026 | 5,000,000 | 4,883,765 | ||||||
4.10%, 06/03/2026 | 3,749,000 | 3,877,827 | ||||||
4.30%, 07/22/2027 | 729,000 | 764,459 | ||||||
5.61%, 01/15/2044 | 317,000 | 377,462 | ||||||
4.65%, 11/04/2044 | 675,000 | 709,935 | ||||||
4.90%, 11/17/2045 | 3,231,000 | 3,527,935 | ||||||
4.75%, 12/07/2046 | 2,153,000 | 2,301,994 | ||||||
Wells Fargo Bank NA | ||||||||
6.00%, 11/15/2017 | 1,568,000 | 1,592,826 | ||||||
Welltower, Inc. | ||||||||
3.75%, 03/15/2023 | 560,000 | 581,002 | ||||||
4.50%, 01/15/2024 | 461,000 | 492,021 | ||||||
4.00%, 06/01/2025 | 872,000 | 901,692 | ||||||
Westpac Banking Co. | ||||||||
1.60%, 01/12/2018 | 846,000 | 846,474 | ||||||
1.91%, 07/30/2018 | 3,060,000 | 3,079,214 | ||||||
4.88%, 11/19/2019 | 1,105,000 | 1,176,763 | ||||||
2.00%, 03/03/2020 (Acquired 02/24/2015, Cost $1,347,885) (1) | 1,349,000 | 1,346,369 | ||||||
3.35%, 03/08/2027 | 1,500,000 | 1,508,925 | ||||||
Willis North America, Inc. | ||||||||
7.00%, 09/29/2019 | 537,000 | 590,362 | ||||||
WR Berkley Co. | ||||||||
4.75%, 08/01/2044 | 3,445,000 | 3,529,103 | ||||||
XLIT Ltd. | ||||||||
2.30%, 12/15/2018 | 4,375,000 | 4,394,377 | ||||||
5.25%, 12/15/2043 | 2,700,000 | 3,064,408 | ||||||
|
| |||||||
| 1,596,438,644 | ||||||||
|
| |||||||
Industrials - 1.77% | ||||||||
ABB Finance USA, Inc. | ||||||||
2.88%, 05/08/2022 | 241,000 | 246,451 | ||||||
4.38%, 05/08/2042 | 107,000 | 116,632 | ||||||
Acuity Brands Lighting, Inc. | ||||||||
6.00%, 12/15/2019 | 451,000 | 488,567 | ||||||
Airbus Group Finance BV | ||||||||
2.70%, 04/17/2023 (Acquired 10/28/2013, Cost $361,125) (1) | 376,000 | 378,045 | ||||||
Airbus SE | ||||||||
3.15%, 04/10/2027 (Acquired 04/05/2017, Cost $735,321) (1) | 736,000 | 742,296 | ||||||
3.95%, 04/10/2047 (Acquired 04/05/2017, Cost $148,161) (1) | 150,000 | 154,241 | ||||||
Amphenol Corp. | ||||||||
3.20%, 04/01/2024 | 8,135,000 | 8,215,805 | ||||||
Arrow Electronics, Inc. | ||||||||
3.50%, 04/01/2022 | 965,000 | 985,723 | ||||||
3.88%, 01/12/2028 | 221,000 | 220,013 | ||||||
BAE Systems Holdings, Inc. | ||||||||
6.38%, 06/01/2019 (Acquired 10/28/2013, Cost $257,040) (1) | 243,000 | 261,707 | ||||||
| Principal Amount | Value | |||||||
3.80%, 10/07/2024 (Acquired 09/30/2014 through 08/28/2015, Cost $772,499) (1) | 770,000 | 803,225 | ||||||
3.85%, 12/15/2025 (Acquired 12/03/2015, Cost $494,874) (1) | 500,000 | 520,282 | ||||||
BAE Systems Plc | ||||||||
5.80%, 10/11/2041 (Acquired 10/28/2013, Cost $578,211) (1) | 550,000 | 671,327 | ||||||
Boeing Co./The | ||||||||
4.88%, 02/15/2020 | 52,000 | 55,971 | ||||||
7.95%, 08/15/2024 | 124,000 | 163,383 | ||||||
Burlington Northern Santa Fe LLC | ||||||||
5.75%, 03/15/2018 | 173,000 | 178,232 | ||||||
3.60%, 09/01/2020 | 146,000 | 152,578 | ||||||
3.45%, 09/15/2021 | 215,000 | 224,109 | ||||||
3.05%, 03/15/2022 | 440,000 | 454,365 | ||||||
3.00%, 03/15/2023 | 206,000 | 211,222 | ||||||
6.70%, 08/01/2028 | 62,000 | 81,141 | ||||||
7.29%, 06/01/2036 | 134,000 | 190,955 | ||||||
6.15%, 05/01/2037 | 320,000 | 422,283 | ||||||
5.75%, 05/01/2040 | 373,000 | 471,589 | ||||||
5.40%, 06/01/2041 | 542,000 | 661,028 | ||||||
4.40%, 03/15/2042 | 400,000 | 431,411 | ||||||
4.38%, 09/01/2042 | 462,000 | 496,939 | ||||||
5.15%, 09/01/2043 | 389,000 | 466,281 | ||||||
4.15%, 04/01/2045 | 1,825,000 | 1,910,488 | ||||||
Canadian Pacific Railway Co. | ||||||||
4.50%, 01/15/2022 | 1,200,000 | 1,286,394 | ||||||
2.90%, 02/01/2025 | 644,000 | 638,304 | ||||||
7.13%, 10/15/2031 | 155,000 | 211,493 | ||||||
6.13%, 09/15/2115 | 678,000 | 851,973 | ||||||
Caterpillar Financial Services Co. | ||||||||
7.15%, 02/15/2019 | 62,000 | 67,221 | ||||||
2.75%, 08/20/2021 | 420,000 | 425,271 | ||||||
1.93%, 10/01/2021 | 445,000 | 437,188 | ||||||
2.85%, 06/01/2022 | 446,000 | 453,557 | ||||||
2.40%, 06/06/2022 | 8,700,000 | 8,676,632 | ||||||
3.75%, 11/24/2023 | 2,825,000 | 2,996,723 | ||||||
3.25%, 12/01/2024 | 714,000 | 732,050 | ||||||
2.40%, 08/09/2026 | 700,000 | 670,275 | ||||||
Caterpillar, Inc. | ||||||||
2.60%, 06/26/2022 | 220,000 | 221,836 | ||||||
CRH America Finance, Inc. | ||||||||
3.40%, 05/09/2027 (Acquired 05/02/2017, Cost $198,560) (1) | 200,000 | 200,034 | ||||||
CRH America, Inc. | ||||||||
3.88%, 05/18/2025 (Acquired 05/12/2015, Cost $353,644) (1) | 354,000 | 367,917 | ||||||
5.13%, 05/18/2045 (Acquired 05/12/2015, Cost $227,275) (1) | 230,000 | 259,553 | ||||||
CSX Co. | ||||||||
4.25%, 06/01/2021 | 205,000 | 218,544 | ||||||
3.40%, 08/01/2024 | 600,000 | 620,010 | ||||||
3.25%, 06/01/2027 | 9,048,000 | 9,133,920 | ||||||
5.50%, 04/15/2041 | 402,000 | 484,635 | ||||||
4.75%, 05/30/2042 | 175,000 | 193,940 | ||||||
3.95%, 05/01/2050 | 246,000 | 240,242 | ||||||
Deere & Co. | ||||||||
2.60%, 06/08/2022 | 619,000 | 626,997 | ||||||
3.90%, 06/09/2042 | 275,000 | 287,467 | ||||||
Eaton Co. | ||||||||
1.50%, 11/02/2017 | 163,000 | 163,032 | ||||||
5.60%, 05/15/2018 | 273,000 | 282,138 | ||||||
7.63%, 04/01/2024 | 206,000 | 247,381 | ||||||
4.00%, 11/02/2032 | 143,000 | 148,100 | ||||||
5.80%, 03/15/2037 | 500,000 | 590,600 | ||||||
Embraer Netherlands Finance BV | ||||||||
5.05%, 06/15/2025 | 1,800,000 | 1,876,500 | ||||||
Federal Express Co. 1998 Pass Through Trust | ||||||||
6.85%, 01/15/2019 | 632,570 | 662,239 | ||||||
6.72%, 01/15/2022 | 168,014 | 183,680 | ||||||
FedEx Corp. | ||||||||
3.90%, 02/01/2035 | 414,000 | 411,386 | ||||||
4.10%, 04/15/2043 | 86,000 | 85,158 | ||||||
4.55%, 04/01/2046 | 2,250,000 | 2,380,142 | ||||||
General Electric Capital Co. | ||||||||
1.60%, 11/20/2017 | 328,000 | 328,201 | ||||||
| Principal Amount | Value | |||||||
6.00%, 08/07/2019 | 157,000 | 170,630 | ||||||
2.10%, 12/11/2019 | 152,000 | 153,213 | ||||||
5.50%, 01/08/2020 | 581,000 | 632,811 | ||||||
5.55%, 05/04/2020 | 191,000 | 209,800 | ||||||
4.38%, 09/16/2020 | 426,000 | 457,222 | ||||||
5.30%, 02/11/2021 | 184,000 | 203,467 | ||||||
3.15%, 09/07/2022 | 554,000 | 574,639 | ||||||
3.10%, 01/09/2023 | 516,000 | 535,039 | ||||||
3.45%, 05/15/2024 | 830,000 | 872,240 | ||||||
6.75%, 03/15/2032 | 135,000 | 185,065 | ||||||
5.88%, 01/14/2038 | 289,000 | 374,597 | ||||||
General Electric Co. | ||||||||
4.65%, 10/17/2021 | 514,000 | 566,147 | ||||||
2.70%, 10/09/2022 | 175,000 | 177,977 | ||||||
Harris Corp. | ||||||||
3.83%, 04/27/2025 | 1,820,000 | 1,884,113 | ||||||
4.85%, 04/27/2035 | 1,000,000 | 1,096,112 | ||||||
Holcim US Finance Sarl & Cie SCS | ||||||||
6.00%, 12/30/2019 (Acquired 10/28/2013, Cost $157,314) (1) | 148,000 | 160,186 | ||||||
Illinois Tool Works, Inc. | ||||||||
1.95%, 03/01/2019 | 167,000 | 168,230 | ||||||
4.88%, 09/15/2041 | 87,000 | 101,778 | ||||||
3.90%, 09/01/2042 | 1,267,000 | 1,317,595 | ||||||
Ingersoll-Rand Co. | ||||||||
6.39%, 11/15/2027 | 80,000 | 94,913 | ||||||
Ingersoll-Rand Global Holding Co. Ltd. | ||||||||
4.25%, 06/15/2023 | 329,000 | 355,430 | ||||||
Ingersoll-Rand Luxembourg Finance SA | ||||||||
2.63%, 05/01/2020 | 360,000 | 363,534 | ||||||
JB Hunt Transport Services, Inc. | ||||||||
3.85%, 03/15/2024 | 650,000 | 671,453 | ||||||
John Deere Capital Co. | ||||||||
1.60%, 07/13/2018 | 315,000 | 315,303 | ||||||
1.70%, 01/15/2020 | 123,000 | 122,557 | ||||||
2.05%, 03/10/2020 | 300,000 | 301,760 | ||||||
1.95%, 06/22/2020 | 4,098,000 | 4,108,753 | ||||||
2.45%, 09/11/2020 | 335,000 | 338,545 | ||||||
3.15%, 10/15/2021 | 257,000 | 265,650 | ||||||
2.80%, 01/27/2023 | 373,000 | 377,108 | ||||||
2.65%, 06/24/2024 | 4,151,000 | 4,120,889 | ||||||
Johnson Controls International Plc | ||||||||
4.25%, 03/01/2021 | 344,000 | 365,201 | ||||||
3.75%, 12/01/2021 | 475,000 | 495,844 | ||||||
3.63%, 07/02/2024 | 161,000 | 166,667 | ||||||
6.00%, 01/15/2036 | 107,000 | 131,580 | ||||||
5.25%, 12/01/2041 | 722,000 | 823,462 | ||||||
5.13%, 09/14/2045 | 205,000 | 236,058 | ||||||
4.95%, 07/02/2064 | 1,380,000 | 1,480,380 | ||||||
Keysight Technologies, Inc. | ||||||||
4.60%, 04/06/2027 | 8,000,000 | 8,404,624 | ||||||
Koninklijke Philips NV | ||||||||
3.75%, 03/15/2022 | 864,000 | 910,706 | ||||||
L3 Technologies, Inc. | ||||||||
3.85%, 12/15/2026 | 280,000 | 288,669 | ||||||
Lockheed Martin Co. | ||||||||
2.50%, 11/23/2020 | 103,000 | 104,405 | ||||||
3.10%, 01/15/2023 | 346,000 | 353,946 | ||||||
6.15%, 09/01/2036 | 400,000 | 520,440 | ||||||
4.85%, 09/15/2041 | 181,000 | 205,237 | ||||||
4.07%, 12/15/2042 | 462,000 | 472,885 | ||||||
Martin Marietta Materials, Inc. | ||||||||
4.25%, 07/02/2024 | 1,705,000 | 1,789,435 | ||||||
3.45%, 06/01/2027 | 811,000 | 806,861 | ||||||
6.25%, 05/01/2037 | 107,000 | 127,720 | ||||||
MeadWestvaco Co. | ||||||||
7.38%, 09/01/2019 | 3,300,000 | 3,650,632 | ||||||
9.75%, 06/15/2020 | 17,000 | 20,109 | ||||||
8.20%, 01/15/2030 | 537,000 | 756,086 | ||||||
Norfolk Southern Co. | ||||||||
3.25%, 12/01/2021 | 570,000 | 588,468 | ||||||
| Principal Amount | Value | |||||||
2.90%, 02/15/2023 | 294,000 | 297,239 | ||||||
5.59%, 05/17/2025 | 6,000 | 6,832 | ||||||
7.80%, 05/15/2027 | 1,705,000 | 2,287,760 | ||||||
3.95%, 10/01/2042 | 332,000 | 329,768 | ||||||
4.80%, 08/15/2043 | 3,400,000 | 3,841,833 | ||||||
6.00%, 03/15/2105 | 351,000 | 421,787 | ||||||
6.00%, 05/23/2111 | 1,083,000 | 1,306,260 | ||||||
Northrop Grumman Corp. | ||||||||
3.20%, 02/01/2027 | 849,000 | 854,923 | ||||||
7.75%, 02/15/2031 | 206,000 | 294,350 | ||||||
3.85%, 04/15/2045 | 195,000 | 193,665 | ||||||
Pactiv LLC | ||||||||
7.95%, 12/15/2025 | 34,000 | 38,080 | ||||||
Parker-Hannifin Co. | ||||||||
5.50%, 05/15/2018 | 80,000 | 82,707 | ||||||
3.30%, 11/21/2024 | 149,000 | 153,541 | ||||||
4.45%, 11/21/2044 | 333,000 | 364,832 | ||||||
4.10%, 03/01/2047 (Acquired 02/21/2017, Cost $580,616) (1) | 583,000 | 610,125 | ||||||
Penske Truck Leasing Co. Lp / PTL Finance Corp. | ||||||||
2.88%, 07/17/2018 (Acquired 10/28/2013, Cost $431,641) (1) | 431,000 | 435,328 | ||||||
2.50%, 06/15/2019 (Acquired 06/12/2014, Cost $183,977) (1) | 184,000 | 184,943 | ||||||
3.38%, 02/01/2022 (Acquired 01/26/2015 through 06/05/2015, Cost $1,990,976) (1) | 2,011,000 | 2,059,825 | ||||||
4.25%, 01/17/2023 (Acquired 01/23/2015, Cost $228,665) (1) | 220,000 | 233,255 | ||||||
Pentair Finance SA | ||||||||
2.90%, 09/15/2018 | 449,000 | 453,647 | ||||||
Precision Castparts Co. | ||||||||
3.25%, 06/15/2025 | 880,000 | 898,790 | ||||||
4.20%, 06/15/2035 | 75,000 | 78,187 | ||||||
4.38%, 06/15/2045 | 415,000 | 450,027 | ||||||
Raytheon Co. | ||||||||
3.15%, 12/15/2024 | 378,000 | 388,400 | ||||||
Republic Services, Inc. | ||||||||
5.25%, 11/15/2021 | 2,795,000 | 3,107,718 | ||||||
3.55%, 06/01/2022 | 496,000 | 516,192 | ||||||
2.90%, 07/01/2026 | 245,000 | 240,228 | ||||||
Rockwell Collins, Inc. | ||||||||
2.80%, 03/15/2022 | 8,800,000 | 8,880,283 | ||||||
3.20%, 03/15/2024 | 12,268,000 | 12,432,354 | ||||||
4.35%, 04/15/2047 | 259,000 | 271,318 | ||||||
Roper Technologies, Inc. | ||||||||
3.00%, 12/15/2020 | 208,000 | 212,868 | ||||||
3.80%, 12/15/2026 | 308,000 | 316,488 | ||||||
Ryder System, Inc. | ||||||||
2.50%, 03/01/2018 | 165,000 | 165,845 | ||||||
2.50%, 05/11/2020 | 1,020,000 | 1,025,469 | ||||||
2.88%, 09/01/2020 | 345,000 | 348,809 | ||||||
Siemens Financieringsmaatschappij NV | ||||||||
2.90%, 05/27/2022 (Acquired 05/18/2015, Cost $553,000) (1) | 553,000 | 564,251 | ||||||
3.13%, 03/16/2024 (Acquired 03/07/2017 through 05/11/2017, Cost $6,787,717) (1) | 6,722,000 | 6,826,816 | ||||||
2.35%, 10/15/2026 (Acquired 09/06/2016, Cost $698,141) (1) | 700,000 | 660,991 | ||||||
4.40%, 05/27/2045 (Acquired 05/18/2015, Cost $509,328) (1) | 513,000 | 556,666 | ||||||
3.30%, 09/15/2046 (Acquired 09/06/2016, Cost $398,587) (1) | 400,000 | 361,435 | ||||||
4.20%, 03/16/2047 (Acquired 03/07/2017, Cost $1,185,796) (1) | 1,190,000 | 1,262,425 | ||||||
Textron, Inc. | ||||||||
3.65%, 03/01/2021 | 11,600,000 | 11,957,918 | ||||||
3.65%, 03/15/2027 | 5,571,000 | 5,593,340 | ||||||
Timken Co./The | ||||||||
3.88%, 09/01/2024 | 1,000,000 | 996,193 | ||||||
TTX Co. | ||||||||
2.25%, 02/01/2019 (Acquired 01/12/2016 through 12/14/2016, Cost $3,376,019) (1) | 3,375,000 | 3,376,964 | ||||||
3.60%, 01/15/2025 (Acquired 11/13/2014, Cost $1,999,908) (1) | 2,000,000 | 2,014,242 | ||||||
3.90%, 02/01/2045 (Acquired 01/26/2015, Cost $3,969,224) (1) | 4,000,000 | 3,840,528 | ||||||
Tyco Electronics Group SA | ||||||||
6.55%, 10/01/2017 | 752,000 | 760,909 | ||||||
2.38%, 12/17/2018 | 7,025,000 | 7,069,693 | ||||||
Union Pacific Corp. | ||||||||
4.16%, 07/15/2022 | 213,000 | 230,454 | ||||||
2.95%, 01/15/2023 | 149,000 | 152,500 | ||||||
2.75%, 04/15/2023 | 240,000 | 242,361 | ||||||
3.65%, 02/15/2024 | 142,000 | 150,175 | ||||||
| Principal Amount | Value | |||||||
3.25%, 01/15/2025 | 200,000 | 206,164 | ||||||
4.30%, 06/15/2042 | 165,000 | 175,605 | ||||||
4.15%, 01/15/2045 | 300,000 | 315,098 | ||||||
4.00%, 04/15/2047 | 4,444,000 | 4,564,375 | ||||||
3.80%, 10/01/2051 | 116,000 | 113,777 | ||||||
Union Pacific Railroad Co. 2003 Pass Through Trust | ||||||||
4.70%, 01/02/2024 | 16,532 | 17,565 | ||||||
Union Pacific Railroad Co. 2015-1 Pass Through Trust | ||||||||
2.70%, 05/12/2027 | 651,930 | 629,645 | ||||||
United Parcel Service of America, Inc. | ||||||||
8.38%, 04/01/2020 | 243,000 | 283,685 | ||||||
8.38%, 04/01/2030 | 83,000 | 118,653 | ||||||
United Parcel Service, Inc. | ||||||||
2.45%, 10/01/2022 | 186,000 | 187,897 | ||||||
United Technologies Corp. | ||||||||
1.78%, 05/04/2018 | 14,316,000 | 14,334,668 | ||||||
3.10%, 06/01/2022 | 524,000 | 541,393 | ||||||
3.13%, 05/04/2027 | 10,719,000 | 10,745,647 | ||||||
4.50%, 06/01/2042 | 693,000 | 757,751 | ||||||
4.15%, 05/15/2045 | 785,000 | 813,950 | ||||||
Vulcan Materials Co. | ||||||||
7.00%, 06/15/2018 | 215,000 | 225,129 | ||||||
7.15%, 11/30/2037 | 2,054,000 | 2,699,108 | ||||||
4.50%, 06/15/2047 | 4,166,000 | 4,203,644 | ||||||
Wabtec Corp./DE | ||||||||
4.38%, 08/15/2023 | 322,000 | 337,542 | ||||||
3.45%, 11/15/2026 (Acquired 03/23/2017, Cost $4,879,474) (1) | 5,000,000 | 4,930,445 | ||||||
Waste Management, Inc. | ||||||||
3.13%, 03/01/2025 | 424,000 | 430,442 | ||||||
Xylem, Inc./NY | ||||||||
3.25%, 11/01/2026 | 1,192,000 | 1,187,109 | ||||||
4.38%, 11/01/2046 | 224,000 | 232,175 | ||||||
|
| |||||||
| 240,466,197 | ||||||||
|
| |||||||
Real Estate - 0.07% | ||||||||
American Tower Corp. | ||||||||
3.50%, 01/31/2023 | 341,000 | 349,679 | ||||||
3.38%, 10/15/2026 | 506,000 | 495,118 | ||||||
HCP, Inc. | ||||||||
3.88%, 08/15/2024 | 1,981,000 | 2,019,748 | ||||||
Realty Income Corp. | ||||||||
2.00%, 01/31/2018 | 4,700,000 | 4,704,644 | ||||||
3.25%, 10/15/2022 | 1,490,000 | 1,512,272 | ||||||
Weyerhaeuser Co. | ||||||||
7.38%, 03/15/2032 | 500,000 | 688,537 | ||||||
|
| |||||||
| 9,769,998 | ||||||||
|
| |||||||
Technology - 1.51% | ||||||||
Analog Devices, Inc. | ||||||||
3.13%, 12/05/2023 | 476,000 | 481,009 | ||||||
4.50%, 12/05/2036 | 1,020,000 | 1,058,087 | ||||||
Apple, Inc. | ||||||||
1.42%, 05/03/2018 | 790,000 | 791,666 | ||||||
2.15%, 02/09/2022 | 1,200,000 | 1,192,998 | ||||||
2.40%, 05/03/2023 | 2,081,000 | 2,069,844 | ||||||
3.00%, 02/09/2024 | 6,709,000 | 6,809,058 | ||||||
3.45%, 05/06/2024 | 795,000 | 827,990 | ||||||
2.85%, 05/11/2024 | 10,476,000 | 10,526,861 | ||||||
3.20%, 05/13/2025 | 1,010,000 | 1,031,615 | ||||||
2.45%, 08/04/2026 | 1,111,000 | 1,063,427 | ||||||
3.35%, 02/09/2027 | 363,000 | 371,684 | ||||||
3.20%, 05/11/2027 | 4,195,000 | 4,234,798 | ||||||
3.00%, 06/20/2027 | 1,462,000 | 1,454,822 | ||||||
4.50%, 02/23/2036 | 723,000 | 812,199 | ||||||
3.45%, 02/09/2045 | 500,000 | 470,549 | ||||||
3.85%, 08/04/2046 | 5,299,000 | 5,303,472 | ||||||
Broadcom Corp. / Broadcom Cayman Finance Ltd. | ||||||||
3.00%, 01/15/2022 (Acquired 01/11/2017, Cost $2,988,784) (1) | 3,000,000 | 3,026,499 | ||||||
3.63%, 01/15/2024 (Acquired 01/11/2017, Cost $1,986,044) (1) | 1,988,000 | 2,033,227 | ||||||
3.88%, 01/15/2027 (Acquired 01/11/2017, Cost $1,842,121) (1) | 1,850,000 | 1,899,961 | ||||||
Dell, Inc. | ||||||||
7.10%, 04/15/2028 | 196,000 | 215,110 | ||||||
| Principal Amount | Value | |||||||
Diamond 1 Finance Co. / Diamond 2 Finance Co. | ||||||||
3.48%, 06/01/2019 (Acquired 05/17/2016, Cost $7,483,782) (1) | 7,485,000 | 7,660,261 | ||||||
4.42%, 06/15/2021 (Acquired 05/17/2016, Cost $2,114,541) (1) | 2,115,000 | 2,229,470 | ||||||
5.45%, 06/15/2023 (Acquired 05/17/2016 through 06/12/2017, Cost $1,693,767) (1) | 1,623,000 | 1,761,010 | ||||||
6.02%, 06/15/2026 (Acquired 05/17/2016, Cost $737,699) (1) | 738,000 | 812,988 | ||||||
8.10%, 07/15/2036 (Acquired 09/28/2016 through 11/30/2016, Cost $1,146,340) (1) | 983,000 | 1,236,678 | ||||||
8.35%, 07/15/2046 (Acquired 09/28/2016 through 05/24/2017, Cost $3,532,776) (1) | 2,807,000 | 3,626,711 | ||||||
Everett Spinco, Inc. | ||||||||
2.88%, 03/27/2020 (Acquired 03/31/2017, Cost $5,326,656) (1) | 5,285,000 | 5,351,068 | ||||||
4.25%, 04/15/2024 (Acquired 03/13/2017 through 06/13/2017, Cost $9,722,453) (1) | 9,435,000 | 9,775,226 | ||||||
Fidelity National Information Services, Inc. | ||||||||
3.63%, 10/15/2020 | 4,000,000 | 4,189,828 | ||||||
3.50%, 04/15/2023 | 2,430,000 | 2,524,665 | ||||||
3.88%, 06/05/2024 | 2,150,000 | 2,252,177 | ||||||
3.00%, 08/15/2026 | 1,300,000 | 1,258,942 | ||||||
Fiserv, Inc. | ||||||||
4.63%, 10/01/2020 | 215,000 | 229,999 | ||||||
4.75%, 06/15/2021 | 5,231,000 | 5,653,859 | ||||||
3.85%, 06/01/2025 | 5,000,000 | 5,194,470 | ||||||
Hewlett Packard Co. | ||||||||
4.38%, 09/15/2021 | 293,000 | 312,252 | ||||||
4.65%, 12/09/2021 | 326,000 | 351,804 | ||||||
6.00%, 09/15/2041 | 731,000 | 775,183 | ||||||
Hewlett Packard Enterprise Co. | ||||||||
2.45%, 10/05/2017 | 3,387,000 | 3,395,942 | ||||||
4.40%, 10/15/2022 | 7,500,000 | 7,950,075 | ||||||
HP Enterprise Services LLC | ||||||||
7.45%, 10/15/2029 | 250,000 | 304,588 | ||||||
Intel Corp. | ||||||||
3.30%, 10/01/2021 | 259,000 | 270,796 | ||||||
3.10%, 07/29/2022 | 245,000 | 253,790 | ||||||
2.88%, 05/11/2024 | 9,517,000 | 9,550,576 | ||||||
3.70%, 07/29/2025 | 456,000 | 478,768 | ||||||
3.15%, 05/11/2027 | 700,000 | 702,469 | ||||||
4.00%, 12/15/2032 | 1,195,000 | 1,260,989 | ||||||
4.10%, 05/11/2047 | 3,629,000 | 3,762,609 | ||||||
International Business Machines Co. | ||||||||
7.63%, 10/15/2018 | 872,000 | 936,999 | ||||||
2.25%, 02/19/2021 | 1,670,000 | 1,678,902 | ||||||
6.22%, 08/01/2027 | 68,000 | 85,054 | ||||||
6.50%, 01/15/2028 | 120,000 | 153,514 | ||||||
4.00%, 06/20/2042 | 79,000 | 79,008 | ||||||
Maxim Integrated Products, Inc. | ||||||||
2.50%, 11/15/2018 | 4,200,000 | 4,234,289 | ||||||
Microsoft Corp. | ||||||||
2.13%, 11/15/2022 | 350,000 | 346,995 | ||||||
2.38%, 05/01/2023 | 394,000 | 392,342 | ||||||
2.88%, 02/06/2024 | 2,068,000 | 2,101,113 | ||||||
2.40%, 08/08/2026 | 600,000 | 577,488 | ||||||
3.30%, 02/06/2027 | 892,000 | 917,157 | ||||||
3.50%, 02/12/2035 | 318,000 | 320,986 | ||||||
4.20%, 11/03/2035 | 231,000 | 252,688 | ||||||
4.10%, 02/06/2037 | 1,468,000 | 1,583,088 | ||||||
4.50%, 10/01/2040 | 125,000 | 140,983 | ||||||
4.25%, 02/06/2047 | 3,610,000 | 3,914,294 | ||||||
4.00%, 02/12/2055 | 1,513,000 | 1,534,736 | ||||||
4.75%, 11/03/2055 | 408,000 | 466,816 | ||||||
3.95%, 08/08/2056 | 264,000 | 264,498 | ||||||
4.50%, 02/06/2057 | 8,636,000 | 9,500,939 | ||||||
Oracle Co. | ||||||||
5.75%, 04/15/2018 | 351,000 | 362,149 | ||||||
5.00%, 07/08/2019 | 547,000 | 582,674 | ||||||
2.80%, 07/08/2021 | 766,000 | 783,426 | ||||||
2.40%, 09/15/2023 | 757,000 | 747,070 | ||||||
3.40%, 07/08/2024 | 2,000,000 | 2,082,844 | ||||||
2.95%, 05/15/2025 | 2,000,000 | 2,007,592 | ||||||
4.30%, 07/08/2034 | 4,981,000 | 5,410,153 | ||||||
3.90%, 05/15/2035 | 2,000,000 | 2,063,252 | ||||||
3.85%, 07/15/2036 | 800,000 | 829,111 | ||||||
6.13%, 07/08/2039 | 265,000 | 347,227 | ||||||
| Principal Amount | Value | |||||||
4.38%, 05/15/2055 | 400,000 | 420,746 | ||||||
Pitney Bowes, Inc. | ||||||||
5.60%, 03/15/2018 | 175,000 | 179,179 | ||||||
Qualcomm, Inc. | ||||||||
2.10%, 05/20/2020 | 3,822,000 | 3,839,321 | ||||||
2.60%, 01/30/2023 | 6,588,000 | 6,566,668 | ||||||
2.90%, 05/20/2024 | 1,200,000 | 1,197,233 | ||||||
3.25%, 05/20/2027 | 1,003,000 | 1,005,402 | ||||||
4.30%, 05/20/2047 | 10,903,000 | 11,130,622 | ||||||
Texas Instruments, Inc. | ||||||||
1.65%, 08/03/2019 | 434,000 | 434,319 | ||||||
TSMC Global Ltd. | ||||||||
1.63%, 04/03/2018 (Acquired 02/04/2016, Cost $4,970,644) (1) | 5,000,000 | 4,989,990 | ||||||
Xerox Co. | ||||||||
2.75%, 09/01/2020 | 1,268,000 | 1,264,793 | ||||||
|
| |||||||
| 204,527,729 | ||||||||
|
| |||||||
Utilities - 2.30% | ||||||||
AEP Transmission Co. LLC | ||||||||
4.00%, 12/01/2046 | 2,020,000 | 2,090,066 | ||||||
Alabama Power Co. | ||||||||
2.80%, 04/01/2025 | 2,025,000 | 1,980,296 | ||||||
6.13%, 05/15/2038 | 219,000 | 276,730 | ||||||
6.00%, 03/01/2039 | 89,000 | 113,368 | ||||||
4.15%, 08/15/2044 | 205,000 | 214,104 | ||||||
3.75%, 03/01/2045 | 415,000 | 410,638 | ||||||
American Electric Power Co., Inc. | ||||||||
1.65%, 12/15/2017 | 246,000 | 246,030 | ||||||
American Water Capital Co. | ||||||||
3.85%, 03/01/2024 | 500,000 | 530,534 | ||||||
3.40%, 03/01/2025 | 592,000 | 612,235 | ||||||
6.59%, 10/15/2037 | 386,000 | 530,718 | ||||||
4.00%, 12/01/2046 | 2,350,000 | 2,440,555 | ||||||
Appalachian Power Co. | ||||||||
6.70%, 08/15/2037 | 430,000 | 567,778 | ||||||
Arizona Public Service Co. | ||||||||
8.75%, 03/01/2019 | 91,000 | 100,969 | ||||||
2.20%, 01/15/2020 | 167,000 | 167,410 | ||||||
3.35%, 06/15/2024 | 676,000 | 689,819 | ||||||
5.05%, 09/01/2041 | 349,000 | 404,083 | ||||||
4.50%, 04/01/2042 | 221,000 | 241,705 | ||||||
3.75%, 05/15/2046 | 2,290,000 | 2,249,032 | ||||||
Atmos Energy Co. | ||||||||
8.50%, 03/15/2019 | 71,000 | 78,615 | ||||||
4.15%, 01/15/2043 | 830,000 | 860,482 | ||||||
4.13%, 10/15/2044 | 1,860,000 | 1,960,319 | ||||||
Baltimore Gas & Electric Co. | ||||||||
2.80%, 08/15/2022 | 509,000 | 513,823 | ||||||
3.50%, 08/15/2046 | 375,000 | 358,092 | ||||||
Berkshire Hathaway Energy Co. | ||||||||
5.75%, 04/01/2018 | 168,000 | 173,010 | ||||||
2.40%, 02/01/2020 | 409,000 | 412,531 | ||||||
3.50%, 02/01/2025 | 625,000 | 641,260 | ||||||
6.13%, 04/01/2036 | 375,000 | 482,281 | ||||||
Boston Gas Co. | ||||||||
4.49%, 02/15/2042 (Acquired 10/28/2013, Cost $241,817) (1) | 253,000 | 270,823 | ||||||
Brooklyn Union Gas Co./The | ||||||||
4.50%, 03/10/2046 (Acquired 03/07/2016, Cost $2,000,000) (1) | 2,000,000 | 2,164,818 | ||||||
CenterPoint Energy Resources Co. | ||||||||
4.50%, 01/15/2021 | 158,000 | 165,910 | ||||||
Centrica PLC | ||||||||
4.00%, 10/16/2023 (Acquired 11/18/2013, Cost $4,981,736) (1) | 5,000,000 | 5,171,095 | ||||||
China Southern Power Grid International Finance BVI Co Ltd. | ||||||||
3.50%, 05/08/2027 (Acquired 04/27/2017, Cost $1,894,588) (1) | 1,910,000 | 1,894,773 | ||||||
Cleveland Electric Illuminating Co./The | ||||||||
7.88%, 11/01/2017 | 356,000 | 362,893 | ||||||
CMS Energy Co. | ||||||||
3.88%, 03/01/2024 | 550,000 | 575,345 | ||||||
3.00%, 05/15/2026 | 110,000 | 107,634 | ||||||
2.95%, 02/15/2027 | 348,000 | 333,758 | ||||||
3.45%, 08/15/2027 | 350,000 | 353,290 | ||||||
| Principal Amount | Value | |||||||
Consumers Energy Co. | ||||||||
4.35%, 08/31/2064 | 191,000 | 197,521 | ||||||
Comision Federal de Electricidad | ||||||||
4.88%, 05/26/2021 (Acquired 10/28/2013, Cost $563,130) (1) | 551,000 | 586,126 | ||||||
4.88%, 01/15/2024 (Acquired 10/28/2013 through 11/22/2013, Cost $1,822,055) (1) | 1,822,000 | 1,924,488 | ||||||
Commonwealth Edison Co. | ||||||||
3.65%, 06/15/2046 | 364,000 | 354,910 | ||||||
Connecticut Light & Power Co./The | ||||||||
5.65%, 05/01/2018 | 95,000 | 98,139 | ||||||
3.20%, 03/15/2027 | 600,000 | 608,352 | ||||||
Consolidated Edison Co. of New York, Inc. | ||||||||
5.70%, 06/15/2040 | 318,000 | 399,621 | ||||||
3.85%, 06/15/2046 | 2,940,000 | 2,968,321 | ||||||
3.88%, 06/15/2047 | 1,100,000 | 1,117,558 | ||||||
4.30%, 12/01/2056 | 3,050,000 | 3,184,624 | ||||||
Consumers Energy Co. | ||||||||
5.65%, 04/15/2020 | 144,000 | 158,515 | ||||||
2.85%, 05/15/2022 | 155,000 | 158,423 | ||||||
3.25%, 08/15/2046 | 190,000 | 174,455 | ||||||
Delmarva Power & Light Co. | ||||||||
4.00%, 06/01/2042 | 170,000 | 171,725 | ||||||
4.15%, 05/15/2045 | 1,842,000 | 1,950,921 | ||||||
Dominion Gas Holdings LLC | ||||||||
2.50%, 12/15/2019 | 1,528,000 | 1,538,288 | ||||||
2.80%, 11/15/2020 | 264,000 | 267,184 | ||||||
Dominion Resources, Inc. | ||||||||
2.75%, 01/15/2022 | 529,000 | 531,821 | ||||||
Dominion Resources, Inc./VA | ||||||||
2.96%, 07/01/2019 | 6,539,000 | 6,637,039 | ||||||
2.85%, 08/15/2026 | 304,000 | 289,813 | ||||||
5.25%, 08/01/2033 | 583,000 | 655,982 | ||||||
7.00%, 06/15/2038 | 124,000 | 165,405 | ||||||
4.90%, 08/01/2041 | 212,000 | 231,959 | ||||||
DTE Energy Co. | ||||||||
2.40%, 12/01/2019 | 278,000 | 279,271 | ||||||
2.65%, 06/15/2022 | 194,000 | 194,427 | ||||||
3.30%, 06/15/2022 | 139,000 | 142,610 | ||||||
3.85%, 12/01/2023 | 292,000 | 303,903 | ||||||
3.50%, 06/01/2024 | �� | 692,000 | 702,618 | |||||
3.70%, 03/15/2045 | 463,000 | 457,231 | ||||||
Duke Energy Carolinas LLC | ||||||||
5.10%, 04/15/2018 | 144,000 | 147,885 | ||||||
4.30%, 06/15/2020 | 205,000 | 218,613 | ||||||
6.00%, 12/01/2028 | 235,000 | 290,677 | ||||||
6.00%, 01/15/2038 | 161,000 | 213,015 | ||||||
4.25%, 12/15/2041 | 141,000 | 150,828 | ||||||
Duke Energy Co. | ||||||||
6.25%, 06/15/2018 | 1,781,000 | 1,856,461 | ||||||
3.55%, 09/15/2021 | 306,000 | 318,931 | ||||||
3.75%, 09/01/2046 | 8,100,000 | 7,706,567 | ||||||
Duke Energy Florida LLC | ||||||||
5.65%, 06/15/2018 | 116,000 | 120,440 | ||||||
6.40%, 06/15/2038 | 72,000 | 98,484 | ||||||
Duke Energy Indiana LLC | ||||||||
3.75%, 05/15/2046 | 600,000 | 593,528 | ||||||
Duke Energy Indiana, Inc. | ||||||||
3.75%, 07/15/2020 | 398,000 | 416,655 | ||||||
6.35%, 08/15/2038 | 320,000 | 425,331 | ||||||
Duke Energy Progress LLC | ||||||||
5.30%, 01/15/2019 | 206,000 | 217,407 | ||||||
3.00%, 09/15/2021 | 372,000 | 381,840 | ||||||
2.80%, 05/15/2022 | 335,000 | 341,646 | ||||||
3.25%, 08/15/2025 | 158,000 | 161,630 | ||||||
4.10%, 05/15/2042 | 217,000 | 226,976 | ||||||
4.10%, 03/15/2043 | 181,000 | 188,195 | ||||||
4.38%, 03/30/2044 | 132,000 | 143,552 | ||||||
4.15%, 12/01/2044 | 129,000 | 135,234 | ||||||
4.20%, 08/15/2045 | 325,000 | 345,881 | ||||||
3.70%, 10/15/2046 | 506,000 | 498,090 | ||||||
Edison International | ||||||||
| Principal Amount | Value | |||||||
2.95%, 03/15/2023 | 400,000 | 403,920 | ||||||
EDP Finance BV | ||||||||
3.63%, 07/15/2024 (Acquired 06/21/2017, Cost $697,648) (1) | 700,000 | 694,708 | ||||||
Electricite de France SA | ||||||||
2.15%, 01/22/2019 (Acquired 01/13/2014, Cost $3,541,853) (1) | 3,558,000 | 3,569,602 | ||||||
4.75%, 10/13/2035 (Acquired 10/07/2015, Cost $4,900,659) (1) | 5,000,000 | 5,346,330 | ||||||
6.00%, 01/22/2114 (Acquired 01/13/2014, Cost $1,003,525) (1) | 1,035,000 | 1,139,023 | ||||||
Emera US Finance LP | ||||||||
3.55%, 06/15/2026 | 2,235,000 | 2,240,395 | ||||||
Enel Finance International NV | ||||||||
5.13%, 10/07/2019 (Acquired 10/28/2013, Cost $913,745) (1) | 888,000 | 945,640 | ||||||
3.63%, 05/25/2027 (Acquired 05/22/2017, Cost $772,188) (1) | 780,000 | 772,553 | ||||||
6.00%, 10/07/2039 (Acquired 10/28/2013 through 10/04/2016, Cost $344,551) (1) | 307,000 | 365,518 | ||||||
4.75%, 05/25/2047 (Acquired 05/22/2017, Cost $5,566,149) (1) | 5,575,000 | 5,744,597 | ||||||
Entergy Arkansas, Inc. | ||||||||
3.50%, 04/01/2026 | 307,000 | 316,976 | ||||||
Entergy Corp. | ||||||||
2.95%, 09/01/2026 | 310,000 | 296,876 | ||||||
Entergy Louisiana LLC | ||||||||
2.40%, 10/01/2026 | 650,000 | 612,744 | ||||||
3.12%, 09/01/2027 | 370,000 | 368,775 | ||||||
3.05%, 06/01/2031 | 440,000 | 424,918 | ||||||
Entergy Mississippi, Inc. | ||||||||
2.85%, 06/01/2028 | 497,000 | 480,195 | ||||||
Exelon Co. | ||||||||
3.50%, 06/01/2022 | 10,180,000 | 10,439,855 | ||||||
4.95%, 06/15/2035 | 1,500,000 | 1,643,889 | ||||||
5.63%, 06/15/2035 | 1,030,000 | 1,208,264 | ||||||
Exelon Generation Co. LLC | ||||||||
6.20%, 10/01/2017 | 3,436,000 | 3,471,566 | ||||||
2.95%, 01/15/2020 | 300,000 | 305,324 | ||||||
4.00%, 10/01/2020 | 150,000 | 156,492 | ||||||
3.40%, 03/15/2022 | 425,000 | 432,551 | ||||||
4.25%, 06/15/2022 | 618,000 | 650,187 | ||||||
6.25%, 10/01/2039 | 300,000 | 327,703 | ||||||
5.75%, 10/01/2041 | 192,000 | 195,560 | ||||||
FirstEnergy Corp. | ||||||||
3.90%, 07/15/2027 | 353,000 | 353,071 | ||||||
4.85%, 07/15/2047 | 263,000 | 266,569 | ||||||
FirstEnergy Transmission LLC | ||||||||
5.45%, 07/15/2044 (Acquired 05/14/2014 through 05/12/2017, Cost $4,996,073) (1) | 4,804,000 | 5,494,537 | ||||||
Florida Power & Light Co. | ||||||||
5.63%, 04/01/2034 | 57,000 | 70,655 | ||||||
5.40%, 09/01/2035 | 700,000 | 843,537 | ||||||
5.95%, 02/01/2038 | 103,000 | 134,496 | ||||||
Georgia Power Co. | ||||||||
3.25%, 04/01/2026 | 147,000 | 146,646 | ||||||
Great Plains Energy, Inc. | ||||||||
4.85%, 06/01/2021 | 156,000 | 166,232 | ||||||
3.15%, 04/01/2022 | 6,950,000 | 7,022,704 | ||||||
Hydro-Quebec | ||||||||
9.40%, 02/01/2021 | 186,000 | 227,709 | ||||||
8.40%, 01/15/2022 | 826,000 | 1,021,340 | ||||||
8.05%, 07/07/2024 | 638,000 | 837,239 | ||||||
Indiana Michigan Power Co. | ||||||||
7.00%, 03/15/2019 | 112,000 | 120,862 | ||||||
3.20%, 03/15/2023 | 991,000 | 1,004,331 | ||||||
ITC Holdings Co. | ||||||||
5.30%, 07/01/2043 | 1,348,000 | 1,571,002 | ||||||
Jersey Central Power & Light Co. | ||||||||
7.35%, 02/01/2019 | 3,758,000 | 4,047,693 | ||||||
4.70%, 04/01/2024 (Acquired 12/07/2016 through 06/29/2017, Cost $7,577,102) (1) | 7,059,000 | 7,654,257 | ||||||
6.15%, 06/01/2037 | 400,000 | 480,670 | ||||||
John Sevier Combined Cycle Generation LLC | ||||||||
4.63%, 01/15/2042 | 453,021 | 492,713 | ||||||
Kansas City Power & Light Co. | ||||||||
3.15%, 03/15/2023 | 375,000 | 378,220 | ||||||
5.30%, 10/01/2041 | 1,032,000 | 1,207,816 | ||||||
4.20%, 06/15/2047 | 1,512,000 | 1,542,140 | ||||||
KeySpan Gas East Corp. | ||||||||
| Principal Amount | Value | |||||||
2.74%, 08/15/2026 (Acquired 08/02/2016, Cost $538,000) (1) | 538,000 | 519,307 | ||||||
Korea Electric Power Co. | ||||||||
6.75%, 08/01/2027 | 233,000 | 303,683 | ||||||
Korea Gas Co. | ||||||||
4.25%, 11/02/2020 (Acquired 10/28/2013, Cost $286,574) (1) | 279,000 | 292,894 | ||||||
1.88%, 07/18/2021 (Acquired 07/11/2016, Cost $586,972) (1) | 588,000 | 570,452 | ||||||
Korea Hydro & Nuclear Power Co. Ltd. | ||||||||
2.88%, 10/02/2018 (Acquired 11/18/2013, Cost $4,011,877) (1) | 4,000,000 | 4,031,848 | ||||||
Massachusetts Electric Co. | ||||||||
4.00%, 08/15/2046 (Acquired 08/02/2016, Cost $624,000) (1) | 624,000 | 630,650 | ||||||
Mega Advance Investments Ltd. | ||||||||
5.00%, 05/12/2021 (Acquired 10/28/2013, Cost $607,862) (1) | 591,000 | 632,396 | ||||||
MidAmerican Energy Co. | ||||||||
5.30%, 03/15/2018 | 72,000 | 73,866 | ||||||
3.50%, 10/15/2024 | 317,000 | 330,562 | ||||||
3.10%, 05/01/2027 | 696,000 | 701,329 | ||||||
Nevada Power Co. | ||||||||
6.50%, 08/01/2018 | 232,000 | 243,867 | ||||||
7.13%, 03/15/2019 | 188,000 | 204,531 | ||||||
5.38%, 09/15/2040 | 261,000 | 308,771 | ||||||
5.45%, 05/15/2041 | 386,000 | 461,941 | ||||||
New York State Electric & Gas Corp. | ||||||||
3.25%, 12/01/2026 (Acquired 11/21/2016 through 05/17/2017, Cost $803,495) (1) | 804,000 | 805,197 | ||||||
NextEra Energy Capital Holdings, Inc. | ||||||||
2.06%, 09/01/2017 | 3,748,000 | 3,749,754 | ||||||
6.00%, 03/01/2019 | 124,000 | 131,890 | ||||||
2.40%, 09/15/2019 | 487,000 | 490,350 | ||||||
2.70%, 09/15/2019 | 3,473,000 | 3,517,406 | ||||||
3.55%, 05/01/2027 | 403,000 | 409,209 | ||||||
7.30%, 09/01/2067 | 295,000 | 296,850 | ||||||
Niagara Mohawk Power Co. | ||||||||
4.88%, 08/15/2019 (Acquired 10/28/2013, Cost $175,935) (1) | 168,000 | 177,785 | ||||||
3.51%, 10/01/2024 (Acquired 09/22/2014, Cost $258,000) (1) | 258,000 | 266,902 | ||||||
NiSource Finance Co. | ||||||||
3.85%, 02/15/2023 | 283,000 | 294,146 | ||||||
6.25%, 12/15/2040 | 550,000 | 689,183 | ||||||
5.80%, 02/01/2042 | 774,000 | 929,902 | ||||||
Northern States Power Co./MN | ||||||||
6.25%, 06/01/2036 | 458,000 | 605,340 | ||||||
4.13%, 05/15/2044 | 1,480,000 | 1,572,324 | ||||||
Ohio Power Co. | ||||||||
6.05%, 05/01/2018 | 160,000 | 165,611 | ||||||
5.38%, 10/01/2021 | 65,000 | 72,360 | ||||||
Oncor Electric Delivery Co. LLC | ||||||||
6.80%, 09/01/2018 | 635,000 | 670,649 | ||||||
7.00%, 09/01/2022 | 124,000 | 149,255 | ||||||
Pacific Gas & Electric Co. | ||||||||
5.63%, 11/30/2017 | 204,000 | 207,350 | ||||||
8.25%, 10/15/2018 | 4,484,000 | 4,845,280 | ||||||
3.25%, 09/15/2021 | 146,000 | 150,199 | ||||||
2.45%, 08/15/2022 | 581,000 | 580,512 | ||||||
3.25%, 06/15/2023 | 206,000 | 212,465 | ||||||
3.40%, 08/15/2024 | 14,420,000 | 14,872,312 | ||||||
3.50%, 06/15/2025 | 547,000 | 565,597 | ||||||
2.95%, 03/01/2026 | 194,000 | 192,674 | ||||||
6.05%, 03/01/2034 | 146,000 | 188,584 | ||||||
4.50%, 12/15/2041 | 749,000 | 809,528 | ||||||
4.45%, 04/15/2042 | 194,000 | 212,113 | ||||||
4.00%, 12/01/2046 | 358,000 | 368,672 | ||||||
PacifiCo. | ||||||||
5.65%, 07/15/2018 | 294,000 | 305,842 | ||||||
5.50%, 01/15/2019 | 26,000 | 27,430 | ||||||
2.95%, 02/01/2022 | 103,000 | 105,324 | ||||||
PECO Energy Co. | ||||||||
5.35%, 03/01/2018 | 93,000 | 95,262 | ||||||
2.38%, 09/15/2022 | 578,000 | 575,159 | ||||||
4.15%, 10/01/2044 | 353,000 | 368,779 | ||||||
Pennsylvania Electric Co. | ||||||||
6.05%, 09/01/2017 | 93,000 | 93,598 | ||||||
Pepco Holdings LLC | ||||||||
| Principal Amount | Value | |||||||
7.45%, 08/15/2032 | 222,000 | 283,256 | ||||||
Potomac Electric Power Co. | ||||||||
6.50%, 11/15/2037 | 136,000 | 185,192 | ||||||
PPL Electric Utilities Co. | ||||||||
2.50%, 09/01/2022 | 178,000 | 177,353 | ||||||
4.13%, 06/15/2044 | 208,000 | 217,139 | ||||||
3.95%, 06/01/2047 | 1,822,000 | 1,877,192 | ||||||
Progress Energy, Inc. | ||||||||
7.05%, 03/15/2019 | 4,553,000 | 4,928,859 | ||||||
4.40%, 01/15/2021 | 390,000 | 414,267 | ||||||
3.15%, 04/01/2022 | 389,000 | 397,070 | ||||||
7.75%, 03/01/2031 | 7,123,000 | 10,019,475 | ||||||
7.00%, 10/30/2031 | 419,000 | 554,821 | ||||||
PSEG Power LLC | ||||||||
5.13%, 04/15/2020 | 430,000 | 460,216 | ||||||
3.00%, 06/15/2021 | 2,310,000 | 2,345,283 | ||||||
4.15%, 09/15/2021 | 332,000 | 348,597 | ||||||
8.63%, 04/15/2031 | 130,000 | 167,761 | ||||||
Public Service Co. of Colorado | ||||||||
5.80%, 08/01/2018 | 28,000 | 29,188 | ||||||
3.20%, 11/15/2020 | 120,000 | 123,732 | ||||||
3.55%, 06/15/2046 | 353,000 | 334,350 | ||||||
Public Service Co. of New Hampshire | ||||||||
3.50%, 11/01/2023 | 101,000 | 105,452 | ||||||
Public Service Co. of Oklahoma | ||||||||
5.15%, 12/01/2019 | 143,000 | 152,432 | ||||||
4.40%, 02/01/2021 | 203,000 | 215,586 | ||||||
6.63%, 11/15/2037 | 649,000 | 857,018 | ||||||
Public Service Electric & Gas Co. | ||||||||
1.80%, 06/01/2019 | 85,000 | 84,887 | ||||||
3.15%, 08/15/2024 | 1,000,000 | 1,020,162 | ||||||
5.38%, 11/01/2039 | 117,000 | 141,899 | ||||||
Puget Energy, Inc. | ||||||||
3.65%, 05/15/2025 | 1,200,000 | 1,202,288 | ||||||
RGS I&M Funding Co. | ||||||||
9.82%, 06/07/2022 | 85,737 | 94,503 | ||||||
San Diego Gas & Electric Co. | ||||||||
6.00%, 06/01/2026 | 213,000 | 257,262 | ||||||
5.35%, 05/15/2040 | 3,430,000 | 4,158,415 | ||||||
3.95%, 11/15/2041 | 310,000 | 315,724 | ||||||
Sempra Energy | ||||||||
6.15%, 06/15/2018 | 237,000 | 246,800 | ||||||
9.80%, 02/15/2019 | 14,970,000 | 16,790,457 | ||||||
2.88%, 10/01/2022 | 361,000 | 361,846 | ||||||
4.05%, 12/01/2023 | 10,325,000 | 10,888,094 | ||||||
3.55%, 06/15/2024 | 709,000 | 726,196 | ||||||
3.25%, 06/15/2027 | 600,000 | 591,326 | ||||||
6.00%, 10/15/2039 | 155,000 | 196,425 | ||||||
Southern California Edison Co. | ||||||||
5.50%, 08/15/2018 | 144,000 | 150,100 | ||||||
3.88%, 06/01/2021 | 102,000 | 107,857 | ||||||
1.85%, 02/01/2022 | 240,000 | 236,990 | ||||||
3.50%, 10/01/2023 | 328,000 | 342,500 | ||||||
5.95%, 02/01/2038 | 67,000 | 86,561 | ||||||
6.05%, 03/15/2039 | 253,000 | 333,847 | ||||||
3.90%, 12/01/2041 | 392,000 | 394,291 | ||||||
Southern Co. Gas Capital Corp. | ||||||||
3.50%, 09/15/2021 | 530,000 | 547,200 | ||||||
2.45%, 10/01/2023 | 230,000 | 223,096 | ||||||
3.25%, 06/15/2026 | 225,000 | 220,821 | ||||||
5.88%, 03/15/2041 | 1,210,000 | 1,465,646 | ||||||
4.40%, 06/01/2043 | 160,000 | 162,882 | ||||||
3.95%, 10/01/2046 | 282,000 | 269,581 | ||||||
Southern Co./The | ||||||||
2.15%, 09/01/2019 | 555,000 | 555,272 | ||||||
2.35%, 07/01/2021 | 5,599,000 | 5,557,674 | ||||||
Southern Power Co. | ||||||||
4.15%, 12/01/2025 | 218,000 | 227,678 | ||||||
5.15%, 09/15/2041 | 746,000 | 786,418 | ||||||
Southwest Gas Corp. | ||||||||
| Principal Amount | Value | |||||||
3.80%, 09/29/2046 | 508,000 | 490,810 | ||||||
Southwestern Electric Power Co. | ||||||||
6.45%, 01/15/2019 | 320,000 | 340,649 | ||||||
Southwestern Public Service Co. | ||||||||
8.75%, 12/01/2018 | 351,000 | 383,886 | ||||||
4.50%, 08/15/2041 | 350,000 | 386,294 | ||||||
State Grid Overseas Investment 2013 Ltd. | ||||||||
1.75%, 05/22/2018 (Acquired 10/28/2013, Cost $240,264) (1) | 241,000 | 240,299 | ||||||
State Grid Overseas Investment 2014 Ltd. | ||||||||
2.75%, 05/07/2019 (Acquired 04/28/2014 through 05/22/2014, Cost $4,233,219) (1) | 4,240,000 | 4,279,172 | ||||||
Talent Yield Investments Ltd. | ||||||||
4.50%, 04/25/2022 (Acquired 10/28/2013 through 02/27/2014, Cost $713,240) (1) | 715,000 | 758,335 | ||||||
Toledo Edison Co./The | ||||||||
6.15%, 05/15/2037 | 680,000 | 845,280 | ||||||
Tri-State Generation & Transmission Association, Inc. | ||||||||
4.25%, 06/01/2046 | 371,000 | 366,109 | ||||||
Union Electric Co. | ||||||||
2.95%, 06/15/2027 | 715,000 | 707,711 | ||||||
3.65%, 04/15/2045 | 1,370,000 | 1,352,524 | ||||||
Virginia Electric & Power Co. | ||||||||
5.40%, 04/30/2018 | 558,000 | 575,066 | ||||||
2.95%, 01/15/2022 | 80,000 | 81,657 | ||||||
3.45%, 02/15/2024 | 191,000 | 197,103 | ||||||
3.50%, 03/15/2027 | 4,955,000 | 5,095,504 | ||||||
4.65%, 08/15/2043 | 3,500,000 | 3,952,781 | ||||||
4.45%, 02/15/2044 | 126,000 | 137,849 | ||||||
4.00%, 11/15/2046 | 2,119,000 | 2,188,185 | ||||||
WEC Energy Group, Inc. | ||||||||
1.65%, 06/15/2018 | 4,043,000 | 4,045,414 | ||||||
3.55%, 06/15/2025 | 865,000 | 892,056 | ||||||
Westar Energy, Inc. | ||||||||
4.13%, 03/01/2042 | 4,175,000 | 4,386,192 | ||||||
Wisconsin Electric Power Co. | ||||||||
2.95%, 09/15/2021 | 27,000 | 27,707 | ||||||
3.10%, 06/01/2025 | 285,000 | 285,768 | ||||||
Xcel Energy, Inc. | ||||||||
4.70%, 05/15/2020 | 62,000 | 65,630 | ||||||
2.40%, 03/15/2021 | 250,000 | 250,611 | ||||||
2.60%, 03/15/2022 | 2,869,000 | �� | 2,884,329 | |||||
3.35%, 12/01/2026 | 5,105,000 | 5,152,747 | ||||||
6.50%, 07/01/2036 | 351,000 | 462,174 | ||||||
4.80%, 09/15/2041 | 95,000 | 101,572 | ||||||
|
| |||||||
| 312,983,779 | ||||||||
|
| |||||||
Total Corporate Bonds (Cost $4,074,166,896) | $ | 4,171,573,939 | ||||||
|
| |||||||
Government Related - 23.47% | ||||||||
African Development Bank | ||||||||
8.80%, 09/01/2019 | 2,720,000 | $ | 3,095,431 | |||||
Alabama Economic Settlement Authority | ||||||||
4.26%, 09/15/2032 | 610,000 | 639,866 | ||||||
American Municipal Power, Inc. | ||||||||
7.50%, 02/15/2050 | 1,350,000 | 1,901,488 | ||||||
Atlanta Independent School System | ||||||||
5.56%, 03/01/2026 | 535,000 | 625,115 | ||||||
Bay Area Toll Authority | ||||||||
6.26%, 04/01/2049 | 1,650,000 | 2,348,461 | ||||||
Caisse d’Amortissement de la Dette Sociale | ||||||||
2.00%, 03/22/2021 (Acquired 03/15/2016, Cost $2,937,804) (1) | 2,940,000 | 2,937,195 | ||||||
California Educational Facilities Authority | ||||||||
5.00%, 06/01/2046 | 1,750,000 | 2,337,072 | ||||||
California Qualified School Bond Joint Powers Authority | ||||||||
7.16%, 03/01/2027 | 805,000 | 932,649 | ||||||
California School Finance Authority | ||||||||
5.04%, 07/01/2020 | 270,000 | 287,545 | ||||||
Central Puget Sound Regional Transit Authority | ||||||||
5.00%, 11/01/2046 | 2,250,000 | 2,985,525 | ||||||
Chile Government International Bond | ||||||||
3.86%, 06/21/2047 | 4,841,000 | 4,853,102 | ||||||
City of Houston TX Combined Utility System Revenue | ||||||||
3.83%, 05/15/2028 | 1,850,000 | 1,958,151 | ||||||
City of Los Angeles Department of Airports | ||||||||
| Principal Amount | Value | |||||||
6.58%, 05/15/2039 | 1,650,000 | 2,153,712 | ||||||
Clark County School District | ||||||||
5.51%, 06/15/2024 | 3,000,000 | 3,318,630 | ||||||
Colombia Government International Bond | ||||||||
4.38%, 07/12/2021 | 1,000,000 | 1,064,000 | ||||||
4.00%, 02/26/2024 | 737,000 | 765,006 | ||||||
4.50%, 01/28/2026 | 1,192,000 | 1,269,480 | ||||||
7.38%, 09/18/2037 | 150,000 | 192,900 | ||||||
5.63%, 02/26/2044 | 200,000 | 218,600 | ||||||
5.00%, 06/15/2045 | 3,991,000 | 4,014,946 | ||||||
Corp. Andina de Fomento | ||||||||
2.00%, 05/10/2019 | 3,215,000 | 3,224,117 | ||||||
2.13%, 09/27/2021 | 6,840,000 | 6,800,191 | ||||||
4.38%, 06/15/2022 | 2,735,000 | 2,957,410 | ||||||
County of Cuyahoga OH | ||||||||
9.13%, 10/01/2023 | 105,000 | 125,035 | ||||||
Curators University Missouri System Facilities | ||||||||
5.96%, 11/01/2039 | 3,445,000 | 4,322,993 | ||||||
District of Columbia Water & Sewer Authority | ||||||||
5.52%, 10/01/2044 | 2,900,000 | 3,595,275 | ||||||
4.81%, 10/01/2114 | 875,000 | 927,535 | ||||||
Eaton Community City School District | ||||||||
5.39%, 08/25/2027 | 275,000 | 285,425 | ||||||
Elgin Local School District | ||||||||
5.50%, 08/31/2027 | 535,000 | 554,255 | ||||||
Export-Import Bank of Korea | ||||||||
2.25%, 01/21/2020 | 1,800,000 | 1,796,818 | ||||||
Fannie Mae Principal Strip | ||||||||
0.00%, 05/15/2030 PO | 929,000 | 621,095 | ||||||
Federal Farm Credit Banks | ||||||||
5.13%, 11/15/2018 | 344,000 | 361,442 | ||||||
Federal Home Loan Banks | ||||||||
4.00%, 10/24/2029 | 2,000,000 | 2,210,214 | ||||||
5.50%, 07/15/2036 | 1,135,000 | 1,540,958 | ||||||
Federal Home Loan Mortgage Co. | ||||||||
1.50%, 01/17/2020 | 4,305,000 | 4,297,936 | ||||||
2.38%, 01/13/2022 | 6,869,000 | 7,012,672 | ||||||
6.25%, 07/15/2032 | 2,596,000 | 3,693,791 | ||||||
Federal National Mortgage Association | ||||||||
0.00%, 10/09/2019 | 730,000 | 700,304 | ||||||
2.63%, 09/06/2024 | 3,714,000 | 3,810,776 | ||||||
1.88%, 09/24/2026 | 845,000 | 801,335 | ||||||
6.25%, 05/15/2029 | 1,285,000 | 1,743,903 | ||||||
7.13%, 01/15/2030 | 1,500,000 | 2,189,835 | ||||||
Financing Co. | ||||||||
0.00%, 11/30/2017 PO | 404,000 | 401,929 | ||||||
0.00%, 04/06/2018 PO | 194,000 | 192,022 | ||||||
0.00%, 05/11/2018 PO | 6,860,000 | 6,774,998 | ||||||
0.00%, 03/07/2019 PO | 205,000 | 199,643 | ||||||
Finnvera OYJ | ||||||||
2.38%, 06/04/2025 (Acquired 09/01/2016, Cost $615,996) (1) | 600,000 | 583,092 | ||||||
Government Trust Certificate | ||||||||
0.00%, 04/01/2019 | 1,375,000 | 1,332,396 | ||||||
Hashemite Kingdom of Jordan Government AID Bond | ||||||||
3.00%, 06/30/2025 | 2,695,000 | 2,818,458 | ||||||
Health & Educational Facilities Authority of the State of Missouri | ||||||||
3.65%, 08/15/2057 | 2,430,000 | 2,396,831 | ||||||
Hungary Government International Bond | ||||||||
6.38%, 03/29/2021 | 1,600,000 | 1,799,200 | ||||||
7.63%, 03/29/2041 | 2,850,000 | 4,246,500 | ||||||
Indonesia Government International Bond | ||||||||
5.88%, 01/15/2024 (Acquired 03/20/2015, Cost $1,463,253) (1) | 1,300,000 | 1,481,782 | ||||||
4.13%, 01/15/2025 (Acquired 01/08/2015, Cost $1,318,639) (1) | 1,325,000 | 1,366,182 | ||||||
Iowa Tobacco Settlement Authority | ||||||||
6.50%, 06/01/2023 | 730,000 | 730,102 | ||||||
Iraq Government AID Bond | ||||||||
2.15%, 01/18/2022 | 3,200,000 | 3,197,274 | ||||||
Israel Government AID Bond | ||||||||
0.00%, 11/01/2019 IO | 345,000 | 331,643 | ||||||
0.00%, 08/15/2022 | 3,701,000 | 3,320,996 | ||||||
| Principal Amount | Value | |||||||
0.00%, 09/15/2023 | 1,837,000 | 1,597,621 | ||||||
5.50%, 09/18/2023 | 8,856,000 | 10,541,155 | ||||||
0.00%, 11/01/2023 IO | 413,000 | 358,068 | ||||||
5.50%, 04/26/2024 | 4,424,000 | 5,280,000 | ||||||
0.00%, 05/15/2024 | 3,640,000 | 3,071,217 | ||||||
0.00%, 08/15/2024 | 1,500,000 | 1,257,520 | ||||||
0.00%, 11/01/2024 | 1,000,000 | 827,365 | ||||||
0.00%, 11/01/2024 PO | 10,349,000 | 8,562,369 | ||||||
0.00%, 11/15/2024 | 2,299,000 | 1,898,666 | ||||||
0.00%, 08/15/2025 | 2,500,000 | 2,018,585 | ||||||
0.00%, 11/15/2026 | 258,000 | 198,770 | ||||||
5.50%, 09/18/2033 | 619,000 | 827,649 | ||||||
Japan Bank for International Cooperation/Japan | ||||||||
2.25%, 02/24/2020 | 2,200,000 | 2,209,361 | ||||||
2.13%, 06/01/2020 | 4,400,000 | 4,399,982 | ||||||
1.50%, 07/21/2021 | 4,000,000 | 3,867,464 | ||||||
Japan Finance Organization for Municipalities | ||||||||
2.13%, 04/13/2021 (Acquired 04/06/2016, Cost $1,597,302) (1) | 1,600,000 | 1,576,224 | ||||||
2.63%, 04/20/2022 (Acquired 04/12/2017, Cost $5,989,773) (1) | 6,000,000 | 6,007,416 | ||||||
2.13%, 10/25/2023 (Acquired 10/18/2016, Cost $3,378,272) (1) | 3,400,000 | 3,290,098 | ||||||
Kuwait International Government Bond | ||||||||
2.75%, 03/20/2022 (Acquired 03/13/2017 through 03/24/2017, Cost $2,630,440) (1) | 2,646,000 | 2,655,261 | ||||||
Lithuania Government International Bond | ||||||||
7.38%, 02/11/2020 (Acquired 08/12/2014, Cost $1,100,159) (1) | 995,000 | 1,126,340 | ||||||
Los Angeles Department of Power | ||||||||
6.60%, 07/01/2050 | 2,400,000 | 3,578,040 | ||||||
Mexico Government International Bond | ||||||||
3.63%, 03/15/2022 | 1,786,000 | 1,852,082 | ||||||
4.00%, 10/02/2023 | 2,418,000 | 2,528,140 | ||||||
3.60%, 01/30/2025 | 868,000 | 878,416 | ||||||
4.13%, 01/21/2026 | 1,429,000 | 1,485,446 | ||||||
4.75%, 03/08/2044 | 3,880,000 | 3,883,880 | ||||||
5.55%, 01/21/2045 | 1,494,000 | 1,673,280 | ||||||
4.35%, 01/15/2047 | 5,337,000 | 5,012,510 | ||||||
5.75%, 10/12/2110 | 588,000 | 610,050 | ||||||
New Hampshire Housing Finance Authority | ||||||||
3.05%, 01/01/2021 | 95,000 | 95,390 | ||||||
3.75%, 07/01/2034 | 200,000 | 203,506 | ||||||
New Jersey Transportation Trust Fund Authority | ||||||||
5.75%, 12/15/2028 | 6,395,000 | 6,790,403 | ||||||
New Jersey Turnpike Authority | ||||||||
7.10%, 01/01/2041 | 5,870,000 | 8,614,577 | ||||||
New York State Dormitory Authority | ||||||||
5.60%, 03/15/2040 | 260,000 | 325,601 | ||||||
New York State Urban Development | ||||||||
5.84%, 03/15/2040 | 2,000,000 | 2,511,980 | ||||||
North American Development Bank | ||||||||
4.38%, 02/11/2020 | 2,500,000 | 2,642,208 | ||||||
2.40%, 10/26/2022 | 2,595,000 | 2,538,159 | ||||||
North Carolina Housing Finance Agency | ||||||||
3.00%, 01/01/2033 | 4,240,000 | 4,235,718 | ||||||
Ohio State University/The | ||||||||
4.05%, 12/01/2056 | 406,000 | 410,015 | ||||||
4.80%, 06/01/2111 | 1,102,000 | 1,137,672 | ||||||
Panama Government International Bond | ||||||||
4.00%, 09/22/2024 | 3,133,000 | 3,289,650 | ||||||
3.75%, 03/16/2025 | 1,234,000 | 1,271,020 | ||||||
4.50%, 05/15/2047 | 3,042,000 | 3,080,025 | ||||||
Peruvian Government International Bond | ||||||||
5.63%, 11/18/2050 | 190,000 | 230,185 | ||||||
Poland Government International Bond | ||||||||
4.00%, 01/22/2024 | 1,040,000 | 1,112,284 | ||||||
Port Authority of New York & New Jersey | ||||||||
5.65%, 11/01/2040 | 1,260,000 | 1,589,591 | ||||||
5.65%, 11/01/2040 | 435,000 | 548,787 | ||||||
4.46%, 10/01/2062 | 2,065,000 | 2,259,812 | ||||||
Province of Manitoba Canada | ||||||||
2.13%, 05/04/2022 | 2,520,000 | 2,508,637 | ||||||
2.13%, 06/22/2026 | 400,000 | 379,541 | ||||||
Province of Ontario Canada | ||||||||
| Principal Amount | Value | |||||||
4.40%, 04/14/2020 | 975,000 | 1,039,768 | ||||||
2.40%, 02/08/2022 | 975,000 | 982,416 | ||||||
2.25%, 05/18/2022 | 2,320,000 | 2,318,429 | ||||||
Province of Quebec Canada | ||||||||
7.37%, 03/06/2026 | 58,000 | 76,621 | ||||||
2.75%, 04/12/2027 | 8,490,000 | 8,453,561 | ||||||
Republic of South Africa Government International Bond | ||||||||
5.88%, 09/16/2025 | 403,000 | 433,320 | ||||||
Residual Funding Co. Principal Strip | ||||||||
0.00%, 10/15/2019 PO | 1,377,000 | 1,326,936 | ||||||
0.00%, 07/15/2020 PO | 25,916,000 | 24,564,196 | ||||||
0.00%, 10/15/2020 PO | 8,372,000 | 7,887,529 | ||||||
0.00%, 01/15/2021 PO | 5,455,000 | 5,099,558 | ||||||
0.00%, 01/15/2030 | 3,380,000 | 2,326,491 | ||||||
0.00%, 04/15/2030 | 1,085,000 | 740,873 | ||||||
Resolution Funding Corp. Interest Strip | ||||||||
0.00%, 10/15/2025 | 1,295,000 | 1,049,019 | ||||||
0.00%, 01/15/2026 | 1,460,000 | 1,171,708 | ||||||
Rhode Island Housing & Mortgage Finance Co./RI | ||||||||
4.00%, 10/01/2023 | 4,000,000 | 4,133,160 | ||||||
Romanian Government International Bond | ||||||||
6.75%, 02/07/2022 | 250,000 | 290,010 | ||||||
San Dieguito Public Facilities Authority | ||||||||
6.46%, 05/01/2027 | 685,000 | 839,961 | ||||||
Saudi Government International Bond | ||||||||
2.38%, 10/26/2021 (Acquired 10/19/2016, Cost $3,023,613) (1) | 3,050,000 | 3,001,200 | ||||||
State of California | ||||||||
2.37%, 04/01/2022 | 1,790,000 | 1,798,162 | ||||||
7.50%, 04/01/2034 | 5,540,000 | 8,064,080 | ||||||
7.30%, 10/01/2039 | 3,900,000 | 5,697,159 | ||||||
State Public School Building Authority | ||||||||
5.00%, 09/15/2027 | 1,536,000 | 1,682,074 | ||||||
Svensk Exportkredit AB | ||||||||
1.75%, 03/10/2021 | 7,180,000 | 7,137,013 | ||||||
Tennessee Valley Authority | ||||||||
2.88%, 02/01/2027 | 1,030,000 | 1,054,263 | ||||||
7.13%, 05/01/2030 | 1,615,000 | 2,339,933 | ||||||
5.88%, 04/01/2036 | 882,000 | 1,210,190 | ||||||
5.50%, 06/15/2038 | 57,000 | 76,517 | ||||||
5.25%, 09/15/2039 | 949,000 | 1,247,028 | ||||||
3.50%, 12/15/2042 | 2,874,000 | 2,996,027 | ||||||
4.63%, 09/15/2060 | 303,000 | 366,746 | ||||||
4.25%, 09/15/2065 | 5,823,000 | 6,563,319 | ||||||
Tennessee Valley Authority Generic Strip | ||||||||
0.00%, 05/01/2019 IO | 1,238,000 | 1,199,461 | ||||||
0.00%, 07/15/2028 IO | 2,000,000 | 1,417,980 | ||||||
0.00%, 03/15/2032 | 1,514,000 | 909,940 | ||||||
Tennessee Valley Authority Principal Strip | ||||||||
0.00%, 12/15/2017 PO | 427,000 | 424,591 | ||||||
0.00%, 11/01/2025 PO | 1,847,000 | 1,457,839 | ||||||
0.00%, 06/15/2035 PO | 258,000 | 136,910 | ||||||
Three Rivers Local School District | ||||||||
5.21%, 09/15/2027 | 285,000 | 295,901 | ||||||
Tokyo Metropolitan Government | ||||||||
2.00%, 05/17/2021 (Acquired 05/10/2016, Cost $2,393,675) (1) | 2,400,000 | 2,359,092 | ||||||
2.50%, 06/08/2022 (Acquired 06/01/2017, Cost $4,999,061) (1) | 5,000,000 | 5,009,845 | ||||||
Turkey Government International Bond | ||||||||
7.00%, 06/05/2020 | 3,910,000 | 4,275,311 | ||||||
U.S. Treasury Inflation Indexed Bonds | ||||||||
0.13%, 04/15/2019 (2) | 939,195 | 939,698 | ||||||
1.38%, 01/15/2020 (2) | 335,839 | 348,112 | ||||||
0.13%, 01/15/2022 (2) | 2,400,560 | 2,396,717 | ||||||
0.13%, 04/15/2022 (2) | 10,974,596 | 10,919,964 | ||||||
2.38%, 01/15/2025 (2) | 778,338 | 886,517 | ||||||
3.63%, 04/15/2028 (2) | 1,576,839 | 2,059,362 | ||||||
2.50%, 01/15/2029 (2) | 470,370 | 565,380 | ||||||
U.S. Treasury Note/Bond | ||||||||
0.88%, 10/15/2017 | 7,960,000 | 7,955,105 | ||||||
4.25%, 11/15/2017 | 3,353,000 | 3,391,264 | ||||||
2.25%, 11/30/2017 | 206,000 | 206,939 | ||||||
| Principal Amount | Value | |||||||
2.75%, 12/31/2017 | 1,459,000 | 1,470,344 | ||||||
0.88%, 01/31/2018 | 245,000 | 244,571 | ||||||
2.63%, 01/31/2018 | 2,683,000 | 2,705,229 | ||||||
3.50%, 02/15/2018 | 6,993,000 | 7,090,790 | ||||||
1.50%, 08/31/2018 | 5,061,000 | 5,070,489 | ||||||
1.00%, 09/15/2018 | 420,000 | 418,458 | ||||||
0.75%, 10/31/2018 | 85,000 | 84,346 | ||||||
1.25%, 10/31/2018 | 1,930,000 | 1,927,738 | ||||||
1.25%, 12/31/2018 | 110,000 | 109,824 | ||||||
1.38%, 12/31/2018 | 722,000 | 722,282 | ||||||
1.50%, 01/31/2019 | 1,050,000 | 1,052,174 | ||||||
0.75%, 02/15/2019 | 5,000,000 | 4,951,760 | ||||||
1.25%, 04/30/2019 | 10,658,000 | 10,632,186 | ||||||
3.13%, 05/15/2019 | 10,774,000 | 11,121,214 | ||||||
1.25%, 05/31/2019 | 27,740,000 | 27,673,896 | ||||||
1.50%, 05/31/2019 | 1,360,000 | 1,363,029 | ||||||
1.25%, 06/30/2019 | 50,673,000 | 50,536,436 | ||||||
1.00%, 11/30/2019 | 2,392,000 | 2,366,678 | ||||||
8.50%, 02/15/2020 | 4,750,000 | 5,607,413 | ||||||
1.50%, 05/15/2020 | 34,255,000 | 34,214,853 | ||||||
3.50%, 05/15/2020 | 1,300,000 | 1,371,399 | ||||||
8.75%, 05/15/2020 | 2,000,000 | 2,404,844 | ||||||
1.50%, 06/15/2020 | 2,804,000 | 2,799,839 | ||||||
1.63%, 06/30/2020 | 1,500,000 | 1,502,520 | ||||||
2.63%, 08/15/2020 | 3,709,000 | 3,825,051 | ||||||
8.75%, 08/15/2020 | 6,304,000 | 7,675,120 | ||||||
1.38%, 08/31/2020 | 10,000,000 | 9,928,910 | ||||||
2.13%, 08/31/2020 | 4,132,000 | 4,198,017 | ||||||
2.63%, 11/15/2020 | 4,596,000 | 4,743,035 | ||||||
1.63%, 11/30/2020 | 23,776,000 | 23,759,285 | ||||||
2.00%, 11/30/2020 | 1,000,000 | 1,011,641 | ||||||
1.75%, 12/31/2020 | 2,523,000 | 2,529,996 | ||||||
1.38%, 01/31/2021 | 15,000,000 | 14,841,795 | ||||||
3.63%, 02/15/2021 | 1,961,000 | 2,094,364 | ||||||
7.88%, 02/15/2021 | 900,000 | 1,094,414 | ||||||
1.13%, 02/28/2021 | 7,772,000 | 7,613,824 | ||||||
1.25%, 03/31/2021 | 1,996,000 | 1,962,785 | ||||||
1.38%, 04/30/2021 | 93,575,000 | 92,379,767 | ||||||
2.25%, 04/30/2021 | 1,800,000 | 1,834,945 | ||||||
3.13%, 05/15/2021 | 4,592,000 | 4,831,105 | ||||||
8.13%, 05/15/2021 | 1,718,000 | 2,127,166 | ||||||
2.13%, 06/30/2021 | 51,510,000 | 52,248,447 | ||||||
1.13%, 07/31/2021 | 5,374,000 | 5,237,549 | ||||||
2.25%, 07/31/2021 | 50,000,000 | 50,949,200 | ||||||
2.13%, 08/15/2021 | 2,805,000 | 2,844,225 | ||||||
8.13%, 08/15/2021 | 1,850,000 | 2,315,390 | ||||||
1.13%, 09/30/2021 | 11,010,000 | 10,708,084 | ||||||
2.13%, 09/30/2021 | 116,865,000 | 118,449,105 | ||||||
1.25%, 10/31/2021 | 1,192,000 | 1,164,156 | ||||||
2.00%, 10/31/2021 | 15,000,000 | 15,118,950 | ||||||
8.00%, 11/15/2021 | 4,414,000 | 5,560,607 | ||||||
1.88%, 11/30/2021 | 10,000 | 10,025 | ||||||
2.00%, 12/31/2021 | 51,000,000 | 51,366,588 | ||||||
1.50%, 01/31/2022 | 1,250,000 | 1,231,006 | ||||||
1.88%, 01/31/2022 | 51,000,000 | 51,059,772 | ||||||
1.75%, 03/31/2022 | 64,525,000 | 64,194,826 | ||||||
1.88%, 03/31/2022 | 63,286,000 | 63,320,617 | ||||||
1.88%, 04/30/2022 | 28,171,000 | 28,163,309 | ||||||
1.75%, 05/15/2022 | 2,000,000 | 1,988,828 | ||||||
1.75%, 05/31/2022 | 16,422,000 | 16,323,846 | ||||||
1.75%, 06/30/2022 | 7,956,000 | 7,903,793 | ||||||
2.13%, 06/30/2022 | 2,000,000 | 2,021,484 | ||||||
2.00%, 07/31/2022 | 8,500,000 | 8,536,856 | ||||||
2.13%, 12/31/2022 | 20,000,000 | 20,157,820 | ||||||
2.00%, 02/15/2023 | 500,000 | 500,156 | ||||||
1.63%, 04/30/2023 | 78,315,000 | 76,611,022 | ||||||
1.75%, 05/15/2023 | 79,000,000 | 77,808,838 | ||||||
2.50%, 08/15/2023 | 1,000,000 | 1,026,133 | ||||||
2.75%, 02/15/2024 | 1,000,000 | 1,040,078 | ||||||
2.00%, 04/30/2024 | 18,370,000 | 18,227,210 | ||||||
| Principal Amount | Value | |||||||
2.50%, 05/15/2024 | 63,300,000 | 64,838,000 | ||||||
2.00%, 05/31/2024 | 13,182,000 | 13,072,326 | ||||||
2.38%, 08/15/2024 | 20,000,000 | 20,300,000 | ||||||
2.25%, 11/15/2024 | 20,000,000 | 20,106,240 | ||||||
2.13%, 05/15/2025 | 69,875,000 | 69,427,381 | ||||||
2.25%, 11/15/2025 | 122,335,000 | 122,349,313 | ||||||
1.63%, 05/15/2026 | 24,145,000 | 22,889,653 | ||||||
1.50%, 08/15/2026 | 12,739,000 | 11,917,933 | ||||||
2.00%, 11/15/2026 | 27,627,000 | 26,941,712 | ||||||
2.38%, 05/15/2027 | 10,991,000 | 11,061,837 | ||||||
5.50%, 08/15/2028 | 1,312,000 | 1,715,953 | ||||||
5.25%, 11/15/2028 | 19,540,500 | 25,163,728 | ||||||
4.75%, 02/15/2037 | 36,425,000 | 48,580,423 | ||||||
5.00%, 05/15/2037 | 8,604,000 | 11,818,403 | ||||||
4.38%, 02/15/2038 | 10,000,000 | 12,755,470 | ||||||
3.50%, 02/15/2039 | 98,799,100 | 111,762,629 | ||||||
4.25%, 05/15/2039 | 6,800,000 | 8,528,424 | ||||||
4.50%, 08/15/2039 | 4,706,000 | 6,103,094 | ||||||
4.38%, 11/15/2039 | 7,900,000 | 10,079,594 | ||||||
4.63%, 02/15/2040 | 3,000,000 | 3,959,883 | ||||||
4.38%, 05/15/2040 | 7,600,000 | 9,709,889 | ||||||
3.88%, 08/15/2040 | 4,380,000 | 5,217,846 | ||||||
4.25%, 11/15/2040 | 25,610,000 | 32,213,590 | ||||||
4.75%, 02/15/2041 | 11,815,000 | 15,924,871 | ||||||
4.38%, 05/15/2041 | 1,500,000 | 1,925,038 | ||||||
2.75%, 11/15/2042 | 1,200,000 | 1,187,344 | ||||||
3.13%, 02/15/2043 | 7,500,000 | 7,932,128 | ||||||
2.88%, 05/15/2043 (4) | 137,150,000 | 138,639,312 | ||||||
3.63%, 08/15/2043 | 3,800,000 | 4,376,977 | ||||||
3.00%, 11/15/2044 | 1,425,000 | 1,472,705 | ||||||
3.00%, 05/15/2045 | 37,295,000 | 38,489,596 | ||||||
2.88%, 08/15/2045 | 21,053,000 | 21,203,487 | ||||||
3.00%, 11/15/2045 | 11,563,000 | 11,929,316 | ||||||
2.50%, 02/15/2046 | 3,455,000 | 3,221,383 | ||||||
2.50%, 05/15/2046 | 8,090,000 | 7,539,815 | ||||||
2.88%, 11/15/2046 | 17,550,000 | 17,676,834 | ||||||
3.00%, 02/15/2047 | 50,810,000 | 52,504,971 | ||||||
U.S. Treasury Strip Coupon | ||||||||
0.00%, 11/15/2017 | 4,029,000 | 4,012,074 | ||||||
0.00%, 02/15/2018 | 3,658,000 | 3,631,688 | ||||||
0.00%, 08/15/2018 | 10,000,000 | 9,853,720 | ||||||
0.00%, 11/15/2018 | 500,000 | 491,052 | ||||||
0.00%, 05/15/2019 | 20,278,000 | 19,748,886 | ||||||
0.00%, 08/15/2019 | 15,757,000 | 15,284,684 | ||||||
0.00%, 11/15/2019 | 7,500,000 | 7,239,885 | ||||||
0.00%, 02/15/2020 | 9,378,000 | 9,017,772 | ||||||
0.00%, 05/15/2020 | 39,615,000 | 37,892,896 | ||||||
0.00%, 08/15/2020 | 28,543,000 | 27,143,679 | ||||||
0.00%, 02/15/2021 | 14,550,000 | 13,658,929 | ||||||
0.00%, 05/15/2021 | 14,843,000 | 13,850,122 | ||||||
0.00%, 08/15/2021 | 9,469,000 | 8,785,045 | ||||||
0.00%, 11/15/2021 | 11,144,000 | 10,270,589 | ||||||
0.00%, 02/15/2022 | 33,917,000 | 31,043,348 | ||||||
0.00%, 05/15/2022 | 18,154,000 | 16,501,859 | ||||||
0.00%, 08/15/2022 | 12,500,000 | 11,284,925 | ||||||
0.00%, 11/15/2022 | 17,400,000 | 15,604,216 | ||||||
0.00%, 02/15/2023 | 61,562,000 | 54,829,888 | ||||||
0.00%, 05/15/2023 | 33,770,000 | 29,868,045 | ||||||
0.00%, 08/15/2023 | 19,635,000 | 17,255,159 | ||||||
0.00%, 11/15/2023 | 9,300,000 | 8,113,822 | ||||||
0.00%, 02/15/2024 | 6,124,000 | 5,300,634 | ||||||
0.00%, 05/15/2024 | 1,322,000 | 1,136,982 | ||||||
0.00%, 08/15/2024 | 1,834,000 | 1,565,156 | ||||||
0.00%, 11/15/2024 | 6,105,000 | 5,178,829 | ||||||
0.00%, 02/15/2025 | 799,000 | 672,468 | ||||||
0.00%, 05/15/2025 | 3,279,000 | 2,739,188 | ||||||
0.00%, 08/15/2025 | 1,360,000 | 1,128,538 | ||||||
0.00%, 02/15/2026 | 1,000,000 | 816,201 | ||||||
0.00%, 05/15/2026 | 3,801,000 | 3,080,167 | ||||||
0.00%, 08/15/2026 | 1,681,000 | 1,352,238 | ||||||
| Principal Amount | Value | |||||||
0.00%, 11/15/2026 | 10,222,000 | 8,161,500 | ||||||
0.00%, 02/15/2027 | 20,416,000 | 16,170,922 | ||||||
0.00%, 05/15/2027 | 1,866,000 | 1,466,308 | ||||||
0.00%, 08/15/2027 | 4,314,000 | 3,367,892 | ||||||
0.00%, 11/15/2027 | 7,702,000 | 5,971,553 | ||||||
0.00%, 02/15/2028 | 7,769,000 | 5,974,144 | ||||||
0.00%, 05/15/2028 | 3,071,000 | 2,343,474 | ||||||
0.00%, 08/15/2028 | 6,918,000 | 5,246,224 | ||||||
0.00%, 11/15/2028 | 7,540,000 | 5,670,329 | ||||||
0.00%, 02/15/2029 | 7,537,000 | 5,624,773 | ||||||
0.00%, 05/15/2029 | 1,330,000 | 984,986 | ||||||
0.00%, 08/15/2029 | 4,738,000 | 3,483,122 | ||||||
0.00%, 11/15/2029 | 5,164,000 | 3,766,601 | ||||||
0.00%, 02/15/2030 | 15,187,000 | 10,976,009 | ||||||
0.00%, 05/15/2030 | 8,464,000 | 6,085,235 | ||||||
0.00%, 08/15/2030 | 13,772,000 | 9,805,292 | ||||||
0.00%, 11/15/2030 | 11,064,000 | 7,819,416 | ||||||
0.00%, 02/15/2031 | 29,298,000 | 20,574,960 | ||||||
0.00%, 05/15/2031 | 19,225,000 | 13,359,779 | ||||||
0.00%, 08/15/2031 | 11,262,000 | 7,768,989 | ||||||
0.00%, 11/15/2031 | 13,399,000 | 9,181,424 | ||||||
0.00%, 02/15/2032 | 20,909,000 | 14,206,683 | ||||||
0.00%, 05/15/2032 | 24,453,000 | 16,500,738 | ||||||
0.00%, 08/15/2032 | 10,925,000 | 7,311,392 | ||||||
0.00%, 11/15/2032 | 14,612,000 | 9,703,932 | ||||||
0.00%, 02/15/2033 | 10,000,000 | 6,584,700 | ||||||
0.00%, 05/15/2033 | 10,845,000 | 7,092,305 | ||||||
0.00%, 08/15/2033 | 4,212,000 | 2,732,847 | ||||||
0.00%, 11/15/2033 | 13,216,000 | 8,507,972 | ||||||
0.00%, 02/15/2034 | 17,759,000 | 11,334,380 | ||||||
0.00%, 05/15/2034 | 24,500,000 | 15,526,655 | ||||||
0.00%, 08/15/2034 | 6,895,000 | 4,331,549 | ||||||
0.00%, 11/15/2034 | 3,492,000 | 2,178,526 | ||||||
0.00%, 02/15/2035 | 1,824,000 | 1,126,212 | ||||||
0.00%, 05/15/2035 | 1,920,000 | 1,179,068 | ||||||
0.00%, 08/15/2035 | 175,000 | 106,530 | ||||||
0.00%, 05/15/2036 | 121,000 | 71,927 | ||||||
0.00%, 08/15/2041 | 1,225,000 | 607,062 | ||||||
U.S. Treasury Strip Principal | ||||||||
0.00%, 05/15/2044 | 16,765,000 | 7,712,521 | ||||||
0.00%, 05/15/2045 | 5,605,000 | 2,492,078 | ||||||
Ukraine Government AID Bonds | ||||||||
1.47%, 09/29/2021 | 1,800,000 | 1,759,937 | ||||||
University of Texas System/The | ||||||||
5.00%, 08/15/2047 | 3,825,000 | 5,068,661 | ||||||
Uruguay Government International Bond | ||||||||
5.10%, 06/18/2050 | 2,400,000 | 2,445,000 | ||||||
West Contra Costa Unified School District | ||||||||
6.25%, 08/01/2030 | 215,000 | 266,705 | ||||||
Westlake City School District | ||||||||
5.23%, 12/01/2026 | 430,000 | 438,045 | ||||||
|
| |||||||
Total Government Related (Cost $3,137,763,634) | $ | 3,190,575,759 | ||||||
|
| |||||||
Mortgage-Backed Obligations - 33.22% | ||||||||
A10 Securitization 2015-1 LLC | ||||||||
3.13%, 04/15/2034 (Acquired 04/24/2015, Cost $515,749) (1) | 515,752 | $ | 518,040 | |||||
A10 Term Asset Financing 2013-2 LLC | ||||||||
4.38%, 11/15/2027 (Acquired 10/30/2013, Cost $424,917) (1) | 425,000 | 424,017 | ||||||
A10 Term Asset Financing 2014-1 LLC | ||||||||
3.02%, 04/15/2033 (Acquired 06/04/2014, Cost $147,535) (1) | 147,549 | 147,438 | ||||||
Access Pt Fdg Trust 2016-1 | ||||||||
6.25%, 02/16/2021 (7)(8) | 1,638,900 | 1,640,199 | ||||||
AJAX Mortgage Loan Trust 2015-B | ||||||||
3.88%, 07/25/2060 (Acquired 06/24/2015, Cost $1,140,985) (1) | 1,143,064 | 1,141,700 | ||||||
Alternative Loan Trust 2002-11 | ||||||||
6.25%, 10/25/2032 | 2,706 | 2,753 | ||||||
Alternative Loan Trust 2002-12 | ||||||||
0.00%, 11/25/2032 PO | 10,485 | 8,237 | ||||||
Alternative Loan Trust 2003-22CB | ||||||||
6.00%, 12/25/2033 | 3,194,081 | 3,204,858 | ||||||
Alternative Loan Trust 2004-2CB | ||||||||
| Principal Amount | Value | |||||||
5.75%, 03/25/2034 | 860,912 | 858,195 | ||||||
Alternative Loan Trust 2004-8CB | ||||||||
1.49%, 06/25/2034 | 3,590,526 | 3,568,676 | ||||||
Alternative Loan Trust 2005-1CB | ||||||||
5.88%, 03/25/2035 IO | 247,685 | 47,812 | ||||||
Alternative Loan Trust 2005-20CB | ||||||||
3.53%, 07/25/2035 IO | 822,167 | 105,913 | ||||||
Alternative Loan Trust 2005-22T1 | ||||||||
3.85%, 06/25/2035 IO | 817,710 | 114,041 | ||||||
Alternative Loan Trust 2005-28CB | ||||||||
5.50%, 08/25/2035 | 345,843 | 318,935 | ||||||
6.00%, 08/25/2035 | 10,886 | 8,650 | ||||||
Alternative Loan Trust 2005-37T1 | ||||||||
3.83%, 09/25/2035 IO | 2,808,227 | 403,946 | ||||||
Alternative Loan Trust 2005-50CB | ||||||||
5.00%, 11/25/2020 | 36,884 | 36,884 | ||||||
Alternative Loan Trust 2005-54CB | ||||||||
3.63%, 11/25/2035 IO | 1,423,373 | 180,206 | ||||||
5.50%, 11/25/2035 | 360,288 | 337,334 | ||||||
5.50%, 11/25/2035 | 4,633 | 4,657 | ||||||
Alternative Loan Trust 2005-64CB | ||||||||
5.50%, 12/25/2035 | 145,844 | 143,186 | ||||||
Alternative Loan Trust 2005-J1 | ||||||||
3.88%, 02/25/2035 IO | 249,374 | 9,196 | ||||||
Alternative Loan Trust 2006-28CB | ||||||||
6.00%, 10/25/2036 | 90,364 | 77,337 | ||||||
Alternative Loan Trust 2006-43CB | ||||||||
6.00%, 02/25/2022 | 20,409 | 20,544 | ||||||
Alternative Loan Trust 2006-7CB | ||||||||
5.25%, 05/25/2021 | 106,040 | 103,463 | ||||||
Alternative Loan Trust 2006-J5 | ||||||||
4.49%, 07/25/2021 | 37,154 | 35,407 | ||||||
American General Mortgage Loan Trust 2006-1 | ||||||||
5.75%, 12/25/2035 (Acquired 10/28/2013, Cost $20,287) (1) | 19,919 | 20,507 | ||||||
Angel Oak Mortgage Trust LLC 2015-1 | ||||||||
4.50%, 11/25/2045 (Acquired 12/10/2015, Cost $525,958) (1) | 526,703 | 527,390 | ||||||
ASG Resecuritization Trust 2009-3 | ||||||||
2.76%, 03/26/2037 (Acquired 10/28/2013 through 06/01/2017, Cost $429,476) (1) | 429,050 | 429,045 | ||||||
ASG Resecuritization Trust 2010-2 | ||||||||
2.57%, 01/28/2037 (Acquired 10/28/2013, Cost $53,336) (1) | 53,928 | 53,945 | ||||||
ASG Resecuritization Trust 2011-1 | ||||||||
3.49%, 11/28/2035 (Acquired 10/28/2013, Cost $195,494) (1) | 197,599 | 196,411 | ||||||
6.00%, 09/28/2036 (Acquired 10/28/2013, Cost $392,389) (1) | 383,717 | 316,775 | ||||||
Assurant Commercial Mortgage Trust 2016-1 | ||||||||
3.17%, 05/15/2049 (Acquired 05/13/2016, Cost $9,347,429) (1) | 9,100,000 | 9,043,769 | ||||||
BAMLL Commercial Mortgage Securities Trust 2012-PARK | ||||||||
2.96%, 12/10/2030 (Acquired 10/28/2013 through 06/29/2017, Cost $5,395,508) (1) | 5,264,000 | 5,358,925 | ||||||
BAMLL Commercial Mortgage Securities Trust 2014-520M | ||||||||
4.35%, 08/15/2046 (Acquired 08/01/2014, Cost $1,154,934) (1) | 1,200,000 | 1,129,868 | ||||||
BAMLL Re-REMIC Trust 2014-FRR5 | ||||||||
0.00%, 06/27/2045 (Acquired 02/15/2017, Cost $4,349,146) (1) | 6,300,000 | 4,415,754 | ||||||
BAMLL Re-REMIC Trust 2015-FRR11 | ||||||||
1.84%, 09/27/2044 (Acquired 01/12/2017, Cost $3,774,231) (1) | 3,904,000 | 3,809,383 | ||||||
Banc of America Alternative Loan Trust 2004-11 | ||||||||
5.50%, 12/25/2019 | 5,566 | 5,619 | ||||||
Banc of America Alternative Loan Trust 2004-6 | ||||||||
0.00%, 07/25/2019 PO | 6,835 | 6,505 | ||||||
Banc of America Alternative Loan Trust 2005-10 | ||||||||
5.25%, 11/25/2020 | 16,792 | 16,882 | ||||||
Banc of America Alternative Loan Trust 2005-11 | ||||||||
5.50%, 12/25/2035 | 17,309 | 16,539 | ||||||
Banc of America Alternative Loan Trust 2005-2 | ||||||||
5.50%, 03/25/2020 | 9,148 | 9,145 | ||||||
5.50%, 03/25/2035 | 10,437 | 10,342 | ||||||
Banc of America Alternative Loan Trust 2005-4 | ||||||||
5.50%, 05/25/2020 | 52,545 | 51,992 | ||||||
Banc of America Alternative Loan Trust 2005-5 | ||||||||
5.50%, 06/25/2035 | 57,974 | 54,063 | ||||||
Banc of America Alternative Loan Trust 2005-9 | ||||||||
5.50%, 10/25/2035 | 24,272 | 23,992 | ||||||
| Principal Amount | Value | |||||||
Banc of America Alternative Loan Trust 2006-5 | ||||||||
6.00%, 06/25/2046 | 54,806 | 47,922 | ||||||
Banc of America Alternative Loan Trust 2007-1 | ||||||||
5.82%, 04/25/2022 | 59,198 | 57,205 | ||||||
Banc of America Commercial Mortgage Trust 2006-5 | ||||||||
0.79%, 09/10/2047 IO (Acquired 10/28/2013, Cost $245,524) (1) | 1,179,927 | 917 | ||||||
Banc of America Commercial Mortgage Trust 2007-5 | ||||||||
5.36%, 02/10/2051 | 3,333,563 | 3,349,244 | ||||||
5.49%, 02/10/2051 | 815,526 | 816,619 | ||||||
Banc of America Funding 2004-1 Trust | ||||||||
0.00%, 03/25/2034 PO | 40,172 | 33,047 | ||||||
Banc of America Funding 2004-2 Trust | ||||||||
5.75%, 09/20/2034 | 3,166,806 | 3,373,795 | ||||||
Banc of America Funding 2004-C Trust | ||||||||
3.23%, 12/20/2034 | 82,674 | 81,878 | ||||||
Banc of America Funding 2005-6 Trust | ||||||||
5.50%, 10/25/2035 | 49,645 | 47,935 | ||||||
Banc of America Funding 2005-7 Trust | ||||||||
0.00%, 11/25/2035 PO | 34,928 | 27,591 | ||||||
Banc of America Funding 2005-8 Trust | ||||||||
0.00%, 01/25/2036 PO | 13,987 | 10,600 | ||||||
Banc of America Funding 2005-C Trust | ||||||||
1.45%, 05/20/2035 | 4,568,770 | 4,304,191 | ||||||
Banc of America Funding 2005-E Trust | ||||||||
3.15%, 03/20/2035 | 87,337 | 88,159 | ||||||
Banc of America Funding 2006-1 Trust | ||||||||
0.00%, 01/25/2036 PO | 23,818 | 18,922 | ||||||
Banc of America Funding 2010-R11 Trust | ||||||||
4.95%, 08/26/2035 (Acquired 10/28/2013, Cost $29,379) (1) | 29,134 | 29,071 | ||||||
Banc of America Merrill Lynch Commercial Mortgage, Inc. | ||||||||
5.56%, 11/10/2042 | 19,702 | 19,681 | ||||||
0.06%, 10/10/2045 IO (Acquired 10/28/2013, Cost $74,073) (1) | 3,655,624 | 6 | ||||||
Banc of America Mortgage 2003-C Trust | ||||||||
3.75%, 04/25/2033 | 23,257 | 23,521 | ||||||
Banc of America Mortgage 2004-J Trust | ||||||||
3.66%, 11/25/2034 | 81,902 | 80,830 | ||||||
Banc of America Mortgage Trust 2004-9 | ||||||||
0.00%, 09/25/2032 PO | 155 | 138 | ||||||
6.50%, 09/25/2032 | 24,540 | 25,472 | ||||||
BANK 2017-BNK4 | ||||||||
3.63%, 05/15/2050 | 3,275,000 | 3,397,283 | ||||||
BB-UBS Trust | ||||||||
2.89%, 06/05/2030 (Acquired 10/28/2013, Cost $553,004) (1) | 568,000 | 563,390 | ||||||
BB-UBS Trust 2012-SHOW | ||||||||
3.43%, 11/05/2036 (Acquired 10/28/2013 through 12/04/2013, Cost $2,499,826) (1) | 2,602,000 | 2,663,560 | ||||||
BCAP LLC 2009-RR5 Trust | ||||||||
5.50%, 11/26/2034 (Acquired 10/28/2013, Cost $139,735) (1) | 138,601 | 143,376 | ||||||
BCAP LLC 2010-RR12 Trust | ||||||||
3.37%, 01/26/2036 (Acquired 10/28/2013 through 02/01/2015, Cost $20,679) (1) | 20,507 | 20,422 | ||||||
BCAP LLC 2010-RR7 Trust | ||||||||
3.24%, 04/26/2035 (Acquired 10/28/2013, Cost $12,456) (1) | 12,595 | 12,614 | ||||||
3.17%, 07/26/2045 (Acquired 10/28/2013, Cost $1,005,240) (1) | 1,027,034 | 1,018,118 | ||||||
BCAP LLC 2011-RR11 Trust | ||||||||
4.00%, 08/26/2021 (Acquired 10/28/2013, Cost $10,222) (1) | 10,175 | 10,162 | ||||||
BCAP LLC 2011-RR4-I Trust | ||||||||
5.00%, 08/26/2037 (Acquired 10/28/2013, Cost $115,897) (1) | 115,583 | 115,563 | ||||||
BCAP LLC 2012-RR1 Trust | ||||||||
9.68%, 07/26/2037 (Acquired 10/28/2013, Cost $87,417) (1) | 86,116 | 87,549 | ||||||
BCAP LLC 2012-RR10-I Trust | ||||||||
1.25%, 02/26/2037 (Acquired 10/28/2013, Cost $186,505) (1) | 193,146 | 190,871 | ||||||
Bear Stearns ALT-A Trust 2005-2 | ||||||||
1.72%, 03/25/2035 | 143,695 | 141,402 | ||||||
Bear Stearns ALT-A Trust 2005-7 | ||||||||
1.76%, 08/25/2035 | 3,604,646 | 3,579,807 | ||||||
Bear Stearns ARM Trust 2003-2 | ||||||||
3.01%, 01/25/2033 (Acquired 10/28/2013, Cost $139,938) (1) | 143,213 | 144,159 | ||||||
Bear Stearns ARM Trust 2003-7 | ||||||||
3.14%, 10/25/2033 | 21,138 | 20,810 | ||||||
Bear Stearns ARM Trust 2004-2 | ||||||||
3.71%, 05/25/2034 | 93,072 | 92,776 | ||||||
| Principal Amount | Value | |||||||
Bear Stearns ARM Trust 2005-5 | ||||||||
2.58%, 08/25/2035 | 461,053 | 467,921 | ||||||
Bear Stearns ARM Trust 2006-1 | ||||||||
2.91%, 02/25/2036 | 404,481 | 403,290 | ||||||
Bear Stearns Asset Backed Securities I Trust 2004-AC2 | ||||||||
5.00%, 05/25/2034 | 64,803 | 64,527 | ||||||
Bear Stearns Commercial Mortgage Securities Trust 2006-PWR14 | ||||||||
0.57%, 12/11/2038 IO (Acquired 10/28/2013, Cost $239,366) (1) | 2,423,666 | 3,947 | ||||||
Bear Stearns Commercial Mortgage Securities Trust 2007-TOP26 | ||||||||
0.08%, 01/12/2045 IO (Acquired 10/28/2013, Cost $286,057) (1) | 13,563,182 | 11,986 | ||||||
CD 2006-CD3 Mortgage Trust | ||||||||
0.76%, 10/15/2048 IO (Acquired 10/28/2013, Cost $171,432) (1) | 3,350,717 | 38,545 | ||||||
CD 2007-CD4 Commercial Mortgage Trust | ||||||||
0.74%, 12/11/2049 IO (Acquired 10/28/2013 through 06/01/2017, Cost $175,680) (1) | 716,941 | 51 | ||||||
CGCMT 2017-P7 A3 | ||||||||
3.44%, 04/14/2050 | 16,000,000 | 16,352,088 | ||||||
Chase Mortgage Finance Trust Series 2006-A1 | ||||||||
3.28%, 09/25/2036 | 222,744 | 200,862 | ||||||
Chase Mortgage Finance Trust Series 2007-A1 | ||||||||
3.44%, 02/25/2037 | 107,243 | 106,741 | ||||||
3.45%, 02/25/2037 | 82,459 | 81,902 | ||||||
3.47%, 02/25/2037 | 20,090 | 20,173 | ||||||
3.62%, 02/25/2037 | 161,618 | 163,013 | ||||||
Chase Mortgage Finance Trust Series 2007-A2 | ||||||||
3.18%, 07/25/2037 | 102,231 | 103,427 | ||||||
3.66%, 07/25/2037 | 62,907 | 62,626 | ||||||
CHL Mortgage Pass-Through Trust 2002-18 | ||||||||
0.00%, 11/25/2032 PO | 17,187 | 15,207 | ||||||
CHL Mortgage Pass-Through Trust 2004-3 | ||||||||
5.50%, 04/25/2034 | 39,710 | 40,464 | ||||||
5.75%, 04/25/2034 | 27,055 | 27,694 | ||||||
CHL Mortgage Pass-Through Trust 2004-5 | ||||||||
5.50%, 06/25/2034 | 195,564 | 198,495 | ||||||
CHL Mortgage Pass-Through Trust 2004-7 | ||||||||
3.52%, 06/25/2034 | 13,224 | 13,007 | ||||||
CHL Mortgage Pass-Through Trust 2004-8 | ||||||||
4.50%, 06/25/2019 | 35,310 | 35,805 | ||||||
CHL Mortgage Pass-Through Trust 2004-HYB1 | ||||||||
3.22%, 05/20/2034 | 21,741 | 20,707 | ||||||
CHL Mortgage Pass-Through Trust 2004-HYB3 | ||||||||
3.24%, 06/20/2034 | 116,569 | 111,787 | ||||||
CHL Mortgage Pass-Through Trust 2004-HYB6 | ||||||||
3.14%, 11/20/2034 | 67,765 | 68,168 | ||||||
CHL Mortgage Pass-Through Trust 2004-J8 | ||||||||
4.75%, 11/25/2019 | 4,273 | 4,311 | ||||||
CHL Mortgage Pass-Through Trust 2005-14 | ||||||||
5.50%, 07/25/2035 | 34,230 | 33,996 | ||||||
CHL Mortgage Pass-Through Trust 2005-16 | ||||||||
5.50%, 09/25/2035 | 16,825 | 15,814 | ||||||
CHL Mortgage Pass-Through Trust 2005-22 | ||||||||
3.19%, 11/25/2035 | 271,164 | 232,684 | ||||||
Citicorp Mortgage Securities Trust Series 2006-1 | ||||||||
5.00%, 02/25/2021 | 9,280 | 9,529 | ||||||
Citicorp Mortgage Securities Trust Series 2006-4 | ||||||||
6.00%, 08/25/2036 | 77,114 | 77,664 | ||||||
Citigroup Commercial Mortgage Trust | ||||||||
2.94%, 05/10/2049 | 10,100,000 | 10,000,818 | ||||||
Citigroup Commercial Mortgage Trust 2013-GC17 | ||||||||
4.13%, 11/10/2046 | 1,376,000 | 1,474,822 | ||||||
Citigroup Commercial Mortgage Trust 2014-GC19 | ||||||||
3.75%, 03/10/2047 | 7,125,000 | 7,484,205 | ||||||
Citigroup Commercial Mortgage Trust 2014-GC21 | ||||||||
3.58%, 05/10/2047 | 6,920,000 | 7,187,341 | ||||||
Citigroup Commercial Mortgage Trust 2014-GC23 | ||||||||
3.36%, 07/10/2047 | 12,300,000 | 12,610,608 | ||||||
Citigroup Commercial Mortgage Trust 2015-GC29 | ||||||||
2.94%, 04/10/2048 | 10,000,000 | 9,914,857 | ||||||
Citigroup Commercial Mortgage Trust 2016-GC37 | ||||||||
3.05%, 04/10/2049 | 13,750,000 | 13,660,856 | ||||||
Citigroup Global Markets Mortgage Securities VII, Inc. | ||||||||
| Principal Amount | Value | |||||||
0.00%, 12/25/2018 PO | 585 | 520 | ||||||
3.95%, 04/25/2032 (Acquired 10/28/2013, Cost $20,863) (1) | 21,089 | 20,931 | ||||||
7.00%, 06/25/2033 | 25,621 | 25,961 | ||||||
3.24%, 09/25/2033 | 178,979 | 178,717 | ||||||
Citigroup Mortgage Loan Trust 2008-AR4 | ||||||||
3.57%, 11/25/2038 (Acquired 10/28/2013, Cost $30,002) (1) | 29,806 | 29,779 | ||||||
Citigroup Mortgage Loan Trust 2009-10 | ||||||||
2.79%, 09/25/2033 (Acquired 10/28/2013, Cost $422,607) (1) | 419,161 | 423,741 | ||||||
7.00%, 12/25/2035 (Acquired 10/28/2013, Cost $204,722) (1) | 200,681 | 205,015 | ||||||
Citigroup Mortgage Loan Trust 2009-11 | ||||||||
5.75%, 05/25/2037 (Acquired 10/28/2013, Cost $107,217) (1) | 105,919 | 105,882 | ||||||
Citigroup Mortgage Loan Trust 2009-5 | ||||||||
6.00%, 06/25/2036 (Acquired 10/28/2013, Cost $83,576) (1) | 82,849 | 83,290 | ||||||
Citigroup Mortgage Loan Trust 2009-8 | ||||||||
6.00%, 11/25/2036 (Acquired 10/28/2013, Cost $44,420) (1) | 43,560 | 44,030 | ||||||
Citigroup Mortgage Loan Trust 2010-3 | ||||||||
2.91%, 02/25/2036 (Acquired 10/28/2013, Cost $22,974) (1) | 22,936 | 22,911 | ||||||
Citigroup Mortgage Loan Trust 2015-A | ||||||||
4.50%, 06/25/2058 (Acquired 03/31/2015, Cost $471,216) (1) | 476,890 | 467,140 | ||||||
Citigroup Mortgage Loan Trust, Inc. | ||||||||
0.00%, 12/25/2018 PO | 3,304 | 3,252 | ||||||
0.00%, 12/25/2018 PO | 896 | 876 | ||||||
5.50%, 12/25/2018 | 11,706 | 11,721 | ||||||
0.00%, 09/25/2033 PO | 6,563 | 5,983 | ||||||
7.00%, 09/25/2033 | 7,911 | 8,026 | ||||||
0.00%, 10/25/2033 PO | 7,296 | 6,102 | ||||||
5.25%, 10/25/2033 | 44,217 | 44,848 | ||||||
1.60%, 12/25/2033 | 35,657 | 35,433 | ||||||
3.15%, 08/25/2034 | 47,618 | 46,285 | ||||||
3.12%, 02/25/2035 | 31,619 | 23,076 | ||||||
5.50%, 05/25/2035 | 162,548 | 166,135 | ||||||
4.01%, 08/25/2035 | 98,246 | 79,419 | ||||||
5.50%, 11/25/2035 | 13,624 | 13,664 | ||||||
6.00%, 11/25/2035 | 4,039,860 | 4,088,750 | ||||||
COBALT CMBS Commercial Mortgage Trust 2006-C1 | ||||||||
1.03%, 08/15/2048 IO | 1,116,742 | 16,695 | ||||||
COMM 2012-CCRE1 Mortgage Trust | ||||||||
3.39%, 05/15/2045 | 3,820,528 | 3,966,498 | ||||||
COMM 2012-CCRE2 Mortgage Trust | ||||||||
1.84%, 08/15/2045 IO | 2,920,171 | 201,999 | ||||||
3.15%, 08/15/2045 | 9,614,464 | 9,879,386 | ||||||
COMM 2013-300P Mortgage Trust | ||||||||
4.35%, 08/10/2030 (Acquired 01/22/2016, Cost $528,555) (1) | 516,000 | 560,968 | ||||||
COMM 2013-CCRE10 Mortgage Trust | ||||||||
3.92%, 08/10/2046 | 4,125,000 | 4,378,372 | ||||||
COMM 2013-CCRE11 Mortgage Trust | ||||||||
3.98%, 08/10/2050 | 4,087,000 | 4,346,318 | ||||||
COMM 2013-CCRE12 Mortgage Trust | ||||||||
3.77%, 10/10/2046 | 7,700,000 | 8,092,034 | ||||||
COMM 2013-CCRE8 Mortgage Trust | ||||||||
3.61%, 06/10/2046 | 331,665 | 346,246 | ||||||
COMM 2013-CCRE9 Mortgage Trust | ||||||||
4.02%, 07/10/2045 | 4,000,000 | 4,263,793 | ||||||
4.37%, 07/10/2045 | 2,695,459 | 2,918,736 | ||||||
COMM 2013-SFS Mortgage Trust | ||||||||
3.09%, 04/12/2035 (Acquired 10/28/2013, Cost $684,323) (1) | 708,000 | 716,607 | ||||||
COMM 2014-CCRE15 Mortgage Trust | ||||||||
2.93%, 02/10/2047 | 6,100,000 | 6,185,665 | ||||||
COMM 2014-CCRE19 Mortgage Trust | ||||||||
3.80%, 08/10/2047 | 17,369,300 | 18,234,863 | ||||||
COMM 2014-CCRE20 Mortgage Trust | ||||||||
3.33%, 11/10/2047 | 12,000,000 | 12,239,726 | ||||||
COMM 2014-PAT Mortgage Trust | ||||||||
1.79%, 08/13/2027 (Acquired 09/18/2014, Cost $1,649,000) (1) | 1,649,000 | 1,649,518 | ||||||
COMM 2014-TWC Mortgage Trust | ||||||||
1.98%, 02/13/2032 (Acquired 01/30/2014 through 08/12/2014, Cost $3,250,360) (1) | 3,250,000 | 3,256,076 | ||||||
2.82%, 02/13/2032 (Acquired 08/12/2014, Cost $1,001,163) (1) | 1,000,000 | 1,003,427 | ||||||
COMM 2014-UBS4 Mortgage Trust | ||||||||
2.96%, 08/10/2047 | 11,000,000 | 11,201,521 | ||||||
COMM 2015-3BP Mortgage Trust | ||||||||
| Principal Amount | Value | |||||||
3.18%, 02/10/2035 (Acquired 10/14/2016, Cost $50,756) (1) | 49,000 | 49,450 | ||||||
COMM 2015-CCRE24 Mortgage Trust | ||||||||
3.43%, 08/10/2048 | 7,500,000 | 7,693,883 | ||||||
3.70%, 08/10/2048 | 770,833 | 802,436 | ||||||
COMM 2015-CCRE25 Mortgage Trust | ||||||||
3.51%, 08/10/2048 | 13,200,000 | 13,592,014 | ||||||
3.76%, 08/10/2048 | 2,437,000 | 2,549,572 | ||||||
COMM 2015-PC1 Mortgage Trust | ||||||||
3.90%, 07/10/2050 | 153,000 | 160,790 | ||||||
Commercial Mortgage Trust | ||||||||
2.94%, 01/10/2046 | 2,459,000 | 2,485,048 | ||||||
Commercial Mortgage Trust 2006-GG7 | ||||||||
5.95%, 07/10/2038 | 129,546 | 129,495 | ||||||
Credit Suisse Commercial Mortgage Trust Series 2007-C2 | ||||||||
0.11%, 01/15/2049 IO (Acquired 10/28/2013, Cost $65,533) (1) | 2,619,969 | 3 | ||||||
Credit Suisse First Boston Mortgage Securities Corp. | ||||||||
4.50%, 10/25/2018 | 1,312 | 1,307 | ||||||
5.00%, 10/25/2018 | 7,117 | 7,120 | ||||||
0.00%, 08/25/2019 PO | 515 | 513 | ||||||
5.25%, 08/25/2019 | 46,208 | 46,601 | ||||||
6.71%, 02/25/2033 | 112,641 | 114,425 | ||||||
3.70%, 06/25/2033 | 56,092 | 56,045 | ||||||
5.25%, 07/25/2033 | 2,684,306 | 2,737,270 | ||||||
5.25%, 09/25/2033 | 91,951 | 94,314 | ||||||
0.00%, 10/25/2033 PO | 67,334 | 56,949 | ||||||
5.25%, 11/25/2033 | 135,680 | 137,423 | ||||||
5.25%, 11/25/2033 | 58,478 | 59,220 | ||||||
5.75%, 11/25/2033 | 353,924 | 365,774 | ||||||
3.38%, 03/25/2034 | 3,264,507 | 3,313,297 | ||||||
5.50%, 09/25/2034 | 90,049 | 93,938 | ||||||
5.50%, 12/25/2034 | 153,536 | 160,376 | ||||||
0.00%, 10/25/2035 PO | 21,621 | 16,360 | ||||||
5.50%, 10/25/2035 IO | 320,694 | 7,565 | ||||||
0.00%, 11/25/2035 PO | 16,782 | 11,341 | ||||||
Credit Suisse Mortgage Capital Certificates | ||||||||
6.00%, 01/27/2038 (Acquired 10/28/2013, Cost $21,572) (1) | 21,325 | 21,309 | ||||||
CSAIL 2015-C4 Commercial Mortgage Trust | ||||||||
3.54%, 11/15/2048 | 7,500,000 | 7,701,949 | ||||||
CSAIL 2016-C7 Commercial Mortgage Trust | ||||||||
3.50%, 11/15/2049 | 2,359,000 | 2,403,812 | ||||||
CSAIL 2017-C8 Commercial Mortgage Trust | ||||||||
3.13%, 06/15/2050 | 15,525,000 | 15,481,049 | ||||||
CSMC 2014-USA OA LLC | ||||||||
3.95%, 09/15/2037 (Acquired 10/15/2015 through 06/29/2017, Cost $1,496,318) (1) | 1,428,000 | 1,476,032 | ||||||
4.37%, 09/15/2037 (Acquired 06/27/2017, Cost $2,850,519) (1) | 3,000,000 | 2,831,656 | ||||||
CSMC 2017-6R 1A1 Mortgage Trust | ||||||||
2.72%, 03/06/2047 (8) | 8,700,000 | 8,700,000 | ||||||
CSMC Series 2010-11R | ||||||||
2.04%, 06/28/2047 (Acquired 10/28/2013, Cost $1,056,369) (1) | 1,088,976 | 1,085,434 | ||||||
CSMC Series 2010-17R | ||||||||
3.17%, 06/26/2036 (Acquired 10/28/2013, Cost $165,407) (1) | 163,028 | 164,352 | ||||||
CSMC Series 2011-16R | ||||||||
3.03%, 12/27/2036 (Acquired 10/28/2013, Cost $23,559) (1) | 23,403 | 23,403 | ||||||
DBUBS 2011-LC2 Mortgage Trust | ||||||||
1.32%, 07/10/2044 IO (Acquired 10/28/2013, Cost $196,983) (1) | 2,702,749 | 87,136 | ||||||
Deephaven Residential Mortgage Trust 2017-1 | ||||||||
3.49%, 12/26/2046 (Acquired 04/07/2017, Cost $1,758,874) (1) | 1,758,899 | 1,758,224 | ||||||
Deutsche Alt-A Securities, Inc. Mortgage Loan Trust Series 2005-1 | ||||||||
5.69%, 02/25/2020 | 44,702 | 44,946 | ||||||
Deutsche Alt-A Securities, Inc. Mortgage Loan Trust Series 2005-3 | ||||||||
3.58%, 06/25/2020 | 67,628 | 65,250 | ||||||
Deutsche Mortgage Securities, Inc. Mortgage Loan Trust Series 2004-1 | ||||||||
0.00%, 10/25/2018 PO | 859 | 853 | ||||||
Deutsche Mortgage Securities, Inc. Mortgage Loan Trust 2004-4 | ||||||||
6.15%, 04/25/2034 | 865 | 880 | ||||||
Fannie Mae | ||||||||
3.00%, 07/15/2027 (3) | 39,050,000 | 40,072,013 | ||||||
5.00%, 07/15/2041 (3) | 9,000,000 | 9,829,664 | ||||||
3.00%, 07/15/2042 (3) | 58,285,000 | 58,193,929 | ||||||
Fannie Mae Grantor Trust 1999-T2 | ||||||||
| Principal Amount | Value | |||||||
7.50%, 01/19/2039 | 107,223 | 119,951 | ||||||
Fannie Mae Grantor Trust 2001-T3 | ||||||||
7.50%, 11/25/2040 | 155,102 | 182,555 | ||||||
Fannie Mae Grantor Trust 2002-T16 | ||||||||
7.00%, 07/25/2042 | 160,430 | 187,339 | ||||||
Fannie Mae Grantor Trust 2004-T1 | ||||||||
6.50%, 01/25/2044 | 43,476 | 49,971 | ||||||
Fannie Mae Grantor Trust 2004-T2 | ||||||||
3.62%, 07/25/2043 | 182,948 | 193,665 | ||||||
7.50%, 11/25/2043 | 310,210 | 363,968 | ||||||
Fannie Mae Grantor Trust 2004-T3 | ||||||||
9.98%, 01/25/2044 | 38,996 | 46,409 | ||||||
6.50%, 02/25/2044 | 421,504 | 486,577 | ||||||
7.00%, 02/25/2044 | 175,702 | 205,790 | ||||||
Fannie Mae Grantor Trust 2017-T1 | ||||||||
2.90%, 06/25/2027 | 6,547,000 | 6,500,704 | ||||||
Fannie Mae Interest Strip | ||||||||
10.00%, 09/25/2017 IO | 4 | 0 | ||||||
4.50%, 07/25/2018 IO | 8,346 | 119 | ||||||
4.50%, 08/25/2018 IO | 11,862 | 142 | ||||||
5.50%, 08/25/2018 IO | 3,298 | 27 | ||||||
10.50%, 03/25/2019 IO | 27 | 1 | ||||||
4.50%, 11/25/2020 IO | 3,290 | 102 | ||||||
7.50%, 04/25/2023 IO | 1,257 | 201 | ||||||
9.00%, 03/25/2024 | 1,012 | 1,175 | ||||||
0.00%, 09/25/2024 PO | 95,825 | 88,652 | ||||||
0.00%, 01/25/2033 PO | 14,079 | 12,493 | ||||||
5.00%, 12/25/2033 IO | 18,551 | 3,327 | ||||||
5.50%, 05/25/2036 IO | 73,559 | 15,952 | ||||||
5.50%, 08/25/2036 IO | 49,863 | 11,293 | ||||||
5.50%, 04/25/2037 IO | 21,475 | 3,896 | ||||||
6.00%, 01/25/2038 IO | 50,581 | 9,791 | ||||||
1.72%, 08/25/2042 | 993,757 | 998,544 | ||||||
1.77%, 08/25/2042 | 2,647,111 | 2,672,775 | ||||||
Fannie Mae Pool | ||||||||
6.00%, 08/01/2017 | 23 | 23 | ||||||
6.50%, 08/01/2017 | 36 | 36 | ||||||
5.50%, 09/01/2017 | 202 | 202 | ||||||
7.00%, 09/01/2017 | 34 | 34 | ||||||
2.62%, 10/01/2017 | 599,000 | 598,397 | ||||||
5.86%, 10/01/2017 | 698,595 | 704,523 | ||||||
6.50%, 10/01/2017 | 132 | 132 | ||||||
6.00%, 11/01/2017 | 371 | 372 | ||||||
6.00%, 11/01/2017 | 18 | 18 | ||||||
3.38%, 01/01/2018 | 1,032,000 | 1,032,552 | ||||||
3.52%, 01/01/2018 | 614,131 | 614,587 | ||||||
3.63%, 01/01/2018 | 310,000 | 310,258 | ||||||
5.50%, 02/01/2018 | 5,233 | 5,260 | ||||||
5.50%, 02/01/2018 | 2,767 | 2,784 | ||||||
6.00%, 03/01/2018 | 56 | 56 | ||||||
5.00%, 04/01/2018 | 2,493 | 2,553 | ||||||
4.50%, 05/01/2018 | 1,313 | 1,344 | ||||||
5.00%, 05/01/2018 | 3,777 | 3,867 | ||||||
5.00%, 05/01/2018 | 8,095 | 8,288 | ||||||
6.00%, 05/01/2018 | 888 | 895 | ||||||
3.73%, 06/01/2018 | 1,584,812 | 1,600,625 | ||||||
4.50%, 06/01/2018 | 2,160 | 2,212 | ||||||
5.00%, 06/01/2018 | 9,395 | 9,620 | ||||||
5.00%, 06/01/2018 | 6,216 | 6,364 | ||||||
5.00%, 06/01/2018 | 1,470 | 1,505 | ||||||
5.00%, 07/01/2018 | 11,542 | 11,818 | ||||||
4.50%, 08/01/2018 | 2,528 | 2,589 | ||||||
5.00%, 08/01/2018 | 6,907 | 7,072 | ||||||
5.00%, 09/01/2018 | 9,119 | 9,337 | ||||||
4.50%, 10/01/2018 | 5,839 | 5,978 | ||||||
5.00%, 10/01/2018 | 5,424 | 5,554 | ||||||
5.00%, 10/01/2018 | 5,419 | 5,549 | ||||||
4.50%, 11/01/2018 | 10,627 | 10,881 | ||||||
5.00%, 11/01/2018 | 15,262 | 15,627 | ||||||
5.00%, 11/01/2018 | 7,385 | 7,561 | ||||||
| Principal Amount | Value | |||||||
5.00%, 11/01/2018 | 1,616 | 1,654 | ||||||
3.04%, 12/01/2018 | 1,238,000 | 1,257,676 | ||||||
5.00%, 12/01/2018 | 96 | 99 | ||||||
5.00%, 12/01/2018 | 23,796 | 24,365 | ||||||
9.50%, 12/01/2018 | 355 | 360 | ||||||
1.88%, 01/01/2019 | 180 | 180 | ||||||
6.00%, 01/01/2019 | 202 | 202 | ||||||
2.48%, 03/01/2019 | 222 | 224 | ||||||
4.50%, 03/01/2019 | 9,786 | 10,020 | ||||||
6.00%, 03/01/2019 | 2,681 | 2,718 | ||||||
3.50%, 04/01/2019 | 12,172 | 12,671 | ||||||
5.00%, 04/01/2019 | 871 | 892 | ||||||
5.00%, 04/01/2019 | 29,676 | 30,388 | ||||||
10.50%, 04/15/2019 | 1,457 | 1,482 | ||||||
2.19%, 05/01/2019 | 932,170 | 937,419 | ||||||
4.50%, 05/01/2019 | 2,641 | 2,704 | ||||||
2.45%, 06/01/2019 | 1,562,589 | 1,578,327 | ||||||
4.50%, 06/01/2019 | 22,029 | 22,556 | ||||||
1.94%, 07/01/2019 | 1,270,186 | 1,271,450 | ||||||
2.20%, 07/01/2019 | 708,983 | 713,267 | ||||||
2.37%, 07/01/2019 | 1,548,000 | 1,569,349 | ||||||
5.50%, 07/01/2019 | 27,981 | 28,555 | ||||||
6.00%, 07/01/2019 | 116 | 116 | ||||||
2.03%, 08/01/2019 | 239,717 | 241,794 | ||||||
2.88%, 08/01/2019 | 60 | 60 | ||||||
5.50%, 08/01/2019 | 26,184 | 26,696 | ||||||
5.00%, 09/01/2019 | 919 | 944 | ||||||
5.50%, 09/01/2019 | 24,548 | 25,203 | ||||||
5.00%, 10/01/2019 | 6,018 | 6,209 | ||||||
6.00%, 10/01/2019 | 3,253 | 3,317 | ||||||
4.13%, 11/01/2019 | 877,000 | 918,148 | ||||||
4.24%, 11/01/2019 | 337,584 | 355,122 | ||||||
4.50%, 11/01/2019 | 15,617 | 15,991 | ||||||
4.50%, 11/01/2019 | 9,240 | 9,473 | ||||||
4.50%, 11/01/2019 | 4,436 | 4,543 | ||||||
1.47%, 12/01/2019 | 785,405 | 777,420 | ||||||
1.69%, 12/01/2019 | 1,032,000 | 1,026,344 | ||||||
4.18%, 12/01/2019 | 454,187 | 475,957 | ||||||
4.26%, 12/01/2019 | 935,440 | 982,049 | ||||||
4.50%, 12/01/2019 | 1,334,639 | 1,403,207 | ||||||
4.50%, 12/01/2019 | 14,034 | 14,370 | ||||||
4.28%, 01/01/2020 | 1,423,591 | 1,489,078 | ||||||
4.54%, 01/01/2020 | 322,148 | 339,888 | ||||||
5.50%, 01/01/2020 | 45,804 | 46,888 | ||||||
4.37%, 02/01/2020 | 1,111,085 | 1,171,525 | ||||||
4.40%, 02/01/2020 | 289,000 | 305,536 | ||||||
4.40%, 02/01/2020 | 6,347,000 | 6,719,175 | ||||||
5.50%, 03/01/2020 | 5,472 | 5,551 | ||||||
6.00%, 03/01/2020 | 5,782 | 5,917 | ||||||
4.00%, 04/01/2020 | 3,453 | 3,501 | ||||||
4.38%, 04/01/2020 | 1,617,644 | 1,710,334 | ||||||
2.01%, 06/01/2020 | 9,288,000 | 9,325,655 | ||||||
5.50%, 06/01/2020 | 36,049 | 36,406 | ||||||
5.50%, 06/01/2020 | 16,235 | 16,618 | ||||||
3.74%, 07/01/2020 | 549,991 | 576,314 | ||||||
3.93%, 07/01/2020 | 1,434,634 | 1,511,410 | ||||||
3.95%, 07/01/2020 | 826,000 | 871,871 | ||||||
4.07%, 07/01/2020 | 3,051,048 | 3,225,323 | ||||||
5.50%, 07/01/2020 | 8,650 | 8,771 | ||||||
3.89%, 08/01/2020 | 1,186,542 | 1,251,356 | ||||||
3.96%, 08/01/2020 | 958,173 | 1,012,619 | ||||||
4.30%, 08/01/2020 | 460,973 | 461,641 | ||||||
6.50%, 08/01/2020 | 2,908 | 2,993 | ||||||
3.43%, 09/01/2020 | 916,126 | 955,337 | ||||||
3.60%, 09/01/2020 | 184,797 | 193,664 | ||||||
3.85%, 09/01/2020 | 1,672,548 | 1,764,215 | ||||||
3.29%, 10/01/2020 | 774,746 | 803,426 | ||||||
3.36%, 10/01/2020 | 804,201 | 837,284 | ||||||
3.50%, 10/01/2020 | 1,106,164 | 1,156,741 | ||||||
3.54%, 10/01/2020 | 991,000 | 1,036,491 | ||||||
| Principal Amount | Value | |||||||
3.59%, 10/01/2020 | 1,470,006 | 1,541,660 | ||||||
3.92%, 10/01/2020 | 677,974 | 716,369 | ||||||
3.23%, 11/01/2020 | 569,688 | 590,199 | ||||||
3.27%, 11/01/2020 | 767,722 | 797,385 | ||||||
2.00%, 12/01/2020 | 1,548,000 | 1,549,938 | ||||||
3.48%, 12/01/2020 | 857,599 | 896,122 | ||||||
3.54%, 12/01/2020 | 838,121 | 875,083 | ||||||
3.62%, 12/01/2020 | 1,650,514 | 1,734,150 | ||||||
3.70%, 12/01/2020 | 365,839 | 384,670 | ||||||
3.83%, 12/01/2020 | 874,276 | 922,988 | ||||||
3.56%, 01/01/2021 | 1,918,951 | 2,011,923 | ||||||
3.87%, 01/01/2021 | 1,151,816 | 1,219,426 | ||||||
3.93%, 01/01/2021 | 392,864 | 416,658 | ||||||
4.05%, 01/01/2021 | 482,000 | 513,626 | ||||||
4.28%, 01/01/2021 | 691,446 | 740,829 | ||||||
4.45%, 01/01/2021 | 412,895 | 442,892 | ||||||
4.33%, 02/01/2021 | 484,888 | 519,305 | ||||||
4.16%, 03/01/2021 | 1,673,765 | 1,783,712 | ||||||
6.00%, 03/01/2021 | 24,889 | 26,099 | ||||||
8.00%, 03/01/2021 | 48 | 48 | ||||||
4.25%, 04/01/2021 | 784,000 | 840,894 | ||||||
4.25%, 04/01/2021 | 1,032,000 | 1,106,891 | ||||||
4.30%, 04/01/2021 | 291,847 | 312,920 | ||||||
4.33%, 04/01/2021 | 706,672 | 758,245 | ||||||
6.00%, 04/01/2021 | 8,069 | 8,438 | ||||||
6.00%, 04/01/2021 | 22,870 | 23,514 | ||||||
4.36%, 05/01/2021 | 1,481,342 | 1,593,376 | ||||||
4.39%, 05/01/2021 | 745,258 | 801,854 | ||||||
3.97%, 06/01/2021 | 618,364 | 659,286 | ||||||
4.02%, 06/01/2021 | 691,000 | 739,510 | ||||||
4.10%, 06/01/2021 | 664,316 | 711,309 | ||||||
4.19%, 06/01/2021 | 534,671 | 572,370 | ||||||
4.24%, 06/01/2021 | 1,673,573 | 1,794,790 | ||||||
4.26%, 06/01/2021 | 707,357 | 753,896 | ||||||
4.30%, 06/01/2021 | 1,226,333 | 1,317,130 | ||||||
4.34%, 06/01/2021 | 1,858,000 | 2,014,730 | ||||||
4.48%, 06/01/2021 | 929,000 | 1,006,072 | ||||||
3.86%, 07/01/2021 | 934,600 | 993,244 | ||||||
3.89%, 07/01/2021 | 900,920 | 959,030 | ||||||
3.94%, 07/01/2021 | 1,032,000 | 1,102,365 | ||||||
3.99%, 07/01/2021 | 519,651 | 554,690 | ||||||
4.06%, 07/01/2021 | 984,663 | 1,054,436 | ||||||
4.26%, 07/01/2021 | 2,223,783 | 2,389,642 | ||||||
4.31%, 07/01/2021 | 882,579 | 947,584 | ||||||
6.00%, 07/01/2021 | 4,011 | 4,115 | ||||||
4.05%, 08/01/2021 | 171,858 | 184,062 | ||||||
4.13%, 08/01/2021 | 762,159 | 815,568 | ||||||
4.50%, 08/01/2021 | 2,838,000 | 3,101,095 | ||||||
6.00%, 08/01/2021 | 41,965 | 43,818 | ||||||
3.77%, 09/01/2021 | 2,776,000 | 2,942,919 | ||||||
3.85%, 09/01/2021 | 842,671 | 896,861 | ||||||
3.88%, 09/01/2021 | 997,146 | 1,063,078 | ||||||
3.89%, 09/01/2021 | 1,428,130 | 1,522,968 | ||||||
3.92%, 09/01/2021 | 641,888 | 684,975 | ||||||
3.31%, 10/01/2021 | 1,645,329 | 1,717,743 | ||||||
3.40%, 10/01/2021 | 340,916 | 357,094 | ||||||
4.07%, 10/01/2021 | 1,756,428 | 1,886,705 | ||||||
3.43%, 11/01/2021 | 971,153 | 1,019,202 | ||||||
5.00%, 11/01/2021 | 79,650 | 81,556 | ||||||
3.03%, 12/01/2021 | 928,075 | 960,372 | ||||||
3.31%, 12/01/2021 | 376,283 | 393,230 | ||||||
3.42%, 12/01/2021 | 5,011,965 | 5,308,201 | ||||||
3.83%, 12/01/2021 | 1,548,000 | 1,654,383 | ||||||
6.00%, 12/01/2021 | 23,633 | 24,799 | ||||||
2.97%, 01/01/2022 | 744,428 | 768,779 | ||||||
3.03%, 01/01/2022 | 848,200 | 877,588 | ||||||
3.09%, 01/01/2022 | 1,301,249 | 1,350,233 | ||||||
3.12%, 01/01/2022 | 1,229,271 | 1,277,473 | ||||||
3.20%, 01/01/2022 | 820,552 | 855,166 | ||||||
2.99%, 02/01/2022 | 279,625 | 289,099 | ||||||
| Principal Amount | Value | |||||||
3.06%, 02/01/2022 | 863,000 | 895,747 | ||||||
3.14%, 02/01/2022 | 466,663 | 485,192 | ||||||
1.80%, 03/01/2022 | 923,834 | 926,973 | ||||||
2.75%, 03/01/2022 | 934,857 | 959,107 | ||||||
3.08%, 03/01/2022 | 409,141 | 424,580 | ||||||
3.14%, 03/01/2022 | 290,585 | 302,185 | ||||||
3.21%, 03/01/2022 | 310,000 | 322,339 | ||||||
2.70%, 04/01/2022 | 1,569,098 | 1,606,393 | ||||||
3.08%, 04/01/2022 | 978,017 | 1,015,853 | ||||||
3.73%, 04/01/2022 | 2,390,646 | 2,536,789 | ||||||
6.50%, 04/01/2022 | 21,215 | 22,330 | ||||||
2.77%, 05/01/2022 | 1,648,646 | 1,693,457 | ||||||
2.86%, 05/01/2022 | 1,410,015 | 1,453,759 | ||||||
2.94%, 05/01/2022 | 1,033,176 | 1,066,556 | ||||||
3.02%, 05/01/2022 | 653,720 | 677,175 | ||||||
3.10%, 05/01/2022 | 771,537 | 802,053 | ||||||
3.12%, 05/01/2022 | 942,111 | 979,992 | ||||||
6.50%, 05/01/2022 | 5,454 | 6,036 | ||||||
2.60%, 06/01/2022 | 831,790 | 846,312 | ||||||
2.76%, 06/01/2022 | 1,605,000 | 1,647,769 | ||||||
2.67%, 07/01/2022 | 624,000 | 638,339 | ||||||
2.69%, 07/01/2022 | 987,100 | 1,010,079 | ||||||
2.71%, 07/01/2022 | 1,000,000 | 1,024,689 | ||||||
2.82%, 07/01/2022 | 1,069,861 | 1,101,433 | ||||||
2.65%, 08/01/2022 | 1,032,000 | 1,054,795 | ||||||
2.47%, 09/01/2022 | 374,927 | 379,879 | ||||||
4.03%, 09/01/2022 | 1,198,504 | 1,297,219 | ||||||
2.39%, 10/01/2022 | 638,606 | 644,854 | ||||||
2.52%, 10/01/2022 | 960,064 | 974,837 | ||||||
2.57%, 10/01/2022 | 596,009 | 606,856 | ||||||
2.64%, 10/01/2022 | 663,652 | 677,779 | ||||||
2.37%, 11/01/2022 | 471,406 | 471,800 | ||||||
2.38%, 11/01/2022 | 854,993 | 862,797 | ||||||
2.41%, 11/01/2022 | 591,644 | 597,903 | ||||||
2.44%, 11/01/2022 | 812,906 | 822,677 | ||||||
2.45%, 11/01/2022 | 1,401,000 | 1,415,881 | ||||||
2.47%, 11/01/2022 | 516,000 | 521,915 | ||||||
2.55%, 11/01/2022 | 1,238,784 | 1,260,164 | ||||||
2.55%, 11/01/2022 | 395,710 | 402,539 | ||||||
7.50%, 11/01/2022 | 1,900 | 2,012 | ||||||
2.24%, 12/01/2022 | 639,978 | 641,336 | ||||||
2.28%, 12/01/2022 | 1,015,249 | 1,019,405 | ||||||
2.32%, 12/01/2022 | 375,574 | 377,885 | ||||||
2.34%, 12/01/2022 | 2,338,566 | 2,353,783 | ||||||
2.38%, 12/01/2022 | 491,889 | 496,283 | ||||||
2.39%, 12/01/2022 | 1,044,919 | 1,054,791 | ||||||
2.40%, 12/01/2022 | 1,632,000 | 1,645,416 | ||||||
2.42%, 12/01/2022 | 1,159,345 | 1,171,967 | ||||||
2.66%, 12/01/2022 | 1,500,000 | 1,532,346 | ||||||
6.50%, 12/01/2022 | 20,695 | 22,903 | ||||||
1.35%, 01/01/2023 | 4,274,826 | 4,261,635 | ||||||
1.39%, 01/01/2023 | 760,038 | 763,664 | ||||||
2.15%, 01/01/2023 | 481,618 | 480,457 | ||||||
2.33%, 01/01/2023 | 1,695,084 | 1,705,837 | ||||||
2.34%, 01/01/2023 | 1,354,015 | 1,372,600 | ||||||
2.37%, 01/01/2023 | 1,086,796 | 1,094,014 | ||||||
2.45%, 01/01/2023 | 724,834 | 733,710 | ||||||
2.51%, 01/01/2023 | 949,000 | 957,591 | ||||||
2.60%, 01/01/2023 | 763,573 | 778,567 | ||||||
1.38%, 02/01/2023 | 1,135,000 | 1,137,234 | ||||||
2.40%, 02/01/2023 | 1,465,000 | 1,476,547 | ||||||
2.45%, 02/01/2023 | 1,290,000 | 1,302,777 | ||||||
6.00%, 02/01/2023 | 245,439 | 262,460 | ||||||
2.49%, 03/01/2023 | 793,189 | 803,009 | ||||||
2.50%, 04/01/2023 | 1,445,000 | 1,458,540 | ||||||
2.64%, 04/01/2023 | 350,614 | 357,613 | ||||||
2.71%, 04/01/2023 | 599,787 | 610,712 | ||||||
2.52%, 05/01/2023 | 3,302,000 | 3,335,726 | ||||||
2.54%, 05/01/2023 | 310,000 | 314,492 | ||||||
5.00%, 05/01/2023 | 19,920 | 20,937 | ||||||
| Principal Amount | Value | |||||||
2.42%, 06/01/2023 | 889,753 | 897,253 | ||||||
2.77%, 06/01/2023 | 1,753,227 | 1,794,738 | ||||||
2.77%, 06/01/2023 | 929,000 | 951,367 | ||||||
2.64%, 07/01/2023 | 413,000 | 419,851 | ||||||
3.67%, 07/01/2023 | 4,850,000 | 5,188,074 | ||||||
3.74%, 07/01/2023 | 561,295 | 597,667 | ||||||
3.59%, 08/01/2023 | 1,135,000 | 1,206,958 | ||||||
4.18%, 09/01/2023 | 1,402,917 | 1,526,084 | ||||||
3.76%, 10/01/2023 | 964,279 | 1,028,945 | ||||||
3.38%, 12/01/2023 | 2,500,000 | 2,628,480 | ||||||
3.50%, 12/01/2023 | 2,234,000 | 2,362,840 | ||||||
3.45%, 01/01/2024 | 1,788,823 | 1,888,129 | ||||||
6.00%, 01/01/2024 | 68,249 | 73,625 | ||||||
6.00%, 01/01/2024 | 199,244 | 214,758 | ||||||
7.00%, 01/01/2024 | 474 | 526 | ||||||
6.50%, 02/01/2024 | 92,517 | 100,062 | ||||||
10.00%, 02/01/2024 | 475 | 477 | ||||||
3.76%, 03/01/2024 | 1,265,000 | 1,355,916 | ||||||
8.00%, 05/01/2024 | 643 | 706 | ||||||
6.00%, 07/01/2024 | 47,194 | 50,833 | ||||||
6.50%, 07/01/2024 | 44,394 | 49,131 | ||||||
8.50%, 07/01/2024 | 1,450 | 1,634 | ||||||
5.00%, 08/01/2024 | 76,499 | 81,121 | ||||||
1.48%, 09/01/2024 | 3,670,657 | 3,676,308 | ||||||
7.50%, 10/01/2024 | 619 | 678 | ||||||
1.37%, 12/01/2024 | 5,000,000 | 5,006,708 | ||||||
2.90%, 12/01/2024 | 2,000,000 | 2,034,824 | ||||||
2.92%, 12/01/2024 | 1,000,000 | 1,019,096 | ||||||
3.08%, 12/01/2024 | 1,946,746 | 2,009,353 | ||||||
3.11%, 12/01/2024 | 2,500,000 | 2,579,196 | ||||||
2.93%, 01/01/2025 | 1,957,320 | 2,001,473 | ||||||
2.99%, 01/01/2025 | 1,568,798 | 1,610,238 | ||||||
3.64%, 01/01/2025 | 560,909 | 595,230 | ||||||
3.07%, 02/01/2025 | 4,995,000 | 5,143,000 | ||||||
2.70%, 04/01/2025 | 5,000,000 | 5,037,691 | ||||||
2.81%, 04/01/2025 | 1,400,000 | 1,412,488 | ||||||
6.50%, 04/01/2025 | 6,242 | 6,908 | ||||||
2.68%, 05/01/2025 | 1,930,386 | 1,950,354 | ||||||
8.50%, 05/01/2025 | 74 | 74 | ||||||
5.50%, 07/01/2025 | 87,675 | 97,045 | ||||||
3.00%, 08/15/2025 (3) | 25,500,000 | 26,141,485 | ||||||
3.10%, 09/01/2025 | 5,000,000 | 5,131,415 | ||||||
3.77%, 12/01/2025 | 3,500,000 | 3,752,907 | ||||||
3.50%, 01/01/2026 | 467,277 | 487,110 | ||||||
7.00%, 04/01/2026 | 5,822 | 6,112 | ||||||
6.00%, 07/01/2026 | 49,985 | 56,212 | ||||||
3.29%, 08/01/2026 | 1,500,000 | 1,552,365 | ||||||
3.29%, 08/01/2026 | 3,000,000 | 3,102,324 | ||||||
4.55%, 08/01/2026 | 1,007,554 | 1,114,096 | ||||||
4.76%, 08/01/2026 | 1,038,772 | 1,164,220 | ||||||
4.77%, 08/01/2026 | 660,826 | 735,554 | ||||||
6.50%, 08/01/2026 | 85,014 | 94,086 | ||||||
3.25%, 09/01/2026 | 1,500,000 | 1,547,777 | ||||||
2.29%, 10/01/2026 | 10,627,206 | 10,236,031 | ||||||
3.24%, 10/01/2026 | 1,910,643 | 1,969,368 | ||||||
3.12%, 11/01/2026 | 1,000,000 | 1,008,203 | ||||||
3.29%, 11/01/2026 | 2,000,000 | 2,069,706 | ||||||
3.14%, 12/01/2026 | 1,912,053 | 1,957,071 | ||||||
3.24%, 12/01/2026 | 1,500,000 | 1,544,430 | ||||||
3.26%, 12/01/2026 | 991,913 | 1,024,161 | ||||||
4.66%, 12/01/2026 | 1,130,170 | 1,258,008 | ||||||
3.12%, 02/01/2027 | 1,468,395 | 1,502,517 | ||||||
3.25%, 02/01/2027 | 5,966,460 | 6,133,471 | ||||||
3.34%, 02/01/2027 | 1,500,000 | 1,572,911 | ||||||
2.91%, 03/01/2027 | 10,000,000 | 10,048,693 | ||||||
3.13%, 03/01/2027 | 6,835,000 | 6,964,850 | ||||||
3.50%, 03/01/2027 | 2,881,730 | 3,000,590 | ||||||
8.00%, 03/01/2027 | 7,419 | 8,226 | ||||||
3.00%, 04/01/2027 | 830,479 | 854,614 | ||||||
3.03%, 04/01/2027 | 1,500,000 | 1,520,954 | ||||||
| Principal Amount | Value | |||||||
2.79%, 05/01/2027 | 2,000,000 | 1,995,973 | ||||||
2.81%, 05/01/2027 | 2,000,000 | 2,001,762 | ||||||
2.83%, 05/01/2027 | 8,000,000 | 7,970,106 | ||||||
3.00%, 05/01/2027 | 4,928,871 | 5,072,331 | ||||||
4.00%, 05/01/2027 | 3,728,901 | 3,909,582 | ||||||
3.00%, 06/01/2027 | 2,000,000 | 2,016,385 | ||||||
8.00%, 06/01/2027 | 7,020 | 7,800 | ||||||
3.50%, 07/01/2027 | 3,790,181 | 3,950,116 | ||||||
3.50%, 07/01/2027 | 8,193,568 | 8,550,732 | ||||||
6.00%, 07/01/2027 | 64,423 | 72,449 | ||||||
2.37%, 09/01/2027 | 5,518 | 5,560 | ||||||
2.50%, 09/01/2027 | 658,330 | 665,998 | ||||||
7.00%, 09/01/2027 | 1,019 | 1,166 | ||||||
6.00%, 11/01/2027 | 29,120 | 32,748 | ||||||
2.50%, 12/01/2027 | 1,491,467 | 1,508,881 | ||||||
6.00%, 12/01/2027 | 83,464 | 93,863 | ||||||
6.00%, 01/01/2028 | 144,168 | 162,129 | ||||||
2.50%, 03/01/2028 | 5,171,393 | 5,230,076 | ||||||
2.50%, 04/01/2028 | 6,107,569 | 6,176,811 | ||||||
5.00%, 05/01/2028 | 29,797 | 32,524 | ||||||
2.86%, 06/01/2028 | 4,300,000 | 4,292,234 | ||||||
8.00%, 06/01/2028 | 4,593 | 5,146 | ||||||
9.50%, 07/01/2028 | 1,027 | 1,085 | ||||||
2.57%, 08/01/2028 | 5,400,000 | 5,204,394 | ||||||
2.64%, 08/01/2028 | 3,398,841 | 3,293,952 | ||||||
3.00%, 08/01/2028 | 2,006,558 | 2,060,557 | ||||||
2.58%, 09/01/2028 | 3,830,000 | 3,685,320 | ||||||
2.59%, 09/01/2028 | 7,552,000 | 7,267,270 | ||||||
3.00%, 09/01/2028 | 3,006,137 | 3,089,235 | ||||||
8.00%, 09/01/2028 | 12,174 | 13,841 | ||||||
2.50%, 10/01/2028 | 715,276 | 723,377 | ||||||
2.55%, 10/01/2028 | 9,300,000 | 8,936,467 | ||||||
2.62%, 10/01/2028 | 9,733,000 | 9,505,619 | ||||||
6.00%, 10/01/2028 | 116,036 | 130,492 | ||||||
8.00%, 11/01/2028 | 33,688 | 40,103 | ||||||
2.69%, 12/01/2028 | 4,567,000 | 4,424,843 | ||||||
3.00%, 12/01/2028 | 1,209,826 | 1,242,384 | ||||||
6.00%, 12/01/2028 | 4,390 | 4,937 | ||||||
6.00%, 01/01/2029 | 5,283 | 5,994 | ||||||
7.00%, 01/01/2029 | 8,636 | 9,417 | ||||||
3.21%, 03/01/2029 | 10,000,000 | 10,186,965 | ||||||
3.94%, 03/01/2029 | 3,770 | 3,898 | ||||||
6.50%, 03/01/2029 | 20,700 | 23,535 | ||||||
3.34%, 04/01/2029 | 5,187,215 | 5,351,028 | ||||||
4.50%, 08/01/2029 | 241,861 | 259,936 | ||||||
4.50%, 09/01/2029 | 281,238 | 302,242 | ||||||
6.00%, 09/01/2029 | 78,668 | 88,470 | ||||||
3.63%, 10/01/2029 | 1,447,059 | 1,526,503 | ||||||
6.50%, 11/01/2029 | 725,768 | 823,825 | ||||||
4.50%, 01/01/2030 | 421,789 | 453,404 | ||||||
3.55%, 02/01/2030 | 1,500,000 | 1,572,756 | ||||||
2.50%, 04/01/2030 | 3,011,079 | 3,036,893 | ||||||
3.03%, 04/01/2030 | 3,500,000 | 3,482,542 | ||||||
3.08%, 04/01/2030 | 2,000,000 | 2,007,827 | ||||||
2.50%, 05/01/2030 | 3,755,624 | 3,787,858 | ||||||
2.92%, 05/01/2030 | 4,000,000 | 3,851,616 | ||||||
2.94%, 05/01/2030 | 2,500,000 | 2,466,201 | ||||||
2.96%, 06/01/2030 | 1,993,618 | 1,990,569 | ||||||
3.13%, 06/01/2030 | 1,000,000 | 980,666 | ||||||
3.20%, 06/01/2030 | 1,000,000 | 1,012,485 | ||||||
3.30%, 07/01/2030 | 1,005,000 | 1,026,234 | ||||||
3.34%, 07/01/2030 | 1,500,000 | 1,539,023 | ||||||
3.39%, 09/01/2030 | 1,943,292 | 1,999,077 | ||||||
3.26%, 10/01/2030 | 5,103,632 | 5,201,448 | ||||||
3.00%, 02/01/2031 | 14,553,650 | 14,945,311 | ||||||
5.00%, 04/01/2031 | 167,790 | 186,155 | ||||||
2.00%, 08/01/2031 | 3,752,533 | 3,673,108 | ||||||
6.50%, 08/01/2031 | 17,538 | 20,223 | ||||||
2.50%, 10/01/2031 | 2,494,568 | 2,508,768 | ||||||
4.00%, 11/01/2031 | 7,005,367 | 7,442,951 | ||||||
| Principal Amount | Value | |||||||
4.00%, 02/01/2032 | 471,058 | 495,327 | ||||||
6.50%, 02/01/2032 | 82,357 | 93,328 | ||||||
3.32%, 04/01/2032 | 6,293,583 | 6,440,344 | ||||||
7.00%, 06/01/2032 | 5,535 | 5,878 | ||||||
3.50%, 07/01/2032 | 167,397 | 174,795 | ||||||
7.00%, 08/01/2032 | 1,292 | 1,316 | ||||||
5.50%, 11/01/2032 | 65,232 | 74,903 | ||||||
3.50%, 12/01/2032 | 440,933 | 458,607 | ||||||
5.00%, 12/01/2032 | 932 | 961 | ||||||
6.00%, 12/01/2032 | 28,133 | 32,132 | ||||||
6.00%, 12/01/2032 | 213,957 | 243,745 | ||||||
3.50%, 02/01/2033 | 787,979 | 819,565 | ||||||
5.50%, 02/01/2033 | 3,103 | 3,471 | ||||||
7.00%, 02/01/2033 | 1,702 | 1,830 | ||||||
5.50%, 03/01/2033 | 112,593 | 127,052 | ||||||
6.00%, 03/01/2033 | 2,795 | 3,147 | ||||||
6.00%, 03/01/2033 | 7,959 | 8,976 | ||||||
6.00%, 03/01/2033 | 4,629 | 5,223 | ||||||
6.00%, 03/01/2033 | 4,405 | 4,965 | ||||||
6.00%, 03/01/2033 | 7,250 | 8,266 | ||||||
5.50%, 04/01/2033 | 77,551 | 86,787 | ||||||
6.00%, 05/01/2033 | 27,012 | 31,135 | ||||||
3.50%, 06/01/2033 | 293,812 | 305,660 | ||||||
5.00%, 06/01/2033 | 21,443 | 23,576 | ||||||
7.00%, 06/01/2033 | 131,464 | 154,855 | ||||||
5.00%, 07/01/2033 | 27,161 | 29,862 | ||||||
5.00%, 07/01/2033 | 22,114 | 24,469 | ||||||
5.50%, 07/01/2033 | 17,656 | 19,622 | ||||||
3.07%, 08/01/2033 | 37,612 | 39,458 | ||||||
6.00%, 08/01/2033 | 12,672 | 14,554 | ||||||
2.76%, 09/01/2033 | 50,958 | 52,750 | ||||||
3.10%, 09/01/2033 | 20,403 | 21,784 | ||||||
5.50%, 09/01/2033 | 300,788 | 336,008 | ||||||
6.00%, 09/01/2033 | 15,489 | 17,042 | ||||||
6.00%, 09/01/2033 | 16,392 | 18,529 | ||||||
3.50%, 10/01/2033 | 14,442,540 | 15,071,561 | ||||||
4.50%, 10/01/2033 | 6,847,997 | 7,377,729 | ||||||
2.98%, 11/01/2033 | 47,497 | 50,227 | ||||||
4.50%, 11/01/2033 | 25,206 | 27,110 | ||||||
5.00%, 11/01/2033 | 7,272 | 7,978 | ||||||
5.00%, 11/01/2033 | 5,054,872 | 5,544,766 | ||||||
5.00%, 11/01/2033 | 323,270 | 354,587 | ||||||
5.50%, 11/01/2033 | 5,763 | 6,452 | ||||||
4.00%, 12/01/2033 | 62,833 | 66,070 | ||||||
5.50%, 12/01/2033 | 116,196 | 132,849 | ||||||
2.91%, 01/01/2034 | 3,369 | 3,379 | ||||||
3.23%, 01/01/2034 | 15,945 | 16,725 | ||||||
5.50%, 01/01/2034 | 10,437 | 11,896 | ||||||
5.50%, 03/01/2034 | 11,515 | 12,989 | ||||||
5.00%, 04/01/2034 | 145,040 | 161,606 | ||||||
5.00%, 05/01/2034 | 45,761 | 50,829 | ||||||
3.29%, 06/01/2034 | 61,225 | 64,408 | ||||||
2.68%, 07/01/2034 | 5,485 | 5,800 | ||||||
2.46%, 08/01/2034 | 38,985 | 40,262 | ||||||
2.90%, 08/01/2034 | 27,848 | 29,309 | ||||||
3.00%, 08/01/2034 | 9,142 | 9,654 | ||||||
2.79%, 09/01/2034 | 6,567 | 6,933 | ||||||
4.50%, 09/01/2034 | 34,793 | 37,375 | ||||||
5.50%, 09/01/2034 | 26,908 | 30,118 | ||||||
2.74%, 10/01/2034 | 24,369 | 25,915 | ||||||
2.92%, 10/01/2034 | 51,176 | 54,107 | ||||||
5.50%, 10/01/2034 | 34,145 | 36,232 | ||||||
2.54%, 11/01/2034 | 11,409 | 11,992 | ||||||
3.09%, 11/01/2034 | 25,443 | 26,819 | ||||||
3.57%, 11/01/2034 | 1,413,135 | 1,464,191 | ||||||
3.61%, 11/01/2034 | 1,437,833 | 1,497,531 | ||||||
5.50%, 11/01/2034 | 85,612 | 95,901 | ||||||
6.00%, 11/01/2034 | 7,267 | 8,300 | ||||||
5.00%, 12/01/2034 | 39,381 | 43,220 | ||||||
5.00%, 12/01/2034 | 371,963 | 408,216 | ||||||
| Principal Amount | Value | |||||||
5.50%, 12/01/2034 | 5,074,760 | 5,683,554 | ||||||
2.85%, 01/01/2035 | 324,423 | 336,758 | ||||||
3.20%, 01/01/2035 | 13,811 | 14,512 | ||||||
5.00%, 01/01/2035 | 39,520 | 43,883 | ||||||
7.50%, 01/01/2035 | 57,714 | 68,587 | ||||||
2.85%, 02/01/2035 | 20,155 | 20,850 | ||||||
5.00%, 02/01/2035 | 951,606 | 1,041,227 | ||||||
5.00%, 02/01/2035 | 4,449,601 | 4,882,111 | ||||||
5.50%, 02/01/2035 | 93,398 | 104,617 | ||||||
3.15%, 03/01/2035 | 56,075 | 58,960 | ||||||
7.50%, 03/01/2035 | 64,120 | 74,434 | ||||||
2.98%, 04/01/2035 | 66,407 | 69,794 | ||||||
3.45%, 04/01/2035 | 1,935,032 | 1,978,584 | ||||||
6.00%, 04/01/2035 | 135,694 | 155,024 | ||||||
3.17%, 05/01/2035 | 44,959 | 47,292 | ||||||
3.42%, 05/01/2035 | 9,348 | 9,769 | ||||||
3.12%, 06/01/2035 | 3,400,000 | 3,357,439 | ||||||
5.00%, 06/01/2035 | 32,106 | 35,144 | ||||||
5.00%, 06/01/2035 | 780,260 | 856,492 | ||||||
2.68%, 07/01/2035 | 48,560 | 51,229 | ||||||
5.00%, 07/01/2035 | 4,198,046 | 4,608,047 | ||||||
5.00%, 07/01/2035 | 32,974 | 36,181 | ||||||
5.00%, 07/01/2035 | 3,708,118 | 4,069,327 | ||||||
2.64%, 08/01/2035 | 7,938 | 8,349 | ||||||
2.86%, 09/01/2035 | 32,626 | 34,169 | ||||||
5.00%, 09/01/2035 | 82,899 | 92,319 | ||||||
3.19%, 10/01/2035 | 68,827 | 72,867 | ||||||
5.00%, 10/01/2035 | 398,627 | 437,557 | ||||||
5.00%, 10/01/2035 | 594,273 | 651,879 | ||||||
5.50%, 12/01/2035 | 49,219 | 53,108 | ||||||
2.67%, 01/01/2036 | 144,536 | 151,224 | ||||||
2.94%, 01/01/2036 | 66,237 | 69,700 | ||||||
3.88%, 01/01/2036 | 3,738 | 3,794 | ||||||
5.00%, 01/01/2036 | 74,687 | 82,003 | ||||||
6.50%, 01/01/2036 | 418,737 | 478,377 | ||||||
3.81%, 02/01/2036 | 23,116 | 24,383 | ||||||
5.00%, 02/01/2036 | 58,338 | 64,040 | ||||||
6.00%, 02/01/2036 | 6,357 | 6,982 | ||||||
7.00%, 02/01/2036 | 50,223 | 56,336 | ||||||
3.82%, 03/01/2036 | 525,768 | 556,738 | ||||||
7.00%, 03/01/2036 | 2,219 | 2,477 | ||||||
5.50%, 04/01/2036 | 106,732 | 119,434 | ||||||
6.50%, 04/01/2036 | 1,047 | 1,058 | ||||||
3.59%, 05/01/2036 | 32,304 | 34,290 | ||||||
5.50%, 05/01/2036 | 90,741 | 102,090 | ||||||
5.50%, 05/01/2036 | 140,963 | 156,939 | ||||||
3.15%, 06/01/2036 | 237,459 | 252,201 | ||||||
3.48%, 06/01/2036 | 54,808 | 58,429 | ||||||
3.50%, 06/01/2036 | 37,776 | 39,886 | ||||||
3.02%, 07/01/2036 | 89,375 | 94,406 | ||||||
6.50%, 07/01/2036 | 8,417 | 9,702 | ||||||
2.65%, 08/01/2036 | 52,675 | 55,579 | ||||||
2.95%, 08/01/2036 | 63,963 | 65,346 | ||||||
3.06%, 08/01/2036 | 185,687 | 197,427 | ||||||
3.50%, 08/01/2036 | 21,718 | 22,604 | ||||||
6.50%, 08/01/2036 | 271,019 | 308,017 | ||||||
2.71%, 09/01/2036 | 243,835 | 252,316 | ||||||
2.86%, 09/01/2036 | 86,459 | 91,290 | ||||||
2.98%, 09/01/2036 | 46,633 | 48,290 | ||||||
3.03%, 09/01/2036 | 171,745 | 182,423 | ||||||
3.20%, 09/01/2036 | 49,384 | 52,092 | ||||||
5.50%, 09/01/2036 | 1,772,915 | 1,986,092 | ||||||
6.00%, 09/01/2036 | 483,807 | 550,082 | ||||||
2.50%, 10/01/2036 | 9,831,800 | 9,692,300 | ||||||
3.07%, 10/01/2036 | 110,370 | 116,479 | ||||||
3.33%, 10/01/2036 | 78,563 | 83,468 | ||||||
3.38%, 10/01/2036 | 144,755 | 153,999 | ||||||
6.50%, 10/01/2036 | 61,175 | 70,144 | ||||||
3.00%, 11/01/2036 | 9,515,007 | 9,662,226 | ||||||
3.39%, 11/01/2036 | 39,661 | 41,965 | ||||||
| Principal Amount | Value | |||||||
3.60%, 11/01/2036 | 46,706 | 49,599 | ||||||
5.50%, 11/01/2036 | 35,698 | 39,896 | ||||||
6.00%, 11/01/2036 | 77,541 | 88,064 | ||||||
2.50%, 12/01/2036 | 5,494,086 | 5,416,133 | ||||||
3.31%, 12/01/2036 | 220,105 | 231,953 | ||||||
3.44%, 12/01/2036 | 41,865 | 44,267 | ||||||
7.00%, 12/01/2036 | 8,017 | 8,771 | ||||||
2.72%, 01/01/2037 | 77,235 | 80,104 | ||||||
3.47%, 01/01/2037 | 50,167 | 53,076 | ||||||
6.50%, 01/01/2037 | 164,179 | 184,404 | ||||||
7.50%, 01/01/2037 | 14,900 | 16,079 | ||||||
2.76%, 02/01/2037 | 113,142 | 117,686 | ||||||
3.30%, 02/01/2037 | 108,848 | 114,153 | ||||||
5.50%, 03/01/2037 | 682,674 | 763,216 | ||||||
6.00%, 03/01/2037 | 139,037 | 149,954 | ||||||
7.00%, 03/01/2037 | 25,047 | 28,330 | ||||||
3.48%, 04/01/2037 | 244,503 | 258,269 | ||||||
5.50%, 04/01/2037 | 221,775 | 248,116 | ||||||
7.00%, 04/01/2037 | 20,723 | 23,094 | ||||||
7.00%, 04/01/2037 | 113,378 | 132,264 | ||||||
3.50%, 05/01/2037 | 7,274,872 | 7,544,770 | ||||||
5.50%, 05/01/2037 | 375,807 | 419,760 | ||||||
6.50%, 05/01/2037 | 8,615 | 8,842 | ||||||
7.50%, 05/01/2037 | 45,508 | 52,354 | ||||||
2.61%, 07/01/2037 | 122,066 | 126,816 | ||||||
2.72%, 07/01/2037 | 8,616 | 8,956 | ||||||
3.04%, 07/01/2037 | 274,884 | 292,419 | ||||||
3.11%, 07/01/2037 | 111,159 | 117,871 | ||||||
5.00%, 07/01/2037 | 1,079,938 | 1,185,104 | ||||||
5.00%, 07/01/2037 | 806,269 | 885,027 | ||||||
5.00%, 07/01/2037 | 290,549 | 318,531 | ||||||
3.82%, 08/01/2037 | 228,633 | 241,906 | ||||||
5.50%, 08/01/2037 | 2,733,340 | 3,062,702 | ||||||
5.50%, 08/01/2037 | 1,372,392 | 1,540,521 | ||||||
6.50%, 08/01/2037 | 48,725 | 56,597 | ||||||
6.50%, 08/01/2037 | 37,756 | 43,774 | ||||||
2.71%, 09/01/2037 | 40,060 | 42,123 | ||||||
3.03%, 09/01/2037 | 10,819 | 11,103 | ||||||
3.06%, 09/01/2037 | 125,142 | 132,744 | ||||||
3.25%, 09/01/2037 | 14,647 | 15,004 | ||||||
5.08%, 09/01/2037 | 22,067 | 22,951 | ||||||
6.00%, 09/01/2037 | 106,128 | 120,709 | ||||||
7.00%, 09/01/2037 | 88,411 | 103,190 | ||||||
6.50%, 10/01/2037 | 110,311 | 123,756 | ||||||
7.50%, 10/01/2037 | 239,056 | 282,756 | ||||||
2.62%, 11/01/2037 | 86,201 | 90,914 | ||||||
2.79%, 11/01/2037 | 241,910 | 254,102 | ||||||
7.50%, 11/01/2037 | 84,119 | 97,548 | ||||||
8.00%, 11/01/2037 | 16,730 | 18,563 | ||||||
2.84%, 12/01/2037 | 444,302 | 470,006 | ||||||
3.41%, 01/01/2038 | 26,566 | 27,656 | ||||||
5.50%, 01/01/2038 | 209,003 | 233,396 | ||||||
8.00%, 01/01/2038 | 7,733 | 9,233 | ||||||
5.00%, 02/01/2038 | 136,665 | 149,975 | ||||||
5.50%, 02/01/2038 | 270,581 | 303,240 | ||||||
6.00%, 04/01/2038 | 38,467 | 43,262 | ||||||
5.50%, 05/01/2038 | 45,406 | 48,933 | ||||||
6.00%, 05/01/2038 | 365,970 | 413,579 | ||||||
5.50%, 06/01/2038 | 208,632 | 233,017 | ||||||
5.50%, 06/01/2038 | 1,552,731 | 1,727,800 | ||||||
5.50%, 09/01/2038 | 1,215,727 | 1,361,544 | ||||||
7.00%, 09/01/2038 | 84,664 | 104,205 | ||||||
6.50%, 10/01/2038 | 132,413 | 150,597 | ||||||
6.50%, 10/01/2038 | 511,858 | 577,399 | ||||||
7.00%, 10/01/2038 | 139,126 | 165,739 | ||||||
6.00%, 11/01/2038 | 88,769 | 102,317 | ||||||
7.00%, 11/01/2038 | 79,857 | 93,425 | ||||||
7.50%, 11/01/2038 | 63,282 | 77,541 | ||||||
7.00%, 12/01/2038 | 240,547 | 285,072 | ||||||
5.00%, 01/01/2039 | 3,348,484 | 3,654,989 | ||||||
| Principal Amount | Value | |||||||
7.00%, 01/01/2039 | 409,341 | �� | 473,973 | |||||
7.50%, 04/01/2039 | 279,946 | 342,716 | ||||||
5.00%, 06/01/2039 | 4,637,859 | 5,084,783 | ||||||
5.50%, 06/01/2039 | 28,106 | 30,242 | ||||||
5.00%, 09/01/2039 | 182,173 | 199,333 | ||||||
5.50%, 09/01/2039 | 138,196 | 153,723 | ||||||
4.50%, 11/01/2039 | 36,736 | 39,565 | ||||||
5.50%, 12/01/2039 | 152,027 | 169,141 | ||||||
6.00%, 12/01/2039 | 1,857,639 | 2,105,659 | ||||||
5.50%, 01/01/2040 | 809,132 | 919,187 | ||||||
4.00%, 07/01/2040 (3) | 128,935,000 | 135,512,696 | ||||||
4.00%, 07/01/2040 | 7,154,155 | 7,553,335 | ||||||
5.50%, 07/01/2040 (3) | 8,000,000 | 8,862,969 | ||||||
4.00%, 08/01/2040 | 253,451 | 267,643 | ||||||
4.50%, 08/01/2040 | 5,402,661 | 5,834,915 | ||||||
4.50%, 08/01/2040 | 2,042,350 | 2,209,498 | ||||||
4.50%, 08/01/2040 | 5,688,607 | 6,150,453 | ||||||
5.00%, 08/01/2040 | 471,694 | 517,492 | ||||||
5.00%, 08/01/2040 | 1,035,037 | 1,132,031 | ||||||
4.00%, 08/15/2040 (3) | 20,000,000 | 20,983,984 | ||||||
4.00%, 09/01/2040 | 1,883,797 | 1,989,019 | ||||||
4.00%, 10/01/2040 | 2,161,616 | 2,282,011 | ||||||
6.00%, 10/01/2040 | 2,435,498 | 2,763,426 | ||||||
3.50%, 12/01/2040 | 155,873 | 160,934 | ||||||
4.00%, 12/01/2040 | 343,809 | 362,674 | ||||||
4.00%, 12/01/2040 | 1,853,813 | 1,957,179 | ||||||
4.50%, 12/01/2040 | 2,320,105 | 2,508,882 | ||||||
4.50%, 12/01/2040 | 7,986,145 | 8,635,646 | ||||||
4.00%, 01/01/2041 | 2,475,733 | 2,613,739 | ||||||
4.00%, 01/01/2041 | 2,195,150 | 2,317,187 | ||||||
4.00%, 01/01/2041 | 751,610 | 793,286 | ||||||
4.00%, 01/01/2041 | 1,476,518 | 1,558,277 | ||||||
4.00%, 01/01/2041 | 2,513,301 | 2,653,307 | ||||||
4.00%, 01/01/2041 | 1,062,205 | 1,121,004 | ||||||
4.00%, 01/01/2041 | 331,929 | 350,296 | ||||||
3.50%, 02/01/2041 | 13,034,474 | 13,456,153 | ||||||
4.00%, 02/01/2041 | 3,540,026 | 3,736,567 | ||||||
4.00%, 02/01/2041 | 92,183 | 97,229 | ||||||
4.00%, 02/01/2041 | 2,071,435 | 2,187,610 | ||||||
4.50%, 03/01/2041 | 1,643,618 | 1,777,622 | ||||||
5.50%, 03/01/2041 | 65,933 | 73,847 | ||||||
4.50%, 04/01/2041 | 1,498,945 | 1,620,802 | ||||||
4.50%, 05/01/2041 | 2,715,466 | 2,932,943 | ||||||
6.00%, 07/01/2041 | 6,473,578 | 7,332,830 | ||||||
3.50%, 07/15/2041 (3) | 80,295,000 | 82,444,168 | ||||||
4.50%, 07/15/2041 (3) | 55,285,000 | 59,288,801 | ||||||
4.00%, 09/01/2041 | 406,534 | 428,887 | ||||||
4.00%, 10/01/2041 | 1,584,367 | 1,672,230 | ||||||
4.00%, 10/01/2041 | 1,079,780 | 1,139,189 | ||||||
3.50%, 11/01/2041 | 5,528,267 | 5,701,909 | ||||||
3.50%, 11/01/2041 | 545,515 | 562,728 | ||||||
3.50%, 12/01/2041 | 10,241,090 | 10,564,230 | ||||||
4.00%, 12/01/2041 | 2,078,053 | 2,191,560 | ||||||
4.00%, 12/01/2041 | 3,160,791 | 3,334,675 | ||||||
4.00%, 01/01/2042 | 4,806,094 | 5,070,482 | ||||||
4.50%, 01/01/2042 | 3,669,381 | 3,967,072 | ||||||
3.50%, 02/01/2042 | 673,075 | 694,350 | ||||||
4.00%, 03/01/2042 | 207,394 | 216,116 | ||||||
3.00%, 05/01/2042 | 751,156 | 754,176 | ||||||
3.50%, 05/01/2042 | 10,823,710 | 11,163,317 | ||||||
5.00%, 05/01/2042 | 3,449,440 | 3,771,045 | ||||||
3.50%, 06/01/2042 | 2,398,731 | 2,474,417 | ||||||
3.50%, 07/01/2042 | 1,647,911 | 1,699,663 | ||||||
3.50%, 07/01/2042 | 5,643,154 | 5,819,234 | ||||||
4.00%, 07/01/2042 | 593,586 | 629,242 | ||||||
4.00%, 07/01/2042 | 1,086,579 | 1,151,725 | ||||||
4.00%, 07/01/2042 | 558,795 | 592,037 | ||||||
4.00%, 07/01/2042 | 662,047 | 701,432 | ||||||
4.00%, 08/01/2042 | 7,718,786 | 8,143,568 | ||||||
3.50%, 09/01/2042 | 7,375,534 | 7,605,643 | ||||||
| Principal Amount | Value | |||||||
3.50%, 09/01/2042 | 1,337,984 | 1,380,582 | ||||||
3.00%, 10/01/2042 | 6,838,908 | 6,866,450 | ||||||
3.50%, 10/01/2042 | 1,042,411 | 1,074,718 | ||||||
3.50%, 10/01/2042 | 570,931 | 589,207 | ||||||
3.00%, 11/01/2042 | 2,636,892 | 2,647,512 | ||||||
3.50%, 11/01/2042 | 9,562,177 | 9,857,566 | ||||||
3.50%, 11/01/2042 | 4,055,415 | 4,179,857 | ||||||
4.50%, 11/01/2042 | 13,174,127 | 14,242,592 | ||||||
3.00%, 12/01/2042 | 1,589,120 | 1,595,520 | ||||||
3.00%, 12/01/2042 | 152,711 | 153,324 | ||||||
3.00%, 01/01/2043 | 2,217,384 | 2,226,289 | ||||||
3.00%, 01/01/2043 | 1,340,444 | 1,345,841 | ||||||
3.00%, 01/01/2043 | 2,340,817 | 2,350,241 | ||||||
3.00%, 01/01/2043 | 2,118,274 | 2,120,893 | ||||||
3.50%, 01/01/2043 | 1,477,498 | 1,522,869 | ||||||
3.50%, 01/01/2043 | 1,099,269 | 1,134,339 | ||||||
3.00%, 02/01/2043 | 1,193,454 | 1,194,940 | ||||||
3.50%, 02/01/2043 | 98,838 | 101,856 | ||||||
3.50%, 02/01/2043 | 98,296 | 101,375 | ||||||
3.50%, 03/01/2043 | 769,072 | 793,669 | ||||||
3.50%, 03/01/2043 | 2,070,306 | 2,135,805 | ||||||
3.00%, 04/01/2043 | 1,673,327 | 1,680,057 | ||||||
3.00%, 04/01/2043 | 3,783,498 | 3,798,543 | ||||||
3.50%, 04/01/2043 | 2,493,963 | 2,574,335 | ||||||
3.50%, 04/01/2043 | 6,556,315 | 6,753,908 | ||||||
3.00%, 05/01/2043 | 201,285 | 202,054 | ||||||
3.00%, 05/01/2043 | 363,888 | 365,332 | ||||||
3.00%, 05/01/2043 | 14,295,474 | 14,352,201 | ||||||
3.00%, 05/01/2043 | 496,961 | 498,902 | ||||||
3.50%, 05/01/2043 | 131,450 | 135,724 | ||||||
3.50%, 05/01/2043 | 2,769,056 | 2,857,384 | ||||||
3.50%, 05/01/2043 | 2,077,520 | 2,143,675 | ||||||
3.50%, 05/01/2043 | 1,047,904 | 1,081,249 | ||||||
3.00%, 06/01/2043 | 340,977 | 342,311 | ||||||
3.00%, 06/01/2043 | 9,470,813 | 9,506,977 | ||||||
3.00%, 06/01/2043 | 118,084 | 118,559 | ||||||
3.00%, 06/01/2043 | 984,732 | 988,697 | ||||||
3.00%, 06/01/2043 | 147,723 | 148,310 | ||||||
3.00%, 06/01/2043 | 782,582 | 785,573 | ||||||
3.50%, 06/01/2043 | 2,469,706 | 2,548,462 | ||||||
3.00%, 07/01/2043 | 1,395,594 | 1,400,917 | ||||||
3.00%, 07/01/2043 | 542,057 | 544,128 | ||||||
3.00%, 07/01/2043 | 419,473 | 421,051 | ||||||
3.00%, 07/01/2043 | 4,371,106 | 4,388,036 | ||||||
3.00%, 07/01/2043 | 10,511,774 | 10,552,490 | ||||||
3.00%, 07/01/2043 | 1,966,677 | 1,973,889 | ||||||
3.00%, 07/01/2043 | 102,710 | 103,108 | ||||||
3.00%, 07/01/2043 | 446,813 | 448,543 | ||||||
3.00%, 07/01/2043 | 154,623 | 155,197 | ||||||
3.00%, 07/01/2043 | 617,706 | 620,130 | ||||||
3.00%, 07/01/2043 | 114,326 | 114,757 | ||||||
3.50%, 07/01/2043 | 12,893,516 | 13,301,445 | ||||||
4.00%, 07/01/2043 | 1,467,516 | 1,555,716 | ||||||
3.00%, 08/01/2043 | 2,122,209 | 2,129,772 | ||||||
3.00%, 08/01/2043 | 4,434,775 | 4,451,249 | ||||||
3.00%, 08/01/2043 | 2,329,799 | 2,338,566 | ||||||
3.00%, 08/01/2043 | 5,062,447 | 5,082,837 | ||||||
3.00%, 08/01/2043 | 1,140,189 | 1,144,779 | ||||||
3.00%, 09/01/2043 | 80,916 | 81,192 | ||||||
3.00%, 09/01/2043 | 145,865 | 146,358 | ||||||
3.00%, 09/01/2043 | 1,998,664 | 2,006,097 | ||||||
3.00%, 09/01/2043 | 3,367,676 | 3,380,006 | ||||||
5.00%, 09/01/2043 | 1,878,008 | 2,049,912 | ||||||
2.50%, 10/01/2043 | 2,925,811 | 2,832,573 | ||||||
3.00%, 10/01/2043 | 62,975 | 63,228 | ||||||
3.00%, 10/01/2043 | 141,114 | 141,682 | ||||||
3.00%, 10/01/2043 | 122,431 | 122,886 | ||||||
4.00%, 11/01/2043 | 5,738,714 | 6,038,735 | ||||||
4.00%, 12/01/2043 | 242,017 | 254,537 | ||||||
4.00%, 12/01/2043 | 2,915,926 | 3,094,545 | ||||||
| Principal Amount | Value | |||||||
3.00%, 02/01/2044 | 9,600,675 | 9,639,181 | ||||||
4.00%, 09/01/2044 | 2,163,081 | 2,274,528 | ||||||
4.00%, 11/01/2044 | 4,989,930 | 5,283,045 | ||||||
3.50%, 02/01/2045 | 11,535,266 | 11,895,775 | ||||||
3.00%, 04/01/2045 | 10,903,672 | 10,920,554 | ||||||
3.50%, 04/01/2045 | 17,682,328 | 18,166,777 | ||||||
3.00%, 05/01/2045 | 5,506,091 | 5,528,280 | ||||||
3.50%, 06/01/2045 | 3,957,203 | 4,065,620 | ||||||
4.00%, 07/01/2045 | 12,139,124 | 12,821,828 | ||||||
3.50%, 08/01/2045 | 9,169,312 | 9,445,109 | ||||||
3.50%, 10/01/2045 | 1,814,706 | 1,877,740 | ||||||
3.50%, 11/01/2045 | 4,406,867 | 4,527,604 | ||||||
3.50%, 12/01/2045 | 3,801,790 | 3,925,309 | ||||||
4.00%, 12/01/2045 | 2,294,090 | 2,412,286 | ||||||
4.00%, 12/01/2045 | 10,713,473 | 11,265,455 | ||||||
3.50%, 01/01/2046 | 14,586,062 | 14,985,682 | ||||||
4.00%, 01/01/2046 | 6,366,731 | 6,694,760 | ||||||
4.00%, 01/01/2046 | 5,315,958 | 5,627,845 | ||||||
3.50%, 02/01/2046 | 7,336,561 | 7,575,629 | ||||||
4.50%, 02/01/2046 | 13,553,736 | 14,639,266 | ||||||
3.50%, 03/01/2046 | 1,919,949 | 1,987,549 | ||||||
4.00%, 03/01/2046 | 10,403,874 | 11,014,929 | ||||||
4.00%, 03/01/2046 | 8,639,085 | 9,146,488 | ||||||
3.50%, 04/01/2046 | 7,902,605 | 8,137,541 | ||||||
2.50%, 05/01/2046 | 1,897,707 | 1,829,557 | ||||||
3.50%, 05/01/2046 | 3,249,960 | 3,361,490 | ||||||
3.50%, 06/01/2046 | 5,504,373 | 5,696,266 | ||||||
3.50%, 06/01/2046 | 8,851,860 | 9,132,767 | ||||||
3.50%, 06/01/2046 | 1,697,932 | 1,751,814 | ||||||
2.50%, 07/01/2046 | 3,847,031 | 3,708,878 | ||||||
3.50%, 07/01/2046 | 311,462 | 321,346 | ||||||
4.00%, 07/01/2046 | 9,377,198 | 9,927,973 | ||||||
3.00%, 08/01/2046 | 150,373 | 150,686 | ||||||
3.00%, 09/01/2046 | 451,394 | 452,335 | ||||||
3.00%, 09/01/2046 | 434,063 | 434,970 | ||||||
3.50%, 09/01/2046 | 4,067,865 | 4,189,440 | ||||||
4.00%, 10/01/2046 | 694,975 | 734,118 | ||||||
3.00%, 11/01/2046 | 1,240,686 | 1,243,279 | ||||||
3.50%, 11/01/2046 | 19,050,752 | 19,572,693 | ||||||
4.00%, 11/01/2046 | 1,672,126 | 1,772,556 | ||||||
3.50%, 12/01/2046 | 9,745,097 | 10,054,345 | ||||||
3.00%, 01/01/2047 | 9,891,468 | 9,882,985 | ||||||
3.00%, 01/01/2047 | 5,262,063 | 5,269,573 | ||||||
3.00%, 01/01/2047 | 1,955,615 | 1,959,706 | ||||||
3.50%, 03/01/2047 | 10,083,259 | 10,404,876 | ||||||
3.50%, 03/01/2047 | 10,306,411 | 10,635,147 | ||||||
3.50%, 04/01/2047 | 9,936,275 | 10,253,211 | ||||||
3.50%, 04/01/2047 | 2,693,779 | 2,779,699 | ||||||
4.50%, 04/01/2047 | 6,191,761 | 6,642,536 | ||||||
4.00%, 06/01/2047 | 3,700,000 | 3,960,338 | ||||||
4.50%, 06/01/2047 | 8,194,784 | 8,801,486 | ||||||
3.50%, 07/01/2047 | 10,345,800 | 10,675,809 | ||||||
6.00%, 11/01/2048 | 53,760 | 58,693 | ||||||
Fannie Mae REMIC Trust 2003-W1 | ||||||||
5.54%, 12/25/2042 | 138,090 | 150,545 | ||||||
6.12%, 12/25/2042 | 36,618 | 41,899 | ||||||
Fannie Mae REMIC Trust 2003-W4 | ||||||||
6.15%, 10/25/2042 | 20,871 | 24,583 | ||||||
Fannie Mae REMIC Trust 2004-W10 | ||||||||
5.75%, 08/25/2034 | 702,000 | 797,457 | ||||||
Fannie Mae REMIC Trust 2004-W11 | ||||||||
6.00%, 05/25/2044 | 114,500 | 130,558 | ||||||
Fannie Mae REMIC Trust 2005-W1 | ||||||||
6.50%, 10/25/2044 | 200,001 | 229,235 | ||||||
Fannie Mae REMIC Trust 2006-W3 | ||||||||
6.00%, 09/25/2046 | 183,384 | 208,011 | ||||||
Fannie Mae REMIC Trust 2007-W1 | ||||||||
6.36%, 08/25/2047 | 24,707 | 27,444 | ||||||
Fannie Mae REMIC Trust 2007-W3 | ||||||||
6.75%, 04/25/2037 | 43,217 | 49,062 | ||||||
| Principal Amount | Value | |||||||
Fannie Mae REMIC Trust 2007-W5 | ||||||||
0.00%, 06/25/2037 PO | 43,111 | 38,670 | ||||||
Fannie Mae REMIC Trust 2007-W7 | ||||||||
31.88%, 07/25/2037 | 33,753 | 48,030 | ||||||
Fannie Mae REMIC Trust 2009-W1 | ||||||||
6.00%, 12/25/2049 | 905,668 | 1,026,082 | ||||||
Fannie Mae REMICS | ||||||||
5.50%, 09/25/2017 | 7 | 7 | ||||||
5.00%, 10/25/2017 | 481 | 481 | ||||||
5.00%, 05/25/2018 | 5,076 | 5,128 | ||||||
4.75%, 09/25/2018 | 28,911 | 29,247 | ||||||
4.00%, 04/25/2019 | 7,768 | 7,942 | ||||||
8.00%, 07/25/2019 | 3,174 | 3,293 | ||||||
8.00%, 10/25/2019 | 993 | 1,038 | ||||||
4.00%, 11/25/2019 | 8,850 | 8,938 | ||||||
8.50%, 11/25/2019 | 661 | 699 | ||||||
9.00%, 11/25/2019 | 334 | 352 | ||||||
9.40%, 11/25/2019 | 505 | 533 | ||||||
7.50%, 12/25/2019 | 1,442 | 1,510 | ||||||
8.50%, 01/25/2020 | 164 | 174 | ||||||
8.80%, 01/25/2020 | 401 | 424 | ||||||
7.00%, 05/25/2020 | 154 | 164 | ||||||
5.50%, 06/25/2020 | 164 | 170 | ||||||
9.50%, 06/25/2020 | 273 | 294 | ||||||
7.00%, 07/25/2020 | 1,496 | 1,566 | ||||||
5.50%, 08/25/2020 | 220 | 228 | ||||||
6.50%, 08/25/2020 | 2,383 | 2,500 | ||||||
505.00%, 08/25/2020 | 4 | 24 | ||||||
1118.04%, 08/25/2020 IO | 5 | 34 | ||||||
6.50%, 09/25/2020 | 1,022 | 1,070 | ||||||
7.00%, 09/25/2020 | 273 | 288 | ||||||
9.00%, 10/25/2020 | 1,202 | 1,287 | ||||||
19.78%, 11/25/2020 | 190 | 239 | ||||||
652.15%, 12/25/2020 IO | 10 | 87 | ||||||
7.00%, 01/25/2021 | 361 | 380 | ||||||
5.00%, 03/25/2021 | 386 | 400 | ||||||
7.00%, 03/25/2021 | 14,719 | 15,448 | ||||||
15.55%, 05/25/2021 | 266 | 309 | ||||||
8.50%, 06/25/2021 | 339 | 369 | ||||||
8.75%, 06/25/2021 | 1,446 | 1,553 | ||||||
955.93%, 06/25/2021 | 6 | 44 | ||||||
6.50%, 07/25/2021 | 994 | 1,058 | ||||||
6.50%, 09/25/2021 | 88,616 | 94,896 | ||||||
13.88%, 09/25/2021 | 705 | 765 | ||||||
8.75%, 10/25/2021 | 2,627 | 2,791 | ||||||
24.18%, 12/25/2021 | 361 | 443 | ||||||
6.00%, 02/25/2022 | 88,835 | 96,847 | ||||||
6.50%, 02/25/2022 | 14,242 | 15,277 | ||||||
0.00%, 03/25/2022 PO | 34,985 | 33,763 | ||||||
7.50%, 06/25/2022 | 97 | 106 | ||||||
7.00%, 07/25/2022 | 1,334 | 1,420 | ||||||
7.50%, 07/25/2022 | 14,702 | 15,995 | ||||||
8.00%, 07/25/2022 | 904 | 904 | ||||||
8.00%, 07/25/2022 | 17,244 | 19,063 | ||||||
1184.78%, 07/25/2022 IO | 5 | 91 | ||||||
6.00%, 08/25/2022 | 2,465 | 2,632 | ||||||
6.50%, 08/25/2022 | 3,493 | 3,760 | ||||||
1.24%, 09/25/2022 | 1,374 | 1,373 | ||||||
5.50%, 09/25/2022 | 1,846 | 1,936 | ||||||
6.00%, 09/25/2022 | 112,946 | 123,701 | ||||||
7.50%, 09/25/2022 | 12,881 | 13,869 | ||||||
7.75%, 09/25/2022 | 6,435 | 7,064 | ||||||
8.00%, 09/25/2022 | 20,097 | 22,203 | ||||||
0.00%, 10/25/2022 PO | 2,058 | 1,967 | ||||||
1.35%, 10/25/2022 | 1,140 | 1,154 | ||||||
7.00%, 10/25/2022 | 2,793 | 3,042 | ||||||
7.50%, 10/25/2022 | 9,051 | 9,936 | ||||||
7.90%, 01/25/2023 | 9,830 | 10,892 | ||||||
6.50%, 02/25/2023 | 3,928 | 4,217 | ||||||
7.00%, 02/25/2023 | 42,487 | 46,524 | ||||||
| Principal Amount | Value | |||||||
15.50%, 02/25/2023 | 1,638 | 2,164 | ||||||
5.50%, 03/25/2023 | 194,050 | 209,390 | ||||||
6.50%, 03/25/2023 | 2,990 | 3,238 | ||||||
7.00%, 03/25/2023 | 25,353 | 27,462 | ||||||
7.50%, 03/25/2023 | 10,049 | 11,072 | ||||||
7.70%, 03/25/2023 | 4,205 | 4,637 | ||||||
0.00%, 04/25/2023 PO | 1,529 | 1,457 | ||||||
5.50%, 04/25/2023 | 11,080 | 11,736 | ||||||
5.50%, 04/25/2023 | 358,478 | 387,980 | ||||||
6.00%, 04/25/2023 | 6,822 | 7,561 | ||||||
7.00%, 04/25/2023 | 8,957 | 9,701 | ||||||
17.47%, 04/25/2023 IO | 7,769 | 2,453 | ||||||
19.03%, 04/25/2023 | 4,297 | 5,603 | ||||||
5.50%, 05/25/2023 | 85,855 | 91,922 | ||||||
7.00%, 05/25/2023 | 99,434 | 108,603 | ||||||
5.00%, 06/25/2023 | 57,178 | 58,229 | ||||||
5.28%, 06/25/2023 IO | 56,890 | 3,814 | ||||||
4.50%, 07/25/2023 | 139,859 | 148,688 | ||||||
6.50%, 07/25/2023 | 2,340 | 2,537 | ||||||
6.79%, 07/25/2023 | 51,711 | 56,398 | ||||||
7.00%, 07/25/2023 | 50,673 | 55,485 | ||||||
7.00%, 07/25/2023 | 32,464 | 35,376 | ||||||
2.10%, 08/25/2023 | 5,965 | 6,055 | ||||||
6.83%, 08/25/2023 IO | 1,741 | 178 | ||||||
6.88%, 08/25/2023 | 45,210 | 49,011 | ||||||
7.00%, 08/25/2023 | 80,869 | 88,322 | ||||||
8.49%, 08/25/2023 IO | 41,055 | 7,113 | ||||||
0.00%, 09/25/2023 PO | 1,470 | 1,405 | ||||||
0.00%, 09/25/2023 PO | 3,787 | 3,593 | ||||||
1.87%, 09/25/2023 | 25,933 | 25,951 | ||||||
6.50%, 09/25/2023 | 4,252 | 4,638 | ||||||
12.50%, 09/25/2023 | 2,934 | 3,284 | ||||||
13.49%, 09/25/2023 | 2,363 | 2,845 | ||||||
6.50%, 10/25/2023 | 27,519 | 29,976 | ||||||
6.50%, 10/25/2023 | 63,561 | 70,460 | ||||||
10.50%, 10/25/2023 | 1,356 | 1,641 | ||||||
19.97%, 10/25/2023 | 3,779 | 5,234 | ||||||
26.93%, 10/25/2023 | 2,033 | 2,932 | ||||||
0.00%, 11/25/2023 PO | 427 | 406 | ||||||
6.50%, 11/25/2023 | 24,233 | 26,863 | ||||||
1.82%, 12/25/2023 | 1,885 | 1,890 | ||||||
2.22%, 12/25/2023 | 5,207 | 5,263 | ||||||
6.50%, 12/25/2023 | 6,297 | 6,897 | ||||||
12.31%, 12/25/2023 | 2,423 | 2,948 | ||||||
20.24%, 12/25/2023 | 5,207 | 7,173 | ||||||
28.16%, 12/25/2023 | 6,400 | 9,357 | ||||||
5.00%, 02/25/2024 IO | 75,459 | 3,981 | ||||||
5.00%, 03/25/2024 IO | 36,564 | 975 | ||||||
5.00%, 03/25/2024 IO | 27,263 | 945 | ||||||
6.50%, 03/25/2024 | 21,249 | 23,181 | ||||||
6.50%, 03/25/2024 | 116,837 | 127,553 | ||||||
7.00%, 04/25/2024 | 76,990 | 85,692 | ||||||
7.00%, 04/25/2024 | 172,260 | 188,003 | ||||||
5.50%, 07/25/2024 | 21,278 | 22,818 | ||||||
5.50%, 08/25/2024 | 198,757 | 215,512 | ||||||
5.00%, 11/25/2024 | 313,789 | 335,961 | ||||||
8.50%, 01/25/2025 | 3,907 | 4,140 | ||||||
8.80%, 01/25/2025 | 7,524 | 8,696 | ||||||
1.52%, 07/25/2025 | 30,367 | 30,406 | ||||||
5.50%, 08/25/2025 | 178,457 | 195,442 | ||||||
5.50%, 01/25/2026 | 128,527 | 137,086 | ||||||
27.17%, 10/25/2026 | 25,247 | 38,310 | ||||||
7.00%, 11/25/2026 | 42,043 | 46,641 | ||||||
1.84%, 03/25/2027 IO | 22,501 | 640 | ||||||
1.84%, 03/25/2027 IO | 7,419 | 229 | ||||||
7.50%, 04/18/2027 | 7,180 | 8,281 | ||||||
7.50%, 04/20/2027 | 10,693 | 12,341 | ||||||
6.50%, 04/25/2027 | 25,446 | 28,208 | ||||||
7.50%, 05/20/2027 | 44,540 | 51,462 | ||||||
1.62%, 05/25/2027 | 3,683,810 | 3,706,180 | ||||||
| Principal Amount | Value | |||||||
6.50%, 07/18/2027 | 2,349 | 2,605 | ||||||
7.00%, 12/18/2027 IO | 11,216 | 1,261 | ||||||
6.00%, 07/18/2028 | 13,347 | 15,045 | ||||||
6.38%, 07/25/2028 IO | 395,401 | 56,966 | ||||||
3.00%, 12/25/2028 | 1,237,521 | 1,210,152 | ||||||
6.00%, 12/25/2028 | 7,620 | 8,257 | ||||||
6.93%, 12/25/2028 IO | 12,695 | 1,639 | ||||||
5.00%, 03/25/2029 | 349,123 | 376,063 | ||||||
5.50%, 04/18/2029 | 33,026 | 36,239 | ||||||
6.35%, 04/25/2029 | 8,654 | 9,520 | ||||||
7.50%, 12/18/2029 | 12,618 | 14,508 | ||||||
7.50%, 02/25/2030 | 71,104 | 82,319 | ||||||
7.88%, 07/25/2030 IO | 25,405 | 4,445 | ||||||
8.50%, 01/25/2031 IO | 3,183 | 696 | ||||||
7.00%, 03/25/2031 | 8,714 | 10,127 | ||||||
3.50%, 04/25/2031 | 1,084,000 | 1,139,654 | ||||||
6.00%, 07/25/2031 IO | 44,445 | 9,947 | ||||||
7.00%, 07/25/2031 | 24,998 | 29,033 | ||||||
7.00%, 08/25/2031 | 45,853 | 52,451 | ||||||
6.50%, 09/25/2031 | 10,598 | 12,029 | ||||||
7.00%, 09/25/2031 | 10,786 | 12,523 | ||||||
7.00%, 09/25/2031 | 12,084 | 13,939 | ||||||
7.00%, 09/25/2031 | 66,116 | 76,899 | ||||||
20.24%, 09/25/2031 | 33,533 | 48,753 | ||||||
6.50%, 10/25/2031 | 8,568 | 9,443 | ||||||
19.30%, 10/25/2031 | 20,877 | 28,791 | ||||||
6.00%, 11/25/2031 | 79,290 | 89,421 | ||||||
7.00%, 11/25/2031 | 83,137 | 96,821 | ||||||
13.08%, 11/25/2031 | 23,859 | 32,433 | ||||||
14.63%, 12/25/2031 | 2,604 | 3,315 | ||||||
0.00%, 01/25/2032 PO | 3,348 | 3,069 | ||||||
21.24%, 02/25/2032 | 9,193 | 15,267 | ||||||
1.60%, 03/25/2032 IO | 89,583 | 4,730 | ||||||
10.00%, 03/25/2032 | 1,243 | 1,578 | ||||||
0.00%, 04/25/2032 PO | 2,593 | 2,279 | ||||||
6.00%, 04/25/2032 | 206,819 | 234,280 | ||||||
6.50%, 04/25/2032 | 38,502 | 43,865 | ||||||
6.50%, 05/25/2032 | 77,904 | 88,594 | ||||||
6.50%, 06/25/2032 | 31,448 | 35,251 | ||||||
6.50%, 07/25/2032 IO | 147,578 | 23,482 | ||||||
6.50%, 08/25/2032 | 90,583 | 102,861 | ||||||
16.46%, 08/25/2032 | 56,661 | 61,517 | ||||||
2.02%, 11/25/2032 | 397,084 | 405,146 | ||||||
5.00%, 11/25/2032 | 20,467 | 21,895 | ||||||
6.00%, 11/25/2032 | 579,893 | 656,129 | ||||||
8.50%, 11/25/2032 | 25,926 | 30,263 | ||||||
0.00%, 12/25/2032 PO | 17,057 | 15,455 | ||||||
5.50%, 12/25/2032 | 199,146 | 211,547 | ||||||
12.25%, 12/25/2032 | 14,003 | 16,667 | ||||||
0.00%, 01/25/2033 PO | 13,514 | 13,376 | ||||||
6.50%, 02/25/2033 | 26,228 | 29,308 | ||||||
5.00%, 03/25/2033 IO | 37,689 | 5,205 | ||||||
6.00%, 03/25/2033 | 11,793 | 11,838 | ||||||
4.00%, 04/25/2033 | 309,740 | 326,916 | ||||||
0.00%, 05/25/2033 PO | 9,861 | 8,738 | ||||||
4.00%, 05/25/2033 | 16,904 | 17,763 | ||||||
6.00%, 05/25/2033 IO | 14,466 | 3,257 | ||||||
6.00%, 05/25/2033 | 217,151 | 235,791 | ||||||
6.00%, 05/25/2033 | 124,000 | 137,648 | ||||||
6.00%, 05/25/2033 | 54,643 | 61,811 | ||||||
6.50%, 05/25/2033 IO | 135,081 | 33,310 | ||||||
7.00%, 05/25/2033 IO | 227,618 | 28,358 | ||||||
5.75%, 06/25/2033 | 87,870 | 98,807 | ||||||
5.88%, 06/25/2033 IO | 112,463 | 8,877 | ||||||
11.77%, 06/25/2033 | 83,657 | 97,276 | ||||||
11.12%, 07/25/2033 | 33,605 | 40,939 | ||||||
11.77%, 07/25/2033 | 24,309 | 25,971 | ||||||
0.00%, 08/25/2033 PO | 9,309 | 8,660 | ||||||
5.50%, 08/25/2033 IO | 335,146 | 62,425 | ||||||
5.50%, 08/25/2033 | 154,717 | 172,467 | ||||||
| Principal Amount | Value | |||||||
6.07%, 08/25/2033 | 105,165 | 113,158 | ||||||
7.98%, 08/25/2033 | 9,385 | 10,997 | ||||||
14.50%, 08/25/2033 | 53,585 | 66,655 | ||||||
3.50%, 09/25/2033 | 1,500,000 | 1,551,055 | ||||||
10.47%, 09/25/2033 | 25,377 | 29,817 | ||||||
3.00%, 10/25/2033 | 908,000 | 901,620 | ||||||
5.50%, 10/25/2033 | 1,139,373 | 1,271,139 | ||||||
6.38%, 11/25/2033 IO | 175,862 | 35,845 | ||||||
0.00%, 12/25/2033 PO | 133,290 | 121,518 | ||||||
11.67%, 12/25/2033 | 33,503 | 36,583 | ||||||
1.97%, 01/25/2034 | 195,536 | 199,559 | ||||||
9.70%, 01/25/2034 | 8,964 | 10,485 | ||||||
13.77%, 01/25/2034 | 20,317 | 24,473 | ||||||
5.50%, 02/25/2034 | 28,646 | 29,400 | ||||||
23.74%, 02/25/2034 | 43,610 | 48,778 | ||||||
0.00%, 03/25/2034 PO | 172,393 | 158,350 | ||||||
1.62%, 03/25/2034 | 158,117 | 158,227 | ||||||
5.50%, 04/25/2034 | 302,808 | 338,058 | ||||||
16.18%, 04/25/2034 | 93,331 | 128,037 | ||||||
1.62%, 05/25/2034 | 359,473 | 361,356 | ||||||
13.16%, 05/25/2034 | 25,083 | 31,602 | ||||||
16.18%, 05/25/2034 | 153,693 | 224,457 | ||||||
19.14%, 05/25/2034 | 34,213 | 48,887 | ||||||
5.50%, 07/25/2034 | 610,914 | 669,873 | ||||||
11.81%, 07/25/2034 | 22,630 | 28,866 | ||||||
1.47%, 08/25/2034 | 111,788 | 111,752 | ||||||
16.46%, 11/25/2034 | 44,835 | 52,318 | ||||||
20.56%, 01/25/2035 | 12,835 | 14,690 | ||||||
0.00%, 04/25/2035 PO | 95,226 | 92,533 | ||||||
1.57%, 04/25/2035 | 167,058 | 167,436 | ||||||
5.00%, 04/25/2035 | 908,432 | �� | 988,193 | |||||
13.96%, 05/25/2035 | 13,768 | 16,592 | ||||||
16.68%, 05/25/2035 | 192,802 | 251,041 | ||||||
16.79%, 05/25/2035 | 132,544 | 173,827 | ||||||
20.29%, 05/25/2035 | 44,259 | 58,510 | ||||||
5.00%, 06/25/2035 | 44,400 | 45,776 | ||||||
6.50%, 06/25/2035 | 1,227 | 1,255 | ||||||
19.42%, 06/25/2035 | 50,991 | 72,586 | ||||||
5.49%, 07/25/2035 IO | 119,040 | 19,936 | ||||||
5.75%, 07/25/2035 | 2,059,030 | 2,380,170 | ||||||
14.33%, 07/25/2035 | 43,064 | 59,025 | ||||||
5.50%, 08/25/2035 | 169,649 | 187,668 | ||||||
5.50%, 08/25/2035 | 1,019,679 | 1,055,569 | ||||||
13.66%, 08/25/2035 | 60,437 | 78,121 | ||||||
13.83%, 08/25/2035 | 75,910 | 97,558 | ||||||
0.00%, 09/25/2035 PO | 25,515 | 24,137 | ||||||
19.34%, 09/25/2035 | 19,289 | 27,583 | ||||||
0.00%, 10/25/2035 PO | 36,927 | 33,606 | ||||||
5.75%, 10/25/2035 | 165,280 | 183,035 | ||||||
13.83%, 10/25/2035 | 68,431 | 85,958 | ||||||
20.11%, 11/25/2035 | 340,155 | 496,016 | ||||||
5.50%, 12/25/2035 | 87,805 | 93,680 | ||||||
5.50%, 12/25/2035 | 584,000 | 665,077 | ||||||
6.00%, 12/25/2035 | 1,000,000 | 1,065,854 | ||||||
6.00%, 12/25/2035 | 32,223 | 35,593 | ||||||
0.00%, 01/25/2036 PO | 14,638 | 14,050 | ||||||
5.50%, 01/25/2036 | 62,232 | 67,511 | ||||||
0.00%, 03/25/2036 PO | 29,750 | 26,451 | ||||||
0.00%, 03/25/2036 PO | 267,364 | 226,223 | ||||||
5.48%, 03/25/2036 IO | 980,334 | 196,500 | ||||||
5.50%, 03/25/2036 | 118,762 | 126,277 | ||||||
5.50%, 03/25/2036 | 386,394 | 433,165 | ||||||
5.50%, 03/25/2036 | 357,824 | 400,192 | ||||||
20.11%, 03/25/2036 | 23,550 | 33,893 | ||||||
0.00%, 04/25/2036 PO | 44,971 | 40,215 | ||||||
0.00%, 04/25/2036 PO | 91,048 | 80,961 | ||||||
0.00%, 04/25/2036 PO | 96,032 | 87,088 | ||||||
1.47%, 04/25/2036 | 166,572 | 165,227 | ||||||
24.68%, 05/25/2036 | 29,880 | 49,565 | ||||||
0.00%, 06/25/2036 PO | 213,259 | 194,015 | ||||||
| Principal Amount | Value | |||||||
0.00%, 06/25/2036 PO | 164,594 | 151,047 | ||||||
0.00%, 06/25/2036 PO | 50,171 | 45,503 | ||||||
0.00%, 06/25/2036 PO | 24,052 | 21,990 | ||||||
0.00%, 06/25/2036 PO | 73,062 | 67,647 | ||||||
1.62%, 06/25/2036 | 56,999 | 56,928 | ||||||
5.36%, 06/25/2036 IO | 209,510 | 32,177 | ||||||
19.74%, 06/25/2036 | 9,102 | 13,106 | ||||||
1.24%, 06/27/2036 | 960,253 | 940,422 | ||||||
0.00%, 07/25/2036 PO | 57,507 | 50,837 | ||||||
0.00%, 07/25/2036 PO | 40,958 | 39,625 | ||||||
0.00%, 07/25/2036 PO | 15,916 | 14,288 | ||||||
0.00%, 07/25/2036 PO | 30,993 | 28,385 | ||||||
1.51%, 07/25/2036 | 474,682 | 473,918 | ||||||
1.68%, 07/25/2036 | 50,035 | 50,254 | ||||||
5.30%, 07/25/2036 IO | 73,125 | 12,696 | ||||||
6.00%, 07/25/2036 | 684,803 | 769,386 | ||||||
6.50%, 07/25/2036 | 321,262 | 374,519 | ||||||
6.50%, 07/25/2036 | 425,806 | 490,795 | ||||||
23.94%, 07/25/2036 | 27,703 | 47,283 | ||||||
32.60%, 07/25/2036 | 22,174 | 39,321 | ||||||
0.00%, 08/25/2036 PO | 42,820 | 38,767 | ||||||
0.00%, 08/25/2036 PO | 56,998 | 52,771 | ||||||
0.00%, 08/25/2036 PO | 20,829 | 19,264 | ||||||
0.00%, 08/25/2036 PO | 104,586 | 95,302 | ||||||
1.57%, 08/25/2036 | 180,654 | 180,818 | ||||||
5.28%, 08/25/2036 IO | 93,197 | 24,856 | ||||||
6.50%, 08/25/2036 | 42,939 | 48,006 | ||||||
6.50%, 08/25/2036 | 241,042 | 268,187 | ||||||
0.00%, 09/25/2036 PO | 30,377 | 28,353 | ||||||
0.00%, 09/25/2036 PO | 57,449 | 52,913 | ||||||
0.00%, 09/25/2036 PO | 56,252 | 51,262 | ||||||
6.50%, 09/25/2036 | 29,711 | 33,138 | ||||||
4.50%, 10/25/2036 | 268,788 | 288,256 | ||||||
21.34%, 10/25/2036 | 35,223 | 53,570 | ||||||
0.00%, 11/25/2036 PO | 40,791 | 36,703 | ||||||
0.00%, 11/25/2036 PO | 91,112 | 80,597 | ||||||
0.00%, 11/25/2036 PO | 15,077 | 13,713 | ||||||
0.00%, 12/25/2036 PO | 48,125 | 42,435 | ||||||
0.00%, 12/25/2036 PO | 20,151 | 18,360 | ||||||
1.12%, 12/25/2036 | 514,171 | 505,556 | ||||||
1.28%, 12/25/2036 | 131,549 | 129,495 | ||||||
5.43%, 12/25/2036 IO | 223,276 | 31,187 | ||||||
21.70%, 12/25/2036 | 10,375 | 15,311 | ||||||
0.00%, 01/25/2037 PO | 139,533 | 121,157 | ||||||
0.00%, 01/25/2037 PO | 45,486 | 40,572 | ||||||
5.50%, 01/25/2037 | 66,741 | 70,561 | ||||||
1.47%, 02/25/2037 | 164,772 | 164,128 | ||||||
31.70%, 02/25/2037 | 8,374 | 24,863 | ||||||
0.00%, 03/25/2037 PO | 39,711 | 35,833 | ||||||
1.72%, 03/25/2037 | 99,710 | 100,115 | ||||||
1.97%, 03/25/2037 | 96,272 | 98,316 | ||||||
4.86%, 03/25/2037 IO | 14,189 | 1,547 | ||||||
5.00%, 03/25/2037 | 10,891 | 11,718 | ||||||
5.22%, 03/25/2037 IO | 357,604 | 63,553 | ||||||
6.00%, 03/25/2037 | 582,026 | 631,356 | ||||||
0.00%, 04/25/2037 PO | 136,294 | 125,791 | ||||||
4.88%, 04/25/2037 IO | 118,635 | 11,762 | ||||||
18.61%, 04/25/2037 | 78,054 | 112,009 | ||||||
0.00%, 05/25/2037 PO | 25,187 | 23,274 | ||||||
1.52%, 05/25/2037 | 73,888 | 73,805 | ||||||
6.00%, 05/25/2037 | 305,929 | 340,460 | ||||||
1.62%, 06/25/2037 | 440,822 | 440,881 | ||||||
1.67%, 06/25/2037 | 35,342 | 36,653 | ||||||
4.56%, 06/25/2037 IO | 75,831 | 10,383 | ||||||
4.88%, 06/25/2037 IO | 282,268 | 44,929 | ||||||
4.88%, 06/25/2037 IO | 92,592 | 14,094 | ||||||
6.50%, 06/25/2037 | 45,484 | 50,503 | ||||||
0.00%, 07/25/2037 PO | 96,445 | 88,225 | ||||||
1.59%, 07/25/2037 | 89,457 | 89,581 | ||||||
1.72%, 07/25/2037 | 52,367 | 52,675 | ||||||
| Principal Amount | Value | |||||||
5.18%, 07/25/2037 IO | 582,887 | 86,324 | ||||||
5.40%, 07/25/2037 IO | 258,860 | 27,568 | ||||||
5.50%, 07/25/2037 | 236,959 | 264,800 | ||||||
5.93%, 07/25/2037 IO | 986,483 | 213,537 | ||||||
13.46%, 07/25/2037 | 59,619 | 73,916 | ||||||
1.67%, 08/25/2037 | 354,695 | 356,054 | ||||||
5.50%, 08/25/2037 | 110,074 | 118,350 | ||||||
6.00%, 08/25/2037 | 32,364 | 36,397 | ||||||
6.00%, 08/25/2037 | 139,175 | 153,873 | ||||||
6.00%, 08/25/2037 | 134,437 | 147,671 | ||||||
6.00%, 08/25/2037 | 193,956 | 212,624 | ||||||
19.56%, 08/25/2037 | 81,542 | 121,087 | ||||||
1.67%, 09/25/2037 | 1,408,659 | 1,416,672 | ||||||
5.32%, 09/25/2037 IO | 304,499 | 59,311 | ||||||
13.11%, 09/25/2037 | 20,098 | 26,187 | ||||||
0.00%, 10/25/2037 PO | 847,414 | 753,197 | ||||||
5.23%, 10/25/2037 IO | 294,695 | 47,011 | ||||||
5.24%, 10/25/2037 IO | 338,992 | 58,460 | ||||||
6.20%, 10/25/2037 | 115,129 | 127,731 | ||||||
5.14%, 12/25/2037 IO | 13,299 | 1,332 | ||||||
5.18%, 12/25/2037 IO | 385,283 | 52,906 | ||||||
5.23%, 12/25/2037 IO | 314,463 | 53,473 | ||||||
6.50%, 12/25/2037 | 245,227 | 279,797 | ||||||
1.49%, 01/25/2038 IO | 844,653 | 46,691 | ||||||
4.69%, 02/25/2038 IO | 330,447 | 47,290 | ||||||
4.78%, 02/25/2038 IO | 582,354 | 103,715 | ||||||
2.12%, 03/25/2038 | 70,706 | 72,136 | ||||||
4.98%, 03/25/2038 IO | 88,704 | 11,983 | ||||||
5.01%, 03/25/2038 IO | 82,685 | 10,288 | ||||||
5.77%, 03/25/2038 IO | 145,513 | 25,004 | ||||||
11.57%, 03/25/2038 | 36,082 | 43,028 | ||||||
5.50%, 04/25/2038 | 271,139 | 273,861 | ||||||
5.63%, 04/25/2038 IO | 85,022 | 10,149 | ||||||
5.68%, 04/25/2038 IO | 122,221 | 17,783 | ||||||
6.50%, 04/25/2038 | 85,688 | 91,983 | ||||||
17.05%, 04/25/2038 | 45,964 | 60,702 | ||||||
0.00%, 05/25/2038 PO | 3,045 | 2,782 | ||||||
1.77%, 06/25/2038 IO | 378,226 | 21,534 | ||||||
5.00%, 07/25/2038 | 74,273 | 80,311 | ||||||
5.00%, 07/25/2038 | 78,403 | 85,722 | ||||||
5.50%, 07/25/2038 | 357,404 | 393,544 | ||||||
5.98%, 07/25/2038 IO | 83,540 | 12,734 | ||||||
4.63%, 09/25/2038 IO | 166,373 | 19,724 | ||||||
4.63%, 09/25/2038 IO | 294,587 | 38,420 | ||||||
4.50%, 11/25/2038 | 28,591 | 28,989 | ||||||
1.62%, 12/25/2038 | 134,740 | 135,040 | ||||||
4.00%, 02/25/2039 | 189,356 | 194,916 | ||||||
4.50%, 02/25/2039 | 13,397 | 14,006 | ||||||
5.33%, 02/25/2039 IO | 204,780 | 39,726 | ||||||
5.43%, 03/25/2039 IO | 142,051 | 23,126 | ||||||
1.67%, 04/25/2039 | 420,853 | 423,553 | ||||||
4.00%, 07/25/2039 | 130,189 | 130,111 | ||||||
5.00%, 07/25/2039 IO | 137,094 | 27,258 | ||||||
7.00%, 07/25/2039 | 7,348 | 8,051 | ||||||
5.00%, 08/25/2039 | 522,288 | 573,205 | ||||||
6.00%, 08/25/2039 | 615,199 | 695,168 | ||||||
5.00%, 09/25/2039 | 405,278 | 432,913 | ||||||
6.02%, 09/25/2039 | 260,428 | 296,524 | ||||||
4.68%, 10/25/2039 IO | 118,518 | 15,333 | ||||||
5.50%, 10/25/2039 IO | 311,363 | 55,283 | ||||||
3.32%, 12/25/2039 | 590,480 | 629,645 | ||||||
4.96%, 12/25/2039 IO | 129,217 | 16,964 | ||||||
6.30%, 12/25/2039 | 409,413 | 464,293 | ||||||
0.00%, 01/25/2040 PO | 75,165 | 65,661 | ||||||
5.03%, 01/25/2040 IO | 230,036 | 36,790 | ||||||
6.22%, 02/25/2040 | 100,237 | 113,217 | ||||||
6.22%, 03/25/2040 | 303,056 | 345,888 | ||||||
6.44%, 03/25/2040 | 335,964 | 387,065 | ||||||
10.23%, 03/25/2040 | 500,592 | 599,104 | ||||||
1.82%, 04/25/2040 | 132,669 | 133,640 | ||||||
| Principal Amount | Value | |||||||
5.20%, 04/25/2040 IO | 204,836 | 31,022 | ||||||
13.61%, 04/25/2040 | 222,096 | 304,285 | ||||||
1.82%, 05/25/2040 | 139,041 | 140,420 | ||||||
5.18%, 05/25/2040 IO | 99,717 | 15,179 | ||||||
0.00%, 06/25/2040 PO | 122,354 | 108,205 | ||||||
5.00%, 06/25/2040 | 1,161,054 | 1,262,835 | ||||||
5.50%, 06/25/2040 | 1,007,000 | 1,076,490 | ||||||
5.50%, 07/25/2040 | 566,861 | 634,735 | ||||||
4.00%, 08/25/2040 | 1,908,799 | 1,939,784 | ||||||
5.00%, 09/25/2040 | 206,000 | 233,442 | ||||||
5.50%, 10/25/2040 | 2,012,000 | 2,261,318 | ||||||
3.22%, 11/25/2040 IO | 1,140,852 | 95,175 | ||||||
1.77%, 01/25/2041 | 295,015 | 296,440 | ||||||
5.31%, 01/25/2041 IO | 1,005,828 | 190,548 | ||||||
1.90%, 04/25/2041 IO | 2,003,147 | 99,418 | ||||||
1.72%, 07/25/2041 | 105,819 | 106,310 | ||||||
1.77%, 08/25/2041 | 334,768 | 338,441 | ||||||
1.72%, 11/25/2041 | 381,336 | 383,428 | ||||||
7.00%, 11/25/2041 | 2,037,548 | 2,346,990 | ||||||
7.00%, 11/25/2041 | 2,428,490 | 2,847,420 | ||||||
7.00%, 11/25/2041 | 1,829,393 | 2,144,647 | ||||||
3.50%, 03/25/2042 | 1,000,000 | 1,024,126 | ||||||
6.50%, 06/25/2042 | 76,635 | 88,955 | ||||||
1.67%, 09/25/2042 | 597,739 | 596,519 | ||||||
1.72%, 09/25/2042 | 293,328 | 294,570 | ||||||
1.72%, 09/25/2042 | 2,271,868 | 2,235,685 | ||||||
1.72%, 10/25/2042 | 952,932 | 958,582 | ||||||
3.00%, 02/25/2043 | 1,000,000 | 967,753 | ||||||
3.50%, 02/25/2043 | 599,344 | 619,806 | ||||||
0.00%, 09/25/2043 PO | 1,912,838 | 1,549,537 | ||||||
0.00%, 10/25/2043 PO | 1,330,834 | 1,071,432 | ||||||
0.00%, 12/25/2043 PO | 3,536,778 | 2,897,580 | ||||||
3.00%, 08/25/2044 | 5,162,638 | 5,266,387 | ||||||
3.00%, 01/25/2046 | 2,813,062 | 2,870,371 | ||||||
4.88%, 11/25/2049 IO | 143,640 | 19,056 | ||||||
5.82%, 02/25/2051 | 188,169 | 205,152 | ||||||
5.45%, 07/25/2051 | 39,477 | 43,536 | ||||||
4.00%, 05/25/2053 | 6,425,369 | 6,797,122 | ||||||
Fannie Mae Trust 2003-W2 | ||||||||
5.90%, 07/25/2042 | 75,318 | 83,989 | ||||||
6.50%, 07/25/2042 | 130,903 | 151,845 | ||||||
Fannie Mae Trust 2003-W6 | ||||||||
5.20%, 09/25/2042 | 489,581 | 550,768 | ||||||
6.50%, 09/25/2042 | 204,604 | 235,132 | ||||||
Fannie Mae Trust 2003-W8 | ||||||||
1.62%, 05/25/2042 | 45,906 | 45,338 | ||||||
7.00%, 10/25/2042 | 244,281 | 285,851 | ||||||
Fannie Mae Trust 2004-W1 | ||||||||
7.00%, 12/25/2033 | 319,764 | 374,347 | ||||||
Fannie Mae Trust 2004-W15 | ||||||||
1.47%, 08/25/2044 | 207,872 | 206,348 | ||||||
Fannie Mae Trust 2004-W2 | ||||||||
7.00%, 02/25/2044 | 75,278 | 87,835 | ||||||
Fannie Mae Trust 2004-W8 | ||||||||
7.50%, 06/25/2044 | 75,150 | 88,305 | ||||||
Fannie Mae Trust 2005-W3 | ||||||||
1.44%, 03/25/2045 | 1,660,526 | 1,619,997 | ||||||
Fannie Mae Trust 2005-W4 | ||||||||
6.00%, 08/25/2045 | 92,800 | 105,242 | ||||||
Fannie Mae Trust 2006-W2 | ||||||||
2.80%, 11/25/2045 | 246,975 | 262,280 | ||||||
1.44%, 02/25/2046 | 801,766 | 801,163 | ||||||
Fannie Mae Whole Loan | ||||||||
1.48%, 11/25/2046 | 2,018,541 | 2,022,349 | ||||||
Fannie Mae-Aces | ||||||||
1.54%, 08/25/2019 | 308,120 | 308,051 | ||||||
4.33%, 03/25/2020 | 702,219 | 741,143 | ||||||
3.66%, 11/25/2020 | 548,466 | 566,854 | ||||||
3.73%, 06/25/2021 | 5,158,000 | 5,459,098 | ||||||
3.76%, 06/25/2021 | 1,013,624 | 1,064,006 | ||||||
| Principal Amount | Value | |||||||
2.92%, 08/25/2021 | 706,000 | 726,385 | ||||||
2.61%, 10/25/2021 | 3,000,000 | 3,060,793 | ||||||
1.93%, 11/25/2022 | 2,820,022 | 2,835,857 | ||||||
2.28%, 12/27/2022 | 1,357,000 | 1,351,429 | ||||||
2.39%, 01/25/2023 | 1,342,000 | 1,346,422 | ||||||
3.51%, 12/25/2023 | 8,394,000 | 8,874,377 | ||||||
3.50%, 01/25/2024 | 16,000,000 | 16,977,307 | ||||||
3.10%, 07/25/2024 | 1,066,000 | 1,101,264 | ||||||
3.02%, 08/25/2024 | 1,273,000 | 1,305,590 | ||||||
2.53%, 09/25/2024 | 1,390,000 | 1,378,621 | ||||||
2.72%, 10/25/2024 | 13,450,000 | 13,493,059 | ||||||
2.59%, 12/25/2024 | 1,640,000 | 1,629,098 | ||||||
3.15%, 12/25/2024 | 2,853,848 | 2,941,250 | ||||||
2.83%, 01/25/2025 | 3,500,000 | 3,548,142 | ||||||
2.90%, 01/25/2025 | 2,000,000 | 2,030,286 | ||||||
3.04%, 11/25/2025 | 8,800,000 | 8,947,925 | ||||||
2.38%, 09/25/2026 | 5,500,000 | 5,298,454 | ||||||
2.50%, 10/25/2026 | 5,335,000 | 5,146,761 | ||||||
2.57%, 12/25/2026 | 8,000,000 | 7,775,550 | ||||||
2.68%, 12/25/2026 | 43,307,000 | 42,293,963 | ||||||
2.96%, 02/25/2027 | 3,535,000 | 3,546,422 | ||||||
3.09%, 04/25/2027 | 23,211,000 | 23,561,702 | ||||||
3.30%, 04/25/2029 | 4,540,000 | 4,608,768 | ||||||
FDIC Guaranteed Notes Trust 2010-C1 | ||||||||
2.98%, 12/06/2020 (Acquired 10/28/2013, Cost $692,266) (1) | 687,207 | 689,493 | ||||||
FHLMC-GNMA | ||||||||
7.00%, 03/25/2023 | 14,586 | 15,709 | ||||||
6.25%, 11/25/2023 | 9,607 | 10,377 | ||||||
7.50%, 04/25/2024 | 68,946 | 76,321 | ||||||
First Horizon Alternative Mortgage Securities Trust 2005-FA7 | ||||||||
5.00%, 09/25/2020 | 8,119 | 8,154 | ||||||
First Horizon Alternative Mortgage Securities Trust 2005-FA8 | ||||||||
5.50%, 11/25/2035 | 134,182 | 120,239 | ||||||
First Horizon Alternative Mortgage Securities Trust 2006-FA6 | ||||||||
5.75%, 11/25/2021 | 37,090 | 36,510 | ||||||
First Horizon Alternative Mortgage Securities Trust 2006-FA8 | ||||||||
5.75%, 02/25/2037 | 65,421 | 57,638 | ||||||
First Horizon Alternative Mortgage Securities Trust 2007-FA4 | ||||||||
4.43%, 08/25/2037 IO | 1,109,398 | 219,457 | ||||||
First Horizon Mortgage Pass-Through Trust 2004-AR2 | ||||||||
3.33%, 05/25/2034 | 58,593 | 58,115 | ||||||
First Horizon Mortgage Pass-Through Trust 2004-AR7 | ||||||||
3.18%, 02/25/2035 | 318,630 | 318,790 | ||||||
First Horizon Mortgage Pass-Through Trust 2005-AR1 | ||||||||
3.17%, 04/25/2035 | 180,680 | 182,737 | ||||||
FNDUS AVAYA T CMT | ||||||||
3.09%, 09/25/2029 (8) | 7,688,000 | 7,692,805 | ||||||
FNDUS SPRINGS CMT | ||||||||
3.02%, 06/25/2029 (8) | 8,200,000 | 8,225,625 | ||||||
Freddie Mac | ||||||||
4.00%, 07/15/2041 (3) | 47,280,000 | 49,716,026 | ||||||
3.50%, 07/15/2042 (3) | 28,295,000 | 29,059,848 | ||||||
Freddie Mac Gold Pool | ||||||||
5.00%, 10/01/2017 | 1,951 | 2,001 | ||||||
6.50%, 11/01/2017 | 106 | 106 | ||||||
5.00%, 12/01/2017 | 12,656 | 12,977 | ||||||
5.00%, 12/01/2017 | 11,575 | 11,868 | ||||||
6.50%, 12/01/2017 | 190 | 190 | ||||||
5.50%, 01/01/2018 | 3,824 | 3,843 | ||||||
5.50%, 02/01/2018 | 3,494 | 3,524 | ||||||
5.50%, 04/01/2018 | 48,408 | 48,863 | ||||||
6.00%, 04/01/2018 | 977 | 985 | ||||||
6.50%, 04/01/2018 | 219 | 219 | ||||||
4.00%, 06/01/2018 | 819 | 848 | ||||||
4.50%, 08/01/2018 | 1,446 | 1,478 | ||||||
4.50%, 10/01/2018 | 908 | 928 | ||||||
4.50%, 10/01/2018 | 11,049 | 11,294 | ||||||
5.50%, 01/01/2019 | 8,917 | 9,012 | ||||||
6.50%, 09/01/2019 | 1,826 | 1,872 | ||||||
5.50%, 12/01/2019 | 11,044 | 11,274 | ||||||
| Principal Amount | Value | |||||||
6.00%, 02/01/2020 | 1,671 | 1,683 | ||||||
5.50%, 04/01/2020 | 14,509 | 14,761 | ||||||
5.50%, 06/01/2020 | 3,793 | 3,822 | ||||||
6.00%, 06/01/2020 | 8,615 | 8,867 | ||||||
8.00%, 07/01/2020 | 6 | 6 | ||||||
6.00%, 08/01/2020 | 4,272 | 4,407 | ||||||
6.00%, 07/01/2021 | 18,664 | 19,168 | ||||||
6.00%, 07/01/2021 | 1,561 | 1,572 | ||||||
6.00%, 01/01/2022 | 570 | 571 | ||||||
6.00%, 02/01/2022 | 258 | 258 | ||||||
6.00%, 03/01/2022 | 3,263 | 3,324 | ||||||
6.50%, 03/01/2022 | 3,766 | 3,923 | ||||||
6.00%, 12/01/2022 | 7,214 | 8,108 | ||||||
5.50%, 02/01/2024 | 17,121 | 18,098 | ||||||
4.00%, 07/01/2024 | 400,466 | 420,256 | ||||||
8.00%, 08/01/2024 | 820 | 925 | ||||||
8.00%, 11/01/2024 | 629 | 683 | ||||||
7.50%, 08/01/2025 | 1,388 | 1,538 | ||||||
3.50%, 11/01/2025 | 459,039 | 478,375 | ||||||
3.50%, 12/01/2025 | 1,519,770 | 1,590,214 | ||||||
10.00%, 03/17/2026 | 18,647 | 18,699 | ||||||
7.00%, 04/01/2026 | 1,632 | 1,847 | ||||||
3.50%, 08/01/2026 | 1,698,552 | 1,777,539 | ||||||
3.50%, 01/01/2027 | 300,029 | 313,906 | ||||||
6.50%, 01/01/2028 | 52,886 | 60,053 | ||||||
2.50%, 03/01/2028 | 12,305,678 | 12,452,647 | ||||||
2.50%, 04/01/2028 | 3,190,375 | 3,228,465 | ||||||
3.00%, 07/01/2028 | 2,622,189 | 2,694,476 | ||||||
8.50%, 07/01/2028 | 4,333 | 5,141 | ||||||
3.00%, 08/01/2028 | 1,408,590 | 1,448,763 | ||||||
3.00%, 09/01/2028 | 5,234,290 | 5,378,585 | ||||||
3.00%, 10/01/2028 | 2,262,402 | 2,327,984 | ||||||
7.00%, 12/01/2028 | 64,706 | 74,329 | ||||||
3.00%, 05/01/2029 | 2,056,471 | 2,116,011 | ||||||
6.50%, 06/01/2029 | 21,093 | 23,625 | ||||||
7.00%, 07/01/2029 | 1,048 | 1,148 | ||||||
6.50%, 08/01/2029 | 112,101 | 127,806 | ||||||
6.00%, 10/01/2029 | 21,822 | 24,807 | ||||||
2.50%, 03/01/2030 | 2,225,626 | 2,241,428 | ||||||
2.50%, 07/01/2030 | 5,395,657 | 5,433,355 | ||||||
10.00%, 10/01/2030 | 122,601 | 131,534 | ||||||
7.00%, 01/01/2031 | 60,287 | 68,988 | ||||||
3.00%, 04/01/2031 | 8,540,152 | 8,775,582 | ||||||
2.50%, 08/01/2031 | 2,706,444 | 2,723,777 | ||||||
3.50%, 01/01/2032 | 779,622 | 813,792 | ||||||
7.50%, 01/01/2032 | 136,012 | 157,017 | ||||||
3.00%, 02/01/2032 | 8,995,501 | 9,246,086 | ||||||
3.50%, 03/01/2032 | 320,912 | 334,978 | ||||||
7.00%, 07/01/2032 | 5,677 | 6,278 | ||||||
7.00%, 08/01/2032 | 7,005 | 7,994 | ||||||
5.50%, 01/01/2033 | 125,745 | 139,229 | ||||||
3.50%, 02/01/2033 | 224,214 | 232,958 | ||||||
6.00%, 02/01/2033 | 80,121 | 86,900 | ||||||
3.50%, 05/01/2033 | 1,120,096 | 1,167,023 | ||||||
3.50%, 05/01/2033 | 311,662 | 324,784 | ||||||
5.50%, 10/01/2033 | 54,267 | 61,923 | ||||||
6.00%, 12/01/2033 | 14,427 | 16,215 | ||||||
3.50%, 01/01/2034 | 12,150,601 | 12,682,265 | ||||||
5.00%, 01/01/2034 | 42,373 | 46,514 | ||||||
6.00%, 01/01/2034 | 41,448 | 47,874 | ||||||
6.00%, 01/01/2034 | 31,289 | 34,604 | ||||||
5.00%, 06/01/2034 | 196,368 | 214,734 | ||||||
5.00%, 09/01/2034 | 111,975 | 124,072 | ||||||
6.50%, 11/01/2034 | 13,831 | 16,212 | ||||||
6.50%, 01/01/2035 | 132,331 | 149,109 | ||||||
5.00%, 03/01/2035 | 54,440 | 59,573 | ||||||
5.50%, 07/01/2035 | 111,330 | 124,567 | ||||||
4.50%, 11/01/2035 | 16,639 | 17,879 | ||||||
6.50%, 12/01/2035 | 55,161 | 61,659 | ||||||
6.50%, 12/01/2035 | 86,914 | 99,642 | ||||||
| Principal Amount | Value | |||||||
5.50%, 01/01/2036 | 30,297 | 33,694 | ||||||
5.00%, 03/01/2036 | 4,126,090 | 4,513,943 | ||||||
5.00%, 07/01/2036 | 3,732 | 4,082 | ||||||
5.00%, 11/01/2036 | 116,458 | 127,378 | ||||||
6.00%, 11/01/2036 | 9,763 | 10,465 | ||||||
6.50%, 11/01/2036 | 390,178 | 435,983 | ||||||
6.50%, 11/01/2036 | 199,419 | 230,033 | ||||||
6.50%, 11/01/2036 | 33,394 | 38,170 | ||||||
5.50%, 12/01/2036 | 55,009 | 61,484 | ||||||
6.00%, 12/01/2036 | 12,782 | 14,491 | ||||||
6.00%, 12/01/2036 | 26,015 | 29,401 | ||||||
6.50%, 12/01/2036 | 154,318 | 177,689 | ||||||
6.50%, 12/01/2036 | 382,373 | 441,872 | ||||||
7.50%, 12/01/2036 | 461,325 | 523,333 | ||||||
6.50%, 01/01/2037 | 22,793 | 25,434 | ||||||
6.50%, 01/01/2037 | 6,602 | 6,811 | ||||||
6.50%, 02/01/2037 | 41,604 | 45,487 | ||||||
7.00%, 02/01/2037 | 11,271 | 12,963 | ||||||
5.00%, 03/01/2037 | 283,236 | 308,828 | ||||||
5.00%, 06/01/2037 | 354,973 | 388,818 | ||||||
6.50%, 06/01/2037 | 20,487 | 22,432 | ||||||
5.00%, 08/01/2037 | 340,751 | 373,421 | ||||||
6.50%, 11/01/2037 | 90,698 | 105,791 | ||||||
7.50%, 01/01/2038 | 51,346 | 59,996 | ||||||
7.50%, 01/01/2038 | 86,381 | 100,821 | ||||||
5.00%, 02/01/2038 | 370,849 | 406,480 | ||||||
5.00%, 03/01/2038 | 357,998 | 391,847 | ||||||
5.00%, 03/01/2038 | 406,220 | 445,669 | ||||||
5.00%, 03/01/2038 | 363,365 | 396,955 | ||||||
5.00%, 03/01/2038 | 95,824 | 105,037 | ||||||
6.50%, 03/01/2038 | 75,245 | 85,482 | ||||||
5.00%, 04/01/2038 | 298,885 | 325,432 | ||||||
5.50%, 05/01/2038 | 93,627 | 103,920 | ||||||
5.50%, 08/01/2038 | 118,063 | 131,521 | ||||||
5.00%, 09/01/2038 | 288,089 | 315,774 | ||||||
5.00%, 09/01/2038 | 1,407 | 1,543 | ||||||
7.50%, 09/01/2038 | 45,375 | 53,494 | ||||||
5.00%, 11/01/2038 | 122,410 | 134,152 | ||||||
5.00%, 11/01/2038 | 2,123 | 2,327 | ||||||
5.00%, 12/01/2038 | 1,223 | 1,341 | ||||||
5.00%, 12/01/2038 | 341,696 | 374,492 | ||||||
5.50%, 01/01/2039 | 4,300,449 | 4,817,292 | ||||||
5.00%, 02/01/2039 | 700,580 | 768,011 | ||||||
5.00%, 05/01/2039 | 11,083 | 12,298 | ||||||
4.50%, 07/01/2039 | 308,065 | 331,069 | ||||||
4.50%, 10/01/2039 | 2,496,342 | 2,683,318 | ||||||
5.00%, 10/01/2039 | 771,492 | 845,556 | ||||||
4.50%, 11/01/2039 | 3,992,939 | 4,291,551 | ||||||
4.50%, 11/01/2039 | 2,863,996 | 3,078,157 | ||||||
5.00%, 03/01/2040 | 3,931,578 | 4,316,332 | ||||||
5.50%, 03/01/2040 | 37,027 | 41,049 | ||||||
5.50%, 05/01/2040 | 2,917,904 | 3,250,111 | ||||||
4.50%, 08/01/2040 | 650,544 | 699,229 | ||||||
4.50%, 08/01/2040 | 4,619,089 | 5,014,124 | ||||||
5.00%, 08/01/2040 | 482,498 | 529,282 | ||||||
5.00%, 08/01/2040 | 1,948,077 | 2,133,969 | ||||||
5.50%, 08/01/2040 | 1,208,352 | 1,345,097 | ||||||
4.00%, 09/01/2040 | 1,032,116 | 1,089,574 | ||||||
4.50%, 09/01/2040 | 502,934 | 540,560 | ||||||
4.50%, 09/01/2040 | 1,970,122 | 2,117,607 | ||||||
4.00%, 11/01/2040 | 3,100,832 | 3,273,863 | ||||||
4.00%, 11/01/2040 | 55,550 | 58,640 | ||||||
0.00%, 12/01/2040 | 5,893,109 | 6,403,566 | ||||||
4.00%, 12/01/2040 | 1,619,446 | 1,715,177 | ||||||
4.00%, 12/01/2040 | 591,494 | 626,463 | ||||||
4.00%, 12/01/2040 | 1,910,662 | 2,017,280 | ||||||
4.00%, 12/01/2040 | 1,969,141 | 2,078,978 | ||||||
4.00%, 12/01/2040 | 1,395,893 | 1,478,418 | ||||||
4.00%, 01/01/2041 | 1,177,798 | 1,243,525 | ||||||
4.50%, 03/01/2041 | 382,496 | 411,927 | ||||||
| Principal Amount | Value | |||||||
5.00%, 04/01/2041 | 1,836,062 | 2,010,404 | ||||||
4.50%, 05/01/2041 | 2,804,518 | 3,014,207 | ||||||
5.00%, 06/01/2041 | 468,345 | 510,180 | ||||||
4.00%, 10/01/2041 | 6,699,350 | 7,073,378 | ||||||
4.00%, 11/01/2041 | 17,144 | 18,101 | ||||||
4.00%, 01/01/2042 | 305,372 | 322,421 | ||||||
4.00%, 01/01/2042 | 403,901 | 431,126 | ||||||
3.50%, 05/01/2042 | 1,311,020 | 1,352,408 | ||||||
4.00%, 05/01/2042 | 22,330 | 23,577 | ||||||
3.50%, 06/01/2042 | 3,967,222 | 4,089,087 | ||||||
3.50%, 06/01/2042 | 623,428 | 643,109 | ||||||
4.00%, 06/01/2042 | 3,193,168 | 3,386,068 | ||||||
3.50%, 07/01/2042 | 14,472,104 | 14,928,974 | ||||||
3.00%, 08/01/2042 | 2,555,529 | 2,564,109 | ||||||
3.50%, 08/01/2042 | 1,252,221 | 1,291,753 | ||||||
3.50%, 09/01/2042 | 8,652,479 | 8,925,632 | ||||||
3.50%, 09/01/2042 | 4,901,511 | 5,056,254 | ||||||
3.00%, 10/01/2042 | 6,361,010 | 6,383,673 | ||||||
3.50%, 10/01/2042 | 3,735,009 | 3,852,925 | ||||||
4.00%, 10/01/2042 | 116,490 | 121,410 | ||||||
3.00%, 11/01/2042 | 8,328,173 | 8,355,717 | ||||||
3.50%, 11/01/2042 | 4,340,513 | 4,476,937 | ||||||
3.50%, 11/01/2042 | 168,936 | 174,127 | ||||||
4.00%, 01/01/2043 | 370,423 | 392,968 | ||||||
3.00%, 02/01/2043 | 540,570 | 542,608 | ||||||
3.00%, 03/01/2043 | 3,449,071 | 3,462,084 | ||||||
3.00%, 03/01/2043 | 6,986,129 | 7,012,470 | ||||||
3.50%, 03/01/2043 | 1,089,131 | 1,123,510 | ||||||
3.00%, 04/01/2043 | 10,350,498 | 10,388,980 | ||||||
3.00%, 04/01/2043 | 129,985 | 130,435 | ||||||
3.50%, 05/01/2043 | 413,143 | 425,852 | ||||||
3.00%, 06/01/2043 | 51,014 | 51,065 | ||||||
3.00%, 06/01/2043 | 19,494,651 | 19,554,115 | ||||||
3.50%, 06/01/2043 | 1,347,401 | 1,388,842 | ||||||
3.50%, 06/01/2043 | 2,301,605 | 2,374,257 | ||||||
4.00%, 06/01/2043 | 22,917 | 24,278 | ||||||
3.00%, 07/01/2043 | 477,495 | 478,755 | ||||||
3.00%, 07/01/2043 | 36,938 | 37,036 | ||||||
3.00%, 07/15/2043 (3) | 46,325,000 | 46,216,423 | ||||||
3.00%, 08/01/2043 | 9,292,480 | 9,313,149 | ||||||
3.00%, 08/01/2043 | 725,174 | 726,183 | ||||||
4.50%, 08/01/2043 | 3,695,867 | 4,004,372 | ||||||
3.00%, 09/01/2043 | 609,226 | 609,324 | ||||||
4.00%, 09/01/2043 | 264,969 | 279,998 | ||||||
4.00%, 09/01/2043 | 10,262,772 | 10,835,157 | ||||||
3.50%, 10/01/2043 | 285,242 | 294,246 | ||||||
3.00%, 11/01/2043 | 73,545 | 73,647 | ||||||
4.00%, 11/01/2043 | 126,479 | 133,667 | ||||||
4.00%, 11/01/2043 | 279,385 | 294,210 | ||||||
4.00%, 12/01/2043 | 2,605,869 | 2,743,250 | ||||||
4.00%, 12/01/2043 | 1,076,908 | 1,138,002 | ||||||
4.00%, 12/01/2043 | 332,520 | 349,924 | ||||||
4.00%, 01/01/2044 | 786,644 | 828,145 | ||||||
4.00%, 01/01/2044 | 187,358 | 197,915 | ||||||
4.00%, 03/01/2044 | 4,405,632 | 4,636,220 | ||||||
4.50%, 03/01/2044 | 1,078,102 | 1,154,366 | ||||||
3.50%, 05/01/2044 | 20,790,106 | 21,488,870 | ||||||
4.50%, 05/01/2044 | 1,566,213 | 1,676,775 | ||||||
4.50%, 07/01/2044 | 83,384 | 89,270 | ||||||
4.50%, 07/01/2044 | 500,470 | 535,800 | ||||||
4.50%, 09/01/2044 | 3,055,255 | 3,271,009 | ||||||
4.00%, 10/01/2044 | 11,865,743 | 12,560,975 | ||||||
4.00%, 01/01/2045 | 760,937 | 800,764 | ||||||
3.50%, 03/01/2045 | 4,545,704 | 4,672,279 | ||||||
3.00%, 05/01/2045 | 2,932,299 | 2,941,106 | ||||||
3.00%, 05/01/2045 | 1,588,004 | 1,594,156 | ||||||
3.00%, 06/01/2045 | 837,952 | 836,552 | ||||||
3.00%, 10/01/2045 | 6,729,113 | 6,755,195 | ||||||
4.00%, 10/01/2045 | 1,111,032 | 1,169,183 | ||||||
3.50%, 12/01/2045 | 5,635,309 | 5,792,224 | ||||||
| Principal Amount | Value | |||||||
3.50%, 01/01/2046 | 6,531,270 | 6,735,888 | ||||||
4.00%, 01/01/2046 | 4,588,389 | 4,887,274 | ||||||
3.50%, 02/01/2046 | 10,741,154 | 11,040,242 | ||||||
3.50%, 03/01/2046 | 20,848,904 | 21,546,205 | ||||||
4.50%, 04/01/2046 | 3,959,509 | 4,303,127 | ||||||
3.50%, 07/01/2046 | 5,868,358 | 6,031,763 | ||||||
3.00%, 12/01/2046 | 13,666,494 | 13,651,749 | ||||||
3.00%, 01/01/2047 | 10,194,162 | 10,183,158 | ||||||
3.50%, 02/01/2047 | 8,035,419 | 8,287,949 | ||||||
4.00%, 06/01/2047 | 3,121,595 | 3,311,063 | ||||||
3.50%, 07/01/2047 | 3,793,638 | 3,909,067 | ||||||
Freddie Mac Multifamily Structured Pass Through Certificates | ||||||||
5.05%, 01/25/2019 | 3,175,000 | 3,296,497 | ||||||
5.09%, 03/25/2019 | 9,000,000 | 9,409,820 | ||||||
2.31%, 03/25/2020 | 6,850,000 | 6,924,516 | ||||||
1.72%, 06/25/2020 IO | 50,794,380 | 1,952,246 | ||||||
2.57%, 09/25/2020 | 12,325,000 | 12,554,159 | ||||||
2.60%, 09/25/2020 | 746,791 | 760,513 | ||||||
3.13%, 06/25/2021 | 12,700,000 | 13,190,080 | ||||||
1.57%, 05/25/2022 IO | 54,077,538 | 3,112,438 | ||||||
2.36%, 08/25/2022 | 3,968,000 | 3,994,096 | ||||||
2.86%, 08/25/2022 | 6,965,000 | 7,144,329 | ||||||
1.70%, 09/25/2022 | 4,191,506 | 4,207,261 | ||||||
2.84%, 09/25/2022 | 2,665,000 | 2,732,311 | ||||||
1.00%, 10/25/2022 IO | 22,771,190 | 869,823 | ||||||
2.31%, 12/25/2022 | 6,000,000 | 5,918,479 | ||||||
2.52%, 01/25/2023 | 2,000,000 | 2,021,189 | ||||||
2.62%, 01/25/2023 | 8,500,000 | 8,610,696 | ||||||
3.11%, 02/25/2023 | 11,900,000 | 12,363,022 | ||||||
3.00%, 01/25/2024 | 6,017,061 | 6,192,236 | ||||||
3.49%, 01/25/2024 | 5,000,000 | 5,293,760 | ||||||
3.10%, 02/25/2024 | 11,250,000 | 11,570,651 | ||||||
3.39%, 03/25/2024 | 4,286,000 | 4,513,090 | ||||||
2.91%, 04/25/2024 | 15,232,000 | 15,557,921 | ||||||
2.81%, 09/25/2024 | 6,287,000 | 6,392,829 | ||||||
2.77%, 05/25/2025 | 4,250,000 | 4,270,631 | ||||||
3.16%, 05/25/2025 | 5,600,000 | 5,786,977 | ||||||
3.33%, 08/25/2025 | 10,000,000 | 10,483,534 | ||||||
1.50%, 03/25/2026 | 27,918,769 | 2,708,743 | ||||||
3.36%, 12/25/2026 | 27,000,000 | 28,128,794 | ||||||
3.51%, 01/25/2027 | 6,000,000 | 6,268,659 | ||||||
3.08%, 01/25/2031 | 4,126,000 | 4,087,606 | ||||||
Freddie Mac Non Gold Pool | ||||||||
2.77%, 07/01/2019 | 506 | 509 | ||||||
2.63%, 07/01/2026 | 4,268 | 4,294 | ||||||
2.82%, 01/01/2027 | 7,858 | 8,195 | ||||||
2.78%, 04/01/2030 | 3,888 | 4,083 | ||||||
2.89%, 09/01/2032 | 5,553 | 5,859 | ||||||
3.03%, 05/01/2033 | 216,320 | 227,119 | ||||||
2.86%, 12/01/2033 | 31,631 | 33,249 | ||||||
3.49%, 04/01/2034 | 57,804 | 61,027 | ||||||
2.99%, 09/01/2034 | 151,159 | 159,340 | ||||||
2.94%, 01/01/2035 | 212,847 | 223,953 | ||||||
2.94%, 01/01/2035 | 75,411 | 79,508 | ||||||
3.29%, 08/01/2035 | 25,845 | 27,249 | ||||||
3.44%, 12/01/2035 | 54,985 | 57,713 | ||||||
2.82%, 02/01/2036 | 134,974 | 143,063 | ||||||
3.25%, 02/01/2036 | 28,531 | 30,088 | ||||||
3.78%, 03/01/2036 | 159,431 | 169,955 | ||||||
3.90%, 03/01/2036 | 126,031 | 132,822 | ||||||
3.01%, 05/01/2036 | 95,828 | 100,884 | ||||||
3.13%, 05/01/2036 | 142,889 | 150,154 | ||||||
4.06%, 05/01/2036 | 28,808 | 30,592 | ||||||
3.67%, 06/01/2036 | 398,696 | 424,977 | ||||||
3.77%, 06/01/2036 | 123,506 | 131,104 | ||||||
2.84%, 07/01/2036 | 47,431 | 50,138 | ||||||
2.97%, 07/01/2036 | 61,014 | 63,156 | ||||||
3.03%, 07/01/2036 | 64,968 | 67,752 | ||||||
2.88%, 08/01/2036 | 17,507 | 18,138 | ||||||
3.01%, 08/01/2036 | 85,945 | 89,930 | ||||||
| Principal Amount | Value | |||||||
3.06%, 08/01/2036 | 352,375 | 365,890 | ||||||
3.10%, 09/01/2036 | 147,488 | 156,364 | ||||||
3.43%, 09/01/2036 | 178,558 | 189,511 | ||||||
2.85%, 10/01/2036 | 63,265 | 67,227 | ||||||
2.86%, 10/01/2036 | 125,748 | 133,288 | ||||||
3.07%, 10/01/2036 | 234,719 | 244,177 | ||||||
3.18%, 10/01/2036 | 140,989 | 146,981 | ||||||
3.19%, 10/01/2036 | 82,290 | 87,225 | ||||||
3.41%, 10/01/2036 | 17,560 | 18,183 | ||||||
3.51%, 10/01/2036 | 67,641 | 72,393 | ||||||
2.79%, 11/01/2036 | 249,292 | 263,701 | ||||||
2.80%, 11/01/2036 | 68,199 | 71,864 | ||||||
3.06%, 11/01/2036 | 75,117 | 79,725 | ||||||
3.14%, 11/01/2036 | 126,852 | 133,377 | ||||||
3.14%, 11/01/2036 | 31,747 | 33,777 | ||||||
3.02%, 12/01/2036 | 366,159 | 388,235 | ||||||
3.02%, 12/01/2036 | 361,064 | 379,589 | ||||||
3.23%, 12/01/2036 | 9,314 | 9,806 | ||||||
3.62%, 12/01/2036 | 168,725 | 179,046 | ||||||
3.63%, 12/01/2036 | 5,053 | 5,439 | ||||||
3.04%, 01/01/2037 | 16,337 | 17,064 | ||||||
3.54%, 01/01/2037 | 73,358 | 77,456 | ||||||
3.37%, 02/01/2037 | 15,578 | 16,412 | ||||||
3.40%, 02/01/2037 | 179,161 | 188,817 | ||||||
3.51%, 02/01/2037 | 13,922 | 14,778 | ||||||
3.67%, 02/01/2037 | 106,655 | 113,775 | ||||||
3.94%, 02/01/2037 | 27,921 | 29,885 | ||||||
3.20%, 03/01/2037 | 296,567 | 309,262 | ||||||
3.85%, 03/01/2037 | 51,965 | 54,605 | ||||||
3.97%, 03/01/2037 | 30,792 | 32,757 | ||||||
2.93%, 04/01/2037 | 46,076 | 48,485 | ||||||
3.54%, 04/01/2037 | 2,868 | 2,958 | ||||||
3.81%, 04/01/2037 | 120,318 | 128,211 | ||||||
2.93%, 05/01/2037 | 116,624 | 120,947 | ||||||
3.39%, 05/01/2037 | 48,603 | 51,437 | ||||||
3.39%, 05/01/2037 | 124,347 | 131,034 | ||||||
3.50%, 05/01/2037 | 41,147 | 43,419 | ||||||
3.76%, 05/01/2037 | 215,808 | 229,406 | ||||||
3.95%, 05/01/2037 | 174,551 | 186,095 | ||||||
3.18%, 06/01/2037 | 67,232 | 70,713 | ||||||
3.30%, 07/01/2037 | 56,234 | 59,588 | ||||||
3.09%, 11/01/2037 | 47,447 | 50,323 | ||||||
3.78%, 04/01/2038 | 150,566 | 161,063 | ||||||
3.62%, 05/01/2038 | 98,974 | 104,546 | ||||||
3.45%, 07/01/2040 | 102,613 | 106,394 | ||||||
Freddie Mac Reference REMIC | ||||||||
6.00%, 04/15/2036 | 485,374 | 552,705 | ||||||
6.00%, 05/15/2036 | 675,195 | 759,492 | ||||||
Freddie Mac REMICS | ||||||||
14.17%, 08/15/2017 | 62 | 63 | ||||||
5.50%, 10/15/2017 | 873 | 876 | ||||||
5.00%, 12/15/2017 | 2,444 | 2,453 | ||||||
5.50%, 12/15/2017 | 5,234 | 5,263 | ||||||
5.00%, 01/15/2018 | 2,945 | 2,964 | ||||||
4.50%, 05/15/2018 | 4,413 | 4,450 | ||||||
6.50%, 05/15/2018 | 627 | 634 | ||||||
4.50%, 06/15/2018 | 39,727 | 40,057 | ||||||
4.94%, 06/15/2018 IO | 6,148 | 110 | ||||||
4.50%, 07/15/2018 | 39,901 | 40,207 | ||||||
0.00%, 03/15/2019 PO | 24,018 | 23,597 | ||||||
6.50%, 03/15/2019 IO | 809 | 31 | ||||||
0.00%, 02/15/2020 PO | 142,602 | 138,481 | ||||||
5.00%, 02/15/2020 IO | 24,589 | 1,070 | ||||||
5.00%, 02/15/2020 IO | 42,487 | 1,984 | ||||||
6.50%, 03/15/2020 | 3,229 | 3,345 | ||||||
10.21%, 03/15/2020 | 7,056 | 7,255 | ||||||
9.50%, 04/15/2020 | 126 | 128 | ||||||
9.60%, 04/15/2020 | 363 | 377 | ||||||
10.00%, 06/15/2020 | 59 | 61 | ||||||
7.80%, 09/15/2020 | 34 | 35 | ||||||
| Principal Amount | Value | |||||||
9.00%, 10/15/2020 | 384 | 412 | ||||||
6.95%, 01/15/2021 | 1,408 | 1,466 | ||||||
8.60%, 01/15/2021 | 6 | 6 | ||||||
9.50%, 01/15/2021 | 333 | 355 | ||||||
9.00%, 04/15/2021 | 320 | 352 | ||||||
2.11%, 05/15/2021 | 240 | 242 | ||||||
5.00%, 05/15/2021 | 814 | 832 | ||||||
6.75%, 05/15/2021 | 647 | 669 | ||||||
7.00%, 05/15/2021 | 4,013 | 4,251 | ||||||
30.06%, 05/15/2021 | 114 | 149 | ||||||
40.01%, 05/15/2021 | 168 | 187 | ||||||
6.00%, 07/15/2021 | 847 | 885 | ||||||
5.50%, 08/15/2021 | 426 | 441 | ||||||
7.00%, 09/15/2021 | 2,016 | 2,117 | ||||||
8.50%, 09/15/2021 | 2,230 | 2,455 | ||||||
6.79%, 11/15/2021 | 96,836 | 100,051 | ||||||
1181.25%, 11/15/2021 IO | 1 | 4 | ||||||
0.00%, 12/15/2021 PO | 63,843 | 63,052 | ||||||
1056.34%, 01/15/2022 IO | 13 | 138 | ||||||
5.00%, 03/15/2022 | 357,913 | 368,187 | ||||||
7.00%, 03/15/2022 | 970 | 1,038 | ||||||
6.00%, 05/15/2022 | 644 | 679 | ||||||
7.00%, 05/15/2022 | 1,155 | 1,172 | ||||||
7.50%, 08/15/2022 | 1,706 | 1,892 | ||||||
8.00%, 08/15/2022 | 4,276 | 4,722 | ||||||
2.31%, 09/15/2022 | 2,880 | 2,932 | ||||||
5.50%, 10/15/2022 | 78,489 | 84,803 | ||||||
4.10%, 12/15/2022 | 2,745 | 2,874 | ||||||
5.50%, 12/15/2022 | 25,833 | 27,301 | ||||||
1.65%, 02/15/2023 | 398 | 406 | ||||||
7.50%, 02/15/2023 | 26,818 | 29,574 | ||||||
5.50%, 03/15/2023 | 146,000 | 160,769 | ||||||
2.31%, 04/15/2023 | 14,930 | 15,256 | ||||||
5.50%, 04/15/2023 | 147,000 | 162,005 | ||||||
7.00%, 04/15/2023 | 23,246 | 25,450 | ||||||
7.50%, 04/15/2023 | 4,582 | 5,058 | ||||||
5.00%, 05/15/2023 | 23,238 | 24,507 | ||||||
7.00%, 05/15/2023 | 2,425 | 2,663 | ||||||
7.89%, 05/15/2023 | 10,291 | 11,550 | ||||||
0.00%, 06/15/2023 PO | 712 | 704 | ||||||
0.00%, 06/15/2023 PO | 977 | 967 | ||||||
5.39%, 06/15/2023 IO | 6,580 | 125 | ||||||
5.60%, 06/15/2023 | 48,620 | 51,882 | ||||||
1.48%, 07/15/2023 | 9,543 | 9,512 | ||||||
7.44%, 07/15/2023 | 12,308 | 13,350 | ||||||
24.94%, 07/15/2023 | 2,004 | 2,829 | ||||||
2.15%, 08/15/2023 | 562 | 578 | ||||||
6.50%, 09/15/2023 | 63,866 | 70,753 | ||||||
7.00%, 09/15/2023 | 19,310 | 21,094 | ||||||
29.50%, 09/15/2023 | 8,294 | 12,821 | ||||||
0.00%, 10/15/2023 PO | 20,713 | 20,403 | ||||||
6.25%, 10/15/2023 | 10,869 | 11,781 | ||||||
18.98%, 10/15/2023 | 5,255 | 7,492 | ||||||
5.00%, 11/15/2023 | 303,163 | 320,920 | ||||||
5.50%, 11/15/2023 | 75,401 | 81,557 | ||||||
6.00%, 11/15/2023 | 25,834 | 27,831 | ||||||
5.00%, 12/15/2023 | 30,901 | 33,037 | ||||||
6.50%, 12/15/2023 | 14,847 | 16,114 | ||||||
6.50%, 12/15/2023 | 28,501 | 30,920 | ||||||
7.00%, 01/15/2024 | 9,627 | 10,543 | ||||||
0.00%, 02/15/2024 PO | 10,488 | 10,110 | ||||||
0.00%, 02/15/2024 PO | 5,959 | 5,395 | ||||||
7.00%, 02/15/2024 | 1,655 | 1,953 | ||||||
10.00%, 02/15/2024 | 2,165 | 2,910 | ||||||
16.63%, 02/15/2024 | 1,104 | 1,453 | ||||||
1.42%, 03/15/2024 | 800 | 793 | ||||||
1.76%, 03/15/2024 | 1,671 | 1,692 | ||||||
7.00%, 03/15/2024 | 8,654 | 9,498 | ||||||
7.00%, 03/15/2024 | 45,703 | 50,225 | ||||||
28.53%, 03/15/2024 IO | 5,671 | 2,170 | ||||||
| Principal Amount | Value | |||||||
7.50%, 04/15/2024 | 30,429 | 33,597 | ||||||
0.00%, 05/15/2024 PO | 6,613 | 6,258 | ||||||
8.33%, 05/15/2024 IO | 15,834 | 2,983 | ||||||
6.00%, 06/15/2024 | 29,040 | 32,839 | ||||||
7.50%, 08/15/2024 | 6,658 | 7,510 | ||||||
4.00%, 12/15/2024 | 206,000 | 221,425 | ||||||
5.00%, 12/15/2024 | 86,509 | 92,862 | ||||||
27.45%, 04/15/2025 | 25,625 | 35,337 | ||||||
4.50%, 06/15/2025 | 722,000 | 784,970 | ||||||
13.98%, 08/15/2025 | 14,378 | 17,265 | ||||||
22.93%, 10/15/2025 | 29,506 | 40,708 | ||||||
3.50%, 01/15/2026 | 2,000,000 | 2,111,149 | ||||||
5.00%, 03/15/2026 | 271,952 | 286,175 | ||||||
6.50%, 03/15/2026 | 4,274 | 4,649 | ||||||
6.50%, 07/15/2026 | 29,136 | 32,279 | ||||||
7.50%, 09/15/2026 | 4,331 | 4,927 | ||||||
8.00%, 09/15/2026 | 12,645 | 14,704 | ||||||
6.50%, 01/15/2027 | 20,458 | 22,664 | ||||||
7.50%, 01/15/2027 | 29,174 | 33,450 | ||||||
7.50%, 01/15/2027 | 10,365 | 11,942 | ||||||
1.86%, 02/15/2027 | 816 | 830 | ||||||
6.00%, 05/15/2027 | 25,301 | 27,619 | ||||||
7.25%, 07/15/2027 | 1,237 | 1,413 | ||||||
7.50%, 09/15/2027 | 10,675 | 12,402 | ||||||
6.50%, 12/15/2027 | 14,635 | 16,342 | ||||||
7.00%, 03/15/2028 IO | 16,994 | 3,328 | ||||||
7.50%, 03/15/2028 | 53,214 | 61,476 | ||||||
7.50%, 05/15/2028 | 17,959 | 20,675 | ||||||
6.50%, 06/15/2028 | 26,725 | 30,003 | ||||||
7.00%, 06/15/2028 | 3,239 | 3,680 | ||||||
6.00%, 07/15/2028 | 10,898 | 11,979 | ||||||
6.25%, 08/15/2028 | 56,404 | 61,893 | ||||||
6.50%, 08/15/2028 | 52,689 | 59,070 | ||||||
6.00%, 09/15/2028 | 10,008 | 11,100 | ||||||
7.00%, 10/15/2028 IO | 20,947 | 2,491 | ||||||
6.00%, 11/15/2028 | 45,286 | 50,311 | ||||||
6.00%, 12/15/2028 | 91,697 | 101,793 | ||||||
1.76%, 01/15/2029 | 21,995 | 22,339 | ||||||
6.00%, 01/15/2029 | 124,102 | 140,988 | ||||||
6.00%, 02/15/2029 | 27,082 | 29,898 | ||||||
6.25%, 02/15/2029 | 139,410 | 154,982 | ||||||
26.00%, 03/15/2029 | 3,567 | 5,851 | ||||||
7.00%, 04/15/2029 IO | 1,972 | 233 | ||||||
4.00%, 05/15/2029 | 396,240 | 404,730 | ||||||
7.00%, 06/15/2029 | 109,688 | 124,965 | ||||||
7.50%, 06/15/2029 IO | 8,723 | 1,088 | ||||||
7.00%, 07/15/2029 | 53,897 | 62,105 | ||||||
7.00%, 08/15/2029 | 29,579 | 33,834 | ||||||
4.00%, 11/15/2029 IO | 233,319 | 16,199 | ||||||
7.50%, 11/15/2029 | 140 | 163 | ||||||
8.00%, 11/15/2029 | 25,314 | 29,161 | ||||||
7.00%, 01/15/2030 | 53,216 | 61,513 | ||||||
8.00%, 01/15/2030 | 15,458 | 18,351 | ||||||
8.00%, 01/15/2030 | 52,134 | 62,127 | ||||||
8.00%, 03/15/2030 | 9,910 | 11,653 | ||||||
5.00%, 04/15/2030 | 702,000 | 794,689 | ||||||
8.00%, 04/15/2030 | 15,067 | 17,965 | ||||||
7.50%, 05/15/2030 | 10,393 | 12,242 | ||||||
7.50%, 08/15/2030 | 11,182 | 13,170 | ||||||
7.25%, 09/15/2030 | 30,156 | 35,350 | ||||||
7.00%, 10/15/2030 | 36,023 | 41,687 | ||||||
7.50%, 10/15/2030 | 3,297 | 3,868 | ||||||
7.50%, 10/15/2030 | 796 | 937 | ||||||
7.25%, 12/15/2030 | 38,744 | 44,865 | ||||||
7.00%, 03/15/2031 | 20,425 | 23,495 | ||||||
6.50%, 05/15/2031 | 9,859 | 11,256 | ||||||
7.00%, 06/15/2031 | 21,713 | 25,033 | ||||||
8.50%, 06/15/2031 | 44,775 | 52,043 | ||||||
6.00%, 07/15/2031 | 10,817 | 12,214 | ||||||
7.00%, 07/15/2031 | 41,367 | 47,822 | ||||||
| Principal Amount | Value | |||||||
6.50%, 08/15/2031 | 20,635 | 23,401 | ||||||
6.50%, 08/15/2031 | 260,285 | 302,982 | ||||||
6.50%, 08/15/2031 | 26,078 | 28,838 | ||||||
6.50%, 08/15/2031 | 21,336 | 23,920 | ||||||
6.50%, 10/15/2031 | 23,825 | 26,396 | ||||||
6.50%, 01/15/2032 | 39,376 | 44,969 | ||||||
6.50%, 01/15/2032 | 26,498 | 30,220 | ||||||
2.06%, 02/15/2032 | 130,260 | 133,055 | ||||||
6.38%, 02/15/2032 | 28,171 | 30,939 | ||||||
6.50%, 02/15/2032 | 49,700 | 56,699 | ||||||
6.50%, 02/15/2032 | 44,657 | 50,947 | ||||||
6.84%, 02/15/2032 IO | 100,400 | 23,380 | ||||||
7.49%, 02/15/2032 IO | 20,956 | 5,720 | ||||||
13.78%, 02/15/2032 | 56,514 | 72,425 | ||||||
16.49%, 02/15/2032 | 51,904 | 77,839 | ||||||
6.50%, 03/15/2032 | 58,455 | 64,878 | ||||||
6.50%, 03/15/2032 | 65,410 | 74,649 | ||||||
6.79%, 03/15/2032 IO | 41,548 | 9,874 | ||||||
6.84%, 03/15/2032 IO | 27,104 | 5,881 | ||||||
7.00%, 03/15/2032 | 51,236 | 59,404 | ||||||
7.00%, 03/15/2032 | 39,841 | 45,984 | ||||||
6.50%, 04/15/2032 | 150,444 | 168,475 | ||||||
6.50%, 04/15/2032 | 96,949 | 110,610 | ||||||
6.50%, 04/15/2032 | 15,636 | 17,855 | ||||||
7.00%, 04/15/2032 | 30,795 | 34,983 | ||||||
7.00%, 04/15/2032 | 91,766 | 105,380 | ||||||
5.50%, 05/15/2032 | 3,281 | 3,280 | ||||||
6.50%, 05/15/2032 | 55,151 | 62,896 | ||||||
7.00%, 05/15/2032 | 40,060 | 46,864 | ||||||
6.50%, 06/15/2032 | 58,268 | 66,498 | ||||||
6.50%, 06/15/2032 | 34,929 | 39,003 | ||||||
6.50%, 06/15/2032 | 46,752 | 52,195 | ||||||
6.50%, 07/15/2032 | 69,651 | 78,504 | ||||||
6.50%, 07/15/2032 | 45,952 | 51,054 | ||||||
0.00%, 09/15/2032 PO | 1,528,733 | 1,373,065 | ||||||
6.00%, 09/15/2032 | 73,261 | 83,010 | ||||||
0.00%, 12/15/2032 PO | 1,852 | 1,843 | ||||||
0.00%, 12/15/2032 PO | 19,972 | 19,682 | ||||||
0.00%, 12/15/2032 PO | 31,768 | 27,919 | ||||||
1.91%, 12/15/2032 | 68,369 | 69,006 | ||||||
6.00%, 12/15/2032 | 70,894 | 80,486 | ||||||
6.00%, 12/15/2032 | 121,213 | 135,330 | ||||||
15.82%, 12/15/2032 | 40,307 | 54,415 | ||||||
6.00%, 01/15/2033 | 83,471 | 95,102 | ||||||
6.00%, 02/15/2033 | 60,954 | 69,507 | ||||||
6.00%, 02/15/2033 | 298,564 | 335,007 | ||||||
6.00%, 03/15/2033 | 52,144 | 56,223 | ||||||
6.50%, 03/15/2033 IO | 33,739 | 6,376 | ||||||
12.73%, 06/15/2033 | 113,133 | 146,573 | ||||||
5.00%, 07/15/2033 | 929,291 | 1,033,054 | ||||||
6.27%, 07/15/2033 | 462 | 562 | ||||||
10.97%, 07/15/2033 | 31,665 | 39,010 | ||||||
3.00%, 08/15/2033 | 495,000 | 497,942 | ||||||
12.63%, 09/15/2033 | 34,013 | 43,630 | ||||||
6.97%, 10/15/2033 | 947,484 | 1,043,003 | ||||||
13.95%, 11/15/2033 | 16,573 | 22,529 | ||||||
1.76%, 12/15/2033 | 255,480 | 256,997 | ||||||
5.00%, 01/15/2034 | 407,614 | 444,037 | ||||||
5.50%, 02/15/2034 | 14,376 | 15,063 | ||||||
6.00%, 05/15/2034 | 248,562 | 271,944 | ||||||
20.24%, 06/15/2034 | 92,552 | 119,522 | ||||||
0.00%, 07/15/2034 PO | 173,592 | 152,110 | ||||||
3.38%, 07/15/2034 | 67,048 | 70,518 | ||||||
4.00%, 11/15/2034 IO | 279,734 | 6,777 | ||||||
0.00%, 01/15/2035 PO | 702 | 694 | ||||||
0.00%, 02/15/2035 PO | 51,146 | 46,671 | ||||||
23.06%, 02/15/2035 | 65,922 | 92,579 | ||||||
0.00%, 04/15/2035 PO | 85,781 | 77,394 | ||||||
6.00%, 04/15/2035 | 1,057,000 | 1,217,252 | ||||||
1.56%, 05/15/2035 | 92,430 | 92,696 | ||||||
| Principal Amount | Value | |||||||
1.46%, 06/15/2035 | 101,222 | 101,094 | ||||||
14.04%, 06/15/2035 | 4,490 | 5,477 | ||||||
0.00%, 08/15/2035 PO | 8,843 | 8,141 | ||||||
1.96%, 08/15/2035 | 89,738 | 91,595 | ||||||
0.00%, 09/15/2035 PO | 44,497 | 40,891 | ||||||
16.14%, 11/15/2035 | 49,445 | 69,078 | ||||||
6.00%, 01/15/2036 | 197,054 | 224,277 | ||||||
20.32%, 01/15/2036 | 15,215 | 22,481 | ||||||
0.00%, 02/15/2036 PO | 55,498 | 50,425 | ||||||
0.00%, 02/15/2036 PO | 42,611 | 37,514 | ||||||
0.00%, 02/15/2036 PO | 166,159 | 150,027 | ||||||
0.00%, 02/15/2036 PO | 36,852 | 31,068 | ||||||
0.00%, 03/15/2036 PO | 102,025 | 92,466 | ||||||
0.00%, 03/15/2036 PO | 97,440 | 88,182 | ||||||
0.00%, 03/15/2036 PO | 11,034 | 9,925 | ||||||
6.00%, 03/15/2036 | 2,193 | 3,316 | ||||||
0.00%, 04/15/2036 PO | 199,791 | 181,589 | ||||||
0.00%, 04/15/2036 PO | 108,893 | 95,090 | ||||||
0.00%, 04/15/2036 PO | 59,630 | 52,276 | ||||||
0.00%, 04/15/2036 PO | 192,620 | 173,696 | ||||||
6.00%, 04/15/2036 | 1,053,287 | 1,185,480 | ||||||
6.00%, 04/15/2036 | 130,833 | 148,141 | ||||||
6.00%, 04/15/2036 IO | 107,665 | 21,917 | ||||||
0.00%, 05/15/2036 PO | 52,039 | 48,372 | ||||||
0.00%, 05/15/2036 PO | 16,226 | 14,724 | ||||||
0.00%, 05/15/2036 PO | 80,564 | 69,490 | ||||||
0.00%, 05/15/2036 PO | 14,307 | 11,741 | ||||||
1.61%, 05/15/2036 | 799,579 | 802,678 | ||||||
1.66%, 05/15/2036 | 414,844 | 416,619 | ||||||
0.00%, 06/15/2036 PO | 185,333 | 171,576 | ||||||
6.00%, 06/15/2036 | 29,322 | 29,558 | ||||||
6.00%, 06/15/2036 | 31,452 | 35,251 | ||||||
16.48%, 06/15/2036 | 33,157 | 45,386 | ||||||
0.00%, 07/15/2036 PO | 36,771 | 32,913 | ||||||
5.94%, 07/15/2036 IO | 14,246 | 1,688 | ||||||
6.50%, 07/15/2036 | 171,443 | 193,080 | ||||||
6.50%, 07/15/2036 | 117,807 | 131,771 | ||||||
0.00%, 08/15/2036 PO | 56,479 | 49,927 | ||||||
5.49%, 08/15/2036 IO | 835,820 | 149,173 | ||||||
5.50%, 08/15/2036 | 251,525 | 277,028 | ||||||
5.50%, 08/15/2036 | 89,683 | 96,147 | ||||||
0.00%, 09/15/2036 PO | 32,384 | 30,027 | ||||||
0.00%, 09/15/2036 PO | 23,812 | 18,960 | ||||||
0.00%, 10/15/2036 PO | 63,093 | 55,895 | ||||||
5.54%, 10/15/2036 IO | 73,883 | 11,651 | ||||||
7.50%, 11/15/2036 | 949,977 | 1,114,908 | ||||||
0.00%, 12/15/2036 PO | 31,505 | 27,306 | ||||||
7.00%, 12/15/2036 | 2,313,344 | 2,699,770 | ||||||
7.50%, 12/15/2036 | 787,074 | 944,705 | ||||||
0.00%, 01/15/2037 PO | 31,366 | 27,419 | ||||||
4.98%, 01/15/2037 IO | 56,705 | 8,489 | ||||||
0.00%, 02/15/2037 PO | 84,713 | 76,682 | ||||||
0.00%, 02/15/2037 PO | 11,185 | 10,115 | ||||||
1.60%, 02/15/2037 | 64,239 | 64,395 | ||||||
6.00%, 02/15/2037 | 99,571 | 105,903 | ||||||
0.00%, 03/15/2037 PO | 18,680 | 17,881 | ||||||
5.29%, 03/15/2037 IO | 84,141 | 11,346 | ||||||
9.00%, 03/15/2037 | 29,549 | 34,665 | ||||||
0.00%, 04/15/2037 PO | 41,379 | 38,108 | ||||||
6.00%, 04/15/2037 | 93,383 | 105,223 | ||||||
0.00%, 05/15/2037 PO | 352,220 | 302,833 | ||||||
0.00%, 05/15/2037 PO | 63,341 | 58,438 | ||||||
0.00%, 05/15/2037 PO | 2,921 | 2,685 | ||||||
6.00%, 05/15/2037 | 185,703 | 193,439 | ||||||
0.00%, 06/15/2037 PO | 9,565 | 9,064 | ||||||
0.00%, 06/15/2037 PO | 35,238 | 32,022 | ||||||
0.00%, 07/15/2037 PO | 448,075 | 381,933 | ||||||
1.40%, 07/15/2037 | 1,655,958 | 1,657,344 | ||||||
4.50%, 07/15/2037 IO | 540,625 | 13,761 | ||||||
5.44%, 07/15/2037 IO | 73,617 | 11,309 | ||||||
| Principal Amount | Value | |||||||
4.00%, 08/15/2037 IO | 510,805 | 22,386 | ||||||
0.00%, 09/15/2037 PO | 46,361 | 42,838 | ||||||
1.76%, 09/15/2037 | 24,195 | 24,433 | ||||||
4.00%, 10/15/2037 IO | 176,145 | 3,605 | ||||||
4.00%, 10/15/2037 IO | 301,022 | 10,251 | ||||||
1.84%, 11/15/2037 | 975,315 | 987,989 | ||||||
5.26%, 11/15/2037 IO | 385,306 | 52,243 | ||||||
5.29%, 11/15/2037 IO | 255,982 | 31,816 | ||||||
4.84%, 01/15/2038 IO | 480,624 | 84,272 | ||||||
14.55%, 02/15/2038 | 19,913 | 24,473 | ||||||
5.50%, 03/15/2038 | 703,705 | 784,165 | ||||||
5.64%, 04/15/2038 IO | 179,474 | 31,540 | ||||||
5.50%, 05/15/2038 | 103,131 | 110,842 | ||||||
5.04%, 06/15/2038 IO | 203,108 | 26,268 | ||||||
6.00%, 06/15/2038 | 552,762 | 611,729 | ||||||
6.00%, 06/15/2038 | 30,527 | 34,164 | ||||||
4.69%, 08/15/2038 IO | 354,288 | 53,689 | ||||||
5.70%, 10/15/2038 | 155,043 | 172,904 | ||||||
5.50%, 01/15/2039 | 287,561 | 320,672 | ||||||
2.76%, 02/15/2039 | 146,772 | 150,930 | ||||||
4.84%, 02/15/2039 IO | 143,340 | 22,150 | ||||||
1.56%, 04/15/2039 | 622,400 | 624,319 | ||||||
1.61%, 05/15/2039 | 756,665 | 753,874 | ||||||
4.94%, 05/15/2039 IO | 85,474 | 7,295 | ||||||
5.14%, 05/15/2039 IO | 179,406 | 17,092 | ||||||
2.36%, 07/15/2039 | 88,636 | 90,649 | ||||||
4.50%, 07/15/2039 | 1,001,102 | 1,067,504 | ||||||
1.61%, 08/15/2039 | 214,430 | 214,888 | ||||||
3.50%, 08/15/2039 | 748,212 | 776,496 | ||||||
0.00%, 10/15/2039 PO | 162,973 | 138,459 | ||||||
5.00%, 10/15/2039 IO | 485,869 | 71,311 | ||||||
5.09%, 12/15/2039 IO | 190,160 | 32,913 | ||||||
0.00%, 01/15/2040 PO | 163,223 | 145,173 | ||||||
1.91%, 01/15/2040 IO | 2,062,851 | 115,036 | ||||||
5.00%, 01/15/2040 | 828,160 | 906,362 | ||||||
13.64%, 02/15/2040 | 475,000 | 632,830 | ||||||
1.66%, 10/15/2040 | 258,086 | 259,510 | ||||||
4.84%, 10/15/2040 IO | 587,770 | 80,438 | ||||||
4.84%, 10/15/2040 IO | 793,329 | 120,507 | ||||||
1.71%, 12/15/2040 | 2,131,116 | 2,149,220 | ||||||
1.71%, 03/15/2041 | 1,547,995 | 1,551,786 | ||||||
5.00%, 05/15/2041 | 1,150,088 | 1,353,170 | ||||||
5.50%, 05/15/2041 | 405,704 | 425,020 | ||||||
5.50%, 05/15/2041 | 1,183,835 | 1,288,744 | ||||||
1.56%, 10/15/2041 | 1,082,662 | 1,087,062 | ||||||
4.00%, 11/15/2041 | 960,579 | 1,014,714 | ||||||
4.00%, 12/15/2041 | 493,098 | 525,493 | ||||||
1.66%, 03/15/2042 | 1,124,049 | 1,130,827 | ||||||
1.66%, 07/15/2042 | 551,200 | 552,674 | ||||||
1.61%, 08/15/2042 | 2,877,016 | 2,913,217 | ||||||
1.56%, 09/15/2042 | 1,003,255 | 998,805 | ||||||
3.00%, 06/15/2043 | 206,000 | 202,783 | ||||||
3.50%, 09/15/2043 | 6,242,666 | 6,474,250 | ||||||
4.50%, 09/15/2043 | 1,000,000 | 1,120,973 | ||||||
3.50%, 11/15/2043 | 5,938,666 | 6,139,439 | ||||||
2.75%, 02/15/2046 | 2,216,867 | 2,291,408 | ||||||
7.29%, 11/15/2046 | 1,075,948 | 1,257,988 | ||||||
3.50%, 06/15/2048 | 6,118,114 | 6,328,025 | ||||||
0.00%, 10/15/2049 PO | 565,417 | 514,661 | ||||||
Freddie Mac Strips | ||||||||
4.50%, 11/15/2020 IO | 43,512 | 1,344 | ||||||
4.50%, 12/15/2020 IO | 30,676 | 1,165 | ||||||
9.00%, 04/01/2022 IO | 117 | 16 | ||||||
0.00%, 04/01/2028 PO | 91,554 | 83,313 | ||||||
5.00%, 09/15/2035 IO | 164,707 | 35,040 | ||||||
5.00%, 09/15/2035 IO | 307,709 | 58,388 | ||||||
5.00%, 09/15/2035 IO | 197,120 | 41,386 | ||||||
6.54%, 08/15/2036 IO | 564,483 | 107,368 | ||||||
1.71%, 07/15/2042 | 3,379,973 | 3,394,287 | ||||||
3.50%, 07/15/2042 | 7,972,490 | 8,210,520 | ||||||
| Principal Amount | Value | |||||||
1.66%, 08/15/2042 | 2,207,840 | 2,219,663 | ||||||
1.71%, 08/15/2042 | 1,932,669 | 1,948,939 | ||||||
3.00%, 08/15/2042 | 2,677,501 | 2,659,009 | ||||||
3.00%, 01/15/2043 | 646,516 | 641,875 | ||||||
0.00%, 09/15/2043 PO | 1,254,498 | 1,013,128 | ||||||
Freddie Mac Structured Pass-Through Certificates | ||||||||
5.66%, 07/25/2032 | 70,871 | 77,181 | ||||||
5.20%, 07/25/2033 | 214,095 | 234,874 | ||||||
3.55%, 10/25/2037 | 1,792,514 | 1,830,361 | ||||||
7.50%, 02/25/2042 | 290,880 | 339,019 | ||||||
7.50%, 08/25/2042 | 48,066 | 58,430 | ||||||
6.50%, 02/25/2043 | 286,097 | 337,032 | ||||||
7.00%, 02/25/2043 | 96,062 | 112,327 | ||||||
5.23%, 05/25/2043 | 678,765 | 765,737 | ||||||
0.00%, 07/25/2043 PO | 27,582 | 24,140 | ||||||
7.50%, 07/25/2043 | 70,762 | 85,312 | ||||||
0.00%, 09/25/2043 PO | 31,513 | 26,374 | ||||||
7.50%, 09/25/2043 | 394,956 | 483,221 | ||||||
0.00%, 10/25/2043 PO | 35,698 | 29,182 | ||||||
7.00%, 10/25/2043 | 397,242 | 478,004 | ||||||
1.89%, 10/25/2044 | 749,332 | 759,702 | ||||||
FREMF 2013-K25 Mortgage Trust | ||||||||
3.62%, 11/25/2045 (Acquired 03/22/2017, Cost $1,964,332) (1) | 2,000,000 | 2,010,099 | ||||||
FREMF 2013-K31 Mortgage Trust | ||||||||
3.74%, 07/25/2046 (Acquired 03/22/2017, Cost $1,952,510) (1) | 2,000,000 | 1,975,120 | ||||||
FREMF 2013-K35 Mortgage Trust | ||||||||
4.08%, 08/25/2023 (Acquired 03/24/2017, Cost $2,864,531) (1) | 2,951,000 | 2,949,253 | ||||||
FREMF 2014-K40 Mortgage Trust | ||||||||
4.21%, 11/25/2047 (Acquired 01/17/2017, Cost $2,840,393) (1) | 2,970,000 | 2,959,642 | ||||||
FREMF 2014-K41 Mortgage Trust | ||||||||
3.96%, 11/25/2047 (Acquired 03/24/2017, Cost $5,606,583) (1) | 6,000,000 | 5,901,005 | ||||||
FREMF 2015-K44 Mortgage Trust | ||||||||
3.81%, 01/25/2048 (Acquired 01/17/2017, Cost $3,447,861) (1) | 3,510,000 | 3,541,667 | ||||||
FREMF 2015-K49 Mortgage Trust | ||||||||
3.85%, 10/25/2048 (Acquired 03/24/2017, Cost $3,616,517) (1) | 4,000,000 | 3,836,618 | ||||||
FREMF 2015-K720 Mortgage Trust | ||||||||
3.51%, 07/25/2022 (Acquired 02/21/2017, Cost $3,622,547) (1) | 4,000,000 | 3,653,288 | ||||||
FREMF 2016-K59 Mortgage Trust | ||||||||
3.69%, 11/25/2049 (Acquired 11/15/2016, Cost $2,215,532) (1) | 2,450,000 | 2,390,340 | ||||||
FREMF 2016-K722 Mortgage Trust | ||||||||
3.97%, 07/25/2049 (Acquired 06/22/2016, Cost $1,751,515) (1) | 1,845,000 | 1,881,602 | ||||||
Ginnie Mae | ||||||||
4.00%, 07/15/2042 (3) | 56,750,000 | 59,711,641 | ||||||
Ginnie Mae I Pool | ||||||||
9.00%, 02/15/2020 | 50 | 51 | ||||||
7.50%, 11/15/2022 | 100 | 100 | ||||||
7.50%, 03/15/2023 | 262 | 280 | ||||||
7.00%, 08/15/2023 | 510 | 542 | ||||||
7.00%, 09/15/2023 | 17,908 | 19,082 | ||||||
7.00%, 11/15/2023 | 997 | 1,081 | ||||||
6.50%, 01/15/2024 | 4,332 | 4,737 | ||||||
7.00%, 02/15/2024 | 7,686 | 8,183 | ||||||
9.50%, 10/15/2024 | 30,723 | 33,028 | ||||||
9.00%, 11/15/2024 | 994 | 1,068 | ||||||
9.50%, 12/15/2025 | 2,282 | 2,471 | ||||||
7.50%, 11/15/2026 | 1,154 | 1,190 | ||||||
7.50%, 07/15/2027 | 1,823 | 1,890 | ||||||
6.50%, 03/15/2028 | 8,226 | 8,995 | ||||||
7.50%, 07/15/2028 | 780 | 799 | ||||||
8.00%, 08/15/2028 | 1,580 | 1,585 | ||||||
6.50%, 09/15/2028 | 17,317 | 18,935 | ||||||
7.50%, 09/15/2028 | 5,682 | 6,282 | ||||||
6.50%, 10/15/2028 | 1,490 | 1,647 | ||||||
6.00%, 11/15/2028 | 10,898 | 12,288 | ||||||
7.00%, 09/15/2031 | 109,293 | 130,187 | ||||||
6.50%, 01/15/2032 | 91,941 | 107,989 | ||||||
6.50%, 07/15/2032 | 2,586 | 2,828 | ||||||
6.50%, 02/15/2033 | 16,333 | 18,096 | ||||||
7.00%, 02/15/2033 | 6,195 | 6,846 | ||||||
5.50%, 04/15/2033 | 342,693 | 386,178 | ||||||
| Principal Amount | Value | |||||||
6.50%, 04/15/2033 | 7,668 | 8,385 | ||||||
5.50%, 06/15/2033 | 4,092 | 4,597 | ||||||
7.00%, 06/15/2033 | 22,519 | 27,009 | ||||||
5.50%, 12/15/2033 | 16,176 | 18,133 | ||||||
5.50%, 07/15/2034 | 8,264 | 9,303 | ||||||
5.50%, 09/15/2034 | 19,715 | 22,036 | ||||||
7.00%, 06/15/2035 | 302,900 | 356,439 | ||||||
6.50%, 12/15/2035 | 100,911 | 117,520 | ||||||
7.00%, 04/15/2037 | 38,495 | 43,516 | ||||||
7.50%, 10/15/2037 | 45,436 | 52,988 | ||||||
4.00%, 06/15/2039 | 669,803 | 704,961 | ||||||
4.50%, 04/15/2040 | 4,059,178 | 4,365,758 | ||||||
4.00%, 10/15/2040 | 359,767 | 379,505 | ||||||
3.50%, 01/15/2042 | 7,121,060 | 7,395,468 | ||||||
3.50%, 03/15/2043 | 1,465,085 | 1,522,870 | ||||||
3.50%, 04/15/2043 | 6,140,373 | 6,394,996 | ||||||
3.00%, 05/15/2043 | 910,530 | 923,358 | ||||||
3.50%, 06/15/2043 | 1,986,056 | 2,067,018 | ||||||
3.50%, 07/15/2043 | 807,511 | 839,166 | ||||||
Ginnie Mae II Pool | ||||||||
8.50%, 03/20/2025 | 433 | 477 | ||||||
8.50%, 04/20/2025 | 2,146 | 2,373 | ||||||
8.50%, 05/20/2025 | 5,419 | 5,985 | ||||||
8.00%, 12/20/2025 | 815 | 909 | ||||||
8.00%, 06/20/2026 | 1,972 | 2,228 | ||||||
8.00%, 08/20/2026 | 1,479 | 1,755 | ||||||
8.00%, 09/20/2026 | 1,614 | 1,919 | ||||||
8.00%, 11/20/2026 | 1,349 | 1,598 | ||||||
8.00%, 10/20/2027 | 3,753 | 4,301 | ||||||
8.00%, 11/20/2027 | 2,938 | 3,347 | ||||||
8.00%, 12/20/2027 | 1,447 | 1,619 | ||||||
7.50%, 02/20/2028 | 2,179 | 2,476 | ||||||
6.00%, 03/20/2028 | 9,453 | 10,956 | ||||||
8.00%, 06/20/2028 | 589 | 599 | ||||||
8.00%, 08/20/2028 | 156 | 163 | ||||||
7.50%, 09/20/2028 | 6,095 | 6,969 | ||||||
8.00%, 09/20/2028 | 463 | 481 | ||||||
6.50%, 07/20/2029 | 99,678 | 115,556 | ||||||
6.00%, 11/20/2033 | 6,734 | 7,635 | ||||||
5.00%, 10/20/2037 | 571,233 | 630,263 | ||||||
7.00%, 08/20/2038 | 41,553 | 47,353 | ||||||
6.00%, 09/20/2038 | 725,704 | 811,121 | ||||||
6.00%, 11/20/2038 | 6,419 | 6,903 | ||||||
6.00%, 08/20/2039 | 364,838 | 421,117 | ||||||
5.50%, 09/20/2039 | 226,630 | 256,371 | ||||||
4.50%, 06/20/2040 | 1,266,384 | 1,360,387 | ||||||
5.00%, 07/20/2040 | 322,247 | 354,090 | ||||||
4.00%, 10/20/2040 | 3,522,931 | 3,741,192 | ||||||
4.50%, 01/20/2041 | 975,642 | 1,048,200 | ||||||
4.50%, 03/20/2041 | 933,716 | 1,003,099 | ||||||
4.50%, 05/20/2041 | 471,487 | 506,494 | ||||||
4.50%, 06/20/2041 | 3,339,514 | 3,587,571 | ||||||
4.50%, 07/15/2041 (3) | 10,385,000 | 11,034,460 | ||||||
4.50%, 09/20/2041 | 1,027,695 | 1,104,098 | ||||||
3.00%, 06/20/2042 | 500,524 | 507,476 | ||||||
4.00%, 06/20/2042 | 4,589,251 | 4,852,187 | ||||||
3.00%, 08/20/2042 | 6,721,423 | 6,814,783 | ||||||
3.50%, 10/20/2042 | 7,659,717 | 7,965,650 | ||||||
3.00%, 11/20/2042 | 3,702,654 | 3,754,083 | ||||||
3.50%, 11/20/2042 | 1,631,810 | 1,696,985 | ||||||
3.00%, 12/20/2042 | 728,846 | 738,969 | ||||||
4.00%, 12/20/2042 | 4,282,344 | 4,527,547 | ||||||
3.00%, 01/20/2043 | 1,888,061 | 1,914,285 | ||||||
4.00%, 02/20/2043 | 2,092,371 | 2,213,091 | ||||||
3.00%, 04/20/2043 | 4,785,847 | 4,852,324 | ||||||
3.50%, 05/20/2043 | 1,774,592 | 1,845,475 | ||||||
3.00%, 09/20/2043 | 1,434,414 | 1,454,340 | ||||||
4.50%, 09/20/2043 | 2,788,459 | 2,964,404 | ||||||
3.00%, 10/20/2043 | 209,205 | 212,111 | ||||||
4.50%, 10/20/2043 | 5,360,449 | 5,698,680 | ||||||
| Principal Amount | Value | |||||||
4.00%, 10/20/2043 | 4,049,537 | 4,282,062 | ||||||
4.50%, 12/20/2043 | 1,414,194 | 1,503,426 | ||||||
3.00%, 01/20/2044 | 1,259,501 | 1,276,997 | ||||||
3.00%, 07/20/2044 | 618,748 | 626,626 | ||||||
3.00%, 12/20/2044 | 1,181,133 | 1,194,255 | ||||||
4.00%, 12/20/2044 | 1,002,671 | 1,055,853 | ||||||
3.50%, 03/20/2045 | 2,853,015 | 2,957,544 | ||||||
3.00%, 04/20/2045 | 8,520,302 | 8,614,524 | ||||||
3.50%, 04/20/2045 | 20,639,700 | 21,395,903 | ||||||
4.00%, 05/20/2045 | 9,762,541 | 10,317,274 | ||||||
3.00%, 07/15/2045 (3) | 23,660,000 | 23,896,600 | ||||||
3.50%, 07/15/2045 (3) | 50,360,000 | 52,150,142 | ||||||
3.50%, 07/20/2045 | 9,176,988 | 9,513,216 | ||||||
4.00%, 01/20/2046 | 1,630,780 | 1,717,276 | ||||||
4.50%, 01/20/2046 | 5,015,021 | 5,331,456 | ||||||
4.00%, 03/20/2046 | 2,124,591 | 2,237,279 | ||||||
3.00%, 04/20/2046 | 11,399,788 | 11,525,854 | ||||||
4.00%, 04/20/2046 | 5,459,867 | 5,749,457 | ||||||
3.00%, 05/20/2046 | 461,251 | 466,352 | ||||||
4.00%, 05/20/2046 | 9,527,038 | 10,032,350 | ||||||
3.50%, 06/20/2046 | 5,335,151 | 5,544,479 | ||||||
4.00%, 06/20/2046 | 4,415,286 | 4,649,472 | ||||||
3.00%, 08/20/2046 | 22,005,339 | 22,248,688 | ||||||
3.00%, 09/20/2046 | 2,923,464 | 2,955,794 | ||||||
3.50%, 11/20/2046 | 19,596,625 | 20,314,612 | ||||||
3.00%, 01/20/2047 | 6,468,153 | 6,539,682 | ||||||
3.00%, 02/20/2047 | 15,018,607 | 15,184,692 | ||||||
3.00%, 03/20/2047 | 996,122 | 1,007,138 | ||||||
4.46%, 05/20/2063 | 522,402 | 548,366 | ||||||
GMACM Mortgage Loan Trust 2003-AR1 | ||||||||
3.69%, 10/19/2033 | 356,044 | 352,403 | ||||||
GMACM Mortgage Loan Trust 2003-AR2 | ||||||||
3.79%, 12/19/2033 | 264,525 | 262,059 | ||||||
GMACM Mortgage Loan Trust 2003-J8 | ||||||||
5.25%, 12/25/2033 | 11,310 | 11,449 | ||||||
GMACM Mortgage Loan Trust 2005-AR3 | ||||||||
3.74%, 06/19/2035 | 216,024 | 211,723 | ||||||
GNMA Remic Trust 2017-H14 | ||||||||
1.65%, 06/20/2067 (8) | 8,264,572 | 8,250,367 | ||||||
1.70%, 06/20/2067 (8) | 15,000,000 | 1,551,563 | ||||||
GNMA Remic Trust 2015-137 | ||||||||
5.47%, 01/20/2038 | 1,032,701 | 1,154,782 | ||||||
Government National Mortgage Association | ||||||||
5.50%, 11/20/2020 | 271,700 | 277,333 | ||||||
5.00%, 04/16/2023 | 381,243 | 389,619 | ||||||
6.50%, 10/16/2024 | 151,367 | 164,292 | ||||||
6.00%, 02/20/2029 | 141,642 | 157,488 | ||||||
7.43%, 08/16/2029 IO | 15,248 | 3,086 | ||||||
8.50%, 02/16/2030 | 173,758 | 201,888 | ||||||
9.00%, 03/16/2030 | 155,102 | 179,401 | ||||||
6.33%, 04/16/2030 IO | 137,464 | 20,159 | ||||||
8.00%, 06/20/2030 | 16,441 | 19,248 | ||||||
9.00%, 10/20/2030 | 24,665 | 29,408 | ||||||
9.00%, 11/16/2030 IO | 1,468 | 213 | ||||||
9.00%, 11/20/2030 | 15,463 | 18,629 | ||||||
7.53%, 01/16/2031 IO | 8,753 | 1,922 | ||||||
7.38%, 03/16/2031 IO | 7,159 | 2,013 | ||||||
17.96%, 03/17/2031 | 74,065 | 102,540 | ||||||
6.88%, 08/16/2031 IO | 18,804 | 5,405 | ||||||
7.08%, 08/16/2031 IO | 19,977 | 5,636 | ||||||
1.56%, 03/20/2032 | 81,167 | 81,323 | ||||||
6.78%, 04/16/2032 IO | 71,680 | 13,125 | ||||||
10.17%, 04/16/2032 | 6,687 | 8,033 | ||||||
9.00%, 06/16/2032 | 2,402 | 2,962 | ||||||
6.50%, 06/20/2032 | 273,781 | 311,970 | ||||||
6.50%, 07/16/2032 | 84,755 | 97,840 | ||||||
6.00%, 07/20/2032 | 28,803 | 31,940 | ||||||
6.50%, 07/20/2032 | 138,841 | 162,356 | ||||||
6.50%, 07/20/2032 | 94,632 | 111,457 | ||||||
12.56%, 11/17/2032 | 18,311 | 21,465 | ||||||
| Principal Amount | Value | |||||||
6.00%, 11/20/2032 | 146,000 | 165,623 | ||||||
0.00%, 12/20/2032 PO | 113,247 | 107,819 | ||||||
5.50%, 01/16/2033 | 552,019 | 613,669 | ||||||
6.50%, 01/20/2033 | 145,939 | 165,036 | ||||||
6.53%, 02/16/2033 IO | 70,792 | 11,524 | ||||||
0.00%, 02/17/2033 PO | 47,458 | 45,081 | ||||||
6.49%, 02/20/2033 IO | 32,469 | 7,463 | ||||||
0.00%, 03/16/2033 PO | 11,321 | 10,178 | ||||||
6.28%, 03/17/2033 | 11,925 | 12,369 | ||||||
6.50%, 03/20/2033 | 280,057 | 316,725 | ||||||
6.50%, 03/20/2033 | 82,179 | 92,383 | ||||||
5.50%, 04/20/2033 | 316,062 | 349,812 | ||||||
6.50%, 05/20/2033 | 107,492 | 123,113 | ||||||
0.00%, 06/16/2033 PO | 55,892 | 47,741 | ||||||
6.00%, 09/16/2033 | 188,616 | 212,930 | ||||||
0.00%, 10/20/2033 PO | 8,950 | 7,994 | ||||||
5.82%, 10/20/2033 | 211,042 | 237,313 | ||||||
5.38%, 11/16/2033 IO | 124,866 | 16,806 | ||||||
5.38%, 12/16/2033 IO | 111,498 | 20,179 | ||||||
5.33%, 03/16/2034 IO | 45,253 | 932 | ||||||
5.50%, 03/16/2034 | 4,603,369 | 5,129,812 | ||||||
16.44%, 04/16/2034 | 53,864 | 76,536 | ||||||
14.14%, 05/18/2034 | 10,106 | 12,101 | ||||||
0.00%, 06/20/2034 PO | 99,780 | 91,305 | ||||||
6.00%, 06/20/2034 | 364,068 | 409,743 | ||||||
12.44%, 08/17/2034 | 51,194 | 58,889 | ||||||
5.72%, 08/20/2034 | 108,001 | 120,420 | ||||||
5.38%, 09/16/2034 IO | 371,625 | 61,544 | ||||||
7.00%, 09/20/2034 | 45,350 | 49,504 | ||||||
23.51%, 09/20/2034 | 45,350 | 71,566 | ||||||
11.73%, 10/16/2034 | 9,513 | 10,774 | ||||||
20.09%, 10/16/2034 | 36,438 | 54,245 | ||||||
4.89%, 10/20/2034 IO | 574,451 | 88,955 | ||||||
9.78%, 10/20/2034 | 13,714 | 14,872 | ||||||
4.87%, 11/20/2034 IO | 294,260 | 39,936 | ||||||
5.54%, 01/20/2035 IO | 400,726 | 60,363 | ||||||
13.61%, 06/17/2035 | 172,421 | 212,442 | ||||||
5.59%, 06/20/2035 | 207,371 | 227,232 | ||||||
5.50%, 07/20/2035 IO | 42,193 | 9,390 | ||||||
16.93%, 08/16/2035 | 20,972 | 30,285 | ||||||
0.00%, 08/20/2035 PO | 244,647 | 219,772 | ||||||
18.14%, 08/20/2035 | 3,093 | 3,765 | ||||||
5.09%, 09/20/2035 IO | 823,091 | 132,760 | ||||||
5.50%, 09/20/2035 | 267,020 | 293,841 | ||||||
0.00%, 10/20/2035 PO | 48,334 | 41,679 | ||||||
0.00%, 11/20/2035 PO | 76,531 | 66,204 | ||||||
6.00%, 12/20/2035 IO | 78,055 | 14,965 | ||||||
5.75%, 02/20/2036 | 57,658 | 61,524 | ||||||
0.00%, 03/20/2036 PO | 66,479 | 60,894 | ||||||
0.00%, 05/20/2036 PO | 91,522 | 83,604 | ||||||
5.29%, 06/20/2036 IO | 13,581 | 1,247 | ||||||
0.00%, 07/20/2036 PO | 13,227 | 11,998 | ||||||
5.49%, 07/20/2036 IO | 39,094 | 961 | ||||||
6.50%, 07/20/2036 | 382,126 | 446,228 | ||||||
6.50%, 08/20/2036 | 499,262 | 578,060 | ||||||
5.49%, 10/20/2036 IO | 114,351 | 16,400 | ||||||
5.56%, 10/20/2036 | 233,954 | 256,963 | ||||||
5.59%, 11/20/2036 IO | 201,445 | 36,615 | ||||||
5.93%, 02/20/2037 | 70,851 | 78,213 | ||||||
0.00%, 03/20/2037 PO | 263,459 | 238,237 | ||||||
4.99%, 03/20/2037 IO | 209,489 | 38,156 | ||||||
0.00%, 04/16/2037 PO | 126,197 | 110,981 | ||||||
5.64%, 04/16/2037 IO | 325,233 | 61,684 | ||||||
4.99%, 04/20/2037 IO | 120,922 | 17,432 | ||||||
6.08%, 04/20/2037 | 145,669 | 161,868 | ||||||
1.47%, 05/16/2037 | 77,624 | 77,388 | ||||||
0.00%, 05/20/2037 PO | 19,532 | 16,624 | ||||||
4.99%, 05/20/2037 IO | 249,044 | 40,990 | ||||||
4.99%, 05/20/2037 IO | 224,635 | 34,261 | ||||||
0.00%, 06/16/2037 PO | 337,106 | 311,438 | ||||||
| Principal Amount | Value | |||||||
0.00%, 06/16/2037 PO | 44,687 | 40,604 | ||||||
5.30%, 06/16/2037 IO | 191,622 | 32,488 | ||||||
5.04%, 06/20/2037 IO | 194,440 | 25,437 | ||||||
5.43%, 07/20/2037 IO | 275,230 | 44,013 | ||||||
5.47%, 07/20/2037 IO | 282,793 | 46,083 | ||||||
5.54%, 07/20/2037 IO | 195,454 | 30,774 | ||||||
5.56%, 08/20/2037 IO | 69,833 | 12,532 | ||||||
0.00%, 09/20/2037 PO | 42,970 | 41,042 | ||||||
5.34%, 09/20/2037 IO | 178,654 | 28,741 | ||||||
16.57%, 09/20/2037 | 49,141 | 65,991 | ||||||
5.50%, 10/16/2037 IO | 319,834 | 39,898 | ||||||
10.98%, 10/20/2037 | 33,397 | 39,633 | ||||||
0.00%, 11/16/2037 PO | 390,954 | 356,800 | ||||||
5.37%, 11/16/2037 IO | 198,107 | 28,299 | ||||||
4.79%, 11/20/2037 IO | 213,318 | 35,101 | ||||||
5.29%, 11/20/2037 IO | 409,932 | 67,680 | ||||||
5.30%, 11/20/2037 IO | 239,299 | 36,472 | ||||||
5.34%, 11/20/2037 IO | 187,668 | 30,961 | ||||||
5.50%, 11/20/2037 | 3,183 | 3,209 | ||||||
16.31%, 11/20/2037 | 23,675 | 33,870 | ||||||
5.34%, 12/20/2037 IO | 297,996 | 50,460 | ||||||
0.00%, 01/20/2038 PO | 13,915 | 11,801 | ||||||
0.00%, 01/20/2038 PO | 7,899 | 7,847 | ||||||
4.79%, 02/20/2038 IO | 1,841,327 | 295,175 | ||||||
5.50%, 02/20/2038 IO | 46,893 | 8,302 | ||||||
6.53%, 04/16/2038 IO | 109,050 | 20,529 | ||||||
5.09%, 04/20/2038 IO | 291,806 | 42,468 | ||||||
5.23%, 05/16/2038 IO | 938,416 | 159,937 | ||||||
4.99%, 06/20/2038 IO | 72,643 | 11,351 | ||||||
6.00%, 06/20/2038 | 144,766 | 164,425 | ||||||
2.03%, 07/20/2038 | 563,326 | 572,790 | ||||||
4.94%, 07/20/2038 IO | 259,432 | 40,443 | ||||||
5.75%, 07/20/2038 | 283,508 | 301,680 | ||||||
4.79%, 08/20/2038 IO | 93,732 | 13,815 | ||||||
5.57%, 08/20/2038 | 409,577 | 465,230 | ||||||
4.69%, 09/20/2038 IO | 306,873 | 41,073 | ||||||
4.99%, 09/20/2038 IO | 630,423 | 88,569 | ||||||
6.39%, 09/20/2038 IO | 133,580 | 24,871 | ||||||
6.10%, 11/20/2038 | 246,823 | 276,312 | ||||||
5.23%, 12/16/2038 IO | 68,114 | 2,872 | ||||||
4.49%, 12/20/2038 IO | 318,814 | 42,497 | ||||||
4.79%, 12/20/2038 IO | 177,570 | 23,167 | ||||||
5.86%, 12/20/2038 | 845,127 | 954,477 | ||||||
6.00%, 12/20/2038 IO | 83,917 | 10,397 | ||||||
6.09%, 12/20/2038 IO | 567,742 | 107,642 | ||||||
5.47%, 01/20/2039 | 1,307,190 | 1,431,819 | ||||||
4.93%, 02/16/2039 IO | 141,455 | 18,910 | ||||||
4.98%, 02/16/2039 IO | 228,109 | 26,337 | ||||||
4.74%, 02/20/2039 IO | 263,294 | 33,603 | ||||||
4.83%, 02/20/2039 IO | 155,701 | 21,533 | ||||||
5.09%, 03/20/2039 IO | 269,667 | 28,063 | ||||||
5.09%, 03/20/2039 IO | 97,281 | 5,469 | ||||||
6.50%, 03/20/2039 IO | 181,196 | 47,290 | ||||||
6.50%, 03/20/2039 IO | 81,829 | 18,214 | ||||||
5.06%, 04/20/2039 IO | 480,408 | 61,733 | ||||||
5.50%, 05/20/2039 IO | 58,109 | 10,870 | ||||||
6.00%, 05/20/2039 IO | 77,398 | 16,108 | ||||||
5.23%, 06/16/2039 IO | 433,089 | 28,503 | ||||||
4.74%, 06/20/2039 IO | 250,416 | 41,397 | ||||||
4.87%, 06/20/2039 IO | 360,123 | 51,309 | ||||||
4.93%, 07/16/2039 IO | 427,035 | 50,621 | ||||||
5.08%, 08/16/2039 IO | 393,772 | 62,776 | ||||||
7.00%, 08/16/2039 | 236,491 | 264,009 | ||||||
4.88%, 09/20/2039 IO | 610,040 | 85,081 | ||||||
5.50%, 09/20/2039 | 317,000 | 386,370 | ||||||
5.23%, 11/16/2039 IO | 487,075 | 72,430 | ||||||
6.00%, 12/20/2039 | 178,032 | 181,865 | ||||||
5.22%, 06/20/2040 | 245,240 | 267,629 | ||||||
5.54%, 07/20/2040 | 349,758 | 392,302 | ||||||
7.00%, 10/16/2040 | 698,320 | 809,655 | ||||||
| Principal Amount | Value | |||||||
0.00%, 12/20/2040 PO | 929,231 | 819,259 | ||||||
5.39%, 05/20/2041 IO | 475,300 | 88,986 | ||||||
4.66%, 09/20/2041 | 540,494 | 583,431 | ||||||
4.66%, 10/20/2041 | 976,290 | 1,052,731 | ||||||
4.53%, 11/16/2041 | 509,874 | 554,426 | ||||||
3.00%, 12/20/2041 | 1,000,000 | 984,511 | ||||||
3.71%, 01/20/2042 | 547,211 | 569,716 | ||||||
3.97%, 09/16/2042 | 382,617 | 404,203 | ||||||
4.63%, 10/20/2042 | 1,928,932 | 2,071,341 | ||||||
4.72%, 11/20/2042 | 282,633 | 305,627 | ||||||
4.49%, 04/20/2043 | 309,988 | 326,959 | ||||||
1.44%, 11/20/2059 | 169,939 | 170,083 | ||||||
1.47%, 01/20/2060 | 223,570 | 223,696 | ||||||
1.44%, 03/20/2060 | 266,043 | 266,222 | ||||||
1.42%, 04/20/2060 | 1,016,772 | 1,017,893 | ||||||
5.24%, 07/20/2060 | 2,388,726 | 2,477,984 | ||||||
1.29%, 08/20/2060 | 96,439 | 96,427 | ||||||
1.46%, 01/20/2061 | 2,626,932 | 2,631,261 | ||||||
1.49%, 03/20/2061 | 2,525,563 | 2,523,526 | ||||||
1.64%, 05/20/2061 | 2,117,095 | 2,122,083 | ||||||
1.69%, 05/20/2061 | 2,075,894 | 2,081,524 | ||||||
1.46%, 08/20/2061 | 678,225 | 677,669 | ||||||
1.54%, 10/20/2061 | 1,253,303 | 1,255,936 | ||||||
1.54%, 12/20/2061 | 7,136,442 | 7,141,581 | ||||||
1.54%, 04/20/2062 | 489,146 | 490,351 | ||||||
1.69%, 04/20/2062 | 1,039,493 | 1,045,970 | ||||||
1.44%, 05/20/2062 | 315,154 | 315,599 | ||||||
1.54%, 07/20/2062 | 1,560,587 | 1,563,220 | ||||||
1.57%, 09/20/2062 | 2,759,372 | 2,767,481 | ||||||
1.58%, 09/20/2062 | 724,472 | 726,019 | ||||||
1.49%, 10/20/2062 | 691,878 | 693,076 | ||||||
1.51%, 10/20/2062 | 3,008,587 | 3,007,511 | ||||||
1.59%, 10/20/2062 | 450,343 | 448,943 | ||||||
1.29%, 11/20/2062 | 85,552 | 85,542 | ||||||
1.33%, 12/20/2062 | 2,747,045 | 2,728,388 | ||||||
1.31%, 01/20/2063 | 1,333,810 | 1,323,679 | ||||||
1.49%, 01/20/2063 | 816,354 | 817,910 | ||||||
1.65%, 01/20/2063 | 2,975,081 | 2,957,868 | ||||||
1.41%, 02/20/2063 | 285,762 | 284,222 | ||||||
1.44%, 02/20/2063 | 1,596,705 | 1,591,603 | ||||||
1.65%, 02/20/2063 | 3,961,518 | 3,944,681 | ||||||
1.40%, 03/20/2063 | 1,140,803 | 1,135,426 | ||||||
1.46%, 03/20/2063 | 370,986 | 370,063 | ||||||
1.65%, 04/20/2063 | 1,256,850 | 1,241,136 | ||||||
1.46%, 06/20/2063 | 3,026,105 | 3,018,553 | ||||||
1.64%, 01/20/2064 | 3,121,832 | 3,133,661 | ||||||
1.64%, 02/20/2064 | 6,497,256 | 6,521,425 | ||||||
1.68%, 02/20/2064 | 3,402,549 | 3,425,744 | ||||||
1.64%, 03/20/2064 | 3,446,116 | 3,462,946 | ||||||
1.59%, 04/20/2064 | 3,998,377 | 4,006,053 | ||||||
1.59%, 04/20/2064 | 3,648,539 | 3,658,391 | ||||||
1.59%, 05/20/2064 | 6,234,453 | 6,251,777 | ||||||
1.49%, 06/20/2064 | 2,603,711 | 2,598,622 | ||||||
1.46%, 07/20/2064 | 4,239,458 | 4,228,254 | ||||||
1.49%, 07/20/2064 | 2,794,806 | 2,789,406 | ||||||
1.49%, 07/20/2064 | 2,085,737 | 2,081,696 | ||||||
1.46%, 09/20/2064 | 4,237,995 | 4,224,376 | ||||||
1.59%, 10/20/2064 | 1,450,173 | 1,446,597 | ||||||
1.49%, 12/20/2064 | 3,961,689 | 3,955,757 | ||||||
1.45%, 02/20/2065 | 2,591,850 | 2,584,957 | ||||||
1.47%, 02/20/2065 | 4,234,108 | 4,221,893 | ||||||
1.46%, 03/20/2065 | 8,682,984 | 8,658,328 | ||||||
1.47%, 04/20/2065 | 6,148,940 | 6,130,784 | ||||||
1.44%, 06/20/2065 | 2,069,545 | 2,062,027 | ||||||
1.43%, 07/20/2065 | 3,824,986 | 3,805,944 | ||||||
1.46%, 08/20/2065 | 655,057 | 652,800 | ||||||
1.59%, 11/20/2065 | 7,377,088 | 7,399,233 | ||||||
1.99%, 12/20/2066 | 2,359,964 | 2,405,708 | ||||||
1.55%, 03/20/2067 | 6,993,220 | 7,000,525 | ||||||
2.17%, 05/20/2067 IO | 15,037,888 | 1,906,967 | ||||||
| Principal Amount | Value | |||||||
GS Mortgage Securities Co. II | ||||||||
2.71%, 12/10/2027 (Acquired 10/28/2013, Cost $1,225,700) (1) | 1,227,601 | 1,242,710 | ||||||
3.38%, 05/10/2050 | 405,000 | 413,077 | ||||||
GS Mortgage Securities Co. Trust 2012-ALOHA | ||||||||
3.55%, 04/10/2034 (Acquired 04/01/2014, Cost $4,218,105) (1) | 4,200,000 | 4,404,175 | ||||||
GS Mortgage Securities Co. Trust 2012-SHOP | ||||||||
1.44%, 06/05/2031 IO (Acquired 10/28/2013, Cost $321,298) (1) | 7,793,000 | 171,351 | ||||||
2.93%, 06/05/2031 (Acquired 07/28/2015 through 09/09/2016, Cost $3,948,852) (1) | 3,861,000 | 3,927,369 | ||||||
GS Mortgage Securities Co. Trust 2013-NYC5 | ||||||||
2.32%, 01/10/2030 (Acquired 10/28/2013, Cost $507,287) (1) | 505,000 | 506,264 | ||||||
GS Mortgage Securities Trust 2006-GG8 | ||||||||
1.07%, 11/10/2039 IO (Acquired 10/28/2013, Cost $144,063) (1) | 1,612,832 | 38 | ||||||
GS Mortgage Securities Trust 2011-GC5 | ||||||||
5.57%, 08/10/2044 (Acquired 03/27/2014, Cost $509,033) (1) | 500,000 | 490,888 | ||||||
GS Mortgage Securities Trust 2012-GCJ9 | ||||||||
2.77%, 11/10/2045 | 13,211,562 | 13,334,098 | ||||||
GS Mortgage Securities Trust 2013-GC13 | ||||||||
3.87%, 07/10/2046 | 5,880,000 | 6,224,470 | ||||||
GS Mortgage Securities Trust 2013-GC16 | ||||||||
1.59%, 11/10/2046 IO | 24,322,484 | 1,147,133 | ||||||
4.27%, 11/10/2046 | 89,000 | 96,179 | ||||||
GS Mortgage Securities Trust 2013-GCJ12 | ||||||||
3.14%, 06/10/2046 | 878,000 | 896,503 | ||||||
GS Mortgage Securities Trust 2013-GCJ14 | ||||||||
0.91%, 08/10/2046 IO | 28,512,733 | 905,256 | ||||||
GS Mortgage Securities Trust 2014-GC18 | ||||||||
4.07%, 01/10/2047 | 2,600,000 | 2,771,380 | ||||||
GS Mortgage Securities Trust 2014-GC26 | ||||||||
3.36%, 11/10/2047 | 8,000,000 | 8,198,580 | ||||||
GS Mortgage Securities Trust 2015-GC28 | ||||||||
3.14%, 02/10/2048 | 9,000,000 | 9,046,090 | ||||||
GSMPS Mortgage Loan Trust 2004-4 | ||||||||
1.62%, 06/25/2034 (Acquired 10/28/2013, Cost $64,686) (1) | 69,895 | 63,281 | ||||||
GSMPS Mortgage Loan Trust 2005-RP2 | ||||||||
1.57%, 03/25/2035 (Acquired 10/28/2013, Cost $115,812) (1) | 127,370 | 112,484 | ||||||
GSMPS Mortgage Loan Trust 2005-RP3 | ||||||||
1.57%, 09/25/2035 (Acquired 10/28/2013, Cost $708,384) (1) | 788,988 | 687,420 | ||||||
3.62%, 09/25/2035 IO (Acquired 10/28/2013, Cost $80,920) (1) | 581,693 | 61,204 | ||||||
GSR Mortgage Loan Trust 2003-3F | ||||||||
5.75%, 04/25/2033 | 46,433 | 48,353 | ||||||
GSR Mortgage Loan Trust 2003-6F | ||||||||
1.62%, 09/25/2032 | 13,138 | 12,609 | ||||||
GSR Mortgage Loan Trust 2004-13F | ||||||||
6.00%, 11/25/2034 | 101,443 | 103,868 | ||||||
GSR Mortgage Loan Trust 2004-6F | ||||||||
5.50%, 05/25/2034 | 123,175 | 126,610 | ||||||
6.50%, 05/25/2034 | 78,581 | 83,604 | ||||||
GSR Mortgage Loan Trust 2005-5F | ||||||||
1.72%, 06/25/2035 | 41,218 | 39,429 | ||||||
GSR Mortgage Loan Trust 2005-7F | ||||||||
6.00%, 09/25/2035 | 207,542 | 220,481 | ||||||
GSR Mortgage Loan Trust 2005-AR6 | ||||||||
3.24%, 09/25/2035 | 14,836 | 14,797 | ||||||
GSR Mortgage Loan Trust 2006-1F | ||||||||
5.50%, 02/25/2036 | 96,621 | 92,442 | ||||||
6.00%, 02/25/2036 | 453,656 | 396,788 | ||||||
GSR Mortgage Loan Trust 2007-1F | ||||||||
5.50%, 01/25/2037 | 342,830 | 340,058 | ||||||
HILT 2014-ORL Mortgage Trust | ||||||||
2.06%, 07/15/2029 (Acquired 09/02/2014 through 01/27/2016, Cost $1,897,840) (1) | 1,900,000 | 1,897,242 | ||||||
HomeBanc Mortgage Trust 2005-3 | ||||||||
1.46%, 07/25/2035 | 1,084,844 | 1,069,129 | ||||||
Impac CMB Trust Series 2004-4 | ||||||||
4.63%, 09/25/2034 | 11,701 | 11,353 | ||||||
Impac CMB Trust Series 2004-7 | ||||||||
1.96%, 11/25/2034 | 1,362,580 | 1,321,684 | ||||||
Impac CMB Trust Series 2005-4 | ||||||||
1.82%, 05/25/2035 | 133,947 | 129,317 | ||||||
Impac Secured Assets CMN Owner Trust | ||||||||
5.50%, 08/25/2033 | 92,609 | 95,858 | ||||||
| Principal Amount | Value | |||||||
2.02%, 11/25/2034 | 2,741 | 2,717 | ||||||
Impac Secured Assets Trust 2006-1 | ||||||||
1.57%, 05/25/2036 | 486,142 | 461,632 | ||||||
Impac Secured Assets Trust 2006-2 | ||||||||
1.57%, 08/25/2036 | 396,763 | 387,470 | ||||||
JP Morgan Alternative Loan Trust | ||||||||
3.36%, 03/25/2036 | 45,739 | 40,777 | ||||||
JP Morgan Chase Commercial Mortgage Securities Corp. | ||||||||
3.46%, 03/15/2050 | 20,000,000 | 20,510,996 | ||||||
3.72%, 03/15/2050 | 1,506,000 | 1,576,957 | ||||||
JP Morgan Chase Commercial Mortgage Securities Trust 2005-CIBC11 | ||||||||
0.04%, 08/12/2037 IO (Acquired 10/28/2013, Cost $66,468) (1) | 8,126,412 | 5,155 | ||||||
JP Morgan Chase Commercial Mortgage Securities Trust 2005-LDP5 | ||||||||
0.00%, 12/15/2044 IO (Acquired 10/28/2013, Cost $99,534) (1)(8) | 3,309,184 | 33 | ||||||
JP Morgan Chase Commercial Mortgage Securities Trust 2006-CIBC15 | ||||||||
0.48%, 06/12/2043 IO | 6,632,923 | 8,350 | ||||||
JP Morgan Chase Commercial Mortgage Securities Trust 2006-LDP9 | ||||||||
1.31%, 05/15/2047 | 182,705 | 182,223 | ||||||
5.34%, 05/15/2047 | 413,000 | 409,389 | ||||||
JP Morgan Chase Commercial Mortgage Securities Trust 2007-C1 | ||||||||
5.72%, 02/15/2051 | 108,966 | 109,574 | ||||||
JP Morgan Chase Commercial Mortgage Securities Trust 2007-LDP12 | ||||||||
0.13%, 02/15/2051 IO (8) | 11,827,321 | 118 | ||||||
JP Morgan Chase Commercial Mortgage Securities Trust 2012-C8 | ||||||||
2.38%, 10/15/2045 | 7,800,000 | 7,855,334 | ||||||
JP Morgan Chase Commercial Mortgage Securities Trust 2013-LC11 | ||||||||
2.96%, 04/15/2046 | 7,152,087 | 7,230,181 | ||||||
JP Morgan Mortgage Trust 2004-A3 | ||||||||
3.75%, 07/25/2034 | 72,704 | 74,712 | ||||||
JP Morgan Mortgage Trust 2004-A4 | ||||||||
3.53%, 09/25/2034 | 85,239 | 87,190 | ||||||
JP Morgan Mortgage Trust 2004-S1 | ||||||||
5.00%, 09/25/2034 | 21,433 | 21,889 | ||||||
JP Morgan Mortgage Trust 2005-A1 | ||||||||
3.47%, 02/25/2035 | 196,260 | 200,823 | ||||||
JP Morgan Mortgage Trust 2005-A4 | ||||||||
3.41%, 07/25/2035 | 226,993 | 226,318 | ||||||
JP Morgan Mortgage Trust 2006-A2 | ||||||||
3.14%, 11/25/2033 | 564,397 | 573,605 | ||||||
3.56%, 08/25/2034 | 1,028,298 | 1,035,504 | ||||||
JP Morgan Mortgage Trust 2006-A3 | ||||||||
3.37%, 08/25/2034 | 133,919 | 134,318 | ||||||
JP Morgan Mortgage Trust 2006-A7 | ||||||||
3.26%, 01/25/2037 | 106,234 | 105,179 | ||||||
3.26%, 01/25/2037 | 186,350 | 184,499 | ||||||
JP Morgan Mortgage Trust 2007-A1 | ||||||||
3.41%, 07/25/2035 | 123,796 | 124,109 | ||||||
3.41%, 07/25/2035 | 1,888,402 | 1,915,099 | ||||||
JP Morgan Mortgage Trust 2007-A2 | ||||||||
3.42%, 04/25/2037 | 403,023 | 362,016 | ||||||
JPMBB Commercial Mortgage Securities Trust 2014-C19 | ||||||||
3.67%, 04/15/2047 | 2,010,000 | 2,088,820 | ||||||
JPMBB Commercial Mortgage Securities Trust 2014-C24 | ||||||||
3.10%, 11/15/2047 | 13,000,000 | 13,223,935 | ||||||
JPMBB Commercial Mortgage Securities Trust 2014-C25 | ||||||||
3.41%, 11/15/2047 | 13,000,000 | 13,346,093 | ||||||
JPMBB Commercial Mortgage Securities Trust 2015-C28 | ||||||||
2.77%, 10/15/2048 | 3,200,000 | 3,253,351 | ||||||
JPMBB Commercial Mortgage Securities Trust 2016-C1 | ||||||||
3.31%, 03/15/2049 | 10,000,000 | 10,146,425 | ||||||
Ladder Capital Commercial Mortgage 2013-GCP Mortgage Trust | ||||||||
3.99%, 02/15/2036 (Acquired 10/28/2013, Cost $985,929) (1) | 1,027,000 | 1,071,639 | ||||||
LB-UBS Commercial Mortgage Trust 2007-C2 | ||||||||
0.46%, 02/15/2040 IO | 1,359,972 | 109 | ||||||
LCCM 2017-LC26 | ||||||||
3.29%, 07/12/2050 (Acquired 06/22/2017, Cost $20,502,744) (1) | 20,300,000 | 20,236,002 | ||||||
Lehman Mortgage Trust 2006-2 | ||||||||
5.86%, 04/25/2036 | 83,062 | 74,157 | ||||||
Lehman Mortgage Trust 2007-6 | ||||||||
6.00%, 07/25/2037 | 53,960 | 50,659 | ||||||
| Principal Amount | Value | |||||||
Lehman Mortgage Trust 2008-2 | ||||||||
6.00%, 03/25/2038 | 407,544 | 303,978 | ||||||
Luminent Mortgage Trust 2005-1 | ||||||||
1.48%, 11/25/2035 | 2,188,710 | 2,014,282 | ||||||
MASTR Adjustable Rate Mortgages Trust 2004-13 | ||||||||
3.08%, 04/21/2034 | 258,368 | 265,601 | ||||||
MASTR Adjustable Rate Mortgages Trust 2004-15 | ||||||||
3.87%, 12/25/2034 | 50,418 | 47,731 | ||||||
MASTR Adjustable Rate Mortgages Trust 2004-3 | ||||||||
3.05%, 04/25/2034 | 86,624 | 80,893 | ||||||
MASTR Alternative Loan Trust 2003-5 | ||||||||
6.00%, 08/25/2033 | 340,549 | 357,694 | ||||||
MASTR Alternative Loan Trust 2003-9 | ||||||||
6.00%, 12/25/2033 | 88,419 | 91,566 | ||||||
6.00%, 01/25/2034 | 28,328 | 29,232 | ||||||
MASTR Alternative Loan Trust 2004-1 | ||||||||
5.00%, 01/25/2019 | 13,900 | 13,924 | ||||||
MASTR Alternative Loan Trust 2004-10 | ||||||||
4.50%, 09/25/2019 | 9,090 | 9,120 | ||||||
MASTR Alternative Loan Trust 2004-13 | ||||||||
5.50%, 01/25/2020 | 280,642 | 286,580 | ||||||
MASTR Alternative Loan Trust 2004-2 | ||||||||
5.00%, 02/25/2019 | 760 | 764 | ||||||
MASTR Alternative Loan Trust 2004-3 | ||||||||
6.00%, 04/25/2034 | 246,498 | 258,813 | ||||||
6.25%, 04/25/2034 | 69,492 | 72,443 | ||||||
MASTR Alternative Loan Trust 2004-4 | ||||||||
5.00%, 04/25/2019 | 11,348 | 11,399 | ||||||
MASTR Alternative Loan Trust 2004-6 | ||||||||
0.00%, 07/25/2034 PO | 38,962 | 31,876 | ||||||
6.00%, 07/25/2034 | 24,842 | 24,912 | ||||||
MASTR Alternative Loan Trust 2004-7 | ||||||||
0.00%, 08/25/2034 PO | 31,445 | 25,563 | ||||||
MASTR Alternative Loan Trust 2004-8 | ||||||||
5.50%, 09/25/2019 | 30,736 | 31,186 | ||||||
MASTR Alternative Loan Trust 2005-1 | ||||||||
5.00%, 02/25/2035 | 212,811 | 212,350 | ||||||
MASTR Alternative Loan Trust 2005-6 | ||||||||
5.50%, 11/25/2020 | 58,477 | 57,191 | ||||||
MASTR Asset Securitization Trust | ||||||||
4.50%, 12/25/2018 | 2,116 | 2,121 | ||||||
MASTR Asset Securitization Trust 2003-12 | ||||||||
0.00%, 12/25/2033 PO | 4,797 | 4,395 | ||||||
5.00%, 12/25/2033 | 21,104 | 21,241 | ||||||
MASTR Asset Securitization Trust 2004-1 | ||||||||
0.00%, 02/25/2034 PO | 4,208 | 3,412 | ||||||
MASTR Asset Securitization Trust 2004-4 | ||||||||
4.50%, 04/25/2019 | 709 | 707 | ||||||
5.25%, 12/26/2033 | 82,182 | 84,966 | ||||||
MASTR Asset Securitization Trust 2004-6 | ||||||||
0.00%, 07/25/2019 PO | 2,389 | 2,341 | ||||||
MASTR Asset Securitization Trust 2004-8 | ||||||||
0.00%, 08/25/2019 PO | 1,847 | 1,775 | ||||||
4.75%, 08/25/2019 | 9,005 | 9,116 | ||||||
MASTR Asset Securitization Trust 2004-9 | ||||||||
5.25%, 09/25/2019 | 16,818 | 16,973 | ||||||
MASTR Reperforming Loan Trust 2005-2 | ||||||||
1.57%, 05/25/2035 (Acquired 10/28/2013, Cost $984,134) (1) | 1,080,512 | 920,052 | ||||||
MASTR Reperforming Loan Trust 2006-2 | ||||||||
4.45%, 05/25/2036 (Acquired 10/28/2013, Cost $124,608) (1) | 130,413 | 119,843 | ||||||
MASTR Resecuritization Trust 2005 | ||||||||
0.00%, 05/28/2035 PO (Acquired 10/28/2013, Cost $44,961) (1) | 45,064 | 34,160 | ||||||
Merrill Lynch Mortgage Backed Securities Trust Series 2007-3 | ||||||||
2.08%, 06/25/2037 | 218,082 | 212,991 | ||||||
Merrill Lynch Mortgage Investors Trust Series 2003-A5 | ||||||||
3.18%, 08/25/2033 | 75,135 | 76,269 | ||||||
Merrill Lynch Mortgage Investors Trust Series MLCC 2003-E | ||||||||
1.84%, 10/25/2028 | 141,640 | 137,770 | ||||||
Merrill Lynch Mortgage Investors Trust Series MLCC 2003-F | ||||||||
1.86%, 10/25/2028 | 181,388 | 177,889 | ||||||
| Principal Amount | Value | |||||||
Merrill Lynch Mortgage Investors Trust Series MLCC 2004-1 | ||||||||
3.08%, 12/25/2034 | 151,503 | 152,141 | ||||||
Merrill Lynch Mortgage Investors Trust Series MLCC 2004-A | ||||||||
1.68%, 04/25/2029 | 60,819 | 58,580 | ||||||
Merrill Lynch Mortgage Investors Trust Series MLCC 2004-C | ||||||||
2.05%, 07/25/2029 | 130,696 | 124,451 | ||||||
Merrill Lynch Mortgage Investors Trust Series MLMI 2004-A4 | ||||||||
3.09%, 08/25/2034 | 131,734 | 134,487 | ||||||
Merrill Lynch Mortgage Investors Trust Series MLMI 2005-A2 | ||||||||
2.98%, 02/25/2035 | 229,572 | 226,086 | ||||||
ML Trust XLVII | ||||||||
8.99%, 10/20/2020 | 277 | 291 | ||||||
ML-CFC Commercial Mortgage Trust 2006-4 | ||||||||
0.86%, 12/12/2049 IO (Acquired 10/28/2013, Cost $353,533) (1) | 1,799,228 | 30 | ||||||
ML-CFC Commercial Mortgage Trust 2007-9 | ||||||||
5.70%, 09/12/2049 | 299,004 | 299,234 | ||||||
Morgan Stanley Bank of America Merrill Lynch Trust 2012-C6 | ||||||||
2.86%, 11/15/2045 | 9,144,055 | 9,277,437 | ||||||
Morgan Stanley Bank of America Merrill Lynch Trust 2013-C10 | ||||||||
4.22%, 07/15/2046 | 1,209,000 | 1,300,871 | ||||||
Morgan Stanley Bank of America Merrill Lynch Trust 2013-C12 | ||||||||
4.26%, 10/15/2046 | 1,229,000 | 1,328,306 | ||||||
Morgan Stanley Bank of America Merrill Lynch Trust 2014-C14 | ||||||||
2.92%, 02/15/2047 | 10,000,000 | 10,151,559 | ||||||
3.67%, 02/15/2047 | 4,400,000 | 4,586,297 | ||||||
3.79%, 02/15/2047 | 845,000 | 889,389 | ||||||
4.06%, 02/15/2047 | 725,000 | 774,210 | ||||||
Morgan Stanley Bank of America Merrill Lynch Trust 2015-C20 | ||||||||
3.25%, 02/15/2048 | 2,979,000 | 3,022,537 | ||||||
Morgan Stanley Bank of America Merrill Lynch Trust 2015-C23 | ||||||||
3.45%, 07/15/2050 | 27,200,000 | 27,992,053 | ||||||
Morgan Stanley Bank of America Merrill Lynch Trust 2015-C24 | ||||||||
3.48%, 05/15/2048 | 5,000,000 | 5,148,163 | ||||||
Morgan Stanley Capital I Trust 2006-IQ12 | ||||||||
0.65%, 12/15/2043 IO (Acquired 10/28/2013, Cost $206,680) (1) | 2,530,879 | 33 | ||||||
Morgan Stanley Capital I Trust 2007-HQ11 | ||||||||
0.45%, 02/12/2044 IO (Acquired 10/28/2013, Cost $146,108) (1) | 6,614,251 | 71,103 | ||||||
Morgan Stanley Capital I Trust 2007-HQ13 | ||||||||
0.59%, 12/15/2044 IO (Acquired 10/28/2013, Cost $106,112) (1) | 5,759,151 | 654 | ||||||
Morgan Stanley Capital I Trust 2007-IQ13 | ||||||||
0.96%, 03/15/2044 IO (Acquired 10/28/2013, Cost $288,756) (1) | 3,414,409 | 6,203 | ||||||
Morgan Stanley Capital I Trust 2011-C3 | ||||||||
4.05%, 07/15/2049 | 547,015 | 565,958 | ||||||
Morgan Stanley Capital I Trust 2012-C4 | ||||||||
2.99%, 03/15/2045 | 672,688 | 684,864 | ||||||
Morgan Stanley Capital I Trust 2014-CPT | ||||||||
3.35%, 07/13/2029 (Acquired 07/31/2015 through 04/27/2017, Cost $4,394,295) (1) | 4,241,000 | 4,399,102 | ||||||
Morgan Stanley Capital I Trust 2016-UB11 | ||||||||
2.53%, 08/15/2049 | 20,000,000 | 19,057,792 | ||||||
Morgan Stanley Mortgage Loan Trust 2004-3 | ||||||||
5.67%, 04/25/2034 | 288,993 | 304,737 | ||||||
Morgan Stanley Mortgage Loan Trust 2004-9 | ||||||||
4.66%, 10/25/2019 | 55,635 | 54,351 | ||||||
Morgan Stanley Reremic Trust | ||||||||
0.25%, 07/27/2049 (Acquired 10/28/2013, Cost $1,037,942) (1) | 1,182,000 | 1,101,033 | ||||||
2.00%, 07/27/2049 (Acquired 10/28/2013, Cost $177,638) (1) | 176,787 | 176,477 | ||||||
1.00%, 03/27/2051 (Acquired 10/28/2013, Cost $494,378) (1) | 498,334 | 492,118 | ||||||
Mortgage Repurchase Agreement Financing Trust Series 2016-4 | ||||||||
2.32%, 05/10/2019 (Acquired 11/04/2016, Cost $23,130,000) (1) | 23,130,000 | 23,067,896 | ||||||
Mortgage Repurchase Agreement Financing Trust Series 2016-5 | ||||||||
2.29%, 06/10/2019 (Acquired 12/13/2016, Cost $3,900,000) (1) | 3,900,000 | 3,893,479 | ||||||
Mortgage Repurchase Agreement Financing Trust Series 2017-1 | ||||||||
1.97%, 07/10/2019 (Acquired 05/08/2017, Cost $7,870,000) (1) | 7,870,000 | 7,873,307 | ||||||
MortgageIT Trust 2005-1 | ||||||||
1.86%, 02/25/2035 | 99,616 | 96,624 | ||||||
MortgageIT Trust 2005-2 | ||||||||
1.74%, 05/25/2035 | 1,426,825 | 1,420,701 | ||||||
MortgageIT Trust 2005-3 | ||||||||
1.52%, 08/25/2035 | 4,093,206 | 3,890,642 | ||||||
MRFC Mortgage Pass-Through Trust Series 1999-TBC2 | ||||||||
| Principal Amount | Value | |||||||
1.64%, 06/15/2030 | 339,947 | 324,345 | ||||||
MRFC Mortgage Pass-Through Trust Series 2000-TBC3 | ||||||||
1.60%, 12/15/2030 | 74,401 | 72,021 | ||||||
NACC Reperforming Loan REMIC Trust 2004-R2 | ||||||||
6.50%, 10/25/2034 (Acquired 10/28/2013, Cost $75,396) (1) | 74,358 | 72,830 | ||||||
NCUA Guaranteed Notes Trust 2010-R3 | ||||||||
1.64%, 12/08/2020 | 1,634,600 | 1,643,514 | ||||||
2.40%, 12/08/2020 | 227,465 | 228,205 | ||||||
New Residential Mortgage Loan Trust 2017-2 | ||||||||
4.00%, 03/25/2057 (Acquired 04/19/2017, Cost $6,221,600) (1) | 5,985,997 | 6,232,219 | ||||||
New Residential Mortgage Loan Trust 2017-3 | ||||||||
4.00%, 04/25/2057 (Acquired 06/05/2017, Cost $5,499,303) (1) | 5,281,209 | 5,484,785 | ||||||
New Residential Mortgage Loan Trust 2017-4 | ||||||||
4.00%, 05/25/2057 (Acquired 06/27/2017, Cost $7,415,859) (1) | 7,100,000 | 7,415,950 | ||||||
Nomura Asset Acceptance Co. Alternative Loan Trust Series 2003-A1 | ||||||||
5.00%, 04/25/2018 | 109 | 108 | ||||||
7.00%, 04/25/2033 | 7,954 | 8,155 | ||||||
5.50%, 05/25/2033 | 33,688 | 34,262 | ||||||
6.00%, 05/25/2033 | 22,069 | 22,442 | ||||||
PaineWebber CMO Trust Series P | ||||||||
8.50%, 08/01/2019 | 309 | 322 | ||||||
PFP 2015-2 Ltd. | ||||||||
2.62%, 07/14/2034 (Acquired 07/28/2015, Cost $714,308) (1) | 714,308 | 714,246 | ||||||
4.42%, 07/14/2034 (Acquired 07/28/2015, Cost $821,000) (1) | 821,000 | 822,128 | ||||||
5.17%, 07/14/2034 (Acquired 07/28/2015, Cost $730,000) (1) | 730,000 | 731,687 | ||||||
PFP 2017-3 Ltd. | ||||||||
2.92%, 01/14/2035 (Acquired 03/06/2017, Cost $2,000,000) (1) | 2,000,000 | 2,008,732 | ||||||
3.67%, 01/14/2035 (Acquired 03/06/2017, Cost $2,000,000) (1) | 2,000,000 | 2,011,229 | ||||||
PPWR 2016-A NOTE | ||||||||
5.73%, 02/27/2019 (7)(8) | 2,682,437 | 2,682,437 | ||||||
Prime Mortgage Trust 2004-CL1 | ||||||||
6.00%, 02/25/2034 | 120,365 | 126,016 | ||||||
Provident Funding Mortgage Loan Trust 2005-1 | ||||||||
3.43%, 05/25/2035 | 42,619 | 41,450 | ||||||
RAIT 2015-FL4 Trust | ||||||||
2.51%, 12/15/2031 (Acquired 05/19/2015, Cost $99,287) (1) | 99,287 | 99,560 | ||||||
2.91%, 12/15/2031 (Acquired 05/19/2015, Cost $966,832) (1) | 966,832 | 974,823 | ||||||
RAIT 2015-FL5 Trust | ||||||||
5.06%, 01/15/2031 (Acquired 12/16/2015, Cost $1,485,000) (1) | 1,485,000 | 1,484,154 | ||||||
RALI Series 2002-QS16 Trust | ||||||||
14.08%, 10/25/2017 | 1,334 | 1,353 | ||||||
RALI Series 2003-QS14 Trust | ||||||||
5.00%, 07/25/2018 | 31,267 | 31,303 | ||||||
RALI Series 2003-QS18 Trust | ||||||||
5.00%, 09/25/2018 | 10,076 | 10,111 | ||||||
RALI Series 2003-QS3 Trust | ||||||||
13.82%, 02/25/2018 | 3,966 | 4,056 | ||||||
RALI Series 2003-QS9 Trust | ||||||||
6.33%, 05/25/2018 IO | 15,788 | 257 | ||||||
RALI Series 2004-QS6 Trust | ||||||||
5.00%, 05/25/2019 | 6,508 | 6,428 | ||||||
RALI Series 2004-QS7 Trust | ||||||||
5.50%, 05/25/2034 | 722,109 | 732,673 | ||||||
RALI Series 2005-QA6 Trust | ||||||||
4.56%, 05/25/2035 | 166,597 | 135,827 | ||||||
RALI Series 2007-QS1 Trust | ||||||||
6.00%, 01/25/2037 | 22,988 | 19,816 | ||||||
RBS Commercial Funding, Inc. 2013-SMV Trust | ||||||||
3.26%, 03/11/2031 (Acquired 10/28/2013, Cost $494,319) (1) | 512,000 | 510,893 | ||||||
RBSSP Resecuritization Trust 2009-1 | ||||||||
6.50%, 02/26/2036 (Acquired 10/28/2013, Cost $347,178) (1) | 336,908 | 355,747 | ||||||
RBSSP Resecuritization Trust 2009-12 | ||||||||
5.76%, 11/25/2033 (Acquired 10/28/2013, Cost $361,471) (1) | 354,123 | 365,563 | ||||||
RBSSP Resecuritization Trust 2009-2 | ||||||||
7.00%, 08/26/2037 (Acquired 10/28/2013, Cost $85,456) (1) | 83,308 | 85,995 | ||||||
RBSSP Resecuritization Trust 2010-9 | ||||||||
5.00%, 10/26/2034 (Acquired 10/28/2013, Cost $44,225) (1) | 43,019 | 43,226 | ||||||
Reperforming Loan REMIC Trust 2005-R1 | ||||||||
0.00%, 03/25/2035 PO (Acquired 10/28/2013, Cost $8,971) (1) | 9,459 | 8,262 | ||||||
Residential Asset Securitization Trust 2003-A14 | ||||||||
| Principal Amount | Value | |||||||
4.75%, 02/25/2019 | 1,025 | 987 | ||||||
Residential Asset Securitization Trust 2003-A8 | ||||||||
4.25%, 10/25/2018 | 17,114 | 17,146 | ||||||
Residential Asset Securitization Trust 2004-A7 | ||||||||
5.50%, 10/25/2034 | 2,542,688 | 2,545,108 | ||||||
Residential Asset Securitization Trust 2005-A2 | ||||||||
3.83%, 03/25/2035 IO | 937,577 | 99,535 | ||||||
Residential Asset Securitization Trust 2006-A4IP | ||||||||
6.00%, 05/25/2036 | 91,627 | 85,719 | ||||||
Resource Capital Co. 2015-CRE4 Ltd. | ||||||||
2.57%, 08/15/2032 (Acquired 08/05/2015, Cost $258,544) (1) | 258,544 | 257,830 | ||||||
4.17%, 08/15/2032 (Acquired 08/05/2015, Cost $1,151,000) (1) | 1,151,000 | 1,147,829 | ||||||
RFMSI Series 2003-S14 Trust | ||||||||
0.00%, 07/25/2018 PO | 2,044 | 2,011 | ||||||
RFMSI Series 2003-S16 Trust | ||||||||
5.00%, 09/25/2018 | 5,909 | 5,917 | ||||||
RFMSI Series 2005-SA4 Trust | ||||||||
3.27%, 09/25/2035 | 71,601 | 59,344 | ||||||
RREF 2015-LT7 LLC | ||||||||
3.00%, 12/25/2032 (Acquired 06/15/2015, Cost $18,884) (1) | 18,895 | 18,895 | ||||||
Sequoia Mortgage Trust 2004-10 | ||||||||
1.83%, 11/20/2034 | 68,139 | 64,306 | ||||||
Sequoia Mortgage Trust 2004-11 | ||||||||
1.81%, 12/20/2034 | 213,204 | 209,762 | ||||||
Sequoia Mortgage Trust 2004-12 | ||||||||
1.75%, 01/20/2035 | 164,916 | 151,933 | ||||||
Sequoia Mortgage Trust 2004-8 | ||||||||
1.91%, 09/20/2034 | 1,316,560 | 1,256,939 | ||||||
2.10%, 09/20/2034 | 220,928 | 216,501 | ||||||
Series RR 2014-1 Trust | ||||||||
0.00%, 05/25/2047 (Acquired 02/16/2017, Cost $1,125,764) (1) | 1,603,000 | 1,126,332 | ||||||
Springleaf Mortgage Loan Trust 2013-2 | ||||||||
1.78%, 12/25/2065 (Acquired 10/28/2013, Cost $545,019) (1) | 547,159 | 546,056 | ||||||
3.52%, 12/25/2065 (Acquired 10/28/2013, Cost $880,336) (1) | 899,000 | 897,544 | ||||||
Springleaf Mortgage Loan Trust 2013-3 | ||||||||
3.79%, 09/25/2057 (Acquired 10/28/2013, Cost $1,261,724) (1) | 1,262,000 | 1,259,558 | ||||||
Structured Adjustable Rate Mortgage Loan Trust | ||||||||
3.44%, 06/25/2034 | 501,041 | 500,500 | ||||||
Structured Asset Mortgage Investments II Trust 2004-AR5 | ||||||||
1.87%, 10/19/2034 | 203,498 | 195,035 | ||||||
Structured Asset Mortgage Investments II Trust 2005-AR5 | ||||||||
1.46%, 07/19/2035 | 674,812 | 656,668 | ||||||
Structured Asset Mortgage Investments Trust 2003-CL1 | ||||||||
1.62%, 07/25/2032 | 469,063 | 447,788 | ||||||
Structured Asset Securities Co. Mortgage Pass Through Certs Ser 2003 29 | ||||||||
4.75%, 09/25/2018 | 18,880 | 18,988 | ||||||
Structured Asset Securities Co. Mortgage Pass Through Certs Ser 2003 30 | ||||||||
5.50%, 10/25/2033 | 25,978 | 26,948 | ||||||
Structured Asset Securities Co. | ||||||||
3.02%, 12/25/2033 | 235,989 | 235,660 | ||||||
3.24%, 12/25/2033 | 1,915,304 | 1,888,578 | ||||||
5.45%, 02/25/2034 | 254,211 | 259,461 | ||||||
1.57%, 06/25/2035 (Acquired 10/28/2013, Cost $86,449) (1) | 97,438 | 84,152 | ||||||
Structured Asset Securities Co. Mortgage Pass Through Ser 2004-5H | ||||||||
5.54%, 12/25/2033 | 512,741 | 525,523 | ||||||
Structured Asset Securities Co. Mortgage Pass-Through Certs Ser 2003-33H | ||||||||
5.50%, 10/25/2033 | 270,400 | 275,308 | ||||||
Structured Asset Securities Co. Mortgage Pass-Through Certs Ser 2003-34A | ||||||||
3.35%, 11/25/2033 | 74,203 | 74,155 | ||||||
Structured Asset Securities Co. Mortgage Pass-Through Certs Ser 2004-22 | ||||||||
4.98%, 01/25/2035 | 3,238,178 | 3,370,830 | ||||||
Thornburg Mortgage Securities Trust 2003-4 | ||||||||
1.86%, 09/25/2043 | 935,337 | 903,239 | ||||||
Thornburg Mortgage Securities Trust 2003-5 | ||||||||
2.88%, 10/25/2043 | 4,824,619 | 4,869,643 | ||||||
Thornburg Mortgage Securities Trust 2004-4 | ||||||||
2.74%, 12/25/2044 | 487,921 | 485,437 | ||||||
Thornburg Mortgage Securities Trust 2005-1 | ||||||||
3.11%, 04/25/2045 | 1,525,508 | 1,529,449 | ||||||
UBS Commercial Mortgage Trust 2012-C1 | ||||||||
| Principal Amount | Value | |||||||
2.27%, 05/10/2045 IO (Acquired 10/28/2013, Cost $200,045) (1) | 1,677,309 | 136,448 | ||||||
UBS-BAMLL Trust | ||||||||
3.66%, 06/10/2030 (Acquired 10/28/2013, Cost $1,766,616) (1) | 1,787,000 | 1,833,029 | ||||||
UBS-Barclays Commercial Mortgage Trust 2012-C2 | ||||||||
1.54%, 05/10/2063 IO (Acquired 10/28/2013, Cost $557,173) (1) | 5,847,876 | 315,550 | ||||||
3.53%, 05/10/2063 | 1,073,000 | 1,117,080 | ||||||
UBS-Barclays Commercial Mortgage Trust 2013-C6 | ||||||||
3.24%, 04/10/2046 | 271,000 | 277,863 | ||||||
Vendee Mortgage Trust 1993-1 | ||||||||
7.25%, 02/15/2023 | 392,011 | 432,538 | ||||||
Vendee Mortgage Trust 1994-1 | ||||||||
5.36%, 02/15/2024 | 101,339 | 107,737 | ||||||
6.50%, 02/15/2024 | 291,212 | 318,304 | ||||||
Vendee Mortgage Trust 1996-1 | ||||||||
6.75%, 02/15/2026 | 152,128 | 171,078 | ||||||
Vendee Mortgage Trust 1996-2 | ||||||||
6.75%, 06/15/2026 | 69,721 | 77,963 | ||||||
Vendee Mortgage Trust 1997-1 | ||||||||
7.50%, 02/15/2027 | 215,343 | 246,506 | ||||||
Vendee Mortgage Trust 1998-1 | ||||||||
7.00%, 03/15/2028 | 137,516 | 158,645 | ||||||
VNDO 2012-6AVE Mortgage Trust | ||||||||
3.00%, 11/15/2030 (Acquired 10/28/2013 through 02/19/2014, Cost $2,223,425) (1) | 2,283,000 | 2,329,831 | ||||||
VNDO 2013-PENN Mortgage Trust | ||||||||
3.81%, 12/13/2029 (Acquired 12/05/2013, Cost $2,542,059) (1) | 2,500,000 | 2,618,510 | ||||||
Wachovia Bank Commercial Mortgage Trust Series 2006-C24 | ||||||||
0.13%, 03/15/2045 IO (Acquired 10/28/2013, Cost $208,180) (1) | 4,642,765 | 13 | ||||||
WaMu Mortgage Pass-Through Certificates Series 2003-AR11 Trust | ||||||||
2.85%, 10/25/2033 | 354,602 | 357,977 | ||||||
WaMu Mortgage Pass-Through Certificates Series 2003-AR7 Trust | ||||||||
2.74%, 08/25/2033 | 119,629 | 120,336 | ||||||
WaMu Mortgage Pass-Through Certificates Series 2003-AR9 Trust | ||||||||
2.79%, 09/25/2033 | 676,412 | 685,104 | ||||||
2.85%, 09/25/2033 | 133,591 | 133,113 | ||||||
WaMu Mortgage Pass-Through Certificates Series 2003-S1 Trust | ||||||||
5.50%, 04/25/2033 | 114,340 | 117,223 | ||||||
WaMu Mortgage Pass-Through Certificates Series 2003-S10 | ||||||||
5.00%, 10/25/2018 | 3,128 | 3,140 | ||||||
WaMu Mortgage Pass-Through Certificates Series 2003-S13 Trust | ||||||||
1.77%, 12/25/2018 | 8,495 | 8,400 | ||||||
WaMu Mortgage Pass-Through Certificates Series 2003-S4 | ||||||||
14.12%, 06/25/2033 | 33,645 | 39,774 | ||||||
WaMu Mortgage Pass-Through Certificates Series 2003-S8 Trust | ||||||||
4.50%, 09/25/2018 | 14,292 | 14,314 | ||||||
4.50%, 09/25/2018 | 5,180 | 5,187 | ||||||
WaMu Mortgage Pass-Through Certificates Series 2003-S9 Trust | ||||||||
0.00%, 10/25/2033 PO | 10,066 | 8,807 | ||||||
5.25%, 10/25/2033 | 458,931 | 476,603 | ||||||
WaMu Mortgage Pass-Through Certificates Series 2004-AR14 Trust | ||||||||
2.91%, 01/25/2035 | 3,750,179 | 3,818,096 | ||||||
WaMu Mortgage Pass-Through Certificates Series 2004-AR3 Trust | ||||||||
3.13%, 06/25/2034 | 4,067,859 | 4,122,486 | ||||||
3.13%, 06/25/2034 | 229,219 | 232,297 | ||||||
WaMu Mortgage Pass-Through Certificates Series 2004-CB1 Trust | ||||||||
5.00%, 06/25/2019 | 24,001 | 24,203 | ||||||
WaMu Mortgage Pass-Through Certificates Series 2004-CB2 Trust | ||||||||
5.00%, 07/25/2019 | 30,947 | 31,181 | ||||||
5.50%, 08/25/2019 | 62,884 | 63,507 | ||||||
6.00%, 08/25/2034 | 966,527 | 1,023,647 | ||||||
WaMu Mortgage Pass-Through Certificates Series 2004-CB3 Trust | ||||||||
5.50%, 10/25/2019 | 8,185 | 8,282 | ||||||
6.00%, 10/25/2019 | 10,168 | 10,426 | ||||||
6.50%, 10/25/2034 | 3,521,627 | 3,761,368 | ||||||
WaMu Mortgage Pass-Through Certificates Series 2004-CB4 Trust | ||||||||
5.50%, 12/25/2019 | 17,647 | 17,904 | ||||||
WaMu Mortgage Pass-Through Certificates Series 2004-RS2 | ||||||||
5.00%, 11/25/2033 | 74,133 | 75,278 | ||||||
WaMu Mortgage Pass-Through Certificates Series 2004-S2 Trust | ||||||||
5.50%, 06/25/2034 | 409,986 | 425,071 | ||||||
WaMu Mortgage Pass-Through Certificates Series 2004-S3 Trust | ||||||||
| Principal Amount | Value | |||||||
5.00%, 07/25/2034 | 70,090 | 71,815 | ||||||
WaMu Mortgage Pass-Through Certificates Series 2006-AR10 Trust | ||||||||
3.02%, 09/25/2036 | 15,298 | 13,509 | ||||||
WaMu Mortgage Pass-Through Certificates Series 2006-AR8 Trust | ||||||||
2.89%, 08/25/2046 | 93,637 | 85,586 | ||||||
Washington Mutual Mortgage Pass-Through Certificates WMALT Series 2005-1 Trust | ||||||||
0.00%, 03/25/2035 PO | 15,995 | 12,294 | ||||||
5.50%, 03/25/2035 | 138,468 | 140,797 | ||||||
Washington Mutual Mortgage Pass-Through Certificates WMALT Series 2005-2 Trust | ||||||||
3.78%, 04/25/2035 IO | 283,462 | 36,695 | ||||||
3.83%, 04/25/2035 IO | 1,029,624 | 141,942 | ||||||
Washington Mutual Mortgage Pass-Through Certificates WMALT Series 2005-4 Trust | ||||||||
5.50%, 06/25/2035 | 353,444 | 330,794 | ||||||
5.50%, 06/25/2035 IO | 340,246 | 68,022 | ||||||
Washington Mutual Mortgage Pass-Through Certificates WMALT Series 2005-6 Trust | ||||||||
5.50%, 08/25/2035 | 70,234 | 68,079 | ||||||
Washington Mutual Mortgage Pass-Through Certificates WMALT Series 2006-1 Trust | ||||||||
5.75%, 02/25/2036 | 27,183 | 25,621 | ||||||
Washington Mutual MSC Mortgage Pass-Through Certificates Series 2003-MS5 Trust | ||||||||
1.72%, 03/25/2018 | 1,960 | 1,955 | ||||||
Washington Mutual MSC Mortgage Pass-Through Certificates Series 2003-MS7 Trust | ||||||||
0.00%, 03/25/2033 PO | 1,050 | 903 | ||||||
Wells Fargo Alternative Loan 2003-1 Trust | ||||||||
0.00%, 09/25/2033 PO | 10,573 | 9,605 | ||||||
Wells Fargo Alternative Loan 2007-PA3 Trust | ||||||||
5.75%, 07/25/2037 | 34,390 | 31,560 | ||||||
Wells Fargo Commercial Mortgage Trust | ||||||||
2.64%, 11/15/2049 | 20,000,000 | 19,269,390 | ||||||
Wells Fargo Commercial Mortgage Trust 2013-120B | ||||||||
2.80%, 03/18/2028 (Acquired 10/28/2013, Cost $1,526,788) (1) | 1,548,000 | 1,566,237 | ||||||
Wells Fargo Commercial Mortgage Trust 2014-LC16 | ||||||||
2.82%, 08/15/2050 | 3,500,000 | 3,553,699 | ||||||
Wells Fargo Commercial Mortgage Trust 2015-C26 | ||||||||
2.99%, 02/15/2048 | 9,300,000 | 9,510,535 | ||||||
Wells Fargo Commercial Mortgage Trust 2015-C29 | ||||||||
3.37%, 06/15/2048 | 10,000,000 | 10,213,940 | ||||||
Wells Fargo Commercial Mortgage Trust 2015-C30 | ||||||||
3.66%, 09/15/2058 | 729,000 | 757,394 | ||||||
Wells Fargo Commercial Mortgage Trust 2015-NXS2 | ||||||||
3.50%, 07/15/2058 | 15,000,000 | 15,455,085 | ||||||
Wells Fargo Commercial Mortgage Trust 2015-NXS3 | ||||||||
3.62%, 09/15/2057 | 548,000 | 567,136 | ||||||
Wells Fargo Commercial Mortgage Trust 2015-SG1 | ||||||||
3.79%, 09/15/2048 | 1,926,000 | 2,016,439 | ||||||
Wells Fargo Commercial Mortgage Trust 2016-LC25 | ||||||||
3.64%, 12/15/2059 | 1,579,000 | 1,637,560 | ||||||
Wells Fargo Commercial Mortgage Trust 2017-C38 | ||||||||
3.19%, 07/15/2050 | 13,800,000 | 13,845,816 | ||||||
Wells Fargo Commercial Mortgage Trust 2017-RB1 | ||||||||
3.64%, 03/15/2050 | 1,611,000 | 1,672,508 | ||||||
Wells Fargo Mortgage Backed Securities 2003-K Trust | ||||||||
2.90%, 11/25/2033 | 239,401 | 241,087 | ||||||
2.90%, 11/25/2033 | 9,184 | 9,288 | ||||||
Wells Fargo Mortgage Backed Securities 2003-L Trust | ||||||||
2.94%, 11/25/2033 | 39,955 | 39,286 | ||||||
Wells Fargo Mortgage Backed Securities 2004-4 Trust | ||||||||
5.50%, 05/25/2034 | 55,089 | 56,236 | ||||||
Wells Fargo Mortgage Backed Securities 2004-B Trust | ||||||||
3.02%, 02/25/2034 | 90,505 | 90,437 | ||||||
Wells Fargo Mortgage Backed Securities 2004-EE Trust | ||||||||
3.24%, 12/25/2034 | 3,053,057 | 3,087,459 | ||||||
3.24%, 12/25/2034 | 125,814 | 128,564 | ||||||
3.58%, 12/25/2034 | 223,794 | 231,460 | ||||||
3.58%, 12/25/2034 | 73,048 | 75,551 | ||||||
Wells Fargo Mortgage Backed Securities 2004-I Trust | ||||||||
3.18%, 07/25/2034 | 324,024 | 329,142 | ||||||
Wells Fargo Mortgage Backed Securities 2004-P Trust | ||||||||
3.03%, 09/25/2034 | 857,505 | 874,527 | ||||||
Wells Fargo Mortgage Backed Securities 2004-V Trust | ||||||||
3.31%, 10/25/2034 | 124,583 | 125,680 | ||||||
| Principal Amount | Value | |||||||
3.31%, 10/25/2034 | 159,790 | 163,909 | ||||||
Wells Fargo Mortgage Backed Securities 2005-14 Trust | ||||||||
0.00%, 12/25/2035 PO | 13,818 | 11,824 | ||||||
5.50%, 12/25/2035 | 89,698 | 92,473 | ||||||
Wells Fargo Mortgage Backed Securities 2005-AR10 Trust | ||||||||
3.15%, 06/25/2035 | 5,430,291 | 5,541,178 | ||||||
Wells Fargo Mortgage Backed Securities 2005-AR3 Trust | ||||||||
| Principal Amount | Value | |||||||
3.31%, 03/25/2035 | 1,942,206 | 1,985,865 | ||||||
Wells Fargo Mortgage Backed Securities 2005-AR8 Trust | ||||||||
3.26%, 06/25/2035 | 176,863 | 180,648 | ||||||
Wells Fargo Mortgage Backed Securities 2007-11 Trust | ||||||||
6.00%, 08/25/2037 | 220,450 | 221,586 | ||||||
Wells Fargo Mortgage Backed Securities 2007-7 Trust | ||||||||
6.00%, 06/25/2037 | 36,005 | 36,198 | ||||||
WFRBS Commercial Mortgage Trust 2011-C3 | ||||||||
4.38%, 03/15/2044 (Acquired 10/28/2013, Cost $1,112,938) (1) | 1,059,000 | 1,124,651 | ||||||
WFRBS Commercial Mortgage Trust 2012-C6 | ||||||||
3.44%, 04/15/2045 | 9,470,780 | 9,845,498 | ||||||
WFRBS Commercial Mortgage Trust 2013-C11 | ||||||||
4.35%, 03/15/2045 (Acquired 08/04/2014, Cost $288,339) (1) | 300,000 | 275,939 | ||||||
WFRBS Commercial Mortgage Trust 2013-C14 | ||||||||
3.07%, 06/15/2046 | 2,244,000 | 2,286,298 | ||||||
3.34%, 06/15/2046 | 229,750 | 236,847 | ||||||
WFRBS Commercial Mortgage Trust 2014-C21 | ||||||||
3.68%, 08/15/2047 | 7,000,000 | 7,296,783 | ||||||
WFRBS Commercial Mortgage Trust 2014-C23 | ||||||||
3.64%, 10/15/2057 | 3,500,000 | 3,683,388 | ||||||
WFRBS Commercial Mortgage Trust 2014-C24 | ||||||||
3.32%, 11/15/2047 | 5,000,000 | 5,185,781 | ||||||
WFRBS Commercial Mortgage Trust 2014-LC14 | ||||||||
3.77%, 03/15/2047 | 10,000,000 | 10,481,064 | ||||||
|
| |||||||
Total Mortgage-Backed Obligations (Cost $4,483,633,130) | $ | 4,517,311,840 | ||||||
|
| |||||||
Total Bonds & Notes (Cost: $13,088,057,611) | $ | 13,276,753,886 | ||||||
|
| |||||||
| Shares | Value | |||||||
PREFERRED STOCKS - 0.02% | ||||||||
Financials - 0.02% | ||||||||
State Street Co. | 95,000 | $ | 2,605,850 | |||||
|
| |||||||
Total Preferred Stocks (Cost $2,375,000) | $ | 2,605,850 | ||||||
|
| |||||||
SHORT-TERM INVESTMENTS - 8.07% | ||||||||
Money Market Funds - 8.06% | ||||||||
Fidelity Institutional Money Market Government Funds - Class I, 0.81% (5)(6) | 547,323,679 | $ | 547,323,679 | |||||
Goldman Sachs Financial Square Treasury Solutions Fund - Class I, 0.84% (5)(6) | 548,895,840 | 548,895,840 | ||||||
|
| |||||||
Total Money Market Funds | 1,096,219,519 | |||||||
|
| |||||||
| Principal Amount | Value | |||||||
U.S. Treasury Bills - 0.01% | ||||||||
U.S. Treasury Bill, 0.00%, 04/26/2018 (4) | $ | 1,000,000 | 990,471 | |||||
|
| |||||||
Total Short-Term Investments (Cost $1,097,210,819) | $ | 1,097,209,990 | ||||||
|
| |||||||
TOTAL INVESTMENTS IN SECURITIES - 105.74% | ||||||||
(Cost: $14,187,643,430) | $ | 14,376,569,726 | ||||||
LIABILITIES IN EXCESS OF OTHER ASSETS - (5.74)% | (780,742,021 | ) | ||||||
|
| |||||||
TOTAL NET ASSETS - 100.00% | $ | 13,595,827,705 | ||||||
|
| |||||||
Percentages are stated as a percent of net assets.
IO Interest Only Strip.
PO Principal Only Strip.
| (1) | Restricted security as defined in Rule 144(A) under the Securities Act of 1933. The value of these securities total $1,934,772,921, which represents 14.23% of total net assets. |
| (2) | Inflation protected security. The value of these securities total $18,115,750, which represents 0.13% of total net assets. |
| (3) | Delayed delivery purchase commitment security. The value of these securities total $713,114,849, which represents 5.25% of total net assets. |
| (4) | Partially assigned as collateral for certain futures contracts. The value of the pledged issues total $2,672,390, which represent 0.02% of total net assets. |
| (5) | Partially assigned as collateral for certain delayed delivery securities. |
| (6) | Represents annualized seven-day yield as of the close of the reporting period. |
| (7) | Security is treated as illiquid by the Fund. The value of these securities total $47,290,200, which represents 0.35% of the total net assets. |
| (8) | Security is categorized as Level 3 per the Trust’s fair value hierarchy. The value of these securities total $127,785,038, which represents 0.94% of total net assets. |
Open Futures Contracts
Number of Contracts Purchased (Sold) | Description | Counterparty | Settlement Month | Notional Amount | Value | Unrealized Appreciation (Depreciation) | ||||||||||||||||
(1,650) | U.S. 10 Year Note Future | J.P. Morgan | Sep. 2017 | $ | (208,560,324 | ) | $ | (207,126,562 | ) | $ | 1,433,762 | |||||||||||
643 | U.S. 2 Year Note Future | J.P. Morgan | Sep. 2017 | 139,149,354 | 138,958,329 | (191,025 | ) | |||||||||||||||
2,885 | U.S. 5 Year Note Future | J.P. Morgan | Sep. 2017 | 340,766,902 | 339,956,682 | (810,220 | ) | |||||||||||||||
(491) | U.S. Long Bond Future | J.P. Morgan | Sep. 2017 | (75,443,364 | ) | (75,460,562 | ) | (17,198 | ) | |||||||||||||
507 | U.S. Ultra Bond Future | J.P. Morgan | Sep. 2017 | 83,270,200 | 84,098,625 | 828,425 | ||||||||||||||||
|
| |||||||||||||||||||||
| $ | 1,243,744 | |||||||||||||||||||||
|
| |||||||||||||||||||||
Bridge Builder Core Plus Bond Fund
Schedule of Investments
June 30, 2017
| Principal Amount | Value | |||||||
BONDS & NOTES - 95.19% | ||||||||
Asset-Backed Obligations - 13.59% | ||||||||
AASET 2017-1 Trust | ||||||||
3.97%, 05/16/2042 (Acquired 05/25/2017, Cost $699,996) (1) | $ | 700,000 | $ | 701,033 | ||||
ABFC 2007-NC1 Trust | ||||||||
1.52%, 05/25/2037 (Acquired 09/03/2015, Cost $3,172,077) (1) | 4,000,000 | 3,191,594 | ||||||
Accredited Mortgage Loan Trust 2003-2 | ||||||||
1.92%, 10/25/2033 | 2,555,367 | 2,506,269 | ||||||
ACE Securities Corp. Home Equity Loan Trust Series 2005-HE7 | ||||||||
1.88%, 11/25/2035 | 610,430 | 608,565 | ||||||
Aegis Asset Backed Securities Trust 2005-5 | ||||||||
1.47%, 12/25/2035 | 6,472,098 | 6,403,277 | ||||||
Ajax Mortgage Loan Trust 2016-B | ||||||||
4.00%, 09/25/2065 (Acquired 08/05/2016, Cost $586,666) (1) | 587,901 | 586,908 | ||||||
Ajax Mortgage Loan Trust 2016-C | ||||||||
4.00%, 10/25/2057 (Acquired 10/21/2016, Cost $1,770,341) (1) | 1,770,341 | 1,763,089 | ||||||
Ally Auto Receivables Trust 2014-1 | ||||||||
2.04%, 12/16/2019 | 345,000 | 345,900 | ||||||
2.48%, 02/16/2021 | 345,000 | 345,480 | ||||||
Ally Auto Receivables Trust 2015-2 | ||||||||
2.07%, 10/15/2020 (Acquired 02/13/2017, Cost $821,936) (1) | 820,000 | 822,888 | ||||||
3.01%, 03/15/2022 (Acquired 02/08/2017, Cost $197,578) (1) | 195,000 | 196,981 | ||||||
Ally Auto Receivables Trust 2016-1 | ||||||||
1.99%, 03/15/2021 | 790,000 | 791,397 | ||||||
2.29%, 06/15/2021 | 530,000 | 532,473 | ||||||
Ally Auto Receivables Trust 2016-3 | ||||||||
1.72%, 04/15/2021 | 2,060,000 | 2,056,568 | ||||||
Ally Auto Receivables Trust 2017-2 | ||||||||
2.33%, 06/15/2022 | 210,000 | 210,528 | ||||||
Ally Auto Receivables Trust 2017-3 | ||||||||
| Principal Amount | Value | |||||||
1.74%, 09/15/2021 | 7,405,000 | 7,396,487 | ||||||
Ally Master Owner Trust | ||||||||
1.54%, 09/15/2019 | 1,450,000 | 1,450,287 | ||||||
1.63%, 05/15/2020 | 1,670,000 | 1,670,252 | ||||||
ALM XI Ltd. | ||||||||
2.64%, 10/17/2026 (Acquired 04/28/2017, Cost $995,000) (1) | 995,000 | 994,365 | ||||||
ALM XIV Ltd. | ||||||||
2.32%, 07/28/2026 (Acquired 04/05/2017, Cost $985,000) (1) | 985,000 | 985,782 | ||||||
2.72%, 07/28/2026 (Acquired 04/05/2017, Cost $1,135,000) (1) | 1,135,000 | 1,131,315 | ||||||
American Express Credit Account Master Trust | ||||||||
1.49%, 04/15/2020 | 2,000,000 | 2,000,684 | ||||||
1.64%, 12/15/2021 | 3,620,000 | 3,617,184 | ||||||
AmeriCredit Automobile Receivables 2015-1 | ||||||||
1.26%, 11/08/2019 | 514,885 | 514,653 | ||||||
AmeriCredit Automobile Receivables 2015-4 | ||||||||
3.72%, 12/08/2021 | 531,000 | 542,394 | ||||||
AmeriCredit Automobile Receivables 2016-1 | ||||||||
1.81%, 10/08/2020 | 175,000 | 175,237 | ||||||
3.59%, 02/08/2022 | 916,000 | 935,353 | ||||||
AmeriCredit Automobile Receivables Trust 2013-5 | ||||||||
2.86%, 12/09/2019 | 3,270,000 | 3,298,325 | ||||||
Americredit Automobile Receivables Trust 2014-4 | ||||||||
3.07%, 11/09/2020 | 5,600,000 | 5,666,511 | ||||||
AmeriCredit Automobile Receivables Trust 2015-3 | ||||||||
3.34%, 08/09/2021 | 1,865,000 | 1,891,237 | ||||||
AmeriCredit Automobile Receivables Trust 2016-2 | ||||||||
1.60%, 11/09/2020 | 1,260,000 | 1,259,828 | ||||||
2.87%, 11/08/2021 | 290,000 | 292,930 | ||||||
3.65%, 05/09/2022 | 605,000 | 617,924 | ||||||
AmeriCredit Automobile Receivables Trust 2016-3 | ||||||||
2.24%, 04/08/2022 | 2,000,000 | 1,986,082 | ||||||
Ameriquest Mortgage Securities, Inc. Asset-Backed Pass-Through Ctfs Ser 2005-R5 | ||||||||
1.71%, 07/25/2035 | 4,284,043 | 4,216,773 | ||||||
Ameriquest Mortgage Securities Trust 2006-R2 | ||||||||
1.39%, 04/25/2036 | 1,699,193 | 1,689,875 | ||||||
Ameriquest Mortgage Securities, Inc. Asset-Backed Pass-Through Ctfs Ser 2004-R8 | ||||||||
2.18%, 09/25/2034 | 2,160,857 | 2,165,954 | ||||||
| Principal | ||||||||
| Amount | Value | |||||||
Ammc Clo 19 Ltd. | ||||||||
2.66%, 10/16/2028 (Acquired 10/07/2016, Cost $4,255,000) (1) | 4,255,000 | 4,265,744 | ||||||
AMPLIT Trust 2015-A | ||||||||
5.00%, 09/15/2021 (Acquired 11/13/2015, Cost $126,089) (1) | 126,089 | 126,454 | ||||||
Applebee’s Funding LLC / IHOP Funding LLC | ||||||||
4.28%, 09/05/2044 (Acquired 05/16/2016, Cost $5,066,667) (1) | 5,000,000 | 4,921,381 | ||||||
ARI Fleet Lease Trust 2017-A | ||||||||
1.91%, 04/15/2026 (Acquired 05/16/2017, Cost $544,936) (1) | 545,000 | 544,573 | ||||||
2.28%, 04/15/2026 (Acquired 06/21/2017, Cost $1,307,356) (1) | 1,305,000 | 1,304,423 | ||||||
Ascentium Equipment Receivables 2016-2 Trust | ||||||||
1.46%, 04/10/2019 (Acquired 10/18/2016, Cost $267,398) (1) | 267,403 | 267,158 | ||||||
Ascentium Equipment Receivables 2017-1 Trust | ||||||||
1.87%, 07/10/2019 (Acquired 04/26/2017, Cost $164,993) (1) | 165,000 | 165,000 | ||||||
2.29%, 06/10/2021 (Acquired 04/26/2017, Cost $169,991) (1) | 170,000 | 170,115 | ||||||
Atrium X | ||||||||
2.04%, 07/16/2025 (Acquired 05/12/2017, Cost $1,400,000) (1) | 1,400,000 | 1,401,501 | ||||||
Avis Budget Rental Car Funding AESOP LLC | ||||||||
2.10%, 03/20/2019 (Acquired 10/20/2016, Cost $330,584) (1) | 330,000 | 330,611 | ||||||
2.62%, 09/20/2019 (Acquired 10/20/2016, Cost $504,907) (1) | 505,000 | 506,360 | ||||||
2.97%, 02/20/2020 (Acquired 08/26/2015 through 10/20/2016, Cost $1,465,458) (1) | 1,450,000 | 1,464,772 | ||||||
2.46%, 07/20/2020 (Acquired 07/15/2015 through 06/17/2016, Cost $2,642,498) (1) | 2,630,000 | 2,636,978 | ||||||
2.50%, 02/20/2021 (Acquired 04/21/2017, Cost $1,484,521) (1) | 1,480,000 | 1,476,181 | ||||||
2.50%, 07/20/2021 (Acquired 10/26/2016, Cost $1,237,797) (1) | 1,230,000 | 1,224,412 | ||||||
Barclays Dryrock Issuance Trust | ||||||||
2.41%, 07/15/2022 | 1,395,000 | 1,412,902 | ||||||
2.20%, 12/15/2022 | 1,705,000 | 1,715,791 | ||||||
Bayview Opportunity Master Fund IIa Trust 2016-RPL3 | ||||||||
3.47%, 07/28/2031 (Acquired 07/15/2016, Cost $327,298) (1) | 327,298 | 325,862 | ||||||
Bayview Opportunity Master Fund IIIb Trust 2017-RN2 | ||||||||
3.47%, 04/28/2032 (Acquired 04/21/2017, Cost $857,770) (1) | 857,770 | 856,878 | ||||||
Bayview Opportunity Master Fund IIIb Trust 2017-RN3 | ||||||||
3.23%, 05/28/2032 (Acquired 05/19/2017, Cost $722,625) (1) | 722,625 | 721,654 | ||||||
Bayview Opportunity Master Fund IVa Trust 2017-SPL5 | ||||||||
3.50%, 07/28/2057 (Acquired 06/23/2017, Cost $494,703) (1) | 480,000 | 492,477 | ||||||
Bayview Opportunity Master Fund IVb Trust 2017-NPL1 | ||||||||
3.60%, 01/28/2032 (Acquired 01/26/2017, Cost $916,043) (1) | 916,043 | 914,145 | ||||||
Bayview Opportunity Master Fund IVb Trust 2017-RN1 | ||||||||
| Principal | ||||||||
| Amount | Value | |||||||
3.60%, 03/01/2032 (Acquired 02/17/2017, Cost $619,997) (1) | 619,997 | 619,307 | ||||||
Bayview Opportunity Master Fund Trust 2016-LT1 | ||||||||
3.47%, 10/28/2031 (Acquired 10/12/2016, Cost $54,707) (1) | 54,707 | 54,683 | ||||||
Blackbird Capital Aircraft Lease Securitization Ltd. 2016-1 | ||||||||
4.21%, 12/16/2041 (Acquired 11/04/2016, Cost $1,451,192) (1) | 1,451,198 | 1,486,882 | ||||||
BMW Vehicle Lease Trust 2016-2 | ||||||||
1.57%, 02/20/2020 | 960,000 | 955,831 | ||||||
Cadogan Square CLO IV BV | ||||||||
1.31%, 07/24/2023 (Acquired 05/02/2017, Cost $6,560,198) (1)* | EUR 6,000,000 | 6,829,484 | ||||||
California Republic Auto Receivables Trust 2017-1 | ||||||||
3.76%, 12/15/2023 | $ | 1,300,000 | 1,301,046 | |||||
CAM Mortgage Trust | ||||||||
4.00%, 01/15/2056 (Acquired 04/18/2016, Cost $71,653) (1) | 71,786 | 72,281 | ||||||
CAM Mortgage Trust 2016-2 | ||||||||
3.25%, 06/15/2057 (Acquired 09/22/2016 through 05/10/2017, Cost $627,918) (1) | 627,718 | 628,498 | ||||||
Capital Auto Receivables Asset Trust 2013-4 | ||||||||
3.83%, 07/20/2022 (Acquired 11/03/2016, Cost $558,407) (1) | 550,000 | 554,915 | ||||||
Capital Auto Receivables Asset Trust 2014-1 | ||||||||
2.84%, 04/22/2019 | 1,185,000 | 1,190,049 | ||||||
3.39%, 07/22/2019 | 960,000 | 970,450 | ||||||
Capital Auto Receivables Asset Trust 2015-2 | ||||||||
4.50%, 01/22/2024 | 1,545,000 | 1,586,229 | ||||||
Capital Auto Receivables Asset Trust 2015-3 | ||||||||
1.94%, 01/21/2020 | 2,000,000 | 2,005,496 | ||||||
Capital Auto Receivables Asset Trust 2016-2 | ||||||||
1.63%, 01/20/2021 | 755,000 | 752,428 | ||||||
Capital One Multi-Asset Execution Trust | ||||||||
1.39%, 01/15/2021 | 3,000,000 | 2,998,715 | ||||||
Capitalsource Real Estate Loan Trust | ||||||||
1.55%, 01/20/2037 (Acquired 05/31/2017, Cost $3,614,465) (1) | 3,669,000 | 3,460,065 | ||||||
1.81%, 01/20/2037 (Acquired 05/31/2017, Cost $3,231,599) (1) | 3,400,000 | 3,196,000 | ||||||
1.91%, 01/20/2037 (Acquired 05/31/2017, Cost $1,116,789) (1) | 1,200,000 | 1,116,000 | ||||||
2.00%, 01/20/2037 (Acquired 05/31/2017, Cost $632,387) (1) | 700,000 | 631,750 | ||||||
CarMax Auto Owner Trust 2013-3 | ||||||||
1.49%, 01/15/2019 | 746,095 | 746,136 | ||||||
CarMax Auto Owner Trust 2016-1 | ||||||||
2.34%, 06/15/2021 | 365,000 | 365,002 | ||||||
| Principal | ||||||||
| Amount | Value | |||||||
CarMax Auto Owner Trust 2016-2 | ||||||||
2.16%, 12/15/2021 | 100,000 | 99,857 | ||||||
CarMax Auto Owner Trust 2016-4 | ||||||||
1.40%, 08/16/2021 | 1,390,000 | 1,378,619 | ||||||
2.26%, 07/15/2022 | 265,000 | 262,991 | ||||||
Carnow Auto Receivables Trust 2015-1 | ||||||||
3.88%, 04/15/2020 (Acquired 09/11/2015, Cost $649,990) (1) | 650,000 | 649,669 | ||||||
CCG Receivables Trust 2016-1 | ||||||||
1.69%, 09/14/2022 (Acquired 06/08/2016, Cost $1,162,702) (1) | 1,162,758 | 1,161,492 | ||||||
CCG Receivables Trust 2017-1 | ||||||||
1.84%, 11/14/2023 (Acquired 06/05/2017, Cost $969,953) (1) | 970,000 | 968,906 | ||||||
Chase Issuance Trust | ||||||||
1.59%, 09/15/2020 | 2,000,000 | 2,007,765 | ||||||
1.37%, 06/15/2021 | 6,150,000 | 6,110,535 | ||||||
Chrysler Capital Auto Receivables Trust 2016-B | ||||||||
1.36%, 01/15/2020 (Acquired 10/26/2016, Cost $553,535) (1) | 553,573 | 552,917 | ||||||
1.64%, 07/15/2021 (Acquired 10/26/2016, Cost $574,904) (1) | 575,000 | 573,328 | ||||||
Citibank Credit Card Issuance Trust | ||||||||
1.75%, 11/19/2021 | 3,770,000 | 3,766,658 | ||||||
1.92%, 04/07/2022 | 9,130,000 | 9,139,690 | ||||||
Citigroup Mortgage Loan Trust 2007-AHL1 | ||||||||
1.36%, 12/25/2036 | 5,778,785 | 5,682,923 | ||||||
Citigroup Mortgage Loan Trust, Inc. | ||||||||
2.12%, 09/25/2035 | 5,900,000 | 5,168,009 | ||||||
CKE Restaurant Holdings, Inc. | ||||||||
4.47%, 03/20/2043 (Acquired 07/28/2015, Cost $2,066,616) (1) | 2,020,082 | 2,016,051 | ||||||
CLI Funding V LLC | ||||||||
3.38%, 10/18/2029 (Acquired 07/23/2015, Cost $948,273) (1) | 944,271 | 943,367 | ||||||
CNH Equipment Trust 2015-A | ||||||||
1.85%, 04/15/2021 | 1,047,000 | 1,049,445 | ||||||
CNH Equipment Trust 2016-C | ||||||||
1.44%, 12/15/2021 | 1,020,000 | 1,012,785 | ||||||
Coinstar Funding LLC Series 2017-1 | ||||||||
5.22%, 04/25/2047 (Acquired 05/04/2017, Cost $1,135,000) (1) | 1,135,000 | 1,153,109 | ||||||
Colony American Finance 2015-1 Ltd. | ||||||||
4.83%, 10/18/2047 (Acquired 10/22/2015, Cost $724,993) (1) | 725,000 | 729,010 | ||||||
Colony American Homes 2014-2 | ||||||||
| Principal | ||||||||
| Amount | Value | |||||||
3.38%, 07/17/2031 (Acquired 03/28/2016, Cost $98,459) (1) | 101,880 | 102,176 | ||||||
Conseco Financial Corp. | ||||||||
7.70%, 05/15/2027 | 13,612,663 | 12,931,932 | ||||||
Countrywide Asset-Backed Certificates | ||||||||
1.46%, 03/25/2036 | 4,671,504 | 3,819,722 | ||||||
1.39%, 03/25/2037 | 9,760,833 | 9,173,177 | ||||||
CPS Auto Receivables Trust 2016-C | ||||||||
5.92%, 06/15/2022 (Acquired 07/18/2016, Cost $1,984,630) (1) | 1,985,000 | 2,105,692 | ||||||
CPS Auto Trust | ||||||||
4.53%, 01/17/2023 (Acquired 10/13/2016, Cost $1,464,820) (1) | 1,465,000 | 1,490,603 | ||||||
CWABS Asset-Backed Certificates Trust 2004-13 | ||||||||
2.30%, 04/25/2035 | 1,757,504 | 1,765,681 | ||||||
CWABS Asset-Backed Certificates Trust 2005-16 | ||||||||
1.70%, 04/25/2036 | 805,000 | 705,770 | ||||||
CWABS Asset-Backed Certificates Trust 2005-7 | ||||||||
1.80%, 09/25/2035 | 8,000,000 | 7,940,581 | ||||||
DB Master Finance LLC 2015-1 | ||||||||
3.26%, 02/20/2045 (Acquired 07/29/2015, Cost $518,453) (1) | 518,075 | 521,178 | ||||||
Denali Capital CLO X Ltd. | ||||||||
2.32%, 04/28/2025 (Acquired 05/30/2017, Cost $15,220,535) (1) | 15,200,000 | 15,201,414 | ||||||
Diamond Resorts Owner Trust 2013-1 | ||||||||
1.95%, 01/20/2025 (Acquired 08/26/2015, Cost $619,733) (1) | 621,915 | 617,786 | ||||||
Diamond Resorts Owner Trust 2014-1 | ||||||||
2.54%, 05/20/2027 (Acquired 07/15/2015, Cost $177,361) (1) | 177,232 | 175,622 | ||||||
Diamond Resorts Owner Trust 2015-1 | ||||||||
2.73%, 07/20/2027 (Acquired 07/23/2015, Cost $118,260) (1) | 118,268 | 117,573 | ||||||
Discover Card Execution Note Trust | ||||||||
1.39%, 03/15/2022 | 2,150,000 | 2,131,995 | ||||||
Domino’s Pizza Master Issuer LLC | ||||||||
5.22%, 01/25/2042 (Acquired 07/15/2015 through 12/06/2016, Cost $4,336,154) (1) | 4,236,282 | 4,238,315 | ||||||
3.48%, 10/25/2045 (Acquired 10/14/2015 through 10/25/2016, Cost $3,306,046) (1) | 3,301,213 | 3,333,994 | ||||||
Drive Auto Receivables Trust 2015-B | ||||||||
2.76%, 07/15/2021 (Acquired 08/06/2015, Cost $652,604) (1) | 653,690 | 657,345 | ||||||
Drive Auto Receivables Trust 2015-C | ||||||||
3.01%, 05/17/2021 (Acquired 07/15/2015, Cost $697,902) (1) | 697,943 | 703,382 | ||||||
Dryden 31 Senior Loan Fund | ||||||||
2.24%, 04/18/2026 (Acquired 03/22/2017, Cost $3,200,000) (1) | 3,200,000 | 3,198,387 | ||||||
| Principal | ||||||||
| Amount | Value | |||||||
Dryden 35 EURO CLO 2014 BV | ||||||||
0.70%, 05/17/2027 (Acquired 05/10/2017, Cost $14,506,770) (1)* | EUR 13,350,000 | 15,232,455 | ||||||
DT Auto Owner Trust 2014-3 | ||||||||
4.47%, 11/15/2021 (Acquired 06/28/2016, Cost $1,814,496) (1) | $ | 1,800,000 | 1,840,234 | |||||
DT Auto Owner Trust 2016-1 | ||||||||
4.66%, 12/15/2022 (Acquired 01/13/2016, Cost $1,599,731) (1) | 1,600,000 | 1,630,372 | ||||||
DT Auto Owner Trust 2016-4 | ||||||||
3.77%, 10/17/2022 (Acquired 09/28/2016, Cost $114,982) (1) | 115,000 | 115,807 | ||||||
DT Auto Owner Trust 2017-1 | ||||||||
3.55%, 11/15/2022 (Acquired 02/06/2017, Cost $2,594,703) (1) | 2,595,000 | 2,600,468 | ||||||
DT Auto Owner Trust 2017-2 | ||||||||
1.72%, 05/15/2020 (Acquired 05/09/2017, Cost $6,739,743) (1) | 6,739,777 | 6,740,015 | ||||||
ECAF I Ltd. | ||||||||
3.47%, 06/15/2040 (Acquired 06/15/2015, Cost $1,389,723) (1)(6)(8) | 1,407,901 | 1,387,249 | ||||||
Emerald Aviation Finance Ltd. | ||||||||
4.65%, 10/15/2038 (Acquired 04/12/2017, Cost $643,543) (1) | 628,947 | 644,117 | ||||||
Enterprise Fleet Financing LLC | ||||||||
2.09%, 02/20/2021 (Acquired 07/22/2015 through 06/08/2016, Cost $1,538,512) (1) | 1,535,000 | 1,538,822 | ||||||
2.08%, 09/20/2021 (Acquired 02/09/2016, Cost $509,956) (1) | 510,000 | 509,107 | ||||||
2.04%, 02/22/2022 (Acquired 07/12/2016, Cost $2,184,605) (1) | 2,185,000 | 2,175,847 | ||||||
2.13%, 07/20/2022 (Acquired 01/24/2017, Cost $329,992) (1) | 330,000 | 330,548 | ||||||
1.97%, 01/20/2023 (Acquired 06/20/2017, Cost $874,956) (1)(8) | 875,000 | 874,955 | ||||||
Fieldstone Mortgage Investment Trust Series 2006-3 | ||||||||
1.16%, 11/25/2036 | 12,102,081 | 10,653,478 | ||||||
First Investors Auto Owner Trust 2015-2 | ||||||||
4.22%, 12/15/2021 (Acquired 08/18/2015, Cost $269,991) (1) | 270,000 | 276,283 | ||||||
First Investors Auto Owner Trust 2016-2 | ||||||||
3.35%, 11/15/2022 (Acquired 09/12/2016, Cost $849,997) (1) | 850,000 | 849,116 | ||||||
First NLC Trust 2005-2 | ||||||||
1.70%, 09/25/2035 | 2,895,849 | 2,883,317 | ||||||
Five Guys Holdings, Inc. | ||||||||
4.60%, 07/25/2047 (Acquired 05/24/2017, Cost $690,000) (1) | 690,000 | 693,749 | ||||||
Flagship Credit Auto Trust 2014-1 | ||||||||
3.34%, 04/15/2020 (Acquired 09/01/2015, Cost $99,931) (1) | 100,000 | 100,322 | ||||||
Flagship Credit Auto Trust 2016-3 | ||||||||
3.89%, 11/15/2022 (Acquired 08/02/2016, Cost $809,832) (1) | 810,000 | 817,906 | ||||||
Flagship Credit Auto Trust 2017-1 | ||||||||
| Principal | ||||||||
| Amount | Value | |||||||
4.23%, 05/15/2023 (Acquired 01/26/2017, Cost $259,986) (1) | 260,000 | 264,817 | ||||||
Flatiron CLO 2014-1 Ltd. | ||||||||
2.34%, 07/17/2026 (Acquired 02/08/2017, Cost $1,660,000) (1) | 1,660,000 | 1,663,506 | ||||||
Ford Credit Auto Lease Trust 2017-A | ||||||||
1.88%, 04/15/2020 | 1,005,000 | 1,006,081 | ||||||
Ford Credit Auto Owner Trust 2014-A | ||||||||
1.90%, 09/15/2019 | 1,100,000 | 1,102,401 | ||||||
Ford Credit Auto Owner Trust 2014-B | ||||||||
0.90%, 10/15/2018 | 146,739 | 146,696 | ||||||
Ford Credit Auto Owner Trust 2014-C | ||||||||
1.06%, 05/15/2019 | 161,251 | 161,076 | ||||||
Ford Credit Auto Owner Trust 2015-A | ||||||||
1.28%, 09/15/2019 | 15,708 | 15,697 | ||||||
Ford Credit Auto Owner Trust 2015-B | ||||||||
1.16%, 11/15/2019 | 18,796 | 18,770 | ||||||
Ford Credit Auto Owner Trust 2015-C | ||||||||
1.41%, 02/15/2020 | 1,893,334 | 1,892,542 | ||||||
Ford Credit Auto Owner Trust 2016-B | ||||||||
1.33%, 10/15/2020 | 1,495,000 | 1,489,963 | ||||||
Ford Credit Auto Owner Trust 2016-C | ||||||||
1.73%, 03/15/2022 | 555,000 | 547,603 | ||||||
1.93%, 04/15/2023 | 370,000 | 366,409 | ||||||
Ford Credit Auto Owner Trust 2016-REV2 | ||||||||
2.03%, 12/15/2027 (Acquired 06/20/2016 through 08/23/2016, Cost $4,567,300) (1) | 4,565,000 | 4,531,280 | ||||||
Ford Credit Auto Owner Trust 2017-B | ||||||||
1.69%, 11/15/2021 | 4,070,000 | 4,063,991 | ||||||
Ford Credit Floorplan Master Owner Trust A | ||||||||
1.55%, 07/15/2021 | 2,660,000 | 2,646,992 | ||||||
2.16%, 11/15/2021 | 385,000 | 384,854 | ||||||
2.09%, 03/15/2022 (Acquired 07/28/2016, Cost $2,278,133) (1) | 2,255,000 | 2,263,550 | ||||||
GCAT 2017-2 LLC | ||||||||
3.50%, 04/25/2047 (Acquired 04/19/2017, Cost $1,116,913) (1) | 1,119,025 | 1,114,392 | ||||||
GCAT 2017-4 LLC | ||||||||
3.23%, 05/25/2022 (Acquired 06/06/2017, Cost $148,681) (1) | 148,681 | 148,383 | ||||||
GCAT 2017-5 LLC | ||||||||
3.23%, 07/25/2047 (Acquired 06/23/2017, Cost $780,000) (1) | 780,000 | 779,359 | ||||||
GM Financial Automobile Leasing Trust 2016-2 | ||||||||
| Principal | ||||||||
| Amount | Value | |||||||
1.76%, 03/20/2020 | 995,000 | 993,927 | ||||||
2.08%, 03/20/2020 | 570,000 | 567,897 | ||||||
2.58%, 03/20/2020 | 350,000 | 349,843 | ||||||
GM Financial Automobile Leasing Trust 2017-1 | ||||||||
2.06%, 05/20/2020 | 940,000 | 943,089 | ||||||
GM Financial Consumer Automobile 2017-1 | ||||||||
1.78%, 10/18/2021 (Acquired 04/03/2017, Cost $409,943) (1) | 410,000 | 409,818 | ||||||
2.30%, 06/16/2023 (Acquired 04/03/2017, Cost $99,981) (1) | 100,000 | 100,156 | ||||||
2.45%, 07/17/2023 (Acquired 04/03/2017, Cost $99,986) (1) | 100,000 | 100,160 | ||||||
GMF Floorplan Owner Revolving Trust | ||||||||
1.96%, 05/17/2021 (Acquired 05/24/2016, Cost $2,034,756) (1) | 2,035,000 | 2,038,342 | ||||||
2.41%, 05/17/2021 (Acquired 05/24/2016, Cost $144,993) (1) | 145,000 | 145,874 | ||||||
2.85%, 05/17/2021 (Acquired 05/24/2016, Cost $99,986) (1) | 100,000 | 100,074 | ||||||
2.22%, 01/18/2022 (Acquired 01/24/2017, Cost $1,499,796) (1) | 1,500,000 | 1,505,931 | ||||||
2.58%, 01/18/2022 (Acquired 01/24/2017, Cost $669,967) (1) | 670,000 | 674,660 | ||||||
GreatAmerica Leasing Receivables Funding LLC Series 2017-1 | ||||||||
1.72%, 04/22/2019 (Acquired 02/07/2017, Cost $159,987) (1) | 160,000 | 159,910 | ||||||
2.06%, 06/22/2020 (Acquired 02/07/2017, Cost $150,000) (1) | 150,000 | 150,182 | ||||||
Hilton Grand Vacations Trust 2017-A | ||||||||
2.66%, 12/26/2028 (Acquired 02/22/2017, Cost $402,525) (1) | 402,579 | 402,735 | ||||||
2.96%, 12/26/2028 (Acquired 02/22/2017, Cost $182,982) (1) | 182,991 | 183,709 | ||||||
HLA 2014-3A AR MTGE | ||||||||
0.00%, 10/22/2025 (8) | 1,585,000 | 1,585,000 | ||||||
HOA Funding LLC | ||||||||
4.85%, 08/20/2044 (Acquired 07/15/2015 through 12/09/2015, Cost $620,108) (1) | 642,600 | 607,758 | ||||||
Holland Park CLO 1 Ltd. | ||||||||
0.60%, 05/14/2027 (Acquired 05/05/2017, Cost $7,918,527) (1)* | EUR 7,200,000 | 8,215,265 | ||||||
Home Equity Asset Trust 2006-3 | ||||||||
1.42%, 07/25/2036 | $ | 7,659,628 | 7,594,393 | |||||
Home Partners of America 2016-1 Trust | ||||||||
4.51%, 03/17/2033 (Acquired 01/22/2016, Cost $679,308) (1) | 705,000 | 724,641 | ||||||
Honda Auto Receivables 2014-2 Owner Trust | ||||||||
1.18%, 05/18/2020 | 725,000 | 724,820 | ||||||
Honda Auto Receivables 2015-1 Owner Trust | ||||||||
1.05%, 10/15/2018 | 34,121 | 34,090 | ||||||
Honda Auto Receivables 2015-2 Owner Trust | ||||||||
1.04%, 02/21/2019 | 44,614 | 44,552 | ||||||
| Principal | ||||||||
| Amount | Value | |||||||
Honda Auto Receivables 2015-3 Owner Trust | ||||||||
1.27%, 04/18/2019 | 1,483,633 | 1,482,528 | ||||||
Honda Auto Receivables 2015-4 Owner Trust | ||||||||
1.23%, 09/23/2019 | 2,105,000 | 2,100,437 | ||||||
Honda Auto Receivables 2016-3 Owner Trust | ||||||||
1.16%, 05/18/2020 | 1,085,000 | 1,078,927 | ||||||
Honda Auto Receivables 2016-4 Owner Trust | ||||||||
1.36%, 01/18/2023 | 610,000 | 603,790 | ||||||
Honda Auto Receivables 2017-2 Owner Trust | ||||||||
1.68%, 08/16/2021 | 2,730,000 | 2,725,919 | ||||||
HSI Asset Securitization Corp. Trust 2006-OPT1 | ||||||||
1.44%, 12/25/2035 | 1,433,147 | 1,427,687 | ||||||
Hyundai Auto Lease Securitization Trust 2015-B | ||||||||
1.66%, 07/15/2019 (Acquired 07/15/2015 through 07/29/2015, Cost $1,675,491) (1) | 1,675,000 | 1,675,839 | ||||||
Hyundai Auto Lease Securitization Trust 2016-B | ||||||||
1.52%, 10/15/2019 (Acquired 05/17/2016, Cost $449,986) (1) | 450,000 | 449,739 | ||||||
1.68%, 04/15/2020 (Acquired 05/17/2016, Cost $139,991) (1) | 140,000 | 139,897 | ||||||
Hyundai Auto Lease Securitization Trust 2016-C | ||||||||
1.49%, 02/18/2020 (Acquired 08/09/2016, Cost $1,364,919) (1) | 1,365,000 | 1,362,141 | ||||||
Hyundai Auto Lease Securitization Trust 2017-A | ||||||||
1.88%, 08/17/2020 (Acquired 01/10/2017, Cost $1,139,978) (1) | 1,140,000 | 1,140,911 | ||||||
Hyundai Auto Lease Securitization Trust 2017-B | ||||||||
1.97%, 07/15/2020 (Acquired 05/24/2017, Cost $2,464,572) (1) | 2,465,000 | 2,467,583 | ||||||
Jimmy Johns Funding LLC | ||||||||
3.61%, 07/30/2047 (Acquired 06/27/2017, Cost $405,000) (1) | 405,000 | 405,000 | ||||||
John Deere Owner Trust 2015-B | ||||||||
1.44%, 10/15/2019 | 295,378 | 295,281 | ||||||
John Deere Owner Trust 2016-B | ||||||||
1.25%, 06/15/2020 | 940,000 | 935,824 | ||||||
Kubota Credit Owner Trust 2014-1 | ||||||||
1.16%, 05/15/2018 (Acquired 07/15/2015, Cost $15,097) (1) | 15,099 | 15,098 | ||||||
Kubota Credit Owner Trust 2015-1 | ||||||||
1.79%, 08/16/2021 (Acquired 11/12/2015, Cost $497,657) (1) | 500,000 | 500,699 | ||||||
Kubota Credit Owner Trust 2016-1 | ||||||||
1.50%, 07/15/2020 (Acquired 07/26/2016, Cost $1,104,851) (1) | 1,105,000 | 1,098,084 | ||||||
Madison Park Funding XIV Ltd. | ||||||||
2.28%, 07/20/2026 (Acquired 04/13/2017, Cost $2,510,000) (1) | 2,510,000 | 2,508,732 | ||||||
| Principal | ||||||||
| Amount | Value | |||||||
Magnetite XII Ltd. | ||||||||
2.49%, 04/15/2027 (Acquired 11/17/2016, Cost $4,385,000) (1) | 4,385,000 | 4,406,035 | ||||||
Mercedes-Benz Auto Lease Trust 2016-B | ||||||||
1.35%, 08/15/2019 | 740,000 | 738,117 | ||||||
Merlin Aviation Holdings DAC | ||||||||
4.50%, 12/15/2032 (Acquired 06/01/2017, Cost $1,455,791) (1) | 1,509,615 | 1,524,712 | ||||||
Merrill Lynch First Franklin Mortgage Loan Trust Series 2007-2 | ||||||||
1.46%, 05/25/2037 | 3,401,198 | 2,114,391 | ||||||
MMAF Equipment Finance LLC 2016-A | ||||||||
1.76%, 01/17/2023 (Acquired 05/03/2016, Cost $279,976) (1) | 280,000 | 277,584 | ||||||
MMAF Equipment Finance LLC 2017-A | ||||||||
1.73%, 05/18/2020 (Acquired 04/25/2017, Cost $254,981) (1) | 255,000 | 254,972 | ||||||
2.04%, 02/16/2022 (Acquired 04/25/2017, Cost $424,982) (1) | 425,000 | 425,369 | ||||||
Munda CLO 1 BV | ||||||||
0.61%, 12/05/2024 (Acquired 05/12/2017, Cost $21,703,208) (1)* | EUR 20,000,000 | 21,464,079 | ||||||
MVW Owner Trust 2015-1 | ||||||||
2.52%, 12/20/2032 (Acquired 08/04/2015, Cost $1,142,450) (1) | $ | 1,142,518 | 1,136,922 | |||||
National Collegiate Student Loan Trust 2005-2 | ||||||||
1.49%, 09/25/2029 | 12,283,690 | 12,197,686 | ||||||
National Collegiate Student Loan Trust 2006-3 | ||||||||
1.49%, 03/25/2029 | 15,179,081 | 15,037,741 | ||||||
National Collegiate Student Loan Trust 2006-4 | ||||||||
1.48%, 02/25/2029 | 15,041,753 | 14,929,571 | ||||||
National Collegiate Student Loan Trust 2007-1 | ||||||||
1.46%, 07/25/2030 | 15,229,079 | 15,060,001 | ||||||
Nationstar HECM Loan Trust 2016-1 | ||||||||
2.98%, 02/25/2026 (Acquired 02/25/2016, Cost $84,009) (1) | 84,009 | 84,034 | ||||||
Nationstar HECM Loan Trust 2016-3 | ||||||||
2.01%, 08/25/2026 (Acquired 08/11/2016, Cost $150,883) (1) | 150,883 | 150,560 | ||||||
Navient Student Loan Trust 2014-2 | ||||||||
1.86%, 03/25/2043 | 1,006,626 | 990,544 | ||||||
Navient Student Loan Trust 2014-3 | ||||||||
1.84%, 03/25/2043 | 376,073 | 371,373 | ||||||
Navient Student Loan Trust 2015-1 | ||||||||
1.82%, 04/25/2040 | 5,620,000 | 5,597,010 | ||||||
Navient Student Loan Trust 2016-1 | ||||||||
1.92%, 02/25/2070 (Acquired 10/03/2016, Cost $3,946,755) (1) | 4,052,778 | 4,003,405 | ||||||
| Principal | ||||||||
| Amount | Value | |||||||
Navient Student Loan Trust 2016-2 | ||||||||
2.72%, 06/25/2065 (Acquired 04/05/2016 through 09/28/2016, Cost $6,314,617) (1) | 6,200,000 | 6,390,254 | ||||||
Navient Student Loan Trust 2016-3 | ||||||||
2.07%, 06/25/2065 (Acquired 06/07/2016, Cost $2,300,000) (1) | 2,300,000 | 2,328,032 | ||||||
Navient Student Loan Trust 2017-1 | ||||||||
2.37%, 07/26/2066 (Acquired 02/08/2017, Cost $4,730,000) (1) | 4,730,000 | 4,789,072 | ||||||
Navient Student Loan Trust 2017-3 | ||||||||
2.27%, 07/26/2066 (Acquired 04/10/2017, Cost $5,000,000) (1) | 5,000,000 | 5,052,772 | ||||||
Nelnet Student Loan Trust 2007-1 | ||||||||
1.26%, 05/25/2025 | 4,150,000 | 4,073,556 | ||||||
Nelnet Student Loan Trust 2008-3 | ||||||||
2.84%, 11/25/2024 | 2,241,637 | 2,290,771 | ||||||
Nelnet Student Loan Trust 2013-1 | ||||||||
1.82%, 06/25/2041 (Acquired 06/26/2017, Cost $5,582,135) (1) | 5,597,411 | 5,582,105 | ||||||
Nelnet Student Loan Trust 2014-2 | ||||||||
1.87%, 07/27/2037 (Acquired 01/27/2016, Cost $3,946,470) (1) | 4,250,000 | 4,130,891 | ||||||
Nelnet Student Loan Trust 2015-2 | ||||||||
1.82%, 09/25/2042 (Acquired 06/16/2016 through 10/04/2016, Cost $3,173,187) (1) | 3,259,542 | 3,219,499 | ||||||
Nelnet Student Loan Trust 2015-3 | ||||||||
1.82%, 02/26/2046 (Acquired 03/02/2017, Cost $4,893,615) (1) | 4,905,085 | 4,915,131 | ||||||
Neuberger Berman CLO XIX Ltd. | ||||||||
0.00%, 07/15/2027 (Acquired 06/26/2017, Cost $500,000) (1) | 500,000 | 500,000 | ||||||
New Century Home Equity Loan Trust 2005-1 | ||||||||
1.89%, 03/25/2035 | 6,000,000 | 5,692,338 | ||||||
New Century Home Equity Loan Trust 2005-3 | ||||||||
1.71%, 07/25/2035 | 1,344,457 | 1,342,194 | ||||||
1.73%, 07/25/2035 | 6,570,000 | 6,377,539 | ||||||
Nissan Auto Lease Trust 2017-A | ||||||||
1.91%, 04/15/2020 | 1,760,000 | 1,757,650 | ||||||
Nissan Auto Receivables 2015-A Owner Trust | ||||||||
1.05%, 10/15/2019 | 13,309 | 13,287 | ||||||
Nissan Auto Receivables 2015-B Owner Trust | ||||||||
1.34%, 03/16/2020 | 3,220,000 | 3,215,614 | ||||||
Nissan Auto Receivables 2015-C Owner Trust | ||||||||
1.37%, 05/15/2020 | 95,000 | 94,836 | ||||||
Nissan Auto Receivables 2016-B Owner Trust | ||||||||
1.05%, 04/15/2019 | 41,133 | 41,085 | ||||||
| Principal | ||||||||
| Amount | Value | |||||||
Nissan Auto Receivables 2016-C Owner Trust | ||||||||
1.18%, 01/15/2021 | 730,000 | 724,735 | ||||||
Nissan Master Owner Trust Receivables | ||||||||
1.54%, 06/15/2021 | 1,465,000 | 1,456,888 | ||||||
1.59%, 04/18/2022 | 4,520,000 | 4,531,265 | ||||||
Nomura Home Equity Loan, Inc. Home Equity Loan Trust Series 2006-HE1 | ||||||||
1.63%, 02/25/2036 | 7,898,690 | 7,889,987 | ||||||
NovaStar Mortgage Funding Trust Series 2005-2 | ||||||||
1.86%, 10/25/2035 | 1,281,209 | 1,280,369 | ||||||
NYMT Residential 2016-RP1 | ||||||||
4.00%, 03/25/2021 (Acquired 04/04/2016, Cost $126,625) (1) | 126,988 | 126,036 | ||||||
Octagon Investment Partners XVII Ltd. | ||||||||
2.10%, 10/27/2025 (Acquired 05/15/2017, Cost $2,700,000) (1) | 2,700,000 | 2,701,652 | ||||||
OneMain Financial Issuance Trust 2015-2 | ||||||||
2.57%, 07/18/2025 (Acquired 07/23/2015, Cost $1,229,025) (1) | 1,228,420 | 1,229,824 | ||||||
3.10%, 07/18/2025 (Acquired 06/06/2016, Cost $1,258,796) (1) | 1,280,000 | 1,276,942 | ||||||
OneMain Financial Issuance Trust 2015-3 | ||||||||
4.16%, 11/18/2028 (Acquired 09/24/2015, Cost $709,881) (1) | 710,000 | 686,743 | ||||||
OneMain Financial Issuance Trust 2016-1 | ||||||||
4.57%, 02/20/2029 (Acquired 02/03/2016, Cost $1,124,841) (1) | 1,125,000 | 1,163,932 | ||||||
OneMain Financial Issuance Trust 2016-2 | ||||||||
5.94%, 03/20/2028 (Acquired 03/16/2016, Cost $1,439,752) (1) | 1,440,000 | 1,505,440 | ||||||
Option One Mortgage Loan Trust 2005-2 | ||||||||
1.88%, 05/25/2035 | 1,084,073 | 1,084,183 | ||||||
Option One Mortgage Loan Trust 2005-3 | ||||||||
1.69%, 08/25/2035 | 1,906,424 | 1,905,737 | ||||||
Option One Mortgage Loan Trust 2005-4 Asset-Backed Certificates Series 2005-4 | ||||||||
1.66%, 11/25/2035 | 6,479,129 | 6,423,834 | ||||||
OSAT 2016-NPL1 Trust | ||||||||
3.75%, 07/25/2056 (Acquired 10/21/2016, Cost $2,932,662) (1) | 2,932,662 | 2,950,883 | ||||||
OSCAR US Funding Trust V | ||||||||
2.73%, 12/15/2020 (Acquired 09/14/2016, Cost $639,961) (1) | 640,000 | 640,448 | ||||||
2.99%, 12/15/2023 (Acquired 09/14/2016, Cost $539,882) (1) | 540,000 | 537,953 | ||||||
OZLM VIII Ltd. | ||||||||
2.60%, 10/17/2026 (Acquired 05/16/2017, Cost $1,445,000) (1) | 1,445,000 | 1,444,997 | ||||||
3.31%, 10/17/2026 (Acquired 05/16/2017, Cost $1,100,000) (1) | 1,100,000 | 1,099,997 | ||||||
Penta CLO 1 SA | ||||||||
| Principal | ||||||||
| Amount | Value | |||||||
1.10%, 06/04/2024 (Acquired 05/15/2017, Cost $2,183,913) (1)* | EUR 2,000,000 | 2,235,829 | ||||||
People’s Choice Home Loan Securities Trust Series 2005-3 | ||||||||
2.07%, 08/25/2035 | $ | 1,245,000 | 1,013,661 | |||||
Progress Residential 2015-SFR3 Trust | ||||||||
4.67%, 11/15/2032 (Acquired 10/23/2015, Cost $504,985) (1) | 505,000 | 522,813 | ||||||
RAMP Series 2005-RS5 Trust | ||||||||
1.66%, 05/25/2035 | 191,274 | 191,125 | ||||||
RASC Series 2005-KS10 Trust | ||||||||
1.66%, 11/25/2035 | 8,930,000 | 8,877,201 | ||||||
Santander Drive Auto Receivables Trust 2013-2 | ||||||||
2.98%, 04/15/2020 (Acquired 06/17/2016, Cost $5,020,259) (1) | 5,000,000 | 5,021,042 | ||||||
Santander Drive Auto Receivables Trust 2013-5 | ||||||||
3.73%, 03/15/2021 (Acquired 03/02/2017, Cost $1,382,708) (1) | 1,362,000 | 1,382,613 | ||||||
Santander Drive Auto Receivables Trust 2014-3 | ||||||||
2.65%, 08/17/2020 | 245,000 | 246,589 | ||||||
3.49%, 09/15/2021 (Acquired 04/12/2017, Cost $997,200) (1) | 985,000 | 991,414 | ||||||
Santander Drive Auto Receivables Trust 2015-4 | ||||||||
3.53%, 08/16/2021 | 937,000 | 955,693 | ||||||
Santander Drive Auto Receivables Trust 2015-5 | ||||||||
3.65%, 12/15/2021 | 275,000 | 281,067 | ||||||
Santander Drive Auto Receivables Trust 2016-3 | ||||||||
2.46%, 03/15/2022 | 155,000 | 155,192 | ||||||
Santander Drive Auto Receivables Trust 2017-1 | ||||||||
1.49%, 02/18/2020 | 700,000 | 699,485 | ||||||
2.10%, 06/15/2021 | 260,000 | 259,795 | ||||||
2.58%, 05/16/2022 | 305,000 | 304,958 | ||||||
Shenton Aircraft Investment I Ltd. | ||||||||
4.75%, 10/15/2042 (Acquired 10/09/2015 through 06/08/2016, Cost $830,095) (1) | 839,305 | 858,647 | ||||||
Sierra Timeshare 2015-2 Receivables Funding LLC | ||||||||
2.43%, 06/20/2032 (Acquired 07/15/2015 through 07/29/2015, Cost $545,392) (1) | 546,456 | 545,853 | ||||||
Sierra Timeshare 2016-2 Receivables Funding LLC | ||||||||
2.33%, 07/20/2033 (Acquired 07/11/2016, Cost $569,825) (1) | 569,929 | 569,633 | ||||||
SLC Student Loan Trust 2005-2 | ||||||||
1.41%, 12/15/2039 | 4,900,000 | 4,595,632 | ||||||
SLC Student Loan Trust 2005-3 | ||||||||
1.40%, 12/15/2039 | 5,000,000 | 4,635,379 | ||||||
SLM Private Credit Student Loan Trust 2003-B | ||||||||
| Principal | ||||||||
| Amount | Value | |||||||
3.28%, 03/15/2033 (8) | 4,350,000 | 4,350,000 | ||||||
SLM Student Loan Trust | ||||||||
1.71%, 04/27/2026 (Acquired 07/19/2016, Cost $3,295,745) (1) | 3,317,368 | 3,326,420 | ||||||
SLM Student Loan Trust 2003-10 | ||||||||
1.60%, 12/15/2027 (Acquired 03/07/2017, Cost $5,980,413) (1) | 5,980,413 | 5,977,902 | ||||||
SLM Student Loan Trust 2004-10 | ||||||||
1.71%, 04/27/2026 (Acquired 12/04/2015, Cost $2,578,292) (1) | 2,617,675 | 2,625,080 | ||||||
SLM Student Loan Trust 2006-2 | ||||||||
1.33%, 01/25/2041 | 4,340,000 | 4,162,290 | ||||||
SLM Student Loan Trust 2007-3 | ||||||||
1.22%, 01/25/2022 | 4,150,000 | 3,998,502 | ||||||
SLM Student Loan Trust 2007-6 | ||||||||
1.54%, 10/25/2024 | 3,389,703 | 3,381,420 | ||||||
SLM Student Loan Trust 2008-2 | ||||||||
1.91%, 04/25/2023 | 5,543,083 | 5,517,002 | ||||||
SLM Student Loan Trust 2008-4 | ||||||||
2.81%, 07/25/2022 | 1,366,131 | 1,399,847 | ||||||
SLM Student Loan Trust 2008-5 | ||||||||
2.86%, 07/25/2023 | 12,311,399 | 12,646,006 | ||||||
SLM Student Loan Trust 2008-9 | ||||||||
2.66%, 04/25/2023 | 1,337,051 | 1,365,511 | ||||||
SLM Student Loan Trust 2009-3 | ||||||||
1.97%, 01/25/2045 (Acquired 06/13/2016, Cost $2,667,778) (1) | 2,772,901 | 2,746,107 | ||||||
SLM Student Loan Trust 2012-3 | ||||||||
1.87%, 12/26/2025 | 1,496,708 | 1,502,835 | ||||||
SLM Student Loan Trust 2012-7 | ||||||||
3.02%, 09/25/2043 | 2,220,000 | 2,151,753 | ||||||
SLM Student Loan Trust 2013-2 | ||||||||
1.67%, 09/25/2026 | 2,877,484 | 2,867,621 | ||||||
SLM Student Loan Trust 2014-1 | ||||||||
1.82%, 02/26/2029 | 4,300,000 | 4,270,035 | ||||||
SMART ABS Series 2016-2US Trust | ||||||||
1.71%, 03/15/2021 | 3,075,000 | 3,037,380 | ||||||
2.05%, 12/14/2022 | 2,370,000 | 2,336,671 | ||||||
SMB Private Education Loan Trust 2014-A | ||||||||
3.05%, 05/15/2026 (Acquired 07/26/2016, Cost $744,811) (1) | 729,036 | 741,318 | ||||||
SMB Private Education Loan Trust 2015-B | ||||||||
| Principal | ||||||||
| Amount | Value | |||||||
2.98%, 07/15/2027 (Acquired 07/23/2015, Cost $358,848) (1) | 360,000 | 368,304 | ||||||
SMB Private Education Loan Trust 2015-C | ||||||||
2.75%, 07/15/2027 (Acquired 10/21/2015, Cost $609,934) (1) | 610,000 | 617,160 | ||||||
SMB Private Education Loan Trust 2016-A | ||||||||
2.70%, 05/15/2031 (Acquired 05/18/2016 through 06/23/2016, Cost $526,498) (1) | 525,000 | 527,047 | ||||||
SMB Private Education Loan Trust 2016-B | ||||||||
2.43%, 02/17/2032 (Acquired 07/13/2016 through 09/19/2016, Cost $2,864,242) (1) | 2,850,000 | 2,825,099 | ||||||
SMB Private Education Loan Trust 2016-C | ||||||||
2.34%, 09/15/2034 (Acquired 10/05/2016, Cost $784,638) (1) | 785,000 | 773,377 | ||||||
SoFi Consumer Loan Program 2017-3 LLC | ||||||||
2.77%, 05/26/2026 (Acquired 05/11/2017, Cost $14,038,889) (1) | 14,038,892 | 14,111,002 | ||||||
SoFi Consumer Loan Program 2017-4 LLC | ||||||||
2.50%, 05/26/2026 (Acquired 06/27/2017, Cost $15,897,122) (1) | 15,900,000 | 15,897,122 | ||||||
SoFi Professional Loan Program 2015-B LLC | ||||||||
3.52%, 03/25/2036 (Acquired 07/23/2015, Cost $927,755) (1) | 930,169 | 940,775 | ||||||
SoFi Professional Loan Program 2015-C LLC | ||||||||
3.58%, 08/25/2036 (Acquired 07/29/2015 through 12/01/2015, Cost $976,175) (1) | 981,182 | 985,444 | ||||||
SoFi Professional Loan Program 2015-d LLC | ||||||||
3.59%, 10/26/2037 (Acquired 11/13/2015 through 08/04/2016, Cost $1,931,334) (1) | 1,917,428 | 1,933,801 | ||||||
SoFi Professional Loan Program 2016-B LLC | ||||||||
3.80%, 04/25/2037 (Acquired 05/20/2016, Cost $194,906) (1) | 195,000 | 198,861 | ||||||
SoFi Professional Loan Program 2016-C LLC | ||||||||
3.35%, 05/25/2037 (Acquired 07/20/2016, Cost $309,860) (1) | 310,000 | 306,936 | ||||||
SoFi Professional Loan Program 2016-D LLC | ||||||||
3.23%, 01/25/2039 (Acquired 09/13/2016, Cost $489,989) (1) | 490,000 | 479,571 | ||||||
SoFi Professional Loan Program 2016-E LLC | ||||||||
3.44%, 07/25/2040 (Acquired 11/16/2016, Cost $1,571,202) (1) | 1,600,000 | 1,597,913 | ||||||
SoFi Professional Loan Program 2017-A LLC | ||||||||
4.43%, 03/26/2040 (Acquired 02/02/2017, Cost $164,138) (1) | 165,000 | 166,584 | ||||||
SoFi Professional Loan Program 2017-C LLC | ||||||||
1.62%, 07/25/2040 (Acquired 05/19/2017, Cost $11,900,000) (1) | 11,900,000 | 11,910,981 | ||||||
SpringCastle America Funding LLC | ||||||||
3.05%, 11/25/2023 (Acquired 09/16/2016 through 06/23/2017, Cost $4,471,761) (1) | 4,452,747 | 4,478,996 | ||||||
Springleaf Funding Trust 2016-A | ||||||||
2.90%, 11/15/2029 (Acquired 12/07/2016, Cost $844,878) (1) | 845,000 | 849,080 | ||||||
Springleaf Funding Trust 2017-A | ||||||||
2.68%, 07/15/2030 (Acquired 06/21/2017, Cost $7,897,602) (1) | 7,900,000 | 7,882,762 | ||||||
| Principal | ||||||||
| Amount | Value | |||||||
3.86%, 07/15/2030 (Acquired 06/21/2017, Cost $1,104,726) (1)(8) | 1,105,000 | 1,100,260 | ||||||
Structured Asset Investment Loan Trust 2006-BNC2 | ||||||||
1.38%, 05/25/2036 | 1,106,626 | 1,015,024 | ||||||
Structured Asset Securities Corp. Mortgage Loan Trust 2006-EQ1 | ||||||||
1.53%, 07/25/2036 (Acquired 08/18/2016, Cost $1,399,804) (1) | 1,655,000 | 1,403,585 | ||||||
Synchrony Credit Card Master Note Trust | ||||||||
1.69%, 03/15/2021 | 1,675,000 | 1,672,554 | ||||||
2.21%, 09/15/2022 | 1,700,000 | 1,698,065 | ||||||
Synchrony Credit Card Master Note Trust 2015-1 | ||||||||
2.37%, 03/15/2023 | 2,215,000 | 2,236,969 | ||||||
2.64%, 03/15/2023 | 1,085,000 | 1,092,464 | ||||||
Synchrony Credit Card Master Note Trust 2015-3 | ||||||||
1.94%, 09/15/2021 | 1,315,000 | 1,314,377 | ||||||
Synchrony Credit Card Master Note Trust 2015-4 | ||||||||
2.62%, 09/15/2023 | 650,000 | 653,036 | ||||||
Taco Bell Funding LLC | ||||||||
3.83%, 05/25/2046 (Acquired 05/04/2016, Cost $1,189,015) (1) | 1,189,015 | 1,215,542 | ||||||
THL Credit Wind River 2014-3 CLO Ltd. | ||||||||
2.22%, 01/22/2027 (Acquired 05/22/2017, Cost $6,290,000) (1) | 6,290,000 | 6,293,705 | ||||||
Tidewater Sales Finance Master Trust Series 2017-A | ||||||||
4.55%, 05/15/2021 (Acquired 05/05/2017, Cost $2,054,793) (1)(6)(8) | 2,055,000 | 2,055,469 | ||||||
Towd Point Mortgage Trust 2016-4 | ||||||||
3.25%, 07/25/2056 (Acquired 05/26/2017, Cost $902,867) (1) | 910,000 | 907,028 | ||||||
Towd Point Mortgage Trust 2017-1 | ||||||||
2.75%, 10/25/2056 (Acquired 02/07/2017, Cost $762,718) (1) | 761,741 | 767,564 | ||||||
Towd Point Mortgage Trust 2017-2 | ||||||||
2.75%, 04/25/2057 (Acquired 05/05/2017, Cost $375,196) (1) | 373,919 | 377,473 | ||||||
Toyota Auto Receivables 2015-A Owner Trust | ||||||||
1.12%, 02/15/2019 | 21,748 | 21,726 | ||||||
Toyota Auto Receivables 2015-B Owner Trust | ||||||||
1.27%, 05/15/2019 | 852,000 | 851,374 | ||||||
Verizon Owner Trust 2016-2 | ||||||||
1.68%, 05/20/2021 (Acquired 11/16/2016, Cost $2,304,810) (1) | 2,305,000 | 2,298,765 | ||||||
2.15%, 05/20/2021 (Acquired 11/16/2016, Cost $1,564,708) (1) | 1,565,000 | 1,565,025 | ||||||
2.36%, 05/20/2021 (Acquired 11/16/2016, Cost $1,244,985) (1) | 1,245,000 | 1,244,933 | ||||||
Verizon Owner Trust 2017-1 | ||||||||
2.06%, 09/20/2021 (Acquired 03/07/2017, Cost $1,864,678) (1) | 1,865,000 | 1,871,772 | ||||||
| Principal | ||||||||
| Amount | Value | |||||||
2.45%, 09/20/2021 (Acquired 03/07/2017, Cost $539,925) (1) | 540,000 | 543,875 | ||||||
2.65%, 09/20/2021 (Acquired 03/07/2017, Cost $724,902) (1) | 725,000 | 729,793 | ||||||
Verizon Owner Trust 2017-2 | ||||||||
2.22%, 12/20/2021 (Acquired 06/30/2017, Cost $734,483) | 735,000 | 734,807 | ||||||
VOLT LI LLC | ||||||||
3.50%, 10/25/2046 (Acquired 10/27/2016, Cost $1,805,092) (1) | 1,805,092 | 1,806,661 | ||||||
VOLT LIV LLC | ||||||||
3.50%, 02/25/2047 (Acquired 02/23/2017, Cost $969,295) (1) | 969,295 | 969,966 | ||||||
VOLT LIX LLC | ||||||||
3.25%, 05/28/2047 (Acquired 05/25/2017, Cost $14,777,735) (1) | 14,777,735 | 14,796,250 | ||||||
VOLT LV LLC | ||||||||
3.50%, 03/25/2047 (Acquired 03/17/2017, Cost $739,392) (1) | 739,392 | 740,634 | ||||||
VOLT LVI LLC | ||||||||
3.50%, 03/25/2047 (Acquired 04/04/2017, Cost $1,352,742) (1) | 1,352,742 | 1,357,033 | ||||||
VOLT LVIII LLC | ||||||||
3.38%, 05/28/2047 (Acquired 05/11/2017, Cost $27,945,674) (1) | 27,945,674 | 27,935,525 | ||||||
VOLT LX LLC | ||||||||
3.25%, 06/25/2047 (Acquired 06/09/2017, Cost $15,600,000) (1) | 15,600,000 | 15,586,316 | ||||||
VOLT LXI LLC | ||||||||
3.13%, 06/25/2047 (Acquired 06/27/2017, Cost $16,755,000) (1)(8) | 16,755,000 | 16,755,000 | ||||||
VOLT XXII LLC | ||||||||
3.50%, 02/25/2055 (Acquired 10/30/2015, Cost $72,132) (1) | 72,410 | 72,665 | ||||||
4.25%, 02/25/2055 (Acquired 03/09/2017, Cost $317,706) (1) | 319,014 | 319,096 | ||||||
VOLT XXIV LLC | ||||||||
3.50%, 02/25/2055 (Acquired 06/05/2017, Cost $182,286) (1) | 181,846 | 182,201 | ||||||
VOLT XXXIII LLC | ||||||||
3.50%, 03/25/2055 (Acquired 04/29/2016 through 04/18/2017, Cost $1,816,436) (1) | 1,817,265 | 1,823,919 | ||||||
VOLT XXXVIII LLC | ||||||||
3.88%, 09/25/2045 (Acquired 09/10/2015 through 10/24/2016, Cost $1,003,013) (1) | 998,985 | 1,003,212 | ||||||
Volvo Financial Equipment LLC Series 2016-1 | ||||||||
1.67%, 02/18/2020 (Acquired 01/20/2016, Cost $394,978) (1) | 395,000 | 395,206 | ||||||
Voya CLO 2014-3 Ltd. | ||||||||
2.58%, 07/25/2026 (Acquired 02/02/2016 through 02/03/2016, Cost $1,139,790) (1) | 1,152,000 | 1,152,022 | ||||||
Wendys Funding LLC 2015-1 | ||||||||
3.37%, 06/15/2045 (Acquired 07/13/2015 through 04/03/2017, Cost $7,463,365) (1) | 7,471,912 | 7,536,021 | ||||||
Westlake Automobile Receivables Trust 2016-1 | ||||||||
3.29%, 09/15/2021 (Acquired 01/14/2016, Cost $800,000) (1) | 800,000 | 807,954 | ||||||
| Principal | ||||||||
| Amount | Value | |||||||
Westlake Automobile Receivables Trust 2016-2 | ||||||||
2.83%, 05/17/2021 (Acquired 06/07/2016, Cost $1,049,984) (1) | 1,050,000 | 1,055,951 | ||||||
Wheels SPV 2 LLC | ||||||||
1.27%, 04/22/2024 (Acquired 07/15/2015 through 07/22/2015, Cost $658,333) (1) | 659,300 | 658,456 | ||||||
1.87%, 05/20/2025 (Acquired 08/02/2016, Cost $909,985) (1) | 910,000 | 905,061 | ||||||
World Financial Network Credit Card Master Trust | ||||||||
1.61%, 12/15/2021 | 1,450,000 | 1,450,070 | ||||||
World Omni Automobile Lease Securitization Trust 2016-A | ||||||||
1.45%, 08/15/2019 | 2,180,000 | 2,171,713 | ||||||
|
| |||||||
Total Asset-Backed Obligations (Cost $869,512,078) | $ | 872,938,753 | ||||||
|
| |||||||
Corporate Bonds - 35.81% | ||||||||
Basic Materials - 0.90% | ||||||||
Aleris International, Inc. | ||||||||
9.50%, 04/01/2021 (Acquired 01/06/2017 through 02/09/2017, Cost $1,259,024) (1) | $ | 1,180,000 | $ | 1,213,382 | ||||
Arconic, Inc. | ||||||||
6.15%, 08/15/2020 | 2,730,000 | 2,938,162 | ||||||
Axalta Coating Systems LLC | ||||||||
4.88%, 08/15/2024 (Acquired 10/13/2016 through 05/24/2017, Cost $1,013,012) (1) | 1,000,000 | 1,032,500 | ||||||
Barrick Gold Corp. | ||||||||
4.10%, 05/01/2023 | 3,227,000 | 3,490,769 | ||||||
CF Industries, Inc. | ||||||||
6.88%, 05/01/2018 | 422,000 | 438,352 | ||||||
4.50%, 12/01/2026 (Acquired 02/14/2017 through 03/27/2017, Cost $3,166,810) (1) | 3,155,000 | 3,244,159 | ||||||
Chemours Co./The | ||||||||
5.38%, 05/15/2027 | 107,000 | 109,809 | ||||||
CVR Partners LP / CVR Nitrogen Finance Corp. | ||||||||
9.25%, 06/15/2023 (Acquired 01/10/2017 through 01/17/2017, Cost $938,139) (1) | 880,000 | 920,700 | ||||||
Freeport-McMoRan, Inc. | ||||||||
4.55%, 11/14/2024 | 1,225,000 | 1,154,563 | ||||||
5.40%, 11/14/2034 | 1,750,000 | 1,561,875 | ||||||
Georgia-Pacific LLC | ||||||||
3.16%, 11/15/2021 (Acquired 07/13/2015 through 06/20/2016, Cost $4,248,066) (1) | 4,171,000 | 4,259,046 | ||||||
3.60%, 03/01/2025 (Acquired 07/14/2015 through 03/07/2017, Cost $3,803,596) (1) | 3,715,000 | 3,830,618 | ||||||
Glencore Funding LLC | ||||||||
4.00%, 04/16/2025 (Acquired 07/13/2015 through 06/15/2016, Cost $4,020,035) (1) | 4,450,000 | 4,451,736 | ||||||
Goldcorp, Inc. | ||||||||
3.70%, 03/15/2023 | 3,270,000 | 3,379,388 | ||||||
| Principal | ||||||||
| Amount | Value | |||||||
International Paper Co. | ||||||||
4.40%, 08/15/2047 | 3,855,000 | 3,885,728 | ||||||
NOVA Chemicals Corp. | ||||||||
5.25%, 06/01/2027 (Acquired 05/25/2017, Cost $99,000) (1) | 99,000 | 98,505 | ||||||
Reliance Steel & Aluminum Co. | ||||||||
4.50%, 04/15/2023 | 2,796,000 | 2,953,104 | ||||||
Solvay Finance America LLC | ||||||||
4.45%, 12/03/2025 (Acquired 11/30/2015 through 06/17/2016, Cost $7,042,915) (1) | 6,810,000 | 7,248,196 | ||||||
Steel Dynamics, Inc. | ||||||||
5.00%, 12/15/2026 | 277,000 | 284,271 | ||||||
Teck Resources Ltd. | ||||||||
8.50%, 06/01/2024 (Acquired 01/25/2017 through 02/09/2017, Cost $2,697,526) (1) | 2,349,000 | 2,713,095 | ||||||
Vale Overseas Ltd. | ||||||||
6.88%, 11/10/2039 | 1,160,000 | 1,244,100 | ||||||
Vale SA | ||||||||
5.63%, 09/11/2042 | 2,700,000 | 2,565,000 | ||||||
Valvoline, Inc. | ||||||||
5.50%, 07/15/2024 (Acquired 08/17/2016 through 02/07/2017, Cost $1,019,697) (1) | 979,000 | 1,035,293 | ||||||
Venator Finance Sarl / Venator Materials Corp. | ||||||||
5.75%, 07/15/2025 (Acquired 06/29/2017, Cost $50,000) | 50,000 | 50,500 | ||||||
Westlake Chemical Corp. | ||||||||
3.60%, 08/15/2026 | 3,920,000 | 3,890,996 | ||||||
|
| |||||||
| 57,993,847 | ||||||||
|
| |||||||
Communications - 3.72% | ||||||||
21st Century Fox America, Inc. | ||||||||
3.70%, 09/15/2024 | 2,500,000 | 2,613,718 | ||||||
Alibaba Group Holding Ltd. | ||||||||
3.13%, 11/28/2021 | 875,000 | 892,433 | ||||||
3.60%, 11/28/2024 | 3,625,000 | 3,733,533 | ||||||
Altice Finco SA | ||||||||
7.63%, 02/15/2025 (Acquired 12/06/2016 through 01/20/2017, Cost $661,364) (1) | 650,000 | 693,875 | ||||||
Altice Luxembourg SA | ||||||||
7.25%, 05/15/2022* | EUR 6,400,000 | 7,752,016 | ||||||
7.63%, 02/15/2025 (Acquired 08/21/2015 through 06/07/2017, Cost $1,130,092) (1) | $ | 1,170,000 | 1,287,000 | |||||
Altice US Finance I Corp. | ||||||||
5.38%, 07/15/2023 (Acquired 11/10/2015 through 06/14/2016, Cost $796,997) (1) | 800,000 | 832,500 | ||||||
5.50%, 05/15/2026 (Acquired 12/01/2016 through 06/06/2017, Cost $1,474,901) (1) | 1,450,000 | 1,522,500 | ||||||
| Principal | ||||||||
| Amount | Value | |||||||
AT&T, Inc. | ||||||||
2.02%, 07/15/2021 | 2,735,000 | 2,763,326 | ||||||
3.00%, 06/30/2022 | 2,925,000 | 2,930,142 | ||||||
3.40%, 05/15/2025 | 5,835,000 | 5,736,850 | ||||||
4.13%, 02/17/2026 | 3,485,000 | 3,573,397 | ||||||
1.80%, 09/04/2026* | EUR 200,000 | 226,283 | ||||||
4.25%, 03/01/2027 | $ | 3,127,000 | 3,232,958 | |||||
2.35%, 09/04/2029* | EUR 200,000 | 225,872 | ||||||
3.15%, 09/04/2036* | 200,000 | 225,233 | ||||||
5.25%, 03/01/2037 | $ | 8,772,000 | 9,355,592 | |||||
4.80%, 06/15/2044 | 1,800,000 | 1,786,237 | ||||||
4.35%, 06/15/2045 | 910,000 | 845,748 | ||||||
4.75%, 05/15/2046 | 1,560,000 | 1,531,836 | ||||||
5.45%, 03/01/2047 | 6,237,000 | 6,723,218 | ||||||
4.50%, 03/09/2048 | 1,400,000 | 1,319,790 | ||||||
Baidu, Inc. | ||||||||
2.88%, 07/06/2022 | 2,500,000 | 2,487,202 | ||||||
Banijay Group SAS | ||||||||
4.00%, 07/01/2022* | EUR 100,000 | 115,357 | ||||||
CCO Holdings LLC / CCO Holdings Capital Corp. | ||||||||
5.50%, 05/01/2026 (Acquired 04/07/2016 through 05/24/2016, Cost $4,867,943) (1) | $ | 4,835,000 | 5,131,144 | |||||
5.13%, 05/01/2027 (Acquired 03/09/2017, Cost $442,672) (1) | 447,000 | 457,057 | ||||||
Cequel Communications Holdings I LLC / Cequel Capital Corp. | ||||||||
7.75%, 07/15/2025 (Acquired 12/06/2016, Cost $1,272,255) (1) | 1,175,000 | 1,298,375 | ||||||
Charter Communications Operating LLC / Charter Communications Operating Capital | ||||||||
4.91%, 07/23/2025 | 11,594,000 | 12,526,297 | ||||||
6.48%, 10/23/2045 | 4,880,000 | 5,864,315 | ||||||
Comcast Corp. | ||||||||
2.35%, 01/15/2027 | 2,435,000 | 2,285,698 | ||||||
3.30%, 02/01/2027 | 3,789,000 | 3,835,957 | ||||||
3.40%, 07/15/2046 | 539,000 | 491,584 | ||||||
Cox Communications, Inc. | ||||||||
3.85%, 02/01/2025 (Acquired 07/22/2015, Cost $1,395,072) (1) | 1,450,000 | 1,461,053 | ||||||
3.35%, 09/15/2026 (Acquired 09/08/2016 through 03/30/2017, Cost $7,767,060) (1) | 7,940,000 | 7,797,461 | ||||||
4.80%, 02/01/2035 (Acquired 03/28/2016 through 03/28/2017, Cost $2,138,008) (1) | 2,300,000 | 2,251,497 | ||||||
4.70%, 12/15/2042 (Acquired 03/24/2016 through 03/28/2017, Cost $735,009) (1) | 810,000 | 739,242 | ||||||
4.50%, 06/30/2043 (Acquired 03/24/2016 through 02/07/2017, Cost $799,560) (1) | 950,000 | 854,056 | ||||||
| Principal | ||||||||
| Amount | Value | |||||||
Crown Castle Towers LLC | ||||||||
3.66%, 05/15/2025 (Acquired 07/14/2015 through 07/27/2015, Cost $1,286,073) (1) | 1,300,000 | 1,345,500 | ||||||
CSC Holdings LLC | ||||||||
8.63%, 02/15/2019 | 625,000 | 684,956 | ||||||
10.88%, 10/15/2025 (Acquired 01/26/2017 through 03/17/2017, Cost $2,132,459) (1) | 1,800,000 | 2,166,750 | ||||||
5.50%, 04/15/2027 (Acquired 12/02/2016, Cost $344,175) (1) | 350,000 | 370,125 | ||||||
DISH DBS Corp. | ||||||||
6.75%, 06/01/2021 | 200,000 | 222,000 | ||||||
5.88%, 07/15/2022 | 200,000 | 215,000 | ||||||
DISH Network Corp. | ||||||||
2.38%, 03/15/2024 (Acquired 05/25/2017 through 05/26/2017, Cost $319,892) (1) | 305,000 | 320,441 | ||||||
Expedia, Inc. | ||||||||
5.00%, 02/15/2026 | 2,560,000 | 2,803,343 | ||||||
Finisar Corp. | ||||||||
0.50%, 12/15/2036 (Acquired 03/10/2017 through 06/29/2017, Cost $1,826,196) (1) | 1,880,000 | 1,835,350 | ||||||
iHeartCommunications, Inc. | ||||||||
9.00%, 09/15/2022 | 6,895,000 | 5,102,300 | ||||||
Intelsat Jackson Holdings SA | ||||||||
7.25%, 04/01/2019 | 7,900,000 | 7,901,975 | ||||||
7.25%, 10/15/2020 | 4,215,000 | 3,983,175 | ||||||
9.75%, 07/15/2025 (Acquired 06/19/2017 through 06/20/2017, Cost $1,039,000) (1) | 1,039,000 | 1,037,701 | ||||||
Interpublic Group of Cos, Inc./The | ||||||||
4.00%, 03/15/2022 | 1,100,000 | 1,153,382 | ||||||
4.20%, 04/15/2024 | 4,993,000 | 5,258,163 | ||||||
Level 3 Financing, Inc. | ||||||||
5.63%, 02/01/2023 | 375,000 | 390,000 | ||||||
5.38%, 05/01/2025 | 1,475,000 | 1,552,438 | ||||||
5.25%, 03/15/2026 | 4,225,000 | 4,383,902 | ||||||
Liberty Media Corp. | ||||||||
2.25%, 09/30/2046 (Acquired 08/12/2016, Cost $535,000) (1) | 535,000 | 575,794 | ||||||
NBCUniversal Media LLC | ||||||||
4.45%, 01/15/2043 | 2,697,000 | 2,867,229 | ||||||
Nokia OYJ | ||||||||
3.38%, 06/12/2022 | 379,000 | 381,881 | ||||||
4.38%, 06/12/2027 | 564,000 | 574,225 | ||||||
Omnicom Group, Inc. | ||||||||
3.65%, 11/01/2024 | 1,600,000 | 1,640,906 | ||||||
| Principal | ||||||||
| Amount | Value | |||||||
Priceline Group, Inc./The | ||||||||
3.65%, 03/15/2025 | 2,368,000 | 2,430,167 | ||||||
3.60%, 06/01/2026 | 8,111,000 | 8,211,293 | ||||||
Proven Honour Capital Ltd. | ||||||||
4.13%, 05/19/2025 | 1,000,000 | 1,026,220 | ||||||
SES GLOBAL Americas Holdings GP | ||||||||
2.50%, 03/25/2019 (Acquired 05/15/2017, Cost $499,700) (1) | 500,000 | 499,349 | ||||||
Sirius XM Radio, Inc. | ||||||||
4.25%, 05/15/2020 (Acquired 09/25/2015 through 12/29/2016, Cost $927,972) (1) | 925,000 | 935,614 | ||||||
5.25%, 08/15/2022 (Acquired 07/20/2015 through 07/29/2015, Cost $1,130,789) (1) | 1,100,000 | 1,129,436 | ||||||
Sky Plc | ||||||||
6.10%, 02/15/2018 (Acquired 02/13/2017, Cost $3,059,592) (1) | 2,980,000 | 3,057,155 | ||||||
3.75%, 09/16/2024 (Acquired 10/08/2015, Cost $277,008) (1) | 280,000 | 287,638 | ||||||
Sprint Communications, Inc. | ||||||||
9.00%, 11/15/2018 (Acquired 08/26/2015 through 04/29/2016, Cost $751,158) (1) | 723,000 | 784,679 | ||||||
Sprint Corp. | ||||||||
7.25%, 09/15/2021 | 3,000,000 | 3,333,750 | ||||||
Sprint Spectrum Co. LLC / Sprint Spectrum Co. II LLC / Sprint Spectrum Co. III LLC | ||||||||
3.36%, 03/20/2023 (Acquired 05/15/2017 through 06/02/2017, Cost $2,126,347) (1) | 2,100,000 | 2,118,375 | ||||||
TEGNA, Inc. | ||||||||
5.50%, 09/15/2024 (Acquired 04/26/2017, Cost $411,194) (1) | 400,000 | 412,000 | ||||||
Tencent Holdings Ltd. | ||||||||
3.80%, 02/11/2025 | 3,210,000 | 3,343,293 | ||||||
Time Warner Cable LLC | ||||||||
3.80%, 02/15/2027 | 3,530,000 | 3,554,234 | ||||||
6.55%, 05/01/2037 | 1,375,000 | 1,643,624 | ||||||
7.30%, 07/01/2038 | 2,755,000 | 3,524,992 | ||||||
6.75%, 06/15/2039 | 930,000 | 1,139,569 | ||||||
4.50%, 09/15/2042 | 4,325,000 | 4,120,531 | ||||||
T-Mobile USA, Inc. | ||||||||
6.50%, 01/15/2026 | 1,235,000 | 1,363,131 | ||||||
Townsquare Media, Inc. | ||||||||
6.50%, 04/01/2023 (Acquired 01/20/2016 through 02/28/2017, Cost $1,161,802) (1) | 1,195,000 | 1,203,963 | ||||||
Univision Communications, Inc. | ||||||||
5.13%, 02/15/2025 (Acquired 07/13/2015 through 02/27/2017, Cost $1,438,603) (1) | 1,460,000 | 1,447,225 | ||||||
UPCB Finance VII Ltd. | ||||||||
3.63%, 06/15/2029 (Acquired 06/14/2017, Cost $549,660) (1)* | EUR 490,000 | 551,372 | ||||||
| Principal | ||||||||
| Amount | Value | |||||||
Verizon Communications, Inc. | ||||||||
2.95%, 03/15/2022 (Acquired 02/03/2017, Cost $1,432,044) (1) | $ | 1,433,000 | 1,442,799 | |||||
5.15%, 09/15/2023 | 2,540,000 | 2,821,018 | ||||||
3.50%, 11/01/2024 | 2,000,000 | 2,020,722 | ||||||
2.63%, 08/15/2026 | 6,933,000 | 6,393,086 | ||||||
4.27%, 01/15/2036 | 7,520,000 | 7,266,035 | ||||||
5.25%, 03/16/2037 | 2,900,000 | 3,120,913 | ||||||
4.13%, 08/15/2046 | 1,751,000 | 1,560,598 | ||||||
4.86%, 08/21/2046 | 4,740,000 | 4,738,824 | ||||||
4.52%, 09/15/2048 | 400,000 | 379,248 | ||||||
Viacom, Inc. | ||||||||
4.85%, 12/15/2034 | 142,000 | 141,272 | ||||||
4.38%, 03/15/2043 | 5,215,000 | 4,641,606 | ||||||
Virgin Media Secured Finance Plc | ||||||||
5.25%, 01/15/2026 (Acquired 01/12/2016, Cost $778,731) (1) | 800,000 | 832,648 | ||||||
5.50%, 08/15/2026 (Acquired 04/13/2016, Cost $200,000) (1) | 200,000 | 209,500 | ||||||
WPP Finance 2010 | ||||||||
4.75%, 11/21/2021 | 2,620,000 | 2,834,012 | ||||||
Zayo Group LLC / Zayo Capital, Inc. | ||||||||
5.75%, 01/15/2027 (Acquired 06/29/2017, Cost $469,125) (1) | 450,000 | 470,813 | ||||||
|
| |||||||
| 239,157,592 | ||||||||
|
| |||||||
Consumer, Cyclical - 3.23% | ||||||||
1011778 BC ULC / New Red Finance, Inc. | ||||||||
4.25%, 05/15/2024 (Acquired 05/23/2017 through 06/02/2017, Cost $1,000,488) (1) | 1,000,000 | 993,690 | ||||||
Air Canada 2013-1 Class A Pass Through Trust | ||||||||
4.13%, 11/15/2026 (Acquired 07/14/2015, Cost $1,281,380) (1) | 1,270,432 | 1,318,073 | ||||||
Air Canada 2013-1 Class B Pass Through Trust | ||||||||
5.38%, 11/15/2022 (Acquired 05/04/2016, Cost $310,722) (1) | 310,722 | 326,647 | ||||||
Air Canada 2015-2 Class B Pass Through Trust | ||||||||
5.00%, 06/15/2025 (Acquired 12/01/2015, Cost $2,225,860) (1) | 2,225,861 | 2,320,460 | ||||||
America West Airlines 2001-1 Pass Through Trust | ||||||||
7.10%, 10/02/2022 | 1,628,083 | 1,770,541 | ||||||
American Airlines 2013-1 Class A Pass Through Trust | ||||||||
4.00%, 01/15/2027 | 1,981,499 | 2,070,666 | ||||||
American Airlines 2014-1 Class A Pass Through Trust | ||||||||
3.70%, 04/01/2028 | 1,887,226 | 1,934,406 | ||||||
American Airlines 2015-1 Class B Pass Through Trust | ||||||||
| Principal | ||||||||
| Amount | Value | |||||||
3.70%, 05/01/2023 | 2,581,529 | 2,555,713 | ||||||
American Airlines 2016-1 Class AA Pass Through Trust | ||||||||
3.58%, 07/15/2029 | 594,572 | 608,248 | ||||||
American Airlines 2016-1 Class B Pass Through Trust | ||||||||
5.25%, 07/15/2025 | 2,759,073 | 2,872,746 | ||||||
American Airlines 2016-2 Class A Pass Through Trust | ||||||||
3.65%, 12/15/2029 | 1,051,920 | 1,067,699 | ||||||
American Airlines 2016-2 Class B Pass Through Trust | ||||||||
4.38%, 12/15/2025 (Acquired 06/28/2016, Cost $4,636,268) (1) | 4,641,300 | 4,676,110 | ||||||
American Airlines 2017-1B Class B Pass Through Trust | ||||||||
4.95%, 08/15/2026 (8) | 1,185,000 | 1,220,550 | ||||||
Aramark Services, Inc. | ||||||||
4.75%, 06/01/2026 | 632,000 | 655,700 | ||||||
AutoNation, Inc. | ||||||||
3.35%, 01/15/2021 | 770,000 | 783,879 | ||||||
4.50%, 10/01/2025 | 465,000 | 485,232 | ||||||
Brinker International, Inc. | ||||||||
3.88%, 05/15/2023 | 336,000 | 325,920 | ||||||
Caesars Entertainment Operating Co., Inc. | ||||||||
10.00%, 12/15/2018 | 7,900,000 | 7,292,687 | ||||||
Caesars Growth Properties Holdings LLC / Caesars Growth Properties Finance, Inc. | ||||||||
9.38%, 05/01/2022 | 9,375,000 | 10,171,875 | ||||||
Chester Downs & Marina LLC / Chester Downs Finance Corp. | ||||||||
9.25%, 02/01/2020 (Acquired 05/04/2017 through 05/05/2017, Cost $11,535,797) (1) | 11,285,000 | 11,623,550 | ||||||
Choice Hotels International, Inc. | ||||||||
5.75%, 07/01/2022 | 3,000,000 | 3,333,750 | ||||||
Churchill Downs, Inc. | ||||||||
5.38%, 12/15/2021 | 750,000 | 778,125 | ||||||
Cintas Corp. No 2 | ||||||||
4.30%, 06/01/2021 | 165,000 | 175,801 | ||||||
Continental Airlines 2000-1 Class A-1 Pass Through Trust | ||||||||
8.05%, 05/01/2022 (8) | 385,057 | 425,488 | ||||||
Continental Airlines 2007-1 Class A Pass Through Trust | ||||||||
5.98%, 10/19/2023 (8) | 4,562,032 | 5,018,235 | ||||||
Continental Airlines 2009-2 Class A Pass Through Trust | ||||||||
7.25%, 05/10/2021 | 976,292 | 1,081,243 | ||||||
Continental Airlines 2012-1 Class A Pass Through Trust | ||||||||
| Principal | ||||||||
| Amount | Value | |||||||
4.15%, 10/11/2025 | 1,044,063 | 1,096,266 | ||||||
Continental Airlines 2012-2 Class A Pass Through Trust | ||||||||
4.00%, 04/29/2026 | 1,887,217 | 1,988,654 | ||||||
CVS Health Corp. | ||||||||
2.80%, 07/20/2020 | 4,972,000 | 5,061,590 | ||||||
3.50%, 07/20/2022 | 735,000 | 762,155 | ||||||
4.75%, 12/01/2022 (Acquired 06/20/2016, Cost $61,911) (1) | 56,000 | 61,374 | ||||||
5.00%, 12/01/2024 | 2,874,000 | 3,183,780 | ||||||
4.88%, 07/20/2035 | 250,000 | 277,976 | ||||||
5.13%, 07/20/2045 | 200,000 | 229,594 | ||||||
CVS Pass-Through Trust | ||||||||
5.77%, 01/10/2033 | 2,721,384 | 3,092,600 | ||||||
CVS Pass-Through Trust Series 2014 | ||||||||
4.16%, 08/11/2036 (Acquired 07/22/2015 through 08/17/2016, Cost $6,323,483) (1) | 6,162,876 | 6,250,388 | ||||||
Delphi Automotive Plc | ||||||||
4.25%, 01/15/2026 | 3,055,000 | 3,236,238 | ||||||
Delta Air Lines 2002-1 Class G-1 Pass Through Trust | ||||||||
6.72%, 07/02/2024 | 1,896,536 | 2,128,862 | ||||||
Delta Air Lines 2015-1 Class AA Pass Through Trust | ||||||||
3.63%, 01/30/2029 | 692,908 | 713,695 | ||||||
Delta Air Lines, Inc. | ||||||||
3.63%, 03/15/2022 | 2,915,000 | 2,992,181 | ||||||
Ford Motor Credit Co. LLC | ||||||||
2.15%, 01/09/2018 | 1,000,000 | 1,003,412 | ||||||
2.55%, 10/05/2018 | 1,950,000 | 1,962,884 | ||||||
3.16%, 08/04/2020 | 1,220,000 | 1,243,171 | ||||||
General Motors Co. | ||||||||
6.60%, 04/01/2036 | 975,000 | 1,130,765 | ||||||
6.25%, 10/02/2043 | 65,000 | 72,285 | ||||||
5.20%, 04/01/2045 | 1,160,000 | 1,139,529 | ||||||
General Motors Financial Co., Inc. | ||||||||
3.10%, 01/15/2019 | 1,868,000 | 1,893,584 | ||||||
2.35%, 10/04/2019 | 3,000,000 | 2,999,841 | ||||||
2.65%, 04/13/2020 | 1,500,000 | 1,506,864 | ||||||
3.70%, 05/09/2023 | 1,080,000 | 1,096,555 | ||||||
4.00%, 01/15/2025 | 10,800,000 | 10,846,840 | ||||||
4.00%, 10/06/2026 | 310,000 | 308,237 | ||||||
| Principal | ||||||||
| Amount | Value | |||||||
GLP Capital LP / GLP Financing II, Inc. | ||||||||
5.38%, 04/15/2026 | 850,000 | 928,446 | ||||||
Goodyear Tire & Rubber Co./The | ||||||||
4.88%, 03/15/2027 | 440,000 | 446,600 | ||||||
H&E Equipment Services, Inc. | ||||||||
7.00%, 09/01/2022 | 225,000 | 234,000 | ||||||
Hanesbrands, Inc. | ||||||||
4.63%, 05/15/2024 (Acquired 05/03/2016 through 12/06/2016, Cost $2,117,929) (1) | 2,118,000 | 2,149,770 | ||||||
Hilton Domestic Operating Co., Inc. | ||||||||
4.25%, 09/01/2024 (Acquired 08/08/2016, Cost $605,000) (1) | 605,000 | 613,319 | ||||||
Hilton Worldwide Finance LLC / Hilton Worldwide Finance Corp. | ||||||||
4.63%, 04/01/2025 (Acquired 03/07/2017 through 03/08/2017, Cost $939,961) (1) | 940,000 | 969,375 | ||||||
4.88%, 04/01/2027 (Acquired 03/07/2017 through 03/14/2017, Cost $869,934) (1) | 870,000 | 910,237 | ||||||
IHO Verwaltungs GmbH | ||||||||
4.13%, 09/15/2021 (Acquired 09/08/2016, Cost $445,000) (1) | 445,000 | 453,344 | ||||||
4.50%, 09/15/2023 (Acquired 09/08/2016, Cost $314,000) (1) | 314,000 | 318,710 | ||||||
Ingram Micro, Inc. | ||||||||
5.45%, 12/15/2024 | 1,400,000 | 1,438,735 | ||||||
KFC Holding Co./Pizza Hut Holdings LLC/Taco Bell of America LLC | ||||||||
5.25%, 06/01/2026 (Acquired 03/10/2017 through 03/14/2017, Cost $501,191) (1) | 500,000 | 526,250 | ||||||
4.75%, 06/01/2027 (Acquired 06/12/2017, Cost $172,000) (1) | 172,000 | 175,655 | ||||||
Magna International, Inc. | ||||||||
4.15%, 10/01/2025 | 665,000 | 706,975 | ||||||
Marriott International, Inc./MD | ||||||||
3.75%, 10/01/2025 | 2,280,000 | 2,345,422 | ||||||
Melco Resorts Finance Ltd. | ||||||||
4.88%, 06/06/2025 (Acquired 05/25/2017 through 06/27/2017, Cost $401,500) (1) | 400,000 | 400,312 | ||||||
New Albertsons, Inc. | ||||||||
7.45%, 08/01/2029 | 175,000 | 169,750 | ||||||
New Red Finance, Inc. | ||||||||
4.63%, 01/15/2022 (Acquired 07/13/2015 through 11/03/2016, Cost $3,552,588) (1) | 3,510,000 | 3,597,750 | ||||||
Newell Rubbermaid, Inc. | ||||||||
3.85%, 04/01/2023 | 1,129,000 | 1,185,231 | ||||||
4.20%, 04/01/2026 | 4,036,000 | 4,285,780 | ||||||
5.50%, 04/01/2046 | 1,520,000 | 1,832,643 | ||||||
O’Reilly Automotive, Inc. | ||||||||
4.63%, 09/15/2021 | 1,300,000 | 1,401,800 | ||||||
| Principal | ||||||||
| Amount | Value | |||||||
PetSmart, Inc. | ||||||||
5.88%, 06/01/2025 (Acquired 05/25/2017, Cost $390,000) (1) | 390,000 | 375,863 | ||||||
QVC, Inc. | ||||||||
3.13%, 04/01/2019 | 400,000 | 404,446 | ||||||
5.13%, 07/02/2022 | 1,600,000 | 1,691,499 | ||||||
4.38%, 03/15/2023 | 920,000 | 930,411 | ||||||
Scientific Games International, Inc. | ||||||||
10.00%, 12/01/2022 | 1,910,000 | 2,093,838 | ||||||
Scotts Miracle-Gro Co./The | ||||||||
5.25%, 12/15/2026 | 255,000 | 267,113 | ||||||
Spirit Airlines 2015-1 Pass Through Trust A | ||||||||
4.10%, 10/01/2029 | 4,183,945 | 4,351,303 | ||||||
Spirit Issuer Plc | ||||||||
3.00%, 12/28/2031* | GBP 810,000 | 1,006,903 | ||||||
Toll Brothers Finance Corp. | ||||||||
4.00%, 12/31/2018 | $ | 1,497,000 | 1,534,425 | |||||
5.88%, 02/15/2022 | 415,000 | 459,613 | ||||||
4.38%, 04/15/2023 | 540,000 | 558,630 | ||||||
Toyota Motor Credit Co. | ||||||||
1.55%, 10/18/2019 | 7,420,000 | 7,387,738 | ||||||
Unique Pub Finance Co. Plc/The | ||||||||
5.66%, 06/30/2027* | GBP 1,840,410 | 2,685,624 | ||||||
United Airlines 2014-2 Class A Pass Through Trust | ||||||||
3.75%, 03/03/2028 | $ | 1,918,952 | 1,986,116 | |||||
US Airways 2011-1 Class A Pass Through Trust | ||||||||
7.13%, 04/22/2025 | 2,012,811 | 2,321,174 | ||||||
US Airways 2013-1 Class A Pass Through Trust | ||||||||
3.95%, 05/15/2027 | 1,824,568 | 1,897,552 | ||||||
Walgreens Boots Alliance, Inc. | ||||||||
3.80%, 11/18/2024 | 2,550,000 | 2,648,654 | ||||||
3.45%, 06/01/2026 | 2,365,000 | 2,360,239 | ||||||
4.80%, 11/18/2044 | 926,000 | 986,747 | ||||||
4.65%, 06/01/2046 | 908,000 | 951,734 | ||||||
Wal-Mart Stores, Inc. | ||||||||
1.13%, 04/11/2018 | 11,110,000 | 11,087,147 | ||||||
WestJet Airlines Ltd. | ||||||||
3.50%, 06/16/2021 (Acquired 06/02/2017, Cost $4,634,180) (1)(6)(8) | 4,540,000 | 4,639,199 | ||||||
| Principal | ||||||||
| Amount | Value | |||||||
Wyndham Worldwide Corp. | ||||||||
5.10%, 10/01/2025 | 1,120,000 | 1,209,772 | ||||||
4.50%, 04/01/2027 | 6,035,000 | 6,222,067 | ||||||
Wynn Las Vegas LLC / Wynn Las Vegas Capital Corp. | ||||||||
5.25%, 05/15/2027 (Acquired 05/04/2017, Cost $388,000) (1) | 388,000 | 397,458 | ||||||
|
| |||||||
| 207,711,723 | ||||||||
|
| |||||||
Consumer, Non-cyclical - 5.27% | ||||||||
Abbott Laboratories | ||||||||
3.88%, 09/15/2025 | 483,000 | 496,824 | ||||||
3.75%, 11/30/2026 | 4,986,000 | 5,090,287 | ||||||
AbbVie, Inc. | ||||||||
1.80%, 05/14/2018 | 3,000,000 | 3,003,813 | ||||||
3.60%, 05/14/2025 | 1,118,000 | 1,140,532 | ||||||
3.20%, 05/14/2026 | 2,075,000 | 2,050,704 | ||||||
4.50%, 05/14/2035 | 600,000 | 633,459 | ||||||
4.70%, 05/14/2045 | 750,000 | 798,086 | ||||||
4.45%, 05/14/2046 | 2,750,000 | 2,842,606 | ||||||
Aetna, Inc. | ||||||||
2.80%, 06/15/2023 | 3,388,000 | 3,381,658 | ||||||
Albertsons Cos LLC / Safeway, Inc. / New Albertson’s, Inc. / Albertson’s LLC | ||||||||
5.75%, 03/15/2025 (Acquired 08/04/2016 through 08/22/2016, Cost $626,383) (1) | 625,000 | 581,250 | ||||||
Allergan Funding SCS | ||||||||
0.03%, 06/01/2019* | EUR 100,000 | 114,307 | ||||||
3.80%, 03/15/2025 | $ | 5,550,000 | 5,741,131 | |||||
4.55%, 03/15/2035 | 400,000 | 427,283 | ||||||
Amgen, Inc. | ||||||||
4.40%, 05/01/2045 | 500,000 | 514,299 | ||||||
4.56%, 06/15/2048 | 1,500,000 | 1,580,571 | ||||||
4.66%, 06/15/2051 | 447,000 | 474,166 | ||||||
Anheuser-Busch InBev Finance, Inc. | ||||||||
3.30%, 02/01/2023 | 5,236,000 | 5,391,001 | ||||||
3.65%, 02/01/2026 | 15,318,000 | 15,783,177 | ||||||
4.90%, 02/01/2046 | 10,388,000 | 11,740,850 | ||||||
Anthem, Inc. | ||||||||
1.88%, 01/15/2018 | 5,000,000 | 5,004,200 | ||||||
3.50%, 08/15/2024 | 6,055,000 | 6,224,540 | ||||||
4.65%, 08/15/2044 | 2,000,000 | 2,169,318 | ||||||
| Principal | ||||||||
| Amount | Value | |||||||
Ascension Health | ||||||||
3.95%, 11/15/2046 | 825,000 | 836,871 | ||||||
AstraZeneca Plc | ||||||||
3.38%, 11/16/2025 | 1,475,000 | 1,506,696 | ||||||
3.13%, 06/12/2027 | 1,000,000 | 996,807 | ||||||
Avon International Operations, Inc. | ||||||||
7.88%, 08/15/2022 (Acquired 10/25/2016, Cost $619,349) (1) | 575,000 | 596,562 | ||||||
B&G Foods, Inc. | ||||||||
5.25%, 04/01/2025 | 2,590,000 | 2,641,800 | ||||||
Baxalta, Inc. | ||||||||
2.88%, 06/23/2020 | 1,000,000 | 1,015,890 | ||||||
4.00%, 06/23/2025 | 7,555,000 | 7,880,658 | ||||||
Baylor Scott & White Holdings | ||||||||
3.97%, 11/15/2046 | 875,000 | 866,626 | ||||||
Becton Dickinson and Co. | ||||||||
3.36%, 06/06/2024 | 2,070,000 | 2,074,008 | ||||||
3.73%, 12/15/2024 | 1,560,000 | 1,585,693 | ||||||
3.70%, 06/06/2027 | 3,495,000 | 3,500,480 | ||||||
7.00%, 08/01/2027 | 361,000 | 453,181 | ||||||
4.67%, 06/06/2047 | 2,445,000 | 2,518,421 | ||||||
Biogen, Inc. | ||||||||
4.05%, 09/15/2025 | 1,835,000 | 1,937,549 | ||||||
5.20%, 09/15/2045 | 1,175,000 | 1,342,265 | ||||||
BioMarin Pharmaceutical, Inc. | ||||||||
1.50%, 10/15/2020 | 455,000 | 541,166 | ||||||
BRF GmbH | ||||||||
4.35%, 09/29/2026 (Acquired 09/22/2016, Cost $1,694,544) (1) | 1,730,000 | 1,617,550 | ||||||
CDK Global, Inc. | ||||||||
4.88%, 06/01/2027 (Acquired 05/10/2017, Cost $276,360) (1) | 275,000 | 282,562 | ||||||
Celgene Corp. | ||||||||
3.55%, 08/15/2022 | 975,000 | 1,014,869 | ||||||
3.63%, 05/15/2024 | 2,260,000 | 2,340,433 | ||||||
3.88%, 08/15/2025 | 3,170,000 | 3,310,891 | ||||||
5.00%, 08/15/2045 | 2,850,000 | 3,213,529 | ||||||
Centene Corp. | ||||||||
4.75%, 05/15/2022 | 201,000 | 209,794 | ||||||
6.13%, 02/15/2024 | 494,000 | 534,103 | ||||||
| Principal | ||||||||
| Amount | Value | |||||||
4.75%, 01/15/2025 | 2,092,000 | 2,149,530 | ||||||
Central Garden & Pet Co. | ||||||||
6.13%, 11/15/2023 | 1,027,000 | 1,093,755 | ||||||
Chobani LLC / Chobani Finance Corp., Inc. | ||||||||
7.50%, 04/15/2025 (Acquired 03/30/2017, Cost $500,000) (1) | 500,000 | 528,125 | ||||||
Constellation Brands, Inc. | ||||||||
6.00%, 05/01/2022 | 750,000 | 855,369 | ||||||
Danone SA | ||||||||
2.08%, 11/02/2021 (Acquired 10/26/2016 through 02/07/2017, Cost $3,778,677) (1) | 3,794,000 | 3,742,531 | ||||||
2.59%, 11/02/2023 (Acquired 10/26/2016 through 11/28/2016, Cost $2,516,010) (1) | 2,535,000 | 2,472,981 | ||||||
DaVita, Inc. | ||||||||
5.00%, 05/01/2025 | 300,000 | 300,750 | ||||||
DP World Ltd. | ||||||||
6.85%, 07/02/2037 | 400,000 | 470,055 | ||||||
DS Services of America, Inc. | ||||||||
10.00%, 09/01/2021 (Acquired 10/05/2015, Cost $594,369) (1) | 561,000 | 594,660 | ||||||
Ecolab, Inc. | ||||||||
2.70%, 11/01/2026 | 645,000 | 622,153 | ||||||
ERAC USA Finance LLC | ||||||||
3.80%, 11/01/2025 (Acquired 11/02/2015 through 06/12/2017, Cost $4,642,118) (1) | 4,605,000 | 4,694,388 | ||||||
3.30%, 12/01/2026 (Acquired 05/23/2016, Cost $2,193,472) (1) | 2,200,000 | 2,142,300 | ||||||
Express Scripts Holding Co. | ||||||||
3.50%, 06/15/2024 | 1,282,000 | 1,292,866 | ||||||
4.50%, 02/25/2026 | 7,483,000 | 7,931,284 | ||||||
3.40%, 03/01/2027 | 6,194,000 | 5,978,628 | ||||||
4.80%, 07/15/2046 | 1,410,000 | 1,436,184 | ||||||
First Quality Finance Co., Inc. | ||||||||
5.00%, 07/01/2025 (Acquired 06/20/2017, Cost $98,000) (1) | 98,000 | 99,960 | ||||||
George Washington University/The | ||||||||
3.55%, 09/15/2046 | 740,000 | 684,645 | ||||||
Gilead Sciences, Inc. | ||||||||
3.70%, 04/01/2024 | 1,000,000 | 1,039,330 | ||||||
3.50%, 02/01/2025 | 1,251,000 | 1,283,940 | ||||||
4.75%, 03/01/2046 | 375,000 | 411,201 | ||||||
HCA, Inc. | ||||||||
3.75%, 03/15/2019 | 1,111,000 | 1,133,220 | ||||||
6.50%, 02/15/2020 | 1,300,000 | 1,418,625 | ||||||
| Principal | ||||||||
| Amount | Value | |||||||
4.75%, 05/01/2023 | 500,000 | 528,750 | ||||||
5.88%, 05/01/2023 | 844,000 | 918,905 | ||||||
5.00%, 03/15/2024 | 1,016,000 | 1,075,690 | ||||||
5.38%, 02/01/2025 | 6,714,000 | 7,081,927 | ||||||
5.25%, 04/15/2025 | 3,075,000 | 3,305,625 | ||||||
5.88%, 02/15/2026 | 3,683,000 | 3,977,640 | ||||||
5.25%, 06/15/2026 | 810,000 | 873,585 | ||||||
4.50%, 02/15/2027 | 3,340,000 | 3,436,025 | ||||||
7.50%, 11/06/2033 | 1,035,000 | 1,170,844 | ||||||
5.50%, 06/15/2047 | 246,000 | 254,610 | ||||||
Hill-Rom Holdings, Inc. | ||||||||
5.75%, 09/01/2023 (Acquired 06/01/2016, Cost $489,352) (1) | 480,000 | 505,200 | ||||||
HPHT Finance 15 Ltd. | ||||||||
2.25%, 03/17/2018 (Acquired 10/09/2015, Cost $839,751) (1) | 840,000 | 839,520 | ||||||
Humana, Inc. | ||||||||
3.85%, 10/01/2024 | 5,050,000 | 5,248,657 | ||||||
3.95%, 03/15/2027 | 540,000 | 562,823 | ||||||
IHS Markit Ltd. | ||||||||
5.00%, 11/01/2022 (Acquired 07/06/2016 through 01/30/2017, Cost $1,092,888) (1) | 1,061,000 | 1,145,212 | ||||||
Impax Laboratories, Inc. | ||||||||
2.00%, 06/15/2022 | 2,015,000 | 1,714,009 | ||||||
Imperial Tobacco Finance Plc | ||||||||
2.95%, 07/21/2020 (Acquired 07/15/2015 through 10/08/2015, Cost $1,666,356) (1) | 1,665,000 | 1,692,995 | ||||||
4.25%, 07/21/2025 (Acquired 10/15/2015, Cost $1,384,137) (1) | 1,345,000 | 1,419,773 | ||||||
Ionis Pharmaceuticals, Inc. | ||||||||
1.00%, 11/15/2021 | 1,030,000 | 1,092,444 | ||||||
Kaiser Foundation Hospitals | ||||||||
3.50%, 04/01/2022 | 1,275,000 | 1,330,966 | ||||||
3.15%, 05/01/2027 | 7,000,000 | 7,005,187 | ||||||
Koninklijke Ahold Delhaize NV | ||||||||
5.70%, 10/01/2040 | 690,000 | 806,047 | ||||||
Kraft Heinz Foods Co. | ||||||||
3.50%, 07/15/2022 | 2,150,000 | 2,216,377 | ||||||
3.95%, 07/15/2025 | 4,605,000 | 4,749,270 | ||||||
3.00%, 06/01/2026 | 1,000,000 | 956,778 | ||||||
5.20%, 07/15/2045 | 1,000,000 | 1,084,342 | ||||||
4.38%, 06/01/2046 | 800,000 | 779,669 | ||||||
| Principal | ||||||||
| Amount | Value | |||||||
Laboratory Corp. of America Holdings | ||||||||
3.60%, 02/01/2025 | 1,475,000 | 1,497,250 | ||||||
Life Technologies Corp. | ||||||||
6.00%, 03/01/2020 | 2,209,000 | 2,407,306 | ||||||
Macquarie Infrastructure Corp. | ||||||||
2.00%, 10/01/2023 | 3,270,000 | 3,255,694 | ||||||
Mead Johnson Nutrition Co. | ||||||||
4.13%, 11/15/2025 | 170,000 | 183,317 | ||||||
Molina Healthcare, Inc. | ||||||||
5.38%, 11/15/2022 | 200,000 | 211,750 | ||||||
4.88%, 06/15/2025 (Acquired 05/22/2017 through 05/23/2017, Cost $475,526) (1) | 475,000 | 478,562 | ||||||
Mondelez International Holdings Netherlands BV | ||||||||
1.63%, 10/28/2019 (Acquired 10/19/2016, Cost $5,131,348) (1) | 5,140,000 | 5,091,946 | ||||||
Mylan NV | ||||||||
3.95%, 06/15/2026 | 4,485,000 | 4,544,821 | ||||||
Mylan, Inc. | ||||||||
2.55%, 03/28/2019 | 300,000 | 302,176 | ||||||
New York and Presbyterian Hospital/The | ||||||||
3.56%, 08/01/2036 | 2,630,000 | 2,555,608 | ||||||
Northwell Healthcare, Inc. | ||||||||
3.98%, 11/01/2046 | 2,980,000 | 2,848,165 | ||||||
NYU Hospitals Center | ||||||||
4.43%, 07/01/2042 | 2,000,000 | 2,063,076 | ||||||
PepsiCo, Inc. | ||||||||
1.35%, 10/04/2019 | 7,250,000 | 7,186,309 | ||||||
Perrigo Finance Unlimited Co. | ||||||||
3.50%, 12/15/2021 | 826,000 | 854,893 | ||||||
Post Holdings, Inc. | ||||||||
8.00%, 07/15/2025 (Acquired 01/30/2017 through 02/27/2017, Cost $526,018) (1)(6)(8) | 470,000 | 533,450 | ||||||
Providence St Joseph Health Obligated Group | ||||||||
2.75%, 10/01/2026 | 1,968,000 | 1,885,100 | ||||||
Quintiles IMS, Inc. | ||||||||
4.88%, 05/15/2023 (Acquired 05/09/2016, Cost $813,461) (1) | 800,000 | 819,000 | ||||||
Reckitt Benckiser Treasury Services Plc | ||||||||
3.00%, 06/26/2027 (Acquired 06/21/2017, Cost $4,072,759) (1) | 4,085,000 | 4,026,470 | ||||||
Reynolds American, Inc. | ||||||||
3.25%, 11/01/2022 | 1,215,000 | 1,222,186 | ||||||
| Principal | ||||||||
| Amount | Value | |||||||
4.45%, 06/12/2025 | 680,000 | 730,001 | ||||||
5.85%, 08/15/2045 | 1,020,000 | 1,250,620 | ||||||
RWJ Barnabas Health, Inc. | ||||||||
3.95%, 07/01/2046 | 2,570,000 | 2,532,545 | ||||||
Shire Acquisitions Investments Ireland DAC | ||||||||
1.90%, 09/23/2019 | 895,000 | 890,884 | ||||||
2.40%, 09/23/2021 | 3,557,000 | 3,515,170 | ||||||
2.88%, 09/23/2023 | 5,510,000 | 5,460,586 | ||||||
3.20%, 09/23/2026 | 5,420,000 | 5,300,527 | ||||||
Smithfield Foods, Inc. | ||||||||
4.25%, 02/01/2027 (Acquired 01/25/2017 through 01/30/2017, Cost $1,288,492) (1) | 1,290,000 | 1,322,967 | ||||||
Spectrum Brands, Inc. | ||||||||
5.75%, 07/15/2025 | 175,000 | 187,705 | ||||||
Surgery Center Holdings, Inc. | ||||||||
6.75%, 07/01/2025 (Acquired 06/19/2017, Cost $58,000) (1) | 58,000 | 58,725 | ||||||
Tenet Healthcare Corp. | ||||||||
4.75%, 06/15/2020 | 1,500,000 | 1,515,000 | ||||||
4.50%, 04/01/2021 | 350,000 | 355,687 | ||||||
4.38%, 10/01/2021 | 500,000 | 507,500 | ||||||
7.50%, 01/01/2022 (Acquired 12/06/2016, Cost $1,030,810) (1) | 1,000,000 | 1,084,800 | ||||||
4.63%, 07/15/2024 (Acquired 06/05/2017, Cost $2,074,000) (1) | 2,074,000 | 2,076,593 | ||||||
Teva Pharmaceutical Finance IV BV | ||||||||
3.65%, 11/10/2021 | 725,000 | 748,581 | ||||||
Teva Pharmaceutical Finance Netherlands III BV | ||||||||
2.80%, 07/21/2023 | 8,985,000 | 8,738,012 | ||||||
3.15%, 10/01/2026 | 9,197,000 | 8,735,108 | ||||||
THC Escrow Corp. III | ||||||||
4.63%, 07/15/2024 (Acquired 06/05/2017, Cost $2,030,000) (1) | 2,030,000 | 2,035,481 | ||||||
Transurban Finance Co. Pty Ltd. | ||||||||
4.13%, 02/02/2026 (Acquired 10/27/2015, Cost $153,816) (1) | 155,000 | 160,885 | ||||||
3.38%, 03/22/2027 (Acquired 09/15/2016, Cost $377,413) (1) | 380,000 | 371,170 | ||||||
Tyson Foods, Inc. | ||||||||
4.55%, 06/02/2047 | 705,000 | 743,272 | ||||||
UBM Plc | ||||||||
5.75%, 11/03/2020 (Acquired 07/13/2015 through 09/29/2016, Cost $3,122,350) (1)(6)(8) | 2,925,000 | 3,078,969 | ||||||
UnitedHealth Group, Inc. | ||||||||
4.75%, 07/15/2045 | 1,000,000 | 1,150,316 | ||||||
| Principal | ||||||||
| Amount | Value | |||||||
Universal Health Services, Inc. | ||||||||
4.75%, 08/01/2022 (Acquired 08/24/2015 through 12/16/2016, Cost $7,690,343) (1) | 7,595,000 | 7,851,331 | ||||||
5.00%, 06/01/2026 (Acquired 05/19/2016 through 12/14/2016, Cost $5,210,115) (1) | 5,247,000 | 5,443,763 | ||||||
University of Southern California | ||||||||
3.03%, 10/01/2039 | 2,750,000 | 2,580,820 | ||||||
Valeant Pharmaceuticals International, Inc. | ||||||||
6.38%, 10/15/2020 (Acquired 06/13/2016 through 07/07/2016, Cost $273,689) (1) | 300,000 | 290,625 | ||||||
6.50%, 03/15/2022 (Acquired 03/09/2017, Cost $900,000) (1) | 900,000 | 943,875 | ||||||
5.50%, 03/01/2023 (Acquired 07/21/2015 through 06/06/2016, Cost $3,662,141) (1) | 4,015,000 | 3,407,691 | ||||||
5.88%, 05/15/2023 (Acquired 08/12/2015 through 09/06/2016, Cost $649,876) (1) | 700,000 | 600,250 | ||||||
6.13%, 04/15/2025 (Acquired 05/27/2016, Cost $863,019) (1) | 1,000,000 | 846,250 | ||||||
Verisk Analytics, Inc. | ||||||||
4.88%, 01/15/2019 | 540,000 | 562,318 | ||||||
WellCare Health Plans, Inc. | ||||||||
5.25%, 04/01/2025 | 785,000 | 822,288 | ||||||
Wm Wrigley Jr Co. | ||||||||
2.40%, 10/21/2018 (Acquired 07/13/2015 through 05/25/2016, Cost $1,629,331) (1) | 1,620,000 | 1,630,976 | ||||||
3.38%, 10/21/2020 (Acquired 07/22/2015 through 06/20/2016, Cost $3,146,194) (1) | 3,040,000 | 3,137,696 | ||||||
|
| |||||||
| 338,787,882 | ||||||||
|
| |||||||
Diversified - 0.04% | ||||||||
Alfa SAB de CV | ||||||||
6.88%, 03/25/2044 | 1,000,000 | 1,090,000 | ||||||
RWT Holdings, Inc. | ||||||||
5.63%, 11/15/2019 | 1,460,000 | 1,527,525 | ||||||
|
| |||||||
| 2,617,525 | ||||||||
|
| |||||||
Energy - 2.86% | ||||||||
Antero Resources Corp. | ||||||||
5.00%, 03/01/2025 (Acquired 06/23/2017, Cost $430,893) (1) | 450,000 | 436,500 | ||||||
APT Pipelines Ltd. | ||||||||
3.88%, 10/11/2022 (Acquired 08/06/2015 through 08/19/2015, Cost $1,355,435) (1) | 1,360,000 | 1,404,906 | ||||||
Boardwalk Pipelines LP | ||||||||
3.38%, 02/01/2023 | 330,000 | 327,344 | ||||||
5.95%, 06/01/2026 | 1,610,000 | 1,792,922 | ||||||
4.45%, 07/15/2027 | 350,000 | 358,376 | ||||||
BP Capital Markets Plc | ||||||||
3.06%, 03/17/2022 | 1,525,000 | 1,558,637 | ||||||
Canadian Natural Resources Ltd. | ||||||||
| Principal | ||||||||
| Amount | Value | |||||||
5.90%, 02/01/2018 | 442,000 | 452,157 | ||||||
3.90%, 02/01/2025 | 130,000 | 131,608 | ||||||
3.85%, 06/01/2027 | 2,045,000 | 2,033,241 | ||||||
6.25%, 03/15/2038 | 2,290,000 | 2,701,538 | ||||||
Cenovus Energy, Inc. | ||||||||
5.70%, 10/15/2019 | 40,000 | 42,215 | ||||||
4.25%, 04/15/2027 (Acquired 05/11/2017 through 05/26/2017, Cost $1,235,308) (1) | 1,245,000 | 1,186,144 | ||||||
5.40%, 06/15/2047 (Acquired 06/02/2017 through 06/16/2017, Cost $2,511,584) (1) | 2,620,000 | 2,448,563 | ||||||
Cheniere Corpus Christi Holdings LLC | ||||||||
5.88%, 03/31/2025 | 400,000 | 426,500 | ||||||
5.13%, 06/30/2027 (Acquired 05/15/2017, Cost $195,000) (1) | 195,000 | 199,875 | ||||||
Chesapeake Energy Corp. | ||||||||
6.13%, 02/15/2021 | 182,000 | 178,360 | ||||||
5.50%, 09/15/2026 (Acquired 02/22/2017 through 06/23/2017, Cost $2,475,223) (1) | 2,485,000 | 2,323,475 | ||||||
Cimarex Energy Co. | ||||||||
4.38%, 06/01/2024 | 1,819,000 | 1,906,907 | ||||||
CNOOC Nexen Finance 2014 ULC | ||||||||
4.25%, 04/30/2024 | 900,000 | 947,000 | ||||||
Concho Resources, Inc. | ||||||||
5.50%, 10/01/2022 | 210,000 | 215,512 | ||||||
ConocoPhillips Co. | ||||||||
4.95%, 03/15/2026 | 1,777,000 | 1,979,262 | ||||||
Continental Resources, Inc./OK | ||||||||
4.50%, 04/15/2023 | 250,000 | 238,750 | ||||||
3.80%, 06/01/2024 | 5,360,000 | 4,907,723 | ||||||
Diamond Offshore Drilling, Inc. | ||||||||
5.88%, 05/01/2019 | 414,000 | 425,385 | ||||||
Diamondback Energy, Inc. | ||||||||
4.75%, 11/01/2024 (Acquired 05/24/2017 through 05/25/2017, Cost $643,468) (1) | 639,000 | 635,805 | ||||||
Enable Midstream Partners LP | ||||||||
2.40%, 05/15/2019 | 600,000 | 597,671 | ||||||
3.90%, 05/15/2024 | 310,000 | 307,446 | ||||||
Enable Oklahoma Intrastate Transmission LLC | ||||||||
6.25%, 03/15/2020 (Acquired 05/08/2017, Cost $1,136,576) (1) | 1,060,000 | 1,140,147 | ||||||
Enbridge Energy Partners LP | ||||||||
5.88%, 10/15/2025 | 2,383,000 | 2,718,710 | ||||||
Enbridge, Inc. | ||||||||
150
| Principal | ||||||||
| Amount | Value | |||||||
6.00%, 01/15/2077 | 1,790,000 | 1,877,262 | ||||||
Energy Transfer Partners LP | ||||||||
4.15%, 10/01/2020 | 1,504,000 | 1,561,940 | ||||||
4.05%, 03/15/2025 | 4,555,000 | 4,573,675 | ||||||
4.75%, 01/15/2026 | 5,707,000 | 5,937,643 | ||||||
6.50%, 02/01/2042 | 1,000,000 | 1,118,297 | ||||||
5.15%, 03/15/2045 | 700,000 | 680,972 | ||||||
EnLink Midstream Partners LP | ||||||||
4.40%, 04/01/2024 | 35,000 | 35,535 | ||||||
4.15%, 06/01/2025 | 6,795,000 | 6,710,742 | ||||||
4.85%, 07/15/2026 | 440,000 | 457,827 | ||||||
Ensco Plc | ||||||||
8.00%, 01/31/2024 | 266,000 | 250,040 | ||||||
Florida Gas Transmission Co. LLC | ||||||||
7.90%, 05/15/2019 (Acquired 03/07/2017, Cost $4,386,562) (1) | 4,000,000 | 4,387,296 | ||||||
Gulfport Energy Corp. | ||||||||
6.38%, 05/15/2025 (Acquired 12/15/2016, Cost $215,000) (1) | 215,000 | 211,775 | ||||||
Helmerich & Payne International Drilling Co. | ||||||||
4.65%, 03/15/2025 | 1,894,000 | 1,986,283 | ||||||
Hess Corp. | ||||||||
4.30%, 04/01/2027 | 1,730,000 | 1,690,013 | ||||||
Kinder Morgan, Inc./DE | ||||||||
4.30%, 06/01/2025 | 1,135,000 | 1,180,137 | ||||||
Matador Resources Co. | ||||||||
6.88%, 04/15/2023 | 530,000 | 549,875 | ||||||
Motiva Enterprises LLC | ||||||||
5.75%, 01/15/2020 (Acquired 07/22/2015 through 06/20/2016, Cost $1,320,025) (1) | 1,244,000 | 1,331,232 | ||||||
Nabors Industries, Inc. | ||||||||
0.75%, 01/15/2024 (Acquired 01/10/2017 through 06/02/2017, Cost $2,443,303) (1) | 2,550,000 | 2,028,844 | ||||||
Newfield Exploration Co. | ||||||||
5.63%, 07/01/2024 | 213,000 | 222,053 | ||||||
5.38%, 01/01/2026 | 3,715,000 | 3,845,025 | ||||||
Oceaneering International, Inc. | ||||||||
4.65%, 11/15/2024 | 2,605,000 | 2,569,259 | ||||||
Parsley Energy LLC / Parsley Finance Corp. | ||||||||
5.38%, 01/15/2025 (Acquired 06/16/2017, Cost $300,375) (1) | 300,000 | 302,250 | ||||||
Pertamina Persero PT | ||||||||
| Principal | ||||||||
| Amount | Value | |||||||
6.00%, 05/03/2042 | 280,000 | 302,261 | ||||||
6.00%, 05/03/2042 | 200,000 | 215,900 | ||||||
Petrobras Global Finance BV | ||||||||
8.38%, 05/23/2021 | 460,000 | 514,915 | ||||||
6.13%, 01/17/2022 | 16,825,000 | 17,371,812 | ||||||
8.75%, 05/23/2026 | 1,915,000 | 2,202,250 | ||||||
6.25%, 12/14/2026* | GBP 5,330,000 | 7,052,854 | ||||||
7.38%, 01/17/2027 | $ | 3,300,000 | 3,491,400 | |||||
5.63%, 05/20/2043 | 2,715,000 | 2,260,237 | ||||||
7.25%, 03/17/2044 | 1,159,000 | 1,139,587 | ||||||
Petroleos Mexicanos | ||||||||
3.50%, 07/18/2018 | 2,730,000 | 2,763,033 | ||||||
6.38%, 02/04/2021 | 1,295,000 | 1,401,579 | ||||||
4.88%, 01/24/2022 | 300,000 | 308,550 | ||||||
5.38%, 03/13/2022 (Acquired 12/06/2016, Cost $392,981) (1) | 395,000 | 415,836 | ||||||
4.50%, 01/23/2026 | 1,105,000 | 1,074,093 | ||||||
Plains All American Pipeline LP / PAA Finance Corp. | ||||||||
4.65%, 10/15/2025 | 1,000,000 | 1,025,081 | ||||||
QEP Resources, Inc. | ||||||||
5.38%, 10/01/2022 | 358,000 | 344,575 | ||||||
Raizen Fuels Finance SA | ||||||||
5.30%, 01/20/2027 (Acquired 01/12/2017, Cost $560,000) (1) | 560,000 | 567,700 | ||||||
Regency Energy Partners LP / Regency Energy Finance Corp. | ||||||||
5.88%, 03/01/2022 | 1,521,000 | 1,675,343 | ||||||
4.50%, 11/01/2023 | 349,000 | 362,082 | ||||||
Rowan Cos, Inc. | ||||||||
7.38%, 06/15/2025 | 975,000 | 909,188 | ||||||
Sabine Pass Liquefaction LLC | ||||||||
5.75%, 05/15/2024 | 650,000 | 723,836 | ||||||
5.63%, 03/01/2025 | 6,004,000 | 6,629,557 | ||||||
5.88%, 06/30/2026 | 2,130,000 | 2,383,889 | ||||||
5.00%, 03/15/2027 | 6,809,000 | 7,248,698 | ||||||
4.20%, 03/15/2028 (Acquired 02/28/2017 through 03/01/2017, Cost $1,895,389) (1) | 1,900,000 | 1,919,804 | ||||||
Schlumberger Holdings Corp. | ||||||||
3.00%, 12/21/2020 (Acquired 12/10/2015, Cost $599,037) (1) | 600,000 | 610,865 | ||||||
4.00%, 12/21/2025 (Acquired 12/10/2015 through 06/21/2016, Cost $4,381,817) (1) | 4,235,000 | 4,439,931 | ||||||
Shell International Finance BV | ||||||||
| Principal | ||||||||
| Amount | Value | |||||||
3.25%, 05/11/2025 | 3,900,000 | 3,978,265 | ||||||
2.88%, 05/10/2026 | 2,495,000 | 2,462,223 | ||||||
4.38%, 05/11/2045 | 1,000,000 | 1,048,041 | ||||||
SM Energy Co. | ||||||||
1.50%, 07/01/2021 | 285,000 | 256,144 | ||||||
6.13%, 11/15/2022 | 10,000 | 9,500 | ||||||
5.00%, 01/15/2024 | 115,000 | 101,775 | ||||||
5.63%, 06/01/2025 | 75,000 | 67,687 | ||||||
Southern Natural Gas Co. LLC | ||||||||
4.80%, 03/15/2047 (Acquired 03/07/2017, Cost $2,906,761) (1) | 2,915,000 | 3,089,142 | ||||||
Southwestern Energy Co. | ||||||||
6.70%, 01/23/2025 | 2,675,000 | 2,614,813 | ||||||
Spectra Energy Partners LP | ||||||||
4.75%, 03/15/2024 | 1,636,000 | 1,763,297 | ||||||
3.38%, 10/15/2026 | 2,605,000 | 2,546,565 | ||||||
4.50%, 03/15/2045 | 250,000 | 246,729 | ||||||
Sunoco Logistics Partners Operations LP | ||||||||
4.25%, 04/01/2024 | 1,500,000 | 1,537,886 | ||||||
Tallgrass Energy Partners LP / Tallgrass Energy Finance Corp. | ||||||||
5.50%, 09/15/2024 (Acquired 08/18/2016 through 05/11/2017, Cost $750,000) (1) | 750,000 | 759,375 | ||||||
Targa Resources Partners LP / Targa Resources Partners Finance Corp. | ||||||||
4.13%, 11/15/2019 | 380,000 | 384,275 | ||||||
6.75%, 03/15/2024 | 825,000 | 886,875 | ||||||
Tesoro Corp. | ||||||||
4.75%, 12/15/2023 (Acquired 12/15/2016, Cost $1,580,000) (1) | 1,580,000 | 1,701,502 | ||||||
5.13%, 12/15/2026 (Acquired 12/15/2016, Cost $1,955,000) (1) | 1,955,000 | 2,126,258 | ||||||
Tesoro Logistics LP / Tesoro Logistics Finance Corp. | ||||||||
5.25%, 01/15/2025 | 390,000 | 409,500 | ||||||
Texas Eastern Transmission LP | ||||||||
2.80%, 10/15/2022 (Acquired 07/16/2015 through 08/12/2016, Cost $3,084,689) (1) | 3,125,000 | 3,065,409 | ||||||
Transocean Phoenix 2 Ltd. | ||||||||
7.75%, 10/15/2024 (Acquired 06/27/2017, Cost $94,989) (1) | 89,300 | 94,881 | ||||||
Transocean Proteus Ltd. | ||||||||
6.25%, 12/01/2024 (Acquired 06/13/2017 through 06/27/2017, Cost $409,279) (1) | 398,050 | 406,011 | ||||||
Western Gas Partners LP | ||||||||
5.45%, 04/01/2044 | 1,200,000 | 1,219,645 | ||||||
Whiting Petroleum Corp. | ||||||||
| Principal | ||||||||
| Amount | Value | |||||||
1.25%, 04/01/2020 | 900,000 | 760,500 | ||||||
Williams Partners LP | ||||||||
3.60%, 03/15/2022 | 1,135,000 | 1,159,459 | ||||||
3.35%, 08/15/2022 | 1,000,000 | 1,005,255 | ||||||
6.30%, 04/15/2040 | 1,323,000 | 1,534,970 | ||||||
Woodside Finance Ltd. | ||||||||
3.65%, 03/05/2025 (Acquired 10/05/2016, Cost $518,150) (1) | 515,000 | 513,176 | ||||||
3.70%, 09/15/2026 (Acquired 09/08/2016 through 10/04/2016, Cost $981,018) (1) | 980,000 | 965,089 | ||||||
|
| |||||||
| 183,599,757 | ||||||||
|
| |||||||
Financials - 13.17% | ||||||||
ACE INA Holdings, Inc. | ||||||||
2.30%, 11/03/2020 | 485,000 | 487,724 | ||||||
AerCap Ireland Capital DAC / AerCap Global Aviation Trust | ||||||||
3.50%, 05/26/2022 | 820,000 | 841,425 | ||||||
AerCap Ireland Capital Ltd. / AerCap Global Aviation Trust | ||||||||
3.95%, 02/01/2022 | 4,272,000 | 4,447,460 | ||||||
4.63%, 07/01/2022 | 450,000 | 482,224 | ||||||
Aircastle Ltd. | ||||||||
5.00%, 04/01/2023 | 1,175,000 | 1,254,312 | ||||||
4.13%, 05/01/2024 | 2,420,000 | 2,459,325 | ||||||
Alexandria Real Estate Equities, Inc. | ||||||||
3.95%, 01/15/2028 | 490,000 | 498,328 | ||||||
Allied World Assurance Co. Holdings Ltd. | ||||||||
4.35%, 10/29/2025 | 2,490,000 | 2,528,169 | ||||||
Ally Financial, Inc. | ||||||||
4.75%, 09/10/2018 | 600,000 | 616,500 | ||||||
3.25%, 11/05/2018 | 505,000 | 511,161 | ||||||
8.00%, 12/31/2018 | 893,000 | 963,324 | ||||||
4.63%, 03/30/2025 | 1,875,000 | 1,920,337 | ||||||
8.00%, 11/01/2031 | 14,690,000 | 17,995,250 | ||||||
American Campus Communities Operating Partnership LP | ||||||||
3.35%, 10/01/2020 | 1,900,000 | 1,949,138 | ||||||
American Express Credit Corp. | ||||||||
7.00%, 03/19/2018 | 1,608,000 | 1,667,792 | ||||||
American International Group, Inc. | ||||||||
3.90%, 04/01/2026 | 4,800,000 | 4,910,990 | ||||||
American Tower Trust #1 | ||||||||
| Principal | ||||||||
| Amount | Value | |||||||
1.55%, 03/15/2043 (Acquired 01/11/2017, Cost $328,366) (1) | 329,000 | 328,336 | ||||||
Banco Santander SA | ||||||||
3.50%, 04/11/2022 | 1,800,000 | 1,842,055 | ||||||
Bank of America Corp. | ||||||||
6.40%, 08/28/2017 | 1,000,000 | 1,007,103 | ||||||
6.00%, 09/01/2017 | 1,000,000 | 1,006,881 | ||||||
5.75%, 12/01/2017 | 3,355,000 | 3,411,817 | ||||||
6.88%, 04/25/2018 | 4,390,000 | 4,568,397 | ||||||
5.65%, 05/01/2018 | 8,930,000 | 9,210,509 | ||||||
7.63%, 06/01/2019 | 8,125,000 | 8,963,825 | ||||||
3.30%, 01/11/2023 | 4,615,000 | 4,705,311 | ||||||
4.10%, 07/24/2023 | 975,000 | 1,032,016 | ||||||
4.00%, 04/01/2024 | 3,955,000 | 4,144,642 | ||||||
4.20%, 08/26/2024 | 340,000 | 352,733 | ||||||
3.88%, 08/01/2025 | 4,400,000 | 4,552,266 | ||||||
4.45%, 03/03/2026 | 810,000 | 843,083 | ||||||
4.25%, 10/22/2026 | 8,975,000 | 9,243,182 | ||||||
3.25%, 10/21/2027 | 4,995,000 | 4,827,388 | ||||||
3.82%, 01/20/2028 | 2,630,000 | 2,675,949 | ||||||
3.71%, 04/24/2028 | 8,100,000 | 8,161,106 | ||||||
4.24%, 04/24/2038 | 3,020,000 | 3,144,089 | ||||||
Bank of Montreal | ||||||||
1.50%, 07/18/2019 | 4,000,000 | 3,962,592 | ||||||
Barclays Plc | ||||||||
5.14%, 10/14/2020 | 275,000 | 294,304 | ||||||
3.68%, 01/10/2023 | 3,060,000 | 3,139,410 | ||||||
4.38%, 09/11/2024 | 1,980,000 | 2,003,942 | ||||||
4.38%, 01/12/2026 | 4,325,000 | 4,494,177 | ||||||
5.20%, 05/12/2026 | 640,000 | 673,218 | ||||||
4.84%, 05/09/2028 | 4,500,000 | 4,600,782 | ||||||
8.25%, 12/15/2048 | 8,435,000 | 8,941,100 | ||||||
7.25%, 03/15/2163* | GBP 14,083,000 | 19,349,974 | ||||||
BBVA Bancomer SA/Texas | ||||||||
4.38%, 04/10/2024 (Acquired 04/06/2017, Cost $2,891,866) (1) | $ | 2,800,000 | 2,906,400 | |||||
Berkshire Hathaway Finance Corp. | ||||||||
1.30%, 08/15/2019 | 1,880,000 | 1,866,432 | ||||||
4.40%, 05/15/2042 | 1,000,000 | 1,090,583 | ||||||
| Principal | ||||||||
| Amount | Value | |||||||
BNP Paribas SA | ||||||||
2.95%, 05/23/2022 (Acquired 05/16/2017, Cost $1,917,648) (1) | 1,920,000 | 1,938,897 | ||||||
3.80%, 01/10/2024 (Acquired 06/16/2017 through 06/22/2017, Cost $656,878) (1) | 630,000 | 655,933 | ||||||
Boston Properties LP | ||||||||
3.65%, 02/01/2026 | 415,000 | 419,997 | ||||||
2.75%, 10/01/2026 | 5,660,000 | 5,344,580 | ||||||
BPCE SA | ||||||||
3.00%, 05/22/2022 (Acquired 05/15/2017 through 06/22/2017, Cost $1,914,669) (1) | 1,910,000 | 1,926,611 | ||||||
4.88%, 04/01/2026 (Acquired 04/26/2016 through 05/23/2016, Cost $2,749,854) (1) | 2,740,000 | 2,895,632 | ||||||
Brixmor Operating Partnership LP | ||||||||
3.88%, 08/15/2022 | 1,155,000 | 1,180,866 | ||||||
3.65%, 06/15/2024 | 2,825,000 | 2,778,498 | ||||||
3.85%, 02/01/2025 | 645,000 | 636,587 | ||||||
4.13%, 06/15/2026 | 2,980,000 | 2,962,999 | ||||||
3.90%, 03/15/2027 | 2,553,000 | 2,490,424 | ||||||
Capital One Bank USA NA | ||||||||
3.38%, 02/15/2023 | 2,538,000 | 2,559,342 | ||||||
Capital One Financial Co. | ||||||||
3.50%, 06/15/2023 | 2,790,000 | 2,845,619 | ||||||
Capital One NA/Mclean VA | ||||||||
2.35%, 08/17/2018 | 1,000,000 | 1,004,045 | ||||||
Carlyle Holdings Finance LLC | ||||||||
3.88%, 02/01/2023 (Acquired 07/31/2015 through 06/15/2016, Cost $1,636,548) (1) | 1,596,000 | 1,638,663 | ||||||
CBOE Holdings, Inc. | ||||||||
3.65%, 01/12/2027 | 2,445,000 | 2,466,294 | ||||||
CBRE Services, Inc. | ||||||||
5.25%, 03/15/2025 | 2,675,000 | 2,913,230 | ||||||
4.88%, 03/01/2026 | 2,860,000 | 3,045,177 | ||||||
CC Holdings GS V LLC / Crown Castle GS III Corp. | ||||||||
3.85%, 04/15/2023 | 2,450,000 | 2,575,295 | ||||||
CIT Group, Inc. | ||||||||
5.50%, 02/15/2019 (Acquired 07/13/2015 through 07/24/2015, Cost $479,348) (1) | 468,000 | 491,400 | ||||||
Citigroup, Inc. | ||||||||
6.00%, 08/15/2017 | 1,000,000 | 1,004,907 | ||||||
6.13%, 11/21/2017 | 2,720,000 | 2,765,342 | ||||||
1.80%, 02/05/2018 | 10,000,000 | 10,007,700 | ||||||
6.13%, 05/15/2018 | 2,000,000 | 2,073,798 | ||||||
| Principal | ||||||||
| Amount | Value | |||||||
2.15%, 07/30/2018 | 7,055,000 | 7,077,336 | ||||||
2.50%, 09/26/2018 | 5,000,000 | 5,034,015 | ||||||
3.50%, 05/15/2023 | 1,660,000 | 1,682,739 | ||||||
2.29%, 09/01/2023 | 3,473,000 | 3,537,494 | ||||||
3.20%, 10/21/2026 | 6,430,000 | 6,253,979 | ||||||
3.89%, 01/10/2028 | 7,818,000 | 7,945,988 | ||||||
Citizens Financial Group, Inc. | ||||||||
5.16%, 06/29/2023 | 6,200,000 | 6,385,777 | ||||||
CNA Financial Corp. | ||||||||
5.88%, 08/15/2020 | 1,700,000 | 1,872,037 | ||||||
Cooperatieve Centrale Raiffeisen-Boerenleenbank BA/Netherlands | ||||||||
4.38%, 08/04/2025 | 1,225,000 | 1,284,729 | ||||||
CPPIB Capital, Inc. | ||||||||
1.25%, 09/20/2019 (Acquired 09/13/2016 through 10/21/2016, Cost $7,387,189) (1) | 7,400,000 | 7,317,867 | ||||||
Credit Agricole SA | ||||||||
4.38%, 03/17/2025 (Acquired 07/31/2015 through 01/31/2017, Cost $8,882,124) (1) | 8,975,000 | 9,302,587 | ||||||
8.13%, 09/19/2033 | 4,200,000 | 4,467,750 | ||||||
Crown Castle International Corp. | ||||||||
4.88%, 04/15/2022 | 4,006,000 | 4,375,786 | ||||||
5.25%, 01/15/2023 | 565,000 | 627,548 | ||||||
4.00%, 03/01/2027 | 1,461,000 | 1,503,937 | ||||||
4.75%, 05/15/2047 | 3,255,000 | 3,313,388 | ||||||
CTR Partnership LP / CareTrust Capital Corp. | ||||||||
5.25%, 06/01/2025 | 194,000 | 199,820 | ||||||
Dexia Credit Local SA | ||||||||
2.25%, 02/18/2020 (Acquired 01/10/2017, Cost $7,049,378) (1) | 7,070,000 | 7,082,761 | ||||||
Digital Realty Trust LP | ||||||||
4.75%, 10/01/2025 | 1,640,000 | 1,764,100 | ||||||
Discover Financial Services | ||||||||
2.60%, 11/13/2018 | 2,010,000 | 2,027,192 | ||||||
3.10%, 06/04/2020 | 2,000,000 | 2,037,938 | ||||||
3.95%, 11/06/2024 | 2,167,000 | 2,200,738 | ||||||
3.75%, 03/04/2025 | 6,262,000 | 6,187,845 | ||||||
4.10%, 02/09/2027 | 2,835,000 | 2,840,191 | ||||||
E*TRADE Financial Corp. | ||||||||
5.38%, 11/15/2022 | 2,947,000 | 3,097,869 | ||||||
4.63%, 09/15/2023 | 5,505,000 | 5,725,200 | ||||||
| Principal | ||||||||
| Amount | Value | |||||||
Essex Portfolio LP | ||||||||
3.63%, 05/01/2027 | 2,785,000 | 2,778,436 | ||||||
Exela Intermediate LLC / Exela Finance, Inc. | ||||||||
10.00%, 07/15/2023 (Acquired 06/28/2017, Cost $300,000) (1) | 300,000 | 296,250 | ||||||
Farmers Exchange Capital II | ||||||||
6.15%, 11/01/2053 (Acquired 08/31/2015, Cost $298,150) (1) | 280,000 | 324,100 | ||||||
Farmers Exchange Capital III | ||||||||
5.45%, 10/15/2054 (Acquired 08/30/2016, Cost $4,101,816) (1) | 4,000,000 | 4,351,080 | ||||||
Goldman Sachs Group, Inc./The | ||||||||
5.95%, 01/18/2018 | 4,000,000 | 4,089,436 | ||||||
2.38%, 01/22/2018 | 2,000,000 | 2,008,894 | ||||||
6.15%, 04/01/2018 | 12,500,000 | 12,901,225 | ||||||
7.50%, 02/15/2019 | 2,865,000 | 3,107,771 | ||||||
5.25%, 07/27/2021 | 2,800,000 | 3,068,654 | ||||||
5.75%, 01/24/2022 | 2,190,000 | 2,465,412 | ||||||
3.00%, 04/26/2022 | 2,120,000 | 2,139,602 | ||||||
3.63%, 01/22/2023 | 5,055,000 | 5,216,699 | ||||||
3.50%, 01/23/2025 | 2,622,000 | 2,650,711 | ||||||
3.50%, 11/16/2026 | 5,660,000 | 5,630,574 | ||||||
3.69%, 06/05/2028 | 3,000,000 | 3,012,240 | ||||||
6.75%, 10/01/2037 | 460,000 | 598,432 | ||||||
Goodman US Finance One LLC | ||||||||
6.38%, 04/15/2021 (Acquired 07/13/2015 through 08/21/2015, Cost $2,087,545) (1) | 1,915,000 | 2,144,099 | ||||||
HCP, Inc. | ||||||||
4.20%, 03/01/2024 | 1,175,000 | 1,221,712 | ||||||
3.40%, 02/01/2025 | 1,500,000 | 1,477,175 | ||||||
Healthcare Realty Trust, Inc. | ||||||||
3.75%, 04/15/2023 | 1,356,000 | 1,379,177 | ||||||
Healthcare Trust of America Holdings LP | ||||||||
2.95%, 07/01/2022 | 3,335,000 | 3,326,886 | ||||||
Hercules Capital, Inc. | ||||||||
4.38%, 02/01/2022 (Acquired 01/20/2017 through 01/30/2017, Cost $1,270,000) (1) | 1,270,000 | 1,298,575 | ||||||
Highwoods Realty LP | ||||||||
7.50%, 04/15/2018 | 3,100,000 | 3,226,548 | ||||||
Host Hotels & Resorts LP | ||||||||
3.75%, 10/15/2023 | 2,175,000 | 2,217,519 | ||||||
4.50%, 02/01/2026 | 1,600,000 | 1,677,974 | ||||||
| Principal | ||||||||
| Amount | Value | |||||||
Howard Hughes Corp./The | ||||||||
5.38%, 03/15/2025 (Acquired 03/03/2017 through 06/12/2017, Cost $1,464,016) (1) | 1,462,000 | 1,494,895 | ||||||
HSBC Holdings Plc | ||||||||
2.95%, 05/25/2021 | 1,805,000 | 1,827,786 | ||||||
2.65%, 01/05/2022 | 1,340,000 | 1,335,467 | ||||||
4.30%, 03/08/2026 | 4,705,000 | 5,007,165 | ||||||
6.38%, 03/29/2049 | 1,500,000 | 1,596,000 | ||||||
6.00%, 05/22/2162 | 200,000 | 206,800 | ||||||
ING Bank NV | ||||||||
5.80%, 09/25/2023 (Acquired 07/29/2015 through 11/13/2015, Cost $3,184,951) (1) | 2,965,000 | 3,347,607 | ||||||
4.13%, 11/21/2023 | 1,840,000 | 1,880,042 | ||||||
International Lease Finance Corp. | ||||||||
7.13%, 09/01/2018 (Acquired 07/14/2015, Cost $523,117) (1) | 500,000 | 529,186 | ||||||
8.25%, 12/15/2020 | 1,700,000 | 2,001,430 | ||||||
Intesa Sanpaolo SpA | ||||||||
5.02%, 06/26/2024 (Acquired 07/29/2015, Cost $2,863,049) (1) | 2,900,000 | 2,941,281 | ||||||
5.71%, 01/15/2026 (Acquired 05/25/2016, Cost $971,752) (1) | 1,000,000 | 1,055,929 | ||||||
Intrum Justitia AB | ||||||||
2.75%, 07/15/2022 (Acquired 06/16/2017, Cost $111,999) (1)* | EUR 100,000 | 114,757 | ||||||
3.13%, 07/15/2024 (Acquired 06/16/2017, Cost $112,000) (1)* | 100,000 | 113,723 | ||||||
Jackson National Life Global Funding | ||||||||
1.88%, 10/15/2018 (Acquired 10/07/2015, Cost $999,773) (1) | $ | 1,000,000 | 1,001,816 | |||||
Jefferies Finance LLC / JFIN Co-Issuer Corp. | ||||||||
7.38%, 04/01/2020 (Acquired 03/19/2013, Cost $10,714,805) (1) | 10,370,000 | 10,629,250 | ||||||
Jefferies Group LLC | ||||||||
5.13%, 01/20/2023 | 3,100,000 | 3,375,357 | ||||||
JPMorgan Chase & Co. | ||||||||
6.00%, 10/01/2017 | 9,811,000 | 9,911,631 | ||||||
6.00%, 01/15/2018 | 1,915,000 | 1,958,057 | ||||||
2.75%, 06/23/2020 | 400,000 | 406,766 | ||||||
2.30%, 08/15/2021 | 4,393,000 | 4,367,015 | ||||||
4.50%, 01/24/2022 | 3,440,000 | 3,724,612 | ||||||
2.70%, 05/18/2023 | 1,850,000 | 1,829,469 | ||||||
2.38%, 10/24/2023 | 6,125,000 | 6,217,071 | ||||||
3.90%, 07/15/2025 | 2,100,000 | 2,190,222 | ||||||
3.30%, 04/01/2026 | 2,175,000 | 2,159,995 | ||||||
2.95%, 10/01/2026 | 6,830,000 | 6,592,336 | ||||||
| Principal | ||||||||
| Amount | Value | |||||||
3.54%, 05/01/2028 | 4,890,000 | 4,916,959 | ||||||
KeyCorp. | ||||||||
2.90%, 09/15/2020 | 980,000 | 996,870 | ||||||
Kilroy Realty LP | ||||||||
4.38%, 10/01/2025 | 1,515,000 | 1,588,915 | ||||||
KIRS Midco 3 Plc | ||||||||
8.38%, 07/15/2023 (Acquired 06/06/2017, Cost $774,483) (1)* | GBP 600,000 | 769,752 | ||||||
Kreditanstalt fuer Wiederaufbau | ||||||||
0.88%, 04/19/2018 | $ | 1,000,000 | 996,408 | |||||
Ladder Capital Finance Holdings LLLP / Ladder Capital Finance Corp. | ||||||||
5.88%, 08/01/2021 (Acquired 08/31/2015 through 10/14/2015, Cost $987,346) (1) | 1,025,000 | 1,048,062 | ||||||
Lazard Group LLC | ||||||||
4.25%, 11/14/2020 | 2,684,000 | 2,831,411 | ||||||
LeasePlan Co. NV | ||||||||
2.50%, 05/16/2018 (Acquired 07/13/2015 through 05/23/2016, Cost $3,329,401) (1) | 3,325,000 | 3,333,928 | ||||||
Liberty Mutual Group, Inc. | ||||||||
4.85%, 08/01/2044 (Acquired 07/21/2015 through 06/21/2016, Cost $3,031,275) (1) | 3,045,000 | 3,271,463 | ||||||
Liberty Property LP | ||||||||
4.13%, 06/15/2022 | 2,000,000 | 2,097,122 | ||||||
Lloyds Banking Group Plc | ||||||||
4.50%, 11/04/2024 | 2,825,000 | 2,942,071 | ||||||
4.65%, 03/24/2026 | 2,700,000 | 2,813,637 | ||||||
7.00%, 06/27/2164* | GBP 18,850,000 | 25,453,564 | ||||||
7.63%, 06/27/2164* | 1,900,000 | 2,734,468 | ||||||
7.88%, 06/27/2164* | 700,000 | 1,065,844 | ||||||
Marsh & McLennan Cos, Inc. | ||||||||
4.35%, 01/30/2047 | $ | 515,000 | 551,200 | |||||
MetLife, Inc. | ||||||||
6.40%, 12/15/2066 | 1,000,000 | 1,155,000 | ||||||
Metropolitan Life Global Funding I | ||||||||
1.55%, 09/13/2019 (Acquired 09/08/2016, Cost $6,957,633) (1) | 6,965,000 | 6,903,499 | ||||||
MGM Growth Properties Operating Partnership LP / MGP Finance Co-Issuer, Inc. | ||||||||
5.63%, 05/01/2024 | 579,000 | 631,110 | ||||||
Morgan Stanley | ||||||||
5.95%, 12/28/2017 | 6,145,000 | 6,270,481 | ||||||
6.63%, 04/01/2018 | 11,500,000 | 11,908,446 | ||||||
7.30%, 05/13/2019 | 2,000,000 | 2,186,610 | ||||||
| Principal | ||||||||
| Amount | Value | |||||||
2.63%, 11/17/2021 | 3,580,000 | 3,574,354 | ||||||
4.88%, 11/01/2022 | 1,365,000 | 1,481,867 | ||||||
3.75%, 02/25/2023 | 5,000,000 | 5,198,975 | ||||||
3.70%, 10/23/2024 | 565,000 | 579,885 | ||||||
5.00%, 11/24/2025 | 7,275,000 | 7,911,985 | ||||||
3.88%, 01/27/2026 | 3,025,000 | 3,114,473 | ||||||
3.13%, 07/27/2026 | 900,000 | 875,113 | ||||||
3.63%, 01/20/2027 | 2,875,000 | 2,893,348 | ||||||
3.95%, 04/23/2027 | 2,630,000 | 2,646,814 | ||||||
MPT Operating Partnership LP / MPT Finance Corp. | ||||||||
5.25%, 08/01/2026 | 70,000 | 72,565 | ||||||
Nationwide Building Society | ||||||||
3.90%, 07/21/2025 (Acquired 07/14/2015 through 06/28/2016, Cost $1,774,258) (1) | 1,725,000 | 1,804,298 | ||||||
4.00%, 09/14/2026 (Acquired 09/07/2016, Cost $653,201) (1) | 655,000 | 647,947 | ||||||
Nationwide Mutual Insurance Co. | ||||||||
3.54%, 12/15/2024 (Acquired 09/29/2015, Cost $1,014,956) (1) | 1,050,000 | 1,048,950 | ||||||
Navient Corp. | ||||||||
5.50%, 01/15/2019 | 2,140,000 | 2,228,275 | ||||||
4.88%, 06/17/2019 | 7,550,000 | 7,852,000 | ||||||
8.00%, 03/25/2020 | 4,503,000 | 5,032,102 | ||||||
5.88%, 03/25/2021 | 6,223,000 | 6,573,044 | ||||||
Neuberger Berman Group LLC / Neuberger Berman Finance Corp. | ||||||||
4.88%, 04/15/2045 (Acquired 07/22/2015 through 08/31/2016, Cost $2,869,067) (1) | 3,244,000 | 3,152,928 | ||||||
New York Life Global Funding | ||||||||
1.55%, 11/02/2018 (Acquired 10/27/2015, Cost $1,998,707) (1) | 2,000,000 | 1,996,594 | ||||||
1.50%, 10/24/2019 (Acquired 10/17/2016, Cost $7,228,543) (1) | 7,230,000 | 7,170,143 | ||||||
2.35%, 07/14/2026 (Acquired 07/11/2016, Cost $999,434) (1) | 1,000,000 | 956,972 | ||||||
Old Republic International Corp. | ||||||||
4.88%, 10/01/2024 | 1,600,000 | 1,711,602 | ||||||
3.88%, 08/26/2026 | 4,305,000 | 4,303,334 | ||||||
OneMain Financial Holdings LLC | ||||||||
6.75%, 12/15/2019 (Acquired 05/10/2017 through 05/19/2017, Cost $8,693,109) (1) | 8,299,000 | 8,713,950 | ||||||
Oppenheimer Holdings, Inc. | ||||||||
6.75%, 07/01/2022 (Acquired 06/16/2017, Cost $112,000) (1) | 112,000 | 112,560 | ||||||
PNC Bank NA | ||||||||
1.50%, 02/23/2018 | 6,690,000 | 6,690,355 | ||||||
Post Apartment Homes LP | ||||||||
| Principal | ||||||||
| Amount | Value | |||||||
4.75%, 10/15/2017 | 91,000 | 91,081 | ||||||
Principal Financial Group, Inc. | ||||||||
4.70%, 05/15/2055 | 1,435,000 | 1,481,637 | ||||||
Prologis LP | ||||||||
3.75%, 11/01/2025 | 1,325,000 | 1,379,534 | ||||||
Protective Life Global Funding | ||||||||
1.77%, 06/08/2018 (Acquired 06/07/2016, Cost $4,000,000) (1) | 4,000,000 | 4,010,260 | ||||||
2.70%, 11/25/2020 (Acquired 11/19/2015, Cost $1,948,808) (1) | 1,950,000 | 1,964,325 | ||||||
Provident Funding Associates LP / PFG Finance Corp. | ||||||||
6.38%, 06/15/2025 (Acquired 05/24/2017, Cost $111,000) (1) | 111,000 | 113,775 | ||||||
Quicken Loans, Inc. | ||||||||
5.75%, 05/01/2025 (Acquired 07/22/2015 through 11/12/2015, Cost $788,964) (1) | 815,000 | 841,487 | ||||||
Raymond James Financial, Inc. | ||||||||
4.95%, 07/15/2046 | 2,000,000 | 2,173,474 | ||||||
Regency Centers LP | ||||||||
3.60%, 02/01/2027 | 685,000 | 680,349 | ||||||
Reinsurance Group of America, Inc. | ||||||||
5.00%, 06/01/2021 | 500,000 | 543,382 | ||||||
4.70%, 09/15/2023 | 1,000,000 | 1,084,785 | ||||||
Retail Opportunity Investments Partnership LP | ||||||||
4.00%, 12/15/2024 | 895,000 | 866,865 | ||||||
Rio Oil Finance Trust Series 2014-1 | ||||||||
9.25%, 07/06/2024 | 401,007 | 407,122 | ||||||
Rio Oil Finance Trust Series 2014-3 | ||||||||
6.75%, 01/06/2027 | 297,878 | 303,836 | ||||||
Royal Bank of Canada | ||||||||
1.20%, 09/19/2018 | 2,840,000 | 2,838,864 | ||||||
Royal Bank of Scotland Group Plc | ||||||||
6.13%, 12/15/2022 | 3,025,000 | 3,311,488 | ||||||
2.65%, 05/15/2023 | 1,187,000 | 1,196,615 | ||||||
3.50%, 05/15/2023 | 855,000 | 860,064 | ||||||
3.88%, 09/12/2023 | 2,885,000 | 2,942,129 | ||||||
6.00%, 12/19/2023 | 960,000 | 1,059,103 | ||||||
5.13%, 05/28/2024 | 375,000 | 393,957 | ||||||
8.00%, 12/29/2049 | 1,475,000 | 1,601,378 | ||||||
Santander Issuances SAU | ||||||||
5.18%, 11/19/2025 | 2,400,000 | 2,572,740 | ||||||
| Principal | ||||||||
| Amount | Value | |||||||
Santander UK Group Holdings Plc | ||||||||
2.88%, 10/16/2020 | 3,135,000 | 3,179,774 | ||||||
2.88%, 08/05/2021 | 4,430,000 | 4,440,185 | ||||||
3.57%, 01/10/2023 | 3,185,000 | 3,257,137 | ||||||
4.75%, 09/15/2025 (Acquired 09/08/2015, Cost $1,022,585) (1) | 1,025,000 | 1,061,750 | ||||||
6.75%, 06/24/2164* | GBP 3,000,000 | 4,067,353 | ||||||
Santander UK Plc | ||||||||
5.00%, 11/07/2023 (Acquired 07/13/2015 through 02/07/2017, Cost $4,264,774) (1) | $ | 4,140,000 | 4,438,155 | |||||
Scottrade Financial Services, Inc. | ||||||||
6.13%, 07/11/2021 (Acquired 05/03/2016 through 10/14/2016, Cost $847,683) (1) | 806,000 | 915,177 | ||||||
Simon Property Group LP | ||||||||
2.50%, 09/01/2020 | 1,530,000 | 1,543,726 | ||||||
3.30%, 01/15/2026 | 1,025,000 | 1,025,341 | ||||||
Sirius International Group Ltd. | ||||||||
4.60%, 11/01/2026 (Acquired 11/21/2016 through 01/31/2017, Cost $1,080,496) (1) | 1,140,000 | 1,091,094 | ||||||
SL Green Realty Corp. | ||||||||
5.00%, 08/15/2018 | 1,963,000 | 2,014,737 | ||||||
7.75%, 03/15/2020 | 1,398,000 | 1,565,208 | ||||||
SLM Corp. | ||||||||
5.13%, 04/05/2022 | 895,000 | 912,900 | ||||||
Societe Generale SA | ||||||||
4.25%, 04/14/2025 (Acquired 07/13/2015, Cost $189,995) (1) | 200,000 | 202,823 | ||||||
4.25%, 04/14/2025 | 5,550,000 | 5,628,333 | ||||||
Springleaf Finance Corp. | ||||||||
5.25%, 12/15/2019 | 120,000 | 124,812 | ||||||
7.75%, 10/01/2021 | 4,360,000 | 4,877,750 | ||||||
6.13%, 05/15/2022 | 1,666,000 | 1,757,630 | ||||||
Stichting AK Rabobank Certificaten | ||||||||
6.50%, 03/29/2166* | EUR 6,043,000 | 8,165,235 | ||||||
Synchrony Financial | ||||||||
3.00%, 08/15/2019 | $ | 1,335,000 | 1,353,877 | |||||
4.50%, 07/23/2025 | 2,778,000 | 2,857,003 | ||||||
Teachers Insurance & Annuity Association of America | ||||||||
4.38%, 09/15/2054 (Acquired 11/09/2015 through 06/02/2016, Cost $4,434,356) (1) | 4,500,000 | 4,550,625 | ||||||
Thomson Reuters Corp. | ||||||||
3.35%, 05/15/2026 | 1,390,000 | 1,387,907 | ||||||
Toronto-Dominion Bank/The | ||||||||
| Principal | ||||||||
| Amount | Value | |||||||
3.63%, 09/15/2031 | 3,335,000 | 3,308,920 | ||||||
Trinity Acquisition Plc | ||||||||
3.50%, 09/15/2021 | 200,000 | 204,786 | ||||||
UBS AG | ||||||||
4.75%, 05/22/2023 | 1,853,000 | 1,889,537 | ||||||
UBS Group Funding Jersey Ltd. | ||||||||
4.13%, 09/24/2025 (Acquired 09/21/2015 through 10/13/2016, Cost $2,904,500) (1) | 2,825,000 | 2,961,538 | ||||||
UBS Group Funding Switzerland AG | ||||||||
3.49%, 05/23/2023 (Acquired 03/16/2017 through 03/20/2017, Cost $4,105,415) (1) | 4,100,000 | 4,194,251 | ||||||
UniCredit SpA | ||||||||
4.63%, 04/12/2027 (Acquired 06/29/2017 through 06/30/2017, Cost $994,286) | 940,000 | 991,618 | ||||||
Unum Group | ||||||||
3.00%, 05/15/2021 | 290,000 | 292,737 | ||||||
3.88%, 11/05/2025 | 4,925,000 | 4,992,659 | ||||||
Ventas Realty LP | ||||||||
2.70%, 04/01/2020 | 3,000,000 | 3,025,941 | ||||||
3.25%, 10/15/2026 | 2,000,000 | 1,922,348 | ||||||
3.85%, 04/01/2027 | 925,000 | 929,921 | ||||||
VEREIT Operating Partnership LP | ||||||||
3.00%, 02/06/2019 | 800,000 | 807,352 | ||||||
4.60%, 02/06/2024 | 685,000 | 715,441 | ||||||
4.88%, 06/01/2026 | 2,710,000 | 2,864,931 | ||||||
Visa, Inc. | ||||||||
4.30%, 12/14/2045 | 2,880,000 | 3,163,360 | ||||||
Wachovia Corp. | ||||||||
5.75%, 02/01/2018 | 8,000,000 | 8,187,488 | ||||||
WEA Finance LLC / Westfield UK & Europe Finance Plc | ||||||||
1.75%, 09/15/2017 (Acquired 06/03/2016, Cost $3,690,628) (1) | 3,690,000 | 3,689,989 | ||||||
2.70%, 09/17/2019 (Acquired 07/31/2015 through 06/01/2016, Cost $4,803,957) (1) | 4,789,000 | 4,828,782 | ||||||
3.25%, 10/05/2020 (Acquired 09/28/2015 through 01/06/2016, Cost $844,713) (1) | 845,000 | 859,856 | ||||||
3.75%, 09/17/2024 (Acquired 06/28/2016, Cost $1,634,406) (1) | 1,570,000 | 1,589,919 | ||||||
Weingarten Realty Investors | ||||||||
3.25%, 08/15/2026 | 1,665,000 | 1,587,331 | ||||||
Wells Fargo & Co. | ||||||||
6.00%, 11/15/2017 | 2,000,000 | 2,031,666 | ||||||
2.60%, 07/22/2020 | 310,000 | 314,345 | ||||||
3.07%, 01/24/2023 | 4,705,000 | 4,767,525 | ||||||
| Principal | ||||||||
| Amount | Value | |||||||
3.55%, 09/29/2025 | 1,290,000 | 1,311,663 | ||||||
3.00%, 04/22/2026 | 6,747,000 | 6,590,152 | ||||||
3.00%, 10/23/2026 | 770,000 | 749,873 | ||||||
3.58%, 05/22/2028 | 12,555,000 | 12,686,200 | ||||||
Welltower, Inc. | ||||||||
4.70%, 09/15/2017 | 1,971,000 | 1,981,868 | ||||||
2.25%, 03/15/2018 | 2,812,000 | 2,819,435 | ||||||
4.00%, 06/01/2025 | 4,690,000 | 4,849,699 | ||||||
Willis North America, Inc. | ||||||||
3.60%, 05/15/2024 | 1,670,000 | 1,686,398 | ||||||
|
| |||||||
| 845,815,918 | ||||||||
|
| |||||||
Industrials - 1.86% | ||||||||
Airbus Group Finance BV | ||||||||
2.70%, 04/17/2023 (Acquired 08/04/2015 through 07/21/2016, Cost $1,623,954) (1) | 1,610,000 | 1,618,755 | ||||||
Amcor Finance USA, Inc. | ||||||||
3.63%, 04/28/2026 (Acquired 06/08/2016 through 10/05/2016, Cost $3,060,216) (1) | 2,990,000 | 2,990,679 | ||||||
Arconic, Inc. | ||||||||
5.87%, 02/23/2022 | 1,520,000 | 1,626,400 | ||||||
Ardagh Packaging Finance Plc / Ardagh Holdings USA, Inc. | ||||||||
4.25%, 09/15/2022 (Acquired 04/17/2017, Cost $402,868) (1) | 400,000 | 410,600 | ||||||
4.63%, 05/15/2023 (Acquired 06/06/2017, Cost $411,091) (1) | 400,000 | 409,836 | ||||||
Autoridad del Canal de Panama | ||||||||
4.95%, 07/29/2035 (Acquired 09/24/2015, Cost $196,638) (1) | 200,000 | 218,000 | ||||||
Aviation Capital Group Corp. | ||||||||
4.88%, 10/01/2025 (Acquired 06/28/2016 through 08/11/2016, Cost $2,807,435) (1) | 2,789,000 | 3,037,595 | ||||||
Avnet, Inc. | ||||||||
4.63%, 04/15/2026 | 5,695,000 | 5,887,041 | ||||||
Ball Corp. | ||||||||
4.38%, 12/15/2020 | 752,000 | 789,600 | ||||||
Belden, Inc. | ||||||||
3.38%, 07/15/2027 (Acquired 06/27/2017, Cost $113,491) (1)* | EUR 100,000 | 113,893 | ||||||
Brambles USA, Inc. | ||||||||
4.13%, 10/23/2025 (Acquired 10/19/2015, Cost $833,258) (1) | $ | 835,000 | 856,497 | |||||
CCCI Treasure Ltd. | ||||||||
3.50%, 12/29/2049 | 200,000 | 201,602 | ||||||
Clean Harbors, Inc. | ||||||||
5.13%, 06/01/2021 | 930,000 | 949,762 | ||||||
| Principal | ||||||||
| Amount | Value | |||||||
CNH Industrial Capital LLC | ||||||||
3.63%, 04/15/2018 | 1,499,000 | 1,512,191 | ||||||
CRCC Yupeng Ltd. | ||||||||
3.95%, 02/28/2049 | 200,000 | 203,513 | ||||||
Crown Americas LLC / Crown Americas Capital Corp. V | ||||||||
4.25%, 09/30/2026 (Acquired 02/06/2017 through 06/26/2017, Cost $1,134,460) (1) | 1,175,000 | 1,172,063 | ||||||
Embraer Netherlands Finance BV | ||||||||
5.40%, 02/01/2027 | 1,290,000 | 1,348,050 | ||||||
Embraer Overseas Ltd. | ||||||||
5.70%, 09/16/2023 (Acquired 07/13/2015, Cost $1,415,473) (1) | 1,350,000 | 1,454,625 | ||||||
General Electric Co. | ||||||||
5.00%, 12/29/2049 | 8,886,000 | 9,431,600 | ||||||
Graphic Packaging International, Inc. | ||||||||
4.88%, 11/15/2022 | 400,000 | 424,000 | ||||||
4.13%, 08/15/2024 | 619,000 | 631,380 | ||||||
Grinding Media, Inc. / MC Grinding Media Canada, Inc. | ||||||||
7.38%, 12/15/2023 (Acquired 12/02/2016 through 02/16/2017, Cost $350,000) (1) | 350,000 | 380,625 | ||||||
Jabil, Inc. | ||||||||
4.70%, 09/15/2022 | 3,685,000 | 3,914,686 | ||||||
Keysight Technologies, Inc. | ||||||||
4.60%, 04/06/2027 | 2,960,000 | 3,109,711 | ||||||
Koppers, Inc. | ||||||||
6.00%, 02/15/2025 (Acquired 01/19/2017, Cost $180,000) (1) | 180,000 | 191,250 | ||||||
L3 Technologies, Inc. | ||||||||
5.20%, 10/15/2019 | 3,200,000 | 3,416,176 | ||||||
LafargeHolcim Finance US LLC | ||||||||
3.50%, 09/22/2026 (Acquired 09/15/2016, Cost $404,682) (1) | 405,000 | 400,449 | ||||||
Lockheed Martin Corp. | ||||||||
2.90%, 03/01/2025 | 5,635,000 | 5,607,321 | ||||||
3.55%, 01/15/2026 | 1,660,000 | 1,720,265 | ||||||
Martin Marietta Materials, Inc. | ||||||||
4.25%, 07/02/2024 | 1,235,000 | 1,296,160 | ||||||
Masco Corp. | ||||||||
3.50%, 04/01/2021 | 2,118,000 | 2,176,308 | ||||||
4.45%, 04/01/2025 | 4,700,000 | 5,020,070 | ||||||
6.50%, 08/15/2032 | 1,340,000 | 1,639,501 | ||||||
Owens Corning | ||||||||
| Principal | ||||||||
| Amount | Value | |||||||
4.20%, 12/15/2022 | 35,000 | 36,923 | ||||||
4.20%, 12/01/2024 | 5,992,000 | 6,274,667 | ||||||
3.40%, 08/15/2026 | 585,000 | 576,346 | ||||||
Park Aerospace Holdings Ltd. | ||||||||
5.25%, 08/15/2022 (Acquired 01/20/2017, Cost $440,000) (1) | 440,000 | 459,941 | ||||||
5.50%, 02/15/2024 (Acquired 01/20/2017, Cost $375,000) (1) | 375,000 | 391,687 | ||||||
Park-Ohio Industries, Inc. | ||||||||
6.63%, 04/15/2027 (Acquired 04/05/2017, Cost $390,000) (1) | 390,000 | 409,500 | ||||||
Penske Truck Leasing Co. LP / PTL Finance Corp. | ||||||||
3.38%, 03/15/2018 (Acquired 07/14/2015 through 09/27/2016, Cost $2,262,718) (1) | 2,236,000 | 2,261,260 | ||||||
4.25%, 01/17/2023 (Acquired 07/22/2015 through 02/07/2017, Cost $1,669,296) (1) | 1,620,000 | 1,717,605 | ||||||
Reliance Intermediate Holdings LP | ||||||||
6.50%, 04/01/2023 (Acquired 07/13/2015 through 08/17/2015, Cost $123,230) (1) | 120,000 | 128,400 | ||||||
Republic Services, Inc. | ||||||||
2.90%, 07/01/2026 | 3,000,000 | 2,941,569 | ||||||
Reynolds Group Issuer, Inc. | ||||||||
5.75%, 10/15/2020 | 500,000 | 511,670 | ||||||
4.66%, 07/15/2021 (Acquired 06/13/2016, Cost $1,189,938) (1) | 1,200,000 | 1,219,500 | ||||||
Rockwell Collins, Inc. | ||||||||
3.20%, 03/15/2024 | 1,553,000 | 1,573,806 | ||||||
3.50%, 03/15/2027 | 2,656,000 | 2,693,566 | ||||||
SBA Communications Corp. | ||||||||
4.88%, 09/01/2024 (Acquired 08/01/2016 through 03/06/2017, Cost $911,399) (1) | 920,000 | 936,100 | ||||||
SBA Tower Trust | ||||||||
2.90%, 10/15/2044 (Acquired 07/14/2015 through 07/30/2015, Cost $1,667,070) (1) | 1,650,000 | 1,658,714 | ||||||
2.88%, 07/15/2046 (Acquired 06/21/2016, Cost $3,000,000) (1) | 3,000,000 | 2,993,425 | ||||||
3.17%, 04/15/2047 (Acquired 04/04/2017, Cost $2,175,000) (1) | 2,175,000 | 2,183,892 | ||||||
3.87%, 10/15/2049 (Acquired 09/02/2015, Cost $835,779) (1) | 830,000 | 842,003 | ||||||
Sealed Air Corp. | ||||||||
5.25%, 04/01/2023 (Acquired 10/28/2016, Cost $895,183) (1) | 850,000 | 911,625 | ||||||
5.50%, 09/15/2025 (Acquired 11/29/2016, Cost $880,172) (1) | 850,000 | 928,625 | ||||||
Siemens Financieringsmaatschappij NV | ||||||||
2.35%, 10/15/2026 (Acquired 09/06/2016 through 01/11/2017, Cost $5,470,008) (1) | 5,640,000 | 5,325,700 | ||||||
Spirit AeroSystems, Inc. | ||||||||
3.85%, 06/15/2026 | 195,000 | 196,860 | ||||||
United Technologies Co. | ||||||||
1.78%, 05/04/2018 | 5,768,000 | 5,775,521 | ||||||
| Principal | ||||||||
| Amount | Value | |||||||
Vulcan Materials Co. | ||||||||
7.00%, 06/15/2018 | 1,458,000 | 1,526,688 | ||||||
7.50%, 06/15/2021 | 1,640,000 | 1,935,300 | ||||||
4.50%, 04/01/2025 | 2,687,000 | 2,869,670 | ||||||
4.50%, 06/15/2047 | 2,148,000 | 2,167,410 | ||||||
Wabtec Corp./DE | ||||||||
3.45%, 11/15/2026 (Acquired 10/31/2016 through 12/02/2016, Cost $3,491,015) (1) | 3,585,000 | 3,535,129 | ||||||
|
| |||||||
| 119,143,306 | ||||||||
|
| |||||||
Real Estate - 0.69% | ||||||||
Alexandria Real Estate Equities, Inc. | ||||||||
2.75%, 01/15/2020 | 1,827,000 | 1,839,427 | ||||||
4.60%, 04/01/2022 | 4,407,000 | 4,708,933 | ||||||
3.95%, 01/15/2027 | 3,440,000 | 3,503,977 | ||||||
4.50%, 07/30/2029 | 636,000 | 674,247 | ||||||
American Tower Corp. | ||||||||
3.30%, 02/15/2021 | 3,098,000 | 3,178,669 | ||||||
3.45%, 09/15/2021 | 110,000 | 113,425 | ||||||
3.50%, 01/31/2023 | 717,000 | 735,250 | ||||||
4.40%, 02/15/2026 | 1,863,000 | 1,953,098 | ||||||
3.38%, 10/15/2026 | 3,487,000 | 3,412,009 | ||||||
Crown Castle International Corp. | ||||||||
4.45%, 02/15/2026 | 1,550,000 | 1,646,511 | ||||||
3.70%, 06/15/2026 | 3,225,000 | 3,252,935 | ||||||
DDR Corp. | ||||||||
3.63%, 02/01/2025 | 2,225,000 | 2,116,874 | ||||||
4.25%, 02/01/2026 | 5,735,000 | 5,623,271 | ||||||
HCP, Inc. | ||||||||
4.00%, 12/01/2022 | 1,900,000 | 1,987,100 | ||||||
4.00%, 06/01/2025 | 3,240,000 | 3,319,179 | ||||||
Jones Lang LaSalle, Inc. | ||||||||
4.40%, 11/15/2022 | 1,270,000 | 1,337,119 | ||||||
Kimco Realty Corp. | ||||||||
3.40%, 11/01/2022 | 150,000 | 152,893 | ||||||
Realty Income Corp. | ||||||||
2.00%, 01/31/2018 | 5,000,000 | 5,004,940 | ||||||
|
| |||||||
| 44,559,857 | ||||||||
|
| |||||||
Technology - 1.93% | ||||||||
| Principal | ||||||||
| Amount | Value | |||||||
Activision Blizzard, Inc. | ||||||||
4.50%, 06/15/2047 | 1,720,000 | 1,713,813 | ||||||
Apple, Inc. | ||||||||
1.00%, 05/03/2018 | 3,000,000 | 2,989,149 | ||||||
2.10%, 05/06/2019 | 2,030,000 | 2,049,108 | ||||||
1.10%, 08/02/2019 | 2,245,000 | 2,221,109 | ||||||
2.40%, 05/03/2023 | 2,780,000 | 2,765,096 | ||||||
3.00%, 02/09/2024 | 1,420,000 | 1,441,178 | ||||||
3.20%, 05/13/2025 | 1,980,000 | 2,022,374 | ||||||
3.20%, 05/11/2027 | 1,125,000 | 1,135,673 | ||||||
4.65%, 02/23/2046 | 1,250,000 | 1,403,174 | ||||||
4.25%, 02/09/2047 | 420,000 | 446,128 | ||||||
Autodesk, Inc. | ||||||||
4.38%, 06/15/2025 | 4,610,000 | 4,863,656 | ||||||
Broadcom Corp. / Broadcom Cayman Finance Ltd. | ||||||||
3.63%, 01/15/2024 (Acquired 01/11/2017, Cost $4,629,607) (1) | 4,633,000 | 4,738,401 | ||||||
3.88%, 01/15/2027 (Acquired 01/11/2017, Cost $7,164,207) (1) | 7,189,000 | 7,383,146 | ||||||
Brocade Communications Systems, Inc. | ||||||||
4.63%, 01/15/2023 | 430,000 | 442,362 | ||||||
Cadence Design Systems, Inc. | ||||||||
4.38%, 10/15/2024 | 3,153,000 | 3,275,368 | ||||||
Dell International LLC / EMC Corp. | ||||||||
3.48%, 06/01/2019 (Acquired 05/25/2017, Cost $1,841,701) (1) | 1,800,000 | 1,842,147 | ||||||
4.42%, 06/15/2021 (Acquired 05/18/2017, Cost $1,022,130) (1) | 970,000 | 1,022,499 | ||||||
6.02%, 06/15/2026 | 4,100,000 | 4,516,597 | ||||||
8.35%, 07/15/2046 (Acquired 04/06/2017 through 04/10/2017, Cost $4,386,909) (1) | 3,440,000 | 4,444,563 | ||||||
Diamond 1 Finance Co. / Diamond 2 Finance Co. | ||||||||
6.02%, 06/15/2026 (Acquired 05/17/2016 through 08/03/2016, Cost $6,439,908) (1) | 6,315,000 | 6,956,661 | ||||||
Evolent Health, Inc. | ||||||||
2.00%, 12/01/2021 (Acquired 11/30/2016, Cost $810,000) (1) | 810,000 | 1,045,912 | ||||||
Fidelity National Information Services, Inc. | ||||||||
0.40%, 01/15/2021* | EUR 200,000 | 227,800 | ||||||
1.70%, 06/30/2022* | GBP 100,000 | 129,125 | ||||||
4.50%, 10/15/2022 | $ | 1,274,000 | 1,384,135 | |||||
3.00%, 08/15/2026 | 9,383,000 | 9,086,657 | ||||||
First Data Corp. | ||||||||
5.00%, 01/15/2024 (Acquired 06/02/2016 through 12/14/2016, Cost $845,775) (1) | 845,000 | 869,023 | ||||||
| Principal | ||||||||
| Amount | Value | |||||||
Hewlett Packard Enterprise Co. | ||||||||
4.90%, 10/15/2025 | 3,440,000 | 3,606,805 | ||||||
j2 Cloud Services LLC / j2 Global Co-Obligor, Inc. | ||||||||
6.00%, 07/15/2025 (Acquired 06/22/2017, Cost $99,000) (1) | 99,000 | 101,970 | ||||||
KLA-Tencor Corp. | ||||||||
4.65%, 11/01/2024 | 2,500,000 | 2,700,125 | ||||||
Microsoft Corp. | ||||||||
1.10%, 08/08/2019 | 7,390,000 | 7,302,724 | ||||||
2.40%, 08/08/2026 | 3,165,000 | 3,046,249 | ||||||
4.10%, 02/06/2037 | 2,505,000 | 2,701,387 | ||||||
3.75%, 02/12/2045 | 650,000 | 646,990 | ||||||
4.45%, 11/03/2045 | 1,100,000 | 1,225,727 | ||||||
MSCI, Inc. | ||||||||
4.75%, 08/01/2026 (Acquired 03/10/2017, Cost $294,337) (1) | 300,000 | 308,340 | ||||||
Nuance Communications, Inc. | ||||||||
1.00%, 12/15/2035 | 3,615,000 | 3,483,956 | ||||||
NXP BV / NXP Funding LLC | ||||||||
4.13%, 06/15/2020 (Acquired 11/22/2016 through 11/28/2016, Cost $476,106) (1) | 459,000 | 482,097 | ||||||
4.13%, 06/01/2021 (Acquired 05/18/2016, Cost $2,931,935) (1) | 2,828,000 | 2,977,884 | ||||||
3.88%, 09/01/2022 (Acquired 08/08/2016 through 03/01/2017, Cost $6,546,312) (1) | 6,447,000 | 6,712,939 | ||||||
Quintiles IMS, Inc. | ||||||||
5.00%, 10/15/2026 (Acquired 09/14/2016, Cost $500,000) (1) | 500,000 | 515,625 | ||||||
Rovi Corp. | ||||||||
0.50%, 03/01/2020 | 930,000 | 913,144 | ||||||
Seagate HDD Cayman | ||||||||
4.75%, 01/01/2025 | 3,297,000 | 3,313,026 | ||||||
4.88%, 06/01/2027 | 855,000 | 853,940 | ||||||
5.75%, 12/01/2034 | 1,022,000 | 1,024,452 | ||||||
TSMC Global Ltd. | ||||||||
1.63%, 04/03/2018 (Acquired 07/13/2015 through 11/16/2016, Cost $7,270,643) (1) | 7,271,000 | 7,256,444 | ||||||
Veritas US, Inc. / Veritas Bermuda Ltd. | ||||||||
7.50%, 02/01/2023 (Acquired 02/16/2017 through 04/25/2017, Cost $1,486,171) (1) | 1,415,000 | 1,521,125 | ||||||
10.50%, 02/01/2024 (Acquired 05/24/2017, Cost $766,893) (1) | 710,000 | 775,675 | ||||||
Western Digital Corp. | ||||||||
7.38%, 04/01/2023 (Acquired 03/30/2016 through 06/16/2016, Cost $1,049,454) (1) | 1,025,000 | 1,126,219 | ||||||
10.50%, 04/01/2024 | 500,000 | 589,840 | ||||||
|
| |||||||
| 123,601,537 | ||||||||
|
| |||||||
| Principal | ||||||||
| Amount | Value | |||||||
Utilities - 2.14% | ||||||||
AEP Texas, Inc. | ||||||||
3.85%, 10/01/2025 (Acquired 09/15/2015, Cost $1,487,542) (1) | 1,500,000 | 1,557,430 | ||||||
American Electric Power Co., Inc. | ||||||||
1.65%, 12/15/2017 | 1,400,000 | 1,400,168 | ||||||
Black Hills Corp. | ||||||||
2.50%, 01/11/2019 | 1,555,000 | 1,563,363 | ||||||
Cleco Power LLC | ||||||||
6.00%, 12/01/2040 | 1,000,000 | 1,217,382 | ||||||
Dominion Energy, Inc. | ||||||||
1.88%, 12/15/2018 (Acquired 12/12/2016, Cost $4,498,452) (1) | 4,500,000 | 4,494,114 | ||||||
3.90%, 10/01/2025 | 2,480,000 | 2,567,497 | ||||||
Dominion Resources, Inc./VA | ||||||||
2.85%, 08/15/2026 | 428,000 | 408,025 | ||||||
Duke Energy Corp. | ||||||||
1.80%, 09/01/2021 | 839,000 | 818,929 | ||||||
2.65%, 09/01/2026 | 4,753,000 | 4,514,566 | ||||||
3.75%, 09/01/2046 | 1,420,000 | 1,351,028 | ||||||
Duke Energy Progress LLC | ||||||||
4.10%, 03/15/2043 | 900,000 | 935,776 | ||||||
4.20%, 08/15/2045 | 1,000,000 | 1,064,249 | ||||||
Duquesne Light Holdings, Inc. | ||||||||
6.40%, 09/15/2020 (Acquired 07/21/2015, Cost $439,202) (1) | 400,000 | 445,725 | ||||||
5.90%, 12/01/2021 (Acquired 10/01/2015, Cost $1,654,623) (1) | 1,500,000 | 1,676,496 | ||||||
Dynegy, Inc. | ||||||||
6.75%, 11/01/2019 | 7,300,000 | 7,528,125 | ||||||
EDP Finance BV | ||||||||
3.63%, 07/15/2024 (Acquired 06/21/2017, Cost $3,149,382) (1) | 3,160,000 | 3,136,110 | ||||||
Emera US Finance LP | ||||||||
2.70%, 06/15/2021 | 3,400,000 | 3,404,893 | ||||||
Enel Finance International NV | ||||||||
5.13%, 10/07/2019 (Acquired 05/25/2017, Cost $1,917,810) (1) | 1,800,000 | 1,916,838 | ||||||
3.63%, 05/25/2027 (Acquired 05/22/2017 through 06/22/2017, Cost $3,157,070) (1) | 3,175,000 | 3,144,688 | ||||||
6.00%, 10/07/2039 (Acquired 07/22/2015, Cost $2,774,719) (1) | 2,445,000 | 2,911,047 | ||||||
4.75%, 05/25/2047 (Acquired 05/22/2017, Cost $768,777) (1) | 770,000 | 793,424 | ||||||
Entergy Corp. | ||||||||
5.13%, 09/15/2020 | 1,250,000 | 1,346,991 | ||||||
| Principal | ||||||||
| Amount | Value | |||||||
FirstEnergy Corp. | ||||||||
3.90%, 07/15/2027 | 5,450,000 | 5,451,101 | ||||||
FirstEnergy Transmission LLC | ||||||||
4.35%, 01/15/2025 (Acquired 07/21/2015 through 11/15/2016, Cost $3,647,131) (1) | 3,535,000 | 3,694,132 | ||||||
Great Plains Energy, Inc. | ||||||||
2.50%, 03/09/2020 | 2,910,000 | 2,936,950 | ||||||
3.15%, 04/01/2022 | 2,200,000 | 2,223,014 | ||||||
4.85%, 04/01/2047 | 1,925,000 | 1,983,560 | ||||||
Indiana Michigan Power Co. | ||||||||
7.00%, 03/15/2019 | 1,397,000 | 1,507,542 | ||||||
Indianapolis Power & Light Co. | ||||||||
4.70%, 09/01/2045 (Acquired 09/08/2015, Cost $994,891) (1) | 1,000,000 | 1,082,526 | ||||||
IPALCO Enterprises, Inc. | ||||||||
5.00%, 05/01/2018 | 1,520,000 | 1,544,700 | ||||||
ITC Holdings Corp. | ||||||||
3.25%, 06/30/2026 | 2,000,000 | 1,967,578 | ||||||
Jersey Central Power & Light Co. | ||||||||
4.80%, 06/15/2018 | 2,000,000 | 2,049,536 | ||||||
4.70%, 04/01/2024 (Acquired 06/13/2016, Cost $161,927) (1) | 150,000 | 162,649 | ||||||
4.30%, 01/15/2026 (Acquired 06/28/2016, Cost $1,065,829) (1) | 1,000,000 | 1,047,982 | ||||||
Kansas City Power & Light Co. | ||||||||
3.65%, 08/15/2025 | 1,700,000 | 1,725,407 | ||||||
KeySpan Gas East Corp. | ||||||||
2.74%, 08/15/2026 (Acquired 08/02/2016, Cost $4,500,000) (1) | 4,500,000 | 4,343,643 | ||||||
Metropolitan Edison Co. | ||||||||
4.00%, 04/15/2025 (Acquired 04/13/2016, Cost $2,059,210) (1) | 2,000,000 | 2,052,068 | ||||||
MidAmerican Energy Co. | ||||||||
4.25%, 05/01/2046 | 949,000 | 1,018,435 | ||||||
NextEra Energy Capital Holdings, Inc. | ||||||||
2.06%, 09/01/2017 | 1,000,000 | 1,000,468 | ||||||
1.65%, 09/01/2018 | 3,230,000 | 3,220,317 | ||||||
2.40%, 09/15/2019 | 793,000 | 798,455 | ||||||
NGL Energy Partners LP / NGL Energy Finance Corp. | ||||||||
7.50%, 11/01/2023 (Acquired 10/25/2016, Cost $608,974) (1) | 600,000 | 591,750 | ||||||
NiSource Finance Corp. | ||||||||
4.38%, 05/15/2047 | 2,097,000 | 2,165,371 | ||||||
| Principal | ||||||||
| Amount | Value | |||||||
Northern States Power Co./MN | ||||||||
4.00%, 08/15/2045 | 1,000,000 | 1,038,740 | ||||||
NRG Energy, Inc. | ||||||||
6.63%, 03/15/2023 | 1,275,000 | 1,310,063 | ||||||
7.25%, 05/15/2026 | 950,000 | 983,250 | ||||||
Oncor Electric Delivery Co. LLC | ||||||||
5.00%, 09/30/2017 | 862,000 | 869,093 | ||||||
Origin Energy Finance Ltd. | ||||||||
3.50%, 10/09/2018 (Acquired 08/05/2015, Cost $1,169,516) (1) | 1,160,000 | 1,173,352 | ||||||
Perusahaan Gas Negara Persero TbkP | ||||||||
5.13%, 05/16/2024 | 200,000 | 214,786 | ||||||
Perusahaan Gas Negara Persero Tbk PT | ||||||||
5.13%, 05/16/2024 | 1,300,000 | 1,396,112 | ||||||
PPL WEM Ltd. / Western Power Distribution Ltd. | ||||||||
5.38%, 05/01/2021 (Acquired 07/14/2015 through 02/07/2017, Cost $2,836,829) (1) | 2,615,000 | 2,821,517 | ||||||
Public Service Co. of New Mexico | ||||||||
3.85%, 08/01/2025 | 2,000,000 | 2,062,184 | ||||||
Puget Energy, Inc. | ||||||||
6.50%, 12/15/2020 | 2,903,000 | 3,244,793 | ||||||
Sempra Energy | ||||||||
2.85%, 11/15/2020 | 375,000 | 380,574 | ||||||
Southern Co. Gas Capital Corp. | ||||||||
3.50%, 09/15/2021 | 3,250,000 | 3,355,472 | ||||||
Southern Co./The | ||||||||
2.35%, 07/01/2021 | 4,624,000 | 4,589,870 | ||||||
2.95%, 07/01/2023 | 6,090,000 | 6,050,129 | ||||||
3.25%, 07/01/2026 | 4,035,000 | 3,947,686 | ||||||
4.40%, 07/01/2046 | 1,120,000 | 1,141,987 | ||||||
Southwestern Electric Power Co. | ||||||||
3.90%, 04/01/2045 | 400,000 | 392,906 | ||||||
Spire, Inc. | ||||||||
3.54%, 02/27/2024 | 5,000,000 | 5,043,400 | ||||||
State Grid Overseas Investment 2016 Ltd. | ||||||||
2.75%, 05/04/2022 (Acquired 04/26/2017 through 04/28/2017, Cost $3,693,571) (1) | 3,700,000 | 3,682,156 | ||||||
Tucson Electric Power Co. | ||||||||
3.05%, 03/15/2025 | 3,000,000 | 2,915,196 | ||||||
|
| |||||||
| 137,377,314 | ||||||||
|
| |||||||
Total Corporate Bonds (Cost $2,266,914,402) | $ | 2,300,366,258 | ||||||
|
| |||||||
| Principal Amount | Value | |||||||
Government Related - 21.79% | ||||||||
Africa Finance Corp. | ||||||||
3.88%, 04/13/2024 (Acquired 04/06/2017, Cost $1,077,008) (1) | $ | 1,085,000 | $ | 1,074,367 | ||||
Argentine Republic Government International Bond | ||||||||
3.88%, 01/15/2022* | EUR 5,000,000 | 5,675,069 | ||||||
Bay Area Toll Authority | ||||||||
6.26%, 04/01/2049 | $ | 650,000 | 925,152 | |||||
Bermuda Government International Bond | ||||||||
4.14%, 01/03/2023 (Acquired 05/09/2017, Cost $563,970) (1) | 544,000 | 567,120 | ||||||
4.85%, 02/06/2024 (Acquired 05/25/2016 through 05/30/2017, Cost $875,844) (1) | 815,000 | 880,876 | ||||||
California Health Facilities Financing Authority | ||||||||
4.00%, 10/01/2047 | 2,750,000 | 2,822,600 | ||||||
City of Houston TX Combined Utility System Revenue | ||||||||
3.83%, 05/15/2028 | 2,540,000 | 2,688,488 | ||||||
City of New York NY | ||||||||
3.55%, 12/01/2028 | 3,645,000 | 3,726,502 | ||||||
6.27%, 12/01/2037 | 2,050,000 | 2,779,780 | ||||||
Commonwealth of Massachusetts | ||||||||
4.91%, 05/01/2029 | 2,460,000 | 2,865,949 | ||||||
East Bay Municipal Utility District Water System Revenue | ||||||||
5.87%, 06/01/2040 | 985,000 | 1,302,633 | ||||||
European Investment Bank | ||||||||
1.75%, 06/17/2019 | 2,850,000 | 2,859,351 | ||||||
Indonesia Government International Bond | ||||||||
3.70%, 01/08/2022 (Acquired 12/01/2016 through 12/13/2016, Cost $269,443) (1) | 270,000 | 277,478 | ||||||
International Bank for Reconstruction & Development | ||||||||
4.25%, 06/20/2019* | COP 27,080,000,000 | 8,787,381 | ||||||
International Finance Corp. | ||||||||
7.80%, 06/03/2019* | INR 553,330,000 | 8,882,583 | ||||||
Israel Government Bond - Fixed | ||||||||
1.75%, 08/31/2025* | ILS 13,735,000 | 3,979,128 | ||||||
Metropolitan Transportation Authority | ||||||||
7.34%, 11/15/2039 | $ | 475,000 | 712,780 | |||||
Metropolitan Water Reclamation District of Greater Chicago | ||||||||
5.72%, 12/01/2038 | 1,000,000 | 1,222,150 | ||||||
Mexican Bonos | ||||||||
| Principal Amount | Value | |||||||
5.00%, 12/11/2019* | MXN 760,834 | 4,039,866 | ||||||
10.00%, 12/05/2024* | 811,600 | 5,327,906 | ||||||
5.75%, 03/05/2026* | 987,571 | 5,079,893 | ||||||
7.75%, 11/13/2042* | 820,957 | 4,783,139 | ||||||
Mexico Government International Bond | ||||||||
4.00%, 10/02/2023 | $ | 1,116,000 | 1,166,834 | |||||
3.60%, 01/30/2025 | 1,060,000 | 1,072,720 | ||||||
4.13%, 01/21/2026 | 915,000 | 951,142 | ||||||
Morocco Government International Bond | ||||||||
4.25%, 12/11/2022 (Acquired 07/22/2015 through 07/30/2015, Cost $504,474) (1) | 495,000 | 518,216 | ||||||
New York City Transitional Finance Authority Future Tax Secured Revenue | ||||||||
2.80%, 02/01/2026 | 1,850,000 | 1,809,855 | ||||||
5.27%, 05/01/2027 | 3,500,000 | 4,117,995 | ||||||
New York City Water & Sewer System | ||||||||
5.75%, 06/15/2041 | 240,000 | 316,949 | ||||||
5.95%, 06/15/2042 | 810,000 | 1,093,654 | ||||||
5.88%, 06/15/2044 | 500,000 | 688,680 | ||||||
New York State Dormitory Authority | ||||||||
5.05%, 09/15/2027 | 1,800,000 | 2,066,580 | ||||||
5.50%, 03/15/2030 | 2,000,000 | 2,373,680 | ||||||
3.88%, 07/01/2046 | 1,650,000 | 1,583,274 | ||||||
Norway Government Bond | ||||||||
4.50%, 05/22/2019 (Acquired 01/18/2017, Cost $7,935,305) (1)* | NOK 62,875,000 | 8,076,919 | ||||||
Perusahaan Penerbit SBSN Indonesia III | ||||||||
4.35%, 09/10/2024 | $ | 400,000 | 417,000 | |||||
Province of Manitoba Canada | ||||||||
3.05%, 05/14/2024 | 430,000 | 444,031 | ||||||
Province of Ontario Canada | ||||||||
1.20%, 02/14/2018 | 9,850,000 | 9,835,540 | ||||||
2.00%, 01/30/2019 | 6,880,000 | 6,920,069 | ||||||
2.50%, 09/10/2021 | 945,000 | 957,839 | ||||||
South Carolina Public Service Authority | ||||||||
2.39%, 12/01/2023 | 960,000 | 903,082 | ||||||
Sri Lanka Government International Bond | ||||||||
6.20%, 05/11/2027 (Acquired 05/04/2017, Cost $400,000) (1) | 400,000 | 399,363 | ||||||
State Board of Administration Finance Corp. | ||||||||
2.16%, 07/01/2019 | 1,220,000 | 1,226,917 | ||||||
| Principal Amount | Value | |||||||
State of California | ||||||||
7.95%, 03/01/2036 | 4,085,000 | 4,660,413 | ||||||
State of Illinois | ||||||||
5.67%, 03/01/2018 | 3,100,000 | 3,150,685 | ||||||
5.10%, 06/01/2033 | 640,000 | 599,117 | ||||||
6.73%, 04/01/2035 | 70,000 | 70,640 | ||||||
7.35%, 07/01/2035 | 55,000 | 58,849 | ||||||
State of Texas | ||||||||
4.68%, 04/01/2040 | 410,000 | 483,435 | ||||||
Svensk Exportkredit AB | ||||||||
1.13%, 08/28/2019 | 6,925,000 | 6,839,968 | ||||||
Texas Public Finance Authority | ||||||||
8.25%, 07/01/2024 | 5,900,000 | 6,253,174 | ||||||
U.S. Treasury Inflation Indexed Bonds | ||||||||
0.13%, 04/15/2021 (2) | 10,177,918 | 10,161,816 | ||||||
0.13%, 04/15/2022 (2) | 5,474,730 | 5,447,477 | ||||||
0.63%, 01/15/2026 (2) | 5,530,741 | 5,564,650 | ||||||
0.13%, 07/15/2026 (2) | 34,296,434 | 33,073,184 | ||||||
0.38%, 01/15/2027 (2) | 9,692,485 | 9,516,896 | ||||||
0.75%, 02/15/2045 (2) | 14,989,304 | 14,057,989 | ||||||
0.88%, 02/15/2047 (2) | 7,663,118 | 7,436,228 | ||||||
U.S. Treasury Note/Bond | ||||||||
0.50%, 07/31/2017 | 5,000,000 | 4,998,525 | ||||||
0.63%, 07/31/2017 | 22,055,000 | 22,050,611 | ||||||
0.75%, 04/30/2018 | 80,780,000 | 80,432,888 | ||||||
0.88%, 05/31/2018 | 16,750,000 | 16,691,107 | ||||||
0.63%, 06/30/2018 | 25,000,000 | 24,841,800 | ||||||
0.75%, 10/31/2018 | 15,235,000 | 15,117,767 | ||||||
1.25%, 04/30/2019 | 92,135,000 | 91,911,849 | ||||||
0.88%, 05/15/2019 | 34,710,000 | 34,390,009 | ||||||
1.25%, 05/31/2019 | 47,490,000 | 47,376,831 | ||||||
1.25%, 06/30/2019 | 14,270,000 | 14,231,542 | ||||||
1.38%, 04/30/2021 | 9,300,000 | 9,181,211 | ||||||
1.38%, 05/31/2021 | 19,150,000 | 18,883,700 | ||||||
2.00%, 08/31/2021 | 3,400,000 | 3,429,617 | ||||||
1.50%, 01/31/2022 | 20,990,000 | 20,671,057 | ||||||
1.88%, 04/30/2022 | 23,745,000 | 23,738,518 | ||||||
| Principal Amount | Value | |||||||
1.75%, 05/31/2022 | 115,525,000 | 114,834,507 | ||||||
1.75%, 06/30/2022 | 142,410,000 | 141,475,506 | ||||||
2.13%, 02/29/2024 (5) | 16,207,000 | 16,222,202 | ||||||
2.00%, 04/30/2024 | 131,200,000 | 130,180,182 | ||||||
2.00%, 05/31/2024 | 79,700,000 | 79,036,896 | ||||||
2.00%, 11/15/2026 | 44,737,000 | 43,627,299 | ||||||
2.25%, 02/15/2027 | 28,345,000 | 28,218,780 | ||||||
2.38%, 05/15/2027 | 9,385,000 | 9,445,486 | ||||||
3.00%, 05/15/2045 (5) | 6,855,000 | 7,074,573 | ||||||
2.50%, 02/15/2046 | 12,560,000 | 11,710,730 | ||||||
2.50%, 05/15/2046 | 21,990,000 | 20,494,504 | ||||||
2.88%, 11/15/2046 | 18,635,000 | 18,769,675 | ||||||
3.00%, 05/15/2047 | 115,950,000 | 119,872,357 | ||||||
University of California | ||||||||
4.60%, 05/15/2031 | 2,800,000 | 3,083,500 | ||||||
4.13%, 05/15/2045 | 190,000 | 196,479 | ||||||
Wisconsin Health & Educational Facilities Authority | ||||||||
4.00%, 11/15/2046 | 2,000,000 | 2,028,260 | ||||||
|
| |||||||
Total Government Related (Cost $1,399,751,555) | $ | 1,399,793,019 | ||||||
|
| |||||||
Mortgage-Backed Obligations - 24.00% | ||||||||
225 Liberty Street Trust 2016-225L | ||||||||
3.60%, 02/12/2036 (Acquired 02/17/2016 through 06/27/2017, Cost $1,144,507) (1) | $ | 1,115,000 | $ | 1,155,260 | ||||
245 Park Avenue Trust 2017-245P | ||||||||
3.51%, 06/05/2037 (Acquired 06/26/2017, Cost $2,235,178) (1) | 2,145,000 | 2,201,826 | ||||||
Alternative Loan Trust 2003-22CB | ||||||||
5.75%, 12/25/2033 | 1,014,582 | 1,038,294 | ||||||
6.00%, 12/25/2033 | 289,101 | 290,077 | ||||||
Alternative Loan Trust 2004-16CB | ||||||||
5.50%, 07/25/2034 | 764,314 | 779,212 | ||||||
5.50%, 08/25/2034 | 871,301 | 895,160 | ||||||
Alternative Loan Trust 2005-61 | ||||||||
1.60%, 12/25/2035 | 82,344 | 70,499 | ||||||
Alternative Loan Trust 2006-HY12 | ||||||||
3.16%, 08/25/2036 | 462,552 | 455,531 | ||||||
Alternative Loan Trust 2006-OA7 | ||||||||
1.67%, 06/25/2046 | 20,220,899 | 18,591,877 | ||||||
BAMLL Commercial Mortgage Securities Trust 2012-PARK | ||||||||
| Principal Amount | Value | |||||||
2.96%, 12/12/2030 (Acquired 06/09/2016 through 03/08/2017, Cost $1,910,219) (1) | 1,860,000 | 1,893,541 | ||||||
BAMLL Commercial Mortgage Securities Trust 2015-ASTR | ||||||||
3.82%, 07/16/2037 (Acquired 06/27/2017, Cost $401,961) (1) | 380,000 | 399,096 | ||||||
Banc of America Commercial Mortgage Trust 2007-3 | ||||||||
5.87%, 06/10/2049 | 822,073 | 826,273 | ||||||
Banc of America Commercial Mortgage Trust 2007-5 | ||||||||
5.49%, 02/10/2051 | 483,490 | 484,138 | ||||||
6.27%, 02/10/2051 | 12,983,273 | 13,188,813 | ||||||
Banc of America Commercial Mortgage Trust 2008-1 | ||||||||
6.51%, 02/10/2051 | 9,300,000 | 9,429,941 | ||||||
Banc of America Funding 2015-R7 Trust | ||||||||
1.61%, 09/26/2046 (Acquired 07/27/2015 through 09/25/2015, Cost $2,078,604) (1) | 2,157,424 | 2,146,266 | ||||||
Banc of America Funding 2015-R8 Trust | ||||||||
1.53%, 11/27/2046 (Acquired 09/28/2015, Cost $3,017,575) (1) | 3,184,405 | 3,168,582 | ||||||
BANK 2017-BNK5 | ||||||||
3.08%, 06/17/2060 (Acquired 06/16/2017, Cost $628,027) (1) | 785,000 | 624,251 | ||||||
Bayview Opportunity Master Fund IVa Trust 2017-RT1 | ||||||||
3.00%, 03/28/2057 (Acquired 04/28/2017, Cost $289,918) (1) | 287,991 | 291,373 | ||||||
Bear Stearns ALT-A Trust 2005-1 | ||||||||
2.34%, 01/25/2035 | 6,750,000 | 5,860,582 | ||||||
Bear Stearns ALT-A Trust 2005-8 | ||||||||
1.76%, 10/25/2035 | 570,373 | 532,220 | ||||||
Bear Stearns ARM Trust 2003-3 | ||||||||
3.19%, 05/25/2033 | 962,143 | 970,490 | ||||||
BXP Trust 2017-GM | ||||||||
3.38%, 06/15/2039 (Acquired 06/21/2017 through 06/27/2017, Cost $8,630,490) (1) | 8,385,000 | 8,419,060 | ||||||
CIM Trust | ||||||||
2.30%, 05/25/2057 (Acquired 05/24/2017, Cost $9,519,746) | 9,522,704 | 9,512,276 | ||||||
3.05%, 10/25/2057 (Acquired 10/20/2016, Cost $7,551,092) (1) | 7,587,143 | 7,616,159 | ||||||
Citigroup Commercial Mortgage Trust 2015-GC27 | ||||||||
2.69%, 02/12/2048 | 1,700,000 | 1,721,607 | ||||||
3.57%, 02/12/2048 | 430,000 | 438,509 | ||||||
Citigroup Commercial Mortgage Trust 2015-GC33 | ||||||||
3.78%, 09/12/2058 | 340,000 | 355,953 | ||||||
4.11%, 09/12/2058 | 350,000 | 368,500 | ||||||
Clavis Securities Plc | ||||||||
0.46%, 12/15/2032* | GBP 1,513,450 | 1,900,728 | ||||||
CLNS Trust 2017-IKPR | ||||||||
| Principal Amount | Value | |||||||
1.80%, 06/11/2032 (Acquired 05/18/2017, Cost $315,000) (1) | $ | 315,000 | 315,392 | |||||
COLT 2017-1 Mortgage Loan Trust | ||||||||
2.61%, 05/27/2047 (Acquired 04/27/2017, Cost $493,636) (1) | 493,645 | 496,193 | ||||||
COMM 2013-300P Mortgage Trust | ||||||||
4.35%, 08/12/2030 (Acquired 01/22/2016, Cost $766,186) (1) | 720,000 | 782,746 | ||||||
COMM 2013-CCRE12 Mortgage Trust | ||||||||
4.05%, 10/15/2046 | 1,830,000 | 1,952,185 | ||||||
COMM 2013-SFS Mortgage Trust | ||||||||
3.09%, 04/13/2035 (Acquired 06/02/2016, Cost $1,482,629) (1) | 1,445,000 | 1,462,567 | ||||||
COMM 2014-277P Mortgage Trust | ||||||||
3.73%, 08/12/2049 (Acquired 05/10/2016, Cost $785,723) (1) | 735,000 | 766,986 | ||||||
COMM 2014-LC15 Mortgage Trust | ||||||||
4.01%, 04/12/2047 | 1,250,000 | 1,327,447 | ||||||
COMM 2014-UBS2 Mortgage Trust | ||||||||
5.15%, 03/12/2047 | 800,000 | 828,974 | ||||||
COMM 2014-UBS4 Mortgage Trust | ||||||||
4.78%, 08/12/2047 | 490,000 | 493,712 | ||||||
COMM 2015-CCRE24 Mortgage Trust | ||||||||
3.70%, 08/10/2055 | 2,020,000 | 2,102,817 | ||||||
COMM 2015-CCRE26 Mortgage Trust | ||||||||
3.63%, 10/13/2048 | 905,000 | 937,242 | ||||||
COMM 2015-PC1 Mortgage Trust | ||||||||
3.90%, 07/10/2050 | 515,000 | 541,223 | ||||||
4.29%, 07/12/2050 | 1,075,000 | 1,140,646 | ||||||
4.59%, 07/12/2050 | 440,000 | 442,892 | ||||||
COMM 2016-787S Mortgage Trust | ||||||||
3.55%, 02/12/2036 (Acquired 02/19/2016, Cost $779,221) (1) | 760,000 | 782,167 | ||||||
Commercial Mortgage Asset Trust | ||||||||
6.25%, 01/17/2032 (Acquired 06/21/2017, Cost $3,546,567) (1) | 3,524,579 | 3,542,202 | ||||||
Commercial Mortgage Pass Through Certificates | ||||||||
3.65%, 02/12/2049 | 391,447 | 395,895 | ||||||
Cosmopolitan Hotel Trust 2016-COSMO | ||||||||
3.26%, 11/15/2033 (Acquired 11/04/2016, Cost $641,000) (1) | 641,000 | 645,816 | ||||||
4.66%, 11/15/2033 (Acquired 11/04/2016, Cost $836,000) (1) | 836,000 | 846,421 | ||||||
5.81%, 11/15/2033 (Acquired 11/04/2016, Cost $1,234,000) (1) | 1,234,000 | 1,253,694 | ||||||
| Principal Amount | Value | |||||||
Countrywide Asset-Backed Certificates | ||||||||
2.02%, 11/25/2035 | 3,019,389 | 2,996,012 | ||||||
Credit Suisse First Boston Mortgage Securities Co. | ||||||||
5.75%, 11/25/2033 | 155,406 | 160,609 | ||||||
Credit Suisse Mortgage Capital Certificates | ||||||||
3.64%, 11/17/2034 (Acquired 12/04/2015 through 11/15/2016, Cost $5,082,402) (1) | 4,860,000 | 5,100,539 | ||||||
3.94%, 11/17/2034 (Acquired 12/04/2015, Cost $570,753) (1) | 560,000 | 586,974 | ||||||
CSAIL 2015-C2 Commercial Mortgage Trust | ||||||||
4.21%, 06/15/2057 | 1,630,000 | 1,673,484 | ||||||
CSAIL 2016-C6 Commercial Mortgage Trust | ||||||||
3.09%, 01/15/2049 | 840,000 | 833,600 | ||||||
CSAIL 2017-C8 Commercial Mortgage Trust | ||||||||
3.39%, 06/17/2050 | 2,405,000 | 2,445,128 | ||||||
CWALT, Inc. 2007-OA2 | ||||||||
1.35%, 03/25/2047 | 15,909,502 | 12,961,996 | ||||||
DBCG 2017-BBG Mortgage Trust | ||||||||
1.80%, 06/16/2034 (Acquired 06/14/2017, Cost $2,645,000) (1) | 2,645,000 | 2,648,835 | ||||||
Deutsche Alt-A Securities, Inc. Mortgage Loan Trust Series 2005-2 | ||||||||
1.62%, 04/25/2035 | 1,452,861 | 1,332,517 | ||||||
Eleven Madison Trust 2015-11MD Mortgage Trust | ||||||||
3.67%, 09/12/2035 (Acquired 09/15/2015 through 06/27/2017, Cost $3,234,393) (1) | 3,110,000 | 3,227,189 | ||||||
Eurosail-UK 2007-5np Plc | ||||||||
1.06%, 09/13/2045* | GBP 13,616,612 | 16,371,999 | ||||||
Fannie Mae Connecticut Avenue Securities | ||||||||
5.77%, 02/25/2025 | $ | 2,005,135 | 2,165,993 | |||||
3.37%, 09/25/2028 | 392,027 | 397,633 | ||||||
2.57%, 01/25/2029 | 234,049 | 235,961 | ||||||
2.52%, 04/25/2029 | 2,188,173 | 2,218,518 | ||||||
2.52%, 05/25/2029 | 276,700 | 278,669 | ||||||
4.77%, 07/25/2029 | 505,000 | 533,305 | ||||||
2.37%, 09/25/2029 | 1,045,663 | 1,055,003 | ||||||
4.87%, 09/25/2029 | 1,710,000 | 1,814,384 | ||||||
4.22%, 10/25/2029 | 410,000 | 421,048 | ||||||
4.07%, 11/26/2029 | 2,050,000 | 2,078,813 | ||||||
Fannie Mae Pool | ||||||||
3.68%, 10/01/2021 | 1,162,762 | 1,230,818 | ||||||
2.28%, 11/01/2022 | 1,612,376 | 1,619,507 | ||||||
2.81%, 04/01/2025 | 980,000 | 988,742 | ||||||
| Principal Amount | Value | |||||||
3.89%, 08/01/2025 | 1,470,000 | 1,584,711 | ||||||
2.74%, 03/01/2026 | 1,535,000 | 1,535,484 | ||||||
4.59%, 08/01/2026 | 1,147,551 | 1,264,363 | ||||||
2.50%, 09/01/2026 | 7,537,738 | 7,621,580 | ||||||
3.40%, 11/01/2026 | 2,793,961 | 2,910,261 | ||||||
4.19%, 11/01/2026 | 1,176,101 | 1,279,644 | ||||||
3.47%, 12/01/2026 | 2,982,172 | 3,106,438 | ||||||
3.22%, 01/01/2027 | 3,565,000 | 3,661,403 | ||||||
3.22%, 01/01/2027 | 3,565,000 | 3,661,403 | ||||||
2.96%, 05/01/2027 | 2,214,266 | 2,229,920 | ||||||
4.00%, 05/01/2027 | 1,445,112 | 1,520,637 | ||||||
3.00%, 07/15/2027 (3) | 10,615,000 | 10,892,815 | ||||||
3.28%, 02/01/2028 | 2,355,000 | 2,417,038 | ||||||
2.91%, 04/01/2028 | 2,014,912 | 2,015,675 | ||||||
2.82%, 05/01/2028 | 2,242,417 | 2,231,624 | ||||||
2.68%, 08/01/2028 | 4,220,000 | 4,095,716 | ||||||
3.00%, 10/01/2028 | 588,798 | 604,644 | ||||||
3.24%, 06/01/2029 | 5,420,000 | 5,535,309 | ||||||
3.24%, 06/01/2029 | 5,580,000 | 5,698,713 | ||||||
4.00%, 07/01/2029 | 1,526,000 | 1,607,563 | ||||||
3.00%, 05/01/2030 | 299,416 | 307,474 | ||||||
2.50%, 07/01/2030 | 1,526,476 | 1,539,572 | ||||||
2.50%, 07/01/2030 | 865,200 | 872,625 | ||||||
2.50%, 08/01/2030 | 2,221,727 | 2,240,794 | ||||||
3.55%, 08/01/2030 | 1,548,453 | 1,616,389 | ||||||
3.00%, 09/01/2030 | 3,541,974 | 3,637,294 | ||||||
3.00%, 12/01/2030 | 1,227,189 | 1,260,215 | ||||||
3.43%, 02/01/2031 | 2,755,000 | 2,843,238 | ||||||
2.97%, 05/01/2031 | 2,925,000 | 2,881,070 | ||||||
2.50%, 10/01/2031 | 121,229 | 122,004 | ||||||
2.50%, 11/01/2031 | 1,705,400 | 1,715,107 | ||||||
2.50%, 12/01/2031 | 6,299,170 | 6,335,027 | ||||||
2.50%, 02/01/2032 | 3,834,479 | 3,856,306 | ||||||
2.50%, 02/01/2032 | 6,345,246 | 6,381,365 | ||||||
2.50%, 06/01/2032 | 10,315,000 | 10,373,716 | ||||||
3.00%, 06/01/2032 | 2,637,184 | 2,708,155 | ||||||
3.00%, 04/01/2033 | 12,076 | 12,117 | ||||||
| Principal Amount | Value | |||||||
3.00%, 06/01/2033 | 19,462 | 19,527 | ||||||
3.00%, 10/01/2033 | 3,018,986 | 3,089,845 | ||||||
6.00%, 03/01/2034 | 3,118,313 | 3,561,916 | ||||||
5.50%, 05/01/2034 | 2,637,811 | 2,954,983 | ||||||
5.50%, 07/01/2034 | 650,135 | 728,527 | ||||||
5.00%, 07/01/2035 | 1,256,273 | 1,386,943 | ||||||
4.50%, 11/01/2035 | 538,089 | 579,384 | ||||||
5.00%, 02/01/2036 | 2,118,140 | 2,325,200 | ||||||
6.00%, 06/01/2036 | 20,762 | 23,580 | ||||||
5.50%, 07/01/2036 | 252,841 | 283,224 | ||||||
3.00%, 11/01/2036 | 2,239,443 | 2,277,556 | ||||||
3.00%, 11/01/2036 | 2,537,837 | 2,581,029 | ||||||
3.00%, 11/01/2036 | 307,237 | 312,466 | ||||||
3.00%, 12/01/2036 | 395,582 | 401,703 | ||||||
6.00%, 07/01/2038 | 2,090,496 | 2,388,757 | ||||||
6.00%, 10/01/2038 | 130,377 | 148,302 | ||||||
5.50%, 12/01/2039 | 537,133 | 598,437 | ||||||
5.50%, 03/01/2040 | 3,023,525 | 3,386,761 | ||||||
5.00%, 05/01/2040 | 52,297 | 57,084 | ||||||
6.50%, 05/01/2040 | 758,390 | 861,396 | ||||||
5.00%, 06/01/2040 | 16,690 | 18,243 | ||||||
4.00%, 07/01/2040 (3) | 59,580,000 | 62,619,509 | ||||||
4.50%, 08/01/2040 | 155,506 | 168,162 | ||||||
4.50%, 08/15/2040 (3) | 39,580,000 | 42,396,952 | ||||||
4.50%, 09/01/2040 | 60,181 | 65,071 | ||||||
4.00%, 11/01/2040 | 517,882 | 546,780 | ||||||
4.00%, 11/01/2040 | 140,079 | 147,898 | ||||||
4.50%, 11/01/2040 | 3,822,364 | 4,133,954 | ||||||
4.00%, 12/01/2040 | 343,608 | 362,713 | ||||||
4.00%, 01/01/2041 | 256,426 | 270,625 | ||||||
4.50%, 01/01/2041 | 37,776 | 40,857 | ||||||
4.00%, 02/01/2041 | 260,676 | 275,203 | ||||||
4.00%, 02/01/2041 | 850,825 | 898,121 | ||||||
4.00%, 02/01/2041 | 1,134,055 | 1,197,657 | ||||||
4.50%, 02/01/2041 | 534,227 | 577,543 | ||||||
5.00%, 02/01/2041 | 1,346,773 | 1,471,095 | ||||||
5.50%, 06/01/2041 | 581,067 | 654,071 | ||||||
| Principal Amount | Value | |||||||
5.00%, 07/01/2041 | 1,541,852 | 1,687,517 | ||||||
3.50%, 07/15/2041 (3) | 35,495,000 | 36,445,056 | ||||||
4.50%, 08/01/2041 | 64,657 | 69,910 | ||||||
5.00%, 08/01/2041 | 566,821 | 619,983 | ||||||
4.00%, 09/01/2041 | 510,758 | 538,996 | ||||||
4.50%, 11/01/2041 | 1,099,161 | 1,186,999 | ||||||
4.00%, 01/01/2042 | 73,025 | 77,033 | ||||||
4.00%, 01/01/2042 | 4,431,844 | 4,675,663 | ||||||
4.00%, 02/01/2042 | 120,717 | 127,343 | ||||||
5.50%, 02/01/2042 | 1,575,582 | 1,752,496 | ||||||
5.50%, 02/01/2042 | 2,351,264 | 2,616,263 | ||||||
5.00%, 03/01/2042 | 875,693 | 958,998 | ||||||
3.50%, 06/01/2042 | 147,666 | 152,390 | ||||||
3.50%, 06/01/2042 | 93,690 | 96,680 | ||||||
3.50%, 07/01/2042 | 124,554 | 128,530 | ||||||
3.50%, 07/01/2042 | 958,407 | 988,897 | ||||||
3.00%, 07/15/2042 (3) | 10,830,000 | 10,813,078 | ||||||
3.50%, 08/01/2042 | 251,892 | 259,912 | ||||||
2.50%, 12/01/2042 | 350,156 | 339,016 | ||||||
3.50%, 12/01/2042 | 2,631,396 | 2,715,629 | ||||||
3.50%, 12/01/2042 | 1,564,574 | 1,612,522 | ||||||
2.50%, 01/01/2043 | 1,060,426 | 1,026,637 | ||||||
2.50%, 01/01/2043 | 5,248,702 | 5,081,761 | ||||||
3.00%, 01/01/2043 | 17,348 | 17,369 | ||||||
3.50%, 01/01/2043 | 392,733 | 405,290 | ||||||
3.00%, 02/01/2043 | 991,593 | 992,820 | ||||||
3.00%, 02/01/2043 | 21,568 | 21,595 | ||||||
3.00%, 03/01/2043 | 165,596 | 165,802 | ||||||
3.00%, 03/01/2043 | 17,460 | 17,482 | ||||||
3.00%, 03/01/2043 | 33,313 | 33,354 | ||||||
3.50%, 03/01/2043 | 1,633,533 | 1,685,777 | ||||||
2.50%, 04/01/2043 | 469,466 | 454,538 | ||||||
3.00%, 04/01/2043 | 1,112,361 | 1,116,829 | ||||||
3.00%, 04/01/2043 | 18,740 | 18,763 | ||||||
3.50%, 04/01/2043 | 129,964 | 133,904 | ||||||
3.00%, 05/01/2043 | 862,208 | 865,633 | ||||||
3.50%, 05/01/2043 | 653,794 | 674,649 | ||||||
| Principal Amount | Value | |||||||
3.00%, 06/01/2043 | 16,351,792 | 16,414,888 | ||||||
3.50%, 06/01/2043 | 1,217,138 | 1,253,226 | ||||||
3.50%, 06/01/2043 | 204,248 | 210,855 | ||||||
3.50%, 06/01/2043 | 2,692,293 | 2,774,158 | ||||||
3.50%, 07/01/2043 | 155,298 | 159,755 | ||||||
3.50%, 07/01/2043 | 253,255 | 261,447 | ||||||
3.00%, 08/01/2043 | 240,876 | 239,909 | ||||||
3.00%, 08/01/2043 | 431,489 | 432,024 | ||||||
3.00%, 08/01/2043 | 11,265,278 | 11,308,154 | ||||||
3.50%, 08/01/2043 | 173,969 | 179,244 | ||||||
3.50%, 09/01/2043 | 703,115 | 725,962 | ||||||
4.00%, 09/01/2043 | 2,855,482 | 3,004,821 | ||||||
5.50%, 10/01/2043 | 990,164 | 1,118,852 | ||||||
4.00%, 12/01/2043 | 5,412,960 | 5,694,560 | ||||||
3.50%, 01/01/2044 | 254,373 | 262,484 | ||||||
3.00%, 02/01/2044 | 49,800 | 49,600 | ||||||
3.50%, 03/01/2044 | 326,976 | 337,856 | ||||||
4.50%, 06/01/2044 | 898,252 | 964,632 | ||||||
3.50%, 07/01/2044 | 1,267,335 | 1,304,175 | ||||||
4.50%, 08/01/2044 | 1,047,265 | 1,124,504 | ||||||
3.00%, 09/01/2044 | 91,368 | 91,482 | ||||||
5.00%, 11/01/2044 | 5,044,655 | 5,534,625 | ||||||
4.50%, 02/01/2045 | 974,425 | 1,046,312 | ||||||
3.00%, 04/01/2045 | 43,064 | 42,891 | ||||||
3.50%, 04/01/2045 | 2,378,650 | 2,443,819 | ||||||
3.00%, 05/01/2045 | 840,598 | 843,985 | ||||||
3.00%, 05/01/2045 | 1,834,026 | 1,836,866 | ||||||
3.50%, 05/01/2045 | 3,095,389 | 3,180,194 | ||||||
3.50%, 05/01/2045 | 1,354,753 | 1,397,442 | ||||||
3.50%, 06/01/2045 | 4,035,588 | 4,146,152 | ||||||
4.50%, 06/01/2045 | 541,791 | 590,178 | ||||||
3.00%, 07/01/2045 | 1,279,431 | 1,279,069 | ||||||
3.00%, 07/01/2045 | 8,253,275 | 8,276,272 | ||||||
3.50%, 07/01/2045 | 4,010,129 | 4,127,686 | ||||||
4.00%, 07/01/2045 | 1,637,781 | 1,722,163 | ||||||
5.00%, 07/01/2045 | 1,094,240 | 1,196,474 | ||||||
4.00%, 09/01/2045 | 190,814 | 200,645 | ||||||
| Principal Amount | Value | |||||||
4.00%, 09/01/2045 | 254,798 | 267,926 | ||||||
3.50%, 10/01/2045 | 546,654 | 562,700 | ||||||
4.00%, 10/01/2045 | 2,854,425 | 3,001,491 | ||||||
3.50%, 11/01/2045 | 7,474,754 | 7,679,542 | ||||||
3.50%, 12/01/2045 | 2,066,411 | 2,123,025 | ||||||
4.00%, 12/01/2045 | 1,702,785 | 1,798,467 | ||||||
4.00%, 12/01/2045 | 249,269 | 263,272 | ||||||
3.50%, 01/01/2046 | 142,835 | 146,748 | ||||||
4.50%, 02/01/2046 | 4,710,279 | 5,057,570 | ||||||
4.00%, 03/01/2046 | 2,251,853 | 2,384,112 | ||||||
4.50%, 03/01/2046 | 3,218,500 | 3,451,389 | ||||||
3.50%, 04/01/2046 | 4,563,270 | 4,688,292 | ||||||
3.50%, 05/01/2046 | 1,337,343 | 1,376,706 | ||||||
3.50%, 06/01/2046 | 3,671,918 | 3,790,627 | ||||||
3.00%, 08/01/2046 | 164,184 | 163,524 | ||||||
3.00%, 09/01/2046 | 197,384 | 196,591 | ||||||
3.50%, 09/01/2046 | 10,105,851 | 10,382,725 | ||||||
4.00%, 09/01/2046 | 154,874 | 162,853 | ||||||
4.50%, 09/01/2046 | 6,803,174 | 7,297,350 | ||||||
3.00%, 10/01/2046 | 9,461,545 | 9,459,381 | ||||||
3.00%, 11/01/2046 | 2,189,661 | 2,187,784 | ||||||
3.00%, 11/01/2046 | 2,673,155 | 2,676,970 | ||||||
3.00%, 11/01/2046 | 1,491,364 | 1,493,492 | ||||||
3.00%, 11/01/2046 | 3,536,840 | 3,536,031 | ||||||
3.00%, 11/01/2046 | 1,126,911 | 1,128,520 | ||||||
3.00%, 11/01/2046 | 6,829,944 | 6,828,382 | ||||||
3.00%, 12/01/2046 | 5,689,239 | 5,697,357 | ||||||
3.00%, 12/01/2046 | 1,773,219 | 1,771,699 | ||||||
3.50%, 12/01/2046 | 3,133,321 | 3,219,166 | ||||||
3.00%, 01/01/2047 | 3,659,225 | 3,666,880 | ||||||
3.50%, 01/01/2047 | 11,074,372 | 11,377,780 | ||||||
3.50%, 02/01/2047 | 2,091,100 | 2,148,391 | ||||||
3.50%, 04/01/2047 | 6,675,083 | 6,857,963 | ||||||
4.00%, 04/01/2047 | 7,130,660 | 7,498,047 | ||||||
4.50%, 04/01/2047 | 38,739,149 | 41,539,641 | ||||||
4.50%, 04/01/2047 | 3,655,232 | 3,920,217 | ||||||
3.50%, 07/01/2047 | 6,385,000 | 6,559,932 | ||||||
| Principal Amount | Value | |||||||
Fannie Mae REMICS | ||||||||
1.72%, 05/25/2046 | 3,833,397 | 3,836,731 | ||||||
1.72%, 09/25/2046 | 1,720,084 | 1,734,828 | ||||||
1.72%, 09/25/2046 | 1,372,803 | 1,388,908 | ||||||
1.67%, 10/25/2046 | 801,394 | 806,413 | ||||||
1.67%, 11/25/2046 | 1,615,832 | 1,626,829 | ||||||
1.72%, 11/25/2046 | 930,692 | 939,805 | ||||||
1.72%, 01/25/2047 | 258,457 | 260,732 | ||||||
1.67%, 03/25/2047 | 971,339 | 979,011 | ||||||
Four Times Square Trust Commercial Mortgage Pass-Through Certificates Series 200 | ||||||||
5.40%, 12/13/2028 (Acquired 11/15/2016, Cost $558,463) (1) | 508,362 | 556,929 | ||||||
Freddie Mac Gold Pool | ||||||||
2.50%, 07/01/2030 | 1,883,739 | 1,895,110 | ||||||
3.00%, 03/01/2031 | 1,170,428 | 1,202,694 | ||||||
2.50%, 12/01/2031 | 9,702,135 | 9,760,699 | ||||||
8.00%, 04/01/2032 | 310,001 | 379,897 | ||||||
4.00%, 08/15/2040 (3) | 2,250,000 | 2,361,621 | ||||||
4.50%, 08/15/2040 (3) | 2,020,000 | 2,160,576 | ||||||
5.50%, 08/01/2041 | 10,375,527 | 11,716,293 | ||||||
5.00%, 11/01/2041 | 1,605,853 | 1,759,875 | ||||||
5.00%, 03/01/2042 | 560,716 | 620,926 | ||||||
4.50%, 07/01/2042 | 1,055,409 | 1,133,975 | ||||||
3.00%, 02/01/2043 | 1,071,639 | 1,075,737 | ||||||
3.00%, 02/01/2043 | 115,554 | 114,858 | ||||||
3.00%, 03/01/2043 | 19,527 | 19,410 | ||||||
3.00%, 03/01/2043 | 42,594 | 42,337 | ||||||
3.50%, 10/01/2043 | 1,181,835 | 1,219,121 | ||||||
3.50%, 01/01/2044 | 1,391,922 | 1,435,815 | ||||||
4.50%, 05/01/2044 | 589,040 | 637,899 | ||||||
4.00%, 01/01/2045 | 2,902,260 | 3,087,578 | ||||||
4.50%, 06/01/2045 | 1,039,419 | 1,138,221 | ||||||
4.00%, 07/01/2045 | 981,388 | 1,032,753 | ||||||
3.50%, 10/01/2045 | 16,193,489 | 16,734,732 | ||||||
4.00%, 11/01/2045 | 18,130,372 | 19,079,306 | ||||||
4.00%, 12/01/2045 | 6,112,857 | 6,493,906 | ||||||
4.50%, 02/01/2046 | 1,044,021 | 1,143,211 | ||||||
3.50%, 03/01/2046 | 2,392,437 | 2,472,453 | ||||||
| Principal Amount | Value | |||||||
3.50%, 03/01/2046 | 10,212,717 | 10,497,090 | ||||||
3.50%, 04/01/2046 | 1,081,702 | 1,111,822 | ||||||
3.50%, 05/01/2046 | 9,484,972 | 9,749,082 | ||||||
3.50%, 05/01/2046 | 868,132 | 893,609 | ||||||
4.00%, 05/01/2046 | 8,972,711 | 9,442,338 | ||||||
4.50%, 05/01/2046 | 1,117,264 | 1,223,417 | ||||||
3.00%, 06/01/2046 | 9,876,100 | 9,859,597 | ||||||
3.50%, 06/01/2046 | 11,088,276 | 11,397,029 | ||||||
4.50%, 06/01/2046 | 1,330,783 | 1,453,482 | ||||||
3.00%, 08/01/2046 | 11,801,456 | 11,781,737 | ||||||
3.50%, 08/01/2046 | 19,210,110 | 19,745,016 | ||||||
3.50%, 08/01/2046 | 15,226,744 | 15,735,098 | ||||||
3.00%, 09/01/2046 | 2,549,973 | 2,545,712 | ||||||
3.00%, 10/01/2046 | 7,811,139 | 7,798,087 | ||||||
3.00%, 11/01/2046 | 3,644,833 | 3,638,743 | ||||||
3.50%, 11/01/2046 | 3,768,380 | 3,873,310 | ||||||
3.00%, 12/01/2046 | 2,560,193 | 2,555,915 | ||||||
3.50%, 12/01/2046 | 1,939,716 | 1,993,728 | ||||||
3.00%, 01/01/2047 | 12,402,181 | 12,381,458 | ||||||
3.50%, 01/01/2047 | 2,211,136 | 2,272,705 | ||||||
3.00%, 02/01/2047 | 8,782,537 | 8,767,862 | ||||||
3.50%, 02/01/2047 | 1,871,422 | 1,923,532 | ||||||
4.50%, 02/01/2047 | 935,084 | 1,027,011 | ||||||
3.00%, 03/01/2047 | 6,455,392 | 6,444,606 | ||||||
3.50%, 04/01/2047 | 8,887,612 | 9,135,088 | ||||||
Freddie Mac Multifamily Structured Pass Through Certificates | ||||||||
3.51%, 04/25/2030 | 1,415,000 | 1,469,472 | ||||||
Freddie Mac REMICS | ||||||||
1.66%, 04/15/2046 | 759,407 | 765,578 | ||||||
1.66%, 08/15/2046 | 113,451 | 114,502 | ||||||
1.66%, 09/15/2046 | 1,246,197 | 1,259,492 | ||||||
1.61%, 10/15/2046 | 416,830 | 419,576 | ||||||
1.66%, 10/15/2046 | 649,580 | 656,186 | ||||||
1.66%, 10/15/2046 | 385,256 | 389,410 | ||||||
1.61%, 01/15/2047 | 894,905 | 900,522 | ||||||
1.66%, 01/15/2047 | 920,353 | 929,243 | ||||||
1.66%, 02/15/2047 | 591,474 | 597,315 | ||||||
| Principal Amount | Value | |||||||
Freddie Mac Structured Agency Credit Risk Debt Notes | ||||||||
3.42%, 02/26/2024 | 593,564 | 610,197 | ||||||
2.87%, 04/25/2024 | 2,217,550 | 2,252,900 | ||||||
3.62%, 08/26/2024 | 43,951 | 44,144 | ||||||
3.87%, 10/25/2024 | 1,385,542 | 1,396,260 | ||||||
3.62%, 01/27/2025 | 159,310 | 160,014 | ||||||
3.42%, 03/25/2025 | 778,526 | 787,540 | ||||||
3.17%, 05/27/2025 | 2,680,000 | 2,730,691 | ||||||
3.07%, 10/25/2027 | 950,000 | 974,393 | ||||||
3.82%, 12/27/2027 | 1,946,718 | 1,994,477 | ||||||
3.87%, 03/27/2028 | 583,594 | 598,337 | ||||||
4.07%, 04/25/2028 | 5,138,209 | 5,321,901 | ||||||
4.02%, 05/25/2028 | 504,553 | 522,389 | ||||||
4.12%, 07/25/2028 | 325,000 | 338,347 | ||||||
3.22%, 12/26/2028 | 955,000 | 978,853 | ||||||
2.02%, 03/26/2029 | 580,201 | 581,498 | ||||||
5.07%, 03/26/2029 | 673,000 | 728,369 | ||||||
2.42%, 07/25/2029 | 371,246 | 376,137 | ||||||
4.47%, 07/25/2029 | 390,000 | 406,831 | ||||||
4.77%, 08/27/2029 | 2,190,000 | 2,315,024 | ||||||
4.67%, 10/25/2029 | 720,000 | 760,391 | ||||||
1.96%, 12/26/2029 | 380,000 | 381,375 | ||||||
3.81%, 12/26/2029 | 250,000 | 250,468 | ||||||
GAHR Commercial Mortgage Trust 2015-NRF | ||||||||
3.49%, 12/15/2019 (Acquired 07/13/2015, Cost $1,244,806) (1) | 1,250,000 | 1,268,241 | ||||||
Ginnie Mae I Pool | ||||||||
7.50%, 08/15/2033 | 470,969 | 550,080 | ||||||
5.00%, 09/15/2039 | 65,599 | 72,769 | ||||||
5.00%, 10/15/2039 | 534,762 | 587,199 | ||||||
5.00%, 12/15/2039 | 764,659 | 840,181 | ||||||
5.00%, 02/15/2040 | 99,947 | 111,842 | ||||||
5.00%, 02/15/2040 | 99,947 | 111,793 | ||||||
5.00%, 06/15/2040 | 305,940 | 336,242 | ||||||
4.50%, 05/15/2041 | 737,755 | 827,148 | ||||||
5.00%, 09/15/2041 | 197,115 | 219,836 | ||||||
3.00%, 10/15/2042 | 280,563 | 284,516 | ||||||
3.00%, 12/15/2042 | 44,274 | 44,898 | ||||||
| Principal Amount | Value | |||||||
3.50%, 12/15/2042 | 15,021 | 15,643 | ||||||
3.50%, 01/15/2043 | 20,892 | 21,761 | ||||||
3.00%, 05/15/2043 | 152,096 | 154,240 | ||||||
3.00%, 06/15/2043 | 13,878 | 14,072 | ||||||
3.00%, 06/15/2043 | 13,844 | 14,038 | ||||||
3.50%, 10/15/2043 | 88,362 | 92,032 | ||||||
5.00%, 07/15/2044 | 277,922 | 308,916 | ||||||
4.50%, 09/15/2045 | 278,871 | 300,510 | ||||||
Ginnie Mae II Pool | ||||||||
5.00%, 05/20/2040 | 309,988 | 340,943 | ||||||
5.00%, 06/20/2040 | 163,389 | 180,661 | ||||||
5.00%, 08/20/2040 | 125,506 | 137,834 | ||||||
5.00%, 09/20/2040 | 104,124 | 114,382 | ||||||
4.50%, 07/15/2041 (3) | 24,170,000 | 25,681,551 | ||||||
4.00%, 07/15/2042 (3) | 38,480,000 | 40,488,175 | ||||||
3.00%, 07/20/2042 | 581,295 | 589,369 | ||||||
3.50%, 08/20/2042 | 28,746 | 29,894 | ||||||
3.50%, 09/20/2042 | 4,917,990 | 5,114,415 | ||||||
2.50%, 10/20/2042 | 814,508 | 798,564 | ||||||
2.50%, 12/20/2042 | 266,692 | 261,472 | ||||||
3.50%, 12/20/2042 | 11,735 | 12,204 | ||||||
3.00%, 01/20/2043 | 876,658 | 888,834 | ||||||
3.50%, 02/20/2043 | 31,974 | 33,251 | ||||||
3.50%, 05/20/2043 | 15,259 | 15,868 | ||||||
2.50%, 06/20/2043 | 332,251 | 325,747 | ||||||
3.50%, 09/20/2043 | 214,777 | 223,356 | ||||||
3.50%, 10/20/2044 | 76,037 | 79,183 | ||||||
3.00%, 12/20/2044 | 976,403 | 987,251 | ||||||
3.50%, 12/20/2044 | 17,600 | 18,254 | ||||||
5.00%, 12/20/2044 | 406,933 | 456,403 | ||||||
2.50%, 01/20/2045 | 2,270,906 | 2,223,105 | ||||||
3.50%, 03/20/2045 | 745,921 | 773,250 | ||||||
3.50%, 05/20/2045 | 24,966 | 25,929 | ||||||
5.50%, 06/20/2045 | 450,543 | 495,195 | ||||||
3.00%, 07/15/2045 (3) | 10,710,000 | 10,817,100 | ||||||
3.50%, 07/15/2045 (3) | 21,930,000 | 22,709,543 | ||||||
3.50%, 07/20/2045 | 966,874 | 1,002,298 | ||||||
| Principal Amount | Value | |||||||
4.00%, 09/20/2045 | 312,596 | 329,176 | ||||||
3.50%, 10/20/2045 | 169,210 | 175,745 | ||||||
3.50%, 10/20/2045 | 127,541 | 132,455 | ||||||
4.00%, 10/20/2045 | 2,213,022 | 2,330,400 | ||||||
4.00%, 11/20/2045 | 1,218,419 | 1,283,043 | ||||||
4.00%, 12/20/2045 | 7,438,703 | 7,833,250 | ||||||
3.00%, 01/20/2046 | 1,195,649 | 1,208,871 | ||||||
3.50%, 01/20/2046 | 3,524,520 | 3,653,653 | ||||||
4.50%, 01/20/2046 | 1,289,797 | 1,371,180 | ||||||
3.50%, 02/20/2046 | 990,296 | 1,029,578 | ||||||
3.50%, 02/20/2046 | 1,989,259 | 2,066,500 | ||||||
3.50%, 03/20/2046 | 3,411,555 | 3,536,549 | ||||||
3.50%, 04/20/2046 | 4,097,355 | 4,247,475 | ||||||
3.00%, 05/20/2046 | 120,882 | 122,510 | ||||||
3.00%, 05/20/2046 | 42,633 | 43,149 | ||||||
3.50%, 05/20/2046 | 119,953 | 124,665 | ||||||
3.50%, 05/20/2046 | 24,522 | 25,485 | ||||||
3.50%, 05/20/2046 | 22,260 | 23,134 | ||||||
3.50%, 05/20/2046 | 10,434,214 | 10,816,506 | ||||||
4.00%, 05/20/2046 | 2,130,659 | 2,243,669 | ||||||
3.00%, 06/20/2046 | 218,044 | 220,580 | ||||||
3.50%, 06/20/2046 | 132,664 | 137,863 | ||||||
3.00%, 07/20/2046 | 279,996 | 283,409 | ||||||
3.00%, 07/20/2046 | 197,141 | 199,522 | ||||||
3.00%, 07/20/2046 | 205,220 | 207,712 | ||||||
3.00%, 07/20/2046 | 71,589 | 72,455 | ||||||
3.00%, 07/20/2046 | 384,807 | 389,479 | ||||||
3.00%, 07/20/2046 | 111,242 | 112,741 | ||||||
3.00%, 08/20/2046 | 169,107 | 171,386 | ||||||
3.00%, 08/20/2046 | 90,044 | 91,108 | ||||||
3.00%, 08/20/2046 | 146,106 | 147,979 | ||||||
3.00%, 08/20/2046 | 1,501,168 | 1,517,768 | ||||||
3.00%, 09/20/2046 | 91,242 | 92,411 | ||||||
3.00%, 09/20/2046 | 90,577 | 91,647 | ||||||
3.50%, 09/20/2046 | 1,350,579 | 1,400,062 | ||||||
2.50%, 10/20/2046 | 731,491 | 712,836 | ||||||
3.00%, 10/20/2046 | 3,954,736 | 3,998,470 | ||||||
| Principal Amount | Value | |||||||
3.00%, 11/20/2046 | 1,978,157 | 2,000,033 | ||||||
3.00%, 12/20/2046 | 11,808,444 | 11,939,030 | ||||||
3.50%, 12/20/2046 | 8,039,172 | 8,333,713 | ||||||
3.50%, 01/20/2047 | 11,870,774 | 12,305,698 | ||||||
4.00%, 01/20/2047 | 4,000,460 | 4,213,609 | ||||||
4.50%, 02/20/2047 | 3,858,226 | 4,102,843 | ||||||
3.00%, 03/20/2047 | 2,383,109 | 2,409,463 | ||||||
4.50%, 03/20/2047 | 7,805,892 | 8,302,252 | ||||||
3.50%, 04/20/2047 | 5,289,031 | 5,482,811 | ||||||
4.00%, 04/20/2047 | 7,258,497 | 7,657,856 | ||||||
4.50%, 04/20/2047 | 12,172,973 | 12,951,391 | ||||||
4.00%, 05/20/2047 | 9,003,875 | 9,502,038 | ||||||
Government National Mortgage Association | ||||||||
3.50%, 03/20/2039 IO | 1,638,786 | 118,338 | ||||||
3.50%, 05/20/2043 IO | 368,947 | 71,462 | ||||||
GS Mortgage Securities Corp. Trust 2013-NYC5 | ||||||||
3.77%, 01/10/2030 (Acquired 08/20/2015, Cost $331,165) (1) | 330,000 | 332,430 | ||||||
GS Mortgage Securities Trust 2011-GC3 | ||||||||
5.82%, 03/11/2044 (Acquired 09/11/2015, Cost $361,836) (1) | 340,000 | 354,433 | ||||||
GS Mortgage Securities Trust 2011-GC5 | ||||||||
5.57%, 08/10/2044 (Acquired 01/25/2016, Cost $219,631) (1) | 220,000 | 215,991 | ||||||
GS Mortgage Securities Trust 2015-GC34 | ||||||||
3.51%, 10/13/2048 | 540,000 | 554,422 | ||||||
3.91%, 10/13/2048 | 170,000 | 175,057 | ||||||
GS Mortgage Securities Trust 2016-GS2 | ||||||||
3.05%, 05/12/2049 | 935,000 | 931,681 | ||||||
GSCCRE Commercial Mortgage Trust 2015-HULA | ||||||||
5.53%, 08/16/2032 (Acquired 01/18/2017, Cost $1,939,832) (1) | 1,936,000 | 1,945,662 | ||||||
Hospitality Mortgage Trust | ||||||||
1.94%, 05/08/2030 (Acquired 05/10/2017, Cost $510,000) (1) | 510,000 | 510,562 | ||||||
2.27%, 05/10/2030 (Acquired 05/10/2017, Cost $405,000) (1) | 405,000 | 405,484 | ||||||
IndyMac INDX Mortgage Loan Trust 2007-AR15 | ||||||||
3.49%, 08/25/2037 | 7,435,929 | 6,370,086 | ||||||
JP Morgan Chase Commercial Mortgage Securities Trust 2005-CIBC13 | ||||||||
5.67%, 01/12/2043 | 4,542,763 | 4,576,126 | ||||||
JP Morgan Chase Commercial Mortgage Securities Trust 2010-CNTR | ||||||||
4.31%, 08/05/2032 (Acquired 07/14/2015 through 09/18/2015, Cost $2,347,796) (1) | 2,195,000 | 2,286,361 | ||||||
| Principal Amount | Value | |||||||
JP Morgan Chase Commercial Mortgage Securities Trust 2015-SGP | ||||||||
3.91%, 07/15/2036 (Acquired 09/28/2015, Cost $250,000) (1) | 250,000 | 251,558 | ||||||
5.66%, 07/15/2036 (Acquired 09/28/2015 through 02/23/2016, Cost $884,441) (1) | 887,000 | 895,846 | ||||||
JP Morgan Chase Commercial Mortgage Securities Trust 2015-UES | ||||||||
3.74%, 09/05/2032 (Acquired 10/07/2015, Cost $564,763) (1) | 590,000 | 586,031 | ||||||
JP Morgan Chase Commercial Mortgage Securities Trust 2016-ATRM | ||||||||
2.96%, 10/06/2028 (Acquired 02/04/2016, Cost $829,195) (1) | 830,000 | 831,760 | ||||||
JP Morgan Chase Commercial Mortgage Securities Trust 2016-JP3 | ||||||||
2.87%, 08/15/2049 | 3,300,000 | 3,232,870 | ||||||
3.40%, 08/15/2049 | 565,000 | 553,505 | ||||||
JP Morgan Chase Commercial Mortgage Securities Trust 2016-NINE | ||||||||
2.95%, 09/09/2038 (Acquired 06/28/2017, Cost $1,185,656) (1) | 1,200,000 | 1,176,596 | ||||||
JP Morgan Chase Commercial Mortgage Securities Trust 2016-WIKI | ||||||||
4.14%, 10/05/2031 (Acquired 10/13/2016, Cost $609,908) (1) | 602,000 | 611,976 | ||||||
3.55%, 10/07/2031 (Acquired 10/13/2016, Cost $404,607) (1) | 394,000 | 402,307 | ||||||
JP Morgan Resecuritization Trust Series 2014-6 | ||||||||
1.23%, 07/27/2046 (Acquired 08/18/2015 through 09/18/2015, Cost $2,338,672) (1) | 2,442,730 | 2,401,078 | ||||||
JPMBB Commercial Mortgage Securities Trust 2014-C22 | ||||||||
3.80%, 09/15/2047 | 1,945,000 | 2,035,123 | ||||||
JPMBB Commercial Mortgage Securities Trust 2015-C28 | ||||||||
3.99%, 10/19/2048 | 1,200,000 | 1,174,415 | ||||||
JPMBB Commercial Mortgage Securities Trust 2015-C30 | ||||||||
3.82%, 07/15/2048 | 3,795,000 | 3,982,233 | ||||||
JPMBB Commercial Mortgage Securities Trust 2015-C31 | ||||||||
3.80%, 08/17/2048 | 5,065,000 | 5,308,083 | ||||||
JPMDB Commercial Mortgage Securities Trust 2017-C5 | ||||||||
3.69%, 03/17/2050 | 2,105,000 | 2,199,127 | ||||||
LB-UBS Commercial Mortgage Trust 2006-C1 | ||||||||
5.28%, 02/15/2041 | 3,696,546 | 3,698,111 | ||||||
LB-UBS Commercial Mortgage Trust 2007-C7 | ||||||||
6.50%, 09/15/2045 | 485,951 | 491,620 | ||||||
Merrill Lynch Mortgage Investors Trust Series MLCC 2004-HB1 | ||||||||
3.01%, 04/25/2029 | 1,409,433 | 1,385,738 | ||||||
Mill City Mortgage Loan Trust 2016-1 | ||||||||
2.50%, 04/25/2057 (Acquired 08/15/2016, Cost $509,291) (1) | 506,375 | 507,329 | ||||||
Mill City Mortgage Loan Trust 2017-2 | ||||||||
2.75%, 07/25/2059 (Acquired 06/12/2017, Cost $938,588) (1) | 930,000 | 929,535 | ||||||
| Principal Amount | Value | |||||||
Morgan Stanley Bank of America Merrill Lynch Trust 2013-C7 | ||||||||
1.86%, 02/16/2046 | 1,096,125 | 1,096,518 | ||||||
Morgan Stanley Bank of America Merrill Lynch Trust 2014-C17 | ||||||||
3.74%, 08/16/2047 | 974,000 | 1,020,229 | ||||||
4.46%, 08/16/2047 | 1,140,000 | 1,200,053 | ||||||
Morgan Stanley Bank of America Merrill Lynch Trust 2015-C24 | ||||||||
4.04%, 08/16/2047 | 45,000 | 47,254 | ||||||
4.50%, 05/15/2048 | 85,000 | 86,771 | ||||||
4.50%, 05/15/2048 | 55,000 | 53,205 | ||||||
Morgan Stanley Bank of America Merrill Lynch Trust 2016-C30 | ||||||||
2.86%, 09/17/2049 | 3,220,000 | 3,141,682 | ||||||
Morgan Stanley Capital I Trust 2017-H1 | ||||||||
3.53%, 06/17/2050 | 2,750,000 | 2,830,448 | ||||||
4.28%, 06/17/2050 | 555,000 | 561,099 | ||||||
Morgan Stanley Resecuritization Trust 2013-R10 | ||||||||
3.14%, 01/26/2051 (Acquired 07/24/2015, Cost $1,079,846) (1) | 1,072,038 | 1,067,532 | ||||||
MortgageIT Trust 2005-2 | ||||||||
1.88%, 05/25/2035 | 742,458 | 700,653 | ||||||
MS MTG LN TR 2006-15XS | ||||||||
6.20%, 11/25/2036 | 16,418,429 | 8,132,051 | ||||||
Nomura Resecuritization Trust 2015-7R | ||||||||
3.14%, 08/26/2036 (Acquired 08/20/2015, Cost $1,667,608) (1) | 1,651,285 | 1,650,415 | ||||||
Olympic Tower 2017-OT Mortgage Trust | ||||||||
3.57%, 05/12/2039 (Acquired 06/26/2017, Cost $2,244,644) (1) | 2,145,000 | 2,211,536 | ||||||
One Market Plaza Trust 2017-1MKT | ||||||||
3.61%, 02/10/2032 (Acquired 02/15/2017, Cost $2,036,274) (1) | 1,980,000 | 2,059,958 | ||||||
Palisades Center Trust 2016-PLSD | ||||||||
2.71%, 04/14/2033 (Acquired 04/20/2016, Cost $640,000) (1) | 640,000 | 643,036 | ||||||
RBS Commercial Funding, Inc. 2013-GSP Trust | ||||||||
3.96%, 01/13/2032 (Acquired 01/19/2016 through 05/03/2016, Cost $1,655,484) (1) | 1,565,000 | 1,656,043 | ||||||
Resource Capital Corp. 2017-CRE5 Ltd. | ||||||||
1.89%, 07/15/2034 (Acquired 06/26/2017, Cost $13,500,000) (1)(8) | 13,500,000 | 13,500,000 | ||||||
3.09%, 07/15/2034 (Acquired 06/26/2017, Cost $3,400,000) (1)(8) | 3,400,000 | 3,400,000 | ||||||
Rosslyn Portfolio Trust 2017-ROSS | ||||||||
2.11%, 06/15/2033 (Acquired 06/21/2017, Cost $15,800,000) (1) | 15,800,000 | 15,799,684 | ||||||
Seasoned Credit Risk Transfer Trust Series 2017-1 | ||||||||
3.00%, 09/25/2055 (Acquired 12/16/2016, Cost $348,205) (1) | 375,000 | 362,670 | ||||||
| Principal Amount | Value | |||||||
Sequoia Mortgage Trust 2003-2 | ||||||||
1.87%, 06/20/2033 | 1,154,831 | 1,156,488 | ||||||
Sequoia Mortgage Trust 2004-9 | ||||||||
2.15%, 10/20/2034 | 2,440,309 | 2,353,520 | ||||||
SFAVE Commercial Mortgage Securities Trust 2015-5AVE | ||||||||
3.87%, 01/08/2043 (Acquired 05/03/2016, Cost $1,331,069) (1) | 1,375,000 | 1,360,619 | ||||||
Southern Pacific Securities 06-1 Plc | ||||||||
0.59%, 03/10/2044* | GBP 3,937,440 | 5,077,670 | ||||||
Starwood Retail Property Trust 2014-STAR | ||||||||
3.63%, 11/15/2027 (Acquired 07/22/2015 through 09/08/2015, Cost $2,205,812) (1) | $ | 2,206,000 | 2,183,412 | |||||
Structured Adjustable Rate Mortgage Loan Trust | ||||||||
3.30%, 03/25/2034 | 864,116 | 873,342 | ||||||
Structured Asset Mortgage Investments Trust 2003-AR3 | ||||||||
1.89%, 11/19/2033 | 1,147,120 | 1,100,021 | ||||||
Towd Point Mortgage Trust 2015-3 | ||||||||
3.00%, 03/25/2054 (Acquired 07/23/2015, Cost $371,783) (1) | 371,691 | 376,086 | ||||||
Towd Point Mortgage Trust 2015-4 | ||||||||
2.75%, 04/25/2055 (Acquired 09/25/2015, Cost $446,116) (1) | 446,268 | 449,663 | ||||||
Towd Point Mortgage Trust 2015-5 | ||||||||
2.75%, 05/25/2055 (Acquired 10/23/2015, Cost $414,210) (1) | 413,598 | 416,783 | ||||||
Towd Point Mortgage Trust 2016-1 | ||||||||
2.75%, 02/25/2055 (Acquired 03/18/2016, Cost $379,263) (1) | 379,663 | 382,491 | ||||||
3.00%, 02/25/2055 (Acquired 03/18/2016, Cost $469,837) (1) | 469,654 | 473,557 | ||||||
Towd Point Mortgage Trust 2016-2 | ||||||||
2.75%, 08/25/2055 (Acquired 05/20/2016, Cost $308,319) (1) | 308,319 | 310,399 | ||||||
Towd Point Mortgage Trust 2016-3 | ||||||||
2.25%, 08/25/2055 (Acquired 07/22/2016, Cost $500,126) (1) | 500,802 | 499,284 | ||||||
Towd Point Mortgage Trust 2016-4 | ||||||||
2.25%, 07/25/2056 (Acquired 09/27/2016, Cost $973,908) (1) | 970,058 | 965,814 | ||||||
Towd Point Mortgage Trust 2016-5 | ||||||||
2.50%, 10/25/2056 (Acquired 12/07/2016, Cost $3,246,592) (1) | 3,248,239 | 3,251,291 | ||||||
UBS-Barclays Commercial Mortgage Trust 2012-C2 | ||||||||
5.06%, 05/11/2063 (Acquired 10/21/2016, Cost $1,135,335) (1) | 1,135,000 | 1,088,769 | ||||||
5.06%, 05/11/2063 (Acquired 07/24/2015, Cost $2,759,903) (1)(6)(8) | 2,750,000 | 2,272,650 | ||||||
Wachovia Bank Commercial Mortgage Trust Series 2007-C31 | ||||||||
5.66%, 04/15/2047 | 13,510,569 | 13,795,912 | ||||||
Wachovia Bank Commercial Mortgage Trust Series 2007-C33 | ||||||||
| Principal Amount | Value | |||||||
6.17%, 02/15/2051 | 10,139,578 | 10,320,476 | ||||||
Wachovia Bank Commercial Mortgage Trust Series 2007-C34 | ||||||||
6.27%, 05/15/2046 | 455,129 | 455,455 | ||||||
5.68%, 05/17/2046 | 348,225 | 347,949 | ||||||
WaMu Mortgage Pass-Through Certificates Series 2005-AR1 Trust | ||||||||
2.00%, 01/25/2045 | 222,699 | 206,152 | ||||||
WaMu Mortgage Pass-Through Certificates Series 2005-AR11 Trust | ||||||||
1.54%, 08/25/2045 | 3,075,924 | 3,046,632 | ||||||
WaMu Mortgage Pass-Through Certificates Series 2005-AR13 Trust | ||||||||
1.51%, 10/25/2045 | 3,342,609 | 3,314,759 | ||||||
WaMu Mortgage Pass-Through Certificates Series 2005-AR15 Trust | ||||||||
1.48%, 11/25/2045 | 4,312,491 | 4,138,535 | ||||||
WaMu Mortgage Pass-Through Certificates Series 2005-AR19 Trust | ||||||||
1.57%, 12/25/2045 | 1,595,471 | 1,538,175 | ||||||
WaMu Mortgage Pass-Through Certificates Series 2005-AR2 Trust | ||||||||
1.55%, 01/25/2045 | 7,826,980 | 7,625,315 | ||||||
WaMu Mortgage Pass-Through Certificates Series 2005-AR8 | ||||||||
1.68%, 07/25/2045 | 765,378 | 752,966 | ||||||
Wells Fargo Commercial Mortgage Trust 2014-TISH | ||||||||
3.41%, 02/15/2027 (Acquired 11/14/2016, Cost $1,393,494) (1) | 1,399,000 | 1,434,873 | ||||||
Wells Fargo Commercial Mortgage Trust 2015-C30 | ||||||||
3.66%, 09/17/2058 | 1,280,000 | 1,329,856 | ||||||
Wells Fargo Commercial Mortgage Trust 2016-C34 | ||||||||
3.10%, 06/17/2049 | 1,135,000 | 1,130,720 | ||||||
Wells Fargo Commercial Mortgage Trust 2017-C38 | ||||||||
3.67%, 07/15/2050 | 1,315,000 | 1,345,416 | ||||||
WFRBS Commercial Mortgage Trust 2011-C2 | ||||||||
5.79%, 02/18/2044 (Acquired 09/02/2015 through 08/04/2016, Cost $2,267,190) (1) | 2,130,000 | 2,160,073 | ||||||
WFRBS Commercial Mortgage Trust 2011-C5 | ||||||||
5.86%, 11/18/2044 (Acquired 01/26/2016, Cost $119,742) (1) | 115,000 | 122,474 | ||||||
WFRBS Commercial Mortgage Trust 2012-C7 | ||||||||
4.98%, 06/16/2045 (Acquired 11/23/2015 through 12/03/2015, Cost $354,090) (1) | 360,000 | 297,592 | ||||||
WFRBS Commercial Mortgage Trust 2013-C18 | ||||||||
3.65%, 12/17/2046 | 320,000 | 334,191 | ||||||
WFRBS Commercial Mortgage Trust 2014-C19 | ||||||||
4.72%, 03/15/2047 | 329,000 | 350,301 | ||||||
WFRBS Commercial Mortgage Trust 2014-C22 | ||||||||
| Principal Amount | Value | |||||||
4.07%, 09/17/2057 | 4,250,000 | 4,454,685 | ||||||
|
| |||||||
Total Mortgage-Backed Obligations (Cost $1,544,917,407) | $ | 1,541,335,468 | ||||||
|
| |||||||
Total Bonds & Notes (Cost $6,081,095,442) | $ | 6,114,433,498 | ||||||
|
| |||||||
Bank Loans - 2.26% | ||||||||
Altice Financing SA | ||||||||
3.91%, 07/15/2025 | $ | 2,835,000 | $ | 2,825,248 | ||||
Altice US Finance I Corp. | ||||||||
3.47%, 07/28/2025 | 3,240,000 | 3,207,600 | ||||||
American Axle & Manufacturing, Inc. | ||||||||
3.28%, 04/08/2024 | 3,242,100 | 3,209,679 | ||||||
Americold Realty Operating Partnership LP | ||||||||
4.98%, 12/01/2022 | 657,515 | 666,556 | ||||||
Ancestry.com Operations, Inc. | ||||||||
4.34%, 10/19/2023 | 2,499,750 | 2,508,074 | ||||||
Aramark Services, Inc. | ||||||||
3.23%, 03/28/2024 | 3,419,430 | 3,436,527 | ||||||
Ascend Learning LLC | ||||||||
4.45%, 07/29/2024 | 100,000 | 100,000 | ||||||
Asurion LLC | ||||||||
8.73%, 03/03/2021 | 1,175,000 | 1,179,406 | ||||||
4.48%, 08/04/2022 | 2,167,100 | 2,175,899 | ||||||
4.23%, 11/03/2023 | 464,989 | 467,314 | ||||||
Avolon T/L B-2 | ||||||||
3.96%, 03/20/2022 | 4,731,000 | 4,758,676 | ||||||
BWAY Corp. | ||||||||
4.33%, 04/03/2024 | 3,000,000 | 2,998,380 | ||||||
CenturyLink, Inc. | ||||||||
1.38%, 01/31/2025 | 6,255,000 | 6,180,315 | ||||||
Change Healthcare Holdings LLC | ||||||||
3.98%, 03/01/2024 | 4,012,388 | 4,010,702 | ||||||
Charter Communications Operating LLC | ||||||||
3.23%, 07/01/2020 | 1,902,754 | 1,907,759 | ||||||
3.23%, 01/03/2021 | 2,023,972 | 2,029,031 | ||||||
3.48%, 01/15/2024 | 3,249,180 | 3,259,545 | ||||||
CHI Doors Holdings Corp. | ||||||||
4.48%, 07/29/2022 | 2,415,279 | 2,401,198 | ||||||
| Principal Amount | Value | |||||||
Colorado Buyer, Inc. | ||||||||
4.17%, 05/01/2024 | 1,125,000 | 1,126,406 | ||||||
Columbus Mckinnon T/L | ||||||||
4.30%, 01/31/2024 | 208,326 | 209,368 | ||||||
CommScope, Inc. | ||||||||
3.30%, 12/29/2022 | 4,400,968 | 4,413,820 | ||||||
DigitalGlobe, Inc. | ||||||||
3.98%, 01/15/2024 | 348,250 | 348,250 | ||||||
Eastern Power LLC | ||||||||
5.23%, 09/24/2021 | 1,275,000 | 1,268,306 | ||||||
Energ Future DIP Delayed Draw | ||||||||
4.20%, 06/01/2024 | 4,470,000 | 4,481,175 | ||||||
Energy Future DIP | ||||||||
4.20%, 06/26/2018 | 1,485,000 | 1,488,713 | ||||||
Envision Healthcare Corp. | ||||||||
4.30%, 12/01/2023 | 795,000 | 798,180 | ||||||
ExamWorks Group, Inc. | ||||||||
4.48%, 07/27/2023 | 1,091,764 | 1,095,181 | ||||||
FinCo I LLC | ||||||||
2.75%, 06/02/2022 | 400,000 | 402,168 | ||||||
First Data Corp. | ||||||||
2.25%, 07/08/2022 | 2,512,083 | 2,506,983 | ||||||
Flex Acquisition Co., Inc. | ||||||||
4.55%, 12/29/2023 | 825,000 | 826,889 | ||||||
HCA, Inc. | ||||||||
3.48%, 02/15/2024 | 3,280,536 | 3,295,396 | ||||||
Hilton Worldwide Finance LLC | ||||||||
3.22%, 10/25/2023 | 10,541,733 | 10,569,247 | ||||||
HUB International Ltd. | ||||||||
4.42%, 10/02/2020 | 1,943,087 | 1,946,935 | ||||||
Hyland Software, Inc. | ||||||||
4.00%, 07/01/2022 | 1,280,000 | 1,287,040 | ||||||
Intelsat Jackson Holdings SA | ||||||||
4.00%, 06/28/2019 | 420,000 | 416,128 | ||||||
JBS USA LUX SA | ||||||||
5.75%, 10/31/2022 | 3,338,000 | 3,251,212 | ||||||
Jo-Ann Stores | ||||||||
| Principal Amount | Value | |||||||
6.39%, 10/20/2023 | 173,065 | 172,127 | ||||||
Kloeckner Pentaplast of America, Inc. | ||||||||
5.45%, 06/29/2022 | 2,390,000 | 2,363,113 | ||||||
4.75%, 07/31/2022* | EUR 100,000 | 113,501 | ||||||
Kronos, Inc./MA | ||||||||
4.68%, 11/01/2023 | $ | 1,752,850 | 1,763,367 | |||||
Level 3 Financing, Inc. | ||||||||
3.47%, 02/22/2024 | 11,350,000 | 11,371,338 | ||||||
Lions Gate Entertainment Corp. | ||||||||
4.23%, 12/08/2023 | 1,086,875 | 1,092,646 | ||||||
Match Group, Inc. | ||||||||
4.37%, 11/16/2022 | 251,563 | 252,191 | ||||||
Mission Broadcasting, Inc. | ||||||||
4.25%, 01/17/2024 | 281,312 | 281,765 | ||||||
MPH Acquisition Holdings LLC | ||||||||
4.30%, 06/07/2023 | 227,305 | 227,128 | ||||||
Nexstar Broadcasting, Inc. | ||||||||
4.24%, 01/17/2024 | 2,847,052 | 2,851,636 | ||||||
Nord Anglia Education Finance LLC | ||||||||
4.70%, 03/31/2021 | 1,801,781 | 1,809,673 | ||||||
Orchestra Borrower LLC | ||||||||
4.95%, 12/02/2021 | 100,000 | 100,542 | ||||||
Post Holdings, Inc. | ||||||||
3.47%, 05/24/2024 | 1,765,000 | 1,766,253 | ||||||
Rackspace Hosting, Inc. | ||||||||
4.17%, 11/03/2023 | 598,500 | 597,937 | ||||||
Radiate Holdco LLC | ||||||||
4.23%, 02/01/2024 | 1,794,849 | 1,767,711 | ||||||
Scientific Games International, Inc. | ||||||||
5.11%, 10/01/2021 | 915,647 | 924,172 | ||||||
Seattle SpinCo., Inc. | ||||||||
4.03%, 06/21/2024 | 1,615,000 | 1,617,019 | ||||||
Sequa Mezzanine Holdings LLC | ||||||||
6.67%, 11/26/2021 | 5,250,000 | 5,276,250 | ||||||
Shearer’s Foods LLC | ||||||||
5.55%, 06/29/2021 | 575,201 | 573,762 | ||||||
5.23%, 06/30/2021 (6)(8) | 493,655 | 491,804 | ||||||
| Principal Amount | Value | |||||||
Station Casinos LLC | ||||||||
3.71%, 06/08/2023 | 1,220,000 | 1,217,780 | ||||||
Surgery Center Holdings, Inc. | ||||||||
4.47%, 06/20/2024 | 790,000 | 792,473 | ||||||
Uber Technologies, Inc. | ||||||||
5.22%, 07/13/2023 | 1,736,875 | 1,736,337 | ||||||
Univision Communications, Inc. | ||||||||
3.98%, 03/15/2024 | 832,838 | 815,832 | ||||||
Valeant Pharmaceuticals International, Inc. | ||||||||
5.83%, 04/01/2022 | 957,945 | 970,523 | ||||||
Veritas US, Inc. | ||||||||
5.80%, 01/27/2023 | 800,000 | 800,832 | ||||||
Vistra Operations Co. LLC | ||||||||
3.79%, 08/04/2023 | 279,140 | 276,524 | ||||||
3.98%, 08/04/2023 | 1,217,801 | 1,206,390 | ||||||
Western Digital Corp. | ||||||||
3.98%, 04/29/2023 | 1,069,227 | 1,072,841 | ||||||
WideOpenWest Finance LLC | ||||||||
4.25%, 08/18/2023 | 1,625,000 | 1,622,238 | ||||||
YUM! Brands | ||||||||
3.21%, 06/16/2023 | 7,399,202 | 7,419,549 | ||||||
Zayo Group LLC | ||||||||
3.22%, 01/19/2021 | 1,628,000 | 1,630,295 | ||||||
3.50%, 01/19/2024 | 3,280,963 | 3,282,341 | ||||||
|
| |||||||
Total Bank Loans (Cost $145,618,971) | $ | 145,311,196 | ||||||
|
| |||||||
| Shares | Value | |||||||
PREFERRED STOCKS - 0.07% | ||||||||
Consumer, Non-cyclical - 0.03% | ||||||||
Bunge Ltd. | 17,080 | $ | 1,780,590 | |||||
|
| |||||||
Financials - 0.04% | ||||||||
Discover Financial Services | 107,846 | 2,780,270 | ||||||
|
| |||||||
Total Preferred Stocks (Cost $4,550,376) | $ | 4,560,860 | ||||||
|
| |||||||
SHORT-TERM INVESTMENTS - 7.68% | ||||||||
Money Market Funds - 6.55% | ||||||||
Fidelity Institutional Money Market Government Funds - Class I, 0.81% (4)(7) | 208,992,028 | $ | 208,992,028 | |||||
Goldman Sachs Financial Square Treasury Solutions Fund - Class I, 0.84% (4)(7) | 211,946,351 | 211,946,351 | ||||||
|
| |||||||
Total Money Market Funds | 420,938,379 | |||||||
|
| |||||||
| Principal | ||||||||
| Amount | Value | |||||||
Certificate of Deposit - 0.05% | ||||||||
Credit Suisse AG/New York NY, 2.03% | $ | 2,940,000 | $ | 2,944,692 | ||||
|
| |||||||
Commercial Paper - 0.07% | ||||||||
Enbridge Energy Partners LP, 1.88% | 3,140,000 | 3,134,581 | ||||||
Ford Motor Credit Co. LLC, 1.78% | 1,490,000 | 1,486,055 | ||||||
|
| |||||||
Total Commercial Paper | 4,620,636 | |||||||
|
| |||||||
Repurchase Agreements - 0.98% | ||||||||
Merrill Lynch Pierce Fenner & Smith, Inc., 1.33%, dated 6/29/2017, due 7/3/2017, repurchase price $50,005,542, (collaterized by U.S. Treasury Bond, value $50,769,343, 3.63%, 2/15/2044) (Cost $50,000,000) | 50,000,000 | 50,000,000 | ||||||
Merrill Lynch Pierce Fenner & Smith, Inc., 1.39% dated 6/30/2017, due 7/3/2017, repurchase price $13,001,546, (collaterized by U.S. Treasury Bond, value $13,054,991, 3.63%, 8/15/2043) (Cost $13,000,000) | 13,000,000 | 13,000,000 | ||||||
|
| |||||||
Total Repurchase Agreements | 63,000,000 | |||||||
|
| |||||||
U.S. Treasury Bills - 0.03% | ||||||||
U.S. Treasury Bill, 0.00%, 09/07/2017 (5) | 2,040,000 | 2,036,446 | ||||||
|
| |||||||
Total Short-Term Investments (Cost $493,534,688) | $ | 493,540,153 | ||||||
|
| |||||||
TOTAL INVESTMENTS IN SECURITIES - 105.20% | ||||||||
(Cost $6,724,799,477) | $ | 6,757,845,707 | ||||||
LIABILITIES IN EXCESS OF OTHER ASSETS - (5.20)% | (334,372,760 | ) | ||||||
|
| |||||||
TOTAL NET ASSETS - 100.00% | $ | 6,423,472,947 | ||||||
|
| |||||||
Percentages are stated as a percent of net assets.
Principal amounts are denominated in the currency in which the security was purchased.
IO Interest Only Strip.
| (1) | Restricted security as defined in Rule 144(A) under the Securities Act of 1933. The value of these securities total $1,110,223,761, which represents 17.28% of total net assets. |
| (2) | Inflation protected security. The value of these securities total $85,258,240 which represents 1.33% of total net assets. |
| (3) | Delayed delivery purchase commitment security. The value of these securities totals $267,385,976, which represents 4.16% of total net assets. |
| (4) | Partially assigned as collateral for certain delayed delivery securities. |
| (5) | Partially assigned as collateral for certain futures and swap contracts. The value of the pledged issues total $5,485,076 , which represent 0.09% of total net assets. |
| (6) | Security is treated as illiquid by the Fund. The value of these securities total $14,458,790, which represents 0.23% of the total net assets. |
| (7) | Represents annualized seven-day yield as of the close of the reporting period. |
| (8) | Security is categorized as Level 3 per the Trust’s fair value hierarchy. The value of these securities total $62,688,278, which represents 0.98% of total net assets. |
Open Futures Contracts
Number of Contracts | Description | Counterparty | Settlement | Notional Amount | Value | Unrealized Appreciation (Depreciation) | ||||||||||||
54 | U.S. 10 Year Note Future | Goldman Sachs | Sep. 2017 | $ | 6,817,586 | $ | 6,778,688 | $ | (38,898 | ) | ||||||||
2,429 | U.S. 10 Year Note Future | RBC Capital Markets | Sep. 2017 | 306,277,974 | 304,915,406 | (1,362,568 | ) | |||||||||||
(508) | U.S. Ultra 10 Year Note Future | Goldman Sachs | Sep. 2017 | (68,649,933 | ) | (68,484,750 | ) | 165,183 | ||||||||||
995 | U.S. 2 Year Note Future | Citigroup Global Markets | Sep. 2017 | 215,330,251 | 215,028,829 | (301,422 | ) | |||||||||||
204 | U.S. 2 Year Note Future | Goldman Sachs | Sep. 2017 | 44,121,703 | 44,086,313 | (35,390 | ) | |||||||||||
471 | U.S. 5 Year Note Future | Citigroup Global Markets | Sep. 2017 | 55,632,069 | 55,500,727 | (131,342 | ) | |||||||||||
97 | U.S. 5 Year Note Future | Goldman Sachs | Sep. 2017 | 11,439,334 | 11,430,086 | (9,248 | ) | |||||||||||
373 | U.S. Long Bond Future | Goldman Sachs | Sep. 2017 | 56,708,253 | 57,325,437 | 617,184 | ||||||||||||
144 | U.S. Ultra Bond Future | Goldman Sachs | Sep. 2017 | 23,810,140 | 23,886,000 | 75,860 | ||||||||||||
|
| |||||||||||||||||
| $ | (1,020,641 | ) | ||||||||||||||||
|
| |||||||||||||||||
Forward Foreign Currency Exchange Contracts
Over-the-Counter
Purchase Contracts | Counterparty | Currency Purchased/Sold | Currency Amount Purchased | Value at Settlement Date | Value at June 30, 2017 | Unrealized Appreciation (Depreciation) | ||||||||||||||||
Euro, Settlement 7/21/17 | Canadian Imperial Bank of Commerce | EUR/USD | 1,365,763 | $ | 1,489,392 | $ | 1,561,727 | $ | 72,335 | |||||||||||||
British Pound, Settlement 8/15/17 | J.P. Morgan | GBP/USD | 5,307,000 | 6,829,637 | 6,922,336 | 92,699 | ||||||||||||||||
British Pound, Settlement 8/15/17 | Morgan Stanley | GBP/USD | 5,810,000 | 7,373,715 | 7,578,439 | 204,724 | ||||||||||||||||
Mexican Peso, Settlement 8/08/17 | Morgan Stanley | MXN/USD | 274,329,000 | 14,368,793 | 15,016,270 | 647,477 | ||||||||||||||||
Euro, Settlement 8/15/17 | J.P. Morgan | EUR/USD | 4,616,000 | 5,167,393 | 5,285,280 | 117,887 | ||||||||||||||||
Euro, Settlement 8/15/17 | Morgan Stanley | EUR/USD | 715,000 | 807,079 | 818,669 | 11,590 | ||||||||||||||||
Turkish Lira, Settlement 8/15/17 | Morgan Stanley | TRY/USD | 51,796,000 | 14,052,222 | 14,521,380 | 469,158 | ||||||||||||||||
|
|
|
|
|
| |||||||||||||||||
| $ | 50,088,231 | $ | 51,704,101 | $ | 1,615,870 | |||||||||||||||||
|
|
|
|
|
| |||||||||||||||||
Sale Contracts | Counterparty | Currency Purchased/Sold | Currency Amount Sold | Value at Settlement Date | Value at June 30, 2017 | Unrealized Appreciation (Depreciation) | ||||||||||||||||
Euro, Settlement 7/21/17 | Royal Bank of Canada | USD/EUR | (1,365,763 | ) | ($ | 1,500,385 | ) | ($ | 1,561,727 | ) | ($ | 61,342 | ) | |||||||||
British Pound, Settlement 8/15/17 | J.P. Morgan | USD/GBP | (20,971,000 | ) | (26,590,171 | ) | (27,354,121 | ) | (763,950 | ) | ||||||||||||
British Pound, Settlement 8/15/17 | Morgan Stanley | USD/GBP | (58,032,000 | ) | (74,896,578 | ) | (75,695,690 | ) | (799,112 | ) | ||||||||||||
Australian Dollar, Settlement 8/15/17 | Morgan Stanley | USD/AUD | (9,828,000 | ) | (7,247,467 | ) | (7,549,205 | ) | (301,738 | ) | ||||||||||||
Euro, Settlement 8/15/17 | J.P. Morgan | USD/EUR | (949,000 | ) | (1,061,926 | ) | (1,086,597 | ) | (24,671 | ) | ||||||||||||
Euro, Settlement 8/15/17 | Morgan Stanley | USD/EUR | (73,210,000 | ) | (80,948,777 | ) | (83,824,821 | ) | (2,876,044 | ) | ||||||||||||
Israeli New Shekel, Settlement 8/17/17 | HSBC | USD/ILS | (13,807,198 | ) | (3,846,939 | ) | (3,965,714 | ) | (118,775 | ) | ||||||||||||
Japanese Yen, Settlement 8/15/17 | Morgan Stanley | USD/JPY | (2,475,700,000 | ) | (21,842,104 | ) | (22,055,739 | ) | (213,635 | ) | ||||||||||||
Mexican Peso, Settlement 7/14/17 | HSBC | USD/MXN | (40,525,000 | ) | (2,220,305 | ) | (2,227,647 | ) | (7,342 | ) | ||||||||||||
Mexican Peso, Settlement 7/14/17 | Canadian Imperial Bank of Commerce | USD/MXN | (2,785,000 | ) | (152,287 | ) | (153,090 | ) | (803 | ) | ||||||||||||
Mexican Peso, Settlement 7/14/17 | Citigroup Global Markets | USD/MXN | (27,430,000 | ) | (1,440,342 | ) | (1,507,819 | ) | (67,477 | ) | ||||||||||||
Turkish Lira, Settlement 8/15/17 | Deutsche Bank | USD/TRY | (1,724,000 | ) | (482,141 | ) | (483,336 | ) | (1,195 | ) | ||||||||||||
|
|
|
|
|
| |||||||||||||||||
| ($ | 222,229,422 | ) | ($ | 227,465,506 | ) | ($ | 5,236,084 | ) | ||||||||||||||
|
|
|
|
|
| |||||||||||||||||
| ($ | 172,141,191 | ) | ($ | 175,761,405 | ) | ($ | 3,620,214 | ) | ||||||||||||||
|
|
|
|
|
| |||||||||||||||||
Centrally Cleared Interest Rate Swap
Counterparty | Fixed Annual | Floating Rate | Floating Rate Paid or Received | Payment Frequency | Maturity Date | Notional Amount | Value | Unrealized Appreciation/ (Depreciation) | ||||||||||||||
Citigroup Global Markets | 1.60% | 3 Month LIBOR | Received | Quarterly | 06/30/2019 | $ | 10,840,000 | $ | 10,848,705 | $ | 8,705 | |||||||||||
|
|
|
|
|
| |||||||||||||||||
| $ | 10,840,000 | $ | 10,848,705 | $ | 8,705 | |||||||||||||||||
|
|
|
|
|
| |||||||||||||||||
Bridge Builder Municipal Bond Fund
Schedule of Investments
June 30, 2017
| Principal Amount | Value | |||||||
Municipal Bonds - 95.71% | ||||||||
Alabama - 0.99% | ||||||||
Alabama Housing Finance Authority | ||||||||
1.35%, 04/01/2020 | $ | 2,000,000 | $ | 2,002,860 | ||||
County of Jefferson AL Sewer Revenue | ||||||||
5.00%, 10/01/2044 | 1,500,000 | 1,681,530 | ||||||
5.25%, 10/01/2048 | 1,650,000 | 1,867,849 | ||||||
5.50%, 10/01/2053 | 715,000 | 816,373 | ||||||
Industrial Development Board of the City of Mobile Alabama | ||||||||
1.85%, 06/01/2034 | 1,025,000 | 1,031,509 | ||||||
1.63%, 07/15/2034 | 11,500,000 | 11,514,720 | ||||||
Montgomery Medical Clinic Board | ||||||||
5.00%, 03/01/2019 | 1,500,000 | 1,574,265 | ||||||
5.00%, 03/01/2029 | 1,000,000 | 1,128,620 | ||||||
Selma Industrial Development Board | ||||||||
5.80%, 05/01/2034 | 2,625,000 | 2,911,545 | ||||||
5.38%, 12/01/2035 | 215,000 | 241,950 | ||||||
Water Works Board of the City of Birmingham/The | ||||||||
5.00%, 01/01/2023 | 430,000 | 501,819 | ||||||
|
| |||||||
| 25,273,040 | ||||||||
|
| |||||||
Alaska - 0.17% | ||||||||
City of Valdez AK | ||||||||
5.00%, 01/01/2021 | 4,000,000 | 4,426,320 | ||||||
|
| |||||||
Arizona - 2.45% | ||||||||
Arizona Health Facilities Authority | ||||||||
5.25%, 01/01/2018 | 1,500,000 | 1,531,050 | ||||||
5.00%, 01/01/2020 | 2,000,000 | 2,179,940 | ||||||
0.93%, 07/01/2035 | 10,000,000 | 10,000,000 | ||||||
5.00%, 02/01/2042 | 2,000,000 | 2,109,200 | ||||||
City of Glendale AZ | ||||||||
5.00%, 07/01/2030 (2)(4) | 1,780,000 | 2,088,563 | ||||||
City of Phoenix AZ | ||||||||
4.00%, 07/01/2022 | 900,000 | 1,009,548 | ||||||
City of Phoenix Civic Improvement Corp. | ||||||||
5.25%, 07/01/2017 | 2,750,000 | 2,750,000 | ||||||
County of Pima AZ | ||||||||
4.00%, 07/01/2022 | 13,160,000 | 14,721,434 | ||||||
County of Pima AZ Sewer System Revenue | ||||||||
5.00%, 07/01/2022 | 10,000,000 | 11,706,900 | ||||||
Glendale Industrial Development Authority | ||||||||
5.00%, 12/01/2027 | 1,000,000 | 1,016,190 | ||||||
5.00%, 12/01/2032 | 1,050,000 | 1,066,999 | ||||||
Industrial Development Authority of the City of Phoenix/The | ||||||||
1.30%, 12/01/2035 | 4,000,000 | 3,999,880 | ||||||
Maricopa County Industrial Development Authority | ||||||||
5.00%, 01/01/2020 | 375,000 | 408,739 | ||||||
5.00%, 01/01/2021 | 350,000 | 392,595 | ||||||
5.75%, 01/01/2036 (Acquired 10/20/2016, Cost $98,866) (1)(2)(4) | 100,000 | 99,213 | ||||||
6.00%, 01/01/2048 (Acquired 10/20/2016, Cost $335,000) (1)(2)(4) | 335,000 | 336,196 | ||||||
McAllister Academic Village LLC | ||||||||
5.00%, 07/01/2021 | 200,000 | 226,572 | ||||||
5.00%, 07/01/2026 | 630,000 | 770,818 | ||||||
Mohave County Unified School District No 20 Kingman | ||||||||
5.00%, 07/01/2024 | 1,800,000 | 2,131,110 | ||||||
| Principal Amount | Value | |||||||
Peoria Industrial Development Authority | ||||||||
5.00%, 11/15/2019 | 170,000 | 172,890 | ||||||
Salt Verde Financial Corp. | ||||||||
5.00%, 12/01/2037 | 3,500,000 | 4,203,710 | ||||||
|
| |||||||
| 62,921,547 | ||||||||
|
| |||||||
Arkansas - 0.04% | ||||||||
Arkansas State University | ||||||||
4.00%, 03/01/2019 | 500,000 | 522,250 | ||||||
4.00%, 03/01/2020 | 525,000 | 559,282 | ||||||
|
| |||||||
| 1,081,532 | ||||||||
|
| |||||||
California - 4.72% | ||||||||
ABAG Finance Authority for Nonprofit Corp. | ||||||||
5.00%, 08/01/2033 | 1,300,000 | 1,468,662 | ||||||
Acalanes Union High School District | ||||||||
5.00%, 08/01/2018 | 1,160,000 | 1,210,878 | ||||||
Alameda Corridor Transportation Authority | ||||||||
5.00%, 10/01/2036 | 2,500,000 | 2,838,000 | ||||||
5.00%, 10/01/2037 | 2,000,000 | 2,263,580 | ||||||
Alisal Union School District | ||||||||
5.25%, 08/01/2042 | 740,000 | 891,619 | ||||||
Bay Area Toll Authority | ||||||||
2.16%, 04/01/2036 | 1,000,000 | 1,029,630 | ||||||
2.10%, 04/01/2045 | 1,000,000 | 1,020,390 | ||||||
2.85%, 04/01/2047 | 1,000,000 | 1,053,530 | ||||||
2.95%, 04/01/2047 | 1,170,000 | 1,231,238 | ||||||
California Health Facilities Financing Authority | ||||||||
5.63%, 07/01/2025 | 2,130,000 | 2,301,721 | ||||||
5.00%, 11/01/2032 | 1,400,000 | 1,644,902 | ||||||
5.00%, 07/01/2034 | 1,710,000 | 1,990,183 | ||||||
1.25%, 10/01/2036 | 2,500,000 | 2,480,325 | ||||||
California Municipal Finance Authority | ||||||||
5.00%, 08/15/2029 | 1,000,000 | 1,212,110 | ||||||
5.00%, 08/15/2034 | 1,065,000 | 1,252,557 | ||||||
California Pollution Control Financing Authority | ||||||||
1.30%, 08/01/2023 (Acquired 04/28/2017, Cost $4,100,000) (1) | 4,100,000 | 4,099,877 | ||||||
California Public Finance Authority | ||||||||
5.00%, 10/15/2047 | 1,775,000 | 1,915,598 | ||||||
California State Public Works Board | ||||||||
5.00%, 05/01/2018 | 7,065,000 | 7,304,433 | ||||||
5.00%, 05/01/2018 | 8,200,000 | 8,477,898 | ||||||
5.00%, 09/01/2021 | 1,060,000 | 1,215,258 | ||||||
5.00%, 03/01/2024 | 2,500,000 | 3,009,850 | ||||||
5.00%, 03/01/2025 | 3,280,000 | 3,995,729 | ||||||
5.00%, 11/01/2037 | 235,000 | 265,837 | ||||||
California Statewide Communities Development Authority | ||||||||
5.00%, 10/01/2028 | 1,100,000 | 1,198,032 | ||||||
0.87%, 08/15/2036 | 1,055,000 | 1,055,000 | ||||||
5.00%, 05/15/2040 | 400,000 | 447,604 | ||||||
5.38%, 11/01/2049 | 100,000 | 103,944 | ||||||
5.50%, 12/01/2054 | 1,960,000 | 2,146,690 | ||||||
Campbell Union High School District | ||||||||
5.00%, 08/01/2021 | 275,000 | 275,789 | ||||||
Centinela Valley Union High School District | ||||||||
4.00%, 08/01/2019 | 415,000 | 439,028 | ||||||
County of Los Angeles CA | ||||||||
5.00%, 06/29/2018 | 2,000,000 | 2,081,160 | ||||||
Foothill-De Anza Community College District | ||||||||
5.00%, 04/01/2035 | 250,000 | 287,732 | ||||||
5.00%, 04/01/2036 | 200,000 | 229,478 | ||||||
Golden State Tobacco Securitization Corp. | ||||||||
5.00%, 06/01/2021 | 285,000 | 320,249 | ||||||
| Principal Amount | Value | |||||||
5.00%, 06/01/2022 | 400,000 | 457,980 | ||||||
5.00%, 06/01/2023 | 455,000 | 527,886 | ||||||
5.00%, 06/01/2024 | 255,000 | 299,597 | ||||||
5.00%, 06/01/2033 | 985,000 | 991,698 | ||||||
5.00%, 06/01/2040 | 2,000,000 | 2,276,460 | ||||||
5.75%, 06/01/2047 | 3,765,000 | 3,790,602 | ||||||
Irvine Unified School District | ||||||||
5.00%, 03/01/2057 | 625,000 | 690,988 | ||||||
Los Angeles County Public Works Financing Authority | ||||||||
5.00%, 12/01/2029 | 1,200,000 | 1,434,096 | ||||||
5.00%, 12/01/2030 | 2,520,000 | 2,996,860 | ||||||
Mendocino-Lake Community College District | ||||||||
5.00%, 08/01/2027 | 1,700,000 | 2,050,149 | ||||||
5.00%, 08/01/2028 | 1,000,000 | 1,194,550 | ||||||
5.00%, 08/01/2029 | 775,000 | 917,019 | ||||||
5.00%, 08/01/2030 | 2,530,000 | 2,971,384 | ||||||
Norman Y Mineta San Jose International Airport SJC | ||||||||
5.00%, 03/01/2028 | 1,250,000 | 1,503,425 | ||||||
5.00%, 03/01/2030 | 1,700,000 | 2,006,476 | ||||||
Oakland Unified School District/Alameda County | ||||||||
5.00%, 08/01/2027 | 1,770,000 | 2,204,553 | ||||||
Orange County Community Facilities District | ||||||||
5.25%, 08/15/2045 | 1,000,000 | 1,112,130 | ||||||
Orchard School District | ||||||||
0.00%, 08/01/2022 | 2,940,000 | 2,672,578 | ||||||
Sacramento City Financing Authority | ||||||||
5.00%, 12/01/2033 | 875,000 | 1,010,433 | ||||||
Sacramento Municipal Utility District | ||||||||
5.00%, 08/15/2028 | 1,475,000 | 1,878,354 | ||||||
San Jose California Airport Revenue, Tender Option Bond Trust, Ser 2017-XM0503 | ||||||||
1.11%, 03/01/2025 (Acquired 04/13/2017, Cost $900,000) (1) | 900,000 | 900,000 | ||||||
State of California | ||||||||
5.00%, 09/01/2018 | 4,000,000 | 4,188,560 | ||||||
5.00%, 08/01/2019 | 1,000,000 | 1,079,790 | ||||||
5.00%, 08/01/2022 | 1,535,000 | 1,800,402 | ||||||
5.00%, 08/01/2023 | 3,000,000 | 3,587,700 | ||||||
5.00%, 09/01/2026 | 2,000,000 | 2,490,040 | ||||||
5.00%, 08/01/2027 | 620,000 | 752,302 | ||||||
5.00%, 08/01/2029 | 935,000 | 1,129,517 | ||||||
5.00%, 09/01/2029 | 370,000 | 447,263 | ||||||
5.00%, 08/01/2030 | 3,500,000 | 4,196,640 | ||||||
1.50%, 12/01/2031 | 750,000 | 760,350 | ||||||
4.00%, 09/01/2035 | 3,625,000 | 3,850,439 | ||||||
|
| |||||||
| 120,928,732 | ||||||||
|
| |||||||
Colorado - 1.40% | ||||||||
Adams 12 Five Star Schools | ||||||||
5.00%, 12/15/2028 | 2,050,000 | 2,499,811 | ||||||
Belleview Station Metropolitan District No 2 | ||||||||
5.00%, 12/01/2036 | 500,000 | 510,835 | ||||||
Canyons Metropolitan District No 5 | ||||||||
6.00%, 12/01/2037 | 500,000 | 505,220 | ||||||
Centerra Metropolitan District No 1 | ||||||||
2.70%, 12/01/2019 | 705,000 | 711,141 | ||||||
Colorado Health Facilities Authority | ||||||||
4.00%, 01/01/2019 | 225,000 | 230,857 | ||||||
4.00%, 01/01/2020 | 250,000 | 259,230 | ||||||
5.00%, 02/01/2020 | 1,210,000 | 1,299,830 | ||||||
5.00%, 12/01/2022 | 1,855,000 | 2,105,035 | ||||||
5.00%, 01/01/2024 | 125,000 | 136,174 | ||||||
5.00%, 01/01/2026 | 100,000 | 108,106 | ||||||
5.00%, 01/01/2031 | 100,000 | 104,571 | ||||||
| Principal Amount | Value | |||||||
5.25%, 02/01/2031 | 2,250,000 | 2,383,312 | ||||||
5.00%, 01/01/2037 | 250,000 | 257,490 | ||||||
5.25%, 05/15/2037 | 475,000 | 506,987 | ||||||
5.00%, 10/01/2038 | 630,000 | 702,500 | ||||||
1.96%, 10/01/2039 | 2,000,000 | 2,006,140 | ||||||
5.25%, 01/01/2040 | 540,000 | 570,499 | ||||||
5.25%, 01/01/2045 | 510,000 | 537,270 | ||||||
6.13%, 12/01/2045 (Acquired 11/20/2015 through 02/16/2017, Cost $378,301) (1) | 375,000 | 394,699 | ||||||
5.00%, 09/01/2046 | 1,000,000 | 1,118,230 | ||||||
Colorado High Performance Transportation Enterprise | ||||||||
5.00%, 12/31/2047 | 550,000 | 607,728 | ||||||
5.00%, 12/31/2051 | 190,000 | 208,363 | ||||||
5.00%, 12/31/2056 | 425,000 | 463,157 | ||||||
Cornerstar Metropolitan District | ||||||||
5.13%, 12/01/2037 | 500,000 | 519,515 | ||||||
Denver Convention Center Hotel Authority | ||||||||
4.00%, 12/01/2020 | 500,000 | 537,000 | ||||||
5.00%, 12/01/2022 | 4,950,000 | 5,701,311 | ||||||
E-470 Public Highway Authority | ||||||||
0.00%, 09/01/2020 | 730,000 | 689,251 | ||||||
1.72%, 09/01/2039 | 325,000 | 326,037 | ||||||
1.87%, 09/01/2039 | 650,000 | 655,415 | ||||||
Park Creek Metropolitan District | ||||||||
5.00%, 12/01/2045 | 1,775,000 | 1,895,327 | ||||||
Sierra Ridge Metropolitan District No 2 | ||||||||
4.50%, 12/01/2031 | 750,000 | 739,800 | ||||||
5.50%, 12/01/2046 | 1,500,000 | 1,539,315 | ||||||
Solaris Metropolitan District No 3 | ||||||||
5.00%, 12/01/2036 | 850,000 | 886,805 | ||||||
5.00%, 12/01/2046 | 1,880,000 | 1,943,337 | ||||||
Southglenn Metropolitan District | ||||||||
5.00%, 12/01/2046 | 500,000 | 503,360 | ||||||
University of Colorado | ||||||||
5.00%, 06/01/2047 | 500,000 | 572,980 | ||||||
University of Colorado Hospital Authority | ||||||||
5.00%, 11/15/2038 | 1,020,000 | 1,156,139 | ||||||
|
| |||||||
| 35,892,777 | ||||||||
|
| |||||||
Connecticut - 3.76% | ||||||||
City of Hartford CT | ||||||||
5.00%, 04/01/2018 | 2,885,000 | 2,833,618 | ||||||
5.00%, 08/15/2019 | 1,700,000 | 1,794,622 | ||||||
5.00%, 07/15/2021 | 3,300,000 | 3,600,795 | ||||||
5.00%, 07/15/2022 | 2,250,000 | 2,483,843 | ||||||
5.00%, 07/15/2023 | 2,000,000 | 2,230,640 | ||||||
5.00%, 07/15/2026 | 2,430,000 | 2,711,880 | ||||||
City of New Britain CT | ||||||||
5.00%, 03/01/2027 | 1,260,000 | 1,511,874 | ||||||
5.00%, 03/01/2028 | 1,490,000 | 1,783,649 | ||||||
5.00%, 03/01/2033 | 1,900,000 | 2,193,949 | ||||||
City of New Haven CT | ||||||||
5.00%, 08/15/2023 | 900,000 | 1,032,741 | ||||||
5.00%, 08/15/2026 | 325,000 | 381,553 | ||||||
5.00%, 08/15/2029 | 2,000,000 | 2,277,340 | ||||||
5.00%, 08/15/2031 | 1,000,000 | 1,126,060 | ||||||
City of West Haven CT | ||||||||
5.00%, 08/01/2021 | 2,495,000 | 2,793,352 | ||||||
Connecticut State Health & Educational Facility Authority | ||||||||
1.00%, 07/01/2042 | 10,000,000 | 9,966,700 | ||||||
1.00%, 07/01/2042 | 18,000,000 | 17,940,060 | ||||||
2.00%, 07/01/2042 | 1,325,000 | 1,274,054 | ||||||
5.00%, 07/01/2043 | 1,750,000 | 1,859,270 | ||||||
| Principal Amount | Value | |||||||
4.00%, 07/01/2046 | 880,000 | 880,651 | ||||||
Mohegan Tribe of Indians of Connecticut | ||||||||
5.25%, 02/01/2022 (Acquired 11/25/2015, Cost $945,450) (1)(2)(4) | 955,000 | 985,741 | ||||||
State of Connecticut | ||||||||
5.00%, 08/01/2019 | 20,380,000 | 21,750,351 | ||||||
5.00%, 09/01/2022 | 5,725,000 | 6,519,687 | ||||||
5.00%, 06/15/2027 | 1,680,000 | 1,929,917 | ||||||
4.00%, 09/15/2027 | 1,040,000 | 1,096,275 | ||||||
5.00%, 03/01/2029 | 1,500,000 | 1,667,220 | ||||||
5.00%, 11/15/2032 | 200,000 | 223,566 | ||||||
Town of Hamden CT | ||||||||
5.00%, 08/15/2026 | 500,000 | 588,770 | ||||||
Town of Stratford CT | ||||||||
2.50%, 01/03/2018 | 1,000,000 | 1,005,930 | ||||||
|
| |||||||
| 96,444,108 | ||||||||
|
| |||||||
Delaware - 0.21% | ||||||||
County of Sussex DE | ||||||||
5.00%, 01/01/2036 | 1,500,000 | 1,599,135 | ||||||
Delaware State Economic Development Authority | ||||||||
5.40%, 02/01/2031 | 500,000 | 543,970 | ||||||
5.00%, 09/01/2036 | 500,000 | 532,065 | ||||||
5.00%, 09/01/2046 | 700,000 | 736,715 | ||||||
Delaware State Health Facilities Authority | ||||||||
0.86%, 10/01/2040 | 2,000,000 | 2,000,000 | ||||||
|
| |||||||
| 5,411,885 | ||||||||
|
| |||||||
District of Columbia - 0.67% | ||||||||
District of Columbia | ||||||||
5.00%, 06/01/2022 | 1,150,000 | 1,344,890 | ||||||
5.00%, 06/01/2031 | 2,500,000 | 3,028,100 | ||||||
Metropolitan Washington Airports Authority | ||||||||
5.00%, 10/01/2019 | 1,400,000 | 1,515,388 | ||||||
5.00%, 10/01/2021 | 2,000,000 | 2,283,380 | ||||||
5.00%, 10/01/2023 | 850,000 | 1,003,697 | ||||||
5.00%, 10/01/2029 | 1,000,000 | 1,197,490 | ||||||
5.00%, 10/01/2037 | 1,000,000 | 1,155,980 | ||||||
Metropolitan Washington Airports Authority Dulles Toll Road Revenue | ||||||||
0.00%, 10/01/2037 | 1,000,000 | 454,950 | ||||||
6.50%, 10/01/2041 | 2,000,000 | 2,583,380 | ||||||
5.00%, 10/01/2053 | 1,000,000 | 1,047,530 | ||||||
Washington Metropolitan Area Transit Authority | ||||||||
4.00%, 07/01/2019 | 1,425,000 | 1,466,126 | ||||||
|
| |||||||
| 17,080,911 | ||||||||
|
| |||||||
Florida - 6.67% | ||||||||
Alachua County Health Facilities Authority | ||||||||
5.00%, 12/01/2036 | 1,000,000 | 1,114,990 | ||||||
5.00%, 12/01/2044 | 1,350,000 | 1,489,347 | ||||||
6.38%, 11/15/2049 | 300,000 | 328,590 | ||||||
Brevard County Health Facilities Authority | ||||||||
5.00%, 04/01/2039 | 1,335,000 | 1,458,367 | ||||||
Celebration Pointe Community Development District | ||||||||
4.00%, 05/01/2022 (Acquired 05/16/2017, Cost $354,596) (1) | 350,000 | 354,508 | ||||||
Citizens Property Insurance Corp. | ||||||||
5.00%, 06/01/2021 | 355,000 | 402,069 | ||||||
City of Cape Coral FL Water & Sewer Revenue | ||||||||
1.65%, 09/01/2019 | 1,085,000 | 1,092,107 | ||||||
City of Jacksonville FL | ||||||||
5.00%, 10/01/2021 | 1,165,000 | 1,334,298 | ||||||
5.00%, 10/01/2024 | 1,185,000 | 1,434,004 | ||||||
City of Lakeland FL Department of Electric Utilities | ||||||||
5.00%, 10/01/2017 | 5,200,000 | 5,250,336 | ||||||
City of Tallahassee FL | ||||||||
| Principal Amount | Value | |||||||
5.00%, 12/01/2026 | 1,380,000 | 1,590,257 | ||||||
City of Tampa FL | ||||||||
5.00%, 04/01/2040 | 1,115,000 | 1,238,609 | ||||||
County of Broward FL Airport System Revenue | ||||||||
5.00%, 10/01/2020 | 880,000 | 981,948 | ||||||
5.00%, 10/01/2022 | 585,000 | 678,126 | ||||||
5.00%, 10/01/2022 | 1,500,000 | 1,753,500 | ||||||
5.00%, 10/01/2022 | 2,435,000 | 2,846,515 | ||||||
5.00%, 10/01/2029 | 500,000 | 572,475 | ||||||
5.00%, 10/01/2042 | 110,000 | 122,272 | ||||||
County of Hillsborough FL | ||||||||
5.00%, 11/01/2025 | 1,775,000 | 2,156,927 | ||||||
County of Miami-Dade FL | ||||||||
5.00%, 07/01/2023 | 1,000,000 | 1,190,200 | ||||||
5.00%, 10/01/2024 | 1,770,000 | 2,105,008 | ||||||
County of Miami-Dade FL Aviation Revenue | ||||||||
5.75%, 10/01/2020 | 615,000 | 674,538 | ||||||
5.25%, 10/01/2021 | 3,000,000 | 3,029,220 | ||||||
5.25%, 10/01/2022 | 5,000,000 | 5,048,700 | ||||||
5.00%, 10/01/2031 | 3,000,000 | 3,389,430 | ||||||
5.00%, 10/01/2035 | 1,000,000 | 1,125,720 | ||||||
County of Miami-Dade Seaport Department | ||||||||
0.93%, 10/01/2050 | 4,000,000 | 4,000,000 | ||||||
County of Palm Beach FL | ||||||||
5.00%, 05/01/2029 | 1,915,000 | 2,303,515 | ||||||
Florida Department of Environmental Protection | ||||||||
5.00%, 07/01/2018 | 5,000,000 | 5,198,800 | ||||||
5.00%, 07/01/2019 | 300,000 | 322,983 | ||||||
Florida Municipal Power Agency | ||||||||
5.00%, 10/01/2025 | 3,475,000 | 4,239,291 | ||||||
Florida’s Turnpike Enterprise | ||||||||
5.00%, 07/01/2017 | 2,000,000 | 2,000,000 | ||||||
5.00%, 07/01/2019 | 2,380,000 | 2,561,856 | ||||||
Greater Orlando Aviation Authority | ||||||||
5.00%, 10/01/2020 | 815,000 | 905,302 | ||||||
5.00%, 10/01/2031 | 2,000,000 | 2,271,140 | ||||||
5.00%, 10/01/2033 | 2,000,000 | 2,251,040 | ||||||
Hernando County School District | ||||||||
5.00%, 07/01/2024 | 805,000 | 959,415 | ||||||
5.00%, 07/01/2025 | 1,000,000 | 1,204,040 | ||||||
Jacksonville Housing Finance Authority | ||||||||
0.85%, 08/01/2018 | 1,500,000 | 1,498,005 | ||||||
JEA Electric System Revenue | ||||||||
5.00%, 10/01/2020 | 4,400,000 | 4,909,740 | ||||||
Lakewood Ranch Stewardship District | ||||||||
4.00%, 05/01/2022 | 650,000 | 654,056 | ||||||
Manatee County School District | ||||||||
5.00%, 10/01/2025 | 520,000 | 628,680 | ||||||
Marion County School Board | ||||||||
5.00%, 06/01/2026 | 1,435,000 | 1,700,963 | ||||||
Martin County Health Facilities Authority | ||||||||
5.00%, 11/15/2023 | 800,000 | 929,120 | ||||||
Miami-Dade County Educational Facilities Authority | ||||||||
5.00%, 04/01/2040 | 2,855,000 | 3,221,268 | ||||||
Miami-Dade County Expressway Authority | ||||||||
5.00%, 07/01/2019 | 1,250,000 | 1,341,150 | ||||||
5.00%, 07/01/2030 | 1,225,000 | 1,447,399 | ||||||
Miami-Dade County Health Facilities Authority | ||||||||
5.00%, 08/01/2025 | 110,000 | 131,222 | ||||||
5.00%, 08/01/2026 | 155,000 | 185,434 | ||||||
5.00%, 08/01/2027 | 345,000 | 413,873 | ||||||
| Principal Amount | Value | |||||||
5.00%, 08/01/2028 | 400,000 | 474,428 | ||||||
5.00%, 08/01/2029 | 480,000 | 564,259 | ||||||
5.00%, 08/01/2030 | 675,000 | 788,366 | ||||||
5.00%, 08/01/2032 | 750,000 | 865,410 | ||||||
Miami-Dade County Industrial Development Authority | ||||||||
4.00%, 09/15/2019 | 395,000 | 408,576 | ||||||
Orange County Health Facilities Authority | ||||||||
5.00%, 01/01/2020 | 1,000,000 | 1,057,480 | ||||||
Orange County School Board | ||||||||
5.00%, 08/01/2029 | 1,000,000 | 1,183,250 | ||||||
Orlando-Orange County Expressway Authority | ||||||||
5.00%, 07/01/2017 | 2,105,000 | 2,105,000 | ||||||
Palm Beach County Health Facilities Authority | ||||||||
7.50%, 06/01/2049 | 100,000 | 117,525 | ||||||
7.50%, 06/01/2049 | 1,875,000 | 2,204,944 | ||||||
Palm Beach County School District | ||||||||
5.00%, 08/01/2030 | 4,520,000 | 5,290,615 | ||||||
5.00%, 08/01/2032 | 3,000,000 | 3,471,360 | ||||||
Reedy Creek Improvement District | ||||||||
5.00%, 06/01/2021 | 1,855,000 | 2,107,744 | ||||||
5.00%, 06/01/2023 | 2,740,000 | 3,247,420 | ||||||
School Board of Miami-Dade County/The | ||||||||
5.00%, 05/01/2025 | 3,000,000 | 3,612,270 | ||||||
5.00%, 05/01/2026 | 1,000,000 | 1,192,190 | ||||||
5.00%, 02/01/2029 | 8,000,000 | 9,405,840 | ||||||
5.00%, 02/01/2030 | 500,000 | 583,695 | ||||||
5.00%, 05/01/2031 | 5,000,000 | 5,725,950 | ||||||
School District of Broward County/FL | ||||||||
5.00%, 07/01/2021 | 4,000,000 | 4,539,720 | ||||||
Seminole Tribe of Florida, Inc. | ||||||||
5.50%, 10/01/2024 (Acquired 09/15/2015 through 09/30/2015, Cost $3,526,397) (1) | 3,500,000 | 3,527,370 | ||||||
South Broward Hospital District | ||||||||
5.00%, 05/01/2019 | 2,195,000 | 2,342,987 | ||||||
5.00%, 05/01/2021 | 2,035,000 | 2,295,154 | ||||||
State of Florida | ||||||||
5.00%, 06/01/2018 | 3,500,000 | 3,627,085 | ||||||
5.00%, 06/01/2019 | 1,210,000 | 1,298,608 | ||||||
5.00%, 06/01/2019 | 1,320,000 | 1,416,664 | ||||||
5.00%, 07/01/2019 | 3,500,000 | 3,768,870 | ||||||
5.00%, 06/01/2021 | 1,120,000 | 1,278,558 | ||||||
5.00%, 07/01/2023 | 2,630,000 | 3,151,792 | ||||||
5.00%, 07/01/2024 | 2,460,000 | 2,996,231 | ||||||
State of Florida Lottery Revenue | ||||||||
5.00%, 07/01/2018 | 4,915,000 | 5,105,456 | ||||||
5.00%, 07/01/2020 | 2,000,000 | 2,220,400 | ||||||
5.00%, 07/01/2020 | 965,000 | 1,071,343 | ||||||
|
| |||||||
| 171,086,913 | ||||||||
|
| |||||||
Georgia - 1.87% | ||||||||
Atlanta Development Authority | ||||||||
6.75%, 01/01/2035 | 825,000 | 815,818 | ||||||
Atlanta Urban Residential Finance Authority | ||||||||
1.40%, 05/01/2020 | 3,000,000 | 2,996,760 | ||||||
City of Atlanta GA | ||||||||
5.00%, 01/01/2018 | 315,000 | 320,985 | ||||||
5.00%, 01/01/2019 | 225,000 | 237,521 | ||||||
5.00%, 01/01/2020 | 275,000 | 298,471 | ||||||
City of Atlanta GA Water & Wastewater Revenue | ||||||||
5.50%, 11/01/2017 | 3,010,000 | 3,054,518 | ||||||
5.00%, 11/01/2021 | 1,900,000 | 2,188,268 | ||||||
City of East Point GA | ||||||||
4.00%, 08/01/2017 | 340,000 | 340,636 | ||||||
| Principal Amount | Value | |||||||
4.00%, 08/01/2018 | 400,000 | 410,784 | ||||||
5.00%, 08/01/2019 | 955,000 | 1,019,004 | ||||||
5.00%, 08/01/2020 | 415,000 | 453,176 | ||||||
5.00%, 08/01/2021 | 250,000 | 278,235 | ||||||
DeKalb County Hospital Authority/GA | ||||||||
6.13%, 09/01/2040 | 550,000 | 597,679 | ||||||
Gainesville & Hall County Hospital Authority | ||||||||
5.00%, 02/15/2022 | 515,000 | 590,751 | ||||||
5.00%, 02/15/2025 | 300,000 | 352,800 | ||||||
5.50%, 02/15/2042 | 650,000 | 778,752 | ||||||
Georgia Housing & Finance Authority | ||||||||
1.40%, 06/01/2018 | 750,000 | 751,575 | ||||||
Gwinnett County School District | ||||||||
5.00%, 02/01/2032 | 1,000,000 | 1,023,340 | ||||||
Macon-Bibb County Urban Development Authority | ||||||||
5.75%, 06/15/2037 (Acquired 06/13/2017, Cost $1,046,742) (1) | 1,000,000 | 1,042,240 | ||||||
Main Street Natural Gas, Inc. | ||||||||
5.00%, 03/15/2018 | 2,000,000 | 2,048,500 | ||||||
5.00%, 03/15/2021 | 2,500,000 | 2,772,150 | ||||||
Marietta Dormitory Authority | ||||||||
5.00%, 11/01/2037 | 300,000 | 311,985 | ||||||
Monroe County Development Authority | ||||||||
2.35%, 10/01/2048 | 500,000 | 504,775 | ||||||
Municipal Electric Authority of Georgia | ||||||||
5.00%, 01/01/2019 | 1,000,000 | 1,047,320 | ||||||
5.00%, 01/01/2020 | 2,095,000 | 2,259,395 | ||||||
5.00%, 01/01/2020 | 2,980,000 | 3,213,841 | ||||||
4.00%, 01/01/2021 | 350,000 | 375,781 | ||||||
5.00%, 01/01/2022 | 250,000 | 282,485 | ||||||
5.00%, 01/01/2023 | 250,000 | 287,102 | ||||||
Peach County Development Authority | ||||||||
1.20%, 10/01/2018 | 2,000,000 | 1,997,300 | ||||||
Private Colleges & Universities Authority | ||||||||
5.00%, 04/01/2027 | 1,900,000 | 2,153,669 | ||||||
5.00%, 10/01/2032 | 1,300,000 | 1,549,951 | ||||||
5.00%, 04/01/2044 | 1,300,000 | 1,403,896 | ||||||
Savannah Economic Development Authority | ||||||||
7.25%, 01/01/2049 | 120,000 | 130,848 | ||||||
Savannah Housing Authority | ||||||||
1.15%, 07/01/2019 | 3,700,000 | 3,703,145 | ||||||
State of Georgia | ||||||||
5.00%, 02/01/2018 | 3,035,000 | 3,106,201 | ||||||
5.00%, 07/01/2026 | 2,625,000 | 3,294,296 | ||||||
|
| |||||||
| 47,993,953 | ||||||||
|
| |||||||
Guam - 0.06% | ||||||||
Guam Government Waterworks Authority | ||||||||
5.00%, 07/01/2035 | 1,500,000 | 1,621,080 | ||||||
|
| |||||||
Hawaii - 0.09% | ||||||||
City & County of Honolulu HI | ||||||||
5.00%, 10/01/2029 | 2,000,000 | 2,383,140 | ||||||
|
| |||||||
Idaho - 0.32% | ||||||||
Idaho Health Facilities Authority | ||||||||
5.00%, 12/01/2020 | 2,900,000 | 3,242,635 | ||||||
5.00%, 03/01/2034 | 3,155,000 | 3,488,767 | ||||||
State of Idaho | ||||||||
4.00%, 06/29/2018 | 1,500,000 | 1,544,970 | ||||||
|
| |||||||
| 8,276,372 | ||||||||
|
| |||||||
Illinois - 9.25% | ||||||||
Chicago Board of Education | ||||||||
5.00%, 12/01/2021 | 2,000,000 | 2,004,980 | ||||||
0.00%, 12/01/2025 | 265,000 | 182,325 | ||||||
| Principal Amount | Value | |||||||
5.00%, 12/01/2041 | 785,000 | 612,379 | ||||||
5.25%, 12/01/2041 | 3,000,000 | 2,410,470 | ||||||
5.00%, 12/01/2042 | 200,000 | 157,132 | ||||||
6.50%, 12/01/2046 | 100,000 | 90,031 | ||||||
Chicago Midway International Airport | ||||||||
5.00%, 01/01/2021 | 5,000,000 | 5,534,700 | ||||||
5.00%, 01/01/2027 | 1,800,000 | 2,084,004 | ||||||
5.00%, 01/01/2032 | 2,000,000 | 2,222,960 | ||||||
5.00%, 01/01/2034 | 1,000,000 | 1,104,670 | ||||||
5.00%, 01/01/2046 | 300,000 | 337,005 | ||||||
Chicago O’Hare International Airport | ||||||||
5.00%, 01/01/2021 | 500,000 | 561,215 | ||||||
5.00%, 01/01/2022 | 700,000 | 805,252 | ||||||
5.00%, 01/01/2022 | 520,000 | 591,646 | ||||||
5.00%, 01/01/2022 | 500,000 | 575,180 | ||||||
5.00%, 01/01/2023 | 1,000,000 | 1,173,300 | ||||||
5.00%, 01/01/2024 | 865,000 | 1,014,074 | ||||||
5.00%, 01/01/2025 | 415,000 | 491,028 | ||||||
5.00%, 01/01/2027 | 385,000 | 456,895 | ||||||
5.00%, 01/01/2030 | 2,000,000 | 2,309,900 | ||||||
5.00%, 01/01/2030 | 2,000,000 | 2,267,840 | ||||||
5.00%, 01/01/2031 | 700,000 | 794,248 | ||||||
5.00%, 01/01/2031 | 660,000 | 756,531 | ||||||
5.00%, 01/01/2032 | 1,300,000 | 1,459,276 | ||||||
5.00%, 01/01/2033 | 345,000 | 396,912 | ||||||
5.00%, 01/01/2034 | 400,000 | 456,968 | ||||||
5.00%, 01/01/2042 | 500,000 | 559,240 | ||||||
Chicago Park District | ||||||||
5.00%, 01/01/2025 | 500,000 | 540,265 | ||||||
Chicago Transit Authority | ||||||||
5.25%, 06/01/2024 | 2,000,000 | 2,185,340 | ||||||
5.00%, 06/01/2026 | 8,275,000 | 9,365,976 | ||||||
City of Chicago IL | ||||||||
4.25%, 01/01/2020 | 465,000 | 486,330 | ||||||
5.00%, 01/01/2020 | 3,500,000 | 3,515,470 | ||||||
5.25%, 01/01/2021 | 1,565,000 | 1,573,185 | ||||||
5.00%, 01/01/2022 | 460,000 | 501,170 | ||||||
5.00%, 01/01/2023 | 1,535,000 | 1,609,140 | ||||||
5.00%, 01/01/2026 | 425,000 | 465,490 | ||||||
5.00%, 01/01/2027 | 500,000 | 543,865 | ||||||
5.25%, 01/01/2027 | 2,435,000 | 2,468,043 | ||||||
5.00%, 01/01/2028 | 865,000 | 889,609 | ||||||
5.75%, 01/01/2034 | 2,000,000 | 2,018,900 | ||||||
5.00%, 01/01/2035 | 750,000 | 713,872 | ||||||
5.50%, 01/01/2035 | 1,000,000 | 986,740 | ||||||
City of Chicago IL Motor Fuel Tax Revenue | ||||||||
5.00%, 01/01/2025 | 2,000,000 | 2,035,440 | ||||||
City of Chicago IL Wastewater Transmission Revenue | ||||||||
5.00%, 01/01/2018 | 300,000 | 305,448 | ||||||
5.00%, 01/01/2019 | 200,000 | 210,218 | ||||||
5.00%, 01/01/2020 | 200,000 | 215,694 | ||||||
5.00%, 01/01/2021 | 370,000 | 407,067 | ||||||
5.00%, 01/01/2022 | 250,000 | 280,655 | ||||||
5.00%, 01/01/2023 | 450,000 | 512,532 | ||||||
5.00%, 01/01/2024 | 500,000 | 577,975 | ||||||
5.00%, 01/01/2028 | 1,530,000 | 1,686,381 | ||||||
5.00%, 01/01/2029 | 1,300,000 | 1,416,207 | ||||||
5.00%, 01/01/2033 | 2,000,000 | 2,157,800 | ||||||
5.00%, 01/01/2039 | 1,000,000 | 1,070,820 | ||||||
City of Chicago IL Waterworks Revenue | ||||||||
5.00%, 11/01/2020 | 915,000 | 1,003,947 | ||||||
| Principal Amount | Value | |||||||
5.00%, 11/01/2021 | 1,525,000 | 1,709,342 | ||||||
4.00%, 11/01/2023 | 1,025,000 | 1,085,885 | ||||||
5.00%, 11/01/2024 | 1,150,000 | 1,324,558 | ||||||
5.00%, 11/01/2024 | 250,000 | 287,948 | ||||||
5.00%, 11/01/2025 | 1,000,000 | 1,132,620 | ||||||
5.00%, 11/01/2033 | 500,000 | 544,665 | ||||||
City of Springfield IL | ||||||||
5.00%, 12/01/2024 | 340,000 | 390,670 | ||||||
5.00%, 12/01/2025 | 265,000 | 306,229 | ||||||
5.00%, 12/01/2026 | 160,000 | 181,325 | ||||||
County of Cook IL | ||||||||
5.25%, 11/15/2022 | 405,000 | 445,593 | ||||||
5.00%, 11/15/2023 | 2,500,000 | 2,892,275 | ||||||
5.00%, 11/15/2025 | 2,500,000 | 2,816,875 | ||||||
5.00%, 11/15/2026 | 1,000,000 | 1,077,680 | ||||||
5.00%, 11/15/2026 | 1,390,000 | 1,589,701 | ||||||
5.25%, 11/15/2028 | 1,035,000 | 1,132,538 | ||||||
5.00%, 11/15/2029 | 1,000,000 | 1,117,090 | ||||||
5.00%, 11/15/2029 | 1,085,000 | 1,197,287 | ||||||
5.00%, 11/15/2030 | 500,000 | 556,015 | ||||||
Illinois Finance Authority | ||||||||
4.00%, 05/15/2023 | 500,000 | 529,975 | ||||||
5.00%, 11/15/2023 | 750,000 | 877,350 | ||||||
5.00%, 01/01/2024 | 250,000 | 286,563 | ||||||
5.00%, 05/15/2024 | 350,000 | 412,549 | ||||||
5.00%, 02/15/2026 | 360,000 | 406,966 | ||||||
5.25%, 11/15/2026 | 50,000 | 50,070 | ||||||
5.00%, 03/01/2027 | 400,000 | 472,584 | ||||||
5.00%, 03/01/2028 | 465,000 | 543,501 | ||||||
5.00%, 07/01/2030 | 275,000 | 313,852 | ||||||
5.00%, 11/15/2030 | 2,000,000 | 2,263,160 | ||||||
5.00%, 01/01/2031 | 3,500,000 | 3,947,790 | ||||||
5.00%, 02/15/2031 | 300,000 | 329,244 | ||||||
5.25%, 08/15/2031 | 500,000 | 565,225 | ||||||
0.93%, 07/01/2032 | 9,500,000 | 9,500,000 | ||||||
4.75%, 05/15/2033 | 960,000 | 994,186 | ||||||
5.00%, 08/15/2033 | 250,000 | 274,725 | ||||||
5.00%, 02/15/2034 | 1,890,000 | 2,044,167 | ||||||
5.00%, 08/15/2034 | 2,500,000 | 2,878,950 | ||||||
5.00%, 11/15/2034 | 3,000,000 | 3,317,550 | ||||||
5.00%, 08/15/2035 | 600,000 | 650,646 | ||||||
5.00%, 08/15/2035 | 100,000 | 108,958 | ||||||
4.00%, 02/15/2036 | 680,000 | 640,703 | ||||||
5.00%, 02/15/2036 | 170,000 | 182,742 | ||||||
5.00%, 07/01/2036 | 325,000 | 362,043 | ||||||
5.00%, 08/15/2036 | 1,000,000 | 1,082,020 | ||||||
5.25%, 11/15/2036 | 50,000 | 50,031 | ||||||
5.00%, 05/15/2037 | 395,000 | 421,828 | ||||||
5.00%, 05/15/2037 | 1,050,000 | 1,067,671 | ||||||
5.00%, 08/15/2037 | 1,000,000 | 1,079,620 | ||||||
5.00%, 11/15/2038 | 3,795,000 | 4,174,766 | ||||||
8.00%, 05/15/2040 | 725,000 | 806,272 | ||||||
5.00%, 02/15/2041 | 1,530,000 | 1,633,367 | ||||||
1.75%, 11/15/2042 | 1,770,000 | 1,773,806 | ||||||
0.89%, 08/01/2043 | 4,825,000 | 4,825,000 | ||||||
5.00%, 08/15/2044 | 200,000 | 215,448 | ||||||
5.00%, 11/15/2045 | 2,500,000 | 2,707,400 | ||||||
8.00%, 05/15/2046 | 1,595,000 | 1,770,594 | ||||||
5.00%, 12/01/2046 | 5,000,000 | 5,363,500 | ||||||
5.00%, 05/15/2047 | 100,000 | 105,635 | ||||||
5.25%, 05/15/2047 | 280,000 | 293,927 | ||||||
| Principal Amount | Value | |||||||
Illinois Housing Development Authority | ||||||||
1.10%, 06/01/2018 | 2,500,000 | 2,500,025 | ||||||
1.33%, 02/01/2020 | 3,000,000 | 3,001,530 | ||||||
Illinois Municipal Electric Agency | ||||||||
5.00%, 02/01/2023 | 275,000 | 319,217 | ||||||
5.00%, 02/01/2031 | 470,000 | 535,109 | ||||||
Illinois Sports Facilities Authority/The | ||||||||
5.25%, 06/15/2032 | 1,735,000 | 1,899,374 | ||||||
Illinois State Toll Highway Authority | ||||||||
5.00%, 12/01/2031 | 235,000 | 272,078 | ||||||
5.00%, 01/01/2038 | 2,700,000 | 3,015,522 | ||||||
5.00%, 01/01/2041 | 7,000,000 | 7,901,390 | ||||||
Kane County School District No 129 West Aurora | ||||||||
5.00%, 02/01/2026 | 1,000,000 | 1,166,560 | ||||||
Lake County Community Unit School District No 60 Waukegan | ||||||||
5.00%, 01/01/2026 | 1,000,000 | 1,184,710 | ||||||
5.00%, 01/01/2027 | 2,200,000 | 2,586,518 | ||||||
McHenry County Community Unit School District No 200 Woodstock | ||||||||
0.00%, 01/15/2024 | 1,000,000 | 847,610 | ||||||
0.00%, 01/15/2025 | 1,000,000 | 818,460 | ||||||
0.00%, 01/15/2026 | 1,000,000 | 787,630 | ||||||
Metropolitan Pier & Exposition Authority | ||||||||
0.00%, 06/15/2018 | 605,000 | 590,789 | ||||||
5.00%, 12/15/2020 | 430,000 | 449,457 | ||||||
5.00%, 12/15/2026 | 2,000,000 | 2,051,820 | ||||||
5.00%, 12/15/2028 | 2,500,000 | 2,528,275 | ||||||
0.00%, 12/15/2033 | 5,970,000 | 2,785,781 | ||||||
0.00%, 12/15/2034 | 1,000,000 | 440,960 | ||||||
5.25%, 06/15/2050 | 3,275,000 | 3,199,642 | ||||||
Northern Illinois Municipal Power Agency | ||||||||
5.00%, 12/01/2018 | 125,000 | 131,174 | ||||||
5.00%, 12/01/2019 | 150,000 | 162,231 | ||||||
5.00%, 12/01/2020 | 1,025,000 | 1,137,073 | ||||||
5.00%, 12/01/2022 | 1,575,000 | 1,814,054 | ||||||
Peoria Public Building Commission | ||||||||
5.00%, 12/01/2022 | 1,500,000 | 1,707,075 | ||||||
Rib Floater Trust Various States | ||||||||
1.21%, 04/01/2036 (Acquired 02/16/2017, Cost $1,400,000) (1)(2)(4) | 1,400,000 | 1,400,000 | ||||||
State of Illinois | ||||||||
5.00%, 01/01/2018 | 1,000,000 | 1,012,970 | ||||||
5.00%, 02/01/2018 | 200,000 | 202,862 | ||||||
5.50%, 08/01/2018 | 1,955,000 | 2,025,106 | ||||||
5.00%, 02/01/2019 | 425,000 | 434,643 | ||||||
4.50%, 06/15/2019 | 1,710,000 | 1,794,337 | ||||||
5.00%, 06/15/2019 | 1,435,000 | 1,519,392 | ||||||
5.00%, 02/01/2020 | 425,000 | 439,361 | ||||||
5.00%, 02/01/2021 | 425,000 | 440,857 | ||||||
5.00%, 01/01/2022 | 700,000 | 716,240 | ||||||
5.00%, 06/15/2024 | 2,000,000 | 2,255,600 | ||||||
5.50%, 07/01/2024 | 1,000,000 | 1,058,410 | ||||||
5.00%, 02/01/2025 | 455,000 | 468,322 | ||||||
5.00%, 05/01/2025 | 3,050,000 | 3,142,110 | ||||||
5.00%, 06/01/2025 | 880,000 | 910,140 | ||||||
5.00%, 06/15/2025 | 4,090,000 | 4,567,467 | ||||||
5.50%, 07/01/2025 | 400,000 | 421,212 | ||||||
5.00%, 11/01/2025 | 2,040,000 | 2,112,869 | ||||||
5.00%, 06/01/2026 | 125,000 | 127,971 | ||||||
5.00%, 02/01/2028 | 1,000,000 | 1,011,340 | ||||||
5.00%, 03/01/2028 | 5,130,000 | 5,161,396 | ||||||
5.00%, 05/01/2028 | 265,000 | 267,266 | ||||||
5.00%, 02/01/2029 | 1,000,000 | 1,010,580 | ||||||
| Principal Amount | Value | |||||||
5.25%, 02/01/2029 | 3,720,000 | 3,800,612 | ||||||
5.25%, 02/01/2030 | 100,000 | 102,111 | ||||||
5.25%, 02/01/2031 | 760,000 | 775,618 | ||||||
5.00%, 05/01/2032 | 800,000 | 804,992 | ||||||
5.50%, 07/01/2038 | 1,500,000 | 1,558,005 | ||||||
Sugar Grove Public Library District | ||||||||
3.00%, 02/01/2020 | 390,000 | 403,190 | ||||||
Village of Bedford Park IL | ||||||||
4.00%, 12/01/2020 | 1,180,000 | 1,218,256 | ||||||
Village of Mount Prospect IL | ||||||||
2.00%, 12/01/2018 | 820,000 | 828,635 | ||||||
Will & Kankakee Counties School District No 255 | ||||||||
4.00%, 06/01/2018 | 1,070,000 | 1,097,692 | ||||||
|
| |||||||
| 237,190,046 | ||||||||
|
| |||||||
Indiana - 2.21% | ||||||||
Ball State University | ||||||||
5.00%, 07/01/2033 | 955,000 | 1,124,169 | ||||||
City of Evansville IN | ||||||||
0.90%, 06/01/2018 | 5,000,000 | 4,994,450 | ||||||
City of Indianapolis IN Thermal Energy System Revenue | ||||||||
5.00%, 10/01/2017 | 1,000,000 | 1,009,150 | ||||||
City of Whiting IN | ||||||||
5.00%, 11/01/2045 | 2,600,000 | 2,966,288 | ||||||
Indiana Development Finance Authority | ||||||||
1.75%, 10/01/2031 | 3,600,000 | 3,602,592 | ||||||
Indiana Finance Authority | ||||||||
5.00%, 09/15/2019 | 700,000 | 743,862 | ||||||
5.00%, 12/01/2024 | 3,000,000 | 3,650,910 | ||||||
6.00%, 12/01/2026 | 2,035,000 | 2,080,889 | ||||||
5.00%, 09/01/2031 | 300,000 | 346,920 | ||||||
5.25%, 02/01/2033 | 2,500,000 | 2,931,725 | ||||||
5.00%, 03/01/2036 | 4,000,000 | 4,444,960 | ||||||
5.00%, 09/01/2036 | 1,000,000 | 1,125,740 | ||||||
5.00%, 09/01/2046 | 2,750,000 | 2,814,543 | ||||||
5.00%, 07/01/2048 | 1,425,000 | 1,531,561 | ||||||
5.25%, 01/01/2051 | 3,450,000 | 3,744,423 | ||||||
Indiana Health & Educational Facilities Financing Authority | ||||||||
1.75%, 11/15/2031 | 3,000,000 | 2,997,480 | ||||||
Indiana Health Facility Financing Authority | ||||||||
2.00%, 10/01/2026 | 3,990,000 | 4,023,955 | ||||||
1.25%, 11/01/2027 | 1,230,000 | 1,221,870 | ||||||
4.00%, 11/01/2027 | 7,410,000 | 7,425,264 | ||||||
Indianapolis Local Public Improvement Bond Bank | ||||||||
5.00%, 01/01/2021 | 370,000 | 411,688 | ||||||
5.00%, 01/01/2022 | 755,000 | 858,677 | ||||||
5.00%, 01/01/2023 | 285,000 | 329,374 | ||||||
5.00%, 01/01/2029 | 1,000,000 | 1,161,640 | ||||||
5.00%, 01/01/2031 | 1,000,000 | 1,148,020 | ||||||
|
| |||||||
| 56,690,150 | ||||||||
|
| |||||||
Iowa - 0.36% | ||||||||
City of Altoona IA | ||||||||
5.00%, 06/01/2026 | 2,200,000 | 2,601,830 | ||||||
Iowa Finance Authority | ||||||||
5.25%, 12/01/2025 | 1,500,000 | 1,548,435 | ||||||
4.75%, 08/01/2042 | 980,000 | 986,105 | ||||||
Iowa Higher Education Loan Authority | ||||||||
1.00%, 09/01/2018 | 4,000,000 | 3,992,680 | ||||||
|
| |||||||
| 9,129,050 | ||||||||
|
| |||||||
Kansas - 0.21% | ||||||||
City of Wichita KS | ||||||||
5.00%, 11/15/2017 | 2,375,000 | 2,409,200 | ||||||
| Principal Amount | Value | |||||||
5.25%, 11/15/2024 | 350,000 | 382,946 | ||||||
Johnson County Unified School District No 232 De Soto | ||||||||
5.00%, 09/01/2022 | 350,000 | 409,381 | ||||||
Kansas Development Finance Authority | ||||||||
5.00%, 11/15/2032 | 2,000,000 | 2,271,460 | ||||||
|
| |||||||
| 5,472,987 | ||||||||
|
| |||||||
Kentucky - 1.32% | ||||||||
City of Ashland KY | ||||||||
5.00%, 02/01/2030 | 555,000 | 617,465 | ||||||
City of Russell KY | ||||||||
5.00%, 11/01/2022 | 3,200,000 | 3,717,152 | ||||||
Kentucky Asset Liability Commission | ||||||||
5.00%, 09/01/2024 | 1,000,000 | 1,189,450 | ||||||
5.00%, 09/01/2025 | 1,250,000 | 1,502,650 | ||||||
Kentucky Economic Development Finance Authority | ||||||||
5.00%, 06/01/2018 | 200,000 | 205,812 | ||||||
5.00%, 06/01/2019 | 375,000 | 395,895 | ||||||
5.00%, 06/01/2020 | 500,000 | 539,150 | ||||||
5.25%, 06/01/2020 | 500,000 | 542,645 | ||||||
5.00%, 06/01/2021 | 250,000 | 274,857 | ||||||
5.50%, 06/01/2021 | 685,000 | 765,857 | ||||||
5.00%, 06/01/2024 | 1,000,000 | 1,143,940 | ||||||
5.00%, 06/01/2037 | 325,000 | 356,363 | ||||||
5.00%, 07/01/2037 | 1,500,000 | 1,625,640 | ||||||
6.38%, 03/01/2040 | 2,400,000 | 2,742,864 | ||||||
6.38%, 06/01/2040 | 3,230,000 | 3,691,438 | ||||||
5.00%, 06/01/2041 | 225,000 | 245,549 | ||||||
5.25%, 06/01/2041 | 225,000 | 251,312 | ||||||
5.00%, 08/15/2041 | 1,000,000 | 1,092,000 | ||||||
6.50%, 03/01/2045 | 1,000,000 | 1,146,410 | ||||||
5.00%, 06/01/2045 | 1,000,000 | 1,087,040 | ||||||
5.00%, 05/15/2046 | 500,000 | 479,345 | ||||||
6.25%, 11/15/2046 | 750,000 | 747,923 | ||||||
5.00%, 05/15/2051 | 325,000 | 308,246 | ||||||
Kentucky Higher Education Student Loan Corp. | ||||||||
5.00%, 06/01/2020 | 600,000 | 644,526 | ||||||
5.00%, 06/01/2021 | 610,000 | 665,406 | ||||||
Kentucky Public Transportation Infrastructure Authority | ||||||||
5.00%, 07/01/2017 | 910,000 | 910,000 | ||||||
5.75%, 07/01/2049 | 1,000,000 | 1,106,340 | ||||||
6.00%, 07/01/2053 | 530,000 | 594,612 | ||||||
Louisville/Jefferson County Metropolitan Government | ||||||||
5.00%, 10/01/2020 | 1,140,000 | 1,254,524 | ||||||
5.00%, 10/01/2023 | 1,565,000 | 1,822,959 | ||||||
5.00%, 10/01/2032 | 430,000 | 497,407 | ||||||
1.50%, 10/01/2033 | 1,705,000 | 1,709,365 | ||||||
|
| |||||||
| 33,874,142 | ||||||||
|
| |||||||
Louisiana - 1.46% | ||||||||
City of New Orleans LA | ||||||||
5.00%, 12/01/2019 | 2,450,000 | 2,639,532 | ||||||
Jefferson Parish Hospital Service District No 1 | ||||||||
5.50%, 01/01/2026 | 3,000,000 | 3,423,660 | ||||||
Louisiana Housing Corp. | ||||||||
1.00%, 09/01/2019 | 2,000,000 | 2,001,000 | ||||||
Louisiana Local Government Environmental Facilities & Community Development Authority | ||||||||
6.50%, 08/01/2029 | 2,200,000 | 2,481,358 | ||||||
Louisiana Public Facilities Authority | ||||||||
5.00%, 06/01/2021 | 7,695,000 | 8,637,484 | ||||||
0.00%, 10/01/2027 | 2,000,000 | 1,689,400 | ||||||
5.00%, 05/15/2031 | 1,250,000 | 1,444,625 | ||||||
5.00%, 05/15/2032 | 1,000,000 | 1,149,290 | ||||||
| Principal Amount | Value | |||||||
New Orleans Aviation Board | ||||||||
5.00%, 01/01/2020 | 135,000 | 146,453 | ||||||
5.00%, 01/01/2021 | 125,000 | 139,129 | ||||||
5.00%, 01/01/2022 | 75,000 | 85,334 | ||||||
5.00%, 01/01/2023 | 50,000 | 57,870 | ||||||
5.00%, 01/01/2024 | 55,000 | 64,588 | ||||||
5.00%, 01/01/2024 | 1,400,000 | 1,644,062 | ||||||
5.00%, 01/01/2025 | 50,000 | 59,349 | ||||||
5.00%, 01/01/2027 | 850,000 | 994,262 | ||||||
5.00%, 01/01/2028 | 155,000 | 184,944 | ||||||
5.00%, 01/01/2029 | 810,000 | 933,136 | ||||||
5.00%, 01/01/2030 (2)(4) | 200,000 | 227,738 | ||||||
5.00%, 01/01/2033 (2)(4) | 335,000 | 375,210 | ||||||
5.00%, 01/01/2034 | 170,000 | 194,565 | ||||||
5.00%, 01/01/2034 | 750,000 | 836,880 | ||||||
5.00%, 01/01/2036 | 500,000 | 554,175 | ||||||
5.00%, 01/01/2037 | 500,000 | 553,345 | ||||||
5.00%, 01/01/2040 | 1,000,000 | 1,116,860 | ||||||
5.00%, 01/01/2040 | 1,540,000 | 1,741,832 | ||||||
Parish of St John the Baptist LA | ||||||||
5.13%, 06/01/2037 | 1,000,000 | 1,002,890 | ||||||
State of Louisiana | ||||||||
5.00%, 11/15/2017 | 1,000,000 | 1,014,480 | ||||||
5.00%, 02/01/2018 | 2,000,000 | 2,045,540 | ||||||
|
| |||||||
| 37,438,991 | ||||||||
|
| |||||||
Maine - 0.19% | ||||||||
Maine Health & Higher Educational Facilities Authority | ||||||||
4.00%, 07/01/2041 | 1,460,000 | 1,268,360 | ||||||
5.00%, 07/01/2041 | 1,135,000 | 1,157,212 | ||||||
5.00%, 07/01/2043 | 350,000 | 357,066 | ||||||
4.00%, 07/01/2046 | 300,000 | 254,334 | ||||||
5.00%, 07/01/2046 | 1,725,000 | 1,751,186 | ||||||
|
| |||||||
| 4,788,158 | ||||||||
|
| |||||||
Maryland - 3.24% | ||||||||
City of Baltimore MD | ||||||||
5.00%, 07/01/2018 | 2,525,000 | 2,624,611 | ||||||
5.00%, 09/01/2023 | 1,000,000 | 1,150,340 | ||||||
5.00%, 07/01/2026 | 720,000 | 882,245 | ||||||
5.00%, 07/01/2029 | 4,770,000 | 5,775,993 | ||||||
5.00%, 09/01/2030 | 3,000,000 | 3,464,820 | ||||||
5.00%, 09/01/2032 | 1,000,000 | 1,141,900 | ||||||
5.00%, 09/01/2039 | 775,000 | 867,953 | ||||||
5.00%, 09/01/2042 | 1,060,000 | 1,183,310 | ||||||
City of Westminster MD | ||||||||
6.25%, 07/01/2044 | 1,100,000 | 1,162,315 | ||||||
County of Anne Arundel MD | ||||||||
5.00%, 04/01/2018 | 1,115,000 | 1,148,450 | ||||||
Maryland Community Development Administration | ||||||||
1.35%, 01/01/2019 (Acquired 06/22/2016, Cost $2,200,000) (1) | 2,200,000 | 2,206,886 | ||||||
1.15%, 02/01/2019 | 5,000,000 | 4,986,850 | ||||||
Maryland Economic Development Corp. | ||||||||
5.00%, 06/01/2019 | 3,415,000 | 3,654,357 | ||||||
5.00%, 03/31/2024 | 2,500,000 | 2,835,800 | ||||||
5.00%, 09/30/2027 | 50,000 | 59,162 | ||||||
5.00%, 09/30/2030 | 905,000 | 1,044,461 | ||||||
5.00%, 03/31/2046 | 1,535,000 | 1,711,402 | ||||||
5.00%, 03/31/2051 | 1,165,000 | 1,292,101 | ||||||
Maryland Health & Higher Educational Facilities Authority | ||||||||
5.00%, 08/15/2017 | 1,370,000 | 1,375,905 | ||||||
5.00%, 07/01/2018 | 2,100,000 | 2,183,496 | ||||||
5.00%, 07/01/2019 | 1,000,000 | 1,067,020 | ||||||
| Principal Amount | Value | |||||||
4.00%, 07/01/2022 | 1,000,000 | 1,112,040 | ||||||
5.00%, 07/01/2024 | 250,000 | 292,980 | ||||||
5.25%, 07/01/2026 | 500,000 | 582,410 | ||||||
5.50%, 01/01/2028 | 2,500,000 | 2,554,175 | ||||||
5.50%, 01/01/2029 | 1,500,000 | 1,781,700 | ||||||
5.50%, 01/01/2030 | 1,750,000 | 2,061,377 | ||||||
5.00%, 07/01/2032 | 750,000 | 839,775 | ||||||
5.00%, 07/01/2035 | 75,000 | 83,000 | ||||||
1.53%, 05/15/2038 | 1,000,000 | 1,000,250 | ||||||
5.00%, 08/15/2038 | 1,945,000 | 2,181,104 | ||||||
5.00%, 05/15/2040 | 3,425,000 | 3,781,440 | ||||||
4.00%, 07/01/2042 | 120,000 | 120,901 | ||||||
5.00%, 07/01/2045 | 2,000,000 | 2,175,460 | ||||||
5.50%, 01/01/2046 | 1,105,000 | 1,255,324 | ||||||
Maryland Stadium Authority | ||||||||
5.00%, 06/15/2021 | 900,000 | 1,020,483 | ||||||
Maryland State Transportation Authority | ||||||||
5.00%, 03/01/2023 | 1,000,000 | 1,132,150 | ||||||
State of Maryland | ||||||||
5.00%, 11/01/2018 | 3,000,000 | 3,158,070 | ||||||
5.00%, 03/01/2020 | 6,000,000 | 6,601,740 | ||||||
5.00%, 08/01/2020 | 655,000 | 707,544 | ||||||
5.00%, 08/01/2022 | 3,000,000 | 3,529,920 | ||||||
State of Maryland Department of Transportation | ||||||||
5.00%, 05/01/2018 | 1,795,000 | 1,854,469 | ||||||
5.00%, 12/01/2019 | 1,625,000 | 1,774,451 | ||||||
University System of Maryland | ||||||||
5.00%, 04/01/2019 | 1,615,000 | 1,724,432 | ||||||
|
| |||||||
| 83,144,572 | ||||||||
|
| |||||||
Massachusetts - 2.38% | ||||||||
City of Boston MA | ||||||||
5.00%, 04/01/2023 | 2,095,000 | 2,497,806 | ||||||
City of Springfield MA | ||||||||
5.00%, 08/01/2017 | 4,580,000 | 4,593,099 | ||||||
City of Worcester MA | ||||||||
2.25%, 01/23/2018 | 600,000 | 604,428 | ||||||
Commonwealth of Massachusetts | ||||||||
4.00%, 12/01/2017 | 6,015,000 | 6,090,970 | ||||||
4.00%, 08/01/2019 | 1,000,000 | 1,059,170 | ||||||
5.00%, 09/01/2028 | 2,000,000 | 2,409,180 | ||||||
5.00%, 12/01/2030 | 1,500,000 | 1,813,860 | ||||||
1.05%, 08/01/2043 | 10,515,000 | 10,413,530 | ||||||
5.00%, 03/01/2046 | 205,000 | 232,462 | ||||||
Commonwealth of Massachusetts Transportation Fund Revenue | ||||||||
5.00%, 06/01/2025 | 2,490,000 | 2,845,597 | ||||||
Massachusetts Development Finance Agency | ||||||||
5.00%, 07/01/2025 | 1,090,000 | 1,278,417 | ||||||
5.00%, 10/01/2025 | 905,000 | 1,030,515 | ||||||
5.00%, 07/01/2026 | 1,140,000 | 1,340,013 | ||||||
5.00%, 10/01/2026 | 955,000 | 1,090,648 | ||||||
5.00%, 10/15/2028 | 1,750,000 | 1,958,705 | ||||||
5.00%, 01/01/2031 | 475,000 | 540,574 | ||||||
5.00%, 01/01/2032 | 635,000 | 714,127 | ||||||
5.00%, 01/01/2033 | 540,000 | 605,572 | ||||||
5.00%, 01/01/2034 | 710,000 | 785,232 | ||||||
5.00%, 01/01/2035 | 745,000 | 818,010 | ||||||
5.00%, 01/01/2036 | 1,100,000 | 1,205,600 | ||||||
1.39%, 07/01/2050 | 4,000,000 | 3,987,640 | ||||||
Massachusetts Educational Financing Authority | ||||||||
4.00%, 01/01/2018 | 1,500,000 | 1,519,050 | ||||||
4.00%, 07/01/2019 | 2,000,000 | 2,091,860 | ||||||
| Principal Amount | Value | |||||||
5.00%, 07/01/2021 | 1,000,000 | 1,112,760 | ||||||
Massachusetts Health & Educational Facilities Authority | ||||||||
5.00%, 10/01/2017 | 2,000,000 | 2,018,680 | ||||||
Massachusetts School Building Authority | ||||||||
5.00%, 01/15/2028 | 1,500,000 | 1,788,660 | ||||||
Massachusetts State Educational Financial Authority, Tender Option Bond Trust, Ser 2017-XG0139 | ||||||||
1.11%, 09/01/2040 (Acquired 06/14/2017 through 06/22/2017, Cost $905,000) (1) | 905,000 | 905,000 | ||||||
Massachusetts Transportation Trust Fund Metropolitan Highway System Revenue | ||||||||
5.00%, 01/01/2019 | 1,500,000 | 1,584,615 | ||||||
Massachusetts Water Resources Authority | ||||||||
5.00%, 08/01/2040 | 1,900,000 | 2,221,100 | ||||||
|
| |||||||
| 61,156,880 | ||||||||
|
| |||||||
Michigan - 3.16% | ||||||||
Avondale School District | ||||||||
5.00%, 11/01/2022 | 600,000 | 686,478 | ||||||
5.00%, 11/01/2023 | 680,000 | 787,828 | ||||||
5.00%, 11/01/2024 | 800,000 | 938,248 | ||||||
5.00%, 11/01/2025 | 785,000 | 925,099 | ||||||
5.00%, 11/01/2026 | 765,000 | 906,318 | ||||||
Calhoun County Hospital Finance Authority | ||||||||
5.00%, 02/15/2037 | 1,695,000 | 1,815,074 | ||||||
City of Detroit MI Sewage Disposal System Revenue | ||||||||
5.25%, 07/01/2039 | 4,050,000 | 4,471,038 | ||||||
City of Detroit MI Water Supply System Revenue | ||||||||
5.25%, 07/01/2041 | 1,000,000 | 1,090,220 | ||||||
City of Wyandotte MI Electric System Revenue | ||||||||
5.00%, 10/01/2021 | 750,000 | 834,150 | ||||||
5.00%, 10/01/2022 | 800,000 | 900,488 | ||||||
5.00%, 10/01/2023 | 500,000 | 568,650 | ||||||
5.00%, 10/01/2024 | 765,000 | 871,289 | ||||||
County of Kent MI | ||||||||
5.00%, 06/01/2028 | 700,000 | 850,101 | ||||||
Grand Rapids Public Schools | ||||||||
5.00%, 05/01/2025 | 1,075,000 | 1,296,977 | ||||||
Great Lakes Water Authority Sewage Disposal System Revenue | ||||||||
5.00%, 07/01/2030 | 3,000,000 | 3,413,790 | ||||||
5.00%, 07/01/2036 | 1,000,000 | 1,110,720 | ||||||
Lake Orion Community School District | ||||||||
5.00%, 05/01/2020 | 1,390,000 | 1,530,682 | ||||||
5.00%, 05/01/2021 | 1,385,000 | 1,567,571 | ||||||
Michigan Finance Authority | ||||||||
5.00%, 11/15/2019 | 75,000 | 81,204 | ||||||
5.00%, 11/15/2020 | 65,000 | 72,354 | ||||||
5.00%, 11/15/2021 | 175,000 | 199,474 | ||||||
5.00%, 11/15/2022 | 275,000 | 319,905 | ||||||
5.00%, 10/01/2024 | 3,000,000 | 3,653,070 | ||||||
5.00%, 10/01/2025 | 5,000,000 | 6,167,850 | ||||||
5.00%, 07/01/2030 | 600,000 | 683,286 | ||||||
5.00%, 07/01/2033 | 350,000 | 383,747 | ||||||
Michigan State Building Authority | ||||||||
5.00%, 10/15/2021 | 1,750,000 | 2,001,108 | ||||||
Michigan State Hospital Finance Authority | ||||||||
1.63%, 11/01/2027 | 3,255,000 | 3,256,823 | ||||||
1.40%, 11/15/2047 | 7,565,000 | 7,584,139 | ||||||
1.90%, 11/15/2047 | 3,000,000 | 3,022,680 | ||||||
2.40%, 11/15/2047 | 850,000 | 868,658 | ||||||
Michigan Strategic Fund | ||||||||
1.45%, 09/01/2030 | 1,260,000 | 1,240,924 | ||||||
Portage Public Schools | ||||||||
5.00%, 11/01/2028 | 1,000,000 | 1,188,030 | ||||||
State of Michigan | ||||||||
| Principal Amount | Value | |||||||
5.00%, 03/15/2020 | 1,670,000 | 1,831,489 | ||||||
5.00%, 03/15/2021 | 2,700,000 | 3,047,436 | ||||||
5.00%, 03/15/2022 | 4,050,000 | 4,685,810 | ||||||
5.00%, 03/15/2023 | 2,000,000 | 2,357,740 | ||||||
5.00%, 03/15/2027 | 1,000,000 | 1,237,250 | ||||||
Wayne County Airport Authority | ||||||||
5.00%, 12/01/2018 | 250,000 | 262,063 | ||||||
5.00%, 12/01/2019 | 200,000 | 216,604 | ||||||
5.00%, 12/01/2020 | 200,000 | 222,640 | ||||||
5.00%, 12/01/2021 | 475,000 | 542,735 | ||||||
5.00%, 12/01/2022 | 200,000 | 232,694 | ||||||
5.00%, 12/01/2023 | 400,000 | 471,772 | ||||||
5.00%, 12/01/2024 | 375,000 | 447,210 | ||||||
5.00%, 12/01/2027 | 4,055,000 | 4,712,153 | ||||||
5.00%, 12/01/2040 | 4,000,000 | 4,507,840 | ||||||
5.00%, 12/01/2042 | 1,000,000 | 1,095,380 | ||||||
|
| |||||||
| 81,158,789 | ||||||||
|
| |||||||
Minnesota - 0.95% | ||||||||
City of Minneapolis MN/St Paul Housing & Redevelopment Authority | ||||||||
5.00%, 11/15/2022 | 1,100,000 | 1,287,594 | ||||||
City of Moorhead MN | ||||||||
5.00%, 12/01/2025 | 775,000 | 891,893 | ||||||
City of North Oaks MN | ||||||||
5.00%, 10/01/2047 | 1,000,000 | 1,048,940 | ||||||
City of Rochester MN | ||||||||
5.00%, 12/01/2025 | 850,000 | 931,719 | ||||||
5.25%, 12/01/2038 | 1,000,000 | 1,049,810 | ||||||
State of Minnesota | ||||||||
5.00%, 08/01/2018 | 2,650,000 | 2,764,188 | ||||||
5.00%, 11/01/2018 | 1,830,000 | 1,926,185 | ||||||
5.00%, 12/01/2018 | 1,000,000 | 1,055,720 | ||||||
5.00%, 08/01/2019 | 2,875,000 | 3,103,764 | ||||||
5.00%, 08/01/2019 | 1,060,000 | 1,144,344 | ||||||
5.00%, 10/01/2019 | 2,685,000 | 2,914,380 | ||||||
5.00%, 03/01/2020 | 1,040,000 | 1,143,730 | ||||||
5.00%, 06/01/2020 | 2,345,000 | 2,599,151 | ||||||
5.00%, 08/01/2021 | 1,000,000 | 1,146,180 | ||||||
5.00%, 08/01/2026 | 1,000,000 | 1,253,340 | ||||||
|
| |||||||
| 24,260,938 | ||||||||
|
| |||||||
Mississippi - 0.56% | ||||||||
County of Warren MS | ||||||||
6.50%, 09/01/2032 | 300,000 | 317,214 | ||||||
State of Mississippi | ||||||||
3.00%, 10/15/2017 | 1,500,000 | 1,507,785 | ||||||
4.00%, 10/15/2018 | 2,100,000 | 2,173,878 | ||||||
5.00%, 10/15/2019 | 4,545,000 | 4,904,691 | ||||||
5.00%, 10/15/2020 | 1,750,000 | 1,940,242 | ||||||
5.00%, 10/15/2021 | 1,300,000 | 1,474,993 | ||||||
5.00%, 10/15/2022 | 1,750,000 | 2,021,023 | ||||||
|
| |||||||
| 14,339,826 | ||||||||
|
| |||||||
Missouri - 0.68% | ||||||||
City of St Louis MO Airport Revenue | ||||||||
5.00%, 07/01/2025 | 400,000 | 477,416 | ||||||
Health & Educational Facilities Authority of the State of Missouri | ||||||||
5.00%, 06/01/2022 | 2,335,000 | 2,685,273 | ||||||
5.00%, 02/01/2029 | 1,000,000 | 1,164,960 | ||||||
5.00%, 02/01/2035 | 1,000,000 | 1,093,160 | ||||||
5.00%, 02/01/2036 | 200,000 | 226,026 | ||||||
4.00%, 02/01/2040 | 100,000 | 101,864 | ||||||
5.00%, 08/01/2040 | 1,145,000 | 1,167,488 | ||||||
5.00%, 02/01/2045 | 300,000 | 335,865 | ||||||
| Principal Amount | Value | |||||||
Kirkwood Industrial Development Authority | ||||||||
5.00%, 05/15/2021 | 1,500,000 | 1,624,980 | ||||||
Missouri Highway & Transportation Commission | ||||||||
5.00%, 05/01/2018 | 2,990,000 | 3,088,820 | ||||||
Missouri State Health & Educational Facilities Authority | ||||||||
5.00%, 04/01/2027 | 500,000 | 589,420 | ||||||
St Louis County Industrial Development Authority | ||||||||
5.00%, 12/01/2025 | 1,185,000 | 1,241,216 | ||||||
5.13%, 08/15/2045 | 200,000 | 200,186 | ||||||
St Louis Land Clearance for Redevelopment Authority | ||||||||
5.00%, 06/01/2029 | 1,000,000 | 1,099,080 | ||||||
5.38%, 06/01/2043 | 2,000,000 | 2,169,600 | ||||||
University of Missouri | ||||||||
5.00%, 11/01/2019 | 175,000 | 190,458 | ||||||
|
| |||||||
| 17,455,812 | ||||||||
|
| |||||||
Montana - 0.05% | ||||||||
City of Kalispell MT | ||||||||
5.25%, 05/15/2037 | 765,000 | 796,617 | ||||||
5.25%, 05/15/2047 | 500,000 | 517,875 | ||||||
|
| |||||||
| 1,314,492 | ||||||||
|
| |||||||
Nebraska - 0.04% | ||||||||
Central Plains Energy Project | ||||||||
5.00%, 09/01/2019 | 915,000 | 986,626 | ||||||
|
| |||||||
Nevada - 0.96% | ||||||||
City of Las Vegas NV | ||||||||
5.00%, 09/01/2030 | 1,815,000 | 2,159,814 | ||||||
Clark County School District | ||||||||
5.00%, 06/15/2018 | 4,000,000 | 4,071,920 | ||||||
Clark County Water Reclamation District | ||||||||
5.00%, 07/01/2026 | 500,000 | 623,745 | ||||||
County of Clark Department of Aviation | ||||||||
5.00%, 07/01/2021 | 830,000 | 940,274 | ||||||
5.00%, 07/01/2022 | 400,000 | 462,228 | ||||||
5.00%, 07/01/2024 | 1,250,000 | 1,488,875 | ||||||
5.00%, 07/01/2025 | 2,220,000 | 2,671,170 | ||||||
County of Clark NV | ||||||||
5.00%, 11/01/2028 | 3,000,000 | 3,659,010 | ||||||
5.00%, 11/01/2032 | 3,000,000 | 3,504,060 | ||||||
County of Washoe NV | ||||||||
1.50%, 08/01/2031 | 1,000,000 | 989,570 | ||||||
3.00%, 03/01/2036 | 700,000 | 731,528 | ||||||
Las Vegas Valley Water District | ||||||||
5.00%, 06/01/2039 | 2,815,000 | 3,259,010 | ||||||
|
| |||||||
| 24,561,204 | ||||||||
|
| |||||||
New Hampshire - 0.36% | ||||||||
New Hampshire Business Finance Authority | ||||||||
4.00%, 01/01/2018 | 545,000 | 551,147 | ||||||
4.00%, 01/01/2019 | 565,000 | 583,063 | ||||||
5.00%, 01/01/2024 | 720,000 | 826,690 | ||||||
New Hampshire Health and Education Facilities Authority Act | ||||||||
3.50%, 07/01/2022 (Acquired 06/07/2017, Cost $100,000) (1)(2)(4) | 100,000 | 99,909 | ||||||
4.13%, 07/01/2024 (Acquired 06/07/2017, Cost $255,000) (1)(2)(4) | 255,000 | 254,615 | ||||||
5.25%, 07/01/2027 (Acquired 06/07/2017, Cost $100,000) (1)(2)(4) | 100,000 | 99,769 | ||||||
5.00%, 10/01/2028 (2)(4) | 1,580,000 | 1,815,325 | ||||||
5.00%, 10/01/2032 (2)(4) | 2,825,000 | 3,171,034 | ||||||
6.13%, 07/01/2037 (Acquired 06/07/2017, Cost $100,000) (1)(2)(4) | 100,000 | 100,110 | ||||||
4.00%, 10/01/2038 (2)(4) | 115,000 | 117,041 | ||||||
5.00%, 10/01/2038 (2)(4) | 300,000 | 330,999 | ||||||
6.25%, 07/01/2042 (Acquired 06/07/2017 through 06/12/2017, Cost $700,000) (1)(2)(4) | 700,000 | 705,677 | ||||||
6.13%, 07/01/2052 (Acquired 06/07/2017 through 06/14/2017, Cost $485,690) (1)(2)(4) | 495,000 | 490,412 | ||||||
|
| |||||||
| 9,145,791 | ||||||||
|
| |||||||
| Principal Amount | Value | |||||||
New Jersey - 3.49% | ||||||||
Borough of Belmar NJ | ||||||||
3.00%, 02/09/2018 | 2,600,000 | 2,626,078 | ||||||
Borough of Carteret NJ | ||||||||
2.50%, 06/01/2018 | 4,050,000 | 4,097,344 | ||||||
Borough of Collingswood NJ | ||||||||
2.50%, 03/22/2018 | 1,200,000 | 1,210,104 | ||||||
Borough of Paulsboro NJ | ||||||||
2.25%, 04/12/2018 | 1,000,000 | 1,006,310 | ||||||
Burlington County Bridge Commission | ||||||||
5.63%, 01/01/2038 | 750,000 | 757,462 | ||||||
City of East Orange NJ | ||||||||
2.50%, 03/26/2018 | 2,636,500 | 2,659,622 | ||||||
City of New Brunswick NJ | ||||||||
2.00%, 06/04/2018 | 2,457,000 | 2,475,894 | ||||||
New Brunswick Parking Authority | ||||||||
5.00%, 09/01/2039 | 2,000,000 | 2,300,720 | ||||||
New Jersey Economic Development Authority | ||||||||
5.00%, 06/15/2019 | 4,500,000 | 4,710,105 | ||||||
4.00%, 01/01/2020 | 115,000 | 119,442 | ||||||
5.00%, 01/01/2023 | 400,000 | 457,360 | ||||||
5.00%, 03/01/2023 | 4,045,000 | 4,327,867 | ||||||
5.00%, 03/01/2024 | 2,405,000 | 2,528,449 | ||||||
5.00%, 06/15/2024 | 2,000,000 | 2,145,180 | ||||||
5.00%, 06/15/2025 | 5,190,000 | 5,561,915 | ||||||
5.50%, 01/01/2027 | 500,000 | 582,140 | ||||||
5.63%, 11/15/2030 | 2,095,000 | 2,360,772 | ||||||
5.00%, 01/01/2031 | 500,000 | 561,675 | ||||||
5.25%, 01/01/2044 | 190,000 | 195,569 | ||||||
5.63%, 01/01/2052 | 2,000,000 | 2,254,580 | ||||||
New Jersey Educational Facilities Authority | ||||||||
5.00%, 07/01/2020 | 375,000 | 417,379 | ||||||
5.00%, 07/01/2021 | 225,000 | 257,992 | ||||||
5.00%, 06/01/2023 | 930,000 | 998,141 | ||||||
5.00%, 07/01/2023 | 3,390,000 | 3,882,804 | ||||||
New Jersey Health Care Facilities Financing Authority | ||||||||
5.00%, 07/01/2019 | 1,225,000 | 1,302,873 | ||||||
5.00%, 07/01/2021 | 40,000 | 44,543 | ||||||
5.00%, 07/01/2022 | 540,000 | 611,031 | ||||||
5.00%, 07/01/2023 | 140,000 | 160,268 | ||||||
5.00%, 07/01/2024 | 2,500,000 | 2,835,175 | ||||||
5.00%, 07/01/2024 | 110,000 | 127,222 | ||||||
5.00%, 07/01/2025 | 1,580,000 | 1,779,080 | ||||||
5.00%, 07/01/2025 | 120,000 | 139,520 | ||||||
5.00%, 07/01/2026 | 40,000 | 46,534 | ||||||
5.00%, 07/01/2027 | 60,000 | 69,034 | ||||||
5.00%, 07/01/2028 | 155,000 | 182,060 | ||||||
5.00%, 07/01/2030 | 165,000 | 185,293 | ||||||
5.00%, 07/01/2031 | 430,000 | 470,459 | ||||||
5.63%, 07/01/2032 | 380,000 | 444,448 | ||||||
5.00%, 07/01/2033 | 500,000 | 562,735 | ||||||
5.00%, 07/01/2046 | 1,000,000 | 1,092,790 | ||||||
New Jersey Higher Education Student Assistance Authority | ||||||||
5.00%, 12/01/2019 | 500,000 | 534,645 | ||||||
5.50%, 12/01/2021 | 2,000,000 | 2,266,480 | ||||||
5.00%, 12/01/2044 | 1,000,000 | 1,043,330 | ||||||
New Jersey Transportation Trust Fund Authority | ||||||||
5.00%, 06/15/2020 | 1,325,000 | 1,410,993 | ||||||
5.00%, 06/15/2022 | 750,000 | 815,528 | ||||||
5.25%, 12/15/2022 | 1,760,000 | 1,915,918 | ||||||
5.00%, 12/15/2023 | 2,700,000 | 2,915,541 | ||||||
| Principal Amount | Value | |||||||
5.25%, 12/15/2023 | 3,690,000 | 4,037,192 | ||||||
5.00%, 06/15/2025 | 450,000 | 477,976 | ||||||
0.00%, 12/15/2026 | 2,600,000 | 1,725,490 | ||||||
5.00%, 06/15/2027 | 235,000 | 256,390 | ||||||
5.00%, 06/15/2029 | 1,200,000 | 1,288,500 | ||||||
0.00%, 12/15/2030 | 2,000,000 | 1,125,980 | ||||||
New Jersey Turnpike Authority | ||||||||
5.00%, 01/01/2020 | 1,220,000 | 1,330,081 | ||||||
Tobacco Settlement Financing Corp./NJ | ||||||||
4.50%, 06/01/2023 | 965,000 | 967,123 | ||||||
4.63%, 06/01/2026 | 2,500,000 | 2,501,975 | ||||||
4.75%, 06/01/2034 | 1,000,000 | 985,740 | ||||||
5.00%, 06/01/2041 | 4,470,000 | 4,378,186 | ||||||
Township of West Deptford NJ | ||||||||
2.25%, 04/12/2018 | 1,000,000 | 1,006,310 | ||||||
|
| |||||||
| 89,531,347 | ||||||||
|
| |||||||
New Mexico - 0.33% | ||||||||
Albuquerque Municipal School District No 12 | ||||||||
5.00%, 08/01/2025 | 800,000 | 984,040 | ||||||
Farmington Municipal School District No 5/NM | ||||||||
5.00%, 09/01/2024 | 490,000 | 592,224 | ||||||
New Mexico Mortgage Finance Authority | ||||||||
1.35%, 06/01/2020 | 3,000,000 | 2,992,410 | ||||||
Town of Clayton NM | ||||||||
4.00%, 11/01/2020 | 3,545,000 | 3,770,356 | ||||||
|
| |||||||
| 8,339,030 | ||||||||
|
| |||||||
New York - 10.41% | ||||||||
Binghamton City School District | ||||||||
2.50%, 11/17/2017 | 800,000 | 803,976 | ||||||
Brooklyn Arena Local Development Corp. | ||||||||
5.00%, 07/15/2017 | 50,000 | 50,047 | ||||||
5.00%, 07/15/2020 | 140,000 | 155,802 | ||||||
5.00%, 07/15/2021 | 300,000 | 342,375 | ||||||
5.00%, 07/15/2022 | 175,000 | 203,066 | ||||||
5.00%, 07/15/2023 | 150,000 | 175,794 | ||||||
5.00%, 07/15/2024 | 250,000 | 295,687 | ||||||
Build NYC Resource Corp. | ||||||||
5.00%, 08/01/2022 | 200,000 | 228,682 | ||||||
5.00%, 08/01/2023 | 230,000 | 266,400 | ||||||
5.00%, 01/01/2035 (Acquired 09/23/2015, Cost $3,157,346) (1) | 3,000,000 | 3,228,600 | ||||||
Canton Central School District | ||||||||
2.25%, 06/29/2018 | 700,000 | 706,734 | ||||||
Chautauqua County Capital Resource Corp. | ||||||||
1.30%, 11/01/2031 | 1,100,000 | 1,105,324 | ||||||
City of Binghamton NY | ||||||||
2.50%, 04/20/2018 | 5,647,617 | 5,705,336 | ||||||
City of New York NY | ||||||||
5.00%, 08/01/2017 | 6,365,000 | 6,383,522 | ||||||
4.00%, 08/01/2018 | 1,165,000 | 1,202,327 | ||||||
5.00%, 08/01/2018 | 3,850,000 | 4,014,241 | ||||||
5.00%, 08/01/2021 | 6,000,000 | 6,861,720 | ||||||
5.00%, 08/01/2022 | 1,065,000 | 1,245,720 | ||||||
1.46%, 08/01/2025 | 500,000 | 499,435 | ||||||
5.00%, 08/01/2027 | 400,000 | 479,856 | ||||||
5.00%, 08/01/2027 | 2,975,000 | 3,604,926 | ||||||
5.00%, 08/01/2028 | 3,975,000 | 4,790,471 | ||||||
5.00%, 08/01/2028 | 5,675,000 | 6,831,111 | ||||||
5.00%, 08/01/2028 | 700,000 | 850,073 | ||||||
0.91%, 08/01/2034 | 5,000,000 | 5,000,000 | ||||||
City of Yonkers NY | ||||||||
2.25%, 11/17/2017 | 3,100,000 | 3,110,137 | ||||||
| Principal Amount | Value | |||||||
4.00%, 07/01/2018 | 2,000,000 | 2,056,320 | ||||||
5.00%, 09/01/2022 | 2,350,000 | 2,728,467 | ||||||
5.00%, 09/01/2025 | 1,015,000 | 1,224,344 | ||||||
Copiague Union Free School District | ||||||||
2.25%, 03/30/2018 | 3,600,000 | 3,627,324 | ||||||
County of Broome NY | ||||||||
2.50%, 05/04/2018 | 4,400,000 | 4,447,520 | ||||||
County of Erie NY | ||||||||
5.00%, 09/15/2017 | 550,000 | 554,323 | ||||||
5.00%, 06/01/2018 | 500,000 | 518,110 | ||||||
5.00%, 09/15/2018 | 365,000 | 382,159 | ||||||
5.00%, 06/01/2019 | 1,000,000 | 1,072,640 | ||||||
5.00%, 09/15/2019 | 500,000 | 541,080 | ||||||
5.00%, 06/01/2020 | 500,000 | 553,130 | ||||||
5.00%, 09/15/2020 | 350,000 | 390,586 | ||||||
5.00%, 06/01/2021 | 750,000 | 852,495 | ||||||
5.00%, 09/15/2021 | 225,000 | 257,661 | ||||||
5.00%, 06/01/2025 | 1,000,000 | 1,222,360 | ||||||
County of Rockland NY | ||||||||
2.50%, 03/22/2018 | 600,000 | 604,710 | ||||||
4.00%, 01/01/2021 | 1,100,000 | 1,186,449 | ||||||
County of Suffolk NY | ||||||||
2.00%, 07/26/2017 | 13,400,000 | 13,408,308 | ||||||
Dutchess County Local Development Corp. | ||||||||
5.00%, 07/01/2033 | 400,000 | 453,836 | ||||||
Glen Cove Local Economic Assistance Corp. | ||||||||
0.00%, 01/01/2045 | 530,000 | 130,306 | ||||||
0.00%, 01/01/2055 | 710,000 | 533,011 | ||||||
5.00%, 01/01/2056 | 485,000 | 493,429 | ||||||
Hudson Yards Infrastructure Corp. | ||||||||
5.00%, 02/15/2035 | 1,700,000 | 1,989,680 | ||||||
Long Island Power Authority | ||||||||
5.00%, 09/01/2024 | 2,735,000 | 3,166,692 | ||||||
Lyons Central School District | ||||||||
2.25%, 06/29/2018 | 600,000 | 605,598 | ||||||
Metropolitan Transportation Authority | ||||||||
5.00%, 11/15/2019 | 1,290,000 | 1,403,004 | ||||||
5.00%, 11/15/2019 | 2,005,000 | 2,180,638 | ||||||
5.00%, 11/15/2020 | 2,000,000 | 2,240,260 | ||||||
5.00%, 11/15/2021 | 500,000 | 574,465 | ||||||
5.00%, 11/15/2021 | 640,000 | 735,315 | ||||||
1.36%, 11/01/2026 | 3,000,000 | 2,999,040 | ||||||
1.33%, 11/01/2032 | 1,000,000 | 1,001,000 | ||||||
MTA Hudson Rail Yards Trust Obligations | ||||||||
5.00%, 11/15/2051 | 1,500,000 | 1,628,040 | ||||||
Nassau County Industrial Development Agency | ||||||||
6.50%, 01/01/2034 | 627,500 | 640,245 | ||||||
6.70%, 01/01/2049 | 293,750 | 295,468 | ||||||
New York City Industrial Development Agency | ||||||||
5.00%, 07/01/2019 | 1,000,000 | 1,058,930 | ||||||
New York City Transitional Finance Authority Future Tax Secured Revenue | ||||||||
5.00%, 11/01/2018 | 1,650,000 | 1,736,278 | ||||||
5.00%, 02/01/2019 | 1,000,000 | 1,061,160 | ||||||
5.00%, 11/01/2021 | 1,000,000 | 1,153,090 | ||||||
1.00%, 11/01/2022 | 1,550,000 | 1,550,000 | ||||||
1.20%, 11/01/2022 | 5,260,000 | 5,260,000 | ||||||
5.00%, 11/01/2028 | 1,500,000 | 1,806,285 | ||||||
5.00%, 11/01/2029 | 2,000,000 | 2,368,660 | ||||||
5.00%, 02/01/2030 | 4,480,000 | 5,323,853 | ||||||
5.00%, 02/01/2041 | 200,000 | 228,648 | ||||||
New York City Water & Sewer System | ||||||||
| Principal Amount | Value | |||||||
5.00%, 06/15/2031 | 6,075,000 | 7,201,183 | ||||||
1.02%, 06/15/2032 | 3,000,000 | 3,000,000 | ||||||
5.25%, 06/15/2047 | 1,250,000 | 1,484,263 | ||||||
New York Convention Center Development Corp. | ||||||||
5.00%, 11/15/2033 | 3,000,000 | 3,510,660 | ||||||
New York Liberty Development Corp. | ||||||||
5.25%, 10/01/2035 | 2,285,000 | 2,845,213 | ||||||
5.38%, 11/15/2040 (Acquired 09/15/2015, Cost $1,559,617) (1) | 1,500,000 | 1,654,395 | ||||||
5.00%, 11/15/2044 (Acquired 09/18/2015, Cost $1,509,178) (1) | 1,500,000 | 1,613,535 | ||||||
5.75%, 11/15/2051 | 2,000,000 | 2,293,480 | ||||||
New York State Dormitory Authority | ||||||||
5.00%, 03/15/2018 | 4,000,000 | 4,114,760 | ||||||
5.00%, 08/15/2018 | 1,425,000 | 1,489,766 | ||||||
4.00%, 12/01/2018 (Acquired 02/08/2017, Cost $307,992) (1) | 300,000 | 308,001 | ||||||
5.00%, 03/15/2019 | 3,500,000 | 3,734,220 | ||||||
4.00%, 12/01/2019 (Acquired 02/08/2017, Cost $518,652) (1) | 500,000 | 521,180 | ||||||
5.00%, 03/15/2021 | 2,000,000 | 2,270,500 | ||||||
4.00%, 12/01/2021 (Acquired 02/08/2017, Cost $524,523) (1) | 500,000 | 533,660 | ||||||
5.00%, 07/01/2022 | 250,000 | 291,492 | ||||||
5.00%, 12/01/2022 (Acquired 02/08/2017, Cost $990,250) (1) | 900,000 | 1,013,517 | ||||||
5.00%, 07/01/2023 | 250,000 | 296,768 | ||||||
5.00%, 12/15/2023 | 1,000,000 | 1,181,650 | ||||||
5.00%, 05/01/2024 | 4,870,000 | 5,810,592 | ||||||
5.00%, 07/01/2024 | 250,000 | 301,750 | ||||||
5.00%, 07/01/2025 | 250,000 | 305,310 | ||||||
5.00%, 03/15/2027 | 2,500,000 | 3,008,450 | ||||||
5.00%, 10/01/2028 | 1,735,000 | 2,131,569 | ||||||
5.00%, 10/01/2029 | 1,430,000 | 1,743,828 | ||||||
5.00%, 10/01/2030 | 1,910,000 | 2,311,940 | ||||||
5.00%, 02/15/2031 | 5,000,000 | 5,975,050 | ||||||
5.25%, 03/15/2033 | 5,000,000 | 5,988,050 | ||||||
New York State Environmental Facilities Corp. | ||||||||
5.00%, 06/15/2019 | 2,300,000 | 2,474,156 | ||||||
5.00%, 06/15/2021 | 2,550,000 | 2,918,756 | ||||||
New York State Thruway Authority | ||||||||
5.00%, 05/01/2019 | 25,325,000 | 27,065,587 | ||||||
New York State Urban Development Corp. | ||||||||
5.00%, 12/15/2019 | 625,000 | 683,081 | ||||||
5.00%, 03/15/2020 | 3,215,000 | 3,535,793 | ||||||
5.00%, 03/15/2021 | 500,000 | 565,495 | ||||||
5.00%, 03/15/2023 | 700,000 | 828,128 | ||||||
5.00%, 03/15/2024 | 400,000 | 481,744 | ||||||
5.00%, 03/15/2035 | 2,800,000 | 3,213,896 | ||||||
New York Transportation Development Corp. | ||||||||
5.00%, 01/01/2023 | 125,000 | 142,925 | ||||||
5.00%, 08/01/2026 | 1,000,000 | 1,073,280 | ||||||
5.00%, 08/01/2031 | 3,475,000 | 3,698,165 | ||||||
5.00%, 07/01/2041 | 2,300,000 | 2,496,581 | ||||||
5.00%, 07/01/2046 | 800,000 | 863,248 | ||||||
Port Authority of New York & New Jersey | ||||||||
5.00%, 09/01/2017 | 3,000,000 | 3,018,600 | ||||||
5.00%, 10/15/2033 | 3,500,000 | 4,013,415 | ||||||
Sales Tax Asset Receivable Corp. | ||||||||
5.00%, 10/15/2017 | 1,500,000 | 1,517,160 | ||||||
Suffolk County Economic Development Corp. | ||||||||
5.00%, 07/01/2028 | 300,000 | 342,732 | ||||||
5.00%, 07/01/2028 | 1,750,000 | 1,905,278 | ||||||
Tompkins County Development Corp. | ||||||||
5.00%, 07/01/2044 | 125,000 | 130,308 | ||||||
Town of Oyster Bay NY | ||||||||
4.00%, 06/01/2018 | 500,000 | 508,915 | ||||||
| Principal Amount | Value | |||||||
TSASC, Inc./NY | ||||||||
5.00%, 06/01/2024 | 800,000 | 932,128 | ||||||
Upper Mohawk Valley Regional Water Finance Authority | ||||||||
5.00%, 04/01/2019 | 500,000 | 532,450 | ||||||
Wappingers Central School District | ||||||||
1.50%, 10/31/2017 | 500,000 | 500,670 | ||||||
Westchester County Local Development Corp. | ||||||||
5.50%, 05/01/2042 | 150,000 | 166,038 | ||||||
|
| |||||||
| 266,929,590 | ||||||||
|
| |||||||
North Carolina - 2.41% | ||||||||
Charlotte-Mecklenburg Hospital Authority/The | ||||||||
5.00%, 01/15/2031 | 1,500,000 | 1,688,220 | ||||||
City of Charlotte NC | ||||||||
5.00%, 07/01/2020 | 2,000,000 | 2,224,140 | ||||||
City of Charlotte NC Airport Revenue | ||||||||
5.00%, 07/01/2022 | 1,310,000 | 1,508,373 | ||||||
County of Forsyth NC | ||||||||
5.00%, 03/01/2021 | 860,000 | 976,109 | ||||||
County of Guilford NC | ||||||||
5.00%, 02/01/2019 | 1,585,000 | 1,683,207 | ||||||
County of Mecklenburg NC | ||||||||
5.00%, 08/01/2018 | 3,000,000 | 3,129,600 | ||||||
5.00%, 12/01/2021 | 2,050,000 | 2,374,474 | ||||||
County of New Hanover NC | ||||||||
5.00%, 10/01/2021 | 1,000,000 | 1,142,220 | ||||||
5.00%, 10/01/2022 | 1,000,000 | 1,165,180 | ||||||
5.00%, 10/01/2023 | 1,125,000 | 1,330,605 | ||||||
5.00%, 10/01/2034 | 1,000,000 | 1,162,650 | ||||||
County of Wake NC | ||||||||
5.00%, 03/01/2020 | 1,515,000 | 1,667,772 | ||||||
5.00%, 09/01/2021 | 350,000 | 402,640 | ||||||
5.00%, 12/01/2027 | 3,785,000 | 4,695,217 | ||||||
Mecklenburg County Public Facilities Corp. | ||||||||
5.00%, 03/01/2024 | 2,600,000 | 2,766,478 | ||||||
North Carolina Capital Facilities Finance Agency | ||||||||
5.00%, 06/01/2019 | 500,000 | 536,810 | ||||||
5.00%, 06/01/2021 | 500,000 | 554,250 | ||||||
1.30%, 06/01/2038 | 500,000 | 499,950 | ||||||
North Carolina Eastern Municipal Power Agency | ||||||||
5.00%, 01/01/2020 | 1,000,000 | 1,057,940 | ||||||
5.00%, 01/01/2021 | 1,420,000 | 1,502,275 | ||||||
5.00%, 01/01/2021 | 1,965,000 | 2,216,323 | ||||||
5.00%, 01/01/2026 | 5,000,000 | 5,289,700 | ||||||
North Carolina Medical Care Commission | ||||||||
4.00%, 10/01/2019 | 15,000 | 15,582 | ||||||
5.00%, 10/01/2020 | 20,000 | 21,609 | ||||||
5.00%, 10/01/2021 | 25,000 | 27,370 | ||||||
5.00%, 10/01/2022 | 40,000 | 44,113 | ||||||
5.00%, 10/01/2023 | 30,000 | 33,119 | ||||||
5.00%, 10/01/2024 | 35,000 | 38,611 | ||||||
5.00%, 10/01/2025 | 25,000 | 27,456 | ||||||
5.00%, 10/01/2030 | 400,000 | 456,476 | ||||||
5.00%, 10/01/2030 | 2,100,000 | 2,204,412 | ||||||
5.00%, 10/01/2031 | 225,000 | 255,229 | ||||||
6.25%, 07/01/2035 | 1,000,000 | 1,134,080 | ||||||
0.88%, 10/01/2035 | 1,400,000 | 1,400,000 | ||||||
5.00%, 10/01/2036 (2)(4) | 330,000 | 384,532 | ||||||
5.00%, 09/01/2037 | 2,000,000 | 2,071,600 | ||||||
5.00%, 10/01/2037 | 250,000 | 257,438 | ||||||
4.88%, 07/01/2040 | 550,000 | 570,806 | ||||||
North Carolina Municipal Power Agency No 1 | ||||||||
| Principal Amount | Value | |||||||
5.00%, 01/01/2020 | 1,100,000 | 1,203,499 | ||||||
5.00%, 01/01/2025 | 2,935,000 | 3,105,054 | ||||||
5.00%, 01/01/2026 | 2,515,000 | 2,660,719 | ||||||
North Carolina Turnpike Authority | ||||||||
5.00%, 01/01/2020 | 350,000 | 378,711 | ||||||
5.00%, 01/01/2027 | 530,000 | 639,291 | ||||||
5.00%, 01/01/2032 | 1,000,000 | 1,156,900 | ||||||
5.00%, 07/01/2051 | 1,700,000 | 1,833,909 | ||||||
State of North Carolina | ||||||||
5.00%, 05/01/2018 | 800,000 | 826,712 | ||||||
5.00%, 06/01/2020 | 1,360,000 | 1,509,450 | ||||||
|
| |||||||
| 61,830,811 | ||||||||
|
| |||||||
Ohio - 1.78% | ||||||||
Akron Bath Copley Joint Township Hospital District | ||||||||
5.25%, 11/15/2031 | 530,000 | 612,144 | ||||||
5.25%, 11/15/2032 | 645,000 | 741,047 | ||||||
5.25%, 11/15/2033 | 1,770,000 | 2,024,420 | ||||||
American Municipal Power, Inc. | ||||||||
5.00%, 02/15/2046 | 740,000 | 835,356 | ||||||
Buckeye Tobacco Settlement Financing Authority | ||||||||
6.50%, 06/01/2047 | 3,000,000 | 3,005,700 | ||||||
City of Cleveland OH Airport System Revenue | ||||||||
5.25%, 01/01/2018 | 1,215,000 | 1,238,413 | ||||||
City of Columbus OH | ||||||||
5.00%, 07/01/2020 | 1,040,000 | 1,154,608 | ||||||
City of Lakewood OH | ||||||||
2.00%, 04/02/2018 | 1,400,000 | 1,409,072 | ||||||
City of Trenton OH Water System Revenue | ||||||||
2.00%, 12/01/2017 | 285,000 | 285,499 | ||||||
2.00%, 12/01/2018 | 265,000 | 266,168 | ||||||
Clermont County Port Authority | ||||||||
5.00%, 12/01/2029 | 750,000 | 864,870 | ||||||
5.00%, 12/01/2030 | 850,000 | 975,417 | ||||||
5.00%, 12/01/2031 | 650,000 | 742,794 | ||||||
County of Belmont OH | ||||||||
1.38%, 08/31/2017 | 400,000 | 400,020 | ||||||
County of Cuyahoga OH | ||||||||
5.00%, 12/01/2026 | 2,500,000 | 2,928,500 | ||||||
5.50%, 02/15/2052 | 1,000,000 | 1,105,200 | ||||||
5.50%, 02/15/2057 | 1,000,000 | 1,095,230 | ||||||
County of Hamilton OH | ||||||||
4.00%, 01/01/2021 | 450,000 | 478,751 | ||||||
5.00%, 01/01/2022 | 465,000 | 519,484 | ||||||
Miami University/Oxford OH | ||||||||
5.00%, 09/01/2034 | 700,000 | 820,470 | ||||||
Ohio Air Quality Development Authority | ||||||||
3.75%, 12/01/2023 | 2,000,000 | 866,180 | ||||||
Ohio Housing Finance Agency | ||||||||
0.85%, 08/01/2017 | 2,000,000 | 1,999,720 | ||||||
Ohio Water Development Authority | ||||||||
4.00%, 12/01/2033 | 2,285,000 | 994,683 | ||||||
Southeastern Ohio Port Authority | ||||||||
5.75%, 12/01/2032 | 445,000 | 490,430 | ||||||
6.00%, 12/01/2042 | 550,000 | 608,493 | ||||||
5.50%, 12/01/2043 | 1,000,000 | 1,079,960 | ||||||
State of Ohio | ||||||||
4.00%, 09/01/2021 | 3,980,000 | 4,407,890 | ||||||
1.70%, 11/01/2022 | 3,000,000 | 3,004,260 | ||||||
University of Akron/The | ||||||||
5.00%, 01/01/2037 | 6,675,000 | 7,573,388 | ||||||
University of Cincinnati | ||||||||
| Principal Amount | Value | |||||||
5.00%, 06/01/2027 | 2,000,000 | 2,423,480 | ||||||
5.00%, 06/01/2028 | 250,000 | 304,030 | ||||||
5.00%, 06/01/2029 | 400,000 | 482,556 | ||||||
|
| |||||||
| 45,738,233 | ||||||||
|
| |||||||
Oklahoma - 0.91% | ||||||||
Canadian County Educational Facilities Authority | ||||||||
4.00%, 09/01/2025 | 1,500,000 | 1,686,180 | ||||||
5.00%, 09/01/2027 | 1,000,000 | 1,194,330 | ||||||
5.00%, 09/01/2028 | 1,000,000 | 1,182,710 | ||||||
Canadian County Oklahoma Educational Facilities | ||||||||
5.00%, 09/01/2026 | 1,395,000 | 1,687,587 | ||||||
Cleveland County Educational Facilities Authority | ||||||||
5.00%, 07/01/2018 | 1,000,000 | 1,037,440 | ||||||
5.00%, 06/01/2023 | 500,000 | 585,240 | ||||||
Dewey County Educational Facilities Authority | ||||||||
5.00%, 09/01/2030 | 2,470,000 | 2,871,326 | ||||||
Garvin County Educational Facilities Authority | ||||||||
4.00%, 09/01/2017 | 500,000 | 502,245 | ||||||
5.00%, 12/01/2024 | 515,000 | 606,840 | ||||||
5.00%, 12/01/2025 | 545,000 | 645,405 | ||||||
5.00%, 12/01/2026 | 320,000 | 379,872 | ||||||
Norman Regional Hospital Authority | ||||||||
4.00%, 09/01/2018 | 125,000 | 128,035 | ||||||
5.00%, 09/01/2020 | 350,000 | 381,132 | ||||||
5.00%, 09/01/2021 | 325,000 | 361,192 | ||||||
5.00%, 09/01/2022 | 325,000 | 367,569 | ||||||
Oklahoma County Finance Authority | ||||||||
5.70%, 04/01/2025 | 595,000 | 595,738 | ||||||
5.13%, 04/01/2042 | 1,900,000 | 1,898,518 | ||||||
Oklahoma Development Finance Authority | ||||||||
3.00%, 06/01/2022 | 1,015,000 | 1,076,316 | ||||||
4.00%, 12/01/2022 | 530,000 | 590,632 | ||||||
4.00%, 06/01/2023 | 1,305,000 | 1,458,090 | ||||||
3.00%, 06/01/2024 | 1,750,000 | 1,851,850 | ||||||
4.00%, 06/01/2024 | 380,000 | 427,724 | ||||||
Tulsa County Industrial Authority | ||||||||
1.30%, 05/01/2020 | 1,000,000 | 1,001,430 | ||||||
5.00%, 11/15/2023 | 230,000 | 256,864 | ||||||
5.00%, 11/15/2029 | 400,000 | 436,000 | ||||||
|
| |||||||
| 23,210,265 | ||||||||
|
| |||||||
Oregon - 0.48% | ||||||||
County of Washington OR | ||||||||
5.00%, 03/01/2022 | 3,000,000 | 3,493,620 | ||||||
Klamath Falls Intercommunity Hospital Authority | ||||||||
5.00%, 09/01/2031 | 200,000 | 230,762 | ||||||
5.00%, 09/01/2032 | 270,000 | 309,903 | ||||||
5.00%, 09/01/2046 | 1,000,000 | 1,119,060 | ||||||
Port of Portland OR Airport Revenue | ||||||||
5.00%, 07/01/2032 | 1,000,000 | 1,138,030 | ||||||
5.00%, 07/01/2033 | 3,485,000 | 3,954,220 | ||||||
State of Oregon Department of Transportation | ||||||||
5.00%, 11/15/2023 | 2,000,000 | 2,143,060 | ||||||
|
| |||||||
| 12,388,655 | ||||||||
|
| |||||||
Pennsylvania - 5.89% | �� | |||||||
Allentown Pennsylvania Neighborhood Improvement Refunding Project | ||||||||
5.00%, 05/01/2032 | 1,275,000 | 1,346,846 | ||||||
Capital Region Water | ||||||||
5.00%, 07/15/2023 | 1,750,000 | 2,057,457 | ||||||
Capital Region Water Sewer Revenue | ||||||||
5.00%, 07/15/2024 | 430,000 | 511,051 | ||||||
5.00%, 07/15/2028 | 350,000 | 420,287 | ||||||
| Principal Amount | Value | |||||||
Central Greene School District | ||||||||
5.00%, 02/15/2018 | 860,000 | 880,958 | ||||||
City of Philadelphia PA | ||||||||
5.00%, 08/01/2017 | 2,000,000 | 2,005,480 | ||||||
5.00%, 08/01/2023 | 4,000,000 | 4,655,280 | ||||||
5.00%, 07/15/2026 | 2,475,000 | 2,856,645 | ||||||
5.00%, 08/01/2028 | 6,000,000 | 6,975,600 | ||||||
Coatesville School District | ||||||||
5.00%, 08/01/2025 | 900,000 | 1,071,450 | ||||||
Commonwealth Financing Authority | ||||||||
5.00%, 06/01/2025 | 1,500,000 | 1,809,150 | ||||||
Commonwealth of Pennsylvania | ||||||||
5.00%, 02/01/2020 | 2,050,000 | 2,237,227 | ||||||
5.00%, 11/01/2020 | 2,800,000 | 3,075,968 | ||||||
5.00%, 02/01/2021 | 1,400,000 | 1,570,702 | ||||||
5.00%, 08/15/2021 | 1,015,000 | 1,154,278 | ||||||
5.00%, 11/01/2021 | 2,000,000 | 2,244,400 | ||||||
5.00%, 02/01/2022 | 1,470,000 | 1,686,575 | ||||||
5.00%, 09/15/2022 | 1,750,000 | 2,033,868 | ||||||
5.00%, 02/01/2023 | 1,440,000 | 1,680,638 | ||||||
5.00%, 03/15/2023 | 9,970,000 | 11,664,800 | ||||||
5.00%, 02/01/2024 | 1,620,000 | 1,917,772 | ||||||
5.00%, 09/15/2026 | 1,000,000 | 1,209,610 | ||||||
5.00%, 03/15/2031 | 430,000 | 494,393 | ||||||
County of Allegheny PA | ||||||||
4.00%, 12/01/2017 | 3,725,000 | 3,771,004 | ||||||
Cumberland County Municipal Authority | ||||||||
5.25%, 01/01/2041 | 170,000 | 172,847 | ||||||
Dauphin County General Authority | ||||||||
5.00%, 06/01/2020 | 815,000 | 894,251 | ||||||
Delaware County Authority | ||||||||
5.00%, 08/01/2030 | 1,150,000 | 1,332,482 | ||||||
Delaware River Joint Toll Bridge Commission | ||||||||
5.00%, 07/01/2042 | 1,100,000 | 1,269,114 | ||||||
Delaware Valley Regional Finance Authority | ||||||||
5.75%, 07/01/2017 | 3,000,000 | 3,000,000 | ||||||
Doylestown Hospital Authority | ||||||||
5.00%, 07/01/2046 | 3,700,000 | 3,988,563 | ||||||
Lancaster County Hospital Authority/PA | ||||||||
5.00%, 07/01/2023 | 775,000 | 861,583 | ||||||
5.00%, 07/01/2031 | 450,000 | 484,956 | ||||||
5.00%, 07/01/2045 | 1,970,000 | 2,103,527 | ||||||
Montgomery County Higher Education & Health Authority | ||||||||
5.00%, 10/01/2023 (2)(4) | 50,000 | 57,330 | ||||||
5.00%, 10/01/2028 (2)(4) | 1,000,000 | 1,116,620 | ||||||
5.00%, 10/01/2036 (2)(4) | 1,000,000 | 1,076,530 | ||||||
Montgomery County Industrial Development Authority/PA | ||||||||
5.25%, 01/15/2036 | 2,500,000 | 2,701,325 | ||||||
5.25%, 01/01/2040 | 1,510,000 | 1,515,542 | ||||||
5.38%, 01/01/2050 | 500,000 | 502,595 | ||||||
Northampton County General Purpose Authority | ||||||||
5.00%, 08/15/2036 | 455,000 | 508,199 | ||||||
5.50%, 08/15/2040 | 125,000 | 131,140 | ||||||
Octorara Area School District | ||||||||
5.00%, 06/01/2018 | 375,000 | 388,444 | ||||||
Pennsylvania Economic Development Financing Authority | ||||||||
4.00%, 03/15/2020 | 1,000,000 | 1,070,630 | ||||||
1.25%, 08/01/2045 | 3,500,000 | 3,499,895 | ||||||
Pennsylvania Higher Educational Facilities Authority | ||||||||
5.00%, 06/15/2022 | 2,000,000 | 2,309,480 | ||||||
5.00%, 06/15/2024 | 3,005,000 | 3,584,394 | ||||||
| Principal Amount | Value | |||||||
5.00%, 06/15/2024 | 1,000,000 | 1,192,810 | ||||||
5.00%, 06/15/2025 | 1,855,000 | 2,234,552 | ||||||
1.20%, 11/01/2031 | 2,355,000 | 2,352,056 | ||||||
Pennsylvania State University | ||||||||
5.00%, 09/01/2020 | 2,440,000 | 2,725,992 | ||||||
5.00%, 09/01/2021 | 1,400,000 | 1,607,508 | ||||||
5.00%, 09/01/2022 | 2,295,000 | 2,696,809 | ||||||
Pennsylvania Turnpike Commission | ||||||||
5.00%, 06/01/2028 | 2,000,000 | 2,349,700 | ||||||
5.00%, 06/01/2029 | 310,000 | 363,137 | ||||||
Reading School District | ||||||||
5.00%, 02/01/2018 | 1,450,000 | 1,479,493 | ||||||
5.00%, 02/01/2019 | 1,660,000 | 1,748,711 | ||||||
5.00%, 02/01/2020 | 1,000,000 | 1,082,610 | ||||||
5.00%, 02/01/2020 | 1,000,000 | 1,082,610 | ||||||
5.00%, 02/01/2021 | 1,000,000 | 1,109,040 | ||||||
5.00%, 02/01/2022 | 1,920,000 | 2,174,803 | ||||||
Redevelopment Authority of the City of Philadelphia | ||||||||
5.00%, 04/15/2023 | 1,335,000 | 1,529,616 | ||||||
School District of Philadelphia/The | ||||||||
5.00%, 09/01/2018 | 150,000 | 155,501 | ||||||
5.25%, 09/01/2023 | 1,750,000 | 1,901,620 | ||||||
5.00%, 09/01/2030 | 4,000,000 | 4,413,520 | ||||||
5.00%, 09/01/2031 | 1,000,000 | 1,098,480 | ||||||
State Public School Building Authority | ||||||||
4.00%, 12/01/2020 | 1,590,000 | 1,700,585 | ||||||
5.00%, 12/01/2022 | 7,370,000 | 8,399,515 | ||||||
5.00%, 04/01/2023 | 2,500,000 | 2,746,925 | ||||||
5.00%, 06/15/2025 | 3,000,000 | 3,518,280 | ||||||
5.00%, 06/01/2026 | 180,000 | 202,194 | ||||||
5.00%, 06/01/2029 | 500,000 | 579,355 | ||||||
5.00%, 12/01/2029 | 2,000,000 | 2,318,440 | ||||||
5.25%, 09/15/2030 | 1,000,000 | 1,110,800 | ||||||
5.00%, 12/01/2032 | 3,060,000 | 3,493,449 | ||||||
Susquehanna Area Regional Airport Authority | ||||||||
6.50%, 01/01/2038 | 475,000 | 485,578 | ||||||
Unionville-Chadds Ford School District | ||||||||
5.00%, 06/01/2026 | 1,000,000 | 1,236,170 | ||||||
|
| |||||||
| 150,990,745 | ||||||||
|
| |||||||
Puerto Rico - 0.20% | ||||||||
Puerto Rico Commonwealth Aqueduct & Sewer Authority | ||||||||
5.00%, 07/01/2019 | 600,000 | 484,524 | ||||||
6.13%, 07/01/2024 | 420,000 | 353,325 | ||||||
5.25%, 07/01/2042 | 1,500,000 | 1,166,250 | ||||||
5.13%, 07/01/2047 | 1,000,000 | 1,019,410 | ||||||
Puerto Rico Electric Power Authority | ||||||||
5.00%, 07/01/2019 | 1,500,000 | 1,536,525 | ||||||
5.50%, 07/01/2019 | 500,000 | 526,400 | ||||||
5.25%, 07/01/2027 | 145,000 | 162,720 | ||||||
|
| |||||||
| 5,249,154 | ||||||||
|
| |||||||
Rhode Island - 0.40% | ||||||||
City of East Providence RI | ||||||||
2.00%, 07/27/2017 | 700,000 | 700,476 | ||||||
Providence Redevelopment Agency | ||||||||
5.00%, 04/01/2028 | 1,200,000 | 1,304,052 | ||||||
Rhode Island Commerce Corp. | ||||||||
5.00%, 06/15/2019 | 1,040,000 | 1,112,914 | ||||||
5.00%, 06/15/2020 | 3,200,000 | 3,519,168 | ||||||
5.00%, 06/15/2021 | 625,000 | 705,344 | ||||||
Rhode Island Health & Educational Building Corp. | ||||||||
5.00%, 09/01/2031 | 710,000 | 801,065 | ||||||
| Principal Amount | Value | |||||||
5.00%, 05/15/2034 | 600,000 | 651,816 | ||||||
5.00%, 09/01/2036 | 100,000 | 110,666 | ||||||
5.00%, 05/15/2039 | 600,000 | 645,282 | ||||||
Rhode Island Infrastructure Bank Water Pollution Control Revolving Fund | ||||||||
5.00%, 10/01/2028 | 500,000 | 605,760 | ||||||
|
| |||||||
| 10,156,543 | ||||||||
|
| |||||||
South Carolina - 0.76% | ||||||||
Lancaster County School District/SC | ||||||||
5.00%, 03/01/2023 | 445,000 | 527,512 | ||||||
Scago Educational Facilities Corp. for Sumter County School 17 | ||||||||
4.00%, 12/01/2019 | 630,000 | 661,834 | ||||||
4.00%, 12/01/2021 | 1,895,000 | 2,033,240 | ||||||
Scago Educational Facilities Corp. for Union School District | ||||||||
5.00%, 12/01/2023 | 1,060,000 | 1,247,408 | ||||||
South Carolina Jobs-Economic Development Authority | ||||||||
2.25%, 05/01/2019 (Acquired 06/02/2017, Cost $2,000,000) (1) | 2,000,000 | 1,999,260 | ||||||
South Carolina Public Service Authority | ||||||||
5.00%, 12/01/2021 | 905,000 | 1,017,645 | ||||||
5.00%, 12/01/2021 | 2,000,000 | 2,248,940 | ||||||
5.00%, 12/01/2035 | 1,500,000 | 1,673,805 | ||||||
5.00%, 12/01/2050 | 2,655,000 | 2,883,861 | ||||||
South Carolina State Housing Finance & Development Authority | ||||||||
1.05%, 01/01/2019 | 3,500,000 | 3,500,000 | ||||||
State of South Carolina | ||||||||
5.00%, 10/01/2020 | 975,000 | 1,092,566 | ||||||
University of South Carolina | ||||||||
4.00%, 05/01/2031 | 500,000 | 546,175 | ||||||
|
| |||||||
| 19,432,246 | ||||||||
|
| |||||||
South Dakota - 0.21% | ||||||||
City of Sioux Falls SD | ||||||||
5.00%, 11/01/2042 | 750,000 | 754,950 | ||||||
South Dakota Health & Educational Facilities Authority | ||||||||
3.00%, 11/01/2017 | 450,000 | 452,556 | ||||||
5.00%, 09/01/2019 | 300,000 | 322,818 | ||||||
5.00%, 11/01/2029 | 800,000 | 918,896 | ||||||
5.00%, 11/01/2030 | 1,000,000 | 1,143,080 | ||||||
5.00%, 11/01/2042 | 145,000 | 157,519 | ||||||
5.00%, 11/01/2045 | 1,500,000 | 1,659,975 | ||||||
|
| |||||||
| 5,409,794 | ||||||||
|
| |||||||
Tennessee - 1.23% | ||||||||
Blount County Health & Educational Facilities Board | ||||||||
5.00%, 01/01/2037 | 1,240,000 | 1,306,030 | ||||||
Chattanooga Health Educational & Housing Facility Board | ||||||||
3.00%, 10/01/2018 | 500,000 | 508,525 | ||||||
3.00%, 10/01/2019 | 600,000 | 616,098 | ||||||
5.00%, 10/01/2021 | 1,000,000 | 1,119,080 | ||||||
5.00%, 10/01/2022 | 325,000 | 369,590 | ||||||
5.00%, 10/01/2030 | 500,000 | 558,460 | ||||||
5.00%, 10/01/2032 | 1,215,000 | 1,344,082 | ||||||
5.00%, 10/01/2035 | 2,260,000 | 2,465,140 | ||||||
County of Monroe TN | ||||||||
1.20%, 06/15/2019 | 1,500,000 | 1,500,420 | ||||||
Johnson City Health & Educational Facilities Board | ||||||||
5.00%, 08/15/2042 | 2,000,000 | 2,133,360 | ||||||
Knox County Health Educational & Housing Facility Board | ||||||||
5.00%, 04/01/2023 | 1,825,000 | 2,077,799 | ||||||
5.00%, 04/01/2024 | 1,000,000 | 1,152,060 | ||||||
5.00%, 04/01/2027 | 1,740,000 | 2,043,091 | ||||||
Lewisburg Industrial Development Board | ||||||||
1.25%, 07/02/2035 (4) | 1,500,000 | 1,500,000 | ||||||
Shelby County Health Educational & Housing Facilities Board | ||||||||
| Principal Amount | Value | |||||||
5.00%, 09/01/2037 | 1,590,000 | 1,612,053 | ||||||
State of Tennessee | ||||||||
5.00%, 08/01/2018 | 1,000,000 | 1,043,090 | ||||||
5.00%, 08/01/2021 | 1,595,000 | 1,828,843 | ||||||
Tennessee Energy Acquisition Corp. | ||||||||
5.00%, 02/01/2019 | 1,100,000 | 1,161,600 | ||||||
5.25%, 09/01/2019 | 1,750,000 | 1,893,132 | ||||||
5.00%, 02/01/2023 | 1,310,000 | 1,504,221 | ||||||
5.25%, 09/01/2023 | 600,000 | 706,266 | ||||||
5.00%, 02/01/2027 | 2,725,000 | 3,210,105 | ||||||
|
| |||||||
| 31,653,045 | ||||||||
|
| |||||||
Texas - 9.73% | ||||||||
Alamito Public Facility Corp. | ||||||||
1.00%, 10/01/2018 | 700,000 | 699,405 | ||||||
Alamo Community College District | ||||||||
4.00%, 02/15/2020 | 1,000,000 | 1,069,010 | ||||||
4.00%, 02/15/2021 | 715,000 | 780,709 | ||||||
4.00%, 02/15/2022 | 665,000 | 739,061 | ||||||
4.00%, 02/15/2023 | 1,000,000 | 1,126,520 | ||||||
3.00%, 11/01/2046 | 2,100,000 | 2,169,090 | ||||||
Aledo Independent School District | ||||||||
5.00%, 02/15/2043 | 475,000 | 546,587 | ||||||
Austin Affordable Public Facility Corp, Inc. | ||||||||
1.15%, 11/01/2019 | 1,000,000 | 1,001,560 | ||||||
Austin Convention Enterprises, Inc. | ||||||||
5.00%, 01/01/2023 | 250,000 | 282,403 | ||||||
5.00%, 01/01/2025 | 150,000 | 172,584 | ||||||
5.00%, 01/01/2028 | 400,000 | 469,588 | ||||||
5.00%, 01/01/2029 | 425,000 | 495,486 | ||||||
Board of Managers Joint Guadalupe County-City of Seguin Hospital | ||||||||
5.25%, 12/01/2035 | 525,000 | 566,753 | ||||||
Brazos Harbor Industrial Development Corp. | ||||||||
5.90%, 05/01/2038 | 1,000,000 | 1,030,260 | ||||||
Central Texas Regional Mobility Authority | ||||||||
5.00%, 01/01/2022 | 500,000 | 570,975 | ||||||
5.00%, 01/01/2022 | 990,000 | 1,130,530 | ||||||
5.00%, 01/01/2024 | 175,000 | 206,437 | ||||||
5.00%, 01/01/2025 | 225,000 | 267,921 | ||||||
5.00%, 01/01/2026 | 150,000 | 180,036 | ||||||
5.00%, 01/01/2028 | 150,000 | 176,257 | ||||||
5.00%, 01/01/2034 | 1,475,000 | 1,673,019 | ||||||
4.00%, 01/01/2041 | 750,000 | 738,758 | ||||||
6.00%, 01/01/2041 | 2,125,000 | 2,457,244 | ||||||
5.00%, 01/01/2042 | 1,335,000 | 1,471,263 | ||||||
5.00%, 01/01/2046 | 1,600,000 | 1,774,880 | ||||||
Central Texas Turnpike System | ||||||||
5.00%, 08/15/2037 | 2,500,000 | 2,760,575 | ||||||
City of Austin TX | ||||||||
5.00%, 09/01/2019 | 610,000 | 659,923 | ||||||
5.00%, 09/01/2033 | 2,920,000 | 3,422,415 | ||||||
City of Austin TX Airport System Revenue | ||||||||
5.00%, 11/15/2044 | 255,000 | 281,178 | ||||||
City of Austin TX Water & Wastewater System Revenue | ||||||||
5.00%, 11/15/2020 | 1,350,000 | 1,514,551 | ||||||
City of Dallas TX Waterworks & Sewer System Revenue | ||||||||
5.00%, 10/01/2027 | 530,000 | 640,330 | ||||||
5.00%, 10/01/2028 | 2,750,000 | 3,299,560 | ||||||
5.00%, 10/01/2031 | 800,000 | 955,264 | ||||||
City of El Paso TX | ||||||||
5.00%, 08/15/2025 | 2,245,000 | 2,728,034 | ||||||
City of Garland TX Water & Sewer System Revenue | ||||||||
| Principal Amount | Value | |||||||
5.00%, 03/01/2028 | 700,000 | 849,240 | ||||||
City of Houston TX Airport System Revenue | ||||||||
5.00%, 07/01/2017 | 1,500,000 | 1,500,000 | ||||||
City of Houston TX Combined Utility System Revenue | ||||||||
4.00%, 11/15/2021 | 200,000 | 221,998 | ||||||
5.00%, 11/15/2022 | 200,000 | 236,020 | ||||||
5.00%, 11/15/2023 | 225,000 | 269,714 | ||||||
0.91%, 05/15/2034 | 10,000,000 | 10,000,000 | ||||||
City of San Antonio TX | ||||||||
5.00%, 02/01/2019 | 1,000,000 | 1,061,480 | ||||||
City of San Antonio TX Electric & Gas Systems Revenue | ||||||||
5.00%, 02/01/2018 | 4,000,000 | 4,092,920 | ||||||
5.00%, 02/01/2020 | 1,000,000 | 1,096,390 | ||||||
5.00%, 02/01/2020 | 600,000 | 657,834 | ||||||
5.00%, 02/01/2023 | 4,000,000 | 4,721,880 | ||||||
3.00%, 12/01/2045 | 5,000,000 | 5,222,400 | ||||||
County of Comal TX | ||||||||
4.00%, 02/01/2023 | 1,000,000 | 1,121,150 | ||||||
County of Dallas TX | ||||||||
5.00%, 08/15/2024 | 1,400,000 | 1,687,280 | ||||||
County of El Paso TX | ||||||||
5.00%, 02/15/2031 | 1,280,000 | 1,482,381 | ||||||
County of Williamson TX | ||||||||
5.00%, 02/15/2021 | 1,000,000 | 1,130,380 | ||||||
Cypress-Fairbanks Independent School District | ||||||||
5.00%, 02/15/2021 | 4,720,000 | 5,324,679 | ||||||
5.00%, 02/15/2027 | 470,000 | 575,985 | ||||||
0.90%, 02/15/2040 | 1,535,000 | 1,533,649 | ||||||
3.00%, 02/15/2040 | 4,000,000 | 4,008,800 | ||||||
3.00%, 02/15/2040 | 5,000,000 | 5,111,050 | ||||||
5.00%, 02/15/2044 | 1,100,000 | 1,247,169 | ||||||
Dallas Area Rapid Transit | ||||||||
5.00%, 12/01/2028 | 2,160,000 | 2,280,658 | ||||||
Dallas County Community College District | ||||||||
5.00%, 02/15/2021 | 7,610,000 | 8,584,917 | ||||||
5.00%, 02/15/2022 | 7,665,000 | 8,866,259 | ||||||
Dallas Independent School District | ||||||||
5.00%, 02/15/2036 | 5,485,000 | 6,302,320 | ||||||
Dallas Love Field | ||||||||
5.00%, 11/01/2035 | 1,000,000 | 1,144,880 | ||||||
Dallas Performing Arts Cultural Facilities Corp. | ||||||||
0.91%, 09/01/2041 | 3,915,000 | 3,915,000 | ||||||
Dallas/Fort Worth International Airport | ||||||||
5.00%, 11/01/2017 | 1,000,000 | 1,013,070 | ||||||
5.00%, 11/01/2018 | 1,275,000 | 1,340,280 | ||||||
5.00%, 11/01/2023 | 245,000 | 286,520 | ||||||
5.00%, 11/01/2038 | 3,110,000 | 3,389,060 | ||||||
Del Rio Housing Facility Corp. | ||||||||
1.35%, 06/01/2021 | 3,000,000 | 2,993,820 | ||||||
Fort Worth Independent School District | ||||||||
5.00%, 02/15/2026 | 1,365,000 | 1,683,687 | ||||||
Garland Independent School District | ||||||||
5.00%, 02/15/2021 | 1,000,000 | 1,130,000 | ||||||
5.00%, 02/15/2022 | 1,000,000 | 1,158,650 | ||||||
Harlandale Independent School District | ||||||||
5.00%, 08/01/2030 | 1,305,000 | 1,536,559 | ||||||
Harris County Cultural Education Facilities Finance Corp. | ||||||||
5.00%, 06/01/2018 | 3,000,000 | 3,105,900 | ||||||
5.00%, 01/01/2043 | 180,000 | 184,156 | ||||||
Harris County Flood Control District | ||||||||
5.00%, 10/01/2025 | 1,000,000 | 1,213,150 | ||||||
| Principal Amount | Value | |||||||
Harris County Health Facilities Development Corp. | ||||||||
7.25%, 12/01/2035 | 4,500,000 | 4,888,755 | ||||||
Houston Independent School District | ||||||||
5.00%, 02/15/2025 | 1,000,000 | 1,224,170 | ||||||
1.38%, 06/01/2037 | 775,000 | 774,116 | ||||||
Love Field Airport Modernization Corp. | ||||||||
5.00%, 11/01/2028 | 250,000 | 286,437 | ||||||
5.25%, 11/01/2040 | 3,015,000 | 3,298,591 | ||||||
Lower Colorado River Authority | ||||||||
5.00%, 05/15/2020 | 1,070,000 | 1,177,856 | ||||||
5.00%, 05/15/2020 | 340,000 | 374,272 | ||||||
5.00%, 05/15/2021 | 800,000 | 905,216 | ||||||
5.00%, 05/15/2022 | 1,025,000 | 1,184,654 | ||||||
Midlothian Independent School District | ||||||||
2.50%, 08/01/2052 | 2,000,000 | 2,032,260 | ||||||
Mission Economic Development Corp. | ||||||||
5.75%, 10/01/2031 (Acquired 05/09/2016 through 05/23/2016, Cost $2,343,824) (1) | 2,250,000 | 2,358,338 | ||||||
New Hope Cultural Education Facilities Finance Corp. | ||||||||
5.00%, 04/01/2031 | 335,000 | 370,135 | ||||||
5.00%, 11/01/2031 | 1,000,000 | 1,084,480 | ||||||
5.00%, 07/01/2035 | 2,100,000 | 2,266,173 | ||||||
5.00%, 04/01/2036 | 355,000 | 384,202 | ||||||
5.00%, 11/01/2040 | 1,100,000 | 1,162,876 | ||||||
5.00%, 07/01/2047 | 1,075,000 | 1,144,079 | ||||||
5.00%, 04/01/2048 | 1,250,000 | 1,333,375 | ||||||
5.50%, 11/15/2052 | 150,000 | 139,862 | ||||||
Newark Higher Education Finance Corp. | ||||||||
5.00%, 04/01/2029 | 505,000 | 584,194 | ||||||
North East Independent School District/TX | ||||||||
1.42%, 08/01/2040 | 600,000 | 595,524 | ||||||
North Texas Tollway Authority | ||||||||
5.00%, 01/01/2020 | 500,000 | 545,625 | ||||||
5.00%, 09/01/2020 | 1,445,000 | 1,608,184 | ||||||
5.00%, 01/01/2022 | 325,000 | 372,648 | ||||||
5.00%, 01/01/2023 | 3,500,000 | 4,092,550 | ||||||
5.00%, 01/01/2023 | 235,000 | 274,785 | ||||||
5.00%, 01/01/2031 | 1,900,000 | 2,163,264 | ||||||
5.00%, 01/01/2033 | 3,150,000 | 3,587,724 | ||||||
5.00%, 01/01/2036 | 550,000 | 626,566 | ||||||
5.00%, 01/01/2039 | 170,000 | 193,259 | ||||||
6.25%, 01/01/2039 | 65,000 | 69,441 | ||||||
6.25%, 01/01/2039 | 275,000 | 295,353 | ||||||
5.00%, 01/01/2040 | 2,000,000 | 2,229,860 | ||||||
Permanent University Fund - University of Texas System | ||||||||
5.00%, 07/01/2029 | 235,000 | 283,490 | ||||||
Plano Independent School District | ||||||||
5.00%, 02/15/2018 | 820,000 | 840,697 | ||||||
5.00%, 02/15/2020 | 550,000 | 603,653 | ||||||
5.00%, 02/15/2021 | 550,000 | 621,500 | ||||||
5.00%, 02/15/2022 | 1,225,000 | 1,419,346 | ||||||
State of Texas | ||||||||
5.00%, 08/01/2018 | 1,325,000 | 1,382,240 | ||||||
5.00%, 04/01/2019 | 2,000,000 | 2,135,160 | ||||||
5.00%, 08/01/2019 | 2,815,000 | 3,040,200 | ||||||
5.00%, 10/01/2019 | 1,950,000 | 2,117,486 | ||||||
5.00%, 04/01/2020 | 2,000,000 | 2,205,060 | ||||||
5.00%, 04/01/2020 | 2,845,000 | 2,930,549 | ||||||
2.00%, 08/01/2025 | 1,100,000 | 1,100,484 | ||||||
5.00%, 04/01/2027 | 5,000,000 | 6,133,750 | ||||||
Tarrant County Cultural Education Facilities Finance Corp. | ||||||||
5.00%, 11/15/2035 | 1,750,000 | 1,836,415 | ||||||
| Principal Amount | Value | |||||||
5.00%, 11/15/2040 | 1,800,000 | 1,886,292 | ||||||
8.25%, 11/15/2044 | 500,000 | 530,310 | ||||||
Texas Municipal Gas Acquisition & Supply Corp. I | ||||||||
5.25%, 12/15/2022 | 450,000 | 515,795 | ||||||
1.54%, 12/15/2026 | 1,250,000 | 1,181,200 | ||||||
6.25%, 12/15/2026 | 7,585,000 | 9,263,257 | ||||||
Texas Municipal Gas Acquisition & Supply Corp. III | ||||||||
5.00%, 12/15/2019 | 3,000,000 | 3,266,640 | ||||||
5.00%, 12/15/2032 | 3,000,000 | 3,292,800 | ||||||
Texas State University System | ||||||||
5.00%, 03/15/2026 | 800,000 | 984,840 | ||||||
5.00%, 03/15/2029 | 610,000 | 739,345 | ||||||
5.00%, 03/15/2032 | 1,325,000 | 1,574,590 | ||||||
Texas Transportation Commission State Highway Fund | ||||||||
5.00%, 10/01/2023 | 5,000,000 | 5,998,450 | ||||||
The University of Texas System | ||||||||
5.00%, 08/15/2021 | 505,000 | 579,947 | ||||||
5.00%, 08/15/2026 | 1,750,000 | 2,178,540 | ||||||
Travis County Health Facilities Development Corp. | ||||||||
7.00%, 11/01/2030 | 195,000 | 219,326 | ||||||
University of Houston | ||||||||
5.00%, 02/15/2030 | 860,000 | 1,019,711 | ||||||
University of Texas System/The | ||||||||
5.25%, 08/15/2018 | 1,170,000 | 1,225,587 | ||||||
5.00%, 08/15/2021 | 3,000,000 | 3,445,230 | ||||||
|
| |||||||
| 249,520,165 | ||||||||
|
| |||||||
Utah - 0.41% | ||||||||
City of Murray UT | ||||||||
0.87%, 05/15/2037 | 2,485,000 | 2,485,000 | ||||||
Salt Lake City Corp. Airport Revenue | ||||||||
5.00%, 07/01/2022 | 1,500,000 | 1,733,355 | ||||||
5.00%, 07/01/2026 | 1,700,000 | 2,055,368 | ||||||
Salt Lake City Utah Airport Revenue, Tender Option Bond Trust, Ser 2017-XM0493 | ||||||||
1.18%, 07/01/2047 (Acquired 02/23/2017, Cost $1,500,000) (1) | 1,500,000 | 1,500,000 | ||||||
Salt Lake City Utah Airport Revenue, Tender Option Bond Trust, Ser 2017-XM0506 | ||||||||
1.16%, 07/01/2042 (Acquired 05/10/2017, Cost $2,600,000) (1) | 2,600,000 | 2,600,000 | ||||||
Salt Lake City Utah Airport Revenue, Tender Option Bond Trust, Ser 2017-ZF0540 | ||||||||
1.11%, 01/01/2025 (Acquired 02/23/2017, Cost $200,000) (1) | 200,000 | 200,000 | ||||||
|
| |||||||
| 10,573,723 | ||||||||
|
| |||||||
Vermont - 0.12% | ||||||||
Vermont Educational & Health Buildings Financing Agency | ||||||||
5.00%, 10/15/2027 | 1,000,000 | 1,112,010 | ||||||
5.00%, 10/15/2029 | 890,000 | 972,779 | ||||||
Vermont Student Assistance Corp. | ||||||||
5.00%, 06/15/2025 | 800,000 | 917,784 | ||||||
|
| |||||||
| 3,002,573 | ||||||||
|
| |||||||
Virgin Islands - 0.12% | ||||||||
Virgin Islands Public Finance Authority | ||||||||
5.00%, 10/01/2032 (Acquired 09/14/2015 through 09/18/2015, Cost $3,227,522) (1) | 3,000,000 | 3,187,410 | ||||||
|
| |||||||
Virginia - 2.72% | ||||||||
Chesapeake Bay Bridge & Tunnel District | ||||||||
5.00%, 07/01/2051 | 1,000,000 | 1,105,860 | ||||||
Chesterfield County Economic Development Authority | ||||||||
5.00%, 05/01/2023 | 200,000 | 212,216 | ||||||
City of Alexandria VA | ||||||||
4.50%, 06/15/2019 | 2,250,000 | 2,398,342 | ||||||
City of Norfolk VA Water Revenue | ||||||||
5.00%, 11/01/2017 | 1,000,000 | 1,013,100 | ||||||
County of Arlington VA | ||||||||
5.00%, 08/15/2020 | 1,630,000 | 1,820,531 | ||||||
5.00%, 08/15/2023 | 1,850,000 | 2,225,365 | ||||||
| Principal Amount | Value | |||||||
County of Botetourt VA | ||||||||
4.75%, 07/01/2023 | 100,000 | 104,629 | ||||||
6.00%, 07/01/2034 | 1,500,000 | 1,637,670 | ||||||
County of Isle Wight VA | ||||||||
4.00%, 04/01/2020 | 700,000 | 751,023 | ||||||
County of Loudoun VA | ||||||||
5.00%, 12/01/2023 | 825,000 | 996,724 | ||||||
Fairfax County Industrial Development Authority | ||||||||
5.00%, 05/15/2035 | 1,175,000 | 1,327,515 | ||||||
5.00%, 05/15/2044 | 975,000 | 1,095,032 | ||||||
Fredericksburg Economic Development Authority | ||||||||
5.00%, 06/15/2031 | 500,000 | 565,580 | ||||||
Greater Richmond Convention Center Authority | ||||||||
5.00%, 06/15/2020 | 1,000,000 | 1,095,490 | ||||||
Hanover County Economic Development Authority | ||||||||
5.00%, 07/01/2042 | 1,000,000 | 1,013,630 | ||||||
5.00%, 07/01/2047 | 2,000,000 | 2,022,840 | ||||||
Norfolk Economic Development Authority | ||||||||
5.00%, 11/01/2020 | 645,000 | 721,607 | ||||||
Prince William County Industrial Development Authority | ||||||||
1.35%, 07/01/2019 | 2,000,000 | 2,002,780 | ||||||
Richmond Metropolitan Transportation Authority/The Expressway System Revenue | ||||||||
5.25%, 07/15/2017 | 100,000 | 100,103 | ||||||
Stafford County Economic Development Authority | ||||||||
5.00%, 06/15/2030 | 150,000 | 170,848 | ||||||
5.00%, 06/15/2033 | 150,000 | 167,756 | ||||||
5.00%, 06/15/2034 | 500,000 | 555,525 | ||||||
4.00%, 06/15/2037 | 50,000 | 50,600 | ||||||
Virginia College Building Authority | ||||||||
5.00%, 02/01/2018 | 5,000,000 | 5,116,150 | ||||||
5.00%, 09/01/2023 | 1,000,000 | 1,194,570 | ||||||
5.00%, 07/01/2030 (Acquired 12/17/2015, Cost $521,120) (1) | 500,000 | 545,530 | ||||||
5.00%, 07/01/2045 (Acquired 09/17/2015, Cost $1,000,000) (1) | 1,000,000 | 1,038,170 | ||||||
5.00%, 07/01/2045 (Acquired 09/17/2015, Cost $500,000) (1) | 500,000 | 518,990 | ||||||
Virginia Commonwealth Transportation Board | ||||||||
5.00%, 05/15/2020 | 1,365,000 | 1,509,485 | ||||||
5.00%, 05/15/2021 | 2,280,000 | 2,592,725 | ||||||
5.00%, 05/15/2022 | 2,000,000 | 2,328,820 | ||||||
Virginia Public School Authority | ||||||||
5.00%, 07/15/2018 | 1,510,000 | 1,572,710 | ||||||
5.00%, 08/01/2018 | 1,480,000 | 1,543,611 | ||||||
5.00%, 07/15/2020 | 3,000,000 | 3,340,500 | ||||||
5.00%, 08/01/2021 | 6,000,000 | 6,866,820 | ||||||
5.00%, 08/01/2022 | 2,505,000 | 2,944,803 | ||||||
5.00%, 08/01/2022 | 1,000,000 | 1,171,830 | ||||||
Virginia Resources Authority | ||||||||
5.00%, 11/01/2021 | 1,800,000 | 2,076,372 | ||||||
Virginia Small Business Financing Authority | ||||||||
5.00%, 11/01/2019 | 1,100,000 | 1,194,787 | ||||||
5.00%, 01/01/2040 | 1,860,000 | 1,949,689 | ||||||
5.50%, 01/01/2042 | 3,725,000 | 4,086,362 | ||||||
Wise County Industrial Development Authority | ||||||||
1.88%, 11/01/2040 | 5,000,000 | 5,021,800 | ||||||
|
| |||||||
| 69,768,490 | ||||||||
|
| |||||||
Washington - 2.19% | ||||||||
City of Kent WA | ||||||||
5.00%, 12/01/2027 | 695,000 | 851,542 | ||||||
5.00%, 12/01/2028 | 860,000 | 1,045,949 | ||||||
City of Tacoma WA Solid Waste Utility Revenue | ||||||||
5.00%, 12/01/2031 | 460,000 | 536,875 | ||||||
Clark County Public Utility District No 1 | ||||||||
| Principal Amount | Value | |||||||
5.00%, 01/01/2022 | 425,000 | 489,702 | ||||||
5.00%, 01/01/2023 | 750,000 | 881,265 | ||||||
County of King WA Sewer Revenue | ||||||||
0.95%, 01/01/2032 | 8,250,000 | 8,250,000 | ||||||
Energy Northwest | ||||||||
5.00%, 07/01/2018 | 1,000,000 | 1,039,450 | ||||||
5.00%, 07/01/2027 | 1,000,000 | 1,211,380 | ||||||
King County Public Hospital District No 1 | ||||||||
5.00%, 12/01/2032 | 4,500,000 | 5,200,560 | ||||||
Pierce County School District No 3 Puyallup | ||||||||
5.00%, 12/01/2032 | 1,000,000 | 1,201,550 | ||||||
Port of Seattle WA | ||||||||
5.00%, 03/01/2021 | 900,000 | 1,016,343 | ||||||
Skagit County Public Hospital District No 1 | ||||||||
5.00%, 12/01/2020 | 1,750,000 | 1,891,820 | ||||||
State of Washington | ||||||||
5.00%, 01/01/2019 | 2,000,000 | 2,117,100 | ||||||
5.00%, 07/01/2019 | 3,150,000 | 3,390,030 | ||||||
5.00%, 08/01/2019 | 730,000 | 787,933 | ||||||
5.00%, 02/01/2020 | 2,420,000 | 2,652,610 | ||||||
5.00%, 07/01/2021 | 1,200,000 | 1,370,424 | ||||||
5.00%, 08/01/2021 | 2,000,000 | 2,288,940 | ||||||
5.00%, 08/01/2027 | 235,000 | 289,045 | ||||||
5.00%, 08/01/2027 | 550,000 | 667,365 | ||||||
5.00%, 08/01/2028 | 235,000 | 286,669 | ||||||
5.00%, 08/01/2030 | 235,000 | 282,830 | ||||||
5.00%, 07/01/2031 | 5,000,000 | 5,856,050 | ||||||
Washington Health Care Facilities Authority | ||||||||
5.00%, 10/01/2017 | 1,150,000 | 1,160,833 | ||||||
5.00%, 10/01/2021 | 1,510,000 | 1,728,104 | ||||||
1.96%, 01/01/2042 | 5,000,000 | 4,988,650 | ||||||
Washington Higher Education Facilities Authority | ||||||||
5.00%, 10/01/2029 | 1,855,000 | 2,075,819 | ||||||
Washington State Housing Finance Commission | ||||||||
4.00%, 07/01/2026 (Acquired 07/21/2016, Cost $1,451,918) (1) | 1,425,000 | 1,432,467 | ||||||
5.00%, 07/01/2031 (Acquired 07/21/2016, Cost $1,074,887) (1) | 1,000,000 | 1,045,640 | ||||||
|
| |||||||
| 56,036,945 | ||||||||
|
| |||||||
West Virginia - 0.37% | ||||||||
County of Pleasants WV | ||||||||
5.25%, 10/15/2037 | 1,645,000 | 1,606,754 | ||||||
School Building Authority of West Virginia | ||||||||
5.00%, 07/01/2020 | 500,000 | 553,545 | ||||||
5.00%, 07/01/2022 | 695,000 | 809,258 | ||||||
5.00%, 07/01/2024 | 500,000 | 603,500 | ||||||
West Virginia Economic Development Authority | ||||||||
1.20%, 02/01/2018 | 3,500,000 | 3,497,830 | ||||||
5.38%, 12/01/2038 | 885,000 | 972,951 | ||||||
1.70%, 01/01/2041 | 1,515,000 | 1,501,168 | ||||||
|
| |||||||
| 9,545,006 | ||||||||
|
| |||||||
Wisconsin - 0.75% | ||||||||
County of La Crosse WI | ||||||||
3.00%, 10/01/2017 | 510,000 | 512,565 | ||||||
Milwaukee Redevelopment Authority | ||||||||
5.00%, 11/15/2031 | 570,000 | 659,878 | ||||||
5.00%, 11/15/2032 | 500,000 | 575,760 | ||||||
Public Finance Authority | ||||||||
5.00%, 05/15/2021 (Acquired 04/07/2017, Cost $199,624) (1)(2)(4) | 185,000 | 201,478 | ||||||
3.00%, 11/15/2022 (Acquired 04/07/2017, Cost $90,000) (1)(2)(4) | 90,000 | 90,284 | ||||||
3.50%, 11/15/2023 (Acquired 04/07/2017, Cost $65,000) (1)(2)(4) | 65,000 | 65,617 | ||||||
3.95%, 11/15/2024 (Acquired 04/07/2017, Cost $50,000) (1)(2)(4) | 50,000 | 50,923 | ||||||
5.00%, 12/01/2025 | 500,000 | 567,415 | ||||||
| Principal Amount | Value | |||||||
4.13%, 05/01/2026 (Acquired 05/12/2016, Cost $800,000) (1) | 800,000 | 794,408 | ||||||
6.25%, 08/01/2027 (Acquired 06/22/2017 through 06/26/2017, Cost $1,003,117) (1) | 1,000,000 | 1,026,240 | ||||||
5.00%, 05/15/2028 (Acquired 04/07/2017, Cost $211,657) (1)(2)(4) | 200,000 | 219,858 | ||||||
4.00%, 08/01/2035 (2)(4) | 2,750,000 | 2,657,077 | ||||||
5.25%, 05/15/2037 (Acquired 04/07/2017, Cost $519,908) (1)(2)(4) | 500,000 | 540,320 | ||||||
5.00%, 01/01/2042 | 600,000 | 606,924 | ||||||
5.25%, 05/15/2042 (Acquired 04/07/2017, Cost $62,101) (1)(2)(4) | 60,000 | 64,388 | ||||||
5.25%, 05/15/2047 (Acquired 04/07/2017, Cost $61,721) (1)(2)(4) | 60,000 | 64,090 | ||||||
5.25%, 05/15/2052 (Acquired 04/07/2017, Cost $117,666) (1)(2)(4) | 115,000 | 122,366 | ||||||
State of Wisconsin | ||||||||
5.00%, 05/01/2018 | 1,000,000 | 1,033,130 | ||||||
5.00%, 05/01/2020 | 1,600,000 | 1,769,440 | ||||||
5.00%, 11/01/2020 | 2,005,000 | 2,251,475 | ||||||
5.00%, 05/01/2034 | 2,000,000 | 2,333,160 | ||||||
Wisconsin Health & Educational Facilities Authority | ||||||||
5.00%, 12/01/2022 | 560,000 | 644,073 | ||||||
4.00%, 02/15/2025 | 270,000 | 301,066 | ||||||
4.00%, 02/15/2026 | 510,000 | 561,882 | ||||||
5.00%, 02/15/2027 | 300,000 | 351,129 | ||||||
4.00%, 02/15/2031 | 460,000 | 487,099 | ||||||
4.00%, 02/15/2033 | 550,000 | 575,184 | ||||||
|
| |||||||
| 19,127,229 | ||||||||
|
| |||||||
Total Municipal Bonds (Cost $2,440,064,634) | $ | 2,454,551,763 | ||||||
|
| |||||||
| Shares | Value | |||||||
SHORT-TERM INVESTMENTS - 3.72% | ||||||||
Money Market Funds - 3.72% | ||||||||
Fidelity Institutional Money Market Government Funds - Class I, 0.81% (3) | 47,660,254 | $ | 47,660,254 | |||||
Goldman Sachs Financial Square Treasury Solutions Fund - Class I, 0.84% (3) | 47,654,460 | 47,654,460 | ||||||
|
| |||||||
Total Short-Term Investments (Cost $95,314,714) | $ | 95,314,714 | ||||||
|
| |||||||
TOTAL INVESTMENTS IN SECURITIES - 99.43% | ||||||||
(Cost $2,535,379,348) | $ | 2,549,866,477 | ||||||
OTHER ASSETS IN EXCESS OF LIABILITIES - 0.57% | 14,707,025 | |||||||
|
| |||||||
TOTAL NET ASSETS - 100.00% | $ | 2,564,573,502 | ||||||
|
| |||||||
Percentages are stated as a percent of net assets.
| (1) | Restricted security as defined in Rule 144(A) under the Securities Act of 1933. The value of these securities total $46,540,887, which represents 1.81% of total net assets. |
| (2) | Security is treated as illiquid by the Fund. The value of these securities total $19,408,965, which represents 0.76% of total net assets. |
| (3) | Represents annualized seven-day yield as of the close of the reporting period. |
| (4) | Security is categorized as Level 3 per the Trust’s fair value hierarchy. The value of these securities total $20,908,965, which represents 0.82% of total net assets. |
Bridge Builder Large Cap Growth Fund
Schedule of Investments
June 30, 2017
| Shares | Value | |||||||
COMMON STOCKS - 95.36% | ||||||||
Consumer Discretionary - 16.34% | ||||||||
Adidas AG | 64,769 | $ | 12,419,404 | |||||
Advance Auto Parts, Inc. | 684 | 79,748 | ||||||
Amazon.com, Inc. (1) | 128,696 | 124,577,728 | ||||||
AMC Networks, Inc. (1) | 1,830 | 97,740 | ||||||
Aramark | 3,607 | 147,815 | ||||||
AutoZone, Inc. (1) | 40,486 | 23,095,644 | ||||||
Borgwarner, Inc. | 759 | 32,151 | ||||||
Bright Horizons Family Solutions, Inc. (1) | 1,778 | 137,279 | ||||||
Brunswick Corp. | 2,649 | 166,172 | ||||||
Burlington Stores, Inc. (1) | 1,432 | 131,730 | ||||||
Cable One, Inc. | 170 | 120,853 | ||||||
CarMax, Inc. (1) | 96,560 | 6,089,074 | ||||||
Carter’s, Inc. | 1,764 | 156,908 | ||||||
CBS Corp. | 13,011 | 829,842 | ||||||
Charter Communications, Inc. (1) | 46,608 | 15,699,905 | ||||||
Chipotle Mexican Grill, Inc. (1) | 75,744 | 31,517,078 | ||||||
Choice Hotels International, Inc. | 1,173 | 75,365 | ||||||
Coach, Inc. | 1,752 | 82,940 | ||||||
Comcast Corp. - Class A | 798,921 | 31,094,005 | ||||||
D. R. Horton, Inc. | 6,654 | 230,029 | ||||||
Darden Restaurants, Inc. | 4,459 | 403,272 | ||||||
Delphi Automotive Plc | 9,823 | 860,986 | ||||||
Dick’s Sporting Goods, Inc. | 2,504 | 99,734 | ||||||
DISH Network Corp. (1) | 6,101 | 382,899 | ||||||
Dollar General Corp. | 3,778 | 272,356 | ||||||
Dollar Tree, Inc. (1) | 8,013 | 560,269 | ||||||
Domino’s Pizza, Inc. | 1,734 | 366,793 | ||||||
Dunkin’ Brands Group, Inc. | 3,290 | 181,345 | ||||||
| Shares | Value | |||||||
Expedia, Inc. | 63,552 | 9,466,070 | ||||||
Extended Stay America, Inc. | 3,276 | 63,423 | ||||||
Floor & Decor Holdings, Inc. (1) | 357 | 14,016 | ||||||
Foot Locker, Inc. | 332 | 16,361 | ||||||
Gap, Inc. | 326 | 7,169 | ||||||
Gentex Corp. | 6,522 | 123,722 | ||||||
Genuine Parts Co. | 1,957 | 181,531 | ||||||
Grand Canyon Education, Inc. (1) | 110,935 | 8,698,413 | ||||||
H&R Block, Inc. | 1,108 | 34,248 | ||||||
Hanesbrands, Inc. | 12,969 | 300,362 | ||||||
Harley-Davidson, Inc. | 5,054 | 273,017 | ||||||
Hasbro, Inc. | 3,080 | 343,451 | ||||||
Hilton Grand Vacations, Inc. (1) | 2,083 | 75,113 | ||||||
Hilton Worldwide Holdings, Inc. | 6,052 | 374,316 | ||||||
Home Depot, Inc. | 43,507 | 6,673,974 | ||||||
Industria de Diseno Textil SA - ADR | 663,401 | 12,770,469 | ||||||
Interpublic Group of Companies, Inc. | 13,306 | 327,328 | ||||||
Kate Spade & Co. (1) | 4,580 | 84,684 | ||||||
L Brands, Inc. | 1,318 | 71,027 | ||||||
Las Vegas Sands Corp. | 13,141 | 839,578 | ||||||
Laureate Education, Inc. (1) | 274,200 | 4,806,726 | ||||||
Lear Corp. | 2,043 | 290,269 | ||||||
Leggett & Platt, Inc. | 3,798 | 199,509 | ||||||
Liberty Expedia Holdings, Inc. (1) | 381 | 20,582 | ||||||
Liberty Interactive Corp. (1) | 8,286 | 203,338 | ||||||
Lions Gate Entertainment Corp. - Class A (1) | 1,096 | 30,915 | ||||||
Lions Gate Entertainment Corp. - Class B (1) | 2,446 | 64,268 | ||||||
Live Nation Entertainment, Inc. (1) | 4,803 | 167,385 | ||||||
LKQ Corp. (1) | 1,651 | 54,400 | ||||||
Lowes Companies, Inc. | 1,011,133 | 78,393,141 | ||||||
Lululemon Athletica, Inc. (1) | 171,555 | 10,236,687 | ||||||
Marriott International, Inc. | 143,966 | 14,441,229 | ||||||
Mattel, Inc. | 2,346 | 50,509 | ||||||
McDonald’s Corp. | 93,765 | 14,361,047 | ||||||
MGM Resorts International | 1,448 | 45,308 | ||||||
Michael Kors Holdings Ltd. (1) | 426 | 15,443 | ||||||
Mohawk Industries, Inc. (1) | 145 | 35,045 | ||||||
| Shares | Value | |||||||
Morningstar, Inc. | 580 | 45,437 | ||||||
Netflix, Inc. (1) | 174,111 | 26,013,925 | ||||||
Newell Brands, Inc. | 282,424 | 15,143,575 | ||||||
Nike, Inc. | 850,656 | 50,188,704 | ||||||
Nordstrom, Inc. | 4,250 | 203,278 | ||||||
NVR, Inc. (1) | 118 | 284,452 | ||||||
Omnicom Group, Inc. | 8,268 | 685,417 | ||||||
O’Reilly Automotive, Inc. (1) | 3,204 | 700,843 | ||||||
Panera Bread Co. (1) | 762 | 239,756 | ||||||
Polaris Industries, Inc. | 2,097 | 193,406 | ||||||
Pool Corp. | 1,419 | 166,832 | ||||||
Pulte Group, Inc. | 2,993 | 73,418 | ||||||
Regal Entertainment Group | 847 | 17,330 | ||||||
Ross Stores, Inc. | 13,729 | 792,575 | ||||||
Sally Beauty Holdings, Inc. (1) | 1,690 | 34,223 | ||||||
Scripps Networks Interactive, Inc. | 1,698 | 115,990 | ||||||
Service Corp. International | 6,520 | 218,094 | ||||||
ServiceMaster Global Holdings, Inc. (1) | 4,771 | 186,975 | ||||||
Sirius XM Holdings, Inc. | 50,425 | 275,825 | ||||||
Six Flags Entertainment Corp. | 2,538 | 151,290 | ||||||
Skechers USA, Inc. (1) | 2,035 | 60,033 | ||||||
Starbucks Corp. | 1,161,612 | 67,733,596 | ||||||
Steven Madden Ltd. (1) | 169,115 | 6,756,144 | ||||||
Tempur Sealy International, Inc. (1) | 635 | 33,903 | ||||||
Tesla, Inc. (1) | 42,459 | 15,353,599 | ||||||
The Madison Square Garden Co. (1) | 45 | 8,861 | ||||||
The Michaels Companies, Inc. (1) | 425,555 | 7,881,279 | ||||||
The Priceline Group, Inc. (1) | 27,710 | 51,832,109 | ||||||
Thor Industries, Inc. | 1,766 | 184,582 | ||||||
TJX Companies, Inc. | 23,547 | 1,699,387 | ||||||
Toll Brothers, Inc. | 2,546 | 100,592 | ||||||
Tractor Supply Co. | 4,613 | 250,071 | ||||||
TripAdvisor, Inc. (1) | 1,861 | 71,090 | ||||||
Tupperware Brands Corp. | 1,783 | 125,220 | ||||||
Twenty-First Century Fox, Inc. - Class A | 2,818 | 79,862 | ||||||
Ulta Beauty, Inc. (1) | 33,933 | 9,750,308 | ||||||
Under Armour, Inc. - Class A (1) | 4,841 | 105,340 | ||||||
| Shares | Value | |||||||
Under Armour, Inc. - Class C (1) | 4,823 | 97,232 | ||||||
Vail Resorts, Inc. | 36,534 | 7,410,191 | ||||||
VF Corp. | 8,804 | 507,110 | ||||||
Visteon Corp. (1) | 1,146 | 116,961 | ||||||
Walt Disney Co. | 38,669 | 4,108,581 | ||||||
Wayfair, Inc. (1) | 1,371 | 105,402 | ||||||
Wendy’s Co. | 6,520 | 101,125 | ||||||
Whirlpool Corp. | 246 | 47,139 | ||||||
Williams-Sonoma, Inc. | 610 | 29,585 | ||||||
Wyndham Worldwide Corp. | 3,663 | 367,802 | ||||||
Wynn Resorts Ltd. | 2,863 | 383,986 | ||||||
Yum China Holdings, Inc. (1) | 11,471 | 452,302 | ||||||
Yum! Brands, Inc. | 12,727 | 938,744 | ||||||
|
| |||||||
| 686,486,618 | ||||||||
|
| |||||||
Consumer Staples - 6.31% | ||||||||
Altria Group, Inc. | 69,969 | 5,210,591 | ||||||
Blue Buffalo Pet Products, Inc. (1) | 3,330 | 75,957 | ||||||
Brown Forman Corp. - Class A | 1,695 | 83,564 | ||||||
Brown Forman Corp. - Class B | 6,120 | 297,432 | ||||||
Campbell Soup Co. | 4,222 | 220,177 | ||||||
Church & Dwight Co., Inc. | 8,946 | 464,118 | ||||||
Clorox Co. | 3,937 | 524,566 | ||||||
Coca Cola Co. | 1,317,943 | 59,109,744 | ||||||
Colgate Palmolive Co. | 4,898 | 363,089 | ||||||
Constellation Brands, Inc. | 5,809 | 1,125,378 | ||||||
Costco Wholesale Corp. | 178,297 | 28,515,039 | ||||||
Dr Pepper Snapple Group, Inc. | 6,561 | 597,773 | ||||||
Energizer Holdings, Inc. | 2,199 | 105,596 | ||||||
Estee Lauder Cos, Inc. | 7,826 | 751,139 | ||||||
General Mills, Inc. | 15,083 | 835,598 | ||||||
Herbalife Ltd. (1) | 90,132 | 6,429,116 | ||||||
Kellogg Co. | 244,157 | 16,959,145 | ||||||
Kimberly-Clark Corp. | 10,970 | 1,416,337 | ||||||
Kroger Co. | 17,708 | 412,951 | ||||||
Lamb Weston Holdings, Inc. | 1,252 | 55,138 | ||||||
McCormick & Co., Inc. | 4,030 | 392,965 | ||||||
Molson Coors Brewing Co. | 286,315 | 24,720,437 | ||||||
| Shares | Value | |||||||
Mondelez International, Inc. | 884,671 | 38,208,940 | ||||||
Monster Beverage Corp. (1) | 306,203 | 15,212,165 | ||||||
Nu Skin Enterprises, Inc. | 529 | 33,242 | ||||||
PepsiCo, Inc. | 44,946 | 5,190,814 | ||||||
Philip Morris International, Inc. | 5,032 | 591,008 | ||||||
Pilgrim’s Pride Corp. (1) | 1,686 | 36,957 | ||||||
Procter & Gamble Co. | 293,681 | 25,594,299 | ||||||
Reynolds American, Inc. | 18,427 | 1,198,492 | ||||||
Rite Aid Corp. (1) | 17,637 | 52,029 | ||||||
Spectrum Brands Holdings, Inc. | 895 | 111,911 | ||||||
Sprouts Farmers Market, Inc. (1) | 4,783 | 108,431 | ||||||
Sysco Corp. | 18,014 | 906,645 | ||||||
The Hershey Co. | 4,492 | 482,306 | ||||||
TreeHouse Foods, Inc. (1) | 562 | 45,910 | ||||||
Walgreens Boots Alliance, Inc. | 235,224 | 18,420,391 | ||||||
Whole Foods Market, Inc. | 242,944 | 10,230,372 | ||||||
|
| |||||||
| 265,089,762 | ||||||||
|
| |||||||
Energy - 4.31% | ||||||||
Antero Resources Corp. (1) | 4,230 | 91,410 | ||||||
Apache Corp. | 854 | 40,932 | ||||||
Cabot Oil & Gas Corp. | 11,781 | 295,468 | ||||||
Cheniere Energy, Inc. (1) | 4,902 | 238,776 | ||||||
Chesapeake Energy Corp. (1) | 2,829 | 14,060 | ||||||
Cimarex Energy Co. | 85,285 | 8,017,643 | ||||||
Concho Resources, Inc. (1) | 68,050 | 8,270,117 | ||||||
ConocoPhillips | 262,015 | 11,518,179 | ||||||
Continental Resources, Inc. (1) | 1,496 | 48,366 | ||||||
Core Laboratories NV | 300,435 | 30,425,053 | ||||||
Devon Energy Corp. | 1,476 | 47,188 | ||||||
Diamondback Energy, Inc. (1) | 858 | 76,199 | ||||||
EOG Resources, Inc. | 164,640 | 14,903,213 | ||||||
Exxon Mobil Corp. | 307,150 | 24,796,220 | ||||||
Gulfport Energy Corp. (1) | 679 | 10,015 | ||||||
Halliburton Co. | 21,054 | 899,216 | ||||||
Laredo Petroleum, Inc. (1) | 5,968 | 62,783 | ||||||
Newfield Exploration Co. (1) | 7,230 | 205,766 | ||||||
ONEOK, Inc. | 8,159 | 425,573 | ||||||
| Shares | Value | |||||||
Parsley Energy, Inc. (1) | 5,611 | 155,705 | ||||||
Pioneer Natural Resources Co. | 65,355 | 10,429,351 | ||||||
RPC, Inc. | 1,966 | 39,733 | ||||||
RSP Permian, Inc. (1) | 2,482 | 80,094 | ||||||
Schlumberger Ltd. | 1,061,761 | 69,906,344 | ||||||
The Williams Companies, Inc. | 4,286 | 129,780 | ||||||
|
| |||||||
| 181,127,184 | ||||||||
|
| |||||||
Financials - 6.73% | ||||||||
Affiliated Managers Group, Inc. | 39,481 | 6,548,319 | ||||||
Allstate Corp. | 3,619 | 320,064 | ||||||
American International Group, Inc. | 4,027 | 251,768 | ||||||
Ameriprise Financial, Inc. | 4,910 | 624,994 | ||||||
Aon Plc | 197,436 | 26,249,116 | ||||||
Arch Capital Group Ltd. (1) | 617 | 57,560 | ||||||
Arthur J. Gallagher & Co. | 4,854 | 277,892 | ||||||
Aspen Insurance Holdings Ltd. | 666 | 33,200 | ||||||
Assurant, Inc. | 403 | 41,787 | ||||||
Bank of the Ozarks, Inc. | 1,860 | 87,178 | ||||||
BGC Partners, Inc. | 1,893 | 23,928 | ||||||
Capital One Financial Corp. | 1,079 | 89,147 | ||||||
CBOE Holdings, Inc. | 3,948 | 360,847 | ||||||
Charles Schwab Corp. | 34,353 | 1,475,805 | ||||||
Citigroup, Inc. | 848,235 | 56,729,957 | ||||||
Commerce Bancshares, Inc. | 300,025 | 17,050,421 | ||||||
Credit Acceptance Corp. (1) | 360 | 92,570 | ||||||
East West Bancorp, Inc. | 147,345 | 8,631,470 | ||||||
Eaton Vance Corp. | 3,944 | 186,630 | ||||||
Erie Indemnity Co. | 662 | 82,796 | ||||||
Federated Investors, Inc. | 970 | 27,403 | ||||||
First Republic Bank | 4,509 | 451,351 | ||||||
Intercontinental Exchange, Inc. | 867,676 | 57,197,202 | ||||||
Invesco Ltd. | 2,057 | 72,386 | ||||||
Lazard Ltd. | 3,862 | 178,926 | ||||||
Legg Mason, Inc. | 707 | 26,979 | ||||||
Leucadia National Corp. | 2,731 | 71,443 | ||||||
LPL Financial Holdings, Inc. | 3,140 | 133,324 | ||||||
MarketAxess Holdings, Inc. | 1,314 | 264,245 | ||||||
| Shares | Value | |||||||
Marsh & McLennan Companies, Inc. | 18,699 | 1,457,774 | ||||||
Moody’s Corp. | 5,958 | 724,969 | ||||||
Morgan Stanley | 633,211 | 28,215,882 | ||||||
MSCI, Inc. | 3,176 | 327,096 | ||||||
Pinnacle Financial Partners, Inc. | 760 | 47,728 | ||||||
Raymond James Financial, Inc. | 1,188 | 95,301 | ||||||
S&P Global, Inc. | 9,388 | 1,370,554 | ||||||
SEI Investments Co. | 4,773 | 256,692 | ||||||
Signature Bank (1) | 61,450 | 8,819,919 | ||||||
State Street Corp. | 358,061 | 32,128,814 | ||||||
SVB Financial Group (1) | 1,392 | 244,700 | ||||||
T. Rowe Price Group, Inc. | 1,331 | 98,774 | ||||||
TD Ameritrade Holding Corp. | 8,126 | 349,337 | ||||||
The Goldman Sachs Group, Inc. | 42,404 | 9,409,448 | ||||||
The Progressive Corp. | 481,216 | 21,216,813 | ||||||
Voya Financial, Inc. | 380 | 14,018 | ||||||
Western Alliance Bancorp (1) | 1,967 | 96,776 | ||||||
XL Group Ltd. | 2,960 | 129,648 | ||||||
|
| |||||||
| 282,642,951 | ||||||||
|
| |||||||
Healthcare - 13.78% | ||||||||
AbbVie, Inc. | 57,662 | 4,181,072 | ||||||
ABIOMED, Inc. (1) | 1,538 | 220,395 | ||||||
ACADIA Pharmaceuticals, Inc. (1) | 4,036 | 112,564 | ||||||
Aetna, Inc. | 3,742 | 568,148 | ||||||
Agilent Technologies, Inc. | 2,821 | 167,314 | ||||||
Agios Pharmaceuticals, Inc. (1) | 1,423 | 73,213 | ||||||
Akorn, Inc. (1) | 3,045 | 102,129 | ||||||
Alexion Pharmaceuticals, Inc. (1) | 6,302 | 766,764 | ||||||
Align Technology, Inc. (1) | 44,995 | 6,754,649 | ||||||
Alkermes Plc (1) | 5,465 | 316,806 | ||||||
Allergan Plc | 168,632 | 40,992,753 | ||||||
Alnylam Pharmaceuticals, Inc. (1) | 2,340 | 186,638 | ||||||
AmerisourceBergen Corp. | 5,732 | 541,846 | ||||||
Amgen, Inc. | 7,767 | 1,337,710 | ||||||
Athenahealth, Inc. (1) | 1,411 | 198,316 | ||||||
Baxter International, Inc. | 1,626 | 98,438 | ||||||
Becton Dickinson and Co. | 8,125 | 1,585,269 | ||||||
| Shares | Value | |||||||
Biogen, Inc. (1) | 7,214 | 1,957,591 | ||||||
BioMarin Pharmaceutical, Inc. (1) | 231,323 | 21,008,755 | ||||||
Bio-Techne Corp. | 1,339 | 157,332 | ||||||
Bioverativ, Inc. (1) | 3,867 | 232,677 | ||||||
Boston Scientific Corp. (1) | 272,030 | 7,540,672 | ||||||
Bristol Myers Squibb Co. | 401,666 | 22,380,830 | ||||||
Bruker Corp. | 1,401 | 40,405 | ||||||
C.R. Bard, Inc. | 2,602 | 822,518 | ||||||
Celgene Corp. (1) | 313,213 | 40,676,972 | ||||||
Centene Corp. (1) | 788 | 62,945 | ||||||
Cerner Corp. (1) | 538,644 | 35,803,667 | ||||||
Charles River Laboratories International, Inc. (1) | 1,673 | 169,224 | ||||||
Cigna Corp. | 7,882 | 1,319,368 | ||||||
Danaher Corp. | 222,950 | 18,814,751 | ||||||
DexCom, Inc. (1) | 3,083 | 225,521 | ||||||
Edwards Lifesciences Corp. (1) | 81,734 | 9,664,228 | ||||||
Eli Lilly & Co. | 178,958 | 14,728,243 | ||||||
Exelixis, Inc. (1) | 10,320 | 254,182 | ||||||
Express Scripts Holding Co. (1) | 1,471 | 93,909 | ||||||
Gilead Sciences, Inc. | 33,677 | 2,383,658 | ||||||
HCA Healthcare, Inc. (1) | 774 | 67,493 | ||||||
Henry Schein, Inc. (1) | 2,837 | 519,228 | ||||||
Hill-Rom Holdings, Inc. | 2,205 | 175,540 | ||||||
Hologic, Inc. (1) | 5,692 | 258,303 | ||||||
Humana, Inc. | 60,790 | 14,627,290 | ||||||
IDEXX Laboratories, Inc. (1) | 3,131 | 505,406 | ||||||
Illumina, Inc. (1) | 54,485 | 9,454,237 | ||||||
Incyte Corp. (1) | 6,040 | 760,496 | ||||||
Intercept Pharmaceuticals, Inc. (1) | 640 | 77,485 | ||||||
Intrexon Corp. (1) | 1,402 | 33,774 | ||||||
Intuitive Surgical, Inc. (1) | 1,324 | 1,238,430 | ||||||
Ionis Pharmaceuticals, Inc. (1) | 4,697 | 238,936 | ||||||
Johnson & Johnson | 284,854 | 37,683,336 | ||||||
LifePoint Health, Inc. (1) | 207 | 13,900 | ||||||
McKesson Corp. | 797 | 131,138 | ||||||
Medtronic Plc | 253,207 | 22,472,121 | ||||||
Merck & Co., Inc. | 5,398 | 345,958 | ||||||
| Shares | Value | |||||||
Mettler-Toledo International, Inc. (1) | 914 | 537,926 | ||||||
Neurocrine Biosciences, Inc. (1) | 3,152 | 144,992 | ||||||
Novo Nordisk A/S - ADR | 712,554 | 30,561,441 | ||||||
OPKO Health, Inc. (1) | 1,406 | 9,251 | ||||||
Patheon NV (1) | 1,199 | 41,821 | ||||||
Patterson Companies, Inc. | 296 | 13,897 | ||||||
PerkinElmer, Inc. | 756 | 51,514 | ||||||
Pfizer, Inc. | 1,122,245 | 37,696,210 | ||||||
Premier, Inc. (1) | 553 | 19,908 | ||||||
QIAGEN NV | 2,690 | 90,196 | ||||||
Quintiles IMS Holdings, Inc. (1) | 2,981 | 266,800 | ||||||
Regeneron Pharmaceuticals, Inc. (1) | 80,005 | 39,293,656 | ||||||
ResMed, Inc. | 4,987 | 388,338 | ||||||
Seattle Genetics, Inc. (1) | 3,423 | 177,106 | ||||||
Shire Plc - ADR | 43,115 | 7,125,616 | ||||||
Stryker Corp. | 12,284 | 1,704,774 | ||||||
Teleflex, Inc. | 258 | 53,602 | ||||||
TESARO, Inc. (1) | 1,328 | 185,734 | ||||||
The Cooper Companies, Inc. | 1,346 | 322,259 | ||||||
Thermo Fisher Scientific, Inc. | 82,633 | 14,416,980 | ||||||
UnitedHealth Group, Inc. | 356,875 | 66,171,763 | ||||||
Varian Medical Systems, Inc. (1) | 3,323 | 342,900 | ||||||
VCA, Inc. (1) | 2,807 | 259,114 | ||||||
Veeva Systems, Inc. (1) | 80,901 | 4,960,040 | ||||||
Vertex Pharmaceuticals, Inc. (1) | 37,849 | 4,877,601 | ||||||
Waters Corp. (1) | 2,729 | 501,699 | ||||||
WellCare Health Plans, Inc. (1) | 1,618 | 290,528 | ||||||
West Pharmaceutical Services, Inc. | 2,834 | 267,870 | ||||||
Zoetis, Inc. | 691,414 | 43,130,405 | ||||||
|
| |||||||
| 579,048,484 | ||||||||
|
| |||||||
Industrials - 10.29% | ||||||||
3M Co. | 20,989 | 4,369,700 | ||||||
A.O. Smith Corp. | 5,134 | 289,198 | ||||||
Acuity Brands, Inc. | 1,243 | 252,677 | ||||||
Air Lease Corp. | 238 | 8,892 | ||||||
Alaska Air Group, Inc. | 3,543 | 318,020 | ||||||
Allegion Plc | 3,394 | 275,321 | ||||||
| Shares | Value | |||||||
Allison Transmission Holdings, Inc. | 4,730 | 177,422 | ||||||
American Airlines Group, Inc. | 6,892 | 346,805 | ||||||
AMETEK, Inc. | 1,378 | 83,465 | ||||||
Armstrong World Industries, Inc. (1) | 1,515 | 69,690 | ||||||
Boeing Co. | 94,580 | 18,703,195 | ||||||
BWX Technologies, Inc. | 221,444 | 10,795,395 | ||||||
C.H. Robinson Worldwide, Inc. | 5,009 | 344,018 | ||||||
Caterpillar, Inc. | 18,703 | 2,009,824 | ||||||
Cintas Corp. | 3,079 | 388,077 | ||||||
Clean Harbors, Inc. (1) | 1,303 | 72,747 | ||||||
Copa Holdings SA | 70 | 8,190 | ||||||
Copart, Inc. (1) | 7,091 | 225,423 | ||||||
CSX Corp. | 200,799 | 10,955,593 | ||||||
Cummins, Inc. | 1,831 | 297,025 | ||||||
Deere & Co. | 82,210 | 10,160,334 | ||||||
Donaldson Co., Inc. | 4,352 | 198,190 | ||||||
Dover Corp. | 619 | 49,656 | ||||||
Dun & Bradstreet Corp. | 75,644 | 8,180,899 | ||||||
Eaton Corp. Plc | 187,930 | 14,626,592 | ||||||
Emerson Electric Co. | 3,289 | 196,090 | ||||||
Equifax, Inc. | 4,266 | 586,234 | ||||||
Expeditors International of Washington, Inc. | 4,523 | 255,459 | ||||||
Fastenal Co. | 289,138 | 12,586,177 | ||||||
FedEx Corp. | 9,000 | 1,955,970 | ||||||
Fortive Corp. | 9,946 | 630,079 | ||||||
Fortune Brands Home & Security, Inc. | 5,192 | 338,726 | ||||||
Gardner Denver Holdings, Inc. (1) | 1,399 | 30,232 | ||||||
General Dynamics Corp. | 3,810 | 754,761 | ||||||
General Electric Co. | 555,199 | 14,995,925 | ||||||
Graco, Inc. | 1,967 | 214,954 | ||||||
HD Supply Holdings, Inc. (1) | 7,241 | 221,792 | ||||||
Heico Corp. | 826 | 59,340 | ||||||
Heico Corp. - Class A | 1,786 | 110,821 | ||||||
Hexcel Corp. | 2,192 | 115,716 | ||||||
Honeywell International, Inc. | 211,774 | 28,227,356 | ||||||
Hubbell, Inc. | 1,285 | 145,423 | ||||||
Huntington Ingalls Industries, Inc. | 1,389 | 258,576 | ||||||
| Shares | Value | |||||||
IDEX Corp. | 2,616 | 295,634 | ||||||
IHS Markit Ltd. (1) | 7,993 | 352,012 | ||||||
Illinois Tool Works, Inc. | 11,096 | 1,589,502 | ||||||
Ingersoll-Rand Plc | 4,602 | 420,577 | ||||||
J.B. Hunt Transportation Services, Inc. | 354,607 | 32,403,988 | ||||||
Johnson Controls International Plc | 480,880 | 20,850,957 | ||||||
Kansas City Southern | 297,467 | 31,129,922 | ||||||
KAR Auction Services, Inc. | 4,877 | 204,688 | ||||||
Landstar System, Inc. | 1,492 | 127,715 | ||||||
Lennox International, Inc. | 1,305 | 239,650 | ||||||
Lincoln Electric Holdings, Inc. | 2,092 | �� | 192,652 | |||||
Lockheed Martin Corp. | 8,145 | 2,261,133 | ||||||
Masco Corp. | 8,222 | 314,163 | ||||||
MSC Industrial Direct Co., Inc. | 685 | 58,883 | ||||||
Nordson Corp. | 2,057 | 249,555 | ||||||
Northrop Grumman Corp. | 5,856 | 1,503,294 | ||||||
Old Dominion Freight Line, Inc. | 1,455 | 138,574 | ||||||
Parker-Hannifin Corp. | 73,867 | 11,805,424 | ||||||
Quanta Services, Inc. (1) | 1,309 | 43,092 | ||||||
Raytheon Co. | 255,301 | 41,226,005 | ||||||
Robert Half International, Inc. | 4,413 | 211,515 | ||||||
Rockwell Automation, Inc. | 67,659 | 10,958,052 | ||||||
Rockwell Collins, Inc. | 5,807 | 610,200 | ||||||
Rollins, Inc. | 3,929 | 159,950 | ||||||
Roper Technologies, Inc. | 3,404 | 788,128 | ||||||
Sensata Technologies Holding NV (1) | 3,060 | 130,723 | ||||||
Snap-on, Inc. | 281 | 44,398 | ||||||
Southwest Airlines Co. | 20,418 | 1,268,775 | ||||||
Stanley Black & Decker, Inc. | 592 | 83,312 | ||||||
The Middleby Corp. (1) | 2,035 | 247,273 | ||||||
The Toro Co. | 3,777 | 261,708 | ||||||
TransDigm Group, Inc. | 39,083 | 10,508,246 | ||||||
TransUnion (1) | 4,575 | 198,143 | ||||||
Union Pacific Corp. | 255,067 | 27,779,347 | ||||||
United Parcel Service, Inc. | 232,263 | 25,685,965 | ||||||
United Rentals, Inc. (1) | 3,028 | 341,286 | ||||||
United Technologies Corp. | 281,160 | 34,332,448 | ||||||
| Shares | Value | |||||||
Univar, Inc. (1) | 3,683 | 107,544 | ||||||
Verisk Analytics, Inc. (1) | 204,930 | 17,289,944 | ||||||
W.W. Grainger, Inc. | 1,776 | 320,621 | ||||||
WABCO Holdings, Inc. (1) | 1,815 | 231,431 | ||||||
Wabtec Corp. | 98,140 | 8,979,810 | ||||||
Waste Management, Inc. | 13,108 | 961,472 | ||||||
Watsco, Inc. | 1,059 | 163,298 | ||||||
Welbilt, Inc. (1) | 4,469 | 84,241 | ||||||
XPO Logistics, Inc. (1) | 2,908 | 187,944 | ||||||
Xylem, Inc. | 3,337 | 184,970 | ||||||
|
| |||||||
| 432,418,143 | ||||||||
|
| |||||||
Information Technology - 33.89% | ||||||||
Accenture Plc | 22,461 | 2,777,976 | ||||||
Activision Blizzard, Inc. | 205,920 | 11,854,814 | ||||||
Acxiom Corp. (1) | 223,808 | 5,814,532 | ||||||
Adobe Systems, Inc. (1) | 192,630 | 27,245,587 | ||||||
Advanced Micro Devices, Inc. (1) | 29,544 | 368,709 | ||||||
Alibaba Group Holding Ltd. - ADR (1) | 203,739 | 28,706,825 | ||||||
Alliance Data Systems Corp. | 130,921 | 33,606,112 | ||||||
Alphabet, Inc. - Class A (1) | 155,937 | 144,971,510 | ||||||
Alphabet, Inc. - Class C (1) | 75,096 | 68,241,988 | ||||||
Amphenol Corp. | 10,980 | 810,544 | ||||||
Analog Devices, Inc. | 13,147 | 1,022,837 | ||||||
ANSYS, Inc. (1) | 3,052 | 371,367 | ||||||
Apple, Inc. | 838,234 | 120,722,461 | ||||||
Applied Materials, Inc. | 180,683 | 7,464,015 | ||||||
Arista Networks, Inc. (1) | 2,003 | 300,029 | ||||||
Atlassian Corporation Plc (1) | 2,626 | 92,383 | ||||||
Autodesk, Inc. (1) | 301,783 | 30,425,762 | ||||||
Automatic Data Processing, Inc. | 372,276 | 38,143,399 | ||||||
Black Knight Financial Services, Inc. (1) | 1,025 | 41,974 | ||||||
Booz Allen Hamilton Holding Corp. | 237,767 | 7,736,938 | ||||||
Broadcom Ltd. | 52,073 | 12,135,613 | ||||||
Broadridge Financial Solutions, Inc. | 4,186 | 316,294 | ||||||
Cadence Design Systems, Inc. (1) | 9,929 | 332,522 | ||||||
Cavium, Inc. (1) | 2,351 | 146,068 | ||||||
CDK Global, Inc. | 5,229 | 324,512 | ||||||
| Shares | Value | |||||||
CDW Corp. | 5,490 | 343,290 | ||||||
Cisco Systems, Inc. | 870,645 | 27,251,189 | ||||||
Citrix Systems, Inc. (1) | 5,405 | 430,130 | ||||||
Cognex Corp. | 2,976 | 252,662 | ||||||
Cognizant Technology Solutions - Class A | 21,344 | 1,417,242 | ||||||
Coherent, Inc. (1) | 874 | 196,641 | ||||||
CommScope Holding Co., Inc. (1) | 3,475 | 132,154 | ||||||
CoreLogic, Inc. (1) | 1,830 | 79,385 | ||||||
Corning, Inc. | 1,861 | 55,923 | ||||||
CoStar Group, Inc. (1) | 36,982 | 9,748,455 | ||||||
CSRA, Inc. | 457,962 | 14,540,294 | ||||||
Cypress Semiconductor Corp. | 950 | 12,968 | ||||||
Dell Technologies, Inc. - VMware, Inc. (1) | 7,338 | 448,425 | ||||||
DST Systems, Inc. | 249 | 15,363 | ||||||
DXC Technology Co. | 172,982 | 13,271,179 | ||||||
eBay, Inc. (1) | 714,935 | 24,965,530 | ||||||
Electronic Arts, Inc. (1) | 10,894 | 1,151,714 | ||||||
Euronet Worldwide, Inc. (1) | 1,794 | 156,742 | ||||||
F5 Networks, Inc. (1) | 2,322 | 295,033 | ||||||
Facebook, Inc. (1) | 882,919 | 133,303,111 | ||||||
FactSet Research Systems, Inc. | 1,530 | 254,255 | ||||||
Fidelity National Information Services, Inc. | 161,256 | 13,771,262 | ||||||
First Data Corp. (1) | 13,116 | 238,711 | ||||||
Fiserv, Inc. (1) | 7,603 | 930,151 | ||||||
FleetCor Technologies, Inc. (1) | 257,373 | 37,115,760 | ||||||
FLIR Systems, Inc. | 2,504 | 86,789 | ||||||
Fortinet, Inc. (1) | 5,255 | 196,747 | ||||||
Gartner, Inc. (1) | 3,146 | 388,562 | ||||||
Genpact Ltd. | 4,984 | 138,705 | ||||||
Global Payments, Inc. | 5,445 | 491,792 | ||||||
GoDaddy, Inc. (1) | 2,777 | 117,800 | ||||||
Guidewire Software, Inc. (1) | 100,861 | 6,930,159 | ||||||
Harris Corp. | 1,120 | 122,170 | ||||||
InterActiveCorp (1) | 2,495 | 257,584 | ||||||
International Business Machines Corp. | 21,387 | 3,289,962 | ||||||
Intuit, Inc. | 8,841 | 1,174,173 | ||||||
IPG Photonics Corp. (1) | 1,283 | 186,163 | ||||||
| Shares | Value | |||||||
J2 Global, Inc. | 113,115 | 9,624,955 | ||||||
Jack Henry & Associates, Inc. | 2,820 | 292,913 | ||||||
KLA-Tencor Corp. | 5,627 | 514,927 | ||||||
Lam Research Corp. | 5,874 | 830,760 | ||||||
LogMeIn, Inc. | 1,160 | 121,220 | ||||||
Manhattan Associates, Inc. (1) | 2,423 | 116,449 | ||||||
Mastercard, Inc. | 331,056 | 40,206,751 | ||||||
Match Group, Inc. (1) | 1,273 | 22,125 | ||||||
Maxim Integrated Products, Inc. | 10,077 | 452,457 | ||||||
MaxLinear, Inc. (1) | 163,496 | 4,559,903 | ||||||
Microchip Technology, Inc. | 7,602 | 586,722 | ||||||
Micron Technology, Inc. (1) | 28,794 | 859,789 | ||||||
Microsemi Corp. (1) | 3,326 | 155,657 | ||||||
Microsoft Corp. | 1,948,948 | 134,340,986 | ||||||
Motorola Solutions, Inc. | 302,333 | 26,224,364 | ||||||
National Instruments Corp. | 233,796 | 9,403,275 | ||||||
NCR Corp. (1) | 4,334 | 177,001 | ||||||
NetApp, Inc. | 8,310 | 332,816 | ||||||
NVIDIA Corp. | 136,940 | 19,796,046 | ||||||
NXP Semiconductors NV (1) | 6,906 | 755,862 | ||||||
ON Semiconductor Corp. (1) | 14,034 | 197,037 | ||||||
Oracle Corp. | 8,402 | 421,276 | ||||||
Palo Alto Networks, Inc. (1) | 97,831 | 13,090,766 | ||||||
Pandora Media, Inc. (1) | 8,004 | 71,396 | ||||||
Paychex, Inc. | 11,493 | 654,411 | ||||||
PayPal Holdings, Inc. (1) | 41,118 | 2,206,803 | ||||||
PTC, Inc. (1) | 4,101 | 226,047 | ||||||
Qorvo, Inc. (1) | 2,363 | 149,625 | ||||||
Red Hat, Inc. (1) | 655,481 | 62,762,306 | ||||||
Sabre Corp. | 5,832 | 126,963 | ||||||
Salesforce.com, Inc. (1) | 711,635 | 61,627,591 | ||||||
SAP SE - ADR | 284,171 | 29,744,179 | ||||||
ServiceNow, Inc. (1) | 5,999 | 635,894 | ||||||
Skyworks Solutions, Inc. | 6,609 | 634,134 | ||||||
Splunk, Inc. (1) | 96,312 | 5,479,190 | ||||||
Square, Inc. (1) | 7,953 | 186,577 | ||||||
SS&C Technologies Holdings, Inc. | 5,658 | 217,324 | ||||||
| Shares | Value | |||||||
Symantec Corp. | 22,105 | 624,466 | ||||||
Synopsys, Inc. (1) | 460 | 33,548 | ||||||
Tableau Software, Inc. (1) | 2,104 | 128,912 | ||||||
Take-Two Interactive Software, Inc. (1) | 3,557 | 261,013 | ||||||
Tencent Holdings Ltd. - ADR | 450,452 | 16,198,254 | ||||||
Teradyne, Inc. | 6,605 | 198,348 | ||||||
Texas Instruments, Inc. | 237,178 | 18,246,104 | ||||||
The Western Union Co. | 16,914 | 322,212 | ||||||
Total System Services, Inc. | 6,496 | 378,392 | ||||||
Trimble, Inc. (1) | 7,097 | 253,150 | ||||||
Twitter, Inc. (1) | 1,542 | 27,556 | ||||||
Tyler Technologies, Inc. (1) | 1,235 | 216,952 | ||||||
Ultimate Software Group, Inc. (1) | 41,709 | 8,761,393 | ||||||
Universal Display Corp. | 1,487 | 162,455 | ||||||
Vantiv, Inc. (1) | 244,057 | 15,458,570 | ||||||
VeriSign, Inc. (1) | 3,180 | 295,613 | ||||||
Versum Materials, Inc. | 400 | 13,000 | ||||||
Visa, Inc. | 885,804 | 83,070,699 | ||||||
VMware, Inc. (1) | 2,558 | 223,646 | ||||||
Western Digital Corp. | 1,496 | 132,546 | ||||||
WEX, Inc. (1) | 1,131 | 117,929 | ||||||
Workday, Inc. (1) | 130,641 | 12,672,177 | ||||||
Xilinx, Inc. | 8,431 | 542,282 | ||||||
Zebra Technologies Corp. (1) | 1,869 | 187,872 | ||||||
Zillow Group, Inc. - Class A (1) | 1,349 | 65,885 | ||||||
Zillow Group, Inc. - Class C (1) | 2,561 | 125,515 | ||||||
|
| |||||||
| 1,424,257,932 | ||||||||
|
| |||||||
Materials - 1.69% | ||||||||
Albemarle Corp. | 747 | 78,838 | ||||||
AptarGroup, Inc. | 527 | 45,775 | ||||||
Ardagh Group SA | 374 | 8,456 | ||||||
Avery Dennison Corp. | 3,011 | 266,082 | ||||||
Axalta Coating Systems Ltd. (1) | 7,580 | 242,863 | ||||||
Ball Corp. | 327,825 | 13,837,493 | ||||||
Berry Global Group, Inc. (1) | 4,634 | 264,184 | ||||||
Celanese Corp. | 2,982 | 283,111 | ||||||
Chemours Co. | 6,641 | 251,827 | ||||||
| Shares | Value | |||||||
Crown Holdings, Inc. (1) | 3,285 | 195,983 | ||||||
DuPont | 31,497 | 2,542,123 | ||||||
Eagle Materials, Inc. | 1,666 | 153,972 | ||||||
Ecolab, Inc. | 322,919 | 42,867,497 | ||||||
FMC Corp. | 4,798 | 350,494 | ||||||
Freeport-McMoRan, Inc. (1) | 9,713 | 116,653 | ||||||
Graphic Packaging Holding Co. | 7,647 | 105,376 | ||||||
Huntsman Corp. | 3,486 | 90,078 | ||||||
International Flavors & Fragrances, Inc. | 2,833 | 382,455 | ||||||
International Paper Co. | 13,401 | 758,631 | ||||||
Lyondellbasell Industries NV | 5,278 | 445,410 | ||||||
Martin Marietta Materials, Inc. | 2,054 | 457,179 | ||||||
Monsanto Co. | 15,918 | 1,884,055 | ||||||
NewMarket Corp. | 243 | 111,897 | ||||||
Owens-Illinois, Inc. (1) | 4,607 | 110,199 | ||||||
Packaging Corporation of America | 3,330 | 370,929 | ||||||
Platform Specialty Products Corp. (1) | 3,584 | 45,445 | ||||||
PPG Industries, Inc. | 8,563 | 941,588 | ||||||
Praxair, Inc. | 9,113 | 1,207,928 | ||||||
Royal Gold, Inc. | 864 | 67,539 | ||||||
RPM International, Inc. | 4,337 | 236,583 | ||||||
Scotts Miracle-Gro Co. | 1,484 | 132,759 | ||||||
Sealed Air Corp. | 4,138 | 185,217 | ||||||
Silgan Holdings, Inc. | 2,676 | 85,043 | ||||||
Southern Copper Corp. | 2,593 | 89,796 | ||||||
Steel Dynamics, Inc. | 1,186 | 42,471 | ||||||
The Sherwin-Williams Co. | 2,979 | 1,045,510 | ||||||
Vulcan Materials Co. | 4,374 | 554,098 | ||||||
W.R. Grace & Co. | 2,420 | 174,264 | ||||||
Westlake Chemical Corp. | 641 | 42,441 | ||||||
|
| |||||||
| 71,072,242 | ||||||||
|
| |||||||
Real Estate - 1.11% | ||||||||
American Tower Corp. | 15,314 | 2,026,349 | ||||||
Boston Properties, Inc. | 848 | 104,321 | ||||||
CBRE Group, Inc. (1) | 4,682 | 170,425 | ||||||
CoreSite Realty Corp. | 1,198 | 124,029 | ||||||
Crown Castle International Corp. | 72,002 | 7,213,160 | ||||||
| Shares | Value | |||||||
CubeSmart | 4,248 | 102,122 | ||||||
CyrusOne, Inc. | 2,750 | 153,313 | ||||||
Digital Realty Trust, Inc. | 4,114 | 464,676 | ||||||
Douglas Emmett, Inc. | 4,102 | 156,737 | ||||||
DuPont Fabros Technology, Inc. | 2,746 | 167,945 | ||||||
Equinix, Inc. | 73,392 | 31,496,911 | ||||||
Equity Lifestyle Properties, Inc. | 2,871 | 247,882 | ||||||
Extra Space Storage, Inc. | 3,714 | 289,692 | ||||||
Federal Realty Investment Trust | 1,008 | 127,401 | ||||||
Gaming and Leisure Properties, Inc. | 2,385 | 89,843 | ||||||
Hudson Pacific Properties, Inc. | 548 | 18,736 | ||||||
Iron Mountain, Inc. | 8,299 | 285,154 | ||||||
Lamar Advertising Co. | 2,676 | 196,873 | ||||||
Outfront Media, Inc. | 782 | 18,080 | ||||||
Public Storage | 5,385 | 1,122,934 | ||||||
SBA Communications Corp. (1) | 4,312 | 581,689 | ||||||
Simon Property Group, Inc. | 10,232 | 1,655,128 | ||||||
Tanger Factory Outlet Centers, Inc. | 258 | 6,703 | ||||||
Taubman Centers, Inc. | 976 | 58,121 | ||||||
|
| |||||||
| 46,878,224 | ||||||||
|
| |||||||
Telecommunication Services - 0.91% | ||||||||
AT&T, Inc. | 911,435 | 34,388,443 | ||||||
T-Mobile US, Inc. (1) | 6,511 | 394,697 | ||||||
Verizon Communications, Inc. | 73,931 | 3,301,758 | ||||||
Zayo Group Holdings, Inc. (1) | 6,649 | 205,454 | ||||||
|
| |||||||
| 38,290,352 | ||||||||
|
| |||||||
Utilities - 0.00% (3) | ||||||||
NRG Energy, Inc. | 2,094 | 36,059 | ||||||
|
| |||||||
Total Common Stocks (Cost $3,437,578,870) | $ | 4,007,347,951 | ||||||
|
| |||||||
SHORT-TERM INVESTMENTS - 4.30% | ||||||||
Money Market Funds - 4.30% | ||||||||
Goldman Sachs Financial Square Government Fund - Class I, 0.86% (2) | 90,274,862 | $ | 90,274,862 | |||||
JPMorgan U.S. Government Money Market Fund - Class I, 0.85% (2) | 90,274,863 | 90,274,863 | ||||||
|
| |||||||
Total Short-Term Investments (Cost $180,549,725) | $ | 180,549,725 | ||||||
|
| |||||||
TOTAL INVESTMENTS IN SECURITIES - 99.66% | ||||||||
(Cost $3,618,128,595) | $ | 4,187,897,676 | ||||||
OTHER ASSETS IN EXCESS OF LIABILITIES - 0.34% | 14,577,461 | |||||||
|
| |||||||
TOTAL NET ASSETS - 100.00% | $ | 4,202,475,137 | ||||||
|
| |||||||
Percentages are stated as a percent of net assets.
ADR American Depositary Receipt
| (1) | Non-income producing security. |
| (2) | Represents annualized seven-day yield as of the close of the reporting period. |
| (3) | Amount calculated is less than 0.005%. |
The sector classifications listed above are in accordance with Global Industry Classification Standards (GICS), which was developed by and/or is the exclusive property of MSCI, Inc. and Standard & Poor’s Financial Services LLC (“S&P”).
Bridge Builder Large Cap Value Fund
Schedule of Investments
June 30, 2017
| Shares | Value | |||||||
COMMON STOCKS - 95.27% | ||||||||
Consumer Discretionary - 12.77% | ||||||||
Adient Plc | 3,869 | $ | 252,956 | |||||
Advance Auto Parts, Inc. | 2,146 | 250,202 | ||||||
Aramark | 5,842 | 239,405 | ||||||
AutoNation, Inc. (1) | 617,969 | 26,053,573 | ||||||
AutoZone, Inc. (1) | 168 | 95,837 | ||||||
Bed Bath & Beyond, Inc. | 5,717 | 173,797 | ||||||
Best Buy, Inc. | 10,875 | 623,464 | ||||||
Borgwarner, Inc. | 7,812 | 330,916 | ||||||
Brunswick Corp. | 641 | 40,210 | ||||||
Burlington Stores, Inc. (1) | 1,285 | 118,207 | ||||||
Cabela’s, Inc. (1) | 2,284 | 135,715 | ||||||
CalAtlantic Group, Inc. | 2,746 | 97,071 | ||||||
Carnival Corp. | 405,546 | 26,591,651 | ||||||
CBS Corp. | 380,759 | 24,284,809 | ||||||
Charter Communications, Inc. (1) | 2,716 | 914,885 | ||||||
Cinemark Holdings, Inc. | 4,372 | 169,852 | ||||||
Coach, Inc. | 9,637 | 456,216 | ||||||
Comcast Corp. - Class A | 14,570 | 567,064 | ||||||
D. R. Horton, Inc. | 6,339 | 219,139 | ||||||
Dick’s Sporting Goods, Inc. | 746 | 29,713 | ||||||
Discovery Communications, Inc. - Class A (1) | 6,234 | 161,024 | ||||||
Discovery Communications, Inc. - Class C (1) | 8,626 | 217,461 | ||||||
DISH Network Corp. (1) | 2,124 | 133,302 | ||||||
Dollar General Corp. | 305,212 | 22,002,733 | ||||||
Dollar Tree, Inc. (1) | 503 | 35,170 | ||||||
Extended Stay America, Inc. | 2,980 | 57,693 | ||||||
Foot Locker, Inc. | 5,002 | 246,499 | ||||||
Ford Motor Co. | 163,309 | 1,827,428 | ||||||
| Shares | Value | |||||||
GameStop Corp. | 4,432 | 95,776 | ||||||
Gap, Inc. | 9,391 | 206,508 | ||||||
Garmin Ltd. | 4,993 | 254,793 | ||||||
General Motors Co. | 57,285 | 2,000,965 | ||||||
Gentex Corp. | 5,408 | 102,590 | ||||||
Genuine Parts Co. | 3,693 | 342,563 | ||||||
Goodyear Tire & Rubber Co. | 10,367 | 362,430 | ||||||
Graham Holdings Co. | 179 | 107,337 | ||||||
H&R Block, Inc. | 7,205 | 222,707 | ||||||
Hanesbrands, Inc. | 722,000 | 16,721,520 | ||||||
Harley-Davidson, Inc. | 1,953 | 105,501 | ||||||
Hasbro, Inc. | 1,136 | 126,675 | ||||||
Hilton Worldwide Holdings, Inc. | 859 | 53,129 | ||||||
Hyatt Hotels Corp. (1) | 1,384 | 77,795 | ||||||
International Game Technology Plc | 4,807 | 87,968 | ||||||
Interpublic Group of Companies, Inc. | 2,497 | 61,426 | ||||||
John Wiley & Sons, Inc. | 1,821 | 96,058 | ||||||
Kohl’s Corp. | 7,069 | 273,358 | ||||||
L Brands, Inc. | 8,405 | 452,945 | ||||||
Lear Corp. | 472 | 67,062 | ||||||
Leggett & Platt, Inc. | 1,065 | 55,944 | ||||||
Lennar Corp. - Class A | 8,205 | 437,491 | ||||||
Lennar Corp. - Class B | 402 | 18,078 | ||||||
Liberty Broadband Corp. - Class A (1) | 1,049 | 89,994 | ||||||
Liberty Broadband Corp. - Class C (1) | 4,277 | 371,030 | ||||||
Liberty Expedia Holdings, Inc. (1) | 264,725 | 14,300,444 | ||||||
Liberty Interactive Corp. (1) | 1,459,184 | 35,808,375 | ||||||
Liberty Media Group LLC - Class A (1) | 1,017 | 35,626 | ||||||
Liberty Media Group LLC - Class C (1) | 4,369 | 159,993 | ||||||
Liberty SiriusXM Group - Class A (1) | 3,707 | 155,620 | ||||||
Liberty SiriusXM Group - Class C (1) | 7,355 | 306,704 | ||||||
Liberty Ventures (1) | 473,551 | 24,761,982 | ||||||
Lions Gate Entertainment Corp. - Class A (1) | 548 | 15,450 | ||||||
Lions Gate Entertainment Corp. - Class B (1) | 1,450 | 38,093 | ||||||
LKQ Corp. (1) | 10,839 | 357,145 | ||||||
Lowes Companies, Inc. | 672,002 | 52,100,315 | ||||||
Macy’s, Inc. | 12,569 | 292,104 | ||||||
| Shares | Value | |||||||
Mattel, Inc. | 11,434 | 246,174 | ||||||
McDonald’s Corp. | 202,570 | 31,025,621 | ||||||
MGM Resorts International | 19,945 | 624,079 | ||||||
Michael Kors Holdings Ltd. (1) | 5,866 | 212,643 | ||||||
Michelin | 306,022 | 40,729,798 | ||||||
Mohawk Industries, Inc. (1) | 2,388 | 577,156 | ||||||
Morningstar, Inc. | 64 | 5,014 | ||||||
Murphy USA, Inc. (1) | 1,418 | 105,088 | ||||||
Newell Brands, Inc. | 493,788 | 26,476,913 | ||||||
News Corp. - Class A | 1,610,848 | 22,068,618 | ||||||
News Corp. - Class B | 4,994 | 70,665 | ||||||
Nike, Inc. | 995,620 | 58,741,580 | ||||||
Norwegian Cruise Line Holdings Ltd. (1) | 540,104 | 29,322,246 | ||||||
NVR, Inc. (1) | 9,400 | 22,659,734 | ||||||
Penske Automotive Group, Inc. | 1,487 | 65,294 | ||||||
Pulte Group, Inc. | 8,621 | 211,473 | ||||||
PVH Corp. | 3,194 | 365,713 | ||||||
Ralph Lauren Corp. | 2,341 | 172,766 | ||||||
Regal Entertainment Group | 3,414 | 69,850 | ||||||
Royal Caribbean Cruises Ltd. | 231,508 | 25,287,619 | ||||||
Sally Beauty Holdings, Inc. (1) | 3,699 | 74,905 | ||||||
Scripps Networks Interactive, Inc. | 1,599 | 109,228 | ||||||
SeaWorld Entertainment, Inc. | 340,900 | 5,546,443 | ||||||
Signet Jewelers Ltd. | 2,812 | 177,831 | ||||||
Sirius XM Holdings, Inc. | 3,157 | 17,269 | ||||||
Skechers USA, Inc. (1) | 3,067 | 90,477 | ||||||
Staples, Inc. | 26,907 | 270,953 | ||||||
Target Corp. | 23,327 | 1,219,769 | ||||||
TEGNA, Inc. | 9,020 | 129,978 | ||||||
Tempur Sealy International, Inc. (1) | 1,173 | 62,626 | ||||||
The Madison Square Garden Co. (1) | 694 | 136,649 | ||||||
The Michaels Companies, Inc. (1) | 841 | 15,575 | ||||||
Tiffany & Co. | 4,444 | 417,158 | ||||||
Time Warner, Inc. | 32,311 | 3,244,348 | ||||||
TJX Companies, Inc. | 501,089 | 36,163,593 | ||||||
Toll Brothers, Inc. | 3,319 | 131,134 | ||||||
Tribune Media Co. | 2,923 | 119,171 | ||||||
| Shares | Value | |||||||
TripAdvisor, Inc. (1) | 2,398 | 91,604 | ||||||
Twenty-First Century Fox, Inc. - Class A | 946,980 | 26,837,413 | ||||||
Twenty-First Century Fox, Inc. - Class B | 18,029 | 502,468 | ||||||
Under Armour, Inc. - Class A (1) | 2,049 | 44,586 | ||||||
Under Armour, Inc. - Class C (1) | 2,080 | 41,933 | ||||||
Urban Outfitters, Inc. (1) | 3,541 | 65,650 | ||||||
VF Corp. | 474,077 | 27,306,835 | ||||||
Viacom, Inc. - Class A | 447 | 17,008 | ||||||
Viacom, Inc. - Class B | 14,471 | 485,791 | ||||||
Walt Disney Co. | 215,152 | 22,859,900 | ||||||
Whirlpool Corp. | 2,742 | 525,422 | ||||||
Williams-Sonoma, Inc. | 2,866 | 139,001 | ||||||
Yum China Holdings, Inc. (1) | 2,066 | 81,462 | ||||||
|
| |||||||
| 643,413,710 | ||||||||
|
| |||||||
Consumer Staples - 7.91% | ||||||||
Altria Group, Inc. | 336,400 | 25,051,708 | ||||||
Archer-Daniels-Midland Co. | 23,527 | 973,547 | ||||||
Brown Forman Corp. - Class A | 78 | 3,845 | ||||||
Brown Forman Corp. - Class B | 437 | 21,238 | ||||||
Bunge Ltd. | 5,777 | 430,964 | ||||||
Campbell Soup Co. | 2,533 | 132,096 | ||||||
Casey’s General Stores, Inc. | 1,603 | 171,697 | ||||||
Clorox Co. | 804 | 107,125 | ||||||
Coca Cola Co. | 870,492 | 39,041,566 | ||||||
Coca-Cola European Partners Plc | 640,000 | 26,028,800 | ||||||
Colgate Palmolive Co. | 533,610 | 39,556,509 | ||||||
Conagra Brands, Inc. | 16,690 | 596,834 | ||||||
Costco Wholesale Corp. | 278,223 | 44,496,204 | ||||||
Coty, Inc. | 19,233 | 360,811 | ||||||
CVS Health Corp. | 664,381 | 53,456,095 | ||||||
Diageo Plc - ADR | 243,631 | 29,194,303 | ||||||
Edgewell Personal Care Co. (1) | 2,357 | 179,179 | ||||||
Flowers Foods, Inc. | 7,271 | 125,861 | ||||||
General Mills, Inc. | 6,864 | 380,266 | ||||||
Hormel Foods Corp. | 11,088 | 378,212 | ||||||
Ingredion, Inc. | 2,935 | 349,881 | ||||||
Kellogg Co. | 761 | 52,859 | ||||||
| Shares | Value | |||||||
Kimberly-Clark Corp. | 2,160 | 278,878 | ||||||
Kraft Heinz Co. | 25,030 | 2,143,569 | ||||||
Kroger Co. | 17,210 | 401,337 | ||||||
Lamb Weston Holdings, Inc. | 4,632 | 203,993 | ||||||
Molson Coors Brewing Co. | 7,112 | 614,050 | ||||||
Mondelez International, Inc. | 61,231 | 2,644,567 | ||||||
Nu Skin Enterprises, Inc. | 1,521 | 95,580 | ||||||
PepsiCo, Inc. | 297,308 | 34,336,101 | ||||||
Philip Morris International, Inc. | 284,797 | 33,449,408 | ||||||
Pilgrim’s Pride Corp. (1) | 237 | 5,195 | ||||||
Pinnacle Foods, Inc. | 4,856 | 288,446 | ||||||
Post Holdings, Inc. (1) | 2,670 | 207,326 | ||||||
Procter & Gamble Co. | 302,930 | 26,400,350 | ||||||
Reynolds American, Inc. | 13,331 | 867,048 | ||||||
Rite Aid Corp. (1) | 23,122 | 68,210 | ||||||
Seaboard Corp. | 11 | 43,945 | ||||||
The Hain Celestial Group, Inc. (1) | 4,185 | 162,462 | ||||||
The Hershey Co. | 597 | 64,100 | ||||||
The J. M. Smucker Co. | 4,642 | 549,288 | ||||||
TreeHouse Foods, Inc. (1) | 1,592 | 130,051 | ||||||
Tyson Foods, Inc. | 11,476 | 718,742 | ||||||
US Foods Holding Corp. (1) | 5,507 | 149,901 | ||||||
Walgreens Boots Alliance, Inc. | 367,642 | 28,790,045 | ||||||
Wal-Mart Stores, Inc. | 60,718 | 4,595,138 | ||||||
Whole Foods Market, Inc. | 11,163 | 470,074 | ||||||
|
| |||||||
| 398,767,404 | ||||||||
|
| |||||||
Energy - 8.56% | ||||||||
Anadarko Petroleum Corp. | 23,695 | 1,074,331 | ||||||
Antero Resources Corp. (1) | 4,812 | 103,987 | ||||||
Apache Corp. | 520,413 | 24,943,395 | ||||||
Baker Hughes, Inc. | 17,891 | 975,238 | ||||||
BP Plc - ADR | 653,500 | 22,643,775 | ||||||
Cabot Oil & Gas Corp. | 5,608 | 140,649 | ||||||
Centennial Resource Development, Inc. (1) | 4,555 | 72,060 | ||||||
Cheniere Energy, Inc. (1) | 2,850 | 138,824 | ||||||
Chesapeake Energy Corp. (1) | 34,694 | 172,429 | ||||||
Chevron Corp. | 301,957 | 31,503,174 | ||||||
| Shares | Value | |||||||
Cimarex Energy Co. | 263 | 24,725 | ||||||
Concho Resources, Inc. (1) | 6,080 | 738,902 | ||||||
ConocoPhillips | 580,068 | 25,499,789 | ||||||
CONSOL Energy, Inc. (1) | 9,366 | 139,928 | ||||||
Continental Resources, Inc. (1) | 2,198 | 71,061 | ||||||
Devon Energy Corp. | 1,371,954 | 43,861,369 | ||||||
Diamondback Energy, Inc. (1) | 3,121 | 277,176 | ||||||
Energen Corp. (1) | 3,993 | 197,134 | ||||||
EOG Resources, Inc. | 273,743 | 24,779,216 | ||||||
EQT Corp. | 7,117 | 416,985 | ||||||
Extraction Oil & Gas, Inc. (1) | 4,948 | 66,551 | ||||||
Exxon Mobil Corp. | 525,038 | 42,386,318 | ||||||
Fairmount Santrol Holdings, Inc. (1) | 1,429,800 | 5,576,220 | ||||||
Gulfport Energy Corp. (1) | 5,902 | 87,055 | ||||||
Halliburton Co. | 11,561 | 493,770 | ||||||
Helmerich & Payne, Inc. | 4,441 | 241,324 | ||||||
Hess Corp. | 1,373,244 | 60,244,214 | ||||||
HollyFrontier Corp. | 7,291 | 200,284 | ||||||
Kinder Morgan, Inc. | 80,377 | 1,540,023 | ||||||
Kosmos Energy Ltd. (1) | 2,090,287 | 13,398,740 | ||||||
Marathon Oil Corp. | 34,973 | 414,430 | ||||||
Marathon Petroleum Corp. | 21,542 | 1,127,293 | ||||||
Murphy Oil Corp. | 6,737 | 172,669 | ||||||
Nabors Industries Ltd. | 11,980 | 97,517 | ||||||
National Oilwell Varco, Inc. | 15,665 | 516,005 | ||||||
Noble Energy, Inc. | 19,834 | 561,302 | ||||||
Occidental Petroleum Corp. | 963,925 | 57,710,190 | ||||||
Oceaneering International, Inc. | 4,038 | 92,228 | ||||||
Parsley Energy, Inc. (1) | 3,240 | 89,910 | ||||||
Patterson-UTI Energy, Inc. | 8,569 | 173,008 | ||||||
PBF Energy, Inc. | 4,500 | 100,170 | ||||||
Phillips 66 | 341,695 | 28,254,760 | ||||||
Pioneer Natural Resources Co. | 7,138 | 1,139,082 | ||||||
QEP Resources, Inc. (1) | 10,610 | 107,161 | ||||||
Range Resources Corp. | 9,398 | 217,752 | ||||||
Rice Energy, Inc. (1) | 3,245 | 86,414 | ||||||
RPC, Inc. | 191 | 3,860 | ||||||
| Shares | Value | |||||||
RSP Permian, Inc. (1) | 2,685 | 86,645 | ||||||
Schlumberger Ltd. | 521,407 | 34,329,437 | ||||||
SM Energy Co. | 4,102 | 67,806 | ||||||
Southwestern Energy Co. (1) | 20,777 | 126,324 | ||||||
Targa Resources Corp. | 8,026 | 362,775 | ||||||
Tesoro Corp. | 6,316 | 591,178 | ||||||
The Williams Companies, Inc. | 29,675 | 898,559 | ||||||
Transocean Ltd. (1) | 16,141 | 132,841 | ||||||
Valero Energy Corp. | 18,695 | 1,261,165 | ||||||
Weatherford International Plc (1) | 36,310 | 140,520 | ||||||
Whiting Petroleum Corp. (1) | 14,806 | 81,581 | ||||||
World Fuel Services Corp. | 3,033 | 116,619 | ||||||
WPX Energy, Inc. (1) | 16,017 | 154,724 | ||||||
|
| |||||||
| 431,222,571 | ||||||||
|
| |||||||
Financials - 19.89% | ||||||||
Affiliated Managers Group, Inc. | 2,479 | 411,167 | ||||||
Aflac, Inc. | 16,195 | 1,258,028 | ||||||
AGNC Investment Corp. | 891,273 | 18,975,202 | ||||||
Alleghany Corp. (1) | 52,170 | 31,030,716 | ||||||
Allied World Assurance Co. Holdings AG | 3,508 | 185,573 | ||||||
Allstate Corp. | 11,020 | 974,609 | ||||||
Ally Financial, Inc. | 19,742 | 412,608 | ||||||
American Express Co. | 725,000 | 61,074,000 | ||||||
American Financial Group, Inc. | 3,048 | 302,880 | ||||||
American International Group, Inc. | 403,787 | 25,244,763 | ||||||
American National Insurance Co. | 340 | 39,607 | ||||||
Ameriprise Financial, Inc. | 627 | 79,811 | ||||||
Annaly Capital Management, Inc. | 41,912 | 505,040 | ||||||
Arch Capital Group Ltd. (1) | 4,263 | 397,695 | ||||||
Arthur J. Gallagher & Co. | 2,432 | 139,232 | ||||||
Aspen Insurance Holdings Ltd. | 1,680 | 83,748 | ||||||
Associated Banc Corp. | 6,433 | 162,112 | ||||||
Assurant, Inc. | 2,014 | 208,832 | ||||||
Assured Guaranty Ltd. | 4,942 | 206,279 | ||||||
Athene Holding Ltd. (1) | 1,832 | 90,886 | ||||||
Axis Capital Holdings Ltd. | 3,745 | 242,152 | ||||||
Bank of America Corp. | 1,952,354 | 47,364,108 | ||||||
| Shares | Value | |||||||
Bank of Hawaii Corp. | 1,733 | 143,787 | ||||||
Bank of New York Mellon Corp. | 42,108 | 2,148,350 | ||||||
Bank of the Ozarks, Inc. | 2,532 | 118,675 | ||||||
BankUnited, Inc. | 4,284 | 144,414 | ||||||
BB&T Corp. | 34,150 | 1,550,751 | ||||||
Berkshire Hathaway, Inc. (1) | 497,497 | 84,261,067 | ||||||
BGC Partners, Inc. | 7,010 | 88,606 | ||||||
BlackRock, Inc. | 71,406 | 30,162,608 | ||||||
BOK Financial Corp. | 1,027 | 86,402 | ||||||
Brown & Brown, Inc. | 4,894 | 210,785 | ||||||
Capital One Financial Corp. | 252,157 | 20,833,211 | ||||||
Charles Schwab Corp. | 10,011 | 430,073 | ||||||
Chimera Investment Corp. | 7,940 | 147,922 | ||||||
Chubb Ltd. | 529,334 | 76,954,577 | ||||||
Cincinnati Financial Corp. | 6,426 | 465,564 | ||||||
CIT Group, Inc. | 8,456 | 411,807 | ||||||
Citigroup, Inc. | 1,447,005 | 96,775,694 | ||||||
Citizens Financial Group, Inc. | 20,881 | 745,034 | ||||||
CME Group, Inc. | 14,146 | 1,771,645 | ||||||
CNA Financial Corp. | 1,112 | 54,210 | ||||||
Comerica, Inc. | 7,261 | 531,796 | ||||||
Commerce Bancshares, Inc. | 3,674 | 208,793 | ||||||
Credit Acceptance Corp. (1) | 44 | 11,314 | ||||||
Cullen/Frost Bankers, Inc. | 2,342 | 219,937 | ||||||
Discover Financial Services | 305,468 | 18,997,055 | ||||||
E*TRADE Financial Corp. (1) | 549,740 | 20,906,612 | ||||||
East West Bancorp, Inc. | 5,555 | 325,412 | ||||||
Erie Indemnity Co. | 228 | 28,516 | ||||||
Everest Re Group Ltd. | 1,723 | 438,659 | ||||||
F.N.B. Corp. | 13,213 | 187,096 | ||||||
Fifth Third Bancorp | 32,241 | 836,976 | ||||||
First American Financial Corp. | 4,424 | 197,709 | ||||||
First Hawaiian, Inc. | 2,185 | 66,905 | ||||||
First Horizon National Corp. | 9,951 | 173,346 | ||||||
First Republic Bank | 1,339 | 134,034 | ||||||
FNF Group | 436,079 | 19,549,422 | ||||||
Franklin Resources, Inc. | 14,420 | 645,872 | ||||||
| Shares | Value | |||||||
Hanover Insurance Group, Inc. | 2,016 | 178,678 | ||||||
Harford Financial Services Group, Inc. | 15,451 | 812,259 | ||||||
Huntington Bancshares, Inc. | 44,487 | 601,464 | ||||||
Interactive Brokers Group, Inc. | 2,775 | 103,840 | ||||||
Intercontinental Exchange, Inc. | 12,873 | 848,588 | ||||||
Invesco Ltd. | 14,106 | 496,390 | ||||||
JPMorgan Chase & Co. | 520,614 | 47,584,120 | ||||||
KeyCorp | 1,477,570 | 27,689,662 | ||||||
Lazard Ltd. | 494 | 22,887 | ||||||
Legg Mason, Inc. | 2,719 | 103,757 | ||||||
Leucadia National Corp. | 10,158 | 265,733 | ||||||
Lincoln National Corp. | 9,617 | 649,917 | ||||||
Loews Corp. | 11,837 | 554,090 | ||||||
M&T Bank Corp. | 6,100 | 987,895 | ||||||
Markel Corp. (1) | 582 | 567,951 | ||||||
Marsh & McLennan Companies, Inc. | 437,328 | 34,094,091 | ||||||
Mercury General Corp. | 1,122 | 60,588 | ||||||
MetLife, Inc. | 38,254 | 2,101,675 | ||||||
MFA Financial, Inc. | 16,008 | 134,307 | ||||||
Morgan Stanley | 55,215 | 2,460,380 | ||||||
Nasdaq OMX Group, Inc. | 4,734 | 338,434 | ||||||
Navient Corp. | 1,275,300 | 21,233,745 | ||||||
New Residential Investment Corp. | 12,629 | 196,507 | ||||||
New York Community Bancorp, Inc. | 1,334,072 | 17,516,365 | ||||||
Northern Trust Corp. | 8,854 | 860,697 | ||||||
Old Republic International Corp. | 9,697 | 189,382 | ||||||
OneMain Holdings, Inc. (1) | 2,082 | 51,196 | ||||||
PacWest Bancorp | 5,124 | 239,291 | ||||||
People’s United Financial, Inc. | 13,921 | 245,845 | ||||||
Pinnacle Financial Partners, Inc. | 2,062 | 129,494 | ||||||
PNC Financial Services Group, Inc. | 487,084 | 60,822,179 | ||||||
Popular, Inc. | 4,141 | 172,721 | ||||||
Principal Financial Group, Inc. | 11,346 | 726,938 | ||||||
ProAssurance Corp. | 2,260 | 137,408 | ||||||
Prosperity Bancshares, Inc. | 2,729 | 175,311 | ||||||
Prudential Financial, Inc. | 17,938 | 1,939,815 | ||||||
Raymond James Financial, Inc. | 3,920 | 314,462 | ||||||
| Shares | Value | |||||||
Regions Financial Corp. | 49,521 | 724,987 | ||||||
Reinsurance Group of America, Inc. | 2,676 | 343,572 | ||||||
RenaissanceRe Holdings Ltd. | 1,061 | 147,532 | ||||||
Santander Consumer USA Holdings, Inc. (1) | 6,078 | 77,555 | ||||||
Signature Bank (1) | 915 | 131,330 | ||||||
SLM Corp. (1) | 2,509,135 | 28,855,053 | ||||||
Starwood Property Trust, Inc. | 10,426 | 233,438 | ||||||
State Street Corp. | 264,637 | 23,745,878 | ||||||
SunTrust Banks, Inc. | 20,525 | 1,164,178 | ||||||
SVB Financial Group (1) | 582 | 102,310 | ||||||
Synchrony Financial | 34,129 | 1,017,727 | ||||||
Synovus Financial Corp. | 5,138 | 227,305 | ||||||
T. Rowe Price Group, Inc. | 8,509 | 631,453 | ||||||
TCF Financial Corp. | 6,531 | 104,104 | ||||||
TD Ameritrade Holding Corp. | 1,032 | 44,366 | ||||||
TFS Financial Corp. | 2,652 | 41,026 | ||||||
The Goldman Sachs Group, Inc. | 148,250 | 32,896,675 | ||||||
Torchmark Corp. | 5,070 | 387,855 | ||||||
Travelers Companies, Inc. | 11,625 | 1,470,911 | ||||||
Two Harbors Investment Corp. | 14,486 | 143,556 | ||||||
U.S. Bancorp | 65,269 | 3,388,766 | ||||||
Unum Group | 9,398 | 438,229 | ||||||
Validus Holdings Ltd. | 3,548 | 184,390 | ||||||
Voya Financial, Inc. | 7,218 | 266,272 | ||||||
W.R. Berkley Corp. | 3,918 | 271,008 | ||||||
Webster Financial Corp. | 3,768 | 196,765 | ||||||
Wells Fargo & Co. | 1,071,440 | 59,368,490 | ||||||
Western Alliance Bancorp (1) | 1,744 | 85,805 | ||||||
White Mountains Insurance Group Ltd. | 197 | 171,120 | ||||||
Willis Towers Watson Plc | 143,914 | 20,933,730 | ||||||
XL Group Ltd. | 634,716 | 27,800,561 | ||||||
Zions Bancorp | 8,440 | 370,600 | ||||||
|
| |||||||
| 1,001,928,293 | ||||||||
|
| |||||||
Healthcare - 13.77% | ||||||||
Abbott Laboratories | 70,612 | 3,432,449 | ||||||
Acadia Healthcare Co., Inc. (1) | 3,231 | 159,547 | ||||||
Aetna, Inc. | 9,049 | 1,373,910 | ||||||
| Shares | Value | |||||||
Agilent Technologies, Inc. | 10,058 | 596,540 | ||||||
Agios Pharmaceuticals, Inc. (1) | 128 | 6,586 | ||||||
Akorn, Inc. (1) | 188 | 6,305 | ||||||
Alere, Inc. (1) | 3,538 | 177,572 | ||||||
Alexion Pharmaceuticals, Inc. (1) | 1,731 | 210,611 | ||||||
Allergan Plc | 87,437 | 21,255,060 | ||||||
Alnylam Pharmaceuticals, Inc. (1) | 326 | 26,002 | ||||||
Amgen, Inc. | 176,219 | 30,350,198 | ||||||
Anthem, Inc. | 176,336 | 33,174,092 | ||||||
Baxter International, Inc. | 18,630 | 1,127,860 | ||||||
Bayer AG - ADR | 132,500 | 17,207,112 | ||||||
Biogen, Inc. (1) | 524 | 142,193 | ||||||
Bio-Rad Laboratories, Inc. (1) | 862 | 195,079 | ||||||
Bristol Myers Squibb Co. | 34,966 | 1,948,306 | ||||||
Brookdale Senior Living, Inc. (1) | 7,574 | 111,414 | ||||||
Bruker Corp. | 2,738 | 78,964 | ||||||
Cardinal Health, Inc. | 1,105,999 | 86,179,442 | ||||||
Centene Corp. (1) | 6,120 | 488,866 | ||||||
Cigna Corp. | 144,767 | 24,232,548 | ||||||
Danaher Corp. | 25,596 | 2,160,046 | ||||||
DaVita, Inc. (1) | 6,412 | 415,241 | ||||||
Dentsply Sirona, Inc. | 9,281 | 601,780 | ||||||
Endo International Plc (1) | 9,092 | 101,558 | ||||||
Envision Healthcare Corp. (1) | 4,786 | 299,939 | ||||||
Express Scripts Holding Co. (1) | 829,625 | 52,963,260 | ||||||
Gilead Sciences, Inc. | 15,554 | 1,100,912 | ||||||
HCA Healthcare, Inc. (1) | 11,572 | 1,009,078 | ||||||
Hill-Rom Holdings, Inc. | 154 | 12,260 | ||||||
Hologic, Inc. (1) | 4,957 | 224,949 | ||||||
Humana, Inc. | 350 | 84,217 | ||||||
Intrexon Corp. (1) | 593 | 14,285 | ||||||
Johnson & Johnson | 446,233 | 59,032,164 | ||||||
Juno Therapeutics, Inc. (1) | 2,618 | 78,252 | ||||||
Laboratory Corp. of America Holdings (1) | 4,206 | 648,313 | ||||||
LifePoint Health, Inc. (1) | 1,275 | 85,616 | ||||||
Mallinckrodt Plc (1) | 4,075 | 182,601 | ||||||
McKesson Corp. | 206,887 | 34,041,187 | ||||||
| Shares | Value | |||||||
MEDNAX, Inc. (1) | 3,753 | 226,569 | ||||||
Medtronic Plc | 1,066,172 | 94,622,765 | ||||||
Merck & Co., Inc. | 1,021,572 | 65,472,549 | ||||||
Mylan (1) | 22,452 | 871,587 | ||||||
OPKO Health, Inc. (1) | 12,126 | 79,789 | ||||||
Patterson Companies, Inc. | 3,075 | 144,371 | ||||||
PerkinElmer, Inc. | 3,648 | 248,575 | ||||||
Perrigo Co. Plc | 5,273 | 398,217 | ||||||
Pfizer, Inc. | 1,014,259 | 34,068,960 | ||||||
Premier, Inc. (1) | 1,498 | 53,928 | ||||||
QIAGEN NV | 6,332 | 212,312 | ||||||
Quest Diagnostics, Inc. | 5,633 | 626,164 | ||||||
Quintiles IMS Holdings, Inc. (1) | 1,799 | 161,010 | ||||||
Roche Holding AG - ADR | 576,689 | 18,338,710 | ||||||
Sanofi - ADR | 325,800 | 15,609,078 | ||||||
STERIS Plc | 3,444 | 280,686 | ||||||
Teleflex, Inc. | 1,640 | 340,726 | ||||||
Teva Pharmaceutical Industries Ltd. - ADR | 626,200 | 20,802,364 | ||||||
The Cooper Companies, Inc. | 444 | 106,302 | ||||||
Thermo Fisher Scientific, Inc. | 8,960 | 1,563,251 | ||||||
United Therapeutics Corp. (1) | 1,833 | 237,795 | ||||||
UnitedHealth Group, Inc. | 335,445 | 62,198,212 | ||||||
Universal Health Services, Inc. | 3,571 | 435,948 | ||||||
VWR Corp. (1) | 3,509 | 115,832 | ||||||
WellCare Health Plans, Inc. (1) | 137 | 24,600 | ||||||
Zimmer Holdings, Inc. | 8,499 | 1,091,272 | ||||||
|
| |||||||
| 693,867,886 | ||||||||
|
| |||||||
Industrials - 10.59% | ||||||||
Acuity Brands, Inc. | 570 | 115,870 | ||||||
AECOM (1) | 6,508 | 210,404 | ||||||
AGCO Corp. | 2,742 | 184,783 | ||||||
Air Lease Corp. | 1,374,424 | 51,348,481 | ||||||
Alaska Air Group, Inc. | 952 | 85,452 | ||||||
AMERCO | 207 | 75,774 | ||||||
American Airlines Group, Inc. | 10,428 | 524,737 | ||||||
AMETEK, Inc. | 7,945 | 481,229 | ||||||
Arconic, Inc. | 16,090 | 364,438 | ||||||
| Shares | Value | |||||||
Canadian National Railway Co. | 494,772 | 40,101,271 | ||||||
Carlisle Companies, Inc. | 2,608 | 248,803 | ||||||
Caterpillar, Inc. | 2,202 | 236,627 | ||||||
Clean Harbors, Inc. (1) | 638 | 35,620 | ||||||
Colfax Corp. (1) | 3,637 | 143,189 | ||||||
Copa Holdings SA | 1,186 | 138,762 | ||||||
Crane Co. | 2,075 | 164,713 | ||||||
CSX Corp. | 3,701 | 201,927 | ||||||
Cummins, Inc. | 4,438 | 719,932 | ||||||
Delta Air Lines, Inc. | 28,215 | 1,516,274 | ||||||
Donaldson Co., Inc. | 279 | 12,706 | ||||||
Dover Corp. | 5,688 | 456,291 | ||||||
Dun & Bradstreet Corp. | 930 | 100,579 | ||||||
Eaton Corp. Plc | 18,837 | 1,466,084 | ||||||
Emerson Electric Co. | 23,366 | 1,393,081 | ||||||
Expeditors International of Washington, Inc. | 2,190 | 123,691 | ||||||
Flowserve Corp. | 5,370 | 249,329 | ||||||
Fluor Corp. | 5,752 | 263,327 | ||||||
Fortive Corp. | 1,201 | 76,083 | ||||||
Fortune Brands Home & Security, Inc. | 436 | 28,445 | ||||||
General Dynamics Corp. | 176,732 | 35,010,609 | ||||||
General Electric Co. | 299,324 | 8,084,741 | ||||||
Genesee & Wyoming, Inc. (1) | 2,507 | 171,454 | ||||||
Hexcel Corp. | 1,240 | 65,460 | ||||||
Honeywell International, Inc. | 379,813 | 50,625,275 | ||||||
Hubbell, Inc. | 804 | 90,989 | ||||||
Huntington Ingalls Industries, Inc. | 294 | 54,731 | ||||||
IDEX Corp. | 173 | 19,551 | ||||||
IHS Markit Ltd. (1) | 6,927 | 305,065 | ||||||
Ingersoll-Rand Plc | 5,247 | 479,523 | ||||||
ITT, Inc. | 3,761 | 151,117 | ||||||
Jacobs Engineering Group, Inc. | 270,299 | 14,701,563 | ||||||
JetBlue Airways Corp. (1) | 13,731 | 313,479 | ||||||
Johnson Controls International Plc | 652,790 | 28,304,959 | ||||||
Kansas City Southern | 4,351 | 455,332 | ||||||
Kirby Corp. (1) | 2,237 | 149,543 | ||||||
L3 Technologies, Inc. | 3,195 | 533,821 | ||||||
| Shares | Value | |||||||
Lennox International, Inc. | 95 | 17,446 | ||||||
Lockheed Martin Corp. | 131,205 | 36,423,820 | ||||||
Macquarie Infrastructure Corp. | 3,358 | 263,267 | ||||||
ManpowerGroup, Inc. | 2,756 | 307,707 | ||||||
Masco Corp. | 4,614 | 176,301 | ||||||
MSC Industrial Direct Co., Inc. | 1,071 | 92,063 | ||||||
Nielsen Holdings Plc | 411,713 | 15,916,825 | ||||||
Norfolk Southern Corp. | 12,205 | 1,485,348 | ||||||
Northrop Grumman Corp. | 89,203 | 22,899,302 | ||||||
Old Dominion Freight Line, Inc. | 952 | 90,668 | ||||||
Orbital ATK, Inc. | 2,361 | 232,228 | ||||||
Oshkosh Corp. | 2,990 | 205,951 | ||||||
Owens Corning | 398,665 | 26,678,662 | ||||||
PACCAR, Inc. | 14,545 | 960,552 | ||||||
Parker-Hannifin Corp. | 735 | 117,468 | ||||||
Pentair Plc | 6,822 | 453,936 | ||||||
Pitney Bowes, Inc. | 7,662 | 115,696 | ||||||
Quanta Services, Inc. (1) | 5,367 | 176,682 | ||||||
Raytheon Co. | 7,661 | 1,237,098 | ||||||
Regal-Beloit Corp. | 1,910 | 155,760 | ||||||
Republic Services, Inc. | 9,469 | 603,459 | ||||||
Roper Technologies, Inc. | 224 | 51,863 | ||||||
Ryder System, Inc. | 2,289 | 164,762 | ||||||
Sensata Technologies Holding NV (1) | 3,433 | 146,658 | ||||||
Snap-on, Inc. | 2,056 | 324,848 | ||||||
Spirit AeroSystems Holdings, Inc. | 380,968 | 22,073,286 | ||||||
Spirit Airlines, Inc. (1) | 2,856 | 147,512 | ||||||
Stanley Black & Decker, Inc. | 187,598 | 26,400,667 | ||||||
Stericycle, Inc. (1) | 3,399 | 259,412 | ||||||
Teledyne Technologies, Inc. (1) | 1,434 | 183,050 | ||||||
Terex Corp. | 3,712 | 139,200 | ||||||
Textron, Inc. | 11,044 | 520,172 | ||||||
The Timken Co. | 2,843 | 131,489 | ||||||
Trinity Industries, Inc. | 6,107 | 171,179 | ||||||
Union Pacific Corp. | 333,643 | 36,337,059 | ||||||
United Continental Holdings, Inc. (1) | 11,793 | 887,423 | ||||||
United Parcel Service, Inc. | 336,590 | 37,223,488 | ||||||
| Shares | Value | |||||||
United Technologies Corp. | 477,343 | 58,288,354 | ||||||
USG Corp. (1) | 3,610 | 104,762 | ||||||
Valmont Industries, Inc. | 910 | 136,136 | ||||||
W.W. Grainger, Inc. | 126 | 22,747 | ||||||
Wabtec Corp. | 2,398 | 219,417 | ||||||
Waste Management, Inc. | 3,274 | 240,148 | ||||||
WESCO International, Inc. (1) | 2,089 | 119,700 | ||||||
XPO Logistics, Inc. (1) | 1,199 | 77,491 | ||||||
Xylem, Inc. | 3,538 | 196,111 | ||||||
|
| |||||||
| 533,762,287 | ||||||||
|
| |||||||
Information Technology - 11.49% | ||||||||
Accenture Plc | 300,582 | 37,175,982 | ||||||
Akamai Technologies, Inc. (1) | 6,941 | 345,731 | ||||||
Alphabet, Inc. - Class C (1) | 49,928 | 45,371,071 | ||||||
Amdocs Ltd. | 5,984 | 385,729 | ||||||
Apple, Inc. | 494,539 | 71,223,507 | ||||||
ARRIS International Plc (1) | 7,420 | 207,908 | ||||||
Arrow Electronics, Inc. (1) | 152,830 | 11,984,929 | ||||||
Autodesk, Inc. (1) | 1,556 | 156,876 | ||||||
Automatic Data Processing, Inc. | 327,919 | 33,598,581 | ||||||
Avnet, Inc. | 459,602 | 17,869,326 | ||||||
Booz Allen Hamilton Holding Corp. | 235 | 7,647 | ||||||
Brocade Communications Systems, Inc. | 16,895 | 213,046 | ||||||
CA, Inc. | 13,635 | 469,998 | ||||||
Cisco Systems, Inc. | 208,979 | 6,541,043 | ||||||
Cognizant Technology Solutions - Class A | 459,756 | 30,527,798 | ||||||
CommScope Holding Co., Inc. (1) | 3,888 | 147,861 | ||||||
Conduent, Inc. (1) | 8,343 | 132,987 | ||||||
CoreLogic, Inc. (1) | 1,425 | 61,817 | ||||||
Corning, Inc. | 36,001 | 1,081,830 | ||||||
Cypress Semiconductor Corp. | 12,396 | 169,205 | ||||||
Dolby Laboratories, Inc. | 2,187 | 107,076 | ||||||
DST Systems, Inc. | 2,261 | 139,504 | ||||||
eBay, Inc. (1) | 42,346 | 1,478,722 | ||||||
EchoStar Corp. (1) | 2,018 | 122,493 | ||||||
Fidelity National Information Services, Inc. | 5,835 | 498,309 | ||||||
FireEye, Inc. (1) | 7,213 | 109,710 | ||||||
| Shares | Value | |||||||
First Solar, Inc. (1) | 3,354 | 133,758 | ||||||
FLIR Systems, Inc. | 2,617 | 90,705 | ||||||
Guidewire Software, Inc. (1) | 1,856 | 127,526 | ||||||
Harris Corp. | 3,727 | 406,541 | ||||||
Hewlett Packard Enterprise Co. | 69,540 | 1,153,669 | ||||||
HP, Inc. | 71,012 | 1,241,290 | ||||||
Intel Corp. | 196,524 | 6,630,720 | ||||||
International Business Machines Corp. | 11,209 | 1,724,280 | ||||||
Jabil, Inc. | 7,324 | 213,788 | ||||||
Juniper Networks, Inc. | 15,390 | 429,073 | ||||||
Keysight Technologies, Inc. (1) | 7,597 | 295,751 | ||||||
Leidos Holdings, Inc. | 5,848 | 302,283 | ||||||
LogMeIn, Inc. | 798 | 83,391 | ||||||
Marvell Technology Group Ltd. | 16,582 | 273,935 | ||||||
Microchip Technology, Inc. | 300,900 | 23,223,462 | ||||||
Micron Technology, Inc. (1) | 10,524 | 314,247 | ||||||
Microsemi Corp. (1) | 896 | 41,933 | ||||||
Microsoft Corp. | 1,043,813 | 71,950,030 | ||||||
Motorola Solutions, Inc. | 6,100 | 529,114 | ||||||
National Instruments Corp. | 774 | 31,130 | ||||||
NetApp, Inc. | 1,622 | 64,961 | ||||||
Nuance Communications, Inc. (1) | 11,807 | 205,560 | ||||||
NXP Semiconductors NV (1) | 5,958 | 652,103 | ||||||
ON Semiconductor Corp. (1) | 961 | 13,492 | ||||||
Oracle Corp. | 1,184,289 | 59,380,250 | ||||||
Qorvo, Inc. (1) | 2,494 | 157,920 | ||||||
QUALCOMM, Inc. | 882,056 | 48,707,132 | ||||||
Sabre Corp. | 1,876 | 40,841 | ||||||
Samsung Electronic Co. Ltd. | 15,422 | 32,121,279 | ||||||
SS&C Technologies Holdings, Inc. | 362 | 13,904 | ||||||
Synopsys, Inc. (1) | 5,793 | 422,483 | ||||||
Teradata Corp. (1) | 5,315 | 156,739 | ||||||
Teradyne, Inc. | 548 | 16,456 | ||||||
Texas Instruments, Inc. | 250,200 | 19,247,886 | ||||||
Trimble, Inc. (1) | 2,194 | 78,260 | ||||||
Twitter, Inc. (1) | 25,803 | 461,100 | ||||||
Versum Materials, Inc. | 303,318 | 9,857,835 | ||||||
| Shares | Value | |||||||
Visa, Inc. | 391,330 | 36,698,927 | ||||||
Western Digital Corp. | 10,458 | 926,579 | ||||||
WEX, Inc. (1) | 324 | 33,783 | ||||||
Xerox Corp. | 9,445 | 271,355 | ||||||
Xilinx, Inc. | 553 | 35,569 | ||||||
Zillow Group, Inc. - Class A (1) | 665 | 32,479 | ||||||
Zillow Group, Inc. - Class C (1) | 1,322 | 64,791 | ||||||
Zynga, Inc. (1) | 30,160 | 109,782 | ||||||
|
| |||||||
| 579,096,778 | ||||||||
|
| |||||||
Materials - 7.34% | ||||||||
Agrium, Inc. | 412,756 | 37,350,291 | ||||||
Air Products & Chemicals, Inc. | 196,228 | 28,072,378 | ||||||
Albemarle Corp. | 3,692 | 389,654 | ||||||
Alcoa Corp. (1) | 7,607 | 248,369 | ||||||
AptarGroup, Inc. | 1,976 | 171,635 | ||||||
Ardagh Group SA | 357 | 8,072 | ||||||
Ashland Global Holdings, Inc. | 2,530 | 166,752 | ||||||
Avery Dennison Corp. | 176 | 15,553 | ||||||
Ball Corp. | 6,371 | 268,920 | ||||||
Bemis, Inc. | 3,762 | 173,993 | ||||||
Cabot Corp. | 2,514 | 134,323 | ||||||
Celanese Corp. | 542,805 | 51,533,907 | ||||||
CF Industries Holdings, Inc. | 9,595 | 268,276 | ||||||
CRH Plc - ADR | 479,600 | 17,011,412 | ||||||
Crown Holdings, Inc. (1) | 1,636 | 97,604 | ||||||
Domtar Corp. | 2,640 | 101,429 | ||||||
Dow Chemical Co. | 51,044 | 3,219,345 | ||||||
DuPont | 320,100 | 25,835,271 | ||||||
Eastman Chemical Co. | 5,995 | 503,520 | ||||||
Ecolab, Inc. | 172,981 | 22,963,228 | ||||||
FMC Corp. | 124,900 | 9,123,945 | ||||||
Freeport-McMoRan, Inc. (1) | 44,741 | 537,339 | ||||||
Goldcorp, Inc. | 3,027,476 | 39,084,715 | ||||||
Graphic Packaging Holding Co. | 3,895 | 53,673 | ||||||
Huntsman Corp. | 4,263 | 110,156 | ||||||
International Paper Co. | 1,544 | 87,406 | ||||||
Kinross Gold Corp. (1) | 7,221,892 | 29,393,100 | ||||||
| Shares | Value | |||||||
Lyondellbasell Industries NV | 804,104 | 67,858,337 | ||||||
Martin Marietta Materials, Inc. | 247 | 54,977 | ||||||
NewMarket Corp. | 13 | 5,986 | ||||||
Newmont Mining Corp. | 21,999 | 712,548 | ||||||
Nucor Corp. | 13,148 | 760,875 | ||||||
Olin Corp. | 6,783 | 205,389 | ||||||
Owens-Illinois, Inc. (1) | 1,449 | 34,660 | ||||||
Platform Specialty Products Corp. (1) | 4,931 | 62,525 | ||||||
PPG Industries, Inc. | 739 | 81,260 | ||||||
Praxair, Inc. | 231,454 | 30,679,228 | ||||||
Reliance Steel & Aluminum Co. | 2,928 | 213,188 | ||||||
Royal Gold, Inc. | 1,683 | 131,560 | ||||||
RPM International, Inc. | 453 | 24,711 | ||||||
Scotts Miracle-Gro Co. | 94 | 8,409 | ||||||
Sealed Air Corp. | 3,916 | 175,280 | ||||||
Sonoco Products Co. | 4,184 | 215,141 | ||||||
Southern Copper Corp. | 361 | 12,501 | ||||||
Steel Dynamics, Inc. | 8,555 | 306,355 | ||||||
Tahoe Resources, Inc. | 12,973 | 111,827 | ||||||
The Mosaic Co. | 14,457 | 330,053 | ||||||
United States Steel Corp. | 7,173 | 158,810 | ||||||
Valvoline, Inc. | 8,417 | 199,644 | ||||||
Vulcan Materials Co. | 346 | 43,831 | ||||||
Westlake Chemical Corp. | 732 | 48,466 | ||||||
WestRock Co. | 10,225 | 579,349 | ||||||
|
| |||||||
| 369,939,176 | ||||||||
|
| |||||||
Real Estate - 1.67% | ||||||||
Alexandria Real Estate Equities, Inc. | 3,705 | 446,341 | ||||||
American Campus Communities, Inc. | 5,551 | 262,562 | ||||||
American Homes 4 Rent | 9,319 | 210,330 | ||||||
American Tower Corp. | 199,173 | 26,354,571 | ||||||
Apartment Investment & Management Co. | 6,497 | 279,176 | ||||||
Apple Hospitality REIT, Inc. | 8,637 | 161,598 | ||||||
AvalonBay Communities, Inc. | 5,757 | 1,106,323 | ||||||
Boston Properties, Inc. | 5,619 | 691,249 | ||||||
Brandywine Realty Trust | 7,103 | 124,516 | ||||||
Brixmor Property Group, Inc. | 11,979 | 214,185 | ||||||
| Shares | Value | |||||||
Camden Property Trust | 3,630 | 310,401 | ||||||
CBRE Group, Inc. (1) | 6,783 | 246,901 | ||||||
Colony NorthStar, Inc. | 22,143 | 311,995 | ||||||
Columbia Property Trust, Inc. | 5,097 | 114,071 | ||||||
CoreCivic, Inc. | 4,845 | 133,625 | ||||||
Corporate Office Properties Trust | 4,115 | 144,148 | ||||||
CubeSmart | 2,237 | 53,777 | ||||||
CyrusOne, Inc. | 857 | 47,778 | ||||||
DCT Industrial Trust, Inc. | 3,790 | 202,538 | ||||||
DDR Corp. | 13,207 | 119,788 | ||||||
Digital Realty Trust, Inc. | 1,966 | 222,060 | ||||||
Douglas Emmett, Inc. | 1,140 | 43,559 | ||||||
Duke Realty Corp. | 14,634 | 409,020 | ||||||
Empire State Realty Trust, Inc. | 5,237 | 108,772 | ||||||
EPR Properties | 2,634 | 189,306 | ||||||
Equity Commonwealth (1) | 5,194 | 164,130 | ||||||
Equity Residential | 14,970 | 985,475 | ||||||
Essex Property Trust, Inc. | 2,784 | 716,240 | ||||||
Extra Space Storage, Inc. | 761 | 59,358 | ||||||
Federal Realty Investment Trust | 1,815 | 229,398 | ||||||
Forest City Realty Trust, Inc. | 9,410 | 227,440 | ||||||
Gaming and Leisure Properties, Inc. | 5,497 | 207,072 | ||||||
GGP, Inc. | 25,351 | 597,270 | ||||||
HCP, Inc. | 19,331 | 617,819 | ||||||
Healthcare Trust of America, Inc. | 8,077 | 251,275 | ||||||
Highwoods Properties, Inc. | 4,134 | 209,635 | ||||||
Hospitality Properties Trust | 6,217 | 181,226 | ||||||
Host Hotels & Resorts, Inc. | 30,057 | 549,141 | ||||||
Hudson Pacific Properties, Inc. | 5,763 | 197,037 | ||||||
Invitation Homes, Inc. | 3,620 | 78,301 | ||||||
Iron Mountain, Inc. | 1,361 | 46,764 | ||||||
Jones Lang LaSalle, Inc. | 1,919 | 239,875 | ||||||
Kilroy Realty Corp. | 4,069 | 305,785 | ||||||
Kimco Realty Corp. | 16,829 | 308,812 | ||||||
Lamar Advertising Co. | 361 | 26,559 | ||||||
Liberty Property Trust | 6,079 | 247,476 | ||||||
Life Storage, Inc. | 1,884 | 139,604 | ||||||
| Shares | Value | |||||||
Medical Properties Trust, Inc. | 14,892 | 191,660 | ||||||
Mid-America Apartment Communities, Inc. | 4,664 | 491,492 | ||||||
National Retail Properties, Inc. | 6,821 | 266,701 | ||||||
Omega Healthcare Investors, Inc. | 8,004 | 264,292 | ||||||
Outfront Media, Inc. | 4,987 | 115,299 | ||||||
Paramount Group, Inc. | 7,839 | 125,424 | ||||||
Park Hotels & Resorts, Inc. | 5,299 | 142,861 | ||||||
Piedmont Office Realty Trust, Inc. | 6,091 | 128,398 | ||||||
Prologis, Inc. | 22,199 | 1,301,749 | ||||||
Public Storage | 159,156 | 33,188,801 | ||||||
Rayonier, Inc. | 5,221 | 150,208 | ||||||
Realogy Holdings Corp. | 5,595 | 181,558 | ||||||
Realty Income Corp. | 11,246 | 620,554 | ||||||
Regency Centers Corp. | 6,137 | 384,422 | ||||||
Retail Properties of America, Inc. | 10,205 | 124,603 | ||||||
Senior Housing Properties Trust | 8,216 | 167,935 | ||||||
Simon Property Group, Inc. | 1,229 | 198,803 | ||||||
SL Green Realty Corp. | 4,082 | 431,876 | ||||||
Spirit Realty Capital, Inc. | 20,023 | 148,370 | ||||||
STORE Capital Corp. | 7,420 | 166,579 | ||||||
Sun Communities, Inc. | 2,949 | 258,598 | ||||||
Tanger Factory Outlet Centers, Inc. | 3,590 | 93,268 | ||||||
Taubman Centers, Inc. | 1,305 | 77,713 | ||||||
The Howard Hughes Corp. (1) | 1,401 | 172,099 | ||||||
The Macerich Co. | 5,630 | 326,878 | ||||||
UDR, Inc. | 10,922 | 425,630 | ||||||
Uniti Group, Inc. | 6,808 | 171,153 | ||||||
Ventas, Inc. | 15,018 | 1,043,451 | ||||||
VEREIT, Inc. | 40,512 | 329,768 | ||||||
Vornado Realty Trust | 7,392 | 694,109 | ||||||
W.P. Carey, Inc. | 4,367 | 288,266 | ||||||
Weingarten Realty Investors | 4,928 | 148,333 | ||||||
Welltower, Inc. | 15,450 | 1,156,433 | ||||||
Weyerhaeuser Co. | 31,757 | 1,063,860 | ||||||
|
| |||||||
| 84,135,426 | ||||||||
|
| |||||||
Telecommunication Services - 0.68% | ||||||||
AT&T, Inc. | 256,312 | 9,670,652 | ||||||
| Shares | Value | |||||||
CenturyLink, Inc. | 22,245 | 531,211 | ||||||
Level 3 Communications, Inc. (1) | 12,163 | 721,266 | ||||||
Sprint Corp. (1) | 25,900 | 212,639 | ||||||
Telephone & Data Systems, Inc. | 4,056 | 112,554 | ||||||
T-Mobile US, Inc. (1) | 4,663 | 282,671 | ||||||
United States Cellular Corp. (1) | 508 | 19,466 | ||||||
Verizon Communications, Inc. | 510,887 | 22,816,213 | ||||||
|
| |||||||
| 34,366,672 | ||||||||
|
| |||||||
Utilities - 0.60% | ||||||||
AES Corp. | 27,195 | 302,136 | ||||||
Alliant Energy Corp. | 9,589 | 385,190 | ||||||
Ameren Corp. | 9,986 | 545,935 | ||||||
American Electric Power Co., Inc. | 20,515 | 1,425,177 | ||||||
American Water Works Co., Inc. | 7,348 | 572,777 | ||||||
Aqua America, Inc. | 7,318 | 243,689 | ||||||
Atmos Energy Corp. | 4,241 | 351,791 | ||||||
Avangrid, Inc. | 2,255 | 99,558 | ||||||
Calpine Corp. (1) | 15,085 | 204,100 | ||||||
CenterPoint Energy, Inc. | 17,767 | 486,460 | ||||||
CMS Energy Corp. | 11,510 | 532,338 | ||||||
Consolidated Edison, Inc. | 12,789 | 1,033,607 | ||||||
Dominion Energy, Inc. | 26,076 | 1,998,204 | ||||||
DTE Energy Co. | 7,507 | 794,166 | ||||||
Duke Energy Corp. | 29,067 | 2,429,711 | ||||||
Edison International | 13,269 | 1,037,503 | ||||||
Entergy Corp. | 7,396 | 567,791 | ||||||
Eversource Energy | 13,308 | 807,929 | ||||||
Exelon Corp. | 38,732 | 1,397,063 | ||||||
FirstEnergy Corp. | 18,293 | 533,424 | ||||||
Great Plains Energy, Inc. | 8,870 | 259,714 | ||||||
Hawaiian Electric Industries, Inc. | 4,642 | 150,308 | ||||||
MDU Resources Group, Inc. | 7,991 | 209,364 | ||||||
National Fuel Gas Co. | 3,308 | 184,719 | ||||||
NextEra Energy, Inc. | 19,395 | 2,717,821 | ||||||
NiSource, Inc. | 13,364 | 338,911 | ||||||
NRG Energy, Inc. | 9,893 | 170,357 | ||||||
OGE Energy Corp. | 8,210 | 285,626 | ||||||
| Shares | Value | |||||||
PG&E Corp. | 21,299 | 1,413,615 | ||||||
Pinnacle West Capital Corp. | 4,576 | 389,692 | ||||||
PPL Corp. | 28,607 | 1,105,947 | ||||||
Public Service Enterprise Group, Inc. | 21,201 | 911,855 | ||||||
SCANA Corp. | 5,532 | 370,699 | ||||||
Sempra Energy | 10,479 | 1,181,507 | ||||||
The Southern Co. | 41,366 | 1,980,604 | ||||||
UGI Corp. | 7,114 | 344,389 | ||||||
Vectren Corp. | 3,504 | 204,774 | ||||||
Vistra Energy Corp. | 9,931 | 166,741 | ||||||
WEC Energy Group, Inc. | 13,256 | 813,653 | ||||||
Westar Energy, Inc. | 5,957 | 315,840 | ||||||
Xcel Energy, Inc. | 21,244 | 974,675 | ||||||
|
| |||||||
| 30,239,360 | ||||||||
|
| |||||||
Total Common Stocks (Cost $4,336,279,087) | $ | 4,800,739,563 | ||||||
|
| |||||||
SHORT-TERM INVESTMENTS - 3.78% | ||||||||
Money Market Funds - 3.78% | ||||||||
Goldman Sachs Financial Square Government Fund - Class I, 0.86% (2) | 95,203,699 | $ | 95,203,699 | |||||
JPMorgan U.S. Government Money Market Fund - Class I, 0.85% (2) | 95,203,699 | 95,203,699 | ||||||
|
| |||||||
Total Short-Term Investments (Cost $190,407,398) | $ | 190,407,398 | ||||||
|
| |||||||
TOTAL INVESTMENTS IN SECURITIES - 99.05% | ||||||||
(Cost $4,526,686,485) | $ | 4,991,146,961 | ||||||
OTHER ASSETS IN EXCESS OF LIABILITIES - 0.95% | 47,855,363 | |||||||
|
| |||||||
TOTAL NET ASSETS - 100.00% | $ | 5,039,002,324 | ||||||
|
| |||||||
Percentages are stated as a percent of net assets.
ADR American Depositary Receipt
| (1) | Non-income producing security. |
| (2) | Represents annualized seven-day yield as of the close of the reporting period. |
The sector classifications listed above are in accordance with Global Industry Classification Standards (GICS), which was developed by and/or is the exclusive property of MSCI, Inc. and Standard & Poor Financial Services LLC (“S&P”).
Bridge Builder Small/Mid Cap Growth Fund
Schedule of Investments
June 30, 2017
| Shares | Value | |||||||
COMMON STOCKS - 95.65% | ||||||||
Consumer Discretionary - 11.19% | ||||||||
1-800-Flowers.com, Inc. (1) | 1,893 | $ | 18,457 | |||||
Advance Auto Parts, Inc. | 210,440 | 24,535,200 | ||||||
AMC Networks, Inc. (1) | 2,352 | 125,620 | ||||||
American Outdoor Brands Corp. (1) | 14,416 | 319,459 | ||||||
America’s Car-Mart, Inc. (1) | 652 | 25,363 | ||||||
Aramark | 4,524 | 185,394 | ||||||
Asbury Automotive Group, Inc. (1) | 4,807 | 271,836 | ||||||
At Home Group, Inc. (1) | 1,010 | 23,523 | ||||||
AutoZone, Inc. (1) | 1,064 | 606,969 | ||||||
Big Lots, Inc. | 11,515 | 556,174 | ||||||
BJ’s Restaurants, Inc. (1) | 5,376 | 200,256 | ||||||
Bloomin Brands, Inc. | 25,431 | 539,900 | ||||||
Bob Evans Farms, Inc. | 5,070 | 364,178 | ||||||
Bojangles, Inc. (1) | 4,374 | 71,077 | ||||||
Borgwarner, Inc. | 1,102 | 46,681 | ||||||
Boyd Gaming Corp. | 19,220 | 476,848 | ||||||
Bridgepoint Education, Inc. (1) | 4,048 | 59,748 | ||||||
Bright Horizons Family Solutions, Inc. (1) | 85,432 | 6,596,205 | ||||||
Brinker International, Inc. | 9,561 | 364,274 | ||||||
Brunswick Corp. | 3,175 | 199,168 | ||||||
Buffalo Wild Wings, Inc. (1) | 106,148 | 13,448,952 | ||||||
Burlington Stores, Inc. (1) | 35,251 | 3,242,739 | ||||||
Cable One, Inc. | 206 | 146,445 | ||||||
Caesars Entertainment Corp. (1) | 1,940 | 23,280 | ||||||
Cambium Learning Group, Inc. (1) | 1,012 | 5,131 | ||||||
Camping World Holdings, Inc. | 3,135 | 96,715 | ||||||
Capella Education Company | 2,716 | 232,490 | ||||||
CarMax, Inc. (1) | 8,101 | 510,849 | ||||||
Carriage Services, Inc. | 1,592 | 42,920 | ||||||
Carter’s, Inc. | 2,076 | 184,660 | ||||||
Carvana Co. (1) | 313 | 6,407 | ||||||
Cavco Industries, Inc. (1) | 2,184 | 283,156 | ||||||
Century Communities, Inc. (1) | 285 | 7,068 | ||||||
Cheesecake Factory, Inc. | 11,475 | 577,192 | ||||||
Chegg, Inc. (1) | 21,369 | 262,625 | ||||||
Children’s Place, Inc. | 4,417 | 450,976 | ||||||
Chipotle Mexican Grill, Inc. (1) | 1,123 | 467,280 | ||||||
Choice Hotels International, Inc. | 1,463 | 93,998 | ||||||
Churchill Downs, Inc. | 3,465 | 635,135 | ||||||
Chuy’s Holdings, Inc. (1) | 79,487 | 1,859,996 | ||||||
ClubCorp Holdings, Inc. | 16,442 | 215,390 | ||||||
Coach, Inc. | 2,151 | 101,828 | ||||||
Collectors Universe, Inc. | 1,978 | 49,153 | ||||||
Columbia Sportswear Co. | 2,662 | 154,556 | ||||||
Cooper-Standard Holdings, Inc. (1) | 981 | 98,953 | ||||||
| Shares | Value | |||||||
Core Mark Holding Company, Inc. | 11,664 | 385,612 | ||||||
Cracker Barrel Old Country Store, Inc. | 4,909 | 821,030 | ||||||
Crocs, Inc. (1) | 13,580 | 104,702 | ||||||
Culp, Inc. | 2,690 | 87,425 | ||||||
D. R. Horton, Inc. | 8,221 | 284,200 | ||||||
Dana, Inc. | 18,062 | 403,324 | ||||||
Darden Restaurants, Inc. | 5,463 | 494,074 | ||||||
Dave & Buster’s Entertainment, Inc. (1) | 10,759 | 715,581 | ||||||
Deckers Outdoor Corp. (1) | 537 | 36,656 | ||||||
Delphi Automotive Plc | 179,876 | 15,766,131 | ||||||
Denny’s Corp. (1) | 13,184 | 155,176 | ||||||
Dick’s Sporting Goods, Inc. | 2,978 | 118,614 | ||||||
DineEquity, Inc. | 2,739 | 120,653 | ||||||
Dollar General Corp. | 4,618 | 332,912 | ||||||
Dollar Tree, Inc. (1) | 9,572 | 669,274 | ||||||
Domino’s Pizza, Inc. | 6,209 | 1,313,390 | ||||||
Dorman Products, Inc. (1) | 35,976 | 2,977,734 | ||||||
Duluth Holdings, Inc. (1) | 2,493 | 45,398 | ||||||
Dunkin’ Brands Group, Inc. | 4,037 | 222,519 | ||||||
Eldorado Resorts, Inc. (1) | 11,852 | 237,040 | ||||||
Emerald Expositions Events, Inc. | 371 | 8,125 | ||||||
Empire Resorts, Inc. (1) | 435 | 10,392 | ||||||
Entravision Communications Corp. | 17,064 | 112,622 | ||||||
Eros International Plc (1) | 3,435 | 39,331 | ||||||
Etsy, Inc. (1) | 29,562 | 443,430 | ||||||
Expedia, Inc. | 25,346 | 3,775,287 | ||||||
Extended Stay America, Inc. | 4,074 | 78,873 | ||||||
Fiesta Restaurant Group, Inc. (1) | 382 | 7,888 | ||||||
Five Below, Inc. (1) | 13,819 | 682,244 | ||||||
Floor & Decor Holdings, Inc. (1) | 447 | 17,549 | ||||||
Foot Locker, Inc. | 401 | 19,761 | ||||||
Fox Factory Holding Corp. (1) | 8,955 | 318,798 | ||||||
Francesca’s Holdings Corp. (1) | 9,722 | 106,359 | ||||||
Fred’s, Inc. | 331 | 3,055 | ||||||
Gap, Inc. | 538 | 11,831 | ||||||
Gentex Corp. | 7,988 | 151,532 | ||||||
Gentherm, Inc. (1) | 77,631 | 3,012,083 | ||||||
Genuine Parts Co. | 2,371 | 219,934 | ||||||
Global Eagle Entertainment, Inc. (1) | 621 | 2,211 | ||||||
Golden Entertainment, Inc. | 451 | 9,340 | ||||||
GoPro, Inc. (1) | 27,205 | 221,177 | ||||||
Grand Canyon Education, Inc. (1) | 12,003 | 941,155 | ||||||
Gray Television, Inc. (1) | 10,880 | 149,056 | ||||||
Groupon, Inc. (1) | 86,625 | 332,640 | ||||||
H&R Block, Inc. | 1,397 | 43,181 | ||||||
Hanesbrands, Inc. | 15,919 | 368,684 | ||||||
Harley-Davidson, Inc. | 5,596 | 302,296 | ||||||
Hasbro, Inc. | 3,770 | 420,393 | ||||||
Helen Of Troy Corp. (1) | 38,338 | 3,607,606 | ||||||
Hemisphere Media Group, Inc. (1) | 385 | 4,562 | ||||||
Hilton Grand Vacations, Inc. (1) | 2,595 | 93,576 | ||||||
Hilton Worldwide Holdings, Inc. | 7,438 | 460,040 | ||||||
Hooker Furniture Corp. | 2,883 | 118,635 | ||||||
| Shares | Value | |||||||
Horizon Global Corp. (1) | 6,509 | 93,469 | ||||||
Houghton Mifflin Harcourt Co. (1) | 18,344 | 225,631 | ||||||
Hovnanian Enterprises, Inc. (1) | 7,071 | 19,799 | ||||||
HSN, Inc. | 8,241 | 262,888 | ||||||
ILG, Inc. | 2,512 | 69,055 | ||||||
IMAX Corp. (1) | 278,124 | 6,118,728 | ||||||
Inspired Entertainment, Inc. (1) | 908 | 11,804 | ||||||
Installed Building Products, Inc. (1) | 5,518 | 292,178 | ||||||
Interpublic Group of Companies, Inc. | 14,612 | 359,455 | ||||||
Intrawest Resorts Holdings, Inc. (1) | 2,671 | 63,410 | ||||||
iRobot Corp. (1) | 6,772 | 569,796 | ||||||
J. Jill, Inc. (1) | 2,967 | 36,464 | ||||||
Jack in the Box, Inc. | 6,460 | 636,310 | ||||||
John Wiley & Sons, Inc. | 272,328 | 14,365,302 | ||||||
Kate Spade & Co. (1) | 5,619 | 103,895 | ||||||
KB Home | 4,692 | 112,467 | ||||||
L Brands, Inc. | 1,789 | 96,409 | ||||||
La Quinta Holdings, Inc. (1) | 4,596 | 67,883 | ||||||
La-Z-Boy, Inc. | 5,486 | 178,295 | ||||||
LCI Industries | 6,202 | 635,085 | ||||||
Lear Corp. | 2,498 | 354,916 | ||||||
Leggett & Platt, Inc. | 4,653 | 244,422 | ||||||
LGI Homes, Inc. (1) | 2,937 | 118,009 | ||||||
Liberty Braves Group - Class A (1) | 2,503 | 59,797 | ||||||
Liberty Braves Group - Class C (1) | 8,755 | 209,857 | ||||||
Liberty Expedia Holdings, Inc. (1) | 421 | 22,742 | ||||||
Liberty Interactive Corp. (1) | 10,187 | 249,989 | ||||||
Liberty Tax, Inc. | 328 | 4,248 | ||||||
Lindblad Expeditions Holdings, Inc. (1) | 4,986 | 52,353 | ||||||
Lions Gate Entertainment Corp. - Class A (1) | 1,471 | 41,498 | ||||||
Lions Gate Entertainment Corp. - Class B (1) | 3,161 | 83,058 | ||||||
Lithia Motors, Inc. | 5,965 | 562,082 | ||||||
Live Nation Entertainment, Inc. (1) | 432,065 | 15,057,465 | ||||||
LKQ Corp. (1) | 74,221 | 2,445,582 | ||||||
Loral Space and Communications, Inc. (1) | 3,300 | 137,115 | ||||||
Lululemon Athletica, Inc. (1) | 37,758 | 2,253,020 | ||||||
Lumber Liquidators Holdings, Inc. (1) | 7,198 | 180,382 | ||||||
M.D.C. Holdings, Inc. | 4,205 | 148,563 | ||||||
M/I Homes, Inc. (1) | 1,270 | 36,259 | ||||||
Malibu Boats, Inc. (1) | 4,643 | 120,114 | ||||||
Marcus Corp. | 3,937 | 118,897 | ||||||
Marine Products Corp. | 1,978 | 30,877 | ||||||
MarineMax, Inc. (1) | 3,788 | 74,055 | ||||||
Marriott International, Inc. | 168,862 | 16,938,547 | ||||||
Marriott Vacations Worldwide Corp. | 4,976 | 585,924 | ||||||
Mattel, Inc. | 2,857 | 61,511 | ||||||
MCBC Holdings, Inc. (1) | 4,688 | 91,650 | ||||||
MDC Partners, Inc. | 4,575 | 45,293 | ||||||
Meritage Homes Corp. (1) | 668 | 28,190 | ||||||
MGM Resorts International | 1,766 | 55,258 | ||||||
Michael Kors Holdings Ltd. (1) | 499 | 18,089 | ||||||
Mohawk Industries, Inc. (1) | 171 | 41,329 | ||||||
Monro Muffler Brake, Inc. | 80,523 | 3,361,835 | ||||||
| Shares | Value | |||||||
Morningstar, Inc. | 58,235 | 4,562,130 | ||||||
Nathan’s Famous, Inc. (1) | 694 | 43,722 | ||||||
National CineMedia, Inc. | 152,657 | 1,132,715 | ||||||
Nautilus, Inc. (1) | 7,710 | 147,647 | ||||||
Netflix, Inc. (1) | 10,339 | 1,544,750 | ||||||
New York Times Co. | 26,111 | 462,165 | ||||||
Nexstar Media Group, Inc. | 11,624 | 695,115 | ||||||
Noodles & Co. (1) | 1,720 | 6,708 | ||||||
Nordstrom, Inc. | 5,092 | 243,550 | ||||||
Nutrisystem, Inc. | 7,564 | 393,706 | ||||||
NVR, Inc. (1) | 143 | 344,717 | ||||||
Ollie’s Bargain Outlet Holdings, Inc. (1) | 194,548 | 8,287,745 | ||||||
Omnicom Group, Inc. | 10,141 | 840,689 | ||||||
O’Reilly Automotive, Inc. (1) | 3,920 | 857,461 | ||||||
Overstock.com, Inc. (1) | 2,164 | 35,273 | ||||||
Oxford Industries, Inc. | 1,661 | 103,796 | ||||||
Panera Bread Co. (1) | 11,771 | 3,703,627 | ||||||
Papa John’s International, Inc. | 38,138 | 2,736,783 | ||||||
Party City Holdings, Inc. (1) | 478 | 7,481 | ||||||
Penn National Gaming, Inc. (1) | 2,781 | 59,513 | ||||||
PetMed Express, Inc. | 5,068 | 205,761 | ||||||
PICO Holdings, Inc. (1) | 369 | 6,458 | ||||||
Pinnacle Entertainment, Inc. (1) | 9,411 | 185,961 | ||||||
Planet Fitness, Inc. | 21,576 | 503,584 | ||||||
Polaris Industries, Inc. | 2,583 | 238,230 | ||||||
Pool Corp. | 29,582 | 3,477,956 | ||||||
Potbelly Corp. (1) | 1,530 | 17,595 | ||||||
Pulte Group, Inc. | 3,824 | 93,803 | ||||||
RCI Hospitality Holdings, Inc. | 223 | 5,316 | ||||||
Reading International, Inc. (1) | 954 | 15,388 | ||||||
Red Robin Gourmet Burgers, Inc. (1) | 3,110 | 202,928 | ||||||
Red Rock Resorts, Inc. | 17,364 | 408,922 | ||||||
Regal Entertainment Group | 1,304 | 26,680 | ||||||
RH (1) | 8,738 | 563,776 | ||||||
Ross Stores, Inc. | 349,517 | 20,177,616 | ||||||
Ruth’s Hospitality Group, Inc. | 7,663 | 166,670 | ||||||
Sally Beauty Holdings, Inc. (1) | 577,085 | 11,685,971 | ||||||
Scientific Games Corp. (1) | 13,536 | 353,290 | ||||||
Scripps Networks Interactive, Inc. | 2,074 | 141,675 | ||||||
Sears Holdings Corp. (1) | 369 | 3,269 | ||||||
SeaWorld Entertainment, Inc. | 17,399 | 283,082 | ||||||
Select Comfort Corp. (1) | 10,523 | 373,461 | ||||||
Service Corp. International | 7,964 | 266,396 | ||||||
ServiceMaster Global Holdings, Inc. (1) | 5,888 | 230,751 | ||||||
Shake Shack, Inc. (1) | 5,606 | 195,537 | ||||||
Shiloh Industries, Inc. (1) | 1,388 | 16,295 | ||||||
Shutterfly, Inc. (1) | 8,705 | 413,488 | ||||||
Signet Jewelers Ltd. | 85,912 | 5,433,075 | ||||||
Sinclair Broadcast Group, Inc. | 18,501 | 608,683 | ||||||
Sirius XM Holdings, Inc. | 61,310 | 335,366 | ||||||
Six Flags Entertainment Corp. | 3,121 | 186,043 | ||||||
Skechers USA, Inc. (1) | 2,475 | 73,013 | ||||||
Sonic Corp. | 6,025 | 159,602 | ||||||
| Shares | Value | |||||||
Sotheby’s (1) | 9,779 | 524,839 | ||||||
Sportsman’s Warehouse Holdings, Inc. (1) | 9,208 | 49,723 | ||||||
Standard Motor Products, Inc. | 3,375 | 176,243 | ||||||
Steven Madden Ltd. (1) | 69,531 | 2,777,763 | ||||||
Strayer Education, Inc. | 2,713 | 252,906 | ||||||
Sturm, Ruger & Company, Inc. | 4,407 | 273,895 | ||||||
Superior Uniform Group, Inc. | 2,074 | 46,354 | ||||||
Systemax, Inc. | 2,199 | 41,341 | ||||||
Tailored Brands, Inc. | 3,791 | 42,308 | ||||||
Taylor Morrison Home Corp. (1) | 15,647 | 375,684 | ||||||
Tempur Sealy International, Inc. (1) | 782 | 41,751 | ||||||
Tenneco, Inc. | 13,665 | 790,247 | ||||||
Texas Roadhouse, Inc. | 94,999 | 4,840,199 | ||||||
The Habit Restaurants, Inc. (1) | 5,093 | 80,469 | ||||||
The Madison Square Garden Co. (1) | 79 | 15,555 | ||||||
The Michaels Companies, Inc. (1) | 3,897 | 72,172 | ||||||
Thor Industries, Inc. | 2,163 | 226,077 | ||||||
Tile Shop Holdings, Inc. | 8,600 | 177,590 | ||||||
Toll Brothers, Inc. | 3,112 | 122,955 | ||||||
TopBuild Corp. (1) | 5,643 | 299,474 | ||||||
Tractor Supply Co. | 192,021 | 10,409,458 | ||||||
Travelport Worldwide Ltd. | 6,278 | 86,385 | ||||||
TRI Pointe Group, Inc. (1) | 2,470 | 32,579 | ||||||
TripAdvisor, Inc. (1) | 2,274 | 86,867 | ||||||
tronc, Inc. (1) | 3,234 | 41,686 | ||||||
Tupperware Brands Corp. | 2,219 | 155,840 | ||||||
Ulta Beauty, Inc. (1) | 15,792 | 4,537,673 | ||||||
Under Armour, Inc. - Class A (1) | 5,873 | 127,796 | ||||||
Under Armour, Inc. - Class C (1) | 5,961 | 120,174 | ||||||
Universal Electronics, Inc. (1) | 3,594 | 240,259 | ||||||
Vail Resorts, Inc. | 1,738 | 352,519 | ||||||
VF Corp. | 10,780 | 620,928 | ||||||
Visteon Corp. (1) | 1,407 | 143,598 | ||||||
Wayfair, Inc. (1) | 1,681 | 129,235 | ||||||
Weight Watchers International, Inc. (1) | 6,661 | 222,611 | ||||||
Wendy’s Co. | 8,082 | 125,352 | ||||||
Whirlpool Corp. | 38,482 | 7,373,921 | ||||||
William Lyon Homes (1) | 1,141 | 27,544 | ||||||
Williams-Sonoma, Inc. | 740 | 35,890 | ||||||
Wingstop, Inc. | 85,923 | 2,655,021 | ||||||
Winmark Corp. | 595 | 76,725 | ||||||
Winnebago Industries, Inc. | 7,014 | 245,490 | ||||||
Wolverine World Wide, Inc. | 24,089 | 674,733 | ||||||
World Wrestling Entertainment, Inc. | 9,790 | 199,422 | ||||||
Wyndham Worldwide Corp. | 4,480 | 449,837 | ||||||
Wynn Resorts Ltd. | 3,504 | 469,956 | ||||||
Yum China Holdings, Inc. (1) | 13,984 | 551,389 | ||||||
ZAGG, Inc. (1) | 4,851 | 41,961 | ||||||
Zoe’s Kitchen, Inc. (1) | 1,264 | 15,054 | ||||||
|
| |||||||
| 283,062,946 | ||||||||
|
| |||||||
Consumer Staples - 6.87% | ||||||||
Amplify Snack Brands, Inc. (1) | 8,412 | 81,092 | ||||||
B&G Foods, Inc. | 16,829 | 599,112 | ||||||
| Shares | Value | |||||||
Blue Buffalo Pet Products, Inc. (1) | 643,472 | 14,677,596 | ||||||
Boston Beer, Inc. (1) | 2,270 | 299,980 | ||||||
Brown Forman Corp. - Class A | 2,240 | 110,432 | ||||||
Brown Forman Corp. - Class B | 7,210 | 350,406 | ||||||
Calavo Growers, Inc. | 88,893 | 6,138,062 | ||||||
Campbell Soup Co. | 5,146 | 268,364 | ||||||
Casey’s General Stores, Inc. | 173,173 | 18,548,560 | ||||||
Castle Brands, Inc. (1) | 22,191 | 38,169 | ||||||
Central Garden & Pet Co. - Class A (1) | 1,086 | 32,602 | ||||||
Central Garden & Pet Co. (1) | 325 | 10,332 | ||||||
Church & Dwight Co., Inc. | 10,924 | 566,737 | ||||||
Clorox Co. | 4,825 | 642,883 | ||||||
Coca-Cola Bottling Co. Consolidated | 1,203 | 275,331 | ||||||
Craft Brew Alliance, Inc. (1) | 3,214 | 54,156 | ||||||
Dean Foods Co. | 1,268 | 21,556 | ||||||
Dr Pepper Snapple Group, Inc. | 8,042 | 732,707 | ||||||
elf Beauty, Inc. (1) | 5,258 | 143,070 | ||||||
Energizer Holdings, Inc. | 2,682 | 128,790 | ||||||
Flowers Foods, Inc. | 921,000 | 15,942,510 | ||||||
Freshpet, Inc. (1) | 6,241 | 103,601 | ||||||
Herbalife Ltd. (1) | 3,007 | 214,489 | ||||||
Hormel Foods Corp. | 433,000 | 14,769,630 | ||||||
Hostess Brands, Inc. (1) | 1,140 | 18,354 | ||||||
HRG Group, Inc. (1) | 28,772 | 509,552 | ||||||
Inter Parfums, Inc. | 2,080 | 76,232 | ||||||
J & J Snack Foods Corp. | 3,851 | 508,602 | ||||||
John B. Sanfilippo & Son, Inc. | 2,190 | 138,211 | ||||||
Kellogg Co. | 10,035 | 697,031 | ||||||
Lamb Weston Holdings, Inc. | 1,482 | 65,267 | ||||||
Lancaster Colony Corp. | 4,806 | 589,312 | ||||||
Landec Corp. (1) | 1,384 | 20,552 | ||||||
Lifeway Foods, Inc. (1) | 1,207 | 11,273 | ||||||
Limoneira Co. | 1,025 | 24,221 | ||||||
McCormick & Co., Inc. | 36,981 | 3,606,017 | ||||||
Medifast, Inc. | 2,762 | 114,540 | ||||||
MGP Ingredients, Inc. | 42,907 | 2,195,551 | ||||||
Molson Coors Brewing Co. | 112,000 | 9,670,080 | ||||||
Monster Beverage Corp. (1) | 66,446 | 3,301,037 | ||||||
National Beverage Corp. | 3,011 | 281,709 | ||||||
Natural Health Trends Corp. | 1,925 | 53,611 | ||||||
Nu Skin Enterprises, Inc. | 622 | 39,086 | ||||||
Performance Food Group Co. (1) | 18,163 | 497,666 | ||||||
Pilgrim’s Pride Corp. (1) | 2,066 | 45,287 | ||||||
PriceSmart, Inc. | 5,640 | 494,064 | ||||||
Primo Water Corp. (1) | 6,441 | 81,801 | ||||||
Revlon, Inc. (1) | 819 | 19,410 | ||||||
Rite Aid Corp. (1) | 21,496 | 63,413 | ||||||
Snyder’s-Lance, Inc. | 504,319 | 17,459,524 | ||||||
Spectrum Brands Holdings, Inc. | 1,073 | 134,168 | ||||||
Sprouts Farmers Market, Inc. (1) | 5,890 | 133,526 | ||||||
The Chefs’ Warehouse, Inc. (1) | 4,513 | 58,669 | ||||||
The Hershey Co. | 5,480 | 588,388 | ||||||
The J. M. Smucker Co. | 115,500 | 13,667,115 | ||||||
| Shares | Value | |||||||
Tootsie Roll Industries, Inc. | 3,006 | 104,759 | ||||||
TreeHouse Foods, Inc. (1) | 250,649 | 20,475,517 | ||||||
Turning Point Brands, Inc. (1) | 1,290 | 19,789 | ||||||
USANA Health Sciences, Inc. (1) | 2,973 | 190,569 | ||||||
Vector Group Ltd. | 11,007 | 234,669 | ||||||
WD-40 Co. | 42,794 | 4,722,318 | ||||||
Whole Foods Market, Inc. | 433,207 | 18,242,347 | ||||||
|
| |||||||
| 173,903,404 | ||||||||
|
| |||||||
Energy - 2.18% | ||||||||
Abraxas Petroleum Corp. (1) | 35,337 | 57,246 | ||||||
Antero Resources Corp. (1) | 4,985 | 107,726 | ||||||
Apache Corp. | 869 | 41,651 | ||||||
Ardmore Shipping Corp. | 3,456 | 28,166 | ||||||
Baker Hughes, Inc. | 23,088 | 1,258,527 | ||||||
Bonanza Creek Energy, Inc. (1) | 338 | 10,718 | ||||||
Cabot Oil & Gas Corp. | 53,097 | 1,331,673 | ||||||
Carrizo Oil & Gas, Inc. (1) | 133,068 | 2,318,045 | ||||||
Cheniere Energy, Inc. (1) | 5,920 | 288,363 | ||||||
Chesapeake Energy Corp. (1) | 1,933 | 9,607 | ||||||
Cimarex Energy Co. | 3,835 | 360,528 | ||||||
Continental Resources, Inc. (1) | 1,540 | 49,788 | ||||||
Core Laboratories NV | 221,395 | 22,420,672 | ||||||
CVR Energy, Inc. | 234 | 5,092 | ||||||
Denbury Resources, Inc. (1) | 805,000 | 1,231,650 | ||||||
Devon Energy Corp. | 1,926 | 61,574 | ||||||
Diamondback Energy, Inc. (1) | 977 | 86,767 | ||||||
Energy XXI Gulf Coast, Inc. (1) | 1,287 | 23,900 | ||||||
Evolution Petroleum Corp. | 6,406 | 51,889 | ||||||
Fairmount Santrol Holdings, Inc. (1) | 35,147 | 137,073 | ||||||
Forum Energy Technologies, Inc. (1) | 215,944 | 3,368,726 | ||||||
Gastar Exploration, Inc. (1) | 21,640 | 20,039 | ||||||
Gulfport Energy Corp. (1) | 691 | 10,192 | ||||||
Isramco, Inc. (1) | 180 | 20,592 | ||||||
Jagged Peak Energy, Inc. (1) | 8,141 | 108,682 | ||||||
Keane Group, Inc. (1) | 7,432 | 118,912 | ||||||
Laredo Petroleum, Inc. (1) | 7,106 | 74,755 | ||||||
Lilis Energy, Inc. (1) | 10,822 | 53,028 | ||||||
Matador Resources Co. (1) | 23,006 | 491,638 | ||||||
NCS Multistage Holdings, Inc. (1) | 2,637 | 66,400 | ||||||
Newfield Exploration Co. (1) | 8,724 | 248,285 | ||||||
Oceaneering International, Inc. | 52,532 | 1,199,831 | ||||||
ONEOK, Inc. | 9,199 | 479,820 | ||||||
Panhandle Oil and Gas, Inc. | 2,212 | 51,097 | ||||||
Par Petroleum Corp. (1) | 2,985 | 53,849 | ||||||
Parsley Energy, Inc. (1) | 265,001 | 7,353,778 | ||||||
Penn Virginia Corp. (1) | 3,282 | 120,614 | ||||||
ProPetro Holding Corp. (1) | 4,280 | 59,749 | ||||||
Range Resources Corp. | 32,988 | 764,332 | ||||||
Resolute Energy Corp. (1) | 339 | 10,092 | ||||||
Rice Energy, Inc. (1) | 75,343 | 2,006,384 | ||||||
RigNet, Inc. (1) | 3,298 | 52,933 | ||||||
Ring Energy, Inc. (1) | 10,897 | 141,661 | ||||||
RPC, Inc. | 62,242 | 1,257,911 | ||||||
| Shares | Value | |||||||
RSP Permian, Inc. (1) | 104,239 | 3,363,793 | ||||||
Sanchez Energy Corp. (1) | 13,898 | 99,788 | ||||||
Select Energy Services, Inc. (1) | 980 | 11,907 | ||||||
SilverBow Resources, Inc. (1) | 396 | 10,359 | ||||||
Smart Sand, Inc. (1) | 4,982 | 44,390 | ||||||
Solaris Oilfield Infrastructure, Inc. (1) | 2,397 | 27,637 | ||||||
SRC Energy, Inc. (1) | 315,338 | 2,122,225 | ||||||
Tellurian, Inc. (1) | 14,192 | 142,346 | ||||||
The Williams Companies, Inc. | 5,304 | 160,605 | ||||||
Ultra Petroleum Corp. (1) | 4,384 | 47,566 | ||||||
Uranium Energy Corp. (1) | 32,593 | 51,823 | ||||||
US Silica Holdings, Inc. | 29,909 | 1,061,470 | ||||||
W&T Offshore, Inc. (1) | 2,397 | 4,698 | ||||||
Westmoreland Coal Co. (1) | 1,060 | 5,162 | ||||||
|
| |||||||
| 55,167,724 | ||||||||
|
| |||||||
Financials - 9.65% | ||||||||
Access National Corp. | 247 | 6,550 | ||||||
Affiliated Managers Group, Inc. | 111,580 | 18,506,659 | ||||||
Allegiance Bancshares, Inc. (1) | 2,057 | 78,783 | ||||||
Allied World Assurance Co. Holdings AG | 330,100 | 17,462,290 | ||||||
Ameriprise Financial, Inc. | 6,015 | 765,649 | ||||||
Ameris Bancorp | 7,079 | 341,208 | ||||||
AMERISAFE, Inc. | 95,447 | 5,435,707 | ||||||
Arch Capital Group Ltd. (1) | 676 | 63,064 | ||||||
Argo Group International Holdings Ltd. | 55,838 | 3,383,783 | ||||||
Arthur J. Gallagher & Co. | 269,350 | 15,420,287 | ||||||
Artisan Partners Asset Management, Inc. | 11,476 | 352,313 | ||||||
Aspen Insurance Holdings Ltd. | 815 | 40,628 | ||||||
Assurant, Inc. | 489 | 50,704 | ||||||
Atlantic Capital Bancshares, Inc. (1) | 732 | 13,908 | ||||||
Atlas Financial Holdings, Inc. (1) | 1,341 | 19,981 | ||||||
Bank of NT Butterfield & Son Ltd. | 9,776 | 333,362 | ||||||
Bank of the Ozarks, Inc. | 2,307 | 108,129 | ||||||
Bankwell Financial Group, Inc. | 191 | 5,965 | ||||||
Bear State Financial, Inc. | 521 | 4,929 | ||||||
BGC Partners, Inc. | 2,556 | 32,308 | ||||||
Blue Hills Bancorp, Inc. | 2,917 | 52,214 | ||||||
Bofi Holding, Inc. (1) | 6,554 | 155,461 | ||||||
Bryn Mawr Bank Corp. | 56,761 | 2,412,342 | ||||||
BSB Bancorp, Inc. (1) | 552 | 16,146 | ||||||
Camden National Corp. | 45,813 | 1,965,836 | ||||||
Capstar Financial Holdings, Inc. (1) | 619 | 10,981 | ||||||
Carolina Financial Corp. | 2,602 | 84,097 | ||||||
CBOE Holdings, Inc. | 4,838 | 442,193 | ||||||
Central Pacific Financial Corp. | 135,498 | 4,264,122 | ||||||
Charter Financial Corp. | 651 | 11,718 | ||||||
Chemical Financial Corp. | 103,612 | 5,015,857 | ||||||
CoBiz Financial, Inc. | 974 | 16,948 | ||||||
Cohen & Steers, Inc. | 5,538 | 224,511 | ||||||
Columbia Banking System, Inc. | 144,739 | 5,767,849 | ||||||
Commerce Bancshares, Inc. | 175,500 | 9,973,665 | ||||||
ConnectOne Bancorp, Inc. | 2,096 | 47,265 | ||||||
Cowen, Inc. (1) | 394 | 6,402 | ||||||
| Shares | Value | |||||||
Crawford & Co. | 2,811 | 26,142 | ||||||
Credit Acceptance Corp. (1) | 443 | 113,913 | ||||||
CU Bancorp (1) | 496 | 17,930 | ||||||
Cullen/Frost Bankers, Inc. | 138,000 | 12,959,580 | ||||||
Diamond Hill Investment Group, Inc. | 819 | 163,309 | ||||||
Donnelley Financial Solutions, Inc. (1) | 6,190 | 142,122 | ||||||
Eagle Bancorp, Inc. (1) | 79,653 | 5,042,035 | ||||||
East West Bancorp, Inc. | 384 | 22,495 | ||||||
Eaton Vance Corp. | 4,848 | 229,407 | ||||||
eHealth, Inc. (1) | 3,580 | 67,304 | ||||||
Enova International, Inc. (1) | 2,652 | 39,382 | ||||||
Equity Bancshares, Inc. (1) | 911 | 27,913 | ||||||
Erie Indemnity Co. | 794 | 99,306 | ||||||
Essent Group Ltd. (1) | 19,797 | 735,261 | ||||||
Evercore Partners, Inc. | 67,210 | 4,738,305 | ||||||
FB Financial Corp. (1) | 843 | 30,508 | ||||||
Federated Investors, Inc. | 1,136 | 32,092 | ||||||
Fifth Street Asset Management, Inc. | 1,153 | 5,592 | ||||||
Financial Engines, Inc. | 15,020 | 549,732 | ||||||
First Connecticut Bancorp, Inc. | 877 | 22,495 | ||||||
First Financial Bankshares, Inc. | 10,546 | 466,133 | ||||||
First Financial Northwest, Inc. | 301 | 4,855 | ||||||
First Foundation, Inc. (1) | 2,583 | 42,439 | ||||||
First of Long Island Corp. | 1,127 | 32,232 | ||||||
First Republic Bank | 145,870 | 14,601,587 | ||||||
FirstCash, Inc. | 2,266 | 132,108 | ||||||
Franklin Financial Network, Inc. (1) | 718 | 29,617 | ||||||
GAMCO Investors, Inc. | 355 | 10,508 | ||||||
Glacier Bancorp, Inc. | 3,192 | 116,859 | ||||||
Great Western Bancorp, Inc. | 154,797 | 6,317,266 | ||||||
Green Bancorp, Inc. (1) | 1,093 | 21,204 | ||||||
Green Dot Corp. (1) | 11,692 | 450,493 | ||||||
Greene County Bancorp, Inc. | 528 | 14,362 | ||||||
Guaranty Bancorp | 1,181 | 32,123 | ||||||
Guaranty Bancshares, Inc. (1) | 511 | 16,326 | ||||||
Hamilton Lane, Inc. | 2,440 | 53,656 | ||||||
HarborOne Bancorp, Inc. (1) | 1,571 | 31,357 | ||||||
HCI Group, Inc. | 1,187 | 55,765 | ||||||
Health Insurance Innovations, Inc. (1) | 2,878 | 67,633 | ||||||
Heritage Commerce Corp. | 598 | 8,240 | ||||||
Heritage Insurance Holdings, Inc. | 823 | 10,715 | ||||||
Hilltop Holdings, Inc. | 94,678 | 2,481,510 | ||||||
Hingham Institution for Savings | 175 | 31,838 | ||||||
Home Bancshares, Inc. | 31,099 | 774,365 | ||||||
Houlihan Lokey, Inc. | 5,493 | 191,706 | ||||||
Howard Bancorp, Inc. (1) | 435 | 8,374 | ||||||
Infinity Property & Casualty Corp. | 386 | 36,284 | ||||||
Invesco Ltd. | 2,847 | 100,186 | ||||||
Investar Holding Corp. | 661 | 15,137 | ||||||
Investment Technology Group, Inc. | 824 | 17,502 | ||||||
Investors Title Co. | 293 | 56,678 | ||||||
James River Group Holdings Ltd. | 105,588 | 4,195,011 | ||||||
Kinsale Capital Group, Inc. | 3,687 | 137,562 | ||||||
| Shares | Value | |||||||
Ladenburg Thalmann Financial Services, Inc. (1) | 3,449 | 8,416 | ||||||
Lakeland Financial Corp. | 1,015 | 46,568 | ||||||
Lazard Ltd. | 194,692 | 9,020,080 | ||||||
LegacyTexas Financial Group, Inc. | 5,029 | 191,756 | ||||||
Legg Mason, Inc. | 890 | 33,962 | ||||||
LendingClub Corp. (1) | 74,649 | 411,316 | ||||||
LendingTree, Inc. (1) | 17,082 | 2,941,520 | ||||||
Leucadia National Corp. | 3,361 | 87,924 | ||||||
Live Oak Bancshares, Inc. | 5,040 | 121,968 | ||||||
LPL Financial Holdings, Inc. | 3,868 | 164,235 | ||||||
Maiden Holdings Ltd. | 1,653 | 18,348 | ||||||
MarketAxess Holdings, Inc. | 21,044 | 4,231,948 | ||||||
Marlin Business Services Corp. | 728 | 18,309 | ||||||
MB Financial, Inc. | 1,753 | 77,202 | ||||||
Medley Management, Inc. | 747 | 4,855 | ||||||
Meridian Bancorp, Inc. | 2,061 | 34,831 | ||||||
Meta Financial Group, Inc. | 229 | 20,381 | ||||||
Midland States Bancorp, Inc. | 266 | 8,916 | ||||||
Moelis & Co. | 6,407 | 248,912 | ||||||
Moody’s Corp. | 7,294 | 887,534 | ||||||
MSCI, Inc. | 3,897 | 401,352 | ||||||
National Bank Holdings Corp. | 2,289 | 75,789 | ||||||
National Commerce Corp. (1) | 1,233 | 48,765 | ||||||
National General Holdings Corp. | 7,775 | 164,052 | ||||||
NewStar Financial, Inc. | 1,252 | 13,146 | ||||||
NMI Holdings, Inc. (1) | 2,235 | 25,591 | ||||||
Northern Trust Corp. | 202,000 | 19,636,420 | ||||||
Northfield Bancorp, Inc. | 1,004 | 17,219 | ||||||
Ocwen Financial Corp. (1) | 1,858 | 4,998 | ||||||
Old Line Bancshares, Inc. | 265 | 7,468 | ||||||
OM Asset Management Plc | 14,291 | 212,364 | ||||||
Opus Bank | 3,545 | 85,789 | ||||||
Pacific Continental Corp. | 2,867 | 73,252 | ||||||
Pacific Premier Bancorp, Inc. (1) | 3,504 | 129,298 | ||||||
Paragon Commercial Corp. (1) | 121 | 6,349 | ||||||
Park Sterling Corp. | 4,386 | 52,106 | ||||||
People’s Utah Bancorp | 444 | 11,899 | ||||||
Pinnacle Financial Partners, Inc. | 987 | 61,999 | ||||||
Piper Jaffray Cos. | 230 | 13,788 | ||||||
PRA Group, Inc. (1) | 99,179 | 3,758,884 | ||||||
Preferred Bank Los Angeles | 3,319 | 177,467 | ||||||
Primerica, Inc. | 10,950 | 829,462 | ||||||
Prosperity Bancshares, Inc. | 147,000 | 9,443,280 | ||||||
Pzena Investment Management, Inc. | 3,351 | 34,046 | ||||||
Raymond James Financial, Inc. | 1,460 | 117,121 | ||||||
Regional Management Corp. (1) | 247 | 5,837 | ||||||
Republic First Bancorp, Inc. (1) | 2,760 | 25,530 | ||||||
RLI Corp. | 8,303 | 453,510 | ||||||
SEI Investments Co. | 5,870 | 315,689 | ||||||
ServisFirst Bancshares, Inc. | 11,866 | 437,737 | ||||||
Signature Bank (1) | 98,988 | 14,207,748 | ||||||
Silvercrest Asset Management Group, Inc. | 2,062 | 27,734 | ||||||
South State Corp. | 76,076 | 6,519,713 | ||||||
| Shares | Value | |||||||
Southern Missouri Bancorp, Inc. | 156 | 5,033 | ||||||
State National Companies, Inc. | 6,969 | 128,090 | ||||||
Stewart Information Services Corp. | 314 | 14,249 | ||||||
Stonegate Bank | 742 | 34,266 | ||||||
Sunshine Bancorp, Inc. (1) | 299 | 6,372 | ||||||
SVB Financial Group (1) | 48,577 | 8,539,351 | ||||||
T. Rowe Price Group, Inc. | 1,601 | 118,810 | ||||||
TD Ameritrade Holding Corp. | 9,917 | 426,332 | ||||||
Texas Capital Bancshares, Inc. (1) | 67,857 | 5,252,132 | ||||||
The Progressive Corp. | 25,434 | 1,121,385 | ||||||
Third Point Reinsurance Ltd. (1) | 9,867 | 137,151 | ||||||
Tompkins Financial Corp. | 201 | 15,823 | ||||||
TriState Capital Holdings, Inc. (1) | 1,580 | 39,816 | ||||||
Trupanion, Inc. (1) | 5,754 | 128,775 | ||||||
Union Bankshares, Inc. | 928 | 44,080 | ||||||
United Insurance Holdings Corp. | 3,487 | 54,851 | ||||||
Universal Insurance Holdings, Inc. | 6,143 | 154,804 | ||||||
Value Line, Inc. | 250 | 4,575 | ||||||
Veritex Holdings, Inc. (1) | 1,177 | 30,990 | ||||||
Virtu Financial, Inc. | 6,317 | 111,495 | ||||||
Virtus Investment Partners, Inc. | 262 | 29,069 | ||||||
Voya Financial, Inc. | 473 | 17,449 | ||||||
Walker & Dunlop, Inc. (1) | 6,096 | 297,668 | ||||||
Waterstone Financial, Inc. | 574 | 10,820 | ||||||
West Bancorporation, Inc. | 883 | 20,883 | ||||||
Western Alliance Bancorp (1) | 42,803 | 2,105,908 | ||||||
Western New England Bancorp, Inc. | 770 | 7,815 | ||||||
Westwood Holdings Group, Inc. | 2,129 | 120,693 | ||||||
WisdomTree Investments, Inc. | 28,790 | 292,794 | ||||||
WSFS Financial Corp. | 2,079 | 94,283 | ||||||
XL Group Ltd. | 3,576 | 156,629 | ||||||
|
| |||||||
| 244,017,042 | ||||||||
|
| |||||||
Healthcare - 20.19% | ||||||||
AAC Holdings, Inc. (1) | 70,092 | 485,738 | ||||||
Abaxis, Inc. | 5,605 | 297,177 | ||||||
ABIOMED, Inc. (1) | 64,111 | 9,187,106 | ||||||
Acadia Healthcare Co., Inc. (1) | 59,773 | 2,951,591 | ||||||
ACADIA Pharmaceuticals, Inc. (1) | 4,231 | 118,003 | ||||||
Accelerate Diagnostics, Inc. (1) | 6,284 | 171,867 | ||||||
Acceleron Pharma, Inc. (1) | 6,779 | 206,014 | ||||||
Accuray, Inc. (1) | 20,816 | 98,876 | ||||||
Achaogen, Inc. (1) | 7,421 | 161,258 | ||||||
Aclaris Therapeutics, Inc. (1) | 5,142 | 139,451 | ||||||
Acorda Therapeutics, Inc. (1) | 1,604 | 31,599 | ||||||
Adamas Pharmaceuticals, Inc. (1) | 1,891 | 33,074 | ||||||
Addus HomeCare Corp. (1) | 1,900 | 70,680 | ||||||
Aduro Biotech, Inc. (1) | 10,539 | 120,145 | ||||||
Advaxis, Inc. (1) | 8,188 | 53,140 | ||||||
Aerie Pharmaceuticals, Inc. (1) | 7,748 | 407,157 | ||||||
Agenus, Inc. (1) | 15,405 | 60,234 | ||||||
Agilent Technologies, Inc. | 3,514 | 208,415 | ||||||
Agios Pharmaceuticals, Inc. (1) | 1,683 | 86,590 | ||||||
Aimmune Therapeutics, Inc. (1) | 8,969 | 184,403 | ||||||
| Shares | Value | |||||||
Akebia Therapeutics, Inc. (1) | 9,393 | 134,977 | ||||||
Akorn, Inc. (1) | 70,392 | 2,360,948 | ||||||
Albany Molecular Research, Inc. (1) | 6,633 | 143,936 | ||||||
Alder Biopharmaceuticals, Inc. (1) | 2,033 | 23,278 | ||||||
Alexion Pharmaceuticals, Inc. (1) | 97,347 | 11,844,209 | ||||||
Align Technology, Inc. (1) | 121,484 | 18,237,178 | ||||||
Alkermes Plc (1) | 6,675 | 386,950 | ||||||
Almost Family, Inc. (1) | 832 | 51,293 | ||||||
Alnylam Pharmaceuticals, Inc. (1) | 2,866 | 228,592 | ||||||
Amedisys, Inc. (1) | 7,284 | 457,508 | ||||||
American Renal Associates Holdings, Inc. (1) | 2,194 | 40,699 | ||||||
AmerisourceBergen Corp. | 170,711 | 16,137,311 | ||||||
Amicus Therapeutics, Inc. (1) | 36,649 | 369,055 | ||||||
AMN Healthcare Services, Inc. (1) | 12,085 | 471,919 | ||||||
Amphastar Pharmaceuticals, Inc. (1) | 9,416 | 168,170 | ||||||
AnaptysBio, Inc. (1) | 1,349 | 32,282 | ||||||
Anavex Life Sciences Corp. (1) | 9,330 | 49,636 | ||||||
ANI Pharmaceuticals, Inc. (1) | 2,059 | 96,361 | ||||||
Anika Therapeutics, Inc. (1) | 3,054 | 150,684 | ||||||
Antares Pharma, Inc. (1) | 36,527 | 117,617 | ||||||
Aratana Therapeutics, Inc. (1) | 9,549 | 69,039 | ||||||
Arena Pharmaceuticals, Inc. (1) | 8,194 | 138,228 | ||||||
Array BioPharma, Inc. (1) | 38,766 | 324,471 | ||||||
Assembly Biosciences, Inc. (1) | 3,545 | 73,204 | ||||||
Asterias Biotherapeutics, Inc. - Class A (1) | 5,354 | 19,007 | ||||||
Athenahealth, Inc. (1) | 20,064 | 2,819,995 | ||||||
Athersys, Inc. (1) | 23,095 | 34,873 | ||||||
AtriCure, Inc. (1) | 8,085 | 196,061 | ||||||
Atrion Corp. | 356 | 229,015 | ||||||
Audentes Therapeutics, Inc. (1) | 3,535 | 67,625 | ||||||
Avexis, Inc. (1) | 6,265 | 514,732 | ||||||
AxoGen, Inc. (1) | 6,980 | 116,915 | ||||||
Axovant Sciences Ltd. (1) | 7,644 | 177,264 | ||||||
Bellicum Pharmaceuticals, Inc. (1) | 4,855 | 56,706 | ||||||
BioCryst Pharmaceuticals, Inc. (1) | 16,998 | 94,509 | ||||||
Biohaven Pharmaceutical Holding Co. Ltd. (1) | 2,260 | 56,500 | ||||||
BioMarin Pharmaceutical, Inc. (1) | 186,094 | 16,901,057 | ||||||
Bio-Rad Laboratories, Inc. (1) | 21,565 | 4,880,375 | ||||||
BioScrip, Inc. (1) | 3,639 | 9,880 | ||||||
BioSpecifics Technologies Corp. (1) | 1,468 | 72,681 | ||||||
Bio-Techne Corp. | 40,780 | 4,791,650 | ||||||
BioTelemetry, Inc. (1) | 7,194 | 240,639 | ||||||
Bioverativ, Inc. (1) | 4,749 | 285,747 | ||||||
Bluebird Bio, Inc. (1) | 4,509 | 473,670 | ||||||
Blueprint Medicines Corp. (1) | 9,931 | 503,204 | ||||||
Bruker Corp. | 1,662 | 47,932 | ||||||
C.R. Bard, Inc. | 55,183 | 17,443,898 | ||||||
Calithera Biosciences, Inc. (1) | 7,837 | 116,379 | ||||||
Cambrex Corp. (1) | 8,321 | 497,180 | ||||||
Cantel Medical Corp. | 59,867 | 4,664,238 | ||||||
Capital Senior Living Corp. (1) | 6,293 | 95,717 | ||||||
Cara Therapeutics, Inc. (1) | 5,910 | 90,955 | ||||||
Cardiovascular Systems, Inc. (1) | 8,124 | 261,837 | ||||||
| Shares | Value | |||||||
Castlight Health, Inc. (1) | 16,122 | 66,906 | ||||||
Catalent, Inc. (1) | 333,500 | 11,705,850 | ||||||
Catalyst Pharmaceuticals, Inc. (1) | 18,245 | 50,356 | ||||||
Cempra, Inc. (1) | 1,018 | 4,683 | ||||||
Centene Corp. (1) | 940 | 75,087 | ||||||
Cerner Corp. (1) | 61,032 | 4,056,797 | ||||||
Cerus Corp. (1) | 22,394 | 56,209 | ||||||
Charles River Laboratories International, Inc. (1) | 2,064 | 208,774 | ||||||
Chemed Corp. | 4,028 | 823,847 | ||||||
ChemoCentryx, Inc. (1) | 5,975 | 55,926 | ||||||
Civitas Solutions, Inc. (1) | 3,824 | 66,920 | ||||||
Clearside Biomedical, Inc. (1) | 2,943 | 26,811 | ||||||
Clovis Oncology, Inc. (1) | 11,051 | 1,034,705 | ||||||
Coherus Biosciences, Inc. (1) | 9,786 | 140,429 | ||||||
Collegium Pharmaceutical, Inc. (1) | 357 | 4,466 | ||||||
Computer Programs & Systems, Inc. | 1,511 | 49,561 | ||||||
Conatus Pharmaceuticals, Inc. (1) | 6,539 | 37,665 | ||||||
Concert Pharmaceuticals, Inc. (1) | 1,945 | 27,133 | ||||||
ConforMIS, Inc. (1) | 3,417 | 14,659 | ||||||
Corbus Pharmaceuticals Holdings, Inc. (1) | 11,300 | 71,190 | ||||||
Corcept Therapeutics, Inc. (1) | 23,301 | 274,952 | ||||||
Corindus Vascular Robotics, Inc. (1) | 21,051 | 39,155 | ||||||
Corium International, Inc. (1) | 4,998 | 37,285 | ||||||
CorVel Corp. (1) | 2,439 | 115,731 | ||||||
Cotiviti Holdings, Inc. (1) | 6,850 | 254,409 | ||||||
Cross Country Healthcare, Inc. (1) | 4,263 | 55,035 | ||||||
CryoLife, Inc. (1) | 5,587 | 111,461 | ||||||
Curis, Inc. (1) | 28,114 | 53,135 | ||||||
Cutera, Inc. (1) | 3,375 | 87,412 | ||||||
Cytokinetics, Inc. (1) | 10,615 | 128,441 | ||||||
CytomX Therapeutics, Inc. (1) | 7,399 | 114,684 | ||||||
Dentsply Sirona, Inc. | 495,680 | 32,139,891 | ||||||
Depomed, Inc. (1) | 14,636 | 157,191 | ||||||
Dermira, Inc. (1) | 8,016 | 233,586 | ||||||
DexCom, Inc. (1) | 3,749 | 274,239 | ||||||
Durect Corp. (1) | 35,512 | 55,399 | ||||||
Dynavax Technologies Corp. (1) | 983 | 9,486 | ||||||
Eagle Pharmaceuticals, Inc. (1) | 2,120 | 167,247 | ||||||
Edge Therapeutics, Inc. (1) | 4,903 | 50,305 | ||||||
Editas Medicine, Inc. (1) | 6,145 | 103,113 | ||||||
Edwards Lifesciences Corp. (1) | 9,171 | 1,084,379 | ||||||
Emergent BioSolutions, Inc. (1) | 4,155 | 140,896 | ||||||
Endologix, Inc. (1) | 21,437 | 104,184 | ||||||
Ensign Group, Inc. | 7,263 | 158,116 | ||||||
Entellus Medical, Inc. (1) | 3,025 | 50,094 | ||||||
Enzo Biochem, Inc. (1) | 9,940 | 109,738 | ||||||
Epizyme, Inc. (1) | 7,570 | 114,307 | ||||||
Esperion Therapeutics, Inc. (1) | 3,819 | 176,743 | ||||||
Evolent Health, Inc. (1) | 2,433 | 61,677 | ||||||
Exact Sciences Corp. (1) | 28,094 | 993,685 | ||||||
Exelixis, Inc. (1) | 12,663 | 311,890 | ||||||
Fate Therapeutics, Inc. (1) | 2,246 | 7,277 | ||||||
FibroGen, Inc. (1) | 15,210 | 491,283 | ||||||
| Shares | Value | |||||||
Flexion Therapeutics, Inc. (1) | 7,004 | 141,621 | ||||||
Fluidigm Corp. (1) | 6,756 | 27,294 | ||||||
FONAR Corp. (1) | 1,366 | 37,907 | ||||||
Fortress Biotech, Inc. (1) | 8,442 | 40,100 | ||||||
Foundation Medicine, Inc. (1) | 3,677 | 146,161 | ||||||
Genesis Healthcare, Inc. (1) | 9,057 | 15,759 | ||||||
GenMark Diagnostics, Inc. (1) | 11,256 | 133,158 | ||||||
Genocea Biosciences, Inc. (1) | 5,981 | 31,221 | ||||||
Genomic Health, Inc. (1) | 4,993 | 162,522 | ||||||
Geron Corp. (1) | 38,487 | 106,609 | ||||||
Glaukos Corp. (1) | 7,325 | 303,768 | ||||||
Global Blood Therapeutics, Inc. (1) | 9,430 | 257,911 | ||||||
Globus Medical, Inc. (1) | 120,341 | 3,989,304 | ||||||
Haemonetics Corp. (1) | 10,855 | 428,664 | ||||||
Halozyme Therapeutics, Inc. (1) | 27,930 | 358,063 | ||||||
HealthEquity, Inc. (1) | 86,152 | 4,292,954 | ||||||
HealthSouth Corp. | 22,863 | 1,106,569 | ||||||
HealthStream, Inc. (1) | 6,597 | 173,633 | ||||||
Henry Schein, Inc. (1) | 65,468 | 11,981,953 | ||||||
Heron Therapeutics, Inc. (1) | 9,958 | 137,918 | ||||||
Heska Corp. (1) | 1,655 | 168,926 | ||||||
Hill-Rom Holdings, Inc. | 2,697 | 214,708 | ||||||
HMS Holdings Corp. (1) | 177,087 | 3,276,110 | ||||||
Hologic, Inc. (1) | 70,236 | 3,187,310 | ||||||
ICON Plc (1) | 34,470 | 3,370,821 | ||||||
ICU Medical, Inc. (1) | 32,629 | 5,628,503 | ||||||
Idera Pharmaceuticals, Inc. (1) | 24,363 | 41,904 | ||||||
IDEXX Laboratories, Inc. (1) | 32,797 | 5,294,092 | ||||||
Ignyta, Inc. (1) | 12,720 | 131,652 | ||||||
Illumina, Inc. (1) | 23,629 | 4,100,104 | ||||||
Immune Design Corp. (1) | 546 | 5,324 | ||||||
ImmunoGen, Inc. (1) | 21,495 | 152,829 | ||||||
Immunomedics, Inc. (1) | 10,125 | 89,404 | ||||||
INC Research Holdings, Inc. (1) | 13,962 | 816,777 | ||||||
Incyte Corp. (1) | 53,970 | 6,795,363 | ||||||
Innoviva, Inc. (1) | 19,388 | 248,166 | ||||||
Inogen, Inc. (1) | 4,358 | 415,840 | ||||||
Inovalon Holdings, Inc. (1) | 15,922 | 209,374 | ||||||
Inovio Pharmaceuticals, Inc. (1) | 17,263 | 135,342 | ||||||
Insmed, Inc. (1) | 13,618 | 233,685 | ||||||
Insulet Corp. (1) | 14,865 | 762,723 | ||||||
Insys Therapeutics, Inc. (1) | 6,014 | 76,077 | ||||||
Integra LifeSciences Holdings Corp. (1) | 437,740 | 23,861,207 | ||||||
Intercept Pharmaceuticals, Inc. (1) | 784 | 94,919 | ||||||
Intersect ENT, Inc. (1) | 6,707 | 187,461 | ||||||
Intrexon Corp. (1) | 2,060 | 49,625 | ||||||
Intuitive Surgical, Inc. (1) | 2,787 | 2,606,876 | ||||||
InVitae Corp. (1) | 9,847 | 94,137 | ||||||
Ionis Pharmaceuticals, Inc. (1) | 5,411 | 275,258 | ||||||
Iovance Biotherapeutics, Inc. (1) | 994 | 7,306 | ||||||
iRhythm Technologies, Inc. (1) | 3,513 | 149,267 | ||||||
Ironwood Pharmaceuticals, Inc. (1) | 34,500 | 651,360 | ||||||
Jounce Therapeutics, Inc. (1) | 1,687 | 23,669 | ||||||
| Shares | Value | |||||||
K2M Group Holdings, Inc. (1) | 10,331 | 251,663 | ||||||
Karyopharm Therapeutics, Inc. (1) | 1,360 | 12,308 | ||||||
Keryx Biopharmaceuticals, Inc. (1) | 20,769 | 150,160 | ||||||
Kindred Biosciences, Inc. (1) | 704 | 6,054 | ||||||
Kite Pharma, Inc. (1) | 12,499 | 1,295,771 | ||||||
Kura Oncology, Inc. (1) | 3,533 | 32,857 | ||||||
La Jolla Pharmaceutical Co. (1) | 4,389 | 130,661 | ||||||
Laboratory Corp. of America Holdings (1) | 122,000 | 18,805,080 | ||||||
Landauer, Inc. | 2,336 | 122,173 | ||||||
Lantheus Holdings, Inc. (1) | 6,134 | 108,265 | ||||||
LeMaitre Vascular, Inc. | 3,795 | 118,480 | ||||||
Lexicon Pharmaceuticals, Inc. (1) | 10,973 | 180,506 | ||||||
LHC Group, Inc. (1) | 3,768 | 255,810 | ||||||
LifePoint Health, Inc. (1) | 272 | 18,265 | ||||||
Ligand Pharmaceuticals, Inc. (1) | 32,598 | 3,957,397 | ||||||
Loxo Oncology, Inc. (1) | 5,120 | 410,573 | ||||||
Luminex Corp. | 4,573 | 96,582 | ||||||
MacroGenics, Inc. (1) | 2,457 | 43,022 | ||||||
Madrigal Pharmaceuticals, Inc. (1) | 903 | 14,683 | ||||||
Magellan Health, Inc. (1) | 4,456 | 324,842 | ||||||
Masimo Corp. (1) | 41,543 | 3,787,891 | ||||||
Matinas BioPharma Holdings, Inc. (1) | 13,244 | 22,382 | ||||||
Medicines Co. (1) | 16,280 | 618,803 | ||||||
MediciNova, Inc. (1) | 7,571 | 39,823 | ||||||
Medidata Solutions, Inc. (1) | 207,359 | 16,215,474 | ||||||
MEDNAX, Inc. (1) | 223,680 | 13,503,562 | ||||||
Meridian Bioscience, Inc. | 9,329 | 146,932 | ||||||
Merit Medical Systems, Inc. (1) | 81,094 | 3,093,736 | ||||||
Merrimack Pharmaceuticals, Inc. | 19,306 | 23,939 | ||||||
Mettler-Toledo International, Inc. (1) | 45,021 | 26,496,659 | ||||||
MiMedx Group, Inc. (1) | 26,524 | 397,064 | ||||||
Minerva Neurosciences, Inc. (1) | 5,273 | 46,666 | ||||||
Miragen Therapeutics, Inc. (1) | 2,392 | 30,929 | ||||||
Molina Healthcare, Inc. (1) | 11,262 | 779,105 | ||||||
Momenta Pharmaceuticals, Inc. (1) | 4,591 | 77,588 | ||||||
MyoKardia, Inc. (1) | 3,989 | 52,256 | ||||||
NanoString Technologies, Inc. (1) | 1,772 | 29,309 | ||||||
Natera, Inc. (1) | 7,955 | 86,391 | ||||||
National Research Corp. | 2,229 | 59,960 | ||||||
Natus Medical, Inc. (1) | 84,346 | 3,146,106 | ||||||
Nektar Therapeutics (1) | 37,883 | 740,613 | ||||||
Neogen Corp. (1) | 56,449 | 3,901,190 | ||||||
NeoGenomics, Inc. (1) | 14,272 | 127,877 | ||||||
Neos Therapeutics, Inc. (1) | 4,411 | 32,200 | ||||||
Neurocrine Biosciences, Inc. (1) | 3,829 | 176,134 | ||||||
Nevro Corp. (1) | 7,086 | 527,411 | ||||||
NewLink Genetics Corp. (1) | 5,565 | 40,903 | ||||||
Novavax, Inc. (1) | 27,738 | 31,899 | ||||||
Novocure Ltd. (1) | 14,732 | 254,864 | ||||||
NuVasive, Inc. (1) | 271,949 | 20,918,317 | ||||||
NxStage Medical, Inc. (1) | 16,606 | 416,312 | ||||||
Nymox Pharmaceutical Corp. (1) | 2,679 | 11,788 | ||||||
Obalon Therapeutics, Inc. (1) | 1,122 | 11,119 | ||||||
| Shares | Value | |||||||
Ocular Therapeutix, Inc. (1) | 5,674 | 52,598 | ||||||
Omeros Corp. (1) | 10,635 | 211,690 | ||||||
Omnicell, Inc. (1) | 98,186 | 4,231,817 | ||||||
Oncocyte Corp. (1) | 936 | 4,867 | ||||||
OPKO Health, Inc. (1) | 1,597 | 10,508 | ||||||
OraSure Technologies, Inc. (1) | 13,719 | 236,790 | ||||||
Organovo Holdings, Inc. (1) | 24,505 | 64,448 | ||||||
Orthofix International (1) | 883 | 41,042 | ||||||
Ovid therapeutics, Inc. (1) | 1,240 | 13,008 | ||||||
Oxford Immunotec Global Plc (1) | 5,570 | 93,687 | ||||||
Pacific Biosciences of California, Inc. (1) | 20,148 | 71,727 | ||||||
Pacira Pharmaceuticals, Inc. (1) | 64,976 | 3,099,355 | ||||||
Paratek Pharmaceuticals, Inc. (1) | 6,005 | 144,721 | ||||||
PAREXEL International Corp. (1) | 212,877 | 18,501,140 | ||||||
Patheon NV (1) | 1,480 | 51,622 | ||||||
Patterson Companies, Inc. | 348 | 16,339 | ||||||
Penumbra, Inc. (1) | 23,554 | 2,066,864 | ||||||
PerkinElmer, Inc. | 936 | 63,779 | ||||||
Phibro Animal Health Corp. | 4,562 | 169,022 | ||||||
Pieris Pharmaceuticals, Inc. (1) | 8,765 | 44,351 | ||||||
Portola Pharmaceuticals, Inc. (1) | 11,753 | 660,166 | ||||||
PRA Health Sciences, Inc. (1) | 9,921 | 744,174 | ||||||
Premier, Inc. (1) | 603 | 21,708 | ||||||
Prestige Brands Holdings, Inc. (1) | 91,041 | 4,807,875 | ||||||
Progenics Pharmaceuticals, Inc. (1) | 17,941 | 121,819 | ||||||
Protagonist Therapeutics, Inc. (1) | 985 | 11,140 | ||||||
Prothena Corporation Plc (1) | 7,620 | 412,394 | ||||||
PTC Therapeutics, Inc. (1) | 6,866 | 125,854 | ||||||
Pulse Biosciences, Inc. (1) | 2,332 | 80,524 | ||||||
Puma Biotechnology, Inc. (1) | 7,351 | 642,477 | ||||||
QIAGEN NV | 3,307 | 110,884 | ||||||
Quality Systems, Inc. (1) | 8,602 | 148,040 | ||||||
Quidel Corp. (1) | 7,073 | 191,961 | ||||||
Quintiles IMS Holdings, Inc. (1) | 3,639 | 325,691 | ||||||
Quotient Ltd. (1) | 4,114 | 30,279 | ||||||
R1 RCM, Inc. (1) | 23,463 | 87,986 | ||||||
Ra Pharmaceuticals, Inc. (1) | 2,976 | 55,770 | ||||||
Radius Health, Inc. (1) | 9,514 | 430,318 | ||||||
RadNet, Inc. (1) | 9,412 | 72,943 | ||||||
Reata Pharmaceuticals, Inc. (1) | 2,178 | 68,912 | ||||||
REGENXBIO, Inc. (1) | 1,955 | 38,611 | ||||||
Repligen Corp. (1) | 63,602 | 2,635,667 | ||||||
ResMed, Inc. | 42,053 | 3,274,667 | ||||||
Revance Therapeutics, Inc. (1) | 5,602 | 147,893 | ||||||
Rigel Pharmaceuticals, Inc. (1) | 31,307 | 85,468 | ||||||
Rockwell Medical, Inc. (1) | 11,095 | 87,983 | ||||||
RTI Surgical, Inc. (1) | 10,472 | 61,261 | ||||||
SAGE Therapeutics, Inc. (1) | 8,838 | 703,858 | ||||||
Sangamo Therapeutics, Inc. (1) | 18,256 | 160,653 | ||||||
Sarepta Therapeutics, Inc. (1) | 10,171 | 342,864 | ||||||
SciClone Pharmaceuticals, Inc. (1) | 4,738 | 52,118 | ||||||
Seattle Genetics, Inc. (1) | 4,193 | 216,946 | ||||||
Select Medical Holdings Corp. (1) | 27,400 | 420,590 | ||||||
| Shares | Value | |||||||
Selecta Biosciences, Inc. (1) | 2,951 | 58,607 | ||||||
Seres Therapeutics, Inc. (1) | 5,125 | 57,913 | ||||||
Simulations Plus, Inc. | 2,698 | 33,320 | ||||||
Spark Therapeutics, Inc. (1) | 5,938 | 354,736 | ||||||
STAAR Surgical Co. (1) | 10,414 | 112,471 | ||||||
Stemline Therapeutics, Inc. (1) | 786 | 7,231 | ||||||
STERIS Plc | 211,000 | 17,196,500 | ||||||
Strongbridge Biopharma Plc (1) | 5,324 | 38,067 | ||||||
Sucampo Pharmaceuticals, Inc. (1) | 5,308 | 55,734 | ||||||
Supernus Pharmaceuticals, Inc. (1) | 12,128 | 522,717 | ||||||
Surgery Partners, Inc. (1) | 4,814 | 109,519 | ||||||
SurModics, Inc. (1) | 3,312 | 93,233 | ||||||
Syndax Pharmaceuticals, Inc. (1) | 2,038 | 28,471 | ||||||
Synergy Pharmaceuticals, Inc. (1) | 57,882 | 257,575 | ||||||
Syros Pharmaceuticals, Inc. (1) | 3,139 | 50,507 | ||||||
Tabula Rasa HealthCare, Inc. (1) | 2,317 | 34,871 | ||||||
Tactile Systems Technology, Inc. (1) | 2,319 | 66,277 | ||||||
Teladoc, Inc. (1) | 13,753 | 477,229 | ||||||
Teleflex, Inc. | 336 | 69,807 | ||||||
Teligent, Inc. (1) | 10,436 | 95,489 | ||||||
Tenet Healthcare Corp. (1) | 20,790 | 402,079 | ||||||
TESARO, Inc. (1) | 1,626 | 227,412 | ||||||
TG Therapeutics, Inc. (1) | 12,396 | 124,580 | ||||||
The Cooper Companies, Inc. | 77,147 | 18,470,535 | ||||||
The Providence Service Corp. (1) | 2,421 | 122,527 | ||||||
The Spectranetics Corp. (1) | 11,101 | 426,278 | ||||||
TherapeuticsMD, Inc. (1) | 39,857 | 210,046 | ||||||
Theravance Biopharma, Inc. (1) | 10,624 | 423,260 | ||||||
Tivity Health, Inc. (1) | 6,227 | 248,146 | ||||||
Tocagen, Inc. (1) | 1,877 | 22,580 | ||||||
Trevena, Inc. (1) | 773 | 1,778 | ||||||
Triple-S Management Corp. (1) | 1,253 | 21,188 | ||||||
Ultragenyx Pharmaceutical, Inc. (1) | 10,117 | 628,367 | ||||||
Universal Health Services, Inc. | 88,837 | 10,845,221 | ||||||
US Physical Therapy, Inc. | 3,078 | 185,911 | ||||||
Utah Medical Products, Inc. | 740 | 53,576 | ||||||
Vanda Pharmaceuticals, Inc. (1) | 11,251 | 183,391 | ||||||
Varex Imaging Corp. (1) | 9,613 | 324,919 | ||||||
Varian Medical Systems, Inc. (1) | 4,032 | 416,062 | ||||||
VBI Vaccines, Inc. (1) | 5,207 | 22,650 | ||||||
VCA, Inc. (1) | 3,430 | 316,623 | ||||||
Veeva Systems, Inc. (1) | 4,697 | 287,973 | ||||||
Veracyte, Inc. (1) | 5,924 | 49,347 | ||||||
Versartis, Inc. (1) | 8,280 | 144,486 | ||||||
ViewRay, Inc. (1) | 7,403 | 47,897 | ||||||
Viveve Medical, Inc. (1) | 3,744 | 26,882 | ||||||
Vocera Communications, Inc. (1) | 7,147 | 188,824 | ||||||
vTv Therapeutics, Inc. (1) | 1,743 | 8,663 | ||||||
Waters Corp. (1) | 75,642 | 13,906,025 | ||||||
WaVe Life Sciences Ltd. (1) | 3,004 | 55,874 | ||||||
WellCare Health Plans, Inc. (1) | 1,796 | 322,490 | ||||||
West Pharmaceutical Services, Inc. | 40,980 | 3,873,430 | ||||||
Wright Medical Group NV (1) | 26,693 | 733,791 | ||||||
| Shares | Value | |||||||
XBiotech, Inc. (1) | 4,382 | 20,595 | ||||||
Xencor, Inc. (1) | 9,742 | 205,654 | ||||||
ZIOPHARM Oncology, Inc. (1) | 33,505 | 208,401 | ||||||
Zoetis, Inc. | 21,586 | 1,346,535 | ||||||
Zogenix, Inc. (1) | 4,706 | 68,237 | ||||||
Zynerba Pharmaceuticals, Inc. (1) | 2,904 | 49,281 | ||||||
|
| |||||||
| 510,704,923 | ||||||||
|
| |||||||
Industrials - 15.21% | ||||||||
A.O. Smith Corp. | 311,767 | 17,561,835 | ||||||
AAON, Inc. | 101,632 | 3,745,139 | ||||||
ABM Industries, Inc. | 7,251 | 301,061 | ||||||
Actuant Corp. | 7,549 | 185,705 | ||||||
Acuity Brands, Inc. | 84,843 | 17,246,885 | ||||||
Advanced Disposal Services, Inc. (1) | 6,391 | 145,267 | ||||||
Advanced Drainage Systems, Inc. | 9,110 | 183,111 | ||||||
Aerojet Rocketdyne Holdings, Inc. (1) | 17,671 | 367,557 | ||||||
Air Lease Corp. | 258 | 9,639 | ||||||
Air Transport Services Group, Inc. (1) | 13,293 | 289,522 | ||||||
Alamo Group, Inc. | 2,087 | 189,520 | ||||||
Alaska Air Group, Inc. | 162,406 | 14,577,563 | ||||||
Albany International Corp. | 5,734 | 306,196 | ||||||
Allegiant Travel Co. | 3,347 | 453,853 | ||||||
Allegion Plc | 4,180 | 339,082 | ||||||
Allied Motion Technologies, Inc. | 1,773 | 48,261 | ||||||
Allison Transmission Holdings, Inc. | 5,853 | 219,546 | ||||||
Altra Industrial Motion Corp. | 7,324 | 291,495 | ||||||
American Airlines Group, Inc. | 8,449 | 425,154 | ||||||
American Woodmark Corp. (1) | 3,595 | 343,502 | ||||||
AMETEK, Inc. | 237,223 | 14,368,597 | ||||||
Apogee Enterprises, Inc. | 7,241 | 411,578 | ||||||
Applied Industrial Technologies, Inc. | 9,773 | 577,096 | ||||||
Aqua Metals, Inc. (1) | 4,249 | 53,325 | ||||||
ArcBest Corp. | 852 | 17,551 | ||||||
Argan, Inc. | 3,720 | 223,200 | ||||||
Armstrong World Industries, Inc. (1) | 1,932 | 88,872 | ||||||
Astec Industries, Inc. | 2,696 | 149,655 | ||||||
Astronics Corp. (1) | 5,477 | 166,884 | ||||||
Atkore International Group, Inc. (1) | 8,393 | 189,262 | ||||||
Avis Budget Group, Inc. (1) | 19,158 | 522,439 | ||||||
Axon Enterprise, Inc. (1) | 61,609 | 1,548,850 | ||||||
AZZ, Inc. | 6,646 | 370,847 | ||||||
Barnes Group, Inc. | 1,744 | 102,076 | ||||||
Barrett Business Services, Inc. | 1,865 | 106,846 | ||||||
Beacon Roofing Supply, Inc. (1) | 115,035 | 5,636,715 | ||||||
BG Staffing, Inc. | 1,745 | 30,328 | ||||||
Blue Bird Corp. (1) | 943 | 16,031 | ||||||
BMC Stock Holdings, Inc. (1) | 913 | 19,949 | ||||||
Brady Corp. | 9,270 | 314,253 | ||||||
Builders FirstSource, Inc. (1) | 24,732 | 378,894 | ||||||
BWX Technologies, Inc. | 4,109 | 200,314 | ||||||
C.H. Robinson Worldwide, Inc. | 6,147 | 422,176 | ||||||
Caesarstone Ltd. (1) | 3,708 | 129,965 | ||||||
CAI International, Inc. (1) | 1,846 | 43,566 | ||||||
| Shares | Value | |||||||
Casella Waste Systems, Inc. (1) | 1,963 | 32,213 | ||||||
Cintas Corp. | 3,769 | 475,045 | ||||||
CIRCOR International, Inc. | 22,320 | 1,325,362 | ||||||
Clean Harbors, Inc. (1) | 1,616 | 90,221 | ||||||
Comfort Systems USA, Inc. | 9,428 | 349,779 | ||||||
Commercial Vehicle Group, Inc. (1) | 6,367 | 53,801 | ||||||
Continental Building Products, Inc. (1) | 10,080 | 234,864 | ||||||
Copa Holdings SA | 99 | 11,583 | ||||||
Copart, Inc. (1) | 8,702 | 276,637 | ||||||
Covanta Holding Corp. | 29,917 | 394,904 | ||||||
CSW Industrials, Inc. (1) | 1,566 | 60,526 | ||||||
Cummins, Inc. | 2,245 | 364,184 | ||||||
Curtiss-Wright Corp. | 8,465 | 776,918 | ||||||
Daseke, Inc. (1) | 4,642 | 51,665 | ||||||
Deluxe Corp. | 12,426 | 860,128 | ||||||
Donaldson Co., Inc. | 5,352 | 243,730 | ||||||
Douglas Dynamics, Inc. | 5,638 | 185,490 | ||||||
Dover Corp. | 200,726 | 16,102,240 | ||||||
Dun & Bradstreet Corp. | 617 | 66,729 | ||||||
DXP Enterprises, Inc. (1) | 3,101 | 106,984 | ||||||
Dycom Industries, Inc. (1) | 7,806 | 698,793 | ||||||
EMCOR Group, Inc. | 11,350 | 742,063 | ||||||
Energous Corp. (1) | 4,806 | 78,146 | ||||||
Energy Recovery, Inc. (1) | 8,637 | 71,601 | ||||||
EnerSys, Inc. | 11,153 | 808,035 | ||||||
EnPro Industries, Inc. | 5,418 | 386,683 | ||||||
EnviroStar, Inc. | 892 | 24,129 | ||||||
Equifax, Inc. | 5,224 | 717,882 | ||||||
Exone Co. (1) | 2,592 | 29,678 | ||||||
Expeditors International of Washington, Inc. | 5,550 | 313,464 | ||||||
Exponent, Inc. | 6,607 | 385,188 | ||||||
Fastenal Co. | 148,683 | 6,472,171 | ||||||
Federal Signal Corp. | 3,626 | 62,947 | ||||||
Fortive Corp. | 12,193 | 772,427 | ||||||
Fortune Brands Home & Security, Inc. | 6,295 | 410,686 | ||||||
Forward Air Corp. | 7,711 | 410,842 | ||||||
Foundation Building Materials, Inc. (1) | 1,076 | 13,837 | ||||||
Franklin Covey Co. (1) | 2,023 | 39,044 | ||||||
Franklin Electric Company, Inc. | 11,202 | 463,763 | ||||||
Gardner Denver Holdings, Inc. (1) | 1,817 | 39,265 | ||||||
Generac Holdings, Inc. (1) | 15,767 | 569,662 | ||||||
General Cable Corp. | 11,833 | 193,470 | ||||||
Genesee & Wyoming, Inc. (1) | 60,114 | 4,111,196 | ||||||
Global Brass and Copper Holdings, Inc. | 5,119 | 156,385 | ||||||
GMS, Inc. (1) | 6,011 | 168,909 | ||||||
GP Strategies Corp. (1) | 2,935 | 77,484 | ||||||
Graco, Inc. | 2,415 | 263,911 | ||||||
Granite Construction, Inc. | 7,903 | 381,241 | ||||||
Great Lakes Dredge & Dock Corp. (1) | 1,313 | 5,646 | ||||||
Griffon Corp. | 6,415 | 140,809 | ||||||
H&E Equipment Services, Inc. | 7,998 | 163,239 | ||||||
Harsco Corp. (1) | 20,519 | 330,356 | ||||||
Hawaiian Holdings, Inc. (1) | 12,302 | 577,579 | ||||||
| Shares | Value | |||||||
HC2 Holdings, Inc. (1) | 10,201 | 59,982 | ||||||
HD Supply Holdings, Inc. (1) | 8,854 | 271,198 | ||||||
Healthcare Services Group, Inc. | 103,691 | 4,855,850 | ||||||
Heartland Express, Inc. | 11,449 | 238,368 | ||||||
Heico Corp. | 91,819 | 6,596,277 | ||||||
Heico Corp. - Class A | 43,328 | 2,688,502 | ||||||
Herc Holdings, Inc. (1) | 6,189 | 243,351 | ||||||
Heritage Crystal Clean, Inc. (1) | 2,014 | 32,023 | ||||||
Herman Miller, Inc. | 13,017 | 395,717 | ||||||
Hexcel Corp. | 2,646 | 139,682 | ||||||
Hill International, Inc. (1) | 7,763 | 40,368 | ||||||
Hillenbrand, Inc. | 16,189 | 584,423 | ||||||
HNI Corp. | 11,297 | 450,411 | ||||||
Hubbell, Inc. | 1,535 | 173,716 | ||||||
Hudson Technologies, Inc. (1) | 9,360 | 79,092 | ||||||
Huntington Ingalls Industries, Inc. | 1,658 | 308,653 | ||||||
Huttig Building Products, Inc. (1) | 4,382 | 30,718 | ||||||
Hyster-Yale Materials Handling, Inc. | 2,201 | 154,620 | ||||||
IDEX Corp. | 296,416 | 33,497,972 | ||||||
IHS Markit Ltd. (1) | 41,754 | 1,838,846 | ||||||
Ingersoll-Rand Plc | 5,635 | 514,983 | ||||||
InnerWorkings, Inc. (1) | 10,826 | 125,582 | ||||||
Insperity, Inc. | 4,677 | 332,067 | ||||||
Insteel Industries, Inc. | 4,189 | 138,111 | ||||||
Interface, Inc. | 14,270 | 280,405 | ||||||
J.B. Hunt Transportation Services, Inc. | 16,994 | 1,552,912 | ||||||
JELD-WEN Holding, Inc. (1) | 5,673 | 184,146 | ||||||
John Bean Technologies Corp. | 8,044 | 788,312 | ||||||
Kadant, Inc. | 2,770 | 208,304 | ||||||
Kaman Corp. | 563 | 28,077 | ||||||
KAR Auction Services, Inc. | 6,008 | 252,156 | ||||||
KBR, Inc. | 4,029 | 61,321 | ||||||
Kennametal, Inc. | 20,519 | 767,821 | ||||||
KeyW Holding Corp. (1) | 123,475 | 1,154,491 | ||||||
Kforce, Inc. | 6,026 | 118,110 | ||||||
Kimball International, Inc. | 8,007 | 133,637 | ||||||
Knight Transportation, Inc. | 17,542 | 649,931 | ||||||
Knoll, Inc. | 11,628 | 233,141 | ||||||
Kornit Digital Ltd. (1) | 57,632 | 1,115,179 | ||||||
Kratos Defense & Security Solutions, Inc. (1) | 7,017 | 83,292 | ||||||
Landstar System, Inc. | 35,395 | 3,029,812 | ||||||
Lawson Products, Inc. (1) | 1,099 | 24,343 | ||||||
Lennox International, Inc. | 1,575 | 289,233 | ||||||
Lincoln Electric Holdings, Inc. | 2,576 | 237,224 | ||||||
Lindsay Corp. | 2,674 | 238,654 | ||||||
Lydall, Inc. (1) | 4,301 | 222,362 | ||||||
Masco Corp. | 9,089 | 347,291 | ||||||
Masonite International Corp. (1) | 7,611 | 574,630 | ||||||
MasTec, Inc. (1) | 17,046 | 769,627 | ||||||
Matson, Inc. | 5,166 | 155,187 | ||||||
Matthews International Corp. | 8,007 | 490,429 | ||||||
McGrath RentCorp | 385 | 13,333 | ||||||
Mercury Systems, Inc. (1) | 11,052 | 465,179 | ||||||
| Shares | Value | |||||||
Milacron Holdings Corp. (1) | 10,097 | 177,606 | ||||||
Miller Industries, Inc. | 188 | 4,672 | ||||||
Mistras Group, Inc. (1) | 517 | 11,358 | ||||||
Moog, Inc. (1) | 735 | 52,714 | ||||||
MSA Safety, Inc. | 8,515 | 691,163 | ||||||
MSC Industrial Direct Co., Inc. | 19,822 | 1,703,899 | ||||||
Mueller Industries, Inc. | 14,519 | 442,104 | ||||||
Mueller Water Products, Inc. | 24,128 | 281,815 | ||||||
Multi-Color Corp. | 3,485 | 284,376 | ||||||
MYR Group, Inc. (1) | 1,815 | 56,301 | ||||||
National Presto Industries, Inc. | 105 | 11,602 | ||||||
Navistar International Corp. (1) | 719 | 18,859 | ||||||
NCI Building Systems, Inc. (1) | 10,171 | 169,856 | ||||||
Neff Corp. (1) | 1,910 | 36,290 | ||||||
NN, Inc. | 6,913 | 189,762 | ||||||
Nordson Corp. | 30,421 | 3,690,676 | ||||||
NV5 Global, Inc. (1) | 1,531 | 65,067 | ||||||
Old Dominion Freight Line, Inc. | 1,722 | 164,003 | ||||||
Omega Flex, Inc. | 761 | 49,008 | ||||||
On Assignment, Inc. (1) | 13,004 | 704,167 | ||||||
Orbital ATK, Inc. | 33,369 | 3,282,175 | ||||||
Orion Group Holdings, Inc. (1) | 3,238 | 24,188 | ||||||
Parker-Hannifin Corp. | 5,020 | 802,296 | ||||||
Patrick Industries, Inc. (1) | 4,167 | 303,566 | ||||||
Paylocity Holding Corp. (1) | 6,640 | 299,995 | ||||||
PGT Innovations, Inc. (1) | 12,491 | 159,885 | ||||||
Plug Power, Inc. (1) | 57,059 | 116,400 | ||||||
Ply Gem Holdings, Inc. (1) | 5,683 | 102,010 | ||||||
Primoris Services Corp. | 128,676 | 3,209,179 | ||||||
Proto Labs, Inc. (1) | 47,935 | 3,223,629 | ||||||
Quad/Graphics, Inc. | 4,579 | 104,951 | ||||||
Quanex Building Products Corp. | 702 | 14,847 | ||||||
Quanta Services, Inc. (1) | 1,605 | 52,837 | ||||||
Radiant Logistics, Inc. (1) | 9,489 | 51,051 | ||||||
Raven Industries, Inc. | 9,231 | 307,392 | ||||||
RBC Bearings, Inc. (1) | 49,787 | 5,066,325 | ||||||
REV Group, Inc. | 3,220 | 89,130 | ||||||
Ritchie Bros Auctioneers, Inc. | 406,571 | 11,684,851 | ||||||
Robert Half International, Inc. | 5,405 | 259,062 | ||||||
Rockwell Automation, Inc. | 213,744 | 34,617,978 | ||||||
Rockwell Collins, Inc. | 7,117 | 747,854 | ||||||
Rollins, Inc. | 4,190 | 170,575 | ||||||
Roper Technologies, Inc. | 4,174 | 966,406 | ||||||
RR Donnelley & Sons Co. | 4,802 | 60,217 | ||||||
Rush Enterprises, Inc. - Class A (1) | 3,660 | 136,079 | ||||||
Rush Enterprises, Inc. - Class B (1) | 606 | 22,064 | ||||||
Saia, Inc. (1) | 2,813 | 144,307 | ||||||
Schneider National, Inc. (1) | 7,704 | 172,338 | ||||||
Sensata Technologies Holding NV (1) | 3,761 | 160,670 | ||||||
Simpson Manufacturing Company, Inc. | 1,601 | 69,980 | ||||||
SiteOne Landscape Supply, Inc. (1) | 46,669 | 2,429,588 | ||||||
Snap-on, Inc. | 333 | 52,614 | ||||||
SP Plus Corp. (1) | 1,386 | 42,342 | ||||||
| Shares | Value | |||||||
Spartan Motors, Inc. | 4,992 | 44,179 | ||||||
Sparton Corp. (1) | 131 | 2,881 | ||||||
SPX Corp. (1) | 10,879 | 273,716 | ||||||
SPX FLOW, Inc. (1) | 2,669 | 98,433 | ||||||
Standex International Corp. | 2,532 | 229,652 | ||||||
Stanley Black & Decker, Inc. | 736 | 103,577 | ||||||
Steelcase, Inc. | 17,819 | 249,466 | ||||||
Stericycle, Inc. (1) | 138,000 | 10,532,160 | ||||||
Sterling Construction Company, Inc. (1) | 1,497 | 19,566 | ||||||
Sun Hydraulics Corp. | 6,032 | 257,385 | ||||||
Supreme Industries, Inc. | 2,137 | 35,154 | ||||||
Swift Transportation Co. (1) | 18,659 | 494,463 | ||||||
Team, Inc. (1) | 3,459 | 81,114 | ||||||
Tennant Co. | 4,284 | 316,159 | ||||||
Tetra Tech, Inc. | 13,621 | 623,161 | ||||||
The Advisory Board Co. (1) | 60,021 | 3,091,081 | ||||||
The Brink’s Co. | 11,742 | 786,714 | ||||||
The Middleby Corp. (1) | 2,482 | 301,588 | ||||||
The Toro Co. | 54,787 | 3,796,191 | ||||||
TPI Composites, Inc. (1) | 2,712 | 50,118 | ||||||
TransDigm Group, Inc. | 2,122 | 570,542 | ||||||
TransUnion (1) | 5,587 | 241,973 | ||||||
Trex Company, Inc. (1) | 7,556 | 511,239 | ||||||
TriNet Group, Inc. (1) | 10,533 | 344,850 | ||||||
TrueBlue, Inc. (1) | 639 | 16,933 | ||||||
Tutor Perini Corp. (1) | 1,516 | 43,585 | ||||||
UniFirst Corp. | 20,777 | 2,923,324 | ||||||
United Rentals, Inc. (1) | 160,529 | 18,093,224 | ||||||
Univar, Inc. (1) | 4,536 | 132,451 | ||||||
Universal Forest Products, Inc. | 4,519 | 394,554 | ||||||
Universal Logistics Holdings, Inc. | 1,350 | 20,250 | ||||||
US Ecology, Inc. | 5,602 | 282,901 | ||||||
Vectrus, Inc. (1) | 528 | 17,065 | ||||||
Verisk Analytics, Inc. (1) | 121,041 | 10,212,229 | ||||||
Viad Corp. | 3,135 | 148,129 | ||||||
Vicor Corp. (1) | 4,001 | 71,618 | ||||||
W.W. Grainger, Inc. | 64,209 | 11,591,651 | ||||||
Wabash National Corp. | 4,285 | 94,184 | ||||||
WABCO Holdings, Inc. (1) | 126,805 | 16,168,906 | ||||||
Wabtec Corp. | 170,202 | 15,573,483 | ||||||
WageWorks, Inc. (1) | 107,243 | 7,206,730 | ||||||
Watsco, Inc. | 33,273 | 5,130,697 | ||||||
Watts Water Technologies, Inc. | 4,156 | 262,659 | ||||||
Welbilt, Inc. (1) | 22,724 | 428,347 | ||||||
West Corp. | 1,762 | 41,090 | ||||||
Willdan Group, Inc. (1) | 1,951 | 59,603 | ||||||
Woodward, Inc. | 13,634 | 921,386 | ||||||
XPO Logistics, Inc. (1) | 3,563 | 230,277 | ||||||
Xylem, Inc. | 4,096 | 227,041 | ||||||
YRC Worldwide, Inc. (1) | 1,549 | 17,225 | ||||||
|
| |||||||
| 384,838,730 | ||||||||
|
| |||||||
Information Technology - 22.93% | ||||||||
2U, Inc. (1) | 11,193 | 525,176 | ||||||
| Shares | Value | |||||||
3D Systems Corp. (1) | 28,058 | 524,685 | ||||||
8x8, Inc. (1) | 104,725 | 1,523,749 | ||||||
A10 Networks, Inc. (1) | 12,134 | 102,411 | ||||||
Acacia Communications, Inc. (1) | 4,314 | 178,902 | ||||||
ACI Worldwide, Inc. (1) | 29,806 | 666,760 | ||||||
Acxiom Corp. (1) | 10,411 | 270,478 | ||||||
Advanced Energy Industries, Inc. (1) | 10,171 | 657,962 | ||||||
Advanced Micro Devices, Inc. (1) | 36,153 | 451,189 | ||||||
Aerohive Networks, Inc. (1) | 7,540 | 37,700 | ||||||
Akamai Technologies, Inc. (1) | 149,000 | 7,421,690 | ||||||
Akoustis Technologies, Inc. (1) | 2,188 | 19,123 | ||||||
Alarm.com Holdings, Inc. (1) | 5,187 | 195,187 | ||||||
Alliance Data Systems Corp. | 47,599 | 12,218,187 | ||||||
Alpha and Omega Semiconductor Ltd. (1) | 287 | 4,784 | ||||||
Alteryx, Inc. (1) | 2,247 | 43,861 | ||||||
Ambarella, Inc. (1) | 3,522 | 170,993 | ||||||
Amber Road, Inc. (1) | 5,040 | 43,193 | ||||||
American Software, Inc. | 4,079 | 41,973 | ||||||
Amkor Technology, Inc. (1) | 1,277 | 12,476 | ||||||
Amphenol Corp. | 13,112 | 967,928 | ||||||
Analog Devices, Inc. | 15,876 | 1,235,153 | ||||||
Angie’s List, Inc. (1) | 16,269 | 208,081 | ||||||
ANSYS, Inc. (1) | 102,708 | 12,497,509 | ||||||
Appfolio, Inc. (1) | 1,924 | 62,722 | ||||||
Applied Optoelectronics, Inc. (1) | 4,708 | 290,907 | ||||||
Apptio, Inc. (1) | 4,525 | 78,509 | ||||||
Arista Networks, Inc. (1) | 2,320 | 347,513 | ||||||
Aspen Technology, Inc. (1) | 405,091 | 22,385,329 | ||||||
Atlassian Corporation Plc (1) | 376,593 | 13,248,542 | ||||||
Autodesk, Inc. (1) | 7,450 | 751,109 | ||||||
Avid Technology, Inc. (1) | 5,196 | 27,331 | ||||||
Axcelis Technologies, Inc. (1) | 7,660 | 160,477 | ||||||
Badger Meter, Inc. | 7,192 | 286,601 | ||||||
Barracuda Networks, Inc. (1) | 6,433 | 148,345 | ||||||
Bel Fuse, Inc. | 581 | 14,351 | ||||||
Benefitfocus, Inc. (1) | 4,041 | 146,890 | ||||||
Black Knight Financial Services, Inc. (1) | 1,261 | 51,638 | ||||||
Blackbaud, Inc. | 148,189 | 12,707,207 | ||||||
Blackhawk Network Holdings, Inc. (1) | 14,049 | 612,536 | ||||||
Blackline, Inc. (1) | 2,795 | 99,893 | ||||||
Blucora, Inc. (1) | 2,135 | 45,262 | ||||||
Booz Allen Hamilton Holding Corp. | 6,035 | 196,379 | ||||||
Bottomline Technologies, Inc. (1) | 8,998 | 231,159 | ||||||
Box, Inc. (1) | 20,070 | 366,077 | ||||||
Brightcove, Inc. (1) | 8,602 | 53,332 | ||||||
Broadridge Financial Solutions, Inc. | 5,137 | 388,152 | ||||||
BroadSoft, Inc. (1) | 7,847 | 337,813 | ||||||
Brooks Automation, Inc. | 17,572 | 381,137 | ||||||
Cabot Microelectronics Corp. | 6,363 | 469,780 | ||||||
Cadence Design Systems, Inc. (1) | 93,558 | 3,133,257 | ||||||
CalAmp Corp. (1) | 8,878 | 180,490 | ||||||
Callidus Software, Inc. (1) | 16,475 | 398,695 | ||||||
Carbonite, Inc. (1) | 6,356 | 138,561 | ||||||
| Shares | Value | |||||||
CardConnect Corp. (1) | 3,946 | 59,387 | ||||||
Cardtronics Plc (1) | 11,697 | 384,363 | ||||||
Care.com, Inc. (1) | 3,327 | 50,238 | ||||||
Cass Information Systems, Inc. | 2,792 | 183,267 | ||||||
Cavium, Inc. (1) | 33,687 | 2,092,973 | ||||||
CDK Global, Inc. | 5,976 | 370,871 | ||||||
CDW Corp. | 6,689 | 418,263 | ||||||
CEVA, Inc. (1) | 5,513 | 250,566 | ||||||
ChannelAdvisor Corp. (1) | 6,033 | 69,681 | ||||||
Check Point Software Technologies Ltd. (1) | 142,900 | 15,587,532 | ||||||
Ciena Corp. (1) | 36,103 | 903,297 | ||||||
Cimpress (1) | 6,409 | 605,843 | ||||||
Cirrus Logic, Inc. (1) | 16,503 | 1,035,068 | ||||||
Citrix Systems, Inc. (1) | 154,476 | 12,293,200 | ||||||
Clearfield, Inc. (1) | 2,940 | 38,808 | ||||||
Cloudera, Inc. (1) | 3,618 | 57,960 | ||||||
Cognex Corp. | 114,655 | 9,734,209 | ||||||
Coherent, Inc. (1) | 1,071 | 240,964 | ||||||
Cohu, Inc. | 1,175 | 18,495 | ||||||
CommerceHub, Inc. - Class A (1) | 3,494 | 60,865 | ||||||
CommerceHub, Inc. - Class C (1) | 7,364 | 128,428 | ||||||
CommScope Holding Co., Inc. (1) | 4,226 | 160,715 | ||||||
CommVault Systems, Inc. (1) | 9,925 | 560,266 | ||||||
Control4 Corp. (1) | 5,625 | 110,306 | ||||||
CoreLogic, Inc. (1) | 2,182 | 94,655 | ||||||
Cornerstone OnDemand, Inc. (1) | 13,305 | 475,654 | ||||||
CoStar Group, Inc. (1) | 17,397 | 4,585,849 | ||||||
Coupa Software, Inc. (1) | 7,602 | 220,306 | ||||||
CPI Card Group, Inc. | 4,970 | 14,164 | ||||||
CSG Systems International, Inc. | 7,069 | 286,860 | ||||||
CSRA, Inc. | 7,096 | 225,298 | ||||||
CyberArk Software Ltd. (1) | 30,799 | 1,538,410 | ||||||
CyberOptics Corp. (1) | 939 | 19,390 | ||||||
Cypress Semiconductor Corp. | 1,211 | 16,530 | ||||||
Daktronics, Inc. | 5,365 | 51,665 | ||||||
Dell Technologies, Inc. - VMware, Inc. (1) | 8,995 | 549,684 | ||||||
Diebold Nixdorf, Inc. | 19,292 | 540,176 | ||||||
Digimarc Corp. (1) | 2,299 | 92,305 | ||||||
Diodes, Inc. (1) | 2,510 | 60,315 | ||||||
Dolby Laboratories, Inc. | 61,194 | 2,996,058 | ||||||
DST Systems, Inc. | 274 | 16,906 | ||||||
DXC Technology Co. | 12,422 | 953,016 | ||||||
Eastman Kodak Co. (1) | 3,784 | 34,434 | ||||||
Ebix, Inc. | 6,154 | 331,701 | ||||||
Electronic Arts, Inc. (1) | 13,200 | 1,395,504 | ||||||
Electronics For Imaging, Inc. (1) | 11,847 | 561,311 | ||||||
Ellie Mae, Inc. (1) | 49,754 | 5,468,462 | ||||||
Endurance International Group Holdings, Inc. (1) | 14,805 | 123,622 | ||||||
EnerNOC, Inc. (1) | 1,261 | 9,773 | ||||||
Entegris, Inc. (1) | 36,305 | 796,895 | ||||||
Envestnet, Inc. (1) | 94,046 | 3,724,222 | ||||||
EPAM Systems, Inc. (1) | 12,576 | 1,057,516 | ||||||
ePlus, Inc. (1) | 3,360 | 248,976 | ||||||
| Shares | Value | |||||||
Euronet Worldwide, Inc. (1) | 45,985 | 4,017,709 | ||||||
Everbridge, Inc. (1) | 4,305 | 104,870 | ||||||
Everi Holdings, Inc. (1) | 16,239 | 118,220 | ||||||
EVERTEC, Inc. | 13,061 | 225,955 | ||||||
Exa Corp. (1) | 3,578 | 49,376 | ||||||
ExlService Holdings, Inc. (1) | 106,611 | 5,925,439 | ||||||
Extreme Networks, Inc. (1) | 27,946 | 257,662 | ||||||
F5 Networks, Inc. (1) | 2,841 | 360,977 | ||||||
Fabrinet (1) | 9,301 | 396,781 | ||||||
FactSet Research Systems, Inc. | 1,690 | 280,844 | ||||||
Fair Isaac Corp. | 7,876 | 1,097,993 | ||||||
FARO Technologies, Inc. (1) | 1,071 | 40,484 | ||||||
Fidelity National Information Services, Inc. | 8,207 | 700,878 | ||||||
Finisar Corp. (1) | 13,224 | 343,560 | ||||||
First Data Corp. (1) | 16,191 | 294,676 | ||||||
Fiserv, Inc. (1) | 9,303 | 1,138,129 | ||||||
Five9, Inc. (1) | 13,318 | 286,603 | ||||||
FleetCor Technologies, Inc. (1) | 4,026 | 580,589 | ||||||
FLIR Systems, Inc. | 173,897 | 6,027,270 | ||||||
FormFactor, Inc. (1) | 18,374 | 227,838 | ||||||
Forrester Research, Inc. | 2,635 | 103,160 | ||||||
Fortinet, Inc. (1) | 786,654 | 29,452,326 | ||||||
Gartner, Inc. (1) | 3,841 | 474,402 | ||||||
Genpact Ltd. | 5,876 | 163,529 | ||||||
Gigamon, Inc. (1) | 9,248 | 363,909 | ||||||
Global Payments, Inc. | 6,658 | 601,351 | ||||||
Global Sources Ltd. (1) | 1,607 | 32,140 | ||||||
Glu Mobile, Inc. (1) | 1,908 | 4,770 | ||||||
GoDaddy, Inc. (1) | 3,431 | 145,543 | ||||||
Gogo, Inc. (1) | 14,602 | 168,361 | ||||||
GrubHub, Inc. (1) | 313,950 | 13,688,220 | ||||||
GTT Communications, Inc. (1) | 7,922 | 250,731 | ||||||
Guidance Software, Inc. (1) | 5,900 | 38,999 | ||||||
Guidewire Software, Inc. (1) | 204,213 | 14,031,475 | ||||||
Hackett Group, Inc. | 6,086 | 94,333 | ||||||
Harris Corp. | 13,767 | 1,501,704 | ||||||
Hortonworks, Inc. (1) | 12,172 | 156,775 | ||||||
HubSpot, Inc. (1) | 8,603 | 565,647 | ||||||
Ichor Holdings Ltd. (1) | 2,997 | 60,420 | ||||||
II-VI, Inc. (1) | 4,418 | 151,537 | ||||||
Immersion Corp. (1) | 7,341 | 66,656 | ||||||
Imperva, Inc. (1) | 8,558 | 409,500 | ||||||
Impinj, Inc. (1) | 4,609 | 224,228 | ||||||
Information Services Group, Inc. (1) | 5,558 | 22,843 | ||||||
Inphi Corp. (1) | 10,673 | 366,084 | ||||||
Insight Enterprises, Inc. (1) | 3,534 | 141,325 | ||||||
Instructure, Inc. (1) | 5,408 | 159,536 | ||||||
Integrated Device Technology, Inc. (1) | 102,482 | 2,643,011 | ||||||
InterActiveCorp (1) | 3,059 | 315,811 | ||||||
Interdigital, Inc. | 8,886 | 686,888 | ||||||
Internap Corp. (1) | 20,184 | 74,075 | ||||||
Intevac, Inc. (1) | 4,923 | 54,645 | ||||||
IPG Photonics Corp. (1) | 121,195 | 17,585,395 | ||||||
| Shares | Value | |||||||
Iteris, Inc. (1) | 5,950 | 37,009 | ||||||
Itron, Inc. (1) | 8,740 | 592,135 | ||||||
J2 Global, Inc. | 11,883 | 1,011,124 | ||||||
Jack Henry & Associates, Inc. | 3,394 | 352,535 | ||||||
KEMET Corp. (1) | 11,698 | 149,734 | ||||||
KLA-Tencor Corp. | 6,882 | 629,772 | ||||||
Kopin Corp. (1) | 13,818 | 51,265 | ||||||
Lam Research Corp. | 7,079 | 1,001,183 | ||||||
Lattice Semiconductor Corp. (1) | 31,290 | 208,391 | ||||||
Limelight Networks, Inc. (1) | 8,132 | 23,501 | ||||||
Littelfuse, Inc. | 33,168 | 5,472,720 | ||||||
LivePerson, Inc. (1) | 13,867 | 152,537 | ||||||
LogMeIn, Inc. | 63,842 | 6,671,489 | ||||||
Lumentum Holdings, Inc. (1) | 15,596 | 889,752 | ||||||
MACOM Technology Solutions Holdings, Inc. (1) | 10,368 | 578,223 | ||||||
Majesco, Inc. (1) | 1,055 | 5,201 | ||||||
Manhattan Associates, Inc. (1) | 41,661 | 2,002,228 | ||||||
Match Group, Inc. (1) | 1,603 | 27,860 | ||||||
Maxim Integrated Products, Inc. | 12,333 | 553,752 | ||||||
MAXIMUS, Inc. | 16,468 | 1,031,391 | ||||||
MaxLinear, Inc. (1) | 15,402 | 429,562 | ||||||
Meet Group, Inc. (1) | 2,988 | 15,089 | ||||||
MercadoLibre, Inc. | 97,688 | 24,507,965 | ||||||
Mesa Laboratories, Inc. | 800 | 114,648 | ||||||
Methode Electronics, Inc. | 9,172 | 377,886 | ||||||
Microchip Technology, Inc. | 56,818 | 4,385,213 | ||||||
Microsemi Corp. (1) | 44,578 | 2,086,250 | ||||||
MicroStrategy, Inc. (1) | 1,357 | 260,096 | ||||||
MicroVision, Inc. (1) | 17,180 | 36,422 | ||||||
MINDBODY, Inc. (1) | 9,416 | 256,115 | ||||||
Mitek Systems, Inc. (1) | 7,616 | 63,974 | ||||||
MKS Instruments, Inc. | 13,783 | 927,596 | ||||||
MobileIron, Inc. (1) | 13,934 | 84,301 | ||||||
Model N, Inc. (1) | 6,036 | 80,279 | ||||||
MoneyGram International, Inc. (1) | 723 | 12,472 | ||||||
Monolithic Power Systems, Inc. | 70,896 | 6,834,374 | ||||||
Monotype Imaging Holdings, Inc. | 5,145 | 94,154 | ||||||
Motorola Solutions, Inc. | 760 | 65,922 | ||||||
MuleSoft, Inc. (1) | 3,851 | 96,044 | ||||||
Nanometrics, Inc. (1) | 4,986 | 126,096 | ||||||
Napco Security Technologies, Inc. (1) | 2,960 | 27,824 | ||||||
National Instruments Corp. | 46,942 | 1,888,007 | ||||||
NCI, Inc. (1) | 548 | 11,563 | ||||||
NCR Corp. (1) | 5,283 | 215,758 | ||||||
NetApp, Inc. | 10,189 | 408,069 | ||||||
NetScout Systems, Inc. (1) | 85,477 | 2,940,409 | ||||||
New Relic, Inc. (1) | 7,488 | 322,059 | ||||||
NIC, Inc. | 16,507 | 312,808 | ||||||
Nice Ltd. - ADR | 134,506 | 10,588,312 | ||||||
Novanta, Inc. (1) | 8,193 | 294,948 | ||||||
Nutanix, Inc. (1) | 8,895 | 179,234 | ||||||
NVE Corp. | 1,120 | 86,240 | ||||||
Oclaro, Inc. (1) | 36,881 | 344,469 | ||||||
| Shares | Value | |||||||
Okta, Inc. (1) | 2,806 | 63,977 | ||||||
Ominto, Inc. (1) | 3,273 | 49,913 | ||||||
ON Semiconductor Corp. (1) | 17,267 | 242,429 | ||||||
OSI Systems, Inc. (1) | 4,445 | 334,042 | ||||||
Palo Alto Networks, Inc. (1) | 190,135 | 25,441,964 | ||||||
Pandora Media, Inc. (1) | 9,897 | 88,281 | ||||||
Park City Group, Inc. (1) | 2,841 | 34,518 | ||||||
Paychex, Inc. | 14,109 | 803,366 | ||||||
Paycom Software, Inc. (1) | 152,577 | 10,437,793 | ||||||
PCM, Inc. (1) | 1,007 | 18,881 | ||||||
PDF Solutions, Inc. (1) | 6,660 | 109,557 | ||||||
Pegasystems, Inc. | 9,410 | 549,074 | ||||||
Perficient, Inc. (1) | 676 | 12,601 | ||||||
Pixelworks, Inc. (1) | 7,212 | 33,103 | ||||||
Planet Payment, Inc. (1) | 11,368 | 37,514 | ||||||
Plantronics, Inc. | 8,540 | 446,727 | ||||||
Power Integrations, Inc. | 115,778 | 8,440,216 | ||||||
Presidio, Inc. (1) | 3,060 | 43,789 | ||||||
Progress Software Corp. | 10,139 | 313,194 | ||||||
Proofpoint, Inc. (1) | 56,012 | 4,863,522 | ||||||
PROS Holdings, Inc. (1) | 6,769 | 185,403 | ||||||
PTC, Inc. (1) | 31,279 | 1,724,098 | ||||||
Pure Storage, Inc. (1) | 23,766 | 304,442 | ||||||
Q2 Holdings, Inc. (1) | 44,297 | 1,636,774 | ||||||
QAD, Inc. | 1,607 | 51,504 | ||||||
Qorvo, Inc. (1) | 2,890 | 182,995 | ||||||
Qualys, Inc. (1) | 177,261 | 7,232,249 | ||||||
Quantenna Communications, Inc. (1) | 5,379 | 102,201 | ||||||
Quantum Corp. (1) | 1,364 | 10,653 | ||||||
Quotient Technology, Inc. (1) | 18,778 | 215,947 | ||||||
Radisys Corp. (1) | 1,612 | 6,061 | ||||||
Rambus, Inc. (1) | 7,377 | 84,319 | ||||||
Rapid7, Inc. (1) | 5,344 | 89,940 | ||||||
RealPage, Inc. (1) | 14,999 | 539,214 | ||||||
Red Hat, Inc. (1) | 211,104 | 20,213,208 | ||||||
Reis, Inc. | 2,322 | 49,343 | ||||||
Rogers Corp. (1) | 4,612 | 500,955 | ||||||
Rosetta Stone, Inc. (1) | 801 | 8,635 | ||||||
Rudolph Technologies, Inc. (1) | 7,161 | 163,629 | ||||||
Sabre Corp. | 7,128 | 155,177 | ||||||
Science Applications International Corp. | 11,231 | 779,656 | ||||||
Semtech Corp. (1) | 169,910 | 6,074,283 | ||||||
ServiceNow, Inc. (1) | 7,334 | 777,404 | ||||||
ServiceSource International, Inc. (1) | 12,432 | 48,236 | ||||||
Shopify, Inc. (1) | 21,780 | 1,892,682 | ||||||
Shutterstock, Inc. (1) | 4,751 | 209,424 | ||||||
Silicon Laboratories, Inc. (1) | 10,733 | 733,601 | ||||||
Silver Spring Networks, Inc. (1) | 2,551 | 28,775 | ||||||
Skyworks Solutions, Inc. | 8,089 | 776,140 | ||||||
Splunk, Inc. (1) | 479,668 | 27,288,313 | ||||||
SPS Commerce, Inc. (1) | 4,318 | 275,316 | ||||||
Square, Inc. (1) | 98,317 | 2,306,517 | ||||||
SS&C Technologies Holdings, Inc. | 6,943 | 266,681 | ||||||
| Shares | Value | |||||||
Stamps.com, Inc. (1) | 16,153 | 2,501,696 | ||||||
StarTek, Inc. (1) | 2,650 | 32,436 | ||||||
Stratasys Ltd. (1) | 6,357 | 148,182 | ||||||
Super Micro Computer, Inc. (1) | 2,104 | 51,864 | ||||||
Sykes Enterprises, Inc. (1) | 981 | 32,893 | ||||||
Symantec Corp. | 27,081 | 765,038 | ||||||
Synaptics, Inc. (1) | 8,814 | 455,772 | ||||||
SYNNEX Corp. | 1,523 | 182,699 | ||||||
Synopsys, Inc. (1) | 101,579 | 7,408,156 | ||||||
Syntel, Inc. | 8,519 | 144,482 | ||||||
Tableau Software, Inc. (1) | 237,958 | 14,579,687 | ||||||
Take-Two Interactive Software, Inc. (1) | 40,652 | 2,983,044 | ||||||
Tech Data Corp. (1) | 703 | 71,003 | ||||||
TechTarget, Inc. (1) | 1,223 | 12,683 | ||||||
Telenav, Inc. (1) | 3,951 | 32,003 | ||||||
TeleTech Holdings, Inc. | 3,626 | 147,941 | ||||||
Teradyne, Inc. | 8,126 | 244,024 | ||||||
The Western Union Co. | 20,681 | 393,973 | ||||||
Total System Services, Inc. | 7,956 | 463,437 | ||||||
Trade Desk, Inc. (1) | 4,433 | 222,138 | ||||||
Trimble, Inc. (1) | 8,689 | 309,937 | ||||||
TrueCar, Inc. (1) | 16,004 | 318,960 | ||||||
TTM Technologies, Inc. (1) | 5,070 | 88,015 | ||||||
Tucows, Inc. (1) | 2,297 | 122,890 | ||||||
Twilio, Inc. (1) | 15,890 | 462,558 | ||||||
Twitter, Inc. (1) | 1,848 | 33,024 | ||||||
Tyler Technologies, Inc. (1) | 14,931 | 2,622,929 | ||||||
Ubiquiti Networks, Inc. (1) | 5,935 | 308,442 | ||||||
Ultimate Software Group, Inc. (1) | 15,915 | 3,343,105 | ||||||
Ultra Clean Holdings, Inc. (1) | 8,428 | 158,025 | ||||||
Unisys Corp. (1) | 9,004 | 115,251 | ||||||
Universal Display Corp. | 1,823 | 199,163 | ||||||
Upland Software, Inc. (1) | 1,851 | 40,703 | ||||||
USA Technologies, Inc. (1) | 9,183 | 47,752 | ||||||
Vantiv, Inc. (1) | 7,040 | 445,914 | ||||||
Varonis Systems, Inc. (1) | 4,882 | 181,610 | ||||||
VASCO Data Security International, Inc. (1) | 708 | 10,160 | ||||||
VeriFone Systems, Inc. (1) | 2,306 | 41,739 | ||||||
Verint Systems, Inc. (1) | 2,581 | 105,047 | ||||||
VeriSign, Inc. (1) | 3,848 | 357,710 | ||||||
Veritone, Inc. (1) | 594 | 6,956 | ||||||
Versum Materials, Inc. | 429 | 13,943 | ||||||
ViaSat, Inc. (1) | 753 | 49,849 | ||||||
Viavi Solutions, Inc. (1) | 21,833 | 229,901 | ||||||
VirnetX Holding Corp. (1) | 13,050 | 59,378 | ||||||
Virtusa Corp. (1) | 5,208 | 153,115 | ||||||
Web.com Group, Inc. (1) | 9,825 | 248,573 | ||||||
WebMD Health Corp. (1) | 9,452 | 554,360 | ||||||
Western Digital Corp. | 1,831 | 162,227 | ||||||
WEX, Inc. (1) | 174,964 | 18,243,496 | ||||||
Workday, Inc. (1) | 336,499 | 32,640,403 | ||||||
Workiva, Inc. (1) | 6,320 | 120,396 | ||||||
Xactly Corp. (1) | 6,672 | 104,417 | ||||||
| Shares | Value | |||||||
Xcerra Corp. (1) | 11,856 | 115,833 | ||||||
Xilinx, Inc. | 10,329 | 664,361 | ||||||
XO Group, Inc. (1) | 4,729 | 83,325 | ||||||
Xperi Corp. | 12,494 | 372,321 | ||||||
Yelp, Inc. (1) | 19,860 | 596,197 | ||||||
Yext, Inc. (1) | 3,171 | 42,269 | ||||||
Zebra Technologies Corp. (1) | 2,291 | 230,291 | ||||||
Zendesk, Inc. (1) | 24,839 | 690,027 | ||||||
Zillow Group, Inc. - Class A (1) | 1,594 | 77,851 | ||||||
Zillow Group, Inc. - Class C (1) | 3,190 | 156,342 | ||||||
Zix Corp. (1) | 13,671 | 77,788 | ||||||
|
| |||||||
| 580,013,448 | ||||||||
|
| |||||||
Materials - 4.32% | ||||||||
A. Schulman, Inc. | 7,233 | 231,456 | ||||||
AdvanSix, Inc. (1) | 6,614 | 206,621 | ||||||
Albemarle Corp. | 905 | 95,514 | ||||||
AptarGroup, Inc. | 271,530 | 23,585,096 | ||||||
Ardagh Group SA | 431 | 9,745 | ||||||
Avery Dennison Corp. | 3,653 | 322,816 | ||||||
Axalta Coating Systems Ltd. (1) | 9,316 | 298,485 | ||||||
Balchem Corp. | 82,969 | 6,447,521 | ||||||
Ball Corp. | 8,397 | 354,437 | ||||||
Berry Global Group, Inc. (1) | 446,689 | 25,465,740 | ||||||
Boise Cascade Co. (1) | 1,940 | 58,976 | ||||||
Calgon Carbon Corp. | 990 | 14,949 | ||||||
Celanese Corp. | 3,649 | 346,436 | ||||||
Century Aluminum Co. (1) | 765 | 11,919 | ||||||
Chase Corp. | 1,844 | 196,755 | ||||||
Chemours Co. | 8,099 | 307,114 | ||||||
Codexis, Inc. (1) | 9,970 | 54,336 | ||||||
Coeur Mining, Inc. (1) | 7,483 | 64,204 | ||||||
Compass Minerals International, Inc. | 7,893 | 515,413 | ||||||
Crown Holdings, Inc. (1) | 4,010 | 239,237 | ||||||
Deltic Timber Corp. | 2,770 | 206,808 | ||||||
Eagle Materials, Inc. | 2,056 | 190,015 | ||||||
Ferro Corp. (1) | 21,453 | 392,375 | ||||||
Flotek Industries, Inc. (1) | 1,672 | 14,948 | ||||||
FMC Corp. | 5,865 | 428,438 | ||||||
Forterra, Inc. (1) | 4,079 | 33,570 | ||||||
Freeport-McMoRan, Inc. (1) | 12,368 | 148,540 | ||||||
Graphic Packaging Holding Co. | 406,810 | 5,605,842 | ||||||
Greif, Inc. - Class A | 5,648 | 315,045 | ||||||
Greif, Inc. - Class B | 1,215 | 73,386 | ||||||
Handy & Harman Ltd. (1) | 393 | 12,340 | ||||||
Hawkins, Inc. | 437 | 20,255 | ||||||
HB Fuller Co. | 9,703 | 495,920 | ||||||
Huntsman Corp. | 4,259 | 110,053 | ||||||
Ingevity Corp. (1) | 77,665 | 4,457,971 | ||||||
International Flavors & Fragrances, Inc. | 31,966 | 4,315,410 | ||||||
International Paper Co. | 16,428 | 929,989 | ||||||
KapStone Paper and Packaging Corp. | 22,204 | 458,068 | ||||||
Klondex Mines Ltd. (1) | 12,850 | 43,304 | ||||||
KMG Chemicals, Inc. | 2,365 | 115,105 | ||||||
| Shares | Value | |||||||
Koppers Holdings, Inc. (1) | 5,267 | 190,402 | ||||||
Kraton Corp. (1) | 1,650 | 56,826 | ||||||
Kronos Worldwide, Inc. | 5,818 | 106,004 | ||||||
Louisiana-Pacific Corp. (1) | 34,934 | 842,259 | ||||||
Martin Marietta Materials, Inc. | 79,242 | 17,637,684 | ||||||
Minerals Technologies, Inc. | 5,089 | 372,515 | ||||||
Myers Industries, Inc. | 5,878 | 105,510 | ||||||
Neenah Paper, Inc. | 3,522 | 282,640 | ||||||
NewMarket Corp. | 301 | 138,604 | ||||||
OMNOVA Solutions, Inc. (1) | 6,874 | 67,021 | ||||||
Owens-Illinois, Inc. (1) | 5,568 | 133,187 | ||||||
Packaging Corporation of America | 4,095 | 456,142 | ||||||
Platform Specialty Products Corp. (1) | 4,439 | 56,286 | ||||||
PolyOne Corp. | 20,840 | 807,342 | ||||||
Quaker Chemical Corp. | 16,920 | 2,457,292 | ||||||
Rayonier Advanced Materials, Inc. | 6,883 | 108,201 | ||||||
Reliance Steel & Aluminum Co. | 40,160 | 2,924,050 | ||||||
Royal Gold, Inc. | 1,057 | 82,626 | ||||||
RPM International, Inc. | 5,362 | 292,497 | ||||||
Schweitzer-Mauduit International, Inc. | 1,473 | 54,840 | ||||||
Scotts Miracle-Gro Co. | 1,776 | 158,881 | ||||||
Sealed Air Corp. | 4,360 | 195,154 | ||||||
Sensient Technologies Corp. | 11,330 | 912,405 | ||||||
Silgan Holdings, Inc. | 3,249 | 103,253 | ||||||
Southern Copper Corp. | 3,209 | 111,128 | ||||||
Steel Dynamics, Inc. | 1,447 | 51,817 | ||||||
Stepan Co. | 3,239 | 282,246 | ||||||
Summit Materials, Inc. (1) | 27,395 | 790,894 | ||||||
Trinseo S.A. | 7,955 | 546,508 | ||||||
United States Lime & Minerals, Inc. | 34 | 2,668 | ||||||
US Concrete, Inc. (1) | 3,896 | 306,031 | ||||||
Valhi, Inc. | 368 | 1,097 | ||||||
Verso Corp. (1) | 1,237 | 5,801 | ||||||
Vulcan Materials Co. | 5,366 | 679,765 | ||||||
W.R. Grace & Co. | 2,987 | 215,094 | ||||||
Westlake Chemical Corp. | 780 | 51,644 | ||||||
Worthington Industries, Inc. | 10,555 | 530,072 | ||||||
|
| |||||||
| 109,310,538 | ||||||||
|
| |||||||
Real Estate - 2.66% | ||||||||
Alexander’s, Inc. | 525 | 221,266 | ||||||
Altisource Portfolio Solutions S.A. (1) | 2,949 | 64,347 | ||||||
American Assets Trust, Inc. | 3,777 | 148,776 | ||||||
Armada Hoffler Properties, Inc. | 10,328 | 133,748 | ||||||
Boston Properties, Inc. | 1,070 | 131,631 | ||||||
Care Capital Properties, Inc. | 2,513 | 67,097 | ||||||
CareTrust REIT, Inc. | 17,151 | 317,980 | ||||||
CBRE Group, Inc. (1) | 5,655 | 205,842 | ||||||
City Office REIT, Inc. | 1,697 | 21,552 | ||||||
Clipper Realty, Inc. | 451 | 5,565 | ||||||
Community Healthcare Trust, Inc. | 613 | 15,687 | ||||||
Consolidated-Tomoka Land Co. | 940 | 53,533 | ||||||
CoreSite Realty Corp. | 44,463 | 4,603,254 | ||||||
Corporate Office Properties Trust | 115,706 | 4,053,181 | ||||||
| Shares | Value | |||||||
CubeSmart | 5,357 | 128,782 | ||||||
CyrusOne, Inc. | 3,334 | 185,870 | ||||||
Digital Realty Trust, Inc. | 4,909 | 554,472 | ||||||
Douglas Emmett, Inc. | 5,145 | 196,590 | ||||||
DuPont Fabros Technology, Inc. | 3,394 | 207,577 | ||||||
EastGroup Properties, Inc. | 8,506 | 712,803 | ||||||
Equity Lifestyle Properties, Inc. | 3,566 | 307,888 | ||||||
Extra Space Storage, Inc. | 4,525 | 352,950 | ||||||
Federal Realty Investment Trust | 1,221 | 154,322 | ||||||
First Industrial Realty Trust, Inc. | 6,841 | 195,789 | ||||||
Four Corners Property Trust, Inc. | 10,834 | 272,042 | ||||||
Gaming and Leisure Properties, Inc. | 2,769 | 104,308 | ||||||
Global Medical REIT, Inc. | 406 | 3,630 | ||||||
Gramercy Property Trust | 5,720 | 169,941 | ||||||
HFF, Inc. | 9,388 | 326,421 | ||||||
Hudson Pacific Properties, Inc. | 107,621 | 3,679,562 | ||||||
Iron Mountain, Inc. | 10,236 | 351,709 | ||||||
Jones Lang LaSalle, Inc. | 122,294 | 15,286,750 | ||||||
Kennedy-Wilson Holdings, Inc. | 11,203 | 213,417 | ||||||
Lamar Advertising Co. | 3,245 | 238,735 | ||||||
LTC Properties, Inc. | 4,174 | 214,502 | ||||||
Marcus & Millichap, Inc. (1) | 4,121 | 108,630 | ||||||
Maui Land & Pineapple Co, Inc. (1) | 1,704 | 34,591 | ||||||
MedEquities Realty Trust, Inc. | 2,140 | 27,007 | ||||||
Monmouth Real Estate Investment Corp. | 3,160 | 47,558 | ||||||
National Health Investors, Inc. | 4,666 | 369,547 | ||||||
National Storage Affiliates Trust Co. | 1,259 | 29,095 | ||||||
NexPoint Residential Trust, Inc. | 277 | 6,895 | ||||||
Outfront Media, Inc. | 920 | 21,270 | ||||||
Physicians Realty Trust | 21,543 | 433,876 | ||||||
Potlatch Corp. | 10,388 | 474,732 | ||||||
PS Business Parks, Inc. | 5,073 | 671,614 | ||||||
QTS Realty Trust, Inc. | 12,056 | 630,890 | ||||||
Retail Opportunity Investments Corp. | 3,090 | 59,297 | ||||||
Rexford Industrial Realty, Inc. | 6,929 | 190,132 | ||||||
RMR Group, Inc. | 1,859 | 90,440 | ||||||
Ryman Hospitality Properties, Inc. | 11,290 | 722,673 | ||||||
Sabra Health Care REIT, Inc. | 2,796 | 67,384 | ||||||
Saul Centers, Inc. | 2,562 | 148,545 | ||||||
SBA Communications Corp. (1) | 178,370 | 24,062,113 | ||||||
Tanger Factory Outlet Centers, Inc. | 275 | 7,145 | ||||||
Taubman Centers, Inc. | 1,205 | 71,758 | ||||||
Terreno Realty Corp. | 107,151 | 3,606,703 | ||||||
The GEO Group, Inc. | 6,896 | 203,915 | ||||||
Trinity Place Holdings, Inc. (1) | 4,265 | 30,324 | ||||||
UMH Properties, Inc. | 5,973 | 101,840 | ||||||
Universal Health Realty Income Trust | 2,981 | 237,109 | ||||||
Urban Edge Properties | 24,985 | 592,894 | ||||||
Washington Real Estate Investment Trust | 7,165 | 228,564 | ||||||
|
| |||||||
| 67,178,060 | ||||||||
|
| |||||||
Telecommunication Services - 0.23% | ||||||||
Boingo Wireless, Inc. (1) | 9,282 | 138,859 | ||||||
Cogent Communications Holdings, Inc. | 10,641 | 426,704 | ||||||
| Shares | Value | |||||||
Consolidated Communications Holdings, Inc. | 8,949 | 192,135 | ||||||
General Communication, Inc. (1) | 6,388 | 234,056 | ||||||
Globalstar, Inc. (1) | 74,051 | 157,729 | ||||||
IDT Corp. | 2,760 | 39,661 | ||||||
Iridium Communications, Inc. (1) | 222,743 | 2,461,310 | ||||||
Lumos Networks Corp. (1) | 4,124 | 73,696 | ||||||
Ooma, Inc. (1) | 4,268 | 34,144 | ||||||
ORBCOMM, Inc. (1) | 15,678 | 177,161 | ||||||
RingCentral, Inc. (1) | 15,962 | 583,411 | ||||||
Shenandoah Telecommunications Co. | 11,897 | 365,238 | ||||||
Straight Path Communications, Inc. (1) | 2,205 | 396,128 | ||||||
Vonage Holdings Corp. (1) | 51,118 | 334,312 | ||||||
Zayo Group Holdings, Inc. (1) | 8,148 | 251,773 | ||||||
|
| |||||||
| 5,866,317 | ||||||||
|
| |||||||
Utilities - 0.22% | ||||||||
American States Water Co. | 6,303 | 298,825 | ||||||
Atlantic Power Corp. (1) | 20,501 | 49,202 | ||||||
Black Hills Corp. | 55,817 | 3,765,973 | ||||||
California Water Service Group | 7,595 | 279,496 | ||||||
Chesapeake Utilities Corp. | 443 | 33,203 | ||||||
Global Water Resources, Inc. | 2,416 | 23,918 | ||||||
MGE Energy, Inc. | 4,334 | 278,893 | ||||||
Middlesex Water Co. | 3,481 | 137,848 | ||||||
New Jersey Resources Corp. | 1,739 | 69,038 | ||||||
NRG Energy, Inc. | 2,585 | 44,514 | ||||||
Ormat Technologies, Inc. | 4,846 | 284,363 | ||||||
Pattern Energy Group, Inc. | 3,830 | 91,307 | ||||||
Pure Cycle Corp. (1) | 4,125 | 31,969 | ||||||
RGC Resources, Inc. | 561 | 15,893 | ||||||
Southwest Gas Holdings, Inc. | 1,231 | 89,937 | ||||||
Spark Energy, Inc. | 2,616 | 49,181 | ||||||
York Water Co. | 3,014 | 105,038 | ||||||
|
| |||||||
| 5,648,598 | ||||||||
|
| |||||||
Total Common Stocks (Cost $2,103,988,825) | $ | 2,419,711,730 | ||||||
|
| |||||||
RIGHTS - 0.00% (2) | ||||||||
Healthcare - 0.00% (2) | ||||||||
Dyax Corp., expires 12/31/2019 (1)(4)(5) | 15,849 | $ | 57,056 | |||||
|
| |||||||
TOTAL RIGHTS (Cost $35,670) | $ | 57,056 | ||||||
|
| |||||||
SHORT-TERM INVESTMENTS - 4.51% | ||||||||
Money Market Funds - 4.51% | ||||||||
Goldman Sachs Financial Square Government Fund - Class I, 0.86% (3) | 57,084,352 | $ | 57,084,352 | |||||
JPMorgan U.S. Government Money Market Fund - Class I, 0.85% (3) | 57,084,353 | 57,084,353 | ||||||
|
| |||||||
Total Short-Term Investments (Cost $114,168,705) | $ | 114,168,705 | ||||||
|
| |||||||
TOTAL INVESTMENTS IN SECURITIES - 100.16% | ||||||||
(Cost $2,218,193,200) | $ | 2,533,937,491 | ||||||
LIABILITIES IN EXCESS OF OTHER ASSETS - (0.16)% | (4,120,070 | ) | ||||||
|
| |||||||
TOTAL NET ASSETS - 100.00% | $ | 2,529,817,421 | ||||||
|
| |||||||
Percentages are stated as a percent of net assets.
ADR - American Depositary Receipt
| (1) | Non-income producing security. |
| (2) | Amount calculated is less than 0.005%. |
| (3) | Represents annualized seven-day yield as of the close of the reporting period. |
| (4) | Security is categorized as Level 3 per the Trust’s fair value hierarchy. This security represents $57,056 or 0.00% of the Fund’s net assets. |
| (5) | Security is treated as illiquid by the Fund. The value of this security totals $57,056, which represents 0.00% of the total net assets. |
The sector classifications listed above are in accordance with Global Industry Classification Standards (GICS®), which was developed by and/or is the exclusive property of MSCI, Inc. and Standard & Poor’s Financial Services LLC (“S&P”).
Bridge Builder Small/Mid Cap Value Fund
Schedule of Investments
June��30, 2017
| Shares | Value | |||||||
COMMON STOCKS - 96.76% | ||||||||
Consumer Discretionary - 11.41% | ||||||||
1-800-Flowers.com, Inc. (1) | 4,181 | $ | 40,765 | |||||
Aaron’s, Inc. | 65,087 | 2,531,884 | ||||||
Abercrombie & Fitch Co. | 15,390 | 191,452 | ||||||
Acushnet Holdings Corp. | 5,197 | 103,108 | ||||||
Adient Plc | 225,649 | 14,752,932 | ||||||
Adtalem Global Education, Inc. | 13,900 | 527,505 | ||||||
Advance Auto Parts, Inc. | 35,510 | 4,140,111 | ||||||
AMC Entertainment Holdings, Inc. | 12,428 | 282,737 | ||||||
American Axle & Manufacturing Holdings, Inc. (1) | 18,815 | 293,514 | ||||||
American Eagle Outfitters, Inc. | 97,218 | 1,171,477 | ||||||
American Public Education, Inc. (1) | 3,567 | 84,360 | ||||||
America’s Car-Mart, Inc. (1) | 1,111 | 43,218 | ||||||
Aramark | 354,742 | 14,537,327 | ||||||
Ascena Retail Group, Inc. (1) | 39,177 | 84,231 | ||||||
Ascent Capital Group, Inc. (1) | 2,469 | 37,924 | ||||||
At Home Group, Inc. (1) | 286 | 6,661 | ||||||
AutoNation, Inc. (1) | 1,777 | 74,918 | ||||||
AutoZone, Inc. (1) | 113 | 64,462 | ||||||
AV Homes, Inc. (1) | 2,751 | 55,158 | ||||||
Barnes & Noble Education, Inc. (1) | 8,607 | 91,492 | ||||||
Barnes & Noble, Inc. | 13,502 | 102,615 | ||||||
Bassett Furniture Industries, Inc. | 2,096 | 79,543 | ||||||
Beasley Broadcast Group, Inc. | 1,265 | 12,397 | ||||||
Beazer Homes USA, Inc. (1) | 7,262 | 99,635 | ||||||
Bed Bath & Beyond, Inc. | 50,323 | 1,529,819 | ||||||
Belmond Ltd. (1) | 19,895 | 264,604 | ||||||
Best Buy, Inc. | 102,949 | 5,902,066 | ||||||
Big 5 Sporting Goods Corp. | 4,505 | 58,790 | ||||||
Biglari Holdings, Inc. (1) | 231 | 92,340 | ||||||
| Shares | Value | |||||||
Black Diamond, Inc. (1) | 4,394 | 29,220 | ||||||
Boot Barn Holdings, Inc. (1) | 2,787 | 19,732 | ||||||
Borgwarner, Inc. | 188,725 | 7,994,391 | ||||||
Boyd Gaming Corp. | 1,740 | 43,169 | ||||||
Bridgepoint Education, Inc. (1) | 583 | 8,605 | ||||||
Brinker International, Inc. | 2,816 | 107,290 | ||||||
Brunswick Corp. | 556,831 | 34,930,009 | ||||||
Buckle, Inc. | 6,391 | 113,760 | ||||||
Build-A-Bear Workshop, Inc. (1) | 3,144 | 32,855 | ||||||
Burlington Stores, Inc. (1) | 817 | 75,156 | ||||||
Cabela’s, Inc. (1) | 1,420 | 84,376 | ||||||
Caesars Acquisition Co. (1) | 10,931 | 208,236 | ||||||
Caesars Entertainment Corp. (1) | 10,752 | 129,024 | ||||||
CalAtlantic Group, Inc. | 44,870 | 1,586,154 | ||||||
Caleres, Inc. | 9,335 | 259,326 | ||||||
Callaway Golf Co. | 20,975 | 268,060 | ||||||
Cambium Learning Group, Inc. (1) | 2,012 | 10,201 | ||||||
Capella Education Company | 165 | 14,124 | ||||||
Career Education Corp. (1) | 15,014 | 144,134 | ||||||
Carriage Services, Inc. | 2,086 | 56,239 | ||||||
Carrols Restaurant Group, Inc. (1) | 7,656 | 93,786 | ||||||
Carvana Co. (1) | 3,097 | 63,396 | ||||||
Cato Corp. | 5,392 | 94,845 | ||||||
CBS Corp. | 63,500 | 4,050,030 | ||||||
Central European Media Enterprises Ltd. (1) | 18,351 | 73,404 | ||||||
Century Casinos, Inc. (1) | 4,341 | 31,993 | ||||||
Century Communities, Inc. (1) | 3,644 | 90,371 | ||||||
Chicos FAS, Inc. | 28,719 | 270,533 | ||||||
Children’s Place, Inc. | 10,900 | 1,112,890 | ||||||
Cinemark Holdings, Inc. | 2,942 | 114,297 | ||||||
Citi Trends, Inc. | 3,056 | 64,848 | ||||||
Clear Channel Outdoor Holdings, Inc. | 8,532 | 41,380 | ||||||
Coach, Inc. | 6,486 | 307,047 | ||||||
Columbia Sportswear Co. | 128,569 | 7,464,716 | ||||||
Conn’s, Inc. (1) | 4,189 | 80,010 | ||||||
Container Store Group, Inc. (1) | 3,655 | 21,638 | ||||||
Cooper Tire & Rubber Co. | 11,871 | 428,543 | ||||||
Cooper-Standard Holdings, Inc. (1) | 20,966 | 2,114,840 | ||||||
| Shares | Value | |||||||
Core Mark Holding Company, Inc. | 192,785 | 6,373,472 | ||||||
Crocs, Inc. (1) | 4,540 | 35,003 | ||||||
CSS Industries, Inc. | 2,026 | 53,000 | ||||||
D. R. Horton, Inc. | 4,267 | 147,510 | ||||||
Daily Journal Corp. (1) | 241 | 49,713 | ||||||
Dana, Inc. | 362,965 | 8,105,008 | ||||||
Deckers Outdoor Corp. (1) | 6,607 | 450,994 | ||||||
Del Frisco’s Restaurant Group, Inc. (1) | 4,767 | 76,749 | ||||||
Del Taco Restaurants, Inc. (1) | 7,382 | 101,502 | ||||||
Delta Apparel, Inc. (1) | 1,627 | 36,087 | ||||||
Denny’s Corp. (1) | 3,715 | 43,726 | ||||||
Dick’s Sporting Goods, Inc. | 555 | 22,106 | ||||||
Dillard’s, Inc. | 3,481 | 200,819 | ||||||
DineEquity, Inc. | 1,705 | 75,105 | ||||||
Discovery Communications, Inc. - Class A (1) | 4,196 | 108,383 | ||||||
Discovery Communications, Inc. - Class C (1) | 5,806 | 146,369 | ||||||
Dollar General Corp. | 4,720 | 340,265 | ||||||
Dollar Tree, Inc. (1) | 338 | 23,633 | ||||||
Drive Shack, Inc. | 4,886 | 15,391 | ||||||
DSW, Inc. | 14,810 | 262,137 | ||||||
E.W. Scripps Co. (1) | 213,028 | 3,794,029 | ||||||
El Pollo Loco Holdings, Inc. (1) | 4,576 | 63,378 | ||||||
Emerald Expositions Events, Inc. | 3,493 | 76,497 | ||||||
Empire Resorts, Inc. (1) | 268 | 6,410 | ||||||
Entercom Communications Corp. | 6,607 | 68,382 | ||||||
Eros International Plc (1) | 3,020 | 34,579 | ||||||
Escalade, Inc. | 2,375 | 31,112 | ||||||
Ethan Allen Interiors, Inc. | 5,523 | 178,393 | ||||||
Expedia, Inc. | 53,186 | 7,922,055 | ||||||
Express, Inc. (1) | 17,096 | 115,398 | ||||||
Extended Stay America, Inc. | 399,145 | 7,727,447 | ||||||
Fiesta Restaurant Group, Inc. (1) | 5,426 | 112,047 | ||||||
Finish Line, Inc. | 255,042 | 3,613,945 | ||||||
Flexsteel Industries, Inc. | 1,617 | 87,496 | ||||||
Fogo De Chao, Inc. (1) | 2,089 | 29,037 | ||||||
Foot Locker, Inc. | 38,967 | 1,920,294 | ||||||
Fossil Group, Inc. (1) | 9,958 | 103,065 | ||||||
Fox Factory Holding Corp. (1) | 258,030 | 9,185,868 | ||||||
| Shares | Value | |||||||
Fred’s, Inc. | 7,567 | 69,843 | ||||||
FTD Cos, Inc. (1) | 3,864 | 77,280 | ||||||
Gaia, Inc. (1) | 1,676 | 18,771 | ||||||
GameStop Corp. | 2,754 | 59,514 | ||||||
Gannett Co., Inc. | 26,324 | 229,545 | ||||||
Gap, Inc. | 6,435 | 141,506 | ||||||
Garmin Ltd. | 3,327 | 169,777 | ||||||
Genesco, Inc. (1) | 4,300 | 145,770 | ||||||
Gentex Corp. | 2,955 | 56,056 | ||||||
Gentherm, Inc. (1) | 1,717 | 66,620 | ||||||
Genuine Parts Co. | 2,486 | 230,601 | ||||||
G-III Apparel Group Ltd. (1) | 9,655 | 240,892 | ||||||
Global Eagle Entertainment, Inc. (1) | 10,365 | 36,899 | ||||||
GNC Holdings, Inc. | 15,478 | 130,480 | ||||||
Golden Entertainment, Inc. | 1,880 | 38,935 | ||||||
Goodyear Tire & Rubber Co. | 120,178 | 4,201,423 | ||||||
Graham Holdings Co. | 129 | 77,355 | ||||||
Grand Canyon Education, Inc. (1) | 78,500 | 6,155,185 | ||||||
Gray Television, Inc. (1) | 5,393 | 73,884 | ||||||
Green Brick Partners, Inc. (1) | 5,176 | 59,265 | ||||||
Group 1 Automotive, Inc. | 32,707 | 2,071,007 | ||||||
Guess, Inc. | 13,356 | 170,690 | ||||||
H&R Block, Inc. | 4,850 | 149,913 | ||||||
Harley-Davidson, Inc. | 46,114 | 2,491,078 | ||||||
Hasbro, Inc. | 20,212 | 2,253,840 | ||||||
Haverty Furniture, Inc. | 4,086 | 102,559 | ||||||
Helen Of Troy Corp. (1) | 3,323 | 312,694 | ||||||
Hemisphere Media Group, Inc. (1) | 3,448 | 40,859 | ||||||
Hibbett Sports, Inc. (1) | 4,784 | 99,268 | ||||||
Hilton Worldwide Holdings, Inc. | 609 | 37,667 | ||||||
Houghton Mifflin Harcourt Co. (1) | 7,076 | 87,035 | ||||||
Hovnanian Enterprises, Inc. (1) | 22,169 | 62,073 | ||||||
Hyatt Hotels Corp. (1) | 948 | 53,287 | ||||||
Iconix Brand Group, Inc. (1) | 11,571 | 79,956 | ||||||
ILG, Inc. | 21,650 | 595,158 | ||||||
International Game Technology Plc | 3,057 | 55,943 | ||||||
International Speedway Corp. | 4,192 | 157,410 | ||||||
Interpublic Group of Companies, Inc. | 727,874 | 17,905,700 | ||||||
| Shares | Value | |||||||
Intrawest Resorts Holdings, Inc. (1) | 549 | 13,033 | ||||||
J. Alexander’s Holdings, Inc. (1) | 2,722 | 33,344 | ||||||
J.C. Penney Co., Inc. (1) | 69,936 | 325,202 | ||||||
Jack in the Box, Inc. | 142,560 | 14,042,160 | ||||||
John Wiley & Sons, Inc. | 1,324 | 69,841 | ||||||
Johnson Outdoors, Inc. | 1,089 | 52,501 | ||||||
K12, Inc. (1) | 7,554 | 135,368 | ||||||
KB Home | 108,145 | 2,592,236 | ||||||
Kirkland’s, Inc. (1) | 3,378 | 34,726 | ||||||
Kohl’s Corp. | 66,558 | 2,573,798 | ||||||
L Brands, Inc. | 5,591 | 301,299 | ||||||
La Quinta Holdings, Inc. (1) | 14,498 | 214,135 | ||||||
Lands End, Inc. (1) | 2,979 | 44,387 | ||||||
Laureate Education, Inc. (1) | 264,627 | 4,638,911 | ||||||
La-Z-Boy, Inc. | 256,576 | 8,338,720 | ||||||
Lear Corp. | 26,328 | 3,740,682 | ||||||
Leggett & Platt, Inc. | 717 | 37,664 | ||||||
Lennar Corp. - Class A | 5,523 | 294,486 | ||||||
Lennar Corp. - Class B | 248 | 11,153 | ||||||
LGI Homes, Inc. (1) | 1,358 | 54,564 | ||||||
Libbey, Inc. | 5,273 | 42,500 | ||||||
Liberty Broadband Corp. - Class A (1) | 717 | 61,511 | ||||||
Liberty Broadband Corp. - Class C (1) | 2,879 | 249,753 | ||||||
Liberty Expedia Holdings, Inc. (1) | 1,262 | 68,173 | ||||||
Liberty Interactive Corp. (1) | 4,996 | 122,602 | ||||||
Liberty Media Group LLC - Class A (1) | 685 | 23,996 | ||||||
Liberty Media Group LLC - Class C (1) | 2,941 | 107,699 | ||||||
Liberty SiriusXM Group - Class A (1) | 2,463 | 103,397 | ||||||
Liberty SiriusXM Group - Class C (1) | 4,950 | 206,415 | ||||||
Liberty Tax, Inc. | 1,575 | 20,396 | ||||||
Liberty TripAdvisor Holdings, Inc. (1) | 16,263 | 188,651 | ||||||
Liberty Ventures (1) | 2,206 | 115,352 | ||||||
Lifetime Brands, Inc. | 2,108 | 38,260 | ||||||
Lions Gate Entertainment Corp. - Class A (1) | 584 | 16,466 | ||||||
Lions Gate Entertainment Corp. - Class B (1) | 976 | 25,636 | ||||||
Lithia Motors, Inc. | 48,190 | 4,540,944 | ||||||
LKQ Corp. (1) | 7,296 | 240,403 | ||||||
M.D.C. Holdings, Inc. | 5,722 | 202,158 | ||||||
| Shares | Value | |||||||
M/I Homes, Inc. (1) | 4,388 | 125,277 | ||||||
Macy’s, Inc. | 48,860 | 1,135,506 | ||||||
Marcus Corp. | 608 | 18,362 | ||||||
MarineMax, Inc. (1) | 2,510 | 49,070 | ||||||
Marriott Vacations Worldwide Corp. | 563 | 66,293 | ||||||
Mattel, Inc. | 7,696 | 165,695 | ||||||
MDC Partners, Inc. | 9,004 | 89,140 | ||||||
Meredith Corp. | 8,815 | 524,052 | ||||||
Meritage Homes Corp. (1) | 8,119 | 342,622 | ||||||
MGM Resorts International | 13,026 | 407,584 | ||||||
Michael Kors Holdings Ltd. (1) | 3,949 | 143,151 | ||||||
Modine Manufacturing Co. (1) | 10,986 | 181,818 | ||||||
Mohawk Industries, Inc. (1) | 72,432 | 17,506,090 | ||||||
Monarch Casino & Resort, Inc. (1) | 2,253 | 68,153 | ||||||
Motorcar Parts of America, Inc. (1) | 4,072 | 114,993 | ||||||
Movado Group, Inc. | 3,448 | 87,062 | ||||||
MSG Networks, Inc. (1) | 13,290 | 298,360 | ||||||
Murphy USA, Inc. (1) | 114,604 | 8,493,302 | ||||||
NACCO Industries, Inc. | 898 | 63,623 | ||||||
National CineMedia, Inc. | 14,294 | 106,061 | ||||||
New Home Company, Inc. (1) | 3,033 | 34,789 | ||||||
New Media Investment Group, Inc. | 11,970 | 161,356 | ||||||
New York Times Co. | 5,406 | 95,686 | ||||||
Newell Brands, Inc. | 338,742 | 18,163,346 | ||||||
News Corp. - Class A | 10,905 | 149,399 | ||||||
News Corp. - Class B | 3,362 | 47,572 | ||||||
Nexstar Media Group, Inc. | 137,775 | 8,238,945 | ||||||
Norwegian Cruise Line Holdings Ltd. (1) | 4,440 | 241,048 | ||||||
Office Depot, Inc. | 619,098 | 3,491,713 | ||||||
Omnicom Group, Inc. | 57,700 | 4,783,330 | ||||||
Overstock.com, Inc. (1) | 1,885 | 30,726 | ||||||
Oxford Industries, Inc. | 2,217 | 138,540 | ||||||
Party City Holdings, Inc. (1) | 5,788 | 90,582 | ||||||
Penn National Gaming, Inc. (1) | 16,509 | 353,293 | ||||||
Penske Automotive Group, Inc. | 31,286 | 1,373,768 | ||||||
Perry Ellis International, Inc. (1) | 2,931 | 57,037 | ||||||
PICO Holdings, Inc. (1) | 4,448 | 77,840 | ||||||
Pier 1 Imports, Inc. | 18,447 | 95,740 | ||||||
| Shares | Value | |||||||
Pinnacle Entertainment, Inc. (1) | 3,539 | 69,931 | ||||||
Potbelly Corp. (1) | 3,667 | 42,171 | ||||||
Pulte Group, Inc. | 5,803 | 142,348 | ||||||
PVH Corp. | 85,850 | 9,829,825 | ||||||
Ralph Lauren Corp. | 1,590 | 117,342 | ||||||
RCI Hospitality Holdings, Inc. | 1,794 | 42,769 | ||||||
Reading International, Inc. (1) | 2,611 | 42,115 | ||||||
Red Lion Hotels Corp. (1) | 3,457 | 25,409 | ||||||
Red Robin Gourmet Burgers, Inc. (1) | 182 | 11,876 | ||||||
Regal Entertainment Group | 2,298 | 47,017 | ||||||
Regis Corp. (1) | 7,895 | 81,082 | ||||||
Rent-A-Center, Inc. | 9,864 | 115,606 | ||||||
Royal Caribbean Cruises Ltd. | 4,759 | 519,826 | ||||||
Ruby Tuesday, Inc. (1) | 12,862 | 25,853 | ||||||
Saga Communications, Inc. | 908 | 41,541 | ||||||
Salem Media Group, Inc. | 2,715 | 19,277 | ||||||
Sally Beauty Holdings, Inc. (1) | 2,490 | 50,423 | ||||||
Scholastic Corp. | 6,391 | 278,584 | ||||||
Scripps Networks Interactive, Inc. | 26,776 | 1,829,069 | ||||||
Sears Holdings Corp. (1) | 2,036 | 18,039 | ||||||
Sequential Brands Group, Inc. (1) | 9,330 | 37,227 | ||||||
ServiceMaster Global Holdings, Inc. (1) | 245,300 | 9,613,307 | ||||||
Shiloh Industries, Inc. (1) | 652 | 7,654 | ||||||
Shoe Carnival, Inc. | 2,522 | 52,659 | ||||||
Signet Jewelers Ltd. | 84,943 | 5,371,795 | ||||||
Sirius XM Holdings, Inc. | 2,125 | 11,624 | ||||||
Skechers USA, Inc. (1) | 2,064 | 60,888 | ||||||
Sonic Automotive, Inc. | 6,150 | 119,618 | ||||||
Sonic Corp. | 3,994 | 105,801 | ||||||
Speedway Motorsports, Inc. | 2,709 | 49,493 | ||||||
Standard Motor Products, Inc. | 1,767 | 92,273 | ||||||
Staples, Inc. | 18,111 | 182,378 | ||||||
Stoneridge, Inc. (1) | 5,973 | 92,044 | ||||||
Sturm, Ruger & Company, Inc. | 22,500 | 1,398,375 | ||||||
Superior Industries International, Inc. | 5,413 | 111,237 | ||||||
Systemax, Inc. | 574 | 10,791 | ||||||
Tailored Brands, Inc. | 7,651 | 85,385 | ||||||
TEGNA, Inc. | 5,946 | 85,682 | ||||||
| Shares | Value | |||||||
Tempur Sealy International, Inc. (1) | 789 | 42,125 | ||||||
Tenneco, Inc. | 68,844 | 3,981,249 | ||||||
The Madison Square Garden Co. (1) | 467 | 91,952 | ||||||
The Michaels Companies, Inc. (1) | 801 | 14,835 | ||||||
Thor Industries, Inc. | 16,900 | 1,766,388 | ||||||
Tiffany & Co. | 2,991 | 280,765 | ||||||
Tilly’s, Inc. | 2,954 | 29,983 | ||||||
Time, Inc. | 22,633 | 324,784 | ||||||
Toll Brothers, Inc. | 2,234 | 88,265 | ||||||
TopBuild Corp. (1) | 3,347 | 177,625 | ||||||
Tower International, Inc. | 4,545 | 102,035 | ||||||
Townsquare Media, Inc. (1) | 2,383 | 24,402 | ||||||
Travelport Worldwide Ltd. | 22,451 | 308,926 | ||||||
TRI Pointe Group, Inc. (1) | 33,503 | 441,905 | ||||||
Tribune Media Co. | 2,024 | 82,518 | ||||||
TripAdvisor, Inc. (1) | 1,614 | 61,655 | ||||||
tronc, Inc. (1) | 1,817 | 23,421 | ||||||
UCP, Inc. (1) | 1,860 | 20,367 | ||||||
Under Armour, Inc. - Class A (1) | 1,379 | 30,007 | ||||||
Under Armour, Inc. - Class C (1) | 1,400 | 28,224 | ||||||
Unifi, Inc. (1) | 3,403 | 104,812 | ||||||
Urban Outfitters, Inc. (1) | 2,383 | 44,181 | ||||||
Vera Bradley, Inc. (1) | 4,266 | 41,721 | ||||||
VF Corp. | 2,381 | 137,146 | ||||||
Viacom, Inc. - Class A | 215 | 8,181 | ||||||
Viacom, Inc. - Class B | 9,871 | 331,369 | ||||||
Vista Outdoor, Inc. (1) | 12,860 | 289,479 | ||||||
Vitamin Shoppe, Inc. (1) | 4,904 | 57,132 | ||||||
VOXX International Corp. (1) | 4,385 | 35,957 | ||||||
Weight Watchers International, Inc. (1) | 452 | 15,106 | ||||||
West Marine, Inc. | 4,252 | 54,638 | ||||||
Weyco Group, Inc. | 1,273 | 35,491 | ||||||
Whirlpool Corp. | 21,345 | 4,090,129 | ||||||
William Lyon Homes (1) | 4,484 | 108,244 | ||||||
Williams-Sonoma, Inc. | 1,929 | 93,557 | ||||||
Winnebago Industries, Inc. | 851 | 29,785 | ||||||
Wolverine World Wide, Inc. | 331,090 | 9,273,831 | ||||||
Wyndham Worldwide Corp. | 42,700 | 4,287,507 | ||||||
| Shares | Value | |||||||
Yum China Holdings, Inc. (1) | 1,391 | 54,847 | ||||||
ZAGG, Inc. (1) | 1,926 | 16,660 | ||||||
Zoe’s Kitchen, Inc. (1) | 3,276 | 39,017 | ||||||
Zumiez, Inc. (1) | 3,868 | 47,770 | ||||||
|
| |||||||
| 370,121,586 | ||||||||
|
| |||||||
Consumer Staples - 1.97% | ||||||||
Alico, Inc. | 691 | 21,628 | ||||||
Brown Forman Corp. - Class A | 86 | 4,240 | ||||||
Brown Forman Corp. - Class B | 316 | 15,358 | ||||||
Bunge Ltd. | 51,488 | 3,841,005 | ||||||
Cal-Maine Foods, Inc. (1) | 6,977 | 276,289 | ||||||
Campbell Soup Co. | 1,705 | 88,916 | ||||||
Casey’s General Stores, Inc. | 135,316 | 14,493,697 | ||||||
Central Garden & Pet Co. - Class A (1) | 6,817 | 204,646 | ||||||
Central Garden & Pet Co. (1) | 2,194 | 69,747 | ||||||
Clorox Co. | 530 | 70,617 | ||||||
Coca-Cola European Partners Plc | 154,147 | 6,269,158 | ||||||
Conagra Brands, Inc. | 11,234 | 401,728 | ||||||
Coty, Inc. | 13,038 | 244,593 | ||||||
Darling Ingredients, Inc. (1) | 36,798 | 579,201 | ||||||
Dean Foods Co. | 91,040 | 1,547,680 | ||||||
Diplomat Pharmacy, Inc. (1) | 10,686 | 158,153 | ||||||
Edgewell Personal Care Co. (1) | 1,586 | 120,568 | ||||||
Farmer Brothers Co. (1) | 1,948 | 58,927 | ||||||
Flowers Foods, Inc. | 555,843 | 9,621,642 | ||||||
Fresh Del Monte Produce, Inc. | 39,632 | 2,017,665 | ||||||
Hormel Foods Corp. | 7,463 | 254,563 | ||||||
Hostess Brands, Inc. (1) | 16,928 | 272,541 | ||||||
HRG Group, Inc. (1) | 1,430 | 25,325 | ||||||
Ingles Markets, Inc. | 3,236 | 107,759 | ||||||
Ingredion, Inc. | 1,976 | 235,559 | ||||||
Inter Parfums, Inc. | 2,008 | 73,593 | ||||||
J & J Snack Foods Corp. | 42,260 | 5,581,278 | ||||||
Kellogg Co. | 566 | 39,314 | ||||||
Kroger Co. | 47,500 | 1,107,700 | ||||||
Lamb Weston Holdings, Inc. | 3,118 | 137,317 | ||||||
Lancaster Colony Corp. | 26,750 | 3,280,085 | ||||||
Landec Corp. (1) | 4,644 | 68,963 | ||||||
| Shares | Value | |||||||
Limoneira Co. | 1,767 | 41,754 | ||||||
MGP Ingredients, Inc. | 398 | 20,366 | ||||||
Molson Coors Brewing Co. | 4,787 | 413,310 | ||||||
Natural Grocers by Vitamin Cottage, Inc. (1) | 2,406 | 19,898 | ||||||
Nature’s Sunshine Products, Inc. | 2,214 | 29,335 | ||||||
Nu Skin Enterprises, Inc. | 1,112 | 69,878 | ||||||
Nutraceutical International Corp. | 1,808 | 75,303 | ||||||
Oil-Dri Corp. of America | 1,120 | 47,051 | ||||||
Omega Protein Corp. | 4,915 | 87,978 | ||||||
Orchids Paper Products Co. | 2,196 | 28,438 | ||||||
Pilgrim’s Pride Corp. (1) | 111,760 | 2,449,779 | ||||||
Pinnacle Foods, Inc. | 3,273 | 194,416 | ||||||
Post Holdings, Inc. (1) | 1,797 | 139,537 | ||||||
Revlon, Inc. (1) | 1,915 | 45,386 | ||||||
Rite Aid Corp. (1) | 15,563 | 45,911 | ||||||
Sanderson Farms, Inc. | 19,717 | 2,280,271 | ||||||
Seaboard Corp. | 7 | 27,965 | ||||||
Seneca Foods Corp. (1) | 1,684 | 52,288 | ||||||
Smart & Final Stores, Inc. (1) | 5,149 | 46,856 | ||||||
Snyder’s-Lance, Inc. | 19,247 | 666,331 | ||||||
SpartanNash Co. | 8,465 | 219,751 | ||||||
SUPERVALU, Inc. (1) | 60,724 | 199,782 | ||||||
The Andersons, Inc. | 6,084 | 207,769 | ||||||
The Chefs’ Warehouse, Inc. (1) | 274 | 3,562 | ||||||
The Hain Celestial Group, Inc. (1) | 2,817 | 109,356 | ||||||
The Hershey Co. | 402 | 43,163 | ||||||
The J. M. Smucker Co. | 3,125 | 369,781 | ||||||
Tootsie Roll Industries, Inc. | 1,166 | 40,635 | ||||||
TreeHouse Foods, Inc. (1) | 1,127 | 92,065 | ||||||
Tyson Foods, Inc. | 7,724 | 483,754 | ||||||
United Natural Foods, Inc. (1) | 39,938 | 1,465,725 | ||||||
Universal Corp. | 27,117 | 1,754,470 | ||||||
US Foods Holding Corp. (1) | 3,707 | 100,905 | ||||||
Vector Group Ltd. | 11,527 | 245,756 | ||||||
Village Super Market, Inc. | 1,738 | 45,049 | ||||||
Weis Markets, Inc. | 2,181 | 106,258 | ||||||
Whole Foods Market, Inc. | 7,475 | 314,772 | ||||||
|
| |||||||
| 63,874,059 | ||||||||
|
| |||||||
| Shares | Value | |||||||
Energy - 5.84% | ||||||||
Abraxas Petroleum Corp. (1) | 2,676 | 4,335 | ||||||
Adams Resources & Energy, Inc. | 448 | 18,404 | ||||||
Alon USA Energy, Inc. | 7,261 | 96,717 | ||||||
Antero Resources Corp. (1) | 3,239 | 69,995 | ||||||
Apache Corp. | 10,066 | 482,463 | ||||||
Approach Resources, Inc. (1) | 9,375 | 31,594 | ||||||
Arch Coal, Inc. | 4,950 | 338,085 | ||||||
Archrock, Inc. | 15,678 | 178,729 | ||||||
Ardmore Shipping Corp. | 3,446 | 28,085 | ||||||
Atwood Oceanics, Inc. (1) | 17,174 | 139,968 | ||||||
Baker Hughes, Inc. | 148,917 | 8,117,466 | ||||||
Basic Energy Services, Inc. (1) | 3,776 | 94,022 | ||||||
Bill Barrett Corp. (1) | 17,078 | 52,429 | ||||||
Bonanza Creek Energy, Inc. (1) | 4,124 | 130,772 | ||||||
Bristow Group, Inc. | 7,626 | 58,339 | ||||||
C&J Energy Services, Inc. (1) | 10,288 | 352,570 | ||||||
Cabot Oil & Gas Corp. | 3,763 | 94,376 | ||||||
California Resources Corp. (1) | 9,691 | 82,858 | ||||||
Callon Petroleum Co. (1) | 602,716 | 6,394,817 | ||||||
CARBO Ceramics, Inc. (1) | 5,269 | 36,093 | ||||||
Carrizo Oil & Gas, Inc. (1) | 359,545 | 6,263,274 | ||||||
Centennial Resource Development, Inc. (1) | 3,066 | 48,504 | ||||||
Cheniere Energy, Inc. (1) | 1,918 | 93,426 | ||||||
Chesapeake Energy Corp. (1) | 23,352 | 116,059 | ||||||
Cimarex Energy Co. | 24,510 | 2,304,185 | ||||||
Clean Energy Fuels Corp. (1) | 30,295 | 76,949 | ||||||
Cloud Peak Energy, Inc. (1) | 16,863 | 59,526 | ||||||
Concho Resources, Inc. (1) | 4,109 | 499,367 | ||||||
CONSOL Energy, Inc. (1) | 6,302 | 94,152 | ||||||
Contango Oil & Gas Company (1) | 5,157 | 34,242 | ||||||
Continental Resources, Inc. (1) | 276,252 | 8,931,227 | ||||||
CVR Energy, Inc. | 3,497 | 76,095 | ||||||
Delek US Holdings, Inc. | 13,749 | 363,524 | ||||||
Denbury Resources, Inc. (1) | 89,047 | 136,242 | ||||||
Devon Energy Corp. | 13,522 | 432,298 | ||||||
DHT Holdings, Inc. | 17,997 | 74,688 | ||||||
Diamond Offshore Drilling, Inc. (1) | 14,513 | 157,176 | ||||||
| Shares | Value | |||||||
Diamondback Energy, Inc. (1) | 115,199 | 10,230,823 | ||||||
Dorian LPG Ltd. (1) | 4,355 | 35,624 | ||||||
Dril-Quip, Inc. (1) | 8,414 | 410,603 | ||||||
Earthstone Energy, Inc. (1) | 2,047 | 20,490 | ||||||
Eclipse Resources Corp. (1) | 19,183 | 54,863 | ||||||
Energen Corp. (1) | 190,607 | 9,410,268 | ||||||
Energy XXI Gulf Coast, Inc. (1) | 5,646 | 104,846 | ||||||
Ensco Plc | 68,650 | 354,234 | ||||||
EP Energy Corp. (1) | 9,350 | 34,221 | ||||||
EQT Corp. | 146,697 | 8,594,977 | ||||||
Era Group, Inc. (1) | 4,189 | 39,628 | ||||||
Exterran Corp. (1) | 7,030 | 187,701 | ||||||
Extraction Oil & Gas, Inc. (1) | 3,331 | 44,802 | ||||||
Fairmount Santrol Holdings, Inc. (1) | 4,080 | 15,912 | ||||||
Forum Energy Technologies, Inc. (1) | 680,483 | 10,615,535 | ||||||
Franks International | 10,893 | 90,303 | ||||||
Frontline Ltd./Bermuda | 17,520 | 100,390 | ||||||
GasLog Ltd. | 9,299 | 141,810 | ||||||
Gastar Exploration, Inc. (1) | 20,031 | 18,549 | ||||||
Gener8 Maritime, Inc. (1) | 10,771 | 61,287 | ||||||
Geospace Technologies Corp. (1) | 2,994 | 41,407 | ||||||
Golar LNG Ltd. | 21,434 | 476,907 | ||||||
Green Plains, Inc. | 8,606 | 176,853 | ||||||
Gulf Island Fabrication, Inc. | 2,923 | 33,907 | ||||||
Gulfport Energy Corp. (1) | 163,269 | 2,408,218 | ||||||
Halcon Resources Corp. (1) | 13,573 | 61,621 | ||||||
Hallador Energy Co. | 3,193 | 24,810 | ||||||
Helix Energy Solutions Group, Inc. (1) | 31,420 | 177,209 | ||||||
Helmerich & Payne, Inc. | 2,958 | 160,738 | ||||||
Hess Corp. | 7,847 | 344,248 | ||||||
HollyFrontier Corp. | 4,946 | 135,867 | ||||||
Independence Contract Drilling, Inc. (1) | 7,187 | 27,957 | ||||||
International Seaways, Inc. (1) | 6,508 | 141,028 | ||||||
Jones Energy, Inc. (1) | 10,117 | 16,187 | ||||||
Keane Group, Inc. (1) | 410 | 6,560 | ||||||
Key Energy Services, Inc. (1) | 2,199 | 42,309 | ||||||
Kosmos Energy Ltd. (1) | 5,398 | 34,601 | ||||||
Mammoth Energy Services, Inc. (1) | 1,596 | 29,686 | ||||||
| Shares | Value | |||||||
Marathon Oil Corp. | 417,038 | 4,941,900 | ||||||
Marathon Petroleum Corp. | 194,447 | 10,175,412 | ||||||
Matador Resources Co. (1) | 374,540 | 8,003,920 | ||||||
Matrix Service Co. (1) | 6,177 | 57,755 | ||||||
McDermott International, Inc. (1) | 416,054 | 2,983,107 | ||||||
Midstates Petroleum Co, Inc. (1) | 2,850 | 36,109 | ||||||
Murphy Oil Corp. | 100,716 | 2,581,351 | ||||||
Nabors Industries Ltd. | 8,011 | 65,210 | ||||||
National Oilwell Varco, Inc. | 10,544 | 347,319 | ||||||
Natural Gas Services Group, Inc. (1) | 2,623 | 65,182 | ||||||
Navios Maritime Acquisition Corp. | 20,571 | 30,239 | ||||||
NCS Multistage Holdings, Inc. (1) | 190 | 4,784 | ||||||
Newfield Exploration Co. (1) | 160,556 | 4,569,424 | ||||||
Newpark Resources, Inc. (1) | 19,212 | 141,208 | ||||||
Noble Corp. Plc | 54,589 | 197,612 | ||||||
Noble Energy, Inc. | �� | 13,350 | 377,805 | |||||
Nordic American Tankers Ltd. | 22,788 | 144,476 | ||||||
Oasis Petroleum, Inc. (1) | 52,780 | 424,879 | ||||||
Oceaneering International, Inc. | 2,905 | 66,350 | ||||||
Oil States International, Inc. (1) | 11,418 | 309,999 | ||||||
Overseas Shipholding Group, Inc. (1) | 10,811 | 28,757 | ||||||
Pacific Ethanol, Inc. (1) | 9,323 | 58,269 | ||||||
Panhandle Oil and Gas, Inc. | 1,564 | 36,128 | ||||||
Par Petroleum Corp. (1) | 4,293 | 77,446 | ||||||
Parker Drilling Co. (1) | 28,537 | 38,525 | ||||||
Parsley Energy, Inc. (1) | 256,847 | 7,127,504 | ||||||
Patterson-UTI Energy, Inc. | 5,768 | 116,456 | ||||||
PBF Energy, Inc. | 3,258 | 72,523 | ||||||
PDC Energy, Inc. (1) | 14,751 | 635,916 | ||||||
Peabody Energy Corp. (1) | 10,781 | 263,595 | ||||||
Penn Virginia Corp. (1) | 418 | 15,361 | ||||||
PHI, Inc. (1) | 2,486 | 24,263 | ||||||
Pioneer Energy Services Corp. (1) | 16,221 | 33,253 | ||||||
Pioneer Natural Resources Co. | 20,008 | 3,192,877 | ||||||
ProPetro Holding Corp. (1) | 1,798 | 25,100 | ||||||
QEP Resources, Inc. (1) | 958,021 | 9,676,012 | ||||||
Range Resources Corp. | 247,011 | 5,723,245 | ||||||
Renewable Energy Group, Inc. (1) | 8,609 | 111,487 | ||||||
| Shares | Value | |||||||
Resolute Energy Corp. (1) | 4,563 | 135,841 | ||||||
REX American Resources Corp. (1) | 1,305 | 126,011 | ||||||
Rice Energy, Inc. (1) | 2,264 | 60,290 | ||||||
Ring Energy, Inc. (1) | 601 | 7,813 | ||||||
Rosehill Resources, Inc. (1) | 488 | 4,070 | ||||||
Rowan Co. Plc (1) | 26,304 | 269,353 | ||||||
RPC, Inc. | 128 | 2,587 | ||||||
RSP Permian, Inc. (1) | 282,982 | 9,131,829 | ||||||
SandRidge Energy, Inc. (1) | 7,798 | 134,204 | ||||||
Scorpio Tankers, Inc. | 37,599 | 149,268 | ||||||
SEACOR Holdings, Inc. (1) | 3,588 | 123,068 | ||||||
SEACOR Marine Holdings, Inc. (1) | 3,476 | 70,771 | ||||||
Seadrill Ltd. (1) | 919 | 331 | ||||||
SemGroup Corp. | 14,843 | 400,761 | ||||||
Ship Finance International Ltd. | 13,873 | 188,673 | ||||||
SilverBow Resources, Inc. (1) | 1,347 | 35,238 | ||||||
SM Energy Co. | 3,119 | 51,557 | ||||||
Smart Sand, Inc. (1) | 355 | 3,163 | ||||||
Southwestern Energy Co. (1) | 13,985 | 85,029 | ||||||
SRC Energy, Inc. (1) | 39,785 | 267,753 | ||||||
Stone Energy Corp. (1) | 4,252 | 78,152 | ||||||
Superior Energy Services, Inc. (1) | 33,809 | 352,628 | ||||||
Targa Resources Corp. | 5,402 | 244,170 | ||||||
Teekay Corp. | 12,427 | 82,888 | ||||||
Teekay Tankers Ltd. | 29,839 | 56,097 | ||||||
Tesco Corp. (1) | 9,324 | 41,492 | ||||||
Tesoro Corp. | 147,707 | 13,825,375 | ||||||
TETRA Technologies, Inc. (1) | 25,468 | 71,056 | ||||||
The Williams Companies, Inc. | 19,682 | 595,971 | ||||||
Transocean Ltd. (1) | 10,906 | 89,756 | ||||||
Ultra Petroleum Corp. (1) | 39,683 | 430,561 | ||||||
Unit Corp. (1) | 11,577 | 216,837 | ||||||
US Silica Holdings, Inc. | 7,078 | 251,198 | ||||||
Valero Energy Corp. | 105,200 | 7,096,792 | ||||||
W&T Offshore, Inc. (1) | 19,708 | 38,628 | ||||||
Weatherford International Plc (1) | 24,440 | 94,583 | ||||||
Westmoreland Coal Co. (1) | 2,782 | 13,548 | ||||||
Whiting Petroleum Corp. (1) | 9,966 | 54,913 | ||||||
| Shares | Value | |||||||
WildHorse Resource Development Corp. (1) | 4,506 | 55,739 | ||||||
Willbros Group, Inc. (1) | 8,805 | 21,748 | ||||||
World Fuel Services Corp. | 1,882 | 72,363 | ||||||
WPX Energy, Inc. (1) | 1,040,058 | 10,046,960 | ||||||
|
| |||||||
| 189,329,853 | ||||||||
|
| |||||||
Financials - 23.41% | ||||||||
1st Source Corp. | 3,585 | 171,865 | ||||||
Access National Corp. | 3,074 | 81,522 | ||||||
ACNB Corp. | 1,421 | 43,340 | ||||||
Affiliated Managers Group, Inc. | 1,590 | 263,717 | ||||||
AG Mortgage Investment Trust, Inc. | 4,967 | 90,896 | ||||||
AGNC Investment Corp. | 9,893 | 210,622 | ||||||
Alleghany Corp. (1) | 20,038 | 11,918,602 | ||||||
Allegiance Bancshares, Inc. (1) | 783 | 29,989 | ||||||
Allied World Assurance Co. Holdings AG | 2,441 | 129,129 | ||||||
Allstate Corp. | 145,050 | 12,828,222 | ||||||
Ally Financial, Inc. | 12,762 | 266,726 | ||||||
Ambac Financial Group, Inc. (1) | 4,701 | 81,562 | ||||||
American Equity Investment Life Holding Co. | 13,310 | 349,787 | ||||||
American Financial Group, Inc. | 27,897 | 2,772,125 | ||||||
American National Bankshares, Inc. | 1,791 | 66,177 | ||||||
American National Insurance Co. | 248 | 28,890 | ||||||
Ameriprise Financial, Inc. | 36,344 | 4,626,228 | ||||||
Ameris Bancorp | 1,988 | 95,822 | ||||||
AMERISAFE, Inc. | 3,725 | 212,139 | ||||||
Ames National Corp. | 1,938 | 59,303 | ||||||
AmTrust Financial Services, Inc. | 19,533 | 295,730 | ||||||
Annaly Capital Management, Inc. | 274,011 | 3,301,833 | ||||||
Anworth Mortgage Asset Corp. | 20,230 | 121,582 | ||||||
Aon Plc | 80,176 | 10,659,399 | ||||||
Apollo Commercial Real Estate Finance, Inc. | 20,944 | 388,511 | ||||||
Arch Capital Group Ltd. (1) | 2,828 | 263,824 | ||||||
Ares Capital Corp. | 1,021,100 | 16,725,618 | ||||||
Ares Commercial Real Estate Corp. | 6,713 | 87,873 | ||||||
Argo Group International Holdings Ltd. | 6,559 | 397,475 | ||||||
Arlington Asset Investment Corp. | 1,634 | 22,337 | ||||||
ARMOUR Residential REIT, Inc. | 8,486 | 212,150 | ||||||
Arrow Financial Corp. | 2,563 | 81,119 | ||||||
| Shares | Value | |||||||
Arthur J. Gallagher & Co. | 251,647 | 14,406,791 | ||||||
ASB Bancorp, Inc. (1) | 585 | 25,711 | ||||||
Aspen Insurance Holdings Ltd. | 1,131 | 56,380 | ||||||
Associated Banc Corp. | 4,192 | 105,638 | ||||||
Associated Capital Group, Inc. | 1,263 | 42,942 | ||||||
Assurant, Inc. | 1,250 | 129,612 | ||||||
Assured Guaranty Ltd. | 77,113 | 3,218,697 | ||||||
Astoria Financial Corp. | 20,945 | 422,042 | ||||||
Athene Holding Ltd. (1) | 211,730 | 10,503,925 | ||||||
Atlantic Capital Bancshares, Inc. (1) | 3,775 | 71,725 | ||||||
Atlas Financial Holdings, Inc. (1) | 1,436 | 21,396 | ||||||
Axis Capital Holdings Ltd. | 2,397 | 154,990 | ||||||
B. Riley Financial, Inc. | 3,230 | 59,922 | ||||||
Baldwin & Lyons, Inc. | 2,390 | 58,555 | ||||||
Banc of California, Inc. | 518,795 | 11,154,092 | ||||||
BancFirst Corp. | 1,863 | 179,966 | ||||||
Banco Latinoamericano De Comerico | 44,861 | 1,228,294 | ||||||
BancorpSouth, Inc. | 470,703 | 14,356,441 | ||||||
Bank Mutual Corp. | 9,615 | 87,977 | ||||||
Bank of Commerce Holdings | 3,199 | 35,349 | ||||||
Bank of Hawaii Corp. | 1,218 | 101,057 | ||||||
Bank of Marin Bancorp | 1,342 | 82,600 | ||||||
Bank of NT Butterfield & Son Ltd. | 3,413 | 116,383 | ||||||
Bank of the Ozarks, Inc. | 1,704 | 79,866 | ||||||
BankFinancial Corp. | 3,215 | 47,968 | ||||||
BankUnited, Inc. | 357,553 | 12,053,112 | ||||||
Bankwell Financial Group, Inc. | 1,083 | 33,822 | ||||||
Banner Corp. | 7,376 | 416,818 | ||||||
Bar Harbor Bankshares | 3,362 | 103,617 | ||||||
BB&T Corp. | 58,895 | 2,674,422 | ||||||
BCB Bancorp, Inc. | 2,090 | 31,977 | ||||||
Bear State Financial, Inc. | 4,250 | 40,205 | ||||||
Beneficial Bancorp, Inc. | 15,448 | 231,720 | ||||||
Berkshire Hills Bancorp, Inc. | 8,023 | 282,008 | ||||||
BGC Partners, Inc. | 4,718 | 59,636 | ||||||
Blue Capital Reinsurance Holdings Ltd. | 1,857 | 33,983 | ||||||
Blue Hills Bancorp, Inc. | 2,818 | 50,442 | ||||||
Bofi Holding, Inc. (1) | 7,815 | 185,372 | ||||||
| Shares | Value | |||||||
BOK Financial Corp. | 691 | 58,134 | ||||||
Boston Private Financial Holdings, Inc. | 18,876 | 289,747 | ||||||
Bridge Bancorp, Inc. | 4,245 | 141,358 | ||||||
Brookline Bancorp, Inc. | 16,957 | 247,572 | ||||||
Brown & Brown, Inc. | 3,278 | 141,183 | ||||||
Bryn Mawr Bank Corp. | 3,756 | 159,630 | ||||||
BSB Bancorp, Inc. (1) | 1,500 | 43,875 | ||||||
C&F Financial Corp. | 772 | 36,207 | ||||||
Cadence BanCorp (1) | 1,980 | 43,322 | ||||||
California First National Bancorp | 524 | 9,877 | ||||||
Camden National Corp. | 3,455 | 148,254 | ||||||
Capital Bank Financial Corp. | 159,812 | 6,088,837 | ||||||
Capital City Bank Group, Inc. | 2,475 | 50,539 | ||||||
Capitol Federal Financial, Inc. | 28,961 | 411,536 | ||||||
Capstar Financial Holdings, Inc. (1) | 1,288 | 22,849 | ||||||
Capstead Mortgage Corp. | 20,942 | 218,425 | ||||||
Carolina Financial Corp. | 970 | 31,350 | ||||||
Cathay General Bancorp | 16,854 | 639,609 | ||||||
CenterState Banks, Inc. | 12,048 | 299,513 | ||||||
Central Pacific Financial Corp. | 6,267 | 197,222 | ||||||
Central Valley Community Bancorp | 2,127 | 47,134 | ||||||
Century Bancorp, Inc. | 661 | 42,040 | ||||||
Charter Financial Corp. | 2,215 | 39,870 | ||||||
Chemical Financial Corp. | 217,998 | 10,553,283 | ||||||
Chemung Financial Corp. | 745 | 30,456 | ||||||
Cherry Hill Mortgage Investment Corp. | 3,166 | 58,476 | ||||||
Chimera Investment Corp. | 117,187 | 2,183,194 | ||||||
Cincinnati Financial Corp. | 4,326 | 313,419 | ||||||
CIT Group, Inc. | 46,310 | 2,255,297 | ||||||
Citizens & Northern Corp. | 2,706 | 62,942 | ||||||
Citizens Financial Group, Inc. | 118,155 | 4,215,770 | ||||||
Citizens, Inc. (1) | 11,844 | 87,409 | ||||||
City Holding Company | 3,384 | 222,904 | ||||||
Civista Bancshares, Inc. | 2,108 | 44,015 | ||||||
Clifton Bancorp, Inc. | 4,634 | 76,600 | ||||||
CNA Financial Corp. | 105,929 | 5,164,039 | ||||||
CNB Financial Corporation, Inc. | 3,293 | 78,933 | ||||||
CNO Financial Group, Inc. | 29,250 | 610,740 | ||||||
| Shares | Value | |||||||
CoBiz Financial, Inc. | 7,673 | 133,510 | ||||||
Codorus Valley Bancorp, Inc. | 1,766 | 50,154 | ||||||
Columbia Banking System, Inc. | 13,013 | 518,568 | ||||||
Comerica, Inc. | 4,887 | 357,924 | ||||||
Commerce Bancshares, Inc. | 2,549 | 144,860 | ||||||
Commerce Union Bancshares, Inc. | 1,406 | 33,561 | ||||||
Community Bank System, Inc. | 10,991 | 612,968 | ||||||
Community Bankers Trust Corp. (1) | 4,524 | 37,323 | ||||||
Community Financial Corp. | 831 | 31,993 | ||||||
Community Trust Bancorp, Inc. | 3,441 | 150,544 | ||||||
ConnectOne Bancorp, Inc. | 4,984 | 112,389 | ||||||
County Bancorp, Inc. | 952 | 22,848 | ||||||
Cowen, Inc. (1) | 6,055 | 98,394 | ||||||
Crawford & Co. | 745 | 6,928 | ||||||
Credit Acceptance Corp. (1) | 30 | 7,714 | ||||||
CU Bancorp (1) | 3,260 | 117,849 | ||||||
Cullen/Frost Bankers, Inc. | 1,587 | 149,035 | ||||||
Customers Bancorp, Inc. (1) | 6,376 | 180,313 | ||||||
CVB Financial Corp. | 446,215 | 10,008,602 | ||||||
CYS Investments, Inc. | 34,770 | 292,416 | ||||||
Dime Community Bancshares, Inc. | 7,254 | 142,178 | ||||||
Discover Financial Services | 301,053 | 18,722,486 | ||||||
DNB Financial Corp. | 629 | 21,575 | ||||||
Donegal Group, Inc. | 2,549 | 40,529 | ||||||
Donnelley Financial Solutions, Inc. (1) | 745 | 17,105 | ||||||
Dynex Capital, Inc. | 11,777 | 83,617 | ||||||
E*TRADE Financial Corp. (1) | 45,366 | 1,725,269 | ||||||
Eagle Bancorp, Inc. (1) | 1,384 | 87,607 | ||||||
East West Bancorp, Inc. | 253,710 | 14,862,332 | ||||||
eHealth, Inc. (1) | 404 | 7,595 | ||||||
Elevate Credit, Inc. (1) | 3,150 | 24,948 | ||||||
Ellington Residential Mortgage REIT | 2,531 | 37,104 | ||||||
EMC Insurance Group, Inc. | 2,324 | 64,561 | ||||||
Employers Holdings, Inc. | 7,246 | 306,506 | ||||||
Encore Capital Group, Inc. (1) | 4,029 | 161,764 | ||||||
Enova International, Inc. (1) | 5,399 | 80,175 | ||||||
Enstar Group Ltd. (1) | 67,722 | 13,452,975 | ||||||
Entegra Financial Corp. (1) | 1,380 | 31,395 | ||||||
| Shares | Value | |||||||
Enterprise Bancorp, Inc. | 2,136 | 75,913 | ||||||
Enterprise Financial Services Corp. | 5,004 | 204,163 | ||||||
Equity Bancshares, Inc. (1) | 1,555 | 47,645 | ||||||
Erie Indemnity Co. | 182 | 22,763 | ||||||
ESSA Bancorp, Inc. | 2,050 | 30,176 | ||||||
Evans Bancorp, Inc. | 975 | 38,951 | ||||||
Everest Re Group Ltd. | 20,349 | 5,180,652 | ||||||
EZCORP, Inc. (1) | 11,382 | 87,641 | ||||||
F.N.B. Corp. | 539,656 | 7,641,529 | ||||||
Farmers & Merchants Bancorp, Inc. | 868 | 53,816 | ||||||
Farmers Capital Bank Corp. | 1,619 | 62,412 | ||||||
Farmers National Banc Corp. | 5,415 | 78,517 | ||||||
FB Financial Corp. (1) | 782 | 28,301 | ||||||
FBL Financial Group, Inc. | 2,310 | 142,065 | ||||||
FCB Financial Holdings, Inc. (1) | 252,905 | 12,076,214 | ||||||
Federal Agricultural Mortgage Corp. | 2,080 | 134,576 | ||||||
Federated Investors, Inc. | 433 | 12,232 | ||||||
Federated National Holding Co. | 3,200 | 51,200 | ||||||
Ferroglobe Representation & Warranty Insurance Trust (1)(3) | 11,189 | — | ||||||
Fidelity & Guaranty Life | 2,871 | 89,145 | ||||||
Fidelity National Financial Ventures Group (1) | 14,560 | 230,048 | ||||||
Fidelity Southern Corp. | 4,896 | 111,923 | ||||||
Fifth Street Asset Management, Inc. | 1,178 | 5,713 | ||||||
Fifth Third Bancorp | 752,301 | 19,529,734 | ||||||
Financial Institutions, Inc. | 3,127 | 93,185 | ||||||
First American Financial Corp. | 365,218 | 16,321,592 | ||||||
First Bancorp NC | 5,442 | 170,117 | ||||||
First Bancorp PR (1) | 38,066 | 220,402 | ||||||
First Bancorp, Inc. | 2,262 | 61,210 | ||||||
First Bancshares, Inc. | 1,799 | 49,652 | ||||||
First Busey Corp. | 7,269 | 213,127 | ||||||
First Business Financial Services, Inc. | 1,799 | 41,521 | ||||||
First Citizens Bancshares, Inc. | 1,667 | 621,291 | ||||||
First Commonwealth Financial Corp. | 21,684 | 274,953 | ||||||
First Community Bancshares, Inc. | 3,673 | 100,457 | ||||||
First Community Financial Partners, Inc. (1) | 2,987 | 38,532 | ||||||
First Connecticut Bancorp, Inc. | 2,468 | 63,304 | ||||||
First Defiance Financial Corp. | 2,215 | 116,686 | ||||||
| Shares | Value | |||||||
First Financial Bancorp | 13,794 | 382,094 | ||||||
First Financial Bankshares, Inc. | 4,979 | 220,072 | ||||||
First Financial Corp. | 2,344 | 110,871 | ||||||
First Financial Northwest, Inc. | 1,686 | 27,195 | ||||||
First Foundation, Inc. (1) | 4,322 | 71,010 | ||||||
First Guaranty Bancshares, Inc. | 773 | 21,057 | ||||||
First Hawaiian, Inc. | 1,471 | 45,042 | ||||||
First Horizon National Corp. | 6,406 | 111,593 | ||||||
First Internet Bancorp | 1,395 | 39,130 | ||||||
First Interstate BancSystem, Inc. | 5,773 | 214,772 | ||||||
First Merchants Corp. | 9,162 | 367,763 | ||||||
First Mid-Illinois Bancshares, Inc. | 2,239 | 76,663 | ||||||
First Midwest Bancorp, Inc. | 22,850 | 532,634 | ||||||
First Northwest Bancorp (1) | 2,269 | 35,782 | ||||||
First of Long Island Corp. | 4,273 | 122,193 | ||||||
First Republic Bank | 854 | 85,485 | ||||||
FirstCash, Inc. | 8,722 | 508,493 | ||||||
Flagstar Bancorp, Inc. (1) | 4,912 | 151,388 | ||||||
Flushing Financial Corp. | 6,339 | 178,696 | ||||||
FNB Bancorp | 1,069 | 29,355 | ||||||
FNF Group | 7,347 | 329,366 | ||||||
Franklin Financial Network, Inc. (1) | 1,968 | 81,180 | ||||||
Fulton Financial Corp. | 38,366 | 728,954 | ||||||
GAIN Capital Holdings, Inc. | 8,644 | 53,852 | ||||||
GAMCO Investors, Inc. | 1,130 | 33,448 | ||||||
Genworth Financial, Inc. (1) | 87,818 | 331,074 | ||||||
German American Bancorp, Inc. | 4,642 | 158,246 | ||||||
Glacier Bancorp, Inc. | 14,438 | 528,575 | ||||||
Global Indemnity Ltd. (1) | 2,018 | 78,238 | ||||||
Great Ajax Corp. | 4,219 | 58,982 | ||||||
Great Southern Bancorp, Inc. | 2,453 | 131,236 | ||||||
Great Western Bancorp, Inc. | 13,254 | 540,896 | ||||||
Green Bancorp, Inc. (1) | 3,834 | 74,380 | ||||||
Greene County Bancorp, Inc. | 160 | 4,352 | ||||||
Greenhill & Co, Inc. | 6,402 | 128,680 | ||||||
Greenlight Capital Re Ltd. (1) | 7,194 | 150,355 | ||||||
Guaranty Bancorp | 4,189 | 113,941 | ||||||
Hallmark Financial Services, Inc. (1) | 3,662 | 41,271 | ||||||
| Shares | Value | |||||||
Hamilton Lane, Inc. | 1,201 | 26,410 | ||||||
Hancock Holding Co. | 18,841 | 923,209 | ||||||
Hanmi Financial Corp. | 7,069 | 201,113 | ||||||
Hannon Armstrong Sustainable Infrastructure Capital, Inc. | 11,005 | 251,684 | ||||||
Hanover Insurance Group, Inc. | 1,222 | 108,306 | ||||||
HarborOne Bancorp, Inc. (1) | 16,033 | 320,019 | ||||||
Harford Financial Services Group, Inc. | 254,682 | 13,388,633 | ||||||
HCI Group, Inc. | 882 | 41,436 | ||||||
Heartland Financial USA, Inc. | 5,489 | 258,532 | ||||||
Heritage Commerce Corp. | 7,238 | 99,740 | ||||||
Heritage Financial Corp. | 6,619 | 175,404 | ||||||
Heritage Insurance Holdings, Inc. | 5,691 | 74,097 | ||||||
Hilltop Holdings, Inc. | 16,977 | 444,967 | ||||||
Hingham Institution for Savings | 161 | 29,291 | ||||||
Home Bancorp, Inc. | 1,275 | 54,213 | ||||||
Home Bancshares, Inc. | 1,826 | 45,467 | ||||||
HomeStreet, Inc. (1) | 6,621 | 183,236 | ||||||
HomeTrust Bancshares, Inc. (1) | 3,694 | 90,134 | ||||||
Hope Bancorp, Inc. | 29,057 | 541,913 | ||||||
Horace Mann Educators Corp. | 192,415 | 7,273,287 | ||||||
Horizon Bancorp | 65,449 | 1,724,581 | ||||||
Howard Bancorp, Inc. (1) | 1,451 | 27,932 | ||||||
Huntington Bancshares, Inc. | 1,672,543 | 22,612,781 | ||||||
IBERIABANK Corp. | 172,505 | 14,059,158 | ||||||
Impac Mortgage Holdings, Inc. (1) | 2,647 | 40,049 | ||||||
Independence Holding Co. | 2,042 | 41,759 | ||||||
Independent Bank Corp. | 185,772 | 12,381,704 | ||||||
Independent Bank Corp. MI | 4,572 | 99,441 | ||||||
Independent Bank Group, Inc. | 3,943 | 234,609 | ||||||
Infinity Property & Casualty Corp. | 2,170 | 203,980 | ||||||
Interactive Brokers Group, Inc. | 1,905 | 71,285 | ||||||
International Bancshares Corp. | 12,306 | 431,325 | ||||||
INTL FCStone, Inc. (1) | 3,563 | 134,539 | ||||||
Invesco Ltd. | 9,592 | 337,542 | ||||||
Invesco Mortgage Capital, Inc. | 25,542 | 426,807 | ||||||
Investar Holding Corp. | 1,155 | 26,450 | ||||||
Investment Technology Group, Inc. | 4,254 | 90,355 | ||||||
Investors Bancorp, Inc. | 1,617,480 | 21,609,533 | ||||||
| Shares | Value | |||||||
Investors Title Co. | 97 | 18,764 | ||||||
James River Group Holdings Ltd. | 4,262 | 169,329 | ||||||
KCG Holdings, Inc. (1) | 10,254 | 204,465 | ||||||
Kearny Financial Corp. | 19,111 | 283,798 | ||||||
Kemper Corp. | 8,909 | 343,887 | ||||||
KeyCorp | 237,469 | 4,450,169 | ||||||
Kingstone Cos, Inc. | 2,247 | 34,379 | ||||||
KKR Real Estate Finance Trust, Inc. (1) | 2,471 | 53,127 | ||||||
Ladder Capital Corp. | 16,396 | 219,870 | ||||||
Ladenburg Thalmann Financial Services, Inc. (1) | 21,552 | 52,587 | ||||||
Lakeland Bancorp, Inc. | 9,982 | 188,161 | ||||||
Lakeland Financial Corp. | 4,513 | 207,056 | ||||||
Lazard Ltd. | 57,032 | 2,642,293 | ||||||
LCNB Corp. | 1,930 | 38,600 | ||||||
LegacyTexas Financial Group, Inc. | 168,154 | 6,411,712 | ||||||
Legg Mason, Inc. | 73,530 | 2,805,905 | ||||||
LendingClub Corp. (1) | 6,656 | 36,675 | ||||||
Leucadia National Corp. | 6,837 | 178,856 | ||||||
Lincoln National Corp. | 84,008 | 5,677,261 | ||||||
Loews Corp. | 218,209 | 10,214,363 | ||||||
M&T Bank Corp. | 4,037 | 653,792 | ||||||
Macatawa Bank Corp. | 5,821 | 55,532 | ||||||
Maiden Holdings Ltd. | 10,276 | 114,064 | ||||||
MainSource Financial Group, Inc. | 5,501 | 184,339 | ||||||
Malvern Bancorp, Inc. (1) | 1,323 | 31,686 | ||||||
Markel Corp. (1) | 385 | 375,706 | ||||||
Marlin Business Services Corp. | 1,443 | 36,291 | ||||||
Marsh & McLennan Companies, Inc. | 110,295 | 8,598,598 | ||||||
MB Financial, Inc. | 16,650 | 733,266 | ||||||
MBIA, Inc. (1) | 28,712 | 270,754 | ||||||
MBT Financial Corp. | 3,895 | 37,782 | ||||||
Medley Management, Inc. | 1,405 | 9,133 | ||||||
Mercantile Bank Corp. | 3,628 | 114,209 | ||||||
Mercury General Corp. | 804 | 43,416 | ||||||
Meridian Bancorp, Inc. | 8,886 | 150,173 | ||||||
Meta Financial Group, Inc. | 1,803 | 160,467 | ||||||
MFA Financial, Inc. | 11,434 | 95,931 | ||||||
MGIC Investment Corp. (1) | 226,270 | 2,534,224 | ||||||
| Shares | Value | |||||||
Middlefield Banc Corp. | 555 | 27,972 | ||||||
Midland States Bancorp, Inc. | 3,189 | 106,895 | ||||||
MidSouth Bancorp, Inc. | 1,828 | 21,479 | ||||||
MidWestOne Financial Group, Inc. | 2,473 | 83,810 | ||||||
Moody’s Corp. | 30,679 | 3,733,021 | ||||||
MTGE Investment Corp. | 10,725 | 201,630 | ||||||
MutualFirst Financial, Inc. | 1,340 | 47,838 | ||||||
Nasdaq OMX Group, Inc. | 122,304 | 8,743,513 | ||||||
National Bank Holdings Corp. | 3,604 | 119,328 | ||||||
National Bankshares, Inc. | 1,480 | 60,384 | ||||||
National Commerce Corp. (1) | 1,286 | 50,861 | ||||||
National General Holdings Corp. | 40,433 | 853,136 | ||||||
National Western Life Group, Inc. - Class A | 540 | 172,595 | ||||||
Nationstar Mortgage Holdings, Inc. (1) | 6,906 | 123,548 | ||||||
Navient Corp. | 511,559 | 8,517,457 | ||||||
Navigators Group, Inc. | 273,750 | 15,028,875 | ||||||
NBT Bancorp, Inc. | 9,546 | 352,725 | ||||||
Nelnet, Inc. | 4,666 | 219,349 | ||||||
New Residential Investment Corp. | 1,022,525 | 15,910,489 | ||||||
New York Community Bancorp, Inc. | 13,174 | 172,975 | ||||||
New York Mortgage Trust, Inc. | 148,334 | 922,637 | ||||||
NewStar Financial, Inc. | 6,178 | 64,869 | ||||||
NI Holdings, Inc. (1) | 2,504 | 44,772 | ||||||
Nicolet Bankshares, Inc. (1) | 1,977 | 108,162 | ||||||
NMI Holdings, Inc. (1) | 11,124 | 127,370 | ||||||
Northern Trust Corp. | 5,841 | 567,804 | ||||||
Northfield Bancorp, Inc. | 8,688 | 148,999 | ||||||
Northrim BanCorp, Inc. | 1,506 | 45,782 | ||||||
Northwest Bancshares, Inc. | 21,391 | 333,914 | ||||||
Norwood Financial Corp. | 802 | 33,885 | ||||||
OceanFirst Financial Corp. | 7,055 | 191,332 | ||||||
Oconee Federal Financial Corp. | 152 | 4,224 | ||||||
Ocwen Financial Corp. (1) | 23,008 | 61,892 | ||||||
OFG Bancorp | 9,849 | 98,490 | ||||||
Ohio Valley Banc Corp. | 845 | 30,462 | ||||||
Old Line Bancshares, Inc. | 1,681 | 47,371 | ||||||
Old National Bancorp | 30,190 | 520,778 | ||||||
Old Point Financial Corp. | 704 | 23,148 | ||||||
| Shares | Value | |||||||
Old Republic International Corp. | 6,753 | 131,886 | ||||||
Old Second Bancorp, Inc. | 6,520 | 75,306 | ||||||
On Deck Capital, Inc. (1) | 11,485 | 53,520 | ||||||
OneBeacon Insurance Group Ltd. | 5,047 | 92,007 | ||||||
OneMain Holdings, Inc. (1) | 1,596 | 39,246 | ||||||
Oppenheimer Holdings, Inc. | 2,715 | 44,526 | ||||||
Opus Bank | 1,616 | 39,107 | ||||||
Orchid Island Capital, Inc. | 5,904 | 58,213 | ||||||
Oritani Financial Corp. | 9,037 | 154,081 | ||||||
Orrstown Financial Services, Inc. | 1,624 | 37,108 | ||||||
Owens Realty Mortgage, Inc. | 2,436 | 41,315 | ||||||
Pacific Continental Corp. | 2,367 | 60,477 | ||||||
Pacific Mercantile Bancorp (1) | 3,353 | 29,506 | ||||||
Pacific Premier Bancorp, Inc. (1) | 5,724 | 211,216 | ||||||
PacWest Bancorp | 284,034 | 13,264,388 | ||||||
Paragon Commercial Corp. (1) | 807 | 42,343 | ||||||
Park National Corp. | 3,018 | 313,027 | ||||||
Park Sterling Corp. | 515,186 | 6,120,410 | ||||||
Parke Bancorp, Inc. | 1,203 | 26,947 | ||||||
PCSB Financial Corp. (1) | 4,013 | 68,462 | ||||||
Peapack Gladstone Financial Corp. | 3,668 | 114,772 | ||||||
PennantPark Investment Corp. | 163,500 | 1,208,265 | ||||||
Penns Woods Bancorp, Inc. | 1,092 | 44,969 | ||||||
PennyMac Mortgage Investment Trust | 13,366 | 244,464 | ||||||
Peoples Bancorp of North Carolina, Inc. | 875 | 27,650 | ||||||
Peoples Bancorp, Inc. | 3,687 | 118,463 | ||||||
Peoples Financial Services Corp. | 1,526 | 66,732 | ||||||
People’s United Financial, Inc. | 9,483 | 167,470 | ||||||
People’s Utah Bancorp | 2,588 | 69,358 | ||||||
PHH Corp. (1) | 11,972 | 164,854 | ||||||
Pinnacle Financial Partners, Inc. | 1,388 | 87,196 | ||||||
Piper Jaffray Cos. | 3,156 | 189,202 | ||||||
PJT Partners, Inc. | 4,168 | 167,637 | ||||||
Popular, Inc. | 43,287 | 1,805,501 | ||||||
PRA Group, Inc. (1) | 4,297 | 162,856 | ||||||
Premier Financial Bancorp, Inc. | 2,117 | 43,631 | ||||||
Principal Financial Group, Inc. | 37,765 | 2,419,604 | ||||||
ProAssurance Corp. | 1,523 | 92,598 | ||||||
| Shares | Value | |||||||
Prosperity Bancshares, Inc. | 1,837 | 118,009 | ||||||
Provident Bancorp, Inc. (1) | 789 | 17,753 | ||||||
Provident Financial Holdings, Inc. | 1,405 | 27,046 | ||||||
Provident Financial Services, Inc. | 13,961 | 354,330 | ||||||
Prudential Bancorp, Inc. | 1,618 | 29,383 | ||||||
Pzena Investment Management, Inc. | 1,283 | 13,035 | ||||||
QCR Holdings, Inc. | 2,702 | 128,075 | ||||||
Radian Group, Inc. | 48,688 | 796,049 | ||||||
Raymond James Financial, Inc. | 181,986 | 14,598,917 | ||||||
Redwood Trust, Inc. | 17,608 | 300,040 | ||||||
Regional Management Corp. (1) | 2,345 | 55,412 | ||||||
Regions Financial Corp. | 848,389 | 12,420,415 | ||||||
Reinsurance Group of America, Inc. | 224,749 | 28,855,524 | ||||||
RenaissanceRe Holdings Ltd. | 837 | 116,385 | ||||||
Renasant Corp. | 9,669 | 422,922 | ||||||
Republic Bancorp, Inc. | 2,237 | 79,861 | ||||||
Republic First Bancorp, Inc. (1) | 8,452 | 78,181 | ||||||
Resource Capital Corp. | 6,596 | 67,081 | ||||||
Riverview Bancorp, Inc. | 4,162 | 27,636 | ||||||
RLI Corp. | 1,566 | 85,535 | ||||||
S & T Bancorp, Inc. | 7,741 | 277,592 | ||||||
Safeguard Scientifics, Inc. (1) | 4,734 | 56,335 | ||||||
Safety Insurance Group, Inc. | 2,339 | 159,754 | ||||||
Sandy Spring Bancorp, Inc. | 5,282 | 214,766 | ||||||
Santander Consumer USA Holdings, Inc. (1) | 4,091 | 52,201 | ||||||
Seacoast Banking Corp. of Florida (1) | 8,950 | 215,695 | ||||||
SEI Investments Co. | 237,092 | 12,750,808 | ||||||
Selective Insurance Group, Inc. | 139,923 | 7,003,146 | ||||||
Shore Bancshares, Inc. | 2,849 | 46,866 | ||||||
SI Financial Group, Inc. | 2,701 | 43,486 | ||||||
Sierra Bancorp | 2,702 | 66,334 | ||||||
Signature Bank (1) | 614 | 88,127 | ||||||
Simmons First National Corp. | 6,780 | 358,662 | ||||||
SLM Corp. (1) | 778,287 | 8,950,301 | ||||||
SmartFinancial, Inc. (1) | 1,506 | 35,963 | ||||||
South State Corp. | 6,453 | 553,022 | ||||||
Southern First Bancshares, Inc. (1) | 1,408 | 52,166 | ||||||
Southern Missouri Bancorp, Inc. | 1,178 | 38,002 | ||||||
| Shares | Value | |||||||
Southern National Bancorp of Virginia, Inc. | 4,112 | 72,371 | ||||||
Southside Bancshares, Inc. | 6,241 | 218,048 | ||||||
Southwest Bancorp, Inc. | 3,965 | 101,306 | ||||||
Starwood Property Trust, Inc. | 87,461 | 1,958,252 | ||||||
State Auto Financial Corp. | 3,913 | 100,681 | ||||||
State Bank Financial Corp. | 8,380 | 227,266 | ||||||
State National Companies, Inc. | 910 | 16,726 | ||||||
State Street Corp. | 93,078 | 8,351,889 | ||||||
Sterling Bancorp | 29,538 | 686,759 | ||||||
Stewart Information Services Corp. | 4,661 | 211,516 | ||||||
Stifel Financial Corp. (1) | 15,019 | 690,574 | ||||||
Stock Yards Bancorp, Inc. | 4,844 | 188,432 | ||||||
Stonegate Bank | 2,499 | 115,404 | ||||||
Summit Financial Group, Inc. | 2,414 | 53,108 | ||||||
Sun Bancorp, Inc. | 2,456 | 60,540 | ||||||
Sunshine Bancorp, Inc. (1) | 1,300 | 27,703 | ||||||
SunTrust Banks, Inc. | 331,284 | 18,790,428 | ||||||
Sutherland Asset Management Corp. | 4,447 | 66,038 | ||||||
SVB Financial Group (1) | 394 | 69,261 | ||||||
Synchrony Financial | 559,707 | 16,690,463 | ||||||
Synovus Financial Corp. | 3,353 | 148,337 | ||||||
T. Rowe Price Group, Inc. | 5,583 | 414,314 | ||||||
TCF Financial Corp. | 173,496 | 2,765,526 | ||||||
TD Ameritrade Holding Corp. | 155,656 | 6,691,651 | ||||||
Territorial Bancorp, Inc. | 1,735 | 54,115 | ||||||
Texas Capital Bancshares, Inc. (1) | 181,903 | 14,079,292 | ||||||
TFS Financial Corp. | 1,455 | 22,509 | ||||||
The Bancorp, Inc. (1) | 10,845 | 82,205 | ||||||
Third Point Reinsurance Ltd. (1) | 9,214 | 128,075 | ||||||
Timberland Bancorp, Inc. | 1,292 | 32,649 | ||||||
Tiptree, Inc. | 6,254 | 44,091 | ||||||
Tompkins Financial Corp. | 3,130 | 246,394 | ||||||
Torchmark Corp. | 54,199 | 4,146,224 | ||||||
Towne Bank | 12,630 | 389,004 | ||||||
TriCo Bancshares | 4,549 | 159,897 | ||||||
TriState Capital Holdings, Inc. (1) | 3,642 | 91,778 | ||||||
Triumph Bancorp, Inc. (1) | 3,469 | 85,164 | ||||||
TrustCo Bank Corp. | 20,789 | 161,115 | ||||||
| Shares | Value | |||||||
Trustmark Corp. | 15,029 | 483,333 | ||||||
Two Harbors Investment Corp. | 9,589 | 95,027 | ||||||
Two River Bancorp | 1,493 | 27,755 | ||||||
UMB Financial Corp. | 10,130 | 758,332 | ||||||
Umpqua Holdings Corp. | 49,702 | 912,529 | ||||||
Union Bankshares Corp. | 9,667 | 327,711 | ||||||
United Bankshares, Inc. | 22,396 | 877,923 | ||||||
United Community Banks, Inc. | 15,842 | 440,408 | ||||||
United Community Financial Corp. | 10,909 | 90,654 | ||||||
United Financial Bancorp, Inc. | 11,497 | 191,885 | ||||||
United Fire Group, Inc. | 3,721 | 163,947 | ||||||
United Insurance Holdings Corp. | 1,148 | 18,058 | ||||||
United Security Bancshares/Fresno CA | 2,689 | 24,873 | ||||||
Unity Bancorp, Inc. | 1,563 | 26,884 | ||||||
Universal Insurance Holdings, Inc. | 65,149 | 1,641,755 | ||||||
Univest Corp. of Pennsylvania | 5,790 | 173,411 | ||||||
Unum Group | 406,956 | 18,976,358 | ||||||
Validus Holdings Ltd. | 2,240 | 116,413 | ||||||
Valley National Bancorp | 58,200 | 687,342 | ||||||
Veritex Holdings, Inc. (1) | 2,140 | 56,346 | ||||||
Virtus Investment Partners, Inc. | 1,346 | 149,339 | ||||||
Voya Financial, Inc. | 75,059 | 2,768,927 | ||||||
W.R. Berkley Corp. | 108,341 | 7,493,947 | ||||||
Waddell & Reed Financial, Inc. | 12,867 | 242,929 | ||||||
Walker & Dunlop, Inc. (1) | 1,009 | 49,269 | ||||||
Washington Federal, Inc. | 20,059 | 665,959 | ||||||
Washington Trust Bancorp, Inc. | 3,377 | 174,084 | ||||||
WashingtonFirst Bankshares, Inc. | 2,139 | 73,860 | ||||||
Waterstone Financial, Inc. | 5,320 | 100,282 | ||||||
Webster Financial Corp. | 2,536 | 132,430 | ||||||
WesBanco, Inc. | 9,473 | 374,562 | ||||||
West Bancorporation, Inc. | 2,805 | 66,338 | ||||||
Westamerica Bancorporation | 5,690 | 318,868 | ||||||
Western Alliance Bancorp (1) | 1,205 | 59,286 | ||||||
Western Asset Mortgage Capital Corp. | 8,590 | 88,477 | ||||||
Western New England Bancorp, Inc. | 5,489 | 55,713 | ||||||
White Mountains Insurance Group Ltd. | 126 | 109,447 | ||||||
Willis Towers Watson Plc | 3,526 | 512,892 | ||||||
| Shares | Value | |||||||
Wins Finance Holdings, Inc. (1)(3)(4) | 222 | 34,135 | ||||||
Wintrust Financial Corp. | 12,410 | 948,620 | ||||||
WMIH Corp. (1) | 44,980 | 56,225 | ||||||
World Acceptance Corp. (1) | 1,367 | 102,402 | ||||||
WSFS Financial Corp. | 5,062 | 229,562 | ||||||
Xenith Bankshares, Inc. (1) | 1,137 | 35,315 | ||||||
XL Group Ltd. | 131,161 | 5,744,852 | ||||||
Zions Bancorp | 51,052 | 2,241,693 | ||||||
|
| |||||||
| 759,804,315 | ||||||||
|
| |||||||
Healthcare - 5.54% | ||||||||
AAC Holdings, Inc. (1) | 2,698 | 18,697 | ||||||
Abeona Therapeutics, Inc. (1) | 5,148 | 32,947 | ||||||
Acadia Healthcare Co., Inc. (1) | 2,175 | 107,401 | ||||||
Accelerate Diagnostics, Inc. (1) | 260 | 7,111 | ||||||
Acceleron Pharma, Inc. (1) | 1,243 | 37,775 | ||||||
Aceto Corp. | 6,574 | 101,568 | ||||||
Achillion Pharmaceuticals, Inc. (1) | 26,197 | 120,244 | ||||||
Acorda Therapeutics, Inc. (1) | 8,451 | 166,485 | ||||||
Adamas Pharmaceuticals, Inc. (1) | 1,408 | 24,626 | ||||||
Addus HomeCare Corp. (1) | 36,611 | 1,361,929 | ||||||
Advaxis, Inc. (1) | 687 | 4,459 | ||||||
Agenus, Inc. (1) | 2,217 | 8,668 | ||||||
Agilent Technologies, Inc. | 6,770 | 401,529 | ||||||
Akorn, Inc. (1) | 53,500 | 1,794,390 | ||||||
Alder Biopharmaceuticals, Inc. (1) | 8,753 | 100,222 | ||||||
Alere, Inc. (1) | 2,382 | 119,553 | ||||||
Allscripts Healthcare Solutions, Inc. (1) | 40,565 | 517,609 | ||||||
Almost Family, Inc. (1) | 2,134 | 131,561 | ||||||
Alnylam Pharmaceuticals, Inc. (1) | 300 | 23,928 | ||||||
AMAG Pharmaceuticals, Inc. (1) | 47,700 | 877,680 | ||||||
American Renal Associates Holdings, Inc. (1) | 217 | 4,025 | ||||||
AMN Healthcare Services, Inc. (1) | 167,070 | 6,524,083 | ||||||
Analogic Corp. | 220,879 | 16,046,859 | ||||||
AngioDynamics, Inc. (1) | 8,118 | 131,593 | ||||||
Anika Therapeutics, Inc. (1) | 533 | 26,298 | ||||||
Aratana Therapeutics, Inc. (1) | 492 | 3,557 | ||||||
Ardelyx, Inc. (1) | 7,339 | 37,429 | ||||||
Array BioPharma, Inc. (1) | 4,811 | 40,268 | ||||||
| Shares | Value | |||||||
Atara Biotherapeutics, Inc. (1) | 5,659 | 79,226 | ||||||
Audentes Therapeutics, Inc. (1) | 376 | 7,193 | ||||||
Becton Dickinson and Co. | 29,839 | 5,821,887 | ||||||
Bellicum Pharmaceuticals, Inc. (1) | 1,916 | 22,379 | ||||||
BioCryst Pharmaceuticals, Inc. (1) | 2,967 | 16,497 | ||||||
Biohaven Pharmaceutical Holding Co Ltd. (1) | 254 | 6,350 | ||||||
Bio-Rad Laboratories, Inc. (1) | 580 | 131,260 | ||||||
BioScrip, Inc. (1) | 16,122 | 43,771 | ||||||
BioTime, Inc. (1) | 16,932 | 53,336 | ||||||
Bluebird Bio, Inc. (1) | 6,051 | 635,658 | ||||||
Boston Scientific Corp. (1) | 345,905 | 9,588,487 | ||||||
Brookdale Senior Living, Inc. (1) | 5,098 | 74,992 | ||||||
Bruker Corp. | 130,577 | 3,765,841 | ||||||
Capital Senior Living Corp. (1) | 162,279 | 2,468,264 | ||||||
Cara Therapeutics, Inc. (1) | 868 | 13,359 | ||||||
Cardinal Health, Inc. | 84,609 | 6,592,733 | ||||||
Cascadian Therapeutics, Inc. (1) | 7,297 | 27,108 | ||||||
Celldex Therapeutics, Inc. (1) | 26,842 | 66,300 | ||||||
Cempra, Inc. (1) | 9,690 | 44,574 | ||||||
Centene Corp. (1) | 129,669 | 10,357,960 | ||||||
Cerus Corp. (1) | 2,216 | 5,562 | ||||||
Chimerix, Inc. (1) | 10,313 | 56,206 | ||||||
Clearside Biomedical, Inc. (1) | 1,887 | 17,191 | ||||||
Collegium Pharmaceutical, Inc. (1) | 4,664 | 58,347 | ||||||
Community Health Systems, Inc. (1) | 21,514 | 214,279 | ||||||
Computer Programs & Systems, Inc. | 1,230 | 40,344 | ||||||
Concert Pharmaceuticals, Inc. (1) | 2,286 | 31,890 | ||||||
ConforMIS, Inc. (1) | 5,591 | 23,985 | ||||||
CONMED Corp. | 6,144 | 312,975 | ||||||
Corvus Pharmaceuticals, Inc. (1) | 1,819 | 22,010 | ||||||
Cross Country Healthcare, Inc. (1) | 4,168 | 53,809 | ||||||
CryoLife, Inc. (1) | 2,146 | 42,813 | ||||||
DaVita, Inc. (1) | 77,102 | 4,993,126 | ||||||
Dentsply Sirona, Inc. | 6,247 | 405,055 | ||||||
Dermira, Inc. (1) | 1,481 | 43,156 | ||||||
Dynavax Technologies Corp. (1) | 10,050 | 96,982 | ||||||
Editas Medicine, Inc. (1) | 2,166 | 36,345 | ||||||
Emergent BioSolutions, Inc. (1) | 41,455 | 1,405,739 | ||||||
| Shares | Value | |||||||
Enanta Pharmaceuticals, Inc. (1) | 3,496 | 125,786 | ||||||
Endo International Plc (1) | 331,230 | 3,699,839 | ||||||
Ensign Group, Inc. | 57,428 | 1,250,208 | ||||||
Envision Healthcare Corp. (1) | 173,822 | 10,893,425 | ||||||
Enzo Biochem, Inc. (1) | 433 | 4,780 | ||||||
Epizyme, Inc. (1) | 2,335 | 35,258 | ||||||
Evolent Health, Inc. (1) | 6,658 | 168,780 | ||||||
Exactech, Inc. (1) | 2,415 | 71,967 | ||||||
Fate Therapeutics, Inc. (1) | 6,070 | 19,667 | ||||||
Five Prime Therapeutics, Inc. (1) | 6,071 | 182,798 | ||||||
FONAR Corp. (1) | 151 | 4,190 | ||||||
Genocea Biosciences, Inc. (1) | 823 | 4,296 | ||||||
Haemonetics Corp. (1) | 2,268 | 89,563 | ||||||
Halyard Health, Inc. (1) | 10,500 | 412,440 | ||||||
Heron Therapeutics, Inc. (1) | 1,408 | 19,501 | ||||||
Hill-Rom Holdings, Inc. | 123 | 9,792 | ||||||
HMS Holdings Corp. (1) | 2,581 | 47,748 | ||||||
Hologic, Inc. (1) | 3,337 | 151,433 | ||||||
Horizon Pharma Plc (1) | 36,466 | 432,851 | ||||||
ICON Plc (1) | 32,925 | 3,219,736 | ||||||
ICU Medical, Inc. (1) | 55,411 | 9,558,398 | ||||||
Idera Pharmaceuticals, Inc. (1) | 2,834 | 4,874 | ||||||
Immune Design Corp. (1) | 3,271 | 31,892 | ||||||
Immunomedics, Inc. (1) | 14,034 | 123,920 | ||||||
Impax Laboratories, Inc. (1) | 16,356 | 263,332 | ||||||
INC Research Holdings, Inc. (1) | 148,940 | 8,712,990 | ||||||
Insmed, Inc. (1) | 1,932 | 33,153 | ||||||
Integer Holdings Corp. (1) | 6,966 | 301,280 | ||||||
Intellia Therapeutics, Inc. (1) | 3,170 | 50,720 | ||||||
Intra-Cellular Therapies, Inc. (1) | 7,537 | 93,610 | ||||||
Intrexon Corp. (1) | 399 | 9,612 | ||||||
Invacare Corp. | 7,093 | 93,628 | ||||||
Iovance Biotherapeutics, Inc. (1) | 10,798 | 79,365 | ||||||
Jazz Pharmaceuticals Plc (1) | 9,400 | 1,461,700 | ||||||
Juno Therapeutics, Inc. (1) | 1,762 | 52,666 | ||||||
Karyopharm Therapeutics, Inc. (1) | 5,828 | 52,743 | ||||||
Kindred Biosciences, Inc. (1) | 4,027 | 34,632 | ||||||
Kindred Healthcare, Inc. | 18,949 | 220,756 | ||||||
| Shares | Value | |||||||
Laboratory Corp. of America Holdings (1) | 83,197 | 12,823,986 | ||||||
Lannet, Inc. (1) | 64,103 | 1,307,701 | ||||||
Lantheus Holdings, Inc. (1) | 496 | 8,754 | ||||||
LHC Group, Inc. (1) | 235 | 15,954 | ||||||
LifePoint Health, Inc. (1) | 35,658 | 2,394,435 | ||||||
LivaNova Plc (1) | 10,845 | 663,822 | ||||||
Luminex Corp. | 5,077 | 107,226 | ||||||
MacroGenics, Inc. (1) | 5,284 | 92,523 | ||||||
Magellan Health, Inc. (1) | 24,135 | 1,759,442 | ||||||
Mallinckrodt Plc (1) | 65,343 | �� | 2,928,020 | |||||
Medicines Co. (1) | 1,231 | 46,790 | ||||||
MediciNova, Inc. (1) | 868 | 4,566 | ||||||
MEDNAX, Inc. (1) | 2,526 | 152,495 | ||||||
Medpace Holdings, Inc. (1) | 1,685 | 48,865 | ||||||
Meridian Bioscience, Inc. | 1,250 | 19,688 | ||||||
Merrimack Pharmaceuticals, Inc. | 9,782 | 12,130 | ||||||
Minerva Neurosciences, Inc. (1) | 797 | 7,053 | ||||||
Miragen Therapeutics, Inc. (1) | 472 | 6,103 | ||||||
Momenta Pharmaceuticals, Inc. (1) | 12,390 | 209,391 | ||||||
Mylan (1) | 14,887 | 577,913 | ||||||
MyoKardia, Inc. (1) | 363 | 4,755 | ||||||
Myriad Genetics, Inc. (1) | 14,345 | 370,675 | ||||||
NanoString Technologies, Inc. (1) | 2,342 | 38,737 | ||||||
NantHealth, Inc. (1) | 3,740 | 15,820 | ||||||
NantKwest, Inc. (1) | 6,755 | 51,270 | ||||||
National HealthCare Corp. | 2,496 | 175,069 | ||||||
National Research Corp. | 243 | 6,537 | ||||||
Novavax, Inc. (1) | 38,907 | 44,743 | ||||||
Novelion Therapeutics, Inc. (1) | 3,205 | 29,582 | ||||||
Nymox Pharmaceutical Corp. (1) | 3,600 | 15,840 | ||||||
Obalon Therapeutics, Inc. (1) | 585 | 5,797 | ||||||
OPKO Health, Inc. (1) | 8,162 | 53,706 | ||||||
OraSure Technologies, Inc. (1) | 716 | 12,358 | ||||||
Orthofix International (1) | 3,093 | 143,763 | ||||||
Otonomy, Inc. (1) | 6,253 | 117,869 | ||||||
Owens & Minor, Inc. | 13,759 | 442,902 | ||||||
Patterson Companies, Inc. | 2,070 | 97,187 | ||||||
PDL BioPharma, Inc. (1) | 38,058 | 94,003 | ||||||
| Shares | Value | |||||||
PerkinElmer, Inc. | 2,456 | 167,352 | ||||||
Perrigo Co. Plc | 3,549 | 268,020 | ||||||
PharMerica Corp. (1) | 38,421 | 1,008,551 | ||||||
Phibro Animal Health Corp. | 205 | 7,595 | ||||||
Portola Pharmaceuticals, Inc. (1) | 873 | 49,036 | ||||||
Premier, Inc. (1) | 1,071 | 38,556 | ||||||
Protagonist Therapeutics, Inc. (1) | 1,154 | 13,052 | ||||||
Prothena Corporation Plc (1) | 1,931 | 104,506 | ||||||
PTC Therapeutics, Inc. (1) | 1,466 | 26,872 | ||||||
QIAGEN NV | 4,263 | 142,930 | ||||||
Quality Systems, Inc. (1) | 4,145 | 71,335 | ||||||
Quest Diagnostics, Inc. | 24,991 | 2,778,000 | ||||||
Quintiles IMS Holdings, Inc. (1) | 77,983 | 6,979,479 | ||||||
Quotient Ltd. (1) | 2,016 | 14,838 | ||||||
R1 RCM, Inc. (1) | 2,790 | 10,463 | ||||||
Recro Pharma, Inc. (1) | 2,656 | 18,672 | ||||||
REGENXBIO, Inc. (1) | 4,430 | 87,493 | ||||||
Retrophin, Inc. (1) | 8,509 | 164,990 | ||||||
Rockwell Medical, Inc. (1) | 854 | 6,772 | ||||||
RTI Surgical, Inc. (1) | 3,052 | 17,854 | ||||||
Sarepta Therapeutics, Inc. (1) | 2,757 | 92,938 | ||||||
SciClone Pharmaceuticals, Inc. (1) | 7,543 | 82,973 | ||||||
Sientra, Inc. (1) | 2,895 | 28,139 | ||||||
Spectrum Pharmaceuticals, Inc. (1) | 17,342 | 129,198 | ||||||
Stemline Therapeutics, Inc. (1) | 4,031 | 37,085 | ||||||
STERIS Plc | 2,318 | 188,917 | ||||||
Sucampo Pharmaceuticals, Inc. (1) | 85,540 | 898,170 | ||||||
Syndax Pharmaceuticals, Inc. (1) | 55 | 768 | ||||||
Teleflex, Inc. | 1,067 | 221,680 | ||||||
Tetraphase Pharmaceuticals, Inc. (1) | 8,423 | 60,056 | ||||||
The Cooper Companies, Inc. | 318 | 76,136 | ||||||
The Providence Service Corp. (1) | 459 | 23,230 | ||||||
Tivity Health, Inc. (1) | 2,736 | 109,030 | ||||||
Tocagen, Inc. (1) | 282 | 3,392 | ||||||
Trevena, Inc. (1) | 11,241 | 25,854 | ||||||
Triple-S Management Corp. (1) | 4,476 | 75,689 | ||||||
United Therapeutics Corp. (1) | 1,233 | 159,957 | ||||||
Universal Health Services, Inc. | 52,946 | 6,463,648 | ||||||
| Shares | Value | |||||||
Utah Medical Products, Inc. | 75 | 5,430 | ||||||
Voyager Therapeutics, Inc. (1) | 3,214 | 28,797 | ||||||
VWR Corp. (1) | 251,566 | 8,304,194 | ||||||
WellCare Health Plans, Inc. (1) | 110 | 19,752 | ||||||
Zimmer Holdings, Inc. | 56,697 | 7,279,895 | ||||||
Zogenix, Inc. (1) | 1,320 | 19,140 | ||||||
|
| |||||||
| 179,690,716 | ||||||||
|
| |||||||
Industrials - 15.45% | ||||||||
AAR Corp. | 7,178 | 249,507 | ||||||
ABM Industries, Inc. | 6,189 | 256,967 | ||||||
Acacia Research Corp. (1) | 2,169 | 8,893 | ||||||
ACCO Brands Corp. (1) | 24,084 | 280,579 | ||||||
Actuant Corp. | 6,517 | 160,318 | ||||||
Acuity Brands, Inc. | 383 | 77,856 | ||||||
AECOM (1) | 4,298 | 138,954 | ||||||
Aegion Corp. (1) | 7,472 | 163,487 | ||||||
AeroVironment, Inc. (1) | 4,594 | 175,491 | ||||||
AGCO Corp. | 1,845 | 124,335 | ||||||
Air Lease Corp. | 111,203 | 4,154,544 | ||||||
Aircastle Ltd. | 10,965 | 238,489 | ||||||
Alamo Group, Inc. | 320 | 29,059 | ||||||
Alaska Air Group, Inc. | 638 | 57,267 | ||||||
Albany International Corp. | 1,358 | 72,517 | ||||||
Allison Transmission Holdings, Inc. | 258,505 | 9,696,523 | ||||||
Altra Industrial Motion Corp. | 194,470 | 7,739,906 | ||||||
AMERCO | 139 | 50,882 | ||||||
Ameresco, Inc. (1) | 4,448 | 34,250 | ||||||
American Airlines Group, Inc. | 99,119 | 4,987,668 | ||||||
American Railcar Industries, Inc. | 1,730 | 66,259 | ||||||
AMETEK, Inc. | 124,951 | 7,568,282 | ||||||
ARC Document Solutions, Inc. (1) | 8,870 | 36,899 | ||||||
ArcBest Corp. | 5,038 | 103,783 | ||||||
Arconic, Inc. | 10,830 | 245,299 | ||||||
Armstrong Flooring, Inc. (1) | 5,229 | 93,965 | ||||||
Armstrong World Industries, Inc. (1) | 316,380 | 14,553,480 | ||||||
Astec Industries, Inc. | 2,405 | 133,502 | ||||||
Atlas Air Worldwide Holdings, Inc. (1) | 38,008 | 1,982,117 | ||||||
Avis Budget Group, Inc. (1) | 71,100 | 1,938,897 | ||||||
| Shares | Value | |||||||
Babcock & Wilcox Enterprises, Inc. (1) | 269,368 | 3,167,768 | ||||||
Barnes Group, Inc. | 9,712 | 568,443 | ||||||
Beacon Roofing Supply, Inc. (1) | 3,482 | 170,618 | ||||||
Blue Bird Corp. (1) | 780 | 13,260 | ||||||
BMC Stock Holdings, Inc. (1) | 265,782 | 5,807,337 | ||||||
Brady Corp. | 2,321 | 78,682 | ||||||
Briggs & Stratton Corp. | 9,321 | 224,636 | ||||||
Caesarstone Ltd. (1) | 276,106 | 9,677,515 | ||||||
CAI International, Inc. (1) | 1,942 | 45,831 | ||||||
Carlisle Companies, Inc. | 1,755 | 167,427 | ||||||
Casella Waste Systems, Inc. (1) | 7,008 | 115,001 | ||||||
CBIZ, Inc. (1) | 11,789 | 176,835 | ||||||
CECO Environmental Corp. | 6,834 | 62,736 | ||||||
Chart Industries, Inc. (1) | 6,871 | 238,630 | ||||||
Chicago Bridge & Iron Co. | 64,432 | 1,271,243 | ||||||
CIRCOR International, Inc. | 72,481 | 4,303,922 | ||||||
Clean Harbors, Inc. (1) | 429 | 23,951 | ||||||
Cogint, Inc. (1) | 4,778 | 24,129 | ||||||
Colfax Corp. (1) | 2,448 | 96,378 | ||||||
Columbus Mckinnon Corp. | 4,286 | 108,950 | ||||||
CompX International, Inc. | 351 | 5,353 | ||||||
Copa Holdings SA | 798 | 93,366 | ||||||
Costamare, Inc. | 8,489 | 62,055 | ||||||
Covenant Transportation Group, Inc. - Class A (1) | 2,671 | 46,823 | ||||||
CRA International, Inc. | 1,998 | 72,567 | ||||||
Crane Co. | 23,083 | 1,832,329 | ||||||
CSW Industrials, Inc. (1) | 1,860 | 71,889 | ||||||
Cubic Corp. | 5,644 | 261,317 | ||||||
Cummins, Inc. | 19,287 | 3,128,737 | ||||||
Curtiss-Wright Corp. | 29,365 | 2,695,120 | ||||||
Delta Air Lines, Inc. | 87,379 | 4,695,747 | ||||||
Deluxe Corp. | 36,700 | 2,540,374 | ||||||
DigitalGlobe, Inc. (1) | 13,881 | 462,237 | ||||||
DMC Global, Inc. | 3,087 | 40,440 | ||||||
Donaldson Co., Inc. | 293 | 13,343 | ||||||
Dover Corp. | 3,829 | 307,162 | ||||||
Ducommun, Inc. (1) | 2,383 | 75,255 | ||||||
Dun & Bradstreet Corp. | 651 | 70,406 | ||||||
| Shares | Value | |||||||
DXP Enterprises, Inc. (1) | 835 | 28,808 | ||||||
Eagle Bulk Shipping, Inc. (1) | 8,137 | 38,488 | ||||||
Eastern Co. | 1,128 | 33,896 | ||||||
Eaton Corp. Plc | 68,316 | 5,317,034 | ||||||
Echo Global Logistics, Inc. (1) | 6,366 | 126,683 | ||||||
EMCOR Group, Inc. | 86,795 | 5,674,657 | ||||||
Encore Wire Corp. | 87,141 | 3,720,921 | ||||||
EnerSys, Inc. | 43,592 | 3,158,240 | ||||||
Engility Holdings, Inc. (1) | 4,078 | 115,815 | ||||||
Ennis, Inc. | 5,590 | 106,769 | ||||||
EnPro Industries, Inc. | 162,760 | 11,616,181 | ||||||
ESCO Technologies, Inc. | 109,347 | 6,522,549 | ||||||
Essendant, Inc. | 8,342 | 123,712 | ||||||
Esterline Technologies Corp. (1) | 134,281 | 12,729,839 | ||||||
Exone Co. (1) | 214 | 2,450 | ||||||
Expeditors International of Washington, Inc. | 1,474 | 83,252 | ||||||
Federal Signal Corp. | 9,944 | 172,628 | ||||||
Flowserve Corp. | 3,615 | 167,844 | ||||||
Fluor Corp. | 86,873 | 3,977,046 | ||||||
Fortive Corp. | 809 | 51,250 | ||||||
Fortune Brands Home & Security, Inc. | 293 | 19,115 | ||||||
Foundation Building Materials, Inc. (1) | 2,047 | 26,324 | ||||||
Franklin Covey Co. (1) | 342 | 6,601 | ||||||
Franklin Electric Company, Inc. | 572 | 23,681 | ||||||
FreightCar America, Inc. | 2,845 | 49,475 | ||||||
FTI Consulting, Inc. (1) | 9,342 | 326,596 | ||||||
GATX Corp. | 8,826 | 567,247 | ||||||
Genco Shipping & Trading Ltd. (1) | 1,506 | 14,262 | ||||||
Gencor Industries, Inc. (1) | 1,707 | 27,653 | ||||||
General Cable Corp. | 912 | 14,911 | ||||||
Genesee & Wyoming, Inc. (1) | 1,687 | 115,374 | ||||||
Gibraltar Industries, Inc. (1) | 7,026 | 250,477 | ||||||
Global Brass and Copper Holdings, Inc. | 52,616 | 1,607,419 | ||||||
Gorman Rupp Co. | 3,867 | 98,492 | ||||||
GP Strategies Corp. (1) | 305 | 8,052 | ||||||
Graham Corp. | 2,147 | 42,210 | ||||||
Granite Construction, Inc. | 2,005 | 96,721 | ||||||
Great Lakes Dredge & Dock Corp. (1) | 11,598 | 49,871 | ||||||
| Shares | Value | |||||||
Greenbrier Companies, Inc. | 47,333 | 2,189,151 | ||||||
Griffon Corp. | 1,055 | 23,157 | ||||||
Hardinge, Inc. | 2,350 | 29,187 | ||||||
Hawaiian Holdings, Inc. (1) | 1,013 | 47,560 | ||||||
HD Supply Holdings, Inc. (1) | 364,100 | 11,152,383 | ||||||
Heartland Express, Inc. | 324 | 6,746 | ||||||
Heidrick & Struggles International, Inc. | 4,178 | 90,872 | ||||||
Heritage Crystal Clean, Inc. (1) | 1,320 | 20,988 | ||||||
Herman Miller, Inc. | 70,587 | 2,145,845 | ||||||
Hertz Global Holdings, Inc. (1) | 12,501 | 143,762 | ||||||
Hexcel Corp. | 835 | 44,080 | ||||||
Hill International, Inc. (1) | 1,014 | 5,273 | ||||||
Hillenbrand, Inc. | 29,200 | 1,054,120 | ||||||
Hub Group, Inc. (1) | 7,231 | 277,309 | ||||||
Hubbell, Inc. | 99,571 | 11,268,450 | ||||||
Huntington Ingalls Industries, Inc. | 32,281 | 6,009,431 | ||||||
Hurco Companies, Inc. | 1,318 | 45,801 | ||||||
Huron Consulting Group, Inc. (1) | 5,016 | 216,691 | ||||||
Huttig Building Products, Inc. (1) | 1,389 | 9,737 | ||||||
Hyster-Yale Materials Handling, Inc. | 410 | 28,803 | ||||||
ICF International, Inc. (1) | 4,089 | 192,592 | ||||||
IDEX Corp. | 155 | 17,517 | ||||||
IES Holdings, Inc. (1) | 1,944 | 35,284 | ||||||
IHS Markit Ltd. (1) | 4,662 | 205,314 | ||||||
Ingersoll-Rand Plc | 120,796 | 11,039,546 | ||||||
InnerWorkings, Inc. (1) | 677 | 7,853 | ||||||
Insteel Industries, Inc. | 393 | 12,957 | ||||||
Interface, Inc. | 1,345 | �� | 26,429 | |||||
ITT, Inc. | 41,558 | 1,669,800 | ||||||
Jacobs Engineering Group, Inc. | 3,310 | 180,031 | ||||||
JetBlue Airways Corp. (1) | 111,042 | 2,535,089 | ||||||
Kaman Corp. | 5,562 | 277,377 | ||||||
Kansas City Southern | 2,929 | 306,520 | ||||||
KAR Auction Services, Inc. | 186,075 | 7,809,568 | ||||||
KBR, Inc. | 28,673 | 436,403 | ||||||
Kelly Services, Inc. | 6,898 | 154,860 | ||||||
KeyW Holding Corp. (1) | 10,707 | 100,110 | ||||||
Kimball International, Inc. | 936 | 15,622 | ||||||
| Shares | Value | |||||||
Kirby Corp. (1) | 1,475 | 98,604 | ||||||
KLX, Inc. (1) | 11,591 | 579,550 | ||||||
Knight Transportation, Inc. | 1,023 | 37,902 | ||||||
Knoll, Inc. | 261,075 | 5,234,554 | ||||||
Korn/Ferry International | 11,419 | 394,298 | ||||||
Kratos Defense & Security Solutions, Inc. (1) | 9,856 | 116,991 | ||||||
L.B. Foster Co. | 1,696 | 36,379 | ||||||
L3 Technologies, Inc. | 22,937 | 3,832,314 | ||||||
Lawson Products, Inc. (1) | 235 | 5,205 | ||||||
Layne Christensen Co. (1) | 3,941 | 34,641 | ||||||
Lennox International, Inc. | 86 | 15,793 | ||||||
LSC Communications, Inc. | 7,583 | 162,276 | ||||||
LSI Industries, Inc. | 5,313 | 48,083 | ||||||
Lydall, Inc. (1) | 190,733 | 9,860,896 | ||||||
Macquarie Infrastructure Corp. | 2,157 | 169,109 | ||||||
ManpowerGroup, Inc. | 173,468 | 19,367,702 | ||||||
Marten Transport Ltd. | 5,100 | 139,740 | ||||||
Masco Corp. | 338,514 | 12,934,620 | ||||||
Masonite International Corp. (1) | 185,020 | 13,969,010 | ||||||
Matson, Inc. | 214,523 | 6,444,271 | ||||||
McGrath RentCorp | 4,926 | 170,587 | ||||||
Mercury Systems, Inc. (1) | 817 | 34,388 | ||||||
Meritor, Inc. (1) | 18,784 | 312,002 | ||||||
Milacron Holdings Corp. (1) | 643,801 | 11,324,460 | ||||||
Miller Industries, Inc. | 2,211 | 54,943 | ||||||
Mistras Group, Inc. (1) | 3,397 | 74,632 | ||||||
Mobile Mini, Inc. | 9,809 | 292,799 | ||||||
Moog, Inc. (1) | 34,662 | 2,485,959 | ||||||
MRC Global, Inc. (1) | 19,928 | 329,211 | ||||||
MSA Safety, Inc. | 76,110 | 6,177,849 | ||||||
MSC Industrial Direct Co., Inc. | 773 | 66,447 | ||||||
Mueller Water Products, Inc. | 470,684 | 5,497,589 | ||||||
MYR Group, Inc. (1) | 1,996 | 61,916 | ||||||
National Presto Industries, Inc. | 1,030 | 113,815 | ||||||
Navigant Consulting, Inc. (1) | 10,776 | 212,934 | ||||||
Navios Maritime Holdings, Inc. (1) | 19,141 | 26,223 | ||||||
Navistar International Corp. (1) | 10,521 | 275,966 | ||||||
Neff Corp. (1) | 278 | 5,282 | ||||||
| Shares | Value | |||||||
Nexeo Solutions, Inc. (1) | 5,867 | 48,696 | ||||||
Nielsen Holdings Plc | 82,817 | 3,201,705 | ||||||
NL Industries, Inc. (1) | 2,045 | 14,417 | ||||||
Northwest Pipe Co. (1) | 1,962 | 31,902 | ||||||
NOW, Inc. (1) | 24,006 | 386,016 | ||||||
NV5 Global, Inc. (1) | 474 | 20,145 | ||||||
Old Dominion Freight Line, Inc. | 640 | 60,954 | ||||||
Orbital ATK, Inc. | 1,589 | 156,294 | ||||||
Orion Group Holdings, Inc. (1) | 3,318 | 24,785 | ||||||
Oshkosh Corp. | 31,064 | 2,139,688 | ||||||
Owens Corning | 66,672 | 4,461,690 | ||||||
PACCAR, Inc. | 9,583 | 632,861 | ||||||
Parker-Hannifin Corp. | 495 | 79,111 | ||||||
Park-Ohio Holdings Corp. | 2,033 | 77,457 | ||||||
Pendrell Corp. (1) | 2,100 | 15,183 | ||||||
Pentair Plc | 191,942 | 12,771,821 | ||||||
Pitney Bowes, Inc. | 89,957 | 1,358,351 | ||||||
Powell Industries, Inc. | 1,915 | 61,261 | ||||||
Preformed Line Products Co. | 662 | 30,730 | ||||||
Quad/Graphics, Inc. | 3,216 | 73,711 | ||||||
Quanex Building Products Corp. | 194,528 | 4,114,267 | ||||||
Quanta Services, Inc. (1) | 3,145 | 103,533 | ||||||
Regal-Beloit Corp. | 1,233 | 100,551 | ||||||
Republic Services, Inc. | 6,374 | 406,215 | ||||||
Resources Connection, Inc. | 6,758 | 92,585 | ||||||
Revolution Lighting Technologies, Inc. (1) | 2,255 | 14,860 | ||||||
Rexnord Corp. (1) | 23,275 | 541,144 | ||||||
Roadrunner Transportation Systems, Inc. (1) | 7,867 | 57,193 | ||||||
Robert Half International, Inc. | 222,370 | 10,658,194 | ||||||
Roper Technologies, Inc. | 151 | 34,961 | ||||||
RPX Corp. (1) | 10,488 | 146,308 | ||||||
RR Donnelley & Sons Co. | 10,283 | 128,949 | ||||||
Rush Enterprises, Inc. - Class A (1) | 3,581 | 133,142 | ||||||
Rush Enterprises, Inc. - Class B (1) | 529 | 19,261 | ||||||
Ryder System, Inc. | 20,672 | 1,487,971 | ||||||
Safe Bulkers, Inc. (1) | 10,354 | 23,711 | ||||||
Saia, Inc. (1) | 3,139 | 161,031 | ||||||
Schneider National, Inc. (1) | 524 | 11,722 | ||||||
| Shares | Value | |||||||
Scorpio Bulkers, Inc. (1) | 13,262 | 94,160 | ||||||
Sensata Technologies Holding NV (1) | 2,311 | 98,726 | ||||||
Simpson Manufacturing Company, Inc. | 7,810 | 341,375 | ||||||
SkyWest, Inc. | 11,145 | 391,190 | ||||||
Snap-on, Inc. | 96,166 | 15,194,228 | ||||||
SP Plus Corp. (1) | 2,702 | 82,546 | ||||||
Spartan Motors, Inc. | 2,957 | 26,169 | ||||||
Sparton Corp. (1) | 2,006 | 44,112 | ||||||
Spirit AeroSystems Holdings, Inc. | 144,457 | 8,369,839 | ||||||
Spirit Airlines, Inc. (1) | 1,922 | 99,271 | ||||||
SPX FLOW, Inc. (1) | 6,946 | 256,168 | ||||||
Standex International Corp. | 70,308 | 6,376,936 | ||||||
Stanley Black & Decker, Inc. | 120,408 | 16,945,018 | ||||||
Steelcase, Inc. | 182,246 | 2,551,444 | ||||||
Stericycle, Inc. (1) | 2,288 | 174,620 | ||||||
Sterling Construction Company, Inc. (1) | 4,171 | 54,515 | ||||||
Sunrun, Inc. (1) | 19,565 | 139,303 | ||||||
Supreme Industries, Inc. | 1,023 | 16,828 | ||||||
Team, Inc. (1) | 3,571 | 83,740 | ||||||
Teledyne Technologies, Inc. (1) | 965 | 123,182 | ||||||
Tennant Co. | 171 | 12,620 | ||||||
Terex Corp. | 2,499 | 93,713 | ||||||
Tetra Tech, Inc. | 884 | 40,443 | ||||||
Textainer Group Holdings Ltd. | 6,161 | 89,335 | ||||||
Textron, Inc. | 194,948 | 9,182,051 | ||||||
The Brink’s Co. | 273,764 | 18,342,188 | ||||||
The Manitowoc Co., Inc. (1) | 28,366 | 170,480 | ||||||
The Timken Co. | 180,296 | 8,338,690 | ||||||
Thermon Group Holdings, Inc. (1) | 7,213 | 138,273 | ||||||
Titan International, Inc. | 11,155 | 133,972 | ||||||
Titan Machinery, Inc. (1) | 4,280 | 76,954 | ||||||
TriMas Corp. (1) | 477,594 | 9,957,835 | ||||||
Trinity Industries, Inc. | 4,161 | 116,633 | ||||||
Triton International Ltd./Bermuda | 9,801 | 327,745 | ||||||
Triumph Group, Inc. | 10,988 | 347,221 | ||||||
TrueBlue, Inc. (1) | 8,856 | 234,684 | ||||||
Tutor Perini Corp. (1) | 7,227 | 207,776 | ||||||
Twin Disc, Inc. (1) | 1,734 | 27,987 | ||||||
| Shares | Value | |||||||
UniFirst Corp. | 3,387 | 476,551 | ||||||
United Continental Holdings, Inc. (1) | 148,857 | 11,201,489 | ||||||
United Rentals, Inc. (1) | 25,100 | 2,829,021 | ||||||
Universal Forest Products, Inc. | 519 | 45,314 | ||||||
Universal Logistics Holdings, Inc. | 548 | 8,220 | ||||||
US Ecology, Inc. | 156,740 | 7,915,370 | ||||||
USG Corp. (1) | 44,099 | 1,279,753 | ||||||
Valmont Industries, Inc. | 613 | 91,705 | ||||||
Vectrus, Inc. (1) | 1,995 | 64,478 | ||||||
Veritiv Corp. (1) | 2,595 | 116,775 | ||||||
Viad Corp. | 1,891 | 89,350 | ||||||
Vicor Corp. (1) | 231 | 4,135 | ||||||
Vivint Solar, Inc. (1) | 6,137 | 35,901 | ||||||
VSE Corp. | 1,889 | 84,967 | ||||||
W.W. Grainger, Inc. | 85 | 15,345 | ||||||
Wabash National Corp. | 76,645 | 1,684,657 | ||||||
WABCO Holdings, Inc. (1) | 60,377 | 7,698,671 | ||||||
Wabtec Corp. | 1,614 | 147,681 | ||||||
Watts Water Technologies, Inc. | 2,618 | 165,458 | ||||||
Werner Enterprises, Inc. | 10,498 | 308,116 | ||||||
Wesco Aircraft Holdings, Inc. (1) | 162,451 | 1,762,593 | ||||||
WESCO International, Inc. (1) | 98,246 | 5,629,496 | ||||||
West Corp. | 8,493 | 198,057 | ||||||
Willis Lease Finance Corp. (1) | 780 | 20,849 | ||||||
XPO Logistics, Inc. (1) | 807 | 52,156 | ||||||
Xylem, Inc. | 2,379 | 131,868 | ||||||
YRC Worldwide, Inc. (1) | 5,651 | 62,839 | ||||||
|
| |||||||
| 501,486,649 | ||||||||
|
| |||||||
Information Technology - 13.90% | ||||||||
Acacia Communications, Inc. (1) | 383 | 15,883 | ||||||
ACI Worldwide, Inc. (1) | 244,150 | 5,461,635 | ||||||
Activision Blizzard, Inc. | 248,952 | 14,332,167 | ||||||
Actua Corp. (1) | 6,806 | 95,624 | ||||||
Acxiom Corp. (1) | 8,647 | 224,649 | ||||||
ADTRAN, Inc. | 10,761 | 222,215 | ||||||
Agilysys, Inc. (1) | 3,273 | 33,123 | ||||||
Akamai Technologies, Inc. (1) | 4,672 | 232,712 | ||||||
Alliance Data Systems Corp. | 36,700 | 9,420,523 | ||||||
| Shares | Value | |||||||
Alpha and Omega Semiconductor Ltd. (1) | 3,854 | 64,246 | ||||||
Ambarella, Inc. (1) | 4,163 | 202,114 | ||||||
Amdocs Ltd. | 246,886 | 15,914,272 | ||||||
American Software, Inc. | 2,325 | 23,924 | ||||||
Amkor Technology, Inc. (1) | 226,881 | 2,216,627 | ||||||
Analog Devices, Inc. | 121,050 | 9,417,690 | ||||||
Anixter International, Inc. (1) | 6,528 | 510,490 | ||||||
Applied Materials, Inc. | 102,100 | 4,217,751 | ||||||
ARRIS International Plc (1) | 4,994 | 139,932 | ||||||
Arrow Electronics, Inc. (1) | 228,330 | 17,905,639 | ||||||
Autodesk, Inc. (1) | 1,047 | 105,559 | ||||||
Avid Technology, Inc. (1) | 2,842 | 14,949 | ||||||
Avnet, Inc. | 364,800 | 14,183,424 | ||||||
AVX Corp. | 10,164 | 166,080 | ||||||
AXT, Inc. (1) | 8,112 | 51,511 | ||||||
Bankrate, Inc. (1) | 10,537 | 135,400 | ||||||
Bazaarvoice, Inc. (1) | 18,428 | 91,219 | ||||||
Bel Fuse, Inc. | 1,605 | 39,643 | ||||||
Belden, Inc. | 9,406 | 709,495 | ||||||
Benchmark Electronics, Inc. (1) | 11,165 | 360,629 | ||||||
Blucora, Inc. (1) | 7,308 | 154,930 | ||||||
Booz Allen Hamilton Holding Corp. | 213 | 6,931 | ||||||
Bottomline Technologies, Inc. (1) | 1,088 | 27,951 | ||||||
Brocade Communications Systems, Inc. | 24,187 | 304,998 | ||||||
CA, Inc. | 56,638 | 1,952,312 | ||||||
CACI International, Inc. (1) | 92,394 | 11,553,870 | ||||||
Calix, Inc. (1) | 9,598 | 65,746 | ||||||
Cars.com, Inc. (1) | 15,825 | 421,420 | ||||||
ChannelAdvisor Corp. (1) | 216 | 2,495 | ||||||
Check Point Software Technologies Ltd. (1) | 101,725 | 11,096,163 | ||||||
Cirrus Logic, Inc. (1) | 39,900 | 2,502,528 | ||||||
Cognizant Technology Solutions - Class A | 44,160 | 2,932,224 | ||||||
Cohu, Inc. | 4,897 | 77,079 | ||||||
CommScope Holding Co., Inc. (1) | 390,305 | 14,843,299 | ||||||
Comtech Telecommunications Corp. | 5,194 | 98,530 | ||||||
Conduent, Inc. (1) | 5,252 | 83,717 | ||||||
Control4 Corp. (1) | 536 | 10,511 | ||||||
Convergys Corp. | 89,971 | 2,139,510 | ||||||
| Shares | Value | |||||||
CoreLogic, Inc. (1) | 1,002 | 43,467 | ||||||
Corning, Inc. | 131,100 | 3,939,555 | ||||||
Cray, Inc. (1) | 8,945 | 164,588 | ||||||
Cree, Inc. (1) | 21,759 | 536,359 | ||||||
CSG Systems International, Inc. | 1,482 | 60,140 | ||||||
CTS Corp. | 7,041 | 152,086 | ||||||
CyberOptics Corp. (1) | 677 | 13,980 | ||||||
Cypress Semiconductor Corp. | 8,344 | 113,896 | ||||||
Daktronics, Inc. | 3,891 | 37,470 | ||||||
DHI Group, Inc. (1) | 10,860 | 30,951 | ||||||
Digi International, Inc. (1) | 6,037 | 61,276 | ||||||
Digimarc Corp. (1) | 109 | 4,376 | ||||||
Diodes, Inc. (1) | 6,317 | 151,798 | ||||||
Dolby Laboratories, Inc. | 1,497 | 73,293 | ||||||
DSP Group, Inc. (1) | 4,716 | 54,706 | ||||||
DST Systems, Inc. | 1,522 | 93,907 | ||||||
DXC Technology Co. | 129,982 | 9,972,219 | ||||||
Eastman Kodak Co. (1) | 691 | 6,288 | ||||||
eBay, Inc. (1) | 255,128 | 8,909,070 | ||||||
EchoStar Corp. (1) | 1,335 | 81,034 | ||||||
Electro Scientific Industries, Inc. (1) | 6,790 | 55,950 | ||||||
EMCORE Corp. | 3,358 | 35,763 | ||||||
EnerNOC, Inc. (1) | 4,654 | 36,068 | ||||||
Entegris, Inc. (1) | 358,860 | 7,876,977 | ||||||
EVERTEC, Inc. | 2,723 | 47,108 | ||||||
F5 Networks, Inc. (1) | 9,000 | 1,143,540 | ||||||
FARO Technologies, Inc. (1) | 2,798 | 105,764 | ||||||
Fidelity National Information Services, Inc. | 362,356 | 30,945,202 | ||||||
Finisar Corp. (1) | 13,394 | 347,976 | ||||||
FireEye, Inc. (1) | 4,855 | 73,845 | ||||||
First Solar, Inc. (1) | 2,256 | 89,969 | ||||||
Fiserv, Inc. (1) | 43,775 | 5,355,433 | ||||||
Fitbit, Inc. (1) | 39,242 | 208,375 | ||||||
Flex Ltd. (1) | 878,035 | 14,320,751 | ||||||
FLIR Systems, Inc. | 1,761 | 61,036 | ||||||
Global Payments, Inc. | 122,325 | 11,048,394 | ||||||
Global Sources Ltd. (1) | 387 | 7,740 | ||||||
Glu Mobile, Inc. (1) | 21,428 | 53,570 | ||||||
| Shares | Value | |||||||
GSI Technology, Inc. (1) | 2,928 | 23,014 | ||||||
Guidewire Software, Inc. (1) | 1,249 | 85,819 | ||||||
Harmonic, Inc. (1) | 17,368 | 91,182 | ||||||
Harris Corp. | 167,844 | 18,308,424 | ||||||
HP, Inc. | 453,105 | 7,920,275 | ||||||
II-VI, Inc. (1) | 9,626 | 330,172 | ||||||
Infinera Corp. (1) | 32,303 | 344,673 | ||||||
Information Services Group, Inc. (1) | 3,306 | 13,588 | ||||||
Insight Enterprises, Inc. (1) | 4,867 | 194,631 | ||||||
InterActiveCorp (1) | 98,236 | 10,141,885 | ||||||
IXYS Corp. (1) | 5,458 | 89,784 | ||||||
Jabil, Inc. | 252,157 | 7,360,463 | ||||||
Juniper Networks, Inc. | 171,759 | 4,788,641 | ||||||
Keysight Technologies, Inc. (1) | 5,114 | 199,088 | ||||||
Kimball Electronics, Inc. (1) | 5,893 | 106,369 | ||||||
Knowles Corp. (1) | 19,724 | 333,730 | ||||||
Kopin Corp. (1) | 1,173 | 4,352 | ||||||
KVH Industries, Inc. (1) | 3,471 | 32,974 | ||||||
Lam Research Corp. | 42,300 | 5,982,489 | ||||||
Leaf Group Ltd. (1) | 2,370 | 18,486 | ||||||
Leidos Holdings, Inc. | 99,797 | 5,158,507 | ||||||
Limelight Networks, Inc. (1) | 8,927 | 25,799 | ||||||
Liquidity Services, Inc. (1) | 5,597 | 35,541 | ||||||
Littelfuse, Inc. | 58,250 | 9,611,250 | ||||||
LogMeIn, Inc. | 537 | 56,116 | ||||||
MACOM Technology Solutions Holdings, Inc. (1) | 212,880 | 11,872,318 | ||||||
Mantech International Corp. | 5,769 | 238,721 | ||||||
Marvell Technology Group Ltd. | 249,742 | 4,125,738 | ||||||
Maxwell Technologies, Inc. (1) | 7,932 | 47,513 | ||||||
Meet Group, Inc. (1) | 12,678 | 64,024 | ||||||
Methode Electronics, Inc. | 86,940 | 3,581,928 | ||||||
Micron Technology, Inc. (1) | 205,375 | 6,132,497 | ||||||
Microsemi Corp. (1) | 95,180 | 4,454,424 | ||||||
MicroStrategy, Inc. (1) | 938 | 179,786 | ||||||
MKS Instruments, Inc. | 161,570 | 10,873,661 | ||||||
MoneyGram International, Inc. (1) | 6,029 | 104,000 | ||||||
Monotype Imaging Holdings, Inc. | 4,785 | 87,565 | ||||||
Motorola Solutions, Inc. | 4,106 | 356,154 | ||||||
| Shares | Value | |||||||
MTS Systems Corp. | 3,739 | 193,680 | ||||||
Nanometrics, Inc. (1) | 922 | 23,317 | ||||||
National Instruments Corp. | 635 | 25,540 | ||||||
NCI, Inc. (1) | 1,192 | 25,151 | ||||||
NCR Corp. (1) | 408,100 | 16,666,804 | ||||||
NeoPhotonics Corp. (1) | 7,262 | 56,063 | ||||||
NetApp, Inc. | 35,992 | 1,441,480 | ||||||
NetEase, Inc. - ADR | 15,890 | 4,777,011 | ||||||
NETGEAR, Inc. (1) | 101,656 | 4,381,374 | ||||||
NetScout Systems, Inc. (1) | 157,813 | 5,428,767 | ||||||
NeuStar, Inc. (1) | 177 | 5,903 | ||||||
Nuance Communications, Inc. (1) | 7,947 | 138,357 | ||||||
NVE Corp. | 59 | 4,543 | ||||||
Oclaro, Inc. (1) | 4,636 | 43,300 | ||||||
ON Semiconductor Corp. (1) | 535,831 | 7,523,067 | ||||||
Park Electrochemical Corp. | 4,249 | 78,267 | ||||||
PC Connection, Inc. | 2,575 | 69,679 | ||||||
PCM, Inc. (1) | 1,351 | 25,331 | ||||||
PDF Solutions, Inc. (1) | 370 | 6,086 | ||||||
Perficient, Inc. (1) | 7,440 | 138,682 | ||||||
Photronics, Inc. (1) | 14,777 | 138,904 | ||||||
Plantronics, Inc. | 23,000 | 1,203,130 | ||||||
Plexus Corp. (1) | 7,497 | 394,117 | ||||||
Presidio, Inc. (1) | 1,607 | 22,996 | ||||||
Progress Software Corp. | 1,795 | 55,448 | ||||||
QAD, Inc. | 742 | 23,781 | ||||||
Qorvo, Inc. (1) | 1,679 | 106,314 | ||||||
Quantum Corp. (1) | 4,894 | 38,222 | ||||||
QuinStreet, Inc. (1) | 8,291 | 34,573 | ||||||
Radisys Corp. (1) | 6,428 | 24,169 | ||||||
Rambus, Inc. (1) | 18,247 | 208,563 | ||||||
RealNetworks, Inc. (1) | 4,761 | 20,615 | ||||||
Rightside Group Ltd. (1) | 2,524 | 26,805 | ||||||
Rocket Fuel, Inc. (1) | 7,802 | 21,456 | ||||||
Rogers Corp. (1) | 61,130 | 6,639,941 | ||||||
Rosetta Stone, Inc. (1) | 3,007 | 32,415 | ||||||
Rubicon Project, Inc. (1) | 10,102 | 51,924 | ||||||
Rudolph Technologies, Inc. (1) | 733 | 16,749 | ||||||
| Shares | Value | |||||||
Sabre Corp. | 1,263 | 27,496 | ||||||
Sanmina Corp. (1) | 71,879 | 2,738,590 | ||||||
ScanSource, Inc. (1) | 5,591 | 225,317 | ||||||
Seagate Technology Plc | 55,900 | 2,166,125 | ||||||
SecureWorks Corp. (1) | 1,804 | 16,759 | ||||||
ServiceSource International, Inc. (1) | 5,679 | 22,035 | ||||||
ShoreTel, Inc. (1) | 15,022 | 87,128 | ||||||
Sigma Designs, Inc. (1) | 8,255 | 48,292 | ||||||
Silver Spring Networks, Inc. (1) | 7,055 | 79,580 | ||||||
Skyworks Solutions, Inc. | 40,852 | 3,919,749 | ||||||
Sonus Networks, Inc. (1) | 10,544 | 78,447 | ||||||
SS&C Technologies Holdings, Inc. | 362 | 13,904 | ||||||
Stratasys Ltd. (1) | 5,700 | 132,867 | ||||||
SunPower Corp. (1) | 13,300 | 124,222 | ||||||
Super Micro Computer, Inc. (1) | 6,887 | 169,765 | ||||||
Sykes Enterprises, Inc. (1) | 8,164 | 273,739 | ||||||
Synchronoss Technologies, Inc. (1) | 9,619 | 158,233 | ||||||
SYNNEX Corp. | 5,184 | 621,873 | ||||||
Synopsys, Inc. (1) | 3,826 | 279,030 | ||||||
TE Connectivity Ltd. | 156,772 | 12,334,821 | ||||||
Tech Data Corp. (1) | 7,266 | 733,866 | ||||||
TechTarget, Inc. (1) | 2,807 | 29,109 | ||||||
Telenav, Inc. (1) | 3,195 | 25,880 | ||||||
TeleTech Holdings, Inc. | 143,951 | 5,873,201 | ||||||
Teradata Corp. (1) | 3,577 | 105,486 | ||||||
Teradyne, Inc. | 369 | 11,081 | ||||||
The Western Union Co. | 111,000 | 2,114,550 | ||||||
TiVo Corp. | 26,304 | 490,570 | ||||||
Trimble, Inc. (1) | 1,565 | 55,824 | ||||||
TTM Technologies, Inc. (1) | 121,632 | 2,111,532 | ||||||
Twitter, Inc. (1) | 17,368 | 310,366 | ||||||
Unisys Corp. (1) | 3,533 | 45,222 | ||||||
VASCO Data Security International, Inc. (1) | 6,133 | 88,009 | ||||||
Veeco Instruments, Inc. (1) | 10,490 | 292,146 | ||||||
VeriFone Systems, Inc. (1) | 23,090 | 417,929 | ||||||
Verint Systems, Inc. (1) | 11,720 | 477,004 | ||||||
Versum Materials, Inc. | 2,738 | 88,985 | ||||||
ViaSat, Inc. (1) | 11,227 | 743,227 | ||||||
| Shares | Value | |||||||
Viavi Solutions, Inc. (1) | 32,105 | 338,066 | ||||||
Virtusa Corp. (1) | 1,803 | 53,008 | ||||||
Vishay Intertechnology, Inc. | 104,322 | 1,731,745 | ||||||
Vishay Precision Group, Inc. (1) | 2,261 | 39,115 | ||||||
Western Digital Corp. | 55,421 | 4,910,301 | ||||||
WEX, Inc. (1) | 218 | 22,731 | ||||||
Xcerra Corp. (1) | 1,655 | 16,169 | ||||||
Xerox Corp. | 60,233 | 1,730,494 | ||||||
Xilinx, Inc. | 373 | 23,991 | ||||||
XO Group, Inc. (1) | 1,355 | 23,875 | ||||||
Zillow Group, Inc. - Class A (1) | 430 | 21,001 | ||||||
Zillow Group, Inc. - Class C (1) | 936 | 45,873 | ||||||
Zynga, Inc. (1) | 21,536 | 78,391 | ||||||
|
| |||||||
| 451,152,083 | ||||||||
|
| |||||||
Materials - 6.66% | ||||||||
AdvanSix, Inc. (1) | 928 | 28,991 | ||||||
AgroFresh Solutions, Inc. (1) | 4,704 | 33,775 | ||||||
AK Steel Holding Corp. (1) | 70,407 | 462,574 | ||||||
Albemarle Corp. | 2,485 | 262,267 | ||||||
Alcoa Corp. (1) | 5,120 | 167,168 | ||||||
Allegheny Technologies, Inc. | 24,126 | 410,383 | ||||||
American Vanguard Corp. | 6,468 | 111,573 | ||||||
Ampco-Pittsburgh Corp. | 1,782 | 26,284 | ||||||
AptarGroup, Inc. | 1,297 | 112,657 | ||||||
Ashland Global Holdings, Inc. | 1,715 | 113,036 | ||||||
Avery Dennison Corp. | 117,343 | 10,369,601 | ||||||
Ball Corp. | 4,288 | 180,996 | ||||||
Bemis, Inc. | 2,555 | 118,169 | ||||||
Berry Global Group, Inc. (1) | 167,995 | 9,577,395 | ||||||
Boise Cascade Co. (1) | 6,976 | 212,070 | ||||||
Cabot Corp. | 32,592 | 1,741,391 | ||||||
Calgon Carbon Corp. | 10,472 | 158,127 | ||||||
Carpenter Technology Corp. | 10,290 | 385,155 | ||||||
Celanese Corp. | 54,456 | 5,170,053 | ||||||
Century Aluminum Co. (1) | 10,457 | 162,920 | ||||||
CF Industries Holdings, Inc. | 6,458 | 180,566 | ||||||
Clearwater Paper Corp. (1) | 3,636 | 169,983 | ||||||
Cliffs Natural Resources, Inc. (1) | 66,705 | 461,599 | ||||||
| Shares | Value | |||||||
Coeur Mining, Inc. (1) | 33,848 | 290,416 | ||||||
Commercial Metals Co. | 25,893 | 503,101 | ||||||
Compass Minerals International, Inc. | 690 | 45,057 | ||||||
Constellium (1) | 1,241,925 | 8,569,283 | ||||||
Core Molding Technologies, Inc. (1) | 1,572 | 33,971 | ||||||
Crown Holdings, Inc. (1) | 417,741 | 24,922,428 | ||||||
Domtar Corp. | 41,966 | 1,612,334 | ||||||
Eagle Materials, Inc. | 71,339 | 6,593,150 | ||||||
Eastman Chemical Co. | 73,935 | 6,209,801 | ||||||
Flotek Industries, Inc. (1) | 11,046 | 98,751 | ||||||
FMC Corp. | 45,457 | 3,320,634 | ||||||
Freeport-McMoRan, Inc. (1) | 30,115 | 361,681 | ||||||
FutureFuel Corp. | 5,453 | 82,286 | ||||||
GCP Applied Technologies, Inc. (1) | 16,023 | 488,701 | ||||||
Gold Resource Corp. | 11,251 | 45,904 | ||||||
Graphic Packaging Holding Co. | 482,441 | 6,648,037 | ||||||
Greif, Inc. - Class A | 850 | 47,413 | ||||||
Greif, Inc. - Class B | 165 | 9,966 | ||||||
Handy & Harman Ltd. (1) | 286 | 8,980 | ||||||
Hawkins, Inc. | 1,735 | 80,417 | ||||||
Haynes International, Inc. | 2,732 | 99,199 | ||||||
HB Fuller Co. | 253,325 | 12,947,441 | ||||||
Hecla Mining Co. | 87,934 | 448,463 | ||||||
Huntsman Corp. | �� | 156,569 | 4,045,743 | |||||
Ingevity Corp. (1) | 142,780 | 8,195,572 | ||||||
Innophos Holdings, Inc. | 4,326 | 189,652 | ||||||
Innospec, Inc. | 5,346 | 350,430 | ||||||
International Paper Co. | 80,639 | 4,564,974 | ||||||
Intrepid Potash, Inc. (1) | 20,410 | 46,127 | ||||||
Kaiser Aluminum Corp. | 3,722 | 329,471 | ||||||
Klondex Mines Ltd. (1) | 27,429 | 92,436 | ||||||
Kraton Corp. (1) | 5,384 | 185,425 | ||||||
Louisiana-Pacific Corp. (1) | 2,094 | 50,486 | ||||||
LSB Industries, Inc. (1) | 4,915 | 50,772 | ||||||
Martin Marietta Materials, Inc. | 178 | 39,619 | ||||||
Materion Corp. | 4,418 | 165,233 | ||||||
Minerals Technologies, Inc. | 113,373 | 8,298,904 | ||||||
Neenah Paper, Inc. | 637 | 51,119 | ||||||
| Shares | Value | |||||||
NewMarket Corp. | 19 | 8,749 | ||||||
Newmont Mining Corp. | 14,807 | 479,599 | ||||||
Nucor Corp. | 8,850 | 512,149 | ||||||
Olin Corp. | 4,566 | 138,258 | ||||||
Olympic Steel, Inc. | 2,065 | 40,226 | ||||||
OMNOVA Solutions, Inc. (1) | 3,506 | 34,183 | ||||||
Owens-Illinois, Inc. (1) | 112,675 | 2,695,186 | ||||||
Packaging Corporation of America | 124,125 | 13,826,284 | ||||||
PH Glatfelter Co. | 302,928 | 5,919,213 | ||||||
Platform Specialty Products Corp. (1) | 3,319 | 42,085 | ||||||
PolyOne Corp. | 285,125 | 11,045,742 | ||||||
PPG Industries, Inc. | 44,604 | 4,904,656 | ||||||
Ramaco Resources, Inc. (1) | 1,591 | 9,626 | ||||||
Rayonier Advanced Materials, Inc. | 3,657 | 57,488 | ||||||
Reliance Steel & Aluminum Co. | 194,111 | 14,133,222 | ||||||
Royal Gold, Inc. | 1,133 | 88,567 | ||||||
RPM International, Inc. | 305 | 16,638 | ||||||
Ryerson Holding Corp. (1) | 3,611 | 35,749 | ||||||
Schnitzer Steel Industries, Inc. | 5,985 | 150,822 | ||||||
Schweitzer-Mauduit International, Inc. | 33,806 | 1,258,597 | ||||||
Scotts Miracle-Gro Co. | 105 | 9,393 | ||||||
Sealed Air Corp. | 2,636 | 117,987 | ||||||
Sonoco Products Co. | 2,714 | 139,554 | ||||||
Southern Copper Corp. | 243 | 8,415 | ||||||
Steel Dynamics, Inc. | 374,089 | 13,396,127 | ||||||
Stepan Co. | 1,643 | 143,171 | ||||||
SunCoke Energy, Inc. (1) | 14,250 | 155,325 | ||||||
Tahoe Resources, Inc. | 9,014 | 77,701 | ||||||
The Mosaic Co. | 9,731 | 222,159 | ||||||
TimkenSteel Corp. (1) | 8,758 | 134,610 | ||||||
Trecora Resources (1) | 4,235 | 47,644 | ||||||
Tredegar Corp. | 5,798 | 88,420 | ||||||
Trinseo S.A. | 42,543 | 2,922,704 | ||||||
Tronox Ltd. | 14,640 | 221,357 | ||||||
UFP Technologies, Inc. (1) | 1,360 | 38,488 | ||||||
United States Lime & Minerals, Inc. | 325 | 25,503 | ||||||
United States Steel Corp. | 4,879 | 108,021 | ||||||
Valhi, Inc. | 5,392 | 16,068 | ||||||
| Shares | Value | |||||||
Valvoline, Inc. | 234,596 | 5,564,612 | ||||||
Verso Corp. (1) | 7,624 | 35,757 | ||||||
Vulcan Materials Co. | 277 | 35,090 | ||||||
Warrior Met Coal, Inc. | 3,701 | 63,398 | ||||||
Westlake Chemical Corp. | 493 | 32,642 | ||||||
WestRock Co. | 113,114 | 6,409,039 | ||||||
Worthington Industries, Inc. | 861 | 43,239 | ||||||
|
| |||||||
| 216,193,573 | ||||||||
|
| |||||||
Real Estate - 7.89% | ||||||||
Acadia Realty Trust | 18,712 | 520,194 | ||||||
Agree Realty Corp. | 5,659 | 259,578 | ||||||
Alexander & Baldwin, Inc. | 292,132 | 12,088,422 | ||||||
Alexander’s, Inc. | 51 | 21,494 | ||||||
Alexandria Real Estate Equities, Inc. | 2,523 | 303,946 | ||||||
Altisource Residential Corp. | 11,354 | 146,921 | ||||||
American Assets Trust, Inc. | 111,541 | 4,393,600 | ||||||
American Campus Communities, Inc. | 3,764 | 178,037 | ||||||
American Homes 4 Rent | 163,491 | 3,689,992 | ||||||
Apartment Investment & Management Co. | 4,323 | 185,759 | ||||||
Apple Hospitality REIT, Inc. | 5,813 | 108,761 | ||||||
Armada Hoffler Properties, Inc. | 1,639 | 21,225 | ||||||
Ashford Hospitality Prime, Inc. | 5,207 | 53,580 | ||||||
Ashford Hospitality Trust, Inc. | 18,743 | 113,957 | ||||||
AvalonBay Communities, Inc. | 3,836 | 737,164 | ||||||
Bluerock Resident Growth REIT, Inc. - Class A | 5,901 | 76,064 | ||||||
Boston Properties, Inc. | 122,908 | 15,120,142 | ||||||
Brandywine Realty Trust | 4,781 | 83,811 | ||||||
Brixmor Property Group, Inc. | 8,314 | 148,654 | ||||||
Camden Property Trust | 2,420 | 206,934 | ||||||
Care Capital Properties, Inc. | 9,779 | 261,099 | ||||||
CareTrust REIT, Inc. | 1,380 | 25,585 | ||||||
CatchMark Timber Trust, Inc. | 9,134 | 103,854 | ||||||
CBL & Associates Properties, Inc. | 129,552 | 1,092,123 | ||||||
CBRE Group, Inc. (1) | 4,566 | 166,202 | ||||||
Cedar Realty Trust, Inc. | 19,560 | 94,866 | ||||||
Chatham Lodging Trust | 113,752 | 2,285,278 | ||||||
Chesapeake Lodging Trust | 13,178 | 322,466 | ||||||
City Office REIT, Inc. | 6,057 | 76,924 | ||||||
| Shares | Value | |||||||
Clipper Realty, Inc. | 3,117 | 38,464 | ||||||
Colony NorthStar, Inc. | 14,905 | 210,011 | ||||||
Colony Starwood Homes | 22,715 | 779,352 | ||||||
Columbia Property Trust, Inc. | 3,389 | 75,846 | ||||||
Community Healthcare Trust, Inc. | 2,525 | 64,615 | ||||||
Consolidated-Tomoka Land Co. | 122 | 6,948 | ||||||
CoreCivic, Inc. | 3,261 | 89,938 | ||||||
CorEnergy Infrastructure Trust, Inc. | 2,919 | 98,049 | ||||||
Corporate Office Properties Trust | 2,795 | 97,909 | ||||||
Cousins Properties, Inc. | 93,889 | 825,284 | ||||||
CubeSmart | 1,730 | 41,589 | ||||||
CyrusOne, Inc. | 132,929 | 7,410,792 | ||||||
DCT Industrial Trust, Inc. | 2,551 | 136,325 | ||||||
DDR Corp. | 189,963 | 1,722,964 | ||||||
DiamondRock Hospitality Co. | 258,264 | 2,827,991 | ||||||
Digital Realty Trust, Inc. | 1,323 | 149,433 | ||||||
Douglas Emmett, Inc. | 191,327 | 7,310,605 | ||||||
Duke Realty Corp. | 9,850 | 275,307 | ||||||
Easterly Government Properties, Inc. | 8,743 | 183,166 | ||||||
EastGroup Properties, Inc. | 106,590 | 8,932,242 | ||||||
Education Realty Trust, Inc. | 16,563 | 641,816 | ||||||
Empire State Realty Trust, Inc. | 3,525 | 73,214 | ||||||
EPR Properties | 1,784 | 128,216 | ||||||
Equity Commonwealth (1) | 391,430 | 12,369,188 | ||||||
Equity Residential | 88,269 | 5,810,748 | ||||||
Essex Property Trust, Inc. | 18,675 | 4,804,517 | ||||||
Extra Space Storage, Inc. | 512 | 39,936 | ||||||
Farmland Partners, Inc. | 7,883 | 70,474 | ||||||
Federal Realty Investment Trust | 1,247 | 157,608 | ||||||
FelCor Lodging Trust, Inc. | 29,198 | 210,518 | ||||||
First Industrial Realty Trust, Inc. | 20,339 | 582,102 | ||||||
First Potomac Realty Trust | 13,205 | 146,708 | ||||||
Forest City Realty Trust, Inc. | 6,334 | 153,093 | ||||||
Forestar Group, Inc. (1) | 5,320 | 91,238 | ||||||
Four Corners Property Trust, Inc. | 4,405 | 110,610 | ||||||
Franklin Street Properties Corp. | 24,130 | 267,360 | ||||||
FRP Holdings, Inc. (1) | 1,413 | 65,210 | ||||||
Gaming and Leisure Properties, Inc. | 3,700 | 139,379 | ||||||
| Shares | Value | |||||||
Getty Realty Corp. | 56,047 | 1,406,780 | ||||||
GGP, Inc. | 139,454 | 3,285,536 | ||||||
Gladstone Commercial Corp. | 5,855 | 127,580 | ||||||
Global Medical REIT, Inc. | 3,249 | 29,046 | ||||||
Global Net Lease, Inc. | 15,313 | 340,561 | ||||||
Government Properties Income Trust | 99,022 | 1,813,093 | ||||||
Gramercy Property Trust | 28,967 | 860,610 | ||||||
Griffin Industrial Realty, Inc. | 129 | 4,047 | ||||||
HCP, Inc. | 13,124 | 419,443 | ||||||
Healthcare Realty Trust, Inc. | 25,909 | 884,792 | ||||||
Healthcare Trust of America, Inc. | 5,437 | 169,145 | ||||||
Hersha Hospitality Trust | 9,159 | 169,533 | ||||||
Highwoods Properties, Inc. | 2,862 | 145,132 | ||||||
Hospitality Properties Trust | 120,308 | 3,506,978 | ||||||
Host Hotels & Resorts, Inc. | 221,531 | 4,047,371 | ||||||
Hudson Pacific Properties, Inc. | 3,879 | 132,623 | ||||||
Independence Realty Trust, Inc. | 134,043 | 1,323,004 | ||||||
InfraREIT, Inc. | 9,925 | 190,064 | ||||||
Investors Real Estate Trust | 28,286 | 175,656 | ||||||
Invitation Homes, Inc. | 2,540 | 54,940 | ||||||
Iron Mountain, Inc. | 916 | 31,474 | ||||||
iStar, Inc. (1) | 16,209 | 195,156 | ||||||
Jernigan Capital, Inc. | 2,307 | 50,754 | ||||||
Jones Lang LaSalle, Inc. | 1,274 | 159,250 | ||||||
Kennedy-Wilson Holdings, Inc. | 492,010 | 9,372,790 | ||||||
Kilroy Realty Corp. | 46,637 | 3,504,771 | ||||||
Kimco Realty Corp. | 183,373 | 3,364,895 | ||||||
Kite Realty Group Trust | 18,010 | 340,929 | ||||||
Lamar Advertising Co. | 243 | 17,878 | ||||||
LaSalle Hotel Properties | 113,681 | 3,387,694 | ||||||
Lexington Realty Trust | 296,680 | 2,940,099 | ||||||
Liberty Property Trust | 4,146 | 168,784 | ||||||
Life Storage, Inc. | 1,268 | 93,959 | ||||||
LTC Properties, Inc. | 5,391 | 277,043 | ||||||
Mack Cali Realty Corp. | 104,354 | 2,832,168 | ||||||
MedEquities Realty Trust, Inc. | 5,319 | 67,126 | ||||||
Medical Properties Trust, Inc. | 138,924 | 1,787,952 | ||||||
Mid-America Apartment Communities, Inc. | 3,173 | 334,371 | ||||||
| Shares | Value | |||||||
Monmouth Real Estate Investment Corp. | 13,467 | 202,678 | ||||||
Monogram Residential Trust, Inc. | 37,489 | 364,018 | ||||||
National Health Investors, Inc. | 4,953 | 392,278 | ||||||
National Retail Properties, Inc. | 4,116 | 160,936 | ||||||
National Storage Affiliates Trust Co. | 9,204 | 212,704 | ||||||
New Senior Investment Group, Inc. | 17,174 | 172,599 | ||||||
NexPoint Residential Trust, Inc. | 3,787 | 94,258 | ||||||
NorthStar Realty Europe Corp. | 12,723 | 161,328 | ||||||
Omega Healthcare Investors, Inc. | 129,688 | 4,282,298 | ||||||
One Liberty Properties, Inc. | 3,636 | 85,191 | ||||||
Outfront Media, Inc. | 3,463 | 80,065 | ||||||
Paramount Group, Inc. | 5,510 | 88,160 | ||||||
Park Hotels & Resorts, Inc. | 3,567 | 96,166 | ||||||
Parkway, Inc. | 9,517 | 217,844 | ||||||
Pebblebrook Hotel Trust | 331,945 | 10,701,907 | ||||||
Pennsylvania Real Estate Investment Trust | 15,752 | 178,313 | ||||||
Physicians Realty Trust | 427,734 | 8,614,563 | ||||||
Piedmont Office Realty Trust, Inc. | 149,311 | 3,147,476 | ||||||
Preferred Apartment Communities, Inc. | 7,283 | 114,707 | ||||||
Prologis, Inc. | 14,693 | 861,598 | ||||||
QTS Realty Trust, Inc. | 147,850 | 7,736,990 | ||||||
Quality Care Properties, Inc. (1) | 21,372 | 391,321 | ||||||
RAIT Financial Trust | 12,998 | 28,466 | ||||||
Ramco-Gershenson Properties Trust | 17,372 | 224,099 | ||||||
Rayonier, Inc. | 3,724 | 107,139 | ||||||
Re/Max Holdings, Inc. | 3,962 | 222,070 | ||||||
Realogy Holdings Corp. | 3,766 | 122,207 | ||||||
Realty Income Corp. | 7,641 | 421,630 | ||||||
Regency Centers Corp. | 150,303 | 9,414,980 | ||||||
Retail Opportunity Investments Corp. | 22,071 | 423,542 | ||||||
Retail Properties of America, Inc. | 6,561 | 80,110 | ||||||
Rexford Industrial Realty, Inc. | 9,026 | 247,673 | ||||||
RLJ Lodging Trust | 27,782 | 552,028 | ||||||
Sabra Health Care REIT, Inc. | 139,897 | 3,371,518 | ||||||
Saul Centers, Inc. | 406 | 23,540 | ||||||
Select Income REIT | 155,302 | 3,731,907 | ||||||
Senior Housing Properties Trust | 233,710 | 4,777,032 | ||||||
Seritage Growth Properties | 5,722 | 240,038 | ||||||
| Shares | Value | |||||||
SL Green Realty Corp. | 148,534 | 15,714,897 | ||||||
Spirit Realty Capital, Inc. | 13,400 | 99,294 | ||||||
STAG Industrial, Inc. | 20,194 | 557,354 | ||||||
STORE Capital Corp. | 4,722 | 106,009 | ||||||
Stratus Properties, Inc. | 1,229 | 36,133 | ||||||
Summit Hotel Properties, Inc. | 136,387 | 2,543,618 | ||||||
Sun Communities, Inc. | 2,008 | 176,082 | ||||||
Sunstone Hotel Investors, Inc. | 49,597 | 799,504 | ||||||
Tanger Factory Outlet Centers, Inc. | 2,417 | 62,794 | ||||||
Taubman Centers, Inc. | 856 | 50,975 | ||||||
Tejon Ranch Co. (1) | 3,351 | 69,165 | ||||||
Terreno Realty Corp. | 8,176 | 275,204 | ||||||
The GEO Group, Inc. | 21,484 | 635,282 | ||||||
The Howard Hughes Corp. (1) | 113,083 | 13,891,116 | ||||||
The Macerich Co. | 3,843 | 223,125 | ||||||
The St. Joe Co. (1) | 10,712 | 200,850 | ||||||
Tier REIT, Inc. | 10,909 | 201,598 | ||||||
Transcontinental Realty Investors, Inc. (1) | 331 | 8,901 | ||||||
UDR, Inc. | 7,352 | 286,507 | ||||||
UMH Properties, Inc. | 1,353 | 23,069 | ||||||
Uniti Group, Inc. | 4,582 | 115,191 | ||||||
Urstadt Biddle Properties, Inc. | 2,833 | 56,093 | ||||||
Ventas, Inc. | 9,889 | 687,088 | ||||||
VEREIT, Inc. | 27,064 | 220,301 | ||||||
Vornado Realty Trust | 4,803 | 451,002 | ||||||
W.P. Carey, Inc. | 2,969 | 195,984 | ||||||
Washington Prime Group, Inc. | 321,118 | 2,687,758 | ||||||
Washington Real Estate Investment Trust | 11,250 | 358,875 | ||||||
Weingarten Realty Investors | 3,427 | 103,153 | ||||||
Welltower, Inc. | 10,215 | 764,593 | ||||||
Weyerhaeuser Co. | 20,690 | 693,115 | ||||||
Whitestone REIT | 8,945 | 109,576 | ||||||
Xenia Hotels & Resorts, Inc. | 161,077 | 3,120,061 | ||||||
|
| |||||||
| 255,908,068 | ||||||||
|
| |||||||
Telecommunication Services - 0.26% | ||||||||
ATN International, Inc. | 2,350 | 160,834 | ||||||
CenturyLink, Inc. | 14,973 | 357,555 | ||||||
Cincinnati Bell, Inc. (1) | 9,467 | 185,080 | ||||||
| Shares | Value | |||||||
Consolidated Communications Holdings, Inc. | 3,381 | 72,590 | ||||||
FairPoint Communications, Inc. (1) | 4,753 | 74,384 | ||||||
Frontier Communications Corp. | 265,707 | 308,220 | ||||||
General Communication, Inc. (1) | 385 | 14,106 | ||||||
Globalstar, Inc. (1) | 34,647 | 73,798 | ||||||
Hawaiian Telcom Holdco, Inc. (1) | 1,353 | 33,811 | ||||||
IDT Corp. | 1,507 | 21,656 | ||||||
Intelsat S.A. (1) | 8,549 | 26,160 | ||||||
Iridium Communications, Inc. (1) | 18,860 | 208,403 | ||||||
Level 3 Communications, Inc. (1) | 8,187 | 485,489 | ||||||
Lumos Networks Corp. (1) | 1,294 | 23,124 | ||||||
ORBCOMM, Inc. (1) | 1,432 | 16,182 | ||||||
pdvWireless, Inc. (1) | 2,095 | 48,814 | ||||||
RingCentral, Inc. (1) | 166,100 | 6,070,955 | ||||||
Spok Holdings, Inc. | 4,493 | 79,526 | ||||||
Telephone & Data Systems, Inc. | 2,868 | 79,587 | ||||||
United States Cellular Corp. (1) | 399 | 15,290 | ||||||
Windstream Holdings, Inc. | 42,823 | 166,153 | ||||||
|
| |||||||
| 8,521,717 | ||||||||
|
| |||||||
Utilities - 4.43% | ||||||||
AES Corp. | 142,905 | 1,587,675 | ||||||
ALLETE, Inc. | 11,491 | 823,675 | ||||||
Alliant Energy Corp. | 164,711 | 6,616,441 | ||||||
Ameren Corp. | 6,722 | 367,492 | ||||||
American Electric Power Co., Inc. | 150,716 | 10,470,241 | ||||||
American States Water Co. | 2,518 | 119,378 | ||||||
American Water Works Co., Inc. | 4,983 | 388,425 | ||||||
Aqua America, Inc. | 4,926 | 164,036 | ||||||
AquaVenture Holdings Ltd. (1) | 2,467 | 37,572 | ||||||
Artesian Resources Corp. | 1,710 | 64,364 | ||||||
Atlantic Power Corp. (1) | 7,467 | 17,921 | ||||||
Atlantica Yield Plc | 629,050 | 13,436,508 | ||||||
Atmos Energy Corp. | 2,855 | 236,822 | ||||||
Avangrid, Inc. | 1,609 | 71,037 | ||||||
Avista Corp. | 14,427 | 612,570 | ||||||
Black Hills Corp. | 12,010 | 810,315 | ||||||
Cadiz, Inc. (1) | 4,440 | 59,940 | ||||||
California Water Service Group | 4,089 | 150,475 | ||||||
| Shares | Value | |||||||
Calpine Corp. (1) | 9,956 | 134,705 | ||||||
CenterPoint Energy, Inc. | 11,959 | 327,437 | ||||||
Chesapeake Utilities Corp. | 3,076 | 230,546 | ||||||
CMS Energy Corp. | 7,747 | 358,299 | ||||||
Connecticut Water Services, Inc. | 2,392 | 132,780 | ||||||
Consolidated Edison, Inc. | 8,530 | 689,395 | ||||||
Consolidated Water Co., Inc. | 3,121 | 38,700 | ||||||
Delta Natural Gas Co, Inc. | 1,434 | 43,694 | ||||||
DTE Energy Co. | 4,987 | 527,575 | ||||||
Dynegy, Inc. (1) | 24,976 | 206,552 | ||||||
Edison International | 174,965 | 13,680,513 | ||||||
El Paso Electric Co. | 9,137 | 472,383 | ||||||
Entergy Corp. | 84,778 | 6,508,407 | ||||||
Eversource Energy | 8,845 | 536,980 | ||||||
Exelon Corp. | 88,500 | 3,192,195 | ||||||
FirstEnergy Corp. | 250,113 | 7,293,295 | ||||||
Genie Energy Ltd. | 2,692 | 20,513 | ||||||
Great Plains Energy, Inc. | 90,863 | 2,660,469 | ||||||
Hawaiian Electric Industries, Inc. | 2,997 | 97,043 | ||||||
IDACORP, Inc. | 11,324 | 966,503 | ||||||
MDU Resources Group, Inc. | 5,379 | 140,930 | ||||||
MGE Energy, Inc. | 71,906 | 4,627,151 | ||||||
Middlesex Water Co. | 397 | 15,721 | ||||||
National Fuel Gas Co. | 64,054 | 3,576,775 | ||||||
New Jersey Resources Corp. | 17,760 | 705,072 | ||||||
NiSource, Inc. | 8,995 | 228,113 | ||||||
Northwest Natural Gas Co. | 6,343 | 379,629 | ||||||
NorthWestern Corp. | 10,804 | 659,260 | ||||||
NRG Energy, Inc. | 6,659 | 114,668 | ||||||
NRG Yield, Inc. - Class A | 8,271 | 141,103 | ||||||
NRG Yield, Inc. - Class C | 14,103 | 248,213 | ||||||
OGE Energy Corp. | 5,526 | 192,250 | ||||||
ONE Gas, Inc. | 69,108 | 4,824,429 | ||||||
Ormat Technologies, Inc. | 4,656 | 273,214 | ||||||
Otter Tail Corp. | 8,806 | 348,718 | ||||||
Pattern Energy Group, Inc. | 12,671 | 302,077 | ||||||
PG&E Corp. | 148,569 | 9,860,525 | ||||||
Pinnacle West Capital Corp. | 95,064 | 8,095,650 | ||||||
| Shares | Value | |||||||
PNM Resources, Inc. | 17,884 | 684,063 | ||||||
Portland General Electric Co. | 247,823 | 11,323,033 | ||||||
PPL Corp. | 19,095 | 738,213 | ||||||
Public Service Enterprise Group, Inc. | 212,297 | 9,130,894 | ||||||
RGC Resources, Inc. | 700 | 19,831 | ||||||
SCANA Corp. | 100,145 | 6,710,716 | ||||||
Sempra Energy | 6,997 | 788,912 | ||||||
SJW Group | 3,579 | 176,015 | ||||||
South Jersey Industries, Inc. | 17,891 | 611,335 | ||||||
Southwest Gas Holdings, Inc. | 9,552 | 697,869 | ||||||
Spark Energy, Inc. | 360 | 6,768 | ||||||
Spire, Inc. | 10,615 | 740,396 | ||||||
TerraForm Global, Inc. (1) | 20,295 | 102,490 | ||||||
TerraForm Power, Inc. (1) | 18,183 | 218,196 | ||||||
UGI Corp. | 4,788 | 231,787 | ||||||
Unitil Corp. | 3,098 | 149,664 | ||||||
Vectren Corp. | 2,303 | 134,587 | ||||||
Vistra Energy Corp. | 6,684 | 112,224 | ||||||
WEC Energy Group, Inc. | 8,812 | 540,881 | ||||||
Westar Energy, Inc. | 3,928 | 208,263 | ||||||
WGL Holdings, Inc. | 11,461 | 956,191 | ||||||
Xcel Energy, Inc. | 14,161 | 649,707 | ||||||
York Water Co. | 186 | 6,482 | ||||||
|
| |||||||
| 143,824,886 | ||||||||
|
| |||||||
Total Common Stocks (Cost $2,802,044,431) | $ | 3,139,907,505 | ||||||
|
| |||||||
SHORT-TERM INVESTMENTS - 3.29% | ||||||||
Money Market Funds - 3.29% | ||||||||
Goldman Sachs Financial Square Government Fund - Class I, 0.86% (2) | 53,371,008 | $ | 53,371,008 | |||||
JPMorgan U.S. Government Money Market Fund - Class I, 0.85% (2) | 53,371,008 | 53,371,008 | ||||||
|
| |||||||
Total Short-Term Investments (Cost $106,742,016) | $ | 106,742,016 | ||||||
|
| |||||||
TOTAL INVESTMENTS IN SECURITIES - 100.05% | ||||||||
(Cost $2,908,786,447) | 3,246,649,521 | |||||||
LIABILITIES IN EXCESS OF OTHER ASSETS - (0.05)% | (1,484,923 | ) | ||||||
|
| |||||||
TOTAL NET ASSETS - 100.00% | $ | 3,245,164,598 | ||||||
|
| |||||||
Percentages are stated as a percent of net assets.
ADR American Depositary Receipt
| (1) | Non-income producing security. |
| (2) | Represents annualized seven-day yield as of the close of the reporting period. |
| (3) | Security is categorized as Level 3 per the Trust’s fair value hierarchy. These securities represent $34,135 or 0.00% of the Fund’s net assets. |
| (4) | Security is treated as illiquid by the Fund. The value of this security totals $34,135, which represents 0.00% of the total net assets. |
The sector classifications listed above are in accordance with Global Industry Classification Standards (GICS), which was developed by and/or is the exclusive property of MSCI, Inc. and Standard & Poor’s Financial Services LLC (“S&P”).
Bridge Builder International Equity Fund
Schedule of Investments
June 30, 2017
| Shares | Value | |||||||
Common Stocks - 94.79% | ||||||||
Australia - 2.36% | ||||||||
AGL Energy | 12,509 | $ | 245,132 | |||||
Alumina Ltd. | 46,991 | 69,213 | ||||||
Amcor Ltd. | 22,185 | 276,374 | ||||||
AMP Ltd. | 54,948 | 219,255 | ||||||
APA Group | 19,535 | 137,648 | ||||||
Aristocrat Leisure Ltd. | 9,696 | 168,099 | ||||||
ASX Ltd. | 3,538 | 145,769 | ||||||
Aurizon Holdings Ltd. | 40,473 | 166,705 | ||||||
AusNet Services | 37,695 | 50,260 | ||||||
Australia & New Zealand Banking Group Ltd. | 54,669 | 1,206,634 | ||||||
Bank of Queensland Ltd. | 7,045 | 61,983 | ||||||
Bendigo & Adelaide Bank Ltd. | 8,308 | 70,722 | ||||||
BHP Billiton Ltd. | 60,295 | 1,074,691 | ||||||
BHP Billiton Plc | 39,372 | 603,210 | ||||||
BlueScope Steel Ltd. | 10,013 | 101,372 | ||||||
Boral Ltd. | 20,340 | 108,600 | ||||||
Brambles Ltd. | 1,515,850 | 11,334,876 | ||||||
Caltex Australia Ltd. | 4,915 | 119,352 | ||||||
Challenger Ltd. | 13,087 | 134,213 | ||||||
CIMIC Group Ltd. | 1,705 | 50,873 | ||||||
Coca-Cola Amatil Ltd. | 10,790 | 76,567 | ||||||
Cochlear Ltd. | 173,632 | 20,738,092 | ||||||
Commonwealth Bank of Australia | 31,793 | 2,022,548 | ||||||
Computershare Ltd. | 7,806 | 84,833 | ||||||
Crown Resorts Ltd. | 7,006 | 66,123 | ||||||
CSL Ltd. | 347,295 | 36,858,246 | ||||||
Dexus Property Group | 18,322 | 133,395 | ||||||
Domino’s Pizza Enterprises Ltd. | 1,093 | 43,737 | ||||||
Flight Centre Travel Group Ltd. | 961 | 28,287 | ||||||
Fortescue Metals Group Ltd. | 28,165 | 112,747 | ||||||
| Shares | Value | |||||||
Goodman Group | 31,397 | 189,756 | ||||||
GPT Group | 32,060 | 117,917 | ||||||
Harvey Norman Holdings Ltd. | 10,932 | 32,102 | ||||||
Healthscope Ltd. | 30,584 | 51,977 | ||||||
Incitec Pivot Ltd. | 29,503 | 77,385 | ||||||
Insurance Australia Group Ltd. | 43,754 | 228,030 | ||||||
LendLease Group | 10,452 | 133,771 | ||||||
Macquarie Group Ltd. | 5,899 | 401,154 | ||||||
Medibank Private Ltd. | 49,995 | 107,645 | ||||||
Mesoblast Ltd. (1) | 847,391 | 1,354,652 | ||||||
Mirvac Group | 64,639 | 105,700 | ||||||
National Australia Bank Ltd. | 49,851 | 1,134,031 | ||||||
Newcrest Mining Ltd. | 13,735 | 213,163 | ||||||
Oil Search Ltd. | 24,276 | 127,123 | ||||||
Orica Ltd. | 6,581 | 104,578 | ||||||
Origin Energy Ltd. (1) | 36,993 | 195,053 | ||||||
Qantas Airways Ltd. | 10,526 | 46,267 | ||||||
QBE Insurance Group Ltd. | 1,431,312 | 12,991,247 | ||||||
Ramsay Health Care Ltd. | 2,606 | 147,452 | ||||||
REA Group Ltd. | 980 | 50,000 | ||||||
Santos Ltd. (1) | 31,810 | 73,985 | ||||||
Scentre Group | 98,202 | 305,319 | ||||||
Seek Ltd. | 851,707 | 11,068,337 | ||||||
Sonic Healthcare Ltd. | 7,087 | 131,951 | ||||||
South32 Ltd. | 99,337 | 204,585 | ||||||
Stockland | 45,159 | 151,865 | ||||||
Suncorp Group Ltd. | 24,736 | 281,742 | ||||||
Sydney Airport | 19,432 | 105,852 | ||||||
Tabcorp Holdings Ltd. | 14,556 | 48,886 | ||||||
Tatts Group Ltd. | 26,570 | 85,355 | ||||||
Telstra Corp. Ltd. | 77,844 | 257,206 | ||||||
TPG Telecom Ltd. | 7,785 | 34,106 | ||||||
Transurban Group | 39,675 | 361,336 | ||||||
Treasury Wine Estates Ltd. | 1,104,934 | 11,173,007 | ||||||
Vicinity Centres | 59,410 | 117,229 | ||||||
Wesfarmers Ltd. | 20,489 | 631,777 | ||||||
Westfield Corp. | 34,741 | 214,272 | ||||||
| Shares | Value | |||||||
Westpac Banking Corp. | 62,526 | 1,463,977 | ||||||
Woodside Petroleum Ltd. | 13,682 | 313,851 | ||||||
Woolworths Ltd. | 22,750 | 446,559 | ||||||
|
| |||||||
| 121,789,756 | ||||||||
|
| |||||||
Austria - 0.01% | ||||||||
Andritz AG | 1,322 | 79,760 | ||||||
Erste Group Bank AG | 5,595 | 214,316 | ||||||
OMV AG | 2,780 | 144,401 | ||||||
Raiffeisen Bank International AG (1) | 2,578 | 65,073 | ||||||
voestalpine AG | 2,104 | 98,067 | ||||||
|
| |||||||
| 601,617 | ||||||||
|
| |||||||
Belgium - 0.84% | ||||||||
Ageas | 3,409 | 137,285 | ||||||
Anheuser-Busch InBev SA/NV | 234,036 | 25,848,984 | ||||||
Colruyt SA | 1,005 | 52,932 | ||||||
Groupe Bruxelles Lambert SA | 1,411 | 135,813 | ||||||
KBC Groep NV | 53,977 | 4,092,493 | ||||||
Proximus | 2,680 | 93,799 | ||||||
Solvay SA | 93,055 | 12,489,049 | ||||||
Telenet Group Holding NV (1) | 1,090 | 68,665 | ||||||
UCB SA | 2,256 | 155,160 | ||||||
Umicore SA | 1,673 | 116,376 | ||||||
|
| |||||||
| 43,190,556 | ||||||||
|
| |||||||
Bermuda - 0.10% | ||||||||
XL Group Ltd. | 116,869 | 5,118,862 | ||||||
|
| |||||||
Brazil - 1.00% | ||||||||
Ambev SA - ADR | 3,408,205 | 18,711,045 | ||||||
Kroton Educacional SA | 1,746,024 | 7,821,243 | ||||||
Raia Drogasil SA | 1,175,200 | 25,008,784 | ||||||
|
| |||||||
| 51,541,072 | ||||||||
|
| |||||||
Canada - 1.09% | ||||||||
Cameco Corp. | 909,377 | 8,275,331 | ||||||
Canadian Pacific Railway Ltd. | 175,405 | 28,206,878 | ||||||
First Quantum Minerals Ltd. | 494,215 | 4,180,705 | ||||||
Lululemon Athletica, Inc. (1) | 152,215 | 9,082,669 | ||||||
Lundin Mining Corp. (1) | 721,609 | 4,101,063 | ||||||
Shopify, Inc. (1) | 28,104 | 2,442,238 | ||||||
| Shares | Value | |||||||
|
| |||||||
| 56,288,884 | ||||||||
|
| |||||||
Chile - 0.18% | ||||||||
Antofagasta Plc | 902,859 | 9,419,559 | ||||||
|
| |||||||
China - 4.59% | ||||||||
Alibaba Group Holding Ltd. - ADR (1) | 194,724 | 27,436,611 | ||||||
Baidu, Inc. - ADR (1) | 244,456 | 43,723,400 | ||||||
China Shenhua Energy Co. Ltd. | 460,000 | 1,023,442 | ||||||
Ctrip.com International Ltd. - ADR (1) | 712,295 | 38,364,209 | ||||||
JD.com, Inc. - ADR (1) | 275,536 | 10,806,522 | ||||||
Lenovo Group Ltd. | 43,154,000 | 27,235,867 | ||||||
NetEase, Inc. - ADR | 27,865 | 8,377,055 | ||||||
Shanghai Fosun Pharmaceutical Group Ltd. | 4,614,000 | 17,884,772 | ||||||
Tencent Holdings Ltd. | 1,354,116 | 48,578,858 | ||||||
Tsingtao Brewery Co. Ltd. | 2,999,000 | 13,270,997 | ||||||
Yangzijiang Shipbuilding Holdings Ltd. | 40,200 | 34,738 | ||||||
|
| |||||||
| 236,736,471 | ||||||||
|
| |||||||
Denmark - 2.29% | ||||||||
A.P. Moller-Maersk A/S - Class A | 66 | 125,934 | ||||||
A.P. Moller-Maersk A/S - Class B | 122 | 245,648 | ||||||
Carlsberg A/S | 154,341 | 16,493,718 | ||||||
CHR Hansen Holding A/S | 267,966 | 19,488,306 | ||||||
Coloplast A/S | 266,043 | 22,237,302 | ||||||
Danske Bank A/S | 141,175 | 5,431,438 | ||||||
DONG Energy A/S (2) | 2,895 | 130,669 | ||||||
DSV A/S | 3,536 | 217,196 | ||||||
Genmab A/S (1) | 1,064 | 226,866 | ||||||
H Lundbeck A/S | 1,209 | 67,870 | ||||||
ISS A/S | 3,067 | 120,475 | ||||||
Novo Nordisk A/S - Class B | 476,428 | 20,470,817 | ||||||
Novozymes A/S | 735,699 | 32,186,187 | ||||||
Pandora A/S | 1,975 | 184,316 | ||||||
TDC A/S | 14,966 | 87,033 | ||||||
Tryg A/S | 2,538 | 55,504 | ||||||
Vestas Wind Systems A/S | 3,993 | 368,823 | ||||||
William Demant Holding A/S (1) | 2,001 | 51,774 | ||||||
|
| |||||||
| 118,189,876 | ||||||||
|
| |||||||
Finland - 0.85% | ||||||||
| Shares | Value | |||||||
Elisa OYJ | 2,861 | 110,985 | ||||||
Fortum OYJ | 8,566 | 134,432 | ||||||
Kone OYJ | 248,633 | 12,649,258 | ||||||
Metso OYJ | 2,451 | 85,045 | ||||||
Neste OYJ | 2,566 | 101,257 | ||||||
Nokia OYJ | 4,810,990 | 29,499,742 | ||||||
Nokian Renkaat OYJ | 2,021 | 83,656 | ||||||
Orion OYJ - Class B | 1,813 | 115,816 | ||||||
Sampo OYJ | 8,224 | 421,938 | ||||||
Stora Enso OYJ | 9,429 | 121,842 | ||||||
UPM-Kymmene OYJ | 9,821 | 280,044 | ||||||
Wartsila OYJ Abp | 2,732 | 161,564 | ||||||
|
| |||||||
| 43,765,579 | ||||||||
|
| |||||||
France - 7.10% | ||||||||
Accor SA | 353,556 | 16,585,066 | ||||||
Aeroports de Paris | 507 | 81,725 | ||||||
Air Liquide SA | 7,310 | 903,489 | ||||||
Airbus SE | 10,557 | 871,224 | ||||||
Alstom | 2,772 | 96,814 | ||||||
Arkema SA | 1,197 | 127,830 | ||||||
Atos SE | 1,752 | 245,825 | ||||||
AXA SA | 35,967 | 984,899 | ||||||
BNP Paribas SA | 414,444 | 29,837,017 | ||||||
Bollore SA | 20,148 | 91,609 | ||||||
Bouygues SA | 233,687 | 9,845,310 | ||||||
Bureau Veritas SA | 4,753 | 105,210 | ||||||
Capgemini SE | 2,914 | 301,024 | ||||||
Carrefour SA | 10,649 | 269,228 | ||||||
Casino Guichard Perrachon SA | 910 | 53,894 | ||||||
Christian Dior SE (1) | 231 | 66,052 | ||||||
Cie de Saint-Gobain | 379,195 | 20,250,970 | ||||||
CNP Assurances | 3,048 | 68,416 | ||||||
Credit Agricole SA | 458,940 | 7,392,784 | ||||||
Danone SA | 162,666 | 12,209,345 | ||||||
Dassault Aviation SA | 47 | 65,683 | ||||||
Dassault Systemes | 2,354 | 211,133 | ||||||
Edenred | 4,113 | 107,288 | ||||||
| Shares | Value | |||||||
Eiffage SA | 1,294 | 117,548 | ||||||
Electricite de France SA | 11,206 | 121,417 | ||||||
Engie | 31,819 | 480,269 | ||||||
Essilor International SA | 146,781 | 18,672,451 | ||||||
Eurazeo SA | 768 | 57,658 | ||||||
Eutelsat Communications SA | 3,014 | 76,902 | ||||||
Faurecia | 94,600 | 4,797,294 | ||||||
Fonciere Des Regions | 628 | 58,253 | ||||||
Gecina SA | 712 | 111,755 | ||||||
Groupe Eurotunnel SE | 8,374 | 89,347 | ||||||
Hermes International | 35,810 | 17,689,315 | ||||||
ICADE | 667 | 55,955 | ||||||
Iliad SA | 37,095 | 8,766,615 | ||||||
Imerys SA | 784 | 68,243 | ||||||
Ingenico Group | 1,131 | 102,568 | ||||||
Ipsen SA | 658 | 90,039 | ||||||
JCDecaux SA | 1,289 | 42,262 | ||||||
Kering | 1,373 | 467,524 | ||||||
Klepierre | 3,849 | 157,755 | ||||||
Lagardere SCA | 2,245 | 70,839 | ||||||
Legrand SA | 147,962 | 10,339,820 | ||||||
L’Oreal SA | 4,564 | 951,662 | ||||||
LVMH Moet Hennessy Louis Vuitton SE | 103,005 | 25,757,011 | ||||||
Michelin | 3,151 | 419,380 | ||||||
Natixis SA | 17,943 | 120,446 | ||||||
Orange SA | 36,811 | 585,845 | ||||||
Pernod Ricard SA | 3,847 | 515,142 | ||||||
Peugeot SA | 8,519 | 169,781 | ||||||
Publicis Groupe SA | 169,280 | 12,616,981 | ||||||
Remy Cointreau SA | 394 | 45,926 | ||||||
Renault SA | 3,303 | 298,841 | ||||||
Rexel SA | 5,295 | 86,533 | ||||||
Safran SA | 149,464 | 13,706,819 | ||||||
Sanofi SA | 776,755 | 74,428,797 | ||||||
Schneider Electric SE | 172,060 | 13,222,750 | ||||||
SCOR SE | 3,035 | 120,574 | ||||||
SEB SA | 401 | 71,975 | ||||||
| Shares | Value | |||||||
Societe BIC SA | 501 | 59,490 | ||||||
Societe Generale SA | 14,257 | 768,820 | ||||||
Sodexo SA | 1,684 | 217,645 | ||||||
Suez Environnement Co. | 6,435 | 119,154 | ||||||
Thales SA | 1,906 | 205,132 | ||||||
TOTAL SA | 890,819 | 44,226,597 | ||||||
Unibail-Rodamco SE | 1,818 | 458,095 | ||||||
Valeo SA | 4,404 | 296,297 | ||||||
Vallourec SA (1) | 822,800 | 5,007,640 | ||||||
Veolia Environnement SA | 9,604 | 203,188 | ||||||
Vinci SA | 92,596 | 7,898,593 | ||||||
Vivendi SA | 19,202 | 427,581 | ||||||
Wendel SA | 654 | 96,733 | ||||||
Zodiac Aerospace | 4,488 | 121,932 | ||||||
|
| |||||||
| 366,431,024 | ||||||||
|
| |||||||
Germany - 5.90% | ||||||||
Adidas AG | 175,001 | 33,556,303 | ||||||
Allianz SE | 110,696 | 21,845,031 | ||||||
Axel Springer SE | 1,088 | 65,444 | ||||||
BASF SE | 17,121 | 1,588,988 | ||||||
Bayer AG | 272,141 | 35,272,320 | ||||||
Bayer Motoren Werke AG | 6,292 | 585,203 | ||||||
Beiersdorf AG | 51,202 | 5,385,519 | ||||||
Brenntag AG | 263,565 | 15,285,256 | ||||||
Commerzbank AG (1) | 2,676,873 | 31,964,427 | ||||||
Continental AG | 36,015 | 7,791,139 | ||||||
Covestro AG (2) | 1,984 | 143,828 | ||||||
Daimler AG | 308,748 | 22,393,127 | ||||||
Deutsche Bank AG | 38,387 | 682,514 | ||||||
Deutsche Boerse AG | 78,298 | 8,270,644 | ||||||
Deutsche Lufthansa AG | 4,634 | 105,607 | ||||||
Deutsche Post AG | 18,677 | 701,103 | ||||||
Deutsche Telekom AG | 811,041 | 14,619,024 | ||||||
Deutsche Wohnen AG | 6,593 | 252,627 | ||||||
E.ON SE | 1,620,213 | 15,294,791 | ||||||
Evonik Industries AG | 2,985 | 95,537 | ||||||
Fraport AG Frankfurt Airport Services Worldwide | 728 | 64,423 | ||||||
| Shares | Value | |||||||
Fresenius Medical Care AG & Co. KGaA | 162,847 | 15,714,228 | ||||||
Fresenius SE & Co. KGaA | 7,792 | 668,968 | ||||||
GEA Group AG | 3,223 | 132,340 | ||||||
Hannover Rueck SE | 1,158 | 139,092 | ||||||
HeidelbergCement AG | 2,750 | 266,582 | ||||||
Henkel AG & Co. KGaA | 1,936 | 234,516 | ||||||
HOCHTIEF AG | 318 | 58,378 | ||||||
HUGO BOSS AG | 1,108 | 77,674 | ||||||
Infineon Technologies AG | 498,458 | 10,587,556 | ||||||
Innogy SE (2) | 2,727 | 107,325 | ||||||
K&S AG | 3,907 | 100,351 | ||||||
LANXESS AG | 1,626 | 123,316 | ||||||
Linde AG | 3,376 | 642,634 | ||||||
MAN SE | 739 | 79,254 | ||||||
Merck KGaA | 2,403 | 290,761 | ||||||
METRO AG | 3,092 | 104,455 | ||||||
Muenchener Rueckversicherungs-Gesellschaft AG in Muenchen | 2,915 | 589,860 | ||||||
OSRAM Licht AG | 1,476 | 117,818 | ||||||
ProSiebenSat.1 Media SE | 4,375 | 183,529 | ||||||
RWE AG (1) | 9,588 | 191,528 | ||||||
SAP SE | 257,199 | 26,921,424 | ||||||
Siemens AG | 85,522 | 11,763,914 | ||||||
Symrise AG | 2,301 | 163,257 | ||||||
Telefonica Deutschland Holding AG | 13,563 | 67,829 | ||||||
ThyssenKrupp AG | 6,736 | 191,976 | ||||||
TUI AG | 7,700 | 112,250 | ||||||
United Internet AG | 2,231 | 122,781 | ||||||
Volkswagen AG | 683 | 106,081 | ||||||
Vonovia SE | 8,810 | 350,517 | ||||||
Zalando SE (1)(2) | 411,057 | 18,796,449 | ||||||
|
| |||||||
| 304,969,498 | ||||||||
|
| |||||||
Hong Kong - 3.56% | ||||||||
1st Pacific Co. | 36,000 | 26,549 | ||||||
AIA Group Ltd. | 4,031,600 | 29,496,641 | ||||||
ASM Pacific Technology Ltd. | 4,800 | 64,765 | ||||||
Bank Of East Asia Ltd. | 21,400 | 91,977 | ||||||
BOC Hong Kong Holdings Ltd. | 69,000 | 330,214 | ||||||
| Shares | Value | |||||||
Cheung Kong Property Holdings Ltd. | 49,000 | 383,439 | ||||||
China Mobile Ltd. | 2,489,500 | 26,393,189 | ||||||
CK Hutchison Holdings Ltd. | 2,647,500 | 33,224,922 | ||||||
CK Infrastructure Holdings Ltd. | 12,000 | 100,803 | ||||||
CLP Holdings Ltd. | 32,000 | 338,379 | ||||||
Galaxy Entertainment Group Ltd. | 6,345,000 | 38,509,739 | ||||||
Hang Lung Group Ltd. | 16,000 | 66,202 | ||||||
Hang Lung Properties Ltd. | 37,000 | 92,468 | ||||||
Hang Seng Bank Ltd. | 14,000 | 292,883 | ||||||
Henderson Land Development Co. Ltd. | 22,800 | 127,131 | ||||||
HK Electric Investments & HK Electric Investments Ltd. (2) | 53,500 | 49,189 | ||||||
HKT Trust & HKT Ltd. | 66,000 | 86,563 | ||||||
Hong Kong & China Gas Co. Ltd. | 153,010 | 287,763 | ||||||
Hong Kong Exchanges & Clearing Ltd. | 20,599 | 532,163 | ||||||
Hongkong Land Holdings Ltd. | 20,600 | 151,600 | ||||||
Hysan Development Co. Ltd. | 12,000 | 57,269 | ||||||
Jardine Matheson Holdings Ltd. | 264,400 | 16,973,417 | ||||||
Jardine Strategic Holdings Ltd. | 3,900 | 162,581 | ||||||
Kerry Properties Ltd. | 11,000 | 37,349 | ||||||
Li & Fung Ltd. | 106,000 | 38,552 | ||||||
Link Real Estate Investment Trust | 40,500 | 308,085 | ||||||
Melco Crown Entertainment Ltd. - ADR | 4,377 | 98,264 | ||||||
MTR Corp. Ltd. | 26,250 | 147,717 | ||||||
New World Development Co. Ltd. | 102,413 | 129,818 | ||||||
NWS Holdings Ltd. | 24,613 | 48,406 | ||||||
PAX Global Technology Ltd. | 5,094,000 | 3,270,222 | ||||||
PCCW Ltd. | 68,000 | 38,645 | ||||||
Power Assets Holdings Ltd. | 26,500 | 233,915 | ||||||
Shangri-La Asia Ltd. | 22,000 | 37,312 | ||||||
Sino Land Co. Ltd. | 62,490 | 102,383 | ||||||
SJM Holdings Ltd. | 45,000 | 47,415 | ||||||
Sun Hung Kai Properties Ltd. | 27,000 | 396,635 | ||||||
Swire Pacific Ltd. - Class A | 2,749,000 | 26,834,796 | ||||||
Swire Properties Ltd. | 22,000 | 72,521 | ||||||
Techtronic Industries Co. Ltd. | 24,000 | 110,280 | ||||||
WH Group Ltd. (2) | 3,607,000 | 3,642,246 | ||||||
Wharf Holdings Ltd. | 23,000 | 190,318 | ||||||
| Shares | Value | |||||||
Wheelock & Co. Ltd. | 14,000 | 105,596 | ||||||
Yue Yuen Industrial Holdings Ltd. | 12,000 | 49,770 | ||||||
|
| |||||||
| 183,780,091 | ||||||||
|
| |||||||
India - 1.00% | ||||||||
Asian Paints Ltd. | 492,755 | 8,398,196 | ||||||
HDFC Bank Ltd. - ADR | 294,048 | 25,573,355 | ||||||
Mahindra & Mahindra Ltd. - GDR | 588,497 | 12,587,571 | ||||||
MakeMyTrip Ltd. (1) | 146,500 | 4,915,075 | ||||||
|
| |||||||
| 51,474,197 | ||||||||
|
| |||||||
Indonesia - 0.45% | ||||||||
Bank Mandiri Persero Tbk PT | 24,332,300 | 23,323,019 | ||||||
|
| |||||||
Ireland - 1.67% | ||||||||
Accenture Plc | 219,664 | 27,168,043 | ||||||
AerCap Holdings NV (1) | 2,888 | 134,090 | ||||||
Bank Of Ireland (1) | 497,720 | 130,751 | ||||||
CRH Plc | 15,784 | 559,439 | ||||||
DCC Plc | 1,790 | 163,014 | ||||||
ICON Plc (1) | 177,114 | 17,319,978 | ||||||
James Hardie Industries Plc | 8,244 | 129,924 | ||||||
Kerry Group Plc | 2,995 | 258,023 | ||||||
Medtronic Plc | 217,160 | 19,272,950 | ||||||
Paddy Power Plc | 1,448 | 154,509 | ||||||
Perrigo Co. Plc | 206,705 | 15,610,362 | ||||||
Ryanair Holdings Plc - ADR (1) | 51,908 | 5,585,820 | ||||||
|
| |||||||
| 86,486,903 | ||||||||
|
| |||||||
Israel - 0.03% | ||||||||
Azrieli Group | 857 | 47,606 | ||||||
Bank Hapoalim BM | 20,458 | 137,952 | ||||||
Bank Leumi Le-Israel BM | 25,304 | 122,940 | ||||||
Bezeq The Israeli telecommunication Corp. Ltd. | 41,995 | 69,661 | ||||||
Check Point Software Technologies Ltd. (1) | 2,422 | 264,192 | ||||||
Elbit Systems Ltd. | 409 | 50,452 | ||||||
Frutarom Industries Ltd. | 643 | 44,890 | ||||||
Israel Chemicals Ltd. | 10,140 | 47,833 | ||||||
Mizrahi Tefahot Bank Ltd. | 2,939 | 53,437 | ||||||
Mobileye NV (1) | 3,718 | 233,490 | ||||||
NICE-Systems Ltd. | 1,055 | 83,119 | ||||||
| Shares | Value | |||||||
Taro Pharmaceutical Industries Ltd. (1) | 221 | 24,765 | ||||||
Teva Pharmaceutical Industries Ltd. - ADR | 16,773 | 557,199 | ||||||
|
| |||||||
| 1,737,536 | ||||||||
|
| |||||||
Italy - 1.92% | ||||||||
Assicurazioni Generali SpA | 23,019 | 379,956 | ||||||
Atlantia SpA | 8,591 | 241,660 | ||||||
Enel SpA | 6,515,683 | 34,946,919 | ||||||
Eni SpA | 2,458,652 | 36,948,392 | ||||||
Ferrari NV | 2,229 | 191,808 | ||||||
Intesa Sanpaolo SpA | 233,837 | 743,793 | ||||||
Intesa Sanpaolo SpA - Savings Share | 19,810 | 58,936 | ||||||
Leonardo SpA | 6,967 | 115,999 | ||||||
Luxottica Group SpA | 256,816 | 14,948,784 | ||||||
Mediobanca SpA | 9,926 | 98,199 | ||||||
Poste Italiane SpA (2) | 10,646 | 73,000 | ||||||
Prysmian SpA | 3,792 | 111,840 | ||||||
Recordati SpA | 1,828 | 74,129 | ||||||
Saipem SpA (1) | 11,480 | 42,513 | ||||||
Snam SpA | 47,785 | 208,542 | ||||||
Telecom Italia SpA (1) | 4,812,044 | 4,451,979 | ||||||
Telecom Italia SpA - Savings Share | 112,690 | 83,394 | ||||||
Terna Rete Elettrica Nazionale SpA | 27,517 | 148,623 | ||||||
UniCredit SpA (1) | 270,757 | 5,071,629 | ||||||
UnipolSai Assicurazioni SpA | 22,412 | 49,169 | ||||||
|
| |||||||
| 98,989,264 | ||||||||
|
| |||||||
Japan - 16.96% | ||||||||
ABC-Mart, Inc. | 700 | 41,253 | ||||||
Acom Co. Ltd. | 7,700 | 35,245 | ||||||
Aeon Co. Ltd. | 10,800 | 164,264 | ||||||
Aeon Financial Service Co. Ltd. | 2,400 | 50,933 | ||||||
Aeon Mall Co. Ltd. | 1,800 | 35,563 | ||||||
Air Water, Inc. | 2,500 | 46,139 | ||||||
Aisin Seiki Co. | 3,100 | 159,361 | ||||||
Ajinomoto Co., Inc. | 9,565 | 206,835 | ||||||
Alfresa Holdings Corp. | 3,300 | 63,799 | ||||||
Alps Electric Co. | 3,500 | 101,669 | ||||||
Amada Holdings Co. | 6,000 | 69,598 | ||||||
| Shares | Value | |||||||
ANA Holdings, Inc. | 22,000 | 76,604 | ||||||
Aozora Bank | 24,000 | 91,629 | ||||||
Asahi Glass Co. Ltd. | 4,000 | 168,931 | ||||||
Asahi Group Holdings Ltd. | 7,400 | 278,686 | ||||||
Asahi Kasei Corp. | 23,000 | 248,131 | ||||||
Asics Corp. | 3,000 | 55,754 | ||||||
Astellas Pharma, Inc. | 39,000 | 478,011 | ||||||
Bandai Namco Holdings | 3,400 | 116,169 | ||||||
Bank of Kyoto Ltd. | 5,000 | 47,380 | ||||||
Benesse Holdings, Inc. | 1,300 | 49,145 | ||||||
Bridgestone Corp. | 11,900 | 514,456 | ||||||
Brother Industries Ltd. | 4,300 | 99,601 | ||||||
Calbee, Inc. | 1,400 | 55,066 | ||||||
Canon, Inc. | 593,400 | 20,184,689 | ||||||
Casio Computer Co. Ltd. | 3,400 | 52,401 | ||||||
Central Japan Railway Co. | 2,700 | 440,955 | ||||||
Chiba Bank Ltd. | 14,000 | 101,884 | ||||||
Chubu Electric Power Co., Inc. | 11,800 | 156,924 | ||||||
Chugai Pharmaceutical Co. Ltd. | 4,200 | 157,357 | ||||||
Chugoku Bank Ltd. | 2,800 | 42,038 | ||||||
Chugoku Electric Power Co., Inc. | 4,900 | 54,103 | ||||||
Coca-Cola Bottlers Japan, Inc. | 2,200 | 63,702 | ||||||
Concordia Financial Group Ltd. | 23,800 | 120,628 | ||||||
Credit Saison Co. Ltd. | 2,400 | 46,994 | ||||||
CYBERDYNE, Inc. | 1,700 | 22,653 | ||||||
Dai Nippon Printing Co. Ltd. | 11,000 | 122,539 | ||||||
Daicel Corp. | 4,800 | 59,994 | ||||||
Dai-ichi Life Holdings, Inc. | 298,700 | 5,421,828 | ||||||
Daiichi Sankyo Co. Ltd. | 10,200 | 240,750 | ||||||
Daikin Industries Ltd. | 4,600 | 471,923 | ||||||
Daito Trust Construction Co. Ltd. | 1,300 | 202,534 | ||||||
Daiwa House Industry Co. Ltd. | 11,000 | 376,481 | ||||||
Daiwa House REIT Investment Corp. | 26 | 61,714 | ||||||
Daiwa Securities Group, Inc. | 32,000 | 190,551 | ||||||
DeNA Co. Ltd. | 1,900 | 42,703 | ||||||
Denso Corp. | 192,900 | 8,186,317 | ||||||
Dentsu, Inc. | 4,000 | 191,892 | ||||||
| Shares | Value | |||||||
Disco Corp. | 500 | 80,196 | ||||||
Don Quijote Holdings Co. Ltd. | 2,000 | 75,990 | ||||||
East Japan Railway Co. | 384,800 | 36,862,389 | ||||||
Eisai Co. Ltd. | 5,000 | 276,638 | ||||||
Electric Power Development Co. Ltd. | 2,800 | 69,351 | ||||||
FamilyMart UNY Holdings Co. Ltd. | 1,450 | 83,036 | ||||||
FANUC Corp. | 3,600 | 696,765 | ||||||
Fast Retailing Co. Ltd. | 1,000 | 334,425 | ||||||
Fuji Electric Co. Ltd. | 9,000 | 47,603 | ||||||
FUJIFILM Holdings Corp. | 7,500 | 270,431 | ||||||
Fujitsu Ltd. | 1,818,000 | 13,446,413 | ||||||
Fukuoka Financial Group, Inc. | 15,000 | 71,568 | ||||||
Hachijuni Bank Ltd. | 7,700 | 49,061 | ||||||
Hakuhodo DY Holdings, Inc. | 4,100 | 54,603 | ||||||
Hamamatsu Photonics KK | 2,400 | 73,961 | ||||||
Hankyu Hanshin Holdings, Inc. | 4,500 | 162,114 | ||||||
Hikari Tsushin, Inc. | 300 | 31,607 | ||||||
Hino Motors Ltd. | 5,355 | 59,792 | ||||||
Hirose Electric Co. Ltd. | 600 | 85,863 | ||||||
Hiroshima Bank Ltd. | 8,000 | 35,611 | ||||||
Hisamitsu Pharmaceutical Co., Inc. | 1,000 | 47,944 | ||||||
Hitachi Chemical Co. Ltd. | 1,900 | 56,963 | ||||||
Hitachi Construction Machinery Co. Ltd. | 2,000 | 50,312 | ||||||
Hitachi High-Technologies Corp. | 1,480 | 57,636 | ||||||
Hitachi Ltd. | 89,000 | 548,747 | ||||||
Hitachi Metals Ltd. | 3,800 | 53,019 | ||||||
Honda Motor Co. Ltd. | 1,544,600 | 42,319,078 | ||||||
Hoshizaki Corp. | 900 | 81,658 | ||||||
Hoya Corp. | 7,000 | 364,430 | ||||||
Hulic Co. Ltd. | 5,000 | 51,204 | ||||||
Idemitsu Kosan Co. Ltd. | 1,800 | 51,208 | ||||||
IHI Corp. | 27,000 | 92,269 | ||||||
Iida Group Holdings Co. Ltd. | 148,000 | 2,470,342 | ||||||
Inpex Corp. | 941,000 | 9,085,792 | ||||||
Isetan Mitsukoshi Holdings Ltd. | 6,600 | 66,397 | ||||||
Isuzu Motors Ltd. | 974,500 | 12,100,722 | ||||||
ITOCHU Corp. | 186,300 | 2,773,807 | ||||||
| Shares | Value | |||||||
J Front Retailing Co. Ltd. | 4,100 | 63,183 | ||||||
Japan Airlines Co. Ltd. | 2,000 | 61,951 | ||||||
Japan Airport Terminal Co. Ltd. | 1,000 | 38,390 | ||||||
Japan Exchange Group, Inc. | 1,146,400 | 20,844,790 | ||||||
Japan Post Bank Co. | 7,600 | 97,562 | ||||||
Japan Post Holdings Co. | 8,100 | 100,759 | ||||||
Japan Prime Realty Investment Corp. | 14 | 48,498 | ||||||
Japan Real Estate Investment Corp. | 24 | 119,302 | ||||||
Japan Retail Fund Investment Corp. | 53 | 97,805 | ||||||
Japan Tobacco, Inc. | 1,231,700 | 43,291,922 | ||||||
JFE Holdings, Inc. | 9,200 | 160,187 | ||||||
JGC Corp. | 4,600 | 74,931 | ||||||
JSR Corp. | 3,300 | 57,127 | ||||||
JTEKT Corp. | 5,200 | 76,520 | ||||||
JXTG Holdings, Inc. | 59,550 | 260,562 | ||||||
Kajima Corp. | 16,000 | 135,226 | ||||||
Kakaku.com, Inc. | 745,300 | 10,713,636 | ||||||
Kamigumi Co. Ltd. | 5,000 | 52,559 | ||||||
Kaneka Corp. | 6,000 | 45,921 | ||||||
Kansai Electric Power Co., Inc. | 12,300 | 169,610 | ||||||
Kansai Paint Co. Ltd. | 4,500 | 103,888 | ||||||
Kao Corp. | 354,800 | 21,095,820 | ||||||
Kawasaki Heavy Industries Ltd. | 29,750 | 88,555 | ||||||
KDDI Corp. | 34,300 | 907,154 | ||||||
Keihan Electric Railway Co. Ltd. | 9,000 | 57,272 | ||||||
Keikyu Corp. | 8,000 | 96,483 | ||||||
Keio Corp. | 11,000 | 92,205 | ||||||
Keisei Electric Railway Co. Ltd. | 2,700 | 72,261 | ||||||
Keyence Corp. | 64,054 | 28,198,356 | ||||||
Kikkoman Corp. | 2,600 | 83,169 | ||||||
Kintetsu Group Holdings Co. Ltd. | 34,000 | 131,175 | ||||||
Kirin Holdings Co. Ltd. | 16,500 | 336,577 | ||||||
Kobe Steel Ltd. | 5,155 | 53,154 | ||||||
Koito Manufacturing Co. Ltd. | 2,100 | 108,592 | ||||||
Komatsu Ltd. | 16,800 | 431,213 | ||||||
Konami Holdings Corp. | 1,700 | 94,632 | ||||||
Konica Minolta, Inc. | 8,800 | 73,417 | ||||||
| Shares | Value | |||||||
Kose Corp. | 600 | 65,802 | ||||||
Kubota Corp. | 19,100 | 322,843 | ||||||
Kuraray Co. Ltd. | 6,500 | 118,359 | ||||||
Kurita Water Industries Ltd. | 1,815 | 49,648 | ||||||
Kyocera Corp. | 6,000 | 348,724 | ||||||
Kyowa Hakko Kirin Co. Ltd. | 4,600 | 85,555 | ||||||
Kyushu Electric Power Co., Inc. | 7,800 | 94,799 | ||||||
Kyushu Financial Group, Inc. | 8,100 | 51,326 | ||||||
Kyushu Railway Co. | 2,800 | 90,816 | ||||||
Lawson, Inc. | 1,045 | 73,132 | ||||||
LINE Corp. | 600 | 20,830 | ||||||
Lion Corp. | 4,000 | 82,967 | ||||||
LIXIL Group Corp. | 4,700 | 117,806 | ||||||
M3, Inc. | 3,900 | 107,587 | ||||||
Mabuchi Motor Co. Ltd. | 1,000 | 49,983 | ||||||
Makita Corp. | 3,900 | 144,433 | ||||||
Marubeni Corp. | 30,700 | 198,895 | ||||||
Marui Group Co. Ltd. | 3,500 | 51,715 | ||||||
Maruichi Steel Tube Ltd. | 900 | 26,185 | ||||||
Mazda Motor Corp. | 10,000 | 140,489 | ||||||
McDonald’s Holdings Co. Japan Ltd. | 1,050 | 40,280 | ||||||
Mebuki Financial Group, Inc. | 17,540 | 65,490 | ||||||
Medipal Holdings Corp. | 2,740 | 50,805 | ||||||
MEIJI Holdings Co. Ltd. | 2,300 | 186,505 | ||||||
Minebea Co. Ltd. | 7,100 | 114,821 | ||||||
Miraca Holdings, Inc. | 1,000 | 45,039 | ||||||
MISUMI Group, Inc. | 5,000 | 114,598 | ||||||
Mitsubishi Chemical Holdings Corp. | 25,500 | 212,460 | ||||||
Mitsubishi Corp. | 1,339,500 | 28,157,657 | ||||||
Mitsubishi Electric Corp. | 1,113,000 | 16,096,878 | ||||||
Mitsubishi Estate Co. Ltd. | 22,700 | 424,327 | ||||||
Mitsubishi Gas Chemical Co., Inc. | 3,200 | 67,966 | ||||||
Mitsubishi Heavy Industries Ltd. | 58,400 | 240,442 | ||||||
Mitsubishi Materials Corp. | 2,200 | 66,762 | ||||||
Mitsubishi Motors Corp. | 13,500 | 89,278 | ||||||
Mitsubishi Tanabe Pharma Corp. | 4,290 | 99,237 | ||||||
Mitsubishi UFJ Financial Group, Inc. | 1,390,000 | 9,375,617 | ||||||
| Shares | Value | |||||||
Mitsubishi UFJ Lease & Finance Co. Ltd. | 7,100 | 38,954 | ||||||
Mitsui & Co. Ltd. | 31,100 | 445,223 | ||||||
Mitsui Chemicals, Inc. | 16,500 | 87,869 | ||||||
Mitsui Fudosan Co. Ltd. | 16,400 | 392,920 | ||||||
Mitsui OSK Lines Ltd. | 20,000 | 59,058 | ||||||
Mixi, Inc. | 775 | 43,128 | ||||||
Mizuho Financial Group, Inc. | 450,300 | 825,613 | ||||||
MS&AD Insurance Group Holdings, Inc. | 653,940 | 22,056,545 | ||||||
Murata Manufacturing Co. Ltd. | 3,500 | 534,331 | ||||||
Nabtesco Corp. | 2,000 | 58,328 | ||||||
Nagoya Railroad Co. Ltd. | 16,500 | 76,991 | ||||||
NEC Corp. | 52,000 | 138,237 | ||||||
Nexon Co. Ltd. | 4,500 | 89,261 | ||||||
NGK Insulators Ltd. | 4,900 | 98,236 | ||||||
NGK Spark Plug Co. Ltd. | 2,900 | 62,119 | ||||||
NH Foods Ltd. | 3,300 | 100,386 | ||||||
Nidec Corp. | 4,400 | 452,056 | ||||||
Nikon Corp. | 6,300 | 100,984 | ||||||
Nintendo Co. Ltd. | 2,100 | 703,063 | ||||||
Nippon Building Fund, Inc. | 26 | 132,662 | ||||||
Nippon Electric Glass Co. Ltd. | 1,400 | 51,069 | ||||||
Nippon Express Co. Ltd. | 16,000 | 100,403 | ||||||
Nippon Paint Holdings Co. Ltd. | 2,800 | 106,525 | ||||||
Nippon Prologis Real Estate Investment Trust, Inc. | 31 | 65,984 | ||||||
Nippon Steel & Sumitomo Metal Corp. | 13,900 | 314,984 | ||||||
Nippon Telegraph & Telephone Corp. | 407,200 | 19,221,511 | ||||||
Nippon Yusen KK | 28,000 | 52,346 | ||||||
Nissan Chemical Industries Ltd. | 2,400 | 79,529 | ||||||
Nissan Motor Co. Ltd. | 44,200 | 441,334 | ||||||
Nisshin Seifun Group, Inc. | 4,400 | 72,334 | ||||||
Nissin Foods Holdings Co. Ltd. | 1,100 | 68,783 | ||||||
Nitori Holdings Co. Ltd. | 1,500 | 200,795 | ||||||
Nitto Denko Corp. | 3,000 | 247,744 | ||||||
NOK Corp. | 1,500 | 31,844 | ||||||
Nomura Holdings, Inc. | 5,370,800 | 32,388,309 | ||||||
Nomura Real Estate Holdings, Inc. | 2,200 | 43,295 | ||||||
Nomura Real Estate Master Fund, Inc. | 66 | 90,191 | ||||||
| Shares | Value | |||||||
Nomura Research Institute Ltd. | 2,348 | 92,761 | ||||||
NSK Ltd. | 7,800 | 98,153 | ||||||
NTT Data Corp. | 11,500 | 128,301 | ||||||
NTT DOCOMO, Inc. | 25,100 | 593,632 | ||||||
Obayashi Corp. | 12,500 | 147,277 | ||||||
Obic Co. Ltd. | 1,100 | 67,734 | ||||||
Odakyu Electric Railway Co. Ltd. | 5,200 | 105,096 | ||||||
Oji Holdings Corp. | 14,850 | 76,886 | ||||||
Olympus Corp. | 335,800 | 12,303,178 | ||||||
Omron Corp. | 747,500 | 32,538,227 | ||||||
Ono Pharmaceutical Co. Ltd. | 8,000 | 174,491 | ||||||
Oracle Corp. | 800 | 52,038 | ||||||
Oriental Land Co. Ltd. | 4,000 | 271,100 | ||||||
ORIX Corp. | 24,900 | 387,441 | ||||||
Osaka Gas Co. Ltd. | 35,000 | 143,319 | ||||||
Otsuka Corp. | 800 | 49,763 | ||||||
Otsuka Holdings Co. Ltd. | 7,130 | 304,417 | ||||||
Panasonic Corp. | 2,924,165 | 39,842,510 | ||||||
Park24 Co. Ltd. | 2,000 | 50,893 | ||||||
Pigeon Corp. | 373,700 | 13,585,983 | ||||||
Pola Orbis Holdings, Inc. | 1,600 | 42,331 | ||||||
Rakuten, Inc. | 1,083,000 | 12,780,393 | ||||||
Recruit Holdings Co. Ltd. | 20,100 | 345,919 | ||||||
Resona Holdings, Inc. | 41,200 | 227,581 | ||||||
Ricoh Co. Ltd. | 13,100 | 116,048 | ||||||
Rinnai Corp. | 700 | 65,398 | ||||||
Rohm Co. Ltd. | 1,700 | 131,072 | ||||||
Ryohin Keikaku Co. Ltd. | 500 | 125,140 | ||||||
Sankyo Co. Ltd. | 600 | 20,382 | ||||||
Santen Pharmaceutical Co. Ltd. | 6,400 | 86,932 | ||||||
SBI Holdings, Inc. | 3,525 | 47,935 | ||||||
Secom Co. Ltd. | 4,200 | 319,557 | ||||||
Sega Sammy Holdings, Inc. | 3,000 | 40,447 | ||||||
Seibu Holdings, Inc. | 3,400 | 62,997 | ||||||
Seiko Epson Corp. | 5,100 | 113,793 | ||||||
Sekisui Chemical Co. Ltd. | 7,800 | 139,959 | ||||||
Sekisui House Ltd. | 1,377,200 | 24,340,083 | ||||||
| Shares | Value | |||||||
Seven & i Holdings Co. Ltd. | 13,700 | 565,323 | ||||||
Seven Bank Ltd. | 10,500 | 37,647 | ||||||
Sharp Corp. | 28,050 | 103,973 | ||||||
Shimadzu Corp. | 4,500 | 85,748 | ||||||
Shimamura Co. Ltd. | 400 | 49,037 | ||||||
Shimano, Inc. | 88,700 | 14,083,661 | ||||||
Shimizu Corp. | 11,000 | 116,882 | ||||||
Shin-Etsu Chemical Co. Ltd. | 7,095 | 645,736 | ||||||
Shinsei Bank Ltd. | 29,000 | 50,801 | ||||||
Shionogi & Co. Ltd. | 5,500 | 306,668 | ||||||
Shiseido Co. Ltd. | 403,400 | 14,380,268 | ||||||
Shizuoka Bank Ltd. | 9,000 | 81,624 | ||||||
Showa Shell Sekiyu KK | 4,300 | 39,940 | ||||||
SMC Corp. | 47,400 | 14,489,815 | ||||||
SoftBank Group Corp. | 15,200 | 1,235,610 | ||||||
Sohgo Security Services Co. Ltd. | 1,300 | 58,682 | ||||||
Sompo Holdings, Inc. | 100,750 | 3,910,598 | ||||||
Sony Corp. | 293,200 | 11,183,745 | ||||||
Sony Financial Holdings, Inc. | 2,800 | 47,886 | ||||||
Stanley Electric Co. Ltd. | 2,500 | 75,762 | ||||||
Start Today Co. Ltd. | 3,400 | 83,792 | ||||||
Subaru Corp. | 11,400 | 386,552 | ||||||
Sugi Holdings Co. Ltd. | 109,500 | 5,867,626 | ||||||
Sumitomo Chemical Co. Ltd. | 27,300 | 157,788 | ||||||
Sumitomo Corp. | 21,800 | 284,276 | ||||||
Sumitomo Dainippon Pharma Co. Ltd. | 2,800 | 38,220 | ||||||
Sumitomo Electric Industries Ltd. | 1,361,400 | 21,061,418 | ||||||
Sumitomo Heavy Industries Ltd. | 11,000 | 72,992 | ||||||
Sumitomo Metal Mining Co. Ltd. | 9,000 | 120,295 | ||||||
Sumitomo Mitsui Financial Group, Inc. | 1,143,200 | 44,635,632 | ||||||
Sumitomo Mitsui Trust Holdings, Inc. | 814,500 | 29,256,262 | ||||||
Sumitomo Realty & Development Co. Ltd. | 7,000 | 216,778 | ||||||
Sumitomo Rubber Industries Ltd. | 3,500 | 59,274 | ||||||
Sundrug Co. Ltd. | 1,200 | 44,763 | ||||||
Suntory Beverage & Food Ltd. | 2,410 | 112,019 | ||||||
Suruga Bank Ltd. | 456,900 | 11,112,027 | ||||||
Suzuken Co. Ltd. | 1,255 | 41,777 | ||||||
| Shares | Value | |||||||
Suzuki Motor Corp. | 6,300 | 300,119 | ||||||
Sysmex Corp. | 229,255 | 13,721,764 | ||||||
T&D Holdings, Inc. | 9,700 | 148,334 | ||||||
Taiheiyo Cement Corp. | 20,000 | 73,141 | ||||||
Taisei Corp. | 20,000 | 182,931 | ||||||
Taisho Pharmaceutical Holdings Co. Ltd. | 800 | 60,956 | ||||||
Taiyo Nippon Sanso Corp. | 2,800 | 31,582 | ||||||
Takashimaya Co. Ltd. | 2,630,000 | 25,090,416 | ||||||
Takeda Pharmaceutical Co. Ltd. | 562,400 | 28,552,472 | ||||||
TDK Corp. | 2,400 | 158,645 | ||||||
Teijin Ltd. | 3,300 | 63,680 | ||||||
Terumo Corp. | 6,400 | 252,537 | ||||||
THK Co. Ltd. | 2,100 | 59,848 | ||||||
Tobu Railway Co. Ltd. | 17,000 | 92,879 | ||||||
Toho Co. Ltd. | 2,200 | 67,848 | ||||||
Toho Gas Co. Ltd. | 6,000 | 43,704 | ||||||
Tohoku Electric Power Co., Inc. | 9,500 | 131,662 | ||||||
Tokio Marine Holdings, Inc. | 564,800 | 23,503,177 | ||||||
Tokyo Electric Power Co., Inc. | 27,400 | 113,117 | ||||||
Tokyo Electron Ltd. | 2,900 | 392,060 | ||||||
Tokyo Gas Co. Ltd. | 35,000 | 182,304 | ||||||
Tokyo Tatemono Co. Ltd. | 3,700 | 48,636 | ||||||
Tokyu Corp. | 19,000 | 145,190 | ||||||
Tokyu Fudosan Holdings Corp. | 8,200 | 48,630 | ||||||
Toppan Printing Co. Ltd. | 9,000 | 98,964 | ||||||
Toray Industries, Inc. | 25,900 | 217,292 | ||||||
Toshiba Corp. | 70,000 | 169,569 | ||||||
Tosoh Corp. | 10,000 | 103,062 | ||||||
TOTO Ltd. | 2,400 | 91,955 | ||||||
Toyo Seikan Group Holdings Ltd. | 2,900 | 49,093 | ||||||
Toyo Suisan Kaisha Ltd. | 1,550 | 59,468 | ||||||
Toyoda Gosei Co. Ltd. | 1,200 | 28,754 | ||||||
Toyota Industries Corp. | 3,200 | 169,249 | ||||||
Toyota Motor Corp. | 116,794 | 6,139,102 | ||||||
Toyota Tsusho Corp. | 4,035 | 121,315 | ||||||
Trend Micro, Inc. | 2,200 | 113,703 | ||||||
Tsuruha Holdings, Inc. | 700 | 74,385 | ||||||
| Shares | Value | |||||||
Unicharm Corp. | 7,500 | 188,820 | ||||||
United Urban Investment Corp. | 52 | 74,186 | ||||||
USS Co. Ltd. | 5,000 | 99,655 | ||||||
West Japan Railway Co. | 55,500 | 3,926,935 | ||||||
Yahoo Japan Corp. | 25,100 | 109,115 | ||||||
Yakult Honsha Co. Ltd. | 1,700 | 115,877 | ||||||
Yamada Denki Co. Ltd. | 10,440 | 51,908 | ||||||
Yamaguchi Financial Group, Inc. | 3,000 | 36,336 | ||||||
Yamaha Corp. | 3,000 | 103,857 | ||||||
Yamaha Motor Co. Ltd. | 957,900 | 24,856,900 | ||||||
Yamato Holdings Co. Ltd. | 6,100 | 123,925 | ||||||
Yamazaki Baking Co. Ltd. | 2,300 | 45,855 | ||||||
Yaskawa Electric Corp. | 4,700 | 100,073 | ||||||
Yokogawa Electric Corp. | 4,500 | 72,420 | ||||||
Yokohama Rubber Co. Ltd. | 2,300 | 46,366 | ||||||
|
| |||||||
| 875,677,920 | ||||||||
|
| |||||||
Jersey - 0.00% (3) | ||||||||
Randgold Resources Ltd. | 1,699 | 150,763 | ||||||
|
| |||||||
Jordan - 0.00% (3) | ||||||||
Hikma Pharmaceuticals Plc | 2,470 | 47,305 | ||||||
|
| |||||||
Luxembourg - 0.01% | ||||||||
ArcelorMittal (1) | 11,617 | 263,510 | ||||||
Eurofins Scientific SE | 207 | 116,791 | ||||||
Millicom International Cellular SA | 1,146 | 67,784 | ||||||
RTL Group SA | 793 | 59,911 | ||||||
SES SA | 6,856 | 160,615 | ||||||
Tenaris SA | 8,258 | 128,938 | ||||||
|
| |||||||
| 797,549 | ||||||||
|
| |||||||
Macau - 0.01% | ||||||||
MGM China Holdings Ltd. | 17,600 | 39,139 | ||||||
Sands China Ltd. | 45,600 | 208,736 | ||||||
Wynn Macau Ltd. | 27,600 | 64,448 | ||||||
|
| |||||||
| 312,323 | ||||||||
|
| |||||||
Malaysia - 0.12% | ||||||||
Public Bank Bhd | 1,292,100 | 6,115,596 | ||||||
|
| |||||||
Mexico - 0.68% | ||||||||
America Movil SAB de CV - ADR | 479,515 | 7,633,879 | ||||||
| Shares | Value | |||||||
Fresnillo Plc | 4,114 | 79,749 | ||||||
Grupo Mexico SAB de CV | 931,600 | 2,617,386 | ||||||
Wal-Mart de Mexico SAB de CV | 10,737,568 | 24,896,308 | ||||||
|
| |||||||
| 35,227,322 | ||||||||
|
| |||||||
Netherlands - 4.05% | ||||||||
ABN AMRO Group NV (2) | 5,399 | 143,030 | ||||||
Aegon NV | 34,391 | 176,010 | ||||||
Akzo Nobel NV | 203,065 | 17,660,317 | ||||||
Altice NV - Class A (1) | 7,447 | 171,575 | ||||||
Altice NV - Class B (1) | 1,629 | 37,574 | ||||||
ASML Holding NV | 6,902 | 899,697 | ||||||
Boskalis Westminster | 1,892 | 61,445 | ||||||
Core Laboratories NV | 178,764 | 18,103,430 | ||||||
EXOR NV | 1,941 | 105,325 | ||||||
Gemalto NV | 311,928 | 18,708,549 | ||||||
Heineken Holding NV | 1,805 | 165,447 | ||||||
Heineken NV | 4,185 | 406,928 | ||||||
ING Groep NV | 580,726 | 10,024,960 | ||||||
Koninklijke Ahold Delhaize NV | 1,255,778 | 23,969,380 | ||||||
Koninklijke DSM NV | 3,163 | 230,053 | ||||||
Koninklijke KPN NV | 1,871,011 | 5,988,304 | ||||||
Koninklijke Philips NV | 17,261 | 614,470 | ||||||
Koninklijke Vopak NV | 1,614 | 74,791 | ||||||
NN Group NV | 5,613 | 199,167 | ||||||
NXP Semiconductors NV (1) | 6,319 | 691,615 | ||||||
PostNL NV | 6,382,968 | 29,787,531 | ||||||
QIAGEN NV - Aquis Listed | 192,376 | 6,401,095 | ||||||
QIAGEN NV - NASDAQ Listed | 222,419 | 7,457,704 | ||||||
Randstad Holding NV | 2,166 | 126,280 | ||||||
Royal Dutch Shell Plc | 488,053 | 12,967,003 | ||||||
Royal Dutch Shell Plc - Class A | 1,176,557 | 31,284,619 | ||||||
Royal Dutch Shell Plc - Class B | 828,889 | 22,252,809 | ||||||
Wolters Kluwer NV | 5,862 | 247,922 | ||||||
|
| |||||||
| 208,957,030 | ||||||||
|
| |||||||
New Zealand - 0.01% | ||||||||
Auckland International Airport Ltd. | 17,542 | 91,660 | ||||||
Contact Energy Ltd. | 14,350 | 54,786 | ||||||
| Shares | Value | |||||||
Fletcher Building Ltd. | 12,077 | 70,722 | ||||||
Mercury NZ Ltd. | 11,706 | 28,480 | ||||||
Meridian Energy Ltd. | 24,811 | 52,903 | ||||||
Ryman Healthcare Ltd. | 7,816 | 47,486 | ||||||
Spark New Zealand Ltd. | 32,051 | 88,808 | ||||||
|
| |||||||
| 434,845 | ||||||||
|
| |||||||
Norway - 0.57% | ||||||||
DNB ASA | 1,665,431 | 28,353,617 | ||||||
Gjensidige Forsikring ASA | 3,460 | 59,062 | ||||||
Marine Harvest ASA | 6,708 | 114,769 | ||||||
Norsk Hydro ASA | 25,792 | 142,733 | ||||||
Orkla ASA | 14,255 | 144,888 | ||||||
Schibsted ASA - Class A | 1,352 | 32,655 | ||||||
Schibsted ASA - Class B | 1,677 | 37,094 | ||||||
Statoil ASA | 21,139 | 350,530 | ||||||
Telenor ASA | 13,161 | 218,344 | ||||||
Yara International ASA | 3,785 | 142,325 | ||||||
|
| |||||||
| 29,596,017 | ||||||||
|
| |||||||
Philippines - 0.08% | ||||||||
Puregold Price Club, Inc. | 4,767,700 | 4,209,295 | ||||||
|
| |||||||
Portugal - 0.25% | ||||||||
EDP - Energias de Portugal SA | 43,400 | 141,971 | ||||||
Galp Energia SGPS SA | 8,062 | 122,170 | ||||||
Jeronimo Martins SGPS SA | 637,904 | 12,454,321 | ||||||
|
| |||||||
| 12,718,462 | ||||||||
|
| |||||||
Republic of Korea - 1.71% | ||||||||
Amorepacific Corp. | 78,949 | 20,967,808 | ||||||
Hana Financial Group, Inc. | 137,171 | 5,417,227 | ||||||
NAVER Corp. | 9,765 | 7,158,046 | ||||||
POSCO | 36,740 | 9,203,079 | ||||||
Samsung Electronic Co. Ltd. | 15,167 | 31,590,159 | ||||||
Samsung Fire & Marine Insurance Co. Ltd. | 56,699 | 13,956,424 | ||||||
|
| |||||||
| 88,292,743 | ||||||||
|
| |||||||
Russia - 0.56% | ||||||||
Gazprom PJSC - ADR | 1,453,474 | 5,756,736 | ||||||
Magnit PJSC - GDR | 153,732 | 5,224,223 | ||||||
Yandex NV (1) | 684,679 | 17,965,977 | ||||||
| Shares | Value | |||||||
|
| |||||||
| 28,946,936 | ||||||||
|
| |||||||
Singapore - 1.84% | ||||||||
Ascendas Real Estate Investment Trust | 49,500 | 93,790 | ||||||
CapitaLand Commercial Trust | 36,600 | 44,111 | ||||||
CapitaLand Ltd. | 45,900 | 116,633 | ||||||
CapitaLand Mall Trust | 68,200 | 97,808 | ||||||
City Developments Ltd. | 10,100 | 78,675 | ||||||
ComfortDelGro Corp. Ltd. | 36,500 | 60,966 | ||||||
DBS Group Holdings Ltd. | 1,769,500 | 26,632,351 | ||||||
Genting Singapore Plc | 102,400 | 80,677 | ||||||
Global Logistic Properties Ltd. | 49,700 | 103,250 | ||||||
Golden Agri-Resources Ltd. | 166,500 | 45,351 | ||||||
Hutchison Port Holdings Trust | 108,900 | 46,788 | ||||||
Jardine Cycle & Carriage Ltd. | 1,700 | 54,734 | ||||||
Keppel Corp. Ltd. | 26,500 | 121,017 | ||||||
Oversea-Chinese Banking Corp. Ltd. | 57,400 | 449,634 | ||||||
SATS Ltd. | 11,300 | 41,919 | ||||||
Sembcorp Industries Ltd. | 17,300 | 38,675 | ||||||
Singapore Airlines Ltd. | 9,300 | 68,348 | ||||||
Singapore Exchange Ltd. | 13,800 | 73,547 | ||||||
Singapore Press Holdings Ltd. | 9,865 | 23,146 | ||||||
Singapore Technologies Engineering Ltd. | 28,600 | 76,406 | ||||||
Singapore Telecommunications Ltd. | 6,086,800 | 17,189,614 | ||||||
StarHub Ltd. | 11,000 | 21,733 | ||||||
Suntec Real Estate Investment Trust | 45,900 | 62,293 | ||||||
United Overseas Bank Ltd. | 2,496,726 | 41,916,633 | ||||||
UOL Group Ltd. | 8,719 | 48,377 | ||||||
Wilmar International Ltd. | 2,996,000 | 7,287,319 | ||||||
|
| |||||||
| 94,873,795 | ||||||||
|
| |||||||
South Africa - 0.72% | ||||||||
Clicks Group Ltd. | 1,122,616 | 11,998,087 | ||||||
Investec Plc | 11,596 | 86,645 | ||||||
Mediclinic International Plc | 6,972 | 67,441 | ||||||
Mondi Plc | 6,916 | 181,351 | ||||||
Naspers Ltd. | 127,029 | 25,016,180 | ||||||
|
| |||||||
| 37,349,704 | ||||||||
|
| |||||||
Spain - 3.54% | ||||||||
| Shares | Value | |||||||
Abertis Infraestructuras SA | 14,273 | 264,572 | ||||||
ACS Actividades Co. | 4,705 | 181,914 | ||||||
Aena SA (2) | 78,815 | 15,390,584 | ||||||
Amadeus IT Group SA | 7,972 | 476,533 | ||||||
Banco Bilbao Vizcaya Argentaria SA | 3,615,089 | 30,113,571 | ||||||
Banco de Sabadell SA | 101,706 | 206,927 | ||||||
Banco Santander | 1,848,951 | 12,276,839 | ||||||
Bankia SA | 1,085,949 | 5,252,472 | ||||||
Bankinter SA | 14,827 | 136,779 | ||||||
CaixaBank SA | 1,724,836 | 8,245,384 | ||||||
Distribuidora Internacional de Alimentacion SA | 1,395,988 | 8,711,513 | ||||||
Enagas SA | 608 | 17,063 | ||||||
Endesa SA | 7,025 | 162,057 | ||||||
Ferrovial SA | 9,558 | 212,314 | ||||||
Gamesa Corp. Technologica SA | 4,169 | 89,198 | ||||||
Gas Natural SDG SA | 7,593 | 177,741 | ||||||
Grifols SA | 5,705 | 159,062 | ||||||
Iberdrola SA | 3,277,914 | 25,975,628 | ||||||
Industria de Diseno Textil SA | 691,179 | 26,544,786 | ||||||
Mapfre SA | 25,683 | 89,896 | ||||||
Red Electrica Corp. SA | 2,381 | 49,812 | ||||||
Repsol SA | 21,888 | 335,567 | ||||||
Telefonica SA | 4,634,020 | 47,969,697 | ||||||
|
| |||||||
| 183,039,909 | ||||||||
|
| |||||||
Sweden - 2.12% | ||||||||
Alfa Laval AB | 5,052 | 103,402 | ||||||
Assa Abloy AB | 18,208 | 401,331 | ||||||
Atlas Copco AB - Class A | 986,018 | 37,914,151 | ||||||
Atlas Copco AB - Class B | 7,085 | 244,891 | ||||||
Boliden AB | 4,860 | 132,848 | ||||||
Electrolux AB | 4,207 | 137,953 | ||||||
Essity AB (1) | 11,519 | 315,160 | ||||||
Getinge AB | 3,412 | 66,828 | ||||||
Hennes & Mauritz AB | 17,809 | 444,015 | ||||||
Hexagon AB | 4,670 | 221,870 | ||||||
Husqvarna AB - Class B | 7,966 | 79,184 | ||||||
ICA Gruppen AB | 1,553 | 57,852 | ||||||
| Shares | Value | |||||||
Industrivarden AB | 3,403 | 81,637 | ||||||
Investor AB | 335,510 | 16,187,194 | ||||||
Kinnevik AB | 4,558 | 139,735 | ||||||
L E Lundbergforetagen AB | 669 | 52,844 | ||||||
Lundin Petroleum AB (1) | 3,767 | 72,605 | ||||||
Nordea Bank AB | 56,071 | 714,145 | ||||||
Sandvik AB | 20,629 | 324,788 | ||||||
Securitas AB | 6,178 | 104,201 | ||||||
Skandinaviska Enskilda Banken AB | 27,860 | 337,291 | ||||||
Skanska AB | 6,716 | 159,478 | ||||||
SKF AB | 7,147 | 145,130 | ||||||
Svenska Handelsbanken AB | 1,257,434 | 18,009,128 | ||||||
Swedbank AB | 17,079 | 416,828 | ||||||
Swedish Match AB | 3,511 | 123,695 | ||||||
Tele2 AB | 6,851 | 71,796 | ||||||
Telefonaktiebolaget LM Ericsson - Class B | 505,118 | 3,631,864 | ||||||
TeliaSonera AB | 6,125,485 | 28,229,855 | ||||||
Volvo AB | 27,986 | 477,263 | ||||||
|
| |||||||
| 109,398,962 | ||||||||
|
| |||||||
Switzerland - 8.50% | ||||||||
ABB Ltd. | 1,195,580 | 29,675,626 | ||||||
Adecco SA | 336,794 | 25,657,709 | ||||||
Baloise Holding AG | 872 | 135,073 | ||||||
Barry Callebaut AG | 44 | 60,567 | ||||||
Chocoladefabriken Lindt & Spruengli AG | 18 | 104,370 | ||||||
Chocoladefabriken Lindt & Spruengli AG - REG | 2 | 139,457 | ||||||
Chubb Ltd. | 223,381 | 32,475,130 | ||||||
Cie Financiere Richemont SA | 157,543 | 13,036,501 | ||||||
Coca-Cola HBC AG | 3,121 | 91,786 | ||||||
Credit Suisse Group AG | 595,201 | 8,660,764 | ||||||
Dufry AG (1) | 617 | 101,256 | ||||||
EMS-Chemie Holding AG | 150 | 110,761 | ||||||
Geberit AG | 723 | 337,612 | ||||||
Givaudan SA | 169 | 338,642 | ||||||
Glencore Plc | 222,534 | 833,890 | ||||||
Julius Baer Group Ltd. | 4,045 | 213,722 | ||||||
Kuehne & Nagel International AG | 1,175 | 196,441 | ||||||
| Shares | Value | |||||||
LafargeHolcim Ltd. | 8,246 | 473,923 | ||||||
Lonza Group AG | 1,352 | 292,865 | ||||||
Nestle SA | 1,041,117 | 90,803,807 | ||||||
Novartis AG | 882,668 | 73,726,264 | ||||||
Novartis AG - Sponsored ADR | 232,215 | 19,382,986 | ||||||
Pargesa Holding SA | 678 | 51,660 | ||||||
Partners Group Holding AG | 306 | 189,999 | ||||||
Roche Holding AG | 239,958 | 61,312,850 | ||||||
Schindler Holding AG - Participation Certificate | 75,065 | 15,914,751 | ||||||
Schindler Holding AG | 381 | 79,194 | ||||||
SGS SA | 8,760 | 21,240,251 | ||||||
Sika AG | 39 | 250,385 | ||||||
Sonova Holding AG | 956 | 155,516 | ||||||
STMicroelectronics NV | 13,014 | 187,135 | ||||||
Straumann Holding AG | 167 | 95,102 | ||||||
Swatch Group AG - BR | 23,516 | 8,697,730 | ||||||
Swatch Group AG - REG | 975 | 71,225 | ||||||
Swiss Life Holding AG | 600 | 202,963 | ||||||
Swiss Prime Site | 1,282 | 116,560 | ||||||
Swiss Re AG | 6,128 | 561,587 | ||||||
Swisscom AG | 499 | 241,167 | ||||||
UBS Group AG | 564,311 | 9,596,609 | ||||||
Vifor Pharma AG | 946 | 104,493 | ||||||
Wolseley Plc | 4,512 | 276,938 | ||||||
Zurich Insurance Group AG | 77,796 | 22,704,683 | ||||||
|
| |||||||
| 438,899,950 | ||||||||
|
| |||||||
Taiwan - 1.99% | ||||||||
Delta Electronics, Inc. - GDR | 383,142 | 10,485,292 | ||||||
Hon Hai Precision Industry Co. Ltd. | 734,000 | 2,821,490 | ||||||
Hon Hai Precision Industry Co. Ltd. - GDR | 1,668,594 | 12,866,852 | ||||||
Taiwan Semiconductor Manufacturing Co. Ltd. | 2,291,000 | 15,652,601 | ||||||
Taiwan Semiconductor Manufacturing Co. Ltd. - ADR | 1,741,915 | 60,897,348 | ||||||
|
| |||||||
| 102,723,583 | ||||||||
|
| |||||||
Thailand - 0.61% | ||||||||
Bangkok Bank Plc | 4,520,000 | 24,596,788 | ||||||
Thai Beverage Plc | 10,980,600 | 7,178,118 | ||||||
|
| |||||||
| 31,774,906 | ||||||||
|
| |||||||
| Shares | Value | |||||||
United Kingdom - 14.07% | ||||||||
3I Group Plc | 18,497 | 217,480 | ||||||
Aberdeen Asset Management Plc | 15,974 | 62,892 | ||||||
Admiral Group Plc | 3,994 | 104,223 | ||||||
Amec Foster Wheeler Plc | 366,968 | 2,235,382 | ||||||
Anglo American Plc (1) | 24,500 | 327,315 | ||||||
Ashtead Group Plc | 9,230 | 190,994 | ||||||
ASOS Plc (1) | 192,725 | 14,425,537 | ||||||
Associated British Foods Plc | 6,939 | 265,538 | ||||||
AstraZeneca Plc | 505,920 | 33,888,482 | ||||||
Auto Trader Group (2) | 2,713,802 | 13,437,074 | ||||||
Aviva Plc | 959,824 | 6,583,823 | ||||||
Babcock International Group Plc | 4,920 | 56,420 | ||||||
BAE Systems Plc | 58,057 | 479,279 | ||||||
Barclays Plc | 2,220,893 | 5,873,787 | ||||||
Barratt Developments Plc | 17,613 | 129,355 | ||||||
Berkeley Group Holdings Plc | 2,449 | 102,980 | ||||||
BP Plc | 10,810,377 | 62,399,690 | ||||||
British American Tobacco Plc | 34,406 | 2,344,537 | ||||||
British Land Co. Plc | 17,747 | 140,105 | ||||||
BT Group Plc | 157,817 | 606,848 | ||||||
Bunzl Plc | 6,127 | 182,661 | ||||||
Burberry Group Plc | 457,272 | 9,894,827 | ||||||
Capita Plc | 1,397,926 | 12,597,488 | ||||||
Centrica Plc | 99,950 | 260,596 | ||||||
CNH Industrial NV | 19,438 | 220,442 | ||||||
Cobham Plc | 49,119 | 82,950 | ||||||
Coca-Cola European Partners Plc | 3,923 | 158,949 | ||||||
Compass Group Plc | 1,375,739 | 29,038,643 | ||||||
ConvaTec Group Plc (1)(2) | 20,475 | 85,124 | ||||||
Croda International Plc | 2,400 | 121,543 | ||||||
Diageo Plc | 559,401 | 16,531,376 | ||||||
Direct Line Insurance Group Plc | 23,009 | 106,544 | ||||||
Dixons Carphone Plc | 19,315 | 71,402 | ||||||
easyJet Plc | 2,897 | 51,321 | ||||||
Experian Plc | 1,349,356 | 27,692,761 | ||||||
Fiat Chrysler Automobiles NV (1) | 19,907 | 210,309 | ||||||
| Shares | Value | |||||||
G4S Plc | 27,132 | 115,391 | ||||||
GKN Plc | 29,986 | 127,369 | ||||||
GlaxoSmithKline Plc | 1,443,736 | 30,733,341 | ||||||
Hammerson Plc | 13,234 | 99,016 | ||||||
Hargreaves Lansdown Plc | 1,149,500 | 19,492,563 | ||||||
Howden Joinery Group Plc | 1,045,940 | 5,548,527 | ||||||
HSBC Holdings Plc | 3,771,843 | 35,010,296 | ||||||
Imagination Technologies Group Plc (1) | 1,686,206 | 3,365,692 | ||||||
IMI Plc | 4,320 | 67,285 | ||||||
Imperial Tobacco Group Plc | 99,571 | 4,474,461 | ||||||
Inmarsat Plc | 7,906 | 79,291 | ||||||
InterContinental Hotels Group Plc | 3,190 | 177,153 | ||||||
International Consolidated Airlines Group SA | 12,916 | 102,622 | ||||||
Intertek Group Plc | 207,831 | 11,417,309 | ||||||
Intu Properties Plc | 15,880 | 55,690 | ||||||
ITV Plc | 69,493 | 164,496 | ||||||
J Sainsbury Plc | 28,341 | 92,961 | ||||||
John Wood Group Plc | 696,476 | 5,819,220 | ||||||
Johnson Matthey Plc | 324,803 | 12,156,343 | ||||||
Jupiter Fund Management Plc | 1,553,756 | 10,219,371 | ||||||
Kingfisher Plc | 8,330,005 | 32,628,106 | ||||||
Land Securities Group Plc | 14,879 | 196,443 | ||||||
Legal & General Group Plc | 112,227 | 377,646 | ||||||
Liberty Global Plc - Class A (1) | 236,035 | 7,581,444 | ||||||
Lloyds Banking Group Plc | 29,040,802 | 25,026,803 | ||||||
London Stock Exchange Group Plc | 5,837 | 277,653 | ||||||
Marks & Spencer Group Plc | 28,827 | 125,113 | ||||||
Meggitt Plc | 13,091 | 81,345 | ||||||
Merlin Entertainments Plc (2) | 13,323 | 83,401 | ||||||
National Grid Plc | 1,154,704 | 14,307,415 | ||||||
Next Plc | 2,590 | 130,081 | ||||||
Old Mutual Plc | 92,520 | 233,418 | ||||||
Pearson Plc | 15,091 | 135,879 | ||||||
Persimmon Plc | 5,396 | 157,599 | ||||||
Petrofac Ltd. | 6,744 | 38,778 | ||||||
Provident Financial Plc | 2,605 | 82,622 | ||||||
Prudential Plc | 47,583 | 1,092,215 | ||||||
| Shares | Value | |||||||
Reckitt Benckiser Group Plc | 339,064 | 34,372,151 | ||||||
RELX NV | 17,635 | 363,578 | ||||||
RELX Plc | 19,605 | 423,803 | ||||||
Rightmove Plc | 320,911 | 17,757,181 | ||||||
Rio Tinto Ltd. | 8,145 | 395,835 | ||||||
Rio Tinto Plc | 22,788 | 965,118 | ||||||
Rolls-Royce Holdings Plc (1) | 30,207 | 350,361 | ||||||
Royal Bank of Scotland Group Plc (1) | 9,984,081 | 32,215,729 | ||||||
Royal Mail Plc | 15,467 | 84,847 | ||||||
RSA Insurance Group Plc | 260,143 | 2,086,828 | ||||||
Sage Group Plc | 20,108 | 180,188 | ||||||
Schroders Plc | 2,203 | 89,081 | ||||||
Segro Plc | 17,686 | 112,727 | ||||||
Severn Trent Plc | 4,144 | 117,808 | ||||||
Sky Plc | 19,041 | 246,604 | ||||||
Smith & Nephew Plc | 16,243 | 280,494 | ||||||
Smiths Group Plc | 6,953 | 144,567 | ||||||
SSE Plc | 18,853 | 356,725 | ||||||
St James’s Place Plc | 9,491 | 146,291 | ||||||
Standard Chartered Plc (1) | 829,851 | 8,404,948 | ||||||
Standard Life Plc | 37,834 | 196,738 | ||||||
Tate & Lyle Plc | 7,792 | 67,155 | ||||||
Taylor Wimpey Plc | 62,713 | 144,018 | ||||||
Tesco Plc (1) | 31,235,678 | 68,769,793 | ||||||
Travis Perkins Plc | 678,913 | 12,870,154 | ||||||
Unilever NV | 101,193 | 5,586,047 | ||||||
Unilever Plc | 408,650 | 22,115,381 | ||||||
Unilever Plc - ADR | 368,310 | 19,932,937 | ||||||
United Utilities Group Plc | 12,841 | 145,153 | ||||||
Vodafone Group Plc | 3,981,629 | 11,307,701 | ||||||
Weir Group Plc | 541,540 | 12,222,531 | ||||||
Whitbread Plc | 3,279 | 169,457 | ||||||
Willis Towers Watson Plc | 34,000 | 4,945,640 | ||||||
WM Morrison Supermarkets Plc | 43,276 | 135,924 | ||||||
Worldpay Group Plc (2) | 36,655 | 150,301 | ||||||
WPP Plc | 262,513 | 5,527,681 | ||||||
|
| |||||||
| 726,434,510 | ||||||||
|
| |||||||
| Shares | Value | |||||||
United States - 1.45% | ||||||||
Amdocs Ltd. | 264,387 | 17,042,386 | ||||||
Carnival Plc | 3,526 | 233,153 | ||||||
Mettler-Toledo International, Inc. (1) | 37,013 | 21,783,631 | ||||||
Mylan (1) | 257,148 | 9,982,485 | ||||||
News Corp. - Class A | 371,776 | 5,093,331 | ||||||
Schlumberger Ltd. | 301,350 | 19,840,884 | ||||||
Shire Plc | 16,741 | 923,086 | ||||||
|
| |||||||
| 74,898,956 | ||||||||
|
| |||||||
Total Common Stocks (Cost $4,458,825,626) | $ | 4,894,712,145 | ||||||
|
| |||||||
Preferred Stocks - 0.23% | ||||||||
Germany - 0.23% | ||||||||
Bayer Motoren Werke AG | 873 | $ | 72,045 | |||||
Fuchs Petrolub SE | 1,139 | 62,079 | ||||||
Henkel AG & Co. KGaA | 3,270 | 450,913 | ||||||
Porsche Automobil Holding SE | 2,796 | 157,335 | ||||||
Schaeffler AG | 2,720 | 39,022 | ||||||
Volkswagen AG | 71,705 | 10,953,374 | ||||||
|
| |||||||
Total Preferred Stocks (Cost $10,395,811) | $ | 11,734,768 | ||||||
|
| |||||||
SHORT-TERM INVESTMENTS - 4.22% | ||||||||
Money Market Funds - 4.22% | ||||||||
Goldman Sachs Financial Square Government Fund - Class I, 0.86% (4) | 108,847,557 | $ | 108,847,557 | |||||
JPMorgan U.S. Government Money Market Fund - Class I, 0.85% (4) | 108,847,557 | 108,847,557 | ||||||
|
| |||||||
Total Short-Term Investments (Cost $217,695,114) | $ | 217,695,114 | ||||||
|
| |||||||
TOTAL INVESTMENTS IN SECURITIES - 99.24% | ||||||||
(Cost $4,686,916,551) | $ | 5,124,142,027 | ||||||
OTHER ASSETS IN EXCESS OF LIABILITIES - 0.76% | 39,430,933 | |||||||
|
| |||||||
TOTAL NET ASSETS - 100.00% | $ | 5,163,572,960 | ||||||
|
| |||||||
Percentages are stated as a percent of net assets.
ADR American Depositary Receipt
| GDR | Global Depositary Receipt |
| (1) | Non-income producing security. |
| (2) | Includes restricted securities as defined in Rule 144(A) under the Securities Act of 1933. The value of these securities total $52,232,220, which represents 1.01% of total net assets. |
| (3) | Amount less than 0.005%. |
| (4) | Represents annualized seven-day yield as of the close of the reporting period. |

Report of Independent Registered Public Accounting Firm
To the Board of Trustees of Bridge Builder Trust and Shareholders of the Bridge Builder Core Bond Fund Bridge Builder Core Plus Bond Fund, Bridge Builder Municipal Bond Fund, Bridge Builder Large Cap Growth Fund, Bridge Builder Large Cap Value Fund, Bridge Builder Small/Mid Cap Growth Fund, Bridge Builder Small/Mid Cap Value Fund and Bridge Builder International Equity Fund
In our opinion, the accompanying statements of assets and liabilities, including the summary schedules of investments, and the related statements of operations and of changes in net assets and the financial highlights (included in Item 1 of this Form N-CSR) and the schedules of investments (included in Item 6 of this Form N-CSR) present fairly, in all material respects, the financial position of Bridge Builder Core Bond Fund, Bridge Builder Core Plus Bond Fund, Bridge Builder Municipal Bond Fund, Bridge Builder Large Cap Growth Fund, Bridge Builder Large Cap Value Fund, Bridge Builder Small/Mid Cap Growth Fund, Bridge Builder Small/Mid Cap Value Fund and Bridge Builder International Equity Fund (each an individual Fund of the Bridge Builder Trust, hereafter referred to as the “Funds”) as of June 30, 2017, the results of each of their operations for the year then ended, the changes in each of their net assets for each of the two years in the period then ended (or for Bridge Builder Core Plus Bond Fund, for the year ended June 30, 2017 and for the period July 13, 2015 (inception date) through June 30, 2016, and for Bridge Builder Municipal Bond Fund, for the year ended June 30, 2017 and for the period September 14, 2015 (inception date) through June 30, 2016, and for Bridge Builder International Equity Fund, for the year ended June 30, 2017 and for the period July 6, 2015 (inception date) through June 30, 2016) and the financial highlights for each of the periods presented therein, in conformity with accounting principles generally accepted in the United States of America. These financial statements, financial highlights, and schedules of investments (hereafter referred to as “financial statements”) are the responsibility of the Funds’ management. Our responsibility is to express an opinion on these financial statements based on our audits. We conducted our audits of these financial statements in accordance with the standards of the Public Company Accounting Oversight Board (United States). Those standards require that we plan and perform the audit to obtain reasonable assurance about whether the financial statements are free of material misstatement. An audit includes examining, on a test basis, evidence supporting the amounts and disclosures in the financial statements, assessing the accounting principles used and significant estimates made by management, and evaluating the overall financial statement presentation. We believe that our audits, which included confirmation of securities as of June 30, 2017 by correspondence with the custodian and brokers, provide a reasonable basis for our opinions.

August 25, 2017
| PricewaterhouseCoopers LLP, One North Wacker, Chicago, IL 60606 |
| T:(312) 298 2000 , F:(312) 298 2001, www.pwc.com/us |
| (b) | Not Applicable |
Item 7. Disclosure of Proxy Voting Policies and Procedures for Closed-End Management Investment Companies.
Not applicable to open-end investment companies.
Item 8. Portfolio Managers of Closed-End Management Investment Companies.
Not applicable to open-end investment companies.
Item 9. Purchases of Equity Securities by Closed-End Management Investment Company and Affiliated Purchasers.
Not applicable to open-end investment companies.
Item 10. Submission of Matters to a Vote of Security Holders.
There have been no material changes to the procedures by which shareholders may recommend nominees to the registrant’s board of trustees.
Item 11. Controls and Procedures.
| (a) | The Registrant’s Principal Executive Officer and Principal Financial Officer have reviewed the Registrant’s disclosure controls and procedures (as defined in Rule 30a-3(c) under the Investment Company Act of 1940 (the “Act”)) as of a date within 90 days of the filing of this report, as required by Rule 30a-3(b) under the Act and Rules 13a-15(b) or 15d-15(b) under the Securities Exchange Act of 1934. Based on their review, such officers have concluded that the disclosure controls and procedures are effective in ensuring that information required to be disclosed in this report is appropriately recorded, processed, summarized and reported and made known to them by others within the Registrant and by the Registrant’s service provider. |
| (b) | There were no changes in the Registrant’s internal control over financial reporting (as defined in Rule 30a-3(d) under the Act) that occurred during the period covered by this report that has materially affected, or is reasonably likely to materially affect, the Registrant’s internal control over financial reporting. |
Item 12. Exhibits.
| (a) | (1) Any code of ethics or amendment thereto, that is the subject of the disclosure required by Item 2, to the extent that the registrant intends to satisfy Item 2 requirements through filing an exhibit. Not Applicable. |
(2) A separate certification for each principal executive and principal financial officer pursuant to Section 302 of the Sarbanes-Oxley Act of 2002. Filed herewith.
(3) Any written solicitation to purchase securities under Rule 23c-1 under the Act sent or given during the period covered by the report by or on behalf of the registrant to 10 or more persons. Not applicable to open-end investment companies.
| (b) | Certifications pursuant to Section 906 of the Sarbanes-Oxley Act of 2002. Furnished herewith. |
SIGNATURES
Pursuant to the requirements of the Securities Exchange Act of 1934 and the Investment Company Act of 1940, the registrant has duly caused this report to be signed on its behalf by the undersigned, thereunto duly authorized.
| (Registrant) | Bridge Builder Trust |
| By (Signature and Title)* | /s/ Ryan Robson | |||
| Ryan Robson, Principal Executive Officer | ||||
| Date | 8/25/2017 | |||
Pursuant to the requirements of the Securities Exchange Act of 1934 and the Investment Company Act of 1940, this report has been signed below by the following persons on behalf of the registrant and in the capacities and on the dates indicated.
| By (Signature and Title)* | /s/ Ryan Robson | |||
| Ryan Robson, Principal Executive Officer |
| Date | 8/25/2017 | |||
| By (Signature and Title)* | /s/ Aaron Masek | |||
| Aaron Masek, Principal Financial Officer |
| Date | 8/25/2017 | |||
| * | Print the name and title of each signing officer under his or her signature. |